UNITED STATES
SECURITIES AND EXCHANGE COMMISSION
Washington, D.C. 20549
FORM N-CSR
CERTIFIED SHAREHOLDER REPORT OF REGISTERED
MANAGEMENT INVESTMENT COMPANIES
Investment Company Act file number | 811-04443 |
|
Eaton Vance Investment Trust |
(Exact name of registrant as specified in charter) |
|
The Eaton Vance Building, 255 State Street, Boston, Massachusetts | | 02109 |
(Address of principal executive offices) | | (Zip code) |
|
Alan R. Dynner
The Eaton Vance Building, 255 State Street, Boston, Massachusetts 02109 |
(Name and address of agent for service) |
|
Registrant’s telephone number, including area code: | (617) 482-8260 | |
|
Date of fiscal year end: | March 31 | |
|
Date of reporting period: | September 30, 2005 | |
| | | | | | | | |
Item 1. Reports to Stockholders

Semiannual Report September 30, 2005


EATON VANCE
NATIONAL
LIMITED
MATURITY
MUNICIPALS
FUND
IMPORTANT NOTICES REGARDING PRIVACY,
DELIVERY OF SHAREHOLDER DOCUMENTS,
PORTFOLIO HOLDINGS AND PROXY VOTING
Privacy. The Eaton Vance organization is committed to ensuring your financial privacy. Each of the financial institutions identified below has in effect the following policy ("Privacy Policy") with respect to nonpublic personal information about
its customers:
• Only such information received from you, through application forms or otherwise, and information about your Eaton Vance fund transactions will be collected. This may include information such as name, address, social security number, tax status, account balances and transactions.
• None of such information about you (or former customers) will be disclosed to anyone, except as permitted by law (which includes disclosure to employees necessary to service your account). In the normal course of servicing a customer's account, Eaton Vance may share information with unaffiliated third parties that perform various required services such as transfer agents, custodians and broker/dealers.
• Policies and procedures (including physical, electronic and procedural safeguards) are in place that are designed to protect the confidentiality of such information.
• We reserve the right to change our Privacy Policy at any time upon proper notification to you. Customers may want to review our Policy periodically for changes by accessing the link on our homepage: www.eatonvance.com.
Our pledge of privacy applies to the following entities within the Eaton Vance organization: the Eaton Vance Family of Funds, Eaton Vance Management, Eaton Vance Investment Counsel, Boston Management and Research, and Eaton Vance Distributors, Inc.
In addition, our Privacy Policy only applies to those Eaton Vance customers who are individuals and who have a direct relationship with us. If a customer's account (i.e. fund shares) is held in the name of a third-party financial adviser/broker-dealer, it is likely that only such adviser's privacy policies apply to the customer. This notice supersedes all previously issued privacy disclosures.
For more information about Eaton Vance's Privacy Policy, please call 1-800-262-1122.
Delivery of Shareholder Documents. The Securities and Exchange Commission (the "SEC") permits funds to deliver only one copy of shareholder documents, including prospectuses, proxy statements and shareholder reports, to fund investors with multiple accounts at the same residential or post office box address. This practice is often called "householding" and it helps eliminate duplicate mailings to shareholders.
Eaton Vance, or your financial adviser, may household the mailing of your documents indefinitely unless you instruct Eaton Vance, or your financial adviser, otherwise.
If you would prefer that your Eaton Vance documents not be householded, please contact Eaton Vance at 1-800-262-1122, or contact your financial adviser.
Your instructions that householding not apply to delivery of your Eaton Vance documents will be effective within 30 days of receipt by Eaton Vance or your financial adviser.
Portfolio Holdings. Each Eaton Vance Fund and it's underlying Portfolio (if applicable) will file a schedule of its portfolio holdings on Form N-Q with the SEC for the first and third quarters of each fiscal year. The Form N-Q will be available on the Eaton Vance website www.eatonvance.com, by calling Eaton Vance at 1-800-262-1122 or in the EDGAR database on the SEC's website at www.sec.gov. Form N-Q may also be reviewed and copied at the SEC's public reference room in Washington, D.C. (call 1-800-732-0330 for information on the operation of the public reference room).
Proxy Voting. From time to time, funds are required to vote proxies related to the securities held by the funds. The Eaton Vance Funds or their underlying Portfolios (if applicable) vote proxies according to a set of policies and procedures approved by the Funds' and Portfolios' Boards. You may obtain a description of these policies and procedures and information on how the Funds or Portfolios voted proxies relating to Portfolio securities during the 12 month period ended June 30, without charge, upon request, by calling 1-800-262-1122. This description is also available on the SEC's website at www.sec.gov.
Eaton Vance National Limited Maturity Municipals Fund as of September 30, 2005
LETTER TO SHAREHOLDERS

Cynthia J. Clemson
Like all fixed-income markets, the municipal bond market responds to many factors, from changes in interest rates and economic trends to fluctuations in municipal bond issuance. Another key variable is the policy of the Federal Reserve, the nation’s central bank, known popularly as “The Fed.” The Fed’s policies are important to the nation’s economy and markets.

Robert B. MacIntosh
Founded in the wake of crisis, the Federal Reserve plays a vital role...
The Federal Reserve System was established by the Federal Reserve Act of 1913 in the wake of a series of financial crises, the most recent of which – the Panic of 1907 – had caused bank failures, a rash of bankruptcies, a dramatic loss of confidence and a severe economic downturn. Congress was determined to create a central bank that provided a vigilant monetary policy, price stability, a more elastic currency and more careful supervision over the nation’s banks.
The Open Market Committee: influencing the money supply and credit conditions...
The Fed has a number of tools at its disposal to adjust monetary policy. Of these, the most commonly used tools are open market operations. The Federal Open Market Committee (FOMC) meets regularly to review inflation, credit conditions and the overall health of the economy. The Fed uses its own research, as well as that of other key economic agencies, to review its various policy options. Treasury, corporate and municipal bond investors alike eagerly await the transcripts of FOMC meetings for a hint of future interest rate trends.
If it deems a change necessary in short-term rates, the Fed will announce an adjustment to its target for the Federal Funds rate – its primary market instrument. To effect that change, the FOMC issues a directive to the trading desk of the Federal Reserve Bank of New York, whose responsibility it is to implement the policy.
Open market operations:
The Fed intervenes...
If the Fed sees weakness in the economy and little threat of inflation, it may make outright purchases of Treasury securities – either from the “street” or privately from foreign central banks – thus adding reserves to the banking system. This action tends to lower interest rates, increase loans and stimulate economic activity. In so doing, the Fed is said to be easing monetary policy.
On the other hand, if the Fed sees the economy overheating and inflation looming, it may sell Treasury securities, thus draining reserves from the system. This action tends to raise rates, discourage consumer and business borrowing and dampen economic activity. In this case, the Fed is said to be tightening monetary policy.
While changes in Fed policy primarily affect short-term rates, long-term rates are determined by inflationary expectations. However, the Fed’s actions can have a significant effect on market psychology and, over time, impact market rates across the borrowing spectrum – for homebuyers seeking mortgages, businesses seeking bank loans and municipal bond issuers.
Fed-watching: A continuing pre-occupation of the market...
Interpreting the Federal Reserve’s actions has long been of keen interest to bond market investors. Until the mid-1990s, analysts needed to keep daily tabs on bank reserves and the Fed’s daily open market activity to determine a change in monetary policy. Starting in February 1994, however, the Fed began to indicate specifically its target Federal Funds rate. That marked a significant change, as analysts were now free to focus less on current policy and more on future potential changes in policy.
Throughout its history, the Federal Reserve has contributed to a more stable and safer monetary system. As that history unfolds, investors will surely continue to monitor its activities closely.
Sincerely, |
| |
/s/ Cynthia J. Clemson | | /s/ Robert B. MacIntosh | |
Cynthia J. Clemson | Robert B. MacIntosh |
Co-Director | Co-Director |
Municipal Investments | Municipal Investments |
| |
| November 9, 2005 |
| | | |
Fund shares are not insured by the FDIC and are not deposits or other obligations of, or guaranteed by, any depository institution. Shares are subject to investment risks, including possible loss of principal invested.
2
MARKET RECAP
The U.S. economy continued to generate moderate growth during the year ended September 30, 2005, although surging energy prices and high interest rates were a continuing concern for investors. Late in the period, the economy was faced with new challenges resulting from Hurricane Katrina and its potential impact on energy and commodity supplies.
The economy has remained on solid footing in 2005...
The nation’s Gross Domestic Product grew at a rate of 3.8% in the third quarter of 2005, according to preliminary Commerce Department figures, following gains of 3.3% in the second quarter and 3.8% in the first quarter. Manufacturing reported a mixed picture, with overall factor activity accelerating somewhat, while areas such as durable goods, metals and textiles remained weak. Consumer spending declined, as soaring energy costs took their toll. While the housing sector showed signs of strain in selected markets due to rising interest rates, the overall housing market remained strong.
With consumers tightening their belts, the burden shifted to businesses. However, the outlook for capital spending was clouded, as businesses remained wary of investing in new equipment, facilities and software in a period of rising energy costs and higher interest rates.
Gulf Coast state economies were dealt a severe blow by Hurricane Katrina...
In the waning days of the fiscal year, Hurricane Katrina struck states along the Gulf Coast. The storm inflicted a catastrophic blow to Louisiana and also damaged parts of Mississippi, Alabama and Florida. While the economies of the affected states will no doubt suffer in the short run, the national economy is also likely to feel some impact from damage to key ports and oil refineries. The pace of the region’s recovery is unclear at this writing, and will likely remain a concern, especially as heating fuel demand rises in coming months.
The Federal Reserve continued its policy of tightening credit during the fiscal year...
Inflation accelerated somewhat during the period, an increase apparent not only in core energy costs, but also in finished products, a sign that producers are passing their higher energy costs along to consumers. The Federal Reserve hiked short-term interest rates, suggesting it will continue to raise rates in an effort to keep the economy from growing too quickly and keep inflation under control. Beginning in June 2004, the Fed increased its Federal Funds rate – a key short-term interest rate barometer – on 12 consecutive occasions, raising that benchmark from 1.00% to 4.00%, including its most recent rate hike in November 2005.
Against this backdrop, the municipal bond market generated solid gains for the period. For the six months ended September 30, 2005, the Lehman Brothers 7-Year Municipal Bond Index – an unmanaged index of investment-grade, municipal debt securities with an average maturity of 7 years – had a total return of 2.22%.*
* It is not possible to invest directly in an Index. The Index’s total return does not reflect expenses that would have been incurred if an investor individually purchased or sold the securities represented in the Index.
The views expressed throughout this report are those of the portfolio manager and are current only through the end of the period of the report as stated on the cover. These views are subject to change at any time based upon market or other conditions, and the investment adviser disclaims any responsibility to update such views. These views may not be relied on as investment advice and, because investment decisions for a fund are based on many factors, may not be relied on as an indication of trading intent on behalf of any Eaton Vance fund.
3
INVESTMENT UPDATE
The Fund
• The Fund’s Class A shares had a total return of 2.63% for the six months ended September 30, 2005.(1) This return was the result of an increase in net asset value (NAV) to $10.27 per share on September 30, 2005, from $10.21 on March 31, 2005, and the reinvestment of $0.208 in dividends.(2)
• The Fund’s Class B shares had a total return of 2.24% for the six months ended September 30, 2005.(1) This return was the result of an increase in NAV to $10.28 per share on September 30, 2005 from $10.22 on March 31, 2005, and the reinvestment of $0.169 in dividends.(2)
• The Fund’s Class C shares had a total return of 2.17% for the six months ended September 30, 2005.(1) This return was the result of an increase in NAV to $9.63 per share on September 30, 2005 from $9.58 on March 31, 2005, and the reinvestment of $0.158 in dividends.(2)
• For comparison, the Lehman Brothers 7-Year Municipal Bond Index – an unmanaged index of investment-grade, municipal debt securities with an average maturity of 7 years – had a total return of 2.22% for the six months ended September 30, 2005.(3)
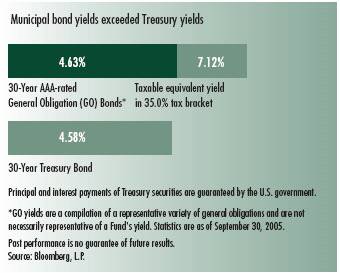
• Based on the Fund’s most recent dividends annualized and NAVs on September 30, 2005 of $10.27 per share for Class A, $10.28 for Class B, and $9.63 for Class C, the Fund’s distribution rates were 3.98%, 3.23% and 3.23%, respectively.(4) The distribution rates are equivalent to taxable rates of 6.12%, 4.97% and 4.97%, respectively.(5)
• The SEC 30-day yields for Class A, Class B, and Class C shares at September 30, 2005 were 3.49%, 2.82%, and 2.82%, respectively.(6) The SEC 30-day yields are equivalent to taxable yields of 5.37%, 4.34% and 4.34%, respectively.(5)
Fund Statistics**
• Number of Issues: | | 174 | |
• Average Maturity: | | 5.43 years | |
• Effective Maturity: | | 12.70 years | |
• Average Rating: | | AA- | |
• Average Call: | | 8.5 years | |
• Average Dollar Price: | | $105.94 | |
** Fund Statistics are as of September 30, 2005. Portfolio information may not be representative of the Fund’s current or future investments and may change due to active management.
Past performance is no guarantee of future results. Returns are historical and are calculated by determining the percentage change in net asset value or offering price (as applicable) with all distributions reinvested. Investment return and principal value will fluctuate so that shares, when redeemed, may be worth more or less than their original cost. Performance is for the stated time period only; due to market volatility, the Fund’s current performance may be lower or higher than the quoted return. For performance as of the most recent month end, please refer to www.eatonvance.com.
Management Discussion

William H. Ahern
Portfolio Manager
• The U.S. economy has continued to generate solid growth thus far in 2005. Unemployment has declined slightly over the past six months to 5.1% as of September 2005 from 5.2% in March 2005. Growth, as measured by Gross Domestic Product (GDP) was 3.3% in the second quarter of 2005, with preliminary third-quarter estimates of 3.8%. Inflation remained moderate, but high energy prices could cause a potential increase in inflation or interest rates, which could provide headwinds to the economy’s ability to grow in coming months.
• Management’s focus on call protection continued to benefit the Fund’s performance during the period. We also improved the average credit quality in the Fund to help protect against a potential slowing in economic growth.
• Health care bonds remained major investments in the Fund. We continued to focus on institutions that we felt had sound financial structures and management teams, as well as in-demand specialties. While hospital bonds typically offer attractive yields, they also tend to come with lower credit ratings.
• Insured* transportation bonds constituted the Fund’s largest sector weighting at September 30, 2005. Investments included issues for major airport authorities, as well as highway and turnpike authorities and a state transportation trust fund. With income drawn from toll collections and airport gate fees, transportation bonds have enjoyed historically stable revenues.
• The Fund maintained a significant investment in the electric utilities sector. As essential services bonds, utilities tend to have a more stable revenue base that may be less sensitive to fluctuations in the economy.
• The Fund invested in special tax revenue issues, which help finance a wide range of infrastructure and capital improvement projects across the nation. The bonds provide communities a financing alternative and are backed by specially directed tax revenues, such as cigarette, sales or use taxes.
* Private insurance does not decrease the risk of principal fluctuations associated with this investment.
(1) These returns do not include the 2.25% maximum sales charge for Class A shares or the applicable contingent deferred sales charges (CDSC) for Class B and Class C shares. If sales charges were deducted, returns would be lower.
(2) A portion of the Fund’s income may be subject to federal income tax and/or alternative minimum tax. Income may be subject to state and local taxes.
(3) It is not possible to invest directly in an Index. The Index’s total return does not reflect expenses that would have been incurred if an investor individually purchased or sold the securities represented in the Index.
(4) The Fund’s distribution rate represents actual distributions paid to shareholders and is calculated by dividing the last distribution per share (annualized) by the net asset value.
(5) Taxable-equivalent rates assume a maximum 35.00% federal income tax rate. A lower rate would result in lower tax-equivalent figures.
(6) The Fund’s SEC yield is calculated by dividing the net investment income per share for the 30-day period by the offering price at the end of the period and annualizing the result.
4
FUND PERFORMANCE
Performance (1) | | Class A | | Class B | | Class C | |
Average Annual Total Returns (at net asset value) | | | | | | | |
One Year | | 3.11 | % | 2.43 | % | 2.30 | % |
Five Years | | 5.50 | | 4.71 | | 4.69 | |
Ten Years | | N.A. | | 4.08 | | 3.96 | |
Life of Fund† | | 5.10 | | 4.47 | | 3.71 | |
| | | | | | | |
SEC Average Annual Total Returns (including sales charge or applicable CDSC) | | | | | | | |
One Year | | 0.78 | % | -0.54 | % | 1.31 | % |
Five Years | | 5.01 | | 4.71 | | 4.69 | |
Ten Years | | N.A. | | 4.08 | | 3.96 | |
Life of Fund† | | 4.84 | | 4.47 | | 3.71 | |
† Inception Dates – Class A: 6/27/96; Class B: 5/22/92; Class C: 12/8/93
(1) Average annual total returns do not include the 2.25% maximum sales charge for Class A shares or the applicable contingent deferred sales charges (CDSC) for Class B and Class C shares. If sales charges were deducted, returns would be lower. SEC average annual total returns for Class A reflect the maximum 2.25% sales charge. SEC returns for Class B reflect applicable CDSC based on the following schedule: 3% - 1st year; 2.5% - 2nd year; 2% - 3rd year; 1% - 4th year. SEC 1-year return for Class C reflects a 1% CDSC.
Past performance is no guarantee of future results. Returns are historical and are calculated by determining the percentage change in net asset value or offering price (as applicable) with all distributions reinvested. Investment return and principal value will fluctuate so that shares, when redeemed, may be worth more or less than their original cost. Performance is for the stated time period only; due to market volatility, the Fund’s current performance may be lower or higher than the quoted return. For performance as of the most recent month end, please refer to www.eatonvance.com.
Rating Distribution(2)
By total investments

(2) Reflects the Fund’s total investments as of September 30, 2005. May not be representative of the Fund’s current or future investments and may change due to active management.
5
FUND EXPENSES
Example: As a shareholder of the Fund, you incur two types of costs: (1) transaction costs, including sales charges (loads) on purchases and redemption fees (if applicable); and (2) ongoing costs, including management fees; distribution or service fees; and other Fund expenses. This Example is intended to help you understand your ongoing costs (in dollars) of investing in a Fund and to compare these costs with the ongoing costs of investing in other mutual funds. The Example is based on an investment of $1,000 invested at the beginning of the period and held for the entire period (April 1, 2005 – September 30, 2005).
Actual Expenses: The first section of the table below provides information about actual account values and actual expenses. You may use the information in this line, together with the amount you invested, to estimate the expenses that you paid over the period. Simply divide your account value by $1,000 (for example, an $8,600 account value divided by $1,000 = 8.6), then multiply the result by the number in the first line under the heading entitled “Expenses Paid During Period” to estimate the expenses you paid on your account during this period.
Hypothetical Example for Comparison Purposes: The second section of the table below provides information about hypothetical account values and hypothetical expenses based on the Fund’s actual expense ratio and an assumed rate of return of 5% per year (before expenses), which is not the actual return of the Fund. The hypothetical account values and expenses may not be used to estimate the actual ending account balance or expenses you paid for the period. You may use this information to compare the ongoing costs of investing in the Fund and other funds. To do so, compare this 5% hypothetical example with the 5% hypothetical examples that appear in the shareholder reports of the other funds.
Please note that the expenses shown in the table are meant to highlight your ongoing costs only and do not reflect any transactional costs, such as sales charges (loads) or redemption fees (if applicable). Therefore, the second section of the table is useful in comparing ongoing costs only, and will not help you determine the relative total costs of owning different funds. In addition, if these transactional costs were included, your costs would have been higher.
Eaton Vance National Limited Maturity Municipals Fund
| | Beginning Account Value
(4/1/05) | | Ending Account Value
(9/30/05) | | Expenses Paid During Period*
(4/1/05 - 9/30/05) | |
| | | | | | | |
Actual | | | | | | | |
Class A | | $ | 1,000.00 | | $ | 1,026.30 | | $ | 3.91 | |
Class B | | $ | 1,000.00 | | $ | 1,022.40 | | $ | 7.71 | |
Class C | | $ | 1,000.00 | | $ | 1,021.70 | | $ | 7.70 | |
| | | | | | | |
Hypothetical | | | | | | | |
(5% return per year before expenses) | | | | | | | |
Class A | | $ | 1,000.00 | | $ | 1,021.20 | | $ | 3.90 | |
Class B | | $ | 1,000.00 | | $ | 1,017.40 | | $ | 7.69 | |
Class C | | $ | 1,000.00 | | $ | 1,017.40 | | $ | 7.69 | |
* Expenses are equal to the Fund’s annualized expense ratio of 0.77% for Class A shares, 1.52% for Class B shares and 1.52% for Class C shares, multiplied by the average account value over the period, multiplied by 183/365 (to reflect the one-half year period). The Example assumes that the $1,000 was invested at the net asset value per share determined at the close of business on March 31, 2005.
6
Eaton Vance National Limited Maturity Municipals Fund as of September 30, 2005
PORTFOLIO OF INVESTMENTS (Unaudited)
| | Tax-Exempt Investments - 98.3% | | | | |
Principal Amount
(000's omitted) | | Security | | Value | |
| | Cogeneration - 1.4% | | | | |
| $ | 1,595 | | | Carbon County, PA, IDA, (Panther Creek Partners),
(AMT), 6.65%, 5/1/10 | | $ | 1,726,205 | | |
| | 985 | | | Ohio Water Development Authority, Solid Waste
Disposal, (Bay Shore Power), (AMT),
6.625%, 9/1/20 | | | 1,022,528 | | |
| | 350 | | | Pennsylvania EDA, (Resource Recovery- Northampton),
(AMT), 6.75%, 1/1/07 | | | 353,713 | | |
| | 675 | | | Pennsylvania EDA, (Resource Recovery-Colver), (AMT),
5.125%, 12/1/15 | | | 679,475 | | |
| | | | | | | $ | 3,781,921 | | |
| | Education - 3.5% | | | | |
| $ | 2,000 | | | Illinois Educational Facility Authority, (Art Institute of
Chicago), 4.45%, 3/1/34 | | $ | 2,027,780 | | |
| | 420 | | | Maryland Industrial Development Financing Authority,
(Our Lady of Good Counsel High School),
5.50%, 5/1/20 | | | 424,813 | | |
| | 2,815 | | | Missouri Health and Educational Facilities Authority,
(St. Louis University), 5.50%, 10/1/16 | | | 3,199,979 | | |
| | 850 | | | New Hampshire HEFA, (Colby-Sawyer College),
7.20%, 6/1/12 | | | 880,192 | | |
| | 1,235 | | | New Jersey Educational Facilities Authority,
(Steven's Institute of Technology),
5.00%, 7/1/12 | | | 1,317,535 | | |
| | 1,700 | | | University of Illinois, 0.00%, 4/1/15 | | | 1,129,191 | | |
| | 1,000 | | | University of Illinois, 0.00%, 4/1/16 | | | 631,810 | | |
| | | | | | | $ | 9,611,300 | | |
| | Electric Utilities - 10.0% | | | | |
| $ | 1,000 | | | Brazos River Authority, TX, (Reliant Energy, Inc.),
7.75%, 12/1/18 | | $ | 1,105,550 | | |
| | 1,500 | | | California Department of Water Resource Power Supply,
5.125%, 5/1/18 | | | 1,594,800 | | |
| | 3,000 | | | Energy Northwest Washington Electric,
(Columbia Generating), 5.50%, 7/1/15 | | | 3,379,620 | | |
| | 1,000 | | | Illinois Development Finance Authority PCR,
(AMT), 5.00%, 6/1/28 | | | 1,013,880 | | |
| | 2,500 | | | New Hampshire Business Finance Authority Pollution
Control, (Central Maine Power Co.), 5.375%, 5/1/14 | | | 2,663,075 | | |
| | 3,050 | | | New York Energy Research and Development Authority
Facility, (AMT), 4.70%, 6/1/36 | | | 3,051,525 | | |
| | 4,100 | | | North Carolina Eastern Municipal Power Agency,
5.375%, 1/1/13 | | | 4,418,160 | | |
| | 4,000 | | | North Carolina Municipal Power Agency, (Catawba),
5.50%, 1/1/13 | | | 4,396,680 | | |
Principal Amount
(000's omitted) | |
Security | |
Value | |
| Electric Utilities (continued) | |
| $ | 1,000 | | | North Carolina Municipal Power Agency, (Catawba),
6.375%, 1/1/13 | | $ | 1,103,920 | | |
| | 1,250 | | | Sam Rayburn, TX, Municipal Power Agency, Power
Supply System, 6.00%, 10/1/16 | | | 1,345,625 | | |
| | 1,000 | | | San Antonio, TX, Electric and Natural Gas,
4.50%, 2/1/21 | | | 1,005,300 | | |
| | 2,500 | | | Wake County, NC, Industrial Facilities and Pollution
Control Financing Authority, (Carolina Power
and Light Co.), 5.375%, 2/1/17 | | | 2,668,775 | | |
| | | | | | | $ | 27,746,910 | | |
| Escrowed / Prerefunded - 6.1% | |
| $ | 1,000 | | | Arkansas State Student Loan Authority, (AMT),
Prerefunded to 6/1/06, 6.25%, 6/1/10 | | $ | 1,019,930 | | |
| | 290 | | | Florence, KY, Housing Facilities, (Bluegrass Housing),
Escrowed to Maturity, 7.25%, 5/1/07 | | | 291,334 | | |
| | 360 | | | Forsyth County, GA, Hospital Authority, (Georgia Baptist
Health Care System), Escrowed to Maturity,
6.00%, 10/1/08 | | | 374,465 | | |
| | 500 | | | Kershaw County, SC, School District, Prerefunded to
2/1/10, 5.00%, 2/1/18 | | | 534,850 | | |
| | 3,500 | | | Maricopa County, AZ, IDA, Multifamily, Escrowed to
Maturity, 6.45%, 1/1/17(1) | | | 3,707,165 | | |
| | 575 | | | Maricopa County, AZ, IDA, Multifamily, Escrowed to
Maturity, 7.875%, 1/1/11 | | | 641,039 | | |
| | 3,000 | | | Massachusetts Turnpike Authority, Escrowed to
Maturity, 5.00%, 1/1/20 | | | 3,267,360 | | |
| | 395 | | | Michigan Hospital Finance Authority, (Presbyterian
Villages), Escrowed to Maturity, 6.20%, 1/1/06 | | | 398,231 | | |
| | 2,000 | | | New Jersey Transportation Trust Fund Authority,
(Transportation System), Prerefunded to
6/15/13, 5.50%, 6/15/14 | | | 2,250,680 | | |
| | 1,195 | | | North Carolina Eastern Municipal Power Agency,
Escrowed to Maturity, 4.00%, 1/1/18 | | | 1,195,514 | | |
| | 1,000 | | | Northwest Arkansas Regional Airport Authority, (AMT),
Prerefunded to 2/1/08, 7.625%, 2/1/27 | | | 1,105,160 | | |
| | 2,000 | | | Orange County, FL, Health Facilities Authority, (Adventist
Health System), Prerefunded to
11/15/10, 6.375%, 11/15/20 | | | 2,292,900 | | |
| | | | | | | $ | 17,078,628 | | |
| General Obligations - 3.4% | |
| $ | 1,000 | | | Keller, TX, Independent School District, 0.00%, 8/15/11 | | $ | 804,830 | | |
| | 1,650 | | | McAllen, TX, Independent School District, (PSF),
4.50%, 2/15/18 | | | 1,662,309 | | |
| | 5,000 | | | New York City, NY, 5.00%, 12/1/20 | | | 5,256,800 | | |
| | 1,500 | | | New York City, NY, 5.625%, 12/1/13 | | | 1,642,050 | | |
| | | | | | | $ | 9,365,989 | | |
See notes to financial statements
7
Eaton Vance National Limited Maturity Municipals Fund as of September 30, 2005
PORTFOLIO OF INVESTMENTS (Unaudited) CONT'D
Principal Amount
(000's omitted) | |
Security | |
Value | |
| | Health Care-Miscellaneous - 0.8% | | | | |
| $ | 1,705 | | | Illinois HFA, (Lutheran Social Services),
6.125%, 8/15/10 | | $ | 1,705,529 | | |
| | 145 | | | Pittsfield Township, MI, EDC, (Arbor Hospice),
7.875%, 8/15/27 | | | 142,023 | | |
| | 515 | | | Tax Revenue Exempt Securities Trust, Community Health
Provider, (Pooled Loan Program Various States Trust
Certificates), 6.00%, 12/1/36 | | | 538,554 | | |
| | | | | | | $ | 2,386,106 | | |
| | Hospital - 8.8% | | | | |
| $ | 550 | | | Colorado Health Facilities Authority, (Parkview Episcopal
Medical Center), 5.75%, 9/1/09 | | $ | 591,701 | | |
| | 165 | | | Colorado Health Facilities Authority, (Parkview Episcopal
Medical Center), 6.125%, 9/1/25 | | | 168,481 | | |
| | 2,500 | | | Cuyahoga County, OH, (Cleveland Clinic Health System),
6.00%, 1/1/17 | | | 2,789,700 | | |
| | 1,100 | | | Highlands County, FL, Health Facilities Authority, (Adventist
Health System), 5.00%, 11/15/16(2) | | | 1,170,521 | | |
| | 100 | | | Michigan Hospital Finance Authority, (Central Michigan
Community Hospital), 6.00%, 10/1/05 | | | 100,005 | | |
| | 100 | | | Michigan Hospital Finance Authority, (Central Michigan
Community Hospital), 6.10%, 10/1/06 | | | 101,955 | | |
| | 225 | | | Michigan Hospital Finance Authority, (Central Michigan
Community Hospital), 6.20%, 10/1/07 | | | 233,469 | | |
| | 370 | | | Michigan Hospital Finance Authority, (Gratiot Community
Hospital), 6.10%, 10/1/07 | | | 383,457 | | |
| | 2,000 | | | Michigan Hospital Finance Authority, (Henry Ford Health
System), 5.50%, 3/1/14 | | | 2,164,460 | | |
| | 1,000 | | | Michigan Hospital Finance Authority, (Memorial Healthcare
Center), 5.875%, 11/15/21 | | | 1,053,130 | | |
| | 2,490 | | | Michigan Hospital Finance Authority, Variable Rate,
8.995%, 11/1/12(3)(4) | | | 3,033,940 | | |
| | 200 | | | New Hampshire HEFA, (Littleton Hospital Association),
5.45%, 5/1/08 | | | 202,992 | | |
| | 1,800 | | | New York Dormitory Authority, (Methodist Hospital),
5.25%, 7/1/15 | | | 1,944,648 | | |
| | 2,055 | | | New York Dormitory Authority, (Methodist Hospital),
5.25%, 7/1/16 | | | 2,210,769 | | |
| | 2,000 | | | Orange County, FL, Health Facilities Authority,
(Adventist Health System), 5.25%, 11/15/18 | | | 2,129,580 | | |
| | 1,130 | | | Orange County, FL, Health Facilities Authority, (Nemours
Foundation), 5.00%, 1/1/18 | | | 1,215,247 | | |
| | 1,740 | | | Saginaw, MI, Hospital Finance Authority,
5.125%, 7/1/22 | | | 1,798,116 | | |
| | 2,000 | | | South Carolina Jobs-Economic Development Authority,
(Palmetto Health Alliance), 6.00%, 8/1/12 | | | 2,197,420 | | |
| | 1,000 | | | Washington County, AR, (Washington Regional Medical
Center), 5.00%, 2/1/16 | | | 1,038,870 | | |
| | | | | | | $ | 24,528,461 | | |
Principal Amount
(000's omitted) | |
Security | |
Value | |
| Housing - 0.5% | |
| $ | 600 | | | Georgia Private Colleges and Universities Authority,
Student Housing Revenue, (Mercer Housing Corp.),
6.00%, 6/1/31 | | $ | 622,434 | | |
| | 675 | | | Sandoval County, NM, Multifamily, 6.00%, 5/1/32 | | | 675,277 | | |
| | 95 | | | Texas Student Housing Corp., (University of Northern
Texas), 9.375%, 7/1/06 | | | 81,225 | | |
| | | | | | | $ | 1,378,936 | | |
| Industrial Development Revenue - 5.1% | |
| $ | 220 | | | Austin, TX, (Cargoport Development LLC), (AMT),
7.50%, 10/1/07 | | $ | 225,185 | | |
| | 425 | | | Austin, TX, (Cargoport Development LLC), (AMT),
8.30%, 10/1/21 | | | 460,249 | | |
| | 1,500 | | | Dallas-Fort Worth, TX, International Airport Facilities
Improvement Corp., (AMT), 9.00%, 5/1/29 | | | 1,436,355 | | |
| | 1,320 | | | Denver, CO, City and County Special Facilities,
(United Airlines), (AMT), 6.875%, 10/1/32(5) | | | 1,209,186 | | |
| | 1,000 | | | Hapeville, GA, Development Authority, IDA, (Hapeville
Hotel, Ltd.), Variable Rate, 2.70%, 11/1/15 | | | 1,000,000 | | |
| | 1,630 | | | Houston, TX, Industrial Development Corp., (AMT),
6.375%, 1/1/23 | | | 1,691,500 | | |
| | 1,435 | | | Mississippi Business Finance Corp., (Air Cargo), (AMT),
7.25%, 7/1/34 | | | 1,475,941 | | |
| | 1,440 | | | New Jersey EDA, (Continental Airlines), (AMT),
6.25%, 9/15/19 | | | 1,228,176 | | |
| | 1,000 | | | New Jersey EDA, (Holt Hauling), (AMT),
7.90%, 3/1/27(5) | | | 961,250 | | |
| | 1,500 | | | Nez Perce County, ID, PCR, (Potlatch Corp.),
6.125%, 12/1/07 | | | 1,535,220 | | |
| | 2,825 | | | Toledo Lucas County, OH, Port Authority, (Cargill, Inc.),
4.50%, 12/1/15 | | | 2,893,704 | | |
| | | | | | | $ | 14,116,766 | | |
| Insured-Cogeneration - 0.6% | |
| $ | 1,600 | | | Pennsylvania EDA, (Resource Recovery-Colver),
(AMBAC), (AMT), 4.625%, 12/1/18 | | $ | 1,633,520 | | |
| | | | | | | $ | 1,633,520 | | |
| Insured-Education - 1.7% | |
| $ | 2,025 | | | New York Dormitory Authority, (Educational Housing
Services), (AMBAC), 5.25%, 7/1/21 | | $ | 2,274,318 | | |
| | 2,000 | | | New York Dormitory Authority, (SUNY, NY), (XLCA),
5.25%, 7/1/32 | | | 2,202,220 | | |
| | 500 | | | Southern Illinois University, Housing and Auxiliary
Facilities, (MBIA), 0.00%, 4/1/17 | | | 302,390 | | |
| | | | | | | $ | 4,778,928 | | |
See notes to financial statements
8
Eaton Vance National Limited Maturity Municipals Fund as of September 30, 2005
PORTFOLIO OF INVESTMENTS (Unaudited) CONT'D
Principal Amount
(000's omitted) | |
Security | |
Value | |
| Insured-Electric Utilities - 1.6% | |
| $ | 750 | | | California Pollution Control Financing Authority, PCR,
(Pacific Gas and Electric), (MBIA), (AMT),
5.35%, 12/1/16 | | $ | 808,995 | | |
| | 2,000 | | | Forsyth, MT, PCR, (Avista Corp.), (AMBAC),
5.00%, 10/1/32(6) | | | 2,096,620 | | |
| | 400 | | | Piedmont, SC, Municipal Power Agency, (MBIA),
5.00%, 1/1/15 | | | 412,388 | | |
| | 1,000 | | | Puerto Rico Electric Power Authority, (XLCA),
5.375%, 7/1/18 | | | 1,133,570 | | |
| | | | | | | $ | 4,451,573 | | |
| Insured-Escrowed / Prerefunded - 1.3% | |
| $ | 1,000 | | | Laredo, TX, Certificates of Obligation, (MBIA),
Prerefunded to 2/15/08, 4.50%, 2/15/17 | | $ | 1,008,810 | | |
| | 1,000 | | | Metropolitan Transportation Authority, NY, Commuter
Facilities, (AMBAC), Escrowed to Maturity,
5.00%, 7/1/20 | | | 1,050,500 | | |
| | 1,000 | | | Metropolitan Transportation Authority, NY, Transit
Facilities, (FGIC), Prerefunded to
10/1/15, 4.50%, 4/1/18 | | | 1,061,650 | | |
| | 500 | | | Metropolitan Transportation Authority, NY,
Transit Facilities, (MBIA), Escrowed to Maturity,
5.00%, 7/1/17 | | | 525,250 | | |
| | | | | | | $ | 3,646,210 | | |
| Insured-General Obligations - 7.3% | |
| $ | 2,240 | | | Clackamas County, OR, (School District No. 7J Lake
Oswego), (FSA), 5.25%, 6/1/21 | | $ | 2,525,802 | | |
| | 1,595 | | | Deschutes County, OR, School District No. 6, (Sisters),
(FSA), 5.25%, 6/15/18 | | | 1,789,478 | | |
| | 1,000 | | | Egg Harbor Township, NJ, School District, (FSA),
5.50%, 7/15/19 | | | 1,150,290 | | |
| | 1,000 | | | Hillsborough Township, NJ, School District, (FSA),
5.375%, 10/1/18 | | | 1,149,870 | | |
| | 1,000 | | | Jackson County, OR, School District No. 9 Eagle Point,
(MBIA), 5.50%, 6/15/19 | | | 1,149,610 | | |
| | 1,055 | | | Linn County, OR, Community School District No. 9,
(Lebanon), (FGIC), 5.25%, 6/15/21 | | | 1,189,840 | | |
| | 3,155 | | | Pima County, AZ, (FSA), 3.50%, 7/1/20 | | | 2,869,946 | | |
| | 3,150 | | | Springfield, OH, City School District, Clark County,
(AMBAC), 4.30%, 12/1/14 | | | 3,237,381 | | |
| | 1,400 | | | Springfield, OH, City School District, Clark County, (FGIC),
5.00%, 12/1/17 | | | 1,504,510 | | |
| | 1,000 | | | St. Louis, MO, Board of Education, (FSA),
0.00%, 4/1/16 | | | 640,970 | | |
| | 500 | | | Summit County, OH, (FGIC), 4.75%, 12/1/21 | | | 524,520 | | |
| | 1,000 | | | Washington County, OR, School District No. 15 Forest
Grove, (FSA), 5.50%, 6/15/19 | | | 1,149,610 | | |
Principal Amount
(000's omitted) | |
Security | |
Value | |
| | Insured-General Obligations (continued) | | | | |
| $ | 1,255 | | | Yamhill County, OR, School District No. 29J, (FGIC),
5.50%, 6/15/19 | | $ | 1,442,761 | | |
| | | | | | | $ | 20,324,588 | | |
| | Insured-Hospital - 4.1% | | | | |
| $ | 1,180 | | | Akron, Bath and Copley, OH, Township, Hospital District,
(Childrens Hospital Center), (FSA), 5.25%, 11/15/16 | | $ | 1,285,268 | | |
| | 2,000 | | | El Paso County, TX, Hospital District, (MBIA),
0.00%, 8/15/06 | | | 1,951,420 | | |
| | 3,000 | | | Montgomery, AL, BMC Special Care Facilities Financing
Authority, (Baptist Health Montgomery), (MBIA),
0.00%, 11/15/17 | | | 2,828,430 | | |
| | 2,000 | | | Montogmery, AL, BMC Special Care Facilities Financing
Authority, (Baptist Health Montgomery), (MBIA),
0.00%, 11/15/18(7) | | | 1,878,120 | | |
| | 2,960 | | | New York Dormitory Authority, (Sloan-Kettering Institute),
(MBIA), 5.75%, 7/1/20 | | | 3,473,027 | | |
| | | | | | | $ | 11,416,265 | | |
| | Insured-Lease Revenue / Certificates of Participation - 0.9% | | | | |
| $ | 1,380 | | | Anaheim, CA, Public Financing Authority, (Public
Improvements), (FSA), 0.00%, 9/1/19 | | $ | 739,763 | | |
| | 2,100 | | | Texas Public Finance Authority, (MBIA), 0.00%, 2/1/12 | | | 1,650,579 | | |
| | | | | | | $ | 2,390,342 | | |
| | Insured-Miscellaneous - 0.4% | | | | |
| $ | 1,000 | | | Missouri Development Finance Board Cultural Facility,
(Nelson Gallery Foundation), (MBIA), 5.25%, 12/1/14 | | $ | 1,090,560 | | |
| | | | | | | $ | 1,090,560 | | |
| | Insured-Solid Waste - 0.5% | | | | |
| $ | 1,175 | | | Massachusetts Development Finance Agency, (Semass
System), (MBIA), 5.625%, 1/1/12 | | $ | 1,295,684 | | |
| | | | | | | $ | 1,295,684 | | |
| | Insured-Special Tax Revenue - 8.3% | | | | |
| $ | 3,000 | | | Arlington, TX, (Dallas Cowboys), (MBIA),
5.00%, 8/15/34 | | $ | 3,251,790 | | |
| | 5,750 | | | Denver, CO, City and County, (FSA), 5.25%, 9/1/19 | | | 6,468,693 | | |
| | 1,000 | | | Julington Creek Plantation, FL, Community Development
District, (MBIA), 4.75%, 5/1/19 | | | 1,033,740 | | |
| | 5,000 | | | Massachusetts School Building Authority, Sales Tax,
(FSA), 5.00%, 8/15/17 | | | 5,419,450 | | |
| | 5,000 | | | Puerto Rico Infrastructure Financing Authority, (FGIC),
5.50%, 7/1/19 | | | 5,772,750 | | |
See notes to financial statements
9
Eaton Vance National Limited Maturity Municipals Fund as of September 30, 2005
PORTFOLIO OF INVESTMENTS (Unaudited) CONT'D
Principal Amount
(000's omitted) | |
Security | |
Value | |
| Insured-Special Tax Revenue (continued) | |
| $ | 1,000 | | | Reno, NV, Capital Improvements, (FGIC),
5.625%, 6/1/14 | | $ | 1,118,180 | | |
| | | | | | | $ | 23,064,603 | | |
| Insured-Transportation - 10.3% | |
| $ | 2,295 | | | Chicago, IL, O'Hare International Airport, (MBIA), (AMT),
5.75%, 1/1/17 | | $ | 2,498,544 | | |
| | 1,000 | | | Denver, CO, City and County Airport, (FSA), (AMT),
5.00%, 11/15/11 | | | 1,065,260 | | |
| | 1,640 | | | Denver, CO, City and County Airport, (MBIA),
6.00%, 11/15/11 | | | 1,852,429 | | |
| | 1,000 | | | Houston, TX, Airport System, (FGIC), (AMT),
5.50%, 7/1/12 | | | 1,084,210 | | |
| | 2,000 | | | Kenton County, KY, Airport, (Cincinnati/Northern
Kentucky), (MBIA), (AMT), 5.625%, 3/1/13 | | | 2,177,840 | | |
| | 2,500 | | | Massachusetts Port Authority, (Delta Airlines), (AMBAC),
(AMT), 5.50%, 1/1/15 | | | 2,649,250 | | |
| | 1,000 | | | Miami-Dade County, FL, Aviation, (Miami International
Airport), (FGIC), (AMT), 5.50%, 10/1/13 | | | 1,092,100 | | |
| | 2,000 | | | Minneapolis and St. Paul, MN, Metropolitan Airport
Commission, (FGIC), (AMT), 5.25%, 1/1/11 | | | 2,146,140 | | |
| | 1,430 | | | Minneapolis and St. Paul, MN, Metropolitan Airports
Commission Airport, (FGIC), (AMT), 6.00%, 1/1/11 | | | 1,568,395 | | |
| | 5,000 | | | New Jersey Transportation Trust Fund Authority, (FGIC),
5.50%, 12/15/20 | | | 5,752,200 | | |
| | 2,000 | | | New Jersey Transportation Trust Fund Authority, (FSA),
5.50%, 10/1/14 | | | 2,243,400 | | |
| | 1,000 | | | Ohio Turnpike Commission, (FGIC), 5.50%, 2/15/18 | | | 1,147,880 | | |
| | 1,000 | | | Port Seattle, WA, (MBIA), (AMT), 6.00%, 2/1/11 | | | 1,109,880 | | |
| | 2,000 | | | Wayne Charter County, MI, Metropolitan Airport, (FGIC),
(AMT), 5.50%, 12/1/15 | | | 2,175,520 | | |
| | | | | | | $ | 28,563,048 | | |
| Insured-Water and Sewer - 0.6% | |
| $ | 2,000 | | | Honolulu, HI, Wastewater System, (FGIC),
0.00%, 7/1/11 | | $ | 1,617,860 | | |
| | | | | | | $ | 1,617,860 | | |
| Lease Revenue / Certificates of Participation - 3.6% | |
| $ | 3,180 | | | Bergen County, NJ, Improvement Authority, (County
Administration Complex), 5.00%, 11/15/19 | | $ | 3,496,982 | | |
| | 2,460 | | | Bergen County, NJ, Improvement Authority, (County
Administration Complex), 5.00%, 11/15/21 | | | 2,708,509 | | |
| | 3,385 | | | New Jersey EDA, (School Facilities Construction),
5.50%, 9/1/19 | | | 3,843,227 | | |
| | | | | | | $ | 10,048,718 | | |
Principal Amount
(000's omitted) | |
Security | |
Value | |
| Nursing Home - 0.6% | |
| $ | 810 | | | Clovis, NM, IDR, (Retirement Ranches, Inc.),
7.75%, 4/1/19 | | $ | 846,345 | | |
| | 250 | | | Massachusetts IFA, (Age Institute of Massachusetts),
7.60%, 11/1/05 | | | 250,213 | | |
| | 485 | | | Wisconsin HEFA, (Wisconsin Illinois Senior Housing),
7.00%, 8/1/29 | | | 480,499 | | |
| | | | | | | $ | 1,577,057 | | |
| Other Revenue - 3.3% | |
| $ | 1,000 | | | Arizona Health Facilities Authority, (Blood Systems, Inc.),
5.00%, 4/1/21 | | $ | 1,031,080 | | |
| | 890 | | | Barona, CA, (Band of Mission Indians),
8.25%, 1/1/20 | | | 930,557 | | |
| | 2,000 | | | California Statewide Communities Development
Authority, (East Valley Tourist Development Authority),
8.25%, 10/1/14(3) | | | 2,160,740 | | |
| | 1,650 | | | Capital Trust Agency, FL, (Seminole Tribe Convention),
8.95%, 10/1/33 | | | 1,805,397 | | |
| | 1,220 | | | Central Falls, RI, Detention Facility Revenue,
7.25%, 7/15/35 | | | 1,269,947 | | |
| | 1,000 | | | Mohegan Tribe, CT, Gaming Authority, 5.375%, 1/1/11(3) | | | 1,053,120 | | |
| | 900 | | | Sandoval County, NM, (Santa Ana Pueblo),
7.75%, 7/1/15(3) | | | 935,523 | | |
| | | | | | | $ | 9,186,364 | | |
| Pooled Loans - 1.5% | |
| $ | 1,900 | | | Arizona Educational Loan Marketing Corp., (AMT),
6.25%, 6/1/06 | | $ | 1,925,650 | | |
| | 1,300 | | | Ohio Economic Development, (Ohio Enterprise Bond Fund),
(AMT), 4.60%, 6/1/20 | | | 1,336,010 | | |
| | 790 | | | Ohio Economic Development, (Ohio Enterprise Bond Fund),
(AMT), 5.25%, 12/1/15 | | | 822,311 | | |
| | | | | | | $ | 4,083,971 | | |
| Senior Living / Life Care - 1.2% | |
| $ | 765 | | | Albuquerque, NM, Retirement Facilities, (La Vida Liena
Retirement Center), 6.60%, 12/15/28 | | $ | 789,281 | | |
| | 1,105 | | | Arizona Health Facilities Authority, (Care Institute,
Inc.-Mesa), 7.625%, 1/1/06(8) | | | 1,083,795 | | |
| | 500 | | | Kansas City, MO, IDR, (Kingswood Manor),
5.80%, 11/15/17 | | | 481,850 | | |
| | 240 | | | Massachusetts IFA, (Forge Hill), (AMT), 6.75%, 4/1/30 | | | 242,218 | | |
| | 280 | | | Mesquite, TX, Health Facilities Development, (Christian
Care Centers), 7.00%, 2/15/10 | | | 299,090 | | |
| | 490 | | | North Miami, FL, Health Facilities Authority, (Imperial
Club), 6.75%, 1/1/33 | | | 459,223 | | |
| | | | | | | $ | 3,355,457 | | |
See notes to financial statements
10
Eaton Vance National Limited Maturity Municipals Fund as of September 30, 2005
PORTFOLIO OF INVESTMENTS (Unaudited) CONT'D
Principal Amount
(000's omitted) | |
Security | |
Value | |
| | Solid Waste - 1.1% | | | | |
| $ | 3,000 | | | Niagara County, NY, IDA, (American Ref-Fuel Co. LLC),
(AMT), 5.55%, 11/15/24 | | $ | 3,220,500 | | |
| | | | | | | $ | 3,220,500 | | |
| | Special Tax Revenue - 8.4% | | | | |
| $ | 1,450 | | | Brentwood, CA, Infrastructure Financing Authority,
6.375%, 9/2/33 | | $ | 1,495,385 | | |
| | 2,500 | | | Bridgeville, DE, (Heritage Shores Special Development
District), 5.125%, 7/1/35 | | | 2,503,600 | | |
| | 3,000 | | | California State Economic Recovery, 5.25%, 7/1/13 | | | 3,322,470 | | |
| | 600 | | | Concorde Estates Community Development District, FL,
Capital Improvements, 5.00%, 5/1/11 | | | 603,606 | | |
| | 500 | | | Cottonwood, CO, Water and Sanitation District,
7.75%, 12/1/20 | | | 519,615 | | |
| | 2,000 | | | Detroit, MI, Downtown Development Authority Tax
Increment, 0.00%, 7/1/21 | | | 899,420 | | |
| | 1,400 | | | Dupree Lakes Community Development District, FL,
5.00%, 11/1/10 | | | 1,403,990 | | |
| | 50 | | | Fishhawk, FL, Community Development District,
5.00%, 11/1/07 | | | 50,446 | | |
| | 1,965 | | | Fishhawk, FL, Community Development District II,
5.125%, 11/1/09 | | | 1,990,329 | | |
| | 250 | | | Frederick County, MD, Urbana Community Development
Authority, 6.625%, 7/1/25 | | | 265,450 | | |
| | 365 | | | Gateway, FL, Services Community Development District,
(Stoneybrook), 5.50%, 7/1/08 | | | 367,993 | | |
| | 1,730 | | | Heritage Harbour, FL, South Community Development
District, Capital Improvements, 5.25%, 11/1/08 | | | 1,742,681 | | |
| | 85 | | | Heritage Palms Community Development District, FL,
Capital Improvements, 6.25%, 11/1/07 | | | 85,921 | | |
| | 785 | | | Jurupa, CA, Community Services District, 5.00%, 9/1/25 | | | 777,645 | | |
| | 100 | | | Longleaf, FL, Community Development District,
6.20%, 5/1/09 | | | 100,314 | | |
| | 3,000 | | | New Jersey EDA, (Cigarette Tax), 5.50%, 6/15/16 | | | 3,277,830 | | |
| | 1,000 | | | New York Local Government Assistance Corp.,
5.25%, 4/1/16 | | | 1,105,890 | | |
| | 1,985 | | | Sterling Hill Community Development District, FL,
Capital Improvements, 5.50%, 11/1/10 | | | 1,999,669 | | |
| | 850 | | | Tiverton, RI, Obligation Tax Increment, (Mount Hope Bay
Village), 6.00%, 5/1/09 | | | 875,526 | | |
| | | | | | | $ | 23,387,780 | | |
| | Transportation - 1.4% | | | | |
| $ | 100 | | | Eagle County, CO, Airport Terminal Corp., (American
Airlines), (AMT), 6.75%, 5/1/06 | | $ | 100,752 | | |
| | 2,500 | | | Louisiana Offshore Terminal Authority, Deepwater Port
Revenue, (Loop, LLC), 5.25%, 9/1/15 | | | 2,593,625 | | |
Principal Amount
(000's omitted) | |
Security | |
Value | |
| Transportation (continued) | |
| $ | 1,000 | | | Port Authority of New York and New Jersey,
5.375%, 3/1/28 | | $ | 1,135,720 | | |
| | | | | $ | 3,830,097 | | |
Total Tax-Exempt Investments - 98.3%
(identified cost $264,132,843) | | | | $ | 272,958,142 | | |
| Other Assets, Less Liabilities - 1.7% | | | | $ | 4,722,172 | | |
| Net Assets - 100.0% | | | | $ | 277,680,314 | | |
AMBAC - AMBAC Financial Group, Inc.
AMT - Interest earned from these securities may be considered a tax preference item for purposes of the Federal Alternative Minimum Tax.
FGIC - Financial Guaranty Insurance Company
FSA - Financial Security Assurance, Inc.
MBIA - Municipal Bond Insurance Association
XLCA - XL Capital Assurance, Inc.
At September 30, 2005, the concentration of the Fund's investments in the various states, determined as a percentage of net assets, is as follows:
| New Jersey | | | 10.6 | % | |
| New York | | | 10.9 | % | |
| Others, representing less than 10% individually | | | 76.8 | % | |
The Fund invests primarily in debt securities issued by municipalities. The ability of the issuers of the debt securities to meet their obligations may be affected by economic developments in a specific industry or municipality. In order to reduce the risk associated with such economic developments, at September 30, 2005, 38.2% of the securities in the portfolio of investments are backed by bond insurance of various financial institutions and financial guaranty assurance agencies. The aggregate percentage insured by an individual financial institution ranged from 1.2% to 11.1% of total investments.
(1) Security (or a portion thereof) has been segregated to cover when-issued securities.
(2) When-issued security.
(3) Security exempt from registration under Rule 144A of the Securities Act of 1933. These securities may be sold in transactions exempt from registration, normally to qualified institutional buyers. At September 30, 2005, the aggregate value of the securities is $7,183,323 or 2.6% of the Fund's net assets.
(4) Security has been issued as a leveraged inverse floater bond. The stated interest rate represents the rate in effect at September 30, 2005.
(5) Defaulted bond.
(6) Security (or a portion thereof) has been segregated to cover margin requirements on open financial futures contracts.
(7) Step bond.
(8) Security is in default and making only partial interest payments.
See notes to financial statements
11
Eaton Vance National Limited Maturity Municipals Fund as of September 30, 2005
FINANCIAL STATEMENTS (Unaudited)
Statement of Assets and Liabilities
As of September 30, 2005
| Assets | | | |
| Investments, at value (identified cost, $264,132,843) | | $ | 272,958,142 | | |
| Cash | | | 844,408 | | |
| Receivable for investments sold | | | 647,574 | | |
| Receivable for Fund shares sold | | | 6,728,987 | | |
| Interest receivable | | | 4,017,561 | | |
| Receivable for daily variation margin on open financial futures contracts | | | 126,890 | | |
| Prepaid expenses | | | 14,509 | | |
| Total assets | | $ | 285,338,071 | | |
| Liabilities | | | |
| Payable for investments purchased | | $ | 5,432,983 | | |
| Payable for when-issued securities | | | 1,172,578 | | |
| Dividends payable | | | 406,388 | | |
| Payable for Fund shares redeemed | | | 326,306 | | |
| Payable to affiliate for distribution and service fees | | | 146,667 | | |
| Payable to affiliate for investment advisory fees | | | 99,676 | | |
| Payable to affiliate for Trustees' fees | | | 35 | | |
| Accrued expenses | | | 73,124 | | |
| Total liabilities | | $ | 7,657,757 | | |
| Net assets | | $ | 277,680,314 | | |
| Sources of Net Assets | | | |
| Paid-in capital | | $ | 274,044,615 | | |
| Accumulated net realized loss (computed on the basis of identified cost) | | | (5,667,227 | ) | |
| Accumulated distributions in excess of net investment income | | | (230,787 | ) | |
| Net unrealized appreciation (computed on the basis of identified cost) | | | 9,533,713 | | |
| Total | | $ | 277,680,314 | | |
| Class A Shares | | | |
| Net Assets | | $ | 172,422,053 | | |
| Shares Outstanding | | | 16,787,222 | | |
Net Asset Value and Redemption Price Per Share
(net assets ÷ shares of beneficial interest outstanding) | | $ | 10.27 | | |
Maximum Offering Price Per Share
(100 ÷ 97.75 of $10.27) | | $ | 10.51 | | |
| Class B Shares | | | |
| Net Assets | | $ | 24,688,408 | | |
| Shares Outstanding | | | 2,401,784 | | |
Net Asset Value, Offering Price and Redemption Price Per Share
(net assets ÷ shares of beneficial interest outstanding) | | $ | 10.28 | | |
| Class C Shares | | | |
| Net Assets | | $ | 80,569,853 | | |
| Shares Outstanding | | | 8,365,839 | | |
Net Asset Value, Offering Price and Redemption Price Per Share
(net assets ÷ shares of beneficial interest outstanding) | | $ | 9.63 | | |
| On sales of $100,000 or more, the offering price of Class A shares is reduced. | |
Statement of Operations
For the Six Months Ended
September 30, 2005
| Investment Income | | | |
| Interest | | $ | 6,274,882 | | |
| Total investment income | | $ | 6,274,882 | | |
| Expenses | | | |
| Investment adviser fee | | $ | 587,057 | | |
| Trustees' fees and expenses | | | 8,514 | | |
Distribution and service fees
Class A | | | 119,656 | | |
| Class B | | | 119,648 | | |
| Class C | | | 358,554 | | |
| Custodian fee | | | 85,254 | | |
| Transfer and dividend disbursing agent fees | | | 66,127 | | |
| Registration fees | | | 37,462 | | |
| Legal and accounting services | | | 27,177 | | |
| Printing and postage | | | 14,705 | | |
| Miscellaneous | | | 21,154 | | |
| Total expenses | | $ | 1,445,308 | | |
Deduct -
Reduction of custodian fee | | $ | 26,864 | | |
| Total expense reductions | | $ | 26,864 | | |
| Net expenses | | $ | 1,418,444 | | |
| Net investment income | | $ | 4,856,438 | | |
| Realized and Unrealized Gain (Loss) | | | |
Net realized gain (loss) -
Investment transactions (identified cost basis) | | $ | 564,505 | | |
| Financial futures contracts | | | (1,450,378 | ) | |
| Net realized loss | | $ | (885,873 | ) | |
Change in unrealized appreciation (depreciation) -
Investments (identified cost basis) | | $ | 1,929,091 | | |
| Financial futures contracts | | | 375,203 | | |
| Net change in unrealized appreciation (depreciation) | | $ | 2,304,294 | | |
| Net realized and unrealized gain | | $ | 1,418,421 | | |
| Net increase in net assets from operations | | $ | 6,274,859 | | |
See notes to financial statements
12
Eaton Vance National Limited Maturity Municipals Fund as of September 30, 2005
FINANCIAL STATEMENTS CONT'D
Statements of Changes in Net Assets
Increase (Decrease)
in Net Assets | | Six Months Ended
September 30, 2005
(Unaudited) | | Year Ended
March 31, 2005 | |
From operations -
Net investment income | | $ | 4,856,438 | | | $ | 8,972,540 | | |
Net realized loss from investment transactions
and financial futures contracts | | | (885,873 | ) | | | (265,297 | ) | |
Net change in unrealized appreciation
(depreciation) from investments and
financial futures contracts | | | 2,304,294 | | | | (4,315,100 | ) | |
| Net increase in net assets from operations | | $ | 6,274,859 | | | $ | 4,392,143 | | |
Distributions to shareholders -
From net investment income
Class A | | $ | (3,167,079 | ) | | $ | (5,454,047 | ) | |
| Class B | | | (429,194 | ) | | | (1,048,876 | ) | |
| Class C | | | (1,284,577 | ) | | | (2,470,667 | ) | |
| Total distributions to shareholders | | $ | (4,880,850 | ) | | $ | (8,973,590 | ) | |
Transactions in shares of beneficial interest -
Proceeds from sale of shares
Class A | | $ | 31,892,656 | | | $ | 64,046,619 | | |
| Class B | | | 2,022,144 | | | | 7,250,045 | | |
| Class C | | | 10,671,884 | | | | 25,915,496 | | |
Net asset value of shares issued to
shareholders in payment of
distributions declared
Class A | | | 1,891,861 | | | | 3,133,855 | | |
| Class B | | | 250,265 | | | | 558,191 | | |
| Class C | | | 580,051 | | | | 1,076,697 | | |
Cost of shares redeemed
Class A | | | (16,461,770 | ) | | | (50,093,129 | ) | |
| Class B | | | (2,723,187 | ) | | | (6,533,382 | ) | |
| Class C | | | (8,430,190 | ) | | | (15,450,266 | ) | |
Net asset value of shares exchanged
Class A | | | 2,186,535 | | | | 7,265,517 | | |
| Class B | | | (2,186,535 | ) | | | (7,265,517 | ) | |
Net increase in net assets from Fund
share transactions | | $ | 19,693,714 | | | $ | 29,904,126 | | |
| Net increase in net assets | | $ | 21,087,723 | | | $ | 25,322,679 | | |
| Net Assets | | Six Months Ended
September 30, 2005
(Unaudited) | | Year Ended
March 31, 2005 | |
| At beginning of period | | $ | 256,592,591 | | | $ | 231,269,912 | | |
| At end of period | | $ | 277,680,314 | | | $ | 256,592,591 | | |
Accumulated
distributions in excess of
net investment income
included in net assets | | | |
| At end of period | | $ | (230,787 | ) | | $ | (206,375 | ) | |
See notes to financial statements
13
Eaton Vance National Limited Maturity Municipals Fund as of September 30, 2005
FINANCIAL STATEMENTS CONT'D
Financial Highlights
| | | Class A | |
| | | Six Months Ended
September 30, 2005 | | Year Ended March 31, | |
| | | (Unaudited)(1) | | 2005(1) | | 2004(1) | | 2003(1) | | 2002(1)(2) | | 2001 | |
| Net asset value - Beginning of period | | $ | 10.210 | | | $ | 10.400 | | | $ | 10.250 | | | $ | 9.860 | | | $ | 10.040 | | | $ | 9.790 | | |
| Income (loss) from operations | |
| Net investment income | | $ | 0.205 | | | $ | 0.422 | | | $ | 0.437 | | | $ | 0.461 | | | $ | 0.485 | | | $ | 0.531 | | |
| Net realized and unrealized gain (loss) | | | 0.061 | | | | (0.187 | ) | | | 0.138 | | | | 0.395 | | | | (0.152 | ) | | | 0.241 | | |
| Total income from operations | | $ | 0.266 | | | $ | 0.235 | | | $ | 0.575 | | | $ | 0.856 | | | $ | 0.333 | | | $ | 0.772 | | |
| Less distributions | |
| From net investment income | | $ | (0.206 | ) | | $ | (0.425 | ) | | $ | (0.425 | ) | | $ | (0.466 | ) | | $ | (0.513 | ) | | $ | (0.522 | ) | |
| Total distributions | | $ | (0.206 | ) | | $ | (0.425 | ) | | $ | (0.425 | ) | | $ | (0.466 | ) | | $ | (0.513 | ) | | $ | (0.522 | ) | |
| Net asset value - End of period | | $ | 10.270 | | | $ | 10.210 | | | $ | 10.400 | | | $ | 10.250 | | | $ | 9.860 | | | $ | 10.040 | | |
| Total Return(3) | | | 2.63 | % | | | 2.29 | % | | | 5.70 | % | | | 8.90 | % | | | 3.39 | % | | | 8.12 | % | |
| Ratios/Supplemental Data | |
| Net assets, end of period (000's omitted) | | $ | 172,422 | | | $ | 152,111 | | | $ | 130,466 | | | $ | 119,619 | | | $ | 83,647 | | | $ | 71,365 | | |
| Ratios (As a percentage of average daily net assets): | |
| Expenses(4) | | | 0.79 | %(5) | | | 0.80 | %† | | | 0.80 | % | | | 0.82 | % | | | 0.91 | % | | | 0.94 | % | |
| Expenses after custodian fee reduction(4) | | | 0.77 | %(5) | | | 0.79 | %† | | | 0.80 | % | | | 0.81 | % | | | 0.88 | % | | | 0.93 | % | |
| Net investment income | | | 3.95 | %(5) | | | 4.09 | %† | | | 4.22 | % | | | 4.54 | % | | | 4.85 | % | | | 5.37 | % | |
| Portfolio Turnover of the Portfolio(6) | | | - | | | | 14 | % | | | 27 | % | | | 24 | % | | | 12 | % | | | 13 | % | |
| Portfolio Turnover of the Fund | | | 17 | % | | | 19 | % | | | - | | | | - | | | | - | | | | - | | |
† The operating expenses of the Fund reflect a reduction of the investment advisor fee. Had such actions not been taken, the ratios would have been the same.
(1) Net investment income per share was computed using the average shares outstanding.
(2) The Fund, through its investment in the Portfolio, has adopted the provisions of the revised AICPA Audit and Accouting Guide for Investment Companies and began using the interest method to amortize premiums on fixed-income securities. The effect of this change for the year ended March 31, 2002 was to increase net investment income per share by $0.002, and increase net realized and unrealized losses per share by $0.002, and increase the ratio of net investment income to average net assets from 4.83% to 4.85%. Per share data and ratios for the periods prior to April 1, 2001 have not been restated to reflect this change in presentation.
(3) Returns are historical and are calculated by determining the percentage change in net asset value with all distributions reinvested. Total return is not computed on an annualized basis.
(4) Includes the Fund's share of the Portfolio's allocated expenses while the Fund was making investments directly into the Portfolio.
(5) Annualized.
(6) Portfolio turnover represents the rate of portfolio activity for the period while the Fund was making investments directly into the Portfolio.
See notes to financial statements
14
Eaton Vance National Limited Maturity Municipals Fund as of September 30, 2005
FINANCIAL STATEMENTS CONT'D
Financial Highlights
| | | Class B | |
| | | Six Months Ended
September 30, 2005 | | Year Ended March 31, | |
| | | (Unaudited)(1) | | 2005(1) | | 2004(1) | | 2003(1) | | 2002(1)(2) | | 2001 | |
| Net asset value - Beginning of period | | $ | 10.220 | | | $ | 10.410 | | | $ | 10.260 | | | $ | 9.860 | | | $ | 10.040 | | | $ | 9.790 | | |
| Income (loss) from operations | | | |
| Net investment income | | $ | 0.166 | | | $ | 0.346 | | | $ | 0.360 | | | $ | 0.381 | | | $ | 0.409 | | | $ | 0.461 | | |
| Net realized and unrealized gain (loss) | | | 0.061 | | | | (0.191 | ) | | | 0.142 | | | | 0.405 | | | | (0.155 | ) | | | 0.232 | | |
| Total income from operations | | $ | 0.227 | | | $ | 0.155 | | | $ | 0.502 | | | $ | 0.786 | | | $ | 0.254 | | | $ | 0.693 | | |
| Less distributions | | | |
| From net investment income | | $ | (0.167 | ) | | $ | (0.345 | ) | | $ | (0.352 | ) | | $ | (0.386 | ) | | $ | (0.434 | ) | | $ | (0.443 | ) | |
| Total distributions | | $ | (0.167 | ) | | $ | (0.345 | ) | | $ | (0.352 | ) | | $ | (0.386 | ) | | $ | (0.434 | ) | | $ | (0.443 | ) | |
| Net asset value - End of period | | $ | 10.280 | | | $ | 10.220 | | | $ | 10.410 | | | $ | 10.260 | | | $ | 9.860 | | | $ | 10.040 | | |
| Total Return(3) | | | 2.24 | % | | | 1.51 | % | | | 4.94 | % | | | 8.15 | % | | | 2.58 | % | | | 7.26 | % | |
| Ratios/Supplemental Data | | | |
| Net assets, end of period (000's omitted) | | $ | 24,688 | | | $ | 27,157 | | | $ | 33,731 | | | $ | 32,517 | | | $ | 10,638 | | | $ | 7,840 | | |
| Ratios (As a percentage of average daily net assets): | |
| Expenses(4) | | | 1.54 | %(5) | | | 1.55 | %† | | | 1.55 | % | | | 1.57 | % | | | 1.66 | % | | | 1.68 | % | |
| Expenses after custodian fee reduction(4) | | | 1.52 | %(5) | | | 1.54 | %† | | | 1.55 | % | | | 1.56 | % | | | 1.63 | % | | | 1.67 | % | |
| Net investment income | | | 3.21 | %(5) | | | 3.36 | %† | | | 3.48 | % | | | 3.75 | % | | | 4.09 | % | | | 4.61 | % | |
| Portfolio Turnover of the Portfolio(6) | | | - | | | | 14 | % | | | 27 | % | | | 24 | % | | | 12 | % | | | 13 | % | |
| Portfolio Turnover of the Fund | | | 17 | % | | | 19 | % | | | - | | | | - | | | | - | | | | - | | |
† The operating expenses of the Fund reflect a reduction of the investment advisor fee. Had such actions not been taken, the ratios would have been the same.
(1) Net investment income per share was computed using the average shares outstanding.
(2) The Fund, through its investment in the Portfolio, has adopted the provisions of the revised AICPA Audit and Accouting Guide for Investment Companies and began using the interest method to amortize premiums on fixed-income securities. The effect of this change for the year ended March 31, 2002 was to increase net investment income per share by $0.002, and increase net realized and unrealized losses per share by $0.002, and increase the ratio of net investment income to average net assets from 4.07% to 4.09%. Per share data and ratios for the periods prior to April 1, 2001 have not been restated to reflect this change in presentation.
(3) Returns are historical and are calculated by determining the percentage change in net asset value with all distributions reinvested. Total return is not computed on an annualized basis.
(4) Includes the Fund's share of the Portfolio's allocated expenses while the Fund was making investments directly into the Portfolio.
(5) Annualized.
(6) Portfolio turnover represents the rate of portfolio activity for the period while the Fund was making investments directly into the Portfolio.
See notes to financial statements
15
Eaton Vance National Limited Maturity Municipals Fund as of September 30, 2005
FINANCIAL STATEMENTS CONT'D
Financial Highlights
| | | Class C | |
| | | Six Months Ended
September 30, 2005 | | Year Ended March 31, | |
| | | (Unaudited)(1) | | 2005(1) | | 2004(1) | | 2003(1) | | 2002(1)(2) | | 2001 | |
| Net asset value - Beginning of period | | $ | 9.580 | | | $ | 9.750 | | | $ | 9.610 | | | $ | 9.240 | | | $ | 9.400 | | | $ | 9.160 | | |
| Income (loss) from operations | |
| Net investment income | | $ | 0.156 | | | $ | 0.324 | | | $ | 0.335 | | | $ | 0.357 | | | $ | 0.379 | | | $ | 0.423 | | |
| Net realized and unrealized gain (loss) | | | 0.051 | | | | (0.171 | ) | | | 0.133 | | | | 0.379 | | | | (0.138 | ) | | | 0.225 | | |
| Total income from operations | | $ | 0.207 | | | $ | 0.153 | | | $ | 0.468 | | | $ | 0.736 | | | $ | 0.241 | | | $ | 0.648 | | |
| Less distributions | |
| From net investment income | | $ | (0.157 | ) | | $ | (0.323 | ) | | $ | (0.328 | ) | | $ | (0.366 | ) | | $ | (0.401 | ) | | $ | (0.408 | ) | |
| Total distributions | | $ | (0.157 | ) | | $ | (0.323 | ) | | $ | (0.328 | ) | | $ | (0.366 | ) | | $ | (0.401 | ) | | $ | (0.408 | ) | |
| Net asset value - End of period | | $ | 9.630 | | | $ | 9.580 | | | $ | 9.750 | | | $ | 9.610 | | | $ | 9.240 | | | $ | 9.400 | | |
| Total Return(3) | | | 2.17 | % | | | 1.51 | %(4) | | | 4.93 | % | | | 8.12 | % | | | 2.58 | % | | | 7.25 | % | |
| Ratios/Supplemental Data | |
| Net assets, end of period (000's omitted) | | $ | 80,570 | | | $ | 77,325 | | | $ | 67,073 | | | $ | 46,629 | | | $ | 19,488 | | | $ | 7,517 | | |
| Ratios (As a percentage of average daily net assets): | |
| Expenses(5) | | | 1.54 | %(6) | | | 1.55 | %† | | | 1.55 | % | | | 1.57 | % | | | 1.66 | % | | | 1.69 | % | |
| Expenses after custodian fee reduction(5) | | | 1.52 | %(6) | | | 1.54 | %† | | | 1.55 | % | | | 1.56 | % | | | 1.63 | % | | | 1.68 | % | |
| Net investment income | | | 3.20 | %(6) | | | 3.35 | %† | | | 3.45 | % | | | 3.75 | % | | | 4.05 | % | | | 4.61 | % | |
| Portfolio Turnover of the Portfolio(7) | | | - | | | | 14 | % | | | 27 | % | | | 24 | % | | | 12 | % | | | 13 | % | |
| Portfolio Turnover of the Fund | | | 17 | % | | | 19 | % | | | - | | | | - | | | | - | | | | - | | |
† The operating expenses of the Fund reflect a reduction of the investment advisor fee. Had such actions not been taken, the ratios would have been the same.
(1) Net investment income per share was computed using the average shares outstanding.
(2) The Fund, through its investment in the Portfolio, has adopted the provisions of the revised AICPA Audit and Accouting Guide for Investment Companies and began using the interest method to amortize premiums on fixed-income securities. The effect of this change for the year ended March 31, 2002 was to increase net investment income per share by $0.002, and increase net realized and unrealized losses per share by $0.002, and increase the ratio of net investment income to average net assets from 4.03% to 4.05%. Per share data and ratios for the periods prior to April 1, 2001 have not been restated to reflect this change in presentation.
(3) Returns are historical and are calculated by determining the percentage change in net asset value with all distributions reinvested. Total return is not computed on an annualized basis.
(4) Total return reflects a decrease of 0.07% due to a change in the timing of the payment and reinvestment of distributions.
(5) Includes the Fund's share of the Portfolio's allocated expenses while the Fund was making investments directly into the Portfolio.
(6) Annualized.
(7) Portfolio turnover represents the rate of portfolio activity for the period while the Fund was making investments directly into the Portfolio.
See notes to financial statements
16
Eaton Vance National Limited Maturity Municipals Fund as of September 30, 2005
NOTES TO FINANCIAL STATEMENTS (Unaudited)
1 Significant Accounting Policies
Eaton Vance National Limited Maturity Municipals Fund (the Fund) is a diversified series of Eaton Vance Investment Trust (the Trust). The Trust is an entity of the type commonly known as a Massachusetts business trust and is registered under the Investment Company Act of 1940, as amended, as an open-end management investment company. The Fund seeks to achieve current income exempt from regular federal income tax and particular state or local income or other taxes by investing primarily in investment grade municipal obligations. The Fund offers three classes of shares: Class A, Class B and Class C shares. Class A shares are generally sold subject to a sales charge imposed at time of purchase. Class B and Class C shares are sold at net asset value and are subject to a contingent deferred sales charge (see Note 6). Class B shares held longer than (i) four yea rs or (ii) the time at which the contingent deferred sales charge applicable to such shares expires will automatically convert to Class A shares. In addition, Class B shares acquired through the reinvestment of distributions will also convert to Class A shares in proportion to shares not acquired through reinvestment. Each class represents a pro rata interest in the Fund, but votes separately on class-specific matters and (as noted below) is subject to different expenses. Realized and unrealized gains or losses are allocated daily to each class of shares based on the relative net assets of each class to the total net assets of the Fund. Net investment income, other than class specific expenses, is allocated daily to each class of shares based upon the ratio of the value of paid shares of each class to the total value of all paid shares. Each class of shares differs in its distribution plan and certain other class specific expenses.
On October 8, 2004, the Fund received its pro rata share of cash and securities from the National Limited Maturity Municipals Portfolio (the Portfolio) in a complete liquidation of its interests in the Portfolio. Subsequent to October 8, 2004, the Fund invests directly in securities rather than through the Portfolio and maintains the same investment objective.
The following is a summary of significant accounting policies consistently followed by the Fund in the preparation of its financial statements. The policies are in conformity with accounting principles generally accepted in the United States of America.
A Investment Valuation - Municipal bonds and taxable obligations, if any, are normally valued on the basis of valuations furnished by a pricing service. Financial futures contracts and options on financial future contracts listed on the commodity exchanges are valued at closing settlement prices. Over-The-Counter options on futures contracts are normally valued at the mean between the latest bid and asked price. Interest rate swaps are normally valued on the basis of valuations furnished by a broker. Short-term obligations, maturing in sixty days or less, are valued at amortized cost, which approximates value. Investments for which valuations or market quotations are unavailable are valued at fair value using methods determined in good faith by or at the direction of the Trustees.
B Income - Interest income is determined on the basis of interest accrued, adjusted for amortization of premium or discount.
C Expenses - The majority of expenses of the Trust are directly identifiable to an individual fund. Expenses which are not readily identifiable to a specific fund are allocated taking into consideration, among other things, the nature and type of expense and the relative size of the funds.
D Federal Taxes - The Fund's policy is to comply with the provisions of the Internal Revenue Code applicable to regulated investment companies and to distribute to shareholders each year all of its taxable income, if any, and tax-exempt income, including any net realized gain on investments. Accordingly, no provision for federal income or excise tax is necessary. At March 31, 2005, the Fund, for federal income tax purposes, had a capital loss carryover of $4,687,486 which will reduce the taxable income arising from future net realized gain on investments, if any, to the extent permitted by the Internal Revenue Code and thus will reduce the amount of distributions t o shareholders which would otherwise be necessary to relieve the Fund of any liability for federal income tax. Such capital loss carryover will expire as follows on: March 31, 2006, $320,446, March 31, 2007, $60,400, March 31, 2009, $248,691, March 31, 2010, $146,034, March 31, 2011, $1,719,505, March 31, 2012, $779,785 and March 31, 2013, $1,412,625. Dividends paid by the Fund from net interest on tax-exempt municipal bonds are not includable by shareholders as gross income for federal income tax purposes because the Fund intends to meet certain requirements of the Internal Revenue Code applicable to regulated Investment companies which will enable the Fund to pay exempt-interest dividends. The portion of such interest, if any, earned on private activity bonds issued after August 7, 1986, may be considered a tax preference item to shareholders.
17
Eaton Vance National Limited Maturity Municipals Fund as of September 30, 2005
NOTES TO FINANCIAL STATEMENTS (Unaudited) CONT'D
E Financial Futures Contracts - Upon the entering of a financial futures contract, the Fund is required to deposit (initial margin) either in cash or securities an amount equal to a certain percentage of the purchase price indicated in the financial futures contract. Subsequent payments are made or received by the Fund (margin maintenance) each day, dependent on the daily fluctuations in the value of the underlying security, and are recorded for book purposes as unrealized gains or losses by the Fund. The Fund's investment in financial futures contracts is designed only to hedge against anticipated future changes in interest rates and investment purposes. Should interes t rates move unexpectedly, the Fund may not achieve the anticipated benefits of the financial futures contracts and may realize a loss.
F Legal Fees - Legal fees and other related expenses incurred as part of negotiations of the terms and requirements of capital infusions, or that are expected to result in the restructuring of or a plan of reorganization for an investment are recorded as realized losses. Ongoing expenditures to protect or enhance an investment are treated as operating expenses.
G Options on Financial Futures Contracts - Upon the purchase of a put option on a financial futures contract by the Fund, the premium paid is recorded as an investment, the value of which is marked-to-market daily. When a purchased option expires, the Fund will realize a loss in the amount of the cost of the option. When the Fund enters into a closing sale transaction, the Fund will realize a gain or loss depending on whether the sales proceeds from the closing sale transaction are greater or less than the cost of the option. When the Fund exercises a put option, settlement is made in cash. The risk associated with purchasing put options is limited to the premium origin ally paid.
H When-issued and Delayed Transactions - The Fund may engage in when-issued and delayed delivery transactions. The Fund records when-issued securities on trade date and maintains security positions such that sufficient liquid assets will be available to make payments for the securities purchased. Securities purchased on a when-issued or delayed delivery basis are marked-to-market daily and begin earning interest on settlement date.
I Expense Reduction - Investors Bank & Trust Company (IBT) serves as custodian of the Fund. Pursuant to the custodian agreement, IBT receives a fee reduced by credits which are determined based on the average daily cash balance the Fund maintains with IBT. All credit balances used to reduce the Fund's custodian fees are reported as a reduction of total expenses on the Statement of Operations.
J Use of Estimates - The preparation of the financial statements in conformity with accounting principles generally accepted in the United States of America requires management to make estimates and assumptions that affect the reported amounts of assets and liabilities at the date of the financial statements and the reported amounts of income and expense during the reporting period. Actual results could differ from those estimates.
K Indemnifications - Under the Trust's organizational documents, its officers and Trustees may be indemnified against certain liabilities and expenses arising out of the performance of their duties to the Fund and shareholders are indemnified against personal liability for obligations of the Trust. Additionally, in the normal course of business, the Fund enters into agreements with service providers that may contain indemnification clauses. The Fund's maximum exposure under these arrangements is unknown as this would involve future claims that may be made against the Fund that have not yet occurred.
L Other - Investment transactions are accounted for on a trade-date basis. Realized gains and losses are computed on the specific identification of securities sold.
M Interim Financial Statements - The interim financial statements relating to September 30, 2005 and for the six months then ended have not been audited by an Independent Registered Public Accounting Firm, but in the opinion of the Fund's management reflect all adjustments, consisting only of normal recurring adjustments, necessary for the fair presentation of the financial statements.
2 Distributions to Shareholders
The net income of the Fund is determined daily and substantially all of the net income so determined is declared as a dividend to shareholders of record at the time of declaration. Dividends are declared separately for each class of shares. Distributions are paid monthly. Distributions of allocated realized capital gains, if any, are made at least annually. Shareholders may reinvest income and capital gain distributions in additional shares of the same class of the Fund at the net asset value as of the reinvestment date. Distributions are paid in the form of additional shares of the same class or, at the election of the shareholder, in cash. The Fund distinguishes between distributions on a tax basis and a financial reporting basis. Accounting principles
18
Eaton Vance National Limited Maturity Municipals Fund as of September 30, 2005
NOTES TO FINANCIAL STATEMENTS (Unaudited) CONT'D
generally accepted in the United States of America require that only distributions in excess of tax basis earnings and profits be reported in the financial statements as a return of capital. Permanent differences between book and tax accounting relating to distributions are reclassified to paid-in capital. The tax treatment of distributions for the calendar year will be reported to shareholders prior to February 1, 2006 and will be based on tax accounting methods which may differ from amounts determined for financial statement purposes.
3 Shares of Beneficial Interest
The Fund's Declaration of Trust permits the Trustees to issue an unlimited number of full and fractional shares of beneficial interest (without par value). Such shares may be issued in a number of different series (such as the Fund) and classes. Transactions in Fund shares were as follows:
| Class A | | Six Months Ended
September 30, 2005
(Unaudited) | | Year Ended
March 31, 2005 | |
| Sales | | | 3,091,841 | | | | 6,206,100 | | |
Issued to shareholders electing to
receive payments of distributions
in Fund shares | | | 183,235 | | | | 304,029 | | |
| Redemptions | | | (1,594,274 | ) | | | (4,862,281 | ) | |
| Exchange from Class B shares | | | 211,764 | | | | 706,919 | | |
| Net increase | | | 1,892,566 | | | | 2,354,767 | | |
| Class B | | Six Months Ended
September 30, 2005
(Unaudited) | | Year Ended
March 31, 2005 | |
| Sales | | | 195,673 | | | | 704,599 | | |
Issued to shareholders electing to
receive payments of distributions
in Fund shares | | | 24,223 | | | | 54,163 | | |
| Redemptions | | | (264,571 | ) | | | (635,881 | ) | |
| Exchange to Class A shares | | | (210,531 | ) | | | (706,414 | ) | |
| Net decrease | | | (255,206 | ) | | | (583,533 | ) | |
| Class C | | Six Months Ended
September 30, 2005
(Unaudited) | | Year Ended
March 31, 2005 | |
| Sales | | | 1,101,853 | | | | 2,689,404 | | |
Issued to shareholders electing to
receive payments of distributions
in Fund shares | | | 59,935 | | | | 111,362 | | |
| Redemptions | | | (870,702 | ) | | | (1,603,822 | ) | |
| Net increase | | | 291,086 | | | | 1,196,944 | | |
4 Investment Adviser Fee and Other Transactions with Affiliates
The investment adviser fee is earned by Boston Management and Research (BMR), a wholly-owned subsidiary of Eaton Vance Management (EVM), as compensation for management and investment advisory services rendered to the Fund. The fee is based upon a percentage of average daily net assets plus a percentage of gross income (i.e., income other than gains from the sale of securities). For the six months ended September 30, 2005 the advisory fee amounted to $587,057 representing 0.44% (annualized) of the Fund's average daily net assets.
EVM serves as the sub-transfer agent of the Fund and receives from the transfer agent an aggregate fee based upon the actual expenses incurred by EVM in the performance of those activities. For the six months ended September 30, 2005, EVM earned $4,151 in sub-transfer agent fees.
The Fund was informed that Eaton Vance Distributors, Inc. (EVD), a subsidiary of EVM and the Fund's principal underwriter, received approximately $11,200 as its portion of the sales charge on sales of Class A shares for the six months ended September 30, 2005.
Except as to Trustees of the Fund who are not members of EVM's or BMR's organization, officers and Trustees receive remuneration for their services to the Fund out of such investment adviser fee. Trustees of the Fund that are not affiliated with the Investment Adviser may elect to defer receipt of all or a percentage of their annual fees in accordance with the terms of the Trustees Deferred Compensation Plan. For the six months ended September 30, 2005, no significant amounts have been deferred.
Certain officers and Trustees of the Fund are officers of the above organizations.
5 Distribution and Service Plans
The Fund has in effect a distribution plan for Class B shares (Class B Plan) and for Class C shares (Class C Plan) pursuant to Rule 12b-1 under the Investment Company Act of 1940 and a service plan for Class A shares (Class A Plan), (collectively, the Plans). The Class B and Class C Plans require the Fund to pay EVD amounts equal to 1/365 of 0.75% of the Fund's daily net assets attributable to Class B and Class C shares for providing ongoing distribution services and facilities to the Fund. The Fund will automatically discontinue payments to EVD during any
19
Eaton Vance National Limited Maturity Municipals Fund as of September 30, 2005
NOTES TO FINANCIAL STATEMENTS (Unaudited) CONT'D
period in which there are no outstanding Uncovered Distribution Charges, which are equivalent to the sum of (i) 3% of the aggregate amount received by the Fund for Class B shares sold and 6.25% of Class C sales of the amount received by the Fund for each share sold and, (ii) interest calculated by applying the rate of 1% over the prevailing prime rate to the outstanding balance of Uncovered Distribution Charges of EVD of each respective class, reduced by the aggregate amount of contingent deferred sales charges (see Note 6) and amounts theretofore paid to or payable to EVD. The amount payable to EVD with respect to each day is accrued on such day as a liability of the Fund and, accordingly, reduces the Fund's net assets. For the six months ended September��30, 2005, the Fund paid or accrued $99,707 and $298,795 for Class B and Class C shares, respectively, to EV D, representing 0.75% (annualized) of the average daily net assets for Class B and Class C shares. At September 30, 2005, the amount of Uncovered Distribution Charges of EVD calculated under the Plan was approximately $1,355,000 and $39,361,000 for Class B and Class C shares, respectively.
The Plans authorize each class to make payments of service fees to EVD, investment dealers and other persons in amounts not exceeding 0.25% (annualized) of the Fund's average daily net assets for each fiscal year. The Trustees approved quarterly service fee payments equal to 0.15% per annum of the Fund's average daily net assets attributable to Class A, Class B, and Class C shares for each fiscal year. Service fee payments will be made for personal services and/or the maintenance of shareholder accounts. Service fees are separate and distinct from the sales commissions and distribution fees payable by the Fund to EVD, and, as such are not subject to automatic discontinuance when there are no outstanding Uncovered Distribution Charges of EVD. Service fee payments for the six months ended September 30, 2005 amounted to $119,656, $19,941, and $59,759 for Class A, Class ;B, and Class C shares, respectively.
Certain officers and Trustees of the Fund are officers or directors of EVD.
6 Contingent Deferred Sales Charge
A contingent deferred sales charge (CDSC) generally is imposed on redemptions of Class B shares made within four years of purchase and on redemptions of Class C shares made within one year of purchase. Class A shares purchased at net asset value in amounts of $1 million or more (other than shares purchased in a single transaction of $5 million or more) are subject to a 1.00% CDSC if redeemed within 18 months of purchase. Generally, the CDSC is based upon the lower of the net asset value at date of redemption or date of purchase. No charge is levied on Class B and Class C shares acquired by reinvestment of dividends or capital gains distributions. The CDSC for Class B shares is imposed at declining rates that begin at 3% in the case of redemptions in the first ye ar of purchase. Class C shares are subject to a 1% CDSC if redeemed within one year of purchase. No CDSC is levied on shares which have been sold to EVM or its affiliates or to their respective employees or clients and may be waived under certain other limited conditions. CDSC charges are paid to EVD to reduce the amount of Uncovered Distribution Charges calculated under the Fund's Distribution Plan (see Note 5). CDSC charges received when no Uncovered Distribution Charges exist will be credited to the Fund. EVD received approximately $6,000, $36,000 and $48,000 of CDSC paid by shareholders for Class A shares, Class B shares and Class C shares, respectively, for the six months ended September 30, 2005.
7 Investment Transactions
Purchases and sales of investments by the Portfolio, other than U.S. Government securities and short-term obligations, aggregated $61,539,021, and $43,835,730 respectively for the six months ended September 30, 2005.
8 Federal Income Tax Basis of Investments
The cost and unrealized appreciation (depreciation) in value of the investments owned at September 30, 2005, as computed on a federal income tax basis, were as follows:
| Aggregate cost | | $ | 263,960,313 | | |
| Gross unrealized appreciation | | $ | 9,437,250 | | |
| Gross unrealized depreciation | | | (439,421 | ) | |
| Net unrealized appreciation | | $ | 8,997,829 | | |
9 Line of Credit
The Fund participates with other portfolios and funds managed by BMR and EVM and their affiliates in a $150 million unsecured line of credit agreement with a group of banks. Borrowings will be made by the portfolio or fund solely to facilitate the handling of unusual and/or unanticipated short-term cash requirements. Interest is charged to each participating portfolio or fund based on its borrowings at an amount above either the Eurodollar rate or federal funds rate. In addition, a fee computed at an annual rate of 0.10% on the daily unused portion of the line of credit is allocated among the participating portfolios
20
Eaton Vance National Limited Maturity Municipals Fund as of September 30, 2005
NOTES TO FINANCIAL STATEMENTS (Unaudited) CONT'D
and funds at the end of each quarter. The Fund did not have any significant borrowings or allocated fees during the six months ended September 30, 2005.
10 Financial Instruments
The Fund regularly trades in financial instruments with off-balance sheet risk in the normal course of its investing activities to assist in managing exposure to various market risks. These financial instruments include written options and futures contracts and may involve, to a varying degree, elements of risk in excess of the amounts recognized for financial statement purposes. The notional or contractual amounts of these instruments represent the investment the fund has in particular classes of financial instruments and do not necessarily represent the amounts potentially subject to risk. The measurement of the risks associated with these instruments is meaningful only when all related and offsetting transactions are considered.
A summary of obligations under these financial instruments as of September 30, 2005, is as follows:
| Futures Contracts | |
Expiration
Date(s) | | Contracts | | Position | | Aggregate
Cost | | Value | | Net
Unrealized
Appreciation | |
| 12/05 | | 250 U.S.
Treasury Bond | | Short | | $ | (29,256,750 | ) | | $ | (28,601,562 | ) | | $ | 655,188 | | |
| 12/05 | | 101 U.S.
Treasury Note | | Short | | | (11,155,336 | ) | | | (11,102,110 | ) | | | 53,226 | | |
| | | | | | | | | | | $ | 708,414 | | |
At September 30, 2005, the Fund had sufficient cash and/or securities to cover margin requirements on open future contracts.
11 Shareholder Meeting
The Fund held a Special Meeting of Shareholders on April 29, 2005 to elect Trustees. The results of the vote were as follows:
| | | Number of Shares | |
| Nominee for Trustee | | Affirmative | | Withhold | |
| Benjamin C. Esty | | | 13,258,716 | | | | 208,905 | | |
| James B. Hawkes | | | 13,251,498 | | | | 216,123 | | |
| Samuel L. Hayes, III | | | 13,266,128 | | | | 201,493 | | |
| William H. Park | | | 13,264,631 | | | | 202,990 | | |
| Ronald A. Pearlman | | | 13,265,179 | | | | 202,442 | | |
| Norton H. Reamer | | | 13,264,055 | | | | 203,566 | | |
| Lynn A. Stout | | | 13,252,655 | | | | 214,966 | | |
| Ralph F. Verni | | | 13,262,973 | | | | 204,648 | | |
Results are rounded to the nearest whole number.
21
Eaton Vance National Limited Maturity Municipals Fund
BOARD OF TRUSTEES' ANNUAL APPROVAL OF THE INVESTMENT ADVISORY AGREEMENT
The investment advisory agreement between Eaton Vance National Limited Maturity Municipals Fund (the "Fund") and the investment adviser, Boston Management and Research, provides that the advisory agreement will continue in effect from year to year so long as its continuance is approved at least annually (i) by a vote of a majority of the noninterested Trustees of the Fund cast in person at a meeting called for the purpose of voting on such approval and (ii) by the Trustees of the Fund or by vote of a majority of the outstanding interests of the Fund.
In considering the annual approval of the investment advisory agreement between the Fund and the investment adviser, the Special Committee of the Board of Trustees considered information that had been provided throughout the year at regular Board meetings, as well as information furnished to the Special Committee for a series of meetings held in February and March in preparation for a Board meeting held on March 21, 2005 to specifically consider the renewal of the investment advisory agreement. Such information included, among other things, the following:
•An independent report comparing the advisory fees of the Fund with those of comparable funds;
•An independent report comparing the expense ratio of the Fund to those of comparable funds;
•Information regarding Fund investment performance in comparison to a relevant peer group of funds and appropriate indices;
•The economic outlook and the general investment outlook in relevant investment markets;
•Eaton Vance Management's ("Eaton Vance") results and financial condition and the overall organization of the investment adviser;
•The procedures and processes used to determine the fair value of Fund assets and actions taken to monitor and test the effectiveness of such procedures and processes;
•Eaton Vance's management of the relationship with the custodian, subcustodians and fund accountants;
•The resources devoted to compliance efforts undertaken by Eaton Vance on behalf of the funds it manages and the record of compliance with the investment policies and restrictions and with policies on personal securities transactions;
•The quality, nature, cost and character of the administrative and other non-investment management services provided by Eaton Vance and its affiliates; and
•The terms of the advisory agreement and the reasonableness and appropriateness of the particular fee paid by the Fund for the services described herein.
The Special Committee also considered the investment adviser's municipal bond portfolio management capabilities, including information relating to the education, experience and number of investment professionals and other personnel who provide services under the investment advisory agreement. Specifically, the Special Committee considered the investment adviser's 30-person municipal bond team, which includes six portfolio managers and nine credit specialists who provide services to the Fund. The Special Committee noted that the investment adviser's municipal bond team affords the investment adviser extensive in-house research capabilities in addition to the other resources available to the investment adviser. The Special Committee also took into account the time and attention to be devoted by senior management to the Fund and the other funds in the complex. The Special Committee evaluated the l evel of skill required to manage the Fund and concluded that the human resources available at the investment adviser were appropriate to fulfill effectively its duties on behalf of the Fund.
22
Eaton Vance National Limited Maturity Municipals Fund
BOARD OF TRUSTEES' ANNUAL APPROVAL OF THE INVESTMENT ADVISORY AGREEMENT CONT'D
In its review of comparative information with respect to Fund investment performance, the Special Committee concluded that the Fund has performed within a range that the Special Committee deemed competitive. With respect to its review of investment advisory fees, the Special Committee concluded that the fees paid by the Fund are within the range of those paid by comparable funds within the mutual fund industry. In reviewing the information regarding the expense ratio of the Fund, the Special Committee concluded that the Fund's expense ratio is within a range that is competitive with comparable funds.
In addition to the factors mentioned above, the Special Committee reviewed the level of the investment adviser's profits in providing investment management services for the Fund and for all Eaton Vance Funds as a group. The Special Committee also considered the other benefits realized by Eaton Vance and its affiliates in connection with the operation of the Fund. In addition, the Special Committee considered the fiduciary duty assumed by the investment adviser in connection with the services rendered to the Fund and the business reputation of the investment adviser and its financial resources. The Trustees concluded that in light of the services rendered, the profits realized by the investment adviser are not unreasonable. The Special Committee also considered the extent to which the investment adviser appears to be realizing benefits from economies of scale in managing the Fund, and concluded that the fee breakpoints which are in place will allow for an equitable sharing of such benefits, when realized, with the shareholders of the Fund.
The Special Committee did not consider any single factor as controlling in determining whether or not to renew the investment advisory agreement. Nor are the items described herein all the matters considered by the Special Committee. In assessing the information provided by Eaton Vance and its affiliates, the Special Committee also took into consideration the benefits to shareholders of investing in a fund that is a part of a large family of funds which provides a large variety of shareholder services.
Based on its consideration of the foregoing and conclusions, and such other factors and conclusions as it deemed relevant, and assisted by independent counsel, the Special Committee concluded that the renewal of the investment advisory agreement, including the fee structure (described herein), is in the interests of shareholders.
23
Eaton Vance National Limited Maturity Municipals Fund
Eaton Vance National Limited Maturity Municipals Fund
Officers
Cynthia J. Clemson
President
William H. Ahern, Jr.
Vice President and Portfolio Manager
Craig R. Brandon
Vice President
James B. Hawkes
Vice President and Trustee
Robert B. MacIntosh
Vice President
Thomas M. Metzold
Vice President
Barbara E. Campbell
Treasurer
Alan R. Dynner
Secretary
Paul M. O'Neil
Chief Compliance Officer | | Trustees
Samuel L. Hayes, III
Chairman
Benjamin C. Esty
James B. Hawkes
William H. Park
Ronald A. Pearlman
Norton H. Reamer
Lynn A. Stout
Ralph F. Verni | |
|
24
This Page Intentionally Left Blank
Investment Adviser of Eaton Vance National Limited Maturity Municipals Fund
Boston Management and Research
The Eaton Vance Building
255 State Street
Boston, MA 02109
Administrator of Eaton Vance National Limited Maturity Municipals Fund
Eaton Vance Management
The Eaton Vance Building
255 State Street
Boston, MA 02109
Principal Underwriter
Eaton Vance Distributors, Inc.
The Eaton Vance Building
255 State Street
Boston, MA 02109
(617) 482-8260
Custodian
Investors Bank & Trust Company
200 Clarendon Street
Boston, MA 02116
Transfer Agent
PFPC Inc.
Attn: Eaton Vance Funds
P.O. Box 9653
Providence, RI 02940-9653
(800) 262-1122
Eaton Vance National Limited Maturity Municipals Fund
The Eaton Vance Building
255 State Street
Boston, MA 02109
This report must be preceded or accompanied by a current prospectus. Before investing, investors should consider carefully the Fund's investment objective(s), risks, and charges and expenses. The Fund's current prospectus contains this and other information about the Fund and is available through your financial advisor. Please read the prospectus carefully before you invest or send money. For further information please call 1-800-225-6265.
439-11/05 LNASRC

Semiannual Report September 30, 2005


EATON VANCE LIMITED MATURITY MUNICIPALS FUNDS
California
Florida
Massachusetts
New Jersey
New York
Ohio
Pennsylvania
IMPORTANT NOTICES REGARDING PRIVACY,
DELIVERY OF SHAREHOLDER DOCUMENTS,
PORTFOLIO HOLDINGS AND PROXY VOTING
Privacy. The Eaton Vance organization is committed to ensuring your financial privacy. Each of the financial institutions identified below has in effect the following policy ("Privacy Policy") with respect to nonpublic personal information about its customers:
• Only such information received from you, through application forms or otherwise, and information about your Eaton Vance fund transactions will be collected. This may include information such as name, address, social security number, tax status, account balances and transactions.
• None of such information about you (or former customers) will be disclosed to anyone, except as permitted by law (which includes disclosure to employees necessary to service your account). In the normal course of servicing a customer's account, Eaton Vance may share information with unaffiliated third parties that perform various required services such as transfer agents, custodians and broker/dealers.
• Policies and procedures (including physical, electronic and procedural safeguards) are in place that are designed to protect the confidentiality of such information.
• We reserve the right to change our Privacy Policy at any time upon proper notification to you. Customers may want to review our Policy periodically for changes by accessing the link on our homepage: www.eatonvance.com.
Our pledge of privacy applies to the following entities within the Eaton Vance organization: the Eaton Vance Family of Funds, Eaton Vance Management, Eaton Vance Investment Counsel, Boston Management and Research, and Eaton Vance Distributors, Inc.
In addition, our Privacy Policy only applies to those Eaton Vance customers who are individuals and who have a direct relationship with us. If a customer's account (i.e. fund shares) is held in the name of a third-party financial adviser/broker-dealer, it is likely that only such adviser's privacy policies apply to the customer. This notice supersedes all previously issued privacy disclosures.
For more information about Eaton Vance's Privacy Policy, please call 1-800-262-1122.
Delivery of Shareholder Documents. The Securities and Exchange Commission (the "SEC") permits funds to deliver only one copy of shareholder documents, including prospectuses, proxy statements and shareholder reports, to fund investors with multiple accounts at the same residential or post office box address. This practice is often called "householding" and it helps eliminate duplicate mailings to shareholders.
Eaton Vance, or your financial adviser, may household the mailing of your documents indefinitely unless you instruct Eaton Vance, or your financial adviser, otherwise.
If you would prefer that your Eaton Vance documents not be householded, please contact Eaton Vance at 1-800-262-1122, or contact your financial adviser.
Your instructions that householding not apply to delivery of your Eaton Vance documents will be effective within 30 days of receipt by Eaton Vance or your financial adviser.
Portfolio Holdings. Each Eaton Vance Fund and it's underlying Portfolio (if applicable) will file a schedule of its portfolio holdings on Form N-Q with the SEC for the first and third quarters of each fiscal year. The Form N-Q will be available on the Eaton Vance website www.eatonvance.com, by calling Eaton Vance at 1-800-262-1122 or in the EDGAR database on the SEC's website at www.sec.gov. Form N-Q may also be reviewed and copied at the SEC's public reference room in Washington, D.C. (call 1-800-732-0330 for information on the operation of the public reference room).
Proxy Voting. From time to time, funds are required to vote proxies related to the securities held by the funds. The Eaton Vance Funds or their underlying Portfolios (if applicable) vote proxies according to a set of policies and procedures approved by the Funds' and Portfolios' Boards. You may obtain a description of these policies and procedures and information on how the Funds or Portfolios voted proxies relating to Portfolio securities during the most recent 12 month period ended June 30, without charge, upon request, by calling 1-800-262-1122. This description is also available on the SEC's website at www.sec.gov.
Eaton Vance Limited Maturity Municipals Funds as of September 30, 2005
TABLE OF CONTENTS
President’s Letter to Shareholders | 2 |
| |
Market Recap | 3 |
| |
Fund Investment Updates | |
California | 4 |
Florida | 6 |
Massachusetts | 8 |
New Jersey | 10 |
New York | 12 |
Ohio | 14 |
Pennsylvania | 16 |
| |
Fund Expenses | 18 |
| |
Financial Statements | 40 |
| |
Investment Management | 79 |
1
LETTER TO SHAREHOLDERS

Cynthia J. Clemson
Like all fixed-income markets, the municipal bond market responds to many factors, from changes in interest rates and economic trends to fluctuations in municipal bond issuance. Another key variable is the policy of the Federal Reserve, the nation’s central bank, known popularly as “The Fed.” The Fed’s policies are important to the nation’s economy and markets.

Robert B. MacIntosh
Founded in the wake of crisis, the Federal Reserve plays a vital role...
The Federal Reserve System was established by the Federal Reserve Act of 1913 in the wake of a series of financial crises, the most recent of which – the Panic of 1907 – had caused bank failures, a rash of bankruptcies, a dramatic loss of confidence and a severe economic downturn. Congress was determined to create a central bank that provided a vigilant monetary policy, price stability, a more elastic currency and more careful supervision over the nation’s banks.
The Open Market Committee: influencing the money supply and credit conditions...
The Fed has a number of tools at its disposal to adjust monetary policy. Of these, the most commonly used tools are open market operations. The Federal Open Market Committee (FOMC) meets regularly to review inflation, credit conditions and the overall health of the economy. The Fed uses its own research, as well as that of other key economic agencies, to review its various policy options. Treasury, corporate and municipal bond investors alike eagerly await the transcripts of FOMC meetings for a hint of future interest rate trends.
If it deems a change necessary in short-term rates, the Fed will announce an adjustment to its target for the Federal Funds rate – its primary market instrument. To effect that change, the FOMC issues a directive to the trading desk of the Federal Reserve Bank of New York, whose responsibility it is to implement the policy.
Open market operations: The Fed intervenes...
If the Fed sees weakness in the economy and little threat of inflation, it may make outright purchases of Treasury securities – either from the “street” or privately from foreign central banks – thus adding reserves to the banking system. This action tends to lower interest rates, increase loans and stimulate economic activity. In so doing, the Fed is said to be easing monetary policy.
On the other hand, if the Fed sees the economy over-heating and inflation looming, it may sell Treasury securities, thus draining reserves from the system. This action tends to raise rates, discourage consumer and business borrowing and dampen economic activity. In this case, the Fed is said to be tightening monetary policy.
While changes in Fed policy primarily affect short-term rates, long-term rates are determined by inflationary expectations. However, the Fed’s actions can have a significant effect on market psychology and, over time, impact market rates across the borrowing spectrum – for homebuyers seeking mortgages, businesses seeking bank loans and municipal bond issuers.
Fed-watching: A continuing pre-occupation of the market...
Interpreting the Federal Reserve’s actions has long been of keen interest to bond market investors. Until the mid-1990s, analysts needed to keep daily tabs on bank reserves and the Fed’s daily open market activity to determine a change in monetary policy. Starting in February 1994, however, the Fed began to indicate specifically its target Federal Funds rate. That marked a significant change, as analysts were now free to focus less on current policy and more on future potential changes in policy.
Throughout its history, the Federal Reserve has contributed to a more stable and safer monetary system. As that history unfolds, investors will surely continue to monitor its activities closely.
Sincerely, |
|
| | |
/s/ Cynthia J. Clemson | | | /s/ Robert B. MacIntosh | |
Cynthia J. Clemson | | Robert B. MacIntosh |
Co-Director | | Co-Director |
Municipal Investments | | Municipal Investments |
| | |
| | November 9, 2005 |
| | | | |
Fund shares are not insured by the FDIC and are not deposits or other obligations of, or guaranteed by, any depository institution. Shares are subject to investment risks, including possible loss of principal invested.
2
MARKET RECAP
The U.S. economy continued to generate moderate growth during the year ended September 30, 2005, although surging energy prices and high interest rates were a continuing concern for investors. Late in the period, the economy was faced with new challenges resulting from Hurricane Katrina and its potential impact on energy and commodity supplies.
The economy has remained on solid footing in 2005...
The nation’s Gross Domestic Product grew at a rate of 3.8% in the third quarter of 2005, according to preliminary Commerce Department figures, following gains of 3.3% in the second quarter and 3.8% in the first quarter. Manufacturing reported a mixed picture, with overall factory activity accelerating somewhat, while areas such as durable goods, metals and textiles remained weak. Consumer spending declined, as soaring energy costs took their toll. While the housing sector showed signs of strain in selected markets due to rising interest rates, the overall housing market remained strong.
With consumers tightening their belts, the burden shifted to businesses. However, the outlook for capital spending was clouded, as businesses remained wary of investing in new equipment, facilities and software in a period of rising energy costs and higher interest rates.
Gulf Coast state economies were dealt a severe blow by Hurricane Katrina...
In the waning days of the fiscal year, Hurricane Katrina struck states along the Gulf Coast. The storm inflicted a catastrophic blow to Louisiana and also damaged parts of Mississippi, Alabama and Florida. While the economies of the affected states will no doubt suffer in the short run, the national economy is also likely to feel some impact from damage to key ports and oil refineries. The pace of the region’s recovery is unclear at this writing, and will likely remain a concern, especially as heating fuel demand rises in coming months.

The Federal Reserve continued its policy of tightening credit during the fiscal year...
Inflation accelerated somewhat during the period, an increase apparent not only in core energy costs, but also in finished products, a sign that producers are passing their higher energy costs along to consumers. The Federal Reserve hiked short-term interest rates, suggesting it will continue to raise rates in an effort to keep the economy from growing too quickly and keep inflation under control. Beginning in June 2004, the Fed increased its Federal Funds rate – a key short-term interest rate barometer – on 12 consecutive occasions, raising that benchmark from 1.00% to 4.00%, including its most recent rate hike in November 2005.
Against this backdrop, the municipal bond market generated solid gains for the period. For the six months ended September 30, 2005, the Lehman Brothers 7-Year Municipal Bond Index – an unmanaged index of investment-grade, municipal debt securities with an average maturity of 7 years – had a total return of 2.22%.*
* It is not possible to invest directly in an Index. The Index’s total return does not reflect expenses that would have been incurred if an investor individually purchased or sold the securities represented in the Index.
The views expressed throughout this report are those of the portfolio managers and are current only through the end of the period of the report as stated on the cover. These views are subject to change at any time based upon market or other conditions, and the investment adviser disclaims any responsibility to update such views. These views may not be relied on as investment advice and, because investment decisions for a fund are based on many factors, may not be relied on as an indication of trading intent on behalf of any Eaton Vance fund.
3
Eaton Vance California Limited Maturity Municipals Fund as of September 30, 2005
INVESTMENT UPDATE
The Fund
• The Fund’s Class A shares had a total return of 2.12% for the six months ended September 30, 2005.(1) This return was the result of an increase in net asset value (NAV) to $10.32 per share on September 30, 2005, from $10.29 on March 31, 2005, and the reinvestment of $0.188 in dividends.(2)
• The Fund’s Class B shares had a total return of 1.73% for the six months ended September 30, 2005.(1) This return was the result of an increase in NAV to $10.29 per share on September 30, 2005, from $10.26 on March 31, 2005, and the reinvestment of $0.147 in dividends.(2)
• The Fund’s Class C shares had a total return of 1.60% for the six months ended September 30, 2005.(1) This return was the result of an increase in NAV to $9.97 per share on September 30, 2005, from $9.95 on March 31, 2005, and the reinvestment of $0.140 in dividends.(2)
• For comparison, the Lehman Brothers 7-Year Municipal Bond Index – an unmanaged index of investment-grade, municipal debt securities with an average maturity of 7 years – had a total return of 2.22% for the six months ended September 30, 2005.(3)
• Based on the Fund’s most recent dividends annualized and NAVs on September 30, 2005 of $10.32 per share for Class A, $10.29 for Class B and $9.97 for Class C, the Fund’s distribution rates were 3.61%, 2.84% and 2.85%, respectively.(4) The distribution rates are equivalent to taxable rates of 6.12%, 4.82% and 4.83%, respectively.(5)
• The SEC 30-day yields for Class A, Class B and Class C shares at September 30, 2005 were 3.03%, 2.35% and 2.35%, respectively.(6) The SEC 30-day yields for Class A, Class B and Class C shares are equivalent to taxable yields of 5.14%, 3.99% and 3.99%, respectively.(5)
Fund Statistics**
• Number of Issues: | | 65 | |
• Average Maturity: | | 11.7 years | |
• Effective Maturity: | | 8.6 years | |
• Average Rating: | | AA | |
• Average Call: | | 8.2 years | |
• Average Dollar Price: | | $103.68 | |
** Fund Statistics are as of September 30, 2005. Portfolio information may not be representative of the Fund’s current or future investments and may change due to active management.
Past performance is no guarantee of future results. Returns are historical and are calculated by determining the percentage change in net asset value or offering price (as applicable) with all distributions reinvested. Investment return and principal value will fluctuate so that shares, when redeemed, may be worth more or less than their original cost. Performance is for the stated time period only; due to market volatility, the Fund’s current performance may be lower or higher than the quoted return. For performance as of the most recent month end, please refer to www.eatonvance.com.
Cynthia J. Clemson
Portfolio Manager
Management Discussion
• California’s economy has continued to generate solid growth thus far in 2005, with a decline in the unemployment rate over the past six months to 5.1% as of September 2005 from 5.4% in March 2005. The construction sector has seen the highest growth rates, with low interest rates helping fuel the housing industry. Government, professional and business services, and trade, transportation and utilities remained the largest employers. High energy prices and a potential increase in inflation or interest rates could provide headwinds in coming months, however.
• Insured* general obligations (GOs) remained a significant sector weighting at September 30, 2005. These bonds performed well during the period, as the California economy continued its recovery.
• Insured* and uninsured special tax revenue bonds were also prominent among the Fund’s holdings. The Fund’s investments included issues that financed transportation projects, watershed improvements and local community development programs.
• Insured* water and sewer bonds are frequent issuers in the California municipal market, as stricter environmental rules have forced communities to upgrade their water and wastewater systems. Management focused on issuers believed to have healthy finances, sound long-term planning and a growing service area.
• Insured* lease revenue/certificates of participation remained large investments for the Fund. These issues provided combined financing for a variety of California jurisdictions.
• Among the Fund’s non-insured holdings, health care bonds were the largest weighting. These issues provide financial support for California’s vital health care industry.
* Private insurance does not decrease the risk of principal fluctuations associated with this investment.
(1) These returns do not include the 2.25% maximum sales charge for Class A shares or the applicable contingent deferred sales charges (CDSC) for Class B and Class C shares. If sales charges were deducted, returns would be lower.
(2) A portion of the Fund’s income may be subject to federal income tax and/or alternative minimum tax and state and local taxes.
(3) It is not possible to invest directly in an Index. The Index’s total return does not reflect expenses that would have been incurred if an investor individually purchased or sold the securities represented in the Index.
(4) The Fund’s distribution rate represents actual distributions paid to shareholders and is calculated by dividing the last distribution per share (annualized) by the net asset value.
(5) Taxable-equivalent rates assume a maximum 41.05% combined federal and state income tax rate. A lower rate would result in lower tax-equivalent figures.
(6) The Fund’s SEC yield is calculated by dividing the net investment income per share for the 30-day period by the offering price at the end of the period and annualizing the result.
4
FUND PERFORMANCE
Performance(1) | | Class A | | Class B | | Class C | |
Average Annual Total Returns (at net asset value) | | | | | | | |
One Year | | 2.05 | % | 1.28 | % | N.A. | |
Five Years | | 4.77 | | 3.95 | | N.A. | |
Ten Years | | N.A. | | 3.73 | | N.A. | |
Life of Fund† | | 4.66 | | 4.05 | | 1.10 | |
| | | | | | | |
SEC Average Annual Total Returns (including sales charge or applicable CDSC) | | | | | | | |
One Year | | -0.23 | % | -1.68 | % | N.A. | |
Five Years | | 4.29 | | 3.95 | | N.A. | |
Ten Years | | N.A. | | 3.73 | | N.A. | |
Life of Fund† | | 4.40 | | 4.05 | | 0.10 | |
† Inception Dates – Class A: 6/27/96; Class B: 5/29/92; Class C: 3/23/05
(1) Average annual total returns do not include the 2.25% maximum sales charge for Class A shares or the applicable contingent deferred sales charges (CDSC) for Class B and Class C shares. If sales charges were deducted, returns would be lower. SEC average annual total returns for Class A reflect the maximum 2.25% sales charge. SEC returns for Class B reflect applicable CDSC based on the following schedule: 3% - 1st year; 2.5% - 2nd year; 2% - 3rd year; 1% - 4th year. SEC 1-year return for Class C reflects a 1% CDSC.
Past performance is no guarantee of future results. Returns are historical and are calculated by determining the percentage change in net asset value or offering price (as applicable) with all distributions reinvested. Investment return and principal value will fluctuate so that shares, when redeemed, may be worth more or less than their original cost. Performance is for the stated time period only; due to market volatility, the Fund’s current performance may be lower or higher than the quoted return. For performance as of the most recent month end, please refer to www.eatonvance.com.
Rating Distribution(2)
By total investments
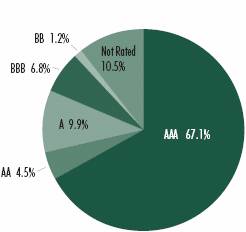
(2) Reflects the Fund’s total investments as of September 30, 2005. May not be representative of the Fund’s current or future investments and may change due to active management.
5
Eaton Vance Florida Limited Maturity Municipals Fund as of September 30, 2005
INVESTMENT UPDATE
The Fund
• The Fund’s Class A shares had a total return of 2.37% for the six months ended September 30, 2005.(1) This return was the result of an increase in net asset value (NAV) to $10.28 per share on September 30, 2005 from $10.23 on March 31, 2005, and the reinvestment of $0.192 in dividends.(2)
• The Fund’s Class B shares had a total return of 1.97% for the six months ended September 30, 2005.(1) This return was the result of an increase in NAV to $10.28 per share on September 30, 2005 from $10.23 on March 31, 2005, and the reinvestment of $0.151 in dividends.(2)
• The Fund’s Class C shares had a total return of 2.11% for the six months ended September 30, 2005.(1) This return was the result of an increase in NAV to $9.71 per share on September 30, 2005 from $9.65 on March 31, 2005, and the reinvestment of $0.143 in dividends.(2)
• For comparison, the Lehman Brothers 7-Year Municipal Bond Index – an unmanaged index of investment-grade, municipal debt securities with an average maturity of 7 years – had a total return of 2.22% for the six months ended September 30, 2005.(3)
• Based on the Fund’s most recent dividends annualized and NAVs on September 30, 2005 of $10.28 per share for Class A and Class B and $9.71 for Class C, the Fund’s distribution rates were 3.70%, 2.92% and 2.92%, respectively.(4) The distribution rates are equivalent to taxable rates of 5.69%, 4.49% and 4.49%, respectively.(5)
• The SEC 30-day yields for Class A, Class B and Class C shares at September 30, 2005 were 2.78%, 2.09% and 2.09%, respectively.(6) The SEC 30-day yields for Class A, Class B and Class C shares are equivalent to taxable yields of 4.28%, 3.22% and 3.22%, respectively.(5)
Fund Statistics**
• Number of Issues: | | 67 | |
• Average Maturity: | | 11.5 years | |
• Effective Maturity: | | 8.0 years | |
• Average Rating: | | AA+ | |
• Average Call: | | 7.6 years | |
• Average Dollar Price: | | $105.66 | |
** Fund Statistics are as of September 30, 2005. Portfolio information may not be representative of the Fund’s current or future investments and may change due to active management.
Past performance is no guarantee of future results. Returns are historical and are calculated by determining the percentage change in net asset value or offering price (as applicable) with all distributions reinvested. Investment return and principal value will fluctuate so that shares, when redeemed, may be worth more or less than their original cost. Performance is for the stated time period only; due to market volatility, the Fund’s current performance may be lower or higher than the quoted return. For performance as of the most recent month end, please refer to www.eatonvance.com.

Craig R. Brandon
Portfolio Manager
Management Discussion
• Florida’s economy showed solid growth during the six months ended September 30, 2005, with unemployment declining to 3.5% in September 2005 from 4.4% in March 2005. Residential construction and service sectors remained very strong, a result of a population growth rate twice that of the U.S. rate. Low mortgage rates, post-hurricane construction (from 2004 storms) and a strong tourism industry have fueled growth. High energy prices and a potential increase in inflation or interest rates could provide headwinds in coming months, however.
• We increased exposure to insured* water and sewer bonds during the period, finding attractive relative value in certain individual issues in this sector. Many communities have initiated upgrades to their water systems, providing an increase in supply of these valued bonds. Backed by a stable stream of regulated water and sewer rates, these utilities have historically represented a stable source of revenues.
• Insured* transportation bonds were significant investments for the Fund. As the demands on Florida’s transportation infrastructure have surged in recent years, these bonds have helped finance improvements and upgrades for local seaports, airport authorities and expressways.
• Management sought bonds with attractive relative value, compared to other bonds in the marketplace. Our research staff seeks opportunities — produced by occasional market inefficiencies — to purchase attractively valued bonds on an individual basis.
• We continued to adjust the Fund’s coupon distribution to reflect a changing interest rate outlook. In addition, management continued to upgrade call structure to protect the Fund against untimely calls.
* Private insurance does not decrease the risk of principal fluctuations associated with this investment.
(1) These returns do not include the 2.25% maximum sales charge for Class A shares or the applicable contingent deferred sales charges (CDSC) for Class B and Class C shares. If sales charges were deducted, returns would be lower.
(2) A portion of the Fund’s income may be subject to federal income tax and/or alternative minimum tax. Income may be subject to state intangibles tax and local taxes.
(3) It is not possible to invest directly in an Index. The Index’s total return does not reflect the expenses that would have been incurred if an investor individually purchased or sold the securities represented in the Index.
(4) The Fund’s distribution rate represents actual distributions paid to shareholders and is calculated by dividing the last distribution per share (annualized) by the net asset value.
(5) Taxable-equivalent rates assume a maximum 35.00% federal income tax rate. A lower rate would result in lower tax-equivalent figures.
(6) The Fund’s SEC yield is calculated by dividing the net investment income per share for the 30-day period by the offering price at the end of the period and annualizing the result.
6
FUND PERFORMANCE
Performance(1) | | Class A | | Class B | | Class C | |
Average Annual Total Returns (at net asset value) | | | | | | | |
One Year | | 2.53 | % | 1.74 | % | 1.74 | % |
Five Years | | 5.13 | | 4.36 | | 4.35 | |
Ten Years | | N.A. | | 3.57 | | 3.55 | |
Life of Fund† | | 4.56 | | 4.06 | | 3.39 | |
| | | | | | | |
SEC Average Annual Total Returns (including sales charge or applicable CDSC) | | | | | | | |
One Year | | 0.22 | % | -1.22 | % | 0.75 | % |
Five Years | | 4.66 | | 4.36 | | 4.35 | |
Ten Years | | N.A. | | 3.57 | | 3.55 | |
Life of Fund† | | 4.31 | | 4.06 | | 3.39 | |
† Inception Dates – Class A: 6/27/96; Class B: 5/29/92; Class C: 12/8/93
(1) Average annual total returns do not include the 2.25% maximum sales charge for Class A shares or the applicable contingent deferred sales charges (CDSC) for Class B and Class C shares. If sales charges were deducted, returns would be lower. SEC average annual total returns for Class A reflect the maximum 2.25% sales charge. SEC returns for Class B reflect applicable CDSC based on the following schedule: 3% - 1st year; 2.5% - 2nd year; 2% - 3rd year; 1% - 4th year. SEC 1-year return for Class C reflects a 1% CDSC.
Past performance is no guarantee of future results. Returns are historical and are calculated by determining the percentage change in net asset value or offering price (as applicable) with all distributions reinvested. Investment return and principal value will fluctuate so that shares, when redeemed, may be worth more or less than their original cost. Performance is for the stated time period only; due to market volatility, the Fund’s current performance may be lower or higher than the quoted return. For performance as of the most recent month end, please refer to www.eatonvance.com.
Rating Distribution(2)
By total investments
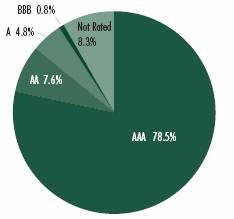
(2) Reflects the Fund’s total investments as of September 30, 2005. May not be representative of the Fund’s current or future investments and may change due to active management.
7
Eaton Vance Massachusetts Limited Maturity Municipals Fund as of September 30, 2005
INVESTMENT UPDATE
The Fund
• The Fund’s Class A shares had a total return of 2.09% for the six months ended September 30, 2005.(1) This return was the result of an increase in net asset value (NAV) to $10.21 per share on September 30, 2005 from $10.18 on March 31, 2005, and the reinvestment of $0.183 in dividends.(2)
• The Fund’s Class B shares had a total return of 1.69% for the six months ended September 30, 2005.(1) This return was the result of an increase in NAV to $10.20 per share on September 30, 2005 from $10.17 on March 31, 2005, and the reinvestment of $0.142 in dividends.(2)
• The Fund’s Class C shares had a total return of 1.71% for the six months ended September 30, 2005.(1) This return was the result of an increase in NAV to $9.77 per share on September 30, 2005 from $9.74 on March 31, 2005, and the reinvestment of $0.137 in dividends.(2)
• For comparison, the Lehman Brothers 7-Year Municipal Bond Index – an unmanaged index of investment-grade, municipal debt securities with an average maturity of 7 years – had a total return of 2.22% for the six months ended September 30, 2005.(3)
• Based on the Fund’s most recent dividends annualized and NAVs on September 30, 2005 of $10.21 per share for Class A, $10.20 for Class B and $9.77 for Class C, the Fund’s distribution rates were 3.55%, 2.77% and 2.77%, respectively.(4) The distribution rates for Class A, Class B and Class C shares are equivalent to taxable rates of 5.77%, 4.50% and 4.50%, respectively.(5)
• The SEC 30-day yields for Class A, Class B and Class C shares at September 30, 2005 were 2.94%, 2.25% and 2.25%, respectively.(6) The SEC 30-day yields for Class A, Class B and Class C shares are equivalent to taxable yields of 4.78%, 3.66% and 3.66%, respectively.(5)
Fund Statistics**
• Number of Issues: | | 83 | |
• Average Maturity: | | 10.3 years | |
• Effective Maturity: | | 7.8 years | |
• Average Rating: | | AA+ | |
• Average Call: | | 7.7 years | |
• Average Dollar Price: | | $108.17 | |
** Fund Statistics are as of September 30, 2005. Portfolio information may not be representative of the Fund’s current or future investments and may change due to active management.
Past performance is no guarantee of future results. Returns are historical and are calculated by determining the percentage change in net asset value or offering price (as applicable) with all distributions reinvested. Investment return and principal value will fluctuate so that shares, when redeemed, may be worth more or less than their original cost. Performance is for the stated time period only; due to market volatility, the Fund’s current performance may be lower or higher than the quoted return. For performance as of the most recent month end, please refer to www.eatonvance.com.

William H. Ahern
Portfolio Manager
Management Discussion
• The Massachusetts economy continued to emerge from the sluggish growth of the 2001-2002 recession. Unemployment declined slightly over the past six months to 4.7% in September 2005 from 4.9% in March 2005 while total non-farm payrolls grew, albeit slightly. With a diverse, innovative economy fueled by its large number of colleges and universities, the state’s service sectors were large employers, while leisure and hospitality also saw solid growth. The manufacturing and technology sectors continued to struggle, however.
• During the period, the Fund maintained its high credit quality, which may have been a factor in the Fund’s underperformance of its benchmark index because lower-quality bonds generally outperformed higher-quality bonds. We believe this trend may be changing, however, and remain committed to a high-quality portfolio. We also shortened the Fund’s duration, or sensitivity to changes in interest rates, which helped mitigate the effects of rising rates in the marketplace.
• Education bonds, which are less sensitive to economic cycles, were the largest sector weighting in the Fund. Investments included some of the Commonwealth’s leading universities and secondary schools. Historically, these institutions have enjoyed strong applicant demand and the ability to generate annual hikes in tuition and fee income.
• Insured* general obligations (GOs) remained a significant weighting in the fund. Insured* school district, public improvement and local GOs have been especially valued by investors in an economy that has continued to pressure some industrial and economically sensitive issuers.
• The Fund maintained a substantial investment in insured* transportation bonds. The Fund’s investments included issues for mass transit, highways and port authority bonds. Many of these issues are backed, in part, by toll revenues and are considered less vulnerable to economic fluctuations than cyclical issues.
* Private insurance does not decrease the risk of principal fluctuations associated with this investment.
(1) These returns do not include the 2.25% maximum sales charge for Class A shares or the applicable contingent deferred sales charges (CDSC) for Class B and Class C shares. If sales charges were deducted, returns would be lower.
(2) A portion of the Fund’s income may be subject to federal income tax and/or alternative minimum tax and state and local taxes.
(3) It is not possible to invest directly in an Index. The Index’s total return does not reflect the expenses that would have been incurred if an investor individually purchased or sold the securities represented in the Index.
(4) The Fund’s distribution rate represents actual distributions paid to shareholders and is calculated by dividing the last distribution per share (annualized) by the net asset value.
(5) Taxable-equivalent rates assume a maximum 38.45% combined federal and state income tax rate. A lower rate would result in lower tax-equivalent figures.
(6) The Fund’s SEC yield is calculated by dividing the net investment income per share for the 30-day period by the offering price at the end of the period and annualizing the result.
8
FUND PERFORMANCE
Performance(1) | | Class A | | Class B | | Class C | |
Average Annual Total Returns (at net asset value) | | | | | | | |
One Year | | 1.67 | % | 0.99 | % | 0.87 | % |
Five Years | | 4.91 | | 4.08 | | 4.09 | |
Ten Years | | N.A. | | 3.55 | | 3.56 | |
Life of Fund† | | 4.54 | | 3.96 | | 3.42 | |
| | | | | | | |
SEC Average Annual Total Returns (including sales charge or applicable CDSC) | | | | | | | |
One Year | | -0.62 | % | -1.96 | % | -0.11 | % |
Five Years | | 4.42 | | 4.08 | | 4.09 | |
Ten Years | | N.A. | | 3.55 | | 3.56 | |
Life of Fund† | | 4.28 | | 3.96 | | 3.42 | |
† Inception Dates – Class A: 6/27/96; Class B: 6/1/92; Class C: 12/8/93
(1) Average annual total returns do not include the 2.25% maximum sales charge for Class A shares or the applicable contingent deferred sales charges (CDSC) for Class B and Class C shares. If sales charges were deducted, returns would be lower. SEC average annual total returns for Class A reflect the maximum 2.25% sales charge. SEC returns for Class B reflect applicable CDSC based on the following schedule: 3% - 1st year; 2.5% - 2nd year; 2% - 3rd year; 1% - 4th year. SEC 1-year return for Class C reflects a 1% CDSC.
Past performance is no guarantee of future results. Returns are historical and are calculated by determining the percentage change in net asset value or offering price (as applicable) with all distributions reinvested. Investment return and principal value will fluctuate so that shares, when redeemed, may be worth more or less than their original cost. Performance is for the stated time period only; due to market volatility, the Fund’s current performance may be lower or higher than the quoted return. For performance as of the most recent month end, please refer to www.eatonvance.com.
Rating Distribution(2)
By total investments

(2) Reflects the Fund’s total investments as of September 30, 2005. May not be representative of the Fund’s current or future investments and may change due to active management.
9
Eaton Vance New Jersey Limited Maturity Municipals Fund as of September 30, 2005
INVESTMENT UPDATE
The Fund
• The Fund’s Class A shares had a total return of 2.10% for the six months ended September 30, 2005.(1) This return was the result of an increase in net asset value (NAV) to $10.13 per share on September 30, 2005 from $10.10 on March 31, 2005, and the reinvestment of $0.181 in dividends.(2)
• The Fund’s Class B shares had a total return of 1.61% for the six months ended September 30, 2005.(1) This return was the result of an increase in NAV to $10.12 per share on September 30, 2005 from $10.10 on March 31, 2005, and the reinvestment of $0.142 in dividends.(2)
• For comparison, the Lehman Brothers 7-Year Municipal Bond Index – an unmanaged index of investment-grade, municipal debt securities with an average maturity of 7 years – had a total return of 2.22% for the six months ended September 30, 2005.(3)
• Based on the most recent dividends annualized and NAVs on September 30, 2005 of $10.13 per share for Class A and $10.12 for Class B, the Fund’s distribution rates were 3.55% and 2.80%, respectively.(4) The distribution rates for Class A and Class B shares are equivalent to taxable rates of 6.00% and 4.73%, respectively.(5)
• The SEC 30-day yields for Class A and B shares at September 30, 2005 were 3.02% and 2.37%, respectively.(6) The SEC 30-day yields for Class A and Class B shares are equivalent to taxable yields of 5.10% and 4.01%, respectively.(5)
Fund Statistics**
• Number of Issues: | | 67 |
• Average Maturity: | | 11 years |
• Effective Maturity: | | 8.5 years |
• Average Rating: | | AA+ |
• Average Call: | | 8.0 years |
• Average Dollar Price: | | $106.80 |
** Fund Statistics are as of September 30, 2005. Portfolio information may not be representative of the Fund’s current or future investments and may change due to active management.
Past performance is no guarantee of future results. Returns are historical and are calculated by determining the percentage change in net asset value or offering price (as applicable) with all distributions reinvested. Investment return and principal value will fluctuate so that shares, when redeemed, may be worth more or less than their original cost. Performance is for the stated time period only; due to market volatility, the Fund’s current performance may be lower or higher than the quoted return. For performance as of the most recent month end, please refer to www.eatonvance.com.

Craig R. Brandon
Portfolio Manager
Management Discussion
• New Jersey continued to show solid economic activity in 2005, with job gains in professional and business services, and slight growth in manufacturing in the Camden area. The state’s unemployment rate was 4.3% in September 2005, unchanged from the same level in March 2005. Leisure and hospitality was the fastest-growing sector during the six-month period, and the state’s housing market remains one of the strongest in the nation. However, New Jersey has continued to see job declines in the manufacturing, mining, and information sectors, and potentially higher interest rates could hurt the real estate market.
• Insured* general obligations remained a significant sector weighting, representing a high-quality investment in a recovering economy. The Fund’s investments were focused on regional and township school district bonds and local board of education issues.
• In the insured* transportation sector, the Fund’s investments constituted primarily a mix of regional transportation authorities and port authorities. The Fund also had investments in the state’s transportation trust fund authority, which – backed by motor fuel tax receipts – finances repairs to bridges, highways and park-ride facilities.
• Insured* water and sewer bonds represented a major investment. Many New Jersey cities and towns needed to upgrade their water infrastructure. Increased issuance of bonds to finance watershed and wastewater projects has provided the Fund with high-quality income opportunities.
• Management continued to adjust coupon structure in response to changing market conditions. In addition, the Fund remained broadly diversified according to issuer, sector, coupon and insurer, while management continued to focus on maintaining ample call protection.
* Private insurance does not decrease the risk of principal fluctuations associated with this investment.
(1) These returns do not include the 2.25% maximum sales charge for Class A shares or the applicable contingent deferred sales charges (CDSC) for Class B shares. If sales charges were deducted, returns would be lower.
(2) A portion of the Fund’s income may be subject to federal income tax and/or alternative minimum tax and state and local taxes.
(3) It is not possible to invest directly in an Index. The Index’s total return does not reflect the expenses that would have been incurred if an investor individually purchased or sold the securities represented in the Index.
(4) The Fund’s distribution rate represents actual distributions paid to shareholders and is calculated by dividing the last distribution per share (annualized) by the net asset value.
(5) Taxable-equivalent rates assume a maximum 40.83% combined federal and state income tax rate. A lower rate would result in lower tax-equivalent figures.
(6) The Fund’s SEC yield is calculated by dividing the net investment income per share for the 30-day period by the offering price at the end of the period and annualizing the result.
10
FUND PERFORMANCE
Performance(1) | | Class A | | Class B | |
Average Annual Total Returns (at net asset value) | | | | | |
One Year | | 2.26 | % | 1.38 | % |
Five Years | | 4.61 | | 3.79 | |
Ten Years | | N.A. | | 3.53 | |
Life of Fund† | | 4.49 | | 3.93 | |
| | | | | |
SEC Average Annual Total Returns (including sales charge or applicable CDSC) | | | | | |
One Year | | -0.07 | % | -1.58 | % |
Five Years | | 4.13 | | 3.79 | |
Ten Years | | N.A. | | 3.53 | |
Life of Fund† | | 4.23 | | 3.93 | |
†Inception date: Class A: 6/27/96; Class B: 6/1/92
(1) Average annual total returns do not include the 2.25% maximum sales charge for Class A shares or the applicable contingent deferred sales charges (CDSC) for Class B shares. If sales charges were deducted, returns would be lower. SEC average annual total returns for Class A reflect the maximum 2.25% sales charge. SEC returns for Class B reflect applicable CDSC based on the following schedule: 3% - 1st year; 2.5% - 2nd year; 2% - 3rd year; 1% - 4th year.
Past performance is no guarantee of future results. Returns are historical and are calculated by determining the percentage change in net asset value or offering price (as applicable) with all distributions reinvested. Investment return and principal value will fluctuate so that shares, when redeemed, may be worth more or less than their original cost. Performance is for the stated time period only; due to market volatility, the Fund’s current performance may be lower or higher than the quoted return. For performance as of the most recent month end, please refer to www.eatonvance.com.
Rating Distribution(2)
By total investments

(2) Reflects the Fund’s total investments as of September 30, 2005. May not be representative of the Fund’s current or future investments and may change due to active management.
11
Eaton Vance New York Limited Maturity Municipals Fund as of September 30, 2005
INVESTMENT UPDATE
The Fund
• The Fund’s Class A shares had a total return of 2.05% for the six months ended September 30, 2005.(1) This return was the result of an increase in net asset value (NAV) to $10.56 per share on September 30, 2005 from $10.54 on March 31, 2005, and the reinvestment of $0.196 in dividends.(2)
• The Fund’s Class B shares had a total return of 1.76% for the six months ended September 30, 2005.(1) This return was the result of an increase in NAV to $10.56 per share on September 30, 2005 from $10.53 on March 31, 2005, and the reinvestment of $0.155 in dividends.(2)
• The Fund’s Class C shares had a total return of 1.66% for the six months ended September 30, 2005.(1) This return was the result of an increase in NAV to $10.04 per share on September 30, 2005 from $10.02 on March 31, 2005, and the reinvestment of $0.147 in dividends.(2)
• For comparison, the Lehman Brothers 7-Year Municipal Bond Index – an unmanaged index of investment-grade, municipal debt securities with an average maturity of 7 years – had a total return of 2.22% for the six months ended September 30, 2005.(3)
• Based on the Fund’s most recent dividends annualized and NAVs on September 30, 2005 of $10.56 per share for Class A and Class B and $10.04 for Class C, the Fund’s distribution rates were 3.68%, 2.91% and 2.91%, respectively.(4) The distribution rates for Class A, Class B and Class C shares are equivalent to taxable rates of 6.13%, 4.85% and 4.85%, respectively.(5)
• The SEC 30-day yields for Class A, Class B and Class C shares at September 30, 2005 were 2.88%, 2.20% and 2.20%, respectively.(6) The SEC 30-day yields for Class A, Class B and Class C shares are equivalent to taxable yields of 4.80%, 3.67% and 3.67%, respectively.(5)
Fund Statistics**
• Number of Issues: | | 96 | |
• Average Maturity: | | 11.4 years | |
• Effective Maturity: | | 8.1 years | |
• Average Rating: | | AA+ | |
• Average Call: | | 8.0 years | |
• Average Dollar Price: | | $108.80 | |
** Fund Statistics are as of September 30, 2005. Portfolio information may not be representative of the Fund’s current or future investments and may change due to active management.
Past performance is no guarantee of future results. Returns are historical and are calculated by determining the percentage change in net asset value or offering price (as applicable) with all distributions reinvested. Investment return and principal value will fluctuate so that shares, when redeemed, may be worth more or less than their original cost. Performance is for the stated time period only; due to market volatility, the Fund’s current performance may be lower or higher than the quoted return. For performance as of the most recent month end, please refer to www.eatonvance.com.

William H. Ahern
Portfolio Manager
Management Discussion
• New York’s economy struggled during the past six months. While the services and housing sectors grew, manufacturing continued to decline. The state’s unemployment rate, at 4.6% in March 2005, hovered at or below the 5% level for most of the period before rising to 5.2% in September 2005. Continued high energy prices and a potential increase in inflation or interest rates could provide headwinds in the months ahead.
• The Fund’s high credit quality may have detracted from its relative performance during the period because lower-quality bonds continued to outperform higher-quality issues. We believe this trend may be changing, however, and remain committed to a high-quality portfolio.
• We found select opportunities in insured* education bonds, which were the largest sector weighting at September 30, 2005. Education bonds tend to be less sensitive to economic cycles and typically provide attractive coupons and call features.
• Insured* general obligations also constituted large commitments for the Fund. The Fund’s investments were focused on city and town school district bonds and county public improvement bonds. While these issues tend to benefit from strength in state and local economies, a significant economic slowdown could detract from their performance.
• We continued to find value in escrowed and insured* escrowed bonds. Escrowed issues have been prerefunded and are backed by Treasury bonds, typically due to a refinancing of existing higher-coupon debt. They are valued by investors for their high quality and relatively stable performance characteristics.
• Insured* transportation bonds were prominent investments for the Fund. Transportation has historically been a key factor in the New York economy, and the demands have become even more acute in recent years.
* Private insurance does not decrease the risk of principal fluctuations associated with this investment.
(1) These returns do not include the 2.25% maximum sales charge for Class A shares or the applicable contingent deferred sales charges (CDSC) for Class B and Class C shares. If sales charges were deducted, returns would be lower.
(2) A portion of the Fund’s income may be subject to federal income tax and/or alternative minimum tax and state and local taxes.
(3) It is not possible to invest directly in an Index. The Index’s total return does not reflect the expenses that would have been incurred if an investor individually purchased or sold the securities represented in the Index.
(4) The Fund’s distribution rate represents actual distributions paid to shareholders and is calculated by dividing the last distribution per share (annualized) by the net asset value.
(5) Taxable-equivalent rates assume a maximum 40.01% combined federal and state income tax rate. A lower rate would result in lower tax-equivalent figures.
(6) The Fund’s SEC yield is calculated by dividing the net investment income per share for the 30-day period by the offering price at the end of the period and annualizing the result.
12
FUND PERFORMANCE
Performance(1) | | Class A | | Class B | | Class C | |
Average Annual Total Returns (at net asset value) | | | | | | | |
One Year | | 1.77 | % | 1.10 | % | 1.03 | % |
Five Years | | 4.92 | | 4.13 | | 4.12 | |
Ten Years | | N.A. | | 3.92 | | 3.89 | |
Life of Fund† | | 4.90 | | 4.25 | | 3.64 | |
| | | | | | | |
SEC Average Annual Total Returns (including sales charge or applicable CDSC) | | | | | |
One Year | | -0.54 | % | -1.85 | % | 0.05 | % |
Five Years | | 4.45 | | 4.13 | | 4.12 | |
Ten Years | | N.A. | | 3.92 | | 3.89 | |
Life of Fund† | | 4.64 | | 4.25 | | 3.64 | |
| | | | | | | | | | |
†Inception Dates – Class A: 6/27/96; Class B: 5/29/92; Class C: 12/8/93
(1) Average annual total returns do not include the 2.25% maximum sales charge for Class A shares or the applicable contingent deferred sales charges (CDSC) for Class B and Class C shares. If sales charges were deducted, returns would be lower. SEC average annual total returns for Class A reflect the maximum 2.25% sales charge. SEC returns for Class B reflect applicable CDSC based on the following schedule: 3% - 1st year; 2.5% - 2nd year; 2% - 3rd year; 1% - 4th year. SEC 1-year return for Class C reflects a 1% CDSC.
Past performance is no guarantee of future results. Returns are historical and are calculated by determining the percentage change in net asset value or offering price (as applicable) with all distributions reinvested. Investment return and principal value will fluctuate so that shares, when redeemed, may be worth more or less than their original cost. Performance is for the stated time period only; due to market volatility, the Fund’s current performance may be lower or higher than the quoted return. For performance as of the most recent month end, please refer to www.eatonvance.com.
Rating Distribution(2)
By total investments
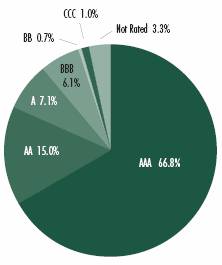
(2) Reflects the Fund’s total investments as of September 30, 2005. May not be representative of the Fund’s current or future investments and may change due to active management.
13
Eaton Vance Ohio Limited Maturity Municipals Fund as of September 30, 2005
INVESTMENT UPDATE
The Fund
• The Fund’s Class A shares had a total return of 2.00% for the six months ended September 30, 2005.(1) This return was the result of an increase in net asset value (NAV) to $9.75 per share on September 30, 2005 from $9.74 on March 31, 2005, and the reinvestment of $0.185 in dividends.(2)
• The Fund’s Class B shares had a total return of 1.51% for the six months ended September 30, 2005.(1) This return was the result of an unchanged NAV of $9.73 per share on September 30, 2005, and the reinvestment of $0.147 in dividends.(2)
• For comparison, the Lehman Brothers 7-Year Municipal Bond Index – an unmanaged index of investment-grade, municipal debt securities with an average maturity of 7 years – had a total return of 2.22% for the six months ended September 30, 2005.(3)
• Based on the most recent dividends annualized and NAVs on September 30, 2005 of $9.75 per share for Class A and $9.73 per share for Class B, the Fund’s distribution rates were 3.79% and 3.04%, respectively.(4) The distribution rates of Class A and Class B are equivalent to taxable rates of 6.30% and 5.06%, respectively.(5)
• The SEC 30-day yields for Class A and B shares at September 30, 2005 were 2.77% and 2.08%, respectively.(6) The SEC 30-day yields of Class A and Class B are equivalent to taxable yields of 4.61% and 3.46%, respectively.(5)
Fund Statistics**
• Number of Issues: | | 44 | |
• Average Maturity: | | 7.0 years | |
• Effective Maturity: | | 7.9 years | |
• Average Rating: | | AA+ | |
• Average Call: | | 7.8 years | |
• Average Dollar Price: | | $106.86 | |
** Fund Statistics are as of September 30, 2005. Portfolio information may not be representative of the Fund’s current or future investments and may change due to active management.
Past performance is no guarantee of future results. Returns are historical and are calculated by determining the percentage change in net asset value or offering price (as applicable) with all distributions reinvested. Investment return and principal value will fluctuate so that shares, when redeemed, may be worth more or less than their original cost. Performance is for the stated time period only; due to market volatility, the Fund’s current performance may be lower or higher than the quoted return. For performance as of the most recent month end, please refer to www.eatonvance.com.

William H. Ahern
Portfolio Manager
Management Discussion
• Despite continued struggles in the manufacturing sector – one of the largest economic sectors in the state – Ohio’s economy has shown solid growth in 2005. Professional and business services and health care have added significantly to employment growth this year, while retail trade, government and manufacturing have declined. Nevertheless, the state’s unemployment rate, at 6.3% in March 2005, declined over the six-month period to 5.8% in September 2005.
• The effects of rising interest rates and the Fund’s higher average credit quality detracted from the Fund’s relative performance during the period. Lower-quality bonds continued to outperform higher-quality issues during the period. We believe this trend may be changing, however, and remain committed to a high-quality portfolio.
• Insured* and uninsured general obligations (GOs) were among the Fund’s largest sector weightings at September 30, 2005. Some of the Fund’s investments focused on school district GOs of communities that management believes have vibrant local economies and a solid property tax base.
• Management has been selective in its hospital sector investments. With the competitive hospital industry under pressure to reduce costs, we sought institutions with sound financial structures, good management and the ability to offer attractive health care specialties. Hospital bonds, while typically offering higher yields, often carry lower credit ratings.
• The Fund invested in some attractive Ohio-issued “bond banks,” which are pools of individual Ohio municipal bonds that can provide lower credit risk than an individual bond because of increased diversification and a higher level of collateral.
* Private insurance does not decrease the risk of principal fluctuations associated with this investment.
(1) These returns do not include the 2.25% maximum sales charge for Class A shares or the applicable contingent deferred sales charges (CDSC) for Class B shares. If sales charges were deducted, returns would be lower.
(2) A portion of the Fund’s income may be subject to federal income taxes and/or alternative minimum tax and state and local taxes.
(3) It is not possible to invest directly in an Index. The Index’s total return does not reflect the expenses that would have been incurred if an investor individually purchased or sold the securities represented in the Index.
(4) The Fund’s distribution rate represents actual distributions paid to shareholders and is calculated by dividing the last distribution per share (annualized) by the net asset value.
(5) Taxable-equivalent rates assume a maximum 39.88% combined federal and state income tax rate. A lower rate would result in lower tax-equivalent figures.
(6) The Fund’s SEC yield is calculated by dividing the net investment income per share for the 30-day period by the offering price at the end of the period and annualizing the result.
14
FUND PERFORMANCE
Performance(1) | | Class A | | Class B | |
Average Annual Total Returns (at net asset value) | | | | | |
One Year | | 1.81 | % | 1.05 | % |
Five Years | | 4.44 | | 3.64 | |
Ten Years | | N.A. | | 3.45 | |
Life of Fund† | | 4.19 | | 3.52 | |
| | | | | |
SEC Average Annual Total Returns (including sales charge or applicable CDSC) | | | | | |
One Year | | -0.49 | % | -1.89 | % |
Five Years | | 3.97 | | 3.64 | |
Ten Years | | N.A. | | 3.45 | |
Life of Fund† | | 3.92 | | 3.52 | |
†Inception date: Class A: 10/22/96; Class B: 4/16/93
(1) Average annual total returns do not include the 2.25% maximum sales charge for Class A shares or the applicable contingent deferred sales charges (CDSC) for Class B shares. If sales charges were deducted, returns would be lower. SEC average annual total returns for Class A reflect the maximum 2.25% sales charge. SEC returns for Class B reflect applicable CDSC based on the following schedule: 3% - 1st year; 2.5% - 2nd year; 2% - 3rd year; 1% - 4th year.
Past performance is no guarantee of future results. Returns are historical and are calculated by determining the percentage change in net asset value or offering price (as applicable) with all distributions reinvested. Investment return and principal value will fluctuate so that shares, when redeemed, may be worth more or less than their original cost. Performance is for the stated time period only; due to market volatility, the Fund’s current performance may be lower or higher than the quoted return. For performance as of the most recent month end, please refer to www.eatonvance.com.
Rating Distribution(2)
By total investments
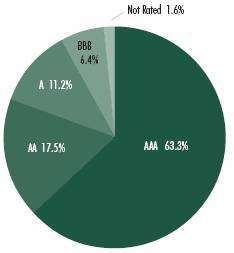
(2) Reflects the Fund’s total investments as of September 30, 2005. May not be representative of the Fund’s current or future investments and may change due to active management.
15
Eaton Vance Pennsylvania Limited Maturity Municipals Fund as of September 30, 2005
INVESTMENT UPDATE
The Fund
• The Fund’s Class A shares had a total return of 2.36% for the six months ended September 30, 2005.(1) This return was the result of an increase in net asset value (NAV) to $10.32 per share on September 30, 2005 from $10.28 on March 31, 2005, and the reinvestment of $0.202 in dividends.(2)
• The Fund’s Class B shares had a total return of 1.96% for the six months ended September 30, 2005.(1) This return was the result of an increase in NAV to $10.32 per share on September 30, 2005 from $10.28 on March 31, 2005, and the reinvestment of $0.162 in dividends.(2)
• The Fund’s Class C shares had a total return of 1.87% for the six months ended September 30, 2005.(1) This return was the result of an increase in NAV to $9.78 per share on September 30, 2005 from $9.75 on March 31, 2005, and the reinvestment of $0.153 in dividends.(2)
• For comparison, the Lehman Brothers 7-Year Municipal Bond Index – an unmanaged index of investment-grade, municipal debt securities with an average maturity of 7 years – had a total return of 2.22% for the six months ended September 30, 2005.(3)
• Based on the Fund’s most recent dividends annualized and NAVs on September 30, 2005 of $10.32 per share for Class A and Class B and $9.78 for Class C, the Fund’s distribution rates were 3.88%, 3.12% and 3.12%, respectively.(4) The distribution rates for Class A, Class B and Class C shares are equivalent to taxable rates of 6.16%, 4.95% and 4.95%, respectively.(5)
• The SEC 30-day yields for Class A, Class B and Class C shares at September 30, 2005 were 3.03%, 2.35% and 2.35%, respectively.(6) The SEC 30-day yields for Class A, Class B and Class C shares are equivalent to taxable yields of 4.81%, 3.73% and 3.73%, respectively.(5)
Fund Statistics**
• Number of Issues: | | 60 |
• Average Maturity: | | 12.6 years |
• Effective Maturity: | | 7.7 years |
• Average Rating: | | AA+ |
• Average Call: | | 7.6 years |
• Average Dollar Price: | | $103.20 |
** Fund Statistics are as of September 30, 2005. Portfolio information may not be representative of the Fund’s current or future investments and may change due to active management.
Past performance is no guarantee of future results. Returns are historical and are calculated by determining the percentage change in net asset value or offering price (as applicable) with all distributions reinvested. Investment return and principal value will fluctuate so that shares, when redeemed, may be worth more or less than their original cost. Performance is for the stated time period only; due to market volatility, the Fund’s current performance may be lower or higher than the quoted return. For performance as of the most recent month end, please refer to www.eatonvance.com.

Craig R. Brandon
Portfolio Manager
Management Discussion
• Pennsylvania’s economy has continued to grow in 2005, building on an economic recovery that began in 2004 after three years of job losses. Health and social services have led the job gains in 2005, and the state now ranks among the top 10 states in health and social workers per capita. Professional and business services, along with construction, have been the fastest-growing sectors. Offsetting these gains, however, have been job declines in the manufacturing, mining, and information technology sectors. The state’s unemployment rate was 4.8% in September 2005, down from 5.4% in March 2005.
• Insured* general obligations were a significant weighting at September 30, 2005, increasing slightly during the period. Management focused on cities, townships, counties and school districts it believes have relatively strong local economies, a sound tax base and reasonable future borrowing needs.
• Insured* transportation bonds were prominent in the Fund. Transportation bonds finance improvements and expansions for the Commonwealth’s highway and port facilities, which are key to moving commercial traffic. The Fund’s investments included issues for highways, turnpikes, transportation and airport authorities.
• Insured* escrowed/prerefunded bonds remained a significant focus of the Fund. Escrowed bonds are those that have been pre-refunded as the result of a refinancing and are backed by Treasuries. The bonds are deemed very high quality by investors and often provide above-average coupons.
• Management continued its efforts, where possible, to upgrade the Fund’s call protection. The Fund sold bonds with approaching call dates in favor of high quality, non-callable bonds and bonds with more attractive call characteristics.
* Private insurance does not decrease the risk of principal fluctuations associated with this investment.
(1) These returns do not include the 2.25% maximum sales charge for Class A shares or the applicable contingent deferred sales charges (CDSC) for Class B and Class C shares. If sales charges were deducted, returns would be lower.
(2) A portion of the Fund’s income may be subject to federal income tax and/or alternative minimum tax and state and local taxes.
(3) It is not possible to invest directly in an Index. The Index’s total return does not reflect the expenses that would have been incurred if an investor individually purchased or sold the securities represented in the Index.
(4) The Fund’s distribution rate represents actual distributions paid to shareholders and is calculated by dividing the last distribution per share (annualized) by the net asset value.
(5) Taxable-equivalent rates assume a maximum 37.00% combined federal and state income tax rate. A lower rate would result in lower tax-equivalent figures.
(6) The Fund’s SEC yield is calculated by dividing the net investment income per share for the 30-day period by the offering price at the end of the period and annualizing the result.
16
FUND PERFORMANCE
Performance(1) | | Class A | | Class B | | Class C | |
| | | | | | | |
Average Annual Total Returns (at net asset value) | | | | | | | |
One Year | | 2.52 | % | 1.74 | % | 1.69 | % |
Five Years | | 4.96 | | 4.16 | | 4.14 | |
Ten Years | | N.A. | | 3.74 | | 3.71 | |
Life of Fund† | | 4.72 | | 4.17 | | 3.53 | |
| | | | | | | |
SEC Average Annual Total Returns (including sales charge or applicable CDSC) | | | | | | | |
One Year | | 0.22 | % | -1.22 | % | 0.70 | % |
Five Years | | 4.48 | | 4.16 | | 4.14 | |
Ten Years | | N.A. | | 3.74 | | 3.71 | |
Life of Fund† | | 4.47 | | 4.17 | | 3.53 | |
†Inception Dates – Class A: 6/27/96; Class B: 6/1/92; Class C: 12/8/93
(1) Average annual total returns do not include the 2.25% maximum sales charge for Class A shares or the applicable contingent deferred sales charges (CDSC) for Class B and Class C shares. If sales charges were deducted, returns would be lower. SEC average annual total returns for Class A reflect the maximum 2.25% sales charge. SEC returns for Class B reflect applicable CDSC based on the following schedule: 3% - 1st year; 2.5% - 2nd year; 2% - 3rd year; 1% - 4th year. SEC 1-year return for Class C reflects a 1% CDSC.
Past performance is no guarantee of future results. Returns are historical and are calculated by determining the percentage change in net asset value or offering price (as applicable) with all distributions reinvested. Investment return and principal value will fluctuate so that shares, when redeemed, may be worth more or less than their original cost. Performance is for the stated time period only; due to market volatility, the Fund’s current performance may be lower or higher than the quoted return. For performance as of the most recent month end, please refer to www.eatonvance.com.
Rating Distribution(2)
By total investments
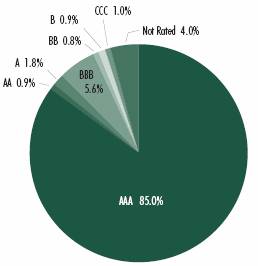
(2) Reflects the Fund’s total investments as of September 30, 2005. May not be representative of the Fund’s current or future investments and may change due to active management.
17
Eaton Vance Limited Maturity Municipals Funds as of September 30, 2005
FUND EXPENSES
Example: As a shareholder of a Fund, you incur two types of costs: (1) transaction costs, including sales charges (loads) on purchases and redemption fees (if applicable); and (2) ongoing costs, including management fees; distribution or service fees; and other Fund expenses. This Example is intended to help you understand your ongoing costs (in dollars) of investing in a Fund and to compare these costs with the ongoing costs of investing in other mutual funds. The Example is based on an investment of $1,000 invested at the beginning of the period and held for the entire period (April 1, 2005 – September 30, 2005).
Actual Expenses: The first section of each table below provides information about actual account values and actual expenses. You may use the information in this section, together with the amount you invested, to estimate the expenses that you paid over the period. Simply divide your account value by $1,000 (for example, an $8,600 account value divided by $1,000 = 8.6), then multiply the result by the number in the first line under the heading entitled “Expenses Paid During Period” to estimate the expenses you paid on your account during this period.
Hypothetical Example for Comparison Purposes: The second section of each table below provides information about hypothetical account values and hypothetical expenses based on a Fund’s actual expense ratio and an assumed rate of return of 5% per year (before expenses), which is not the actual return of the Fund. The hypothetical account values and expenses may not be used to estimate the actual ending account balance or expenses you paid for the period. You may use this information to compare the ongoing costs of investing in the Funds and other funds. To do so, compare this 5% hypothetical example with the 5% hypothetical examples that appear in the shareholder reports of the other funds.
Please note that the expenses shown in the table are meant to highlight your ongoing costs only and do not reflect any transactional costs, such as sales charges (loads) or redemption fees (if applicable). Therefore, the second section of the table is useful in comparing ongoing costs only, and will not help you determine the relative total costs of owning different funds. In addition, if these transactional costs were included, your costs would have been higher.
Eaton Vance California Limited Maturity Municipals Fund
| | Beginning Account Value | | Ending Account Value | | Expenses Paid During Period* | |
| | (4/1/05) | | (9/30/05) | | (4/1/05 - 9/30/05) | |
| | | | | | | |
Actual | | | | | | | |
Class A | | $ | 1,000.00 | | $ | 1,021.20 | | $ | 4.41 | |
Class B | | $ | 1,000.00 | | $ | 1,017.30 | | $ | 8.19 | |
Class C | | $ | 1,000.00 | | $ | 1,016.00 | | $ | 8.19 | |
| | | | | | | | | | |
Hypothetical
(5% return per year before expenses) | | | | | | | |
Class A | | $ | 1,000.00 | | $ | 1,020.70 | | $ | 4.41 | |
Class B | | $ | 1,000.00 | | $ | 1,016.90 | | $ | 8.19 | |
Class C | | $ | 1,000.00 | | $ | 1,016.90 | | $ | 8.19 | |
* Expenses are equal to the Fund’s annualized expense ratio of 0.87% for Class A shares, 1.62% for Class B shares and 1.62% for Class C shares, multiplied by the average account value over the period, multiplied by 183/365 (to reflect the one-half year period). The Example assumes that the $1,000 was invested at the net asset value per share determined at the close of business on March 31, 2005.
Eaton Vance Florida Limited Maturity Municipals Fund
| | Beginning Account Value | | Ending Account Value | | Expenses Paid During Period* | |
| | (4/1/05) | | (9/30/05) | | (4/1/05 - 9/30/05) | |
| | | | | | | |
Actual | | | | | | | |
Class A | | $ | 1,000.00 | | $ | 1,023.70 | | $ | 4.21 | |
Class B | | $ | 1,000.00 | | $ | 1,019.70 | | $ | 8.00 | |
Class C | | $ | 1,000.00 | | $ | 1,021.10 | | $ | 7.99 | |
| | | | | | | | | | |
Hypothetical
(5% return per year before expenses) | | | | | | | |
Class A | | $ | 1,000.00 | | $ | 1,020.90 | | $ | 4.20 | |
Class B | | $ | 1,000.00 | | $ | 1,017.10 | | $ | 7.99 | |
Class C | | $ | 1,000.00 | | $ | 1,017.10 | | $ | 7.99 | |
* Expenses are equal to the Fund’s annualized expense ratio of 0.83% for Class A shares, 1.58% for Class B shares and 1.58% for Class C shares, multiplied by the average account value over the period, multiplied by 183/365 (to reflect the one-half year period). The Example assumes that the $1,000 was invested at the net asset value per share determined at the close of business on March 31, 2005.
18
Eaton Vance Massachusetts Limited Maturity Municipals Fund
| | Beginning Account Value | | Ending Account Value | | Expenses Paid During Period* | |
| | (4/1/05) | | (9/30/05) | | (4/1/05 - 9/30/05) | |
| | | | | | | |
Actual | | | | | | | |
Class A | | $ | 1,000.00 | | $ | 1,020.90 | | $ | 4.10 | |
Class B | | $ | 1,000.00 | | $ | 1,016.90 | | $ | 7.89 | |
Class C | | $ | 1,000.00 | | $ | 1,017.10 | | $ | 7.89 | |
| | | | | | | | | | |
Hypothetical
(5% return per year before expenses) | | | | | | | |
Class A | | $ | 1,000.00 | | $ | 1,021.00 | | $ | 4.10 | |
Class B | | $ | 1,000.00 | | $ | 1,017.20 | | $ | 7.89 | |
Class C | | $ | 1,000.00 | | $ | 1,017.20 | | $ | 7.89 | |
* Expenses are equal to the Fund’s annualized expense ratio of 0.81% for Class A shares, 1.56% for Class B shares and 1.56% for Class C shares, multiplied by the average account value over the period, multiplied by 183/365 (to reflect the one-half year period). The Example assumes that the $1,000 was invested at the net asset value per share determined at the close of business on March 31, 2005.
Eaton Vance New Jersey Limited Maturity Municipals Fund
| | Beginning Account Value | | Ending Account Value | | Expenses Paid During Period* | |
| | (4/1/05) | | (9/30/05) | | (4/1/05 - 9/30/05) | |
Actual | | | | | | | |
Class A | | $ | 1,000.00 | | $ | 1,021.00 | | $ | 4.36 | |
Class B | | $ | 1,000.00 | | $ | 1,016.10 | | $ | 8.14 | |
| | | | | | | | | | |
Hypothetical
(5% return per year before expenses) | | | | | | | |
Class A | | $ | 1,000.00 | | $ | 1,020.80 | | $ | 4.36 | |
Class B | | $ | 1,000.00 | | $ | 1,017.00 | | $ | 8.14 | |
* Expenses are equal to the Fund’s annualized expense ratio of 0.86% for Class A shares and 1.61% for Class B shares, multiplied by the average account value over the period, multiplied by 183/365 (to reflect the one-half year period). The Example assumes that the $1,000 was invested at the net asset value per share determined at the close of business on March 31, 2005.
Eaton Vance New York Limited Maturity Municipals Fund
| | Beginning Account Value | | Ending Account Value | | Expenses Paid During Period* | |
| | (4/1/05) | | (9/30/05) | | (4/1/05 - 9/30/05) | |
Actual | | | | | | | |
Class A | | $ | 1,000.00 | | $ | 1,010.50 | | $ | 4.10 | |
Class B | | $ | 1,000.00 | | $ | 1,017.60 | | $ | 7.89 | |
Class C | | $ | 1,000.00 | | $ | 1,016.60 | | $ | 7.89 | |
| | | | | | | | | | |
Hypothetical
(5% return per year before expenses) | | | | | | | |
Class A | | $ | 1,000.00 | | $ | 1,021.00 | | $ | 4.10 | |
Class B | | $ | 1,000.00 | | $ | 1,017.20 | | $ | 7.89 | |
Class C | | $ | 1,000.00 | | $ | 1,017.20 | | $ | 7.89 | |
* Expenses are equal to the Fund’s annualized expense ratio of 0.81% for Class A shares, 1.56% for Class B shares and 1.56% for Class C shares, multiplied by the average account value over the period, multiplied by 183/365 (to reflect the one-half year period). The Example assumes that the $1,000 was invested at the net asset value per share determined at the close of business on March 31, 2005.
19
Eaton Vance Ohio Limited Maturity Municipals Fund
| | Beginning Account Value | | Ending Account Value | | Expenses Paid During Period* | |
| | (4/1/05) | | (9/30/05) | | (4/1/05 - 9/30/05) | |
| | | | | | | |
Actual | | | | | | | |
Class A | | $ | 1,000.00 | | $ | 1,020.00 | | $ | 5.22 | |
Class B | | $ | 1,000.00 | | $ | 1,015.10 | | $ | 8.99 | |
| | | | | | | |
Hypothetical
(5% return per year before expenses) | | | | | | | |
Class A | | $ | 1,000.00 | | $ | 1,019.90 | | $ | 5.22 | |
Class B | | $ | 1,000.00 | | $ | 1,016.10 | | $ | 9.00 | |
* Expenses are equal to the Fund’s annualized expense ratio of 1.03% for Class A shares and 1.78% for Class B shares, multiplied by the average account value over the period, multiplied by 183/365 (to reflect the one-half year period). The Example assumes that the $1,000 was invested at the net asset value per share determined at the close of business on March 31, 2005.
Eaton Vance Pennsylvania Limited Maturity Municipals Fund
| | Beginning Account Value | | Ending Account Value | | Expenses Paid During Period* | |
| | (4/1/05) | | (9/30/05) | | (4/1/05 - 9/30/05) | |
| | | | | | | |
Actual | | | | | | | |
Class A | | $ | 1,000.00 | | $ | 1,023.60 | | $ | 4.41 | |
Class B | | $ | 1,000.00 | | $ | 1,019.70 | | $ | 8.20 | |
Class C | | $ | 1,000.00 | | $ | 1,018.70 | | $ | 8.20 | |
| | | | | | | |
Hypothetical
(5% return per year before expenses) | | | | | | | |
Class A | | $ | 1,000.00 | | $ | 1,020.70 | | $ | 4.41 | |
Class B | | $ | 1,000.00 | | $ | 1,016.90 | | $ | 8.19 | |
Class C | | $ | 1,000.00 | | $ | 1,016.90 | | $ | 8.19 | |
* Expenses are equal to the Fund’s annualized expense ratio of 0.87% for Class A shares, 1.62% for Class B shares and 1.62% for Class C shares, multiplied by the average account value over the period, multiplied by 183/365 (to reflect the one-half year period). The Example assumes that the $1,000 was invested at the net asset value per share determined at the close of business on March 31, 2005.
20
Eaton Vance California Limited Maturity Municipals Fund as of September 30, 2005
PORTFOLIO OF INVESTMENTS (Unaudited)
| |
Tax-Exempt Investments - 98.2% | | | | |
Principal Amount
(000's omitted) | |
Security | |
Value | |
| | Electric Utilities - 0.7% | | | | |
| $ | 250 | | | California Department of Water Resource Power Supply,
5.125%, 5/1/18 | | $ | 265,800 | | |
| | | | | | | $ | 265,800 | | |
| | Escrowed / Prerefunded - 1.6% | | | | |
| $ | 520 | | | California Statewide Communities Development Authority,
(San Gabriel Valley), Escrowed to Maturity,
5.50%, 9/1/14 | | $ | 580,824 | | |
| | | | | | | $ | 580,824 | | |
| | General Obligations - 4.1% | | | | |
| $ | 400 | | | California, 5.25%, 2/1/14 | | $ | 435,792 | | |
| | 1,000 | | | California, 5.25%, 11/1/16 | | | 1,088,480 | | |
| | | | | | | $ | 1,524,272 | | |
| | Hospital - 8.3% | | | | |
| $ | 500 | | | California Health Facilities Financing Authority,
(Cedars-Sinai Medical Center), 5.00%, 11/15/16 | | $ | 531,630 | | |
| | 700 | | | California Statewide Communities Development Authority,
(Daughters of Charity Health System California),
5.00%, 7/1/22 | | | 711,571 | | |
| | 700 | | | California Statewide Communities Development Authority,
(Huntington Memorial Hospital), 5.00%, 7/1/16 | | | 746,991 | | |
| | 130 | | | Eastern Plumas Health Care District, 7.50%, 8/1/07 | | | 133,620 | | |
| | 200 | | | San Benito Health Care District, 5.375%, 10/1/12 | | | 205,418 | | |
| | 400 | | | Stockton Health Facilities, (Dameron Hospital),
5.70%, 12/1/14 | | | 418,748 | | |
| | 300 | | | Torrance Hospital, (Torrance Memorial Medical Center),
5.40%, 6/1/15 | | | 320,865 | | |
| | | | | | | $ | 3,068,843 | | |
| | Industrial Development Revenue - 0.5% | | | | |
| $ | 200 | | | California Pollution Control Financing Authority,
(Browning Ferris Industries), (AMT), 5.80%, 12/1/16 | | $ | 195,884 | | |
| | | | | | | $ | 195,884 | | |
| | Insured-Education - 5.2% | | | | |
| $ | 1,000 | | | California Educational Facilities Authority,
(Pepperdine University), (AMBAC), 5.00%, 12/1/35 | | $ | 1,051,640 | | |
Principal Amount
(000's omitted)
Security | | | | Value | |
| Insured-Education (continued) | |
| $ | 475 | | | California Educational Facilities Authority,
(San Diego University), (AMBAC), 0.00%, 10/1/15 | | $ | 311,980 | | |
| | 500 | | | California Educational Facilities Authority,
(Santa Clara University), (MBIA), 5.00%, 2/1/19 | | | 533,855 | | |
| | | | | $ | 1,897,475 | | |
| Insured-Electric Utilities - 6.2% | |
| $ | 1,000 | | | California Pollution Control Financing Authority,
(San Diego Gas and Electric), (MBIA), 5.90%, 6/1/14(1) | | $ | 1,153,580 | | |
| | 500 | | | California Pollution Control Financing Authority, PCR,
(Pacific Gas and Electric), (MBIA), (AMT),
5.35%, 12/1/16 | | | 539,330 | | |
| | 500 | | | Puerto Rico Electric Power Authority, (MBIA),
5.50%, 7/1/18 | | | 578,385 | | |
| | | | | $ | 2,271,295 | | |
| Insured-Escrowed / Prerefunded - 2.1% | |
| $ | 210 | | | California University Foundation Revenue,
(Sacramento Auxiliary), (MBIA), Prerefunded to 10/1/12,
5.50%, 10/1/20 | | $ | 236,231 | | |
| | 500 | | | Napa County Flood Protection and Watershed
Improvements Authority, (FGIC), Prerefunded to 6/15/09,
5.00%, 6/15/18 | | | 538,920 | | |
| | | | | $ | 775,151 | | |
| Insured-General Obligations - 23.4% | |
| $ | 400 | | | Barstow Unified School District, (FGIC), 5.25%, 8/1/18 | | $ | 437,760 | | |
| | 1,000 | | | Burbank Unified School District, (FGIC), 0.00%, 8/1/12 | | | 773,780 | | |
| | 1,080 | | | Fillmore Unified School District, (FGIC), 0.00%, 7/1/15 | | | 716,980 | | |
| | 760 | | | Fresno Unified School District, (MBIA), 5.80%, 2/1/16 | | | 882,740 | | |
| | 750 | | | Los Angeles Unified School District, (Election of 1997),
(MBIA), 5.125%, 7/1/21 | | | 804,495 | | |
| | 500 | | | Oak Grove School District, (Election of 1995), (FGIC),
5.00%, 8/1/16 | | | 536,525 | | |
| | 1,000 | | | Redwood City Elementary School District, (FGIC),
5.00%, 8/1/15 | | | 1,098,790 | | |
| | 1,000 | | | San Diego Unified School District, (MBIA), 5.00%, 7/1/17 | | | 1,097,410 | | |
| | 1,000 | | | San Juan Unified School District, (FSA), 0.00%, 8/1/17 | | | 595,340 | | |
| | 705 | | | Ukiah Unified School District, (FGIC), 0.00%, 8/1/10 | | | 597,311 | | |
| | 1,000 | | | Walnut Valley Unified School District, (FGIC),
5.25%, 8/1/18 | | | 1,093,880 | | |
| | | | | $ | 8,635,011 | | |
See notes to financial statements
21
Eaton Vance California Limited Maturity Municipals Fund as of September 30, 2005
PORTFOLIO OF INVESTMENTS (Unaudited) CONT'D
Principal Amount
(000's omitted)
Security | | | | Value | |
| Insured-Hospital - 1.2% | |
| $ | 400 | | | California Statewide Communities Development Authority,
(Sutter Health), (FSA), 6.00%, 8/15/13 | | $ | 440,264 | | |
| | | | | $ | 440,264 | | |
Insured-Lease Revenue / Certificates of
Participation - 6.3% | |
| $ | 1,750 | | | Anaheim Public Financing Authority,
(Public Improvements), (FSA), 0.00%, 9/1/19 | | $ | 938,105 | | |
| | 750 | | | California Public Works, (UCLA Replacement Hospital),
(FSA), 5.375%, 10/1/16 | | | 817,942 | | |
| | 505 | | | California State Public Works Board, (Department of
Corrections), (AMBAC), 5.25%, 12/1/13 | | | 561,535 | | |
| | | | | $ | 2,317,582 | | |
| Insured-Special Tax Revenue - 10.9% | |
| $ | 600 | | | Burbank Public Financing Authority, (Golden State
Redevelopment), (AMBAC), 5.25%, 12/1/22 | | $ | 645,084 | | |
| | 1,050 | | | California Economic Recovery, (FGIC), 5.25%, 7/1/14 | | | 1,169,438 | | |
| | 1,000 | | | Garden Grove Community Development (Tax Allocation),
(AMBAC), 5.25%, 10/1/16 | | | 1,089,530 | | |
| | 1,000 | | | San Mateo County Transportation District, (MBIA),
5.25%, 6/1/17 | | | 1,125,040 | | |
| | | | | $ | 4,029,092 | | |
| Insured-Transportation - 5.3% | |
| $ | 1,000 | | | Puerto Rico Commonwealth Highway and Transportation
Authority, (FSA), 5.50%, 7/1/17 | | $ | 1,152,180 | | |
| | 1,000 | | | San Joaquin Hills, Transportation Corridor Agency Bridge &
Toll Road, (MBIA), 0.00%, 1/15/12 | | | 791,900 | | |
| | | | | $ | 1,944,080 | | |
| Insured-Water and Sewer - 5.3% | |
| $ | 1,000 | | | California Department of Water Resources, (FGIC),
5.50%, 12/1/17 | | $ | 1,146,990 | | |
| | 250 | | | Sacramento County, Sanitation Financing Authority,
(AMBAC), 5.50%, 12/1/19 | | | 286,883 | | |
| | 500 | | | Sunnyvale Financing Authority Water and Wastewater,
(AMBAC), 5.00%, 10/1/22 | | | 528,800 | | |
| | | | | $ | 1,962,673 | | |
| Lease Revenue / Certificates of Participation - 3.0% | |
| $ | 1,000 | | | California Public Works, (University of California),
5.25%, 6/1/20 | | $ | 1,111,740 | | |
| | | | | $ | 1,111,740 | | |
Principal Amount
(000's omitted)
Security | | | | Value | |
| Other Revenue - 0.9% | |
| $ | 295 | | | California Statewide Communities Development Authority,
(East Valley Tourist Development Authority),
8.25%, 10/1/14 | | $ | 318,709 | | |
| | | | | $ | 318,709 | | |
| Senior Living / Life Care - 0.7% | |
| $ | 250 | | | ABAG Finance Authority, (American Baptist Homes),
5.75%, 10/1/17 | | $ | 252,620 | | |
| | | | | $ | 252,620 | | |
| Solid Waste - 1.0% | |
| $ | 350 | | | Napa-Vallejo Waste Management Authority,
(Solid Waste Transfer Facilities), (AMT),
5.10%, 2/15/14 | | $ | 353,889 | | |
| | | | | $ | 353,889 | | |
| Special Tax Revenue - 9.3% | |
| $ | 300 | | | Alameda Public Financing Authority, 5.45%, 9/2/14 | | $ | 307,512 | | |
| | 240 | | | Brentwood Infrastructure Financing Authority,
5.625%, 9/2/15 | | | 247,279 | | |
| | 195 | | | Corona Public Financing Authority, 5.70%, 9/1/13 | | | 195,770 | | |
| | 200 | | | Fontana Redevelopment Agency, (Jurupa Hills),
5.50%, 10/1/17 | | | 210,690 | | |
| | 250 | | | Jurupa Community Services District, 5.00%, 9/1/25 | | | 247,658 | | |
| | 40 | | | Moreno Valley Unified School District, (Community
District No. 2003-2), 5.20%, 9/1/17 | | | 40,602 | | |
| | 80 | | | Moreno Valley Unified School District, (Community
District No. 2003-2), 5.25%, 9/1/18 | | | 81,358 | | |
| | 160 | | | Murrueta Valley Unified School District, 5.70%, 9/1/17 | | | 171,578 | | |
| | 390 | | | Pomona Redevelopment Agency, (West Holt Avenue
Redevelopment), 5.50%, 5/1/13 | | | 416,493 | | |
| | 295 | | | Rancho Cucamonga Public Finance Authority,
5.75%, 9/2/12 | | | 312,027 | | |
| | 290 | | | Roseville Special Tax, 6.00%, 9/1/11 | | | 314,975 | | |
| | 200 | | | Santa Margarita Water District, 6.10%, 9/1/14 | | | 217,790 | | |
| | 200 | | | Santaluz Community Facility District No. 2,
5.80%, 9/1/14 | | | 203,974 | | |
| | 200 | | | Torrance Redevelopment Agency, 5.50%, 9/1/12 | | | 208,596 | | |
| | 250 | | | Whittier Public Financing Authority, (Greenleaf Avenue
Redevelopment), 5.50%, 11/1/16 | | | 264,580 | | |
| | | | | $ | 3,440,882 | | |
| Transportation - 0.8% | |
| $ | 290 | | | Port Redwood City, (AMT), 5.40%, 6/1/19 | | $ | 299,616 | | |
| | | | | $ | 299,616 | | |
See notes to financial statements
22
Eaton Vance California Limited Maturity Municipals Fund as of September 30, 2005
PORTFOLIO OF INVESTMENTS (Unaudited) CONT'D
Principal Amount
(000's omitted)
Security | | | | Value | |
| Water and Sewer - 1.4% | |
| $ | 500 | | | Metropolitan Water District, (Southern California Waterworks),
4.75%, 7/1/22 | | $ | 509,010 | | |
| | | | | $ | 509,010 | | |
Total Tax-Exempt Investments - 98.2%
(identified cost $34,761,208) | | | | $ | 36,194,712 | | |
| Other Assets, Less Liabilities - 1.8% | | | | $ | 666,008 | | |
| Net Assets - 100% | | | | $ | 36,860,720 | | |
AMBAC - AMBAC Financial Group, Inc.
AMT - Interest earned from these securities may be considered a tax preference item for purposes of the Federal Alternative Minimum Tax.
FGIC - Financial Guaranty Insurance Company
FSA - Financial Security Assurance, Inc.
MBIA - Municipal Bond Insurance Association
The Fund invests primarily in debt securities issued by California municipalities. The ability of the issuers of the debt securities to meet their obligations may be affected by economic developments in a specific industry or municipality. In order to reduce the risk associated with such economic developments, at September 30, 2005, 67.1% of the securities in the portfolio of investments are backed by bond insurance of various financial institutions and financial guaranty assurance agencies. The aggregate percentage insured by an individual financial institution ranged from 10.9% to 22.4% of total investments.
(1) Security (or a portion thereof) has been segregated to cover margin requirements on open financial futures contracts.
See notes to financial statements
23
Eaton Vance Florida Limited Maturity Municipals Fund as of September 30, 2005
PORTFOLIO OF INVESTMENTS (Unaudited)
Tax-Exempt Investments - 99.9% | |
Principal Amount
(000's omitted) | |
Security | |
Value | |
| Hospital - 3.9% | |
| $ | 1,000 | | | Highlands County Health Facilities Authority,
(Adventist Health System), 5.25%, 11/15/20 | | $ | 1,032,500 | | |
| | 800 | | | Highlands County, Health Facilities Authority,
(Adventist Health System), 5.00%, 11/15/16(1) | | | 851,288 | | |
| | 500 | | | West Orange Healthcare District, 5.50%, 2/1/10 | | | 535,560 | | |
| | | | | | | $ | 2,419,348 | | |
| Industrial Development Revenue - 0.9% | |
| $ | 500 | | | Polk County IDA, (Cargill Fertilizer), (AMT),
5.50%, 11/1/09 | | $ | 532,105 | | |
| | | | | | | $ | 532,105 | | |
| Insured-Electric Utilities - 7.0% | |
| $ | 2,000 | | | Escambia County Utilities Authority, (FGIC),
0.00%, 1/1/15 | | $ | 1,360,220 | | |
| | 1,165 | | | Puerto Rico Electric Power Authority, (MBIA),
5.50%, 7/1/18 | | | 1,347,637 | | |
| | 1,450 | | | Puerto Rico Electric Power Authority, (XLCA),
5.375%, 7/1/18 | | | 1,643,676 | | |
| | | | | | | $ | 4,351,533 | | |
| Insured-Escrowed / Prerefunded - 2.4% | |
| $ | 750 | | | Palm Beach County Public Improvements, (Convention Center),
(FGIC), Prerefunded to 1/01/11, 5.625%, 11/1/15 | | $ | 839,932 | | |
| | 1,000 | | | Port Saint Lucie Utility, (MBIA), Escrowed to Maturity,
0.00%, 9/1/15 | | | 661,030 | | |
| | | | | | | $ | 1,500,962 | | |
| Insured-General Obligations - 5.5% | |
| $ | 500 | | | Miami, (Homeland Defense), (MBIA), 0.00%, 1/1/12 | | $ | 393,685 | | |
| | 1,000 | | | Miami, (MBIA), 5.375%, 9/1/15 | | | 1,102,360 | | |
| | 750 | | | Miami-Dade County General Obligation, (Fire and
Rescue Service District), (AMBAC), 5.25%, 4/1/17 | | | 815,512 | | |
| | 1,000 | | | Miami-Dade County School District, (FSA), 5.375%, 8/1/15 | | | 1,126,720 | | |
| | | | | | | $ | 3,438,277 | | |
| Insured-Hospital - 4.0% | |
| $ | 750 | | | Miami-Dade County, Health Facilities Authority,
(Miami Children's Hospital), (AMBAC), 5.625%, 8/15/16 | | $ | 834,097 | | |
| | 1,000 | | | Saint Petersburg Health Facilities Authority,
(All Children's Hospital), (AMBAC), 5.50%, 11/15/17 | | | 1,087,950 | | |
| | 500 | | | Sarasota County Public Hospital, (MBIA), 5.25%, 7/1/18 | | | 551,655 | | |
| | | | | | | $ | 2,473,702 | | |
Principal Amount
(000's omitted)
Security | | | | Value | |
| Insured-Housing - 2.0% | | | |
| $ | 620 | | | Florida Housing Finance Authority, (Leigh Meadows
Apartments), (AMBAC), (AMT), 5.85%, 9/1/10 | | $ | 640,218 | | |
| | 585 | | | Florida Housing Finance Authority, (Stottert Arms
Apartments), (AMBAC), (AMT), 5.90%, 9/1/10 | | | 604,305 | | |
| | | | | $ | 1,244,523 | | |
| Insured-Miscellaneous - 6.2% | | | |
| $ | 500 | | | Florida Board of Education Lottery Revenue, (FGIC),
5.00%, 7/1/20 | | $ | 531,355 | | |
| | 1,100 | | | Florida Board of Education Lottery Revenue, (FGIC),
5.25%, 7/1/20 | | | 1,183,611 | | |
| | 1,500 | | | Jacksonville Entitlement Revenue, (Public Improvements),
(FGIC), 5.00%, 10/1/21 | | | 1,593,840 | | |
| | 500 | | | Saint Johns County IDA, (Professional Golf Hall of Fame),
(MBIA), 5.00%, 9/1/20 | | | 532,050 | | |
| | | | | $ | 3,840,856 | | |
| Insured-Solid Waste - 4.0% | | | |
| $ | 1,750 | | | Dade County, Resource Recovery Facilities, (AMBAC),
(AMT), 5.30%, 10/1/07(2) | | $ | 1,819,790 | | |
| | 1,100 | | | Palm Beach Solid Waste Authority, (AMBAC),
0.00%, 10/1/16 | | | 687,324 | | |
| | | | | $ | 2,507,114 | | |
| Insured-Special Tax Revenue - 9.5% | | | |
| $ | 1,755 | | | Julington Creek Plantation Community Development District,
(MBIA), 4.75%, 5/1/19 | | $ | 1,814,214 | | |
| | 2,000 | | | Miami-Dade County Professional Sports Franchise Facilities,
(MBIA), 0.00%, 10/1/13 | | | 1,463,600 | | |
| | 330 | | | Miami-Dade County, (MBIA), 0.00%, 10/1/08 | | | 298,402 | | |
| | 770 | | | Seminole County Sales Tax, (FGIC), 5.375%, 10/1/19 | | | 847,524 | | |
| | 595 | | | St. Cloud, Sales Tax, (FGIC), 5.00%, 9/1/18 | | | 636,823 | | |
| | 250 | | | St. Cloud, Sales Tax, (FGIC), 5.00%, 9/1/19 | | | 267,467 | | |
| | 500 | | | Tamarac, Sales Tax, (FGIC), 5.00%, 4/1/18 | | | 534,315 | | |
| | | | | $ | 5,862,345 | | |
| Insured-Transportation - 17.3% | | | |
| $ | 1,000 | | | Broward County Airport System, (MBIA), (AMT),
5.375%, 10/1/13 | | $ | 1,058,050 | | |
| | 1,000 | | | Canaveral Port Authority Improvements, (FGIC),
5.00%, 6/1/19 | | | 1,068,970 | | |
| | 1,750 | | | Dade County, Seaport, (MBIA), 5.125%, 10/1/16(3) | | | 1,816,973 | | |
| | 2,000 | | | Hillsborough County, Avaition Authority, (AMBAC),
(AMT), 5.25%, 10/1/18 | | | 2,172,640 | | |
| | 4,000 | | | Puerto Rico Highway and Transportation Authority,
(MBIA), 5.50%, 7/1/19 | | | 4,641,200 | | |
| | | | | $ | 10,757,833 | | |
See notes to financial statements
24
Eaton Vance Florida Limited Maturity Municipals Fund as of September 30, 2005
PORTFOLIO OF INVESTMENTS (Unaudited) CONT'D
Principal Amount
(000's omitted)
Security | | | | Value | |
| Insured-Water and Sewer - 20.5% | | | |
| $ | 2,260 | | | Boynton Beach Utility System, (FGIC), 5.50%, 11/1/17 | | $ | 2,595,158 | | |
| | 750 | | | Hillsborough County, Capacity Assessment, (FSA),
5.125%, 3/1/20 | | | 802,088 | | |
| | 1,500 | | | Marco Island Utility System, (MBIA), 5.25%, 10/1/16 | | | 1,648,875 | | |
| | 2,000 | | | Seacoast Utilities Authority Water and Sewer, (FGIC),
5.50%, 3/1/16 | | | 2,278,220 | | |
| | 1,320 | | | Sebring Water and Wastewater, (FGIC), 5.25%, 1/1/15 | | | 1,441,136 | | |
| | 1,000 | | | Sunrise Utilities Systems, (AMBAC), 5.20%, 10/1/22 | | | 1,109,910 | | |
| | 1,000 | | | Sunrise Utilities Systems, (AMBAC), 5.50%, 10/1/18 | | | 1,140,890 | | |
| | 1,000 | | | Tallahassee, Consolidated Utilities System, (FGIC),
5.50%, 10/1/18 | | | 1,149,290 | | |
| | 500 | | | Tallahassee, Consolidated Utilities System, (FGIC),
5.50%, 10/1/19 | | | 576,035 | | |
| | | | | $ | 12,741,602 | | |
| Nursing Home - 1.5% | | | |
| $ | 555 | | | Okaloosa County, Retirement Rental Housing,
(Encore Retirement Partners), 6.125%, 2/1/14 | | $ | 507,614 | | |
| | 385 | | | Orange County, Health Facilities Authority,
(Westminister Community Care Services), 6.50%, 4/1/12 | | | 399,926 | | |
| | | | | $ | 907,540 | | |
| Senior Living / Life Care - 1.7% | | | |
| $ | 250 | | | Lee County IDA, (Shell Point Village), 5.50%, 11/15/21 | | $ | 255,650 | | |
| | 250 | | | Lee County IDA, (Shell Point Village), 5.75%, 11/15/14 | | | 260,958 | | |
| | 590 | | | North Miami HFA, (Imperial Club), 6.75%, 1/1/33 | | | 552,942 | | |
| | | | | $ | 1,069,550 | | |
| Special Tax Revenue - 7.6% | | | |
| $ | 700 | | | Concorde Estates Community Development District,
Capital Improvements, 5.00%, 5/1/11 | | $ | 704,207 | | |
| | 400 | | | Dupree Lakes Community Development District,
5.00%, 11/1/10 | | | 401,140 | | |
| | 50 | | | Fishhawk Community Development District II,
5.00%, 11/1/07 | | | 50,446 | | |
| | 375 | | | Fishhawk Community Development District ll,
5.125%, 11/1/09 | | | 379,834 | | |
| | 355 | | | Gateway Services Community Development District,
(Stoneybrook), 5.50%, 7/1/08 | | | 357,911 | | |
| | 345 | | | Heritage Harbour South Community Development District,
(Capital Improvements), 5.25%, 11/1/08 | | | 347,529 | | |
| | 180 | | | Heritage Harbour South Community Development District,
(Capital Improvements), 5.40%, 11/1/08 | | | 181,418 | | |
| | 60 | | | Heritage Palms Community Development District,
Capital Improvements, 6.25%, 11/1/07 | | | 60,650 | | |
| | 115 | | | Longleaf Community Development District, 6.20%, 5/1/09 | | | 115,361 | | |
| | 345 | | | North Springs, Improvement District, (Heron Bay),
7.00%, 5/1/19 | | | 355,385 | | |
Principal Amount
(000's omitted)
Security | | | | Value | |
| Special Tax Revenue (continued) | | | |
| $ | 1,000 | | | Orlando Capital Improvements, 5.00%, 10/1/18 | | $ | 1,055,930 | | |
| | 645 | | | Sterling Hill Community Development District,
Capital Improvements, 5.50%, 11/1/10 | | | 649,767 | | |
| | 40 | | | Waterlefe Community Development District,
Capital Improvements, 6.25%, 5/1/10 | | | 40,414 | | |
| | | | | $ | 4,699,992 | | |
| Transportation - 2.3% | | | |
| $ | 1,340 | | | Florida Turnpike Authority, 5.25%, 7/1/21 | | $ | 1,440,634 | | |
| | | | | $ | 1,440,634 | | |
| Utilities - 3.6% | | | |
| $ | 240 | | | Orlando Utilities Commission Water and Electric,
5.00%, 10/1/18 | | $ | 256,937 | | |
| | 750 | | | Orlando Utilities Commission Water and Electric,
5.00%, 10/1/22 | | | 793,350 | | |
| | 1,100 | | | Orlando Water and Electric Utilities Commission,
5.25%, 10/1/20 | | | 1,192,862 | | |
| | | | | $ | 2,243,149 | | |
Total Tax-Exempt Investments - 99.9%
(identified cost $59,576,304) | | | | $ | 62,031,065 | | |
| Other Assets, Less Liabilities - 0.1% | | | | $ | 37,086 | | |
| Net Assets - 100.0% | | | | $ | 62,068,151 | | |
AMBAC - AMBAC Financial Group, Inc.
AMT - Interest earned from these securities may be considered a tax preference item for purposes of the Federal Alternative Minimum Tax.
FGIC - Financial Guaranty Insurance Company
FSA - Financial Security Assurance, Inc.
MBIA - Municipal Bond Insurance Association
XLCA - XL Capital Assurance, Inc.
The Fund invests primarily in debt securities issued by Florida municipalities. The ability of the issuers of the debt securities to meet their obligations may be affected by economic developments in a specific industry or municipality. In order to reduce the risk associated with such economic developments, at September 30, 2005, 78.5% of the securities in the portfolio of investments are backed by bond insurance of various financial institutions and financial guaranty assurance agencies. The aggregate percentage insured by an individual financial institution ranged from 2.6% to 27.9% of total investments.
(1) When-issued security.
(2) Security (or a portion thereof) has been segregated to cover when-issued securities.
(3) Security (or a portion thereof) has been segregated to cover margin requirements on open financial futures contracts.
See notes to financial statements
25
Eaton Vance Massachusetts Limited Maturity Municipals Fund as of September 30, 2005
PORTFOLIO OF INVESTMENTS (Unaudited)
| | Tax-Exempt Investments - 99.9% | | | | |
Principal Amount
(000's omitted) | |
Security | |
Value | |
| | Education - 16.0% | | | | |
| $ | 580 | | | Massachusetts Development Finance Agency, (Massachusetts
College of Pharmacy), 5.00%, 7/1/11 | | $ | 606,471 | | |
| | 1,000 | | | Massachusetts Development Finance Agency,
(Milton Academy), 5.00%, 9/1/19 | | | 1,074,440 | | |
| | 400 | | | Massachusetts Development Finance Agency,
(Xaverian Brothers High School), 5.55%, 7/1/19 | | | 416,556 | | |
| | 1,000 | | | Massachusetts HEFA, (Boston College), 5.00%, 6/1/11 | | | 1,075,420 | | |
| | 1,305 | | | Massachusetts HEFA, (Boston College), 5.25%, 6/1/20 | | | 1,400,604 | | |
| | 1,000 | | | Massachusetts HEFA, (Boston College), 5.375%, 6/1/14 | | | 1,113,630 | | |
| | 1,000 | | | Massachusetts HEFA, (Harvard University),
5.00%, 7/15/22 | | | 1,062,080 | | |
| | 1,000 | | | Massachusetts HEFA, (Massachusetts Institute of
Technology), 5.00%, 7/1/18 | | | 1,110,170 | | |
| | 1,000 | | | Massachusetts HEFA, (Massachusetts Institute of
Technology), 5.375%, 7/1/17 | | | 1,143,520 | | |
| | 750 | | | Massachusetts HEFA, (Tufts University), 5.50%, 8/15/15 | | | 851,025 | | |
| | 1,125 | | | Massachusetts IFA, (Babson College), 5.375%, 10/1/17 | | | 1,172,171 | | |
| | 500 | | | Massachusetts IFA, (Belmont Hill School), 5.15%, 9/1/13 | | | 520,065 | | |
| | 750 | | | Massachusetts IFA, (St. Johns High School, Inc.),
5.70%, 6/1/18 | | | 779,505 | | |
| | 500 | | | Massachusetts IFA, (Wentworth Institute of Technology),
5.55%, 10/1/13 | | | 527,900 | | |
| | | | | | | $ | 12,853,557 | | |
| | Electric Utilities - 0.7% | | | | |
| $ | 500 | | | Massachusetts Development Finance Agency,
(Devens Electric System), 5.75%, 12/1/20 | | $ | 535,535 | | |
| | | | | | | $ | 535,535 | | |
| | Escrowed / Prerefunded - 8.7% | | | | |
| $ | 350 | | | Massachusetts Development Finance Agency,
(YMCA of Greater Boston), Prerefunded to 11/1/08,
5.25%, 11/1/13 | | $ | 375,781 | | |
| | 500 | | | Massachusetts HEFA, (Dana Farber Cancer Institute),
Escrowed to Maturity, 6.50%, 12/1/05 | | | 503,095 | | |
| | 485 | | | Massachusetts IFA, (Dana Hall), Prerefunded to 7/1/07,
5.90%, 7/1/27 | | | 516,598 | | |
| | 1,030 | | | Massachusetts IFA, (Park School), Prerefunded to 9/1/06,
5.50%, 9/1/16 | | | 1,067,966 | | |
| | 1,000 | | | Massachusetts Turnpike Authority, Escrowed to Maturity,
5.00%, 1/1/13 | | | 1,074,280 | | |
| | 2,100 | | | Massachusetts Turnpike Authority, Escrowed to Maturity,
5.00%, 1/1/20(1) | | | 2,287,152 | | |
Principal Amount
(000's omitted) | |
Security | |
Value | |
| | Escrowed / Prerefunded (continued) | | | | |
| $ | 680 | | | Massachusetts Water Pollution Abatement Trust,
Escrowed to Maturity, 5.25%, 8/1/14 | | $ | 752,094 | | |
| | 400 | | | Rail Connections, Inc., (Rte. 128 Parking Garage),
Escrowed to Maturity, 5.30%, 7/1/09 | | | 430,416 | | |
| | | | | | | $ | 7,007,382 | | |
| | General Obligations - 6.8% | | | | |
| $ | 1,000 | | | Boston, 5.00%, 2/1/18 | | $ | 1,065,120 | | |
| | 500 | | | Burlington, 5.00%, 2/1/15 | | | 546,435 | | |
| | 500 | | | Burlington, 5.00%, 2/1/16 | | | 547,955 | | |
| | 750 | | | Falmouth, 5.25%, 2/1/16 | | | 823,935 | | |
| | 1,100 | | | Wellesley, 5.00%, 6/1/16 | | | 1,219,427 | | |
| | 1,150 | | | Wellesley, 5.00%, 6/1/17 | | | 1,277,316 | | |
| | | | | | | $ | 5,480,188 | | |
| | Health Care-Miscellaneous - 0.5% | | | | |
| $ | 165 | | | Massachusetts Development Finance Agency,
(MCHSP Human Services), 6.60%, 8/15/29 | | $ | 167,734 | | |
| | 225 | | | Massachusetts Development Finance Agency,
(New England Center for Children), 5.30%, 11/1/08 | | | 230,240 | | |
| | | | | | | $ | 397,974 | | |
| | Hospital - 4.5% | | | | |
| $ | 600 | | | Massachusetts HEFA, (Baystate Medical Center),
5.75%, 7/1/14 | | $ | 652,494 | | |
| | 865 | | | Massachusetts HEFA, (Baystate Medical Center),
5.75%, 7/1/15 | | | 936,977 | | |
| | 245 | | | Massachusetts HEFA, (Berkshire Health System),
4.50%, 10/1/05 | | | 245,002 | | |
| | 435 | | | Massachusetts HEFA, (Central New England
Health Systems), 6.125%, 8/1/13 | | | 436,479 | | |
| | 250 | | | Massachusetts HEFA, (Partners Healthcare System),
5.00%, 7/1/09 | | | 263,877 | | |
| | 1,000 | | | Massachusetts HEFA, (Partners Healthcare System),
5.50%, 7/1/10 | | | 1,090,010 | | |
| | | | | | | $ | 3,624,839 | | |
| | Insured-Education - 3.5% | | | | |
| $ | 1,560 | | | Massachusetts College Building Authority, (XLCA),
5.375%, 5/1/14 | | $ | 1,732,723 | | |
| | 1,000 | | | University of Massachusetts Building Authority, (AMBAC),
5.25%, 11/1/13 | | | 1,107,810 | | |
| | | | | | | $ | 2,840,533 | | |
See notes to financial statements
26
Eaton Vance Massachusetts Limited Maturity Municipals Fund as of September 30, 2005
PORTFOLIO OF INVESTMENTS (Unaudited) CONT'D
Principal Amount
(000's omitted) | |
Security | |
Value | |
| Insured-Electric Utilities - 9.3% | |
| $ | 2,120 | | | Massachusetts Municipal Wholesale Electric Co., (MBIA),
5.25%, 7/1/12 | | $ | 2,327,251 | | |
| | 1,000 | | | Massachusetts Power Supply System, (Municipal Wholesale
Electric Co.), (MBIA), 5.25%, 7/1/13 | | | 1,094,300 | | |
| | 1,500 | | | Puerto Rico Electric Power Authority, (MBIA),
5.50%, 7/1/16 | | | 1,721,130 | | |
| | 2,000 | | | Puerto Rico Electric Power Authority, (MBIA),
5.50%, 7/1/18 | | | 2,313,540 | | |
| | | | | | | $ | 7,456,221 | | |
| Insured-Escrowed / Prerefunded - 1.7% | |
| $ | 400 | | | Massachusetts Turnpike Authority, Escrowed to Maturity,
(FGIC), 5.125%, 1/1/23 | | $ | 446,636 | | |
| | 850 | | | Route 3 North Transportation Improvements Association,
(MBIA), Prerefunded to 6/15/10, 5.625%, 6/15/21 | | | 937,312 | | |
| | | | | | | $ | 1,383,948 | | |
| Insured-General Obligations - 13.7% | |
| $ | 1,000 | | | Boston, (MBIA), 5.00%, 2/1/19 | | $ | 1,075,060 | | |
| | 2,000 | | | Dudley-Charlton Regional School District, (FGIC),
5.125%, 6/15/13 | | | 2,203,320 | | |
| | 1,000 | | | Fall River, (FSA), 5.25%, 2/1/14 | | | 1,109,240 | | |
| | 780 | | | Groton-Dunstable Regional School District, (FSA),
5.00%, 10/15/17 | | | 841,129 | | |
| | 750 | | | Haverhill, (FGIC), 5.00%, 6/15/17 | | | 779,475 | | |
| | 750 | | | Lawrence, (MBIA), 5.00%, 3/15/13 | | | 817,462 | | |
| | 1,000 | | | Massachusetts, (AMBAC), 5.00%, 7/1/12 | | | 1,084,770 | | |
| | 1,095 | | | Puerto Rico Public Improvements, (XLCA), 5.25%, 7/1/17 | | | 1,223,914 | | |
| | 1,175 | | | Puerto Rico Public Improvements, (XLCA), 5.50%, 7/1/15 | | | 1,331,839 | | |
| | 500 | | | Springfield, (MBIA), 5.25%, 1/15/15 | | | 548,770 | | |
| | | | | | | $ | 11,014,979 | | |
| Insured-Hospital - 1.3% | |
| $ | 1,000 | | | Massachusetts HEFA, (New England Medical Center Hospital),
(FGIC), 5.375%, 5/15/15 | | $ | 1,088,690 | | |
| | | | | | | $ | 1,088,690 | | |
| Insured-Miscellaneous - 1.0% | |
| $ | 750 | | | Boston Convention Center Act 1997, (AMBAC),
5.00%, 5/1/16 | | $ | 802,613 | | |
| | | | | | | $ | 802,613 | | |
Principal Amount
(000's omitted) | |
Security | |
Value | |
| Insured-Solid Waste - 2.7% | |
| $ | 1,000 | | | Massachusetts Development Finance Agency,
(Semass System), (MBIA), 5.625%, 1/1/13 | | $ | 1,106,500 | | |
| | 1,000 | | | Massachusetts Development Finance Agency,
(Semass System), (MBIA), 5.625%, 1/1/16 | | | 1,090,760 | | |
| | | | | | | $ | 2,197,260 | | |
| Insured-Special Tax Revenue - 4.1% | |
| $ | 1,500 | | | Massachusetts Special Obligations, (FGIC), 5.25%, 1/1/21 | | $ | 1,685,895 | | |
| | 1,000 | | | Puerto Rico Infrastructure Financing Authority, (FGIC),
5.50%, 7/1/19 | | | 1,154,550 | | |
| | 400 | | | Virgin Islands Public Financing Authority, (FSA),
5.00%, 10/1/13 | | | 438,348 | | |
| | | | | | | $ | 3,278,793 | | |
| Insured-Transportation - 10.1% | |
| $ | 1,630 | | | Massachusetts Bay Transportation Authority,
(General Transportation System), (MBIA), 5.50%, 3/1/14 | | $ | 1,835,266 | | |
| | 500 | | | Massachusetts Port Authority, (Delta Airlines), (AMBAC),
(AMT), 5.50%, 1/1/15 | | | 529,850 | | |
| | 1,225 | | | Massachusetts Port Authority, (FSA), 5.125%, 7/1/17 | | | 1,303,572 | | |
| | 1,500 | | | Massachusetts State Federal Highway Grant Anticipation Notes,
(FSA), 5.50%, 12/15/13 | | | 1,689,315 | | |
| | 1,000 | | | Puerto Rico Commonwealth Highway and Transportation
Authority, (FSA), 5.50%, 7/1/11 | | | 1,112,420 | | |
| | 500 | | | Puerto Rico Commonwealth Highway and Transportation
Authority, (FSA), 5.50%, 7/1/17 | | | 576,090 | | |
| | 1,000 | | | Puerto Rico Highway and Transportation Authority (CIFG),
5.50%, 7/1/15 | | | 1,131,740 | | |
| | | | | | | $ | 8,178,253 | | |
| Lease Revenue / Certificates of Participation - 0.7% | |
| $ | 580 | | | Puerto Rico, ITEM & ECFA, (Guaynabo Municipal Government),
5.375%, 7/1/06 | | $ | 589,170 | | |
| | | | | | | $ | 589,170 | | |
| Miscellaneous - 1.3% | |
| $ | 1,000 | | | Massachusetts Development Finance Agency,
(Jewish Philanthropies), 5.25%, 2/1/22 | | $ | 1,082,570 | | |
| | | | | | | $ | 1,082,570 | | |
| Nursing Home - 0.9% | |
| $ | 515 | | | Massachusetts HEFA, (Christopher House), 6.25%, 1/1/07 | | $ | 520,619 | | |
| | 175 | | | Massachusetts IFA, (Age Institute of Massachusetts),
7.60%, 11/1/05 | | | 175,149 | | |
| | | | | | | $ | 695,768 | | |
See notes to financial statements
27
Eaton Vance Massachusetts Limited Maturity Municipals Fund as of September 30, 2005
PORTFOLIO OF INVESTMENTS (Unaudited) CONT'D
Principal Amount
(000's omitted) | |
Security | |
Value | |
| | Senior Living / Life Care - 1.4% | | | | |
| $ | 600 | | | Massachusetts Development Finance Agency,
(Berkshire Retirement), 5.60%, 7/1/19 | | $ | 605,604 | | |
| | 480 | | | Massachusetts IFA, (Forge Hill), (AMT), 6.75%, 4/1/30 | | | 484,435 | | |
| | | | | | | $ | 1,090,039 | | |
| | Solid Waste - 1.3% | | | | |
| $ | 1,000 | | | Massachusetts IFA, (Ogden Haverhill), (AMT),
5.50%, 12/1/13 | | $ | 1,022,590 | | |
| | | | | | | $ | 1,022,590 | | |
| | Special Tax Revenue - 4.5% | | | | |
| $ | 750 | | | Massachusetts Bay Transportation Authority, Sales Tax,
5.25%, 7/1/16 | | $ | 838,538 | | |
| | 1,000 | | | Massachusetts Bay Transportation Authority, Sales Tax,
5.25%, 7/1/16 | | | 1,118,050 | | |
| | 1,000 | | | Massachusetts Bay Transportation Authority, Sales Tax,
5.50%, 7/1/17 | | | 1,142,020 | | |
| | 500 | | | Massachusetts Special Obligations, 5.00%, 6/1/14 | | | 543,090 | | |
| | | | | | | $ | 3,641,698 | | |
| | Transportation - 3.0% | | | | |
| $ | 1,000 | | | Massachusetts Port Authority, (AMT), 6.25%, 7/1/17 | | $ | 1,097,420 | | |
| | 2,000 | | | Massachusetts State Federal Highway Grant Anticipation
Notes, 0.00%, 6/15/15 | | | 1,332,740 | | |
| | | | | | | $ | 2,430,160 | | |
| | Water and Sewer - 2.2% | | | | |
| $ | 1,595 | | | Massachusetts Water Pollution Abatement Trust,
0.00%, 8/1/12 | | $ | 1,228,405 | | |
| | 500 | | | Massachusetts Water Pollution Abatement Trust,
5.25%, 2/1/12 | | | 545,860 | | |
| | | | | | | $ | 1,774,265 | | |
| | Total Tax-Exempt Investments - 99.9%
(identified cost $77,244,960) | | | | | $ | 80,467,025 | | |
| | Other Assets, Less Liabilities - 0.1% | | | | | $ | 89,178 | | |
| | Net Assets - 100.0% | | | | | $ | 80,556,203 | | |
AMBAC - AMBAC Financial Group, Inc.
AMT - Interest earned from these securities may be considered a tax preference item for purposes of the Federal Alternative Minimum Tax.
CIFG - CDC IXIS Financial Guaranty North America, Inc.
FGIC - Financial Guaranty Insurance Company
FSA - Financial Security Assurance, Inc.
MBIA - Municipal Bond Insurance Association
XLCA - XL Capital Assurance, Inc.
The Fund invests primarily in debt securities issued by Massachusetts municipalities. The ability of the issuers of the debt securities to meet their obligations may be affected by economic developments in a specific industry or municipality. In order to reduce the risk associated with such economic developments, at September 30, 2005, 47.5% of the securities in the portfolio of investments are backed by bond insurance of various financial institutions and financial guaranty assurance agencies. The aggregate percentage insured by an individual financial institution ranged from 1.4% to 18.5% of total investments.
(1) Security (or a portion thereof) has been segregated to cover margin requirements on open financial futures contracts.
See notes to financial statements
28
Eaton Vance New Jersey Limited Maturity Municipals Fund as of September 30, 2005
PORTFOLIO OF INVESTMENTS (Unaudited)
Tax-Exempt Investments - 99.8% | |
Principal Amount
(000's omitted) | |
Security | |
Value | |
| Education - 1.6% | |
| $ | 750 | | | New Jersey Educational Facilities Authority,
(Stevens Institute of Technology), 5.00%, 7/1/11 | | $ | 798,262 | | |
| | | | | | | $ | 798,262 | | |
| Electric Utilities - 0.9% | |
| $ | 420 | | | New Jersey Economic Development Authority PCR,
(PSEG Power), 5.00%, 3/1/12 | | $ | 446,023 | | |
| | | | | | | $ | 446,023 | | |
| Escrowed / Prerefunded - 6.8% | |
| $ | 350 | | | New Jersey EDA, (Kapkowski Road Landfill),
Prerefunded to 5/15/14, 6.375%, 4/1/18 | | $ | 413,192 | | |
| | 2,030 | | | New Jersey EDA, (Principal Custodial Receipts),
Escrowed to Maturity, 0.00%, 12/15/12 | | | 1,541,014 | | |
| | 300 | | | New Jersey EDA, (The Seeing Eye, Inc.),
Prerefunded to 12/1/09, 6.20%, 12/1/24 | | | 337,320 | | |
| | 600 | | | New Jersey Educational Facility Authority,
(Higher Education Capital Improvements),
Prerefunded to 9/1/10, 5.00%, 9/1/15 | | | 647,028 | | |
| | 500 | | | New Jersey, Prerefunded to 2/1/09, 4.50%, 2/1/18 | | | 521,555 | | |
| | | | | | | $ | 3,460,109 | | |
| General Obligations - 5.1% | |
| $ | 500 | | | Jersey City School District, 6.25%, 10/1/10 | | $ | 562,845 | | |
| | 1,050 | | | Puerto Rico, 0.00%, 7/1/08 | | | 961,096 | | |
| | 1,000 | | | Union County, (General Improvements), 5.00%, 3/1/17 | | | 1,069,700 | | |
| | | | | | | $ | 2,593,641 | | |
| Hospital - 7.5% | |
| $ | 1,000 | | | Camden County, Improvement Authority, (Cooper Health),
5.75%, 2/15/34 | | $ | 1,053,460 | | |
| | 500 | | | New Jersey Health Care Facilities Financing Authority,
(Atlantic City Medical Care Center), 6.00%, 7/1/12 | | | 559,730 | | |
| | 450 | | | New Jersey Health Care Facilities Financing Authority,
(Hackensack University Medical Center), 6.125%, 1/1/20 | | | 486,513 | | |
| | 500 | | | New Jersey Health Care Facilities Financing Authority,
(Robert Wood Johnson University Hospital), 5.60%, 7/1/15 | | | 534,395 | | |
| | 425 | | | New Jersey Health Care Facilities Financing Authority,
(Saint Peters University Hospital), 6.875%, 7/1/20 | | | 471,746 | | |
| | 680 | | | New Jersey Health Care Facilities Financing Authority,
(St. Elizabeth's Hospital), 5.75%, 7/1/08 | | | 704,840 | | |
| | | | | | | $ | 3,810,684 | | |
Principal Amount
(000's omitted)
Security | | | | Value | |
| Industrial Development Revenue - 4.2% | |
| $ | 350 | | | New Jersey EDA, (American Airlines), (AMT),
7.10%, 11/1/31 | | $ | 270,312 | | |
| | 450 | | | New Jersey EDA, (Continental Airlines), (AMT),
6.25%, 9/15/19 | | | 383,805 | | |
| | 500 | | | New Jersey EDA, (Holt Hauling), (AMT), 7.90%, 3/1/27(1) | | | 480,625 | | |
| | 1,000 | | | New Jersey EDA, (Waste Management, Inc.), (AMT),
4.50%, 6/1/15 | | | 993,750 | | |
| | | | | $ | 2,128,492 | | |
| Insured-Education - 2.9% | |
| $ | 900 | | | New Jersey Educational Facilities Authority,
(Ramapo College), (AMBAC), 4.60%, 7/1/14 | | $ | 938,970 | | |
| | 500 | | | University of New Jersey Medicine and Dentistry,
(AMBAC), 5.375%, 12/1/13 | | | 552,655 | | |
| | | | | $ | 1,491,625 | | |
| Insured-Electric Utilities - 3.7% | |
| $ | 560 | | | Cape May County Industrial Pollution Control Financing
Authority, (Atlantic City Electric Co,), (MBIA),
6.80%, 3/1/21 | | $ | 724,982 | | |
| | 1,000 | | | Puerto Rico Electric Power Authority, (XLCA),
5.375%, 7/1/18(2) | | | 1,133,570 | | |
| | | | | $ | 1,858,552 | | |
| Insured-Escrowed / Prerefunded - 4.8% | |
| $ | 1,000 | | | New Jersey Economic Development Authority,
(School Facility), (AMBAC), Prerefunded to 6/15/11,
5.25%, 6/15/16 | | $ | 1,097,320 | | |
| | 1,300 | | | Washington Township Board of Education, (MBIA),
Prerefunded to 2/01/07, 5.125%, 2/1/15 | | | 1,336,985 | | |
| | | | | $ | 2,434,305 | | |
| Insured-General Obligations - 14.1% | |
| $ | 330 | | | Clearview Regional High School District, (FGIC),
5.375%, 8/1/15 | | $ | 367,947 | | |
| | 320 | | | Egg Harbor Township School District, (FSA),
5.50%, 7/15/19 | | | 368,093 | | |
| | 750 | | | Freehold Regional High School District, (FGIC),
5.00%, 3/1/18 | | | 830,970 | | |
| | 720 | | | Hillsborough Township School District, (FSA),
5.375%, 10/1/18 | | | 827,906 | | |
| | 750 | | | Hunterdon Central Regional High School District, (FSA),
4.75%, 5/1/12 | | | 807,210 | | |
| | 500 | | | Manalapan-Englishtown Regional Board of Education, (FGIC),
5.50%, 12/1/16 | | | 572,095 | | |
See notes to financial statements
29
Eaton Vance New Jersey Limited Maturity Municipals Fund as of September 30, 2005
PORTFOLIO OF INVESTMENTS (Unaudited) CONT'D
Principal Amount
(000's omitted)
Security | | | | Value | |
| Insured-General Obligations (continued) | | | |
| $ | 725 | | | Monroe Township Board of Education, (FGIC),
5.20%, 8/1/11 | | $ | 795,129 | | |
| | 825 | | | Monroe Township Board of Education, (FGIC),
5.20%, 8/1/14 | | | 913,704 | | |
| | 1,000 | | | Puerto Rico Public Improvements, (CIFG), 5.25%, 7/1/17 | | | 1,114,740 | | |
| | 500 | | | Puerto Rico Public Improvements, (XLCA), 5.25%, 7/1/17 | | | 558,865 | | |
| | | | | $ | 7,156,659 | | |
| Insured-Hospital - 2.9% | | | |
| $ | 1,300 | | | New Jersey Health Care Facilities Financing Authority,
(AHS Hospital Corp.), (AMBAC), 6.00%, 7/1/12(3) | | $ | 1,485,055 | | |
| | | | | $ | 1,485,055 | | |
| Insured-Housing - 2.0% | | | |
| $ | 1,000 | | | New Jersey Housing and Mortgage Finance Agency,
(FGIC), 4.50%, 11/1/19 | | $ | 1,009,900 | | |
| | | | | $ | 1,009,900 | | |
Insured-Lease Revenue / Certificates of
Participation - 3.9% | | | |
| $ | 1,000 | | | Hudson County, (MBIA), 6.25%, 6/1/15 | | $ | 1,175,210 | | |
| | 710 | | | Puerto Rico Public Finance Corp., (AMBAC),
5.375%, 6/1/17 | | | 809,180 | | |
| | | | | $ | 1,984,390 | | |
| Insured-Nursing Home - 0.9% | | | |
| $ | 400 | | | Rahway Geriatrics Center Inc., (MBIA), 5.25%, 5/1/15 | | $ | 441,552 | | |
| | | | | $ | 441,552 | | |
| Insured-Other Revenue - 2.1% | | | |
| $ | 500 | | | Monmouth County Improvements Authority,
(AMBAC), 5.00%, 12/1/11 | | $ | 542,425 | | |
| | 500 | | | Trenton Parking Authority, (FGIC), 5.125%, 4/1/12 | | | 539,830 | | |
| | | | | $ | 1,082,255 | | |
| Insured-Special Tax Revenue - 4.4% | | | |
| $ | 1,000 | | | New Jersey EDA, (Motor Vehicle Surcharges),
(MBIA), 5.25%, 7/1/16 | | $ | 1,099,230 | | |
| | 1,000 | | | Puerto Rico Infrastructure Financing Authority,
(FGIC), 5.50%, 7/1/19 | | | 1,154,550 | | |
| | | | | $ | 2,253,780 | | |
Principal Amount
(000's omitted)
Security | | | | Value | |
| Insured-Transportation - 9.7% | |
| $ | 1,000 | | | Delaware River Port Authority, (AMBAC), 5.00%, 1/1/16 | | $ | 1,095,270 | | |
| | 1,000 | | | Delaware River Port Authority, (FSA), 5.10%, 1/1/20 | | | 1,066,070 | | |
| | 500 | | | Delaware River Port Authority, (FSA), 5.50%, 1/1/10 | | | 543,805 | | |
| | 1,000 | | | New Jersey Transportation Trust Fund Authority, (MBIA),
5.50%, 12/15/17 | | | 1,137,990 | | |
| | 750 | | | New Jersey Transportation Trust Fund Authority,
(Transportation System), (AMBAC), 5.50%, 12/15/13 | | | 841,275 | | |
| | 250 | | | South Jersey Transportation Authority, (AMBAC),
5.00%, 11/1/18 | | | 266,768 | | |
| | | | | $ | 4,951,178 | | |
| Insured-Water and Sewer - 7.5% | |
| $ | 1,135 | | | Bayonne Municipal Utilities Authority, (XLCA),
5.25%, 4/1/19 | | $ | 1,224,268 | | |
| | 420 | | | Musconetcong Sewer Authority, (MBIA), 5.25%, 1/1/13 | | | 462,601 | | |
| | 1,000 | | | North Hudson Sewer Authority, (FGIC), 5.25%, 8/1/16 | | | 1,092,500 | | |
| | 565 | | | Pennsville Sewer Authority, (MBIA), 0.00%, 11/1/16 | | | 360,871 | | |
| | 565 | | | Pennsville Sewer Authority, (MBIA), 0.00%, 11/1/17 | | | 342,492 | | |
| | 565 | | | Pennsville Sewer Authority, (MBIA), 0.00%, 11/1/18 | | | 325,242 | | |
| | | | | $ | 3,807,974 | | |
| Lease Revenue / Certificates of Participation - 6.5% | |
| $ | 1,000 | | | Bergen County, Improvement Authority,
(County Administration Complex), 5.00%, 11/15/21 | | $ | 1,101,020 | | |
| | 1,000 | | | New Jersey EDA, (School Facilities Construction),
5.00%, 3/1/19(4) | | | 1,059,280 | | |
| | 1,000 | | | New Jersey EDA, (School Facilities Construction),
5.50%, 9/1/19 | | | 1,135,370 | | |
| | | | | $ | 3,295,670 | | |
| Nursing Home - 1.0% | |
| $ | 500 | | | New Jersey EDA, (Masonic Charity Foundation),
4.80%, 6/1/11 | | $ | 524,480 | | |
| | | | | $ | 524,480 | | |
| Senior Living / Life Care - 1.2% | |
| $ | 300 | | | New Jersey EDA, (Fellowship Village), 5.50%, 1/1/18 | | $ | 304,338 | | |
| | 300 | | | New Jersey EDA, (Fellowship Village), 5.50%, 1/1/25 | | | 302,061 | | |
| | | | | $ | 606,399 | | |
| Solid Waste - 0.3% | |
| $ | 170 | | | Atlantic County Utilities Authority, Solid Waste System,
7.00%, 3/1/08 | | $ | 171,751 | | |
| | | | | $ | 171,751 | | |
See notes to financial statements
30
Eaton Vance New Jersey Limited Maturity Municipals Fund as of September 30, 2005
PORTFOLIO OF INVESTMENTS (Unaudited) CONT'D
Principal Amount
(000's omitted)
Security | | | | Value | |
| Special Tax Revenue - 2.2% | | | |
| $ | 1,000 | | | New Jersey EDA, (Cigarette Tax), 5.50%, 6/15/16 | | $ | 1,092,610 | | |
| | | | | $ | 1,092,610 | | |
| Transportation - 3.6% | | | |
| $ | 1,000 | | | New Jersey Transportation Trust Fund Authority,
Variable Rate, 7.00%, 6/15/17(5)(6) | | $ | 1,104,740 | | |
| | 700 | | | Port Authority of New York and New Jersey, (AMT),
5.50%, 7/15/12 | | | 737,723 | | |
| | | | | $ | 1,842,463 | | |
Total Tax-Exempt Investments - 99.8%
(identified cost $48,380,406) | | | | $ | 50,727,809 | | |
| Other Assets, Less Liabilities - 0.2% | | | | $ | 76,600 | | |
| Net Assets - 100.0% | | | | $ | 50,804,409 | | |
AMBAC - AMBAC Financial Group, Inc.
AMT - Interest earned from these securities may be considered a tax preference item for purposes of the Federal Alternative Minimum Tax.
CIFG - CDC IXIS Financial Guaranty North America, Inc.
FGIC - Financial Guaranty Insurance Company
FSA - Financial Security Assurance, Inc.
MBIA - Municipal Bond Insurance Association
XLCA - XL Capital Assurance, Inc.
The Fund invests primarily in debt securities issued by New Jersey municipalities. The ability of the issuers of the debt securities to meet their obligations may be affected by economic developments in a specific industry or municipality. In order to reduce the risk associated with such economic developments, at September 30, 2005, 59.1% of the securities in the portfolio of investments are backed by bond insurance of various financial institutions and financial guaranty assurance agencies. The aggregate percentage insured by an individual financial institution ranged from 2.2% to 15.0% of total investments.
(1) Defaulted bond.
(2) Security (or a portion thereof) has been segregated to cover when-issued securities.
(3) Security (or a portion thereof) has been segregated to cover margin requirements on open financial futures contracts.
(4) When-issued security.
(5) Security exempt from registration under Rule 144A of the Securities Act of 1933. These securities may be sold in transactions exempt from registration, normally to qualified institutional buyers. At September 30, 2005, the aggregate value of the securities is $1,104,740 or 2.2% of the Fund's net assets.
(6) Security has been issued as an inverse floater bond. The stated interest rate represents the rate in effect at September 30, 2005.
See notes to financial statements
31
Eaton Vance New York Limited Maturity Municipals Fund as of September 30, 2005
PORTFOLIO OF INVESTMENTS (Unaudited)
Tax-Exempt Investments - 99.8% | |
Principal Amount
(000's omitted) | |
Security | |
Value | |
| Cogeneration - 0.5% | |
| $ | 600 | | | Suffolk County IDA, (Nissequogue Cogeneration Partners
Facility), (AMT), 5.50%, 1/1/23 | | $ | 603,720 | | |
| | | | | | | $ | 603,720 | | |
| Education - 2.3% | |
| $ | 1,000 | | | New York Dormitory Authority, (Columbia University),
5.125%, 7/1/15 | | $ | 1,091,700 | | |
| | 600 | | | New York Dormitory Authority, (State University
Educational Facilities), 5.25%, 5/15/15 | | | 660,912 | | |
| | 105 | | | New York Dormitory Authority, (State University
Educational Facilities), 5.25%, 5/15/19 | | | 116,092 | | |
| | 625 | | | Troy IDA, (Rensselaer Polytechnic Institute),
5.50%, 9/1/15 | | | 694,919 | | |
| | | | | | | $ | 2,563,623 | | |
| Electric Utilities - 2.2% | |
| $ | 2,500 | | | New York Energy Research and Development Authority
Facility, (AMT), 4.70%, 6/1/36 | | $ | 2,501,250 | | |
| | | | | | | $ | 2,501,250 | | |
| Escrowed / Prerefunded - 7.4% | |
| $ | 1,000 | | | Metropolitan Transportation Authority, Prerefunded to
7/1/15, 5.50%, 7/1/17 | | $ | 1,141,340 | | |
| | 745 | | | New York Environmental Facility Corp., Pollution Control,
(New York City Municipal Water), Escrowed to Maturity,
5.75%, 6/15/10 | | | 827,628 | | |
| | 1,000 | | | New York State Urban Development Corp.,
(Youth Facilities), Prerefunded to 4/1/07,
5.75%, 4/1/10 | | | 1,060,380 | | |
| | 1,000 | | | New York Urban Development Corp., (Personal Income Tax),
Prerefunded to 3/15/12, 5.375%, 3/15/17 | | | 1,111,130 | | |
| | 1,170 | | | Triborough Bridge and Tunnel Authority, Escrowed to
Maturity, 5.00%, 1/1/20 | | | 1,289,129 | | |
| | 1,000 | | | Triborough Bridge and Tunnel Authority, Prerefunded to
1/1/16, 5.375%, 1/1/19 | | | 1,126,760 | | |
| | 500 | | | Triborough Bridge and Tunnel Authority, Prerefunded to
1/1/22, 5.25%, 1/1/28 | | | 568,020 | | |
| | 1,000 | | | Triborough Bridge and Tunnel Authority, Prerefunded to
7/1/09, 5.25%, 1/1/17 | | | 1,080,210 | | |
| | | | | | | $ | 8,204,597 | | |
Principal Amount
(000's omitted) | |
Security | |
Value | |
| General Obligations - 3.6% | |
| $ | 1,000 | | | New York City, 0.00%, 8/1/08 | | $ | 911,730 | | |
| | 1,000 | | | New York City, 0.00%, 8/1/08 | | | 911,730 | | |
| | 1,000 | | | New York City, 5.00%, 3/1/19 | | | 1,054,900 | | |
| | 1,000 | | | Orange County, 5.00%, 7/15/18 | | | 1,098,780 | | |
| | | | | | | $ | 3,977,140 | | |
| Health Care-Miscellaneous - 0.6% | |
| $ | 245 | | | Suffolk County IDA, (Alliance of Long Island Agencies),
7.50%, 9/1/15 | | $ | 266,420 | | |
| | 400 | | | Westchester County IDA, (Children's Village),
5.375%, 3/15/19 | | | 405,552 | | |
| | | | | | | $ | 671,972 | | |
| Hospital - 4.9% | |
| $ | 455 | | | Chautauqua County IDA, (Womans Christian Association),
6.35%, 11/15/17 | | $ | 479,338 | | |
| | 580 | | | Fulton County IDA, (Nathan Littauer Hospital),
5.75%, 11/1/09 | | | 579,901 | | |
| | 1,000 | | | Monroe County IDA, (Highland Hospital),
5.00%, 8/1/15 | | | 1,053,390 | | |
| | 225 | | | Nassau County Industrial Development Agency,
(North Shore Health System), 5.875%, 11/1/11 | | | 245,045 | | |
| | 1,200 | | | New York Dormitory Authority, (Lenox Hill Hospital),
5.75%, 7/1/15 | | | 1,294,920 | | |
| | 500 | | | New York Dormitory Authority, (Lenox Hill Hospital),
5.75%, 7/1/17 | | | 536,385 | | |
| | 500 | | | Oneida County IDA, (St. Elizabeth Medical Center),
5.50%, 12/1/10 | | | 510,290 | | |
| | 750 | | | Suffolk County Industrial Development Agency,
(Huntington Hospital), 6.00%, 11/1/22 | | | 806,047 | | |
| | | | | | | $ | 5,505,316 | | |
| Housing - 0.5% | |
| $ | 500 | | | New York State Mortgage Agency, (AMT), 5.20%, 10/1/08 | | $ | 512,735 | | |
| | | | | | | $ | 512,735 | | |
| Industrial Development Revenue - 2.2% | |
| $ | 1,000 | | | Dutchess County IDA, (IBM), (AMT), Variable Rate,
5.45%, 12/1/29 | | $ | 1,074,550 | | |
| | 250 | | | Onondaga County, IDA, (Senior Air Cargo), (AMT),
6.125%, 1/1/32 | | | 257,260 | | |
| | 1,500 | | | Puerto Rico Port Authority, (American Airlines), (AMT),
6.25%, 6/1/26 | | | 1,126,980 | | |
| | | | | | | $ | 2,458,790 | | |
See notes to financial statements
32
Eaton Vance New York Limited Maturity Municipals Fund as of September 30, 2005
PORTFOLIO OF INVESTMENTS (Unaudited) CONT'D
Principal Amount
(000's omitted) | |
Security | |
Value | |
| Insured-Education - 10.9% | |
| $ | 1,900 | | | New York Dormitory Authority, (New York University),
(AMBAC), 5.50%, 7/1/16 | | $ | 2,167,501 | | |
| | 1,000 | | | New York Dormitory Authority Revenue, (State University
Educational Facilities), (FSA), 5.75%, 5/15/17 | | | 1,162,890 | | |
| | 1,000 | | | New York Dormitory Authority, (Canisius College), (MBIA),
5.00%, 7/1/16 | | | 1,080,460 | | |
| | 1,420 | | | New York Dormitory Authority, (Educational Housing Services),
(AMBAC), 5.25%, 7/1/20 | | | 1,593,467 | | |
| | 1,455 | | | New York Dormitory Authority, (Mt. Sinai School of Medicine),
(MBIA), 5.25%, 7/1/13 | | | 1,594,927 | | |
| | 1,000 | | | New York Dormitory Authority, (New York University),
(AMBAC), 5.50%, 7/1/19 | | | 1,151,120 | | |
| | 1,000 | | | New York Dormitory Authority, (Student Housing), (FGIC),
5.25%, 7/1/15 | | | 1,105,870 | | |
| | 1,000 | | | New York Dormitory Authority, (University Educational
Facilities), (FGIC), 5.25%, 5/15/13 | | | 1,105,830 | | |
| | 1,000 | | | New York Dormitory, (City University), (AMBAC),
5.625%, 7/1/16 | | | 1,140,250 | | |
| | | | | | | $ | 12,102,315 | | |
| Insured-Electric Utilities - 5.8% | |
| $ | 500 | | | Long Island Power Authority, Electric System Revenue,
(FSA), 0.00%, 6/1/15 | | $ | 339,500 | | |
| | 500 | | | Long Island Power Authority, Electric System Revenue,
(FSA), 5.00%, 12/1/18 | | | 526,830 | | |
| | 3,625 | | | Puerto Rico Electric Power Authority, (MBIA),
5.50%, 7/1/16 | | | 4,159,397 | | |
| | 1,250 | | | Puerto Rico Electric Power Authority, (XLCA),
5.375%, 7/1/18 | | | 1,416,962 | | |
| | | | | | | $ | 6,442,689 | | |
| Insured-Escrowed / Prerefunded - 8.7% | |
| $ | 1,000 | | | Long Island Power Authority, Electric System Revenue,
(FSA), Escrowed to Maturity, 5.25%, 12/1/14 | | $ | 1,120,210 | | |
| | 2,000 | | | Metropolitan Transportation Authority, (FGIC),
Prerefunded to 10/1/15, 5.00%, 4/1/23 | | | 2,206,040 | | |
| | 2,240 | | | Metropolitan Transportation Authority, (FGIC),
Prerefunded to 7/1/08, 5.70%, 7/1/10 | | | 2,397,002 | | |
| | 1,000 | | | Metropolitan Transportation Authority, (FGIC),
Prerefunded to 7/1/09, 5.25%, 7/1/17 | | | 1,076,490 | | |
| | 490 | | | New York Dormitory Authority, (Mental Health
Services Facilities), Prerefunded to 8/15/07, (FSA),
5.125%, 8/15/17 | | | 513,878 | | |
| | 1,225 | | | New York Dormitory Authority, (Mental Health Services),
Prerefunded to 8/15/11, (MBIA), 5.50%, 8/15/13 | | | 1,366,769 | | |
| | 450 | | | New York Thruway Authority Service Contract,
(Local Highway and Bridge), (MBIA), Prerefunded to
4/1/09, 5.40%, 4/1/15 | | | 488,538 | | |
Principal Amount
(000's omitted) | |
Security | |
Value | |
| | Insured-Escrowed / Prerefunded (continued) | | | | |
| $ | 250 | | | New York Urban Development Corp., (Correctional Facilities),
(AMBAC), Prerefunded to 1/01/09, 5.25%, 1/1/15 | | $ | 269,042 | | |
| | 250 | | | Niagara County IDA, (Niagara University), (AMBAC),
Escrowed to Maturity, 5.25%, 10/1/18 | | | 282,938 | | |
| | | | | | | $ | 9,720,907 | | |
| | Insured-General Obligations - 9.7% | | | | |
| $ | 500 | | | Clarence, Central School District, (FSA), 5.00%, 5/15/17 | | $ | 536,280 | | |
| | 1,000 | | | Monroe County, (Public Improvements), (MBIA),
6.00%, 3/1/19 | | | 1,202,040 | | |
| | 1,000 | | | New York City, (MBIA), 5.75%, 8/1/14 | | | 1,111,200 | | |
| | 1,500 | | | New York City, (XLCA), 5.50%, 8/1/12 | | | 1,668,390 | | |
| | 1,915 | | | Puerto Rico, (FGIC), 5.50%, 7/1/17 | | | 2,206,425 | | |
| | 1,965 | | | Puerto Rico, (MBIA), 5.50%, 7/1/16 | | | 2,254,680 | | |
| | 1,645 | | | Red Hook Central School District, (FSA), 5.125%, 6/15/16 | | | 1,785,582 | | |
| | | | | | | $ | 10,764,597 | | |
| | Insured-Health Care Miscellaneous - 0.0% | | | | |
| $ | 5 | | | New York Dormitory Authority, (Mental Health Services
Facilities), (FSA), 5.125%, 8/15/17 | | $ | 5,224 | | |
| | | | | | | $ | 5,224 | | |
| | Insured-Hospital - 2.1% | | | | |
| $ | 1,600 | | | New York Dormitory Authority, (Memorial Sloan Kettering
Cancer Center), (MBIA), 5.50%, 7/1/17 | | $ | 1,812,736 | | |
| | 500 | | | New York Dormitory Authority, (New York and Presbyterian
Hospital), (AMBAC), 5.50%, 8/1/11 | | | 550,130 | | |
| | | | | | | $ | 2,362,866 | | |
| | Insured-Lease Revenue / Certificates of
Participation - 4.8% | | | | |
| $ | 2,470 | | | Metropolitan Transportation Authority, Service Contract,
(FSA), 5.50%, 7/1/17 | | $ | 2,823,284 | | |
| | 1,250 | | | Metropolitan Transportation Authority, Service Contract,
(MBIA), 5.50%, 7/1/14 | | | 1,413,350 | | |
| | 1,000 | | | New York Dormitory Authority, (Municipal Health Facilities),
(FSA), 5.50%, 1/15/13 | | | 1,094,530 | | |
| | | | | | | $ | 5,331,164 | | |
| | Insured-Special Tax Revenue - 4.9% | | | | |
| $ | 2,250 | | | New York Local Government Assistance Corp., (MBIA),
0.00%, 4/1/13 | | $ | 1,692,653 | | |
| | 2,000 | | | New York Urban Development Corp., (Personal Income Tax),
(AMBAC), 5.50%, 3/15/19(1) | | | 2,292,960 | | |
See notes to financial statements
33
Eaton Vance New York Limited Maturity Municipals Fund as of September 30, 2005
PORTFOLIO OF INVESTMENTS (Unaudited) CONT'D
Principal Amount
(000's omitted) | |
Security | |
Value | |
| | Insured-Special Tax Revenue (continued) | | | | |
| $ | 1,250 | | | Puerto Rico Infrastructure Financing Authority, (FGIC),
5.50%, 7/1/19 | | $ | 1,443,188 | | |
| | | | | | | $ | 5,428,801 | | |
| | Insured-Transportation - 8.1% | | | | |
| $ | 1,000 | | | Metropolitan Transportation Authority, (MBIA),
5.50%, 11/15/13 | | $ | 1,127,000 | | |
| | 500 | | | Monroe County Airport Authority, (MBIA), (AMT),
Variable Rate, 8.619%, 1/1/17(2)(3) | | | 637,790 | | |
| | 1,000 | | | Puerto Rico Commonwealth Highway and Transportation
Authority, (FSA), 5.50%, 7/1/17 | | | 1,152,180 | | |
| | 1,585 | | | Puerto Rico Highway and Transportation (Finance Authority),
(FSA), 5.50%, 7/1/12 | | | 1,779,654 | | |
| | 1,850 | | | Puerto Rico Highway and Transportation Authority, (MBIA),
5.50%, 7/1/15 | | | 2,113,107 | | |
| | 1,920 | | | Triborough Bridge and Tunnel Authority, (MBIA),
5.50%, 11/15/18 | | | 2,210,707 | | |
| | | | | | | $ | 9,020,438 | | |
| | Lease Revenue / Certificates of Participation - 3.8% | | | | |
| $ | 1,000 | | | New York Dormitory Authority, (Child Care Facility),
5.375%, 4/1/14 | | $ | 1,082,510 | | |
| | 2,000 | | | New York State Energy Research and Development
Authority, (Western NY Nuclear Service Center),
6.00%, 4/1/06 | | | 2,031,580 | | |
| | 1,000 | | | New York Urban Development Corp., (Correctional and
Youth Facilities), 5.50%, 1/1/17 | | | 1,086,400 | | |
| | | | | | | $ | 4,200,490 | | |
| | Other Revenue - 0.7% | | | | |
| $ | 750 | | | Albany Industrial Development Agency,
(Charitable Leadership), 6.00%, 7/1/19 | | $ | 805,643 | | |
| | | | | | | $ | 805,643 | | |
| | Senior Living / Life Care - 1.1% | | | | |
| $ | 330 | | | Glen Cove IDA, (Regency at Glen Cove),
9.50%, 7/1/12(4) | | $ | 284,830 | | |
| | 400 | | | Mt. Vernon IDA, (Wartburg Senior Housing, Inc.),
6.15%, 6/1/19 | | | 412,088 | | |
| | 500 | | | Suffolk County IDA, (Jeffersons Ferry), 7.20%, 11/1/19 | | | 543,405 | | |
| | | | | | | $ | 1,240,323 | | |
| | Solid Waste - 2.6% | | | | |
| $ | 750 | | | Hempstead IDA, (American Refuel), 5.00%, 12/1/10 | | $ | 783,405 | | |
| | 2,000 | | | Niagra County, IDA, (American Ref-Fuel Co. LLC), (AMT),
Variable Rate, 5.55%, 11/15/24 | | | 2,147,000 | | |
| | | | | | | $ | 2,930,405 | | |
Principal Amount
(000's omitted) | |
Security | |
Value | |
| | Special Tax Revenue - 7.3% | | | | |
| $ | 1,140 | | | 34th Street Partnership, Inc., 5.00%, 1/1/17 | | $ | 1,215,149 | | |
| | 1,000 | | | New York City Transitional Finance Authority,
4.75%, 11/15/23 | | | 1,024,970 | | |
| | 945 | | | New York City Transitional Finance Authority, (Future Tax),
5.00%, 5/1/16 | | | 978,973 | | |
| | 1,000 | | | New York City Transitional Finance Authority, (Future Tax),
5.375%, 2/1/13 | | | 1,091,650 | | |
| | 500 | | | New York City Transitional Finance Authority, (Future Tax),
5.375%, 2/15/14 | | | 546,260 | | |
| | 3,000 | | | New York Local Government Assistance Corp.,
5.25%, 4/1/16 | | | 3,317,670 | | |
| | | | | | | $ | 8,174,672 | | |
| | Transportation - 1.6% | | | | |
| $ | 1,685 | | | Triborough Bridge and Tunnel Authority, 5.00%, 1/1/15 | | $ | 1,789,268 | | |
| | | | | | | $ | 1,789,268 | | |
| | Water and Sewer - 3.5% | | | | |
| $ | 2,000 | | | New York City Municipal Water Finance Authority,
5.125%, 6/15/21 | | $ | 2,077,120 | | |
| | 1,000 | | | New York Environmental Facilities Corp., Water Finance
Authority, 5.00%, 6/15/17 | | | 1,079,550 | | |
| | 500 | | | New York Environmental Facility Corp., Clean Water,
(Municipal Water Finance), 5.25%, 6/15/14 | | | 548,535 | | |
| | 120 | | | New York Environmental Facility Corp., Pollution Control,
(New York City Municipal Water), 5.75%, 6/15/10 | | | 132,761 | | |
| | | | | | | $ | 3,837,966 | | |
| | Total Tax-Exempt Investments - 99.8%
(identified cost $107,212,603) | | | | | $ | 111,156,911 | | |
| | Other Assets, Less Liabilities - 0.2% | | | | | $ | 218,772 | | |
| | Net Assets - 100.0% | | | | | $ | 111,375,683 | | |
AMBAC - AMBAC Financial Group, Inc.
AMT - Interest earned from these securities may be considered a tax preference item for purposes of the Federal Alternative Minimum Tax.
FGIC - Financial Guaranty Insurance Company
FSA - Financial Security Assurance, Inc.
MBIA - Municipal Bond Insurance Association
XLCA - XL Capital Assurance, Inc.
See notes to financial statements
34
Eaton Vance New York Limited Maturity Municipals Fund as of September 30, 2005
PORTFOLIO OF INVESTMENTS (Unaudited) CONT'D
The Fund invests primarily in debt securities issued by New York municipalities. The ability of the issuers of the debt securities to meet their obligations may be affected by economic developments in a specific industry or municipality. In order to reduce the risk associated with such economic developments, at September 30, 2005, 55.0% of the securities in the portfolio of investments are backed by bond insurance of various financial institutions and financial guaranty assurance agencies. The aggregate percentage insured by an individual financial institution ranged from 2.8% to 21.8% of total investments.
(1) Security (or a portion thereof) has been segregated to cover margin requirements on open financial futures contracts.
(2) Security exempt from registration under Rule 144A of the Securities Act of 1933. These securities may be sold in transactions exempt from registration, normally to qualified institutional buyers. At September 30, 2005, the aggregate value of the securities is $637,790 or 0.6% of the Fund's net assets.
(3) Security has been issued as an inverse floater bond. The stated interest rate represents the rate in effect at September 30, 2005.
(4) Security is in default and making only partial interest payments.
See notes to financial statements
35
Eaton Vance Ohio Limited Maturity Municipals Fund as of September 30, 2005
PORTFOLIO OF INVESTMENTS (Unaudited)
Tax-Exempt Investments - 98.7% | | | |
Principal Amount
(000's omitted)
Security | | | | Value | |
| Cogeneration - 0.5% | | | |
| $ | 95 | | | Ohio Water Development Authority, Solid Waste Disposal,
(Bay Shore Power), (AMT), 6.625%, 9/1/20 | | $ | 98,619 | | |
| | | | | $ | 98,619 | | |
| Education - 5.6% | | | |
| $ | 500 | | | Ohio Higher Educational Facilities Commission,
(John Carroll University), 5.00%, 11/15/13 | | $ | 541,875 | | |
| | 500 | | | Ohio State University General Receipts, 5.25%, 12/1/17 | | | 547,565 | | |
| | | | | $ | 1,089,440 | | |
| Escrowed / Prerefunded - 1.4% | | | |
| $ | 250 | | | Cuyahoga County, (Rock and Roll Hall of Fame),
Escrowed to Maturity, 5.85%, 12/1/08 | | $ | 270,180 | | |
| | | | | $ | 270,180 | | |
| General Obligations - 4.8% | | | |
| $ | 100 | | | Cuyahoga County, Sewer Improvement District,
5.45%, 12/1/15 | | $ | 109,247 | | |
| | 500 | | | Hamilton School District, 6.15%, 12/1/15 | | | 593,065 | | |
| | 250 | | | Ohio, 0.00%, 8/1/08 | | | 228,582 | | |
| | | | | $ | 930,894 | | |
| Hospital - 8.5% | | | |
| $ | 500 | | | Cuyahoga County, (Cleveland Clinic Health System),
6.00%, 1/1/17 | | $ | 557,940 | | |
| | 500 | | | Erie County Hospital Facility, (Firelands Regional
Medical Center), 5.50%, 8/15/12 | | | 543,665 | | |
| | 250 | | | Parma, Hospital Improvement, (Parma Community
General Hospital Association), 5.25%, 11/1/13 | | | 260,302 | | |
| | 250 | | | Richland County Hospital Facilities, (Medcentral Health
Systems), 6.375%, 11/15/22 | | | 273,518 | | |
| | | | | $ | 1,635,425 | | |
| Housing - 1.6% | | | |
| $ | 300 | | | Ohio Housing Finance Agency Mortgage, (AMT),
4.55%, 9/1/11 | | $ | 309,651 | | |
| | | | | $ | 309,651 | | |
Principal Amount
(000's omitted)
Security | | | | Value | |
| Industrial Development Revenue - 7.1% | | | |
| $ | 500 | | | Dayton, Special Facilities Revenue, (Emery Air Freight),
5.625%, 2/1/18 | | $ | 530,445 | | |
| | 330 | | | Summit County Port Authority, (Twinsburg Township),
5.125%, 5/15/25 | | | 330,254 | | |
| | 500 | | | Toledo Lucas County Port Authority, (Cargill, Inc.),
4.50%, 12/1/15 | | | 512,160 | | |
| | | | | $ | 1,372,859 | | |
| Insured-Education - 4.1% | | | |
| $ | 750 | | | Cleveland-Cuyahoga Port Authority, (AMBAC),
5.00%, 8/1/21 | | $ | 794,798 | | |
| | | | | $ | 794,798 | | |
| Insured-Electric Utility - 2.7% | | | |
| $ | 500 | | | Hamilton Electric, (FSA), 4.30%, 10/15/16 | | $ | 515,305 | | |
| | | | | $ | 515,305 | | |
| Insured-General Obligations - 23.5% | | | |
| $ | 200 | | | Amherst School District, (FGIC), 5.00%, 12/1/11 | | $ | 217,548 | | |
| | 250 | | | Athens City School District, (FSA), 5.45%, 12/1/10 | | | 275,590 | | |
| | 265 | | | Clinton Massie Local School District, (AMBAC),
0.00%, 12/1/11 | | | 212,254 | | |
| | 265 | | | Clinton Massie Local School District, (MBIA),
0.00%, 12/1/09 | | | 230,608 | | |
| | 225 | | | Finneytown Local School District, (FGIC), 6.15%, 12/1/11 | | | 259,839 | | |
| | 1,000 | | | Hilliard School District, (FGIC), 0.00%, 12/1/14 | | | 685,670 | | |
| | 175 | | | Sciota Valley and Ross County School District, (FGIC),
0.00%, 12/1/11 | | | 140,168 | | |
| | 750 | | | Springfield City School District, Clark County, (AMBAC),
4.30%, 12/1/14 | | | 770,805 | | |
| | 600 | | | Springfield City School District, Clark County, (FGIC),
5.00%, 12/1/17 | | | 644,790 | | |
| | 500 | | | Strongsville City School District, (MBIA), 5.375%, 12/1/12(1) | | | 558,295 | | |
| | 460 | | | Wyoming, School District, (FGIC), 5.75%, 12/1/17 | | | 538,632 | | |
| | | | | $ | 4,534,199 | | |
| Insured-Hospital - 2.9% | | | |
| $ | 500 | | | Cuyahoga County, (Metrohealth System), (MBIA),
5.50%, 2/15/12 | | $ | 554,865 | | |
| | | | | $ | 554,865 | | |
| Insured-Industrial Development Revenue - 3.0% | | | |
| $ | 500 | | | Akron Economic Development, (MBIA), 6.00%, 12/1/12 | | $ | 570,390 | | |
| | | | | $ | 570,390 | | |
See notes to financial statements
36
Eaton Vance Ohio Limited Maturity Municipals Fund as of September 30, 2005
PORTFOLIO OF INVESTMENTS (Unaudited) CONT'D
Principal Amount
(000's omitted)
Security | | | | Value | |
Insured-Lease Revenue / Certificates of
Participation - 2.9% | | | |
| $ | 500 | | | Ohio Building Authority, (FSA), 5.50%, 10/1/11 | | $ | 554,290 | | |
| | | | | $ | 554,290 | | |
| Insured-Special Tax Revenue - 3.0% | | | |
| $ | 500 | | | Puerto Rico Infrastructure Financing Authority, (FGIC),
5.50%, 7/1/19 | | $ | 577,275 | | |
| | | | | $ | 577,275 | | |
| Insured-Transportation - 6.1% | | | |
| $ | 300 | | | Cleveland Airport System, (FSA), 5.25%, 1/1/14 | | $ | 322,596 | | |
| | 750 | | | Ohio Turnpike Commission, (FGIC), 5.50%, 2/15/18 | | | 860,910 | | |
| | | | | $ | 1,183,506 | | |
| Insured-Water and Sewer - 6.6% | | | |
| $ | 475 | | | Cleveland Waterworks, (FSA), 5.375%, 1/1/16 | | $ | 519,441 | | |
| | 650 | | | Ohio Water Development Authority, (FSA),
5.50%, 12/1/17 | | | 747,585 | | |
| | | | | $ | 1,267,026 | | |
| Lease Revenue / Certificates of Participation - 5.4% | | | |
| $ | 750 | | | Ohio Parks and Recreational Capital Facilities,
5.50%, 6/1/14 | | $ | 835,478 | | |
| | 200 | | | Union County, (Pleasant Valley Joint Fire District),
6.125%, 12/1/19 | | | 211,690 | | |
| | | | | $ | 1,047,168 | | |
| Pooled Loans - 6.1% | | | |
| $ | 250 | | | Cuyahoga County Port Authority, (Garfield Heights),
5.25%, 5/15/23 | | $ | 251,198 | | |
| | 295 | | | Ohio Economic Development, (Ohio Enterprise Bond Fund),
(AMT), 4.60%, 6/1/20 | | | 303,172 | | |
| | 250 | | | Ohio Economic Development, (Ohio Enterprise Bond Fund),
(AMT), 5.25%, 12/1/15 | | | 260,225 | | |
| | 200 | | | Toledo Lucas County Port Authority, (Northwest Ohio
Bond Fund), (Alex Products), (AMT), 6.125%, 11/15/09 | | | 216,018 | | |
| | 150 | | | Toledo Lucas County Port Authority, (Northwest Ohio
Bond Fund), (Superior), 5.10%, 5/15/12 | | | 153,009 | | |
| | | | | $ | 1,183,622 | | |
Principal Amount
(000's omitted)
Security | | | | Value | |
| Water and Sewer - 2.9% | |
| $ | 500 | | | Ohio Water Development Authority, (Drinking Water),
5.50%, 12/1/14 | | $ | 559,570 | | |
| | | | | $ | 559,570 | | |
Total Tax-Exempt Investments - 98.7%
(identified cost $17,978,100) | | | | $ | 19,049,082 | | |
| Other Assets, Less Liabilities - 1.3% | | | | $ | 243,885 | | |
| Net Assets - 100.0% | | | | $ | 19,292,967 | | |
AMBAC - AMBAC Financial Group, Inc.
AMT - Interest earned from these securities may be considered a tax preference item for purposes of the Federal Alternative Minimum Tax.
FGIC - Financial Guaranty Insurance Company
FSA - Financial Security Assurance, Inc.
MBIA - Municipal Bond Insurance Association
The Fund invests primarily in debt securities issued by Ohio municipalities. The ability of the issuers of the debt securities to meet their obligations may be affected by economic developments in a specific industry or municipality. In order to reduce the risk associated with such economic developments, at September 30, 2005, 55.4% of the securities in the portfolio of investments are backed by bond insurance of various financial institutions and financial guaranty assurance agencies. The aggregate percentage insured by an individual financial institution ranged from 9.3% to 20.6% of total investments.
(1) Security (or a portion thereof) has been segregated to cover margin requirements on open financial futures contracts.
See notes to financial statements
37
Eaton Vance Pennsylvania Limited Maturity Municipals Fund as of September 30, 2005
PORTFOLIO OF INVESTMENTS (Unaudited)
Tax-Exempt Investments - 98.0% | | | |
Principal Amount
(000's omitted)
Security | | | | Value | |
| Cogeneration - 1.1% | | | |
| $ | 295 | | | Carbon County IDA, (Panther Creek Partners), (AMT),
6.65%, 5/1/10 | | $ | 319,267 | | |
| | 350 | | | Pennsylvania EDA, (Resource Recovery-Colver), (AMT),
5.125%, 12/1/15 | | | 352,320 | | |
| | | | | $ | 671,587 | | |
| Electric Utilities - 0.7% | | | |
| $ | 400 | | | York County IDA, Pollution Control, (Public Service
Enterprise Group, Inc.), 5.50%, 9/1/20 | | $ | 422,900 | | |
| | | | | $ | 422,900 | | |
| Escrowed / Prerefunded - 2.1% | | | |
| $ | 1,200 | | | Lehigh County, General Purpose Authority, (Muhlenberg
Hospital), Escrowed to Maturity, 5.75%, 7/15/10 | | $ | 1,269,216 | | |
| | | | | $ | 1,269,216 | | |
| Health Care-Miscellaneous - 0.5% | | | |
| $ | 250 | | | Allegheny County IDA, (Residential Resources, Inc.),
6.50%, 9/1/21 | | $ | 265,515 | | |
| | | | | $ | 265,515 | | |
| Hospital - 4.0% | | | |
| $ | 500 | | | Allegheny County Hospital Development Authority,
(West Pennsylvania Health System), 8.65%, 11/15/05 | | $ | 502,160 | | |
| | 160 | | | Hazleton Health Services Authority, (Hazleton
General Hospital), 5.50%, 7/1/07 | | | 158,046 | | |
| | 145 | | | Hazleton Health Services Authority, (St. Joseph's Hospital),
5.85%, 7/1/06 | | | 144,574 | | |
| | 200 | | | Lebanon County Health Facility Authority, (Good Samaritan
Hospital), 5.50%, 11/15/18 | | | 212,008 | | |
| | 500 | | | Pennsylvania Higher Educational Facilities Authority,
(UPMC Health System), 6.25%, 1/15/18 | | | 557,825 | | |
| | 800 | | | Washington County Hospital Authority, (Monongahela
Vineyard Hospital), 5.00%, 6/1/12 | | | 842,072 | | |
| | | | | $ | 2,416,685 | | |
| Industrial Development Revenue - 3.5% | | | |
| $ | 700 | | | Erie IDA, (International Paper), (AMT), 5.85%, 12/1/20 | | $ | 728,140 | | |
| | 750 | | | Puerto Rico Port Authority, (American Airlines), (AMT),
6.25%, 6/1/26 | | | 563,490 | | |
| | 750 | | | Schuylkill County IDA, (Pine Grove Landfill, Inc.), (AMT),
5.10%, 10/1/19 | | | 773,738 | | |
| | | | | $ | 2,065,368 | | |
Principal Amount
(000's omitted)
Security | | | | Value | |
| Insured-Cogeneration - 1.4% | | | |
| $ | 800 | | | Pennsylvania EDA, (Resource Recovery-Colver), (AMBAC),
(AMT), 4.625%, 12/1/18 | | $ | 816,760 | | |
| | | | | $ | 816,760 | | |
| Insured-Education - 5.0% | | | |
| $ | 1,500 | | | Allegheny County, Higher Education Building Authority,
(Duquesne University), (AMBAC), 5.00%, 3/1/16(1) | | $ | 1,540,410 | | |
| | 1,100 | | | Lycoming County Authority College, (Pennsylvania
College of Technology), (AMBAC), 5.125%, 5/1/22 | | | 1,178,221 | | |
| | 250 | | | University of Pittsburgh, (FGIC), 5.125%, 6/1/22 | | | 261,480 | | |
| | | | | $ | 2,980,111 | | |
| Insured-Electric Utilities - 11.2% | | | |
| $ | 1,500 | | | Cambria County IDA, (Pennsylvania Electric), (MBIA),
5.35%, 11/1/10 | | $ | 1,637,340 | | |
| | 2,000 | | | Puerto Rico Electric Power Authority, (FGIC),
5.00%, 7/1/35 | | | 2,111,260 | | |
| | 1,250 | | | Puerto Rico Electric Power Authority, (MBIA),
5.50%, 7/1/16 | | | 1,434,275 | | |
| | 1,370 | | | Puerto Rico Electric Power Authority, (XLCA),
5.375%, 7/1/18 | | | 1,552,991 | | |
| | | | | $ | 6,735,866 | | |
| Insured-Escrowed / Prerefunded - 12.0% | | | |
| $ | 580 | | | Allegheny County, (FGIC), Prerefunded to 5/1/11,
5.40%, 11/1/19 | | $ | 639,108 | | |
| | 500 | | | Pennsylvania Public School Building Authority,
(Garnet Valley School District), (AMBAC), Prerefunded to
2/1/11, 5.50%, 2/1/20 | | | 551,795 | | |
| | 1,000 | | | Pennsylvania Turnpike Commission, Registration
Fee Revenue, (AMBAC), Prerefunded to 7/15/11,
5.125%, 7/15/22 | | | 1,098,280 | | |
| | 1,000 | | | Philadelphia School District, (FSA), Prerefunded to
2/1/12, 5.50%, 2/1/17 | | | 1,112,000 | | |
| | 1,000 | | | Spring-Ford Area School District, (FSA), Prerefunded to
9/1/11, 5.00%, 9/1/19 | | | 1,084,660 | | |
| | 5,000 | | | Westmoreland County, Municipal Authority, Water Utility,
(FGIC), Escrowed to Maturity, 0.00%, 8/15/19 | | | 2,714,950 | | |
| | | | | $ | 7,200,793 | | |
| Insured-General Obligations - 31.2% | | | |
| $ | 785 | | | Allegheny County, (FGIC), 5.40%, 11/1/19 | | $ | 855,689 | | |
| | 1,540 | | | Centre County, (MBIA), 5.25%, 7/1/18 | | | 1,682,157 | | |
| | 1,020 | | | Cornwall Lebanon School District, (FSA), 0.00%, 3/15/16 | | | 651,678 | | |
| | 1,000 | | | Council Rock School District, (MBIA), 5.00%, 11/15/19 | | | 1,070,510 | | |
| | 1,250 | | | Cranberry Township, (FGIC), 5.00%, 12/1/20 | | | 1,326,800 | | |
See notes to financial statements
38
Eaton Vance Pennsylvania Limited Maturity Municipals Fund as of September 30, 2005
PORTFOLIO OF INVESTMENTS (Unaudited) CONT'D
Principal Amount
(000's omitted)
Security | | | | Value | |
| Insured-General Obligations (continued) | |
| $ | 2,000 | | | Ephrata Area School District, (FGIC), 5.25%, 4/15/19 | | $ | 2,174,880 | | |
| | 1,635 | | | Harrisburg, (AMBAC), 0.00%, 9/15/12 | | | 1,252,492 | | |
| | 1,355 | | | McKeesport, (FGIC), 0.00%, 10/1/11 | | | 1,093,756 | | |
| | 1,000 | | | Palmyra Area School District, (FGIC), 5.00%, 5/1/17 | | | 1,069,550 | | |
| | 2,000 | | | Pennsylvania, (MBIA), 5.375%, 7/1/19 | | | 2,282,900 | | |
| | 2,000 | | | Pittsburgh, (AMBAC), 5.125%, 9/1/18 | | | 2,110,800 | | |
| | 1,000 | | | Pittsburgh, (AMBAC), 5.25%, 9/1/22 | | | 1,057,070 | | |
| | 1,000 | | | Reading School District, (FGIC), 0.00%, 1/15/12 | | | 788,480 | | |
| | 1,250 | | | Sto-Rox School District, (FGIC), 5.125%, 12/15/22 | | | 1,340,763 | | |
| | | | | $ | 18,757,525 | | |
| Insured-Hospital - 1.8% | |
| $ | 500 | | | Allegheny County Hospital Development Authority,
(South Hills Health), (MBIA), 5.50%, 5/1/08 | | $ | 517,035 | | |
| | 500 | | | Washington County Hospital Authority, (Washington
Hospital), (AMBAC), 5.375%, 7/1/14 | | | 554,995 | | |
| | | | | $ | 1,072,030 | | |
Insured-Lease Revenue / Certificates of
Participation - 2.5% | |
| $ | 1,355 | | | Philadelphia IDA, Stadium Lease, (FSA),
5.50%, 10/1/21 | | $ | 1,494,389 | | |
| | | | | $ | 1,494,389 | | |
| Insured-Special Tax Revenue - 0.6% | |
| $ | 350 | | | Pittsburgh and Allegheny County, Public Auditorium Authority,
(AMBAC), 5.00%, 2/1/24 | | $ | 367,899 | | |
| | | | | $ | 367,899 | | |
| Insured-Transportation - 13.1% | |
| $ | 1,000 | | | Allegheny County Airport, (MBIA), (AMT), 5.75%, 1/1/10 | | $ | 1,079,720 | | |
| | 590 | | | Allegheny County Airport, (MBIA), (AMT), 5.75%, 1/1/12 | | | 645,726 | | |
| | 2,000 | | | Pennsylvania Turnpike Commission, Reistration Fee Revenue,
(FSA), 5.25%, 7/15/22 | | | 2,265,320 | | |
| | 1,000 | | | Philadelphia Airport, (FGIC), (AMT), 5.375%, 7/1/14 | | | 1,053,920 | | |
| | 1,000 | | | Puerto Rico Highway and Transportation Authority, (MBIA),
5.50%, 7/1/15 | | | 1,142,220 | | |
| | 1,000 | | | Puerto Rico Highway and Transportation Authority, (MBIA),
5.50%, 7/1/18 | | | 1,156,770 | | |
| | 500 | | | Southeastern Pennsylvania Transportation Authority, (FGIC),
5.25%, 3/1/16 | | | 533,815 | | |
| | | | | $ | 7,877,491 | | |
Principal Amount
(000's omitted)
Security | | | | Value | |
| Insured-Utility - 1.8% | |
| $ | 1,000 | | | Philadelphia Gas Works Revenue, (FSA), 5.25%, 8/1/17 | | $ | 1,083,670 | | |
| | | | | $ | 1,083,670 | | |
| Insured-Water and Sewer - 2.7% | |
| $ | 1,500 | | | Allegheny County, Sanitation Authority, (MBIA),
5.00%, 12/1/19 | | $ | 1,606,050 | | |
| | | | | $ | 1,606,050 | | |
| Senior Living / Life Care - 2.1% | |
| $ | 500 | | | Bucks County IDA, (Pennswood), 5.80%, 10/1/20 | | $ | 529,105 | | |
| | 390 | | | Cliff House Trust, (AMT), 6.625%, 6/1/27 | | | 196,197 | | |
| | 335 | | | Crawford County Hospital Authority, (Wesbury United
Methodist Community), 6.00%, 8/15/11 | | | 352,420 | | |
| | 185 | | | Lancaster County Hospital Authority, (Willow Valley
Retirement), 5.55%, 6/1/15 | | | 196,588 | | |
| | | | | $ | 1,274,310 | | |
| Transportation - 0.7% | |
| $ | 435 | | | Erie Municipal Airport Authority, (AMT), 5.50%, 7/1/09 | | $ | 443,217 | | |
| | | | | $ | 443,217 | | |
Total Tax-Exempt Investments - 98.0%
(identified cost $56,138,787) | | | | $ | 58,821,382 | | |
| Other Assets, Less Liabilities - 2.0% | | | | $ | 1,227,876 | | |
| Net Assets - 100.0% | | | | $ | 60,049,258 | | |
AMBAC - AMBAC Financial Group, Inc.
AMT - Interest earned from these securities may be considered a tax preference item for purposes of the Federal Alternative Minimum Tax.
FGIC - Financial Guaranty Insurance Company
FSA - Financial Security Assurance, Inc.
MBIA - Municipal Bond Insurance Association
XLCA - XL Capital Assurance, Inc.
The Fund invests primarily in debt securities issued by Pennsylvania municipalities. The ability of the issuers of the debt securities to meet their obligations may be affected by economic developments in a specific industry or municipality. In order to reduce the risk associated with such economic developments, at September 30, 2005, 85.0% of the securities in the portfolio of investments are backed by bond insurance of various financial institutions and financial guaranty assurance agencies. The aggregate percentage insured by an individual financial institution ranged from 2.6% to 27.1% of total investments.
(1) Security (or a portion thereof) has been segregated to cover margin requirements on open financial futures contracts.
See notes to financial statements
39
Eaton Vance Limited Maturity Municipals Funds as of September 30, 2005
FINANCIAL STATEMENTS (Unaudited)
Statements of Assets and Liabilities
As of September 30, 2005
| | | California
Limited Fund | | Florida
Limited Fund | | Massachusetts
Limited Fund | | New Jersey
Limited Fund | |
| Assets | | | |
| Investments - | |
| Identified cost | | $ | 34,761,208 | | | $ | 59,576,304 | | | $ | 77,244,960 | | | $ | 48,380,406 | | |
| Unrealized appreciation | | | 1,433,504 | | | | 2,454,761 | | | | 3,222,065 | | | | 2,347,403 | | |
| Investments, at value | | $ | 36,194,712 | | | $ | 62,031,065 | | | $ | 80,467,025 | | | $ | 50,727,809 | | |
| Cash | | $ | 352,785 | | | $ | 68,050 | | | $ | - | | | $ | 155,250 | | |
| Receivable for investments sold | | | 5,000 | | | | 110,481 | | | | - | | | | 658,124 | | |
| Receivable for Fund shares sold | | | 206,973 | | | | - | | | | 3,362 | | | | 45,663 | | |
| Interest receivable | | | 427,030 | | | | 956,090 | | | | 1,001,832 | | | | 670,386 | | |
| Receivable for daily variation margin on open financial futures contracts | | | 31,125 | | | | 51,843 | | | | 38,953 | | | | 45,515 | | |
| Prepaid expenses | | | - | | | | 2,324 | | | | 2,325 | | | | - | | |
| Total assets | | $ | 37,217,625 | | | $ | 63,219,853 | | | $ | 81,513,497 | | | $ | 52,302,747 | | |
| Liabilities | | | |
| Payable for Fund shares redeemed | | $ | 250,897 | | | $ | 119,661 | | | $ | 348,710 | | | $ | 288,813 | | |
| Demand note payable | | | - | | | | - | | | | 300,000 | | | | - | | |
| Dividends payable | | | 52,735 | | | | 87,945 | | | | 107,085 | | | | 72,207 | | |
| Payable for when-issued securities | | | - | | | | 852,784 | | | | - | | | | 1,062,400 | | |
| Due to bank | | | - | | | | - | | | | 85,037 | | | | - | | |
| Payable to affiliate for Trustees' fees | | | 17 | | | | - | | | | - | | | | - | | |
| Payable to affiliate for investment advisory fees | | | 13,069 | | | | 22,779 | | | | 29,156 | | | | 18,506 | | |
| Payable to affiliate for distribution and service fees | | | 16,202 | | | | 34,457 | | | | 46,259 | | | | 24,718 | | |
| Accrued expenses | | | 23,985 | | | | 34,076 | | | | 41,047 | | | | 31,694 | | |
| Total liabilities | | $ | 356,905 | | | $ | 1,151,702 | | | $ | 957,294 | | | $ | 1,498,338 | | |
| Net Assets | | $ | 36,860,720 | | | $ | 62,068,151 | | | $ | 80,556,203 | | | $ | 50,804,409 | | |
| Sources of Net Assets | | | |
| Paid-in capital | | $ | 36,276,162 | | | $ | 61,368,322 | | | $ | 80,445,576 | | | $ | 50,224,374 | | |
| Accumulated net realized loss (computed on the basis of identified cost) | | | (1,084,129 | ) | | | (2,012,044 | ) | | | (3,309,521 | ) | | | (2,009,294 | ) | |
| Accumulated undistributed (distributions in excess of) net investment income | | | (8,277 | ) | | | (6,990 | ) | | | (1,735 | ) | | | 5,872 | | |
| Net unrealized appreciation (computed on the basis of identified cost) | | | 1,676,964 | | | | 2,718,863 | | | | 3,421,883 | | | | 2,583,457 | | |
| Total | | $ | 36,860,720 | | | $ | 62,068,151 | | | $ | 80,556,203 | | | $ | 50,804,409 | | |
| Class A Shares | | | |
| Net Assets | | $ | 33,560,834 | | | $ | 39,756,991 | | | $ | 46,244,506 | | | $ | 42,605,973 | | |
| Shares Outstanding | | | 3,251,687 | | | | 3,866,897 | | | | 4,530,937 | | | | 4,207,087 | | |
Net Asset Value and Redemption Price Per Share
(net assets ÷ shares of beneficial interest outstanding) | | $ | 10.32 | | | $ | 10.28 | | | $ | 10.21 | | | $ | 10.13 | | |
Maximum Offering Price Per Share
(100 ÷ 97.75 of net asset value per share) | | $ | 10.56 | | | $ | 10.52 | | | $ | 10.45 | | | $ | 10.36 | | |
| Class B Shares | | | |
| Net Assets | | $ | 3,257,713 | | | $ | 7,268,565 | | | $ | 9,443,892 | | | $ | 8,198,436 | | |
| Shares Outstanding | | | 316,634 | | | | 706,912 | | | | 926,102 | | | | 809,745 | | |
Net Asset Value, Offering Price and Redemption Price Per Share
(net assets ÷ shares of beneficial interest outstanding) | | $ | 10.29 | | | $ | 10.28 | | | $ | 10.20 | | | $ | 10.12 | | |
| Class C Shares | | | |
| Net Assets | | $ | 42,173 | | | $ | 15,042,595 | | | $ | 24,867,805 | | | $ | - | | |
| Shares Outstanding | | | 4,229 | | | | 1,549,785 | | | | 2,544,349 | | | | - | | |
Net Asset Value, Offering Price and Redemption Price Per Share
(net assets ÷ shares of beneficial interest outstanding) | | $ | 9.97 | | | $ | 9.71 | | | $ | 9.77 | | | $ | - | | |
On sales of $100,000 or more, the offering price of Class A shares is reduced.
See notes to financial statements
40
Eaton Vance Limited Maturity Municipals Funds as of September 30, 2005
FINANCIAL STATEMENTS (Unaudited) CONT'D
Statements of Assets and Liabilities
As of September 30, 2005
| | | New York
Limited Fund | | Ohio
Limited Fund | | Pennsylvania
Limited Fund | |
| Assets | | | |
| Investments - | |
| Identified cost | | $ | 107,212,603 | | | $ | 17,978,100 | | | $ | 56,138,787 | | |
| Unrealized appreciation | | | 3,944,308 | | | | 1,070,982 | | | | 2,682,595 | | |
| Investments, at value | | $ | 111,156,911 | | | $ | 19,049,082 | | | $ | 58,821,382 | | |
| Cash | | $ | 1,406,702 | | | $ | 96,794 | | | $ | 281,653 | | |
| Receivable for Fund shares sold | | | 95,388 | | | | 11,789 | | | | 455,681 | | |
| Interest receivable | | | 1,533,095 | | | | 242,651 | | | | 739,927 | | |
| Receivable for daily variation margin on open financial futures contracts | | | 63,093 | | | | 8,016 | | | | 46,500 | | |
| Prepaid expenses | | | 1,728 | | | | - | | | | - | | |
| Total assets | | $ | 114,256,917 | | | $ | 19,408,332 | | | $ | 60,345,143 | | |
| Liabilities | | | |
| Payable for investments purchased | | $ | 2,190,018 | | | $ | - | | | $ | - | | |
| Payable for Fund shares redeemed | | | 386,248 | | | | 50,000 | | | | 121,338 | | |
| Dividends payable | | | 154,989 | | | | 29,331 | | | | 87,510 | | |
| Payable to affiliate for investment advisory fees | | | 39,737 | | | | 6,908 | | | | 21,460 | | |
| Payable to affiliate for distribution and service fees | | | 60,868 | | | | 8,448 | | | | 33,101 | | |
| Accrued expenses | | | 49,374 | | | | 20,678 | | | | 32,476 | | |
| Total liabilities | | $ | 2,881,234 | | | $ | 115,365 | | | $ | 295,885 | | |
| Net Assets | | $ | 111,375,683 | | | $ | 19,292,967 | | | $ | 60,049,258 | | |
| Sources of Net Assets | | | |
| Paid-in capital | | $ | 110,311,297 | | | $ | 19,226,504 | | | $ | 59,571,264 | | |
| Accumulated net realized loss (computed on the basis of identified cost) | | | (3,058,243 | ) | | | (1,046,657 | ) | | | (2,428,550 | ) | |
| Accumulated undistributed (distributions in excess of) net investment income | | | (96,601 | ) | | | 9,081 | | | | (27,596 | ) | |
| Net unrealized appreciation (computed on the basis of identified cost) | | | 4,219,230 | | | | 1,104,039 | | | | 2,934,140 | | |
| Total | | $ | 111,375,683 | | | $ | 19,292,967 | | | $ | 60,049,258 | | |
| Class A Shares | | | |
| Net Assets | | $ | 67,974,859 | | | $ | 17,371,664 | | | $ | 35,506,274 | | |
| Shares Outstanding | | | 6,434,439 | | | | 1,782,530 | | | | 3,441,160 | | |
Net Asset Value and Redemption Price Per Share
(net assets ÷ shares of beneficial interest outstanding) | | $ | 10.56 | | | $ | 9.75 | | | $ | 10.32 | | |
Maximum Offering Price Per Share
(100 ÷ 97.75 of net asset value per share) | | $ | 10.80 | | | $ | 9.97 | | | $ | 10.56 | | |
| Class B Shares | | | |
| Net Assets | | $ | 11,597,786 | | | $ | 1,921,303 | | | $ | 7,722,853 | | |
| Shares Outstanding | | | 1,098,681 | | | | 197,453 | | | | 748,426 | | |
Net Asset Value, Offering Price and Redemption Price Per Share
(net assets ÷ shares of beneficial interest outstanding) | | $ | 10.56 | | | $ | 9.73 | | | $ | 10.32 | | |
| Class C Shares | | | |
| Net Assets | | $ | 31,803,038 | | | $ | - | | | $ | 16,820,131 | | |
| Shares Outstanding | | | 3,166,928 | | | | - | | | | 1,719,336 | | |
Net Asset Value, Offering Price and Redemption Price Per Share
(net assets ÷ shares of beneficial interest outstanding) | | $ | 10.04 | | | $ | - | | | $ | 9.78 | | |
On sales of $100,000 or more, the offering price of Class A shares is reduced.
See notes to financial statements
41
Eaton Vance Limited Maturity Municipals Funds as of September 30, 2005
FINANCIAL STATEMENTS (Unaudited) CONT'D
Statements of Operations
For the Six Months Ended September 30, 2005
| | | California
Limited Fund | | Florida
Limited Fund | | Massachusetts
Limited Fund | | New Jersey
Limited Fund | |
| Investment Income | | | |
| Interest | | $ | 809,285 | | | $ | 1,516,745 | | | $ | 1,833,511 | | | $ | 1,165,048 | | |
| Total investment income | | $ | 809,285 | | | $ | 1,516,745 | | | $ | 1,833,511 | | | $ | 1,165,048 | | |
| Expenses | | | |
| Investment adviser fee | | $ | 78,841 | | | $ | 145,719 | | | $ | 181,337 | | | $ | 113,033 | | |
| Trustees fees and expenses | | | 944 | | | | 3,664 | | | | 3,631 | | | | 3,699 | | |
| Distribution and service fees | |
| Class A | | | 24,770 | | | | 32,291 | | | | 35,431 | | | | 32,820 | | |
| Class B | | | 15,896 | | | | 34,757 | | | | 45,319 | | | | 39,041 | | |
| Class C | | | 130 | | | | 73,920 | | | | 122,704 | | | | - | | |
| Legal and accounting services | | | 13,600 | | | | 14,906 | | | | 16,088 | | | | 15,520 | | |
| Printing and postage | | | 4,599 | | | | 8,585 | | | | 9,868 | | | | 8,206 | | |
| Custodian fee | | | 18,808 | | | | 27,494 | | | | 34,174 | | | | 22,308 | | |
| Transfer and dividend disbursing agent | | | 6,588 | | | | 14,910 | | | | 21,065 | | | | 15,040 | | |
| Registration fees | | | 2,013 | | | | 3,005 | | | | 4,934 | | | | 1,098 | | |
| Miscellaneous | | | 10,213 | | | | 13,360 | | | | 13,342 | | | | 11,175 | | |
| Total expenses | | $ | 176,402 | | | $ | 372,611 | | | $ | 487,893 | | | $ | 261,940 | | |
| Deduct - | |
| Reduction of custodian fee | | $ | 3,568 | | | $ | 2,059 | | | $ | 6,449 | | | $ | 2,906 | | |
| Total expense reductions | | $ | 3,568 | | | $ | 2,059 | | | $ | 6,449 | | | $ | 2,906 | | |
| Net expenses | | $ | 172,834 | | | $ | 370,552 | | | $ | 481,444 | | | $ | 259,034 | | |
| Net investment income | | $ | 636,451 | | | $ | 1,146,193 | | | $ | 1,352,067 | | | $ | 906,014 | | |
| Realized and Unrealized Gain (Loss) | | | |
| Net realized gain (loss) - | |
| Investment transactions (identified cost basis) | | $ | 36,070 | | | $ | 228,244 | | | $ | (76,438 | ) | | $ | 155,075 | | |
| Financial futures contracts | | | (394,109 | ) | | | (420,035 | ) | | | (545,321 | ) | | | (376,487 | ) | |
| Net realized loss | | $ | (358,039 | ) | | $ | (191,791 | ) | | $ | (621,759 | ) | | $ | (221,412 | ) | |
| Change in unrealized appreciation (depreciation) - | |
| Investments (identified cost basis) | | $ | 351,212 | | | $ | 566,796 | | | $ | 828,301 | | | $ | 327,973 | | |
| Financial futures contracts | | | 101,157 | | | | 37,742 | | | | 99,418 | | | | 36,125 | | |
| Net change in unrealized appreciation (depreciation) | | $ | 452,369 | | | $ | 604,538 | | | $ | 927,719 | | | $ | 364,098 | | |
| Net realized and unrealized gain | | $ | 94,330 | | | $ | 412,747 | | | $ | 305,960 | | | $ | 142,686 | | |
| Net increase in net assets from operations | | $ | 730,781 | | | $ | 1,558,940 | | | $ | 1,658,027 | | | $ | 1,048,700 | | |
See notes to financial statements
42
Eaton Vance Limited Maturity Municipals Funds as of September 30, 2005
FINANCIAL STATEMENTS (Unaudited) CONT'D
Statements of Operations
For the Six Months Ended September 30, 2005
| | | New York
Limited Fund | | Ohio
Limited Fund | | Pennsylvania
Limited Fund | |
| Investment Income | |
| Interest | | $ | 2,490,506 | | | $ | 433,338 | | | $ | 1,375,112 | | |
| Total investment income | | $ | 2,490,506 | | | $ | 433,338 | | | $ | 1,375,112 | | |
| Expenses | |
| Investment adviser fee | | $ | 243,692 | | | $ | 41,660 | | | $ | 129,191 | | |
| Trustees fees and expenses | | | 4,742 | | | | 90 | | | | 2,834 | | |
| Distribution and service fees | |
| Class A | | | 49,487 | | | | 12,874 | | | | 25,369 | | |
| Class B | | | 55,588 | | | | 9,150 | | | | 37,392 | | |
| Class C | | | 155,782 | | | | - | | | | 75,637 | | |
| Legal and accounting services | | | 18,117 | | | | 11,416 | | | | 14,691 | | |
| Printing and postage | | | 13,529 | | | | 4,642 | | | | 10,057 | | |
| Custodian fee | | | 40,368 | | | | 13,807 | | | | 23,625 | | |
| Transfer and dividend disbursing agent | | | 33,841 | | | | 5,407 | | | | 21,439 | | |
| Registration fees | | | 3,202 | | | | 1,006 | | | | 1,415 | | |
| Miscellaneous | | | 17,062 | | | | 8,609 | | | | 10,790 | | |
| Total expenses | | $ | 635,410 | | | $ | 108,661 | | | $ | 352,440 | | |
| Deduct - | |
| Reduction of custodian fee | | $ | 1,580 | | | $ | 2,137 | | | $ | 2,800 | | |
| Total expense reductions | | $ | 1,580 | | | $ | 2,137 | | | $ | 2,800 | | |
| Net expenses | | $ | 633,830 | | | $ | 106,524 | | | $ | 349,640 | | |
| Net investment income | | $ | 1,856,676 | | | $ | 326,814 | | | $ | 1,025,472 | | |
| Realized and Unrealized Gain (Loss) | |
| Net realized gain (loss) - | |
| Investment transactions (identified cost basis) | | $ | 217,622 | | | $ | 3,641 | | | $ | (35,088 | ) | |
| Financial futures contracts | | | (745,648 | ) | | | (130,042 | ) | | | (403,779 | ) | |
| Net realized loss | | $ | (528,026 | ) | | $ | (126,401 | ) | | $ | (438,867 | ) | |
| Change in unrealized appreciation (depreciation) - | |
| Investments (identified cost basis) | | $ | 685,808 | | | $ | 150,796 | | | $ | 607,243 | | |
| Financial futures contracts | | | 90,622 | | | | 3,341 | | | | 44,320 | | |
| Net change in unrealized appreciation (depreciation) | | $ | 776,430 | | | $ | 154,137 | | | $ | 651,563 | | |
| Net realized and unrealized gain | | $ | 248,404 | | | $ | 27,736 | | | $ | 212,696 | | |
| Net increase in net assets from operations | | $ | 2,105,080 | | | $ | 354,550 | | | $ | 1,238,168 | | |
See notes to financial statements
43
Eaton Vance Limited Maturity Municipals Funds as of September 30, 2005
FINANCIAL STATEMENTS (Unaudited) CONT'D
Statements of Changes in Net Assets
For the Six Months Ended September 30, 2005
| Increase (Decrease) in Net Assets | | California
Limited Fund | | Florida
Limited Fund | | Massachusetts
Limited Fund | | New Jersey
Limited Fund | |
| From operations - | |
| Net investment income | | $ | 636,451 | | | $ | 1,146,193 | | | $ | 1,352,067 | | | $ | 906,014 | | |
Net realized loss from investment transactions
and financial futures contracts | | | (358,039 | ) | | | (191,791 | ) | | | (621,759 | ) | | | (221,412 | ) | |
Net change in unrealized appreciation (depreciation) from investments
and financial futures contracts | | | 452,369 | | | | 604,538 | | | | 927,719 | | | | 364,098 | | |
| Net increase in net assets from operations | | $ | 730,781 | | | $ | 1,558,940 | | | $ | 1,658,027 | | | $ | 1,048,700 | | |
| Distributions to shareholders - | |
| From net investment income | |
| Class A | | $ | (592,170 | ) | | $ | (793,512 | ) | | $ | (834,399 | ) | | $ | (774,145 | ) | |
| Class B | | | (49,969 | ) | | | (112,261 | ) | | | (138,551 | ) | | | (120,280 | ) | |
| Class C | | | (413 | ) | | | (239,873 | ) | | | (377,229 | ) | | | - | | |
| Total distributions to shareholders | | $ | (642,552 | ) | | $ | (1,145,646 | ) | | $ | (1,350,179 | ) | | $ | (894,425 | ) | |
| Transactions in shares of beneficial interest - | |
| Proceeds from sale of shares | |
| Class A | | $ | 6,808,797 | | | $ | 1,539,642 | | | $ | 5,333,662 | | | $ | 1,968,907 | | |
| Class B | | | 91,852 | | | | 87,498 | | | | 294,255 | | | | 290,730 | | |
| Class C | | | 32,286 | | | | 862,094 | | | | 1,907,711 | | | | - | | |
Net asset value of shares issued to shareholders in payment of
distributions declared | | | |
| Class A | | | 332,528 | | | | 318,249 | | | | 479,485 | | | | 547,510 | | |
| Class B | | | 22,318 | | | | 62,341 | | | | 88,602 | | | | 63,790 | | |
| Class C | | | 146 | | | | 68,139 | | | | 236,212 | | | | - | | |
| Cost of shares redeemed | |
| Class A | | | (5,465,092 | ) | | | (7,579,416 | ) | | | (9,279,917 | ) | | | (3,844,673 | ) | |
| Class B | | | (451,479 | ) | | | (790,694 | ) | | | (692,650 | ) | | | (651,334 | ) | |
| Class C | | | - | | | | (3,460,706 | ) | | | (4,959,880 | ) | | | - | | |
| Net asset value of shares exchanged | |
| Class A | | | 255,812 | | | | 502,255 | | | | 634,331 | | | | 383,070 | | |
| Class B | | | (255,812 | ) | | | (502,255 | ) | | | (634,331 | ) | | | (383,070 | ) | |
| Net increase (decrease) in net assets from Fund share transactions | | $ | 1,371,356 | | | $ | (8,892,853 | ) | | $ | (6,592,520 | ) | | $ | (1,625,070 | ) | |
| Net increase (decrease) in net assets | | $ | 1,459,585 | | | $ | (8,479,559 | ) | | $ | (6,284,672 | ) | | $ | (1,470,795 | ) | |
| Net Assets | |
| At beginning of period | | $ | 35,401,135 | | | $ | 70,547,710 | | | $ | 86,840,875 | | | $ | 52,275,204 | | |
| At end of period | | $ | 36,860,720 | | | $ | 62,068,151 | | | $ | 80,556,203 | | | $ | 50,804,409 | | |
Accumulated undistributed
(distributions in excess of) net
investment income included in net assets | |
| At end of period | | $ | (8,277 | ) | | $ | (6,990 | ) | | $ | (1,735 | ) | | $ | 5,872 | | |
See notes to financial statements
44
Eaton Vance Limited Maturity Municipals Funds as of September 30, 2005
FINANCIAL STATEMENTS (Unaudited) CONT'D
Statements of Changes in Net Assets
For the Six Months Ended September 30, 2005
| Increase (Decrease) in Net Assets | | New York
Limited Fund | | Ohio
Limited Fund | | Pennsylvania
Limited Fund | |
| From operations - | |
| Net investment income | | $ | 1,856,676 | | | $ | 326,814 | | | $ | 1,025,472 | | |
| Net realized loss from investment transactions and financial futures contracts | | | (528,026 | ) | | | (126,401 | ) | | | (438,867 | ) | |
Net change in unrealized appreciation (depreciation) from investments
and financial futures contracts | | | 776,430 | | | | 154,137 | | | | 651,563 | | |
| Net increase in net assets from operations | | $ | 2,105,080 | | | $ | 354,550 | | | $ | 1,238,168 | | |
| Distributions to shareholders - | |
| From net investment income | |
| Class A | | $ | (1,205,374 | ) | | $ | (321,476 | ) | | $ | (652,860 | ) | |
| Class B | | | (178,399 | ) | | | (30,549 | ) | | | (128,797 | ) | |
| Class C | | | (499,599 | ) | | | - | | | | (259,465 | ) | |
| Total distributions to shareholders | | $ | (1,883,372 | ) | | $ | (352,025 | ) | | $ | (1,041,122 | ) | |
| Transactions in shares of beneficial interest - | |
| Proceeds from sale of shares | |
| Class A | | $ | 6,313,862 | | | $ | 1,073,829 | | | $ | 3,544,126 | | |
| Class B | | | 834,982 | | | | 13,161 | | | | 155,785 | | |
| Class C | | | 1,736,521 | | | | - | | | | 2,100,015 | | |
| Net asset value of shares issued to shareholders in payment of distributions declared | |
| Class A | | | 848,682 | | | | 201,819 | | | | 325,135 | | |
| Class B | | | 103,037 | | | | 13,540 | | | | 67,340 | | |
| Class C | | | 281,396 | | | | - | | | | 117,734 | | |
| Cost of shares redeemed | |
| Class A | | | (3,399,726 | ) | | | (706,077 | ) | | | (2,605,946 | ) | |
| Class B | | | (609,669 | ) | | | (247,538 | ) | | | (964,521 | ) | |
| Class C | | | (7,152,112 | ) | | | - | | | | (2,124,948 | ) | |
| Net asset value of shares exchanged | |
| Class A | | | 1,278,625 | | | | 19,920 | | | | 528,935 | | |
| Class B | | | (1,278,625 | ) | | | (19,920 | ) | | | (528,935 | ) | |
| Net increase (decrease) in net assets from Fund share transactions | | $ | (1,043,027 | ) | | $ | 348,734 | | | $ | 614,720 | | |
| Net increase (decrease) in net assets | | $ | (821,319 | ) | | $ | 351,259 | | | $ | 811,766 | | |
| Net Assets | |
| At beginning of period | | $ | 112,197,002 | | | $ | 18,941,708 | | | $ | 59,237,492 | | |
| At end of period | | $ | 111,375,683 | | | $ | 19,292,967 | | | $ | 60,049,258 | | |
Accumulated undistributed
(distributions in excess of) net
investment income included in net assets | |
| At end of period | | $ | (96,601 | ) | | $ | 9,081 | | | $ | (27,596 | ) | |
See notes to financial statements
45
Eaton Vance Limited Maturity Municipals Funds as of September 30, 2005
FINANCIAL STATEMENTS CONT'D
Statements of Changes in Net Assets
For the Year Ended March 31, 2005
| Increase (Decrease) in Net Assets | | California
Limited Fund | | Florida
Limited Fund | | Massachusetts
Limited Fund | | New Jersey
Limited Fund | |
| From operations - | |
| Net investment income | | $ | 1,242,422 | | | $ | 2,467,172 | | | $ | 2,794,336 | | | $ | 1,843,744 | | |
Net realized loss from investment transactions
and financial futures contracts | | | (483,332 | ) | | | (528,473 | ) | | | (836,936 | ) | | | (394,246 | ) | |
Net change in unrealized appreciation (depreciation) from investments
and financial futures contracts | | | (476,395 | ) | | | (1,465,859 | ) | | | (1,731,173 | ) | | | (1,065,428 | ) | |
| Net increase in net assets from operations | | $ | 282,695 | | | $ | 472,840 | | | $ | 226,227 | | | $ | 384,070 | | |
| Distributions to shareholders - | |
| From net investment income | |
| Class A | | $ | (1,081,026 | ) | | $ | (1,636,159 | ) | | $ | (1,655,950 | ) | | $ | (1,549,369 | ) | |
| Class B | | | (140,147 | ) | | | (254,856 | ) | | | (293,970 | ) | | | (255,018 | ) | |
| Class C | | | - | | | | (520,724 | ) | | | (772,079 | ) | | | - | | |
| Total distributions to shareholders | | $ | (1,221,173 | ) | | $ | (2,411,739 | ) | | $ | (2,721,999 | ) | | $ | (1,804,387 | ) | |
| Transactions in shares of beneficial interest - | |
| Proceeds from sale of shares | |
| Class A | | $ | 9,116,022 | | | $ | 15,587,696 | | | $ | 7,737,121 | | | $ | 6,192,248 | | |
| Class B | | | 869,482 | | | | 1,887,828 | | | | 2,297,970 | | | | 1,122,724 | | |
| Class C | | | 10,000 | | | | 3,484,991 | | | | 6,660,947 | | | | - | | |
Net asset value of shares issued to shareholders in payment of
distributions declared | | | |
| Class A | | | 618,161 | | | | 660,063 | | | | 977,103 | | | | 1,111,428 | | |
| Class B | | | 59,463 | | | | 119,985 | | | | 178,831 | | | | 134,604 | | |
| Class C | | | - | | | | 146,077 | | | | 461,305 | | | | - | | |
| Cost of shares redeemed | |
| Class A | | | (8,205,022 | ) | | | (15,962,888 | ) | | | (6,810,780 | ) | | | (9,551,199 | ) | |
| Class B | | | (1,930,131 | ) | | | (1,790,219 | ) | | | (1,826,854 | ) | | | (1,717,448 | ) | |
| Class C | | | - | | | | (4,904,569 | ) | | | (6,918,264 | ) | | | - | | |
| Net asset value of shares exchanged | |
| Class A | | | 879,247 | | | | 568,137 | | | | 822,155 | | | | 654,539 | | |
| Class B | | | (879,247 | ) | | | (568,137 | ) | | | (822,155 | ) | | | (654,539 | ) | |
| Net increase (decrease) in net assets from Fund share transactions | | $ | 537,975 | | | $ | (771,036 | ) | | $ | 2,757,379 | | | $ | (2,707,643 | ) | |
| Net increase (decrease) in net assets | | $ | (400,503 | ) | | $ | (2,709,935 | ) | | $ | 261,607 | | | $ | (4,127,960 | ) | |
| Net Assets | |
| At beginning of year | | $ | 35,801,638 | | | $ | 73,257,645 | | | $ | 86,579,268 | | | $ | 56,403,164 | | |
| At end of year | | $ | 35,401,135 | | | $ | 70,547,710 | | | $ | 86,840,875 | | | $ | 52,275,204 | | |
Accumulated distributions
in excess of net investment
income included in net assets | |
| At end of year | | $ | (2,176 | ) | | $ | (7,537 | ) | | $ | (3,623 | ) | | $ | (5,717 | ) | |
See notes to financial statements
46
Eaton Vance Limited Maturity Municipals Funds as of September 30, 2005
FINANCIAL STATEMENTS CONT'D
Statements of Changes in Net Assets
For the Year Ended March 31, 2005
| Increase (Decrease) in Net Assets | | New York
Limited Fund | | Ohio
Limited Fund | | Pennsylvania
Limited Fund | |
| From operations - | |
| Net investment income | | $ | 3,957,209 | | | $ | 727,796 | | | $ | 2,165,758 | | |
| Net realized loss from investment transactions and financial futures contracts | | | (603,532 | ) | | | (190,188 | ) | | | (660,278 | ) | |
Net change in unrealized appreciation (depreciation) from investments
and financial futures contracts | | | (2,970,057 | ) | | | (461,728 | ) | | | (1,048,426 | ) | |
| Net increase in net assets from operations | | $ | 383,620 | | | $ | 75,880 | | | $ | 457,054 | | |
| Distributions to shareholders - | |
| From net investment income | |
| Class A | | $ | (2,350,829 | ) | | $ | (635,174 | ) | | $ | (1,302,522 | ) | |
| Class B | | | (393,409 | ) | | | (65,256 | ) | | | (295,280 | ) | |
| Class C | | | (1,130,081 | ) | | | - | | | | (543,127 | ) | |
| Total distributions to shareholders | | $ | (3,874,319 | ) | | $ | (700,430 | ) | | $ | (2,140,929 | ) | |
| Transactions in shares of beneficial interest - | |
| Proceeds from sale of shares | |
| Class A | | $ | 12,395,821 | | | $ | 2,551,261 | | | $ | 2,893,354 | | |
| Class B | | | 1,254,824 | | | | 155,720 | | | | 1,357,119 | | |
| Class C | | | 6,265,088 | | | | - | | | | 2,982,295 | | |
| Net asset value of shares issued to shareholders in payment of distributions declared | |
| Class A | | | 1,598,070 | | | | 376,732 | | | | 681,829 | | |
| Class B | | | 226,310 | | | | 29,705 | | | | 159,192 | | |
| Class C | | | 611,393 | | | | - | | | | 239,536 | | |
| Cost of shares redeemed | |
| Class A | | | (18,456,676 | ) | | | (6,049,639 | ) | | | (5,179,173 | ) | |
| Class B | | | (2,439,848 | ) | | | (524,644 | ) | | | (1,635,297 | ) | |
| Class C | | | (11,493,978 | ) | | | - | | | | (7,422,457 | ) | |
| Net asset value of shares exchanged | |
| Class A | | | 1,505,549 | | | | 56,850 | | | | 943,724 | | |
| Class B | | | (1,505,549 | ) | | | (56,850 | ) | | | (943,724 | ) | |
| Net decrease in net assets from Fund share transactions | | $ | (10,038,996 | ) | | $ | (3,460,865 | ) | | $ | (5,923,602 | ) | |
| Net decrease in net assets | | $ | (13,529,695 | ) | | $ | (4,085,415 | ) | | $ | (7,607,477 | ) | |
| Net Assets | |
| At beginning of year | | $ | 125,726,697 | | | $ | 23,027,123 | | | $ | 66,844,969 | | |
| At end of year | | $ | 112,197,002 | | | $ | 18,941,708 | | | $ | 59,237,492 | | |
Accumulated undistributed
(distributions in excess of) net
investment income included in net assets | |
| At end of year | | $ | (69,905 | ) | | $ | 34,292 | | | $ | (11,946 | ) | |
See notes to financial statements
47
Eaton Vance Limited Maturity Municipals Funds as of September 30, 2005
FINANCIAL STATEMENTS CONT'D
Financial Highlights
| | | California Limited Fund - Class A | |
| | | Six Months Ended
September 30, 2005 | | Year Ended March 31, | |
| | | (Unaudited)(1) | | 2005(1) | | 2004(1) | | 2003(1) | | 2002(1)(2) | | 2001(1) | |
| Net asset value - Beginning of period | | $ | 10.290 | | | $ | 10.560 | | | $ | 10.540 | | | $ | 10.100 | | | $ | 10.260 | | | $ | 9.700 | | |
| Income (loss) from operations | |
| Net investment income | | $ | 0.185 | | | $ | 0.377 | | | $ | 0.394 | | | $ | 0.414 | | | $ | 0.430 | | | $ | 0.440 | | |
| Net realized and unrealized gain (loss) | | | 0.032 | | | | (0.274 | ) | | | 0.016 | | | | 0.436 | | | | (0.160 | ) | | | 0.559 | | |
| Total income from operations | | $ | 0.217 | | | $ | 0.103 | | | $ | 0.410 | | | $ | 0.850 | | | $ | 0.270 | | | $ | 0.999 | | |
| Less distributions | |
| From net investment income | | $ | (0.187 | ) | | $ | (0.373 | ) | | $ | (0.390 | ) | | $ | (0.410 | ) | | $ | (0.430 | ) | | $ | (0.439 | ) | |
| Total distributions | | $ | (0.187 | ) | | $ | (0.373 | ) | | $ | (0.390 | ) | | $ | (0.410 | ) | | $ | (0.430 | ) | | $ | (0.439 | ) | |
| Net asset value - End of period | | $ | 10.320 | | | $ | 10.290 | | | $ | 10.560 | | | $ | 10.540 | | | $ | 10.100 | | | $ | 10.260 | | |
| Total Return(3) | | | 2.12 | % | | | 0.99 | % | | | 3.92 | % | | | 8.56 | % | | | 2.65 | % | | | 10.54 | % | |
| Ratios/Supplemental Data | |
| Net assets, end of period (000's omitted) | | $ | 33,561 | | | $ | 31,555 | | | $ | 29,957 | | | $ | 26,750 | | | $ | 20,747 | | | $ | 19,578 | | |
| Ratios (As a percentage of average daily net assets): | |
| Expenses(4) | | | 0.89 | %(5) | | | 0.90 | % | | | 0.88 | % | | | 0.96 | % | | | 1.02 | % | | | 1.03 | % | |
| Expenses after custodian fee reduction(4) | | | 0.87 | %(5) | | | 0.89 | % | | | 0.88 | % | | | 0.94 | % | | | 1.00 | % | | | 1.00 | % | |
| Net investment income | | | 3.55 | %(5) | | | 3.62 | % | | | 3.73 | % | | | 3.97 | % | | | 4.19 | % | | | 4.42 | % | |
| Portfolio Turnover of the Portfolio(6) | | | - | | | | 13 | % | | | 27 | % | | | 7 | % | | | 9 | % | | | 8 | % | |
| Portfolio Turnover of the Fund | | | 16 | % | | | 13 | % | | | - | | | | - | | | | - | | | | - | | |
(1) Net investment income per share was computed using average shares outstanding.
(2) The Fund, through its investment in the Portfolio, has adopted the provisions of the revised AICPA Audit and Accounting Guide for Investment Companies and began using the interest method to amortize premiums on fixed-income securities. The effect of this change for the year ended March 31, 2002 was to increase net investment income per share by $0.002, increase net realized and unrealized losses per share by $0.002 and increase the ratio of net investment income to average net assets from 4.17% to 4.19%. Per share data and ratios for the periods prior to April 1, 2001 have not been restated to reflect this change in presentation.
(3) Returns are historical and are calculated by determining the percentage change in net asset value with all distributions reinvested. Total return is not computed on an annualized basis.
(4) Includes the Fund's share of its corresponding Portfolio's allocated expenses while the Fund was making investments directly into the Portfolio.
(5) Annualized.
(6) Portfolio turnover represents the rate of portfolio activity for the period while the Fund was making investments directly into the Portfolio.
See notes to financial statements
48
Eaton Vance Limited Maturity Municipals Funds as of September 30, 2005
FINANCIAL STATEMENTS CONT'D
Financial Highlights
| | | California Limited Fund - Class B | |
| | | Six Months Ended
September 30, 2005 | | Year Ended March 31, | |
| | | (Unaudited) | | 2005 | | 2004(1) | | 2003(1) | | 2002(1)(2) | | 2001(1) | |
| Net asset value - Beginning of period | | $ | 10.260 | | | $ | 10.520 | | | $ | 10.500 | | | $ | 10.070 | | | $ | 10.260 | | | $ | 9.700 | | |
| Income (loss) from operations | | | |
| Net investment income | | $ | 0.146 | | | $ | 0.301 | | | $ | 0.313 | | | $ | 0.333 | | | $ | 0.353 | | | $ | 0.365 | | |
| Net realized and unrealized gain (loss) | | | 0.031 | | | | (0.268 | ) | | | 0.017 | | | | 0.432 | | | | (0.185 | ) | | | 0.564 | | |
| Total income from operations | | $ | 0.177 | | | $ | 0.033 | | | $ | 0.330 | | | $ | 0.765 | | | $ | 0.168 | | | $ | 0.929 | | |
| Less distributions | | | |
| From net investment income | | $ | (0.147 | ) | | $ | (0.293 | ) | | $ | (0.310 | ) | | $ | (0.335 | ) | | $ | (0.358 | ) | | $ | (0.369 | ) | |
| Total distributions | | $ | (0.147 | ) | | $ | (0.293 | ) | | $ | (0.310 | ) | | $ | (0.335 | ) | | $ | (0.358 | ) | | $ | (0.369 | ) | |
| Net asset value - End of period | | $ | 10.290 | | | $ | 10.260 | | | $ | 10.520 | | | $ | 10.500 | | | $ | 10.070 | | | $ | 10.260 | | |
| Total Return(3) | | | 1.73 | % | | | 0.31 | % | | | 3.16 | % | | | 7.71 | % | | | 1.64 | % | | | 9.77 | % | |
| Ratios/Supplemental Data | | | |
| Net assets, end of period (000's omitted) | | $ | 3,258 | | | $ | 3,837 | | | $ | 5,844 | | | $ | 5,107 | | | $ | 1,723 | | | $ | 1,890 | | |
| Ratios (As a percentage of average daily net assets): | |
| Expenses(4) | | | 1.64 | %(5) | | | 1.65 | % | | | 1.63 | % | | | 1.71 | % | | | 1.77 | % | | | 1.78 | % | |
| Expenses after custodian fee reduction(4) | | | 1.62 | %(5) | | | 1.64 | % | | | 1.63 | % | | | 1.69 | % | | | 1.75 | % | | | 1.75 | % | |
| Net investment income | | | 2.81 | %(5) | | | 2.90 | % | | | 2.97 | % | | | 3.19 | % | | | 3.44 | % | | | 3.68 | % | |
| Portfolio Turnover of the Portfolio(6) | | | - | | | | 13 | % | | | 27 | % | | | 7 | % | | | 9 | % | | | 8 | % | |
| Portfolio Turnover of the Fund | | | 16 | % | | | 13 | % | | | - | | | | - | | | | - | | | | - | | |
(1) Net investment income per share was computed using average shares outstanding.
(2) The Fund, through its investment in the Portfolio, has adopted the provisions of the revised AICPA Audit and Accounting Guide for Investment Companies and began using the interest method to amortize premiums on fixed-income securities. The effect of this change for the year ended March 31, 2002 was to increase net investment income per share by $0.002, increase net realized and unrealized losses per share by $0.002 and increase the ratio of net investment income to average net assets from 3.42% to 3.44%. Per share data and ratios for the periods prior to April 1, 2001 have not been restated to reflect this change in presentation.
(3) Returns are historical and are calculated by determining the percentage change in net asset value with all distributions reinvested. Total return is not computed on an annualized basis.
(4) Includes the Fund's share of its corresponding Portfolio's allocated expenses while the Fund was making investments directly into the Portfolio.
(5) Annualized.
(6) Portfolio turnover represents the rate of portfolio activity for the period while the Fund was making investments directly into the Portfolio.
See notes to financial statements
49
Eaton Vance Limited Maturity Municipals Funds as of September 30, 2005
FINANCIAL STATEMENTS CONT'D
Financial Highlights
| | | California Limited Fund - Class C | |
| | | Six Months Ended
September 30, 2005 | | Year Ended March 31, | |
| | | (Unaudited)(2) | | 2005(1)(2) | |
| Net asset value - Beginning of period | | $ | 9.950 | | | $ | 10.000 | | |
| Income (loss) from operations | |
| Net investment income | | $ | 0.140 | | | $ | 0.002 | | |
| Net realized and unrealized gain (loss) | | | 0.024 | | | | (0.052 | ) | |
| Total income (loss) from operations | | $ | 0.164 | | | $ | (0.050 | ) | |
| Less distributions | |
| From net investment income | | $ | (0.144 | ) | | $ | - | | |
| Total distributions | | $ | (0.144 | ) | | $ | - | | |
| Net asset value - End of period | | $ | 9.970 | | | $ | 9.950 | | |
| Total Return(3) | | | 1.60 | % | | | (0.01 | )% | |
| Ratios/Supplemental Data | |
| Net assets, end of period (000's omitted) | | $ | 42 | | | $ | 10 | | |
| Ratios (As a percentage of average daily net assets): | |
| Expenses | | | 1.64 | %(4) | | | 0.00 | %(4)(5) | |
| Expenses after custodian fee reduction | | | 1.62 | %(4) | | | - | | |
| Net investment income | | | 2.79 | %(4) | | | 0.00 | %(4)(5) | |
| Portfolio Turnover of the Fund | | | 16 | % | | | 13 | % | |
(1) For the period from the commencement of offering of Class C shares, March 23, 2005 to March 31, 2005.
(2) Net investment income per share was computed using average shares outstanding.
(3) Returns are historical and are calculated by determining the percentage change in net asset value with all distributions reinvested. Total return is not computed on an annualized basis.
(4) Annualized.
(5) Represents less than 0.01%
See notes to financial statements
50
Eaton Vance Limited Maturity Municipals Funds as of September 30, 2005
FINANCIAL STATEMENTS CONT'D
Financial Highlights
| | | Florida Limited Fund - Class A | |
| | | Six Months Ended
September 30, 2005 | | Year Ended March 31, | |
| | | (Unaudited)(1) | | 2005(1) | | 2004(1) | | 2003(1) | | 2002(1)(2) | | 2001(1) | |
| Net asset value - Beginning of period | | $ | 10.230 | | | $ | 10.500 | | | $ | 10.480 | | | $ | 10.050 | | | $ | 10.130 | | | $ | 9.670 | | |
| Income (loss) from operations | |
| Net investment income | | $ | 0.191 | | | $ | 0.387 | | | $ | 0.396 | | | $ | 0.420 | | | $ | 0.449 | | | $ | 0.449 | | |
| Net realized and unrealized gain (loss) | | | 0.050 | | | | (0.277 | ) | | | 0.018 | | | | 0.425 | | | | (0.077 | ) | | | 0.455 | | |
| Total income from operations | | $ | 0.241 | | | $ | 0.110 | | | $ | 0.414 | | | $ | 0.845 | | | $ | 0.372 | | | $ | 0.904 | | |
| Less distributions | |
| From net investment income | | $ | (0.191 | ) | | $ | (0.380 | ) | | $ | (0.394 | ) | | $ | (0.415 | ) | | $ | (0.452 | ) | | $ | (0.444 | ) | |
| Total distributions | | $ | (0.191 | ) | | $ | (0.380 | ) | | $ | (0.394 | ) | | $ | (0.415 | ) | | $ | (0.452 | ) | | $ | (0.444 | ) | |
| Net asset value - End of period | | $ | 10.280 | | | $ | 10.230 | | | $ | 10.500 | | | $ | 10.480 | | | $ | 10.050 | | | $ | 10.130 | | |
| Total Return(3) | | | 2.37 | % | | | 1.06 | % | | | 3.99 | % | | | 8.59 | % | | | 3.71 | % | | | 9.59 | % | |
| Ratios/Supplemental Data | |
| Net assets, end of period (000's omitted) | | $ | 39,757 | | | $ | 44,720 | | | $ | 45,088 | | | $ | 47,033 | | | $ | 33,611 | | | $ | 31,754 | | |
| Ratios (As a percentage of average daily net assets): | |
| Expenses(4) | | | 0.84 | %(5) | | | 0.82 | % | | | 0.82 | % | | | 0.84 | % | | | 0.94 | % | | | 0.95 | % | |
| Expenses after custodian fee reduction(4) | | | 0.83 | %(5) | | | 0.81 | % | | | 0.82 | % | | | 0.81 | % | | | 0.91 | % | | | 0.93 | % | |
| Net investment income | | | 3.68 | %(5) | | | 3.74 | % | | | 3.76 | % | | | 4.07 | % | | | 4.42 | % | | | 4.57 | % | |
| Portfolio Turnover of the Portfolio(6) | | | - | | | | 8 | % | | | 13 | % | | | 23 | % | | | 15 | % | | | 7 | % | |
| Portfolio Turnover of the Fund | | | 7 | % | | | 16 | % | | | - | | | | - | | | | - | | | | - | | |
(1) Net investment income per share was computed using average shares outstanding.
(2) The Fund, through its investment in the Portfolio, has adopted the provisions of the revised AICPA Audit and Accounting Guide for Investment Companies and began using the interest method to amortize premiums on fixed-income securities. The effect of this change for the year ended March 31, 2002 was to increase net investment income per share by $0.001, increase net realized and unrealized losses per share by $0.001 and increase the ratio of net investment income to average net assets from 4.41% to 4.42%. Per share data and ratios for the periods prior to April 1, 2001 have not been restated to reflect this change in presentation.
(3) Returns are historical and are calculated by determining the percentage change in net asset value with all distributions reinvested. Total return is not computed on an annualized basis.
(4) Includes the Fund's share of its corresponding Portfolio's allocated expenses while the Fund was making investments directly into the Portfolio.
(5) Annualized.
(6) Portfolio turnover represents the rate of portfolio activity for the period while the Fund was making investments directly into the Portfolio.
See notes to financial statements
51
Eaton Vance Limited Maturity Municipals Funds as of September 30, 2005
FINANCIAL STATEMENTS CONT'D
Financial Highlights
| | | Florida Limited Fund - Class B | |
| | | Six Months Ended
September 30, 2005 | | Year Ended March 31, | |
| | | (Unaudited)(1) | | 2005(1) | | 2004(1) | | 2003(1) | | 2002(1)(2) | | 2001(1) | |
| Net asset value - Beginning of period | | $ | 10.230 | | | $ | 10.500 | | | $ | 10.480 | | | $ | 10.050 | | | $ | 10.130 | | | $ | 9.670 | | |
| Income (loss) from operations | | | |
| Net investment income | | $ | 0.152 | | | $ | 0.310 | | | $ | 0.316 | | | $ | 0.340 | | | $ | 0.377 | | | $ | 0.369 | | |
| Net realized and unrealized gain (loss) | | | 0.048 | | | | (0.280 | ) | | | 0.018 | | | | 0.433 | | | | (0.077 | ) | | | 0.460 | | |
| Total income from operations | | $ | 0.200 | | | $ | 0.030 | | | $ | 0.334 | | | $ | 0.773 | | | $ | 0.300 | | | $ | 0.829 | | |
| Less distributions | | | |
| From net investment income | | $ | (0.150 | ) | | $ | (0.300 | ) | | $ | (0.314 | ) | | $ | (0.343 | ) | | $ | (0.380 | ) | | $ | (0.369 | ) | |
| Total distributions | | $ | (0.150 | ) | | $ | (0.300 | ) | | $ | (0.314 | ) | | $ | (0.343 | ) | | $ | (0.380 | ) | | $ | (0.369 | ) | |
| Net asset value - End of period | | $ | 10.280 | | | $ | 10.230 | | | $ | 10.500 | | | $ | 10.480 | | | $ | 10.050 | | | $ | 10.130 | | |
| Total Return(3) | | | 1.97 | % | | | 0.28 | % | | | 3.22 | % | | | 7.84 | % | | | 2.98 | % | | | 8.76 | % | |
| Ratios/Supplemental Data | | | |
| Net assets, end of period (000's omitted) | | $ | 7,269 | | | $ | 8,361 | | | $ | 8,944 | | | $ | 8,217 | | | $ | 2,621 | | | $ | 4,905 | | |
| Ratios (As a percentage of average daily net assets): | |
| Expenses(4) | | | 1.59 | %(5) | | | 1.57 | % | | | 1.57 | % | | | 1.59 | % | | | 1.69 | % | | | 1.70 | % | |
| Expenses after custodian fee reduction(4) | | | 1.58 | %(5) | | | 1.56 | % | | | 1.57 | % | | | 1.56 | % | | | 1.66 | % | | | 1.68 | % | |
| Net investment income | | | 2.93 | %(5) | | | 3.00 | % | | | 3.01 | % | | | 3.28 | % | | | 3.72 | % | | | 3.81 | % | |
| Portfolio Turnover of the Portfolio(6) | | | - | | | | 8 | % | | | 13 | % | | | 23 | % | | | 15 | % | | | 7 | % | |
| Portfolio Turnover of the Fund | | | 7 | % | | | 16 | % | | | - | | | | - | | | | - | | | | - | | |
(1) Net investment income per share was computed using average shares outstanding.
(2) The Fund, through its investment in the Portfolio, has adopted the provisions of the revised AICPA Audit and Accounting Guide for Investment Companies and began using the interest method to amortize premiums on fixed-income securities. The effect of this change for the year ended March 31, 2002 was to increase net investment income per share by $0.001, increase net realized and unrealized losses per share by $0.001 and increase the ratio of net investment income to average net assets from 3.71% to 3.72%. Per share data and ratios for the periods prior to April 1, 2001 have not been restated to reflect this change in presentation.
(3) Returns are historical and are calculated by determining the percentage change in net asset value with all distributions reinvested. Total return is not computed on an annualized basis.
(4) Includes the Fund's share of its corresponding Portfolio's allocated expenses while the Fund was making investments directly into the Portfolio.
(5) Annualized.
(6) Portfolio turnover represents the rate of portfolio activity for the period while the Fund was making investments directly into the Portfolio.
See notes to financial statements
52
Eaton Vance Limited Maturity Municipals Funds as of September 30, 2005
FINANCIAL STATEMENTS CONT'D
Financial Highlights
| | | Florida Limited Fund - Class C | |
| | | Six Months Ended
September 30, 2005 | | Year Ended March 31, | |
| | | (Unaudited)(1) | | 2005(1) | | 2004(1) | | 2003(1) | | 2002(1)(2) | | 2001(1) | |
| Net asset value - Beginning of period | | $ | 9.650 | | | $ | 9.910 | | | $ | 9.890 | | | $ | 9.490 | | | $ | 9.570 | | | $ | 9.140 | | |
| Income (loss) from operations | | | |
| Net investment income | | $ | 0.143 | | | $ | 0.293 | | | $ | 0.298 | | | $ | 0.319 | | | $ | 0.348 | | | $ | 0.356 | | |
| Net realized and unrealized gain (loss) | | | 0.059 | | | | (0.268 | ) | | | 0.021 | | | | 0.404 | | | | (0.068 | ) | | | 0.423 | | |
| Total income from operations | | $ | 0.202 | | | $ | 0.025 | | | $ | 0.319 | | | $ | 0.723 | | | $ | 0.280 | | | $ | 0.779 | | |
| Less distributions | | | |
| From net investment income | | $ | (0.142 | ) | | $ | (0.285 | ) | | $ | (0.299 | ) | | $ | (0.323 | ) | | $ | (0.360 | ) | | $ | (0.349 | ) | |
| Total distributions | | $ | (0.142 | ) | | $ | (0.285 | ) | | $ | (0.299 | ) | | $ | (0.323 | ) | | $ | (0.360 | ) | | $ | (0.349 | ) | |
| Net asset value - End of period | | $ | 9.710 | | | $ | 9.650 | | | $ | 9.910 | | | $ | 9.890 | | | $ | 9.490 | | | $ | 9.570 | | |
| Total Return(3) | | | 2.11 | % | | | 0.19 | %(4) | | | 3.24 | % | | | 7.76 | % | | | 2.93 | % | | | 8.70 | % | |
| Ratios/Supplemental Data | | | |
| Net assets, end of period (000's omitted) | | $ | 15,043 | | | $ | 17,467 | | | $ | 19,226 | | | $ | 12,883 | | | $ | 4,322 | | | $ | 2,609 | | |
| Ratios (As a percentage of average daily net assets): | |
| Expenses(5) | | | 1.59 | %(6) | | | 1.57 | % | | | 1.57 | % | | | 1.59 | % | | | 1.69 | % | | | 1.69 | % | |
| Expenses after custodian fee reduction(5) | | | 1.58 | %(6) | | | 1.56 | % | | | 1.57 | % | | | 1.56 | % | | | 1.66 | % | | | 1.67 | % | |
| Net investment income | | | 2.94 | %(6) | | | 3.00 | % | | | 3.00 | % | | | 3.26 | % | | | 3.63 | % | | | 3.84 | % | |
| Portfolio Turnover of the Portfolio(7) | | | - | | | | 8 | % | | | 13 | % | | | 23 | % | | | 15 | % | | | 7 | % | |
| Portfolio Turnover of the Fund | | | 7 | % | | | 16 | % | | | - | | | | - | | | | - | | | | - | | |
(1) Net investment income per share was computed using average shares outstanding.
(2) The Fund, through its investment in the Portfolio, has adopted the provisions of the revised AICPA Audit and Accounting Guide for Investment Companies and began using the interest method to amortize premiums on fixed-income securities. The effect of this change for the year ended March 31, 2002 was to increase net investment income per share by $0.001, increase net realized and unrealized losses per share by $0.001 and increase the ratio of net investment income to average net assets from 3.62% to 3.63%. Per share data and ratios for the periods prior to April 1, 2001 have not been restated to reflect this change in presentation.
(3) Returns are historical and are calculated by determining the percentage change in net asset value with all distributions reinvested. Total return is not computed on an annualized basis.
(4) Total return reflects a decrease of 0.06% due to a change in the timing of the payment and reinvestment of distributions.
(5) Include's the Fund's share of its corresponding Portfolio's allocated expenses while the fund was making investments directly into the Portfolio.
(6) Annualized.
(7) Portfolio turnover represents the rate of portfolio activity for the period while the Fund was making investments directly into the Portfolio.
See notes to financial statements
53
Eaton Vance Limited Maturity Municipals Funds as of September 30, 2005
FINANCIAL STATEMENTS CONT'D
Financial Highlights
| | | Massachusetts Limited Fund - Class A | |
| | | Six Months Ended
September 30, 2005 | | Year Ended March 31, | |
| | | (Unaudited)(1) | | 2005(1) | | 2004(1) | | 2003(1) | | 2002(1)(2) | | 2001(1) | |
| Net asset value - Beginning of period | | $ | 10.180 | | | $ | 10.460 | | | $ | 10.450 | | | $ | 9.980 | | | $ | 10.110 | | | $ | 9.680 | | |
| Income (loss) from operations | |
| Net investment income | | $ | 0.182 | | | $ | 0.370 | | | $ | 0.384 | | | $ | 0.413 | | | $ | 0.443 | | | $ | 0.462 | | |
| Net realized and unrealized gain (loss) | | | 0.030 | | | | (0.287 | ) | | | 0.013 | | | | 0.483 | | | | (0.124 | ) | | | 0.413 | | |
| Total income from operations | | $ | 0.212 | | | $ | 0.083 | | | $ | 0.397 | | | $ | 0.896 | | | $ | 0.319 | | | $ | 0.875 | | |
| Less distributions | |
| From net investment income | | $ | (0.182 | ) | | $ | (0.363 | ) | | $ | (0.387 | ) | | $ | (0.426 | ) | | $ | (0.449 | ) | | $ | (0.445 | ) | |
| Total distributions | | $ | (0.182 | ) | | $ | (0.363 | ) | | $ | (0.387 | ) | | $ | (0.426 | ) | | $ | (0.449 | ) | | $ | (0.445 | ) | |
| Net asset value - End of period | | $ | 10.210 | | | $ | 10.180 | | | $ | 10.460 | | | $ | 10.450 | | | $ | 9.980 | | | $ | 10.110 | | |
| Total Return(3) | | | 2.09 | % | | | 0.79 | % | | | 3.84 | % | | | 9.17 | % | | | 3.17 | % | | | 9.26 | % | |
| Ratios/Supplemental Data | |
| Net assets, end of period (000's omitted) | | $ | 46,245 | | | $ | 48,901 | | | $ | 47,567 | | | $ | 47,321 | | | $ | 33,848 | | | $ | 32,736 | | |
| Ratios (As a percentage of average daily net assets): | |
| Expenses(4) | | | 0.82 | %(5) | | | 0.82 | % | | | 0.80 | % | | | 0.85 | % | | | 0.94 | % | | | 0.95 | % | |
| Expenses after custodian fee reduction(4) | | | 0.81 | %(5) | | | 0.81 | % | | | 0.80 | % | | | 0.83 | % | | | 0.91 | % | | | 0.92 | % | |
| Net investment income | | | 3.53 | %(5) | | | 3.59 | % | | | 3.66 | % | | | 4.01 | % | | | 4.37 | % | | | 4.70 | % | |
| Portfolio Turnover of the Portfolio(6) | | | - | | | | 13 | % | | | 12 | % | | | 22 | % | | | 8 | % | | | 8 | % | |
| Portfolio Turnover of the Fund | | | 3 | % | | | 7 | % | | | - | | | | - | | | | - | | | | - | | |
(1) Net investment income per share was computed using average shares outstanding.
(2) The Fund, through its investment in the Portfolio, has adopted the provisions of the revised AICPA Audit and Accounting Guide for Investment Companies and began using the interest method to amortize premiums on fixed-income securities. The effect of this change for the year ended March 31, 2002 was to increase net investment income per share by $0.001, increase net realized and unrealized losses per share by $0.001 and increase the ratio of net investment income to average net assets from 4.36% to 4.37%. Per share data and ratios for the periods prior to April 1, 2001 have not been restated to reflect this change in presentation.
(3) Returns are historical and are calculated by determining the percentage change in net asset value with all distributions reinvested. Total return is not computed on an annualized basis.
(4) Includes the Fund's share of its corresponding Portfolio's allocated expenses while the Fund was making investments directly into the Portfolio.
(5) Annualized.
(6) Portfolio turnover represents the rate of portfolio activity for the period while the Fund was making investments directly into the Portfolio.
See notes to financial statements
54
Eaton Vance Limited Maturity Municipals Funds as of September 30, 2005
FINANCIAL STATEMENTS CONT'D
Financial Highlights
| | | Massachusetts Limited Fund - Class B | |
| | | Six Months Ended
September 30, 2005 | | Year Ended March 31, | |
| | | (Unaudited)(1) | | 2005(1) | | 2004(1) | | 2003(1) | | 2002(1)(2) | | 2001(1) | |
| Net asset value - Beginning of period | | $ | 10.170 | | | $ | 10.450 | | | $ | 10.430 | | | $ | 9.970 | | | $ | 10.110 | | | $ | 9.680 | | |
| Income (loss) from operations | |
| Net investment income | | $ | 0.143 | | | $ | 0.292 | | | $ | 0.304 | | | $ | 0.331 | | | $ | 0.364 | | | $ | 0.387 | | |
| Net realized and unrealized gain (loss) | | | 0.029 | | | | (0.289 | ) | | | 0.022 | | | | 0.475 | | | | (0.135 | ) | | | 0.410 | | |
| Total income from operations | | $ | 0.172 | | | $ | 0.003 | | | $ | 0.326 | | | $ | 0.806 | | | $ | 0.229 | | | $ | 0.797 | | |
| Less distributions | |
| From net investment income | | $ | (0.142 | ) | | $ | (0.283 | ) | | $ | (0.306 | ) | | $ | (0.346 | ) | | $ | (0.369 | ) | | $ | (0.367 | ) | |
| Total distributions | | $ | (0.142 | ) | | $ | (0.283 | ) | | $ | (0.306 | ) | | $ | (0.346 | ) | | $ | (0.369 | ) | | $ | (0.367 | ) | |
| Net asset value - End of period | | $ | 10.200 | | | $ | 10.170 | | | $ | 10.450 | | | $ | 10.430 | | | $ | 9.970 | | | $ | 10.110 | | |
| Total Return(3) | | | 1.69 | % | | | 0.02 | % | | | 3.16 | % | | | 8.23 | % | | | 2.27 | % | | | 8.41 | % | |
| Ratios/Supplemental Data | |
| Net assets, end of period (000's omitted) | | $ | 9,444 | | | $ | 10,350 | | | $ | 10,818 | | | $ | 9,127 | | | $ | 3,969 | | | $ | 2,218 | | |
| Ratios (As a percentage of average daily net assets): | |
| Expenses(4) | | | 1.57 | %(5) | | | 1.57 | % | | | 1.55 | % | | | 1.60 | % | | | 1.69 | % | | | 1.70 | % | |
| Expenses after custodian fee reduction(4) | | | 1.56 | %(5) | | | 1.56 | % | | | 1.55 | % | | | 1.58 | % | | | 1.66 | % | | | 1.67 | % | |
| Net investment income | | | 2.77 | %(5) | | | 2.83 | % | | | 2.91 | % | | | 3.22 | % | | | 3.59 | % | | | 3.93 | % | |
| Portfolio Turnover of the Portfolio(6) | | | - | | | | 13 | % | | | 12 | % | | | 22 | % | | | 8 | % | | | 8 | % | |
| Portfolio Turnover of the Fund | | | 3 | % | | | 7 | % | | | - | | | | - | | | | - | | | | - | | |
(1) Net investment income per share was computed using average shares outstanding.
(2) The Fund, through its investment in the Portfolio, has adopted the provisions of the revised AICPA Audit and Accounting Guide for Investment Companies and began using the interest method to amortize premiums on fixed-income securities. The effect of this change for the year ended March 31, 2002 was to increase net investment income per share by $0.001, increase net realized and unrealized losses per share by $0.001 and increase the ratio of net investment income to average net assets from 3.58% to 3.59%. Per share data and ratios for the periods prior to April 1, 2001 have not been restated to reflect this change in presentation.
(3) Returns are historical and are calculated by determining the percentage change in net asset value with all distributions reinvested. Total return is not computed on an annualized basis.
(4) Includes the Fund's share of its corresponding Portfolio's allocated expenses while the Fund was making investments directly into the Portfolio.
(5) Annualized.
(6) Portfolio turnover represents the rate of portfolio activity for the period while the Fund was making investments directly into the Portfolio.
See notes to financial statements
55
Eaton Vance Limited Maturity Municipals Funds as of September 30, 2005
FINANCIAL STATEMENTS CONT'D
Financial Highlights
| | | Massachusetts Limited Fund - Class C | |
| | | Six Months Ended
September 30, 2005 | | Year Ended March 31, | |
| | | (Unaudited)(1) | | 2005(1) | | 2004(1) | | 2003(1) | | 2002(1)(2) | | 2001(1) | |
| Net asset value - Beginning of period | | $ | 9.740 | | | $ | 10.020 | | | $ | 10.010 | | | $ | 9.560 | | | $ | 9.680 | | | $ | 9.260 | | |
| Income (loss) from operations | |
| Net investment income | | $ | 0.137 | | | $ | 0.280 | | | $ | 0.289 | | | $ | 0.316 | | | $ | 0.348 | | | $ | 0.375 | | |
| Net realized and unrealized gain (loss) | | | 0.029 | | | | (0.287 | ) | | | 0.017 | | | | 0.465 | | | | (0.114 | ) | | | 0.395 | | |
| Total income (loss) from operations | | $ | 0.166 | | | $ | (0.007 | ) | | $ | 0.306 | | | $ | 0.781 | | | $ | 0.234 | | | $ | 0.770 | | |
| Less distributions | |
| From net investment income | | $ | (0.136 | ) | | $ | (0.273 | ) | | $ | (0.296 | ) | | $ | (0.331 | ) | | $ | (0.354 | ) | | $ | (0.350 | ) | |
| Total distributions | | $ | (0.136 | ) | | $ | (0.273 | ) | | $ | (0.296 | ) | | $ | (0.331 | ) | | $ | (0.354 | ) | | $ | (0.350 | ) | |
| Net asset value - End of period | | $ | 9.770 | | | $ | 9.740 | | | $ | 10.020 | | | $ | 10.010 | | | $ | 9.560 | | | $ | 9.680 | | |
| Total Return(3) | | | 1.71 | % | | | (0.14 | )%(4) | | | 3.09 | % | | | 8.32 | % | | | 2.40 | % | | | 8.49 | % | |
| Ratios/Supplemental Data | |
| Net assets, end of period (000's omitted) | | $ | 24,868 | | | $ | 27,589 | | | $ | 28,195 | | | $ | 15,231 | | | $ | 5,632 | | | $ | 2,573 | | |
| Ratios (As a percentage of average daily net assets): | |
| Expenses(5) | | | 1.57 | %(6) | | | 1.57 | % | | | 1.55 | % | | | 1.60 | % | | | 1.69 | % | | | 1.71 | % | |
| Expenses after custodian fee reduction(5) | | | 1.56 | %(6) | | | 1.56 | % | | | 1.55 | % | | | 1.58 | % | | | 1.66 | % | | | 1.68 | % | |
| Net investment income | | | 2.78 | %(6) | | | 2.83 | % | | | 2.88 | % | | | 3.20 | % | | | 3.58 | % | | | 3.99 | % | |
| Portfolio Turnover of the Portfolio(7) | | | - | | | | 13 | % | | | 12 | % | | | 22 | % | | | 8 | % | | | 8 | % | |
| Portfolio Turnover of the Fund | | | 3 | % | | | 7 | % | | | - | | | | - | | | | - | | | | - | | |
(1) Net investment income per share was computed using average shares outstanding.
(2) The Fund, through its investment in the Portfolio, has adopted the provisions of the revised AICPA Audit and Accounting Guide for Investment Companies and began using the interest method to amortize premiums on fixed-income securities. The effect of this change for the year ended March 31, 2002 was to increase net investment income per share by $0.001, increase net realized and unrealized losses per share by $0.001 and increase the ratio of net investment income to average net assets from 3.57% to 3.58%. Per share data and ratios for the periods prior to April 1, 2001 have not been restated to reflect this change in presentation.
(3) Returns are historical and are calculated by determining the percentage change in net asset value with all distributions reinvested. Total return is not computed on an annualized basis.
(4) Total return reflects a decrease of 0.05% due to a change in the timing of the payment and reinvestment of distributions.
(5) Includes the Fund's share of its corresponding Portfolio's allocated expenses while the Fund was making investments directly into the Portfolio.
(6) Annualized.
(7) Portfolio turnover represents the rate of portfolio activity for the period while the Fund was making investments directly into the Portfolio.
See notes to financial statements
56
Eaton Vance Limited Maturity Municipals Funds as of September 30, 2005
FINANCIAL STATEMENTS CONT'D
Financial Highlights
| | | New Jersey Limited Fund - Class A | |
| | | Six Months Ended
September 30, 2005 | | Year Ended March 31, | |
| | | (Unaudited)(1) | | 2005(1) | | 2004(1) | | 2003(1) | | 2002(1)(2) | | 2001 | |
| Net asset value - Beginning of period | | $ | 10.100 | | | $ | 10.360 | | | $ | 10.300 | | | $ | 10.000 | | | $ | 10.180 | | | $ | 9.780 | | |
| Income (loss) from operations | | | |
| Net investment income | | $ | 0.183 | | | $ | 0.366 | | | $ | 0.379 | | | $ | 0.427 | | | $ | 0.453 | | | $ | 0.470 | | |
| Net realized and unrealized gain (loss) | | | 0.027 | | | | (0.266 | ) | | | 0.052 | | | | 0.301 | | | | (0.169 | ) | | | 0.392 | | |
| Total income from operations | | $ | 0.210 | | | $ | 0.100 | | | $ | 0.431 | | | $ | 0.728 | | | $ | 0.284 | | | $ | 0.862 | | |
| Less distributions | | | |
| From net investment income | | $ | (0.180 | ) | | $ | (0.360 | ) | | $ | (0.371 | ) | | $ | (0.428 | ) | | $ | (0.464 | ) | | $ | (0.462 | ) | |
| Total distributions | | $ | (0.180 | ) | | $ | (0.360 | ) | | $ | (0.371 | ) | | $ | (0.428 | ) | | $ | (0.464 | ) | | $ | (0.462 | ) | |
| Net asset value - End of period | | $ | 10.130 | | | $ | 10.100 | | | $ | 10.360 | | | $ | 10.300 | | | $ | 10.000 | | | $ | 10.180 | | |
| Total Return(3) | | | 2.10 | % | | | 0.98 | % | | | 4.22 | % | | | 7.45 | % | | | 2.82 | % | | | 9.04 | % | |
| Ratios/Supplemental Data | | | |
| Net assets, end of period (000's omitted) | | $ | 42,606 | | | $ | 43,424 | | | $ | 46,192 | | | $ | 39,572 | | | $ | 34,898 | | | $ | 30,889 | | |
| Ratios (As a percentage of average daily net assets): | |
| Expenses(4) | | | 0.88 | %(5) | | | 0.87 | % | | | 0.84 | % | | | 0.90 | % | | | 0.96 | % | | | 0.98 | % | |
| Expenses after custodian fee reduction(4) | | | 0.86 | %(5) | | | 0.86 | % | | | 0.84 | % | | | 0.89 | % | | | 0.94 | % | | | 0.96 | % | |
| Net investment income | | | 3.58 | %(5) | | | 3.59 | % | | | 3.66 | % | | | 4.17 | % | | | 4.47 | % | | | 4.73 | % | |
| Portfolio Turnover of the Portfolio(6) | | | - | | | | 11 | % | | | 11 | % | | | 25 | % | | | 17 | % | | | 11 | % | |
| Portfolio Turnover of the Fund | | | 14 | % | | | 14 | % | | | - | | | | - | | | | - | | | | - | | |
(1) Net investment income per share was computed using average shares outstanding.
(2) The Fund, through its investment in the Portfolio, has adopted the provisions of the revised AICPA Audit and Accounting Guide for Investment Companies and began using the interest method to amortize premiums on fixed-income securities. The effect of this change for the year ended March 31, 2002 was to increase net investment income per share by $0.001, increase net realized and unrealized losses per share by $0.001 and increase the ratio of net investment income to average net assets from 4.46% to 4.47%. Per-share data and ratios for the periods prior to April 1, 2001 have not been restated to reflect this change in presentation.
(3) Returns are historical and are calculated by determining the percentage change in net asset value with all distributions reinvested. Total return is not computed on an annualized basis.
(4) Includes the Fund's share of its corresponding Portfolio's allocated expenses while the Fund was making investments directly into the Portfolio.
(5) Annualized.
(6) Portfolio turnover represents the rate of portfolio activity for the period while the Fund was making investments directly into the Portfolio.
See notes to financial statements
57
Eaton Vance Limited Maturity Municipals Funds as of September 30, 2005
FINANCIAL STATEMENTS CONT'D
Financial Highlights
| | | New Jersey Limited Fund - Class B | |
| | | Six Months Ended
September 30, 2005 | | Year Ended March 31, | |
| | | (Unaudited)(1) | | 2005(1) | | 2004(1) | | 2003(1) | | 2002(1)(2) | | 2001 | |
| Net asset value - Beginning of period | | $ | 10.100 | | | $ | 10.350 | | | $ | 10.290 | | | $ | 9.990 | | | $ | 10.180 | | | $ | 9.780 | | |
| Income (loss) from operations | |
| Net investment income | | $ | 0.144 | | | $ | 0.290 | | | $ | 0.302 | | | $ | 0.343 | | | $ | 0.376 | | | $ | 0.411 | | |
| Net realized and unrealized gain (loss) | | | 0.018 | | | | (0.260 | ) | | | 0.051 | | | | 0.306 | | | | (0.182 | ) | | | 0.373 | | |
| Total income from operations | | $ | 0.162 | | | $ | 0.030 | | | $ | 0.353 | | | $ | 0.649 | | | $ | 0.194 | | | $ | 0.784 | | |
| Less distributions | |
| From net investment income | | $ | (0.142 | ) | | $ | (0.280 | ) | | $ | (0.293 | ) | | $ | (0.349 | ) | | $ | (0.384 | ) | | $ | (0.384 | ) | |
| Total distributions | | $ | (0.142 | ) | | $ | (0.280 | ) | | $ | (0.293 | ) | | $ | (0.349 | ) | | $ | (0.384 | ) | | $ | (0.384 | ) | |
| Net asset value - End of period | | $ | 10.120 | | | $ | 10.100 | | | $ | 10.350 | | | $ | 10.290 | | | $ | 9.990 | | | $ | 10.180 | | |
| Total Return(3) | | | 1.61 | % | | | 0.30 | % | | | 3.45 | % | | | 6.63 | % | | | 1.92 | % | | | 8.19 | % | |
| Ratios/Supplemental Data | |
| Net assets, end of period (000's omitted) | | $ | 8,198 | | | $ | 8,851 | | | $ | 10,211 | | | $ | 8,099 | | | $ | 3,152 | | | $ | 2,476 | | |
| Ratios (As a percentage of average daily net assets): | |
| Expenses(4) | | | 1.63 | %(5) | | | 1.62 | % | | | 1.59 | % | | | 1.65 | % | | | 1.71 | % | | | 1.73 | % | |
| Expenses after custodian fee reduction(4) | | | 1.61 | %(5) | | | 1.61 | % | | | 1.59 | % | | | 1.64 | % | | | 1.69 | % | | | 1.71 | % | |
| Net investment income | | | 2.83 | %(5) | | | 2.84 | % | | | 2.91 | % | | | 3.35 | % | | | 3.70 | % | | | 3.97 | % | |
| Portfolio Turnover of the Portfolio(6) | | | - | | | | 11 | % | | | 11 | % | | | 25 | % | | | 17 | % | | | 11 | % | |
| Portfolio Turnover of the Fund | | | 14 | % | | | 14 | % | | | - | | | | - | | | | - | | | | - | | |
(1) Net investment income per share was computed using average shares outstanding.
(2) The Fund, through its investment in the Portfolio, has adopted the provisions of the revised AICPA Audit and Accounting Guide for Investment Companies and began using the interest method to amortize premiums on fixed-income securities. The effect of this change for the year ended March 31, 2002 was to increase net investment income per share by $0.001, increase net realized and unrealized losses per share by $0.001 and increase the ratio of net investment income to average net assets from 3.69% to 3.70%. Per-share data and ratios for the periods prior to April 1, 2001 have not been restated to reflect this change in presentation.
(3) Returns are historical and are calculated by determining the percentage change in net asset value with all distributions reinvested. Total return is not computed on an annualized basis.
(4) Includes the Fund's share of its corresponding Portfolio's allocated expenses while the Fund was making investments directly into the Portfolio.
(5) Annualized.
(6) Portfolio turnover represents the rate of portfolio activity for the period while the Fund was making investments directly into the Portfolio.
See notes to financial statements
58
Eaton Vance Limited Maturity Municipals Funds as of September 30, 2005
FINANCIAL STATEMENTS CONT'D
Financial Highlights
| | | New York Limited Fund - Class A | |
| | | Six Months Ended
September 30, 2005 | | Year Ended March 31, | |
| | | (Unaudited)(1) | | 2005(1) | | 2004(1) | | 2003(1) | | 2002(1)(2) | | 2001 | |
| Net asset value - Beginning of period | | $ | 10.540 | | | $ | 10.850 | | | $ | 10.770 | | | $ | 10.360 | | | $ | 10.550 | | | $ | 10.030 | | |
| Income (loss) from operations | | | |
| Net investment income | | $ | 0.192 | | | $ | 0.394 | | | $ | 0.400 | | | $ | 0.430 | | | $ | 0.460 | | | $ | 0.470 | | |
| Net realized and unrealized gain (loss) | | | 0.023 | | | | (0.315 | ) | | | 0.081 | | | | 0.415 | | | | (0.180 | ) | | | 0.519 | | |
| Total income from operations | | $ | 0.215 | | | $ | 0.079 | | | $ | 0.481 | | | $ | 0.845 | | | $ | 0.280 | | | $ | 0.989 | | |
| Less distributions | | | |
| From net investment income | | $ | (0.195 | ) | | $ | (0.389 | ) | | $ | (0.401 | ) | | $ | (0.435 | ) | | $ | (0.470 | ) | | $ | (0.469 | ) | |
| Total distributions | | $ | (0.195 | ) | | $ | (0.389 | ) | | $ | (0.401 | ) | | $ | (0.435 | ) | | $ | (0.470 | ) | | $ | (0.469 | ) | |
| Net asset value - End of period | | $ | 10.560 | | | $ | 10.540 | | | $ | 10.850 | | | $ | 10.770 | | | $ | 10.360 | | | $ | 10.550 | | |
| Total Return(3) | | | 2.05 | % | | | 0.73 | % | | | 4.51 | % | | | 8.32 | % | | | 2.67 | % | | | 10.11 | % | |
| Ratios/Supplemental Data | | | |
| Net assets, end of period (000's omitted) | | $ | 67,975 | | | $ | 62,843 | | | $ | 67,711 | | | $ | 60,721 | | | $ | 44,811 | | | $ | 43,835 | | |
| Ratios (As a percentage of average daily net assets): | |
| Expenses(4) | | | 0.81 | %(5) | | | 0.80 | % | | | 0.79 | % | | | 0.83 | % | | | 0.92 | % | | | 0.94 | % | |
| Expenses after custodian fee reduction(4) | | | 0.81 | %(5) | | | 0.80 | % | | | 0.79 | % | | | 0.81 | % | | | 0.89 | % | | | 0.92 | % | |
| Net investment income | | | 3.59 | %(5) | | | 3.69 | % | | | 3.69 | % | | | 4.03 | % | | | 4.37 | % | | | 4.59 | % | |
| Portfolio Turnover of the Portfolio(6) | | | - | | | | 7 | % | | | 20 | % | | | 18 | % | | | 11 | % | | | 10 | % | |
| Portfolio Turnover of the Fund | | | 7 | % | | | 12 | % | | | - | | | | - | | | | - | | | | - | | |
(1) Net investment income per share was computed using average shares outstanding.
(2) The Fund, through its investment in the Portfolio, has adopted the provisions of the revised AICPA Audit and Accounting Guide for Investment Companies and began using the interest method to amortize premiums on fixed-income securities. The effect of this change for the year ended March 31, 2002 was to increase net investment income per share by $0.001, increase net realized and unrealized losses per share by $0.001 and increase the ratio of net investment income to average net assets from 4.36% to 4.37%. Per-share data and ratios for the periods prior to April 1, 2001 have not been restated to reflect this change in presentation.
(3) Returns are historical and are calculated by determining the percentage change in net asset value with all distributions reinvested. Total return is not computed on an annualized basis.
(4) Includes the Fund's share of its corresponding Portfolio's allocated expenses while the Fund was making investments directly into the Portfolio.
(5) Annualized.
(6) Portfolio turnover represents the rate of portfolio activity for the period while the Fund was making investments directly into the Portfolio.
See notes to financial statements
59
Eaton Vance Limited Maturity Municipals Funds as of September 30, 2005
FINANCIAL STATEMENTS CONT'D
Financial Highlights
| | | New York Limited Fund - Class B | |
| | | Six Months Ended
September 30, 2005 | | Year Ended March 31, | |
| | | (Unaudited)(1) | | 2005(1) | | 2004(1) | | 2003(1) | | 2002(1)(2) | | 2001 | |
| Net asset value - Beginning of period | | $ | 10.530 | | | $ | 10.840 | | | $ | 10.760 | | | $ | 10.340 | | | $ | 10.550 | | | $ | 10.030 | | |
| Income (loss) from operations | |
| Net investment income | | $ | 0.152 | | | $ | 0.314 | | | $ | 0.318 | | | $ | 0.346 | | | $ | 0.378 | | | $ | 0.397 | | |
| Net realized and unrealized gain (loss) | | | 0.032 | | | | (0.317 | ) | | | 0.081 | | | | 0.428 | | | | (0.198 | ) | | | 0.512 | | |
| Total income (loss) from operations | | $ | 0.184 | | | $ | (0.003 | ) | | $ | 0.399 | | | $ | 0.774 | | | $ | 0.180 | | | $ | 0.909 | | |
| Less distributions | |
| From net investment income | | $ | (0.154 | ) | | $ | (0.307 | ) | | $ | (0.319 | ) | | $ | (0.354 | ) | | $ | (0.390 | ) | | $ | (0.389 | ) | |
| Total distributions | | $ | (0.154 | ) | | $ | (0.307 | ) | | $ | (0.319 | ) | | $ | (0.354 | ) | | $ | (0.390 | ) | | $ | (0.389 | ) | |
| Net asset value - End of period | | $ | 10.560 | | | $ | 10.530 | | | $ | 10.840 | | | $ | 10.760 | | | $ | 10.340 | | | $ | 10.550 | | |
| Total Return(3) | | | 1.76 | % | | | (0.03 | )% | | | 3.73 | % | | | 7.61 | % | | | 1.70 | % | | | 9.26 | % | |
| Ratios/Supplemental Data | |
| Net assets, end of period (000's omitted) | | $ | 11,598 | | | $ | 12,518 | | | $ | 15,389 | | | $ | 14,227 | | | $ | 4,822 | | | $ | 4,227 | | |
| Ratios (As a percentage of average daily net assets): | |
| Expenses(4) | | | 1.56 | %(5) | | | 1.55 | % | | | 1.54 | % | | | 1.58 | % | | | 1.67 | % | | | 1.69 | % | |
| Expenses after custodian fee reduction(4) | | | 1.56 | %(5) | | | 1.55 | % | | | 1.54 | % | | | 1.56 | % | | | 1.64 | % | | | 1.67 | % | |
| Net investment income | | | 2.85 | %(5) | | | 2.94 | % | | | 2.93 | % | | | 3.24 | % | | | 3.59 | % | | | 3.83 | % | |
| Portfolio Turnover of the Portfolio(6) | | | - | | | | 7 | % | | | 20 | % | | | 18 | % | | | 11 | % | | | 10 | % | |
| Portfolio Turnover of the Fund | | | 7 | % | | | 12 | % | | | - | | | | - | | | | - | | | | - | | |
(1) Net investment income per share was computed using average shares outstanding.
(2) The Fund, through its investment in the Portfolio, has adopted the provisions of the revised AICPA Audit and Accounting Guide for Investment Companies and began using the interest method to amortize premiums on fixed-income securities. The effect of this change for the year ended March 31, 2002 was to increase net investment income per share by $0.001, increase net realized and unrealized losses per share by $0.001 and increase the ratio of net investment income to average net assets from 3.58% to 3.59%. Per-share data and ratios for the periods prior to April 1, 2001 have not been restated to reflect this change in presentation.
(3) Returns are historical and are calculated by determining the percentage change in net asset value with all distributions reinvested. Total return is not computed on an annualized basis.
(4) Includes the Fund's share of its corresponding Portfolio's allocated expenses while the Fund was making investments directly into the Portfolio.
(5) Annualized.
(6) Portfolio turnover represents the rate of portfolio activity for the period while the Fund was making investments directly into the Portfolio.
See notes to financial statements
60
Eaton Vance Limited Maturity Municipals Funds as of September 30, 2005
FINANCIAL STATEMENTS CONT'D
Financial Highlights
| | | New York Limited Fund - Class C | |
| | | Six Months Ended
September 30, 2005 | | Year Ended March 31, | |
| | | (Unaudited)(1) | | 2005(1) | | 2004(1) | | 2003(1) | | 2002(1)(2) | | 2001 | |
| Net asset value - Beginning of period | | $ | 10.020 | | | $ | 10.310 | | | $ | 10.230 | | | $ | 9.840 | | | $ | 10.010 | | | $ | 9.510 | | |
| Income (loss) from operations | |
| Net investment income | | $ | 0.145 | | | $ | 0.299 | | | $ | 0.301 | | | $ | 0.324 | | | $ | 0.356 | | | $ | 0.369 | | |
| Net realized and unrealized gain (loss) | | | 0.021 | | | | (0.299 | ) | | | 0.081 | | | | 0.401 | | | | (0.163 | ) | | | 0.493 | | |
| Total income from operations | | $ | 0.166 | | | $ | - | | | $ | 0.382 | | | $ | 0.725 | | | $ | 0.193 | | | $ | 0.862 | | |
| Less distributions | |
| From net investment income | | $ | (0.146 | ) | | $ | (0.290 | ) | | $ | (0.302 | ) | | $ | (0.335 | ) | | $ | (0.363 | ) | | $ | (0.362 | ) | |
| Total distributions | | $ | (0.146 | ) | | $ | (0.290 | ) | | $ | (0.302 | ) | | $ | (0.335 | ) | | $ | (0.363 | ) | | $ | (0.362 | ) | |
| Net asset value - End of period | | $ | 10.040 | | | $ | 10.020 | | | $ | 10.310 | | | $ | 10.230 | | | $ | 9.840 | | | $ | 10.010 | | |
| Total Return(3) | | | 1.66 | % | | | (0.07 | )%(4) | | | 3.76 | % | | | 7.49 | % | | | 1.92 | % | | | 9.26 | % | |
| Ratios/Supplemental Data | |
| Net assets, end of period (000's omitted) | | $ | 31,803 | | | $ | 36,837 | | | $ | 42,627 | | | $ | 27,781 | | | $ | 7,408 | | | $ | 2,547 | | |
| Ratios (As a percentage of average daily net assets): | |
| Expenses(5) | | | 1.56 | %(6) | | | 1.55 | % | | | 1.54 | % | | | 1.58 | % | | | 1.67 | % | | | 1.68 | % | |
| Expenses after custodian fee reduction(5) | | | 1.56 | %(6) | | | 1.55 | % | | | 1.54 | % | | | 1.56 | % | | | 1.64 | % | | | 1.66 | % | |
| Net investment income | | | 2.86 | %(6) | | | 2.94 | % | | | 2.92 | % | | | 3.19 | % | | | 3.57 | % | | | 3.83 | % | |
| Portfolio Turnover of the Portfolio(7) | | | - | | | | 7 | % | | | 20 | % | | | 18 | % | | | 11 | % | | | 10 | % | |
| Portfolio Turnover of the Fund | | | 7 | % | | | 12 | % | | | - | | | | - | | | | - | | | | - | | |
(1) Net investment income per share was computed using average shares outstanding.
(2) The Fund, through its investment in the Portfolio, has adopted the provisions of the revised AICPA Audit and Accounting Guide for Investment Companies and began using the interest method to amortize premiums on fixed-income securities. The effect of this change for the year ended March 31, 2002 was to increase net investment income per share by $0.001, increase net realized and unrealized losses per share by $0.001 and increase the ratio of net investment income to average net assets from 3.56% to 3.57%. Per-share data and ratios for the periods prior to April 1, 2001 have not been restated to reflect this change in presentation.
(3) Returns are historical and are calculated by determining the percentage change in net asset value with all distributions reinvested. Total return is not computed on an annualized basis.
(4) Total returns reflects a decrease of 0.06% due to a change in the timing of the payment and reinvestment of distributions.
(5) Includes the Fund's share of its corresponding Portfolio's allocated expenses while the Fund was making investments directly into the Portfolio.
(6) Annualized.
(7) Portfolio turnover represents the rate of portfolio activity for the period while the Fund was making investments directly into the Portfolio.
See notes to financial statements
61
Eaton Vance Limited Maturity Municipals Funds as of September 30, 2005
FINANCIAL STATEMENTS CONT'D
Financial Highlights
| | | Ohio Limited Fund - Class A | |
| | | Six Months Ended
September 30, 2005 | | Year Ended March 31, | |
| | | (Unaudited)(1) | | 2005(1) | | 2004(1) | | 2003(1) | | 2002(1)(2) | | 2001(1) | |
| Net asset value - Beginning of period | | $ | 9.740 | | | $ | 10.020 | | | $ | 10.010 | | | $ | 9.590 | | | $ | 9.760 | | | $ | 9.430 | | |
| Income (loss) from operations | |
| Net investment income | | $ | 0.171 | | | $ | 0.363 | | | $ | 0.361 | | | $ | 0.392 | | | $ | 0.394 | | | $ | 0.431 | | |
| Net realized and unrealized gain (loss) | | | 0.023 | | | | (0.293 | ) | | | 0.014 | | | | 0.410 | | | | (0.142 | ) | | | 0.343 | | |
| Total income from operations | | $ | 0.194 | | | $ | 0.070 | | | $ | 0.375 | | | $ | 0.802 | | | $ | 0.252 | | | $ | 0.774 | | |
| Less distributions | |
| From net investment income | | $ | (0.184 | ) | | $ | (0.350 | ) | | $ | (0.365 | ) | | $ | (0.382 | ) | | $ | (0.422 | ) | | $ | (0.444 | ) | |
| Total distributions | | $ | (0.184 | ) | | $ | (0.350 | ) | | $ | (0.365 | ) | | $ | (0.382 | ) | | $ | (0.422 | ) | | $ | (0.444 | ) | |
| Net asset value - End of period | | $ | 9.750 | | | $ | 9.740 | | | $ | 10.020 | | | $ | 10.010 | | | $ | 9.590 | | | $ | 9.760 | | |
| Total Return(3) | | | 2.00 | % | | | 0.70 | % | | | 3.80 | % | | | 8.52 | % | | | 2.62 | % | | | 8.42 | % | |
| Ratios/Supplemental Data | |
| Net assets, end of period (000's omitted) | | $ | 17,372 | | | $ | 16,783 | | | $ | 20,404 | | | $ | 18,313 | | | $ | 16,310 | | | $ | 15,046 | | |
| Ratios (As a percentage of average daily net assets): | |
| Expenses(4) | | | 1.05 | %(5) | | | 1.05 | % | | | 0.99 | % | | | 1.03 | % | | | 1.14 | % | | | 1.18 | % | |
| Expenses after custodian fee reduction(4) | | | 1.03 | %(5) | | | 1.04 | % | | | 0.99 | % | | | 1.02 | % | | | 1.11 | % | | | 1.14 | % | |
| Net investment income | | | 3.48 | %(5) | | | 3.68 | % | | | 3.61 | % | | | 3.96 | % | | | 4.05 | % | | | 4.53 | % | |
| Portfolio Turnover of the Portfolio(6) | | | - | | | | 6 | % | | | 28 | % | | | 12 | % | | | 19 | % | | | 17 | % | |
| Portfolio Turnover of the Fund | | | 12 | % | | | 7 | % | | | - | | | | - | | | | - | | | | - | | |
(1) Net investment income per share was computed using average shares outstanding.
(2) The Fund, through its investment in the Portfolio, has adopted the provisions of the revised AICPA Audit and Accounting Guide for Investment Companies and began using the interest method to amortize premiums on fixed-income securities. The effect of this change for the year ended March 31, 2002 was to increase net investment income per share by less than $0.001, increase net realized and unrealized losses per share by less than $0.001 and increase the ratio net investment income to average net assets by less than 0.01%. Per share data and ratios for the periods prior to April 1, 2001 have not been restated to reflect this change in presentation.
(3) Returns are historical and are calculated by determining the percentage change in net asset value with all distributions reinvested. Total return is not computed on an annualized basis.
(4) Includes the Fund's share of its corresponding Portfolio's allocated expenses while the Fund was making investments directly into the Portfolio.
(5) Annualized.
(6) Portfolio turnover represents the rate of portfolio activity for the period while the Fund was making investments directly into the Portfolio.
See notes to financial statements
62
Eaton Vance Limited Maturity Municipals Funds as of September 30, 2005
FINANCIAL STATEMENTS CONT'D
Financial Highlights
| | | Ohio Limited Fund - Class B | |
| | | Six Months Ended
September 30, 2005 | | Year Ended March 31, | |
| | | (Unaudited)(1) | | 2005(1) | | 2004(1) | | 2003(1) | | 2002(1)(2) | | 2001(1) | |
| Net asset value - Beginning of period | | $ | 9.730 | | | $ | 10.010 | | | $ | 10.000 | | | $ | 9.590 | | | $ | 9.760 | | | $ | 9.430 | | |
| Income (loss) from operations | |
| Net investment income | | $ | 0.135 | | | $ | 0.289 | | | $ | 0.286 | | | $ | 0.314 | | | $ | 0.321 | | | $ | 0.361 | | |
| Net realized and unrealized gain (loss) | | | 0.012 | | | | (0.294 | ) | | | 0.017 | | | | 0.407 | | | | (0.139 | ) | | | 0.343 | | |
| Total income (loss) from operations | | $ | 0.147 | | | $ | (0.005 | ) | | $ | 0.303 | | | $ | 0.721 | | | $ | 0.182 | | | $ | 0.704 | | |
| Less distributions | |
| From net investment income | | $ | (0.147 | ) | | $ | (0.275 | ) | | $ | (0.293 | ) | | $ | (0.311 | ) | | $ | (0.352 | ) | | $ | (0.374 | ) | |
| Total distributions | | $ | (0.147 | ) | | $ | (0.275 | ) | | $ | (0.293 | ) | | $ | (0.311 | ) | | $ | (0.352 | ) | | $ | (0.374 | ) | |
| Net asset value - End of period | | $ | 9.730 | | | $ | 9.730 | | | $ | 10.010 | | | $ | 10.000 | | | $ | 9.590 | | | $ | 9.760 | | |
| Total Return(3) | | | 1.51 | % | | | (0.05 | )% | | | 3.06 | % | | | 7.64 | % | | | 1.89 | % | | | 7.63 | % | |
| Ratios/Supplemental Data | |
| Net assets, end of period (000's omitted) | | $ | 1,921 | | | $ | 2,159 | | | $ | 2,623 | | | $ | 2,768 | | | $ | 1,390 | | | $ | 1,519 | | |
| Ratios (As a percentage of average daily net assets): | |
| Expenses(4) | | | 1.80 | %(5) | | | 1.80 | % | | | 1.74 | % | | | 1.78 | % | | | 1.89 | % | | | 1.93 | % | |
| Expenses after custodian fee reduction(4) | | | 1.78 | %(5) | | | 1.79 | % | | | 1.74 | % | | | 1.77 | % | | | 1.86 | % | | | 1.89 | % | |
| Net investment income | | | 2.75 | %(5) | | | 2.94 | % | | | 2.86 | % | | | 3.17 | % | | | 3.30 | % | | | 3.79 | % | |
| Portfolio Turnover of the Portfolio(6) | | | - | | | | 6 | % | | | 28 | % | | | 12 | % | | | 19 | % | | | 17 | % | |
| Portfolio Turnover of the Fund | | | 12 | % | | | 7 | % | | | - | | | | - | | | | - | | | | - | | |
(1) Net investment income per share was computed using average shares outstanding.
(2) The Fund, through its investment in the Portfolio, has adopted the provisions of the revised AICPA Audit and Accounting Guide for Investment Companies and began using the interest method to amortize premiums on fixed-income securities. The effect of this change for the year ended March 31, 2002 was to increase net investment income per share by less than $0.001, increase net realized and unrealized losses per share by less than $0.001 and increase the ratio net investment income to average net assets by less than 0.01%. Per share data and ratios for the periods prior to April 1, 2001 have not been restated to reflect this change in presentation.
(3) Returns are historical and are calculated by determining the percentage change in net asset value with all distributions reinvested. Total return is not computed on an annualized basis.
(4) Includes the Fund's share of its corresponding Portfolio's allocated expenses while the Fund was making investments directly into the Portfolio.
(5) Annualized.
(6) Portfolio turnover represents the rate of portfolio activity for the period while the Fund was making investments directly into the Portfolio.
See notes to financial statements
63
Eaton Vance Limited Maturity Municipals Funds as of September 30, 2005
FINANCIAL STATEMENTS CONT'D
Financial Highlights
| | | Pennsylvania Limited Fund - Class A | |
| | | Six Months Ended
September 30, 2005 | | Year Ended March 31, | |
| | | (Unaudited)(1) | | 2005(1) | | 2004(1) | | 2003(1) | | 2002(1)(2) | | 2001(1) | |
| Net asset value - Beginning of period | | $ | 10.280 | | | $ | 10.550 | | | $ | 10.470 | | | $ | 10.130 | | | $ | 10.270 | | | $ | 9.870 | | |
| Income (loss) from operations | | | |
| Net investment income | | $ | 0.197 | | | $ | 0.402 | | | $ | 0.406 | | | $ | 0.440 | | | $ | 0.453 | | | $ | 0.472 | | |
| Net realized and unrealized gain (loss) | | | 0.044 | | | | (0.272 | ) | | | 0.084 | | | | 0.349 | | | | (0.130 | ) | | | 0.388 | | |
| Total income from operations | | $ | 0.241 | | | $ | 0.130 | | | $ | 0.490 | | | $ | 0.789 | | | $ | 0.323 | | | $ | 0.860 | | |
| Less distributions | | | |
| From net investment income | | $ | (0.201 | ) | | $ | (0.400 | ) | | $ | (0.410 | ) | | $ | (0.449 | ) | | $ | (0.463 | ) | | $ | (0.460 | ) | |
| Total distributions | | $ | (0.201 | ) | | $ | (0.400 | ) | | $ | (0.410 | ) | | $ | (0.449 | ) | | $ | (0.463 | ) | | $ | (0.460 | ) | |
| Net asset value - End of period | | $ | 10.320 | | | $ | 10.280 | | | $ | 10.550 | | | $ | 10.470 | | | $ | 10.130 | | | $ | 10.270 | | |
| Total Return(3) | | | 2.36 | % | | | 1.25 | % | | | 4.72 | % | | | 7.97 | % | | | 3.18 | % | | | 8.94 | % | |
| Ratios/Supplemental Data | | | |
| Net assets, end of period (000's omitted) | | $ | 35,506 | | | $ | 33,611 | | | $ | 35,175 | | | $ | 33,580 | | | $ | 29,845 | | | $ | 28,840 | | |
| Ratios (As a percentage of average daily net assets): | |
| Expenses(4) | | | 0.88 | %(5) | | | 0.88 | % | | | 0.85 | % | | | 0.89 | % | | | 0.97 | % | | | 0.99 | % | |
| Expenses after custodian fee reduction(4) | | | 0.87 | %(5) | | | 0.87 | % | | | 0.85 | % | | | 0.87 | % | | | 0.92 | % | | | 0.96 | % | |
| Net investment income | | | 3.80 | %(5) | | | 3.86 | % | | | 3.85 | % | | | 4.24 | % | | | 4.41 | % | | | 4.72 | % | |
| Portfolio Turnover of the Portfolio(6) | | | - | | | | 0 | % | | | 8 | % | | | 3 | % | | | 20 | % | | | 6 | % | |
| Portfolio Turnover of the Fund | | | 11 | % | | | 6 | % | | | - | | | | - | | | | - | | | | - | | |
(1) Net investment income per share was computed using average shares outstanding.
(2) The Fund, through its investment in the Portfolio, has adopted the provisions of the revised AICPA Audit and Accounting Guide for Investment Companies and began using the interest method to amortize premiums on fixed-income securities. The effect of this change for the year ended March 31, 2002 was to increase net investment income per share by $0.001, increase net realized and unrealized losses per share by $0.001 and increase the ratio of net investment income to average net assets from 4.40% to 4.41%. Per-share data and ratios for the periods prior to April 1, 2001 have not been restated to reflect this change in presentation.
(3) Returns are historical and are calculated by determining the percentage change in net asset value with all distributions reinvested. Total return is not computed on an annualized basis.
(4) Includes the Fund's share of its corresponding Portfolio's allocated expenses while the Fund was making investments directly into the Portfolio.
(5) Annualized.
(6) Portfolio turnover represents the rate of portfolio activity for the period while the Fund was making investments directly into the Portfolio.
See notes to financial statements
64
Eaton Vance Limited Maturity Municipals Funds as of September 30, 2005
FINANCIAL STATEMENTS CONT'D
Financial Highlights
| | | Pennsylvania Limited Fund - Class B | |
| | | Six Months Ended
September 30, 2005 | | Year Ended March 31, | |
| | | (Unaudited)(1) | | 2005(1) | | 2004(1) | | 2003(1) | | 2002(1)(2) | | 2001(1) | |
| Net asset value - Beginning of period | | $ | 10.280 | | | $ | 10.550 | | | $ | 10.460 | | | $ | 10.120 | | | $ | 10.270 | | | $ | 9.870 | | |
| Income (loss) from operations | |
| Net investment income | | $ | 0.159 | | | $ | 0.323 | | | $ | 0.327 | | | $ | 0.355 | | | $ | 0.372 | | | $ | 0.397 | | |
| Net realized and unrealized gain (loss) | | | 0.041 | | | | (0.273 | ) | | | 0.093 | | | | 0.354 | | | | (0.138 | ) | | | 0.384 | | |
| Total income from operations | | $ | 0.200 | | | $ | 0.050 | | | $ | 0.420 | | | $ | 0.709 | | | $ | 0.234 | | | $ | 0.781 | | |
| Less distributions | |
| From net investment income | | $ | (0.160 | ) | | $ | (0.320 | ) | | $ | (0.330 | ) | | $ | (0.369 | ) | | $ | (0.384 | ) | | $ | (0.381 | ) | |
| Total distributions | | $ | (0.160 | ) | | $ | (0.320 | ) | | $ | (0.330 | ) | | $ | (0.369 | ) | | $ | (0.384 | ) | | $ | (0.381 | ) | |
| Net asset value - End of period | | $ | 10.320 | | | $ | 10.280 | | | $ | 10.550 | | | $ | 10.460 | | | $ | 10.120 | | | $ | 10.270 | | |
| Total Return(3) | | | 1.96 | % | | | 0.48 | % | | | 4.04 | % | | | 7.14 | % | | | 2.28 | % | | | 8.08 | % | |
| Ratios/Supplemental Data | |
| Net assets, end of period (000's omitted) | | $ | 7,723 | | | $ | 8,957 | | | $ | 10,273 | | | $ | 9,313 | | | $ | 2,643 | | | $ | 2,286 | | |
| Ratios (As a percentage of average daily net assets): | |
| Expenses(4) | | | 1.63 | %(5) | | | 1.63 | % | | | 1.60 | % | | | 1.64 | % | | | 1.72 | % | | | 1.74 | % | |
| Expenses after custodian fee reduction(4) | | | 1.62 | %(5) | | | 1.62 | % | | | 1.60 | % | | | 1.62 | % | | | 1.67 | % | | | 1.71 | % | |
| Net investment income | | | 3.05 | %(5) | | | 3.11 | % | | | 3.10 | % | | | 3.42 | % | | | 3.63 | % | | | 3.96 | % | |
| Portfolio Turnover of the Portfolio(6) | | | - | | | | 0 | % | | | 8 | % | | | 3 | % | | | 20 | % | | | 6 | % | |
| Portfolio Turnover of the Fund | | | 11 | % | | | 6 | % | | | - | | | | - | | | | - | | | | - | | |
(1) Net investment income per share was computed using average shares outstanding.
(2) The Fund, through its investment in the Portfolio, has adopted the provisions of the revised AICPA Audit and Accounting Guide for Investment Companies and began using the interest method to amortize premiums on fixed-income securities. The effect of this change for the year ended March 31, 2002 was to increase net investment income per share by $0.001, increase net realized and unrealized losses per share by $0.001 and increase the ratio of net investment income to average net assets from 3.62% to 3.63%. Per-share data and ratios for the periods prior to April 1, 2001 have not been restated to reflect this change in presentation.
(3) Returns are historical and are calculated by determining the percentage change in net asset value with all distributions reinvested. Total return is not computed on an annualized basis.
(4) Includes the Fund's share of its corresponding Portfolio's allocated expenses while the Fund was making investments directly into the Portfolio.
(5) Annualized.
(6) Portfolio turnover represents the rate of portfolio activity for the period while the Fund was making investments directly into the Portfolio.
See notes to financial statements
65
Eaton Vance Limited Maturity Municipals Funds as of September 30, 2005
FINANCIAL STATEMENTS CONT'D
Financial Highlights
| | | Pennsylvania Limited Fund - Class C | |
| | | Six Months Ended
September 30, 2005 | | Year Ended March 31, | |
| | | (Unaudited)(1) | | 2005(1) | | 2004(1) | | 2003(1) | | 2002(1)(2) | | 2001(1) | |
| Net asset value - Beginning of period | | $ | 9.750 | | | $ | 10.000 | | | $ | 9.910 | | | $ | 9.590 | | | $ | 9.720 | | | $ | 9.340 | | |
| Income (loss) from operations | |
| Net investment income | | $ | 0.150 | | | $ | 0.307 | | | $ | 0.308 | | | $ | 0.339 | | | $ | 0.354 | | | $ | 0.376 | | |
| Net realized and unrealized gain (loss) | | | 0.032 | | | | (0.257 | ) | | | 0.091 | | | | 0.330 | | | | (0.121 | ) | | | 0.363 | | |
| Total income from operations | | $ | 0.182 | | | $ | 0.050 | | | $ | 0.399 | | | $ | 0.669 | | | $ | 0.233 | | | $ | 0.739 | | |
| Less distributions | |
| From net investment income | | $ | (0.152 | ) | | $ | (0.300 | ) | | $ | (0.309 | ) | | $ | (0.349 | ) | | $ | (0.363 | ) | | $ | (0.359 | ) | |
| Total distributions | | $ | (0.152 | ) | | $ | (0.300 | ) | | $ | (0.309 | ) | | $ | (0.349 | ) | | $ | (0.363 | ) | | $ | (0.359 | ) | |
| Net asset value - End of period | | $ | 9.780 | | | $ | 9.750 | | | $ | 10.000 | | | $ | 9.910 | | | $ | 9.590 | | | $ | 9.720 | | |
| Total Return(3) | | | 1.87 | % | | | 0.44 | %(4) | | | 4.06 | % | | | 7.11 | % | | | 2.40 | % | | | 8.08 | % | |
| Ratios/Supplemental Data | |
| Net assets, end of period (000's omitted) | | $ | 16,820 | | | $ | 16,670 | | | $ | 21,398 | | | $ | 15,188 | | | $ | 7,262 | | | $ | 4,413 | | |
| Ratios (As a percentage of average daily net assets): | |
| Expenses(5) | | | 1.63 | %(6) | | | 1.63 | % | | | 1.60 | % | | | 1.64 | % | | | 1.72 | % | | | 1.73 | % | |
| Expenses after custodian fee reduction(5) | | | 1.62 | %(6) | | | 1.62 | % | | | 1.60 | % | | | 1.62 | % | | | 1.67 | % | | | 1.70 | % | |
| Net investment income | | | 3.05 | %(6) | | | 3.12 | % | | | 3.08 | % | | | 3.44 | % | | | 3.64 | % | | | 3.96 | % | |
| Portfolio Turnover of the Portfolio(7) | | | - | | | | 0 | % | | | 8 | % | | | 3 | % | | | 20 | % | | | 6 | % | |
| Portfolio Turnover of the Fund | | | 11 | % | | | 6 | % | | | - | | | | - | | | | - | | | | - | | |
(1) Net investment income per share was computed using average shares outstanding.
(2) The Fund, through its investment in the Portfolio, has adopted the provisions of the revised AICPA Audit and Accounting Guide for Investment Companies and began using the interest method to amortize premiums on fixed-income securities. The effect of this change for the year ended March 31, 2002 was to increase net investment income per share by $0.001, increase net realized and unrealized losses per share by $0.001 and increase the ratio of net investment income to average net assets from 3.63% to 3.64%. Per-share data and ratios for the periods prior to April 1, 2001 have not been restated to reflect this change in presentation.
(3) Returns are historical and are calculated by determining the percentage change in net asset value with all distributions reinvested. Total return is not computed on an annualized basis.
(4) Total return reflects a decrease of 0.6% due to a change in the timing of the payment and reinvestment of distributions.
(5) Includes the Fund's share of its corresponding Portfolio's allocated expenses while the Fund was making investments directly into the Portfolio.
(6) Annualized.
(7) Portfolio turnover represents the rate of portfolio activity for the period while the Fund was making investments directly into the Portfolio.
See notes to financial statements
66
Eaton Vance Limited Maturity Municipals Funds as of September 30, 2005
NOTES TO FINANCIAL STATEMENTS (Unaudited)
1 Significant Accounting Policies
Eaton Vance Investment Trust (the Trust) is an entity of the type commonly known as a Massachusetts business trust and is registered under the Investment Company Act of 1940, as amended, as an open-end management investment company. The Trust presently consists of eight Funds, each non-diversified, seven of which are included in these financial statements. They include Eaton Vance California Limited Maturity Municipals Fund (California Limited Fund), Eaton Vance Florida Limited Maturity Municipals Fund (Florida Limited Fund), Eaton Vance Massachusetts Limited Maturity Municipals Fund (Massachusetts Limited Fund), Eaton Vance New Jersey Limited Maturity Municipals Fund (New Jersey Limited Fund), Eaton Vance New York Limited Maturity Municipals Fund (New York Limited Fund), Eaton Vance Ohio Limited Maturity Municipals Fund (Ohio Limited Fund) and Eaton Vance Pennsylvania Limited Maturity Municipal s Fund (Pennsylvania Limited Fund), collectively the "Funds" or individually the "Fund." The Funds seek to achieve current income exempt from regular federal income tax and particular state or local income or other taxes by investing primarily in investment grade municipal obligations. The Funds may offer three classes of shares: Class A, Class B and Class C. Class A shares are generally sold subject to a sales charge imposed at time of purchase. Class B and Class C shares are sold at net asset value and are subject to a contingent deferred sales charge (see Note 6). Class B shares held longer than (i) four years or (ii) the time at which the contingent deferred sales charge applicable to such shares expires will automatically convert to Class A shares. In addition, Class B shares acquired through the reinvestment of distributions will also convert to Class A shares in proportion to shares not acquired through reinvestment. Each class represents a p ro rata interest in the Fund, but votes separately on class-specific matters and (as noted below) is subject to different expenses. Realized and unrealized gains and losses are allocated daily to each class of shares based on the relative net assets of each class to the total net assets of the Fund. Net investment income, other than class-specific expenses, is allocated daily to each class of shares based upon the ratio of the value of each class' paid shares to the total value of all paid shares. Each class of shares differs in its distribution plan and certain other class-specific expenses.
On October 8, 2004, the California Limited Fund, Florida Limited Fund, Massachusetts Limited Fund, New Jersey Limited Fund, New York Limited Fund, Ohio Limited Fund, and Pennsylvania Limited Fund received its pro rata share of cash and securities from the California Limited Maturity Municipals Portfolio (California Limited Portfolio), Florida Limited Maturity Municipals Portfolio (Florida Limited Portfolio), Massachusetts Limited Maturity Municipals Portfolio (Massachusetts Limited Portfolio), New Jersey Limited Maturity Municipals Portfolio (New Jersey Limited Portfolio), New York Limited Maturity Municipals Portfolio (New York Limited Portfolio), Ohio Limited Maturity Municipals Portfolio (Ohio Limited Portfolio) and Pennsylvania Limited Maturity Municipals Portfolio (Pennsylvania Lim ited Portfolio), respectively, in a complete liquidation of its interest in its corresponding Portfolio. Subsequent to October 8, 2004, each Fund invests directly in securities rather than through its corresponding Portfolio and maintains the same investment objectives.
The following is a summary of significant accounting policies consistently followed by the Trust in the preparation of its financial statements. The policies are in conformity with accounting principles generally accepted in the United States of America.
A Investment Valuations - Municipal bonds and taxable obligations, if any, are normally valued on the basis of valuations furnished by a pricing service. Financial futures contracts and options on financial futures contracts listed on commodity exchanges are valued at closing settlement prices. Over-the-counter options of future contracts are normally valued at the mean between the latest bid and asked prices. Interest rate swaps are normally valued on the basis of valuations furnished by a broker. Short-term obligations, maturing in sixty days or less, are valued at amortized cost, which approximates fair value. Investments for which valuations or m arket quotations are unavailable are valued at fair value using methods determined in good faith by or at the direction of the Trustees.
B Income - Interest income is determined on the basis of interest accrued, adjusted for amortization of premium or discount.
C Federal Taxes - Each Fund's policy is to comply with the provisions of the Internal Revenue Code applicable to regulated investment companies and to distribute to shareholders each year all of its taxable and tax-exempt income, including any net realized gain on investments. Accordingly, no provision for federal income or excise tax is necessary. At March 31, 2005, the following Funds, for federal income tax purposes, had capital loss carryovers, which will reduce each Fund's taxable income arising from future taxable net realized gain on investments, if any, to the extent permitted by the Internal Revenue Code, and thus will reduce the amount of the
67
Eaton Vance Limited Maturity Municipals Funds as of September 30, 2005
NOTES TO FINANCIAL STATEMENTS (Unaudited) CONT'D
distributions to shareholders which would otherwise be necessary to relieve the Funds of any liability for federal income or excise taxes. A portion of such capital loss carryovers were acquired through a Fund Reorganization and may be subject to certain limitations. The amounts and expiration dates of the capital loss carryovers are as follows:
| Fund | | Amount | | Expires | |
| California Limited Fund | | $ | 83,841 | | | March 31, 2009 | |
|
| | | | 123,502 | | | March 31, 2011 | |
|
| | | | 13,351 | | | March 31, 2012 | |
|
| | | | 384,970 | | | March 31, 2013 | |
|
| Florida Limited Fund | | | 355,608 | | | March 31, 2006 | |
|
| | | | 80,496 | | | March 31, 2009 | |
|
| | | | 200,399 | | | March 31, 2011 | |
|
| | | | 995,128 | | | March 31, 2013 | |
|
| Massachusetts Limited Fund | | | 197,971 | | | March 31, 2006 | |
|
| | | | 136,941 | | | March 31, 2009 | |
|
| | | | 35,096 | | | March 31, 2010 | |
|
| | | | 506,705 | | | March 31, 2011 | |
|
| | | | 393,962 | | | March 31, 2012 | |
|
| | | | 1,336,686 | | | March 31, 2013 | |
|
| New Jersey Limited Fund | | | 213,255 | | | March 31, 2006 | |
|
| | | | 374,246 | | | March 31, 2011 | |
|
| | | | 298,472 | | | March 31, 2012 | |
|
| | | | 728,451 | | | March 31, 2013 | |
|
| New York Limited Fund | | | 411,305 | | | March 31, 2011 | |
|
| | | | 483,774 | | | March 31, 2012 | |
|
| | | | 1,522,094 | | | March 31, 2013 | |
|
| Ohio Limited Fund | | | 36,233 | | | March 31, 2009 | |
|
| | | | 69,085 | | | March 31, 2010 | |
|
| | | | 366,442 | | | March 31, 2011 | |
|
| | | | 60,692 | | | March 31, 2012 | |
|
| | | | 358,602 | | | March 31, 2013 | |
|
| Pennsylvania Limited Fund | | | 245,499 | | | March 31, 2009 | |
|
| | | | 59,482 | | | March 31, 2010 | |
|
| | | | 400,339 | | | March 31, 2011 | |
|
| | | | 154,413 | | | March 31, 2012 | |
|
| | | | 954,523 | | | March 31, 2013 | |
|
Dividends paid by each Fund from net interest on tax-exempt municipal bonds are not includable by shareholders as gross income for federal income tax purposes because each Fund intends to meet certain requirements of the Internal Revenue Code applicable to regulated investment companies which will enable the Funds to pay exempt-interest dividends. The portion of such interest, if any, earned on private activity bonds issued after August 7, 1986, may be considered a tax preference item to shareholders.
D Financial Futures Contracts - Upon the entering of a financial futures contract, a Fund is required to deposit (initial margin) either in cash or securities an amount equal to a certain percentage of the purchase price indicated in the financial futures contract. Subsequent payments are made or received by a Fund (margin maintenance) each day, dependent on the daily fluctuations in the value of the underlying security, and are recorded for book purposes as unrealized gains or losses by a Fund. A Fund's investment in financial futures contracts is designed for both hedging against anticipated future changes in interest rates and investment purposes. Should interest rates mo ve unexpectedly, a Fund may not achieve the anticipated benefits of the financial futures contracts and may realize a loss.
E Legal Fees - Legal fees and other related expenses incurred as part of negotiations of the terms and requirements of capital infusions, or that are expected to result in the restructuring of or a plan of reorganization for an investment are recorded as realized losses. Ongoing expenditures to protect or enhance an investment are treated as operating expenses.
F Options on Financial Futures Contracts - Upon the purchase of a put option on a financial futures contract by a Fund, the premium paid is recorded as an investment, the value of which is marked-to-market daily. When a purchased option expires, a Fund will realize a loss in the amount of the cost of the option. When a Fund enters into a closing sale transaction, a Fund will realize a gain or loss depending on whether the sales proceeds from the closing sale transaction are greater or less than the cost of the option. When a Fund exercises a put option, settlement is made in cash. The risk associated with purchasing put options is limited to the premium originally paid.
G When-issued and Delayed Delivery Transactions - The Funds may engage in when-issued and delayed delivery transactions. The Funds record when-issued securities on trade date and maintain security positions such that sufficient liquid assets will be available to make payments for the securities purchased. Securities purchased on a when-issued or delayed delivery basis are marked-to-market daily and begin earning interest on settlement date.
H Interest Rate Swaps - A Fund may enter into interest rate swap agreements to enhance return, to hedge against fluctuations in securities prices or interest rates or as substitution for the purchase or sale of securities. Pursuant to these agreements, the Funds make semi-annual payments at a fixed interest rate. In exchange,
68
Eaton Vance Limited Maturity Municipals Funds as of September 30, 2005
NOTES TO FINANCIAL STATEMENTS (Unaudited) CONT'D
a Fund receives payments based on the interest rate of a benchmark industry index. During the term of the outstanding swap agreement, changes in the underlying value of the swap are recorded as unrealized gains and losses. The value of the swap is determined by changes in the relationship between two rates of interest. The Fund is exposed to credit loss in the event of non-performance by the swap counterparty. However, the Fund does not anticipate non-performance by the counterparty. Risk may also arise from the unanticipated movements in value of interest rates.
I Expenses - The majority of expenses of the Trust are directly identifiable to an individual fund. Expenses which are not readily identifiable to a specific fund are allocated taking into consideration, among other things, the nature and type of expense and the relative size of the funds.
J Expense Reduction - Investors Bank & Trust Company (IBT) serves as custodian of the Funds. Pursuant to the respective custodian agreements, IBT receives a fee reduced by credits which are determined based on the average daily cash balances the Funds maintain with IBT. All credit balances used to reduce the Funds' custodian fees are reported as a reduction of total expenses on the Statements of Operations.
K Use of Estimates - The preparation of the financial statements in conformity with accounting principles generally accepted in the United States of America requires management to make estimates and assumptions that affect the reported amounts of assets and liabilities at the date of the financial statements and the reported amounts of income and expense during the reporting period. Actual results could differ from those estimates.
L Indemnifications - Under the Trust's organizational documents, its officers and Trustees may be indemnified against certain liabilities and expenses arising out of the performance of their duties to the Funds and shareholders are indemnified against personal liability for obligations of the Trust. Additionally, in the normal course of business, the Funds enter into agreements with service providers that may contain indemnification clauses. The Funds' maximum exposure under these arrangements is unknown as this would involve future claims that may be made against the Funds that have not yet occurred.
M Other - Investment transactions are accounted for on a trade-date basis. Realized gains and losses are computed based on the specific identification of the securities sold.
N Interim Financial Statements - The interim financial statements relating to September 30, 2005 and for the six months then ended have not been audited by an Independent Registered Public Accounting Firm, but in the opinion of the Funds' management reflect all adjustments, consisting only of normal recurring adjustments, necessary for the fair presentation of the financial statements.
2 Distributions to Shareholders
The net income of each Fund is determined daily and substantially all of the net income so determined is declared as a dividend to shareholders of record at the time of declaration. Dividends are declared separately for each class of shares. Distributions are paid monthly. Distributions of allocated realized capital gains, if any, are made at least annually. Shareholders may reinvest income and capital gain distributions in additional shares of the same class of a Fund at the net asset value as of the reinvestment date. Distributions are paid in the form of additional shares of the same class or, at the election of the shareholder, in cash. The Funds distinguish between distributions on a tax basis and a financial reporting basis. Accounting principles generally accepted in the United States of America require that only distributions in excess of tax basis earnings and profits be reported in the financial statements as a return of capital. Permanent differences between book and tax accounting relating to distributions are reclassified to paid-in capital. The tax treatment of distributions for the calendar year will be reported to shareholders prior to February 1, 2006, and will be based on tax accounting methods which may differ from amounts determined for financial statement purposes.
3 Shares of Beneficial Interest
The Funds' Declaration of Trust permits the Trustees to issue an unlimited number of full and fractional shares of beneficial interest (without par value). Such shares may be issued in a number of different series (such as the Funds) and classes. Transactions in Fund shares were as follows:
| | | California Limited Fund | |
| Class A | | Six Months Ended
September 30, 2005
(Unaudited) | | Year Ended
March 31, 2005 | |
| Sales | | | 656,285 | | | | 873,266 | | |
Issued to shareholders electing to
receive payments of distributions
in Fund shares | | | 32,048 | | | | 59,380 | | |
| Redemptions | | | (527,132 | ) | | | (787,924 | ) | |
| Exchange from Class B shares | | | 24,671 | | | | 84,485 | | |
| Net increase | | | 185,872 | | | | 229,207 | | |
69
Eaton Vance Limited Maturity Municipals Funds as of September 30, 2005
NOTES TO FINANCIAL STATEMENTS (Unaudited) CONT'D
| | | California Limited Fund | |
| Class B | | Six Months Ended
September 30, 2005
(Unaudited) | | Year Ended
March 31, 2005 | |
| Sales | | | 8,895 | | | | 83,638 | | |
Issued to shareholders electing to
receive payments of distributions
in Fund shares | | | 2,158 | | | | 5,736 | | |
| Redemptions | | | (43,645 | ) | | | (185,989 | ) | |
| Exchange to Class A shares | | | (24,741 | ) | | | (84,778 | ) | |
| Net decrease | | | (57,333 | ) | | | (181,393 | ) | |
| | | California Limited Fund | |
| Class C | | Six Months Ended
September 30, 2005
(Unaudited) | | Year Ended
March 31, 2005(1) | |
| Sales | | | 3,214 | | | | 1,000 | | |
Issued to shareholders electing to
receive payments of distributions
in Fund shares | | | 15 | | | | - | | |
| Net increase | | | 3,229 | | | | 1,000 | | |
| | | Florida Limited Fund | |
| Class A | | Six Months Ended
September 30, 2005
(Unaudited) | | Year Ended
March 31, 2005 | |
| Sales | | | 149,308 | | | | 1,501,353 | | |
Issued to shareholders electing to
receive payments of distributions
in Fund shares | | | 30,833 | | | | 63,761 | | |
| Redemptions | | | (734,868 | ) | | | (1,539,509 | ) | |
| Exchange from Class B shares | | | 48,574 | | | | 55,116 | | |
| Net increase (decrease) | | | (506,153 | ) | | | 80,721 | | |
| | | Florida Limited Fund | |
| Class B | | Six Months Ended
September 30, 2005
(Unaudited) | | Year Ended
March 31, 2005 | |
| Sales | | | 8,475 | | | | 182,427 | | |
Issued to shareholders electing to
receive payments of distributions
in Fund shares | | | 6,040 | | | | 11,591 | | |
| Redemptions | | | (76,673 | ) | | | (173,029 | ) | |
| Exchange to Class A shares | | | (48,563 | ) | | | (55,127 | ) | |
| Net decrease | | | (110,721 | ) | | | (34,138 | ) | |
| | | Florida Limited Fund | |
| Class C | | Six Months Ended
September 30, 2005
(Unaudited) | | Year Ended
March 31, 2005 | |
| Sales | | | 88,398 | | | | 357,357 | | |
Issued to shareholders electing to
receive payments of distributions
in Fund shares | | | 6,995 | | | | 14,945 | | |
| Redemptions | | | (355,016 | ) | | | (502,171 | ) | |
| Net decrease | | | (259,623 | ) | | | (129,869 | ) | |
| | | Massachusetts Limited Fund | |
| Class A | | Six Months Ended
September 30, 2005
(Unaudited) | | Year Ended
March 31, 2005 | |
| Sales | | | 518,881 | | | | 746,351 | | |
Issued to shareholders electing to
receive payments of distributions
in Fund shares | | | 46,669 | | | | 94,679 | | |
| Redemptions | | | (901,924 | ) | | | (661,339 | ) | |
| Exchange from Class B shares | | | 61,811 | | | | 80,078 | | |
| Net increase (decrease) | | | (274,563 | ) | | | 259,769 | | |
| | | Massachusetts Limited Fund | |
| Class B | | Six Months Ended
September 30, 2005
(Unaudited) | | Year Ended
March 31, 2005 | |
| Sales | | | 28,587 | | | | 222,750 | | |
Issued to shareholders electing to
receive payments of distributions
in Fund shares | | | 8,630 | | | | 17,350 | | |
| Redemptions | | | (67,425 | ) | | | (176,830 | ) | |
| Exchange to Class A shares | | | (61,851 | ) | | | (80,170 | ) | |
| Net decrease | | | (92,059 | ) | | | (16,900 | ) | |
| | | Massachusetts Limited Fund | |
| Class C | | Six Months Ended
September 30, 2005
(Unaudited) | | Year Ended
March 31, 2005 | |
| Sales | | | 194,091 | | | | 672,244 | | |
Issued to shareholders electing to
receive payments of distributions
in Fund shares | | | 24,013 | | | | 46,638 | | |
| Redemptions | | | (505,385 | ) | | | (701,485 | ) | |
| Net increase (decrease) | | | (287,281 | ) | | | 17,397 | | |
70
Eaton Vance Limited Maturity Municipals Funds as of September 30, 2005
NOTES TO FINANCIAL STATEMENTS (Unaudited) CONT'D
| | | New Jersey Limited Fund | |
| Class A | | Six Months Ended
September 30, 2005
(Unaudited) | | Year Ended
March 31, 2005 | |
| Sales | | | 193,571 | | | | 604,405 | | |
Issued to shareholders electing to
receive payments of distributions
in Fund shares | | | 53,818 | | | | 108,936 | | |
| Redemptions | | | (377,619 | ) | | | (937,971 | ) | |
| Exchange from Class B shares | | | 37,697 | | | | 63,956 | | |
| Net decrease | | | (92,533 | ) | | | (160,674 | ) | |
| | | New Jersey Limited Fund | |
| Class B | | Six Months Ended
September 30, 2005
(Unaudited) | | Year Ended
March 31, 2005(1) | |
| Sales | | | 28,591 | | | | 110,215 | | |
Issued to shareholders electing to
receive payments of distributions
in Fund shares | | | 6,272 | | | | 13,202 | | |
| Redemptions | | | (64,043 | ) | | | (169,384 | ) | |
| Exchange to Class A shares | | | (37,706 | ) | | | (63,958 | ) | |
| Net decrease | | | (66,886 | ) | | | (109,925 | ) | |
| | | New York Limited Fund | |
| Class A | | Six Months Ended
September 30, 2005
(Unaudited) | | Year Ended
March 31, 2005 | |
| Sales | | | 593,649 | | | | 1,158,541 | | |
Issued to shareholders electing to
receive payments of distributions
in Fund shares | | | 79,830 | | | | 149,621 | | |
| Redemptions | | | (320,044 | ) | | | (1,728,153 | ) | |
| Exchange from Class B shares | | | 120,352 | | | | 141,018 | | |
| Net increase (decrease) | | | 473,787 | | | | (278,973 | ) | |
| | | New York Limited Fund | |
| Class B | | Six Months Ended
September 30, 2005
(Unaudited) | | Year Ended
March 31, 2005 | |
| Sales | | | 78,504 | | | | 117,562 | | |
Issued to shareholders electing to
receive payments of distributions
in Fund shares | | | 9,699 | | | | 21,214 | | |
| Redemptions | | | (57,446 | ) | | | (228,944 | ) | |
| Exchange to Class A shares | | | (120,431 | ) | | | (141,133 | ) | |
| Net decrease | | | (89,674 | ) | | | (231,301 | ) | |
| | | New York Limited Fund | |
| Class C | | Six Months Ended
September 30, 2005
(Unaudited) | | Year Ended
March 31, 2005 | |
| Sales | | | 171,777 | | | | 616,332 | | |
Issued to shareholders electing to
receive payments of distributions
in Fund shares | | | 27,842 | | | | 60,168 | | |
| Redemptions | | | (708,761 | ) | | | (1,134,879 | ) | |
| Net decrease | | | (509,142 | ) | | | (458,379 | ) | |
| | | Ohio Limited Fund | |
| Class A | | Six Months Ended
September 30, 2005
(Unaudited) | | Year Ended
March 31, 2005 | |
| Sales | | | 109,294 | | | | 258,944 | | |
Issued to shareholders electing to
receive payments of distributions
in Fund shares | | | 20,568 | | | | 38,212 | | |
| Redemptions | | | (72,007 | ) | | | (616,382 | ) | |
| Exchange from Class B shares | | | 2,030 | | | | 5,781 | | |
| Net increase (decrease) | | | 59,885 | | | | (313,445 | ) | |
| | | Ohio Limited Fund | |
| Class B | | Six Months Ended
September 30, 2005
(Unaudited) | | Year Ended
March 31, 2005 | |
| Sales | | | 1,344 | | | | 15,804 | | |
Issued to shareholders electing to
receive payments of distributions
in Fund shares | | | 1,383 | | | | 3,019 | | |
| Redemptions | | | (25,183 | ) | | | (53,279 | ) | |
| Exchange to Class A shares | | | (2,033 | ) | | | (5,779 | ) | |
| Net decrease | | | (24,489 | ) | | | (40,235 | ) | |
| | | Pennsylvania Limited Fund | |
| Class A | | Six Months Ended
September 30, 2005
(Unaudited) | | Year Ended
March 31, 2005 | |
| Sales | | | 341,692 | | | | 276,953 | | |
Issued to shareholders electing to
receive payments of distributions
in Fund shares | | | 31,379 | | | | 65,579 | | |
| Redemptions | | | (251,326 | ) | | | (498,134 | ) | |
| Exchange from Class B shares | | | 51,001 | | | | 90,804 | | |
| Net increase (decrease) | | | 172,746 | | | | (64,798 | ) | |
71
Eaton Vance Limited Maturity Municipals Funds as of September 30, 2005
NOTES TO FINANCIAL STATEMENTS (Unaudited) CONT'D
| | | Pennsylvania Limited Fund | |
| Class B | | Six Months Ended
September 30, 2005
(Unaudited) | | Year Ended
March 31, 2005 | |
| Sales | | | 15,019 | | | | 130,395 | | |
Issued to shareholders electing to
receive payments of distributions
in Fund shares | | | 6,498 | | | | 15,311 | | |
| Redemptions | | | (93,080 | ) | | | (157,563 | ) | |
| Exchange to Class A shares | | | (50,993 | ) | | | (90,801 | ) | |
| Net decrease | | | (122,556 | ) | | | (102,658 | ) | |
| | | Pennsylvania Limited Fund | |
| Class C | | Six Months Ended
September 30, 2005
(Unaudited) | | Year Ended
March 31, 2005 | |
| Sales | | | 213,629 | | | | 301,675 | | |
Issued to shareholders electing to
receive payments of distributions
in Fund shares | | | 11,985 | | | | 24,292 | | |
| Redemptions | | | (216,215 | ) | | | (756,161 | ) | |
| Net increase (decrease) | | | 9,399 | | | | (430,194 | ) | |
(1) Class C shares of the California Limited Fund commenced operations on March 23, 2005.
4 Investment Adviser Fee and Other Transactions with Affiliates
The investment adviser fee is earned by Boston Management and Research (BMR), a wholly-owned subsidiary of Eaton Vance Management (EVM), as compensation for management and investment advisory services rendered to each Fund. The fee is based upon a percentage of average daily net assets plus a percentage of gross income (i.e., income other than gains from the sale of securities). For the six months ended September 30, 2005, advisory fees incurred by the Funds were as follows:
| Fund | | Amount | | Effective Rate* | |
| California Limited | | $ | 78,841 | | | | 0.43 | % | |
| Florida Limited | | | 145,719 | | | | 0.43 | % | |
| Massachusetts Limited | | | 181,337 | | | | 0.43 | % | |
| New Jersey Limited | | | 113,033 | | | | 0.43 | % | |
| New York Limited | | | 243,692 | | | | 0.43 | % | |
| Ohio Limited | | | 41,660 | | | | 0.43 | % | |
| Pennsylvania Limited | | | 129,191 | | | | 0.44 | % | |
* As a percentage of average daily net assets (annualized).
Except as to Trustees of the Funds who are not members of EVM's or BMR's organization, officers and Trustees receive remuneration for their services to the Funds out of such investment adviser fee. EVM serves as the Administrator of each Fund, but receives no compensation. EVM serves as the sub-transfer agent of the Fund and receives from the transfer agent an aggregate fee based upon the actual expenses incurred by EVM in the performance of those services. For the six months ended September 30, 2005, EVM earned approximately $350, $800, $1,400, $900, $2,000, $300 and $1,200 in sub-transfer agent fees from California Limited Fund, Florida Limited Fund, Massachusetts Limited Fund, New Jersey Limited Fund, New York Limited Fund, Ohio Limited Fund and Pennsylvania Limited Fund, respectively. The Funds were informed that Eaton Vance Distributors, Inc. (EVD), a subsidiary of EVM and the Funds' p rincipal underwriter, received approximately $800, $1,100, $1,900, $1,900, $2,200, $1,700 and $1,600 as its portion of the sales charge on sales of Class A shares from California Limited Fund, Florida Limited Fund, Massachusetts Limited Fund, New Jersey Limited Fund, New York Limited Fund, Ohio Limited Fund and Pennsylvania Limited Fund, respectively, for the six months ended September 30, 2005.
Trustees of the Funds that are not affiliated with the Investment Adviser may elect to defer receipt of all or a percentage of their annual fees in accordance with the terms of the Trustees Deferred Compensation Plan. For the six months ended September 30, 2005, no significant amounts have been deferred.
Certain of the officers and Trustees of the Funds are officers of the above organizations.
5 Distribution and Service Plans
Each Fund has in effect distribution plans for Class B (Class B Plan) and Class C (Class C Plan) pursuant to Rule 12b-1 under the Investment Company Act of 1940 and a service plan for Class A shares (Class A Plan) (collectively, the Plans). The Plans require the Class B and Class C shares to pay EVD amounts equal to 1/365 of 0.75% of each Fund's daily net assets attributable to Class B and Class C, for providing ongoing distribution services and facilities to the respective Fund. Each Fund will automatically discontinue payments to EVD during any period in which there are no outstanding Uncovered Distribution Charges, which are equivalent to the sum of (i) 3% (3-1/2% for Ohio Limited Fund) of the aggregate amount received by the Fund for Class B shares sold and 6.25% of Class C sales of the amount received by the Fund for each share sold and, (ii) interest calculated by applying
72
Eaton Vance Limited Maturity Municipals Funds as of September 30, 2005
NOTES TO FINANCIAL STATEMENTS (Unaudited) CONT'D
the rate of 1% over the prevailing prime rate to the outstanding balance of Uncovered Distribution Charges of EVD reduced by the aggregate amount of contingent deferred sales charges (see Note 6) and daily amounts theretofore paid to EVD. The amount payable to EVD with respect to each day is accrued on such day as a liability of each Fund's Class B and Class C shares and, accordingly, reduces each Fund's Class B and Class C net assets. For the six months ended September 30, 2005, the California Limited Fund, Florida Limited Fund, Massachusetts Limited Fund, New Jersey Limited Fund, New York Limited Fund, Ohio Limited Fund, and Pennsylvania Limited Fund paid or accrued $13,246, $28,964, $37,766, $32,534, $46,323, $7,625, and $31,160, respectively, for Class B shares, and California Limited Fund, Florida Limited Fund, Massachusetts Limited Fund, New York Limited Fund and Pennsylvania Limited Fund paid or accrued $108, $61,600, $102,253, $129,818, and $63,031, respectively, for Class C shares, to or payable to EVD representing 0.75% (annualized) of each Fund's Class B and Class C average daily net assets. At September 30, 2005, the amount of Uncovered Distribution Charges of EVD calculated under the Plans for California Limited Fund, Florida Limited Fund, Massachusetts Limited Fund, New Jersey Limited Fund, New York Limited Fund, Ohio Limited Fund and Pennsylvania Limited Fund were approximately $441,000, $853,000, $536,000, $531,000, $764,000, $694,000 and $373,000, respectively for Class B shares, and for Florida Limited Fund, Massachusetts Limited Fund, New York Limited Fund and Pennsylvania Limited Fund the amount of Uncovered Distribution Charges of EVD were approximately $7,626,000, $3,854,000, $4,673,000 and $4,611,000, respectively for Class C shares.
The Plans authorize the Funds to make payments of service fees to EVD, investment dealers and other persons in amounts not exceeding 0.25% of each Fund's average daily net assets for any fiscal year. The Trustees approved service fee payments equal to 0.15% per annum of each Fund's average daily net assets attributable to Class A, Class B and Class C shares for each fiscal year. Service fee payments are made for personal services and/or maintenance of shareholder accounts. Service fees paid to EVD and investment dealers are separate and distinct from the sales commissions and distribution fees payable by each Fund to EVD, and as such are not subject to automatic discontinuance when there are no outstanding Uncovered Distribution Charges of EVD. For the six months ended September 30, 2005, the California Limited Fund, Florida Limited Fund, Massachusetts Limited Fund, New Jerse y Limited Fund, New York Limited Fund, Ohio Limited Fund and Pennsylvania Limited Fund paid or accrued service fees to or payable to EVD in the amount of $24,770, $32,291, $35,431, $32,820, $49,487, $12,874, and $25,369, respectively, for Class A shares, and $2,650, $5,793, $7,553, $6,507, $9,265, $1,525, and $6,232, respectively, for Class B shares. For the six months ended September 30, 2005, California Limited Fund, Florida Limited Fund, Massachusetts Limited Fund, New York Limited Fund and Pennsylvania Limited Fund paid or accrued service fees to or payable to EVD in the amount of $22, $12,320, $20,451, $25,964 and $12,606, respectively, for Class C shares.
Certain officers and Trustees of the Fund are officers or directors of EVD.
6 Contingent Deferred Sales Charge
A contingent deferred sales charge (CDSC) generally is imposed on redemptions of Class B shares made within four years of purchase and on redemptions of Class C shares within one year of purchase. Class A shares purchased at net asset value in amounts of $1 million or more (other than shares purchased in a single transaction of $5 million or more) are subject to a 1% CDSC if redeemed within 18 months of Purchase. Generally, the CDSC is based upon the lower of the net asset value at date of redemption or date of purchase. No charge is levied on Class B and Class C shares acquired by reinvestment of dividends or capital gains distributions. The CDSC for Class B shares is imposed at declining rates that begin at 3% in the case of redemptions in the first year after purchase declining half a percentage point the second and third year and one percentage point each s ubsequent year. Class C shares are subject to a 1% CDSC if redeemed within one year of purchase. No CDSC is levied on shares which have been sold to EVM or its affiliates or to their respective employees or clients and may be waived under certain other limited conditions. CDSC charges are paid to EVD to reduce the amount of Uncovered Distribution Charges calculated under each Fund's Distribution Plan. CDSC charges received when no Uncovered Distribution Charges exist will be credited to the Fund. For the six months ended September 30, 2005, EVD received approximately $469, $7,000, $5,000, $3,000, $356, and $2,000, respectively, for Class A shares, of CDSC paid by shareholders of the California Limited Fund, Florida Limited Fund, Massachusetts Limited Fund, New Jersey Limited Fund, New York Limited Fund, and Pennsylvania Limited Fund. EVD received approximately $5,000, $7,000, $9,000, $7,000, $6,000, $4,000 and $13,000, respectively, for Class B shares, of CDSC paid by shareholders of Cali fornia Limited Fund, Florida Limited Fund, Massachusetts Limited Fund, New Jersey Limited Fund, New York Limited Fund, Ohio Limited Fund and Pennsylvania Limited Fund, and CDSC paid by shareholders of the Florida Limited Fund, Massachusetts Limited Fund, New York Limited Fund and Pennsylvania
73
Eaton Vance Limited Maturity Municipals Funds as of September 30, 2005
NOTES TO FINANCIAL STATEMENTS (Unaudited) CONT'D
Limited Fund were approximately $3,000, $9,000, $3,000 and $3,000, respectively, for Class C shares.
7 Investments
Purchases and sales of investments by the Funds, other than U.S. Government securities and short-term obligations, for the six months ended September 30, 2005, were as follows:
| California Limited Fund | | | |
| Purchases | | $ | 6,118,676 | | |
| Sales | | | 5,686,059 | | |
| Florida Limited Fund | | | |
| Purchases | | $ | 4,737,834 | | |
| Sales | | | 13,603,732 | | |
| Massachusetts Limited Fund | | | |
| Purchases | | $ | 2,904,407 | | |
| Sales | | | 9,634,907 | | |
| New Jersey Limited Fund | | | |
| Purchases | | $ | 6,971,720 | | |
| Sales | | | 7,864,994 | | |
| New York Limited Fund | | | |
| Purchases | | $ | 7,317,502 | | |
| Sales | | | 9,296,814 | | |
| Ohio Limited Fund | | | |
| Purchases | | $ | 2,474,088 | | |
| Sales | | | 2,264,019 | | |
| Pennsylvania Limited Fund | | | |
| Purchases | | $ | 6,152,408 | | |
| Sales | | | 6,544,726 | | |
8 Federal Income Tax Basis of Unrealized Appreciation (Depreciation)
The cost and unrealized appreciation (depreciation) in value of the investments owned by each Fund at September 30, 2005, as computed on a federal income tax basis, are as follows:
| California Limited Fund | | | |
| Aggregate cost | | $ | 34,737,628 | | |
| Gross unrealized appreciation | | $ | 1,519,671 | | |
| Gross unrealized depreciation | | | (62,587 | ) | |
| Net unrealized appreciation | | $ | 1,457,084 | | |
| Florida Limited Fund | | | |
| Aggregate cost | | $ | 59,536,156 | | |
| Gross unrealized appreciation | | $ | 2,585,147 | | |
| Gross unrealized depreciation | | | (90,238 | ) | |
| Net unrealized appreciation | | $ | 2,494,909 | | |
| Massachusetts Limited Fund | | | |
| Aggregate cost | | $ | 77,226,915 | | |
| Gross unrealized appreciation | | $ | 3,286,330 | | |
| Gross unrealized depreciation | | | (46,220 | ) | |
| Net unrealized appreciation | | $ | 3,240,110 | | |
| New Jersey Limited Fund | | | |
| Aggregate cost | | $ | 48,333,204 | | |
| Gross unrealized appreciation | | $ | 2,585,077 | | |
| Gross unrealized depreciation | | | (190,472 | ) | |
| Net unrealized appreciation | | $ | 2,394,605 | | |
| New York Limited Fund | | | |
| Aggregate cost | | $ | 107,152,151 | | |
| Gross unrealized appreciation | | $ | 4,440,402 | | |
| Gross unrealized depreciation | | | (435,642 | ) | |
| Net unrealized appreciation | | $ | 4,004,760 | | |
| Ohio Limited Fund | | | |
| Aggregate cost | | $ | 17,977,743 | | |
| Gross unrealized appreciation | | $ | 1,071,339 | | |
| Gross unrealized depreciation | | | - | | |
| Net unrealized appreciation | | $ | 1,071,339 | | |
74
Eaton Vance Limited Maturity Municipals Funds as of September 30, 2005
NOTES TO FINANCIAL STATEMENTS (Unaudited) CONT'D
| Pennsylvania Limited Fund | | | |
| Aggregate cost | | $ | 56,104,868 | | |
| Gross unrealized appreciation | | $ | 2,964,321 | | |
| Gross unrealized depreciation | | | (247,807 | ) | |
| Net unrealized appreciation | | $ | 2,716,514 | | |
9 Line of Credit
The Funds participate with other portfolios and funds managed by BMR and EVM and their affiliates in a $150 million unsecured line of credit agreement with a group of banks. Borrowings will be made by the portfolios or funds solely to facilitate the handling of unusual and/or unanticipated short-term cash requirements. Interest is charged to each participating portfolio or fund based on its borrowings at an amount above either the Eurodollar rate or Federal Funds effective rate. In addition, a fee computed at an annual rate of 0.10% on the daily unused portion of the line of credit is allocated among the participating portfolios and funds at the end of each quarter. At September 30, 2005 the Massachusetts Limited Fund had a balance outstanding pursuant to this line of credit of $300,000. The Funds did not have any significant borrowings or allocated fees during the six months ended Sep tember 30, 2005.
10 Overdraft Advances
Pursuant to the custodian agreement between the Funds and Investors Bank & Trust (the Bank), the Bank may in its discretion advance funds to the Funds to make properly authorized payments. When such payments result in an overdraft by the Funds, the Funds are obligated to repay the Bank at the current rate of interest charged by the Bank for secured loans (currently, a rate above the federal funds rate). This obligation is payable on demand to the Bank. At September 30, 2005, the Massachusetts Limited Fund had payments due to the Bank pursuant to the foregoing arrangement of $85,037.
11 Financial Instruments
The Funds regularly trade in financial instruments with off-balance sheet risk in the normal course of their investing activities to assist in managing exposure to various market risks. These financial instruments include futures contracts and may involve, to a varying degree, elements of risk in excess of the amounts recognized for financial statement purposes. The notional or contractual amounts of these instruments represent the investment a Fund has in particular classes of financial instruments and does not necessarily represent the amounts potentially subject to risk. The measurement of the risks associated with these instruments is meaningful only when all related and offsetting transactions are considered.
A summary of obligations under these financial instruments at September 30, 2005, is as follows:
Futures Contracts
| Fund | | Expiration
Date | | Contracts | | Position | | Aggregate
Cost | | Value | | Net
Unrealized
Appreciation
(Depreciation) | |
California
Limited | | 12/05 | | 83 U.S.
Treasury Bond | | Short | | $ | (9,739,179 | ) | | $ | (9,495,719 | ) | | $ | 243,460 | | |
Florida
Limited | | 12/05 | | 91 U.S.
Treasury Bond | | Short | | $ | (10,646,613 | ) | | $ | (10,410,969 | ) | | $ | 235,644 | | |
| | | 12/05 | | 54 U.S.
Treasury Note | | Short | | | (5,964,240 | ) | | | (5,935,782 | ) | | | 28,458 | | |
Massachusetts
Limited | | 12/05 | | 68 U.S.
Treasury Bond | | Short | | $ | (7,957,836 | ) | | $ | (7,779,625 | ) | | $ | 178,211 | | |
| | | 12/05 | | 41 U.S.
Treasury Note | | Short | | | (4,528,404 | ) | | | (4,506,797 | ) | | | 21,607 | | |
New Jersey
Limited | | 12/05 | | 82 U.S.
Treasury Bond | | Short | | $ | (9,593,652 | ) | | $ | (9,381,313 | ) | | $ | 212,339 | | |
| | | 12/05 | | 45 U.S.
Treasury Note | | Short | | | (4,970,200 | ) | | | (4,946,485 | ) | | | 23,715 | | |
New York
Limited | | 12/05 | | 86 U.S.
Treasury Bond | | Short | | $ | (10,064,322 | ) | | $ | (9,838,938 | ) | | $ | 225,384 | | |
| | | 12/05 | | 94 U.S.
Treasury Note | | Short | | | (10,382,195 | ) | | | (10,332,657 | ) | | | 49,538 | | |
Ohio
Limited | | 12/05 | | 10 U.S.
Treasury Bond | | Short | | $ | (1,170,269 | ) | | $ | (1,144,062 | ) | | $ | 26,207 | | |
| | | 12/05 | | 13 U.S.
Treasury Note | | Short | | | (1,435,835 | ) | | | (1,428,984 | ) | | | 6,851 | | |
Pennsylvania
Limited | | 12/05 | | 89 U.S.
Treasury Bond | | Short | | $ | (10,412,621 | ) | | $ | (10,182,156 | ) | | $ | 230,465 | | |
| | | 12/05 | | 40 U.S.
Treasury Note | | Short | | | (4,417,955 | ) | | | (4,396,875 | ) | | | 21,080 | | |
At September 30, 2005, the Funds had sufficient cash and/or securities to cover margin requirements on open future contracts.
75
Eaton Vance Limited Maturity Municipals Funds as of September 30, 2005
NOTES TO FINANCIAL STATEMENTS (Unaudited) CONT'D
12 Shareholder Meeting
The Funds held a Special Meeting of Shareholders on April 29, 2005 to elect Trustees. The results of the vote were as follows:
| Fund | | Benjamin C.
Esty | | James B.
Hawkes | | Samuel L.
Hayes | | William H.
Park | | Ronald A.
Pearlman | | Norton H.
Reamer | | Lynn A.
Stout | | Ralph F.
Verni | |
| California Fund | | | | | | | | | | | | | | | | | | | |
| Affirmative | | | 3,209,779 | | | | 3,209,779 | | | | 3,209,779 | | | | 3,209,779 | | | | 3,209,779 | | | | 3,209,779 | | | | 3,209,779 | | | | 3,209,779 | | |
| Withhold | | | 20,532 | | | | 20,532 | | | | 20,532 | | | | 20,532 | | | | 20,532 | | | | 20,532 | | | | 20,532 | | | | 20,532 | | |
| Florida Fund | | | | | | | | | | | | | | | | | | | |
| Affirmative | | | 6,249,381 | | | | 6,254,987 | | | | 6,254,987 | | | | 6,250,619 | | | | 6,252,011 | | | | 6,253,521 | | | | 6,251,478 | | | | 6,250,865 | | |
| Withhold | | | 426,003 | | | | 420,397 | | | | 420,397 | | | | 424,765 | | | | 423,373 | | | | 421,863 | | | | 423,906 | | | | 424,519 | | |
| Massachusetts Fund | | | | | | | | | | | | | | | | | | | |
| Affirmative | | | 7,708,103 | | | | 7,727,577 | | | | 7,705,446 | | | | 7,727,577 | | | | 7,720,433 | | | | 7,724,512 | | | | 7,731,488 | | | | 7,707,033 | | |
| Withhold | | | 58,582 | | | | 39,108 | | | | 61,238 | | | | 39,108 | | | | 46,252 | | | | 42,173 | | | | 35,197 | | | | 59,652 | | |
| New Jersey Fund | | | | | | | | | | | | | | | | | | | |
| Affirmative | | | 4,507,309 | | | | 4,496,440 | | | | 4,496,012 | | | | 4,502,828 | | | | 4,494,784 | | | | 4,496,012 | | | | 4,500,680 | | | | 4,507,309 | | |
| Withhold | | | 71,943 | | | | 82,812 | | | | 83,239 | | | | 76,424 | | | | 84,467 | | | | 83,239 | | | | 78,571 | | | | 71,943 | | |
| New York Fund | | | | | | | | | | | | | | | | | | | |
| Affirmative | | | 9,712,312 | | | | 9,709,694 | | | | 9,702,825 | | | | 9,709,152 | | | | 9,702,095 | | | | 9,702,825 | | | | 9,712,312 | | | | 9,712,312 | | |
| Withhold | | | 175,673 | | | | 178,291 | | | | 185,160 | | | | 178,833 | | | | 185,890 | | | | 185,160 | | | | 175,673 | | | | 175,673 | | |
| Ohio Fund | | | | | | | | | | | | | | | | | | | |
| Affirmative | | | 1,768,414 | | | | 1,768,414 | | | | 1,768,414 | | | | 1,768,414 | | | | 1,768,414 | | | | 1,768,414 | | | | 1,768,414 | | �� | | 1,768,414 | | |
| Withhold | | | 24,327 | | | | 24,327 | | | | 24,327 | | | | 24,327 | | | | 24,327 | | | | 24,327 | | | | 24,327 | | | | 24,327 | | |
| Pennsylvania Fund | | | | | | | | | | | | | | | | | | | |
| Affirmative | | | 5,449,917 | | | | 5,439,452 | | | | 5,445,189 | | | | 5,450,433 | | | | 5,445,708 | | | | 5,445,189 | | | | 5,444,177 | | | | 5,449,917 | | |
| Withhold | | | 53,269 | | | | 63,734 | | | | 57,997 | | | | 52,753 | | | | 57,478 | | | | 57,997 | | | | 59,009 | | | | 53,269 | | |
76
Eaton Vance Limited Maturity Municipals Funds
BOARD OF TRUSTEES' ANNUAL APPROVAL OF THE INVESTMENT ADVISORY AGREEMENTS
The investment advisory agreements between each of Eaton Vance California Limited Maturity Municipals Fund, Eaton Vance Florida Limited Maturity Municipals Fund, Eaton Vance Massachusetts Limited Maturity Municipals Fund, Eaton Vance New Jersey Limited Maturity Municipals Fund, Eaton Vance New York Limited Maturity Municipals Fund, Eaton Vance Ohio Limited Maturity Municipals Fund and Eaton Vance Pennsylvania Limited Maturity Municipals Fund (collectively the "Funds" or individually the "Fund"), and the investment adviser, Boston Management and Research, each provide that the advisory agreement will continue in effect from year to year so long as its continuance is approved at least annually (i) by a vote of a majority of the noninterested Trustees of the Fund cast in person at a meeting called for the purpose of voting on such approval and (ii) by the Trustees of the Fund or by vote of a majority of the outstanding interests of the Fund.
In considering the annual approval of the investment advisory agreements between each of Fund and the investment adviser, the Special Committee of the Board of Trustees considered information that had been provided throughout the year at regular Board meetings, as well as information furnished to the Special Committee for a series of meetings held in February and March in preparation for a Board meeting held on March 21, 2005 to specifically consider the renewal of the investment advisory agreements. Such information included, among other things, the following:
•An independent report comparing the advisory fees of each Fund with those of comparable funds;
•An independent report comparing the expense ratio of each Fund to those of comparable funds;
•Information regarding Fund investment performance in comparison to a relevant universe of funds and appropriate indices;
•The economic outlook and the general investment outlook in relevant investment markets;
•Eaton Vance Management's ("Eaton Vance") results and financial condition and the overall organization of the investment adviser;
•The procedures and processes used to determine the fair value of Fund assets and action taken to monitor and test the effectiveness of such procedures and processes;
•Eaton Vance's management of the relationship with the custodian, subcustodians and fund accountants;
•The resources devoted to compliance efforts undertaken by Eaton Vance on behalf of the funds it manages and the record of compliance with the investment policies and restrictions and with policies on personal securities transactions;
•The quality, nature, cost and character of the administrative and other non-investment management services provided by Eaton Vance and its affiliates; and
•The terms of the advisory agreements and the reasonableness and appropriateness of the particular fee paid by each Fund for the services described therein.
The Special Committee also considered the investment adviser's municipal bond portfolio management capabilities, including information relating to the education, experience, and number of investment professionals and other personnel who provide services under the investment advisory agreements. Specifically, the Special Committee considered the investment adviser's 30-person municipal bond team, which includes six portfolio managers and nine credit specialists who provide services to the Funds. The Special Committee noted that the investment adviser's municipal bond team affords the investment adviser extensive in-house research capabilities in addition to the other resources available to the investment adviser. The Special Committee also took into account the time and attention to be devoted by senior
77
Eaton Vance Limited Maturity Municipals Funds
BOARD OF TRUSTEES' ANNUAL APPROVAL OF THE INVESTMENT ADVISORY AGREEMENTS CONT'D
management to the Funds and the other funds in the complex. The Special Committee evaluated the level of skill required to manage the Funds and concluded that the human resources available at the investment adviser were appropriate to fulfill effectively its duties on behalf of the Funds.
In its review of comparative information with respect to each Fund's investment performance, the Special Committee concluded that the Fund has performed within a range that the Special Committee deemed competitive. With respect to its review of investment advisory fees, the Special Committee concluded that the fees paid by each Fund are within the range of those paid by comparable funds within the mutual fund industry. In reviewing the information regarding the expense ratio of each Fund, the Special Committee concluded that each Fund's expense ratio is within a range that is competitive with comparable funds.
In addition to the factors mentioned above, the Special Committee reviewed the level of the investment adviser's profits in providing investment management services for each Fund and for all Eaton Vance Funds as a group. The Special Committee also reviewed the level of profits of Eaton Vance and its affiliates in providing administration services for each Fund and for all Eaton Vance Funds as a group. In addition, the Special Committee considered the fiduciary duty assumed by the investment adviser in connection with the services rendered to each Fund and the business reputation of the investment adviser and its financial resources. The Trustees concluded that in light of the services rendered, the profits realized by the investment adviser are not unreasonable. The Special Committee also considered the extent to which the investment adviser appears to be realizing benefits from economies of sc ale in managing the Funds, and concluded that the fee breakpoints which are in place will allow for an equitable sharing of such benefits, when realized, with the shareholders of the Funds.
The Special Committee did not consider any single factor as controlling in determining whether or not to renew the investment advisory agreements. Nor are the items described herein all the matters considered by the Special Committee. In assessing the information provided by Eaton Vance and its affiliates, the Special Committee also took into consideration the benefits to shareholders of investing in a fund that is a part of a large family of funds which provides a large variety of shareholder services.
Based on its consideration of the foregoing factors and conclusions, and such other factors and conclusions as it deemed relevant, and assisted by independent counsel, the Special Committee concluded that the renewal of the investment advisory agreements, including the fee structures (described herein), is in the interests of shareholders.
78
Eaton Vance Limited Maturity Municipals Funds
INVESTMENT MANAGEMENT
Limited Maturity Municipals Funds
Officers
Cynthia J. Clemson
President and Portfolio Manager
of California Limited Maturity
Municipals Fund
William H. Ahern, Jr.
Vice President and Portfolio
Ma nager of Massachusetts, New York and Ohio Limited Maturity Municipals Funds
Craig R. Brandon
Vice President and Portfolio
Manager of Florida, New Jersey and Pennsylvania Limited Maturity Municipals Funds
James B Hawkes
Vice President and Trustee
Robert B. MacIntosh
Vice President
Thomas M. Metzold
Vice President
Barbara E. Campbell
Treasurer
Alan R. Dynner
Secretary
Paul M. O'Neil
Chief Compliance Offic er | | Trustees
Samuel L. Hayes, III
Chairman
Benjamin C. Esty
William H. Park
Ronald A. Pearlman
Norton H. Reamer
Lynn A. Stout
Ralph F. Verni | |
|
79
This Page Intentionally Left Blank
This Page Intentionally Left Blank
Investment Adviser of the Eaton Vance Limited Maturity Municipals Funds
Boston Management and Research
The Eaton Vance Building
255 State Street
Boston, MA 02109
Administrator of Eaton Vance Limited Maturity Municipals Funds
Eaton Vance Management
The Eaton Vance Building
255 State Street
Boston, MA 02109
Principal Underwriter
Eaton Vance Distributors, Inc.
The Eaton Vance Building
255 State Street
Boston, MA 02109
(617) 482-8260
Custodian
Investors Bank & Trust Company
200 Clarendon Street
Boston, MA 02116
Transfer Agent
PFPC Inc.
Attn: Eaton Vance Funds
P.O. Box 9653
Providence, RI 02940-9653
(800) 262-1122
Eaton Vance Investment Trust
The Eaton Vance Building
255 State Street
Boston, MA 02109
This report must be preceded or accompanied by a current prospectus. Before investing, investors should consider carefully the Fund's investment objective(s), risks, and charges and expenses. The Fund's current prospectus contains this and other information about the Fund and is available through your financial advisor. Please read the prospectus carefully before you invest or send money. For further information please call 1-800-225-6265.
442-11/05 7LTFSRC
Item 2. Code of Ethics
The registrant has adopted a code of ethics applicable to its Principal Executive Officer, Principal Financial Officer and Principal Accounting Officer. The registrant undertakes to provide a copy of such code of ethics to any person upon request, without charge, by calling 1-800-262-1122.
Item 3. Audit Committee Financial Expert
The registrant’s Board has designated William H. Park, Samuel L. Hayes, III and Norton H. Reamer, each an independent trustee, as its audit committee financial experts. Mr. Park is a certified public accountant who is the President and Chief Executive Officer of Prizm Capital Management, LLC (investment management firm). Previously, he served as Executive Vice President and Chief Financial Officer of United Asset Management Corporation (“UAM”) (a holding company owning institutional investment management firms). Mr. Hayes is the Jacob H. Schiff Professor of Investment Banking Emeritus of the Harvard University Graduate School of Business Administration. Mr. Reamer is the President, Chief Executive Officer and a Director of Asset Management Finance Corp. (a specialty finance company serving the investment management industry) and is President of Unicorn Corporation (an investment and financial advisory services company). Formerly, Mr. Reamer was Chairman of Hellman, Jordan Management Co., Inc. (an investment management company) and Advisory Director of Berkshire Capital Corporation (an investment banking firm), Chairman of the Board of UAM and Chairman, President and Director of the UAM Funds (mutual funds).
Item 4. Principal Accountant Fees and Services
Not required in this filing
Item 5. Audit Committee of Listed registrants
Not required in this filing.
Item 6. Schedule of Investments
Please see schedule of investments contained in the Report to Stockholders included under Item 1 of this Form N-CSR.
Item 7. Disclosure of Proxy Voting Policies and Procedures for Closed-End Management Investment Companies
Not required in this filing.
Item 8. Purchases of Equity Securities by Closed-End Management Investment Company and Affiliated Purchasers.
Not required in this filing.
Item 9. Submission of Matters to a Vote of Security Holders.
Effective February 7, 2005, the Governance Committee of the Board of Trustees revised the procedures by which a Fund’s shareholders may recommend nominees to the registrant’s Board of Trustees to add the following (highlighted):
The Governance Committee shall, when identifying candidates for the position of Independent Trustee, consider any such candidate recommended by a shareholder of a Fund if such recommendation contains (i)sufficient background information concerning the candidate, including evidence the candidate is willing to serve as an Independent Trustee if selected for the position; and (ii) is received in a sufficiently timely manner (and in any event no later than the date specified for receipt of shareholder
proposals in any applicable proxy statement with respect to a Fund). Shareholders shall be directed to address any such recommendations in writing to the attention of the Governance Committee, c/o the Secretary of the Fund. The Secretary shall retain copies of any shareholder recommendations which meet the foregoing requirements for a period of not more than 12 months following receipt. The Secretary shall have no obligation to acknowledge receipt of any shareholder recommendations
Item 10. Controls and Procedures
(a) It is the conclusion of the registrant’s principal executive officer and principal financial officer that the effectiveness of the registrant’s current disclosure controls and procedures (such disclosure controls and procedures having been evaluated within 90 days of the date of this filing) provide reasonable assurance that the information required to be disclosed by the registrant has been recorded, processed, summarized and reported within the time period specified in the Commission’s rules and forms and that the information required to be disclosed by the registrant has been accumulated and communicated to the registrant’s principal executive officer and principal financial officer in order to allow timely decisions regarding required disclosure.
(b) There have been no changes in the registrant’s internal controls over financial reporting during the second fiscal quarter of the period covered by this report that has materially affected, or is reasonably likely to materially affect, the registrant’s internal control over financial reporting.
Item 11. Exhibits
(a)(1) | | Registrant’s Code of Ethics – Not applicable (please see Item 2). |
(a)(2)(i) | | Treasurer’s Section 302 certification. |
(a)(2)(ii) | | President’s Section 302 certification. |
(b) | | Combined Section 906 certification. |
Signatures
Pursuant to the requirements of the Securities Exchange Act of 1934 and the Investment Company Act of 1940, the registrant has duly caused this report to be signed on its behalf by the undersigned, thereunto duly authorized.
Eaton Vance Investment Trust | |
| |
By: | /s/ Cynthia J. Clemson | |
| Cynthia J. Clemson |
| President |
| |
| |
Date: | November 16, 2005 | |
Pursuant to the requirements of the Securities Exchange Act of 1934 and the Investment Company Act of 1940, this report has been signed below by the following persons on behalf of the registrant and in the capacities and on the dates indicated.
By: | /s/ Barbara E. Campbell | |
| Barbara E. Campbell |
| Treasurer |
| |
| |
Date: | November 16, 2005 | |
By: | /s/ Cynthia J. Clemson | |
| Cynthia J. Clemson |
| President |
| |
| |
Date: | November 16, 2005 | |