UNITED STATES
SECURITIES AND EXCHANGE COMMISSION
Washington, D.C. 20549
Form N-CSR
CERTIFIED SHAREHOLDER REPORT OF REGISTERED
MANAGEMENT INVESTMENT COMPANIES
Investment Company Act File Number: 811-04443
Eaton Vance Investment Trust
(Exact Name of Registrant as Specified in Charter)
Two International Place, Boston, Massachusetts 02110
(Address of Principal Executive Offices)
Maureen A. Gemma
Two International Place, Boston, Massachusetts 02110
(Name and Address of Agent for Services)
(617) 482-8260
(Registrant’s Telephone Number)
March 31
Date of Fiscal Year End
September 30, 2020
Date of Reporting Period
| Item 1. | Reports to Stockholders |

Eaton Vance
Floating-Rate Municipal Income Fund
Semiannual Report
September 30, 2020
Important Note. Beginning on January 1, 2021, as permitted by regulations adopted by the Securities and Exchange Commission, paper copies of the Fund’s annual and semi-annual shareholder reports will no longer be sent by mail unless you specifically request paper copies of the reports. Instead, the reports will be made available on the Fund’s website (eatonvance.com/funddocuments), and you will be notified by mail each time a report is posted and provided with a website address to access the report.
If you already elected to receive shareholder reports electronically, you will not be affected by this change and you need not take any action. If you are a direct investor, you may elect to receive shareholder reports and other communications from the Fund electronically by signing up for e-Delivery at eatonvance.com/edelivery. If you own your shares through a financial intermediary (such as a broker-dealer or bank), you must contact your financial intermediary to sign up.
You may elect to receive all future Fund shareholder reports in paper free of charge. If you are a direct investor, you can inform the Fund that you wish to continue receiving paper copies of your shareholder reports by calling 1-800-262-1122. If you own these shares through a financial intermediary, you must contact your financial intermediary or follow instructions included with this disclosure, if applicable, to elect to continue to receive paper copies of your shareholder reports. Your election to receive reports in paper will apply to all Eaton Vance funds held directly or to all funds held through your financial intermediary, as applicable.

Commodity Futures Trading Commission Registration. Effective December 31, 2012, the Commodity Futures Trading Commission (“CFTC”) adopted certain regulatory changes that subject registered investment companies and advisers to regulation by the CFTC if a fund invests more than a prescribed level of its assets in certain CFTC-regulated instruments (including futures, certain options and swap agreements) or markets itself as providing investment exposure to such instruments. The investment adviser has claimed an exclusion from the definition of “commodity pool operator” under the Commodity Exchange Act with respect to its management of the Fund. Accordingly, neither the Fund nor the adviser with respect to the operation of the Fund is subject to CFTC regulation. Because of its management of other strategies, the Fund’s adviser is registered with the CFTC as a commodity pool operator. The adviser is also registered as a commodity trading advisor.
Fund shares are not insured by the FDIC and are not deposits or other obligations of, or guaranteed by, any depository institution. Shares are subject to investment risks, including possible loss of principal invested.
This report must be preceded or accompanied by a current summary prospectus or prospectus. Before investing, investors should consider carefully the investment objective, risks, and charges and expenses of a mutual fund. This and other important information is contained in the summary prospectus and prospectus, which can be obtained from a financial intermediary. Prospective investors should read the prospectus carefully before investing. For further information, please call 1-800-262-1122.
Semiannual Report September 30, 2020
Eaton Vance
Floating-Rate Municipal Income Fund
Eaton Vance
Floating-Rate Municipal Income Fund
September 30, 2020
Performance1,2
Portfolio Managers Craig R. Brandon, CFA and Adam A. Weigold, CFA
| | | | | | | | | | | | | | | | | | | | | | | | |
| % Average Annual Total Returns | | Class
Inception Date | | | Performance Inception Date | | | Six Months | | | One Year | | | Five Years | | | Ten Years | |
| | | | | | |
Class A at NAV | | | 06/27/1996 | | | | 05/29/1992 | | | | –0.17 | % | | | 0.07 | % | | | 0.89 | % | | | 1.02 | % |
Class A with 2.25% Maximum Sales Charge | | | — | | | | — | | | | –2.45 | | | | –2.21 | | | | 0.42 | | | | 0.79 | |
Class I at NAV | | | 08/03/2010 | | | | 05/29/1992 | | | | –0.09 | | | | 0.22 | | | | 1.04 | | | | 1.18 | |
|
| |
| | | | | | |
Bloomberg Barclays 1 Year Municipal Bond Index | | | — | | | | — | | | | 1.57 | % | | | 2.24 | % | | | 1.40 | % | | | 1.14 | % |
| | | | | | |
| % Total Annual Operating Expense Ratios3 | | | | | | | | | | | | | | Class A | | | Class I | |
| | | | | | |
| | | | | | | | | | | | | | | | | | | 0.59 | % | | | 0.44 | % |
| | | | | | |
| % Distribution Rates/Yields4 | | | | | | | | | | | | | | Class A | | | Class I | |
| | | | | | |
Distribution Rate | | | | | | | | | | | | | | | | | | | 0.15 | % | | | 0.29 | % |
Taxable-Equivalent Distribution Rate | | | | | | | | | | | | | | | | | | | 0.25 | | | | 0.49 | |
| | | | | | |
SEC 30-day Yield | | | | | | | | | | | | | | | | | | | 0.15 | | | | 0.30 | |
Taxable-Equivalent SEC 30-day Yield | | | | | | | | | | | | | | | | | | | 0.25 | | | | 0.51 | |
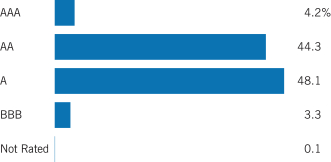
Fund Profile
Credit Quality (% of total investments)5
See Endnotes and Additional Disclosures in this report.
Past performance is no guarantee of future results. Returns are historical and are calculated by determining the percentage change in net asset value (NAV) or offering price (as applicable) with all distributions reinvested. Investment return and principal value will fluctuate so that shares, when redeemed, may be worth more or less than their original cost. Performance for periods less than or equal to one year is cumulative. Performance is for the stated time period only; due to market volatility, current Fund performance may be lower or higher than the quoted return. For performance as of the most recent month-end, please refer to eatonvance.com.
Eaton Vance
Floating-Rate Municipal Income Fund
September 30, 2020
Endnotes and Additional Disclosures
| 1 | Bloomberg Barclays 1 Year Municipal Bond Index is an unmanaged index of municipal bonds traded in the U.S. with maturities ranging from 1-2 years. Unless otherwise stated, index returns do not reflect the effect of any applicable sales charges, commissions, expenses, taxes or leverage, as applicable. It is not possible to invest directly in an index. |
| 2 | Total Returns at NAV do not include applicable sales charges. If sales charges were deducted, the returns would be lower. Total Returns shown with maximum sales charge reflect the stated maximum sales charge. Unless otherwise stated, performance does not reflect the deduction of taxes on Fund distributions or redemptions of Fund shares. |
Effective August 19, 2013, the Fund changed its investment objective and policies. Prior to August 19, 2013, the Fund employed a strategy of investing in fixed-rate bonds with a dollar-weighted average portfolio duration of between three and nine years. Performance prior to August 19, 2013 reflects the Fund’s performance under its former investment objective and policies.
| 3 | Source: Fund prospectus. The expense ratios for the current reporting period can be found in the Financial Highlights section of this report. |
| 4 | The Distribution Rate is based on the Fund’s last regular distribution per share in the period (annualized) divided by the Fund’s NAV at the end of the period. The Fund’s distributions may be comprised of amounts characterized for federal income tax purposes as tax-exempt income, qualified and non-qualified ordinary dividends, capital gains and nondividend distributions, also known as return of capital. The Fund will determine the federal income tax character of distributions paid to a shareholder after the end of the calendar year. This is reported on the IRS form 1099- DIV and provided to the shareholder shortly after each year-end. The Fund’s distributions are determined by the investment adviser based on its current assessment of the Fund’s long-term return potential. As portfolio and market conditions change, the rate of distributions paid by the Fund could change. Taxable-equivalent performance is based on the highest combined federal and state income tax rates, where applicable. Lower tax rates would result in lower tax-equivalent performance. Actual tax rates will vary depending on your income, exemptions and deductions. Rates do not include local taxes. The SEC Yield is a standardized measure based on the estimated yield to maturity of a fund’s investments over a 30-day period and is based on the maximum offer price at the date specified. The SEC Yield is not based on the distributions made by the Fund, which may differ. |
| 5 | Ratings are based on Moody’s Investors Service, Inc. (“Moody’s”), S&P Global Ratings (“S&P”) or Fitch Ratings (“Fitch”), as applicable. If securities are rated differently by the ratings agencies, the highest rating is applied. Ratings, which are subject to change, apply to the creditworthiness of the issuers of the underlying securities and not to the Fund or its shares. Credit ratings measure the quality of a bond based on the issuer’s creditworthiness, with ratings ranging from AAA, being the highest, to D, being the lowest based on S&P’s measures. Ratings of BBB or higher by S&P or Fitch (Baa or higher by Moody’s) are considered to be investment-grade quality. Credit ratings are based largely on the ratings agency’s analysis at the time of rating. The rating assigned to any particular security is not necessarily a reflection of the issuer’s current financial condition and does not necessarily reflect its |
| | assessment of the volatility of a security’s market value or of the liquidity of an investment in the security. Holdings designated as “Not Rated” (if any) are not rated by the national ratings agencies stated above. |
Fund profile subject to change due to active management.
Eaton Vance
Floating-Rate Municipal Income Fund
September 30, 2020
Fund Expenses
Example: As a Fund shareholder, you incur two types of costs: (1) transaction costs, including sales charges (loads) on purchases and redemption fees (if applicable); and (2) ongoing costs, including management fees; distribution and/or service fees; and other Fund expenses. This Example is intended to help you understand your ongoing costs (in dollars) of Fund investing and to compare these costs with the ongoing costs of investing in other mutual funds. The Example is based on an investment of $1,000 invested at the beginning of the period and held for the entire period (April 1, 2020 – September 30, 2020).
Actual Expenses: The first section of the table below provides information about actual account values and actual expenses. You may use the information in this section, together with the amount you invested, to estimate the expenses that you paid over the period. Simply divide your account value by $1,000 (for example, an $8,600 account value divided by $1,000 = 8.6), then multiply the result by the number in the first section under the heading entitled “Expenses Paid During Period” to estimate the expenses you paid on your account during this period.
Hypothetical Example for Comparison Purposes: The second section of the table below provides information about hypothetical account values and hypothetical expenses based on the actual Fund expense ratio and an assumed rate of return of 5% per year (before expenses), which is not the actual Fund return. The hypothetical account values and expenses may not be used to estimate the actual ending account balance or expenses you paid for the period. You may use this information to compare the ongoing costs of investing in your Fund and other funds. To do so, compare this 5% hypothetical example with the 5% hypothetical examples that appear in the shareholder reports of the other funds.
Please note that the expenses shown in the table are meant to highlight your ongoing costs only and do not reflect any transactional costs, such as sales charges (loads) or redemption fees (if applicable). Therefore, the second section of the table is useful in comparing ongoing costs only, and will not help you determine the relative total costs of owning different funds. In addition, if these transactional costs were included, your costs would be higher.
| | | | | | | | | | | | | | | | |
| | | Beginning
Account Value
(4/1/20) | | | Ending
Account Value
(9/30/20) | | | Expenses Paid
During Period*
(4/1/20 – 9/30/20) | | | Annualized
Expense
Ratio | |
| | | | |
Actual | | | | | | | | | | | | | | | | |
Class A | | $ | 1,000.00 | | | $ | 998.30 | | | $ | 2.86 | | | | 0.57 | % |
Class I | | $ | 1,000.00 | | | $ | 999.10 | | | $ | 2.10 | | | | 0.42 | % |
| | | | | |
Hypothetical | | | | | | | | | | | | | | | | |
(5% return per year before expenses) | | | | | | | | | | | | | | | | |
Class A | | $ | 1,000.00 | | | $ | 1,022.20 | | | $ | 2.89 | | | | 0.57 | % |
Class I | | $ | 1,000.00 | | | $ | 1,023.00 | | | $ | 2.13 | | | | 0.42 | % |
| * | Expenses are equal to the Fund’s annualized expense ratio for the indicated Class, multiplied by the average account value over the period, multiplied by 183/365 (to reflect the one-half year period). The Example assumes that the $1,000 was invested at the net asset value per share determined at the close of business on March 31, 2020. |
Eaton Vance
Floating-Rate Municipal Income Fund
September 30, 2020
Portfolio of Investments (Unaudited)
| | | | | | | | |
| Tax-Exempt Municipal Securities — 97.6% | |
| Security | | Principal
Amount
(000’s omitted) | | | Value | |
|
| Education — 9.2% | |
| | |
California Infrastructure and Economic Development Bank, (The Colburn School), 1.31%, (SIFMA + 1.20%), 6/1/22 (Put Date), 8/1/37(1) | | $ | 20,000 | | | $ | 20,084,600 | |
| | |
Lehigh County General Purpose Authority, PA, (Muhlenberg College), 0.69%, (SIFMA + 0.58%), 11/1/24 (Put Date), 11/1/37(1) | | | 3,835 | | | | 3,823,802 | |
| | |
Montana State University, 0.56%, (SIFMA + 0.45%), 9/1/23 (Put Date), 11/15/35(1) | | | 1,680 | | | | 1,678,354 | |
| | |
Ohio Higher Educational Facility Commission, (Case Western Reserve University), 0.529%, (70% of 1 mo. USD LIBOR + 0.42%), 4/1/22 (Put Date), 10/1/44(1) | | | 6,750 | | | | 6,744,397 | |
| | |
University of Michigan, 0.38%, (SIFMA + 0.27%), 4/1/22 (Put Date), 4/1/33(1) | | | 3,440 | | | | 3,442,236 | |
| | |
University of North Carolina at Chapel Hill, 0.454%, (67% of 1 mo. USD LIBOR + 0.35%), 12/1/21 (Put Date), 12/1/41(1) | | | 5,000 | | | | 5,000,350 | |
| | |
| | | | | | | $ | 40,773,739 | |
|
| Electric Utilities — 4.5% | |
| | |
Long Island Power Authority, NY, Electric System Revenue, Series 2014C, 0.859%, (70% of 1 mo. USD LIBOR + 0.75%), 10/1/23 (Put Date), 5/1/33(1) | | $ | 5,050 | | | $ | 5,048,586 | |
| | |
Long Island Power Authority, NY, Electric System Revenue, Series 2015C, 0.859%, (70% of 1 mo. USD LIBOR + 0.75%), 10/1/23 (Put Date), 5/1/33(1) | | | 1,750 | | | | 1,749,528 | |
| | |
Oklahoma Municipal Power Authority, 0.50%, (SIFMA + 0.39%), 1/1/23(1) | | | 5,035 | | | | 5,034,496 | |
| | |
Seattle, WA, Municipal Light and Power Revenue, 0.60%, (SIFMA + 0.49%), 11/1/23 (Put Date), 11/1/46(1) | | | 8,000 | | | | 8,028,480 | |
| | |
| | | | | | | $ | 19,861,090 | |
|
| General Obligations — 10.1% | |
| | |
Bethlehem Area School District Authority, PA, 0.586%, (70% of 1 mo. USD LIBOR + 0.48%), 11/1/21 (Put Date), 7/1/31(1) | | $ | 2,000 | | | $ | 1,985,980 | |
| | |
Bethlehem Area School District Authority, PA, 0.596%, (70% of 1 mo. USD LIBOR + 0.49%), 11/1/21 (Put Date), 1/1/30(1) | | | 7,955 | | | | 7,900,111 | |
| | |
Connecticut, 0.86%, (SIFMA + 0.75%),
3/1/21(1) | | | 275 | | | | 275,547 | |
| | |
Connecticut, 0.96%, (SIFMA + 0.85%),
3/1/22(1) | | | 700 | | | | 704,977 | |
| | |
Delaware Valley Regional Finance Authority, PA, 0.64%, (SIFMA + 0.53%), 9/1/23 (Put Date), 9/1/48(1) | | | 9,100 | | | | 9,017,918 | |
| | |
Delaware Valley Regional Finance Authority, PA, 0.864%, (67% of 1 mo. USD LIBOR + 0.76%), 9/1/24 (Put Date), 9/1/48(1) | | | 10,000 | | | | 9,987,700 | |
| | |
Illinois, 5.125%, 5/1/22 | | | 500 | | | | 521,950 | |
| | | | | | | | |
| Security | | Principal
Amount
(000’s omitted) | | | Value | |
|
| General Obligations (continued) | |
| | |
Katy Independent School District, TX, (PSF Guaranteed), 0.38%, (67% of 1 mo. USD LIBOR + 0.28%),
8/16/21 (Put Date), 8/15/36(1) | | $ | 4,800 | | | $ | 4,784,976 | |
| | |
Manheim Township School District, PA, 0.575%, (68% of 1 mo. USD LIBOR + 0.47%), 11/1/21 (Put Date), 5/1/25(1) | | | 3,400 | | | | 3,382,830 | |
| | |
Massachusetts, 0.718%, (67% of 3 mo. USD LIBOR + 0.55%), 11/1/25(1) | | | 6,400 | | | | 6,391,552 | |
| | |
| | | | | | | $ | 44,953,541 | |
|
| Hospital — 26.8% | |
| | |
Arizona Health Facilities Authority, (Phoenix Children’s Hospital), 1.96%, (SIFMA + 1.85%), 2/1/23 (Put Date), 2/1/48(1) | | $ | 7,500 | | | $ | 7,627,950 | |
| | |
Charlotte-Mecklenburg Hospital Authority, NC, (Atrium Health), 0.71%, (SIFMA + 0.60%), 12/1/23 (Put Date), 1/15/48(1) | | | 5,000 | | | | 5,003,550 | |
| | |
Charlotte-Mecklenburg Hospital Authority, NC, (Carolinas HealthCare System), (SPA: JPMorgan Chase Bank, N.A.), 0.13%, 1/15/37(2) | | | 1,500 | | | | 1,500,000 | |
| | |
Colorado Health Facilities Authority, (Valley View Hospital Association), 2.80% to 5/15/23 (Put Date), 5/15/42 | | | 2,845 | | | | 2,971,432 | |
| | |
Geisinger Authority, PA, (Geisinger Health System Foundation), 1.167%, (67% of 1 mo. USD LIBOR + 1.07%), 6/1/24 (Put Date), 6/1/28(1) | | | 2,000 | | | | 1,994,980 | |
| | |
Harris County Cultural Education Facilities Finance Corp., TX, (Memorial Hermann Health System), 0.68%, (SIFMA + 0.57%), 12/4/24 (Put Date), 12/1/49(1) | | | 1,800 | | | | 1,791,036 | |
| | |
Illinois Finance Authority, (Edward-Elmhurst Healthcare), 0.86%, (SIFMA + 0.75%), 7/1/23 (Put Date), 1/1/46(1) | | | 7,500 | | | | 7,504,425 | |
| | |
Indiana Finance Authority, (Parkview Health), 0.66%, (SIFMA + 0.55%), 11/1/23 (Put Date), 11/1/39(1) | | | 6,785 | | | | 6,783,711 | |
| | |
Iowa Finance Authority, (Iowa Health System), 0.69%, (SIFMA + 0.58%), 1/4/24 (Put Date), 2/15/35(1)(3) | | | 11,210 | | | | 11,137,471 | |
| | |
Irving Hospital Authority, TX, (Baylor Scott & White Medical Center - Irving), 1.21%, (SIFMA + 1.10%), 10/15/23 (Put Date), 10/15/44(1) | | | 1,665 | | | | 1,627,771 | |
| | |
Louisiana Public Facilities Authority, (Louisiana Children’s Medical Center), 0.76%, (SIFMA + 0.65%), 9/1/23 (Put Date), 9/1/57(1) | | | 10,000 | | | | 9,982,200 | |
| | |
Michigan Finance Authority, (McLaren Health Care), 0.503%, (68% of 1 mo. USD LIBOR + 0.40%), 10/15/21 (Put Date), 10/15/30(1) | | | 890 | | | | 884,224 | |
| | |
Michigan Finance Authority, (Trinity Health Credit Group), 0.59%, (SIFMA + 0.48%), 2/1/22 (Put Date), 3/1/51(1) | | | 5,000 | | | | 4,999,450 | |
| | |
Michigan Finance Authority, (Trinity Health Credit Group), 0.641%, (67% of 1 mo. USD LIBOR + 0.54%), 12/1/20 (Put Date),
12/1/39(1) | | | 5,100 | | | | 5,098,980 | |
| | |
Montgomery County Higher Education and Health Authority, PA, (Thomas Jefferson University), 0.83%, (SIFMA + 0.72%), 9/1/23 (Put Date), 9/1/51(1) | | | 10,500 | | | | 10,496,640 | |
| | | | |
| | 5 | | See Notes to Financial Statements. |
Eaton Vance
Floating-Rate Municipal Income Fund
September 30, 2020
Portfolio of Investments (Unaudited) — continued
| | | | | | | | |
| Security | | Principal
Amount
(000’s omitted) | | | Value | |
|
| Hospital (continued) | |
| | |
Northampton County General Purpose Authority, PA, (St. Luke’s University Health Network), 1.149%, (70% of 1 mo. USD LIBOR + 1.04%), 8/15/24 (Put Date), 8/15/48(1) | | $ | 2,000 | | | $ | 1,993,560 | |
| | |
Ohio, (Cleveland Clinic Health System), 0.51%, (SIFMA + 0.40%), 6/1/23 (Put Date), 1/1/52(1) | | | 18,440 | | | | 18,371,587 | |
| | |
Southcentral Pennsylvania General Authority, (WellSpan Health Obligated Group), 0.71%, (SIFMA + 0.60%), 6/1/24 (Put Date), 6/1/49(1) | | | 7,500 | | | | 7,502,025 | |
| | |
Washington Health Care Facilities Authority, (Catholic Health Initiatives), 1.11%, (SIFMA + 1.00%), 1/1/21 (Put Date), 1/1/35(1) | | | 3,000 | | | | 2,994,630 | |
| | |
Wisconsin Health and Educational Facilities Authority, (Advocate Aurora Health Credit Group), 0.66%, (SIFMA + 0.55%), 7/26/23 (Put Date), 8/15/54(1) | | | 1,000 | | | | 1,000,420 | |
| | |
Wisconsin Health and Educational Facilities Authority, (Advocate Aurora Health Credit Group), 0.76%, (SIFMA + 0.65%), 7/31/24 (Put Date), 8/15/54(1) | | | 8,200 | | | | 8,212,874 | |
| | |
| | | | | | | $ | 119,478,916 | |
|
| Housing — 9.9% | |
| | |
Massachusetts Housing Finance Agency, (FHLMC), (FNMA), (GNMA), 0.459%, (70% of 1 mo. USD LIBOR + 0.35%), 6/1/21 (Put Date), 12/1/48(1) | | $ | 4,000 | | | $ | 4,000,080 | |
| | |
Massachusetts Housing Finance Agency, (Mill Road Apartments), 0.66%, (SIFMA + 0.55%), 11/1/23 (Put Date), 11/1/48(1) | | | 3,955 | | | | 3,955,000 | |
| | |
Massachusetts Housing Finance Agency, (Single Family Housing), 0.44%, (SIFMA + 0.33%), 12/1/21 (Put Date), 12/1/48(1) | | | 3,775 | | | | 3,775,264 | |
| | |
Minnesota Housing Finance Agency, (FHLMC), (FNMA), (GNMA), 0.54%, (SIFMA + 0.43%), 7/3/23 (Put Date), 1/1/45(1) | | | 10,000 | | | | 9,999,600 | |
| | |
Minnesota Housing Finance Agency, (FHLMC), (FNMA), (GNMA), 0.66%, (SIFMA + 0.55%), 12/12/23 (Put Date), 7/1/41(1) | | | 10,000 | | | | 10,025,300 | |
| | |
Pennsylvania Housing Finance Agency, 0.676%, (70% of 1 mo. USD LIBOR + 0.57%), 10/1/23 (Put Date), 10/1/47(1) | | | 2,440 | | | | 2,438,317 | |
| | |
Pennsylvania Housing Finance Agency, 0.706%, (70% of 1 mo. USD LIBOR + 0.60%), 6/1/23 (Put Date), 10/1/45(1) | | | 5,000 | | | | 5,005,100 | |
| | |
Washington Housing Finance Commission, 0.66%, (SIFMA + 0.55%), 10/1/23 (Put Date), 12/1/48(1) | | | 5,000 | | | | 5,012,150 | |
| | |
| | | | | | | $ | 44,210,811 | |
|
| Industrial Development Revenue — 2.6% | |
| | |
Mission Economic Development Corp., TX, (Waste Management, Inc.), (AMT), 0.91%, (SIFMA + 0.80%), 11/1/21 (Put Date), 11/1/48(1) | | $ | 5,000 | | | $ | 5,001,950 | |
| | | | | | | | |
| Security | | Principal
Amount
(000’s omitted) | | | Value | |
|
| Industrial Development Revenue (continued) | |
| | |
National Finance Authority, NH, (Waste Management, Inc.), (AMT), 0.86%, (SIFMA + 0.75%), 10/1/21 (Put Date), 10/1/33(1) | | $ | 6,750 | | | $ | 6,751,080 | |
| | |
| | | | | | | $ | 11,753,030 | |
|
| Insured – General Obligations — 1.2% | |
| | |
Allegheny County, PA, (AGM), 0.718%, (67% of 3 mo. USD LIBOR + 0.55%), 11/1/26(1) | | $ | 5,230 | | | $ | 5,174,144 | |
| | |
| | | | | | | $ | 5,174,144 | |
|
| Insured – Lease Revenue / Certificates of Participation — 0.4% | |
| | |
Kentucky Asset/Liability Commission, (NPFG), 0.718%, (67% of 3 mo. USD LIBOR + 0.55%), 11/1/25(1) | | $ | 2,000 | | | $ | 1,973,080 | |
| | |
| | | | | | | $ | 1,973,080 | |
|
| Insured – Transportation — 0.6% | |
| | |
Metropolitan Transportation Authority, NY, (AGM), 0.407%, (69% of 1 mo. USD LIBOR + 0.30%), 4/1/21 (Put Date), 11/1/32(1) | | $ | 1,500 | | | $ | 1,483,560 | |
| | |
Metropolitan Transportation Authority, NY, (AGM), 0.787%, (69% of 1 mo. USD LIBOR + 0.68%), 4/6/21 (Put Date), 11/1/32(1) | | | 1,250 | | | | 1,238,237 | |
| | |
| | | | | | | $ | 2,721,797 | |
|
| Lease Revenue / Certificates of Participation — 0.5% | |
| | |
New Jersey Economic Development Authority, (School Facilities Construction), 1.66%, (SIFMA + 1.55%), 9/1/27(1) | | $ | 2,000 | | | $ | 1,976,980 | |
| | |
| | | | | | | $ | 1,976,980 | |
|
| Other Revenue — 16.5% | |
| | |
Black Belt Energy Gas District, AL, 0.73%, (SIFMA + 0.62%), 12/1/23 (Put Date), 12/1/48(1) | | $ | 20,000 | | | $ | 20,027,600 | |
| | |
California Infrastructure and Economic Development Bank, (California Academy of Sciences), 0.486%, (70% of 1 mo. USD LIBOR + 0.38%), 8/1/21 (Put Date), 8/1/47(1) | | | 10,000 | | | | 9,967,200 | |
| | |
California Infrastructure and Economic Development Bank, (Museum Associates), 0.754%, (70% of 1 mo. USD LIBOR + 0.65%), 2/1/21 (Put Date), 12/1/50(1) | | | 3,000 | | | | 2,999,010 | |
| | |
Northern California Gas Authority No. 1, Gas Project Revenue, 0.918%, (67% of 3 mo. USD LIBOR + 0.72%), 7/1/27(1) | | | 3,665 | | | | 3,629,486 | |
| | |
Patriots Energy Group Financing Agency, SC, Gas Supply Revenue, (Liq: Royal Bank of Canada), 0.96%, (67% of 1 mo. USD LIBOR + 0.86%), 2/1/24 (Put Date), 10/1/48(1) | | | 17,500 | | | | 17,529,400 | |
| | |
Southeast Alabama Gas Supply District, (Project No. 2), 0.954%, (67% of 1 mo. USD LIBOR + 0.85%), 6/1/24 (Put Date), 6/1/49(1) | | | 5,000 | | | | 4,986,450 | |
| | | | |
| | 6 | | See Notes to Financial Statements. |
Eaton Vance
Floating-Rate Municipal Income Fund
September 30, 2020
Portfolio of Investments (Unaudited) — continued
| | | | | | | | |
| Security | | Principal
Amount
(000’s omitted) | | | Value | |
|
| Other Revenue (continued) | |
| | |
Washington Health Care Facilities Authority, (Fred Hutchinson Cancer Research Center), 1.16%, (SIFMA + 1.05%), 7/3/23 (Put Date), 1/1/42(1) | | $ | 12,000 | | | $ | 12,120,480 | |
| | |
Washington Health Care Facilities Authority, (Fred Hutchinson Cancer Research Center), 1.201%, (67% of 1 mo. USD LIBOR + 1.10%), 7/1/22 (Put Date),
1/1/42(1) | | | 2,000 | | | | 2,012,400 | |
| | |
| | | | | | | $ | 73,272,026 | |
|
| Special Tax Revenue — 0.0%(4) | |
| | |
New River Community Development District, FL, (Capital Improvements),
5.00%, 5/1/13(5) | | $ | 35 | | | $ | 0 | |
| | |
New River Community Development District, FL, (Capital Improvements), Series 2010A-2, 5.75%, 5/1/38 | | | 60 | | | | 60,155 | |
| | |
Sterling Hill Community Development District, FL, (Capital Improvements),
5.50%, 11/1/10(5) | | | 90 | | | | 56,873 | |
| | |
| | | | | | | $ | 117,028 | |
|
| Transportation — 14.4% | |
| | |
Bay Area Toll Authority, CA, (San Francisco Bay Area), 0.757%, (70% of 3 mo. USD LIBOR + 0.55%), 4/1/21 (Put Date),
4/1/45(1) | | $ | 12,000 | | | $ | 12,000,480 | |
| | |
E-470 Public Highway Authority, CO, 0.517%, (67% of 1 mo. USD LIBOR + 0.42%), 9/1/21 (Put Date), 9/1/39(1) | | | 5,000 | | | | 5,000,150 | |
| | |
Metropolitan Transportation Authority, NY, 0.54%, (SIFMA + 0.43%), 2/1/25 (Put Date), 11/1/31(1) | | | 20,000 | | | | 18,022,800 | |
| | |
New Jersey Transportation Trust Fund Authority, (Transportation Program), 1.31%, (SIFMA + 1.20%), 12/15/21 (Put Date), 6/15/34(1) | | | 9,000 | | | | 9,003,330 | |
| | |
New Jersey Turnpike Authority, 0.569%, (70% of 1 mo. USD LIBOR + 0.46%), 1/1/21 (Put Date), 1/1/28(1) | | | 2,000 | | | | 1,999,660 | |
| | |
Pennsylvania Turnpike Commission, 0.71%, (SIFMA + 0.60%), 12/1/23(1) | | | 1,000 | | | | 1,004,700 | |
| | |
Pennsylvania Turnpike Commission, 0.81%, (SIFMA + 0.70%), 12/1/23(1) | | | 2,500 | | | | 2,514,350 | |
| | |
South Carolina Transportation Infrastructure Bank, 0.554%, (67% of 1 mo. USD LIBOR + 0.45%), 10/1/22 (Put Date), 10/1/31(1) | | | 7,955 | | | | 7,915,623 | |
| | |
Triborough Bridge and Tunnel Authority, NY, 0.804%, (67% of 1 mo. USD LIBOR + 0.70%), 2/1/21 (Put Date), 1/1/32(1) | | | 6,605 | | | | 6,609,293 | |
| | |
| | | | | | | $ | 64,070,386 | |
|
| Water and Sewer — 0.9% | |
| | |
North Penn Water Authority, PA, 0.27%, (SIFMA + 0.16%), 11/1/20(1) | | $ | 1,000 | | | $ | 999,790 | |
| | |
North Penn Water Authority, PA, 0.47%, (SIFMA + 0.36%), 11/1/22(1) | | | 1,450 | | | | 1,443,765 | |
| | | | | | | | |
| Security | | Principal
Amount
(000’s omitted) | | | Value | |
|
| Water and Sewer (continued) | |
| | |
North Penn Water Authority, PA, 0.67%, (SIFMA + 0.56%), 11/1/24(1) | | $ | 1,690 | | | $ | 1,679,691 | |
| | |
| | | | | | | $ | 4,123,246 | |
| |
Total Tax-Exempt Municipal Securities — 97.6%
(identified cost $436,979,914) | | | $ | 434,459,814 | |
| |
Other Assets, Less Liabilities — 2.4% | | | $ | 10,864,924 | |
| |
Net Assets — 100.0% | | | $ | 445,324,738 | |
The percentage shown for each investment category in the Portfolio of Investments is based on net assets.
At September 30, 2020, the concentration of the Fund’s investments in the various states, determined as a percentage of net assets, is as follows:
| | | | |
| |
| Pennsylvania | | | 17.6% | |
| |
| California | | | 11.0% | |
| |
| Others, representing less than 10% individually | | | 69.0% | |
The Fund invests primarily in debt securities issued by municipalities. The ability of the issuers of the debt securities to meet their obligations may be affected by economic developments in a specific industry or municipality. At September 30, 2020, 2.3% of total investments are backed by bond insurance of various financial guaranty assurance agencies. The aggregate percentage insured by an individual financial guaranty assurance agency ranged from 0.5% to 1.8% of total investments.
| (1) | Floating rate security. The stated interest rate represents the rate in effect at September 30, 2020. |
| (2) | Variable rate demand obligation that may be tendered at par on any day for payment the same or next business day. The stated interest rate, which generally resets daily, is determined by the remarketing agent and represents the rate in effect at September 30, 2020. |
| (3) | Security exempt from registration under Rule 144A of the Securities Act of 1933, as amended. These securities may be sold in certain transactions in reliance on an exemption from registration (normally to qualified institutional buyers). At September 30, 2020, the aggregate value of these securities is $11,137,471 or 2.5% of the Fund’s net assets. |
| (4) | Amount is less than 0.05%. |
| (5) | Issuer is in default with respect to interest and/or principal payments. |
| | | | |
| | 7 | | See Notes to Financial Statements. |
Eaton Vance
Floating-Rate Municipal Income Fund
September 30, 2020
Portfolio of Investments (Unaudited) — continued
Abbreviations:
| | | | |
| | |
| AGM | | – | | Assured Guaranty Municipal Corp. |
| | |
| AMT | | – | | Interest earned from these securities may be considered a tax preference item for purposes of the Federal Alternative Minimum Tax. |
| | |
| FHLMC | | – | | Federal Home Loan Mortgage Corp. |
| | |
| FNMA | | – | | Federal National Mortgage Association |
| | |
| GNMA | | – | | Government National Mortgage Association |
| | |
| LIBOR | | – | | London Interbank Offered Rate |
| | |
| Liq | | – | | Liquidity Provider |
| | |
| NPFG | | – | | National Public Finance Guarantee Corp. |
| | |
| PSF | | – | | Permanent School Fund |
| | |
| SIFMA | | – | | Securities Industry and Financial Markets Association Municipal Swap Index |
| | |
| SPA | | – | | Standby Bond Purchase Agreement |
| | |
| USD | | – | | United States Dollar |
| | | | |
| | 8 | | See Notes to Financial Statements. |
Eaton Vance
Floating-Rate Municipal Income Fund
September 30, 2020
Statement of Assets and Liabilities (Unaudited)
| | | | |
| Assets | | September 30, 2020 | |
| |
Investments, at value (identified cost, $436,979,914) | | $ | 434,459,814 | |
| |
Cash | | | 3,934,791 | |
| |
Interest receivable | | | 404,700 | |
| |
Receivable for investments sold | | | 8,905,000 | |
| |
Receivable for Fund shares sold | | | 80,069 | |
| |
Total assets | | $ | 447,784,374 | |
|
| Liabilities | |
| |
Payable for Fund shares redeemed | | $ | 2,140,975 | |
| |
Distributions payable | | | 10,813 | |
| |
Payable to affiliates: | | | | |
| |
Investment adviser fee | | | 120,299 | |
| |
Distribution and service fees | | | 27,835 | |
| |
Accrued expenses | | | 159,714 | |
| |
Total liabilities | | $ | 2,459,636 | |
| |
Net Assets | | $ | 445,324,738 | |
|
| Sources of Net Assets | |
| |
Paid-in capital | | $ | 450,815,896 | |
| |
Accumulated loss | | | (5,491,158 | ) |
| |
Net Assets | | $ | 445,324,738 | |
|
| Class A Shares | |
| |
Net Assets | | $ | 221,559,072 | |
| |
Shares Outstanding | | | 22,687,731 | |
|
Net Asset Value and Redemption Price Per Share | |
| |
(net assets ÷ shares of beneficial interest outstanding) | | $ | 9.77 | |
|
Maximum Offering Price Per Share | |
| |
(100 ÷ 97.75 of net asset value per share) | | $ | 9.99 | |
|
| Class I Shares | |
| |
Net Assets | | $ | 223,765,666 | |
| |
Shares Outstanding | | | 22,901,275 | |
| |
Net Asset Value, Offering Price and Redemption Price Per Share | | | | |
| |
(net assets ÷ shares of beneficial interest outstanding) | | $ | 9.77 | |
On sales of $100,000 or more, the offering price of Class A shares is reduced.
| | | | |
| | 9 | | See Notes to Financial Statements. |
Eaton Vance
Floating-Rate Municipal Income Fund
September 30, 2020
Statement of Operations (Unaudited)
| | | | |
| Investment Income | | Six Months Ended
September 30, 2020 | |
| |
Interest | | $ | 2,170,263 | |
| |
Total investment income | | $ | 2,170,263 | |
|
| Expenses | |
| |
Investment adviser fee | | $ | 812,723 | |
|
Distribution and service fees | |
| |
Class A | | | 187,037 | |
| |
Trustees’ fees and expenses | | | 13,371 | |
| |
Custodian fee | | | 75,793 | |
| |
Transfer and dividend disbursing agent fees | | | 34,518 | |
| |
Legal and accounting services | | | 24,462 | |
| |
Printing and postage | | | 11,274 | |
| |
Registration fees | | | 40,617 | |
| |
Miscellaneous | | | 30,273 | |
| |
Total expenses | | $ | 1,230,068 | |
| |
Net investment income | | $ | 940,195 | |
|
| Realized and Unrealized Gain (Loss) | |
|
Net realized gain (loss) — | |
| |
Investment transactions | | $ | (1,326,578 | ) |
| |
Net realized loss | | $ | (1,326,578 | ) |
|
Change in unrealized appreciation (depreciation) — | |
| |
Investments | | $ | (1,420,156 | ) |
| |
Net change in unrealized appreciation (depreciation) | | $ | (1,420,156 | ) |
| |
Net realized and unrealized loss | | $ | (2,746,734 | ) |
| |
Net decrease in net assets from operations | | $ | (1,806,539 | ) |
| | | | |
| | 10 | | See Notes to Financial Statements. |
Eaton Vance
Floating-Rate Municipal Income Fund
September 30, 2020
Statements of Changes in Net Assets
| | | | | | | | |
| Increase (Decrease) in Net Assets | | Six Months Ended September 30, 2020
(Unaudited) | | | Year Ended March 31, 2020 | |
| | |
From operations — | | | | | | | | |
| | |
Net investment income | | $ | 940,195 | | | $ | 10,354,893 | |
| | |
Net realized loss | | | (1,326,578 | ) | | | (1,092,745 | ) |
| | |
Net change in unrealized appreciation (depreciation) | | | (1,420,156 | ) | | | (1,389,159 | ) |
| | |
Net increase (decrease) in net assets from operations | | $ | (1,806,539 | ) | | $ | 7,872,989 | |
| | |
Distributions to shareholders — | | | | | | | | |
| | |
Class A | | $ | (366,911 | ) | | $ | (3,936,734 | ) |
| | |
Class I | | | (556,404 | ) | | | (6,398,797 | ) |
| | |
Total distributions to shareholders | | $ | (923,315 | ) | | $ | (10,335,531 | ) |
| | |
Transactions in shares of beneficial interest — | | | | | | | | |
| | |
Proceeds from sale of shares | | | | | | | | |
| | |
Class A | | $ | 10,832,815 | | | $ | 216,416,435 | |
| | |
Class I | | | 52,331,628 | | | | 225,365,243 | |
| | |
Net asset value of shares issued to shareholders in payment of distributions declared | | | | | | | | |
| | |
Class A | | | 361,514 | | | | 3,815,304 | |
| | |
Class I | | | 457,028 | | | | 5,547,624 | |
| | |
Cost of shares redeemed | | | | | | | | |
| | |
Class A | | | (70,021,751 | ) | | | (194,335,552 | ) |
| | |
Class I | | | (116,331,372 | ) | | | (403,345,225 | ) |
| | |
Net decrease in net assets from Fund share transactions | | $ | (122,370,138 | ) | | $ | (146,536,171 | ) |
| | |
Net decrease in net assets | | $ | (125,099,992 | ) | | $ | (148,998,713 | ) |
| | |
| Net Assets | | | | | | | | |
| | |
At beginning of period | | $ | 570,424,730 | | | $ | 719,423,443 | |
| | |
At end of period | | $ | 445,324,738 | | | $ | 570,424,730 | |
| | | | |
| | 11 | | See Notes to Financial Statements. |
Eaton Vance
Floating-Rate Municipal Income Fund
September 30, 2020
Financial Highlights
| | | | | | | | | | | | | | | | | | | | | | | | |
| | | Class A | |
| | |
| | | Six Months Ended
September 30, 2020
(Unaudited) | | | Year Ended March 31, | |
| | | 2020 | | | 2019 | | | 2018 | | | 2017 | | | 2016 | |
| | | | | | | |
Net asset value — Beginning of period | | $ | 9.800 | | | $ | 9.830 | | | $ | 9.830 | | | $ | 9.800 | | | $ | 9.800 | | | $ | 9.900 | |
| | | | | | |
| Income (Loss) From Operations | | | | | | | | | | | | | | | | | | | | | | | | |
| | | | | | |
Net investment income(1) | | $ | 0.015 | | | $ | 0.138 | | | $ | 0.147 | | | $ | 0.090 | | | $ | 0.064 | | | $ | 0.053 | |
| | | | | | |
Net realized and unrealized gain (loss) | | | (0.031 | ) | | | (0.029 | ) | | | (0.001 | ) | | | 0.029 | | | | 0.005 | | | | (0.099 | ) |
| | | | | | |
Total income (loss) from operations | | $ | (0.016 | ) | | $ | 0.109 | | | $ | 0.146 | | | $ | 0.119 | | | $ | 0.069 | | | $ | (0.046 | ) |
| | | | | | |
| Less Distributions | | | | | | | | | | | | | | | | | | | | | | | | |
| | | | | | |
From net investment income | | $ | (0.014 | ) | | $ | (0.139 | ) | | $ | (0.146 | ) | | $ | (0.089 | ) | | $ | (0.069 | ) | | $ | (0.053 | ) |
| | | | | | |
From net realized gain | | | — | | | | — | | | | — | | | | — | | | | — | | | | (0.001 | ) |
| | | | | | |
Total distributions | | $ | (0.014 | ) | | $ | (0.139 | ) | | $ | (0.146 | ) | | $ | (0.089 | ) | | $ | (0.069 | ) | | $ | (0.054 | ) |
| | | | | | |
Net asset value — End of period | | $ | 9.770 | | | $ | 9.800 | | | $ | 9.830 | | | $ | 9.830 | | | $ | 9.800 | | | $ | 9.800 | |
| | | | | | |
Total Return(2) | | | (0.17 | )%(3) | | | 1.12 | %(4) | | | 1.49 | %(4) | | | 1.22 | % | | | 0.71 | % | | | (0.46 | )% |
| | | | | | |
| Ratios/Supplemental Data | | | | | | | | | | | | | | | | | | | | | | | | |
| | | | | | |
Net assets, end of period (000’s omitted) | | $ | 221,559 | | | $ | 281,709 | | | $ | 257,118 | | | $ | 160,528 | | | $ | 139,418 | | | $ | 129,593 | |
| | | | | | |
Ratios (as a percentage of average daily net assets): | | | | | | | | | | | | | | | | | | | | | | | | |
| | | | | | |
Expenses(5) | | | 0.57 | %(6) | | | 0.59 | %(4) | | | 0.60 | %(4) | | | 0.60 | % | | | 0.63 | % | | | 0.61 | % |
| | | | | | |
Net investment income | | | 0.30 | %(6) | | | 1.40 | % | | | 1.49 | % | | | 0.92 | % | | | 0.65 | % | | | 0.54 | % |
| | | | | | |
Portfolio Turnover | | | 0 | %(3)(7) | | | 49 | % | | | 43 | % | | | 78 | % | | | 71 | % | | | 7 | % |
| (1) | Computed using average shares outstanding. |
| (2) | Returns are historical and are calculated by determining the percentage change in net asset value with all distributions reinvested and do not reflect the effect of sales charges. |
| (4) | The investment adviser and administrator reimbursed certain operating expenses (equal to less than 0.005% of average daily net assets for each of the years ended March 31, 2020 and 2019). Absent this reimbursement, total return would be lower. |
| (5) | Excludes the effect of custody fee credits, if any, of less than 0.005%. Effective September 1, 2015, custody fee credits, which were earned on cash deposit balances, were discontinued by the custodian. |
| (7) | Amount is less than 1%. |
| | | | |
| | 12 | | See Notes to Financial Statements. |
Eaton Vance
Floating-Rate Municipal Income Fund
September 30, 2020
Financial Highlights — continued
| | | | | | | | | | | | | | | | | | | | | | | | |
| | | Class I | |
| | |
| | | Six Months Ended
September 30, 2020
(Unaudited) | | | Year Ended March 31, | |
| | | 2020 | | | 2019 | | | 2018 | | | 2017 | | | 2016 | |
| | | | | | | |
Net asset value — Beginning of period | | $ | 9.800 | | | $ | 9.840 | | | $ | 9.830 | | | $ | 9.800 | | | $ | 9.800 | | | $ | 9.910 | |
| | | | | | |
| Income (Loss) From Operations | | | | | | | | | | | | | | | | | | | | | | | | |
| | | | | | |
Net investment income(1) | | $ | 0.022 | | | $ | 0.154 | | | $ | 0.162 | | | $ | 0.106 | | | $ | 0.075 | | | $ | 0.067 | |
| | | | | | |
Net realized and unrealized gain (loss) | | | (0.031 | ) | | | (0.039 | ) | | | 0.008 | | | | 0.028 | | | | 0.009 | | | | (0.108 | ) |
| | | | | | |
Total income (loss) from operations | | $ | (0.009 | ) | | $ | 0.115 | | | $ | 0.170 | | | $ | 0.134 | | | $ | 0.084 | | | $ | (0.041 | ) |
| | | | | | |
| Less Distributions | | | | | | | | | | | | | | | | | | | | | | | | |
| | | | | | |
From net investment income | | $ | (0.021 | ) | | $ | (0.155 | ) | | $ | (0.160 | ) | | $ | (0.104 | ) | | $ | (0.084 | ) | | $ | (0.068 | ) |
| | | | | | |
From net realized gain | | | — | | | | — | | | | — | | | | — | | | | — | | | | (0.001 | ) |
| | | | | | |
Total distributions | | $ | (0.021 | ) | | $ | (0.155 | ) | | $ | (0.160 | ) | | $ | (0.104 | ) | | $ | (0.084 | ) | | $ | (0.069 | ) |
| | | | | | |
Net asset value — End of period | | $ | 9.770 | | | $ | 9.800 | | | $ | 9.840 | | | $ | 9.830 | | | $ | 9.800 | | | $ | 9.800 | |
| | | | | | |
Total Return(2) | | | (0.09 | )%(3) | | | 1.17 | %(4) | | | 1.75 | %(4) | | | 1.37 | % | | | 0.86 | % | | | (0.41 | )% |
| | | | | | |
| Ratios/Supplemental Data | | | | | | | | | | | | | | | | | | | | | | | | |
| | | | | | |
Net assets, end of period (000’s omitted) | | $ | 223,766 | | | $ | 288,716 | | | $ | 462,305 | | | $ | 242,928 | | | $ | 139,300 | | | $ | 29,849 | |
| | | | | | |
Ratios (as a percentage of average daily net assets): | | | | | | | | | | | | | | | | | | | | | | | | |
| | | | | | |
Expenses(5) | | | 0.42 | %(6) | | | 0.44 | %(4) | | | 0.45 | %(4) | | | 0.45 | % | | | 0.48 | % | | | 0.46 | % |
| | | | | | |
Net investment income | | | 0.45 | %(6) | | | 1.56 | % | | | 1.65 | % | | | 1.08 | % | | | 0.77 | % | | | 0.69 | % |
| | | | | | |
Portfolio Turnover | | | 0 | %(3)(7) | | | 49 | % | | | 43 | % | | | 78 | % | | | 71 | % | | | 7 | % |
| (1) | Computed using average shares outstanding. |
| (2) | Returns are historical and are calculated by determining the percentage change in net asset value with all distributions reinvested. |
| (4) | The investment adviser and administrator reimbursed certain operating expenses (equal to less than 0.005% of average daily net assets for each of the years ended March 31, 2020 and 2019). Absent this reimbursement, total return would be lower. |
| (5) | Excludes the effect of custody fee credits, if any, of less than 0.005%. Effective September 1, 2015, custody fee credits, which were earned on cash deposit balances, were discontinued by the custodian. |
| (7) | Amount is less than 1%. |
| | | | |
| | 13 | | See Notes to Financial Statements. |
Eaton Vance
Floating-Rate Municipal Income Fund
September 30, 2020
Notes to Financial Statements (Unaudited)
1 Significant Accounting Policies
Eaton Vance Floating-Rate Municipal Income Fund (the Fund) is a diversified series of Eaton Vance Investment Trust (the Trust). The Trust is a Massachusetts business trust registered under the Investment Company Act of 1940, as amended (the 1940 Act), as an open-end management investment company. The Fund’s investment objective is to provide current income exempt from regular federal income tax. The Fund offers two classes of shares. Class A shares are generally sold subject to a sales charge imposed at time of purchase. Class I shares are sold at net asset value and are not subject to a sales charge. Each class represents a pro-rata interest in the Fund, but votes separately on class-specific matters and (as noted below) is subject to different expenses. Realized and unrealized gains and losses are allocated daily to each class of shares based on the relative net assets of each class to the total net assets of the Fund. Net investment income, other than class-specific expenses, is allocated daily to each class of shares based upon the ratio of the value of each class’s paid shares to the total value of all paid shares. Each class of shares differs in its distribution plan and certain other class-specific expenses.
The following is a summary of significant accounting policies of the Fund. The policies are in conformity with accounting principles generally accepted in the United States of America (U.S. GAAP). The Fund is an investment company and follows accounting and reporting guidance in the Financial Accounting Standards Board (FASB) Accounting Standards Codification Topic 946.
A Investment Valuation — The following methodologies are used to determine the market value or fair value of investments.
Debt Obligations. Debt obligations are generally valued on the basis of valuations provided by third party pricing services, as derived from such services’ pricing models. Inputs to the models may include, but are not limited to, reported trades, executable bid and ask prices, broker/dealer quotations, prices or yields of securities with similar characteristics, interest rates, anticipated prepayments, benchmark curves or information pertaining to the issuer, as well as industry and economic events. The pricing services may use a matrix approach, which considers information regarding securities with similar characteristics to determine the valuation for a security. Short-term debt obligations purchased with a remaining maturity of sixty days or less for which a valuation from a third party pricing service is not readily available may be valued at amortized cost, which approximates fair value.
Fair Valuation. Investments for which valuations or market quotations are not readily available or are deemed unreliable are valued at fair value using methods determined in good faith by or at the direction of the Trustees of the Fund in a manner that most fairly reflects the security’s “fair value”, which is the amount that the Fund might reasonably expect to receive for the security upon its current sale in the ordinary course. Each such determination is based on a consideration of relevant factors, which are likely to vary from one pricing context to another. These factors may include, but are not limited to, the type of security, the existence of any contractual restrictions on the security’s disposition, the price and extent of public trading in similar securities of the issuer or of comparable companies or entities, quotations or relevant information obtained from broker/dealers or other market participants, information obtained from the issuer, analysts, and/or the appropriate stock exchange (for exchange-traded securities), an analysis of the company’s or entity’s financial statements, and an evaluation of the forces that influence the issuer and the market(s) in which the security is purchased and sold.
B Investment Transactions and Related Income — Investment transactions for financial statement purposes are accounted for on a trade date basis. Realized gains and losses on investments sold are determined on the basis of identified cost. Interest income is recorded on the basis of interest accrued, adjusted for amortization of premium or accretion of discount.
C Federal Taxes — The Fund’s policy is to comply with the provisions of the Internal Revenue Code applicable to regulated investment companies and to distribute to shareholders each year substantially all of its taxable, if any, and tax-exempt net investment income, and all or substantially all of its net realized capital gains. Accordingly, no provision for federal income or excise tax is necessary. The Fund intends to satisfy conditions which will enable it to designate distributions from the interest income generated by its investments in non-taxable municipal securities, which are exempt from regular federal income tax when received by the Fund, as exempt-interest dividends.
As of September 30, 2020, the Fund had no uncertain tax positions that would require financial statement recognition, de-recognition, or disclosure. The Fund files a U.S. federal income tax return annually after its fiscal year-end, which is subject to examination by the Internal Revenue Service for a period of three years from the date of filing.
D Expenses — The majority of expenses of the Trust are directly identifiable to an individual fund. Expenses which are not readily identifiable to a specific fund are allocated taking into consideration, among other things, the nature and type of expense and the relative size of the funds.
E Legal Fees — Legal fees and other related expenses incurred as part of negotiations of the terms and requirement of capital infusions, or that are expected to result in the restructuring of, or a plan of reorganization for, an investment are recorded as realized losses. Ongoing expenditures to protect or enhance an investment are treated as operating expenses.
F Use of Estimates — The preparation of the financial statements in conformity with U.S. GAAP requires management to make estimates and assumptions that affect the reported amounts of assets and liabilities at the date of the financial statements and the reported amounts of income and expense during the reporting period. Actual results could differ from those estimates.
G Indemnifications — Under the Trust’s organizational documents, its officers and Trustees may be indemnified against certain liabilities and expenses arising out of the performance of their duties to the Fund. Under Massachusetts law, if certain conditions prevail, shareholders of a Massachusetts business trust (such as the Trust) could be deemed to have personal liability for the obligations of the Trust. However, the Trust’s Declaration of Trust contains an
Eaton Vance
Floating-Rate Municipal Income Fund
September 30, 2020
Notes to Financial Statements (Unaudited) — continued
express disclaimer of liability on the part of Fund shareholders and the By-laws provide that the Trust shall assume, upon request by the shareholder, the defense on behalf of any Fund shareholders. Moreover, the By-laws also provide for indemnification out of Fund property of any shareholder held personally liable solely by reason of being or having been a shareholder for all loss or expense arising from such liability. Additionally, in the normal course of business, the Fund enters into agreements with service providers that may contain indemnification clauses. The Fund’s maximum exposure under these arrangements is unknown as this would involve future claims that may be made against the Fund that have not yet occurred.
H Interim Financial Statements — The interim financial statements relating to September 30, 2020 and for the six months then ended have not been audited by an independent registered public accounting firm, but in the opinion of the Fund’s management, reflect all adjustments, consisting only of normal recurring adjustments, necessary for the fair presentation of the financial statements.
2 Distributions to Shareholders and Income Tax Information
The net investment income of the Fund is determined daily and substantially all of the net investment income so determined is declared as a dividend to shareholders of record at the time of declaration. Distributions are declared separately for each class of shares. Distributions are paid monthly. Distributions of realized capital gains are made at least annually. Shareholders may reinvest income and capital gain distributions in additional shares of the same class of the Fund at the net asset value as of the reinvestment date or, at the election of the shareholder, receive distributions in cash. Distributions to shareholders are determined in accordance with income tax regulations, which may differ from U.S. GAAP. As required by U.S. GAAP, only distributions in excess of tax basis earnings and profits are reported in the financial statements as a return of capital. Permanent differences between book and tax accounting relating to distributions are reclassified to paid-in capital. For tax purposes, distributions from short-term capital gains are considered to be from ordinary income.
At March 31, 2020, the Fund, for federal income tax purposes, had deferred capital losses of $1,638,426 which would reduce its taxable income arising from future net realized gains on investment transactions, if any, to the extent permitted by the Internal Revenue Code, and thus would reduce the amount of distributions to shareholders, which would otherwise be necessary to relieve the Fund of any liability for federal income or excise tax. The deferred capital losses are treated as arising on the first day of the Fund’s next taxable year and retain the same short-term or long-term character as when originally deferred. Of the deferred capital losses at March 31, 2020, $484,048 are short-term and $1,154,378 are long-term.
The cost and unrealized appreciation (depreciation) of investments of the Fund at September 30, 2020, as determined on a federal income tax basis, were as follows:
| | | | |
| |
Aggregate cost | | $ | 436,923,251 | |
| |
Gross unrealized appreciation | | $ | 487,500 | |
| |
Gross unrealized depreciation | | | (2,950,937 | ) |
| |
Net unrealized depreciation | | $ | (2,463,437 | ) |
3 Investment Adviser Fee and Other Transactions with Affiliates
The investment adviser fee is earned by Boston Management and Research (BMR), a subsidiary of Eaton Vance Management (EVM) and an indirect subsidiary of Eaton Vance Corp., as compensation for management and investment advisory services rendered to the Fund. The fee is based upon a percentage of average daily net assets plus a percentage of gross income (i.e., income other than gains from the sale of securities) and is payable monthly. The annual asset rate and daily income rate are 0.30% and 3.00%, respectively, on average daily net assets of up to $500 million, 0.275% and 2.75%, respectively, on average daily net assets of $500 million but less than $1 billion and at reduced rates on daily net assets of $1 billion or more. For the six months ended September 30, 2020, the investment adviser fee amounted to $812,723 or 0.33% (annualized) of the Fund’s average daily net assets.
EVM serves as the administrator of the Fund, but receives no compensation. EVM provides sub-transfer agency and related services to the Fund pursuant to a Sub-Transfer Agency Support Services Agreement. For the six months ended September 30, 2020, EVM earned $1,089 from the Fund pursuant to such agreement, which is included in transfer and dividend disbursing agent fees on the Statement of Operations. The Fund was informed that Eaton Vance Distributors, Inc. (EVD), an affiliate of EVM and the Fund’s principal underwriter, received $459 as its portion of the sales charge on sales of Class A shares for the six months ended September 30, 2020. EVD also received distribution and service fees from Class A shares (see Note 4).
Trustees and officers of the Fund who are members of EVM’s or BMR’s organizations receive remuneration for their services to the Fund out of the investment adviser fee. Trustees of the Fund who are not affiliated with the investment adviser may elect to defer receipt of all or a percentage of their annual fees in accordance with the terms of the Trustees Deferred Compensation Plan. For the six months ended September 30, 2020, no significant amounts have been deferred. Certain officers and Trustees of the Fund are officers of the above organizations.
Eaton Vance
Floating-Rate Municipal Income Fund
September 30, 2020
Notes to Financial Statements (Unaudited) — continued
4 Distribution Plan
The Fund has in effect a distribution plan for Class A shares (Class A Plan) pursuant to Rule 12b-1 under the 1940 Act. Pursuant to the Class A Plan, the Fund pays EVD a distribution and service fee not exceeding 0.25% per annum of its average daily net assets attributable to Class A shares for distribution services and facilities provided to the Fund by EVD, as well as for personal services and/or the maintenance of shareholder accounts. The Trustees approved distribution and service fee payments equal to 0.15% per annum of the Fund’s average daily net assets attributable to Class A shares. Distribution and service fees paid or accrued to EVD for the six months ended September 30, 2020 amounted to $187,037 for Class A shares.
Distribution and service fees are subject to the limitations contained in the Financial Industry Regulatory Authority Rule 2341(d).
5 Purchases and Sales of Investments
Purchases and sales of investments, other than short-term obligations, aggregated $2,000,000 and $150,178,388, respectively, for the six months ended September 30, 2020.
6 Shares of Beneficial Interest
The Fund’s Declaration of Trust permits the Trustees to issue an unlimited number of full and fractional shares of beneficial interest (without par value). Such shares may be issued in a number of different series (such as the Fund) and classes. Transactions in Fund shares were as follows:
| | | | | | | | |
| Class A | | Six Months Ended
September 30, 2020
(Unaudited) | | | Year Ended
March 31, 2020 | |
| | |
Sales | | | 1,114,255 | | | | 21,990,575 | |
| | |
Issued to shareholders electing to receive payments of distributions in Fund shares | | | 37,295 | | | | 387,971 | |
| | |
Redemptions | | | (7,216,341 | ) | | | (19,780,187 | ) |
| | |
Net increase (decrease) | | | (6,064,791 | ) | | | 2,598,359 | |
| | |
| Class I | | Six Months Ended
September 30, 2020
(Unaudited) | | | Year Ended
March 31, 2020 | |
| | |
Sales | | | 5,381,133 | | | | 22,895,259 | |
| | |
Issued to shareholders electing to receive payments of distributions in Fund shares | | | 47,085 | | | | 563,744 | |
| | |
Redemptions | | | (11,979,074 | ) | | | (41,010,299 | ) |
| | |
Net decrease | | | (6,550,856 | ) | | | (17,551,296 | ) |
7 Line of Credit
The Fund participates with other portfolios and funds managed by EVM and its affiliates in an $800 million unsecured line of credit agreement with a group of banks, which is in effect through October 27, 2020. Borrowings are made by the Fund solely for temporary purposes related to redemptions and other short-term cash needs. Interest is charged to the Fund based on its borrowings at an amount above either the Eurodollar rate or Federal Funds rate. In addition, a fee computed at an annual rate of 0.15% on the daily unused portion of the line of credit is allocated among the participating portfolios and funds at the end of each quarter. Because the line of credit is not available exclusively to the Fund, it may be unable to borrow some or all of its requested amounts at any particular time. The Fund did not have any significant borrowings or allocated fees during the six months ended September 30, 2020. Effective October 27, 2020, the Fund renewed its line of credit agreement, which expires October 26, 2021, at substantially the same terms.
Eaton Vance
Floating-Rate Municipal Income Fund
September 30, 2020
Notes to Financial Statements (Unaudited) — continued
8 Fair Value Measurements
Under generally accepted accounting principles for fair value measurements, a three-tier hierarchy to prioritize the assumptions, referred to as inputs, is used in valuation techniques to measure fair value. The three-tier hierarchy of inputs is summarized in the three broad levels listed below.
| • | | Level 1 – quoted prices in active markets for identical investments |
| • | | Level 2 – other significant observable inputs (including quoted prices for similar investments, interest rates, prepayment speeds, credit risk, etc.) |
| • | | Level 3 – significant unobservable inputs (including a fund’s own assumptions in determining the fair value of investments) |
In cases where the inputs used to measure fair value fall in different levels of the fair value hierarchy, the level disclosed is determined based on the lowest level input that is significant to the fair value measurement in its entirety. The inputs or methodology used for valuing securities are not necessarily an indication of the risk associated with investing in those securities.
At September 30, 2020, the hierarchy of inputs used in valuing the Fund’s investments, which are carried at value, were as follows:
| | | | | | | | | | | | | | | | |
| Asset Description | | Level 1 | | | Level 2 | | | Level 3 | | | Total | |
| | | | |
Tax-Exempt Municipal Securities | | $ | — | | | $ | 434,459,814 | | | $ | — | | | $ | 434,459,814 | |
| | | | |
Total Investments | | $ | — | | | $ | 434,459,814 | | | $ | — | | | $ | 434,459,814 | |
9 Risks and Uncertainties
Pandemic Risk
An outbreak of respiratory disease caused by a novel coronavirus was first detected in China in December 2019 and subsequently spread internationally. This coronavirus has resulted in closing borders, enhanced health screenings, changes to healthcare service preparation and delivery, quarantines, cancellations, disruptions to supply chains and customer activity, as well as general concern and uncertainty. Health crises caused by outbreaks, such as the coronavirus outbreak, may exacerbate other pre-existing political, social and economic risks and disrupt normal market conditions and operations. The impact of this outbreak has negatively affected the worldwide economy, the economies of individual countries, individual companies, and the market in general, and may continue to do so in significant and unforeseen ways, as may other epidemics and pandemics that may arise in the future. Any such impact could adversely affect the Fund’s performance, or the performance of the securities in which the Fund invests.
10 Subsequent Event
On October 8, 2020, Morgan Stanley and Eaton Vance Corp. (“Eaton Vance”) announced that they had entered into a definitive agreement under which Morgan Stanley would acquire Eaton Vance. Under the Investment Company Act of 1940, as amended, consummation of this transaction may result in the automatic termination of the Fund’s investment advisory agreement, and any related sub-advisory agreement(s), if applicable. Thus, the Fund’s Board will be asked to approve a new investment advisory agreement (and new sub-advisory agreement(s), if applicable). If approved by the Fund’s Board, the new investment advisory agreement (and new sub-advisory agreement(s), if applicable) is expected to be presented to Fund shareholders for approval, and, if approved, would take effect upon the closing of the transaction.
Eaton Vance
Floating-Rate Municipal Income Fund
September 30, 2020
Board of Trustees’ Contract Approval
Overview of the Contract Review Process
The Investment Company Act of 1940, as amended (the “1940 Act”), provides, in substance, that the investment advisory agreement between a fund and its investment adviser will continue in effect from year-to-year only if its continuation is approved on an annual basis by a vote of the fund’s board of trustees, including a majority of the trustees who are not “interested persons” of the fund (“independent trustees”), cast in person at a meeting called for the purpose of considering such approval.
At a meeting held on April 22, 2020 (the “April 2020 Meeting”), the Boards of Trustees/Directors comprised of the same individuals (collectively, the “Board”) that oversees a majority of the registered investment companies advised by Eaton Vance Management or its affiliate, Boston Management and Research (the “Eaton Vance Funds”), including a majority of the independent trustees (the “Independent Trustees”), voted to approve the continuation of existing investment advisory agreements and sub-advisory agreements(1) for each of the Eaton Vance Funds for an additional one-year period. The Board relied upon the affirmative recommendation of its Contract Review Committee, which is a committee exclusively comprised of Independent Trustees. Prior to making its recommendation, the Contract Review Committee reviewed information furnished by the adviser and sub-adviser to each of the Eaton Vance Funds (including information specifically requested by the Board) for a series of formal meetings held between February and April 2020. Members of the Contract Review Committee also considered information received at prior meetings of the Board and its committees, to the extent such information was relevant to the Contract Review Committee’s annual evaluation of the investment advisory agreements and sub-advisory agreements.
In connection with its evaluation of the investment advisory agreements and sub-advisory agreements, the Board considered various information relating to the Eaton Vance Funds. This included information applicable to all or groups of Eaton Vance Funds, which is referenced immediately below, and information applicable to the particular Eaton Vance Fund covered by this report (additional fund-specific information is referenced below under “Results of the Contract Review Process”). (For funds that invest through one or more underlying portfolios, references to “each fund” in this section may include information that was considered at the portfolio-level.)
Information about Fees, Performance and Expenses
| | • | | A report from an independent data provider comparing advisory and other fees paid by each fund to such fees paid by comparable funds, as identified by the independent data provider (“comparable funds”); |
| | • | | A report from an independent data provider comparing each fund’s total expense ratio (and its components) to those of comparable funds; |
| | • | | A report from an independent data provider comparing the investment performance of each fund (including, as relevant, total return data, income data, Sharpe ratios and information ratios) to the investment performance of comparable funds and, as applicable, benchmark indices, over various time periods; |
| | • | | In certain instances, data regarding investment performance relative to customized groups of peer funds and blended indices identified by the adviser in consultation with the Portfolio Management Committee of the Board; |
| | • | | Comparative information concerning the fees charged and services provided by the adviser and sub-adviser to each fund in managing other accounts (which may include other mutual funds, collective investment funds and institutional accounts) using investment strategies and techniques similar to those used in managing such fund(s), if any; |
| | • | | Profitability analyses with respect to the adviser and sub-adviser to each of the funds; |
Information about Portfolio Management and Trading
| | • | | Descriptions of the investment management services provided to each fund, as well as each of the funds’ investment strategies and policies; |
| | • | | The procedures and processes used to determine the fair value of fund assets, when necessary, and actions taken to monitor and test the effectiveness of such procedures and processes; |
| | • | | Information about the policies and practices of each fund’s adviser and sub-adviser (in the context of a sub-adviser, only those with trading responsibilities) with respect to trading, including their processes for seeking best execution of portfolio transactions; |
| | • | | Information about the allocation of brokerage transactions and the benefits, if any, received by the adviser and sub-adviser (in the context of a sub-adviser, only those with trading responsibilities) to each fund as a result of brokerage allocation, including, as applicable, information concerning the acquisition of research through client commission arrangements and policies with respect to “soft dollars”; |
| | • | | Data relating to the portfolio turnover rate of each fund; |
Information about each Adviser and Sub-adviser
| | • | | Reports detailing the financial results and condition of the adviser and sub-adviser to each fund; |
| | • | | Information regarding the individual investment professionals whose responsibilities include portfolio management and investment research for the funds, and, for portfolio managers and certain other investment professionals, information relating to their responsibilities with respect to managing other mutual funds and investment accounts, as applicable; |
| (1) | Not all Eaton Vance Funds have entered into a sub-advisory agreement with a sub-adviser. Accordingly, references to “sub-adviser” or “sub-advisory agreement” in this “Overview” section may not be applicable to the particular Eaton Vance Fund covered by this report. |
Eaton Vance
Floating-Rate Municipal Income Fund
September 30, 2020
Board of Trustees’ Contract Approval — continued
| | • | | The Code of Ethics of the adviser and its affiliates and the sub-adviser of each fund, together with information relating to compliance with, and the administration of, such codes; |
| | • | | Policies and procedures relating to proxy voting and the handling of corporate actions and class actions; |
| | • | | Information concerning the resources devoted to compliance efforts undertaken by the adviser and its affiliates and the sub-adviser of each fund, if any, including descriptions of their various compliance programs and their record of compliance; |
| | • | | Information concerning the business continuity and disaster recovery plans of the adviser and its affiliates and the sub-adviser of each fund, if any; |
| | • | | A description of Eaton Vance Management’s and Boston Management and Research’s oversight of sub-advisers, including with respect to regulatory and compliance issues, investment management and other matters; |
Other Relevant Information
| | • | | Information concerning the nature, cost and character of the administrative and other non-investment advisory services provided by Eaton Vance Management and its affiliates; |
| | • | | Information concerning oversight of the relationship with the custodian, subcustodians and fund accountants by the adviser and/or administrator to each of the funds; |
| | • | | For an Eaton Vance Fund structured as an exchange-listed closed-end fund, information concerning the benefits of the closed-end fund structure, as well as, where relevant, the closed-end fund’s market prices, trading volume data, distribution rates and other relevant matters; and |
| | • | | The terms of each investment advisory agreement and sub-advisory agreement. |
During the various meetings of the Board and its committees throughout the twelve months ended April 2020, the Trustees received information from portfolio managers and other investment professionals of the advisers and sub-advisers of the funds regarding investment and performance matters, and considered various investment and trading strategies used in pursuing the funds’ investment objectives. The Trustees also received information regarding risk management techniques employed in connection with the management of the funds. The Board and its committees evaluated issues pertaining to industry and regulatory developments, compliance procedures, fund governance and other issues with respect to the funds, and received and participated in reports and presentations provided by Eaton Vance Management, Boston Management and Research and fund sub-advisers, with respect to such matters. In addition to the formal meetings of the Board and its committees, the Independent Trustees held regular teleconferences to discuss, among other topics, matters relating to the continuation of investment advisory agreements and sub-advisory agreements.
The Contract Review Committee was advised throughout the contract review process by Goodwin Procter LLP, independent legal counsel for the Independent Trustees. The members of the Contract Review Committee, with the advice of such counsel, exercised their own business judgment in determining the material factors to be considered in evaluating each investment advisory agreement and sub-advisory agreement and the weight to be given to each such factor. The conclusions reached with respect to each investment advisory agreement and sub-advisory agreement were based on a comprehensive evaluation of all the information provided and not any single factor. Moreover, each member of the Contract Review Committee may have placed varying emphasis on particular factors in reaching conclusions with respect to each investment advisory agreement and sub-advisory agreement. In evaluating each investment advisory agreement and sub-advisory agreement, including the fee structures and other terms contained in such agreements, the members of the Contract Review Committee were also informed by multiple years of analysis and discussion with the adviser and sub-adviser to each of the Eaton Vance Funds.
In voting its approval of the continuation of existing investment advisory agreements and sub-advisory agreements at the April 2020 Meeting, the Board relied on an order issued by the Securities and Exchange Commission on March 25, 2020, which provided temporary relief from the in-person voting requirements under Section 15 of the 1940 Act in response to the impacts of the COVID-19 pandemic.
Results of the Contract Review Process
Based on its consideration of the foregoing, and such other information it deemed relevant, including the factors and conclusions described below, the Contract Review Committee concluded that the continuation of the investment advisory agreement between Eaton Vance Floating-Rate Municipal Income Fund (the “Fund”) and Boston Management and Research (the “Adviser”), including its fee structure, is in the interests of shareholders and, therefore, recommended to the Board approval of the agreement. Based on the recommendation of the Contract Review Committee, the Board, including a majority of the Independent Trustees, voted to approve continuation of the investment advisory agreement for the Fund.
Nature, Extent and Quality of Services
In considering whether to approve the investment advisory agreement for the Fund, the Board evaluated the nature, extent and quality of services provided to the Fund by the Adviser.
The Board considered the Adviser’s management capabilities and investment processes in light of the types of investments held by the Fund, including the education, experience and number of investment professionals and other personnel who provide portfolio management, investment research, and similar services to the Fund. In particular, the Board considered, where relevant, the abilities and experience of the Adviser’s investment professionals in analyzing factors such as credit risk, tax efficiency, and special considerations relevant to investing in municipal obligations. The Board considered the Adviser’s municipal bond team, which includes investment professionals and credit specialists who provide services to the Fund. The Board also took into account
Eaton Vance
Floating-Rate Municipal Income Fund
September 30, 2020
Board of Trustees’ Contract Approval — continued
the resources dedicated to portfolio management and other services, the compensation methods of the Adviser and other factors, including the reputation and resources of the Adviser to recruit and retain highly qualified research, advisory and supervisory investment professionals. In addition, the Board considered the time and attention devoted to the Eaton Vance Funds, including the Fund, by senior management, as well as the infrastructure, operational capabilities and support staff in place to assist in the portfolio management and operations of the Fund, including the provision of administrative services. The Board also considered the business-related and other risks to which the Adviser or its affiliates may be subject in managing the Fund.
The Board considered the compliance programs of the Adviser and relevant affiliates thereof. The Board considered compliance and reporting matters regarding, among other things, personal trading by investment professionals, disclosure of portfolio holdings, late trading, frequent trading, portfolio valuation, business continuity and the allocation of investment opportunities. The Board also considered the responses of the Adviser and its affiliates to requests in recent years from regulatory authorities, such as the Securities and Exchange Commission and the Financial Industry Regulatory Authority.
The Board considered other administrative services provided or overseen by Eaton Vance Management and its affiliates, including transfer agency and accounting services. The Board evaluated the benefits to shareholders of investing in a fund that is a part of a large fund complex offering exposure to a variety of asset classes and investment disciplines, as well as the ability, in many cases, to exchange an investment among different funds without incurring additional sales charges.
After consideration of the foregoing factors, among others, the Board concluded that the nature, extent and quality of services provided by the Adviser, taken as a whole, are appropriate and consistent with the terms of the investment advisory agreement.
Fund Performance
The Board compared the Fund’s investment performance to that of comparable funds identified by an independent data provider (the peer group), as well as an appropriate benchmark index, and assessed the Fund’s performance on the basis of total return and current income return. The Board’s review included comparative performance data with respect to the Fund for the one-, three-, five- and ten-year periods ended September 30, 2019. In this regard, the Board noted that the performance of the Fund was lower than the median performance of the Fund’s peer group for the three-year period. The Board also noted that the performance of the Fund was lower than its benchmark index for the three-year period. The Board considered, among other things, the Adviser’s efforts to generate competitive levels of tax exempt current income over time through investments that, relative to its comparable funds, focus on higher quality municipal bonds with longer maturities. The Board noted that the performance of the Fund relative to its peer group and benchmark index during the three-year period was adversely impacted by the Fund’s 80% policy to invest in shorter duration floating-rate instruments, which underperformed slightly longer duration fixed-rate instruments during a period of a flattening yield curve.
Management Fees and Expenses
The Board considered contractual fee rates payable by the Fund for advisory and administrative services (referred to collectively as “management fees”). As part of its review, the Board considered the Fund’s management fees and total expense ratio for the one-year period ended September 30, 2019, as compared to those of comparable funds, before and after giving effect to any undertaking to waive fees or reimburse expenses. The Board also considered certain factors identified by management in response to inquiries from the Contract Review Committee regarding the Fund’s total expense ratio relative to comparable funds.
After considering the foregoing information, and in light of the nature, extent and quality of the services provided by the Adviser, the Board concluded that the management fees charged for advisory and related services are reasonable.
Profitability and “Fall-Out” Benefits
The Board considered the level of profits realized by the Adviser and relevant affiliates thereof in providing investment advisory and administrative services to the Fund and to all Eaton Vance Funds as a group. The Board considered the level of profits realized without regard to marketing support or other payments by the Adviser and its affiliates to third parties in respect of distribution or other services.
The Board concluded that, in light of the foregoing factors and the nature, extent and quality of the services rendered, the profits realized by the Adviser and its affiliates are deemed not to be excessive.
The Board also considered direct or indirect fall-out benefits received by the Adviser and its affiliates in connection with their respective relationships with the Fund, including the benefits of research services that may be available to the Adviser as a result of securities transactions effected for the Fund and other investment advisory clients.
Economies of Scale
In reviewing management fees and profitability, the Board also considered the extent to which the Adviser and its affiliates, on the one hand, and the Fund, on the other hand, can expect to realize benefits from economies of scale as the assets of the Fund increase. The Board acknowledged the difficulty in accurately measuring the benefits resulting from economies of scale, if any, with respect to the management of any specific fund or group of funds. The
Eaton Vance
Floating-Rate Municipal Income Fund
September 30, 2020
Board of Trustees’ Contract Approval — continued
Board reviewed data summarizing the increases and decreases in the assets of the Fund and of all Eaton Vance Funds as a group over various time periods, and evaluated the extent to which the total expense ratio of the Fund and the profitability of the Adviser and its affiliates may have been affected by such increases or decreases. Based upon the foregoing, the Board concluded that the Fund currently shares in the benefits from economies of scale, if any, when they are realized by the Adviser. The Board also concluded that the structure of the advisory fee, which includes breakpoints at several asset levels, will allow the Fund to continue to benefit from any economies of scale in the future.
Eaton Vance
Floating-Rate Municipal Income Fund
September 30, 2020
Liquidity Risk Management Program
The Fund has implemented a written liquidity risk management program (Program) and related procedures to manage its liquidity in accordance with Rule 22e-4 under the Investment Company Act of 1940, as amended (Liquidity Rule). The Liquidity Rule defines “liquidity risk” as the risk that a fund could not meet requests to redeem shares issued by the fund without significant dilution of the remaining investors’ interests in the fund. The Fund’s Board of Trustees/Directors has designated the investment adviser to serve as the administrator of the Program and the related procedures. The administrator has established a Liquidity Risk Management Oversight Committee (Committee) to perform the functions necessary to administer the Program. As part of the Program, the administrator is responsible for identifying illiquid investments and categorizing the relative liquidity of the Fund’s investments in accordance with the Liquidity Rule. Under the Program, the administrator assesses, manages, and periodically reviews the Fund’s liquidity risk, and is responsible for making certain reports to the Fund’s Board of Trustees/Directors and the Securities and Exchange Commission (SEC) regarding the liquidity of the Fund’s investments, and to notify the Board of Trustees/Directors and the SEC of certain liquidity events specified in the Liquidity Rule. The liquidity of the Fund’s portfolio investments is determined based on a number of factors including, but not limited to, relevant market, trading and investment-specific considerations under the Program.
At a meeting of the Fund’s Board of Trustees/Directors, the Committee provided a written report to the Fund’s Board of Trustees/Directors pertaining to the operation, adequacy, and effectiveness of implementation of the Program, as well as the operation of the highly liquid investment minimum (if applicable) for the period December 1, 2018 through December 31, 2019 (Review Period). The Program operated effectively during the Review Period, supporting the administrator’s ability to assess, manage and monitor Fund liquidity risk, including during periods of market volatility and net redemptions. During the Review Period, the Fund met redemption requests on a timely basis.
There can be no assurance that the Program will achieve its objectives in the future. Please refer to the Fund’s prospectus for more information regarding the Fund’s exposure to liquidity risk and other principal risks to which an investment in the Fund may be subject.
Eaton Vance
Floating-Rate Municipal Income Fund
September 30, 2020
Officers and Trustees
Officers
Eric A. Stein
President
Maureen A. Gemma
Vice President, Secretary and Chief Legal Officer
James F. Kirchner
Treasurer
Richard F. Froio
Chief Compliance Officer
Trustees
William H. Park
Chairperson
Thomas E. Faust Jr.*
Mark R. Fetting
Cynthia E. Frost
George J. Gorman
Valerie A. Mosley
Helen Frame Peters
Keith Quinton
Marcus L. Smith
Susan J. Sutherland
Scott E. Wennerholm
Eaton Vance Funds
IMPORTANT NOTICES
Privacy. The Eaton Vance organization is committed to ensuring your financial privacy. Each entity listed below has adopted a privacy policy and procedures (“Privacy Program”) Eaton Vance believes is reasonably designed to protect your personal information and to govern when and with whom Eaton Vance may share your personal information.
| • | | At the time of opening an account, Eaton Vance generally requires you to provide us with certain information such as name, address, social security number, tax status, account numbers, and account balances. This information is necessary for us to both open an account for you and to allow us to satisfy legal requirements such as applicable anti-money laundering reviews and know-your-customer requirements. |
| • | | On an ongoing basis, in the normal course of servicing your account, Eaton Vance may share your information with unaffiliated third parties that perform various services for Eaton Vance and/or your account. These third parties include transfer agents, custodians, broker/dealers and our professional advisers, including auditors, accountants, and legal counsel. Eaton Vance may additionally share your personal information with our affiliates. |
| • | | We believe our Privacy Program is reasonably designed to protect the confidentiality of your personal information and to prevent unauthorized access to that information. |
| • | | We reserve the right to change our Privacy Program at any time upon proper notification to you. You may want to review our Privacy Program periodically for changes by accessing the link on our homepage: www.eatonvance.com. |
Our pledge of protecting your personal information applies to the following entities within the Eaton Vance organization: the Eaton Vance Family of Funds, Eaton Vance Management, Eaton Vance Investment Counsel, Eaton Vance Distributors, Inc., Eaton Vance Trust Company, Eaton Vance Management (International) Limited, Eaton Vance Advisers International Ltd., Eaton Vance Global Advisors Limited, Eaton Vance Management’s Real Estate Investment Group, Boston Management and Research, Calvert Research and Management, and Calvert Funds. This Privacy Notice supersedes all previously issued privacy disclosures. For more information about our Privacy Program or about how your personal information may be used, please call 1-800-262-1122.
Delivery of Shareholder Documents. The Securities and Exchange Commission (SEC) permits funds to deliver only one copy of shareholder documents, including prospectuses, proxy statements and shareholder reports, to fund investors with multiple accounts at the same residential or post office box address. This practice is often called “householding” and it helps eliminate duplicate mailings to shareholders. Eaton Vance, or your financial intermediary, may household the mailing of your documents indefinitely unless you instruct Eaton Vance, or your financial intermediary, otherwise. If you would prefer that your Eaton Vance documents not be householded, please contact Eaton Vance at 1-800-262-1122, or contact your financial intermediary. Your instructions that householding not apply to delivery of your Eaton Vance documents will typically be effective within 30 days of receipt by Eaton Vance or your financial intermediary.
Portfolio Holdings. Each Eaton Vance Fund and its underlying Portfolio(s) (if applicable) files a schedule of portfolio holdings on Part F to Form N-PORT with the SEC. Certain information filed on Form N-PORT may be viewed on the Eaton Vance website at www.eatonvance.com, by calling Eaton Vance at 1-800-262-1122 or in the EDGAR database on the SEC’s website at www.sec.gov.
Proxy Voting. From time to time, funds are required to vote proxies related to the securities held by the funds. The Eaton Vance Funds or their underlying Portfolios (if applicable) vote proxies according to a set of policies and procedures approved by the Funds’ and Portfolios’ Boards. You may obtain a description of these policies and procedures and information on how the Funds or Portfolios voted proxies relating to portfolio securities during the most recent 12-month period ended June 30, without charge, upon request, by calling 1-800-262-1122 and by accessing the SEC’s website at www.sec.gov.
Investment Adviser
Boston Management and Research
Two International Place
Boston, MA 02110
Administrator
Eaton Vance Management
Two International Place
Boston, MA 02110
Principal Underwriter*
Eaton Vance Distributors, Inc.
Two International Place
Boston, MA 02110
(617) 482-8260
Custodian
State Street Bank and Trust Company
State Street Financial Center, One Lincoln Street
Boston, MA 02111
Transfer Agent
BNY Mellon Investment Servicing (US) Inc.
Attn: Eaton Vance Funds
P.O. Box 9653
Providence, RI 02940-9653
(800) 262-1122
Fund Offices
Two International Place
Boston, MA 02110
| * | FINRA BrokerCheck. Investors may check the background of their Investment Professional by contacting the Financial Industry Regulatory Authority (FINRA). FINRA BrokerCheck is a free tool to help investors check the professional background of current and former FINRA-registered securities firms and brokers. FINRA BrokerCheck is available by calling 1-800-289-9999 and at www.FINRA.org. The FINRA BrokerCheck brochure describing this program is available to investors at www.FINRA.org. |

7642 9.30.20

Eaton Vance
National Limited Maturity Municipal Income Fund
Semiannual Report
September 30, 2020
Important Note. Beginning on January 1, 2021, as permitted by regulations adopted by the Securities and Exchange Commission, paper copies of the Fund’s annual and semi-annual shareholder reports will no longer be sent by mail unless you specifically request paper copies of the reports. Instead, the reports will be made available on the Fund’s website (eatonvance.com/funddocuments), and you will be notified by mail each time a report is posted and provided with a website address to access the report.
If you already elected to receive shareholder reports electronically, you will not be affected by this change and you need not take any action. If you are a direct investor, you may elect to receive shareholder reports and other communications from the Fund electronically by signing up for e-Delivery at eatonvance.com/edelivery. If you own your shares through a financial intermediary (such as a broker-dealer or bank), you must contact your financial intermediary to sign up.
You may elect to receive all future Fund shareholder reports in paper free of charge. If you are a direct investor, you can inform the Fund that you wish to continue receiving paper copies of your shareholder reports by calling 1-800-262-1122. If you own these shares through a financial intermediary, you must contact your financial intermediary or follow instructions included with this disclosure, if applicable, to elect to continue to receive paper copies of your shareholder reports. Your election to receive reports in paper will apply to all Eaton Vance funds held directly or to all funds held through your financial intermediary, as applicable.

Commodity Futures Trading Commission Registration. Effective December 31, 2012, the Commodity Futures Trading Commission (“CFTC”) adopted certain regulatory changes that subject registered investment companies and advisers to regulation by the CFTC if a fund invests more than a prescribed level of its assets in certain CFTC-regulated instruments (including futures, certain options and swap agreements) or markets itself as providing investment exposure to such instruments. The investment adviser has claimed an exclusion from the definition of “commodity pool operator” under the Commodity Exchange Act with respect to its management of the Fund. Accordingly, neither the Fund nor the adviser with respect to the operation of the Fund is subject to CFTC regulation. Because of its management of other strategies, the Fund’s adviser is registered with the CFTC as a commodity pool operator. The adviser is also registered as a commodity trading advisor.
Fund shares are not insured by the FDIC and are not deposits or other obligations of, or guaranteed by, any depository institution. Shares are subject to investment risks, including possible loss of principal invested.
This report must be preceded or accompanied by a current summary prospectus or prospectus. Before investing, investors should consider carefully the investment objective, risks, and charges and expenses of a mutual fund. This and other important information is contained in the summary prospectus and prospectus, which can be obtained from a financial intermediary. Prospective investors should read the prospectus carefully before investing. For further information, please call 1-800-262-1122.
Semiannual Report September 30, 2020
Eaton Vance
National Limited Maturity Municipal Income Fund
Eaton Vance
National Limited Maturity Municipal Income Fund
September 30, 2020
Performance1,2
Portfolio Managers Adam A. Weigold, CFA, Christopher J. Eustance, CFA and Trevor G. Smith
| | | | | | | | | | | | | | | | | | | | | | | | |
| % Average Annual Total Returns | | Class
Inception Date | | | Performance
Inception Date | | | Six Months | | | One Year | | | Five Years | | | Ten Years | |
| | | | | | |
Class A at NAV | | | 06/27/1996 | | | | 05/22/1992 | | | | 3.11 | % | | | 2.54 | % | | | 2.33 | % | | | 2.71 | % |
Class A with 2.25% Maximum Sales Charge | | | — | | | | — | | | | 0.83 | | | | 0.20 | | | | 1.87 | | | | 2.48 | |
Class C at NAV | | | 12/08/1993 | | | | 05/22/1992 | | | | 2.74 | | | | 1.77 | | | | 1.58 | | | | 1.94 | |
Class C with 1% Maximum Sales Charge | | | — | | | | — | | | | 1.74 | | | | 0.77 | | | | 1.58 | | | | 1.94 | |
Class I at NAV | | | 10/01/2009 | | | | 05/22/1992 | | | | 3.19 | | | | 2.59 | | | | 2.48 | | | | 2.87 | |
|
| |
| | | | | | |
Bloomberg Barclays Short-Intermediate 1-10 Year Municipal Bond Index | | | — | | | | — | | | | 3.75 | % | | | 4.03 | % | | | 2.70 | % | | | 2.70 | % |
Bloomberg Barclays 7 Year Municipal Bond Index | | | — | | | | — | | | | 4.83 | | | | 4.78 | | | | 3.46 | | | | 3.59 | |
| | | | | | |
| % Total Annual Operating Expense Ratios3 | | | | | | | | | | | Class A | | | Class C | | | Class I | |
| | | | | | |
| | | | | | | | | | | | | | | 0.66 | % | | | 1.41 | % | | | 0.51 | % |
| | | | | | |
| % Distribution Rates/Yields4 | | | | | | | | | | | Class A | | | Class C | | | Class I | |
| | | | | | |
Distribution Rate | | | | | | | | | | | | | | | 2.29 | % | | | 1.54 | % | | | 2.44 | % |
Taxable-Equivalent Distribution Rate | | | | | | | | | | | | | | | 3.87 | | | | 2.60 | | | | 4.12 | |
SEC 30-day Yield | | | | | | | | | | | | | | | 0.61 | | | | –0.12 | | | | 0.77 | |
Taxable-Equivalent SEC 30-day Yield | | | | | | | | | | | | | | | 1.02 | | | | –0.21 | | | | 1.30 | |
Fund Profile
Credit Quality (% of total investments)5
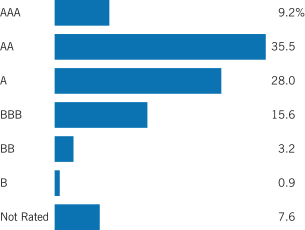
See Endnotes and Additional Disclosures in this report.
Past performance is no guarantee of future results. Returns are historical and are calculated by determining the percentage change in net asset value (NAV) or offering price (as applicable) with all distributions reinvested. Investment return and principal value will fluctuate so that shares, when redeemed, may be worth more or less than their original cost. Performance for periods less than or equal to one year is cumulative. Performance is for the stated time period only; due to market volatility, current Fund performance may be lower or higher than the quoted return. For performance as of the most recent month-end, please refer to eatonvance.com.
Eaton Vance
National Limited Maturity Municipal Income Fund
September 30, 2020
Endnotes and Additional Disclosures
| 1 | Bloomberg Barclays Short-Intermediate 1-10 Year Municipal Bond Index is an unmanaged index of municipal bonds traded in the U.S. with maturities ranging from 1-10 years. Bloomberg Barclays 7 Year Municipal Bond Index is an unmanaged index of municipal bonds traded in the U.S. with maturities ranging from 6-8 years. Unless otherwise stated, index returns do not reflect the effect of any applicable sales charges, commissions, expenses, taxes or leverage, as applicable. It is not possible to invest directly in an index. |
| 2 | Total Returns at NAV do not include applicable sales charges. If sales charges were deducted, the returns would be lower. Total Returns shown with maximum sales charge reflect the stated maximum sales charge. Unless otherwise stated, performance does not reflect the deduction of taxes on Fund distributions or redemptions of Fund shares. |
| | Effective May 1, 2020, the Fund changed its primary benchmark from the Bloomberg Barclays 7 Year Municipal Bond Index to the Bloomberg Barclays Short-Intermediate 1-10 Year Municipal Bond Index in connection with a change to the Fund’s investment policy with respect to its average portfolio duration (“Duration Policy”) because the investment adviser believes that the Bloomberg Barclays Short-Intermediate 1-10 Year Municipal Bond Index better reflects the Fund’s updated Duration Policy. |
| 3 | Source: Fund prospectus. The expense ratios for the current reporting period can be found in the Financial Highlights section of this report. |
| 4 | The Distribution Rate is based on the Fund’s last regular distribution per share in the period (annualized) divided by the Fund’s NAV at the end of the period. The Fund’s distributions may be comprised of amounts characterized for federal income tax purposes as tax-exempt income, qualified and non-qualified ordinary dividends, capital gains and nondividend distributions, also known as return of capital. The Fund will determine the federal income tax character of distributions paid to a shareholder after the end of the calendar year. This is reported on the IRS form 1099- DIV and provided to the shareholder shortly after each year-end. The Fund’s distributions are determined by the investment adviser based on its current assessment of the Fund’s long-term return potential. As portfolio and market conditions change, the rate of distributions paid by the Fund could change. Taxable-equivalent performance is based on the highest combined federal and state income tax rates, where applicable. Lower tax rates would result in lower tax-equivalent performance. Actual tax rates will vary depending on your income, exemptions and deductions. Rates do not include local taxes. The SEC Yield is a standardized measure based on the estimated yield to maturity of a fund’s investments over a 30-day period and is based on the maximum offer price at the date specified. The SEC Yield is not based on the distributions made by the Fund, which may differ. |
| 5 | Ratings are based on Moody’s Investors Service, Inc. (“Moody’s”), S&P Global Ratings (“S&P”) or Fitch Ratings (“Fitch”), as applicable. If securities are rated differently by the ratings agencies, the highest rating is applied. Ratings, which are subject to change, apply to the creditworthiness of the issuers of the underlying securities and not to the Fund or its shares. Credit ratings measure the quality of a bond based on the issuer’s creditworthiness, with ratings ranging from AAA, being the highest, to D, being the lowest based on S&P’s measures. Ratings of BBB or higher by S&P or Fitch (Baa or higher by Moody’s) |
| | are considered to be investment-grade quality. Credit ratings are based largely on the ratings agency’s analysis at the time of rating. The rating assigned to any particular security is not necessarily a reflection of the issuer’s current financial condition and does not necessarily reflect its assessment of the volatility of a security’s market value or of the liquidity of an investment in the security. Holdings designated as “Not Rated” (if any) are not rated by the national ratings agencies stated above. |
| | Fund profile subject to change due to active management. |
Eaton Vance
National Limited Maturity Municipal Income Fund
September 30, 2020
Fund Expenses
Example: As a Fund shareholder, you incur two types of costs: (1) transaction costs, including sales charges (loads) on purchases and redemption fees (if applicable); and (2) ongoing costs, including management fees; distribution and/or service fees; and other Fund expenses. This Example is intended to help you understand your ongoing costs (in dollars) of Fund investing and to compare these costs with the ongoing costs of investing in other mutual funds. The Example is based on an investment of $1,000 invested at the beginning of the period and held for the entire period (April 1, 2020 – September 30, 2020).
Actual Expenses: The first section of the table below provides information about actual account values and actual expenses. You may use the information in this section, together with the amount you invested, to estimate the expenses that you paid over the period. Simply divide your account value by $1,000 (for example, an $8,600 account value divided by $1,000 = 8.6), then multiply the result by the number in the first section under the heading entitled “Expenses Paid During Period” to estimate the expenses you paid on your account during this period.
Hypothetical Example for Comparison Purposes: The second section of the table below provides information about hypothetical account values and hypothetical expenses based on the actual Fund expense ratio and an assumed rate of return of 5% per year (before expenses), which is not the actual Fund return. The hypothetical account values and expenses may not be used to estimate the actual ending account balance or expenses you paid for the period. You may use this information to compare the ongoing costs of investing in your Fund and other funds. To do so, compare this 5% hypothetical example with the 5% hypothetical examples that appear in the shareholder reports of the other funds.
Please note that the expenses shown in the table are meant to highlight your ongoing costs only and do not reflect any transactional costs, such as sales charges (loads) or redemption fees (if applicable). Therefore, the second section of the table is useful in comparing ongoing costs only, and will not help you determine the relative total costs of owning different funds. In addition, if these transactional costs were included, your costs would be higher.
| | | | | | | | | | | | | | | | |
| | | Beginning Account Value
(4/1/20) | | | Ending Account Value
(9/30/20) | | | Expenses Paid During Period*
(4/1/20 – 9/30/20) | | | Annualized Expense
Ratio | |
|
Actual | |
Class A | | $ | 1,000.00 | | | $ | 1,031.10 | | | $ | 3.36 | | | | 0.66 | % |
Class C | | $ | 1,000.00 | | | $ | 1,027.40 | | | $ | 7.17 | | | | 1.41 | % |
Class I | | $ | 1,000.00 | | | $ | 1,031.90 | | | $ | 2.60 | | | | 0.51 | % |
| |
Hypothetical | |
(5% return per year before expenses) | |
Class A | | $ | 1,000.00 | | | $ | 1,021.80 | | | $ | 3.35 | | | | 0.66 | % |
Class C | | $ | 1,000.00 | | | $ | 1,018.00 | | | $ | 7.13 | | | | 1.41 | % |
Class I | | $ | 1,000.00 | | | $ | 1,022.50 | | | $ | 2.59 | | | | 0.51 | % |
| * | Expenses are equal to the Fund’s annualized expense ratio for the indicated Class, multiplied by the average account value over the period, multiplied by 183/365 (to reflect the one-half year period). The Example assumes that the $1,000 was invested at the net asset value per share determined at the close of business on March 31, 2020. |
Eaton Vance
National Limited Maturity Municipal Income Fund
September 30, 2020
Portfolio of Investments (Unaudited)
| | | | | | | | |
| Tax-Exempt Municipal Securities — 88.7% | |
| Security | | Principal Amount (000’s omitted) | | | Value | |
| | |
| Bond Bank — 0.7% | | | | | | |
| | |
Massachusetts Water Pollution Abatement Trust, 5.00%, 8/1/25 | | $ | 3,000 | | | $ | 3,681,300 | |
| |
| | | | $ | 3,681,300 | |
| | |
| Education — 2.6% | | | | | | |
| | |
Allegheny County Higher Education Building Authority, PA, (Duquesne University), 5.00%, 3/1/25 | | $ | 100 | | | $ | 110,413 | |
| | |
Connecticut Health and Educational Facilities Authority, (Choate Rosemary Hall), 5.00%, 7/1/24 | | | 150 | | | | 175,146 | |
| | |
Connecticut Health and Educational Facilities Authority, (Choate Rosemary Hall), 5.00%, 7/1/26 | | | 165 | | | | 205,245 | |
| | |
Connecticut Health and Educational Facilities Authority, (Choate Rosemary Hall), 5.00%, 7/1/27 | | | 125 | | | | 159,629 | |
| | |
Connecticut Health and Educational Facilities Authority, (Choate Rosemary Hall), 5.00%, 7/1/28 | | | 185 | | | | 241,616 | |
| | |
Connecticut Health and Educational Facilities Authority, (Quinnipiac University), 5.00%, 7/1/27 | | | 1,120 | | | | 1,355,838 | |
| | |
Forest Grove, OR, (Pacific University), Series 2015A, 5.00%, 5/1/22 | | | 200 | | | | 210,472 | |
| | |
Forest Grove, OR, (Pacific University), Series 2015A, 5.00%, 5/1/23 | | | 400 | | | | 429,760 | |
| | |
Houston Higher Education Finance Corp., TX, (St. John’s School), Prerefunded to 9/1/22, 5.00%, 9/1/25 | | | 1,000 | | | | 1,090,430 | |
| | |
New York Dormitory Authority, (Icahn School of Medicine at Mount Sinai), 5.00%, 7/1/23 | | | 4,000 | | | | 4,460,200 | |
| | |
New York Dormitory Authority, (Rochester Institute of Technology), 5.00%, 7/1/28 | | | 600 | | | | 777,378 | |
| | |
Port of Greater Cincinnati Development Authority, OH, (St. Xavier High School, Inc.), 5.00%, 4/1/25 | | | 175 | | | | 202,025 | |
| | |
Port of Greater Cincinnati Development Authority, OH, (St. Xavier High School, Inc.), 5.00%, 4/1/26 | | | 180 | | | | 211,732 | |
| | |
Romeoville, IL, (Lewis University), 5.00%, 10/1/21 | | | 500 | | | | 514,635 | |
| | |
Romeoville, IL, (Lewis University), 5.00%, 10/1/22 | | | 500 | | | | 528,920 | |
| | |
Troy Capital Resource Corp., NY, (Rensselaer Polytechnic Institute), 5.00%, 9/1/31 | | | 1,795 | | | | 2,240,304 | |
| | |
Union County Higher Educational Facilities Financing Authority, PA, (Bucknell University), Prerefunded to 4/1/22, 5.00%, 4/1/28 | | | 530 | | | | 568,012 | |
| | |
University of California, 5.00%, 5/15/21 | | | 20 | | | | 20,079 | |
| |
| | | | $ | 13,501,834 | |
| | |
| Electric Utilities — 5.2% | | | | | | |
| | |
American Municipal Power-Ohio, Inc., (Meldahl Hydroelectric Project), 5.00%, 2/15/21 | | $ | 4,235 | | | $ | 4,309,875 | |
| | |
Apache County Industrial Development Authority, AZ, (Tucson Electric Power Co.), 4.50%, 3/1/30 | | | 2,390 | | | | 2,475,251 | |
| | | | | | | | |
| Security | | Principal Amount (000’s omitted) | | | Value | |
| | |
| Electric Utilities (continued) | | | | | | |
| | |
Arkansas River Power Authority, CO, 5.00%, 10/1/28 | | $ | 1,110 | | | $ | 1,317,648 | |
| | |
Arkansas River Power Authority, CO, 5.00%, 10/1/30 | | | 1,000 | | | | 1,169,180 | |
| | |
Hawaii Department of Budget and Finance, (Hawaiian Electric Co.), (AMT), 3.25%, 1/1/25 | | | 3,000 | | | | 3,181,710 | |
| | |
Long Island Power Authority, NY, Electric System Revenue, 0.859%, (70% of 1 mo. USD LIBOR + 0.75%), 10/1/23 (Put Date), 5/1/33(1) | | | 10,000 | | | | 9,997,300 | |
| | |
Municipal Electric Authority of Georgia, 5.25%, 1/1/21 | | | 2,000 | | | | 2,023,780 | |
| | |
Nebraska Public Power District, 5.00%, 1/1/29 | | | 2,000 | | | | 2,425,480 | |
| |
| | | | $ | 26,900,224 | |
| | |
| Escrowed / Prerefunded — 3.5% | | | | | | |
| | |
Beaverton School District No. 48J, OR, Prerefunded to 6/15/24, 5.00%, 6/15/30 | | $ | 1,150 | | | $ | 1,353,539 | |
| | |
Delaware Health Facilities Authority, (Nanticoke Memorial Hospital, Inc.), Escrowed to Maturity, 5.00%, 7/1/23 | | | 1,000 | | | | 1,126,430 | |
| | |
Lancaster Industrial Development Authority, PA, (Garden Spot Village), Escrowed to Maturity, 5.00%, 5/1/23 | | | 340 | | | | 381,796 | |
| | |
Norfolk Economic Development Authority, VA, (Bon Secours Health System, Inc.), Prerefunded to 11/1/22, 5.00%, 11/1/27 | | | 2,500 | | | | 2,742,425 | |
| | |
North Carolina Medical Care Commission, (Vidant Health), Prerefunded to 6/1/22, 5.00%, 6/1/36 | | | 1,830 | | | | 1,975,522 | |
| | |
Oklahoma Development Finance Authority, (St. John Health System), Prerefunded to 2/15/22, 5.00%, 2/15/26 | | | 5,000 | | | | 5,328,050 | |
| | |
Virginia Transportation Board, Prerefunded to 3/15/22, 4.00%, 3/15/25 | | | 4,645 | | | | 4,904,423 | |
| |
| | | | $ | 17,812,185 | |
| | |
| General Obligations — 14.8% | | | | | | |
| | |
Beaverton School District No. 48J, Washington and Multnomah Counties, OR, 5.00%, 6/15/25 | | $ | 1,000 | | | $ | 1,216,890 | |
| | |
Bergen County Improvement Authority, NJ, (County Administration Complex), 5.00%, 11/15/24 | | | 1,100 | | | | 1,310,309 | |
| | |
Bergen County Improvement Authority, NJ, (Valley Program Project), 4.00%, 3/1/32 | | | 1,100 | | | | 1,344,101 | |
| | |
Bingham and Bonneville Counties Joint School District No. 93, ID, 5.00%, 9/15/25 | | | 630 | | | | 687,859 | |
| | |
Collin County Community College District, TX, 5.00%, 8/15/26 | | | 1,000 | | | | 1,261,060 | |
| | |
Connecticut, 4.00%, 6/1/32 | | | 700 | | | | 843,535 | |
| | |
Cook County School District No. 63, IL, 5.00%, 12/1/28 | | | 2,595 | | | | 3,311,116 | |
| | |
Cook County School District No. 63, IL, 5.00%, 12/1/29 | | | 2,725 | | | | 3,457,752 | |
| | |
Dane County, WI, 2.00%, 4/1/28(2) | | | 1,000 | | | | 1,067,920 | |
| | |
Dane County, WI, 2.00%, 4/1/29(2) | | | 1,000 | | | | 1,058,190 | |
| | |
Dane County, WI, 2.00%, 4/1/30(2) | | | 1,000 | | | | 1,051,900 | |
| | |
Delaware Valley Regional Finance Authority, PA, 0.64%, (SIFMA + 0.53%), 9/1/23 (Put Date), 9/1/48(1) | | | 4,900 | | | | 4,855,802 | |
| | | | |
| | 5 | | See Notes to Financial Statements. |
Eaton Vance
National Limited Maturity Municipal Income Fund
September 30, 2020
Portfolio of Investments (Unaudited) — continued
| | | | | | | | |
| Security | | Principal Amount (000’s omitted) | | | Value | |
| | |
| General Obligations (continued) | | | | | | |
| | |
Franklin Township School District, NJ, 5.00%, 8/15/22 | | $ | 1,000 | | | $ | 1,090,510 | |
| | |
Guilford, CT, 4.00%, 8/1/32 | | | 250 | | | | 315,070 | |
| | |
Gwinnett County School District, GA, 5.00%, 2/1/26 | | | 2,220 | | | | 2,673,990 | |
| | |
Illinois, 3.25%, 11/1/26 | | | 960 | | | | 945,907 | |
| | |
Illinois, 4.00%, 6/1/33 | | | 4,900 | | | | 4,820,963 | |
| | |
Illinois, 5.00%, 2/1/23 | | | 5,000 | | | | 5,244,150 | |
| | |
Illinois, 5.00%, 11/1/24 | | | 1,100 | | | | 1,172,545 | |
| | |
Illinois, 5.00%, 2/1/25 | | | 4,000 | | | | 4,315,040 | |
| | |
Illinois, 5.00%, 11/1/26 | | | 5,000 | | | | 5,401,750 | |
| | |
Illinois, 5.50%, 5/1/30 | | | 500 | | | | 572,370 | |
| | |
Kentwood Public Schools, MI, 4.00%, 5/1/21 | | | 465 | | | | 475,328 | |
| | |
Millcreek Township School District, PA, 5.00%, 9/15/21 | | | 3,730 | | | | 3,882,743 | |
| | |
Millcreek Township School District, PA, 5.00%, 9/15/25 | | | 500 | | | | 566,260 | |
| | |
New York, NY, 5.00%, 8/1/24 | | | 2,000 | | | | 2,307,260 | |
| | |
Palo Alto, CA, (Election of 2008), 5.00%, 8/1/28 | | | 1,250 | | | | 1,254,838 | |
| | |
Pittsburgh, PA, Prerefunded to 9/1/22, 5.00%, 9/1/26 | | | 1,000 | | | | 1,092,450 | |
| | |
Portland Community College District, OR, 5.00%, 6/15/28 | | | 1,000 | | | | 1,244,950 | |
| | |
Portland Community College District, OR, 5.00%, 6/15/29 | | | 2,500 | | | | 3,094,950 | |
| | |
Salem-Keizer School District No. 24J, OR, 0.00%, 6/15/23 | | | 13,010 | | | | 12,867,150 | |
| | |
Salem-Keizer School District No. 24J, OR, 5.00%, 6/15/27 | | | 1,150 | | | | 1,482,546 | |
| |
| | | | $ | 76,287,204 | |
| | |
| Hospital — 7.2% | | | | | | |
| | |
Batesville Public Facilities Board, AR, (White River Health System, Inc.), 5.00%, 6/1/22 | | $ | 595 | | | $ | 624,351 | |
| | |
Batesville Public Facilities Board, AR, (White River Health System, Inc.), 5.00%, 6/1/23 | | | 795 | | | | 851,676 | |
| | |
Berks County Municipal Authority, PA, (Tower Health), 5.00% to 2/1/27 (Put Date), 2/1/40 | | | 3,000 | | | | 3,334,980 | |
| | |
Boone County, MO, (Boone Hospital Center), 5.00%, 8/1/28 | | | 1,000 | | | | 1,116,300 | |
| | |
California Municipal Finance Authority, (NorthBay Healthcare Group), Series 2015, 5.00%, 11/1/21 | | | 300 | | | | 310,782 | |
| | |
California Municipal Finance Authority, (NorthBay Healthcare Group), Series 2015, 5.00%, 11/1/22 | | | 185 | | | | 198,081 | |
| | |
Chattanooga Health, Educational and Housing Facility Board, TN, (CommonSpirit Health), 5.00%, 8/1/30 | | | 1,010 | | | | 1,276,973 | |
| | |
Cobb County Kennestone Hospital Authority, GA, (WellStar Health System, Inc.), 5.00%, 4/1/27 | | | 200 | | | | 249,184 | |
| | |
Cobb County Kennestone Hospital Authority, GA, (WellStar Health System, Inc.), 5.00%, 4/1/28 | | | 250 | | | | 316,515 | |
| | |
Escambia County Health Facilities Authority, FL, (Baptist Health Care Corp. Obligated Group), 5.00%, 8/15/34 | | | 1,150 | | | | 1,412,062 | |
| | |
Florence County, SC, (McLeod Regional Medical Center), 5.00%, 11/1/22 | | | 665 | | | | 724,198 | |
| | |
Halifax Hospital Medical Center, FL, 5.00%, 6/1/22 | | | 515 | | | | 551,297 | |
| | |
Halifax Hospital Medical Center, FL, 5.00%, 6/1/24 | | | 325 | | | | 371,709 | |
| | | | | | | | |
| Security | | Principal Amount (000’s omitted) | | | Value | |
| | |
| Hospital (continued) | | | | | | |
| | |
Halifax Hospital Medical Center, FL, 5.00%, 6/1/25 | | $ | 1,380 | | | $ | 1,619,665 | |
| | |
Hamilton County, OH, (Cincinnati Children’s Hospital Medical Center), 5.00%, 5/15/24 | | | 1,250 | | | | 1,443,075 | |
| | |
Hawaii Department of Budget and Finance, (Hawaii Pacific Health Group), 5.00%, 7/1/24 | | | 460 | | | | 513,719 | |
| | |
Illinois Finance Authority, (Presence Health Network), 5.00%, 2/15/23 | | | 1,000 | | | | 1,106,090 | |
| | |
Illinois Finance Authority, (Presence Health Network), 5.00%, 2/15/24 | | | 500 | | | | 574,570 | |
| | |
Louisville/Jefferson County Metro Government, KY, (Norton Healthcare, Inc.), 5.00% to 10/1/26 (Put Date), 10/1/47 | | | 1,500 | | | | 1,832,160 | |
| | |
Montgomery County Higher Education and Health Authority, PA, (Thomas Jefferson University Obligated Group), 5.00%, 9/1/33 | | | 4,000 | | | | 4,932,240 | |
| | |
New York Dormitory Authority, (Orange Regional Medical Center), Series 2017, 5.00%, 12/1/26(3) | | | 1,500 | | | | 1,795,545 | |
| | |
New York Dormitory Authority, (Orange Regional Medical Center), Series 2017, 5.00%, 12/1/27(3) | | | 1,200 | | | | 1,446,372 | |
| | |
Oregon Facilities Authority, (Providence Health and Services Group), 5.00%, 10/1/24 | | | 1,000 | | | | 1,126,840 | |
| | |
Philadelphia Hospitals and Higher Education Facilities Authority, PA, (The Children’s Hospital of Philadelphia), 5.00%, 7/1/32 | | | 925 | | | | 953,175 | |
| | |
Rhode Island Health and Educational Building Corp., (Care New England Health System), 5.00%, 9/1/31 | | | 2,650 | | | | 2,755,576 | |
| | |
South Carolina Jobs-Economic Development Authority, (Bon Secours Mercy Health, Inc.), 5.00% to 10/1/25 (Put Date), 12/1/48 | | | 1,500 | | | | 1,791,945 | |
| | |
Southeastern Ohio Port Authority, (Memorial Health System Obligated Group), 5.00%, 12/1/20 | | | 375 | | | | 377,138 | |
| | |
Southeastern Ohio Port Authority, (Memorial Health System Obligated Group), 5.00%, 12/1/22 | | | 500 | | | | 537,275 | |
| | |
Southeastern Ohio Port Authority, (Memorial Health System Obligated Group), 5.00%, 12/1/23 | | | 250 | | | | 276,803 | |
| | |
Southeastern Ohio Port Authority, (Memorial Health System Obligated Group), 5.00%, 12/1/24 | | | 285 | | | | 302,815 | |
| | |
University of California, (Regents Medical Center), 5.00%, 5/15/22 | | | 890 | | | | 958,583 | |
| | |
Yuma Industrial Development Authority, AZ, (Yuma Regional Medical Center), 5.00%, 8/1/25 | | | 1,230 | | | | 1,418,178 | |
| |
| | | | $ | 37,099,872 | |
| | |
| Housing — 0.5% | | | | | | |
| | |
Allegheny County Residential Finance Authority, PA, SFMR, (AMT), 4.80%, 11/1/22 | | $ | 155 | | | $ | 155,516 | |
| | |
New Hope Cultural Education Facilities Finance Corp., TX, (CHF-Collegiate Housing Corpus Christi II, LLC - Texas A&M University), 4.00%, 4/1/25 | | | 360 | | | | 345,802 | |
| | | | |
| | 6 | | See Notes to Financial Statements. |
Eaton Vance
National Limited Maturity Municipal Income Fund
September 30, 2020
Portfolio of Investments (Unaudited) — continued
| | | | | | | | |
| Security | | Principal Amount (000’s omitted) | | | Value | |
| | |
| Housing (continued) | | | | | | |
| | |
New Hope Cultural Education Facilities Finance Corp., TX, (CHF-Collegiate Housing Corpus Christi II, LLC - Texas A&M University), 4.00%, 4/1/26 | | $ | 375 | | | $ | 355,957 | |
| | |
Phoenix Industrial Development Authority, AZ, (Downtown Phoenix Student Housing II, LLC - Arizona State University), 5.00%, 7/1/32 | | | 365 | | | | 399,591 | |
| | |
Phoenix Industrial Development Authority, AZ, (Downtown Phoenix Student Housing II, LLC - Arizona State University), 5.00%, 7/1/33 | | | 300 | | | | 326,562 | |
| | |
Public Finance Authority, WI, (NC A&T Real Estate Foundation, LLC), 5.00%, 6/1/27 | | | 500 | | | | 550,415 | |
| | |
Sandoval County, NM, MFMR, 6.00%, 5/1/32(3) | | | 505 | | | | 505,419 | |
| | |
Texas Student Housing Corp., (University of North Texas), 9.375%, 7/1/06(4) | | | 95 | | | | 95,000 | |
| |
| | | | $ | 2,734,262 | |
| | |
| Industrial Development Revenue — 4.2% | | | | | | |
| | |
Maine Finance Authority, (Casella Waste Systems, Inc.), (AMT), 5.125% to 8/1/25 (Put Date), 8/1/35(3) | | $ | 1,880 | | | $ | 2,098,644 | |
| | |
New Hampshire Business Finance Authority, (Casella Waste Systems, Inc.), (AMT), 2.95%, 4/1/29(3) | | | 860 | | | | 852,965 | |
| | |
New York State Environmental Facilities Corp., (Casella Waste Systems, Inc.), (AMT), 2.875% to 12/3/29 (Put Date), 12/1/44(3) | | | 435 | | | | 428,597 | |
| | |
Pennsylvania Economic Development Financing Authority, (Waste Management, Inc.), (AMT), 0.45% to 11/2/20 (Put Date), 8/1/45(5) | | | 1,500 | | | | 1,500,105 | |
| | |
Public Finance Authority, WI, (Celanese Corp.), (AMT), 5.00%, 1/1/24 | | | 3,000 | | | | 3,312,390 | |
| | |
Public Finance Authority, WI, (Waste Management, Inc.), (AMT), 2.625%, 11/1/25 | | | 1,000 | | | | 1,056,840 | |
| | |
Richland County, SC, (International Paper Co.), (AMT), 3.875%, 4/1/23 | | | 6,165 | | | | 6,632,800 | |
| | |
Whiting, IN, (BP Products North America, Inc.), (AMT), 5.00% to 3/1/23 (Put Date), 3/1/46 | | | 5,000 | | | | 5,521,450 | |
| |
| | | | $ | 21,403,791 | |
| | |
| Insured – Education — 1.8% | | | | | | |
| | |
California Educational Facilities Authority, (Santa Clara University), (NPFG), 5.00%, 9/1/23 | | $ | 500 | | | $ | 547,300 | |
| | |
New York Dormitory Authority, (Educational Housing Services), (AMBAC), 5.25%, 7/1/21 | | | 2,025 | | | | 2,092,756 | |
| | |
New York Dormitory Authority, (Rochester Institute of Technology), (AMBAC), 5.25%, 7/1/22 | | | 5,150 | | | | 5,586,308 | |
| | |
Northern Illinois University, (BAM), 5.00%, 4/1/30 | | | 850 | | | | 1,085,918 | |
| |
| | | | $ | 9,312,282 | |
| | | | | | | | |
| Security | | Principal Amount (000’s omitted) | | | Value | |
| | |
| Insured – Electric Utilities — 1.0% | | | | | | |
| | |
Brownsville, TX, Utility System Revenue, (AGM), 5.00%, 9/1/28 | | $ | 450 | | | $ | 584,127 | |
| | |
Brownsville, TX, Utility System Revenue, (AGM), 5.00%, 9/1/29 | | | 875 | | | | 1,154,755 | |
| | |
Louisiana Energy & Power Authority, (AGM), 5.25%, 6/1/25 | | | 1,125 | | | | 1,268,854 | |
| | |
Paducah Electric Plant Board, KY, (AGM), 5.00%, 10/1/26 | | | 1,100 | | | | 1,357,664 | |
| | |
Puerto Rico Electric Power Authority, (NPFG), 5.00%, 7/1/23 | | | 160 | | | | 161,046 | |
| | |
Puerto Rico Electric Power Authority, (NPFG), 5.00%, 7/1/24 | | | 115 | | | | 115,943 | |
| | |
Puerto Rico Electric Power Authority, (NPFG), Series SS, 5.00%, 7/1/25 | | | 300 | | | | 302,460 | |
| |
| | | | $ | 4,944,849 | |
| | |
| Insured – Escrowed / Prerefunded — 0.4% | | | | | | |
| | |
Bolingbrook, IL, (AGM), Escrowed to Maturity, 5.00%, 1/1/23 | | $ | 875 | | | $ | 967,663 | |
| | |
North Hudson Sewer Authority, NJ, (NPFG), Escrowed to Maturity, 5.125%, 8/1/22 | | | 1,000 | | | | 1,089,750 | |
| |
| | | | $ | 2,057,413 | |
| | |
| Insured – General Obligations — 11.4% | | | | | | |
| | |
Atlantic City, NJ, (BAM), 5.00%, 3/1/26 | | $ | 250 | | | $ | 304,148 | |
| | |
Bolingbrook, IL, (AGM), 5.00%, 1/1/23 | | | 125 | | | | 137,680 | |
| | |
Boston, MA, (NPFG), 0.125%, 3/1/22 | | | 7,855 | | | | 7,855,157 | |
| | |
Cambria County, PA, (AGM), 4.00%, 8/1/33 | | | 500 | | | | 567,600 | |
| | |
Cambria County, PA, (BAM), 5.00%, 8/1/21 | | | 1,085 | | | | 1,125,590 | |
| | |
Cambria County, PA, (BAM), 5.00%, 8/1/22 | | | 1,850 | | | | 2,000,793 | |
| | |
Community College District No. 536, IL, (Lewis and Clark Community College), (AGM), 4.00%, 5/1/28 | | | 400 | | | | 465,996 | |
| | |
Jackson Township Board of Education of Ocean County, NJ, (NPFG), 5.25%, 6/15/23 | | | 6,000 | | | | 6,639,480 | |
| | |
Linn County Community School District No. 9, OR, (Lebanon), (NPFG), 5.25%, 6/15/21 | | | 1,055 | | | | 1,093,001 | |
| | |
Linn County Community School District No. 9, OR, (Lebanon), (NPFG), 5.25%, 6/15/22 | | | 625 | | | | 679,413 | |
| | |
Livonia Public Schools School District, MI, (BAM), 5.00%, 5/1/22 | | | 1,675 | | | | 1,798,213 | |
| | |
Luzerne County, PA, (AGM), 5.00%, 11/15/22 | | | 2,250 | | | | 2,461,972 | |
| | |
McHenry County Community Unit School District No. 12, IL, (AGM), 5.00%, 1/1/23 | | | 940 | | | | 1,026,912 | |
| | |
McHenry County Community Unit School District No. 12, IL, (AGM), 5.00%, 1/1/24 | | | 1,165 | | | | 1,318,675 | |
| | |
New Haven, CT, (AGM), 5.00%, 8/1/22 | | | 5,000 | | | | 5,358,950 | |
| | |
Philadelphia School District, PA, (AGM), 5.50%, 6/1/21 | | | 1,000 | | | | 1,032,070 | |
| | |
Puerto Rico, (AGM), 5.25%, 7/1/24 | | | 500 | | | | 512,870 | |
| | |
Puerto Rico Public Buildings Authority, (NPFG), 6.00%, 7/1/24 | | | 240 | | | | 246,250 | |
| | |
Rockland County, NY, (AGM), 4.00%, 5/1/21 | | | 1,820 | | | | 1,860,422 | |
| | |
Rockland County, NY, (AGM), 5.00%, 3/1/21 | | | 3,000 | | | | 3,059,910 | |
| | | | |
| | 7 | | See Notes to Financial Statements. |
Eaton Vance
National Limited Maturity Municipal Income Fund
September 30, 2020
Portfolio of Investments (Unaudited) — continued
| | | | | | | | |
| Security | | Principal Amount (000’s omitted) | | | Value | |
| | |
| Insured – General Obligations (continued) | | | | | | |
| | |
San Mateo County Community College District, CA, (Election of 2005), (NPFG), 0.00%, 9/1/22 | | $ | 3,000 | | | $ | 2,983,380 | |
| | |
Vauxmont Metropolitan District, CO, (AGM), 5.00%, 12/1/31 | | | 910 | | | | 1,175,129 | |
| | |
Washington, (AMBAC), 0.00%, 12/1/22 | | | 10,000 | | | | 9,927,800 | |
| | |
West Virginia, (NPFG), 0.00%, 11/1/21 | | | 4,275 | | | | 4,265,723 | |
| | |
Will and Cook Counties Community High School District No. 210, IL, (AGM), 4.00%, 1/1/34 | | | 650 | | | | 716,541 | |
| |
| | | | $ | 58,613,675 | |
| | |
| Insured – Hospital — 0.2% | | | | | | |
| | |
Allegheny County Hospital Development Authority, PA, (UPMC Health System), (NPFG), 6.00%, 7/1/24 | | $ | 250 | | | $ | 299,120 | |
| | |
Massachusetts Development Finance Agency, (Wellforce), (AGM), 5.00%, 10/1/26 | | | 360 | | | | 441,972 | |
| | |
Oregon Health and Science University, (NPFG), 0.00%, 7/1/21 | | | 365 | | | | 364,317 | |
| |
| | | | $ | 1,105,409 | |
| | |
| Insured – Special Tax Revenue — 2.8% | | | | | | |
| | |
Garden State Preservation Trust, NJ, (AGM), 5.75%, 11/1/28 | | $ | 1,000 | | | $ | 1,258,600 | |
| | |
Illinois Sports Facilities Authority, (AMBAC), 0.00%, 6/15/22 | | | 7,000 | | | | 6,706,910 | |
| | |
Massachusetts, Special Obligation, (AGM), 5.50%, 6/1/21 | | | 5,000 | | | | 5,178,450 | |
| | |
Pennsylvania Turnpike Commission, Registration Fee Revenue, (AGM), 5.25%, 7/15/22 | | | 1,000 | | | | 1,091,310 | |
| |
| | | | $ | 14,235,270 | |
| | |
| Insured – Transportation — 1.1% | | | | | | |
| | |
New Jersey Transportation Trust Fund Authority, (NPFG), 5.50%, 12/15/20 | | $ | 5,350 | | | $ | 5,399,862 | |
| |
| | | | $ | 5,399,862 | |
|
| Insured – Water and Sewer — 1.3% | |
| | |
Allegheny County Sanitation Authority, PA, (AGM), 5.00%, 6/1/24 | | $ | 500 | | | $ | 503,990 | |
| | |
Calexico Financing Authority, CA, Water Revenue, (AGM), 4.00%, 11/1/27 | | | 125 | | | | 151,293 | |
| | |
Calexico Financing Authority, CA, Water Revenue, (AGM), 4.00%, 11/1/28 | | | 200 | | | | 244,532 | |
| | |
Calexico Financing Authority, CA, Water Revenue, (AGM), 4.00%, 11/1/29 | | | 205 | | | | 253,236 | |
| | |
Michigan Finance Authority, (Detroit Water and Sewerage Department), (AGM), 5.00%, 7/1/23 | | | 5,000 | | | | 5,645,400 | |
| |
| | | | $ | 6,798,451 | |
| | | | | | | | |
| Security | | Principal Amount (000’s omitted) | | | Value | |
|
| Lease Revenue / Certificates of Participation — 1.9% | |
| | |
Burke County, NC, Limited Obligation Bonds, 5.00%, 4/1/28 | | $ | 250 | | | $ | 316,738 | |
| | |
Burke County, NC, Limited Obligation Bonds, 5.00%, 4/1/29 | | | 250 | | | | 314,570 | |
| | |
California State Public Works Board, 5.00%, 11/1/26 | | | 2,725 | | | | 3,107,399 | |
| | |
Michigan Strategic Fund, Limited Obligation Revenue, (Facility for Rare Isotope Beams), 5.00%, 3/1/21 | | | 500 | | | | 509,480 | |
| | |
New Jersey Economic Development Authority, (School Facilities Construction), 4.00%, 6/15/28 | | | 5,000 | | | | 5,277,950 | |
| |
| | | | $ | 9,526,137 | |
| | |
| Other Revenue — 2.5% | | | | | | |
| | |
Black Belt Energy Gas District, AL, 0.48%, (SIFMA + 0.37%), 10/1/26 (Put Date), 10/1/49(1) | | $ | 5,000 | | | $ | 4,914,400 | |
| | |
California Infrastructure and Economic Development Bank, (Academy of Motion Picture Arts and Sciences Obligated Group), 5.00%, 11/1/23 | | | 1,000 | | | | 1,149,640 | |
| | |
Central Falls Detention Facility Corp., RI, 7.25%, 7/15/35(6) | | | 1,200 | | | | 216,000 | |
| | |
Kalispel Tribe of Indians, WA, Series A, 5.00%, 1/1/32(3) | | | 1,035 | | | | 1,165,296 | |
| | |
Patriots Energy Group Financing Agency, SC, Gas Supply Revenue, (Liq: Royal Bank of Canada), 0.96%, (67% of 1 mo. USD LIBOR + 0.86%), 2/1/24 (Put Date), 10/1/48(1) | | | 2,000 | | | | 2,003,360 | |
| | |
Philadelphia Redevelopment Authority, PA, (Transformation Initiative), 5.00%, 4/15/24 | | | 750 | | | | 801,870 | |
| | |
Riversouth Authority, OH, (Lazarus Building Redevelopment), 5.75%, 12/1/27 | | | 240 | | | | 240,310 | |
| | |
Will and Kankakee Counties Community Unit School District No. 255-U, IL, 5.00%, 6/1/23 | | | 675 | | | | 745,834 | |
| | |
Will and Kankakee Counties Community Unit School District No. 255-U, IL, 5.00%, 6/1/24 | | | 590 | | | | 673,420 | |
| | |
Will and Kankakee Counties Community Unit School District No. 255-U, IL, 5.00%, 6/1/25 | | | 1,000 | | | | 1,173,170 | |
| |
| | | | $ | 13,083,300 | |
| | |
| Senior Living / Life Care — 3.9% | | | | | | |
| | |
Hawaii State Department of Budget and Finance, Special Purpose Senior Living Revenue, 5.00%, 11/15/27 | | $ | 1,775 | | | $ | 1,921,579 | |
| | |
Howard County, MD, (Vantage House), 5.00%, 4/1/21 | | | 90 | | | | 90,580 | |
| | |
Illinois Finance Authority, (Presbyterian Homes Obligated Group), 1.459%, (70% of 1 mo. USD LIBOR + 1.35%), 5/1/21 (Put Date), 5/1/36(1) | | | 1,300 | | | | 1,300,195 | |
| | |
Missouri Health and Educational Facilities Authority, (Bethesda Health Group, Inc.), 5.00%, 8/1/21 | | | 675 | | | | 690,113 | |
| | |
Missouri Health and Educational Facilities Authority, (Bethesda Health Group, Inc.), 5.00%, 8/1/22 | | | 550 | | | | 576,153 | |
| | |
Missouri Health and Educational Facilities Authority, (Bethesda Health Group, Inc.), 5.00%, 8/1/23 | | | 705 | | | | 755,048 | |
| | |
Missouri Health and Educational Facilities Authority, (Bethesda Health Group, Inc.), 5.00%, 8/1/24 | | | 480 | | | | 524,112 | |
| | | | |
| | 8 | | See Notes to Financial Statements. |
Eaton Vance
National Limited Maturity Municipal Income Fund
September 30, 2020
Portfolio of Investments (Unaudited) — continued
| | | | | | | | |
| Security | | Principal Amount (000’s omitted) | | | Value | |
| | |
| Senior Living / Life Care (continued) | | | | | | |
| | |
New Hope Cultural Education Facilities Finance Corp., TX, (Longhorn Village), 4.25%, 1/1/33 | | $ | 2,105 | | | $ | 2,229,174 | |
| | |
New Hope Cultural Education Facilities Finance Corp., TX, (Longhorn Village), 5.00%, 1/1/30 | | | 1,265 | | | | 1,377,534 | |
| | |
North Oaks, MN, (Waverly Gardens), 4.00%, 10/1/20 | | | 1,230 | | | | 1,230,000 | |
| | |
North Oaks, MN, (Waverly Gardens), 4.00%, 10/1/21 | | | 1,380 | | | | 1,399,858 | |
| | |
North Oaks, MN, (Waverly Gardens), 4.00%, 10/1/22 | | | 1,435 | | | | 1,473,860 | |
| | |
St. Johns County Industrial Development Authority, FL, (Westminster St. Augustine), Prerefunded to 8/1/22, 4.125% to 8/1/24 (Put Date), 8/1/47 | | | 975 | | | | 1,052,532 | |
| | |
Tempe Industrial Development Authority, AZ, (Friendship Village of Tempe), 6.00%, 12/1/27 | | | 2,140 | | | | 2,184,384 | |
| | |
Washington Housing Finance Commission, (Wesley Homes at Lea Hill),
3.75%, 7/1/26(3) | | | 3,420 | | | | 3,422,291 | |
| |
| | | | $ | 20,227,413 | |
| | |
| Special Tax Revenue — 7.8% | | | | | | |
| | |
Baltimore, MD, (Harbor Point), 3.05%, 6/1/28(3) | | $ | 190 | | | $ | 185,791 | |
| | |
Baltimore, MD, (Harbor Point), 3.15%, 6/1/29(3) | | | 200 | | | | 195,386 | |
| | |
Baltimore, MD, (Harbor Point), 3.20%, 6/1/30(3) | | | 200 | | | | 194,150 | |
| | |
Detroit Downtown Development Authority, MI, 0.00%, 7/1/21 | | | 2,000 | | | | 1,935,580 | |
| | |
Franklin County Convention Facilities Authority, OH, (Greater Columbus Convention Center Hotel Expansion), 5.00%, 12/1/34 | | | 1,010 | | | | 998,971 | |
| | |
Garden State Preservation Trust, NJ, 4.00%, 11/1/23 | | | 2,040 | | | | 2,119,703 | |
| | |
Jurupa Public Financing Authority, CA, 5.00%, 9/1/21 | | | 600 | | | | 625,884 | |
| | |
Louisiana, Highway Improvement Revenue, 5.00%, 6/15/25 | | | 750 | | | | 874,672 | |
| | |
Michigan Finance Authority, Detroit Financial Recovery Income Tax Revenue, 4.00%, 10/1/24 | | | 2,500 | | | | 2,625,750 | |
| | |
Michigan Trunk Line, 5.00%, 11/15/23 | | | 600 | | | | 631,830 | |
| | |
Michigan Trunk Line, 5.00%, 11/15/26 | | | 1,100 | | | | 1,157,585 | |
| | |
Michigan Trunk Line, 5.00%, 11/15/28 | | | 2,000 | | | | 2,102,620 | |
| | |
Michigan Trunk Line, 5.00%, 11/15/29 | | | 1,500 | | | | 1,576,965 | |
| | |
New River Community Development District, FL, (Capital Improvements),
5.00%, 5/1/13(6) | | | 280 | | | | 0 | |
| | |
New River Community Development District, FL, (Capital Improvements), Series 2010A-2, 5.75%, 5/1/38 | | | 345 | | | | 345,897 | |
| | |
New York Dormitory Authority, Sales Tax Revenue, (AMT), 5.00%, 3/15/24 | | | 1,405 | | | | 1,614,219 | |
| | |
New York Dormitory Authority, Sales Tax Revenue, (AMT), 5.00%, 3/15/25 | | | 1,470 | | | | 1,743,214 | |
| | |
New York Dormitory Authority, Sales Tax Revenue, (AMT), 5.00%, 3/15/26 | | | 1,545 | | | | 1,881,501 | |
| | |
New York State Urban Development Corp., Personal Income Tax Revenue, 5.00%, 3/15/31 | | | 1,480 | | | | 1,969,318 | |
| | |
Pennsylvania Turnpike Commission, Oil Franchise Tax, 5.00%, 12/1/25 | | | 6,350 | | | | 7,168,832 | |
| | | | | | | | |
| Security | | Principal Amount (000’s omitted) | | | Value | |
| | |
| Special Tax Revenue (continued) | | | | | | |
| | |
Saint Clair County Highway Revenue, IL, 4.00%, 1/1/22 | | $ | 555 | | | $ | 581,612 | |
| | |
Saint Clair County Highway Revenue, IL, Escrowed to Maturity, 4.00%, 1/1/23 | | | 310 | | | | 336,620 | |
| | |
Saint Clair County Highway Revenue, IL, Prerefunded to 1/1/23, 4.00%, 1/1/24 | | | 360 | | | | 390,913 | |
| | |
Sales Tax Securitization Corp., IL, Series 2018C, 5.00%, 1/1/29 | | | 1,525 | | | | 1,887,386 | |
| | |
Sales Tax Securitization Corp., IL, Series 2020A, 5.00%, 1/1/29 | | | 500 | | | | 618,815 | |
| | |
South Orange County Public Financing Authority, CA, 5.00%, 8/15/24 | | | 1,000 | | | | 1,061,570 | |
| | |
Sterling Hill Community Development District, FL, (Capital Improvements),
5.50%, 11/1/10(6) | | | 276 | | | | 173,612 | |
| | |
Terrebonne Levee and Conservation District, LA, (Public Improvement Sales Tax), Prerefunded to 7/1/23, 5.00%, 7/1/25 | | | 2,815 | | | | 3,183,343 | |
| | |
Winter Garden Village at Fowler Groves Community Development District, FL, 3.00%, 5/1/24 | | | 1,830 | | | | 1,854,430 | |
| | |
| | | | | | | $ | 40,036,169 | |
|
| Student Loan — 1.3% | |
| | |
Connecticut Higher Education Supplemental Loan Authority, (AMT), 5.00%, 11/15/22 | | $ | 125 | | | $ | 134,106 | |
| | |
Connecticut Higher Education Supplemental Loan Authority, (AMT), 5.00%, 11/15/23 | | | 230 | | | | 253,525 | |
| | |
Connecticut Higher Education Supplemental Loan Authority, (AMT), 5.00%, 11/15/24 | | | 300 | | | | 338,532 | |
| | |
Massachusetts Educational Financing Authority, (AMT), 3.50%, 7/1/33 | | | 4,930 | | | | 4,998,182 | |
| | |
Massachusetts Educational Financing Authority, (AMT), 5.00%, 7/1/24 | | | 1,000 | | | | 1,131,340 | |
| | |
| | | | | | | $ | 6,855,685 | |
|
| Transportation — 10.8% | |
| | |
Allegheny County Airport Authority, PA, (Pittsburgh International Airport), (AMT), Prerefunded to 1/1/22, 5.00%, 1/1/26 | | $ | 840 | | | $ | 888,023 | |
| | |
Allegheny County Airport Authority, PA, (Pittsburgh International Airport), (AMT), Prerefunded to 1/1/22, 5.00%, 1/1/28 | | | 520 | | | | 549,728 | |
| | |
Burbank-Glendale-Pasadena Airport Authority, CA, (AMT), 5.00%, 7/1/21 | | | 3,755 | | | | 3,875,085 | |
| | |
Chicago, IL, (Midway International Airport), (AMT), 5.00%, 1/1/21 | | | 500 | | | | 504,880 | |
| | |
Chicago, IL, (Midway International Airport), (AMT), 5.00%, 1/1/26 | | | 3,500 | | | | 4,150,685 | |
| | |
Chicago, IL, (O’Hare International Airport), (AMT), 5.00%, 1/1/21 | | | 950 | | | | 959,291 | |
| | | | |
| | 9 | | See Notes to Financial Statements. |
Eaton Vance
National Limited Maturity Municipal Income Fund
September 30, 2020
Portfolio of Investments (Unaudited) — continued
| | | | | | | | |
| Security | | Principal Amount (000’s omitted) | | | Value | |
|
| Transportation (continued) | |
| | |
Chicago, IL, (O’Hare International Airport), (AMT), 5.00%, 1/1/22 | | $ | 825 | | | $ | 865,574 | |
| | |
Chicago, IL, (O’Hare International Airport), (AMT), 5.00%, 1/1/23 | | | 1,300 | | | | 1,419,587 | |
| | |
Chicago, IL, (O’Hare International Airport), (AMT), 5.00%, 1/1/30 | | | 3,000 | | | | 3,144,750 | |
| | |
Grand Parkway Transportation Corp., TX, 5.00%, 2/1/23 | | | 2,400 | | | | 2,632,872 | |
| | |
Greater Orlando Aviation Authority, FL, (AMT), 5.00%, 10/1/21 | | | 4,750 | | | | 4,958,952 | |
| | |
Kentucky Public Transportation Infrastructure Authority, 0.00%, 7/1/21 | | | 550 | | | | 540,793 | |
| | |
Los Angeles Department of Airports, CA, (Los Angeles International Airport), (AMT), 5.00%, 5/15/25 | | | 2,500 | | | | 2,961,475 | |
| | |
Metropolitan Nashville Airport Authority, TN, (AMT), 5.00%, 7/1/26 | | | 885 | | | | 1,041,096 | |
| | |
Metropolitan Nashville Airport Authority, TN, (AMT), 5.00%, 7/1/27 | | | 1,250 | | | | 1,464,163 | |
| | |
New Jersey Transportation Trust Fund Authority, (Transportation Program), 1.31%, (SIFMA + 1.20%), 12/15/21 (Put Date), 6/15/34(1) | | | 4,000 | | | | 4,001,480 | |
| | |
New York Thruway Authority, 5.00%, 1/1/30 | | | 2,340 | | | | 2,730,031 | |
| | |
Pennsylvania Economic Development Financing Authority, (National Railroad Passenger), (AMT), 5.00%, 11/1/25 | | | 1,000 | | | | 1,090,550 | |
| | |
Pennsylvania Economic Development Financing Authority, (National Railroad Passenger), (AMT), 5.00%, 11/1/26 | | | 890 | | | | 969,424 | |
| | |
Pennsylvania Turnpike Commission, 5.00%, 12/1/37 | | | 2,850 | | | | 3,538,988 | |
| | |
Pennsylvania Turnpike Commission, Series 2013C, 5.00%, 12/1/22 | | | 1,000 | | | | 1,103,010 | |
| | |
Philadelphia, PA, Airport Revenue, (AMT), 5.00%, 6/15/23 | | | 1,000 | | | | 1,030,150 | |
| | |
Port Authority of New York and New Jersey, 5.00%, 7/15/31 | | | 2,500 | | | | 3,274,750 | |
| | |
Port of New Orleans, LA, (AMT), 5.00%, 4/1/26 | | | 485 | | | | 583,508 | |
| | |
Port of New Orleans, LA, (AMT), 5.00%, 4/1/27 | | | 505 | | | | 618,529 | |
| | |
Port of New Orleans, LA, (AMT), 5.00%, 4/1/28 | | | 485 | | | | 602,283 | |
| | |
Port of New Orleans, LA, (AMT), 5.00%, 4/1/29 | | | 515 | | | | 646,222 | |
| | |
Port of Seattle, WA, (AMT), 5.00%, 4/1/31 | | | 4,000 | | | | 4,979,960 | |
| | |
South Jersey Transportation Authority, NJ, 5.00%, 11/1/22 | | | 155 | | | | 166,158 | |
| | |
South Jersey Transportation Authority, NJ, 5.00%, 11/1/24 | | | 395 | | | | 447,823 | |
| | |
| | | | | | | $ | 55,739,820 | |
|
| Water and Sewer — 1.8% | |
| | |
Chicago, IL, Water Revenue, 5.00%, 11/1/22 | | $ | 1,000 | | | $ | 1,084,030 | |
| | |
Great Lakes Water Authority, MI, 5.00%, 7/1/24 | | | 150 | | | | 173,389 | |
| | |
Great Lakes Water Authority, MI, 5.00%, 7/1/25 | | | 100 | | | | 119,322 | |
| | |
Great Lakes Water Authority, MI, 5.00%, 7/1/26 | | | 300 | | | | 367,665 | |
| | |
Great Lakes Water Authority, MI, 5.00%, 7/1/27 | | | 300 | | | | 376,602 | |
| | |
Great Lakes Water Authority, MI, 5.00%, 7/1/28 | | | 220 | | | | 283,336 | |
| | |
Great Lakes Water Authority, MI, 5.00%, 7/1/29 | | | 460 | | | | 600,682 | |
| | | | | | | | |
| Security | | Principal Amount (000’s omitted) | | | Value | |
|
| Water and Sewer (continued) | |
| | |
Jefferson County, AL, Sewer Revenue, 5.00%, 10/1/22 | | $ | 1,000 | | | $ | 1,086,990 | |
| | |
New York City Municipal Water Finance Authority, NY, (Water and Sewer System), 5.00%, 6/15/32 | | | 3,000 | | | | 3,976,620 | |
| | |
Portland, OR, Sewer System Revenue, 5.00%, 5/1/28 | | | 1,000 | | | | 1,243,920 | |
| | |
| | | | | | | $ | 9,312,556 | |
| |
Total Tax-Exempt Municipal Securities — 88.7%
(identified cost $437,658,234) | | | $ | 456,668,963 | |
|
| Taxable Municipal Securities — 5.3% | |
| Security | | Principal Amount (000’s omitted) | | | Value | |
|
| Electric Utilities — 0.2% | |
| | |
Lincoln, NE, Electric System Revenue, 1.649%, 9/1/31 | | $ | 1,000 | | | $ | 1,010,610 | |
| | |
| | | | | | | $ | 1,010,610 | |
|
| General Obligations — 2.1% | |
| | |
Chicago, IL, 7.75%, 1/1/42 | | $ | 2,650 | | | $ | 2,868,519 | |
| | |
Clint Independent School District, TX, (PSF Guaranteed), 2.065%, 2/15/37 | | | 2,000 | | | | 2,041,520 | |
| | |
DeKalb, Kane, LaSalle, Lee, Ogle, Winnebago and Boone Counties Community College District No. 523, IL, 1.827%, 2/1/22 | | | 300 | | | | 300,990 | |
| | |
Dripping Springs Independent School District, TX , (PSF Guaranteed), 2.085%, 2/15/37 | | | 1,920 | | | | 1,961,491 | |
| | |
Encinitas Union School District, CA, 2.077%, 8/1/34(2) | | | 1,505 | | | | 1,509,636 | |
| | |
Leander Independent School District, TX, (PSF Guaranteed), 1.449%, 8/15/31 | | | 440 | | | | 445,227 | |
| | |
Leander Independent School District, TX, (PSF Guaranteed), 1.639%, 8/15/33 | | | 500 | | | | 507,050 | |
| | |
Leander Independent School District, TX, (PSF Guaranteed), 1.689%, 8/15/34 | | | 1,000 | | | | 1,011,350 | |
| | |
Mill Valley School District, CA, 1.30%, 8/1/22 | | | 155 | | | | 156,776 | |
| |
| | | | $ | 10,802,559 | |
| | |
| Hospital — 0.3% | | | | | | |
| | |
Middleburg Heights, OH, (Southwest General Health Center), 1.899%, 8/1/21 | | $ | 465 | | | $ | 465,205 | |
| | |
Middleburg Heights, OH, (Southwest General Health Center), 1.949%, 8/1/22 | | | 500 | | | | 500,445 | |
| | |
Middleburg Heights, OH, (Southwest General Health Center), 2.025%, 8/1/23 | | | 615 | | | | 615,713 | |
| |
| | | | $ | 1,581,363 | |
| | | | |
| | 10 | | See Notes to Financial Statements. |
Eaton Vance
National Limited Maturity Municipal Income Fund
September 30, 2020
Portfolio of Investments (Unaudited) — continued
| | | | | | | | |
| Security | | Principal Amount (000’s omitted) | | | Value | |
| | |
| Senior Living / Life Care — 1.7% | | | | | | |
| | |
Montgomery County Industrial Development Authority, PA, (ACTS Retirement-Life Communities, Inc. Obligated Group), 2.33%, 11/15/21 | | $ | 495 | | | $ | 495,406 | |
| | |
Montgomery County Industrial Development Authority, PA, (ACTS Retirement-Life Communities, Inc. Obligated Group), 2.38%, 11/15/22 | | | 360 | | | | 360,194 | |
| | |
Montgomery County Industrial Development Authority, PA, (ACTS Retirement-Life Communities, Inc. Obligated Group), 2.60%, 11/15/24 | | | 4,000 | | | | 3,997,800 | |
| | |
St. Johns County Industrial Development Authority, FL, (Westminster St. Augustine), Prerefunded to 8/1/22, 5.50% to 8/1/24 (Put Date), 8/1/44 | | | 3,675 | | | | 3,998,253 | |
| |
| | | | $ | 8,851,653 | |
| | |
| Student Loan — 0.2% | | | | | | |
| | |
Massachusetts Educational Financing Authority, 3.875%, 7/1/23 | | $ | 1,100 | | | $ | 1,153,647 | |
| |
| | | | $ | 1,153,647 | |
| | |
| Transportation — 0.3% | | | | | | |
| | |
Pennsylvania Turnpike Commission, 1.812%, 12/1/20 | | $ | 1,260 | | | $ | 1,262,810 | |
| |
| | | | $ | 1,262,810 | |
| | |
| Water and Sewer — 0.5% | | | | | | |
| | |
Henrico County, VA, Water and Sewer System Revenue, 2.317%, 5/1/40(2) | | $ | 2,500 | | | $ | 2,484,800 | |
| |
| | | | $ | 2,484,800 | |
| | |
Total Taxable Municipal Securities — 5.3%
(identified cost $26,655,508) | | | | | | $ | 27,147,442 | |
| | |
Total Investments — 94.0%
(identified cost $464,313,742) | | | | | | $ | 483,816,405 | |
| | |
Other Assets, Less Liabilities — 6.0% | | | | | | $ | 31,012,602 | |
| | |
Net Assets — 100.0% | | | | | | $ | 514,829,007 | |
The percentage shown for each investment category in the Portfolio of Investments is based on net assets.
At September 30, 2020, the concentration of the Fund’s investments in the various states and territories, determined as a percentage of net assets, is as follows:
| | | | |
| |
| Illinois | | | 13.1% | |
| |
| Pennsylvania | | | 10.6% | |
| |
| New York | | | 10.4% | |
| |
| Others, representing less than 10% individually | | | 59.9% | |
The Fund invests primarily in debt securities issued by municipalities. The ability of the issuers of the debt securities to meet their obligations may be affected by economic developments in a specific industry or municipality. At September 30, 2020, 21.2% of total investments are backed by bond insurance of various financial institutions and financial guaranty assurance agencies. The aggregate percentage insured by an individual financial institution or financial guaranty assurance agency ranged from 1.3% to 8.2% of total investments.
| (1) | Floating rate security. The stated interest rate represents the rate in effect at September 30, 2020. |
| (3) | Security exempt from registration under Rule 144A of the Securities Act of 1933, as amended. These securities may be sold in certain transactions in reliance on an exemption from registration (normally to qualified institutional buyers). At September 30, 2020, the aggregate value of these securities is $12,290,456 or 2.4% of the Fund’s net assets. |
| (4) | The issuer is in default on the payment of principal but continues to pay interest. |
| (5) | Variable rate security that may be tendered at par quarterly. The stated interest rate, which resets quarterly, is determined by the remarketing agent and represents the rate in effect at September 30, 2020. |
| (6) | Issuer is in default with respect to interest and/or principal payments. |
Abbreviations:
| | | | |
| AGM | | – | | Assured Guaranty Municipal Corp. |
| | |
| AMBAC | | – | | AMBAC Financial Group, Inc. |
| | |
| AMT | | – | | Interest earned from these securities may be considered a tax preference item for purposes of the Federal Alternative Minimum Tax. |
| | |
| BAM | | – | | Build America Mutual Assurance Co. |
| | |
| LIBOR | | – | | London Interbank Offered Rate |
| | |
| Liq | | – | | Liquidity Provider |
| | |
| MFMR | | – | | Multi-Family Mortgage Revenue |
| | |
| NPFG | | – | | National Public Finance Guarantee Corp. |
| | |
| PSF | | – | | Permanent School Fund |
| | |
| SFMR | | – | | Single Family Mortgage Revenue |
| | |
| SIFMA | | – | | Securities Industry and Financial Markets Association Municipal Swap Index |
| | |
| USD | | – | | United States Dollar |
| | | | |
| | 11 | | See Notes to Financial Statements. |
Eaton Vance
National Limited Maturity Municipal Income Fund
September 30, 2020
Statement of Assets and Liabilities (Unaudited)
| | | | |
| Assets | | September 30, 2020 | |
| |
Investments, at value (identified cost, $464,313,742) | | $ | 483,816,405 | |
| |
Cash | | | 26,739,430 | |
| |
Interest receivable | | | 4,891,336 | |
| |
Receivable for investments sold | | | 7,003,798 | |
| |
Receivable for Fund shares sold | | | 1,251,644 | |
| |
Total assets | | $ | 523,702,613 | |
|
| Liabilities | |
| |
Payable for when-issued securities | | $ | 7,186,460 | |
| |
Payable for Fund shares redeemed | | | 864,383 | |
| |
Distributions payable | | | 449,506 | |
| |
Payable to affiliates: | | | | |
| |
Investment adviser fee | | | 162,582 | |
| |
Distribution and service fees | | | 37,570 | |
| |
Accrued expenses | | | 173,105 | |
| |
Total liabilities | | $ | 8,873,606 | |
| |
Net Assets | | $ | 514,829,007 | |
|
| Sources of Net Assets | |
| |
Paid-in capital | | $ | 503,486,142 | |
| |
Distributable earnings | | | 11,342,865 | |
| |
Net Assets | | $ | 514,829,007 | |
|
| Class A Shares | |
| |
Net Assets | | $ | 197,557,657 | |
| |
Shares Outstanding | | | 19,997,578 | |
|
Net Asset Value and Redemption Price Per Share | |
| |
(net assets ÷ shares of beneficial interest outstanding) | | $ | 9.88 | |
|
Maximum Offering Price Per Share | |
| |
(100 ÷ 97.75 of net asset value per share) | | $ | 10.11 | |
|
| Class C Shares | |
| |
Net Assets | | $ | 18,650,891 | |
| |
Shares Outstanding | | | 2,012,419 | |
| |
Net Asset Value and Offering Price Per Share* | | | | |
| |
(net assets ÷ shares of beneficial interest outstanding) | | $ | 9.27 | |
|
| Class I Shares | |
| |
Net Assets | | $ | 298,620,459 | |
| |
Shares Outstanding | | | 30,215,086 | |
| |
Net Asset Value, Offering Price and Redemption Price Per Share | | | | |
| |
(net assets ÷ shares of beneficial interest outstanding) | | $ | 9.88 | |
On sales of $100,000 or more, the offering price of Class A shares is reduced.
| * | Redemption price per share is equal to the net asset value less any applicable contingent deferred sales charge. |
| | | | |
| | 12 | | See Notes to Financial Statements. |
Eaton Vance
National Limited Maturity Municipal Income Fund
September 30, 2020
Statement of Operations (Unaudited)
| | | | |
| Investment Income | | Six Months Ended
September 30, 2020 | |
| |
Interest | | $ | 7,593,324 | |
| |
Total investment income | | $ | 7,593,324 | |
|
| Expenses | |
| |
Investment adviser fee | | $ | 980,296 | |
|
Distribution and service fees | |
| |
Class A | | | 140,984 | |
| |
Class C | | | 95,121 | |
| |
Trustees’ fees and expenses | | | 13,494 | |
| |
Custodian fee | | | 61,602 | |
| |
Transfer and dividend disbursing agent fees | | | 72,460 | |
| |
Legal and accounting services | | | 36,500 | |
| |
Printing and postage | | | 12,140 | |
| |
Registration fees | | | 59,775 | |
| |
Miscellaneous | | | 35,723 | |
| |
Total expenses | | $ | 1,508,095 | |
| |
Net investment income | | $ | 6,085,229 | |
|
| Realized and Unrealized Gain (Loss) | |
| |
Net realized gain (loss) — | | | | |
| |
Investment transactions | | $ | 995,464 | |
| |
Net realized gain | | $ | 995,464 | |
| |
Change in unrealized appreciation (depreciation) — | | | | |
| |
Investments | | $ | 8,270,102 | |
| |
Net change in unrealized appreciation (depreciation) | | $ | 8,270,102 | |
| |
Net realized and unrealized gain | | $ | 9,265,566 | |
| |
Net increase in net assets from operations | | $ | 15,350,795 | |
| | | | |
| | 13 | | See Notes to Financial Statements. |
Eaton Vance
National Limited Maturity Municipal Income Fund
September 30, 2020
Statements of Changes in Net Assets
| | | | | | | | |
| Increase (Decrease) in Net Assets | | Six Months Ended September 30, 2020
(Unaudited) | | | Year Ended March 31, 2020 | |
|
From operations — | |
| | |
Net investment income | | $ | 6,085,229 | | | $ | 13,610,174 | |
| | |
Net realized gain | | | 995,464 | | | | 813,998 | |
| | |
Net change in unrealized appreciation (depreciation) | | | 8,270,102 | | | | (5,339,810 | ) |
| | |
Net increase in net assets from operations | | $ | 15,350,795 | | | $ | 9,084,362 | |
| | |
Distributions to shareholders — | | | | | | | | |
| | |
Class A | | $ | (2,304,692 | ) | | $ | (4,876,685 | ) |
| | |
Class C | | | (181,006 | ) | | | (545,487 | ) |
| | |
Class I | | | (3,765,355 | ) | | | (8,349,720 | ) |
| | |
Total distributions to shareholders | | $ | (6,251,053 | ) | | $ | (13,771,892 | ) |
| | |
Transactions in shares of beneficial interest — | | | | | | | | |
| | |
Proceeds from sale of shares | | | | | | | | |
| | |
Class A | | $ | 23,813,395 | | | $ | 15,985,957 | |
| | |
Class C | | | 2,136,265 | | | | 3,861,760 | |
| | |
Class I | | | 55,923,252 | | | | 90,310,195 | |
| | |
Net asset value of shares issued to shareholders in payment of distributions declared | | | | | | | | |
| | |
Class A | | | 1,945,321 | | | | 4,098,245 | |
| | |
Class C | | | 149,205 | | | | 428,649 | |
| | |
Class I | | | 1,249,427 | | | | 2,352,620 | |
| | |
Cost of shares redeemed | | | | | | | | |
| | |
Class A | | | (14,458,726 | ) | | | (35,878,208 | ) |
| | |
Class C | | | (5,866,207 | ) | | | (9,798,975 | ) |
| | |
Class I | | | (55,989,011 | ) | | | (91,965,796 | ) |
| | |
Net asset value of shares converted | | | | | | | | |
| | |
Class A | | | 2,287,450 | | | | 5,899,401 | |
| | |
Class C | | | (2,287,450 | ) | | | (5,899,401 | ) |
| | |
Net increase (decrease) in net assets from Fund share transactions | | $ | 8,902,921 | | | $ | (20,605,553 | ) |
| | |
Net increase (decrease) in net assets | | $ | 18,002,663 | | | $ | (25,293,083 | ) |
|
| Net Assets | |
| | |
At beginning of period | | $ | 496,826,344 | | | $ | 522,119,427 | |
| | |
At end of period | | $ | 514,829,007 | | | $ | 496,826,344 | |
| | | | |
| | 14 | | See Notes to Financial Statements. |
Eaton Vance
National Limited Maturity Municipal Income Fund
September 30, 2020
Financial Highlights
| | | | | | | | | | | | | | | | | | | | | | | | |
| | | Class A | |
| | |
| | | Six Months Ended
September 30, 2020
(Unaudited) | | | Year Ended March 31, | |
| | | 2020 | | | 2019 | | | 2018 | | | 2017 | | | 2016 | |
| | | | | | | |
Net asset value — Beginning of period | | $ | 9.700 | | | $ | 9.790 | | | $ | 9.730 | | | $ | 9.850 | | | $ | 10.160 | | | $ | 10.180 | |
| | | | | | |
| Income (Loss) From Operations | | | | | | | | | | | | | | | | | | | | | | | | |
| | | | | | |
Net investment income(1) | | $ | 0.117 | | | $ | 0.251 | | | $ | 0.272 | | | $ | 0.274 | | | $ | 0.283 | | | $ | 0.298 | |
| | | | | | |
Net realized and unrealized gain (loss) | | | 0.183 | | | | (0.087 | ) | | | 0.058 | | | | (0.120 | ) | | | (0.311 | ) | | | (0.020 | ) |
| | | | | | |
Total income (loss) from operations | | $ | 0.300 | | | $ | 0.164 | | | $ | 0.330 | | | $ | 0.154 | | | $ | (0.028 | ) | | $ | 0.278 | |
| | | | |
| Less Distributions | | | | | | | | | | | | | | | | | |
| | | | | | |
From net investment income | | $ | (0.120 | ) | | $ | (0.254 | ) | | $ | (0.270 | ) | | $ | (0.274 | ) | | $ | (0.282 | ) | | $ | (0.298 | ) |
| | | | | | |
Total distributions | | $ | (0.120 | ) | | $ | (0.254 | ) | | $ | (0.270 | ) | | $ | (0.274 | ) | | $ | (0.282 | ) | | $ | (0.298 | ) |
| | | | | | |
Net asset value — End of period | | $ | 9.880 | | | $ | 9.700 | | | $ | 9.790 | | | $ | 9.730 | | | $ | 9.850 | | | $ | 10.160 | |
| | | | | | |
Total Return(2) | | | 3.11 | %(3) | | | 1.66 | % | | | 3.45 | % | | | 1.55 | % | | | (0.29 | )% | | | 2.79 | % |
| | | | |
| Ratios/Supplemental Data | | | | | | | | | | | | | | | | | |
| | | | | | |
Net assets, end of period (000’s omitted) | | $ | 197,558 | | | $ | 180,506 | | | $ | 192,155 | | | $ | 189,734 | | | $ | 212,891 | | | $ | 275,435 | |
| | | | | | |
Ratios (as a percentage of average daily net assets): | | | | | | | | | | | | | | | | | | | | | | | | |
| | | | | | |
Expenses(4) | | | 0.66 | %(5) | | | 0.66 | % | | | 0.68 | % | | | 0.67 | % | | | 0.67 | % | | | 0.66 | % |
| | | | | | |
Net investment income | | | 2.38 | %(5) | | | 2.55 | % | | | 2.80 | % | | | 2.77 | % | | | 2.82 | % | | | 2.95 | % |
| | | | | | |
Portfolio Turnover | | | 30 | %(3) | | | 40 | % | | | 14 | % | | | 13 | % | | | 17 | % | | | 10 | % |
| (1) | Computed using average shares outstanding. |
| (2) | Returns are historical and are calculated by determining the percentage change in net asset value with all distributions reinvested and do not reflect the effect of sales charges. |
| (4) | Excludes the effect of custody fee credits, if any, of less than 0.005%. Effective September 1, 2015, custody fee credits, which were earned on cash deposit balances, were discontinued by the custodian. |
| | | | |
| | 15 | | See Notes to Financial Statements. |
Eaton Vance
National Limited Maturity Municipal Income Fund
September 30, 2020
Financial Highlights — continued
| | | | | | | | | | | | | | | | | | | | | | | | |
| | | Class C | |
| | |
| | | Six Months Ended
September 30, 2020
(Unaudited) | | | Year Ended March 31, | |
| | | 2020 | | | 2019 | | | 2018 | | | 2017 | | | 2016 | |
| | | | | | | |
Net asset value — Beginning of period | | $ | 9.100 | | | $ | 9.180 | | | $ | 9.120 | | | $ | 9.240 | | | $ | 9.530 | | | $ | 9.550 | |
| | | | | | |
| Income (Loss) From Operations | | | | | | | | | | | | | | | | | | | | | | | | |
| | | | | | |
Net investment income(1) | | $ | 0.076 | | | $ | 0.167 | | | $ | 0.186 | | | $ | 0.188 | | | $ | 0.195 | | | $ | 0.209 | |
| | | | | | |
Net realized and unrealized gain (loss) | | | 0.172 | | | | (0.078 | ) | | | 0.059 | | | | (0.121 | ) | | | (0.291 | ) | | | (0.020 | ) |
| | | | | | |
Total income (loss) from operations | | $ | 0.248 | | | $ | 0.089 | | | $ | 0.245 | | | $ | 0.067 | | | $ | (0.096 | ) | | $ | 0.189 | |
| | | | |
| Less Distributions | | | | | | | | | | | | | | | | | |
| | | | | | |
From net investment income | | $ | (0.078 | ) | | $ | (0.169 | ) | | $ | (0.185 | ) | | $ | (0.187 | ) | | $ | (0.194 | ) | | $ | (0.209 | ) |
| | | | | | |
Total distributions | | $ | (0.078 | ) | | $ | (0.169 | ) | | $ | (0.185 | ) | | $ | (0.187 | ) | | $ | (0.194 | ) | | $ | (0.209 | ) |
| | | | | | |
Net asset value — End of period | | $ | 9.270 | | | $ | 9.100 | | | $ | 9.180 | | | $ | 9.120 | | | $ | 9.240 | | | $ | 9.530 | |
| | | | | | |
Total Return(2) | | | 2.74 | %(3) | | | 0.95 | % | | | 2.73 | % | | | 0.71 | % | | | (1.03 | )% | | | 2.01 | % |
| | | | |
| Ratios/Supplemental Data | | | | | | | | | | | | | | | | | |
| | | | | | |
Net assets, end of period (000’s omitted) | | $ | 18,651 | | | $ | 24,108 | | | $ | 35,667 | | | $ | 73,533 | | | $ | 100,360 | | | $ | 119,453 | |
| | | | | | |
Ratios (as a percentage of average daily net assets): | | | | | | | | | | | | | | | | | | | | | | | | |
| | | | | | |
Expenses(4) | | | 1.41 | %(5) | | | 1.41 | % | | | 1.43 | % | | | 1.42 | % | | | 1.42 | % | | | 1.41 | % |
| | | | | | |
Net investment income | | | 1.65 | %(5) | | | 1.80 | % | | | 2.05 | % | | | 2.02 | % | | | 2.07 | % | | | 2.21 | % |
| | | | | | |
Portfolio Turnover | | | 30 | %(3) | | | 40 | % | | | 14 | % | | | 13 | % | | | 17 | % | | | 10 | % |
| (1) | Computed using average shares outstanding. |
| (2) | Returns are historical and are calculated by determining the percentage change in net asset value with all distributions reinvested and do not reflect the effect of sales charges. |
| (4) | Excludes the effect of custody fee credits, if any, of less than 0.005%. Effective September 1, 2015, custody fee credits, which were earned on cash deposit balances, were discontinued by the custodian. |
| | | | |
| | 16 | | See Notes to Financial Statements. |
Eaton Vance
National Limited Maturity Municipal Income Fund
September 30, 2020
Financial Highlights — continued
| | | | | | | | | | | | | | | | | | | | | | | | |
| | | Class I | |
| | |
| | | Six Months Ended
September 30, 2020
(Unaudited) | | | Year Ended March 31, | |
| | | 2020 | | | 2019 | | | 2018 | | | 2017 | | | 2016 | |
| | | | | | | |
Net asset value — Beginning of period | | $ | 9.700 | | | $ | 9.790 | | | $ | 9.730 | | | $ | 9.850 | | | $ | 10.170 | | | $ | 10.190 | |
| | | | | | |
| Income (Loss) From Operations | | | | | | | | | | | | | | | | | | | | | | | | |
| | | | | | |
Net investment income(1) | | $ | 0.125 | | | $ | 0.266 | | | $ | 0.286 | | | $ | 0.289 | | | $ | 0.298 | | | $ | 0.314 | |
| | | | | | |
Net realized and unrealized gain (loss) | | | 0.183 | | | | (0.087 | ) | | | 0.059 | | | | (0.120 | ) | | | (0.321 | ) | | | (0.021 | ) |
| | | | | | |
Total income (loss) from operations | | $ | 0.308 | | | $ | 0.179 | | | $ | 0.345 | | | $ | 0.169 | | | $ | (0.023 | ) | | $ | 0.293 | |
| | | | |
| Less Distributions | | | | | | | | | | | | | | | | | |
| | | | | | |
From net investment income | | $ | (0.128 | ) | | $ | (0.269 | ) | | $ | (0.285 | ) | | $ | (0.289 | ) | | $ | (0.297 | ) | | $ | (0.313 | ) |
| | | | | | |
Total distributions | | $ | (0.128 | ) | | $ | (0.269 | ) | | $ | (0.285 | ) | | $ | (0.289 | ) | | $ | (0.297 | ) | | $ | (0.313 | ) |
| | | | | | |
Net asset value — End of period | | $ | 9.880 | | | $ | 9.700 | | | $ | 9.790 | | | $ | 9.730 | | | $ | 9.850 | | | $ | 10.170 | |
| | | | | | |
Total Return(2) | | | 3.19 | %(3) | | | 1.81 | % | | | 3.61 | % | | | 1.70 | % | | | (0.24 | )% | | | 2.94 | % |
| | | | |
| Ratios/Supplemental Data | | | | | | | | | | | | | | | | | |
| | | | | | |
Net assets, end of period (000’s omitted) | | $ | 298,620 | | | $ | 292,213 | | | $ | 294,297 | | | $ | 288,575 | | | $ | 286,331 | | | $ | 297,168 | |
| | | | | | |
Ratios (as a percentage of average daily net assets): | | | | | | | | | | | | | | | | | | | | | | | | |
| | | | | | |
Expenses(4) | | | 0.51 | %(5) | | | 0.51 | % | | | 0.53 | % | | | 0.52 | % | | | 0.52 | % | | | 0.51 | % |
| | | | | | |
Net investment income | | | 2.54 | %(5) | | | 2.69 | % | | | 2.95 | % | | | 2.92 | % | | | 2.97 | % | | | 3.10 | % |
| | | | | | |
Portfolio Turnover | | | 30 | %(3) | | | 40 | % | | | 14 | % | | | 13 | % | | | 17 | % | | | 10 | % |
| (1) | Computed using average shares outstanding. |
| (2) | Returns are historical and are calculated by determining the percentage change in net asset value with all distributions reinvested. |
| (4) | Excludes the effect of custody fee credits, if any, of less than 0.005%. Effective September 1, 2015, custody fee credits, which were earned on cash deposit balances, were discontinued by the custodian. |
| | | | |
| | 17 | | See Notes to Financial Statements. |
Eaton Vance
National Limited Maturity Municipal Income Fund
September 30, 2020
Notes to Financial Statements (Unaudited)
1 Significant Accounting Policies
Eaton Vance National Limited Maturity Municipal Income Fund (the Fund) is a diversified series of Eaton Vance Investment Trust (the Trust). The Trust is a Massachusetts business trust registered under the Investment Company Act of 1940, as amended (the 1940 Act), as an open-end management investment company. The Fund’s investment objective is to provide current income exempt from regular federal income tax. The Fund offers three classes of shares. Class A shares are generally sold subject to a sales charge imposed at time of purchase. Class C shares are sold at net asset value and are generally subject to a contingent deferred sales charge (see Note 5). Effective January 25, 2019, Class C shares generally automatically convert to Class A shares ten years after their purchase and, effective November 5, 2020, automatically convert to Class A shares eight years after their purchase as described in the Fund’s prospectus. Class I shares are sold at net asset value and are not subject to a sales charge. Each class represents a pro-rata interest in the Fund, but votes separately on class-specific matters and (as noted below) is subject to different expenses. Realized and unrealized gains and losses are allocated daily to each class of shares based on the relative net assets of each class to the total net assets of the Fund. Net investment income, other than class-specific expenses, is allocated daily to each class of shares based upon the ratio of the value of each class’s paid shares to the total value of all paid shares. Each class of shares differs in its distribution plan and certain other class-specific expenses.
The following is a summary of significant accounting policies of the Fund. The policies are in conformity with accounting principles generally accepted in the United States of America (U.S. GAAP). The Fund is an investment company and follows accounting and reporting guidance in the Financial Accounting Standards Board (FASB) Accounting Standards Codification Topic 946.
A Investment Valuation — The following methodologies are used to determine the market value or fair value of investments.
Debt Obligations. Debt obligations are generally valued on the basis of valuations provided by third party pricing services, as derived from such services’ pricing models. Inputs to the models may include, but are not limited to, reported trades, executable bid and ask prices, broker/dealer quotations, prices or yields of securities with similar characteristics, interest rates, anticipated prepayments, benchmark curves or information pertaining to the issuer, as well as industry and economic events. The pricing services may use a matrix approach, which considers information regarding securities with similar characteristics to determine the valuation for a security. Short-term debt obligations purchased with a remaining maturity of sixty days or less for which a valuation from a third party pricing service is not readily available may be valued at amortized cost, which approximates fair value.
Fair Valuation. Investments for which valuations or market quotations are not readily available or are deemed unreliable are valued at fair value using methods determined in good faith by or at the direction of the Trustees of the Fund in a manner that most fairly reflects the security’s “fair value”, which is the amount that the Fund might reasonably expect to receive for the security upon its current sale in the ordinary course. Each such determination is based on a consideration of relevant factors, which are likely to vary from one pricing context to another. These factors may include, but are not limited to, the type of security, the existence of any contractual restrictions on the security’s disposition, the price and extent of public trading in similar securities of the issuer or of comparable companies or entities, quotations or relevant information obtained from broker/dealers or other market participants, information obtained from the issuer, analysts, and/or the appropriate stock exchange (for exchange-traded securities), an analysis of the company’s or entity’s financial statements, and an evaluation of the forces that influence the issuer and the market(s) in which the security is purchased and sold.
B Investment Transactions and Related Income — Investment transactions for financial statement purposes are accounted for on a trade date basis. Realized gains and losses on investments sold are determined on the basis of identified cost. Interest income is recorded on the basis of interest accrued, adjusted for amortization of premium or accretion of discount.
C Federal Taxes — The Fund’s policy is to comply with the provisions of the Internal Revenue Code applicable to regulated investment companies and to distribute to shareholders each year substantially all of its taxable, if any, and tax-exempt net investment income, and all or substantially all of its net realized capital gains. Accordingly, no provision for federal income or excise tax is necessary. The Fund intends to satisfy conditions which will enable it to designate distributions from the interest income generated by its investments in non-taxable municipal securities, which are exempt from regular federal income tax when received by the Fund, as exempt-interest dividends. The portion of such interest, if any, earned on private activity bonds issued after August 7, 1986, may be considered a tax preference item to shareholders.
As of September 30, 2020, the Fund had no uncertain tax positions that would require financial statement recognition, de-recognition, or disclosure. The Fund files a U.S. federal income tax return annually after its fiscal year-end, which is subject to examination by the Internal Revenue Service for a period of three years from the date of filing.
D Expenses — The majority of expenses of the Trust are directly identifiable to an individual fund. Expenses which are not readily identifiable to a specific fund are allocated taking into consideration, among other things, the nature and type of expense and the relative size of the funds.
E Legal Fees — Legal fees and other related expenses incurred as part of negotiations of the terms and requirement of capital infusions, or that are expected to result in the restructuring of, or a plan of reorganization for, an investment are recorded as realized losses. Ongoing expenditures to protect or enhance an investment are treated as operating expenses.
F Use of Estimates — The preparation of the financial statements in conformity with U.S. GAAP requires management to make estimates and assumptions that affect the reported amounts of assets and liabilities at the date of the financial statements and the reported amounts of income and expense during the reporting period. Actual results could differ from those estimates.
Eaton Vance
National Limited Maturity Municipal Income Fund
September 30, 2020
Notes to Financial Statements (Unaudited) — continued
G Indemnifications — Under the Trust’s organizational documents, its officers and Trustees may be indemnified against certain liabilities and expenses arising out of the performance of their duties to the Fund. Under Massachusetts law, if certain conditions prevail, shareholders of a Massachusetts business trust (such as the Trust) could be deemed to have personal liability for the obligations of the Trust. However, the Trust’s Declaration of Trust contains an express disclaimer of liability on the part of Fund shareholders and the By-laws provide that the Trust shall assume, upon request by the shareholder, the defense on behalf of any Fund shareholders. Moreover, the By-laws also provide for indemnification out of Fund property of any shareholder held personally liable solely by reason of being or having been a shareholder for all loss or expense arising from such liability. Additionally, in the normal course of business, the Fund enters into agreements with service providers that may contain indemnification clauses. The Fund’s maximum exposure under these arrangements is unknown as this would involve future claims that may be made against the Fund that have not yet occurred.
H When-Issued Securities and Delayed Delivery Transactions — The Fund may purchase or sell securities on a delayed delivery or when-issued basis. Payment and delivery may take place after the customary settlement period for that security. At the time the transaction is negotiated, the price of the security that will be delivered is fixed. The Fund maintains cash and/or security positions for these commitments such that sufficient liquid assets will be available to make payments upon settlement. Securities purchased on a delayed delivery or when-issued basis are marked-to-market daily and begin earning interest on settlement date. Losses may arise due to changes in the market value of the underlying securities or if the counterparty does not perform under the contract.
I Interim Financial Statements — The interim financial statements relating to September 30, 2020 and for the six months then ended have not been audited by an independent registered public accounting firm, but in the opinion of the Fund’s management, reflect all adjustments, consisting only of normal recurring adjustments, necessary for the fair presentation of the financial statements.
2 Distributions to Shareholders and Income Tax Information
The net investment income of the Fund is determined daily and substantially all of the net investment income so determined is declared as a dividend to shareholders of record at the time of declaration. Distributions are declared separately for each class of shares. Distributions are paid monthly. Distributions of realized capital gains are made at least annually. Shareholders may reinvest income and capital gain distributions in additional shares of the same class of the Fund at the net asset value as of the reinvestment date or, at the election of the shareholder, receive distributions in cash. Distributions to shareholders are determined in accordance with income tax regulations, which may differ from U.S. GAAP. As required by U.S. GAAP, only distributions in excess of tax basis earnings and profits are reported in the financial statements as a return of capital. Permanent differences between book and tax accounting relating to distributions are reclassified to paid-in capital. For tax purposes, distributions from short-term capital gains are considered to be from ordinary income.
At March 31, 2020, the Fund, for federal income tax purposes, had deferred capital losses of $9,392,277 which would reduce its taxable income arising from future net realized gains on investment transactions, if any, to the extent permitted by the Internal Revenue Code, and thus would reduce the amount of distributions to shareholders, which would otherwise be necessary to relieve the Fund of any liability for federal income or excise tax. The deferred capital losses are treated as arising on the first day of the Fund’s next taxable year and retain the same short-term or long-term character as when originally deferred. Of the deferred capital losses at March 31, 2020, $9,263,260 are short-term and $129,017 are long term.
The cost and unrealized appreciation (depreciation) of investments of the Fund at September 30, 2020, as determined on a federal income tax basis, were as follows:
| | | | |
| |
Aggregate cost | | $ | 464,006,588 | |
| |
Gross unrealized appreciation | | $ | 22,226,237 | |
| |
Gross unrealized depreciation | | | (2,416,420 | ) |
| |
Net unrealized appreciation | | $ | 19,809,817 | |
Eaton Vance
National Limited Maturity Municipal Income Fund
September 30, 2020
Notes to Financial Statements (Unaudited) — continued
3 Investment Adviser Fee and Other Transactions with Affiliates
The investment adviser fee is earned by Boston Management and Research (BMR), a subsidiary of Eaton Vance Management (EVM) and an indirect subsidiary of Eaton Vance Corp., as compensation for management and investment advisory services rendered to the Fund. The fee is based upon a percentage of average daily net assets plus a percentage of gross income (i.e., income other than gains from the sale of securities) as presented in the following table and is payable monthly.
| | | | | | | | |
| Daily Net Assets | | Annual Asset
Rate | | | Daily Income
Rate | |
| | |
Up to $500 million | | | 0.300 | % | | | 3.00 | % |
| | |
$500 million but less than $1 billion | | | 0.275 | | | | 2.75 | |
On average daily net assets of $1 billion or more, the rates are further reduced.
For the six months ended September 30, 2020, the investment adviser fee amounted to $980,296 or 0.39% (annualized) of the Fund’s average daily net assets.
EVM serves as the administrator of the Fund, but receives no compensation. EVM provides sub-transfer agency and related services to the Fund pursuant to a Sub-Transfer Agency Support Services Agreement. For the six months ended September 30, 2020, EVM earned $6,164 from the Fund pursuant to such agreement, which is included in transfer and dividend disbursing agent fees on the Statement of Operations. The Fund was informed that Eaton Vance Distributors, Inc. (EVD), an affiliate of EVM and the Fund’s principal underwriter, received $6,173 as its portion of the sales charge on sales of Class A shares for the six months ended September 30, 2020. EVD also received distribution and service fees from Class A and Class C shares (see Note 4) and contingent deferred sales charges (see Note 5).
Trustees and officers of the Fund who are members of EVM’s or BMR’s organizations receive remuneration for their services to the Fund out of the investment adviser fee. Trustees of the Fund who are not affiliated with the investment adviser may elect to defer receipt of all or a percentage of their annual fees in accordance with the terms of the Trustees Deferred Compensation Plan. For the six months ended September 30, 2020, no significant amounts have been deferred. Certain officers and Trustees of the Fund are officers of the above organizations.
4 Distribution Plans
The Fund has in effect a distribution plan for Class A shares (Class A Plan) pursuant to Rule 12b-1 under the 1940 Act. Pursuant to the Class A Plan, the Fund pays EVD a distribution and service fee not exceeding 0.25% per annum of its average daily net assets attributable to Class A shares for distribution services and facilities provided to the Fund by EVD, as well as for personal services and/or the maintenance of shareholder accounts. The Trustees approved distribution and service fee payments equal to 0.15% per annum of its average daily net assets attributable to Class A shares. Distribution and service fees paid or accrued to EVD for the six months ended September 30, 2020 amounted to $140,984 for Class A shares.
The Fund also has in effect a distribution plan for Class C shares (Class C Plan) pursuant to Rule 12b-1 under the 1940 Act. Pursuant to the Class C Plan, the Fund pays EVD amounts equal to 0.75% per annum of its average daily net assets attributable to Class C shares for providing ongoing distribution services and facilities to the Fund. For the six months ended September 30, 2020, the Fund paid or accrued to EVD $79,267 for Class C shares.
Pursuant to the Class C Plan, the Fund also makes payments of service fees to EVD, financial intermediaries and other persons in amounts not exceeding 0.25% per annum of its average daily net assets attributable to that class. The Trustees approved service fee payments equal to 0.15% per annum of its average daily net assets attributable to Class C shares. Service fees paid or accrued are for personal services and/or the maintenance of shareholder accounts. They are separate and distinct from the sales commissions and distribution fees payable to EVD. Service fees paid or accrued for the six months ended September 30, 2020 amounted to $15,854 for Class C shares.
Distribution and service fees are subject to the limitations contained in the Financial Industry Regulatory Authority Rule 2341(d).
5 Contingent Deferred Sales Charges
A contingent deferred sales charge (CDSC) of 1% generally is imposed on redemptions of Class C shares made within 12 months of purchase. Class A shares may be subject to a 1% CDSC if redeemed within 18 months of purchase (depending on the circumstances of purchase). Generally, the CDSC is based upon the lower of the net asset value at date of redemption or date of purchase. No charge is levied on shares acquired by reinvestment of dividends or capital gain distributions. For the six months ended September 30, 2020, the Fund was informed that EVD received $3,000 and $300 of CDSCs paid by Class A and Class C shareholders, respectively.
Eaton Vance
National Limited Maturity Municipal Income Fund
September 30, 2020
Notes to Financial Statements (Unaudited) — continued
6 Purchases and Sales of Investments
Purchases and sales of investments, other than short-term obligations, aggregated $145,038,859 and $159,261,356, respectively, for the six months ended September 30, 2020.
7 Shares of Beneficial Interest
The Fund’s Declaration of Trust permits the Trustees to issue an unlimited number of full and fractional shares of beneficial interest (without par value). Such shares may be issued in a number of different series (such as the Fund) and classes. Transactions in Fund shares were as follows:
| | | | | | | | |
| Class A | | Six Months Ended September 30, 2020
(Unaudited) | | | Year Ended March 31, 2020 | |
| | |
Sales | | | 2,426,154 | | | | 1,619,063 | |
| | |
Issued to shareholders electing to receive payments of distributions in Fund shares | | | 198,482 | | | | 414,876 | |
| | |
Redemptions | | | (1,476,913 | ) | | | (3,648,824 | ) |
| | |
Converted from Class C shares | | | 233,529 | | | | 598,972 | |
| | |
Net increase (decrease) | | | 1,381,252 | | | | (1,015,913 | ) |
| | |
| Class C | | Six Months Ended September 30, 2020
(Unaudited) | | | Year Ended March 31, 2020 | |
| | |
Sales | | | 230,454 | | | | 417,836 | |
| | |
Issued to shareholders electing to receive payments of distributions in Fund shares | | | 16,242 | | | | 46,269 | |
| | |
Redemptions | | | (635,583 | ) | | | (1,059,606 | ) |
| | |
Converted to Class A shares | | | (248,923 | ) | | | (638,462 | ) |
| | |
Net decrease | | | (637,810 | ) | | | (1,233,963 | ) |
| | |
| Class I | | Six Months Ended September 30, 2020
(Unaudited) | | | Year Ended March 31, 2020 | |
| | |
Sales | | | 5,711,366 | | | | 9,167,402 | |
| | |
Issued to shareholders electing to receive payments of distributions in Fund shares | | | 127,392 | | | | 238,077 | |
| | |
Redemptions | | | (5,748,674 | ) | | | (9,337,517 | ) |
| | |
Net increase | | | 90,084 | | | | 67,962 | |
8 Line of Credit
The Fund participates with other portfolios and funds managed by EVM and its affiliates in an $800 million unsecured line of credit agreement with a group of banks, which is in effect through October 27, 2020. Borrowings are made by the Fund solely for temporary purposes related to redemptions and other short-term cash needs. Interest is charged to the Fund based on its borrowings at an amount above either the Eurodollar rate or Federal Funds rate. In addition, a fee computed at an annual rate of 0.15% on the daily unused portion of the line of credit is allocated among the participating portfolios and funds at the end of each quarter. Because the line of credit is not available exclusively to the Fund, it may be unable to borrow some or all of its requested amounts at any particular time. The Fund did not have any significant borrowings or allocated fees during the six months ended September 30, 2020. Effective October 27, 2020, the Fund renewed its line of credit agreement, which expires October 26, 2021, at substantially the same terms.
Eaton Vance
National Limited Maturity Municipal Income Fund
September 30, 2020
Notes to Financial Statements (Unaudited) — continued
9 Fair Value Measurements
Under generally accepted accounting principles for fair value measurements, a three-tier hierarchy to prioritize the assumptions, referred to as inputs, is used in valuation techniques to measure fair value. The three-tier hierarchy of inputs is summarized in the three broad levels listed below.
| • | | Level 1 – quoted prices in active markets for identical investments |
| • | | Level 2 – other significant observable inputs (including quoted prices for similar investments, interest rates, prepayment speeds, credit risk, etc.) |
| • | | Level 3 – significant unobservable inputs (including a fund’s own assumptions in determining the fair value of investments) |
In cases where the inputs used to measure fair value fall in different levels of the fair value hierarchy, the level disclosed is determined based on the lowest level input that is significant to the fair value measurement in its entirety. The inputs or methodology used for valuing securities are not necessarily an indication of the risk associated with investing in those securities.
At September 30, 2020, the hierarchy of inputs used in valuing the Fund’s investments, which are carried at value, were as follows:
| | | | | | | | | | | | | | | | |
| Asset Description | | Level 1 | | | Level 2 | | | Level 3 | | | Total | |
| | | | |
Tax-Exempt Municipal Securities | | $ | — | | | $ | 456,668,963 | | | $ | — | | | $ | 456,668,963 | |
| | | | |
Taxable Municipal Securities | | | — | | | | 27,147,442 | | | | — | | | | 27,147,442 | |
| | | | |
Total Investments | | $ | — | | | $ | 483,816,405 | | | $ | — | | | $ | 483,816,405 | |
10 Risks and Uncertainties
Pandemic Risk
An outbreak of respiratory disease caused by a novel coronavirus was first detected in China in December 2019 and subsequently spread internationally. This coronavirus has resulted in closing borders, enhanced health screenings, changes to healthcare service preparation and delivery, quarantines, cancellations, disruptions to supply chains and customer activity, as well as general concern and uncertainty. Health crises caused by outbreaks, such as the coronavirus outbreak, may exacerbate other pre-existing political, social and economic risks and disrupt normal market conditions and operations. The impact of this outbreak has negatively affected the worldwide economy, the economies of individual countries, individual companies, and the market in general, and may continue to do so in significant and unforeseen ways, as may other epidemics and pandemics that may arise in the future. Any such impact could adversely affect the Fund’s performance, or the performance of the securities in which the Fund invests.
11 Subsequent Event
On October 8, 2020, Morgan Stanley and Eaton Vance Corp. (“Eaton Vance”) announced that they had entered into a definitive agreement under which Morgan Stanley would acquire Eaton Vance. Under the Investment Company Act of 1940, as amended, consummation of this transaction may result in the automatic termination of the Fund’s investment advisory agreement, and any related sub-advisory agreement(s), if applicable. Thus, the Fund’s Board will be asked to approve a new investment advisory agreement (and new sub-advisory agreement(s), if applicable). If approved by the Fund’s Board, the new investment advisory agreement (and new sub-advisory agreement(s), if applicable) is expected to be presented to Fund shareholders for approval, and, if approved, would take effect upon the closing of the transaction.
Eaton Vance
National Limited Maturity Municipal Income Fund
September 30, 2020
Board of Trustees’ Contract Approval
Overview of the Contract Review Process
The Investment Company Act of 1940, as amended (the “1940 Act”), provides, in substance, that the investment advisory agreement between a fund and its investment adviser will continue in effect from year-to-year only if its continuation is approved on an annual basis by a vote of the fund’s board of trustees, including a majority of the trustees who are not “interested persons” of the fund (“independent trustees”), cast in person at a meeting called for the purpose of considering such approval.
At a meeting held on April 22, 2020 (the “April 2020 Meeting”), the Boards of Trustees/Directors comprised of the same individuals (collectively, the “Board”) that oversees a majority of the registered investment companies advised by Eaton Vance Management or its affiliate, Boston Management and Research (the “Eaton Vance Funds”), including a majority of the independent trustees (the “Independent Trustees”), voted to approve the continuation of existing investment advisory agreements and sub-advisory agreements(1) for each of the Eaton Vance Funds for an additional one-year period. The Board relied upon the affirmative recommendation of its Contract Review Committee, which is a committee exclusively comprised of Independent Trustees. Prior to making its recommendation, the Contract Review Committee reviewed information furnished by the adviser and sub-adviser to each of the Eaton Vance Funds (including information specifically requested by the Board) for a series of formal meetings held between February and April 2020. Members of the Contract Review Committee also considered information received at prior meetings of the Board and its committees, to the extent such information was relevant to the Contract Review Committee’s annual evaluation of the investment advisory agreements and sub-advisory agreements.
In connection with its evaluation of the investment advisory agreements and sub-advisory agreements, the Board considered various information relating to the Eaton Vance Funds. This included information applicable to all or groups of Eaton Vance Funds, which is referenced immediately below, and information applicable to the particular Eaton Vance Fund covered by this report (additional fund-specific information is referenced below under “Results of the Contract Review Process”). (For funds that invest through one or more underlying portfolios, references to “each fund” in this section may include information that was considered at the portfolio-level.)
Information about Fees, Performance and Expenses
| | • | | A report from an independent data provider comparing advisory and other fees paid by each fund to such fees paid by comparable funds, as identified by the independent data provider (“comparable funds”); |
| | • | | A report from an independent data provider comparing each fund’s total expense ratio (and its components) to those of comparable funds; |
| | • | | A report from an independent data provider comparing the investment performance of each fund (including, as relevant, total return data, income data, Sharpe ratios and information ratios) to the investment performance of comparable funds and, as applicable, benchmark indices, over various time periods; |
| | • | | In certain instances, data regarding investment performance relative to customized groups of |
| | peer funds and blended indices identified by the adviser in consultation with the Portfolio Management Committee of the Board; |
| | • | | Comparative information concerning the fees charged and services provided by the adviser and sub-adviser to each fund in managing other accounts (which may include other mutual funds, collective investment funds and institutional accounts) using investment strategies and techniques similar to those used in managing such fund(s), if any; |
| | • | | Profitability analyses with respect to the adviser and sub-adviser to each of the funds; |
Information about Portfolio Management and Trading
| | • | | Descriptions of the investment management services provided to each fund, as well as each of the funds’ investment strategies and policies; |
| | • | | The procedures and processes used to determine the fair value of fund assets, when necessary, and actions taken to monitor and test the effectiveness of such procedures and processes; |
| | • | | Information about the policies and practices of each fund’s adviser and sub-adviser (in the context of a sub-adviser, only those with trading responsibilities) with respect to trading, including their processes for seeking best execution of portfolio transactions; |
| | • | | Information about the allocation of brokerage transactions and the benefits, if any, received by the adviser and sub-adviser (in the context of a sub-adviser, only those with trading responsibilities) to each fund as a result of brokerage allocation, including, as applicable, information concerning the acquisition of research through client commission arrangements and policies with respect to “soft dollars”; |
| | • | | Data relating to the portfolio turnover rate of each fund; |
Information about each Adviser and Sub-adviser
| | • | | Reports detailing the financial results and condition of the adviser and sub-adviser to each fund; |
| | • | | Information regarding the individual investment professionals whose responsibilities include portfolio management and investment research for the funds, and, for portfolio managers and certain other investment professionals, information relating to their responsibilities with respect to managing other mutual funds and investment accounts, as applicable; |
| (1) | Not all Eaton Vance Funds have entered into a sub-advisory agreement with a sub-adviser. Accordingly, references to “sub-adviser” or “sub-advisory agreement” in this “Overview” section may not be applicable to the particular Eaton Vance Fund covered by this report. |
Eaton Vance
National Limited Maturity Municipal Income Fund
September 30, 2020
Board of Trustees’ Contract Approval — continued
| | • | | The Code of Ethics of the adviser and its affiliates and the sub-adviser of each fund, together with information relating to compliance with, and the administration of, such codes; |
| | • | | Policies and procedures relating to proxy voting and the handling of corporate actions and class actions; |
| | • | | Information concerning the resources devoted to compliance efforts undertaken by the adviser and its affiliates and the sub-adviser of each fund, if any, including descriptions of their various compliance programs and their record of compliance; |
| | • | | Information concerning the business continuity and disaster recovery plans of the adviser and its affiliates and the sub-adviser of each fund, if any; |
| | • | | A description of Eaton Vance Management’s and Boston Management and Research’s oversight of sub-advisers, including with respect to regulatory and compliance issues, investment management and other matters; |
Other Relevant Information
| | • | | Information concerning the nature, cost and character of the administrative and other non-investment advisory services provided by Eaton Vance Management and its affiliates; |
| | • | | Information concerning oversight of the relationship with the custodian, subcustodians and fund accountants by the adviser and/or administrator to each of the funds; |
| | • | | For an Eaton Vance Fund structured as an exchange-listed closed-end fund, information concerning the benefits of the closed-end fund structure, as well as, where relevant, the closed-end fund’s market prices, trading volume data, distribution rates and other relevant matters; and |
| | • | | The terms of each investment advisory agreement and sub-advisory agreement. |
During the various meetings of the Board and its committees throughout the twelve months ended April 2020, the Trustees received information from portfolio managers and other investment professionals of the advisers and sub-advisers of the funds regarding investment and performance matters, and considered various investment and trading strategies used in pursuing the funds’ investment objectives. The Trustees also received information regarding risk management techniques employed in connection with the management of the funds. The Board and its committees evaluated issues pertaining to industry and regulatory developments, compliance procedures, fund governance and other issues with respect to the funds, and received and participated in reports and presentations provided by Eaton Vance Management, Boston Management and Research and fund sub-advisers, with respect to such matters. In addition to the formal meetings of the Board and its committees, the Independent Trustees held regular teleconferences to discuss, among other topics, matters relating to the continuation of investment advisory agreements and sub-advisory agreements.
The Contract Review Committee was advised throughout the contract review process by Goodwin Procter LLP, independent legal counsel for the Independent Trustees. The members of the Contract Review Committee, with the advice of such counsel, exercised their own business judgment in determining the material factors to be considered in evaluating each investment advisory agreement and sub-advisory agreement and the weight to be given to each such factor. The conclusions reached with respect to each investment advisory agreement and sub-advisory agreement were based on a comprehensive evaluation of all the information provided and not any single factor. Moreover, each member of the Contract Review Committee may have placed varying emphasis on particular factors in reaching conclusions with respect to each investment advisory agreement and sub-advisory agreement. In evaluating each investment advisory agreement and sub-advisory agreement, including the fee structures and other terms contained in such agreements, the members of the Contract Review Committee were also informed by multiple years of analysis and discussion with the adviser and sub-adviser to each of the Eaton Vance Funds.
In voting its approval of the continuation of existing investment advisory agreements and sub-advisory agreements at the April 2020 Meeting, the Board relied on an order issued by the Securities and Exchange Commission on March 25, 2020, which provided temporary relief from the in-person voting requirements under Section 15 of the 1940 Act in response to the impacts of the COVID-19 pandemic.
Results of the Contract Review Process
Based on its consideration of the foregoing, and such other information it deemed relevant, including the factors and conclusions described below, the Contract Review Committee concluded that the continuation of the investment advisory agreement between Eaton Vance National Limited Maturity Municipal Income Fund (the “Fund”) and Boston Management and Research (the “Adviser”), including its fee structure, is in the interests of shareholders and, therefore, recommended to the Board approval of the agreement. Based on the recommendation of the Contract Review Committee, the Board, including a majority of the Independent Trustees, voted to approve continuation of the investment advisory agreement for the Fund.
Nature, Extent and Quality of Services
In considering whether to approve the investment advisory agreement for the Fund, the Board evaluated the nature, extent and quality of services provided to the Fund by the Adviser.
The Board considered the Adviser’s management capabilities and investment processes in light of the types of investments held by the Fund, including the education, experience and number of investment professionals and other personnel who provide portfolio management, investment research, and similar services to the Fund, including recent changes to such personnel. In particular, the Board considered, where relevant, the abilities and experience of the Adviser’s investment professionals in analyzing factors such as credit risk, tax efficiency, and special considerations relevant to investing in municipal
Eaton Vance
National Limited Maturity Municipal Income Fund
September 30, 2020
Board of Trustees’ Contract Approval — continued
obligations. The Board considered the Adviser’s municipal bond team, which includes investment professionals and credit specialists who provide services to the Fund. The Board also took into account the resources dedicated to portfolio management and other services, the compensation methods of the Adviser and other factors, including the reputation and resources of the Adviser to recruit and retain highly qualified research, advisory and supervisory investment professionals. In addition, the Board considered the time and attention devoted to the Eaton Vance Funds, including the Fund, by senior management, as well as the infrastructure, operational capabilities and support staff in place to assist in the portfolio management and operations of the Fund, including the provision of administrative services. The Board also considered the business-related and other risks to which the Adviser or its affiliates may be subject in managing the Fund.
The Board considered the compliance programs of the Adviser and relevant affiliates thereof. The Board considered compliance and reporting matters regarding, among other things, personal trading by investment professionals, disclosure of portfolio holdings, late trading, frequent trading, portfolio valuation, business continuity and the allocation of investment opportunities. The Board also considered the responses of the Adviser and its affiliates to requests in recent years from regulatory authorities, such as the Securities and Exchange Commission and the Financial Industry Regulatory Authority.
The Board considered other administrative services provided or overseen by Eaton Vance Management and its affiliates, including transfer agency and accounting services. The Board evaluated the benefits to shareholders of investing in a fund that is a part of a large fund complex offering exposure to a variety of asset classes and investment disciplines, as well as the ability, in many cases, to exchange an investment among different funds without incurring additional sales charges.
After consideration of the foregoing factors, among others, the Board concluded that the nature, extent and quality of services provided by the Adviser, taken as a whole, are appropriate and consistent with the terms of the investment advisory agreement.
Fund Performance
The Board compared the Fund’s investment performance to that of comparable funds identified by an independent data provider (the peer group), as well as an appropriate benchmark index, and assessed the Fund’s performance on the basis of total return and current income return. The Board’s review included comparative performance data with respect to the Fund for the one-, three-, five- and ten-year periods ended September 30, 2019. In this regard, the Board noted that the performance of the Fund was lower than the median performance of the Fund’s peer group for the three-year period. The Board also noted that the performance of the Fund was lower than its benchmark index for the three-year period. The Board considered, among other things, the Adviser’s efforts to generate competitive levels of tax-exempt current income over time. The Board noted that actions are being taken by the Adviser to address Fund performance and determined to continue to monitor and evaluate their effectiveness over time.
Management Fees and Expenses
The Board considered contractual fee rates payable by the Fund for advisory and administrative services (referred to collectively as “management fees”). As part of its review, the Board considered the Fund’s management fees and total expense ratio for the one-year period ended September 30, 2019, as compared to those of comparable funds, before and after giving effect to any undertaking to waive fees or reimburse expenses. The Board also considered factors that had an impact on the Fund’s total expense ratio relative to comparable funds.
After considering the foregoing information, and in light of the nature, extent and quality of the services provided by the Adviser, the Board concluded that the management fees charged for advisory and related services are reasonable.
Profitability and “Fall-Out” Benefits
The Board considered the level of profits realized by the Adviser and relevant affiliates thereof in providing investment advisory and administrative services to the Fund and to all Eaton Vance Funds as a group. The Board considered the level of profits realized without regard to marketing support or other payments by the Adviser and its affiliates to third parties in respect of distribution or other services.
The Board concluded that, in light of the foregoing factors and the nature, extent and quality of the services rendered, the profits realized by the Adviser and its affiliates are deemed not to be excessive.
The Board also considered direct or indirect fall-out benefits received by the Adviser and its affiliates in connection with their respective relationships with the Fund, including the benefits of research services that may be available to the Adviser as a result of securities transactions effected for the Fund and other investment advisory clients.
Eaton Vance
National Limited Maturity Municipal Income Fund
September 30, 2020
Board of Trustees’ Contract Approval — continued
Economies of Scale
In reviewing management fees and profitability, the Board also considered the extent to which the Adviser and its affiliates, on the one hand, and the Fund, on the other hand, can expect to realize benefits from economies of scale as the assets of the Fund increase. The Board acknowledged the difficulty in accurately measuring the benefits resulting from economies of scale, if any, with respect to the management of any specific fund or group of funds. The Board reviewed data summarizing the increases and decreases in the assets of the Fund and of all Eaton Vance Funds as a group over various time periods, and evaluated the extent to which the total expense ratio of the Fund and the profitability of the Adviser and its affiliates may have been affected by such increases or decreases. Based upon the foregoing, the Board concluded that the Fund currently shares in the benefits from economies of scale, if any, when they are realized by the Adviser. The Board also concluded that the structure of the advisory fee, which includes breakpoints at several asset levels, will allow the Fund to continue to benefit from any economies of scale in the future.
Eaton Vance
National Limited Maturity Municipal Income Fund
September 30, 2020
Liquidity Risk Management Program
The Fund has implemented a written liquidity risk management program (Program) and related procedures to manage its liquidity in accordance with Rule 22e-4 under the Investment Company Act of 1940, as amended (Liquidity Rule). The Liquidity Rule defines “liquidity risk” as the risk that a fund could not meet requests to redeem shares issued by the fund without significant dilution of the remaining investors’ interests in the fund. The Fund’s Board of Trustees/Directors has designated the investment adviser to serve as the administrator of the Program and the related procedures. The administrator has established a Liquidity Risk Management Oversight Committee (Committee) to perform the functions necessary to administer the Program. As part of the Program, the administrator is responsible for identifying illiquid investments and categorizing the relative liquidity of the Fund’s investments in accordance with the Liquidity Rule. Under the Program, the administrator assesses, manages, and periodically reviews the Fund’s liquidity risk, and is responsible for making certain reports to the Fund’s Board of Trustees/Directors and the Securities and Exchange Commission (SEC) regarding the liquidity of the Fund’s investments, and to notify the Board of Trustees/Directors and the SEC of certain liquidity events specified in the Liquidity Rule. The liquidity of the Fund’s portfolio investments is determined based on a number of factors including, but not limited to, relevant market, trading and investment-specific considerations under the Program.
At a meeting of the Fund’s Board of Trustees/Directors, the Committee provided a written report to the Fund’s Board of Trustees/Directors pertaining to the operation, adequacy, and effectiveness of implementation of the Program, as well as the operation of the highly liquid investment minimum (if applicable) for the period December 1, 2018 through December 31, 2019 (Review Period). The Program operated effectively during the Review Period, supporting the administrator’s ability to assess, manage and monitor Fund liquidity risk, including during periods of market volatility and net redemptions. During the Review Period, the Fund met redemption requests on a timely basis.
There can be no assurance that the Program will achieve its objectives in the future. Please refer to the Fund’s prospectus for more information regarding the Fund’s exposure to liquidity risk and other principal risks to which an investment in the Fund may be subject.
Eaton Vance
National Limited Maturity Municipal Income Fund
September 30, 2020
Officers and Trustees
Officers
Eric A. Stein
President
Maureen A. Gemma
Vice President, Secretary and Chief Legal Officer
James F. Kirchner
Treasurer
Richard F. Froio
Chief Compliance Officer
Trustees
William H. Park
Chairperson
Thomas E. Faust Jr.*
Mark R. Fetting
Cynthia E. Frost
George J. Gorman
Valerie A. Mosley
Helen Frame Peters
Keith Quinton
Marcus L. Smith
Susan J. Sutherland
Scott E. Wennerholm
Eaton Vance Funds
IMPORTANT NOTICES
Privacy. The Eaton Vance organization is committed to ensuring your financial privacy. Each entity listed below has adopted a privacy policy and procedures (“Privacy Program”) Eaton Vance believes is reasonably designed to protect your personal information and to govern when and with whom Eaton Vance may share your personal information.
| • | | At the time of opening an account, Eaton Vance generally requires you to provide us with certain information such as name, address, social security number, tax status, account numbers, and account balances. This information is necessary for us to both open an account for you and to allow us to satisfy legal requirements such as applicable anti-money laundering reviews and know-your-customer requirements. |
| • | | On an ongoing basis, in the normal course of servicing your account, Eaton Vance may share your information with unaffiliated third parties that perform various services for Eaton Vance and/or your account. These third parties include transfer agents, custodians, broker/dealers and our professional advisers, including auditors, accountants, and legal counsel. Eaton Vance may additionally share your personal information with our affiliates. |
| • | | We believe our Privacy Program is reasonably designed to protect the confidentiality of your personal information and to prevent unauthorized access to that information. |
| • | | We reserve the right to change our Privacy Program at any time upon proper notification to you. You may want to review our Privacy Program periodically for changes by accessing the link on our homepage: www.eatonvance.com. |
Our pledge of protecting your personal information applies to the following entities within the Eaton Vance organization: the Eaton Vance Family of Funds, Eaton Vance Management, Eaton Vance Investment Counsel, Eaton Vance Distributors, Inc., Eaton Vance Trust Company, Eaton Vance Management (International) Limited, Eaton Vance Advisers International Ltd., Eaton Vance Global Advisors Limited, Eaton Vance Management’s Real Estate Investment Group, Boston Management and Research, Calvert Research and Management, and Calvert Funds. This Privacy Notice supersedes all previously issued privacy disclosures. For more information about our Privacy Program or about how your personal information may be used, please call 1-800-262-1122.
Delivery of Shareholder Documents. The Securities and Exchange Commission (SEC) permits funds to deliver only one copy of shareholder documents, including prospectuses, proxy statements and shareholder reports, to fund investors with multiple accounts at the same residential or post office box address. This practice is often called “householding” and it helps eliminate duplicate mailings to shareholders. Eaton Vance, or your financial intermediary, may household the mailing of your documents indefinitely unless you instruct Eaton Vance, or your financial intermediary, otherwise. If you would prefer that your Eaton Vance documents not be householded, please contact Eaton Vance at 1-800-262-1122, or contact your financial intermediary. Your instructions that householding not apply to delivery of your Eaton Vance documents will typically be effective within 30 days of receipt by Eaton Vance or your financial intermediary.
Portfolio Holdings. Each Eaton Vance Fund and its underlying Portfolio(s) (if applicable) files a schedule of portfolio holdings on Part F to Form N-PORT with the SEC. Certain information filed on Form N-PORT may be viewed on the Eaton Vance website at www.eatonvance.com, by calling Eaton Vance at 1-800-262-1122 or in the EDGAR database on the SEC’s website at www.sec.gov.
Proxy Voting. From time to time, funds are required to vote proxies related to the securities held by the funds. The Eaton Vance Funds or their underlying Portfolios (if applicable) vote proxies according to a set of policies and procedures approved by the Funds’ and Portfolios’ Boards. You may obtain a description of these policies and procedures and information on how the Funds or Portfolios voted proxies relating to portfolio securities during the most recent 12-month period ended June 30, without charge, upon request, by calling 1-800-262-1122 and by accessing the SEC’s website at www.sec.gov.
This Page Intentionally Left Blank
This Page Intentionally Left Blank
This Page Intentionally Left Blank
Investment Adviser
Boston Management and Research
Two International Place
Boston, MA 02110
Administrator
Eaton Vance Management
Two International Place
Boston, MA 02110
Principal Underwriter*
Eaton Vance Distributors, Inc.
Two International Place
Boston, MA 02110
(617) 482-8260
Custodian
State Street Bank and Trust Company
State Street Financial Center, One Lincoln Street
Boston, MA 02111
Transfer Agent
BNY Mellon Investment Servicing (US) Inc.
Attn: Eaton Vance Funds
P.O. Box 9653
Providence, RI 02940-9653
(800) 262-1122
Fund Offices
Two International Place
Boston, MA 02110
| * | FINRA BrokerCheck. Investors may check the background of their Investment Professional by contacting the Financial Industry Regulatory Authority (FINRA). FINRA BrokerCheck is a free tool to help investors check the professional background of current and former FINRA-registered securities firms and brokers. FINRA BrokerCheck is available by calling 1-800-289-9999 and at www.FINRA.org. The FINRA BrokerCheck brochure describing this program is available to investors at www.FINRA.org. |

7643 9.30.20

Eaton Vance
New York Municipal Opportunities Fund
Semiannual Report
September 30, 2020
Important Note. Beginning on January 1, 2021, as permitted by regulations adopted by the Securities and Exchange Commission, paper copies of the Fund’s annual and semi-annual shareholder reports will no longer be sent by mail unless you specifically request paper copies of the reports. Instead, the reports will be made available on the Fund’s website (eatonvance.com/funddocuments), and you will be notified by mail each time a report is posted and provided with a website address to access the report.
If you already elected to receive shareholder reports electronically, you will not be affected by this change and you need not take any action. If you are a direct investor, you may elect to receive shareholder reports and other communications from the Fund electronically by signing up for e-Delivery at eatonvance.com/edelivery. If you own your shares through a financial intermediary (such as a broker-dealer or bank), you must contact your financial intermediary to sign up.
You may elect to receive all future Fund shareholder reports in paper free of charge. If you are a direct investor, you can inform the Fund that you wish to continue receiving paper copies of your shareholder reports by calling 1-800-262-1122. If you own these shares through a financial intermediary, you must contact your financial intermediary or follow instructions included with this disclosure, if applicable, to elect to continue to receive paper copies of your shareholder reports. Your election to receive reports in paper will apply to all Eaton Vance funds held directly or to all funds held through your financial intermediary, as applicable.

Commodity Futures Trading Commission Registration. Effective December 31, 2012, the Commodity Futures Trading Commission (“CFTC”) adopted certain regulatory changes that subject registered investment companies and advisers to regulation by the CFTC if a fund invests more than a prescribed level of its assets in certain CFTC-regulated instruments (including futures, certain options and swap agreements) or markets itself as providing investment exposure to such instruments. The investment adviser has claimed an exclusion from the definition of “commodity pool operator” under the Commodity Exchange Act with respect to its management of the Fund. Accordingly, neither the Fund nor the adviser with respect to the operation of the Fund is subject to CFTC regulation. Because of its management of other strategies, the Fund’s adviser is registered with the CFTC as a commodity pool operator. The adviser is also registered as a commodity trading advisor.
Fund shares are not insured by the FDIC and are not deposits or other obligations of, or guaranteed by, any depository institution. Shares are subject to investment risks, including possible loss of principal invested.
This report must be preceded or accompanied by a current summary prospectus or prospectus. Before investing, investors should consider carefully the investment objective, risks, and charges and expenses of a mutual fund. This and other important information is contained in the summary prospectus and prospectus, which can be obtained from a financial intermediary. Prospective investors should read the prospectus carefully before investing. For further information, please call 1-800-262-1122.
Semiannual Report September 30, 2020
Eaton Vance
New York Municipal Opportunities Fund
Eaton Vance
New York Municipal Opportunities Fund
September 30, 2020
Performance1,2
Portfolio Managers Adam A. Weigold, CFA and Craig R. Brandon, CFA
| | | | | | | | | | | | | | | | | | | | | | | | |
| % Average Annual Total Returns | | Class
Inception Date | | | Performance
Inception Date | | | Six Months | | | One Year | | | Five Years | | | Ten Years | |
| | | | | | |
Class A at NAV | | | 06/27/1996 | | | | 05/29/1992 | | | | 3.95 | % | | | 2.36 | % | | | 2.73 | % | | | 2.56 | % |
Class A with 4.75% Maximum Sales Charge | | | — | | | | — | | | | –0.95 | | | | –2.53 | | | | 1.74 | | | | 2.06 | |
Class C at NAV | | | 12/08/1993 | | | | 05/29/1992 | | | | 3.50 | | | | 1.61 | | | | 1.98 | | | | 1.79 | |
Class C with 1% Maximum Sales Charge | | | — | | | | — | | | | 2.50 | | | | 0.61 | | | | 1.98 | | | | 1.79 | |
Class I at NAV | | | 08/03/2010 | | | | 05/29/1992 | | | | 4.03 | | | | 2.51 | | | | 2.89 | | | | 2.71 | |
|
| |
| | | | | | |
Bloomberg Barclays Municipal Bond Index | | | — | | | | — | | | | 3.99 | % | | | 4.09 | % | | | 3.84 | % | | | 3.99 | % |
Bloomberg Barclays New York Municipal Bond Index | | | — | | | | — | | | | 2.89 | | | | 2.71 | | | | 3.38 | | | | 3.69 | |
| | | | | | |
| % Total Annual Operating Expense Ratios3 | | | | | | | | | | | Class A | | | Class C | | | Class I | |
| | | | | | |
| | | | | | | | | | | | | | | 0.74 | % | | | 1.50 | % | | | 0.59 | % |
| | | | | | |
| % Distribution Rates/Yields4 | | | | | | | | | | | Class A | | | Class C | | | Class I | |
| | | | | | |
Distribution Rate | | | | | | | | | | | | | | | 1.84 | % | | | 1.10 | % | | | 1.99 | % |
Taxable-Equivalent Distribution Rate | | | | | | | | | | | | | | | 3.65 | | | | 2.18 | | | | 3.95 | |
SEC 30-day Yield | | | | | | | | | | | | | | | 1.12 | | | | 0.44 | | | | 1.33 | |
Taxable-Equivalent SEC 30-day Yield | | | | | | | | | | | | | | | 2.23 | | | | 0.86 | | | | 2.64 | |
Fund Profile
Credit Quality (% of total investments)5
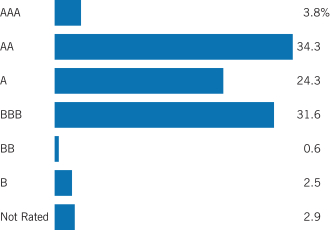
See Endnotes and Additional Disclosures in this report.
Past performance is no guarantee of future results. Returns are historical and are calculated by determining the percentage change in net asset value (NAV) or offering price (as applicable) with all distributions reinvested. Investment return and principal value will fluctuate so that shares, when redeemed, may be worth more or less than their original cost. Performance for periods less than or equal to one year is cumulative. Performance is for the stated time period only; due to market volatility, current Fund performance may be lower or higher than the quoted return. For performance as of the most recent month-end, please refer to eatonvance.com.
Eaton Vance
New York Municipal Opportunities Fund
September 30, 2020
Endnotes and Additional Disclosures
| 1 | Bloomberg Barclays Municipal Bond Index is an unmanaged index of municipal bonds traded in the U.S. Bloomberg Barclays New York Municipal Bond Index is an unmanaged index of New York municipal bonds. Unless otherwise stated, index returns do not reflect the effect of any applicable sales charges, commissions, expenses, taxes or leverage, as applicable. It is not possible to invest directly in an index. |
| 2 | Total Returns at NAV do not include applicable sales charges. If sales charges were deducted, the returns would be lower. Total Returns shown with maximum sales charge reflect the stated maximum sales charge. Unless otherwise stated, performance does not reflect the deduction of taxes on Fund distributions or redemptions of Fund shares. |
| | Performance prior to April 25, 2016 reflects the Fund’s performance under its former investment objective and policies. |
| 3 | Source: Fund prospectus. The expense ratios for the current reporting period can be found in the Financial Highlights section of this report. |
| 4 | The Distribution Rate is based on the Fund’s last regular distribution per share in the period (annualized) divided by the Fund’s NAV at the end of the period. The Fund’s distributions may be comprised of amounts characterized for federal income tax purposes as tax-exempt income, qualified and non-qualified ordinary dividends, capital gains and nondividend distributions, also known as return of capital. The Fund will determine the federal income tax character of distributions paid to a shareholder after the end of the calendar year. This is reported on the IRS form 1099- DIV and provided to the shareholder shortly after each year-end. The Fund’s distributions are determined by the investment adviser based on its current assessment of the Fund’s long-term return potential. As portfolio and market conditions change, the rate of distributions paid by the Fund could change. Taxable-equivalent performance is based on the highest combined federal and state income tax rates, where applicable. Lower tax rates would result in lower tax-equivalent performance. Actual tax rates will vary depending on your income, exemptions and deductions. Rates do not include local taxes. The SEC Yield is a standardized measure based on the estimated yield to maturity of a fund’s investments over a 30-day period and is based on the maximum offer price at the date specified. The SEC Yield is not based on the distributions made by the Fund, which may differ. |
| 5 | Ratings are based on Moody’s Investors Service, Inc. (“Moody’s”), S&P Global Ratings (“S&P”) or Fitch Ratings (“Fitch”), as applicable. If securities are rated differently by the ratings agencies, the highest rating is applied. Ratings, which are subject to change, apply to the creditworthiness of the issuers of the underlying securities and not to the Fund or its shares. Credit ratings measure the quality of a bond based on the issuer’s creditworthiness, with ratings ranging from AAA, being the highest, to D, being the lowest based on S&P’s measures. Ratings of BBB or higher by S&P or Fitch (Baa or higher by Moody’s) are considered to be investment-grade quality. Credit ratings are based largely on the ratings agency’s analysis at the time of rating. The rating assigned to any particular security is not necessarily a reflection of the issuer’s current financial condition and does not necessarily reflect its assessment of the volatility of a security’s market value or of the liquidity of an investment in the security. Holdings designated as “Not Rated” (if any) are not rated by the national ratings agencies stated above. |
| | Fund profile subject to change due to active management. |
Eaton Vance
New York Municipal Opportunities Fund
September 30, 2020
Fund Expenses
Example: As a Fund shareholder, you incur two types of costs: (1) transaction costs, including sales charges (loads) on purchases and redemption fees (if applicable); and (2) ongoing costs, including management fees; distribution and/or service fees; and other Fund expenses. This Example is intended to help you understand your ongoing costs (in dollars) of Fund investing and to compare these costs with the ongoing costs of investing in other mutual funds. The Example is based on an investment of $1,000 invested at the beginning of the period and held for the entire period (April 1, 2020 – September 30, 2020).
Actual Expenses: The first section of the table below provides information about actual account values and actual expenses. You may use the information in this section, together with the amount you invested, to estimate the expenses that you paid over the period. Simply divide your account value by $1,000 (for example, an $8,600 account value divided by $1,000 = 8.6), then multiply the result by the number in the first section under the heading entitled “Expenses Paid During Period” to estimate the expenses you paid on your account during this period.
Hypothetical Example for Comparison Purposes: The second section of the table below provides information about hypothetical account values and hypothetical expenses based on the actual Fund expense ratio and an assumed rate of return of 5% per year (before expenses), which is not the actual Fund return. The hypothetical account values and expenses may not be used to estimate the actual ending account balance or expenses you paid for the period. You may use this information to compare the ongoing costs of investing in your Fund and other funds. To do so, compare this 5% hypothetical example with the 5% hypothetical examples that appear in the shareholder reports of the other funds.
Please note that the expenses shown in the table are meant to highlight your ongoing costs only and do not reflect any transactional costs, such as sales charges (loads) or redemption fees (if applicable). Therefore, the second section of the table is useful in comparing ongoing costs only, and will not help you determine the relative total costs of owning different funds. In addition, if these transactional costs were included, your costs would be higher.
| | | | | | | | | | | | | | | | |
| | | Beginning
Account Value
(4/1/20) | | | Ending
Account Value
(9/30/20) | | | Expenses Paid
During Period*
(4/1/20 – 9/30/20) | | | Annualized
Expense
Ratio | |
| | | |
Actual | | | | | | | | | | | | | |
Class A | | $ | 1,000.00 | | | $ | 1,039.50 | | | $ | 3.89 | | | | 0.76 | % |
Class C | | $ | 1,000.00 | | | $ | 1,035.00 | | | $ | 7.70 | | | | 1.51 | % |
Class I | | $ | 1,000.00 | | | $ | 1,040.30 | | | $ | 3.12 | | | | 0.61 | % |
| | | | | |
Hypothetical | | | | | | | | | | | | | | | | |
(5% return per year before expenses) | | | | | | | | | | | | | |
Class A | | $ | 1,000.00 | | | $ | 1,021.30 | | | $ | 3.85 | | | | 0.76 | % |
Class C | | $ | 1,000.00 | | | $ | 1,017.50 | | | $ | 7.64 | | | | 1.51 | % |
Class I | | $ | 1,000.00 | | | $ | 1,022.00 | | | $ | 3.09 | | | | 0.61 | % |
| * | Expenses are equal to the Fund’s annualized expense ratio for the indicated Class, multiplied by the average account value over the period, multiplied by 183/365 (to reflect the one-half year period). The Example assumes that the $1,000 was invested at the net asset value per share determined at the close of business on March 31, 2020. |
Eaton Vance
New York Municipal Opportunities Fund
September 30, 2020
Portfolio of Investments (Unaudited)
| | | | | | | | |
| Tax-Exempt Investments — 97.0% | |
| Security | | Principal
Amount
(000’s omitted) | | | Value | |
|
| Bond Bank — 1.7% | |
| | |
New York State Environmental Facilities Corp., (State Revolving Fund), Green Bonds, 5.00%, 8/15/44 | | $ | 1,000 | | | $ | 1,280,950 | |
| | |
| | | | | | | $ | 1,280,950 | |
|
| Cogeneration — 0.3% | |
| | |
Suffolk County Industrial Development Agency, (Nissequogue Cogeneration Partners Facility), (AMT), 5.50%, 1/1/23 | | $ | 250 | | | $ | 252,298 | |
| | |
| | | | | | | $ | 252,298 | |
|
| Education — 8.8% | |
| | |
Buffalo and Erie County Industrial Land Development Corp., (Global Concepts Charter School), 5.00%, 10/1/37 | | $ | 405 | | | $ | 469,691 | |
| | |
Dutchess County Local Development Corp., (Marist College), 5.00%, 7/1/29 | | | 130 | | | | 164,559 | |
| | |
Monroe County Industrial Development Corp., (Nazareth College of Rochester), 5.00%, 10/1/24 | | | 885 | | | | 983,810 | |
| | |
Monroe County Industrial Development Corp., (Nazareth College of Rochester), 5.00%, 10/1/25 | | | 930 | | | | 1,052,704 | |
| | |
Monroe County Industrial Development Corp., (True North Rochester Preparatory Charter School), 5.00%, 6/1/40(1) | | | 165 | | | | 192,484 | |
| | |
New York Dormitory Authority, (Culinary Institute of America), 5.00%, 7/1/23 | | | 250 | | | | 268,555 | |
| | |
New York Dormitory Authority, (Rockefeller University), Green Bonds, 5.00%, 7/1/50 | | | 500 | | | | 627,215 | |
| | |
Syracuse Industrial Development Agency, (Syracuse City School District), 4.00%, 5/1/33 | | | 1,200 | | | | 1,417,620 | |
| | |
Troy Capital Resource Corp., (Rensselaer Polytechnic Institute), 5.00%, 9/1/35 | | | 1,000 | | | | 1,217,060 | |
| | |
Yonkers Economic Development Corp., (Lamartine/Warburton, LLC - Charter School of Educational Excellence), 4.00%, 10/15/29 | | | 330 | | | | 339,458 | |
| | |
Yonkers Economic Development Corp., (Lamartine/Warburton, LLC - Charter School of Educational Excellence), 5.00%, 10/15/39 | | | 80 | | | | 85,203 | |
| | |
| | | | | | | $ | 6,818,359 | |
|
| Electric Utilities — 5.5% | |
| | |
Long Island Power Authority, Electric System Revenue, 4.00%, 9/1/39 | | $ | 1,650 | | | $ | 1,961,701 | |
| | |
New York Power Authority, 4.00%, 11/15/45 | | | 1,140 | | | | 1,334,997 | |
| | |
New York Power Authority, 4.00%, 11/15/50 | | | 355 | | | | 413,082 | |
| | |
New York Power Authority, 4.00%, 11/15/55 | | | 500 | | | | 577,155 | |
| | |
| | | | | | | $ | 4,286,935 | |
| | | | | | | | |
| Security | | Principal
Amount
(000’s omitted) | | | Value | |
|
| General Obligations — 3.9% | |
| | |
Elmira, 4.00%, 5/27/21 | | $ | 400 | | | $ | 400,496 | |
| | |
New York City, 4.00%, 3/1/36 | | | 360 | | | | 420,437 | |
| | |
New York City, 4.00%, 8/1/38 | | | 1,495 | | | | 1,716,843 | |
| | |
Valley Stream, 2.00%, 5/15/25 | | | 235 | | | | 227,797 | |
| | |
Valley Stream, 2.125%, 5/15/26 | | | 240 | | | | 230,654 | |
| | |
| | | | | | | $ | 2,996,227 | |
|
| Hospital — 16.1% | |
| | |
Build NYC Resource Corp., (New York Methodist Hospital), 5.00%, 7/1/24 | | $ | 400 | | | $ | 458,056 | |
| | |
Dutchess County Local Development Corp., (Nuvance Health), 5.00%, 7/1/24 | | | 100 | | | | 113,960 | |
| | |
Jefferson County Civic Facility Development Corp., (Samaritan Medical Center), 4.00%, 11/1/28 | | | 1,390 | | | | 1,561,804 | |
| | |
Jefferson County Civic Facility Development Corp., (Samaritan Medical Center), 4.00%, 11/1/29 | | | 1,000 | | | | 1,110,430 | |
| | |
Jefferson County Civic Facility Development Corp., (Samaritan Medical Center), 5.00%, 11/1/25 | | | 1,305 | | | | 1,520,756 | |
| | |
Nassau County Local Economic Assistance and Financing Corp., (Catholic Health Services of Long Island), 5.00%, 7/1/22 | | | 1,000 | | | | 1,031,670 | |
| | |
Nassau County Local Economic Assistance Corp., (Catholic Health Services of Long Island), 5.00%, 7/1/23 | | | 500 | | | | 557,235 | |
| | |
New York Dormitory Authority, (Catholic Health System Obligated Group), 5.00%, 7/1/30 | | | 625 | | | | 779,987 | |
| | |
New York Dormitory Authority, (Catholic Health System Obligated Group), 5.00%, 7/1/32 | | | 640 | | | | 785,926 | |
| | |
New York Dormitory Authority, (Montefiore Obligated Group), 4.00%, 9/1/37 | | | 400 | | | | 442,732 | |
| | |
New York Dormitory Authority, (NYU Langone Hospitals Obligated Group), 4.00%, 7/1/50 | | | 1,625 | | | | 1,815,629 | |
| | |
New York Dormitory Authority, (Orange Regional Medical Center), 5.00%, 12/1/23(1) | | | 400 | | | | 446,172 | |
| | |
New York Dormitory Authority, (Orange Regional Medical Center), 5.00%, 12/1/24(1) | | | 600 | | | | 688,974 | |
| | |
New York Dormitory Authority, (Orange Regional Medical Center), 5.00%, 12/1/25(1) | | | 500 | | | | 579,520 | |
| | |
New York Dormitory Authority, (Orange Regional Medical Center), Series 2017, 5.00%, 12/1/26(1) | | | 500 | | | | 598,515 | |
| | |
| | | | | | | $ | 12,491,366 | |
|
| Housing — 1.2% | |
| | |
Albany Capital Resource Corp., (Empire Commons Student Housing, Inc.), 5.00%, 5/1/26 | | $ | 300 | | | $ | 341,010 | |
| | |
Westchester County Local Development Corp., (Purchase Housing Corp. II), 5.00%, 6/1/24 | | | 165 | | | | 179,311 | |
| | | | |
| | 5 | | See Notes to Financial Statements. |
Eaton Vance
New York Municipal Opportunities Fund
September 30, 2020
Portfolio of Investments (Unaudited) — continued
| | | | | | | | |
| Security | | Principal
Amount
(000’s omitted) | | | Value | |
|
| Housing (continued) | |
| | |
Westchester County Local Development Corp., (Purchase Housing Corp. II), 5.00%, 6/1/25 | | $ | 170 | | | $ | 187,085 | |
| | |
Westchester County Local Development Corp., (Purchase Housing Corp. II), 5.00%, 6/1/26 | | | 170 | | | | 189,905 | |
| | |
| | | | | | | $ | 897,311 | |
|
| Industrial Development Revenue — 7.2% | |
| | |
Build NYC Resource Corp., (Pratt Paper (NY), Inc.), (AMT), 4.50%, 1/1/25(1) | | $ | 685 | | | $ | 728,045 | |
| | |
Essex County Industrial Development Agency, (International Paper Co.), (AMT), 2.10% to 10/1/24 (Put Date), 3/1/27 | | | 625 | | | | 655,138 | |
| | |
New York Energy Research and Development Authority, (Rochester Gas and Electric Corp.), 2.875% to 7/1/25 (Put Date), 5/15/32 | | | 1,155 | | | | 1,257,576 | |
| | |
New York State Environmental Facilities Corp., (Casella Waste Systems, Inc.), (AMT), 2.875% to 12/3/29 (Put Date), 12/1/44(1) | | | 250 | | | | 246,320 | |
| | |
New York State Environmental Facilities Corp., (Casella Waste Systems, Inc.), (AMT), 3.125% to 6/1/26 (Put Date), 12/1/44(1) | | | 1,000 | | | | 1,020,580 | |
| | |
New York Transportation Development Corp., (Delta Air Lines, Inc. - LaGuardia Airport Terminals C&D Redevelopment), (AMT), 4.00%, 10/1/30 | | | 1,000 | | | | 1,024,040 | |
| | |
Niagara Area Development Corp., (Covanta), 3.50%, 11/1/24(1) | | | 610 | | | | 619,418 | |
| | |
| | | | | | | $ | 5,551,117 | |
|
| Insured – Electric Utilities — 2.7% | |
| | |
Puerto Rico Electric Power Authority, (NPFG), 5.25%, 7/1/29 | | $ | 2,050 | | | $ | 2,118,654 | |
| | |
| | | | | | | $ | 2,118,654 | |
|
| Insured – General Obligations — 5.5% | |
| | |
Clinton County, (AGM), (AMT), 3.50%, 6/1/27 | | $ | 1,000 | | | $ | 1,108,840 | |
| | |
East Ramapo Central School District, (AGM), 4.00%, 12/15/27 | | | 1,605 | | | | 1,887,512 | |
| | |
Monroe County, (AGM), 5.00%, 6/1/27 | | | 1,000 | | | | 1,273,600 | |
| | |
| | | | | | | $ | 4,269,952 | |
|
| Insured – Solid Waste — 1.4% | |
| | |
Onondaga County Resource Recovery Agency, (AGM), (AMT), 5.00%, 5/1/26 | | $ | 150 | | | $ | 184,917 | |
| | |
Onondaga County Resource Recovery Agency, (AGM), (AMT), 5.00%, 5/1/28 | | | 740 | | | | 927,546 | |
| | |
| | | | | | | $ | 1,112,463 | |
| | | | | | | | |
| Security | | Principal
Amount
(000’s omitted) | | | Value | |
|
| Insured – Water and Sewer — 0.4% | |
| | |
Buffalo Municipal Water Finance Authority, (AGM), 5.00%, 7/1/29 | | $ | 125 | | | $ | 153,430 | |
| | |
Buffalo Municipal Water Finance Authority, (AGM), 5.00%, 7/1/31 | | | 140 | | | | 170,614 | |
| | |
| | | | | | | $ | 324,044 | |
|
| Lease Revenue / Certificates of Participation — 1.4% | |
| | |
Hudson Yards Infrastructure Corp., 5.00%, 2/15/42 | | $ | 500 | | | $ | 580,740 | |
| | |
Monroe County Industrial Development Agency, (Rochester Schools Modernization), 5.00%, 5/1/27 | | | 400 | | | | 503,968 | |
| | |
| | | | | | | $ | 1,084,708 | |
|
| Other Revenue — 5.3% | |
| | |
Albany Parking Authority, 5.00%, 7/15/23 | | $ | 700 | | | $ | 746,970 | |
| | |
Chautauqua County Capital Resource Corp., (Jamestown Center City Development Corp.), 1.75% to 11/1/24 (Put Date), 11/1/31 | | | 1,650 | | | | 1,717,105 | |
| | |
New York City Cultural Resources Trust, (Lincoln Center for the Performing Arts, Inc.), 5.00%, 12/1/32 | | | 1,250 | | | | 1,612,688 | |
| | |
| | | | | | | $ | 4,076,763 | |
|
| Senior Living / Life Care — 8.9% | |
| | |
Brookhaven Local Development Corp., (Jefferson’s Ferry), 5.25%, 11/1/25 | | $ | 750 | | | $ | 845,910 | |
| | |
Buffalo and Erie County Industrial Land Development Corp., (Orchard Park CCRC, Inc.), 5.00%, 11/15/23 | | | 1,455 | | | | 1,566,191 | |
| | |
Suffolk County Economic Development Corp., (Peconic Landing at Southold, Inc.), 5.00%, 12/1/34(2) | | | 1,000 | | | | 1,098,840 | |
| | |
Tompkins County Development Corp., (Kendal at Ithaca, Inc.), 3.25%, 7/1/22 | | | 235 | | | | 237,009 | |
| | |
Westchester County Local Development Corp., (Kendal on Hudson), 4.00%, 1/1/23 | | | 500 | | | | 510,035 | |
| | |
Westchester County Local Development Corp., (Kendal on Hudson), 5.00%, 1/1/28 | | | 1,090 | | | | 1,140,369 | |
| | |
Westchester County Local Development Corp., (Kendal on Hudson), 5.00%, 1/1/34 | | | 480 | | | | 495,720 | |
| | |
Westchester County Local Development Corp., (Miriam Osborn Memorial Home Association), 5.00%, 7/1/24 | | | 340 | | | | 377,679 | |
| | |
Westchester County Local Development Corp., (Miriam Osborn Memorial Home Association), 5.00%, 7/1/25 | | | 260 | | | | 295,401 | |
| | |
Westchester County Local Development Corp., (Miriam Osborn Memorial Home Association), 5.00%, 7/1/26 | | | 290 | | | | 331,099 | |
| | |
| | | | | | | $ | 6,898,253 | |
| | | | |
| | 6 | | See Notes to Financial Statements. |
Eaton Vance
New York Municipal Opportunities Fund
September 30, 2020
Portfolio of Investments (Unaudited) — continued
| | | | | | | | |
| Security | | Principal
Amount
(000’s omitted) | | | Value | |
|
| Solid Waste — 0.8% | |
| | |
Onondaga County Resource Recovery Agency, (AMT), 5.00%, 5/1/25 | | $ | 540 | | | $ | 644,566 | |
| | |
| | | | | | | $ | 644,566 | |
|
| Special Tax Revenue — 10.2% | |
| | |
New York City Transitional Finance Authority, Future Tax Revenue, 3.00%, 5/1/48 | | $ | 425 | | | $ | 441,023 | |
| | |
New York City Transitional Finance Authority, Future Tax Revenue, 4.00%, 11/1/38 | | | 1,000 | | | | 1,147,060 | |
| | |
New York Dormitory Authority, Sales Tax Revenue, 5.00%, 3/15/40 | | | 1,000 | | | | 1,220,580 | |
| | |
New York Dormitory Authority, Sales Tax Revenue, (AMT), 5.00%, 3/15/30 | | | 1,875 | | | | 2,379,244 | |
| | |
New York State Urban Development Corp., Personal Income Tax Revenue, 4.00%, 3/15/38 | | | 800 | | | | 939,016 | |
| | |
New York State Urban Development Corp., Personal Income Tax Revenue, 4.00%, 3/15/41 | | | 700 | | | | 811,818 | |
| | |
New York State Urban Development Corp., Personal Income Tax Revenue, 5.00%, 3/15/35 | | | 750 | | | | 970,507 | |
| | |
| | | | | | | $ | 7,909,248 | |
|
| Transportation — 12.7% | |
| | |
Albany County Airport Authority, (AMT), 5.00%, 12/15/25 | | $ | 500 | | | $ | 593,460 | |
| | |
New York Thruway Authority, 3.00%, 1/1/48 | | | 1,060 | | | | 1,101,796 | |
| | |
New York Thruway Authority, 5.00%, 1/1/39 | | | 95 | | | | 120,018 | |
| | |
New York Thruway Authority, 5.00%, 1/1/40 | | | 905 | | | | 1,139,829 | |
| | |
New York Transportation Development Corp., (LaGuardia Airport Terminal B Redevelopment), (AMT), 5.00%, 7/1/41 | | | 2,000 | | | | 2,147,480 | |
| | |
Niagara Frontier Transportation Authority, (Buffalo Niagara International Airport), (AMT), 5.00%, 4/1/24 | | | 795 | | | | 898,875 | |
| | |
Niagara Frontier Transportation Authority, (Buffalo Niagara International Airport), (AMT), 5.00%, 4/1/28 | | | 520 | | | | 644,914 | |
| | |
Niagara Frontier Transportation Authority, (Buffalo Niagara International Airport), (AMT), 5.00%, 4/1/29 | | | 275 | | | | 346,552 | |
| | |
Niagara Frontier Transportation Authority, (Buffalo Niagara International Airport), (AMT), 5.00%, 4/1/30 | | | 455 | | | | 569,797 | |
| | |
Port Authority of New York and New Jersey, (AMT), 5.00%, 11/1/30 | | | 1,100 | | | | 1,407,846 | |
| | |
Port Authority of New York and New Jersey, (AMT), 5.00%, 10/15/35 | | | 740 | | | | 871,417 | |
| | |
| | | | | | | $ | 9,841,984 | |
|
| Water and Sewer — 3.0% | |
| | |
New York City Municipal Water Finance Authority, (Water and Sewer System), 3.00%, 6/15/40 | | $ | 1,385 | | | $ | 1,483,113 | |
| | |
New York City Municipal Water Finance Authority, (Water and Sewer System), 4.00%, 6/15/40 | | | 200 | | | | 232,652 | |
| | | | | | | | |
| Security | | Principal
Amount
(000’s omitted) | | | Value | |
|
| Water and Sewer (continued) | |
| | |
New York City Municipal Water Finance Authority, (Water and Sewer System), 5.00%, 6/15/48 | | $ | 500 | | | $ | 601,840 | |
| | |
| | | | | | | $ | 2,317,605 | |
| | |
Total Tax-Exempt Investments — 97.0%
(identified cost $72,631,855) | | | | | | $ | 75,172,803 | |
|
| Miscellaneous — 0.5% | |
| Security | | Units | | | Value | |
|
| Real Estate — 0.5% | |
| | |
CMS Liquidating Trust(1)(3)(4) | | | 150 | | | $ | 371,238 | |
| |
Total Miscellaneous — 0.5%
(identified cost $480,000) | | | $ | 371,238 | |
| |
Total Investments — 97.5%
(identified cost $73,111,855) | | | $ | 75,544,041 | |
| | |
Other Assets, Less Liabilities — 2.5% | | | | | | $ | 1,914,090 | |
| | |
Net Assets — 100.0% | | | | | | $ | 77,458,131 | |
The percentage shown for each investment category in the Portfolio of Investments is based on net assets.
The Fund invests primarily in debt securities issued by New York municipalities. The ability of the issuers of the debt securities to meet their obligations may be affected by economic developments in a specific industry or municipality. At September 30, 2020, 10.4% of total investments are backed by bond insurance of various financial institutions and financial guaranty assurance agencies. The aggregate percentage insured by an individual financial institution or financial guaranty assurance agency ranged from 2.8% to 7.6% of total investments.
| (1) | Security exempt from registration under Rule 144A of the Securities Act of 1933, as amended. These securities may be sold in certain transactions in reliance on an exemption from registration (normally to qualified institutional buyers). At September 30, 2020, the aggregate value of these securities is $5,491,266 or 7.1% of the Fund’s net assets. |
| (2) | When-issued security. |
| (3) | Non-income producing security. |
| (4) | For fair value measurement disclosure purposes, security is categorized as Level 3 (see note 9). |
Abbreviations:
| | | | |
| | |
| AGM | | – | | Assured Guaranty Municipal Corp. |
| | |
| AMT | | – | | Interest earned from these securities may be considered a tax preference item for purposes of the Federal Alternative Minimum Tax. |
| | |
| NPFG | | – | | National Public Finance Guarantee Corp. |
| | | | |
| | 7 | | See Notes to Financial Statements. |
Eaton Vance
New York Municipal Opportunities Fund
September 30, 2020
Statement of Assets and Liabilities (Unaudited)
| | | | |
| Assets | | September 30, 2020 | |
| |
Investments, at value (identified cost, $73,111,855) | | $ | 75,544,041 | |
| |
Cash | | | 1,945,563 | |
| |
Interest receivable | | | 801,902 | |
| |
Receivable for Fund shares sold | | | 456,138 | |
| |
Total assets | | $ | 78,747,644 | |
| |
| Liabilities | | | | |
| |
Payable for when-issued securities | | $ | 1,117,180 | |
| |
Payable for Fund shares redeemed | | | 44,309 | |
| |
Distributions payable | | | 33,995 | |
| |
Payable to affiliates: | | | | |
| |
Investment adviser fee | | | 23,885 | |
| |
Distribution and service fees | | | 10,059 | |
| |
Accrued expenses | | | 60,085 | |
| |
Total liabilities | | $ | 1,289,513 | |
| |
Net Assets | | $ | 77,458,131 | |
| |
| Sources of Net Assets | | | | |
| |
Paid-in capital | | $ | 74,951,787 | |
| |
Distributable earnings | | | 2,506,344 | |
| |
Net Assets | | $ | 77,458,131 | |
| |
| Class A Shares | | | | |
| |
Net Assets | | $ | 41,737,413 | |
| |
Shares Outstanding | | | 4,100,493 | |
| |
Net Asset Value and Redemption Price Per Share | | | | |
| |
(net assets ÷ shares of beneficial interest outstanding) | | $ | 10.18 | |
| |
Maximum Offering Price Per Share | | | | |
| |
(100 ÷ 95.25 of net asset value per share) | | $ | 10.69 | |
| |
| Class C Shares | | | | |
| |
Net Assets | | $ | 6,868,228 | |
| |
Shares Outstanding | | | 709,804 | |
| |
Net Asset Value and Offering Price Per Share* | | | | |
| |
(net assets ÷ shares of beneficial interest outstanding) | | $ | 9.68 | |
| |
| Class I Shares | | | | |
| |
Net Assets | | $ | 28,852,490 | |
| |
Shares Outstanding | | | 2,834,225 | |
| |
Net Asset Value, Offering Price and Redemption Price Per Share | | | | |
| |
(net assets ÷ shares of beneficial interest outstanding) | | $ | 10.18 | |
On sales of $50,000 or more, the offering price of Class A shares is reduced.
| * | Redemption price per share is equal to the net asset value less any applicable contingent deferred sales charge. |
| | | | |
| | 8 | | See Notes to Financial Statements. |
Eaton Vance
New York Municipal Opportunities Fund
September 30, 2020
Statement of Operations (Unaudited)
| | | | |
| Investment Income | | Six Months Ended
September 30, 2020 | |
| |
Interest | | $ | 1,049,784 | |
| |
Total investment income | | $ | 1,049,784 | |
| |
| Expenses | | | | |
| |
Investment adviser fee | | $ | 145,103 | |
| |
Distribution and service fees | | | | |
| |
Class A | | | 30,819 | |
| |
Class C | | | 35,123 | |
| |
Trustees’ fees and expenses | | | 2,272 | |
| |
Custodian fee | | | 14,392 | |
| |
Transfer and dividend disbursing agent fees | | | 16,471 | |
| |
Legal and accounting services | | | 27,208 | |
| |
Printing and postage | | | 8,743 | |
| |
Registration fees | | | 4,300 | |
| |
Miscellaneous | | | 12,174 | |
| |
Total expenses | | $ | 296,605 | |
| |
Net investment income | | $ | 753,179 | |
| |
| Realized and Unrealized Gain (Loss) | | | | |
| |
Net realized gain (loss) — | | | | |
| |
Investment transactions | | $ | 635,445 | |
| |
Net realized gain | | $ | 635,445 | |
| |
Change in unrealized appreciation (depreciation) — | | | | |
| |
Investments | | $ | 1,446,105 | |
| |
Net change in unrealized appreciation (depreciation) | | $ | 1,446,105 | |
| |
Net realized and unrealized gain | | $ | 2,081,550 | |
| |
Net increase in net assets from operations | | $ | 2,834,729 | |
| | | | |
| | 9 | | See Notes to Financial Statements. |
Eaton Vance
New York Municipal Opportunities Fund
September 30, 2020
Statements of Changes in Net Assets
| | | | | | | | |
| Increase (Decrease) in Net Assets | | Six Months Ended September 30, 2020
(Unaudited) | | | Year Ended March 31, 2020 | |
| | |
From operations — | | | | | | | | |
| | |
Net investment income | | $ | 753,179 | | | $ | 1,595,351 | |
| | |
Net realized gain | | | 635,445 | | | | 1,056,576 | |
| | |
Net change in unrealized appreciation (depreciation) | | | 1,446,105 | | | | (1,071,385 | ) |
| | |
Net increase in net assets from operations | | $ | 2,834,729 | | | $ | 1,580,542 | |
| | |
Distributions to shareholders — | | | | | | | | |
| | |
Class A | | $ | (403,920 | ) | | $ | (931,248 | ) |
| | |
Class C | | | (47,995 | ) | | | (137,584 | ) |
| | |
Class I | | | (286,419 | ) | | | (549,970 | ) |
| | |
Total distributions to shareholders | | $ | (738,334 | ) | | $ | (1,618,802 | ) |
| | |
Transactions in shares of beneficial interest — | | | | | | | | |
| | |
Proceeds from sale of shares | | | | | | | | |
| | |
Class A | | $ | 2,313,607 | | | $ | 4,994,312 | |
| | |
Class C | | | 560,298 | | | | 942,261 | |
| | |
Class I | | | 4,237,369 | | | | 7,501,561 | |
| | |
Net asset value of shares issued to shareholders in payment of distributions declared | | | | | | | | |
| | |
Class A | | | 341,433 | | | | 806,909 | |
| | |
Class C | | | 32,322 | | | | 85,515 | |
| | |
Class I | | | 151,773 | | | | 302,653 | |
| | |
Cost of shares redeemed | | | | | | | | |
| | |
Class A | | | (3,696,731 | ) | | | (7,228,826 | ) |
| | |
Class C | | | (3,216,263 | ) | | | (1,393,645 | ) |
| | |
Class I | | | (1,760,314 | ) | | | (3,309,638 | ) |
| | |
Net asset value of shares converted | | | | | | | | |
| | |
Class A | | | 172,197 | | | | 901,147 | |
| | |
Class C | | | (172,197 | ) | | | (901,147 | ) |
| | |
Net increase (decrease) in net assets from Fund share transactions | | $ | (1,036,506 | ) | | $ | 2,701,102 | |
| | |
Net increase in net assets | | $ | 1,059,889 | | | $ | 2,662,842 | |
| | |
| Net Assets | | | | | | | | |
| | |
At beginning of period | | $ | 76,398,242 | | | $ | 73,735,400 | |
| | |
At end of period | | $ | 77,458,131 | | | $ | 76,398,242 | |
| | | | |
| | 10 | | See Notes to Financial Statements. |
Eaton Vance
New York Municipal Opportunities Fund
September 30, 2020
Financial Highlights
| | | | | | | | | | | | | | | | | | | | | | | | |
| | | Class A | |
| | |
| | | Six Months Ended
September 30, 2020
(Unaudited) | | | Year Ended March 31, | |
| | | 2020 | | | 2019 | | | 2018 | | | 2017 | | | 2016 | |
| | | | | | | |
Net asset value — Beginning of period | | $ | 9.890 | | | $ | 9.870 | | | $ | 9.660 | | | $ | 9.770 | | | $ | 10.090 | | | $ | 10.110 | |
| | | | | | |
| Income (Loss) From Operations | | | | | | | | | | | | | | | | | | | | | | | | |
| | | | | | |
Net investment income(1) | | $ | 0.101 | | | $ | 0.210 | | | $ | 0.245 | | | $ | 0.241 | | | $ | 0.269 | | | $ | 0.275 | |
| | | | | | |
Net realized and unrealized gain (loss) | | | 0.288 | | | | 0.023 | (2) | | | 0.207 | | | | (0.113 | ) | | | (0.322 | ) | | | (0.023 | ) |
| | | | | | |
Total income (loss) from operations | | $ | 0.389 | | | $ | 0.233 | | | $ | 0.452 | | | $ | 0.128 | | | $ | (0.053 | ) | | $ | 0.252 | |
| | | | | | |
| Less Distributions | | | | | | | | | | | | | | | | | | | | | | | | |
| | | | | | |
From net investment income | | $ | (0.099 | ) | | $ | (0.213 | ) | | $ | (0.242 | ) | | $ | (0.238 | ) | | $ | (0.267 | ) | | $ | (0.272 | ) |
| | | | | | |
Total distributions | | $ | (0.099 | ) | | $ | (0.213 | ) | | $ | (0.242 | ) | | $ | (0.238 | ) | | $ | (0.267 | ) | | $ | (0.272 | ) |
| | | | | | |
Net asset value — End of period | | $ | 10.180 | | | $ | 9.890 | | | $ | 9.870 | | | $ | 9.660 | | | $ | 9.770 | | | $ | 10.090 | |
| | | | | | |
Total Return(3) | | | 3.95 | %(4) | | | 2.33 | % | | | 4.75 | % | | | 1.30 | % | | | (0.55 | )% | | | 2.54 | % |
| | | | | | |
| Ratios/Supplemental Data | | | | | | | | | | | | | | | | | | | | | | | | |
| | | | | | |
Net assets, end of period (000’s omitted) | | $ | 41,737 | | | $ | 41,504 | | | $ | 42,073 | | | $ | 44,330 | | | $ | 51,983 | | | $ | 47,738 | |
| | | | | | |
Ratios (as a percentage of average daily net assets): | | | | | | | | | | | | | | | | | | | | | | | | |
| | | | | | |
Expenses(5) | | | 0.76 | %(6) | | | 0.74 | % | | | 0.79 | % | | | 0.75 | % | | | 0.74 | % | | | 0.75 | % |
| | | | | | |
Net investment income | | | 2.00 | %(6) | | | 2.08 | % | | | 2.54 | % | | | 2.45 | % | | | 2.70 | % | | | 2.74 | % |
| | | | | | |
Portfolio Turnover | | | 48 | %(4) | | | 102 | % | | | 54 | % | | | 66 | % | | | 68 | % | | | 9 | % |
| (1) | Computed using average shares outstanding. |
| (2) | The per share amount is not in accord with the net realized and unrealized gain (loss) on investments for the period because of the timing of sales of Fund shares and the amount of the per share realized and unrealized gains and losses at such time. |
| (3) | Returns are historical and are calculated by determining the percentage change in net asset value with all distributions reinvested and do not reflect the effect of sales charges. |
| (5) | Excludes the effect of custody fee credits, if any, of less than 0.005%. Effective September 1, 2015, custody fee credits, which were earned on cash deposit balances, were discontinued by the custodian. |
| | | | |
| | 11 | | See Notes to Financial Statements. |
Eaton Vance
New York Municipal Opportunities Fund
September 30, 2020
Financial Highlights — continued
| | | | | | | | | | | | | | | | | | | | | | | | |
| | | Class C | |
| | |
| | | Six Months Ended
September 30, 2020
(Unaudited) | | | Year Ended March 31, | |
| | | 2020 | | | 2019 | | | 2018 | | | 2017 | | | 2016 | |
| | | | | | | |
Net asset value — Beginning of period | | $ | 9.410 | | | $ | 9.390 | | | $ | 9.180 | | | $ | 9.290 | | | $ | 9.590 | | | $ | 9.610 | |
| | | | | | |
| Income (Loss) From Operations | | | | | | | | | | | | | | | | | | | | | | | | |
| | | | | | |
Net investment income(1) | | $ | 0.061 | | | $ | 0.128 | | | $ | 0.164 | | | $ | 0.159 | | | $ | 0.185 | | | $ | 0.190 | |
| | | | | | |
Net realized and unrealized gain (loss) | | | 0.267 | | | | 0.022 | (2) | | | 0.207 | | | | (0.113 | ) | | | (0.302 | ) | | | (0.023 | ) |
| | | | | | |
Total income (loss) from operations | | $ | 0.328 | | | $ | 0.150 | | | $ | 0.371 | | | $ | 0.046 | | | $ | (0.117 | ) | | $ | 0.167 | |
| | | | | | |
| Less Distributions | | | | | | | | | | | | | | | | | | | | | | | | |
| | | | | | |
From net investment income | | $ | (0.058 | ) | | $ | (0.130 | ) | | $ | (0.161 | ) | | $ | (0.156 | ) | | $ | (0.183 | ) | | $ | (0.187 | ) |
| | | | | | |
Total distributions | | $ | (0.058 | ) | | $ | (0.130 | ) | | $ | (0.161 | ) | | $ | (0.156 | ) | | $ | (0.183 | ) | | $ | (0.187 | ) |
| | | | | | |
Net asset value — End of period | | $ | 9.680 | | | $ | 9.410 | | | $ | 9.390 | | | $ | 9.180 | | | $ | 9.290 | | | $ | 9.590 | |
| | | | | | |
Total Return(3) | | | 3.50 | %(4) | | | 1.58 | % | | | 4.09 | % | | | 0.48 | % | | | (1.24 | )% | | | 1.77 | % |
| | | | | | |
| Ratios/Supplemental Data | | | | | | | | | | | | | | | | | | | | | | | | |
| | | | | | |
Net assets, end of period (000’s omitted) | | $ | 6,868 | | | $ | 9,441 | | | $ | 10,663 | | | $ | 16,306 | | | $ | 22,763 | | | $ | 26,312 | |
| | | | | | |
Ratios (as a percentage of average daily net assets): | | | | | | | | | | | | | | | | | | | | | | | | |
| | | | | | |
Expenses(5) | | | 1.51 | %(6) | | | 1.50 | % | | | 1.54 | % | | | 1.50 | % | | | 1.50 | % | | | 1.50 | % |
| | | | | | |
Net investment income | | | 1.27 | %(6) | | | 1.33 | % | | | 1.79 | % | | | 1.71 | % | | | 1.95 | % | | | 1.99 | % |
| | | | | | |
Portfolio Turnover | | | 48 | %(4) | | | 102 | % | | | 54 | % | | | 66 | % | | | 68 | % | | | 9 | % |
| (1) | Computed using average shares outstanding. |
| (2) | The per share amount is not in accord with the net realized and unrealized gain (loss) on investments for the period because of the timing of sales of Fund shares and the amount of the per share realized and unrealized gains and losses at such time. |
| (3) | Returns are historical and are calculated by determining the percentage change in net asset value with all distributions reinvested and do not reflect the effect of sales charges. |
| (5) | Excludes the effect of custody fee credits, if any, of less than 0.005%. Effective September 1, 2015, custody fee credits, which were earned on cash deposit balances, were discontinued by the custodian. |
| | | | |
| | 12 | | See Notes to Financial Statements. |
Eaton Vance
New York Municipal Opportunities Fund
September 30, 2020
Financial Highlights — continued
| | | | | | | | | | | | | | | | | | | | | | | | |
| | | Class I | |
| | |
| | | Six Months Ended
September 30, 2020
(Unaudited) | | | Year Ended March 31, | |
| | | 2020 | | | 2019 | | | 2018 | | | 2017 | | | 2016 | |
| | | | | | | �� |
Net asset value — Beginning of period | | $ | 9.890 | | | $ | 9.870 | | | $ | 9.660 | | | $ | 9.770 | | | $ | 10.090 | | | $ | 10.110 | |
| | | | | | |
| Income (Loss) From Operations | | | | | | | | | | | | | | | | | | | | | | | | |
| | | | | | |
Net investment income(1) | | $ | 0.108 | | | $ | 0.225 | | | $ | 0.260 | | | $ | 0.255 | | | $ | 0.284 | | | $ | 0.290 | |
| | | | | | |
Net realized and unrealized gain (loss) | | | 0.289 | | | | 0.023 | (2) | | | 0.206 | | | | (0.112 | ) | | | (0.322 | ) | | | (0.023 | ) |
| | | | | | |
Total income (loss) from operations | | $ | 0.397 | | | $ | 0.248 | | | $ | 0.466 | | | $ | 0.143 | | | $ | (0.038 | ) | | $ | 0.267 | |
| | | | | | |
| Less Distributions | | | | | | | | | | | | | | | | | | | | | | | | |
| | | | | | |
From net investment income | | $ | (0.107 | ) | | $ | (0.228 | ) | | $ | (0.256 | ) | | $ | (0.253 | ) | | $ | (0.282 | ) | | $ | (0.287 | ) |
| | | | | | |
Total distributions | | $ | (0.107 | ) | | $ | (0.228 | ) | | $ | (0.256 | ) | | $ | (0.253 | ) | | $ | (0.282 | ) | | $ | (0.287 | ) |
| | | | | | |
Net asset value — End of period | | $ | 10.180 | | | $ | 9.890 | | | $ | 9.870 | | | $ | 9.660 | | | $ | 9.770 | | | $ | 10.090 | |
| | | | | | |
Total Return(3) | | | 4.03 | %(4) | | | 2.48 | % | | | 4.91 | % | | | 1.45 | % | | | (0.40 | )% | | | 2.70 | % |
| | | | | | |
| Ratios/Supplemental Data | | | | | | | | | | | | | | | | | | | | | | | | |
| | | | | | |
Net assets, end of period (000’s omitted) | | $ | 28,852 | | | $ | 25,454 | | | $ | 21,000 | | | $ | 16,301 | | | $ | 17,869 | | | $ | 13,601 | |
| | | | | | |
Ratios (as a percentage of average daily net assets): | | | | | | | | | | | | | | | | | | | | | | | | |
| | | | | | |
Expenses(5) | | | 0.61 | %(6) | | | 0.59 | % | | | 0.64 | % | | | 0.60 | % | | | 0.60 | % | | | 0.60 | % |
| | | | | | |
Net investment income | | | 2.15 | %(6) | | | 2.23 | % | | | 2.68 | % | | | 2.60 | % | | | 2.85 | % | | | 2.89 | % |
| | | | | | |
Portfolio Turnover | | | 48 | %(4) | | | 102 | % | | | 54 | % | | | 66 | % | | | 68 | % | | | 9 | % |
| (1) | Computed using average shares outstanding. |
| (2) | The per share amount is not in accord with the net realized and unrealized gain (loss) on investments for the period because of the timing of sales of Fund shares and the amount of the per share realized and unrealized gains and losses at such time. |
| (3) | Returns are historical and are calculated by determining the percentage change in net asset value with all distributions reinvested. |
| (5) | Excludes the effect of custody fee credits, if any, of less than 0.005%. Effective September 1, 2015, custody fee credits, which were earned on cash deposit balances, were discontinued by the custodian. |
| | | | |
| | 13 | | See Notes to Financial Statements. |
Eaton Vance
New York Municipal Opportunities Fund
September 30, 2020
Notes to Financial Statements (Unaudited)
1 Significant Accounting Policies
Eaton Vance New York Municipal Opportunities Fund (the Fund) is a non-diversified series of Eaton Vance Investment Trust (the Trust). The Trust is a Massachusetts business trust registered under the Investment Company Act of 1940, as amended (the 1940 Act), as an open-end management investment company. The Fund’s investment objective is to seek to maximize after-tax total return. The Fund offers three classes of shares. Class A shares are generally sold subject to a sales charge imposed at time of purchase. Class C shares are sold at net asset value and are generally subject to a contingent deferred sales charge (see Note 5). Effective January 25, 2019, Class C shares generally automatically convert to Class A shares ten years after their purchase and, effective November 5, 2020, will automatically convert to Class A shares eight years after their purchase as described in the Fund’s prospectus. Class I shares are sold at net asset value and are not subject to a sales charge. Each class represents a pro-rata interest in the Fund, but votes separately on class-specific matters and (as noted below) is subject to different expenses. Realized and unrealized gains and losses are allocated daily to each class of shares based on the relative net assets of each class to the total net assets of the Fund. Net investment income, other than class-specific expenses, is allocated daily to each class of shares based upon the ratio of the value of each class’s paid shares to the total value of all paid shares. Each class of shares differs in its distribution plan and certain other class-specific expenses.
The following is a summary of significant accounting policies of the Fund. The policies are in conformity with accounting principles generally accepted in the United States of America (U.S. GAAP). The Fund is an investment company and follows accounting and reporting guidance in the Financial Accounting Standards Board (FASB) Accounting Standards Codification Topic 946.
A Investment Valuation — The following methodologies are used to determine the market value or fair value of investments.
Debt Obligations. Debt obligations are generally valued on the basis of valuations provided by third party pricing services, as derived from such services’ pricing models. Inputs to the models may include, but are not limited to, reported trades, executable bid and ask prices, broker/dealer quotations, prices or yields of securities with similar characteristics, interest rates, anticipated prepayments, benchmark curves or information pertaining to the issuer, as well as industry and economic events. The pricing services may use a matrix approach, which considers information regarding securities with similar characteristics to determine the valuation for a security. Short-term debt obligations purchased with a remaining maturity of sixty days or less for which a valuation from a third party pricing service is not readily available may be valued at amortized cost, which approximates fair value.
Fair Valuation. Investments for which valuations or market quotations are not readily available or are deemed unreliable are valued at fair value using methods determined in good faith by or at the direction of the Trustees of the Fund in a manner that most fairly reflects the security’s “fair value”, which is the amount that the Fund might reasonably expect to receive for the security upon its current sale in the ordinary course. Each such determination is based on a consideration of relevant factors, which are likely to vary from one pricing context to another. These factors may include, but are not limited to, the type of security, the existence of any contractual restrictions on the security’s disposition, the price and extent of public trading in similar securities of the issuer or of comparable entities, quotations or relevant information obtained from broker/dealers or other market participants, information obtained from the issuer, analysts, and/or the appropriate stock exchange (for exchange-traded securities), an analysis of the entity’s financial statements, and an evaluation of the forces that influence the issuer and the market(s) in which the security is purchased and sold.
B Investment Transactions and Related Income — Investment transactions for financial statement purposes are accounted for on a trade date basis. Realized gains and losses on investments sold are determined on the basis of identified cost. Interest income is recorded on the basis of interest accrued, adjusted for amortization of premium or accretion of discount.
C Federal Taxes — The Fund’s policy is to comply with the provisions of the Internal Revenue Code applicable to regulated investment companies and to distribute to shareholders each year substantially all of its taxable, if any, and tax-exempt net investment income, and all or substantially all of its net realized capital gains. Accordingly, no provision for federal income or excise tax is necessary. The Fund intends to satisfy conditions which will enable it to designate distributions from the interest income generated by its investments in non-taxable municipal securities, which are exempt from regular federal income tax when received by the Fund, as exempt-interest dividends. The portion of such interest, if any, earned on private activity bonds issued after August 7, 1986, may be considered a tax preference item to shareholders.
As of September 30, 2020, the Fund had no uncertain tax positions that would require financial statement recognition, de-recognition, or disclosure. The Fund files a U.S. federal income tax return annually after its fiscal year-end, which is subject to examination by the Internal Revenue Service for a period of three years from the date of filing.
D Expenses — The majority of expenses of the Trust are directly identifiable to an individual fund. Expenses which are not readily identifiable to a specific fund are allocated taking into consideration, among other things, the nature and type of expense and the relative size of the funds.
E Legal Fees — Legal fees and other related expenses incurred as part of negotiations of the terms and requirement of capital infusions, or that are expected to result in the restructuring of, or a plan of reorganization for, an investment are recorded as realized losses. Ongoing expenditures to protect or enhance an investment are treated as operating expenses.
F Use of Estimates — The preparation of the financial statements in conformity with U.S. GAAP requires management to make estimates and assumptions that affect the reported amounts of assets and liabilities at the date of the financial statements and the reported amounts of income and expense during the reporting period. Actual results could differ from those estimates.
Eaton Vance
New York Municipal Opportunities Fund
September 30, 2020
Notes to Financial Statements (Unaudited) — continued
G Indemnifications — Under the Trust’s organizational documents, its officers and Trustees may be indemnified against certain liabilities and expenses arising out of the performance of their duties to the Fund. Under Massachusetts law, if certain conditions prevail, shareholders of a Massachusetts business trust (such as the Trust) could be deemed to have personal liability for the obligations of the Trust. However, the Trust’s Declaration of Trust contains an express disclaimer of liability on the part of Fund shareholders and the By-laws provide that the Trust shall assume, upon request by the shareholder, the defense on behalf of any Fund shareholders. Moreover, the By-laws also provide for indemnification out of Fund property of any shareholder held personally liable solely by reason of being or having been a shareholder for all loss or expense arising from such liability. Additionally, in the normal course of business, the Fund enters into agreements with service providers that may contain indemnification clauses. The Fund’s maximum exposure under these arrangements is unknown as this would involve future claims that may be made against the Fund that have not yet occurred.
H When-Issued Securities and Delayed Delivery Transactions — The Fund may purchase or sell securities on a delayed delivery or when-issued basis. Payment and delivery may take place after the customary settlement period for that security. At the time the transaction is negotiated, the price of the security that will be delivered is fixed. The Fund maintains cash and/or security positions for these commitments such that sufficient liquid assets will be available to make payments upon settlement. Securities purchased on a delayed delivery or when-issued basis are marked-to-market daily and begin earning interest on settlement date. Losses may arise due to changes in the market value of the underlying securities or if the counterparty does not perform under the contract.
I Interim Financial Statements — The interim financial statements relating to September 30, 2020 and for the six months then ended have not been audited by an independent registered public accounting firm, but in the opinion of the Fund’s management, reflect all adjustments, consisting only of normal recurring adjustments, necessary for the fair presentation of the financial statements.
2 Distributions to Shareholders and Income Tax Information
The net investment income of the Fund is determined daily and substantially all of the net investment income so determined is declared as a dividend to shareholders of record at the time of declaration. Distributions are declared separately for each class of shares. Distributions are paid monthly. Distributions of realized capital gains are made at least annually. Shareholders may reinvest income and capital gain distributions in additional shares of the same class of the Fund at the net asset value as of the reinvestment date or, at the election of the shareholder, receive distributions in cash. Distributions to shareholders are determined in accordance with income tax regulations, which may differ from U.S. GAAP. As required by U.S. GAAP, only distributions in excess of tax basis earnings and profits are reported in the financial statements as a return of capital. Permanent differences between book and tax accounting relating to distributions are reclassified to paid-in capital. For tax purposes, distributions from short-term capital gains are considered to be from ordinary income.
At March 31, 2020, the Fund, for federal income tax purposes, had deferred capital losses of $646,945 which would reduce its taxable income arising from future net realized gains on investment transactions, if any, to the extent permitted by the Internal Revenue Code, and thus would reduce the amount of distributions to shareholders, which would otherwise be necessary to relieve the Fund of any liability for federal income or excise tax. The deferred capital losses are treated as arising on the first day of the Fund’s next taxable year and retain the same short-term or long-term character as when originally deferred. Of the deferred capital losses at March 31, 2020, $646,945 are short-term.
The cost and unrealized appreciation (depreciation) of investments of the Fund at September 30, 2020, as determined on a federal income tax basis, were as follows:
| | | | |
| |
Aggregate cost | | $ | 73,025,137 | |
| |
Gross unrealized appreciation | | $ | 2,917,921 | |
| |
Gross unrealized depreciation | | | (399,017 | ) |
| |
Net unrealized appreciation | | $ | 2,518,904 | |
3 Investment Adviser Fee and Other Transactions with Affiliates
The investment adviser fee is earned by Boston Management and Research (BMR), a subsidiary of Eaton Vance Management (EVM) and an indirect subsidiary of Eaton Vance Corp., as compensation for management and investment advisory services rendered to the Fund. The fee is based upon a percentage of average daily net assets plus a percentage of gross income (i.e., income other than gains from the sale of securities) and is payable monthly. The annual asset rate and daily income rate are 0.30% and 3.00%, respectively, when daily net assets are less than $500 million and at reduced rates when daily net assets are $500 million or more. For the six months ended September 30, 2020, the investment adviser fee amounted to $145,103 or 0.38% (annualized) of the Fund’s average daily net assets.
Eaton Vance
New York Municipal Opportunities Fund
September 30, 2020
Notes to Financial Statements (Unaudited) — continued
EVM serves as the administrator of the Fund, but receives no compensation. EVM provides sub-transfer agency and related services to the Fund pursuant to a Sub-Transfer Agency Support Services Agreement. For the six months ended September 30, 2020, EVM earned $3,100 from the Fund pursuant to such agreement, which is included in transfer and dividend disbursing agent fees on the Statement of Operations. The Fund was informed that Eaton Vance Distributors, Inc. (EVD), an affiliate of EVM and the Fund’s principal underwriter, received $1,867 as its portion of the sales charge on sales of Class A shares for the six months ended September 30, 2020. EVD also received distribution and service fees from Class A and Class C shares (see Note 4).
Trustees and officers of the Fund who are members of EVM’s or BMR’s organizations receive remuneration for their services to the Fund out of the investment adviser fee. Trustees of the Fund who are not affiliated with the investment adviser may elect to defer receipt of all or a percentage of their annual fees in accordance with the terms of the Trustees Deferred Compensation Plan. For the six months ended September 30, 2020, no significant amounts have been deferred. Certain officers and Trustees of the Fund are officers of the above organizations.
4 Distribution Plans
The Fund has in effect a distribution plan for Class A shares (Class A Plan) pursuant to Rule 12b-1 under the 1940 Act. Pursuant to the Class A Plan, the Fund pays EVD a distribution and service fee not exceeding 0.25% per annum of its average daily net assets attributable to Class A shares for distribution services and facilities provided to the Fund by EVD, as well as for personal services and/or the maintenance of shareholder accounts. The Trustees approved distribution and service fee payments equal to 0.15% per annum of the Fund’s average daily net assets attributable to Class A shares. Distribution and service fees paid or accrued to EVD for the six months ended September 30, 2020 amounted to $30,819 for Class A shares.
The Fund also has in effect a distribution plan for Class C shares (Class C Plan) pursuant to Rule 12b-1 under the 1940 Act. Pursuant to the Class C Plan, the Fund pays EVD amounts equal to 0.75% per annum of its average daily net assets attributable to Class C shares for providing ongoing distribution services and facilities to the Fund. For the six months ended September 30, 2020, the Fund paid or accrued to EVD $29,269 for Class C shares.
Pursuant to the Class C Plan, the Fund also makes payments of service fees to EVD, financial intermediaries and other persons in amounts not exceeding 0.25% per annum of its average daily net assets attributable to Class C shares. The Trustees approved service fee payments equal to 0.15% per annum of the Fund’s average daily net assets attributable to Class C shares. Service fees paid or accrued are for personal services and/or the maintenance of shareholder accounts. They are separate and distinct from the Class C sales commissions and distribution fees payable to EVD. Service fees paid or accrued for the six months ended September 30, 2020 amounted to $5,854 for Class C shares.
Distribution and service fees are subject to the limitations contained in the Financial Industry Regulatory Authority Rule 2341(d).
5 Contingent Deferred Sales Charges
A contingent deferred sales charge (CDSC) of 1% generally is imposed on redemptions of Class C shares made within 12 months of purchase. Class A shares may be subject to a 1% CDSC if redeemed within 18 months of purchase (depending on the circumstances of purchase). Generally, the CDSC is based upon the lower of the net asset value at date of redemption or date of purchase. No charge is levied on shares acquired by reinvestment of dividends or capital gain distributions. For the six months ended September 30, 2020, the Fund was informed that EVD received less than $100 of CDSCs paid by Class C shareholders and no CDSCs paid by Class A shareholders.
6 Purchases and Sales of Investments
Purchases and sales of investments, other than short-term obligations, aggregated $36,494,446 and $41,884,400, respectively, for the six months ended September 30, 2020.
Eaton Vance
New York Municipal Opportunities Fund
September 30, 2020
Notes to Financial Statements (Unaudited) — continued
7 Shares of Beneficial Interest
The Fund’s Declaration of Trust permits the Trustees to issue an unlimited number of full and fractional shares of beneficial interest (without par value). Such shares may be issued in a number of different series (such as the Fund) and classes. Transactions in Fund shares were as follows:
| | | | | | | | |
| Class A | | Six Months Ended
September 30, 2020
(Unaudited) | | | Year Ended
March 31, 2020 | |
| | |
Sales | | | 228,441 | | | | 492,131 | |
| | |
Issued to shareholders electing to receive payments of distributions in Fund shares | | | 34,003 | | | | 79,792 | |
| | |
Redemptions | | | (374,549 | ) | | | (726,951 | ) |
| | |
Converted from Class C shares | | | 17,278 | | | | 89,208 | |
| | |
Net decrease | | | (94,827 | ) | | | (65,820 | ) |
| | |
| Class C | | Six Months Ended
September 30, 2020
(Unaudited) | | | Year Ended
March 31, 2020 | |
| | |
Sales | | | 58,004 | | | | 98,447 | |
| | |
Issued to shareholders electing to receive payments of distributions in Fund shares | | | 3,389 | | | | 8,901 | |
| | |
Redemptions | | | (337,241 | ) | | | (145,630 | ) |
| | |
Converted to Class A shares | | | (18,178 | ) | | | (93,835 | ) |
| | |
Net decrease | | | (294,026 | ) | | | (132,117 | ) |
| | |
| Class I | | Six Months Ended
September 30, 2020
(Unaudited) | | | Year Ended
March 31, 2020 | |
| | |
Sales | | | 423,517 | | | | 744,643 | |
| | |
Issued to shareholders electing to receive payments of distributions in Fund shares | | | 15,102 | | | | 29,924 | |
| | |
Redemptions | | | (177,105 | ) | | | (328,431 | ) |
| | |
Net increase | | | 261,514 | | | | 446,136 | |
8 Line of Credit
The Fund participates with other portfolios and funds managed by EVM and its affiliates in an $800 million unsecured line of credit agreement with a group of banks, which is in effect through October 27, 2020. In connection with the renewal of the agreement on October 29, 2019, funds managed by Calvert Research and Management, an affiliate of EVM, were added as participating funds to the agreement and the borrowing limit was increased from $625 million. Borrowings are made by the Fund solely for temporary purposes related to redemptions and other short-term cash needs. Interest is charged to the Fund based on its borrowings at an amount above either the Eurodollar rate or Federal Funds rate. In addition, a fee computed at an annual rate of 0.15% on the daily unused portion of the line of credit is allocated among the participating portfolios and funds at the end of each quarter. Because the line of credit is not available exclusively to the Fund, it may be unable to borrow some or all of its requested amounts at any particular time. The Fund did not have any significant borrowings or allocated fees during the six months ended September 30, 2020.
Effective October 27, 2020, the Fund renewed its line of credit agreement, which expires October 26, 2021, at substantially the same terms.
Eaton Vance
New York Municipal Opportunities Fund
September 30, 2020
Notes to Financial Statements (Unaudited) — continued
9 Fair Value Measurements
Under generally accepted accounting principles for fair value measurements, a three-tier hierarchy to prioritize the assumptions, referred to as inputs, is used in valuation techniques to measure fair value. The three-tier hierarchy of inputs is summarized in the three broad levels listed below.
| • | | Level 1 – quoted prices in active markets for identical investments |
| • | | Level 2 – other significant observable inputs (including quoted prices for similar investments, interest rates, prepayment speeds, credit risk, etc.) |
| • | | Level 3 – significant unobservable inputs (including a fund’s own assumptions in determining the fair value of investments) |
In cases where the inputs used to measure fair value fall in different levels of the fair value hierarchy, the level disclosed is determined based on the lowest level input that is significant to the fair value measurement in its entirety. The inputs or methodology used for valuing securities are not necessarily an indication of the risk associated with investing in those securities.
At September 30, 2020, the hierarchy of inputs used in valuing the Fund’s investments, which are carried at value, were as follows:
| | | | | | | | | | | | | | | | |
| Asset Description | | Level 1 | | | Level 2 | | | Level 3* | | | Total | |
| | | | |
Tax-Exempt Investments | | $ | — | | | $ | 75,172,803 | | | $ | — | | | $ | 75,172,803 | |
| | | | |
Miscellaneous | | | — | | | | — | | | | 371,238 | | | | 371,238 | |
| | | | |
Total Investments | | $ | — | | | $ | 75,172,803 | | | $ | 371,238 | | | $ | 75,544,041 | |
| * | None of the unobservable inputs for Level 3 assets, individually or collectively, had a material impact on the Fund. |
Level 3 investments at the beginning and/or end of the period in relation to net assets were not significant and accordingly, a reconciliation of Level 3 assets for the six months ended September 30, 2020 is not presented.
10 Risks and Uncertainties
Pandemic Risk
An outbreak of respiratory disease caused by a novel coronavirus was first detected in China in December 2019 and subsequently spread internationally. This coronavirus has resulted in closing borders, enhanced health screenings, changes to healthcare service preparation and delivery, quarantines, cancellations, disruptions to supply chains and customer activity, as well as general concern and uncertainty. Health crises caused by outbreaks, such as the coronavirus outbreak, may exacerbate other pre-existing political, social and economic risks and disrupt normal market conditions and operations. The impact of this outbreak has negatively affected the worldwide economy, the economies of individual countries, individual companies, and the market in general, and may continue to do so in significant and unforeseen ways, as may other epidemics and pandemics that may arise in the future. Any such impact could adversely affect the Fund’s performance, or the performance of the securities in which the Fund invests.
11 Subsequent Event
On October 8, 2020, Morgan Stanley and Eaton Vance Corp. (“Eaton Vance”) announced that they had entered into a definitive agreement under which Morgan Stanley would acquire Eaton Vance. Under the Investment Company Act of 1940, as amended, consummation of this transaction may result in the automatic termination of the Fund’s investment advisory agreement, and any related sub-advisory agreement(s), if applicable. Thus, the Fund’s Board will be asked to approve a new investment advisory agreement (and new sub-advisory agreement(s), if applicable). If approved by the Fund’s Board, the new investment advisory agreement (and new sub-advisory agreement(s), if applicable) is expected to be presented to Fund shareholders for approval, and, if approved, would take effect upon the closing of the transaction.
Eaton Vance
New York Municipal Opportunities Fund
September 30, 2020
Board of Trustees’ Contract Approval
Overview of the Contract Review Process
The Investment Company Act of 1940, as amended (the “1940 Act”), provides, in substance, that the investment advisory agreement between a fund and its investment adviser will continue in effect from year-to-year only if its continuation is approved on an annual basis by a vote of the fund’s board of trustees, including a majority of the trustees who are not “interested persons” of the fund (“independent trustees”), cast in person at a meeting called for the purpose of considering such approval.
At a meeting held on April 22, 2020 (the “April 2020 Meeting”), the Boards of Trustees/Directors comprised of the same individuals (collectively, the “Board”) that oversees a majority of the registered investment companies advised by Eaton Vance Management or its affiliate, Boston Management and Research (the “Eaton Vance Funds”), including a majority of the independent trustees (the “Independent Trustees”), voted to approve the continuation of existing investment advisory agreements and sub-advisory agreements(1) for each of the Eaton Vance Funds for an additional one-year period. The Board relied upon the affirmative recommendation of its Contract Review Committee, which is a committee exclusively comprised of Independent Trustees. Prior to making its recommendation, the Contract Review Committee reviewed information furnished by the adviser and sub-adviser to each of the Eaton Vance Funds (including information specifically requested by the Board) for a series of formal meetings held between February and April 2020. Members of the Contract Review Committee also considered information received at prior meetings of the Board and its committees, to the extent such information was relevant to the Contract Review Committee’s annual evaluation of the investment advisory agreements and sub-advisory agreements.
In connection with its evaluation of the investment advisory agreements and sub-advisory agreements, the Board considered various information relating to the Eaton Vance Funds. This included information applicable to all or groups of Eaton Vance Funds, which is referenced immediately below, and information applicable to the particular Eaton Vance Fund covered by this report (additional fund-specific information is referenced below under “Results of the Contract Review Process”). (For funds that invest through one or more underlying portfolios, references to “each fund” in this section may include information that was considered at the portfolio-level.)
Information about Fees, Performance and Expenses
| | • | | A report from an independent data provider comparing advisory and other fees paid by each fund to such fees paid by comparable funds, as identified by the independent data provider (“comparable funds”); |
| | • | | A report from an independent data provider comparing each fund’s total expense ratio (and its components) to those of comparable funds; |
| | • | | A report from an independent data provider comparing the investment performance of each fund (including, as relevant, total return data, income data, Sharpe ratios and information ratios) to the investment performance of comparable funds and, as applicable, benchmark indices, over various time periods; |
| | • | | In certain instances, data regarding investment performance relative to customized groups of peer funds and blended indices identified by the adviser in consultation with the Portfolio Management Committee of the Board; |
| | • | | Comparative information concerning the fees charged and services provided by the adviser and sub-adviser to each fund in managing other accounts (which may include other mutual funds, collective investment funds and institutional accounts) using investment strategies and techniques similar to those used in managing such fund(s), if any; |
| | • | | Profitability analyses with respect to the adviser and sub-adviser to each of the funds; |
Information about Portfolio Management and Trading
| | • | | Descriptions of the investment management services provided to each fund, as well as each of the funds’ investment strategies and policies; |
| | • | | The procedures and processes used to determine the fair value of fund assets, when necessary, and actions taken to monitor and test the effectiveness of such procedures and processes; |
| | • | | Information about the policies and practices of each fund’s adviser and sub-adviser (in the context of a sub-adviser, only those with trading responsibilities) with respect to trading, including their processes for seeking best execution of portfolio transactions; |
| | • | | Information about the allocation of brokerage transactions and the benefits, if any, received by the adviser and sub-adviser (in the context of a sub-adviser, only those with trading responsibilities) to each fund as a result of brokerage allocation, including, as applicable, information concerning the acquisition of research through client commission arrangements and policies with respect to “soft dollars”; |
| | • | | Data relating to the portfolio turnover rate of each fund; |
Information about each Adviser and Sub-adviser
| | • | | Reports detailing the financial results and condition of the adviser and sub-adviser to each fund; |
| | • | | Information regarding the individual investment professionals whose responsibilities include portfolio management and investment research for the funds, and, for portfolio managers and certain other investment professionals, information relating to their responsibilities with respect to managing other mutual funds and investment accounts, as applicable; |
| | • | | The Code of Ethics of the adviser and its affiliates and the sub-adviser of each fund, together with information relating to compliance with, and the administration of, such codes; |
| (1) | Not all Eaton Vance Funds have entered into a sub-advisory agreement with a sub-adviser. Accordingly, references to “sub-adviser” or “sub-advisory agreement” in this “Overview” section may not be applicable to the particular Eaton Vance Fund covered by this report. |
Eaton Vance
New York Municipal Opportunities Fund
September 30, 2020
Board of Trustees’ Contract Approval — continued
| | • | | Policies and procedures relating to proxy voting and the handling of corporate actions and class actions; |
| | • | | Information concerning the resources devoted to compliance efforts undertaken by the adviser and its affiliates and the sub-adviser of each fund, if any, including descriptions of their various compliance programs and their record of compliance; |
| | • | | Information concerning the business continuity and disaster recovery plans of the adviser and its affiliates and the sub-adviser of each fund, if any; |
| | • | | A description of Eaton Vance Management’s and Boston Management and Research’s oversight of sub-advisers, including with respect to regulatory and compliance issues, investment management and other matters; |
Other Relevant Information
| | • | | Information concerning the nature, cost and character of the administrative and other non-investment advisory services provided by Eaton Vance Management and its affiliates; |
| | • | | Information concerning oversight of the relationship with the custodian, subcustodians and fund accountants by the adviser and/or administrator to each of the funds; |
| | • | | For an Eaton Vance Fund structured as an exchange-listed closed-end fund, information concerning the benefits of the closed-end fund structure, as well as, where relevant, the closed-end fund’s market prices, trading volume data, distribution rates and other relevant matters; and |
| | • | | The terms of each investment advisory agreement and sub-advisory agreement. |
During the various meetings of the Board and its committees throughout the twelve months ended April 2020, the Trustees received information from portfolio managers and other investment professionals of the advisers and sub-advisers of the funds regarding investment and performance matters, and considered various investment and trading strategies used in pursuing the funds’ investment objectives. The Trustees
also received information regarding risk management techniques employed in connection with the management of the funds. The Board and its committees evaluated issues pertaining to industry and regulatory developments, compliance procedures, fund governance and other issues with respect to the funds, and received and participated in reports and presentations provided by Eaton Vance Management, Boston Management and Research and fund sub-advisers, with respect to such matters. In addition to the formal meetings of the Board and its committees, the Independent Trustees held regular teleconferences to discuss, among other topics, matters relating to the continuation of investment advisory agreements and sub-advisory agreements.
The Contract Review Committee was advised throughout the contract review process by Goodwin Procter LLP, independent legal counsel for the Independent Trustees. The members of the Contract Review Committee, with the advice of such counsel, exercised their own business judgment in determining the material factors to be considered in evaluating each investment advisory agreement and sub-advisory agreement and the weight to be given to each such factor. The conclusions reached with respect to each investment advisory agreement and sub-advisory agreement were based on a comprehensive evaluation of all the information provided and not any single factor. Moreover, each member of the Contract Review Committee may have placed varying emphasis on particular factors in reaching conclusions with respect to each investment advisory agreement and sub-advisory agreement. In evaluating each investment advisory agreement and sub-advisory agreement, including the fee structures and other terms contained in such agreements, the members of the Contract Review Committee were also informed by multiple years of analysis and discussion with the adviser and sub-adviser to each of the Eaton Vance Funds.
In voting its approval of the continuation of existing investment advisory agreements and sub-advisory agreements at the April 2020 Meeting, the Board relied on an order issued by the Securities and Exchange Commission on March 25, 2020, which provided temporary relief from the in-person voting requirements under Section 15 of the 1940 Act in response to the impacts of the COVID-19 pandemic.
Results of the Contract Review Process
Based on its consideration of the foregoing, and such other information it deemed relevant, including the factors and conclusions described below, the Contract Review Committee concluded that the continuation of the investment advisory agreement between Eaton Vance New York Municipal Opportunities Fund (the “Fund”) and Boston Management and Research (the “Adviser”), including its fee structure, is in the interests of shareholders and, therefore, recommended to the Board approval of the agreement. Based on the recommendation of the Contract Review Committee, the Board, including a majority of the Independent Trustees, voted to approve continuation of the investment advisory agreement for the Fund.
Nature, Extent and Quality of Services
In considering whether to approve the investment advisory agreement for the Fund, the Board evaluated the nature, extent and quality of services provided to the Fund by the Adviser.
The Board considered the Adviser’s management capabilities and investment processes in light of the types of investments held by the Fund, including the education, experience and number of investment professionals and other personnel who provide portfolio management, investment research, and similar services to the Fund. In particular, the Board considered, where relevant, the abilities and experience of the Adviser’s investment professionals in analyzing factors such as credit risk, tax efficiency, and special considerations relevant to investing in municipal obligations. The Board considered the Adviser’s municipal bond team, which includes investment professionals and credit specialists who provide services to the Fund. The Board also took into account the resources dedicated to portfolio management and other services, the compensation methods of the Adviser and other factors, including the reputation
Eaton Vance
New York Municipal Opportunities Fund
September 30, 2020
Board of Trustees’ Contract Approval — continued
and resources of the Adviser to recruit and retain highly qualified research, advisory and supervisory investment professionals. In addition, the Board considered the time and attention devoted to the Eaton Vance Funds, including the Fund, by senior management, as well as the infrastructure, operational capabilities and support staff in place to assist in the portfolio management and operations of the Fund, including the provision of administrative services. The Board also considered the business-related and other risks to which the Adviser or its affiliates may be subject in managing the Fund.
The Board considered the compliance programs of the Adviser and relevant affiliates thereof. The Board considered compliance and reporting matters regarding, among other things, personal trading by investment professionals, disclosure of portfolio holdings, late trading, frequent trading, portfolio valuation, business continuity and the allocation of investment opportunities. The Board also considered the responses of the Adviser and its affiliates to requests in recent years from regulatory authorities, such as the Securities and Exchange Commission and the Financial Industry Regulatory Authority.
The Board considered other administrative services provided or overseen by Eaton Vance Management and its affiliates, including transfer agency and accounting services. The Board evaluated the benefits to shareholders of investing in a fund that is a part of a large fund complex offering exposure to a variety of asset classes and investment disciplines, as well as the ability, in many cases, to exchange an investment among different funds without incurring additional sales charges.
After consideration of the foregoing factors, among others, the Board concluded that the nature, extent and quality of services provided by the Adviser, taken as a whole, are appropriate and consistent with the terms of the investment advisory agreement.
Fund Performance
The Board compared the Fund’s investment performance to that of comparable funds identified by an independent data provider (the peer group), as well as appropriate benchmark indices. The Board’s review included comparative performance data with respect to the Fund for the one-, three-, five- and ten-year periods ended September 30, 2019. In this regard, the Board noted that the performance of the Fund was higher than the median performance of the Fund’s peer group for the three-year period. The Board also noted that the performance of the Fund was lower than its primary and both secondary benchmark indexes for the three-year period. The Board concluded that the performance of the Fund was satisfactory.
Management Fees and Expenses
The Board considered contractual fee rates payable by the Fund for advisory and administrative services (referred to collectively as “management fees”). As part of its review, the Board considered the Fund’s management fees and total expense ratio for the one-year period ended September 30, 2019, as compared to those of comparable funds, before and after giving effect to any undertaking to waive fees or reimburse expenses. The Board also considered certain factors identified by management in response to inquiries from the Contract Review Committee regarding the Fund’s total expense ratio relative to comparable funds.
After considering the foregoing information, and in light of the nature, extent and quality of the services provided by the Adviser, the Board concluded that the management fees charged for advisory and related services are reasonable.
Profitability and “Fall-Out” Benefits
The Board considered the level of profits realized by the Adviser and relevant affiliates thereof in providing investment advisory and administrative services to the Fund and to all Eaton Vance Funds as a group. The Board considered the level of profits realized without regard to marketing support or other payments by the Adviser and its affiliates to third parties in respect of distribution or other services.
The Board concluded that, in light of the foregoing factors and the nature, extent and quality of the services rendered, the profits realized by the Adviser and its affiliates are deemed not to be excessive.
The Board also considered direct or indirect fall-out benefits received by the Adviser and its affiliates in connection with their respective relationships with the Fund, including the benefits of research services that may be available to the Adviser as a result of securities transactions effected for the Fund and other investment advisory clients.
Economies of Scale
In reviewing management fees and profitability, the Board also considered the extent to which the Adviser and its affiliates, on the one hand, and the Fund, on the other hand, can expect to realize benefits from economies of scale as the assets of the Fund increase. The Board acknowledged the difficulty in accurately measuring the benefits resulting from economies of scale, if any, with respect to the management of any specific fund or group of funds. The Board reviewed data summarizing the increases and decreases in the assets of the Fund and of all Eaton Vance Funds as a group over various time periods, and evaluated the extent to which the total expense ratio of the Fund and the profitability of the Adviser and its affiliates may have been affected by such increases or decreases. Based upon the foregoing, the Board concluded that the Fund currently shares in the benefits from economies of scale, if any, when they are realized by the Adviser. The Board also concluded that the structure of the advisory fee, which includes breakpoints at several asset levels, will allow the Fund to continue to benefit from any economies of scale in the future.
Eaton Vance
New York Municipal Opportunities Fund
September 30, 2020
Liquidity Risk Management Program
The Fund has implemented a written liquidity risk management program (Program) and related procedures to manage its liquidity in accordance with Rule 22e-4 under the Investment Company Act of 1940, as amended (Liquidity Rule). The Liquidity Rule defines “liquidity risk” as the risk that a fund could not meet requests to redeem shares issued by the fund without significant dilution of the remaining investors’ interests in the fund. The Fund’s Board of Trustees/Directors has designated the investment adviser to serve as the administrator of the Program and the related procedures. The administrator has established a Liquidity Risk Management Oversight Committee (Committee) to perform the functions necessary to administer the Program. As part of the Program, the administrator is responsible for identifying illiquid investments and categorizing the relative liquidity of the Fund’s investments in accordance with the Liquidity Rule. Under the Program, the administrator assesses, manages, and periodically reviews the Fund’s liquidity risk, and is responsible for making certain reports to the Fund’s Board of Trustees/Directors and the Securities and Exchange Commission (SEC) regarding the liquidity of the Fund’s investments, and to notify the Board of Trustees/Directors and the SEC of certain liquidity events specified in the Liquidity Rule. The liquidity of the Fund’s portfolio investments is determined based on a number of factors including, but not limited to, relevant market, trading and investment-specific considerations under the Program.
At a meeting of the Fund’s Board of Trustees/Directors, the Committee provided a written report to the Fund’s Board of Trustees/Directors pertaining to the operation, adequacy, and effectiveness of implementation of the Program, as well as the operation of the highly liquid investment minimum (if applicable) for the period December 1, 2018 through December 31, 2019 (Review Period). The Program operated effectively during the Review Period, supporting the administrator’s ability to assess, manage and monitor Fund liquidity risk, including during periods of market volatility and net redemptions. During the Review Period, the Fund met redemption requests on a timely basis.
There can be no assurance that the Program will achieve its objectives in the future. Please refer to the Fund’s prospectus for more information regarding the Fund’s exposure to liquidity risk and other principal risks to which an investment in the Fund may be subject.
Eaton Vance
New York Municipal Opportunities Fund
September 30, 2020
Officers and Trustees
Officers
Eric A. Stein
President
Maureen A. Gemma
Vice President, Secretary and Chief Legal Officer
James F. Kirchner
Treasurer
Richard F. Froio
Chief Compliance Officer
Trustees
William H. Park
Chairperson
Thomas E. Faust Jr.*
Mark R. Fetting
Cynthia E. Frost
George J. Gorman
Valerie A. Mosley
Helen Frame Peters
Keith Quinton
Marcus L. Smith
Susan J. Sutherland
Scott E. Wennerholm
Eaton Vance Funds
IMPORTANT NOTICES
Privacy. The Eaton Vance organization is committed to ensuring your financial privacy. Each entity listed below has adopted a privacy policy and procedures (“Privacy Program”) Eaton Vance believes is reasonably designed to protect your personal information and to govern when and with whom Eaton Vance may share your personal information.
| • | | At the time of opening an account, Eaton Vance generally requires you to provide us with certain information such as name, address, social security number, tax status, account numbers, and account balances. This information is necessary for us to both open an account for you and to allow us to satisfy legal requirements such as applicable anti-money laundering reviews and know-your-customer requirements. |
| • | | On an ongoing basis, in the normal course of servicing your account, Eaton Vance may share your information with unaffiliated third parties that perform various services for Eaton Vance and/or your account. These third parties include transfer agents, custodians, broker/dealers and our professional advisers, including auditors, accountants, and legal counsel. Eaton Vance may additionally share your personal information with our affiliates. |
| • | | We believe our Privacy Program is reasonably designed to protect the confidentiality of your personal information and to prevent unauthorized access to that information. |
| • | | We reserve the right to change our Privacy Program at any time upon proper notification to you. You may want to review our Privacy Program periodically for changes by accessing the link on our homepage: www.eatonvance.com. |
Our pledge of protecting your personal information applies to the following entities within the Eaton Vance organization: the Eaton Vance Family of Funds, Eaton Vance Management, Eaton Vance Investment Counsel, Eaton Vance Distributors, Inc., Eaton Vance Trust Company, Eaton Vance Management (International) Limited, Eaton Vance Advisers International Ltd., Eaton Vance Global Advisors Limited, Eaton Vance Management’s Real Estate Investment Group, Boston Management and Research, Calvert Research and Management, and Calvert Funds. This Privacy Notice supersedes all previously issued privacy disclosures. For more information about our Privacy Program or about how your personal information may be used, please call 1-800-262-1122.
Delivery of Shareholder Documents. The Securities and Exchange Commission (SEC) permits funds to deliver only one copy of shareholder documents, including prospectuses, proxy statements and shareholder reports, to fund investors with multiple accounts at the same residential or post office box address. This practice is often called “householding” and it helps eliminate duplicate mailings to shareholders. Eaton Vance, or your financial intermediary, may household the mailing of your documents indefinitely unless you instruct Eaton Vance, or your financial intermediary, otherwise. If you would prefer that your Eaton Vance documents not be householded, please contact Eaton Vance at 1-800-262-1122, or contact your financial intermediary. Your instructions that householding not apply to delivery of your Eaton Vance documents will typically be effective within 30 days of receipt by Eaton Vance or your financial intermediary.
Portfolio Holdings. Each Eaton Vance Fund and its underlying Portfolio(s) (if applicable) files a schedule of portfolio holdings on Part F to Form N-PORT with the SEC. Certain information filed on Form N-PORT may be viewed on the Eaton Vance website at www.eatonvance.com, by calling Eaton Vance at 1-800-262-1122 or in the EDGAR database on the SEC’s website at www.sec.gov.
Proxy Voting. From time to time, funds are required to vote proxies related to the securities held by the funds. The Eaton Vance Funds or their underlying Portfolios (if applicable) vote proxies according to a set of policies and procedures approved by the Funds’ and Portfolios’ Boards. You may obtain a description of these policies and procedures and information on how the Funds or Portfolios voted proxies relating to portfolio securities during the most recent 12-month period ended June 30, without charge, upon request, by calling 1-800-262-1122 and by accessing the SEC’s website at www.sec.gov.
Investment Adviser
Boston Management and Research
Two International Place
Boston, MA 02110
Administrator
Eaton Vance Management
Two International Place
Boston, MA 02110
Principal Underwriter*
Eaton Vance Distributors, Inc.
Two International Place
Boston, MA 02110
(617) 482-8260
Custodian
State Street Bank and Trust Company
State Street Financial Center, One Lincoln Street
Boston, MA 02111
Transfer Agent
BNY Mellon Investment Servicing (US) Inc.
Attn: Eaton Vance Funds
P.O. Box 9653
Providence, RI 02940-9653
(800) 262-1122
Fund Offices
Two International Place
Boston, MA 02110
| * | FINRA BrokerCheck. Investors may check the background of their Investment Professional by contacting the Financial Industry Regulatory Authority (FINRA). FINRA BrokerCheck is a free tool to help investors check the professional background of current and former FINRA-registered securities firms and brokers. FINRA BrokerCheck is available by calling 1-800-289-9999 and at www.FINRA.org. The FINRA BrokerCheck brochure describing this program is available to investors at www.FINRA.org. |

23359 9.30.20

Eaton Vance
Short Duration Municipal Opportunities Fund
Semiannual Report
September 30, 2020
Important Note. Beginning on January 1, 2021, as permitted by regulations adopted by the Securities and Exchange Commission, paper copies of the Fund’s annual and semi-annual shareholder reports will no longer be sent by mail unless you specifically request paper copies of the reports. Instead, the reports will be made available on the Fund’s website (eatonvance.com/funddocuments), and you will be notified by mail each time a report is posted and provided with a website address to access the report.
If you already elected to receive shareholder reports electronically, you will not be affected by this change and you need not take any action. If you are a direct investor, you may elect to receive shareholder reports and other communications from the Fund electronically by signing up for e-Delivery at eatonvance.com/edelivery. If you own your shares through a financial intermediary (such as a broker-dealer or bank), you must contact your financial intermediary to sign up.
You may elect to receive all future Fund shareholder reports in paper free of charge. If you are a direct investor, you can inform the Fund that you wish to continue receiving paper copies of your shareholder reports by calling 1-800-262-1122. If you own these shares through a financial intermediary, you must contact your financial intermediary or follow instructions included with this disclosure, if applicable, to elect to continue to receive paper copies of your shareholder reports. Your election to receive reports in paper will apply to all Eaton Vance funds held directly or to all funds held through your financial intermediary, as applicable.

Commodity Futures Trading Commission Registration. Effective December 31, 2012, the Commodity Futures Trading Commission (“CFTC”) adopted certain regulatory changes that subject registered investment companies and advisers to regulation by the CFTC if a fund invests more than a prescribed level of its assets in certain CFTC-regulated instruments (including futures, certain options and swap agreements) or markets itself as providing investment exposure to such instruments. The investment adviser has claimed an exclusion from the definition of “commodity pool operator” under the Commodity Exchange Act with respect to its management of the Fund. Accordingly, neither the Fund nor the adviser with respect to the operation of the Fund is subject to CFTC regulation. Because of its management of other strategies, the Fund’s adviser is registered with the CFTC as a commodity pool operator. The adviser is also registered as a commodity trading advisor.
Fund shares are not insured by the FDIC and are not deposits or other obligations of, or guaranteed by, any depository institution. Shares are subject to investment risks, including possible loss of principal invested.
This report must be preceded or accompanied by a current summary prospectus or prospectus. Before investing, investors should consider carefully the investment objective, risks, and charges and expenses of a mutual fund. This and other important information is contained in the summary prospectus and prospectus, which can be obtained from a financial intermediary. Prospective investors should read the prospectus carefully before investing. For further information, please call 1-800-262-1122.
Semiannual Report September 30, 2020
Eaton Vance
Short Duration Municipal Opportunities Fund
Eaton Vance
Short Duration Municipal Opportunities Fund
September 30, 2020
Performance1,2
Portfolio Manager Adam A. Weigold, CFA
| | | | | | | | | | | | | | | | | | | | | | | | |
| % Average Annual Total Returns | | Class
Inception Date | | | Performance
Inception Date | | | Six Months | | | One Year | | | Five Years | | | Ten Years | |
| | | | | | |
Class A at NAV | | | 06/27/1996 | | | | 06/01/1992 | | | | 3.15 | % | | | 1.20 | % | | | 2.56 | % | | | 2.45 | % |
Class A with 2.25% Maximum Sales Charge | | | — | | | | — | | | | 0.81 | | | | –1.04 | | | | 2.10 | | | | 2.21 | |
Class C at NAV | | | 12/08/1993 | | | | 06/01/1992 | | | | 2.76 | | | | 0.42 | | | | 1.77 | | | | 1.67 | |
Class C with 1% Maximum Sales Charge | | | — | | | | — | | | | 1.76 | | | | –0.58 | | | | 1.77 | | | | 1.67 | |
Class I at NAV | | | 08/03/2010 | | | | 06/01/1992 | | | | 3.33 | | | | 1.35 | | | | 2.73 | | | | 2.61 | |
|
| |
| | | | | | |
Bloomberg Barclays Short-Intermediate
1–10 Year Municipal Bond Index | | | — | | | | — | | | | 3.75 | % | | | 4.03 | % | | | 2.70 | % | | | 2.70 | % |
| | | | | | |
| % Total Annual Operating Expense Ratios3 | | | | | | | | | | | Class A | | | Class C | | | Class I | |
| | | | | | |
| | | | | | | | | | | | | | | 0.66 | % | | | 1.41 | % | | | 0.51 | % |
| | | | | | |
| % Distribution Rates/Yields4 | | | | | | | | | | | Class A | | | Class C | | | Class I | |
| | | | | | |
Distribution Rate | | | | | | | | | | | | | | | 1.51 | % | | | 0.77 | % | | | 1.65 | % |
Taxable-Equivalent Distribution Rate | | | | | | | | | | | | | | | 2.55 | | | | 1.30 | | | | 2.79 | |
SEC 30-day Yield | | | | | | | | | | | | | | | 1.13 | | | | 0.42 | | | | 1.31 | |
Taxable-Equivalent SEC 30-day Yield | | | | | | | | | | | | | | | 1.91 | | | | 0.70 | | | | 2.21 | |
Fund Profile
Credit Quality (% of total investments)5
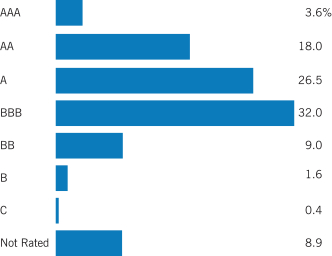
See Endnotes and Additional Disclosures in this report.
Past performance is no guarantee of future results. Returns are historical and are calculated by determining the percentage change in net asset value (NAV) or offering price (as applicable) with all distributions reinvested. Investment return and principal value will fluctuate so that shares, when redeemed, may be worth more or less than their original cost. Performance for periods less than or equal to one year is cumulative. Performance is for the stated time period only; due to market volatility, current Fund performance may be lower or higher than the quoted return. For performance as of the most recent month-end, please refer to eatonvance.com.
Eaton Vance
Short Duration Municipal Opportunities Fund
September 30, 2020
Endnotes and Additional Disclosures
| 1 | Bloomberg Barclays Short-Intermediate 1–10 Year Municipal Bond Index is an unmanaged index of municipal bonds traded in the U.S. with maturities ranging from 1–10 years. Unless otherwise stated, index returns do not reflect the effect of any applicable sales charges, commissions, expenses, taxes or leverage, as applicable. It is not possible to invest directly in an index. |
| 2 | Total Returns at NAV do not include applicable sales charges. If sales charges were deducted, the returns would be lower. Total Returns shown with maximum sales charge reflect the stated maximum sales charge. Unless otherwise stated, performance does not reflect the deduction of taxes on Fund distributions or redemptions of Fund shares. |
| | Performance prior to November 14, 2016 reflects the Fund’s performance under its former investment objective and policies. |
| 3 | Source: Fund prospectus. The expense ratios for the current reporting period can be found in the Financial Highlights section of this report. |
| 4 | The Distribution Rate is based on the Fund’s last regular distribution per share in the period (annualized) divided by the Fund’s NAV at the end of the period. The Fund’s distributions may be comprised of amounts characterized for federal income tax purposes as tax-exempt income, qualified and non-qualified ordinary dividends, capital gains and nondividend distributions, also known as return of capital. The Fund will determine the federal income tax character of distributions paid to a shareholder after the end of the calendar year. This is reported on the IRS form 1099- DIV and provided to the shareholder shortly after each year-end. The Fund’s distributions are determined by the investment adviser based on its current assessment of the Fund’s long-term return potential. As portfolio and market conditions change, the rate of distributions paid by the Fund could change. Taxable-equivalent performance is based on the highest combined federal and state income tax rates, where applicable. Lower tax rates would result in lower tax-equivalent performance. Actual tax rates will vary depending on your income, exemptions and deductions. Rates do not include local taxes. The SEC Yield is a standardized measure based on the estimated yield to maturity of a fund’s investments over a 30-day period and is based on the maximum offer price at the date specified. The SEC Yield is not based on the distributions made by the Fund, which may differ. |
| 5 | Ratings are based on Moody’s Investors Service, Inc. (“Moody’s”), S&P Global Ratings (“S&P”) or Fitch Ratings (“Fitch”), as applicable. If securities are rated differently by the ratings agencies, the highest rating is applied. Ratings, which are subject to change, apply to the creditworthiness of the issuers of the underlying securities and not to the Fund or its shares. Credit ratings measure the quality of a bond based on the issuer’s creditworthiness, with ratings ranging from AAA, being the highest, to D, being the lowest based on S&P’s measures. Ratings of BBB or higher by S&P or Fitch (Baa or higher by Moody’s) are considered to be investment-grade quality. Credit ratings are based largely on the ratings agency’s analysis at the time of rating. The rating assigned to any particular security is not necessarily a reflection of the issuer’s current financial condition and does not necessarily reflect its assessment of the volatility of a security’s market value or of the liquidity of an investment in the security. Holdings designated as “Not Rated” (if any) are not rated by the national ratings agencies stated above. |
| | Fund profile subject to change due to active management. |
Eaton Vance
Short Duration Municipal Opportunities Fund
September 30, 2020
Fund Expenses
Example: As a Fund shareholder, you incur two types of costs: (1) transaction costs, including sales charges (loads) on purchases and redemption fees (if applicable); and (2) ongoing costs, including management fees; distribution and/or service fees; and other Fund expenses. This Example is intended to help you understand your ongoing costs (in dollars) of Fund investing and to compare these costs with the ongoing costs of investing in other mutual funds. The Example is based on an investment of $1,000 invested at the beginning of the period and held for the entire period (April 1, 2020 – September 30, 2020).
Actual Expenses: The first section of the table below provides information about actual account values and actual expenses. You may use the information in this section, together with the amount you invested, to estimate the expenses that you paid over the period. Simply divide your account value by $1,000 (for example, an $8,600 account value divided by $1,000 = 8.6), then multiply the result by the number in the first section under the heading entitled “Expenses Paid During Period” to estimate the expenses you paid on your account during this period.
Hypothetical Example for Comparison Purposes: The second section of the table below provides information about hypothetical account values and hypothetical expenses based on the actual Fund expense ratio and an assumed rate of return of 5% per year (before expenses), which is not the actual Fund return. The hypothetical account values and expenses may not be used to estimate the actual ending account balance or expenses you paid for the period. You may use this information to compare the ongoing costs of investing in your Fund and other funds. To do so, compare this 5% hypothetical example with the 5% hypothetical examples that appear in the shareholder reports of the other funds.
Please note that the expenses shown in the table are meant to highlight your ongoing costs only and do not reflect any transactional costs, such as sales charges (loads) or redemption fees (if applicable). Therefore, the second section of the table is useful in comparing ongoing costs only, and will not help you determine the relative total costs of owning different funds. In addition, if these transactional costs were included, your costs would be higher.
| | | | | | | | | | | | | | | | |
| | | Beginning
Account Value
(4/1/20) | | | Ending
Account Value
(9/30/20) | | | Expenses Paid
During Period*
(4/1/20 – 9/30/20) | | | Annualized Expense
Ratio | |
| | | | |
Actual | | | | | | | | | | | | | | | | |
Class A | | $ | 1,000.00 | | | $ | 1,031.50 | | | $ | 3.31 | | | | 0.65 | % |
Class C | | $ | 1,000.00 | | | $ | 1,027.60 | | | $ | 7.12 | | | | 1.40 | % |
Class I | | $ | 1,000.00 | | | $ | 1,033.30 | | | $ | 2.55 | | | | 0.50 | % |
| | | | | |
Hypothetical | | | | | | | | | | | | | | | | |
(5% return per year before expenses) | | | | | | | | | | | | | | | | |
Class A | | $ | 1,000.00 | | | $ | 1,021.80 | | | $ | 3.29 | | | | 0.65 | % |
Class C | | $ | 1,000.00 | | | $ | 1,018.00 | | | $ | 7.08 | | | | 1.40 | % |
Class I | | $ | 1,000.00 | | | $ | 1,022.60 | | | $ | 2.54 | | | | 0.50 | % |
| * | Expenses are equal to the Fund’s annualized expense ratio for the indicated Class, multiplied by the average account value over the period, multiplied by 183/365 (to reflect the one-half year period). The Example assumes that the $1,000 was invested at the net asset value per share determined at the close of business on March 31, 2020. |
Eaton Vance
Short Duration Municipal Opportunities Fund
September 30, 2020
Portfolio of Investments (Unaudited)
| | | | | | | | |
| Tax-Exempt Municipal Securities — 88.2% | | | | | | | | |
| Security | | Principal Amount (000’s omitted) | | | Value | |
| | |
| Education — 4.1% | | | | | | |
| | |
Arizona Industrial Development Authority, (Academies of Math & Science), 4.00%, 7/1/29(1) | | $ | 380 | | | $ | 389,428 | |
| | |
Arizona Industrial Development Authority, (Pinecrest Academy of Nevada), 4.00%, 7/15/30(1) | | | 625 | | | | 647,831 | |
| | |
California Municipal Finance Authority, (California Lutheran University), 5.00%, 10/1/21 | | | 250 | | | | 258,705 | |
| | |
California Municipal Finance Authority, (California Lutheran University), 5.00%, 10/1/22 | | | 250 | | | | 267,050 | |
| | |
California Municipal Finance Authority, (California Lutheran University), 5.00%, 10/1/23 | | | 225 | | | | 247,327 | |
| | |
California Municipal Finance Authority, (California Lutheran University), 5.00%, 10/1/24 | | | 275 | | | | 310,211 | |
| | |
California School Finance Authority, (Green Dot Public Schools), 5.00%, 8/1/21(1) | | | 100 | | | | 102,733 | |
| | |
California School Finance Authority, (Green Dot Public Schools), 5.00%, 8/1/22(1) | | | 165 | | | | 175,232 | |
| | |
California School Finance Authority, (Green Dot Public Schools), 5.00%, 8/1/23(1) | | | 175 | | | | 192,616 | |
| | |
California School Finance Authority, (Green Dot Public Schools), 5.00%, 8/1/24(1) | | | 160 | | | | 181,118 | |
| | |
California School Finance Authority, (Green Dot Public Schools), 5.00%, 8/1/25(1) | | | 300 | | | | 348,510 | |
| | |
California School Finance Authority, (KIPP SoCal Public Schools), 5.00%, 7/1/22(1) | | | 100 | | | | 106,675 | |
| | |
California School Finance Authority, (KIPP SoCal Public Schools), 5.00%, 7/1/23(1) | | | 100 | | | | 110,324 | |
| | |
California School Finance Authority, (KIPP SoCal Public Schools), 5.00%, 7/1/24(1) | | | 135 | | | | 153,472 | |
| | |
California School Finance Authority, (KIPP SoCal Public Schools), 5.00%, 7/1/25(1) | | | 200 | | | | 233,562 | |
| | |
California School Finance Authority, (KIPP SoCal Public Schools), 5.00%, 7/1/26(1) | | | 105 | | | | 125,500 | |
| | |
California School Finance Authority, (KIPP SoCal Public Schools), 5.00%, 7/1/27(1) | | | 110 | | | | 134,005 | |
| | |
California School Finance Authority, (KIPP SoCal Public Schools), 5.00%, 7/1/28(1) | | | 160 | | | | 197,762 | |
| | |
California School Finance Authority, (KIPP SoCal Public Schools), 5.00%, 7/1/29(1) | | | 165 | | | | 206,776 | |
| | |
District of Columbia, (District of Columbia International School), 5.00%, 7/1/21 | | | 200 | | | | 204,618 | |
| | |
District of Columbia, (District of Columbia International School), 5.00%, 7/1/25 | | | 500 | | | | 569,800 | |
| | |
District of Columbia, (District of Columbia International School), 5.00%, 7/1/29 | | | 885 | | | | 1,064,690 | |
| | |
District of Columbia, (KIPP DC), 5.00%, 7/1/22 | | | 200 | | | | 212,202 | |
| | |
District of Columbia, (KIPP DC), 5.00%, 7/1/25 | | | 270 | | | | 314,496 | |
| | |
District of Columbia, (KIPP DC), 5.00%, 7/1/26 | | | 250 | | | | 296,990 | |
| | | | | | | | |
| Security | | Principal Amount (000’s omitted) | | | Value | |
| | |
| Education (continued) | | | | | | |
| | |
District of Columbia, (KIPP DC), 5.00%, 7/1/27 | | $ | 250 | | | $ | 301,890 | |
| | |
District of Columbia, (KIPP DC), 5.00%, 7/1/28 | | | 240 | | | | 294,108 | |
| | |
District of Columbia, (KIPP DC), 5.00%, 7/1/29 | | | 235 | | | | 292,140 | |
| | |
District of Columbia, (Rocketship DC Obligated Group), 5.00%, 6/1/29(1) | | | 465 | | | | 507,273 | |
| | |
Florida Higher Educational Facilities Financing Authority, (Ringling College of Art and Design), 5.00%, 3/1/26 | | | 275 | | | | 305,514 | |
| | |
Florida Higher Educational Facilities Financing Authority, (Ringling College of Art and Design), 5.00%, 3/1/27 | | | 210 | | | | 235,555 | |
| | |
Florida Higher Educational Facilities Financing Authority, (Ringling College of Art and Design), 5.00%, 3/1/28 | | | 230 | | | | 259,730 | |
| | |
Florida Higher Educational Facilities Financing Authority, (Ringling College of Art and Design), 5.00%, 3/1/29 | | | 225 | | | | 255,438 | |
| | |
Florida Higher Educational Facilities Financing Authority, (Ringling College of Art and Design), 5.00%, 3/1/31 | | | 865 | | | | 970,374 | |
| | |
Massachusetts Development Finance Agency, (Suffolk University), 5.00%, 7/1/23 | | | 425 | | | | 467,904 | |
| | |
Massachusetts Development Finance Agency, (Suffolk University), 5.00%, 7/1/24 | | | 350 | | | | 395,692 | |
| | |
Massachusetts Development Finance Agency, (Wentworth Institute of Technology), 5.00%, 10/1/21 | | | 355 | | | | 367,901 | |
| | |
Massachusetts Development Finance Agency, (Wentworth Institute of Technology), 5.00%, 10/1/22 | | | 600 | | | | 643,134 | |
| | |
Michigan Finance Authority, (Cesar Chavez Academy), 3.25%, 2/1/24 | | | 400 | | | | 401,368 | |
| | |
Michigan Finance Authority, (Cesar Chavez Academy), 4.00%, 2/1/29 | | | 700 | | | | 719,971 | |
| | |
Missouri Health and Educational Facilities Authority, (St. Louis College of Pharmacy), 5.00%, 5/1/40 | | | 1,410 | | | | 1,469,699 | |
| | |
Montana State University, 0.56%, (SIFMA + 0.45%), 9/1/23 (Put Date), 11/15/35(2) | | | 1,675 | | | | 1,673,358 | |
| | |
Montgomery County Higher Education and Health Authority, PA, (Gwynedd Mercy University), 4.00% to 5/1/22 (Put Date), 5/1/36 | | | 1,105 | | | | 1,130,338 | |
| | |
Montgomery County Higher Education and Health Authority, PA, (Gwynedd Mercy University), 4.00% to 5/1/23 (Put Date), 5/1/36 | | | 1,200 | | | | 1,243,776 | |
| | |
New York Dormitory Authority, (Yeshiva University), 4.00%, 9/1/23 | | | 1,235 | | | | 1,236,087 | |
| | |
Northeastern Pennsylvania Hospital and Education Authority, (Wilkes University), 5.00%, 3/1/25 | | | 1,000 | | | | 1,070,070 | |
| | |
Pennsylvania Higher Educational Facilities Authority, (York College of Pennsylvania), 2.85% to 5/1/21 (Put Date), 5/1/34 | | | 1,420 | | | | 1,434,583 | |
| | |
Philadelphia Industrial Development Authority, PA, (La Salle University), 5.00%, 5/1/23 | | | 1,840 | | | | 1,924,622 | |
| | |
Philadelphia Industrial Development Authority, PA, (La Salle University), 5.00%, 5/1/24 | | | 1,715 | | | | 1,817,420 | |
| | | | |
| | 5 | | See Notes to Financial Statements. |
Eaton Vance
Short Duration Municipal Opportunities Fund
September 30, 2020
Portfolio of Investments (Unaudited) — continued
| | | | | | | | |
| Security | | Principal Amount (000’s omitted) | | | Value | |
| | |
| Education (continued) | | | | | | |
| | |
Philadelphia Industrial Development Authority, PA, (La Salle University), 5.00%, 5/1/25 | | $ | 905 | | | $ | 969,092 | |
| | |
Public Finance Authority, WI, (North Carolina Leadership Academy), 4.00%, 6/15/29(1) | | | 320 | | | | 326,531 | |
| | |
Public Finance Authority, WI, (Roseman University of Health Sciences), 3.00%, 4/1/25(1) | | | 635 | | | | 630,511 | |
| | |
Public Finance Authority, WI, (Roseman University of Health Sciences), 5.00%, 4/1/30(1) | | | 750 | | | | 823,935 | |
| | |
Troy Capital Resource Corp., NY, (Rensselaer Polytechnic Institute), 5.00%, 9/1/27 | | | 1,000 | | | | 1,211,880 | |
| | |
Troy Capital Resource Corp., NY, (Rensselaer Polytechnic Institute), 5.00%, 9/1/28 | | | 1,000 | | | | 1,229,820 | |
| | |
University of Pittsburgh, PA, 0.47%, (SIFMA + 0.36%), 2/15/24(2) | | | 2,000 | | | | 2,002,220 | |
| | |
Wisconsin Health and Educational Facilities Authority, (Hmong American Peace Academy, Ltd.), 4.00%, 3/15/30 | | | 400 | | | | 443,780 | |
| | |
Yonkers Economic Development Corp., NY, (Lamartine/Warburton, LLC - Charter School of Educational Excellence), 4.00%, 10/15/29 | | | 330 | | | | 339,458 | |
| |
| | | | $ | 34,446,805 | |
| | |
| Electric Utilities — 2.3% | | | | | | |
| | |
Burke County Development Authority, GA, (Oglethorpe Power Corp.), 3.25% to 2/3/25 (Put Date), 11/1/45 | | $ | 4,000 | | | $ | 4,319,040 | |
| | |
Hawaii Department of Budget and Finance, (Hawaiian Electric Co.), 3.20%, 7/1/39 | | | 2,170 | | | | 2,215,961 | |
| | |
Hawaii Department of Budget and Finance, (Hawaiian Electric Co.), (AMT), 3.25%, 1/1/25 | | | 3,250 | | | | 3,446,852 | |
| | |
Long Island Power Authority, NY, Electric System Revenue, 0.859%, (70% of 1 mo. USD LIBOR + 0.75%), 10/1/23 (Put Date), 5/1/33(2) | | | 4,000 | | | | 3,998,920 | |
| | |
Louisville/Jefferson County Metro Government, KY, (Louisville Gas and Electric Co.), 1.75% to 7/1/26 (Put Date), 2/1/35 | | | 4,000 | | | | 4,117,640 | |
| | |
Vermont Public Power Supply Authority, (Swanton Peaking Facility), 5.00%, 7/1/22 | | | 385 | | | | 412,936 | |
| | |
Vermont Public Power Supply Authority, (Swanton Peaking Facility), 5.00%, 7/1/23 | | | 600 | | | | 667,638 | |
| | |
Vermont Public Power Supply Authority, (Swanton Peaking Facility), 5.00%, 7/1/24 | | | 500 | | | | 574,560 | |
| |
| | | | $ | 19,753,547 | |
| | |
| Escrowed / Prerefunded — 0.4% | | | | | | |
| | |
Delaware Health Facilities Authority, (Nanticoke Memorial Hospital, Inc.), Escrowed to Maturity, 5.00%, 7/1/23 | | $ | 655 | | | $ | 737,812 | |
| | |
Pennsylvania Higher Educational Facilities Authority, (Messiah College), Prerefunded to 11/1/21, 2.20%, 11/1/31 | | | 700 | | | | 713,125 | |
| | | | | | | | |
| Security | | Principal Amount (000’s omitted) | | | Value | |
| | |
| Escrowed / Prerefunded (continued) | | | | | | |
| | |
Pennsylvania Higher Educational Facilities Authority, (Messiah College), Prerefunded to 5/1/21, 2.72%, 11/1/31 | | $ | 1,845 | | | $ | 1,871,955 | |
| |
| | | | $ | 3,322,892 | |
| | |
| General Obligations — 9.6% | | | | | | |
| | |
American Samoa Economic Development Authority, 6.00%, 9/1/23(1) | | $ | 1,050 | | | $ | 1,126,073 | |
| | |
Bensalem Township School District, PA, 3.00%, 2/15/21 | | | 20 | | | | 20,203 | |
| | |
Berwyn, IL, 5.00%, 12/1/23 | | | 1,090 | | | | 1,179,118 | |
| | |
Champaign County Community Unit School District No. 4, IL, 0.00%, 1/1/26 | | | 400 | | | | 381,776 | |
| | |
Champaign County Community Unit School District No. 4, IL, 0.00%, 1/1/27 | | | 380 | | | | 355,585 | |
| | |
Champaign County Community Unit School District No. 4, IL, 0.00%, 1/1/28 | | | 565 | | | | 517,111 | |
| | |
Chicago Board of Education, IL, 0.00%, 12/1/25 | | | 500 | | | | 431,590 | |
| | |
Chicago Board of Education, IL, 4.00%, 12/1/20 | | | 250 | | | | 251,210 | |
| | |
Chicago Board of Education, IL, 4.00%, 12/1/22 | | | 700 | | | | 726,789 | |
| | |
Chicago Board of Education, IL, 5.00%, 12/1/20 | | | 945 | | | | 951,114 | |
| | |
Chicago Board of Education, IL, 5.00%, 12/1/22 | | | 1,200 | | | | 1,271,148 | |
| | |
Chicago Board of Education, IL, 5.00%, 12/1/23 | | | 2,000 | | | | 2,162,700 | |
| | |
Chicago Board of Education, IL, 5.00%, 12/1/24 | | | 2,000 | | | | 2,196,780 | |
| | |
Chicago, IL, 0.00%, 1/1/21 | | | 115 | | | | 114,173 | |
| | |
Chicago, IL, 0.00%, 1/1/24 | | | 225 | | | | 203,216 | |
| | |
Chicago, IL, 0.00%, 1/1/26 | | | 160 | | | | 134,190 | |
| | |
Chicago, IL, 5.00%, 12/1/22 | | | 1,000 | | | | 1,003,520 | |
| | |
Chicago, IL, 5.00%, 1/1/30 | | | 7,320 | | | | 7,943,957 | |
| | |
Chicago, IL, 5.625%, 1/1/29 | | | 1,000 | | | | 1,099,180 | |
| | |
Connecticut, 5.00%, 4/15/23 | | | 3,200 | | | | 3,581,888 | |
| | |
Connecticut, 1.01%, (SIFMA + 0.90%), 3/1/23(2) | | | 3,500 | | | | 3,530,905 | |
| | |
Delaware Valley Regional Finance Authority, PA, 0.864%, (67% of 1 mo. USD LIBOR + 0.76%), 9/1/24 (Put Date), 9/1/48(2) | | | 9,000 | | | | 8,988,930 | |
| | |
Detroit, MI, 5.00%, 4/1/21 | | | 1,000 | | | | 1,009,450 | |
| | |
Elmira, NY, 4.00%, 5/27/21 | | | 400 | | | | 400,496 | |
| | |
Elmira, NY, 5.00%, 5/15/26 | | | 115 | | | | 115,233 | |
| | |
Harford County, MD, 5.00%, 9/15/23 | | | 1,000 | | | | 1,143,320 | |
| | |
Illinois, 3.25%, 11/1/26 | | | 1,440 | | | | 1,418,861 | |
| | |
Illinois, 5.00%, 2/1/22 | | | 370 | | | | 383,450 | |
| | |
Illinois, 5.00%, 6/1/22 | | | 495 | | | | 516,597 | |
| | |
Illinois, 5.00%, 10/1/23 | | | 285 | | | | 302,123 | |
| | |
Illinois, 5.00%, 2/1/24 | | | 500 | | | | 532,285 | |
| | |
Illinois, 5.00%, 6/1/24 | | | 4,850 | | | | 5,184,844 | |
| | |
Illinois, 5.00%, 8/1/24 | | | 2,085 | | | | 2,160,414 | |
| | |
Illinois, 5.00%, 11/1/24 | | | 1,650 | | | | 1,758,817 | |
| | | | |
| | 6 | | See Notes to Financial Statements. |
Eaton Vance
Short Duration Municipal Opportunities Fund
September 30, 2020
Portfolio of Investments (Unaudited) — continued
| | | | | | | | |
| Security | | Principal Amount (000’s omitted) | | | Value | |
| | |
| General Obligations (continued) | | | | | | |
| | |
Illinois, 5.00%, 8/1/25 | | $ | 1,000 | | | $ | 1,034,830 | |
| | |
Illinois, 5.00%, 11/1/25 | | | 5,000 | | | | 5,377,500 | |
| | |
Illinois, Series of October 2000, 0.00%, 8/1/21 | | | 140 | | | | 136,781 | |
| | |
Illinois, Series of October 2002, 0.00%, 8/1/21 | | | 60 | | | | 58,621 | |
| | |
Johnson County, KS, 2.00%, 9/1/31 | | | 4,560 | | | | 4,935,470 | |
| | |
New Haven, CT, 5.00%, 8/1/21 | | | 1,000 | | | | 1,030,280 | |
| | |
New York, NY, 5.00% to 2/1/24 (Put Date), 8/1/38 | | | 5,000 | | | | 5,582,650 | |
| | |
Union City, NJ, 5.00%, 11/1/23 | | | 1,000 | | | | 1,108,770 | |
| | |
Washington, 5.00%, 6/1/27(3) | | | 1,500 | | | | 1,905,090 | |
| | |
West Hartford, CT, 5.00%, 7/1/21 | | | 2,195 | | | | 2,273,274 | |
| | |
West Hartford, CT, 5.00%, 7/1/22 | | | 710 | | | | 770,322 | |
| | |
West Hartford, CT, 5.00%, 7/1/23 | | | 500 | | | | 566,460 | |
| | |
Will and Cook Counties Community High School District No. 210, IL, 5.00%, 1/1/27 | | | 2,355 | | | | 2,510,736 | |
| |
| | | | $ | 80,387,830 | |
| | |
| Hospital — 16.3% | | | | | | |
| | |
Berks County Municipal Authority, PA, (Tower Health), 5.00% to 2/1/25 (Put Date), 2/1/40 | | $ | 4,000 | | | $ | 4,340,000 | |
| | |
Calcasieu Parish Memorial Hospital Service District, LA, (Lake Charles Memorial Hospital), 4.00%, 12/1/20 | | | 520 | | | | 521,357 | |
| | |
Calcasieu Parish Memorial Hospital Service District, LA, (Lake Charles Memorial Hospital), 4.00%, 12/1/21 | | | 775 | | | | 788,950 | |
| | |
Calcasieu Parish Memorial Hospital Service District, LA, (Lake Charles Memorial Hospital), 4.00%, 12/1/22 | | | 810 | | | | 835,839 | |
| | |
Calcasieu Parish Memorial Hospital Service District, LA, (Lake Charles Memorial Hospital), 4.00%, 12/1/23 | | | 1,135 | | | | 1,184,826 | |
| | |
Calcasieu Parish Memorial Hospital Service District, LA, (Lake Charles Memorial Hospital), 4.00%, 12/1/24 | | | 1,145 | | | | 1,207,517 | |
| | |
California Municipal Finance Authority, (NorthBay Healthcare Group), 5.00%, 11/1/23 | | | 450 | | | | 496,363 | |
| | |
California Public Finance Authority, (Henry Mayo Newhall Hospital), 5.00%, 10/15/22 | | | 150 | | | | 161,336 | |
| | |
California Public Finance Authority, (Henry Mayo Newhall Hospital), 5.00%, 10/15/23 | | | 175 | | | | 194,444 | |
| | |
California Statewide Communities Development Authority, (Loma Linda University Medical Center),
5.50%, 12/1/58(1) | | | 2,000 | | | | 2,239,600 | |
| | |
California Statewide Communities Development Authority, (Methodist Hospital of Southern California), 5.00%, 1/1/22 | | | 500 | | | | 525,105 | |
| | |
California Statewide Communities Development Authority, (Methodist Hospital of Southern California), 5.00%, 1/1/23 | | | 500 | | | | 544,705 | |
| | |
Charlotte-Mecklenburg Hospital Authority, NC, (Atrium Health), 0.71%, (SIFMA + 0.60%), 12/1/23 (Put Date), 1/15/48(2) | | | 3,000 | | | | 3,002,130 | |
| | | | | | | | |
| Security | | Principal Amount (000’s omitted) | | | Value | |
| | |
| Hospital (continued) | | | | | | |
| | |
Colorado Health Facilities Authority, (CommonSpirit Health), 5.00% to 8/1/25 (Put Date), 8/1/49 | | $ | 3,000 | | | $ | 3,487,080 | |
| | |
Colorado Health Facilities Authority, (Valley View Hospital Association), 2.80% to 5/15/23 (Put Date), 5/15/42 | | | 1,895 | | | | 1,979,214 | |
| | |
Connecticut Health and Educational Facilities Authority, (Griffin Hospital), 5.00%, 7/1/27(1) | | | 725 | | | | 854,238 | |
| | |
Connecticut Health and Educational Facilities Authority, (Griffin Hospital), 5.00%, 7/1/30(1) | | | 285 | | | | 332,661 | |
| | |
Connecticut Health and Educational Facilities Authority, (Griffin Hospital), 5.00%, 7/1/33(1) | | | 1,170 | | | | 1,327,108 | |
| | |
Conway, AR, (Conway Regional Medical Center), 5.00%, 8/1/21 | | | 250 | | | | 258,480 | |
| | |
Conway, AR, (Conway Regional Medical Center), 5.00%, 8/1/22 | | | 515 | | | | 553,440 | |
| | |
Conway, AR, (Conway Regional Medical Center), 5.00%, 8/1/25 | | | 385 | | | | 454,939 | |
| | |
Conway, AR, (Conway Regional Medical Center), 5.00%, 8/1/26 | | | 445 | | | | 538,325 | |
| | |
Crawford County Hospital Authority, PA, (Meadville Medical Center), 6.00%, 6/1/36 | | | 740 | | | | 821,185 | |
| | |
Cuyahoga County, OH, (The MetroHealth System), 5.00%, 2/15/23 | | | 1,000 | | | | 1,086,270 | |
| | |
Escambia County Health Facilities Authority, FL, (Baptist Health Care Corp. Obligated Group), 5.00%, 8/15/31 | | | 3,000 | | | | 3,742,920 | |
| | |
Escambia County Health Facilities Authority, FL, (Baptist Health Care Corp. Obligated Group), 5.00%, 8/15/32 | | | 3,015 | | | | 3,734,620 | |
| | |
Escambia County Health Facilities Authority, FL, (Baptist Health Care Corp. Obligated Group), 5.00%, 8/15/33 | | | 2,950 | | | | 3,633,485 | |
| | |
Escambia County Health Facilities Authority, FL, (Baptist Health Care Corp. Obligated Group), 5.00%, 8/15/34 | | | 1,150 | | | | 1,412,062 | |
| | |
Harris County Cultural Education Facilities Finance Corp., TX, (Memorial Hermann Health System), 0.53%, (SIFMA + 0.42%), 12/1/22 (Put Date), 12/1/49(2) | | | 3,000 | | | | 2,983,620 | |
| | |
Idaho Health Facilities Authority, (Madison Memorial Hospital), 5.00%, 9/1/21 | | | 1,630 | | | | 1,681,720 | |
| | |
Illinois Finance Authority, (Edward-Elmhurst Healthcare), 0.86%, (SIFMA + 0.75%), 7/1/23 (Put Date), 1/1/46(2) | | | 5,000 | | | | 5,002,950 | |
| | |
Illinois Finance Authority, (Presence Health Network), 5.00%, 2/15/23 | | | 1,000 | | | | 1,106,090 | |
| | |
Illinois Finance Authority, (Southern Illinois Healthcare Enterprises, Inc.), 5.00%, 3/1/23 | | | 250 | | | | 276,692 | |
| | |
Indiana Finance Authority, (Parkview Health), 0.66%, (SIFMA + 0.55%), 11/1/23 (Put Date), 11/1/39(2) | | | 7,755 | | | | 7,753,527 | |
| | |
Lexington County Health Services District, Inc., SC, (Lexington Medical Center), 5.00%, 11/1/21 | | | 50 | | | | 52,411 | |
| | |
Lexington County Health Services District, Inc., SC, (Lexington Medical Center), 5.00%, 11/1/23 | | | 500 | | | | 567,690 | |
| | |
Lexington County Health Services District, Inc., SC, (Lexington Medical Center), 5.00%, 11/1/25 | | | 80 | | | | 96,702 | |
| | | | |
| | 7 | | See Notes to Financial Statements. |
Eaton Vance
Short Duration Municipal Opportunities Fund
September 30, 2020
Portfolio of Investments (Unaudited) — continued
| | | | | | | | |
| Security | | Principal Amount (000’s omitted) | | | Value | |
| | |
| Hospital (continued) | | | | | | |
| | |
Maine Health and Higher Educational Facilities Authority, (Northern Light Eastern Maine Medical Center), 5.00%, 7/1/21 | | $ | 2,620 | | | $ | 2,707,403 | |
| | |
Maine Health and Higher Educational Facilities Authority, (Northern Light Eastern Maine Medical Center), 5.00%, 7/1/22 | | | 1,855 | | | | 1,999,004 | |
| | |
Maine Health and Higher Educational Facilities Authority, (Northern Light Eastern Maine Medical Center), 5.00%, 7/1/23 | | | 1,945 | | | | 2,180,656 | |
| | |
Maricopa County Industrial Development Authority, AZ, (Banner Health), 0.68%, (SIFMA + 0.57%), 10/18/24 (Put Date), 1/1/35(2) | | | 6,810 | | | | 6,749,800 | |
| | |
Massachusetts Development Finance Agency, (Lawrence General Hospital), 5.00%, 7/1/23 | | | 555 | | | | 558,519 | |
| | |
Massachusetts Development Finance Agency, (Milford Regional Medical Center), 5.00%, 7/15/21 | | | 185 | | | | 189,978 | |
| | |
Massachusetts Development Finance Agency, (Milford Regional Medical Center), 5.00%, 7/15/25(1) | | | 120 | | | | 136,043 | |
| | |
Massachusetts Development Finance Agency, (Milford Regional Medical Center), 5.00%, 7/15/26(1) | | | 150 | | | | 172,677 | |
| | |
Massachusetts Development Finance Agency, (Milford Regional Medical Center), 5.00%, 7/15/27(1) | | | 170 | | | | 197,735 | |
| | |
Massachusetts Development Finance Agency, (Milford Regional Medical Center), 5.00%, 7/15/28(1) | | | 175 | | | | 204,876 | |
| | |
Massachusetts Development Finance Agency, (Milford Regional Medical Center), 5.00%, 7/15/29(1) | | | 320 | | | | 376,810 | |
| | |
Massachusetts Development Finance Agency, (Milford Regional Medical Center), 5.00%, 7/15/30(1) | | | 350 | | | | 414,788 | |
| | |
Massachusetts Development Finance Agency, (Milford Regional Medical Center), 5.00%, 7/15/31(1) | | | 325 | | | | 382,743 | |
| | |
Massachusetts Development Finance Agency, (Milford Regional Medical Center), 5.00%, 7/15/32(1) | | | 420 | | | | 491,429 | |
| | |
Massachusetts Development Finance Agency, (Wellforce), 5.00%, 7/1/22 | | | 450 | | | | 480,523 | |
| | |
Massachusetts Development Finance Agency, (Wellforce), 5.00%, 7/1/23 | | | 725 | | | | 799,639 | |
| | |
Massachusetts Development Finance Agency, (Wellforce), 5.00%, 7/1/24 | | | 650 | | | | 738,172 | |
| | |
Michigan Finance Authority, (McLaren Health Care), 0.503%, (68% of 1 mo. USD LIBOR + 0.40%), 10/15/21 (Put Date), 10/15/30(2) | | | 890 | | | | 884,224 | |
| | |
Michigan Finance Authority, (Trinity Health Credit Group), 0.59%, (SIFMA + 0.48%), 2/1/22 (Put Date), 3/1/51(2) | | | 5,000 | | | | 4,999,450 | |
| | |
Montana Facility Finance Authority, (Billings Clinic Obligated Group), 0.66%, (SIFMA + 0.55%), 8/15/23 (Put Date), 8/15/37(2) | | | 2,735 | | | | 2,734,426 | |
| | |
Montgomery County Higher Education and Health Authority, PA, (Holy Redeemer Health System), 5.00%, 10/1/25 | | | 1,050 | | | | 1,168,828 | |
| | | | | | | | |
| Security | | Principal Amount (000’s omitted) | | | Value | |
| | |
| Hospital (continued) | | | | | | |
| | |
Montgomery County Higher Education and Health Authority, PA, (Holy Redeemer Health System), 5.00%, 10/1/26 | | $ | 1,010 | | | $ | 1,118,878 | |
| | |
Montgomery County Higher Education and Health Authority, PA, (Thomas Jefferson University), 5.00%, 9/1/23 | | | 1,000 | | | | 1,126,470 | |
| | |
New Jersey Health Care Facilities Financing Authority, (St. Joseph’s Healthcare System Obligated Group), 5.00%, 7/1/24 | | | 540 | | | | 608,602 | |
| | |
New Jersey Health Care Facilities Financing Authority, (St. Joseph’s Healthcare System Obligated Group), 5.00%, 7/1/26 | | | 800 | | | | 944,576 | |
| | |
New Jersey Health Care Facilities Financing Authority, (St. Joseph’s Healthcare System Obligated Group), 5.00%, 7/1/27 | | | 2,000 | | | | 2,354,200 | |
| | |
New Jersey Health Care Facilities Financing Authority, (St. Joseph’s Healthcare System Obligated Group), 5.00%, 7/1/29 | | | 300 | | | | 349,137 | |
| | |
New Jersey Health Care Facilities Financing Authority, (St. Joseph’s Healthcare System Obligated Group), 5.00%, 7/1/30 | | | 1,595 | | | | 1,848,063 | |
| | |
New York Dormitory Authority, (Catholic Health System Obligated Group), 5.00%, 7/1/26 | | | 400 | | | | 479,564 | |
| | |
New York Dormitory Authority, (Catholic Health System Obligated Group), 5.00%, 7/1/27 | | | 390 | | | | 477,348 | |
| | |
New York Dormitory Authority, (Catholic Health System Obligated Group), 5.00%, 7/1/28 | | | 455 | | | | 566,493 | |
| | |
New York Dormitory Authority, (Catholic Health System Obligated Group), 5.00%, 7/1/29 | | | 750 | | | | 948,892 | |
| | |
New York Dormitory Authority, (Montefiore Obligated Group), 5.00%, 8/1/24 | | | 1,300 | | | | 1,478,360 | |
| | |
New York Dormitory Authority, (Montefiore Obligated Group), 5.00%, 9/1/27 | | | 1,400 | | | | 1,702,736 | |
| | |
New York Dormitory Authority, (Montefiore Obligated Group), 5.00%, 9/1/28 | | | 1,500 | | | | 1,849,695 | |
| | |
New York Dormitory Authority, (Montefiore Obligated Group), 5.00%, 8/1/29 | | | 1,910 | | | | 2,342,214 | |
| | |
New York Dormitory Authority, (Montefiore Obligated Group), 5.00%, 9/1/29 | | | 1,400 | | | | 1,752,226 | |
| | |
New York Dormitory Authority, (Montefiore Obligated Group), 5.00%, 8/1/30 | | | 1,495 | | | | 1,816,709 | |
| | |
New York Dormitory Authority, (Montefiore Obligated Group), 5.00%, 8/1/31 | | | 3,195 | | | | 3,841,732 | |
| | |
Northampton County General Purpose Authority, PA, (St. Luke’s University Health Network), 1.149%, (70% of 1 mo. USD LIBOR + 1.04%), 8/15/24 (Put Date), 8/15/48(2) | | | 1,000 | | | | 996,780 | |
| | |
Oklahoma Development Finance Authority, (OU Medicine), 5.00%, 8/15/23 | | | 1,250 | | | | 1,374,150 | |
| | |
Oklahoma Development Finance Authority, (OU Medicine), 5.00%, 8/15/24 | | | 720 | | | | 813,874 | |
| | | | |
| | 8 | | See Notes to Financial Statements. |
Eaton Vance
Short Duration Municipal Opportunities Fund
September 30, 2020
Portfolio of Investments (Unaudited) — continued
| | | | | | | | |
| Security | | Principal Amount (000’s omitted) | | | Value | |
| | |
| Hospital (continued) | | | | | | |
| | |
Oklahoma Development Finance Authority, (OU Medicine), 5.00%, 8/15/25 | | $ | 400 | | | $ | 463,696 | |
| | |
Oregon Facilities Authority, (Samaritan Health Services), 5.00%, 10/1/24 | | | 200 | | | | 230,294 | |
| | |
Oregon Facilities Authority, (Samaritan Health Services), 5.00%, 10/1/25 | | | 225 | | | | 266,499 | |
| | |
Oregon Facilities Authority, (Samaritan Health Services), 5.00%, 10/1/26 | | | 150 | | | | 181,728 | |
| | |
Oregon Facilities Authority, (Samaritan Health Services), 5.00%, 10/1/27 | | | 125 | | | | 154,303 | |
| | |
Oregon Facilities Authority, (Samaritan Health Services), 5.00%, 10/1/28 | | | 150 | | | | 187,965 | |
| | |
Oroville, CA, (Oroville Hospital), 5.00%, 4/1/25 | | | 1,195 | | | | 1,296,886 | |
| | |
Oroville, CA, (Oroville Hospital), 5.00%, 4/1/28 | | | 1,395 | | | | 1,547,613 | |
| | |
Oroville, CA, (Oroville Hospital), 5.00%, 4/1/29 | | | 1,000 | | | | 1,113,420 | |
| | |
Oroville, CA, (Oroville Hospital), 5.00%, 4/1/30 | | | 1,000 | | | | 1,106,600 | |
| | |
Oroville, CA, (Oroville Hospital), 5.25%, 4/1/54 | | | 3,000 | | | | 3,195,510 | |
| | |
Roane County Building Commission, WV, (Roane General Hospital), 2.55%, 11/1/21 | | | 2,250 | | | | 2,253,015 | |
| | |
Southcentral Pennsylvania General Authority, (WellSpan Health Obligated Group), 0.71%, (SIFMA + 0.60%), 6/1/24 (Put Date), 6/1/49(2) | | | 7,500 | | | | 7,502,025 | |
| | |
Tallahassee, FL, (Tallahassee Memorial HealthCare, Inc.), 5.00%, 12/1/23 | | | 50 | | | | 55,772 | |
| |
| | | | $ | 136,693,349 | |
| | |
| Housing — 3.1% | | | | | | |
| | |
California Municipal Finance Authority, (CHF-Riverside II, LLC), 5.00%, 5/15/30 | | $ | 3,635 | | | $ | 4,539,533 | |
| | |
Maryland Economic Development Corp., (Bowie State University), Student Housing Revenue, 4.00%, 7/1/23 | | | 150 | | | | 155,126 | |
| | |
Maryland Economic Development Corp., (Bowie State University), Student Housing Revenue, 4.00%, 7/1/24 | | | 175 | | | | 182,606 | |
| | |
Maryland Economic Development Corp., (Bowie State University), Student Housing Revenue, 4.00%, 7/1/25 | | | 300 | | | | 314,934 | |
| | |
Maryland Economic Development Corp., (Bowie State University), Student Housing Revenue, 4.00%, 7/1/26 | | | 320 | | | | 337,286 | |
| | |
Maryland Economic Development Corp., (Bowie State University), Student Housing Revenue, 4.00%, 7/1/27 | | | 250 | | | | 264,063 | |
| | |
Maryland Economic Development Corp., (Bowie State University), Student Housing Revenue, 4.00%, 7/1/28 | | | 200 | | | | 211,740 | |
| | |
Maryland Economic Development Corp., (Bowie State University), Student Housing Revenue, 4.00%, 7/1/29 | | | 270 | | | | 286,143 | |
| | |
Maryland Economic Development Corp., (Bowie State University), Student Housing Revenue, 4.00%, 7/1/30 | | | 280 | | | | 295,042 | |
| | |
Maryland Economic Development Corp., (Bowie State University), Student Housing Revenue, 4.00%, 7/1/31 | | | 290 | | | | 303,694 | |
| | | | | | | | |
| Security | | Principal Amount (000’s omitted) | | | Value | |
| | |
| Housing (continued) | | | | | | |
| | |
Massachusetts Development Finance Agency, (UMass Boston Student Housing), 5.00%, 10/1/21 | | $ | 1,000 | | | $ | 1,004,050 | |
| | |
Massachusetts Development Finance Agency, (UMass Boston Student Housing), 5.00%, 10/1/22 | | | 500 | | | | 503,015 | |
| | |
Massachusetts Housing Finance Agency, (Mill Road Apartments), 0.66%, (SIFMA + 0.55%), 11/1/23 (Put Date), 11/1/48(2) | | | 2,650 | | | | 2,650,000 | |
| | |
New Hope Cultural Education Facilities Finance Corp., TX, (CHF-Collegiate Housing Galveston I, LLC), 5.00%, 4/1/22 | | | 835 | | | | 860,142 | |
| | |
New York City Housing Development Corp., NY, 2.10% to 10/1/29 (Put Date), 11/1/46 | | | 5,000 | | | | 5,332,450 | |
| | |
Phoenix Industrial Development Authority, AZ, (Downtown Phoenix Student Housing II, LLC - Arizona State University), 5.00%, 7/1/26 | | | 160 | | | | 175,178 | |
| | |
Phoenix Industrial Development Authority, AZ, (Downtown Phoenix Student Housing II, LLC - Arizona State University), 5.00%, 7/1/27 | | | 385 | | | | 424,770 | |
| | |
Phoenix Industrial Development Authority, AZ, (Downtown Phoenix Student Housing II, LLC - Arizona State University), 5.00%, 7/1/28 | | | 240 | | | | 266,294 | |
| | |
Phoenix Industrial Development Authority, AZ, (Downtown Phoenix Student Housing II, LLC - Arizona State University), 5.00%, 7/1/29 | | | 535 | | | | 596,274 | |
| | |
Phoenix Industrial Development Authority, AZ, (Downtown Phoenix Student Housing II, LLC - Arizona State University), 5.00%, 7/1/30 | | | 225 | | | | 249,158 | |
| | |
Phoenix Industrial Development Authority, AZ, (Downtown Phoenix Student Housing II, LLC - Arizona State University), 5.00%, 7/1/31 | | | 410 | | | | 451,430 | |
| | |
Phoenix Industrial Development Authority, AZ, (Downtown Phoenix Student Housing, LLC - Arizona State University), 5.00%, 7/1/23 | | | 20 | | | | 21,155 | |
| | |
Phoenix Industrial Development Authority, AZ, (Downtown Phoenix Student Housing, LLC - Arizona State University), 5.00%, 7/1/24 | | | 180 | | | | 193,455 | |
| | |
Phoenix Industrial Development Authority, AZ, (Downtown Phoenix Student Housing, LLC - Arizona State University), 5.00%, 7/1/25 | | | 850 | | | | 925,446 | |
| | |
Phoenix Industrial Development Authority, AZ, (Downtown Phoenix Student Housing, LLC - Arizona State University), 5.00%, 7/1/26 | | | 400 | | | | 440,152 | |
| | |
Phoenix Industrial Development Authority, AZ, (Downtown Phoenix Student Housing, LLC - Arizona State University), 5.00%, 7/1/27 | | | 250 | | | | 277,422 | |
| | |
Phoenix Industrial Development Authority, AZ, (Downtown Phoenix Student Housing, LLC - Arizona State University), 5.00%, 7/1/28 | | | 315 | | | | 351,786 | |
| | |
Phoenix Industrial Development Authority, AZ, (Downtown Phoenix Student Housing, LLC - Arizona State University), 5.00%, 7/1/29 | | | 300 | | | | 333,084 | |
| | | | |
| | 9 | | See Notes to Financial Statements. |
Eaton Vance
Short Duration Municipal Opportunities Fund
September 30, 2020
Portfolio of Investments (Unaudited) — continued
| | | | | | | | |
| Security | | Principal Amount (000’s omitted) | | | Value | |
| | |
| Housing (continued) | | | | | | |
| | |
Phoenix Industrial Development Authority, AZ, (Downtown Phoenix Student Housing, LLC - Arizona State University), 5.00%, 7/1/30 | | $ | 350 | | | $ | 386,337 | |
| | |
Public Finance Authority, WI, (NC A&T Real Estate Foundation, LLC), 4.00%, 6/1/21 | | | 115 | | | | 115,883 | |
| | |
Public Finance Authority, WI, (NC A&T Real Estate Foundation, LLC), 4.00%, 6/1/22 | | | 230 | | | | 234,839 | |
| | |
Public Finance Authority, WI, (NC A&T Real Estate Foundation, LLC), 5.00%, 6/1/23 | | | 390 | | | | 411,349 | |
| | |
Public Finance Authority, WI, (NC A&T Real Estate Foundation, LLC), 5.00%, 6/1/24 | | | 440 | | | | 470,985 | |
| | |
Public Finance Authority, WI, (NC A&T Real Estate Foundation, LLC), 5.00%, 6/1/25 | | | 980 | | | | 1,059,272 | |
| | |
Public Finance Authority, WI, (NC A&T Real Estate Foundation, LLC), 5.00%, 6/1/26 | | | 1,090 | | | | 1,188,939 | |
| |
| | | | $ | 25,813,032 | |
| | |
| Industrial Development Revenue — 10.8% | | | | | | |
| | |
Appling County Development Authority, GA, (Oglethorpe Power Corp.), 1.50% to 2/3/25 (Put Date), 1/1/38 | | $ | 1,500 | | | $ | 1,509,450 | |
| | |
Burke County Development Authority, GA, (Georgia Transmission Corp.), 2.50% to 5/3/21 (Put Date), 1/1/52 | | | 2,000 | | | | 2,021,240 | |
| | |
California Pollution Control Financing Authority, (Waste Management, Inc.), (AMT), 2.50% to 5/1/24 (Put Date), 7/1/31 | | | 1,625 | | | | 1,715,220 | |
| | |
Florida Development Finance Corp., (Waste Pro USA, Inc.), (AMT), 5.00%, 5/1/29(1) | | | 1,550 | | | | 1,656,500 | |
| | |
Florida Development Finance Corp., (Waste Pro USA, Inc.), (AMT), 5.00% to 8/1/22 (Put Date), 8/1/29(1) | | | 1,000 | | | | 1,024,720 | |
| | |
Gilliam County, OR, (Waste Management, Inc.), (AMT), 2.40% to 5/2/22 (Put Date), 7/1/38 | | | 2,375 | | | | 2,434,280 | |
| | |
Iowa Finance Authority, (Iowa Fertilizer Co.), 3.125%, 12/1/22 | | | 3,335 | | | | 3,382,090 | |
| | |
Maine Finance Authority, (Casella Waste Systems, Inc.), (AMT), 4.375% to 8/1/25 (Put Date), 8/1/35(1) | | | 875 | | | | 947,118 | |
| | |
Matagorda County Navigation District No. 1, TX, (Central Power and Light Co.), 2.60%, 11/1/29 | | | 1,000 | | | | 1,062,360 | |
| | |
Michigan Strategic Fund, (Waste Management, Inc.), (AMT), 2.85% to 8/2/21 (Put Date), 8/1/27 | | | 3,000 | | | | 3,056,250 | |
| | |
Mission Economic Development Corp., TX, (Waste Management, Inc.), (AMT), 0.91%, (SIFMA + 0.80%), 11/1/21 (Put Date), 11/1/48(2) | | | 5,000 | | | | 5,001,950 | |
| | |
Mississippi Business Finance Corp., (Waste Pro USA, Inc.), (AMT), 5.00% to 8/1/22 (Put Date), 2/1/36(1) | | | 1,500 | | | | 1,534,395 | |
| | |
National Finance Authority, NH, (Waste Management, Inc.), (AMT), 0.86%, (SIFMA + 0.75%), 10/1/21 (Put Date), 10/1/33(2) | | | 2,000 | | | | 2,000,320 | |
| | | | | | | | |
| Security | | Principal Amount (000’s omitted) | | | Value | |
| | |
| Industrial Development Revenue (continued) | | | | | | |
| | |
New Hampshire Business Finance Authority, (United Illuminating Co.), 2.80% to 10/2/23 (Put Date), 10/1/33 | | $ | 3,500 | | | $ | 3,663,170 | |
| | |
New Jersey Economic Development Authority, (New Jersey Natural Gas Co.), (AMT), 2.45% to 4/1/26 (Put Date), 4/1/59 | | | 2,500 | | | | 2,658,375 | |
| | |
New York State Environmental Facilities Corp., (Casella Waste Systems, Inc.), (AMT), 2.875% to 12/3/29 (Put Date), 12/1/44(1) | | | 710 | | | | 699,549 | |
| | |
New York Transportation Development Corp., (Delta Airlines, Inc. - LaGuardia Airport Terminals C&D Redevelopment), (AMT), 5.00%, 1/1/23 | | | 3,000 | | | | 3,129,900 | |
| | |
Niagara Area Development Corp., NY, (Covanta), 3.50%, 11/1/24(1) | | | 4,080 | | | | 4,142,995 | |
| | |
Ohio Air Quality Development Authority, (AMG Vanadium), (AMT), 5.00%, 7/1/49(1) | | | 5,000 | | | | 5,113,400 | |
| | |
Ohio Air Quality Development Authority, (Pratt Paper, LLC), (AMT), 3.75%, 1/15/28(1) | | | 1,225 | | | | 1,339,513 | |
| | |
Pennsylvania Economic Development Financing Authority, (Waste Management, Inc.), (AMT), 1.75% to 8/1/24 (Put Date), 8/1/38 | | | 5,000 | | | | 5,145,850 | |
| | |
Public Finance Authority, WI, (Waste Management, Inc.), (AMT), 2.00% to 6/1/21 (Put Date), 7/1/29 | | | 5,000 | | | | 5,046,650 | |
| | |
Public Finance Authority, WI, (Waste Management, Inc.), (AMT), 2.625%, 11/1/25 | | | 1,500 | | | | 1,585,260 | |
| | |
Richland County, SC, (International Paper Co.), (AMT), 3.875%, 4/1/23 | | | 1,520 | | | | 1,635,338 | |
| | |
Rockdale County Development Authority, GA, (Pratt Paper, LLC), (AMT), 4.00%, 1/1/38(1) | | | 2,000 | | | | 2,161,820 | |
| | |
Rockport, IN, (AEP Generating Co.), Series 1995A, 1.35% to 9/1/22 (Put Date), 7/1/25 | | | 2,000 | | | | 2,018,560 | |
| | |
Rockport, IN, (AEP Generating Co.), Series 1995B, 1.35% to 9/1/22 (Put Date), 7/1/25 | | | 2,250 | | | | 2,271,060 | |
| | |
Rockport, IN, (Indiana Michigan Power Co.), 3.05%, 6/1/25 | | | 1,600 | | | | 1,753,440 | |
| | |
St. John the Baptist Parish, LA, (Marathon Oil Corp.), 2.10% to 7/1/24 (Put Date), 6/1/37 | | | 10,250 | | | | 10,316,317 | |
| | |
Trimble County, KY, (Louisville Gas and Electric Co.), (AMT), 1.30% to 9/1/27 (Put Date), 9/1/44 | | | 4,250 | | | | 4,238,142 | |
| | |
Tuscaloosa County Industrial Development Authority, AL, (Hunt Refining Co.), 4.50%, 5/1/32(1) | | | 2,245 | | | | 2,418,741 | |
| | |
West Virginia Economic Development Authority, (Appalachian Power Co.), 2.55% to 4/1/24 (Put Date), 3/1/40 | | | 4,000 | | | | 4,211,200 | |
| |
| | | | $ | 90,895,173 | |
| | |
| Insured – Bond Bank — 0.0%(4) | | | | | | |
| | |
Puerto Rico Municipal Finance Agency, (AGC), 5.25%, 8/1/22 | | $ | 250 | | | $ | 265,358 | |
| |
| | | | $ | 265,358 | |
| | | | |
| | 10 | | See Notes to Financial Statements. |
Eaton Vance
Short Duration Municipal Opportunities Fund
September 30, 2020
Portfolio of Investments (Unaudited) — continued
| | | | | | | | |
| Security | | Principal Amount (000’s omitted) | | | Value | |
| | |
| Insured – Education — 0.7% | | | | | | |
| | |
Missouri Southern State University, (AGM), 5.00%, 10/1/24 | | $ | 110 | | | $ | 125,135 | |
| | |
Missouri Southern State University, (AGM), 5.00%, 10/1/25 | | | 125 | | | | 145,545 | |
| | |
Missouri Southern State University, (AGM), 5.00%, 10/1/27 | | | 205 | | | | 247,749 | |
| | |
Missouri Southern State University, (AGM), 5.00%, 10/1/28 | | | 200 | | | | 245,072 | |
| | |
Missouri Southern State University, (AGM), 5.00%, 10/1/31 | | | 290 | | | | 356,024 | |
| | |
Missouri Southern State University, (AGM), 5.00%, 10/1/32 | | | 155 | | | | 188,940 | |
| | |
Northern Illinois University, (BAM), 5.00%, 4/1/23 | | | 120 | | | | 131,641 | |
| | |
Northern Illinois University, (BAM), 5.00%, 4/1/24 | | | 500 | | | | 566,805 | |
| | |
Northern Illinois University, (BAM), 5.00%, 4/1/25 | | | 400 | | | | 466,140 | |
| | |
Northern Illinois University, (BAM), 5.00%, 4/1/26 | | | 650 | | | | 774,767 | |
| | |
Northern Illinois University, (BAM), 5.00%, 4/1/27 | | | 530 | | | | 644,740 | |
| | |
Northern Illinois University, (BAM), 5.00%, 4/1/28 | | | 625 | | | | 774,144 | |
| | |
Northern Illinois University, (BAM), 5.00%, 4/1/29 | | | 700 | | | | 880,873 | |
| | |
Southern Illinois University, (NPFG), 0.00%, 4/1/26 | | | 200 | | | | 173,112 | |
| |
| | | | $ | 5,720,687 | |
| | |
| Insured – Electric Utilities — 0.6% | | | | | | |
| | |
Puerto Rico Electric Power Authority, (AGM), 4.00%, 7/1/23 | | $ | 305 | | | $ | 305,338 | |
| | |
Puerto Rico Electric Power Authority, (NPFG), 5.25%, 7/1/21 | | | 450 | | | | 454,504 | |
| | |
Puerto Rico Electric Power Authority, (NPFG), 5.25%, 7/1/29 | | | 1,740 | | | | 1,798,273 | |
| | |
Puerto Rico Electric Power Authority, Series QQ, (NPFG), 5.00%, 7/1/22 | | | 100 | | | | 100,488 | |
| | |
Puerto Rico Electric Power Authority, Series RR, (NPFG), 5.00%, 7/1/23 | | | 170 | | | | 171,112 | |
| | |
Puerto Rico Electric Power Authority, Series RR, (NPFG), 5.00%, 7/1/24 | | | 845 | | | | 851,929 | |
| | |
Puerto Rico Electric Power Authority, Series SS, (NPFG), 5.00%, 7/1/23 | | | 1,140 | | | | 1,147,456 | |
| |
| | | | $ | 4,829,100 | |
| | |
| Insured – General Obligations — 3.2% | | | | | | |
| | |
Boston, MA, (NPFG), 0.125%, 3/1/22 | | $ | 2,920 | | | $ | 2,920,058 | |
| | |
Cambria County, PA, (AGM), 4.00%, 8/1/32 | | | 500 | | | | 570,845 | |
| | |
Chicago Board of Education, IL, (AGM), 5.00%, 12/1/23 | | | 100 | | | | 112,106 | |
| | |
Chicago Board of Education, IL, (NPFG), 0.00%, 12/1/20 | | | 1,000 | | | | 996,990 | |
| | |
Chicago Board of Education, IL, (NPFG), 0.00%, 12/1/21 | | | 1,125 | | | | 1,099,856 | |
| | |
Chicago Board of Education, IL, (NPFG), 0.00%, 12/1/22 | | | 470 | | | | 449,560 | |
| | |
Chicago Board of Education, IL, (NPFG), 0.00%, 12/1/23 | | | 2,245 | | | | 2,095,101 | |
| | |
Chicago Board of Education, IL, (NPFG), 0.00%, 12/1/26 | | | 1,870 | | | | 1,583,423 | |
| | |
Chicago Board of Education, IL, (NPFG), 5.25%, 12/1/21 | | | 570 | | | | 598,842 | |
| | |
Chicago Board of Education, IL, Series 1998B, (NPFG), 0.00%, 12/1/24 | | | 365 | | | | 331,070 | |
| | |
Chicago Board of Education, IL, Series 1999A, (NPFG), 0.00%, 12/1/24 | | | 260 | | | | 235,830 | |
| | |
Chicago, IL, (AGM), 0.00%, 1/1/25 | | | 250 | | | | 229,418 | |
| | | | | | | | |
| Security | | Principal Amount (000’s omitted) | | | Value | |
| | |
| Insured – General Obligations (continued) | | | | | | |
| | |
Chicago, IL, (NPFG), 0.00%, 1/1/23 | | $ | 175 | | | $ | 166,096 | |
| | |
Community College District No. 536, IL, (Lewis and Clark Community College), (AGM), 4.00%, 5/1/29 | | | 500 | | | | 578,855 | |
| | |
Lake County Community Unit School District No. 187, IL, (AGM), 0.00%, 1/1/23 | | | 150 | | | | 145,281 | |
| | |
Matteson, IL, (AGM), 3.60%, 12/1/24 | | | 395 | | | | 405,238 | |
| | |
McCook, IL, (AGM), 4.00%, 12/1/20 | | | 50 | | | | 50,265 | |
| | |
McCook, IL, (AGM), 4.00%, 12/1/21 | | | 135 | | | | 140,057 | |
| | |
McCook, IL, (AGM), 4.00%, 12/1/22 | | | 225 | | | | 241,544 | |
| | |
McCook, IL, (AGM), 4.00%, 12/1/23 | | | 250 | | | | 276,550 | |
| | |
McHenry and Kane Counties Community Consolidated School District No. 158, IL, (NPFG), 0.00%, 1/1/21 | | | 1,090 | | | | 1,087,689 | |
| | |
Paterson, NJ, (BAM), 5.00%, 1/15/26 | | | 485 | | | | 528,752 | |
| | |
Puerto Rico, (AGC), 5.00%, 7/1/24 | | | 125 | | | | 127,048 | |
| | |
Puerto Rico, (AGM), 4.00%, 7/1/22 | | | 3,610 | | | | 3,744,978 | |
| | |
Puerto Rico, (NPFG), 5.25%, 7/1/22 | | | 135 | | | | 135,686 | |
| | |
Puerto Rico, (NPFG), 6.00%, 7/1/27 | | | 575 | | | | 589,973 | |
| | |
Puerto Rico Public Buildings Authority, (NPFG), 6.00%, 7/1/28 | | | 2,680 | | | | 2,749,787 | |
| | |
Stickney, IL, (BAM), 4.00%, 12/1/22 | | | 200 | | | | 213,454 | |
| | |
Stickney, IL, (BAM), 4.00%, 12/1/23 | | | 350 | | | | 383,236 | |
| | |
Vauxmont Metropolitan District, CO, (AGM), 5.00%, 12/1/22 | | | 495 | | | | 539,669 | |
| | |
Vauxmont Metropolitan District, CO, (AGM), 5.00%, 12/1/25 | | | 540 | | | | 649,652 | |
| | |
Vauxmont Metropolitan District, CO, (AGM), 5.00%, 12/1/28 | | | 630 | | | | 808,933 | |
| | |
Will County Community High School District No. 210, IL, (AGM), 0.00%, 1/1/21 | | | 1,770 | | | | 1,765,628 | |
| | |
Will County Community High School District No. 210, IL, (AGM), 0.00%, 1/1/25 | | | 130 | | | | 122,971 | |
| |
| | | | $ | 26,674,441 | |
| | |
| Insured – Hospital — 0.1% | | | | | | |
| | |
Kentucky Economic Development Finance Authority, (Norton Healthcare, Inc.), (NPFG), 0.00%, 10/1/22 | | $ | 720 | | | $ | 697,010 | |
| |
| | | | $ | 697,010 | |
|
| Insured – Lease Revenue / Certificates of Participation — 1.2% | |
| | |
Kentucky Asset/Liability Commission, (NPFG), 0.698%, (67% of 3 mo. USD LIBOR + 0.53%), 11/1/27(2) | | $ | 1,545 | | | $ | 1,521,887 | |
| | |
Kentucky Asset/Liability Commission, (NPFG), 0.718%, (67% of 3 mo. USD LIBOR + 0.55%), 11/1/25(2) | | | 8,890 | | | | 8,770,340 | |
| |
| | | | $ | 10,292,227 | |
| | | | |
| | 11 | | See Notes to Financial Statements. |
Eaton Vance
Short Duration Municipal Opportunities Fund
September 30, 2020
Portfolio of Investments (Unaudited) — continued
| | | | | | | | |
| Security | | Principal Amount (000’s omitted) | | | Value | |
| | |
| Insured – Other Revenue — 0.4% | | | | | | |
| | |
Arborwood Community Development District, FL, (AGM), 2.60%, 5/1/24 | | $ | 1,180 | | | $ | 1,258,258 | |
| | |
New York City Industrial Development Agency, NY, (Yankee Stadium), (AGM), 5.00%, 3/1/30(3) | | | 1,500 | | | | 1,942,125 | |
| |
| | | | $ | 3,200,383 | |
| | |
| Insured – Special Tax Revenue — 0.4% | | | | | | |
| | |
Puerto Rico Convention Center District Authority, (AMBAC), 5.00%, 7/1/31 | | $ | 1,960 | | | $ | 1,960,803 | |
| | |
Puerto Rico Infrastructure Financing Authority, (AMBAC), 0.00%, 7/1/43 | | | 520 | | | | 184,522 | |
| | |
Puerto Rico Infrastructure Financing Authority, (AMBAC), 5.50%, 7/1/24 | | | 410 | | | | 441,894 | |
| | |
Puerto Rico Infrastructure Financing Authority, (AMBAC), 5.50%, 7/1/25 | | | 460 | | | | 501,106 | |
| |
| | | | $ | 3,088,325 | |
| | |
| Insured – Transportation — 0.9% | | | | | | |
| | |
Alabama Port Authority, (AGM), (AMT), 5.00%, 10/1/23 | | $ | 2,075 | | | $ | 2,348,714 | |
| | |
New Jersey Transportation Trust Fund Authority, (NPFG), 5.50%, 12/15/22 | | | 3,000 | | | | 3,271,260 | |
| | |
Puerto Rico Highway and Transportation Authority, (AMBAC), 5.50%, 7/1/29 | | | 315 | | | | 344,654 | |
| | |
Puerto Rico Highway and Transportation Authority, (NPFG), 5.00%, 7/1/29 | | | 955 | | | | 962,067 | |
| | |
Puerto Rico Highway and Transportation Authority, (NPFG), 5.25%, 7/1/23 | | | 365 | | | | 374,154 | |
| |
| | | | $ | 7,300,849 | |
|
| Lease Revenue / Certificates of Participation — 0.8% | |
| | |
Commonwealth Financing Authority, PA, Tobacco Master Settlement Payment Revenue, 5.00%, 6/1/25 | | $ | 2,000 | | | $ | 2,399,700 | |
| | |
New Jersey Economic Development Authority, (School Facilities Construction), 1.66%, (SIFMA + 1.55%), 9/1/27(2) | | | 1,000 | | | | 988,490 | |
| | |
New Jersey Economic Development Authority, (School Facilities Construction), 1.71%, (SIFMA + 1.60%), 3/1/28(2) | | | 3,080 | | | | 3,048,954 | |
| |
| | | | $ | 6,437,144 | |
| | |
| Other Revenue — 10.2% | | | | | | |
| | |
Albany Parking Authority, NY, 5.00%, 7/15/21 | | $ | 635 | | | $ | 657,593 | |
| | |
Albany Parking Authority, NY, 5.00%, 7/15/22 | | | 705 | | | | 737,592 | |
| | |
Allentown Neighborhood Improvement Zone Development Authority, PA, (City Center Project), 5.00%, 5/1/23(1) | | | 570 | | | | 601,145 | |
| | | | | | | | |
| Security | | Principal Amount (000’s omitted) | | | Value | |
| | |
| Other Revenue (continued) | | | | | | |
| | |
Allentown Neighborhood Improvement Zone Development Authority, PA, (City Center Project), 5.00%, 5/1/32(1) | | $ | 3,000 | | | $ | 3,196,980 | |
| | |
Austin Convention Enterprises, Inc., TX, (Convention Center Hotel), 5.00%, 1/1/23 | | | 500 | | | | 518,270 | |
| | |
Austin Convention Enterprises, Inc., TX, (Convention Center Hotel), 5.00%, 1/1/24 | | | 600 | | | | 622,122 | |
| | |
Austin Convention Enterprises, Inc., TX, (Convention Center Hotel), 5.00%, 1/1/25 | | | 500 | | | | 517,285 | |
| | |
Black Belt Energy Gas District, AL, 4.00% to 12/1/23 (Put Date), 12/1/48 | | | 1,000 | | | | 1,094,060 | |
| | |
Black Belt Energy Gas District, AL, 1.004%, (67% of 1 mo. USD LIBOR + 0.90%), 12/1/23 (Put Date), 12/1/48(2) | | | 20,000 | | | | 19,940,600 | |
| | |
Black Belt Energy Gas District, AL, 0.48%, (SIFMA + 0.37%), 10/1/26 (Put Date), 10/1/49(2) | | | 15,000 | | | | 14,743,200 | |
| | |
Kalispel Tribe of Indians, WA, Series A, 5.00%, 1/1/32(1) | | | 795 | | | | 895,083 | |
| | |
Main Street Natural Gas, Inc., GA, Gas Supply Revenue, 0.854%, (67% of 1 mo. USD LIBOR + 0.75%), 9/1/23 (Put Date), 4/1/48(2) | | | 2,500 | | | | 2,497,925 | |
| | |
Main Street Natural Gas, Inc., GA, Gas Supply Revenue, (Liq: Royal Bank of Canada), 0.68%, (SIFMA + 0.57%), 12/1/23 (Put Date), 8/1/48(2) | | | 3,000 | | | | 3,008,490 | |
| | |
Main Street Natural Gas, Inc., GA, Gas Supply Revenue, (Liq: Royal Bank of Canada), 0.934%, (67% of 1 mo. USD LIBOR + 0.83%), 12/1/23 (Put Date), 8/1/48(2) | | | 16,000 | | | | 16,015,200 | |
| | |
Northern California Gas Authority No. 1, Gas Project Revenue, 0.918%, (67% of 3 mo. USD LIBOR + 0.72%), 7/1/27(2) | | | 960 | | | | 950,698 | |
| | |
Salt Verde Financial Corp., AZ, Senior Gas Revenue, 5.25%, 12/1/27 | | | 7,000 | | | | 8,795,500 | |
| | |
Southeast Alabama Gas Supply District, (Project No. 1), 0.76%, (SIFMA + 0.65%), 4/1/24 (Put Date), 4/1/49(2) | | | 2,000 | | | | 2,003,640 | |
| | |
Southeast Alabama Gas Supply District, (Project No. 2), 0.954%, (67% of 1 mo. USD LIBOR + 0.85%), 6/1/24 (Put Date), 6/1/49(2) | | | 2,000 | | | | 1,994,580 | |
| | |
Texas Municipal Gas Acquisition and Supply Corp. I, Gas Supply Revenue, 0.868%, (67% of 3 mo. USD LIBOR + 0.70%), 12/15/26(2) | | | 3,330 | | | | 3,306,290 | |
| | |
Washington Health Care Facilities Authority, (Fred Hutchinson Cancer Research Center), 1.201%, (67% of 1 mo. USD LIBOR + 1.10%), 7/1/22 (Put Date), 1/1/42(2) | | | 3,250 | | | | 3,270,150 | |
| |
| | | | $ | 85,366,403 | |
| | |
| Senior Living / Life Care — 9.8% | | | | | | |
| | |
Atlantic Beach, FL, (Fleet Landing), 3.25%, 11/15/24 | | $ | 2,155 | | | $ | 2,157,478 | |
| | |
Berks County Industrial Development Authority, PA, (Highlands at Wyomissing), 5.00%, 5/15/28 | | | 300 | | | | 330,099 | |
| | |
Bexar County Health Facilities Development Corp., TX, (Army Retirement Residence Foundation), 5.00%, 7/15/22 | | | 225 | | | | 234,036 | |
| | | | |
| | 12 | | See Notes to Financial Statements. |
Eaton Vance
Short Duration Municipal Opportunities Fund
September 30, 2020
Portfolio of Investments (Unaudited) — continued
| | | | | | | | |
| Security | | Principal Amount (000’s omitted) | | | Value | |
| | |
| Senior Living / Life Care (continued) | | | | | | |
| | |
Bexar County Health Facilities Development Corp., TX, (Army Retirement Residence Foundation), 5.00%, 7/15/23 | | $ | 375 | | | $ | 397,571 | |
| | |
Bexar County Health Facilities Development Corp., TX, (Army Retirement Residence Foundation), 5.00%, 7/15/24 | | | 300 | | | | 323,316 | |
| | |
Bexar County Health Facilities Development Corp., TX, (Army Retirement Residence Foundation), 5.00%, 7/15/25 | | | 250 | | | | 273,292 | |
| | |
Brookhaven Local Development Corp., NY, (Jefferson’s Ferry), 5.25%, 11/1/26 | | | 240 | | | | 275,117 | |
| | |
Bucks County Industrial Development Authority, PA, (Pennswood Village), 5.00%, 10/1/24 | | | 800 | | | | 876,592 | |
| | |
Centerville, OH, (Graceworks Lutheran Services), 5.00%, 11/1/20 | | | 290 | | | | 290,386 | |
| | |
Centerville, OH, (Graceworks Lutheran Services), 5.00%, 11/1/21 | | | 315 | | | | 320,497 | |
| | |
Centerville, OH, (Graceworks Lutheran Services), 5.00%, 11/1/22 | | | 430 | | | | 443,519 | |
| | |
Clackamas County Hospital Facility Authority, OR, (Rose Villa), 2.75%, 11/15/25 | | | 1,000 | | | | 1,009,030 | |
| | |
Colorado Health Facilities Authority, (Christian Living Neighborhoods), 4.00%, 1/1/22 | | | 300 | | | | 300,711 | |
| | |
Colorado Health Facilities Authority, (Christian Living Neighborhoods), 4.00%, 1/1/24 | | | 540 | | | | 567,437 | |
| | |
Colorado Health Facilities Authority, (Christian Living Neighborhoods), 4.00%, 1/1/27 | | | 200 | | | | 214,250 | |
| | |
Colorado Health Facilities Authority, (Christian Living Neighborhoods), 4.00%, 1/1/28 | | | 240 | | | | 257,225 | |
| | |
Colorado Health Facilities Authority, (Christian Living Neighborhoods), Series 2016, 4.00%, 1/1/21 | | | 300 | | | | 300,186 | |
| | |
Colorado Health Facilities Authority, (Christian Living Neighborhoods), Series 2019, 4.00%, 1/1/21 | | | 700 | | | | 702,016 | |
| | |
Colorado Health Facilities Authority, (Frasier Meadows Retirement Community), 5.00%, 5/15/21 | | | 1,135 | | | | 1,151,673 | |
| | |
Colorado Health Facilities Authority, (Frasier Meadows Retirement Community), 5.00%, 5/15/22 | | | 850 | | | | 881,297 | |
| | |
District of Columbia, (Ingleside at Rock Creek), 3.875%, 7/1/24 | | | 2,030 | | | | 2,020,459 | |
| | |
Franklin County Industrial Development Authority, PA, (Menno-Haven, Inc.), 5.00%, 12/1/21 | | | 250 | | | | 257,405 | |
| | |
Franklin County Industrial Development Authority, PA, (Menno-Haven, Inc.), 5.00%, 12/1/22 | | | 250 | | | | 263,550 | |
| | |
Franklin County Industrial Development Authority, PA, (Menno-Haven, Inc.), 5.00%, 12/1/23 | | | 355 | | | | 382,367 | |
| | |
Franklin County Industrial Development Authority, PA, (Menno-Haven, Inc.), 5.00%, 12/1/24 | | | 425 | | | | 465,983 | |
| | |
Franklin County Industrial Development Authority, PA, (Menno-Haven, Inc.), 5.00%, 12/1/30 | | | 500 | | | | 552,985 | |
| | |
Glendale Industrial Development Authority, AZ, (Terraces of Phoenix), 3.60%, 7/1/23 | | | 465 | | | | 467,046 | |
| | | | | | | | |
| Security | | Principal Amount (000’s omitted) | | | Value | |
| | |
| Senior Living / Life Care (continued) | | | | | | |
| | |
Hanover County Economic Development Authority, VA, (Covenant Woods), 3.625%, 7/1/28 | | $ | 655 | | | $ | 632,809 | |
| | |
Illinois Finance Authority, (Lifespace Communities, Inc.), 5.00%, 5/15/21 | | | 860 | | | | 874,500 | |
| | |
Illinois Finance Authority, (Lifespace Communities, Inc.), 5.00%, 5/15/22 | | | 415 | | | | 432,633 | |
| | |
Iowa Finance Authority, (Lifespace Communities, Inc.), 2.875%, 5/15/49 | | | 1,750 | | | | 1,757,805 | |
| | |
Lancaster County Hospital Authority, PA, (Brethren Village), 5.00%, 7/1/22 | | | 920 | | | | 946,450 | |
| | |
Lancaster County Hospital Authority, PA, (Moravian Manors, Inc.), 2.875%, 12/15/23 | | | 1,925 | | | | 1,897,395 | |
| | |
Massachusetts Development Finance Agency, (Linden Ponds, Inc.), 4.00%, 11/15/23(1) | | | 2,055 | | | | 2,079,393 | |
| | |
Massachusetts Development Finance Agency, (NewBridge on the Charles, Inc.), 3.50%, 10/1/22(1) | | | 500 | | | | 508,995 | |
| | |
Massachusetts Development Finance Agency, (NewBridge on the Charles, Inc.), 4.00%, 10/1/25(1) | | | 515 | | | | 544,123 | |
| | |
Massachusetts Development Finance Agency, (NewBridge on the Charles, Inc.), 4.00%, 10/1/26(1) | | | 1,000 | | | | 1,061,280 | |
| | |
Massachusetts Development Finance Agency, (NewBridge on the Charles, Inc.), 4.00%, 10/1/27(1) | | | 400 | | | | 426,116 | |
| | |
Missouri Health and Educational Facilities Authority, (Lutheran Senior Services), 2.875% to 2/1/22 (Put Date), 2/1/34 | | | 2,000 | | | | 1,997,760 | |
| | |
Montgomery County Industrial Development Authority, PA, (Waverly Heights, Ltd.), 4.00%, 12/1/21 | | | 100 | | | | 102,346 | |
| | |
Montgomery County Industrial Development Authority, PA, (Waverly Heights, Ltd.), 4.00%, 12/1/22 | | | 100 | | | | 104,148 | |
| | |
Montgomery County Industrial Development Authority, PA, (Waverly Heights, Ltd.), 4.00%, 12/1/23 | | | 125 | | | | 132,270 | |
| | |
Montgomery County Industrial Development Authority, PA, (Waverly Heights, Ltd.), 4.00%, 12/1/24 | | | 150 | | | | 160,808 | |
| | |
Montgomery County Industrial Development Authority, PA, (Waverly Heights, Ltd.), 4.00%, 12/1/25 | | | 100 | | | | 108,535 | |
| | |
Montgomery County Industrial Development Authority, PA, (Waverly Heights, Ltd.), 4.00%, 12/1/26 | | | 150 | | | | 164,211 | |
| | |
Montgomery County Industrial Development Authority, PA, (Waverly Heights, Ltd.), 4.00%, 12/1/27 | | | 200 | | | | 220,546 | |
| | |
Montgomery County Industrial Development Authority, PA, (Waverly Heights, Ltd.), 4.00%, 12/1/28 | | | 200 | | | | 219,928 | |
| | |
Montgomery County Industrial Development Authority, PA, (Waverly Heights, Ltd.), 4.00%, 12/1/29 | | | 250 | | | | 274,007 | |
| | |
Montgomery County Industrial Development Authority, PA, (Whitemarsh Continuing Care Retirement Community), 4.00%, 1/1/23 | | | 1,060 | | | | 1,068,226 | |
| | |
National Finance Authority, NH, (The Vista), 5.25%, 7/1/39(1) | | | 705 | | | | 716,604 | |
| | |
National Finance Authority, NH, (The Vista), 5.625%, 7/1/46(1) | | | 425 | | | | 436,632 | |
| | | | |
| | 13 | | See Notes to Financial Statements. |
Eaton Vance
Short Duration Municipal Opportunities Fund
September 30, 2020
Portfolio of Investments (Unaudited) — continued
| | | | | | | | |
| Security | | Principal Amount (000’s omitted) | | | Value | |
| | |
| Senior Living / Life Care (continued) | | | | | | |
| | |
National Finance Authority, NH, (The Vista), 5.75%, 7/1/54(1) | | $ | 1,130 | | | $ | 1,164,036 | |
| | |
New Hope Cultural Education Facilities Finance Corp., TX, (Longhorn Village), 5.00%, 1/1/21 | | | 540 | | | | 543,332 | |
| | |
New Hope Cultural Education Facilities Finance Corp., TX, (Longhorn Village), 5.00%, 1/1/23 | | | 1,795 | | | | 1,888,376 | |
| | |
New Hope Cultural Education Facilities Finance Corp., TX, (Longhorn Village), 5.00%, 1/1/30 | | | 630 | | | | 686,045 | |
| | |
New Mexico Hospital Equipment Loan Council, (Haverland Carter Lifestyle Group), 2.25%, 7/1/23 | | | 1,525 | | | | 1,485,579 | |
| | |
New Mexico Hospital Equipment Loan Council, (Haverland Carter Lifestyle Group), 2.375%, 7/1/24 | | | 1,525 | | | | 1,474,050 | |
| | |
New Mexico Hospital Equipment Loan Council, (Haverland Carter Lifestyle Group), 5.00%, 7/1/30 | | | 400 | | | | 432,076 | |
| | |
New Mexico Hospital Equipment Loan Council, (Haverland Carter Lifestyle Group), 5.00%, 7/1/31 | | | 670 | | | | 720,471 | |
| | |
New Mexico Hospital Equipment Loan Council, (Haverland Carter Lifestyle Group), 5.00%, 7/1/32 | | | 1,500 | | | | 1,527,525 | |
| | |
Norfolk Redevelopment and Housing Authority, VA, (Fort Norfolk Retirement Community, Inc. - Harbor’s Edge), 4.00%, 1/1/25 | | | 1,705 | | | | 1,705,222 | |
| | |
North Carolina Medical Care Commission, (Galloway Ridge), 4.00%, 1/1/25 | | | 250 | | | | 256,273 | |
| | |
North Carolina Medical Care Commission, (Galloway Ridge), 4.00%, 1/1/26 | | | 240 | | | | 246,391 | |
| | |
North Carolina Medical Care Commission, (Galloway Ridge), 5.00%, 1/1/27 | | | 565 | | | | 611,827 | |
| | |
North Carolina Medical Care Commission, (United Methodist Retirement Homes), 5.00%, 10/1/31 | | | 650 | | | | 701,499 | |
| | |
Palm Beach County Health Facilities Authority, FL, (Lifespace Communities, Inc.), 5.00%, 5/15/21 | | | 830 | | | | 843,994 | |
| | |
Palm Beach County Health Facilities Authority, FL, (Lifespace Communities, Inc.), 5.00%, 5/15/26 | | | 1,000 | | | | 1,102,430 | |
| | |
Polk County Industrial Development Authority, FL, (Carpenter’s Home Estates, Inc.), 5.00%, 1/1/29 | | | 440 | | | | 486,270 | |
| | |
Public Finance Authority, WI, (Penick Village), 4.00%, 9/1/29(1) | | | 585 | | | | 575,505 | |
| | |
Rockville, MD, (Ingleside at King Farm), 3.50%, 11/1/26 | | | 525 | | | | 514,831 | |
| | |
Salem Hospital Facility Authority, OR, (Capital Manor), 5.00%, 5/15/23 | | | 210 | | | | 223,831 | |
| | |
Santa Fe, NM, (El Castillo Retirement Residences), 2.25%, 5/15/24 | | | 600 | | | | 583,260 | |
| | |
Santa Fe, NM, (El Castillo Retirement Residences), 2.625%, 5/15/25 | | | 1,000 | | | | 977,570 | |
| | |
South Carolina Jobs-Economic Development Authority, (South Carolina Episcopal Home at Still Hopes), 5.00%, 4/1/22 | | | 500 | | | | 516,390 | |
| | |
South Carolina Jobs-Economic Development Authority, (South Carolina Episcopal Home at Still Hopes), 5.00%, 4/1/23 | | | 1,365 | | | | 1,436,267 | |
| | | | | | | | |
| Security | | Principal Amount (000’s omitted) | | | Value | |
| | |
| Senior Living / Life Care (continued) | | | | | | |
| | |
South Carolina Jobs-Economic Development Authority, (South Carolina Episcopal Home at Still Hopes), 5.00%, 4/1/24 | | $ | 1,450 | | | $ | 1,551,572 | |
| | |
South Carolina Jobs-Economic Development Authority, (South Carolina Episcopal Home at Still Hopes), 5.00%, 4/1/25 | | | 1,510 | | | | 1,639,482 | |
| | |
South Carolina Jobs-Economic Development Authority, (South Carolina Episcopal Home at Still Hopes), 5.00%, 4/1/26 | | | 1,595 | | | | 1,744,404 | |
| | |
South Carolina Jobs-Economic Development Authority, (Woodlands at Furman), 4.00%, 11/15/24 | | | 200 | | | | 202,342 | |
| | |
South Carolina Jobs-Economic Development Authority, (Woodlands at Furman), 4.00%, 11/15/25 | | | 275 | | | | 278,294 | |
| | |
South Carolina Jobs-Economic Development Authority, (Woodlands at Furman), 5.00%, 11/15/27 | | | 300 | | | | 321,678 | |
| | |
South Carolina Jobs-Economic Development Authority, (Woodlands at Furman), 5.00%, 11/15/29 | | | 115 | | | | 124,808 | |
| | |
South Carolina Jobs-Economic Development Authority, (Woodlands at Furman), 5.00%, 11/15/30 | | | 180 | | | | 195,633 | |
| | |
St. Johns County Industrial Development Authority, FL, (Westminster St. Augustine), Prerefunded to 8/1/22, 4.125% to 8/1/24 (Put Date), 8/1/47 | | | 1,100 | | | | 1,187,472 | |
| | |
St. Louis County Industrial Development Authority, MO, (Friendship Village St. Louis Obligated Group), 5.00%, 9/1/23 | | | 2,015 | | | | 2,124,294 | |
| | |
St. Louis County Industrial Development Authority, MO, (Friendship Village St. Louis Obligated Group), 5.00%, 9/1/24 | | | 1,490 | | | | 1,594,687 | |
| | |
St. Louis County Industrial Development Authority, MO, (Friendship Village St. Louis Obligated Group), 5.00%, 9/1/25 | | | 1,615 | | | | 1,749,223 | |
| | |
Suffolk County Economic Development Corp., NY, (Peconic Landing at Southold, Inc.), 4.00%, 12/1/21(3) | | | 310 | | | | 315,013 | |
| | |
Suffolk County Economic Development Corp., NY, (Peconic Landing at Southold, Inc.), 4.00%, 12/1/23(3) | | | 235 | | | | 244,962 | |
| | |
Suffolk County Economic Development Corp., NY, (Peconic Landing at Southold, Inc.), 4.00%, 12/1/24(3) | | | 245 | | | | 257,867 | |
| | |
Suffolk County Economic Development Corp., NY, (Peconic Landing at Southold, Inc.), 4.00%, 12/1/25(3) | | | 250 | | | | 265,205 | |
| | |
Tarrant County Cultural Education Facilities Finance Corp., TX, (MRC Stevenson Oaks), 6.25%, 11/15/31 | | | 620 | | | | 647,410 | |
| | |
Tempe Industrial Development Authority, AZ, (Mirabella at ASU), 4.00%, 10/1/23(1) | | | 2,000 | | | | 1,996,080 | |
| | |
Tulsa County Industrial Authority, OK, (Montereau, Inc.), 5.00%, 11/15/23 | | | 230 | | | | 242,680 | |
| | |
Vermont Economic Development Authority, (Wake Robin Corp.), 4.00%, 5/1/21 | | | 215 | | | | 215,436 | |
| | |
Vermont Economic Development Authority, (Wake Robin Corp.), 5.00%, 5/1/27 | | | 1,000 | | | | 1,054,370 | |
| | | | |
| | 14 | | See Notes to Financial Statements. |
Eaton Vance
Short Duration Municipal Opportunities Fund
September 30, 2020
Portfolio of Investments (Unaudited) — continued
| | | | | | | | |
| Security | | Principal Amount (000’s omitted) | | | Value | |
| | |
| Senior Living / Life Care (continued) | | | | | | |
| | |
Washington County, MD, (Diakon Lutheran Social Ministries), 5.00%, 1/1/21 | | $ | 340 | | | $ | 342,268 | |
| | |
Washington County, MD, (Diakon Lutheran Social Ministries), 5.00%, 1/1/23 | | | 365 | | | | 385,710 | |
| | |
Washington County, MD, (Diakon Lutheran Social Ministries), 5.00%, 1/1/24 | | | 350 | | | | 377,454 | |
| | |
Washington Housing Finance Commission, (Horizon House), 5.00%, 1/1/25(1) | | | 1,165 | | | | 1,279,158 | |
| | |
Washington Housing Finance Commission, (Judson Park), 3.70%, 7/1/23(1) | | | 285 | | | | 289,489 | |
| | |
Washington Housing Finance Commission, (Transforming Age), 2.375%, 1/1/26(1) | | | 4,000 | | | | 3,864,240 | |
| | |
Washington Housing Finance Commission, (Transforming Age), 5.00%, 1/1/24(1) | | | 180 | | | | 191,718 | |
| | |
Washington Housing Finance Commission, (Transforming Age), 5.00%, 1/1/25(1) | | | 385 | | | | 416,474 | |
| | |
Washington Housing Finance Commission, (Transforming Age), 5.00%, 1/1/26(1) | | | 400 | | | | 436,932 | |
| | |
Washington Housing Finance Commission, (Wesley Homes at Lea Hill),
3.20%, 7/1/21(1) | | | 120 | | | | 119,820 | |
| | |
Wayzata, MN, (Folkestone Senior Living Community), 3.00%, 8/1/22 | | | 200 | | | | 199,324 | |
| | |
Wayzata, MN, (Folkestone Senior Living Community), 3.00%, 8/1/23 | | | 100 | | | | 99,193 | |
| | |
Wayzata, MN, (Folkestone Senior Living Community), 3.00%, 8/1/24 | | | 100 | | | | 98,962 | |
| | |
Wayzata, MN, (Folkestone Senior Living Community), 3.00%, 8/1/25 | | | 100 | | | | 98,492 | |
| | |
Wayzata, MN, (Folkestone Senior Living Community), 3.00%, 8/1/26 | | | 250 | | | | 244,875 | |
| | |
Wayzata, MN, (Folkestone Senior Living Community), 3.00%, 8/1/27 | | | 425 | | | | 411,923 | |
| | |
Wayzata, MN, (Folkestone Senior Living Community), 3.125%, 8/1/28 | | | 650 | | | | 633,847 | |
| | |
Westchester County Local Development Corp., NY, (Kendal on Hudson), 4.00%, 1/1/23 | | | 150 | | | | 153,011 | |
| | |
Wisconsin Health and Educational Facilities Authority, (Saint John’s Communities, Inc.), 4.00%, 9/15/22 | | | 200 | | | | 205,758 | |
| | |
Wisconsin Health and Educational Facilities Authority, (Saint John’s Communities, Inc.), 4.00%, 9/15/24 | | | 365 | | | | 379,220 | |
| | |
Wisconsin Health and Educational Facilities Authority, (Saint John’s Communities, Inc.), Series 2015B, 4.00%, 9/15/23 | | | 100 | | | | 102,763 | |
| | |
Wisconsin Health and Educational Facilities Authority, (Saint John’s Communities, Inc.), Series 2018A, 4.00%, 9/15/23 | | | 250 | | | | 260,318 | |
| |
| | | | $ | 81,829,954 | |
| | | | | | | | |
| Security | | Principal Amount (000’s omitted) | | | Value | |
| | |
| Special Tax Revenue — 1.7% | | | | | | |
| | |
Baltimore, MD, (Harbor Point), 2.65%, 6/1/22(1) | | $ | 200 | | | $ | 199,448 | |
| | |
Baltimore, MD, (Harbor Point), 2.70%, 6/1/23(1) | | | 285 | | | | 283,615 | |
| | |
Baltimore, MD, (Harbor Point), 2.80%, 6/1/25(1) | | | 125 | | | | 123,863 | |
| | |
Baltimore, MD, (Harbor Point), 2.85%, 6/1/26(1) | | | 135 | | | | 133,740 | |
| | |
Baltimore, MD, (Harbor Point), 2.95%, 6/1/27(1) | | | 175 | | | | 173,114 | |
| | |
Franklin County Convention Facilities Authority, OH, (Greater Columbus Convention Center Hotel Expansion), 5.00%, 12/1/25 | | | 250 | | | | 257,082 | |
| | |
Franklin County Convention Facilities Authority, OH, (Greater Columbus Convention Center Hotel Expansion), 5.00%, 12/1/26 | | | 330 | | | | 339,006 | |
| | |
Franklin County Convention Facilities Authority, OH, (Greater Columbus Convention Center Hotel Expansion), 5.00%, 12/1/27 | | | 325 | | | | 333,336 | |
| | |
Franklin County Convention Facilities Authority, OH, (Greater Columbus Convention Center Hotel Expansion), 5.00%, 12/1/28 | | | 425 | | | | 432,131 | |
| | |
Franklin County Convention Facilities Authority, OH, (Greater Columbus Convention Center Hotel Expansion), 5.00%, 12/1/29 | | | 400 | | | | 402,080 | |
| | |
Franklin County Convention Facilities Authority, OH, (Greater Columbus Convention Center Hotel Expansion), 5.00%, 12/1/30 | | | 680 | | | | 680,326 | |
| | |
Franklin County Convention Facilities Authority, OH, (Greater Columbus Convention Center Hotel Expansion), 5.00%, 12/1/31 | | | 785 | | | | 778,116 | |
| | |
Franklin County Convention Facilities Authority, OH, (Greater Columbus Convention Center Hotel Expansion), 5.00%, 12/1/32 | | | 660 | | | | 653,770 | |
| | |
Illinois Sports Facilities Authority, 5.00%, 6/15/22 | | | 315 | | | | 329,651 | |
| | |
Illinois Sports Facilities Authority, 5.00%, 6/15/23 | | | 250 | | | | 267,990 | |
| | |
Illinois, Sales Tax Revenue, 5.00%, 6/15/21 | | | 140 | | | | 143,389 | |
| | |
Illinois, Sales Tax Revenue, 5.00%, 6/15/22 | | | 945 | | | | 998,326 | |
| | |
Illinois, Sales Tax Revenue, 5.00%, 6/15/23 | | | 925 | | | | 1,002,561 | |
| | |
Ohio County Commission, WV, (Fort Henry Economic Opportunity Development District - The Highlands), 4.00%, 3/1/28 | | | 225 | | | | 222,608 | |
| | |
Sales Tax Securitization Corp., IL, 5.00%, 1/1/23 | | | 650 | | | | 704,028 | |
| | |
Sales Tax Securitization Corp., IL, 5.00%, 1/1/30 | | | 2,000 | | | | 2,501,320 | |
| | |
Sales Tax Securitization Corp., IL, Series 2018C, 5.00%, 1/1/29 | | | 1,525 | | | | 1,887,386 | |
| | |
Sales Tax Securitization Corp., IL, Series 2020A, 5.00%, 1/1/29 | | | 500 | | | | 618,815 | |
| | |
Sparks, NV, (Legends at Sparks Marina), 2.50%, 6/15/24(1) | | | 1,125 | | | | 1,119,060 | |
| |
| | | | $ | 14,584,761 | |
| | | | |
| | 15 | | See Notes to Financial Statements. |
Eaton Vance
Short Duration Municipal Opportunities Fund
September 30, 2020
Portfolio of Investments (Unaudited) — continued
| | | | | | | | |
| Security | | Principal Amount (000’s omitted) | | | Value | |
| | |
| Student Loan — 2.2% | | | | | | |
| | |
Connecticut Higher Education Supplement Loan Authority, (AMT), 5.00%, 11/15/20 | | $ | 550 | | | $ | 552,426 | |
| | |
Connecticut Higher Education Supplement Loan Authority, (AMT), 5.00%, 11/15/22 | | | 750 | | | | 804,638 | |
| | |
Massachusetts Educational Financing Authority, (AMT), 3.50%, 7/1/33 | | | 5,380 | | | | 5,454,405 | |
| | |
Massachusetts Educational Financing Authority, (AMT), 5.00%, 7/1/21 | | | 3,900 | | | | 4,015,479 | |
| | |
Massachusetts Educational Financing Authority, (AMT), 5.00%, 7/1/23 | | | 1,000 | | | | 1,101,230 | |
| | |
New Jersey Higher Education Student Assistance Authority, (AMT), 5.00%, 12/1/23 | | | 4,475 | | | | 4,976,826 | |
| | |
Rhode Island Student Loan Authority, Series 2017, (AMT), 5.00%, 12/1/23 | | | 600 | | | | 659,052 | |
| | |
Rhode Island Student Loan Authority, Series 2018, (AMT), 5.00%, 12/1/23 | | | 1,250 | | | | 1,373,025 | |
| |
| | | | $ | 18,937,081 | |
| | |
| Transportation — 9.3% | | | | | | |
| | |
Chicago, IL, (O’Hare International Airport), 5.00%, 1/1/30(3) | | $ | 5,000 | | | $ | 6,511,050 | |
| | |
Chicago, IL, (O’Hare International Airport), 5.00%, 1/1/31(3) | | | 5,440 | | | | 7,016,784 | |
| | |
Denver City and County, CO, Airport System Revenue, (AMT), 5.00%, 12/1/24 | | | 5,000 | | | | 5,829,850 | |
| | |
E-470 Public Highway Authority, CO, 0.517%, (67% of 1 mo. USD LIBOR + 0.42%), 9/1/21 (Put Date), 9/1/39(2) | | | 3,500 | | | | 3,500,105 | |
| | |
E-470 Public Highway Authority, CO, 1.151%, (67% of 1 mo. USD LIBOR + 1.05%), 9/1/21 (Put Date), 9/1/39(2) | | | 3,375 | | | | 3,384,652 | |
| | |
Eagle County Air Terminal Corp., CO, (AMT), 4.00%, 5/1/26 | | | 1,000 | | | | 1,096,100 | |
| | |
Grand Parkway Transportation Corp., TX, 5.00%, 2/1/23 | | | 1,600 | | | | 1,755,248 | |
| | |
Maryland Economic Development Corp., (Purple Line Light Rail), (AMT), 5.00%, 3/31/24 | | | 1,000 | | | | 995,570 | |
| | |
Maryland Economic Development Corp., (Transportation Facilities), 5.00%, 6/1/23 | | | 1,480 | | | | 1,600,280 | |
| | |
Miami-Dade County, FL, Aviation Revenue, (AMT), 5.00%, 10/1/34 | | | 5,000 | | | | 5,617,500 | |
| | |
New Jersey Transportation Trust Fund Authority, 0.00%, 12/15/24 | | | 200 | | | | 182,732 | |
| | |
New Jersey Transportation Trust Fund Authority, 5.00%, 6/15/23 | | | 1,000 | | | | 1,099,370 | |
| | |
New Jersey Transportation Trust Fund Authority, (Transportation Program), 1.31%, (SIFMA + 1.20%), 12/15/21 (Put Date), 6/15/34(2) | | | 13,000 | | | | 13,004,810 | |
| | |
New Jersey Transportation Trust Fund Authority, (Transportation System), 5.00%, 12/15/23 | | | 1,500 | | | | 1,667,595 | |
| | |
New Jersey Transportation Trust Fund Authority, (Transportation System), 5.00%, 12/15/24 | | | 2,000 | | | | 2,274,980 | |
| | |
Pennsylvania Turnpike Commission, 0.71%, (SIFMA + 0.60%), 12/1/23(2) | | | 1,000 | | | | 1,004,700 | |
| | |
Port of Oakland, CA, (AMT), 5.00%, 11/1/24 | | | 2,000 | | | | 2,345,260 | |
| | | | | | | | |
| Security | | Principal Amount (000’s omitted) | | | Value | |
| | |
| Transportation (continued) | | | | | | |
| | |
South Carolina Transportation Infrastructure Bank, 0.554%, (67% of 1 mo. USD LIBOR + 0.45%), 10/1/22 (Put Date), 10/1/31(2) | | $ | 12,440 | | | $ | 12,378,422 | |
| | |
South Jersey Port Corp., NJ, (AMT), 5.00%, 1/1/22 | | | 1,585 | | | | 1,650,445 | |
| | |
Susquehanna Area Regional Airport Authority, PA, (AMT), 5.00%, 1/1/21 | | | 2,000 | | | | 2,008,980 | |
| | |
Texas Private Activity Bond Surface Transportation Corp., (North Tarrant Express Managed Lanes Project), 5.00%, 12/31/30 | | | 2,500 | | | | 3,176,425 | |
| |
| | | | $ | 78,100,858 | |
| | |
| Water and Sewer — 0.1% | | | | | | |
| | |
Henrico County, VA, Water and Sewer System Revenue, 4.00%, 5/1/31 | | $ | 615 | | | $ | 761,505 | |
| |
| | | | $ | 761,505 | |
| |
Total Tax-Exempt Municipal Securities — 88.2%
(identified cost $733,103,458) | | | $ | 739,398,714 | |
|
| Tax-Exempt Mortgage-Backed Securities — 1.4% | |
| Security | | Principal Amount (000’s omitted) | | | Value | |
| | |
Federal Home Loan Mortgage Corp., Multifamily Variable Rate Certificates, (AMT), 2.304%, 5/15/27 | | $ | 2,140 | | | $ | 2,275,590 | |
| | |
FRETE 2017-ML01 Trust, Class A, (Freddie Mac guaranteed), 0.645%, (1 mo. USD LIBOR + 0.50%), 1/25/33(1)(2) | | | 474 | | | | 470,919 | |
| | |
National Finance Authority, NH, Municipal Certificates, Series 2020 -1, Class A, 4.125%, 1/20/34 | | | 8,386 | | | | 9,063,921 | |
| |
Total Tax-Exempt Mortgage-Backed Securities — 1.4%
(identified cost $12,460,077) | | | $ | 11,810,430 | |
|
| Taxable Municipal Securities — 2.8% | |
| Security | | Principal Amount (000’s omitted) | | | Value | |
| | |
| Education — 0.4% | | | | | | |
| | |
Florida Higher Educational Facilities Financing Authority, (Jacksonville University), 5.43%, 6/1/27(1) | | $ | 3,340 | | | $ | 3,372,632 | |
| | |
| | | | | | | $ | 3,372,632 | |
| | |
| Escrowed / Prerefunded — 0.1% | | | | | | |
| | |
South Jersey Transportation Authority, NJ, Escrowed to Maturity, 4.20%, 11/1/21 | | $ | 725 | | | $ | 754,399 | |
| | |
| | | | | | | $ | 754,399 | |
| | | | |
| | 16 | | See Notes to Financial Statements. |
Eaton Vance
Short Duration Municipal Opportunities Fund
September 30, 2020
Portfolio of Investments (Unaudited) — continued
| | | | | | | | |
| Security | | Principal Amount (000’s omitted) | | | Value | |
| | |
| General Obligations — 1.3% | | | | | | |
| | |
Amarillo Independent School District,TX, (PSF Guaranteed), 2.164%, 2/1/39(3) | | $ | 4,045 | | | $ | 4,122,947 | |
| | |
Argyle Independent School District, TX, (PSF Guaranteed), 2.127%, 8/15/38(3) | | | 1,450 | | | | 1,457,076 | |
| | |
Chicago Board of Education, IL, 5.182%, 12/1/21(5) | | | 325 | | | | 326,732 | |
| | |
Chicago, IL, 7.75%, 1/1/42 | | | 2,659 | | | | 2,878,261 | |
| | |
Prosper Independent School District, TX, (PSF Guaranteed), 2.211%, 2/15/40(3) | | | 2,295 | | | | 2,315,127 | |
| | |
| | | | | | | $ | 11,100,143 | |
| | |
| Hospital — 0.4% | | | | | | |
| | |
Doylestown Hospital Authority, PA, (Doylestown Hospital), 3.263%, 7/1/21 | | $ | 1,000 | | | $ | 1,002,750 | |
| | |
Doylestown Hospital Authority, PA, (Doylestown Hospital), 3.489%, 7/1/22 | | | 815 | | | | 822,017 | |
| | |
Oklahoma Development Finance Authority, (OU Medicine), 5.45%, 8/15/28 | | | 1,250 | | | | 1,470,300 | |
| | |
| | | | | | | $ | 3,295,067 | |
| | |
| Insured – Hospital — 0.1% | | | | | | |
| | |
Massachusetts Development Finance Agency, (Wellforce), (AGM), 3.653%, 7/1/22 | | $ | 375 | | | $ | 391,534 | |
| | |
| | | | | | | $ | 391,534 | |
| | |
| Senior Living / Life Care — 0.4% | | | | | | |
| | |
Berks County Industrial Development Authority, PA, (Highlands at Wyomissing), 3.20%, 5/15/21 | | $ | 285 | | | $ | 285,912 | |
| | |
St. Johns County Industrial Development Authority, FL, (Westminster St. Augustine), Prerefunded to 8/1/22, 5.50% to 8/1/24 (Put Date), 8/1/44 | | | 3,055 | | | | 3,323,718 | |
| | |
| | | | | | | $ | 3,609,630 | |
| | |
| Special Tax Revenue — 0.1% | | | | | | |
| | |
Ohio County Commission, WV, (Fort Henry Economic Opportunity Development District - The Highlands), 5.25%, 3/1/31 | | $ | 330 | | | $ | 329,762 | |
| | |
St. Louis Land Clearance for Redevelopment Authority, MO, (Kiel Opera House Renovation), 5.00%, 10/1/35 | | | 990 | | | | 874,725 | |
| | |
| | | | | | | $ | 1,204,487 | |
| | |
Total Taxable Municipal Securities — 2.8%
(identified cost $23,170,818) | | | | | | $ | 23,727,892 | |
| | | | | | | | |
| Corporate Bonds & Notes — 0.9% | |
| Security | | Principal Amount (000’s omitted) | | | Value | |
| | |
| Hospital — 0.4% | | | | | | |
| | |
Harnett Health System, Inc., 4.25%, 4/1/32 | | $ | 1,775 | | | $ | 1,741,648 | |
| | |
St. Joseph’s Hospital & Medical Center, 3.926%, 7/1/22 | | | 1,250 | | | | 1,281,200 | |
| | |
| | | | | | | $ | 3,022,848 | |
| | |
| Other — 0.5% | | | | | | |
| | |
Morongo Band of Mission Indians, 7.00%, 10/1/39(1) | | $ | 3,470 | | | $ | 4,054,972 | |
| | |
| | | | | | | $ | 4,054,972 | |
| | |
Total Corporate Bonds & Notes — 0.9%
(identified cost $6,495,000) | | | | | | $ | 7,077,820 | |
| | |
| Closed-End Funds — 1.7% | | | | | | | | |
| Security | | Shares | | | Value | |
| | |
BlackRock Municipal 2020 Term Trust | | | 382,158 | | | $ | 5,743,835 | |
| | |
Nuveen Intermediate Duration Municipal Term Fund | | | 617,678 | | | | 8,252,178 | |
| | |
Total Closed-End Funds — 1.7%
(identified cost $13,136,261) | | | | | | $ | 13,996,013 | |
| | |
Total Investments — 95.0%
(identified cost $788,365,614) | | | | | | $ | 796,010,869 | |
| | |
Other Assets, Less Liabilities — 5.0% | | | | | | $ | 42,282,248 | |
| | |
Net Assets — 100.0% | | | | | | $ | 838,293,117 | |
The percentage shown for each investment category in the Portfolio of Investments is based on net assets.
At September 30, 2020, the concentration of the Fund’s investments in the various states and territories, determined as a percentage of net assets, is as follows:
| | | | |
| |
| Illinois | | | 11.1% | |
| |
| Others, representing less than 10% individually | | | 82.2% | |
The Fund invests primarily in debt securities issued by municipalities. The ability of the issuers of the debt securities to meet their obligations may be affected by economic developments in a specific industry or municipality. At September 30, 2020, 7.8% of total investments are backed by bond insurance of various financial institutions and financial guaranty assurance agencies. The aggregate percentage insured by an individual financial institution or financial guaranty assurance agency ranged from less than 0.05% to 4.4% of total investments.
| (1) | Security exempt from registration under Rule 144A of the Securities Act of 1933, as amended. These securities may be sold in certain transactions in reliance on an exemption from registration (normally to qualified |
| | | | |
| | 17 | | See Notes to Financial Statements. |
Eaton Vance
Short Duration Municipal Opportunities Fund
September 30, 2020
Portfolio of Investments (Unaudited) — continued
| | institutional buyers). At September 30, 2020, the aggregate value of these securities is $65,620,492 or 7.8% of the Fund’s net assets. |
| (2) | Floating rate security. The stated interest rate represents the rate in effect at September 30, 2020. |
| (3) | When-issued/delayed delivery security. |
| (4) | Amount is less than 0.05%. |
| (5) | Build America Bond. Represents taxable municipal obligation issued pursuant to the American Recovery and Reinvestment Act of 2009 or other legislation providing for the issuance of taxable municipal debt on which the issuer receives federal support. |
Abbreviations:
| | | | |
| | |
| AGC | | – | | Assured Guaranty Corp. |
| | |
| AGM | | – | | Assured Guaranty Municipal Corp. |
| | |
| AMBAC | | – | | AMBAC Financial Group, Inc. |
| | |
| AMT | | – | | Interest earned from these securities may be considered a tax preference item for purposes of the Federal Alternative Minimum Tax. |
| | |
| BAM | | – | | Build America Mutual Assurance Co. |
| | |
| LIBOR | | – | | London Interbank Offered Rate |
| | |
| Liq | | – | | Liquidity Provider |
| | |
| NPFG | | – | | National Public Finance Guarantee Corp. |
| | |
| PSF | | – | | Permanent School Fund |
| | |
| SIFMA | | – | | Securities Industry and Financial Markets Association Municipal Swap Index |
Currency Abbreviations:
| | | | |
| | |
| USD | | – | | United States Dollar |
| | | | |
| | 18 | | See Notes to Financial Statements. |
Eaton Vance
Short Duration Municipal Opportunities Fund
September 30, 2020
Statement of Assets and Liabilities (Unaudited)
| | | | |
| Assets | | September 30, 2020 | |
| |
Investments, at value (identified cost, $788,365,614) | | $ | 796,010,869 | |
| |
Cash | | | 60,289,820 | |
| |
Interest and dividends receivable | | | 6,587,635 | |
| |
Receivable for investments sold | | | 2,084,445 | |
| |
Receivable for Fund shares sold | | | 3,049,566 | |
| |
Total assets | | $ | 868,022,335 | |
|
| Liabilities | |
| |
Payable for when-issued/delayed delivery securities | | $ | 26,878,126 | |
| |
Payable for Fund shares redeemed | | | 2,108,893 | |
| |
Distributions payable | | | 194,359 | |
| |
Payable to affiliates: | | | | |
| |
Investment adviser and administration fee | | | 275,384 | |
| |
Distribution and service fees | | | 45,911 | |
| |
Accrued expenses | | | 226,545 | |
| |
Total liabilities | | $ | 29,729,218 | |
| |
Net Assets | | $ | 838,293,117 | |
|
| Sources of Net Assets | |
| |
Paid-in capital | | $ | 832,694,508 | |
| |
Distributable earnings | | | 5,598,609 | |
| |
Net Assets | | $ | 838,293,117 | |
| |
| Class A Shares | | | | |
| |
Net Assets | | $ | 169,789,453 | |
| |
Shares Outstanding | | | 16,759,935 | |
| |
Net Asset Value and Redemption Price Per Share | | | | |
| |
(net assets ÷ shares of beneficial interest outstanding) | | $ | 10.13 | |
| |
Maximum Offering Price Per Share | | | | |
| |
(100 ÷ 97.75 of net asset value per share) | | $ | 10.36 | |
|
| Class C Shares | |
| |
Net Assets | | $ | 34,464,000 | |
| |
Shares Outstanding | | | 3,551,479 | |
| |
Net Asset Value and Offering Price Per Share* | | | | |
| |
(net assets ÷ shares of beneficial interest outstanding) | | $ | 9.70 | |
|
| Class I Shares | |
| |
Net Assets | | $ | 634,039,664 | |
| |
Shares Outstanding | | | 62,553,872 | |
| |
Net Asset Value, Offering Price and Redemption Price Per Share | | | | |
| |
(net assets ÷ shares of beneficial interest outstanding) | | $ | 10.14 | |
On sales of $100,000 or more, the offering price of Class A shares is reduced.
| * | Redemption price per share is equal to the net asset value less any applicable contingent deferred sales charge. |
| | | | |
| | 19 | | See Notes to Financial Statements. |
Eaton Vance
Short Duration Municipal Opportunities Fund
September 30, 2020
Statement of Operations (Unaudited)
| | | | |
| Investment Income | | Six Months Ended
September 30, 2020 | |
| |
Interest | | $ | 9,162,333 | |
| |
Dividends | | | 180,346 | |
| |
Total investment income | | $ | 9,342,679 | |
|
| Expenses | |
| |
Investment adviser and administration fee | | $ | 1,647,218 | |
| |
Distribution and service fees | | | | |
| |
Class A | | | 122,977 | |
| |
Class C | | | 156,519 | |
| |
Trustees’ fees and expenses | | | 22,261 | |
| |
Custodian fee | | | 104,573 | |
| |
Transfer and dividend disbursing agent fees | | | 117,746 | |
| |
Legal and accounting services | | | 31,554 | |
| |
Printing and postage | | | 19,536 | |
| |
Registration fees | | | 66,585 | |
| |
Miscellaneous | | | 61,232 | |
| |
Total expenses | | $ | 2,350,201 | |
| |
Net investment income | | $ | 6,992,478 | |
|
| Realized and Unrealized Gain (Loss) | |
| |
Net realized gain (loss) — | | | | |
| |
Investment transactions | | $ | (386,222 | ) |
| |
Net realized loss | | $ | (386,222 | ) |
| |
Change in unrealized appreciation (depreciation) — | | | | |
| |
Investments | | $ | 19,549,648 | |
| |
Net change in unrealized appreciation (depreciation) | | $ | 19,549,648 | |
| |
Net realized and unrealized gain | | $ | 19,163,426 | |
| |
Net increase in net assets from operations | | $ | 26,155,904 | |
| | | | |
| | 20 | | See Notes to Financial Statements. |
Eaton Vance
Short Duration Municipal Opportunities Fund
September 30, 2020
Statements of Changes in Net Assets
| | | | | | | | |
| Increase (Decrease) in Net Assets | | Six Months Ended September 30, 2020
(Unaudited) | | | Year Ended
March 31, 2020 | |
| | |
From operations — | | | | | | | | |
| | |
Net investment income | | $ | 6,992,478 | | | $ | 14,524,336 | |
| | |
Net realized loss | | | (386,222 | ) | | | (1,782,904 | ) |
| | |
Net change in unrealized appreciation (depreciation) | | | 19,549,648 | | | | (18,066,910 | ) |
| | |
Net increase (decrease) in net assets from operations | | $ | 26,155,904 | | | $ | (5,325,478 | ) |
| | |
Distributions to shareholders — | | | | | | | | |
| | |
Class A | | $ | (1,320,466 | ) | | $ | (2,600,744 | ) |
| | |
Class C | | | (150,432 | ) | | | (399,012 | ) |
| | |
Class I | | | (5,510,686 | ) | | | (11,848,973 | ) |
| | |
Total distributions to shareholders | | $ | (6,981,584 | ) | | $ | (14,848,729 | ) |
| | |
Transactions in shares of beneficial interest — | | | | | | | | |
| | |
Proceeds from sale of shares | | | | | | | | |
| | |
Class A | | $ | 36,081,437 | | | $ | 127,045,802 | |
| | |
Class C | | | 3,890,761 | | | | 16,363,186 | |
| | |
Class I | | | 172,244,457 | | | | 483,827,640 | |
| | |
Net asset value of shares issued to shareholders in payment of distributions declared | | | | | | | | |
| | |
Class A | | | 1,072,510 | | | | 1,936,736 | |
| | |
Class C | | | 119,060 | | | | 318,203 | |
| | |
Class I | | | 4,568,094 | | | | 9,786,651 | |
| | |
Cost of shares redeemed | | | | | | | | |
| | |
Class A | | | (34,419,160 | ) | | | (56,698,982 | ) |
| | |
Class C | | | (5,231,812 | ) | | | (8,185,314 | ) |
| | |
Class I | | | (173,589,427 | ) | | | (301,596,591 | ) |
| | |
Net asset value of shares converted | | | | | | | | |
| | |
Class A | | | 287,204 | | | | 846,321 | |
| | |
Class C | | | (287,204 | ) | | | (846,321 | ) |
| | |
Net increase in net assets from Fund share transactions | | $ | 4,735,920 | | | $ | 272,797,331 | |
| | |
Net increase in net assets | | $ | 23,910,240 | | | $ | 252,623,124 | |
|
| Net Assets | |
| | |
At beginning of period | | $ | 814,382,877 | | | $ | 561,759,753 | |
| | |
At end of period | | $ | 838,293,117 | | | $ | 814,382,877 | |
| | | | |
| | 21 | | See Notes to Financial Statements. |
Eaton Vance
Short Duration Municipal Opportunities Fund
September 30, 2020
Financial Highlights
| | | | | | | | | | | | | | | | | | | | | | | | |
| | | Class A | |
| | |
| | | Six Months Ended
September 30, 2020
(Unaudited) | | | Year Ended March 31, | |
| | | 2020 | | | 2019 | | | 2018 | | | 2017 | | | 2016 | |
| | | | | | | |
Net asset value — Beginning of period | | $ | 9.900 | | | $ | 10.070 | | | $ | 9.950 | | | $ | 9.830 | | | $ | 10.060 | | | $ | 10.030 | |
| | | | | | |
| Income (Loss) From Operations | | | | | | | | | | | | | | | | | | | | | | | | |
| | | | | | |
Net investment income(1) | | $ | 0.081 | | | $ | 0.196 | | | $ | 0.224 | | | $ | 0.212 | | | $ | 0.248 | | | $ | 0.264 | |
| | | | | | |
Net realized and unrealized gain (loss) | | | 0.230 | | | | (0.163 | ) | | | 0.121 | | | | 0.117 | | | | (0.235 | ) | | | 0.027 | |
| | | | | | |
Total income from operations | | $ | 0.311 | | | $ | 0.033 | | | $ | 0.345 | | | $ | 0.329 | | | $ | 0.013 | | | $ | 0.291 | |
| | | | |
| Less Distributions | | | | | | | | | | | | | | | | | |
| | | | | | |
From net investment income | | $ | (0.081 | ) | | $ | (0.197 | ) | | $ | (0.225 | ) | | $ | (0.209 | ) | | $ | (0.243 | ) | | $ | (0.261 | ) |
| | | | | | |
From net realized gain | | | — | | | | (0.006 | ) | | | — | | | | — | | | | — | | | | — | |
| | | | | | |
Total distributions | | $ | (0.081 | ) | | $ | (0.203 | ) | | $ | (0.225 | ) | | $ | (0.209 | ) | | $ | (0.243 | ) | | $ | (0.261 | ) |
| | | | | | |
Net asset value — End of period | | $ | 10.130 | | | $ | 9.900 | | | $ | 10.070 | | | $ | 9.950 | | | $ | 9.830 | | | $ | 10.060 | |
| | | | | | |
Total Return(2) | | | 3.15 | %(3) | | | 0.29 | % | | | 3.52 | %(4) | | | 3.36 | %(4) | | | 0.13 | %(4) | | | 2.95 | % |
| | | | |
| Ratios/Supplemental Data | | | | | | | | | | | | | | | | | |
| | | | | | |
Net assets, end of period (000’s omitted) | | $ | 169,789 | | | $ | 162,846 | | | $ | 94,489 | | | $ | 36,045 | | | $ | 24,526 | | | $ | 35,441 | |
| | | | | | |
Ratios (as a percentage of average daily net assets): | | | | | | | | | | | | | | | | | | | | | | | | |
| | | | | | |
Expenses(5) | | | 0.65 | %(6) | | | 0.66 | % | | | 0.70 | %(4) | | | 0.70 | %(4) | | | 0.80 | %(4)(7) | | | 0.77 | % |
| | | | | | |
Net investment income | | | 1.61 | %(6) | | | 1.93 | % | | | 2.25 | % | | | 2.13 | % | | | 2.48 | % | | | 2.65 | % |
| | | | | | |
Portfolio Turnover | | | 10 | %(3) | | | 52 | % | | | 48 | % | | | 55 | % | | | 82 | % | | | 9 | % |
| (1) | Computed using average shares outstanding. |
| (2) | Returns are historical and are calculated by determining the percentage change in net asset value with all distributions reinvested and do not reflect the effect of sales charges. |
| (4) | The investment adviser and administrator reimbursed certain operating expenses (equal to 0.01%, 0.15% and 0.22% of average daily net assets for the years ended March 31, 2019, 2018 and 2017, respectively). Absent this reimbursement, total return would be lower. |
| (5) | Excludes the effect of custody fee credits, if any, of less than 0.005%. Effective September 1, 2015, custody fee credits, which were earned on cash deposit balances, were discontinued by the custodian. |
| (7) | Includes interest expense of 0.01%. |
| | | | |
| | 22 | | See Notes to Financial Statements. |
Eaton Vance
Short Duration Municipal Opportunities Fund
September 30, 2020
Financial Highlights — continued
| | | | | | | | | | | | | | | | | | | | | | | | |
| | | Class C | |
| | |
| | | Six Months Ended
September 30, 2020
(Unaudited) | | | Year Ended March 31, | |
| | | 2020 | | | 2019 | | | 2018 | | | 2017 | | | 2016 | |
| | | | | | | |
Net asset value — Beginning of period | | $ | 9.480 | | | $ | 9.650 | | | $ | 9.530 | | | $ | 9.410 | | | $ | 9.640 | | | $ | 9.610 | |
| | | | | | |
| Income (Loss) From Operations | | | | | | | | | | | | | | | | | | | | | | | | |
| | | | | | |
Net investment income(1) | | $ | 0.042 | | | $ | 0.117 | | | $ | 0.144 | | | $ | 0.131 | | | $ | 0.165 | | | $ | 0.181 | |
| | | | | | |
Net realized and unrealized gain (loss) | | | 0.219 | | | | (0.165 | ) | | | 0.120 | | | | 0.117 | | | | (0.234 | ) | | | 0.027 | |
| | | | | | |
Total income (loss) from operations | | $ | 0.261 | | | $ | (0.048 | ) | | $ | 0.264 | | | $ | 0.248 | | | $ | (0.069 | ) | | $ | 0.208 | |
| | | | |
| Less Distributions | | | | | | | | | | | | | | | | | |
| | | | | | |
From net investment income | | $ | (0.041 | ) | | $ | (0.116 | ) | | $ | (0.144 | ) | | $ | (0.128 | ) | | $ | (0.161 | ) | | $ | (0.178 | ) |
| | | | | | |
From net realized gain | | | — | | | | (0.006 | ) | | | — | | | | — | | | | — | | | | — | |
| | | | | | |
Total distributions | | $ | (0.041 | ) | | $ | (0.122 | ) | | $ | (0.144 | ) | | $ | (0.128 | ) | | $ | (0.161 | ) | | $ | (0.178 | ) |
| | | | | | |
Net asset value — End of period | | $ | 9.700 | | | $ | 9.480 | | | $ | 9.650 | | | $ | 9.530 | | | $ | 9.410 | | | $ | 9.640 | |
| | | | | | |
Total Return(2) | | | 2.76 | %(3) | | | (0.53 | )% | | | 2.79 | %(4) | | | 2.64 | %(4) | | | (0.73 | )%(4) | | | 2.20 | % |
| | | | |
| Ratios/Supplemental Data | | | | | | | | | | | | | | | | | |
| | | | | | |
Net assets, end of period (000’s omitted) | | $ | 34,464 | | | $ | 35,156 | | | $ | 28,258 | | | $ | 16,403 | | | $ | 9,324 | | | $ | 10,396 | |
| | | | | | |
Ratios (as a percentage of average daily net assets): | | | | | | | | | | | | | | | | | | | | | | | | |
| | | | | | |
Expenses(5) | | | 1.40 | %(6) | | | 1.41 | % | | | 1.45 | %(4) | | | 1.45 | %(4) | | | 1.55 | %(4)(7) | | | 1.52 | % |
| | | | | | |
Net investment income | | | 0.87 | %(6) | | | 1.20 | % | | | 1.51 | % | | | 1.37 | % | | | 1.72 | % | | | 1.89 | % |
| | | | | | |
Portfolio Turnover | | | 10 | %(3) | | | 52 | % | | | 48 | % | | | 55 | % | | | 82 | % | | | 9 | % |
| (1) | Computed using average shares outstanding. |
| (2) | Returns are historical and are calculated by determining the percentage change in net asset value with all distributions reinvested and do not reflect the effect of sales charges. |
| (4) | The investment adviser and administrator reimbursed certain operating expenses (equal to 0.01%, 0.15% and 0.24% of average daily net assets for the years ended March 31, 2019, 2018 and 2017, respectively). Absent this reimbursement, total return would be lower. |
| (5) | Excludes the effect of custody fee credits, if any, of less than 0.005%. Effective September 1, 2015, custody fee credits, which were earned on cash deposit balances, were discontinued by the custodian. |
| (7) | Includes interest expense of 0.01%. |
| | | | |
| | 23 | | See Notes to Financial Statements. |
Eaton Vance
Short Duration Municipal Opportunities Fund
September 30, 2020
Financial Highlights — continued
| | | | | | | | | | | | | | | | | | | | | | | | |
| | | Class I | |
| | |
| | | Six Months Ended
September 30, 2020
(Unaudited) | | | Year Ended March 31, | |
| | | 2020 | | | 2019 | | | 2018 | | | 2017 | | | 2016 | |
| | | | | | | |
Net asset value — Beginning of period | | $ | 9.900 | | | $ | 10.080 | | | $ | 9.950 | | | $ | 9.830 | | | $ | 10.060 | | | $ | 10.030 | |
| | | | | | |
| Income (Loss) From Operations | | | | | | | | | | | | | | | | | | | | | | | | |
| | | | | | |
Net investment income(1) | | $ | 0.088 | | | $ | 0.212 | | | $ | 0.237 | | | $ | 0.226 | | | $ | 0.269 | | | $ | 0.278 | |
| | | | | | |
Net realized and unrealized gain (loss) | | | 0.240 | | | | (0.173 | ) | | | 0.133 | | | | 0.118 | | | | (0.242 | ) | | | 0.027 | |
| | | | | | |
Total income from operations | | $ | 0.328 | | | $ | 0.039 | | | $ | 0.370 | | | $ | 0.344 | | | $ | 0.027 | | | $ | 0.305 | |
| | | | |
| Less Distributions | | | | | | | | | | | | | | | | | |
| | | | | | |
From net investment income | | $ | (0.088 | ) | | $ | (0.213 | ) | | $ | (0.240 | ) | | $ | (0.224 | ) | | $ | (0.257 | ) | | $ | (0.275 | ) |
| | | | | | |
From net realized gain | | | — | | | | (0.006 | ) | | | — | | | | — | | | | — | | | | — | |
| | | | | | |
Total distributions | | $ | (0.088 | ) | | $ | (0.219 | ) | | $ | (0.240 | ) | | $ | (0.224 | ) | | $ | (0.257 | ) | | $ | (0.275 | ) |
| | | | | | |
Net asset value — End of period | | $ | 10.140 | �� | | $ | 9.900 | | | $ | 10.080 | | | $ | 9.950 | | | $ | 9.830 | | | $ | 10.060 | |
| | | | | | |
Total Return(2) | | | 3.33 | %(3) | | | 0.34 | % | | | 3.78 | %(4) | | | 3.51 | %(4) | | | 0.27 | %(4) | | | 3.10 | % |
| | | | |
| Ratios/Supplemental Data | | | | | | | | | | | | | | | | | |
| | | | | | |
Net assets, end of period (000’s omitted) | | $ | 634,040 | | | $ | 616,381 | | | $ | 439,012 | | | $ | 84,347 | | | $ | 7,755 | | | $ | 15,931 | |
| | | | | | |
Ratios (as a percentage of average daily net assets): | | | | | | | | | | | | | | | | | | | | | | | | |
| | | | | | |
Expenses(5) | | | 0.50 | %(6) | | | 0.51 | % | | | 0.55 | %(4) | | | 0.55 | %(4) | | | 0.68 | %(4)(7) | | | 0.62 | % |
| | | | | | |
Net investment income | | | 1.77 | %(6) | | | 2.09 | % | | | 2.37 | % | | | 2.26 | % | | | 2.68 | % | | | 2.79 | % |
| | | | | | |
Portfolio Turnover | | | 10 | %(3) | | | 52 | % | | | 48 | % | | | 55 | % | | | 82 | % | | | 9 | % |
| (1) | Computed using average shares outstanding. |
| (2) | Returns are historical and are calculated by determining the percentage change in net asset value with all distributions reinvested. |
| (4) | The investment adviser and administrator reimbursed certain operating expenses (equal to 0.01%, 0.15% and 0.11% of average daily net assets for the years ended March 31, 2019, 2018 and 2017, respectively). Absent this reimbursement, total return would be lower. |
| (5) | Excludes the effect of custody fee credits, if any, of less than 0.005%. Effective September 1, 2015, custody fee credits, which were earned on cash deposit balances, were discontinued by the custodian. |
| (7) | Includes interest expense of 0.01%. |
| | | | |
| | 24 | | See Notes to Financial Statements. |
Eaton Vance
Short Duration Municipal Opportunities Fund
September 30, 2020
Notes to Financial Statements (Unaudited)
1 Significant Accounting Policies
Eaton Vance Short Duration Municipal Opportunities Fund (the Fund) is a non-diversified series of Eaton Vance Investment Trust (the Trust). The Trust is a Massachusetts business trust registered under the Investment Company Act of 1940, as amended (the 1940 Act), as an open-end management investment company. The Fund’s investment objective is to seek to maximize after-tax total return. The Fund offers three classes of shares. Class A shares are generally sold subject to a sales charge imposed at time of purchase. Class C shares are sold at net asset value and are generally subject to a contingent deferred sales charge (see Note 5). Effective January 25, 2019, Class C shares generally automatically convert to Class A shares ten years after their purchase and, effective November 5, 2020, will automatically convert to Class A shares eight years after their purchase as described in the Fund’s prospectus. Class I shares are sold at net asset value and are not subject to a sales charge. Each class represents a pro-rata interest in the Fund, but votes separately on class-specific matters and (as noted below) is subject to different expenses. Realized and unrealized gains and losses are allocated daily to each class of shares based on the relative net assets of each class to the total net assets of the Fund. Net investment income, other than class-specific expenses, is allocated daily to each class of shares based upon the ratio of the value of each class’s paid shares to the total value of all paid shares. Each class of shares differs in its distribution plan and certain other class-specific expenses.
The following is a summary of significant accounting policies of the Fund. The policies are in conformity with accounting principles generally accepted in the United States of America (U.S. GAAP). The Fund is an investment company and follows accounting and reporting guidance in the Financial Accounting Standards Board (FASB) Accounting Standards Codification Topic 946.
A Investment Valuation — The following methodologies are used to determine the market value or fair value of investments.
Debt Obligations. Debt obligations are generally valued on the basis of valuations provided by third party pricing services, as derived from such services’ pricing models. Inputs to the models may include, but are not limited to, reported trades, executable bid and ask prices, broker/dealer quotations, prices or yields of securities with similar characteristics, interest rates, anticipated prepayments, benchmark curves or information pertaining to the issuer, as well as industry and economic events. The pricing services may use a matrix approach, which considers information regarding securities with similar characteristics to determine the valuation for a security. Short-term debt obligations purchased with a remaining maturity of sixty days or less for which a valuation from a third party pricing service is not readily available may be valued at amortized cost, which approximates fair value.
Equity Securities. Equity securities listed on a U.S. securities exchange generally are valued at the last sale or closing price on the day of valuation or, if no sales took place on such date, at the mean between the closing bid and ask prices on the exchange where such securities are principally traded. Equity securities listed on the NASDAQ Global or Global Select Market generally are valued at the NASDAQ official closing price. Unlisted or listed securities for which closing sales prices or closing quotations are not available are valued at the mean between the latest available bid and ask prices.
Fair Valuation. Investments for which valuations or market quotations are not readily available or are deemed unreliable are valued at fair value using methods determined in good faith by or at the direction of the Trustees of the Fund in a manner that most fairly reflects the security’s “fair value”, which is the amount that the Fund might reasonably expect to receive for the security upon its current sale in the ordinary course. Each such determination is based on a consideration of relevant factors, which are likely to vary from one pricing context to another. These factors may include, but are not limited to, the type of security, the existence of any contractual restrictions on the security’s disposition, the price and extent of public trading in similar securities of the issuer or of comparable companies or entities, quotations or relevant information obtained from broker/dealers or other market participants, information obtained from the issuer, analysts, and/or the appropriate stock exchange (for exchange-traded securities), an analysis of the company’s or entity’s financial statements, and an evaluation of the forces that influence the issuer and the market(s) in which the security is purchased and sold.
B Investment Transactions and Related Income — Investment transactions for financial statement purposes are accounted for on a trade date basis. Realized gains and losses on investments sold are determined on the basis of identified cost. Interest income is recorded on the basis of interest accrued, adjusted for amortization of premium or accretion of discount. Distributions from investment companies are recorded on the ex-dividend date as income, capital gains or return of capital based on the nature of the distribution.
C Federal Taxes — The Fund’s policy is to comply with the provisions of the Internal Revenue Code applicable to regulated investment companies and to distribute to shareholders each year substantially all of its taxable, if any, and tax-exempt net investment income, and all or substantially all of its net realized capital gains. Accordingly, no provision for federal income or excise tax is necessary. The Fund intends to satisfy conditions which will enable it to designate distributions from the interest and dividend income generated by its investments in non-taxable municipal securities, which are exempt from regular federal income tax when received by the Fund, as exempt-interest dividends. The portion of such interest, if any, earned on private activity bonds issued after August 7, 1986, may be considered a tax preference item to shareholders.
As of September 30, 2020, the Fund had no uncertain tax positions that would require financial statement recognition, de-recognition, or disclosure. The Fund files a U.S. federal income tax return annually after its fiscal year-end, which is subject to examination by the Internal Revenue Service for a period of three years from the date of filing.
D Expenses — The majority of expenses of the Trust are directly identifiable to an individual fund. Expenses which are not readily identifiable to a specific fund are allocated taking into consideration, among other things, the nature and type of expense and the relative size of the funds.
E Legal Fees — Legal fees and other related expenses incurred as part of negotiations of the terms and requirement of capital infusions, or that are expected to result in the restructuring of, or a plan of reorganization for, an investment are recorded as realized losses. Ongoing expenditures to protect or enhance an investment are treated as operating expenses.
Eaton Vance
Short Duration Municipal Opportunities Fund
September 30, 2020
Notes to Financial Statements (Unaudited) — continued
F Use of Estimates — The preparation of the financial statements in conformity with U.S. GAAP requires management to make estimates and assumptions that affect the reported amounts of assets and liabilities at the date of the financial statements and the reported amounts of income and expense during the reporting period. Actual results could differ from those estimates.
G Indemnifications — Under the Trust’s organizational documents, its officers and Trustees may be indemnified against certain liabilities and expenses arising out of the performance of their duties to the Fund. Under Massachusetts law, if certain conditions prevail, shareholders of a Massachusetts business trust (such as the Trust) could be deemed to have personal liability for the obligations of the Trust. However, the Trust’s Declaration of Trust contains an express disclaimer of liability on the part of Fund shareholders and the By-laws provide that the Trust shall assume, upon request by the shareholder, the defense on behalf of any Fund shareholders. Moreover, the By-laws also provide for indemnification out of Fund property of any shareholder held personally liable solely by reason of being or having been a shareholder for all loss or expense arising from such liability. Additionally, in the normal course of business, the Fund enters into agreements with service providers that may contain indemnification clauses. The Fund’s maximum exposure under these arrangements is unknown as this would involve future claims that may be made against the Fund that have not yet occurred.
H When-Issued Securities and Delayed Delivery Transactions — The Fund may purchase or sell securities on a delayed delivery or when-issued basis. Payment and delivery may take place after the customary settlement period for that security. At the time the transaction is negotiated, the price of the security that will be delivered is fixed. The Fund maintains cash and/or security positions for these commitments such that sufficient liquid assets will be available to make payments upon settlement. Securities purchased on a delayed delivery or when-issued basis are marked-to-market daily and begin earning interest on settlement date. Losses may arise due to changes in the market value of the underlying securities or if the counterparty does not perform under the contract.
I Interim Financial Statements — The interim financial statements relating to September 30, 2020 and for the six months then ended have not been audited by an independent registered public accounting firm, but in the opinion of the Fund’s management, reflect all adjustments, consisting only of normal recurring adjustments, necessary for the fair presentation of the financial statements.
2 Distributions to Shareholders and Income Tax Information
The net investment income of the Fund is determined daily and substantially all of the net investment income so determined is declared as a dividend to shareholders of record at the time of declaration. Distributions are declared separately for each class of shares. Distributions are paid monthly. Distributions of realized capital gains are made at least annually. Shareholders may reinvest income and capital gain distributions in additional shares of the same class of the Fund at the net asset value as of the reinvestment date or, at the election of the shareholder, receive distributions in cash. Distributions to shareholders are determined in accordance with income tax regulations, which may differ from U.S. GAAP. As required by U.S. GAAP, only distributions in excess of tax basis earnings and profits are reported in the financial statements as a return of capital. Permanent differences between book and tax accounting relating to distributions are reclassified to paid-in capital. For tax purposes, distributions from short-term capital gains are considered to be from ordinary income.
The cost and unrealized appreciation (depreciation) of investments of the Fund at September 30, 2020, as determined on a federal income tax basis, were as follows:
| | | | |
| |
Aggregate cost | | $ | 788,143,923 | |
| |
Gross unrealized appreciation | | $ | 14,571,698 | |
| |
Gross unrealized depreciation | | | (6,704,752 | ) |
| |
Net unrealized appreciation | | $ | 7,866,946 | |
3 Investment Adviser and Administration Fee and Other Transactions with Affiliates
The investment adviser and administration fee is earned by Eaton Vance Management (EVM), a wholly-owned subsidiary of Eaton Vance Corp., as compensation for investment advisory and administrative services rendered to the Fund. The fee is computed at an annual rate of 0.40% of the Fund’s average daily net assets up to $1 billion, and at a reduced rate on daily net assets of $1 billion or more, and is payable monthly. For the six months ended September 30, 2020, the investment adviser and administration fee amounted to $1,647,218 or 0.40% (annualized) of the Fund’s average daily net assets.
Prior to August 1, 2020, EVM had agreed to reimburse the Fund’s expenses to the extent that total annual operating expenses (relating to ordinary operating expenses only and excluding such expenses as borrowing costs, taxes or litigation expenses) exceeded 0.70%, 1.45% and 0.55% of the Fund’s average daily net assets for Class A, Class C and Class I, respectively. Pursuant to this agreement, no operating expenses were allocated to EVM for the six months ended September 30, 2020.
Eaton Vance
Short Duration Municipal Opportunities Fund
September 30, 2020
Notes to Financial Statements (Unaudited) — continued
EVM provides sub-transfer agency and related services to the Fund pursuant to a Sub-Transfer Agency Support Services Agreement. For the six months ended September 30, 2020, EVM earned $2,642 from the Fund pursuant to such agreement, which is included in transfer and dividend disbursing agent fees on the Statement of Operations. The Fund was informed that Eaton Vance Distributors, Inc. (EVD), an affiliate of EVM and the Fund’s principal underwriter, received $2,417 as its portion of the sales charge on sales of Class A shares for the six months ended September 30, 2020. EVD also received distribution and service fees from Class A and Class C shares (see Note 4) and contingent deferred sales charges (see Note 5).
Trustees and officers of the Fund who are members of EVM’s organization receive remuneration for their services to the Fund out of the investment adviser and administration fee. Trustees of the Fund who are not affiliated with EVM may elect to defer receipt of all or a percentage of their annual fees in accordance with the terms of the Trustees Deferred Compensation Plan. For the six months ended September 30, 2020, no significant amounts have been deferred. Certain officers and Trustees of the Fund are officers of EVM.
4 Distribution Plans
The Fund has in effect a distribution plan for Class A shares (Class A Plan) pursuant to Rule 12b-1 under the 1940 Act. Pursuant to the Class A Plan, the Fund pays EVD a distribution and service fee not exceeding 0.25% per annum of its average daily net assets attributable to Class A shares for distribution services and facilities provided to the Fund by EVD, as well as for personal services and/or the maintenance of shareholder accounts. The Trustees approved distribution and service fee payments equal to 0.15% per annum of the Fund’s average daily net assets attributable to Class A shares. Distribution and service fees paid or accrued to EVD for the six months ended September 30, 2020 amounted to $122,977 for Class A shares.
The Fund also has in effect a distribution plan for Class C shares (Class C Plan) pursuant to Rule 12b-1 under the 1940 Act. Pursuant to the Class C Plan, the Fund pays EVD amounts equal to 0.75% per annum of its average daily net assets attributable to Class C shares for providing ongoing distribution services and facilities to the Fund. For the six months ended September 30, 2020, the Fund paid or accrued to EVD $130,432 for Class C shares.
Pursuant to the Class C Plan, the Fund also makes payments of service fees to EVD, financial intermediaries and other persons in amounts not exceeding 0.25% per annum of its average daily net assets attributable to Class C shares. The Trustees approved service fee payments equal to 0.15% per annum of the Fund’s average daily net assets attributable to Class C shares. Service fees paid or accrued are for personal services and/or the maintenance of shareholder accounts. They are separate and distinct from the Class C sales commissions and distribution fees payable to EVD. Service fees paid or accrued for the six months ended September 30, 2020 amounted to $26,087 for Class C shares.
Distribution and service fees are subject to the limitations contained in the Financial Industry Regulatory Authority Rule 2341(d).
5 Contingent Deferred Sales Charges
A contingent deferred sales charge (CDSC) of 1% generally is imposed on redemptions of Class C shares made within 12 months of purchase. Class A shares may be subject to a 1% CDSC if redeemed within 18 months of purchase (depending on the circumstances of purchase). Generally, the CDSC is based upon the lower of the net asset value at date of redemption or date of purchase. No charge is levied on shares acquired by reinvestment of dividends or capital gain distributions. For the six months ended September 30, 2020, the Fund was informed that EVD received approximately $69,000 and $4,000 of CDSCs paid by Class A and Class C shareholders, respectively.
6 Purchases and Sales of Investments
Purchases and sales of investments, other than short-term obligations, aggregated $76,734,353 and $138,412,783, respectively, for the six months ended September 30, 2020.
Eaton Vance
Short Duration Municipal Opportunities Fund
September 30, 2020
Notes to Financial Statements (Unaudited) — continued
7 Shares of Beneficial Interest
The Fund’s Declaration of Trust permits the Trustees to issue an unlimited number of full and fractional shares of beneficial interest (without par value). Such shares may be issued in a number of different series (such as the Fund) and classes. Transactions in Fund shares were as follows:
| | | | | | | | |
| Class A | | Six Months Ended September 30, 2020
(Unaudited) | | | Year Ended March 31, 2020 | |
| | |
Sales | | | 3,617,106 | | | | 12,444,611 | |
| | |
Issued to shareholders electing to receive payments of distributions in Fund shares | | | 107,402 | | | | 190,411 | |
| | |
Redemptions | | | (3,450,333 | ) | | | (5,641,070 | ) |
| | |
Converted from Class C shares | | | 28,891 | | | | 83,985 | |
| | |
Net increase | | | 303,066 | | | | 7,077,937 | |
| | |
| Class C | | Six Months Ended September 30, 2020
(Unaudited) | | | Year Ended March 31, 2020 | |
| | |
Sales | | | 407,341 | | | | 1,676,665 | |
| | |
Issued to shareholders electing to receive payments of distributions in Fund shares | | | 12,471 | | | | 32,673 | |
| | |
Redemptions | | | (547,124 | ) | | | (841,221 | ) |
| | |
Converted to Class A shares | | | (30,157 | ) | | | (87,679 | ) |
| | |
Net increase (decrease) | | | (157,469 | ) | | | 780,438 | |
| | |
| Class I | | Six Months Ended September 30, 2020
(Unaudited) | | | Year Ended March 31, 2020 | |
| | |
Sales | | | 17,318,297 | | | | 47,556,210 | |
| | |
Issued to shareholders electing to receive payments of distributions in Fund shares | | | 457,436 | | | | 961,712 | |
| | |
Redemptions | | | (17,480,047 | ) | | | (29,816,539 | ) |
| | |
Net increase | | | 295,686 | | | | 18,701,383 | |
8 Line of Credit
The Fund participates with other portfolios and funds managed by EVM and its affiliates in an $800 million unsecured line of credit agreement with a group of banks, which is in effect through October 27, 2020. In connection with the renewal of the agreement on October 29, 2019, funds managed by Calvert Research and Management, an affiliate of EVM, were added as participating funds to the agreement and the borrowing limit was increased from $625 million. Borrowings are made by the Fund solely for temporary purposes related to redemptions and other short-term cash needs. Interest is charged to the Fund based on its borrowings at an amount above either the Eurodollar rate or Federal Funds rate. In addition, a fee computed at an annual rate of 0.15% on the daily unused portion of the line of credit is allocated among the participating portfolios and funds at the end of each quarter. Because the line of credit is not available exclusively to the Fund, it may be unable to borrow some or all of its requested amounts at any particular time. The Fund did not have any significant borrowings or allocated fees during the six months ended September 30, 2020.
Effective October 27, 2020, the Fund renewed its line of credit agreement, which expires October 26, 2021, at substantially the same terms.
Eaton Vance
Short Duration Municipal Opportunities Fund
September 30, 2020
Notes to Financial Statements (Unaudited) — continued
9 Fair Value Measurements
Under generally accepted accounting principles for fair value measurements, a three-tier hierarchy to prioritize the assumptions, referred to as inputs, is used in valuation techniques to measure fair value. The three-tier hierarchy of inputs is summarized in the three broad levels listed below.
| • | | Level 1 – quoted prices in active markets for identical investments |
| • | | Level 2 – other significant observable inputs (including quoted prices for similar investments, interest rates, prepayment speeds, credit risk, etc.) |
| • | | Level 3 – significant unobservable inputs (including a fund’s own assumptions in determining the fair value of investments) |
In cases where the inputs used to measure fair value fall in different levels of the fair value hierarchy, the level disclosed is determined based on the lowest level input that is significant to the fair value measurement in its entirety. The inputs or methodology used for valuing securities are not necessarily an indication of the risk associated with investing in those securities.
At September 30, 2020, the hierarchy of inputs used in valuing the Fund’s investments, which are carried at value, were as follows:
| | | | | | | | | | | | | | | | |
| Asset Description | | Level 1 | | | Level 2 | | | Level 3 | | | Total | |
| | | | |
Tax-Exempt Municipal Securities | | $ | — | | | $ | 739,398,714 | | | $ | — | | | $ | 739,398,714 | |
| | | | |
Tax-Exempt Mortgage-Backed Securities | | | — | | | | 11,810,430 | | | | — | | | | 11,810,430 | |
| | | | |
Taxable Municipal Securities | | | — | | | | 23,727,892 | | | | — | | | | 23,727,892 | |
| | | | |
Corporate Bonds & Notes | | | — | | | | 7,077,820 | | | | — | | | | 7,077,820 | |
| | | | |
Closed-End Funds | | | 13,996,013 | | | | — | | | | — | | | | 13,996,013 | |
| | | | |
Total Investments | | $ | 13,996,013 | | | $ | 782,014,856 | | | $ | — | | | $ | 796,010,869 | |
10 Risks and Uncertainties
Pandemic Risk
An outbreak of respiratory disease caused by a novel coronavirus was first detected in China in December 2019 and subsequently spread internationally. This coronavirus has resulted in closing borders, enhanced health screenings, changes to healthcare service preparation and delivery, quarantines, cancellations, disruptions to supply chains and customer activity, as well as general concern and uncertainty. Health crises caused by outbreaks, such as the coronavirus outbreak, may exacerbate other pre-existing political, social and economic risks and disrupt normal market conditions and operations. The impact of this outbreak has negatively affected the worldwide economy, the economies of individual countries, individual companies, and the market in general, and may continue to do so in significant and unforeseen ways, as may other epidemics and pandemics that may arise in the future. Any such impact could adversely affect the Fund’s performance, or the performance of the securities in which the Fund invests.
11 Subsequent Event
On October 8, 2020, Morgan Stanley and Eaton Vance Corp. (“Eaton Vance”) announced that they had entered into a definitive agreement under which Morgan Stanley would acquire Eaton Vance. Under the Investment Company Act of 1940, as amended, consummation of this transaction may result in the automatic termination of the Fund’s investment advisory agreement, and any related sub-advisory agreement(s), if applicable. Thus, the Fund’s Board will be asked to approve a new investment advisory agreement (and new sub-advisory agreement(s), if applicable). If approved by the Fund’s Board, the new investment advisory agreement (and new sub-advisory agreement(s), if applicable) is expected to be presented to Fund shareholders for approval, and, if approved, would take effect upon the closing of the transaction.
Eaton Vance
Short Duration Municipal Opportunities Fund
September 30, 2020
Board of Trustees’ Contract Approval
Overview of the Contract Review Process
The Investment Company Act of 1940, as amended (the “1940 Act”), provides, in substance, that the investment advisory agreement between a fund and its investment adviser will continue in effect from year-to-year only if its continuation is approved on an annual basis by a vote of the fund’s board of trustees, including a majority of the trustees who are not “interested persons” of the fund (“independent trustees”), cast in person at a meeting called for the purpose of considering such approval.
At a meeting held on April 22, 2020 (the “April 2020 Meeting”), the Boards of Trustees/Directors comprised of the same individuals (collectively, the “Board”) that oversees a majority of the registered investment companies advised by Eaton Vance Management or its affiliate, Boston Management and Research (the “Eaton Vance Funds”), including a majority of the independent trustees (the “Independent Trustees”), voted to approve the continuation of existing investment advisory agreements and sub-advisory agreements(1) for each of the Eaton Vance Funds for an additional one-year period. The Board relied upon the affirmative recommendation of its Contract Review Committee, which is a committee exclusively comprised of Independent Trustees. Prior to making its recommendation, the Contract Review Committee reviewed information furnished by the adviser and sub-adviser to each of the Eaton Vance Funds (including information specifically requested by the Board) for a series of formal meetings held between February and April 2020. Members of the Contract Review Committee also considered information received at prior meetings of the Board and its committees, to the extent such information was relevant to the Contract Review Committee’s annual evaluation of the investment advisory agreements and sub-advisory agreements.
In connection with its evaluation of the investment advisory agreements and sub-advisory agreements, the Board considered various information relating to the Eaton Vance Funds. This included information applicable to all or groups of Eaton Vance Funds, which is referenced immediately below, and information applicable to the particular Eaton Vance Fund covered by this report (additional fund-specific information is referenced below under “Results of the Contract Review Process”). (For funds that invest through one or more underlying portfolios, references to “each fund” in this section may include information that was considered at the portfolio-level.)
Information about Fees, Performance and Expenses
| | • | | A report from an independent data provider comparing advisory and other fees paid by each fund to such fees paid by comparable funds, as identified by the independent data provider (“comparable funds”); |
| | • | | A report from an independent data provider comparing each fund’s total expense ratio (and its components) to those of comparable funds; |
| | • | | A report from an independent data provider comparing the investment performance of each fund (including, as relevant, total return data, income data, Sharpe ratios and information ratios) to the investment performance of comparable funds and, as applicable, benchmark indices, over various time periods; |
| | • | | In certain instances, data regarding investment performance relative to customized groups of peer funds and blended indices identified by the adviser in consultation with the Portfolio Management Committee of the Board; |
| | • | | Comparative information concerning the fees charged and services provided by the adviser and sub-adviser to each fund in managing other accounts (which may include other mutual funds, collective investment funds and institutional accounts) using investment strategies and techniques similar to those used in managing such fund(s), if any; |
| | • | | Profitability analyses with respect to the adviser and sub-adviser to each of the funds; |
Information about Portfolio Management and Trading
| | • | | Descriptions of the investment management services provided to each fund, as well as each of the funds’ investment strategies and policies; |
| | • | | The procedures and processes used to determine the fair value of fund assets, when necessary, and actions taken to monitor and test the effectiveness of such procedures and processes; |
| | • | | Information about the policies and practices of each fund’s adviser and sub-adviser (in the context of a sub-adviser, only those with trading responsibilities) with respect to trading, including their processes for seeking best execution of portfolio transactions; |
| | • | | Information about the allocation of brokerage transactions and the benefits, if any, received by the adviser and sub-adviser (in the context of a sub-adviser, only those with trading responsibilities) to each fund as a result of brokerage allocation, including, as applicable, information concerning the acquisition of research through client commission arrangements and policies with respect to “soft dollars”; |
| | • | | Data relating to the portfolio turnover rate of each fund; |
Information about each Adviser and Sub-adviser
| | • | | Reports detailing the financial results and condition of the adviser and sub-adviser to each fund; |
| | • | | Information regarding the individual investment professionals whose responsibilities include portfolio management and investment research for the funds, and, for portfolio managers and certain other investment professionals, information relating to their responsibilities with respect to managing other mutual funds and investment accounts, as applicable; |
| | • | | The Code of Ethics of the adviser and its affiliates and the sub-adviser of each fund, together with information relating to compliance with, and the administration of, such codes; |
| (1) | Not all Eaton Vance Funds have entered into a sub-advisory agreement with a sub-adviser. Accordingly, references to “sub-adviser” or “sub-advisory agreement” in this “Overview” section may not be applicable to the particular Eaton Vance Fund covered by this report. |
Eaton Vance
Short Duration Municipal Opportunities Fund
September 30, 2020
Board of Trustees’ Contract Approval — continued
| | • | | Policies and procedures relating to proxy voting and the handling of corporate actions and class actions; |
| | • | | Information concerning the resources devoted to compliance efforts undertaken by the adviser and its affiliates and the sub-adviser of each fund, if any, including descriptions of their various compliance programs and their record of compliance; |
| | • | | Information concerning the business continuity and disaster recovery plans of the adviser and its affiliates and the sub-adviser of each fund, if any; |
| | • | | A description of Eaton Vance Management’s and Boston Management and Research’s oversight of sub-advisers, including with respect to regulatory and compliance issues, investment management and other matters; |
Other Relevant Information
| | • | | Information concerning the nature, cost and character of the administrative and other non-investment advisory services provided by Eaton Vance Management and its affiliates; |
| | • | | Information concerning oversight of the relationship with the custodian, subcustodians and fund accountants by the adviser and/or administrator to each of the funds; |
| | • | | For an Eaton Vance Fund structured as an exchange-listed closed-end fund, information concerning the benefits of the closed-end fund structure, as well as, where relevant, the closed-end fund’s market prices, trading volume data, distribution rates and other relevant matters; and |
| | • | | The terms of each investment advisory agreement and sub-advisory agreement. |
During the various meetings of the Board and its committees throughout the twelve months ended April 2020, the Trustees received information from portfolio managers and other investment professionals of the advisers and sub-advisers of the funds regarding investment and performance matters, and considered various investment and trading strategies used in pursuing the funds’ investment objectives. The Trustees also received information regarding risk management techniques employed in connection with the management of the funds. The Board and its committees evaluated issues pertaining to industry and regulatory developments, compliance procedures, fund governance and other issues with respect to the funds, and received and participated in reports and presentations provided by Eaton Vance Management, Boston Management and Research and fund sub-advisers, with respect to such matters. In addition to the formal meetings of the Board and its committees, the Independent Trustees held regular teleconferences to discuss, among other topics, matters relating to the continuation of investment advisory agreements and sub-advisory agreements.
The Contract Review Committee was advised throughout the contract review process by Goodwin Procter LLP, independent legal counsel for the Independent Trustees. The members of the Contract Review Committee, with the advice of such counsel, exercised their own business judgment in determining the material factors to be considered in evaluating each investment advisory agreement and sub-advisory agreement and the weight to be given to each such factor. The conclusions reached with respect to each investment advisory agreement and sub-advisory agreement were based on a comprehensive evaluation of all the information provided and not any single factor. Moreover, each member of the Contract Review Committee may have placed varying emphasis on particular factors in reaching conclusions with respect to each investment advisory agreement and sub-advisory agreement. In evaluating each investment advisory agreement and sub-advisory agreement, including the fee structures and other terms contained in such agreements, the members of the Contract Review Committee were also informed by multiple years of analysis and discussion with the adviser and sub-adviser to each of the Eaton Vance Funds.
In voting its approval of the continuation of existing investment advisory agreements and sub-advisory agreements at the April 2020 Meeting, the Board relied on an order issued by the Securities and Exchange Commission on March 25, 2020, which provided temporary relief from the in-person voting requirements under Section 15 of the 1940 Act in response to the impacts of the COVID-19 pandemic.
Results of the Contract Review Process
Based on its consideration of the foregoing, and such other information it deemed relevant, including the factors and conclusions described below, the Contract Review Committee concluded that the continuation of the investment advisory and administrative agreement between Eaton Vance Short Duration Municipal Opportunities Fund (the “Fund”) and Eaton Vance Management (the “Adviser”), including its fee structure, is in the interests of shareholders and, therefore, recommended to the Board approval of the agreement. Based on the recommendation of the Contract Review Committee, the Board, including a majority of the Independent Trustees, voted to approve continuation of the investment advisory and administrative agreement for the Fund.
Nature, Extent and Quality of Services
In considering whether to approve the investment advisory and administrative agreement for the Fund, the Board evaluated the nature, extent and quality of services provided to the Fund by the Adviser.
The Board considered the Adviser’s management capabilities and investment processes in light of the types of investments held by the Fund, including the education, experience and number of investment professionals and other personnel who provide portfolio management, investment research, and similar services to the Fund. In particular, the Board considered, where relevant, the abilities and experience of the Adviser’s investment professionals in analyzing factors such as credit risk, tax efficiency, and special considerations relevant to investing in municipal obligations. The Board considered the Adviser’s municipal bond team, which includes investment professionals and credit specialists who provide services to the Fund. The Board also took into account the resources dedicated to portfolio management and other services, the compensation methods of the Adviser and other factors, including the reputation
Eaton Vance
Short Duration Municipal Opportunities Fund
September 30, 2020
Board of Trustees’ Contract Approval — continued
and resources of the Adviser to recruit and retain highly qualified research, advisory and supervisory investment professionals. In addition, the Board considered the time and attention devoted to the Eaton Vance Funds, including the Fund, by senior management, as well as the infrastructure, operational capabilities and support staff in place to assist in the portfolio management and operations of the Fund, including the provision of administrative services. The Board also considered the business-related and other risks to which the Adviser or its affiliates may be subject in managing the Fund.
The Board considered the compliance programs of the Adviser and relevant affiliates thereof. The Board considered compliance and reporting matters regarding, among other things, personal trading by investment professionals, disclosure of portfolio holdings, late trading, frequent trading, portfolio valuation, business continuity and the allocation of investment opportunities. The Board also considered the responses of the Adviser and its affiliates to requests in recent years from regulatory authorities, such as the Securities and Exchange Commission and the Financial Industry Regulatory Authority.
The Board considered other administrative services provided or overseen by Eaton Vance Management and its affiliates, including transfer agency and accounting services. The Board evaluated the benefits to shareholders of investing in a fund that is a part of a large fund complex offering exposure to a variety of asset classes and investment disciplines, as well as the ability, in many cases, to exchange an investment among different funds without incurring additional sales charges.
After consideration of the foregoing factors, among others, the Board concluded that the nature, extent and quality of services provided by the Adviser, taken as a whole, are appropriate and consistent with the terms of the investment advisory and administrative agreement.
Fund Performance
The Board compared the Fund’s investment performance to that of comparable funds identified by an independent data provider (the peer group), as well as appropriate benchmark indices. The Board’s review included comparative performance data with respect to the Fund for the one-, three-, five- and ten-year periods ended September 30, 2019. In this regard, the Board noted that the performance of the Fund was higher than the median performance of the Fund’s peer group for the three-year period. The Board also noted that the performance of the Fund was higher than its primary benchmark index and lower than its secondary benchmark index for the three-year period. The Board concluded that the performance of the Fund was satisfactory.
Management Fees and Expenses
The Board considered contractual fee rates payable by the Fund for advisory and administrative services (referred to collectively as “management fees”). As part of its review, the Board considered the Fund’s management fees and total expense ratio for the one-year period ended September 30, 2019, as compared to those of comparable funds, before and after giving effect to any undertaking to waive fees or reimburse expenses. The Board also considered certain factors identified by management in response to inquiries from the Contract Review Committee regarding the Fund’s total expense ratio relative to comparable funds.
After considering the foregoing information, and in light of the nature, extent and quality of the services provided by the Adviser, the Board concluded that the management fees charged for advisory and related services are reasonable.
Profitability and “Fall-Out” Benefits
The Board considered the level of profits realized by the Adviser and relevant affiliates thereof in providing investment advisory and administrative services to the Fund and to all Eaton Vance Funds as a group. The Board considered the level of profits realized without regard to marketing support or other payments by the Adviser and its affiliates to third parties in respect of distribution or other services.
The Board concluded that, in light of the foregoing factors and the nature, extent and quality of the services rendered, the profits realized by the Adviser and its affiliates are deemed not to be excessive.
The Board also considered direct or indirect fall-out benefits received by the Adviser and its affiliates in connection with their respective relationships with the Fund, including the benefits of research services that may be available to the Adviser as a result of securities transactions effected for the Fund and other investment advisory clients.
Economies of Scale
In reviewing management fees and profitability, the Board also considered the extent to which the Adviser and its affiliates, on the one hand, and the Fund, on the other hand, can expect to realize benefits from economies of scale as the assets of the Fund increase. The Board acknowledged the difficulty in accurately measuring the benefits resulting from economies of scale, if any, with respect to the management of any specific fund or group of funds. The Board reviewed data summarizing the increases and decreases in the assets of the Fund and of all Eaton Vance Funds as a group over various time periods, and evaluated the extent to which the total expense ratio of the Fund and the profitability of the Adviser and its affiliates may have been affected by such increases or decreases. Based upon the foregoing, the Board concluded that the Fund currently shares in the benefits from economies of scale, if any, when they are realized by the Adviser. The Board also concluded that the structure of the advisory fee, which includes breakpoints at several asset levels, will allow the Fund to continue to benefit from any economies of scale in the future.
Eaton Vance
Short Duration Municipal Opportunities Fund
September 30, 2020
Liquidity Risk Management Program
The Fund has implemented a written liquidity risk management program (Program) and related procedures to manage its liquidity in accordance with Rule 22e-4 under the Investment Company Act of 1940, as amended (Liquidity Rule). The Liquidity Rule defines “liquidity risk” as the risk that a fund could not meet requests to redeem shares issued by the fund without significant dilution of the remaining investors’ interests in the fund. The Fund’s Board of Trustees/Directors has designated the investment adviser to serve as the administrator of the Program and the related procedures. The administrator has established a Liquidity Risk Management Oversight Committee (Committee) to perform the functions necessary to administer the Program. As part of the Program, the administrator is responsible for identifying illiquid investments and categorizing the relative liquidity of the Fund’s investments in accordance with the Liquidity Rule. Under the Program, the administrator assesses, manages, and periodically reviews the Fund’s liquidity risk, and is responsible for making certain reports to the Fund’s Board of Trustees/Directors and the Securities and Exchange Commission (SEC) regarding the liquidity of the Fund’s investments, and to notify the Board of Trustees/Directors and the SEC of certain liquidity events specified in the Liquidity Rule. The liquidity of the Fund’s portfolio investments is determined based on a number of factors including, but not limited to, relevant market, trading and investment-specific considerations under the Program.
At a meeting of the Fund’s Board of Trustees/Directors, the Committee provided a written report to the Fund’s Board of Trustees/Directors pertaining to the operation, adequacy, and effectiveness of implementation of the Program, as well as the operation of the highly liquid investment minimum (if applicable) for the period December 1, 2018 through December 31, 2019 (Review Period). The Program operated effectively during the Review Period, supporting the administrator’s ability to assess, manage and monitor Fund liquidity risk, including during periods of market volatility and net redemptions. During the Review Period, the Fund met redemption requests on a timely basis.
There can be no assurance that the Program will achieve its objectives in the future. Please refer to the Fund’s prospectus for more information regarding the Fund’s exposure to liquidity risk and other principal risks to which an investment in the Fund may be subject.
Eaton Vance
Short Duration Municipal Opportunities Fund
September 30, 2020
Officers and Trustees
Officers
Eric A. Stein
President
Maureen A. Gemma
Vice President, Secretary and Chief Legal Officer
James F. Kirchner
Treasurer
Richard F. Froio
Chief Compliance Officer
Trustees
William H. Park
Chairperson
Thomas E. Faust Jr.*
Mark R. Fetting
Cynthia E. Frost
George J. Gorman
Valerie A. Mosley
Helen Frame Peters
Keith Quinton
Marcus L. Smith
Susan J. Sutherland
Scott E. Wennerholm
Eaton Vance Funds
IMPORTANT NOTICES
Privacy. The Eaton Vance organization is committed to ensuring your financial privacy. Each entity listed below has adopted a privacy policy and procedures (“Privacy Program”) Eaton Vance believes is reasonably designed to protect your personal information and to govern when and with whom Eaton Vance may share your personal information.
| • | | At the time of opening an account, Eaton Vance generally requires you to provide us with certain information such as name, address, social security number, tax status, account numbers, and account balances. This information is necessary for us to both open an account for you and to allow us to satisfy legal requirements such as applicable anti-money laundering reviews and know-your-customer requirements. |
| • | | On an ongoing basis, in the normal course of servicing your account, Eaton Vance may share your information with unaffiliated third parties that perform various services for Eaton Vance and/or your account. These third parties include transfer agents, custodians, broker/dealers and our professional advisers, including auditors, accountants, and legal counsel. Eaton Vance may additionally share your personal information with our affiliates. |
| • | | We believe our Privacy Program is reasonably designed to protect the confidentiality of your personal information and to prevent unauthorized access to that information. |
| • | | We reserve the right to change our Privacy Program at any time upon proper notification to you. You may want to review our Privacy Program periodically for changes by accessing the link on our homepage: www.eatonvance.com. |
Our pledge of protecting your personal information applies to the following entities within the Eaton Vance organization: the Eaton Vance Family of Funds, Eaton Vance Management, Eaton Vance Investment Counsel, Eaton Vance Distributors, Inc., Eaton Vance Trust Company, Eaton Vance Management (International) Limited, Eaton Vance Advisers International Ltd., Eaton Vance Global Advisors Limited, Eaton Vance Management’s Real Estate Investment Group, Boston Management and Research, Calvert Research and Management, and Calvert Funds. This Privacy Notice supersedes all previously issued privacy disclosures. For more information about our Privacy Program or about how your personal information may be used, please call 1-800-262-1122.
Delivery of Shareholder Documents. The Securities and Exchange Commission (SEC) permits funds to deliver only one copy of shareholder documents, including prospectuses, proxy statements and shareholder reports, to fund investors with multiple accounts at the same residential or post office box address. This practice is often called “householding” and it helps eliminate duplicate mailings to shareholders. Eaton Vance, or your financial intermediary, may household the mailing of your documents indefinitely unless you instruct Eaton Vance, or your financial intermediary, otherwise. If you would prefer that your Eaton Vance documents not be householded, please contact Eaton Vance at 1-800-262-1122, or contact your financial intermediary. Your instructions that householding not apply to delivery of your Eaton Vance documents will typically be effective within 30 days of receipt by Eaton Vance or your financial intermediary.
Portfolio Holdings. Each Eaton Vance Fund and its underlying Portfolio(s) (if applicable) files a schedule of portfolio holdings on Part F to Form N-PORT with the SEC. Certain information filed on Form N-PORT may be viewed on the Eaton Vance website at www.eatonvance.com, by calling Eaton Vance at 1-800-262-1122 or in the EDGAR database on the SEC’s website at www.sec.gov.
Proxy Voting. From time to time, funds are required to vote proxies related to the securities held by the funds. The Eaton Vance Funds or their underlying Portfolios (if applicable) vote proxies according to a set of policies and procedures approved by the Funds’ and Portfolios’ Boards. You may obtain a description of these policies and procedures and information on how the Funds or Portfolios voted proxies relating to portfolio securities during the most recent 12-month period ended June 30, without charge, upon request, by calling 1-800-262-1122 and by accessing the SEC’s website at www.sec.gov.
This Page Intentionally Left Blank
Investment Adviser and Administrator
Eaton Vance Management
Two International Place
Boston, MA 02110
Principal Underwriter*
Eaton Vance Distributors, Inc.
Two International Place
Boston, MA 02110
(617) 482-8260
Custodian
State Street Bank and Trust Company
State Street Financial Center, One Lincoln Street
Boston, MA 02111
Transfer Agent
BNY Mellon Investment Servicing (US) Inc.
Attn: Eaton Vance Funds
P.O. Box 9653
Providence, RI 02940-9653
(800) 262-1122
Fund Offices
Two International Place
Boston, MA 02110
| * | FINRA BrokerCheck. Investors may check the background of their Investment Professional by contacting the Financial Industry Regulatory Authority (FINRA). FINRA BrokerCheck is a free tool to help investors check the professional background of current and former FINRA-registered securities firms and brokers. FINRA BrokerCheck is available by calling 1-800-289-9999 and at www.FINRA.org. The FINRA BrokerCheck brochure describing this program is available to investors at www.FINRA.org. |

23358 9.30.20
Not required in this filing.
| Item 3. | Audit Committee Financial Expert |
Not required in this filing.
| Item 4. | Principal Accountant Fees and Services |
Not required in this filing.
| Item 5. | Audit Committee of Listed Registrants |
Not applicable.
| Item 6. | Schedule of Investments |
Please see schedule of investments contained in the Report to Stockholders included under Item 1 of this Form N-CSR.
| Item 7. | Disclosure of Proxy Voting Policies and Procedures for Closed-End Management Investment Companies |
Not applicable.
| Item 8. | Portfolio Managers of Closed-End Management Investment Companies |
Not applicable.
| Item 9. | Purchases of Equity Securities by Closed-End Management Investment Company and Affiliated Purchasers |
Not applicable.
| Item 10. | Submission of Matters to a Vote of Security Holders |
No material changes.
| Item 11. | Controls and Procedures |
(a) It is the conclusion of the registrant’s principal executive officer and principal financial officer that the effectiveness of the registrant’s current disclosure controls and procedures (such disclosure controls and procedures having been evaluated within 90 days of the date of this filing) provide reasonable assurance that the information required to be disclosed by the registrant has been recorded, processed, summarized and reported within the time period specified in the Commission’s rules and forms and that the information required to be disclosed by the registrant has been accumulated and communicated to the registrant’s principal executive officer and principal financial officer in order to allow timely decisions regarding required disclosure.
(b) There have been no changes in the registrant’s internal controls over financial reporting during the period covered by this report that has materially affected, or is reasonably likely to materially affect, the registrant’s internal control over financial reporting.
| Item 12. | Disclosure of Securities Lending Activities for Closed-End Management Investment Companies |
Not applicable.
Signatures
Pursuant to the requirements of the Securities Exchange Act of 1934 and the Investment Company Act of 1940, the registrant has duly caused this report to be signed on its behalf by the undersigned, thereunto duly authorized.
| | |
| Eaton Vance Investment Trust |
| |
| By: | | /s/ Eric A. Stein |
| | Eric A. Stein |
| | President |
| |
| Date: | | November 23, 2020 |
Pursuant to the requirements of the Securities Exchange Act of 1934 and the Investment Company Act of 1940, this report has been signed below by the following persons on behalf of the registrant and in the capacities and on the dates indicated.
| | |
| By: | | /s/ James F. Kirchner |
| | James F. Kirchner |
| | Treasurer |
| |
| Date: | | November 23, 2020 |
| |
| By: | | /s/ Eric A. Stein |
| | Eric A. Stein |
| | President |
| |
| Date: | | November 23, 2020 |