 1 Earnings Conference Call 3 rd Quarter 2007 October 26, 2007 Exhibit 99.2 |
 2 Forward-Looking Statements This presentation includes forward-looking statements within the meaning of the Private Securities Litigation Reform Act of 1995, that are subject to risks and uncertainties. The factors that could cause actual results to differ materially from these forward-looking statements include those discussed herein as well as those discussed in (1) Exelon’s 2006 Annual Report on Form 10-K in (a) ITEM 1A. Risk Factors, (b) ITEM 7. Management’s Discussion and Analysis of Financial Condition and Results of Operations and (c) ITEM 8. Financial Statements and Supplementary Data: Note 18; (2) Exelon’s Third Quarter 2007 Quarterly Report on Form 10-Q (to be filed on October 26, 2007) in (a) Part II, Other Information, ITEM 1A. Risk Factors and (b) Part I, Financial Information, ITEM 1. Financial Statements: Note 13; and (3) other factors discussed in filings with the Securities and Exchange Commission by Exelon Corporation, Exelon Generation Company, LLC, Commonwealth Edison Company, and PECO Energy Company (Companies). Readers are cautioned not to place undue reliance on these forward-looking statements, which apply only as of the date of this presentation. None of the Companies undertakes any obligation to publicly release any revision to its forward- looking statements to reflect events or circumstances after the date of this presentation. This presentation includes references to adjusted (non-GAAP) operating earnings that exclude the impact of certain factors. We believe that these adjusted operating earnings are representative of the underlying operational results of the company. Please refer to the attachments to the earnings release and the appendix to this presentation for a reconciliation of adjusted (non-GAAP) operating earnings to GAAP earnings. |
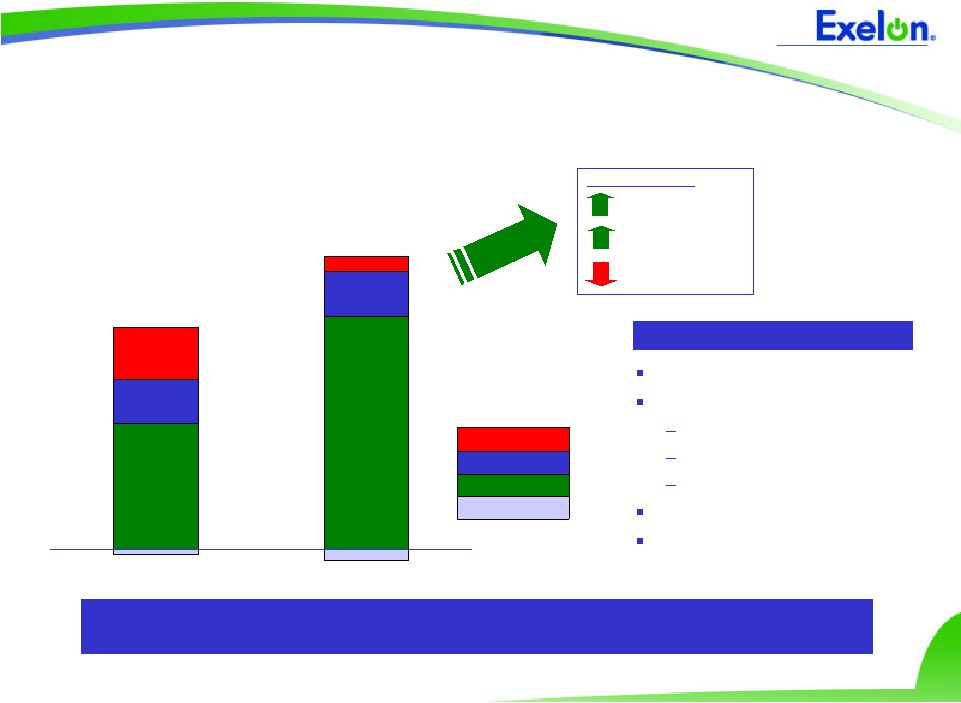
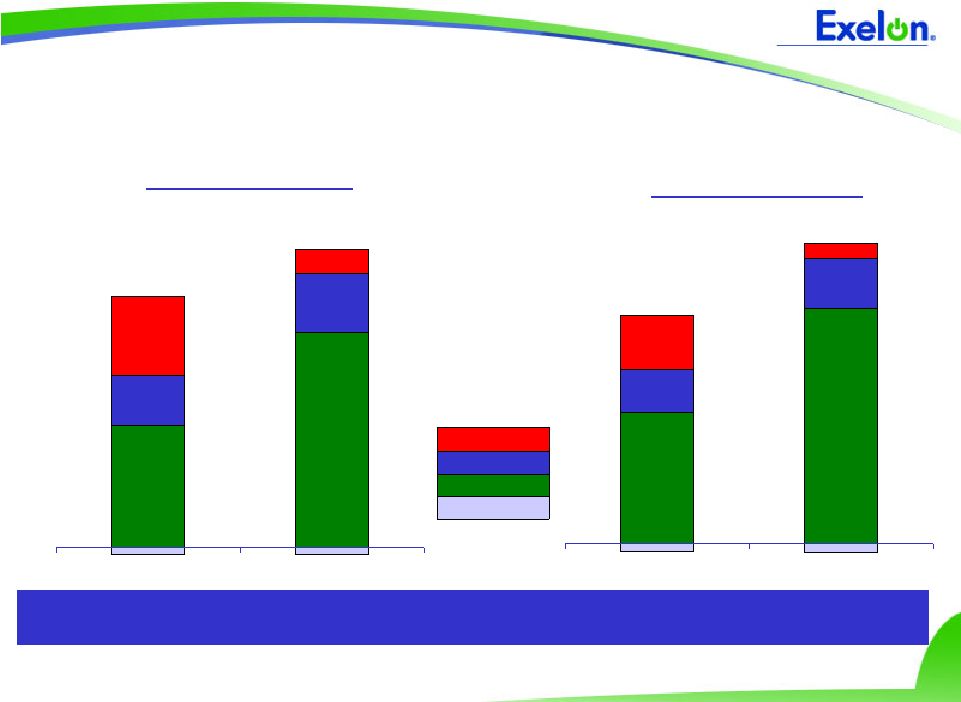 3 2006 2007 Exelon Operating EPS $1.21 Exelon’s strong performance for the third quarter was driven primarily by increased earnings at Exelon Generation, which were partially offset by the expected decrease in ComEd earnings $0.90 $0.25 $0.10 HoldCo/Other ExGen PECO ComEd Third Quarter (Q3) 2006 2007 $2.50 $1.49 $0.61 $0.49 $3.31 $2.67 $0.17 $0.58 $1.02 $0.51 $0.33 $0.21 Year-to-Date (YTD) Refer to Earnings Release Attachments for additional details on Q3 and YTD earnings and to the Appendix for a reconciliation of adjusted (non-GAAP) operating EPS to GAAP EPS. |
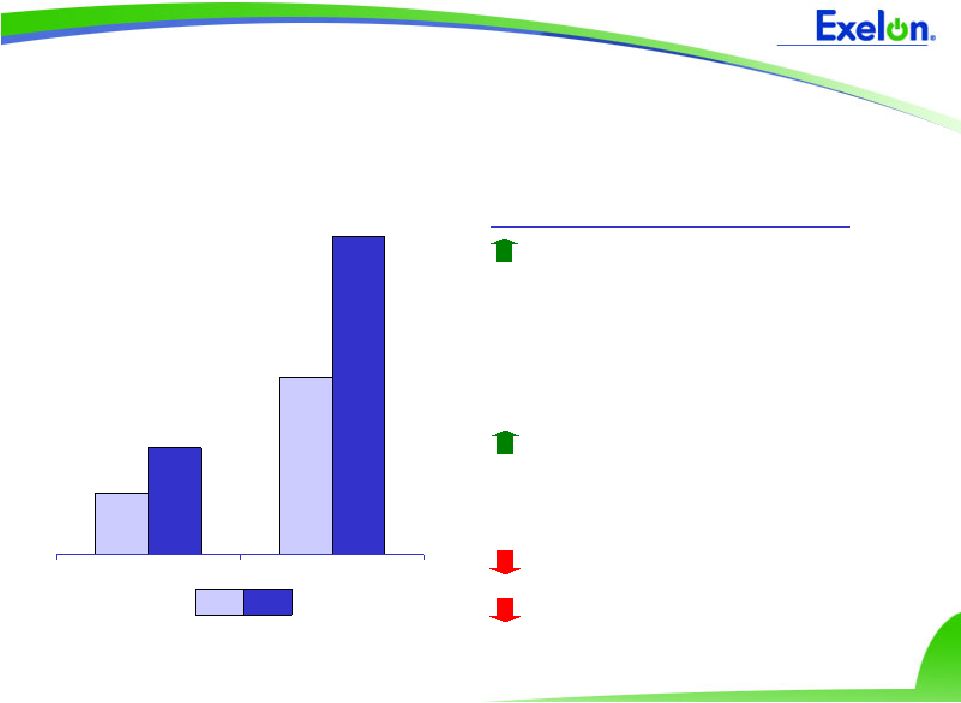 4 Exelon Generation Operating EPS Q3 YTD $0.51 $0.90 Key Drivers – Q3 ’07 vs. Q3 ’06* Higher wholesale margins • End of the below-market PPA with ComEd • Contractual price increase associated with the PECO PPA • Favorable market and portfolio conditions Nuclear refueling outages • Lower number of refueling outage days during the quarter favorably impacted margins and outage costs Lower hydro generation Labor-related inflation and nuclear plant development costs $2.67 $1.49 2007 2006 *Refer to the Earnings Release Attachments for additional details. Refer to the Appendix for a reconciliation of adjusted (non-GAAP) operating EPS to GAAP EPS |
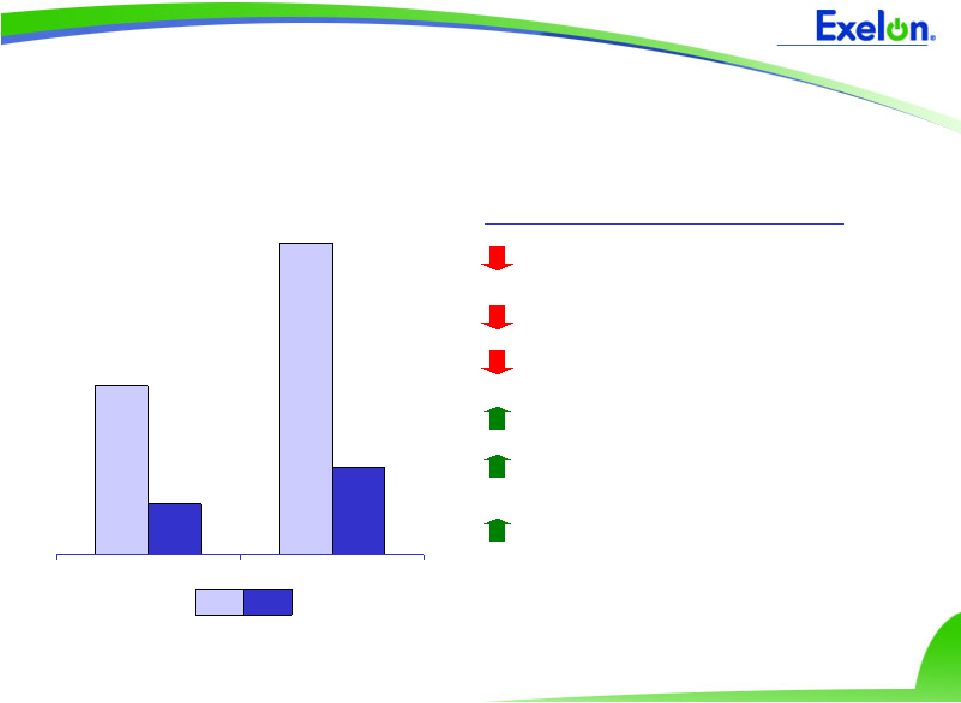 5 Q3 YTD ComEd Operating EPS $0.33 $0.10 Key Drivers – Q3 ’07 vs. Q3 ’06* End of the regulatory transition period in IL Higher storm costs One-time 2006 benefit for environmental cost recovery Warmer weather Increased distribution revenues (December 2006 ICC Rate Order) Increased transmission revenues (2007 Transmission Rate Case) $0.17 $0.61 2007 2006 *Refer to the Earnings Release Attachments for additional details. Refer to the Appendix for a reconciliation of adjusted (non-GAAP) operating EPS to GAAP EPS |
 6 ComEd Transmission Case Settlement (1) ($ in millions) FERC Filing 3/1/07 Preliminary Order 6/5/07 Settlement Filing 10/5/07 (1) Total Revenue Requirement (in year 1) (2) $415 $387 $364 Revenue Requirement increase (in year 1) $146 $116 (3) $93 Rate Base (in year 1) $1,826 $1,744 $1,672 (4) Common Equity Ratio 58% 58% 58% (5) Return on Equity (ROE) (6) 12.20% 11.70% + 0.50% RTO adder 12.20% 11.70% + 0.50% RTO adder 11.50% 11.0% + 0.50% RTO adder Return on Rate Base (ROR) 9.87% 9.87% 9.40% Rate settlement establishes reasonable framework for timely recovery of transmission investment on an annual basis through formula rates (1) Subject to final FERC approval (2) Included a request for project incentives of $16 million (3) Rates effective 5/1/07, subject to refund (4) Excludes pension asset; 6.51% debt return allowed in operating expenses (5) Equity cap of 58% for 2 years, declining to 55% by 2011 (6) ROE is fixed and not subject to annual updating RTO = Regional Transmission Organization (Docket Nos. ER07-583-000 & EL07-41-000) |
 7 Formula Transmission Rate Annual Update Process (1) Annual filing by May 15th will update the current year revenue requirement and true-up prior year to actual: Update current year Estimate current year revenue requirement using updated costs based on prior year actual data per FERC Form 1 plus projected plant additions for the current calendar year True-up prior year Perform a true-up of the prior year’s rates by comparing prior year actual data per FERC Form 1 to the estimate used for that year; over/under-recoveries for the prior year are collected in the current year Rates take effect on June 1st Interested parties have 180 days to submit information requests and raise concerns; unresolved concerns go before FERC for resolution The combination of annual updating and true-up virtually eliminates regulatory lag (1) Subject to final FERC approval |
 8 ComEd Delivery Service Rate Case Filing $361 (6) Total ($2,049 million revenue requirement) $(51) Other adjustments (5) $48 O&M expenses $99 Administrative & General expenses (4) $50 Capital Structure (3) : ROE - 10.75% / Common Equity - 45.11% / ROR - 8.55% $215 (2) Rate Base: $7,071 million (1) Requested Revenue Requirement Increase ($ in millions) Revenue increase needed to recover significant distribution system investment and represents an important step in ComEd’s regulatory recovery plan (1) Based on 2006 test year, including pro forma capital additions through 3Q 2008; represents a $1,550 million increase from 2006 ICC order (2) Includes increased depreciation expense associated with capital additions (3) Requested cap structure does not include goodwill; ICC docket 05-0597 allowed 10.045% ROE, 42.86% equity ratio and 8.01% ROR (return on rate base) (4) Primarily includes increases in pension and other post-retirement benefits costs and effects of a reclassification of rental revenue of $20 million, which is offset in “Other adjustments” (5) Includes taxes other than income, regulatory expenses, and reductions for other revenues and load growth (6) Or approximately $359 million adjusted for normal weather |
 9 ComEd Delivery Service Rate Case Filing – Tentative Schedule Filed – October 17, 2007 Rebuttal Testimony – February 2008 Hearings – May 2008 Administrative Law Judge (ALJ) Order – July 2008 Final Order Expected – September 2008 Note: Dates are based on typical approach to rate cases but the Illinois Commerce Commission (ICC) will set the actual schedule. |
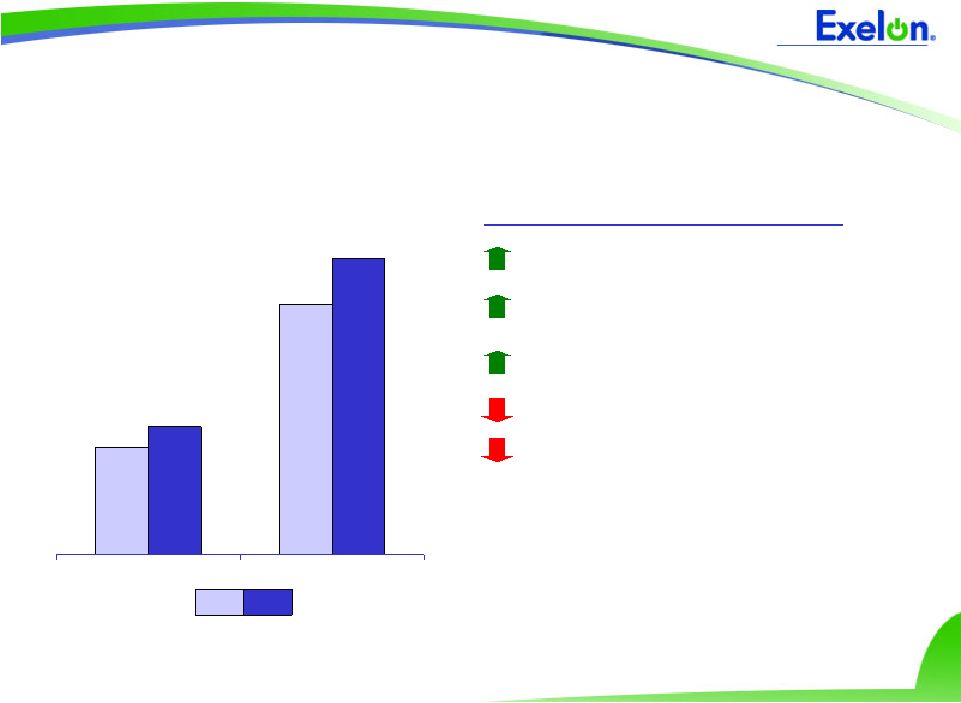 10 Q3 YTD PECO Operating EPS $0.21 $0.25 Key Drivers – Q3 ’07 vs. Q3 ’06* Load growth Reduction in reserve for property taxes (PURTA) Absence of storm costs (2006) Scheduled CTC amortization Favorable tax settlement in 2006 $0.58 $0.49 2007 2006 *Refer to the Earnings Release Attachments for additional details. Refer to the Appendix for a reconciliation of adjusted (non-GAAP) operating EPS to GAAP EPS |
 11 2007 Operating EPS Guidance (1) $3.22 $0.78 $0.67 $1.88 $0.65 - $0.70 $3.45 - $3.55 $4.15 - $4.30 $0.20 - $0.25 2006 Operating EPS Actual $ / Share HoldCo/Other ExGen PECO ComEd $0.60 - $0.63 (1) Earnings Guidance; Operating EPS Guidance revised on 9/4/07 from previous range of $4.00 - $4.30 per share (2) GAAP Guidance revised on 10/26/07 from previous range of $3.70 - $4.00 per share 2007 and Beyond Exelon Generation ComEd PECO Exelon expects to see robust earnings growth over next five years driven by Exelon Generation and ComEd’s recovery Operating EPS (1) : $4.15 - $4.30 per share GAAP EPS (2) : $3.90 - $4.20 per share 2007 Operating Earnings Guidance ComEd regulatory recovery plan Improving market fundamentals Gas prices Capacity values Heat rates End of IL and PA transition periods Carbon regulation Earnings Drivers |
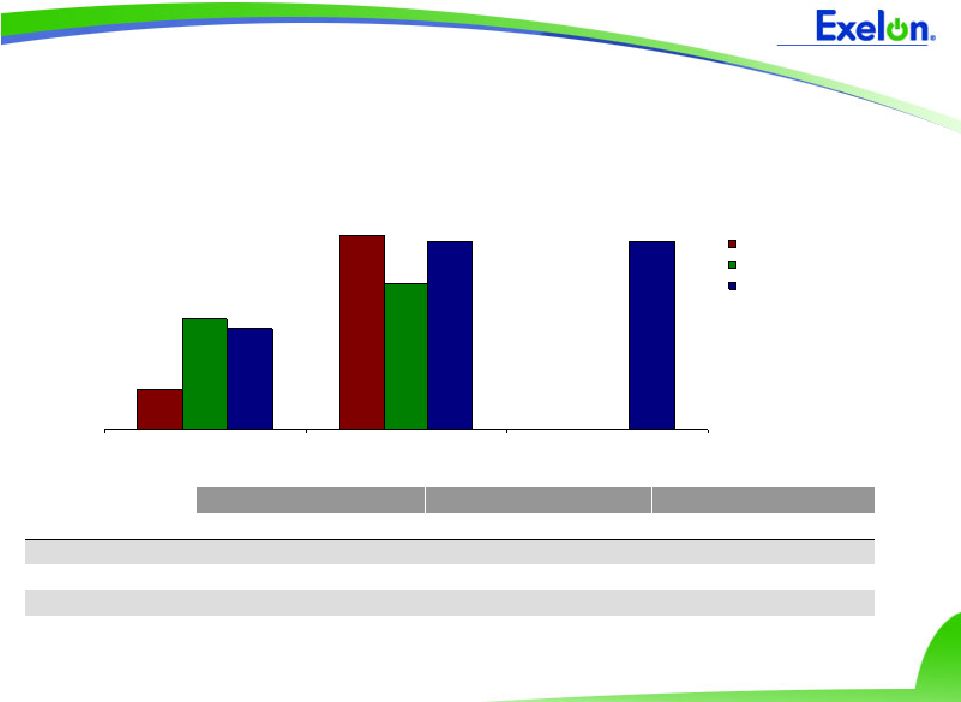 12 Reliability Pricing Model Auction 40.80 197.67 111.92 148.80 191.32 191.32 102.04 Rest of Market Eastern MAAC MAAC + APS 2007/2008 2008/2009 2009/2010 0 1,500 MW N/A N/A N/A N/A MAAC + APS (7) 9,750 - 9,950 MW (3) 9,500 MW 9,550 - 9,850 MW (3) 9,500 MW 9,500 - 9,800 MW (3) 9,500 MW Eastern MAAC 4,750 - 4,950 MW (6) 12,700 MW 6,600 - 6,800 MW 14,500 MW (5) 6,600 - 6,800 MW 16,000 MW (4) Rest of Market Obligation Capacity (2) Obligation Capacity (2) Obligation Capacity (2) 2009 / 2010 2008 / 2009 2007 / 2008 Exelon Generation Participation within PJM Reliability Pricing Model (1) PJM RPM Auction Results ($/MW day) (6) In 09/10, obligation is reduced due to roll-off of part of ComEd auction load obligation in May 2009 (3) EMAAC obligation consists of load from PECO and BGS commitments (7) MAAC = Mid-Atlantic Area Council; APS = Allegheny Power System (5) 08/09 Capacity supply decreased due to roll-off of several purchase power agreements (PPAs) (4) Removing State Line from the supply in October 2007 reduces this by 515 MW (2) All capacity values are in installed capacity terms (summer ratings) (1) All values are approximate and not inclusive of wholesale transactions |
 13 Appendix – GAAP Reconciliation |
 14 GAAP EPS Reconciliation Three Months Ended September 30, 2006 1.02 (0.03) 0.21 0.33 0.51 2006 Adjusted (non-GAAP) Operating Earnings (Loss) Per Share (0.08) - - (0.08) - Recovery of debt costs at ComEd 1.15 - - 1.15 - Impairment of ComEd's goodwill 0.02 - - 0.01 0.01 Severance charges 0.06 0.05 0.01 - - Charges related to now terminated merger with PSEG 0.02 0.02 - - - Investments in synthetic fuel-producing facilities (0.08) - - - (0.08) Mark-to-market adjustments from economic hedging activities $(0.07) $(0.10) $0.20 $(0.75) $0.58 2006 GAAP Earnings (Loss) Per Share Exelon Other (1) PECO (1) ComEd (1) ExGen (1) Note: Amounts may not add due to rounding (1) Amounts shown per Exelon share and represent contributions to Exelon's EPS |
 15 GAAP EPS Reconciliation Three Months Ended September 30, 2007 Note: Amounts may not add due to rounding (1) Amounts shown per Exelon share and represent contributions to Exelon's EPS 1.21 (0.04) 0.25 0.10 0.90 2007 Adjusted (non-GAAP) Operating Earnings (Loss) Per Share (0.03) - - - (0.03) Nuclear decommissioning obligation reduction 0.12 - - - 0.12 2007 Illinois electric rate settlement (0.03) (0.03) - - - Investments in synthetic fuel-producing facilities $1.15 $(0.01) $0.25 $0.10 $0.81 2007 GAAP Earnings (Loss) Per Share Exelon Other (1) PECO (1) ComEd (1) ExGen (1) |
 16 GAAP EPS Reconciliation Nine Months Ended September 30, 2006 2.50 (0.09) 0.49 0.61 1.49 2006 Adjusted (non-GAAP) Operating Earnings (Loss) Per Share (0.08) - - (0.08) - Recovery of debt costs at ComEd 1.15 - - 1.15 - Impairment of ComEd's goodwill 0.02 - - 0.01 0.01 Severance charges (0.13) - - - (0.13) Nuclear decommissioning obligation reduction 0.09 0.06 0.02 0.01 - Charges related to now terminated merger with PSEG 0.08 0.08 - - - Investments in synthetic fuel-producing facilities (0.11) - - - (0.11) Mark-to-market adjustments from economic hedging activities $1.48 $(0.23) $0.47 $(0.48) $1.72 2006 GAAP Earnings (Loss) Per Share Exelon Other (1) PECO (1) ComEd (1) ExGen (1) Note: Amounts may not add due to rounding (1) Amounts shown per Exelon share and represent contributions to Exelon's EPS |
 17 GAAP EPS Reconciliation Nine Months Ended September 30, 2007 Note: Amounts may not add due to rounding (1) Amounts shown per Exelon share and represent contributions to Exelon's EPS Exelon Other (1) PECO (1) ComEd (1) ExGen (1) 3.31 (0.11) 0.58 0.17 2.67 2007 Adjusted (non-GAAP) Operating Earnings (Loss) Per Share (0.01) - - - (0.01) Sale of Generation's investments in TEG and TEP 0.14 - - 0.03 0.11 2007 Illinois electric rate settlement (0.01) - - - (0.01) Settlement of a tax matter at Generation related to Sithe (0.03) - - - (0.03) Nuclear decommissioning obligation reduction (0.10) (0.10) - - - Investments in synthetic fuel-producing facilities 0.12 - - - 0.12 Mark-to-market adjustments from economic hedging activities $3.20 $(0.01) $0.58 $0.14 $2.49 2007 GAAP Earnings (Loss) Per Share |
 18 GAAP EPS Reconciliation Year Ended December 31, 2006 3.22 (0.11) 0.67 0.78 1.88 2006 Adjusted (non-GAAP) Operating Earnings (Loss) Per Share $2.35 $(0.21) $0.65 $(0.17) $2.08 2006 GAAP Earnings (Loss) Per Share - - - - - 0.05 0.04 - Other (1) (0.14) 1.15 (0.08) - 0.01 0.01 - - ComEd (1) - - - (0.13) 0.01 0.01 - (0.09) ExGen (1) - - - - 0.01 0.01 - - PECO (1) Exelon 1.15 Impairment of ComEd’s goodwill (0.08) Recovery of debt costs at ComEd 0.03 Severance charges (0.13) Nuclear decommissioning obligation reduction (0.14) Recovery of severance costs at ComEd 0.09 Charges related to now terminated merger with PSEG 0.04 Investments in synthetic fuel-producing facilities (0.09) Mark-to-market adjustments from economic hedging activities Note: Amounts may not add due to rounding (1) Amounts shown per Exelon share and represent contributions to Exelon's EPS |