Earnings Conference Call 3 Quarter 2008 October 24, 2008 EXHIBIT 99.2 rd |
2 Forward-Looking Statements This presentation includes forward-looking statements within the meaning of the Private Securities Litigation Reform Act of 1995, that are subject to risks and uncertainties. The factors that could cause actual results to differ materially from these forward-looking statements include those discussed herein as well as those discussed in (1) Exelon’s 2007 Annual Report on Form 10-K in (a) ITEM 1A. Risk Factors, (b) ITEM 7. Management’s Discussion and Analysis of Financial Condition and Results of Operations and (c) ITEM 8. Financial Statements and Supplementary Data: Note 19; (2) Exelon’s Third Quarter 2008 Quarterly Report on Form 10-Q (to be filed on October 24, 2008) in (a) Part II, Other Information, ITEM 1A. Risk Factors and (b) Part I, Financial Information, ITEM 1. Financial Statements: Note 12; and (3) other factors discussed in filings with the Securities and Exchange Commission by Exelon Corporation, Exelon Generation Company, LLC, Commonwealth Edison Company, and PECO Energy Company (Companies). Readers are cautioned not to place undue reliance on these forward-looking statements, which apply only as of the date of this presentation. None of the Companies undertakes any obligation to publicly release any revision to its forward-looking statements to reflect events or circumstances after the date of this presentation. This presentation includes references to adjusted (non-GAAP) operating earnings and non- GAAP cash flows that exclude the impact of certain factors. We believe that these adjusted operating earnings and cash flows are representative of the underlying operational results of the Companies. Please refer to the attachments to the earnings release and the appendix to this presentation for a reconciliation of adjusted (non-GAAP) operating earnings to GAAP earnings and non-GAAP cash flows to GAAP cash flows. |
3 Strong Cash Flows and Value Return Note: Cash Flow from Operations primarily includes net cash flows provided by operating activities, excluding counterparty collateral activity, and including net cash flows used in investing activities other than capital expenditures. Cash Flow from Operations in 2005 reflect discretionary pension contributions of $2 billion. Operate well Maintain sufficient liquidity Limit risk Manage the political/regulatory environment Maintaining Focus in Challenging Times $0 $1,000 $2,000 $3,000 $4,000 $5,000 $6,000 2001 2002 2003 2004 2005 2006 2007 2008E $0.00 $0.50 $1.00 $1.50 $2.00 $2.50 Cash flow from operations Annual cash dividend / share Announcing 5% increase in annual dividend to $2.10 We consistently generate strong cash flows and remain committed to creating and returning value to shareholders |
4 Key Financial Messages Q3 operating results of $1.07/share powered by strong Generation fundamentals: Nuclear capacity factor of 97.2% 12% increase in average realized energy margins in 3Q08 compared to 3Q07 Diversified and well-managed counterparty exposure – no single counterparty represented more than 10% of Generation’s net exposure as of September 30 (1) Well-positioned in these turbulent times Strong cash flow from operations – forecasted at over $5 billion this year (2) Sufficient liquidity – $6.8 billion available under credit facilities as of October 20 Minimal near-term debt maturities – $29 million in total through 12/31/09 (3) Expect 2008 operating earnings to be very close to the bottom of $4.15-$4.30/share range Refer to Earnings Release Attachments for additional details and to the Appendix for a reconciliation of adjusted (non-GAAP) operating EPS to GAAP EPS. (1) Does not include credit risk exposure from uranium procurement contracts or exposure through Regional Transmission Organizations, Independent System Operators and New York Mercantile Exchange and Intercontinental Exchange commodity exchanges. Additionally, does not include receivables related to the supplier forward agreements with ComEd and the PPA with PECO. (2) Primarily includes net cash flows provided by operating activities, excluding counterparty collateral activity, and including net cash flows used in investing activities other than capital expenditures. (3) Excludes securitization debt and includes capital leases. Exelon’s financial position and operations are strong th th |
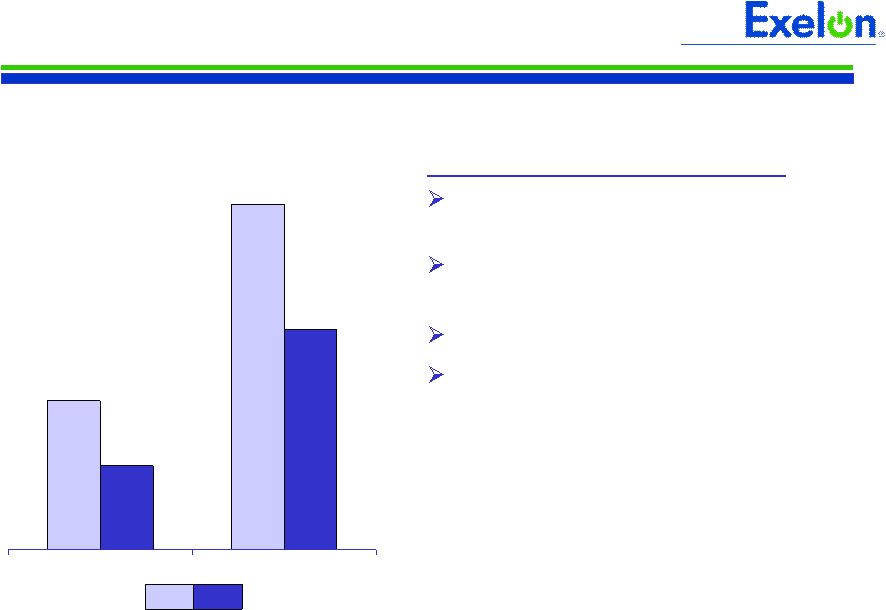
5 $2.67 $2.66 $0.58 $0.37 $0.17 $0.17 2007 2008 $0.90 $0.92 $0.25 $0.14 $0.10 $0.05 2007 2008 Exelon Operating EPS $1.07 HoldCo/Other ExGen PECO ComEd 3rd Quarter (Q3) $3.13 $1.21 Year-to-Date (YTD) Lower operating earnings at ComEd and PECO more than offset higher earnings at Exelon Generation Refer to Earnings Release Attachments for additional details and to the Appendix for a reconciliation of adjusted (non-GAAP) operating EPS to GAAP EPS. $1.15 $1.06 $3.20 $3.06 $3.31 GAAP EPS |
6 Exelon Generation Operating EPS Contribution 3Q YTD $0.90 $0.92 $2.66 $2.67 2008 2007 Key Drivers – Q3 ’08 vs. Q3 ’07* Favorable portfolio/market conditions +$0.08 Nuclear volume +$0.02 Higher O&M costs, reflecting both inflationary pressures and other O&M costs – ($0.04) Reserve associated with Lehman bankruptcy – ($0.02) Costs associated with possible nuclear construction project – ($0.01) *Refer to the Earnings Release Attachments for additional details and to the Appendix for a reconciliation of adjusted (non-GAAP) operating EPS to GAAP EPS |
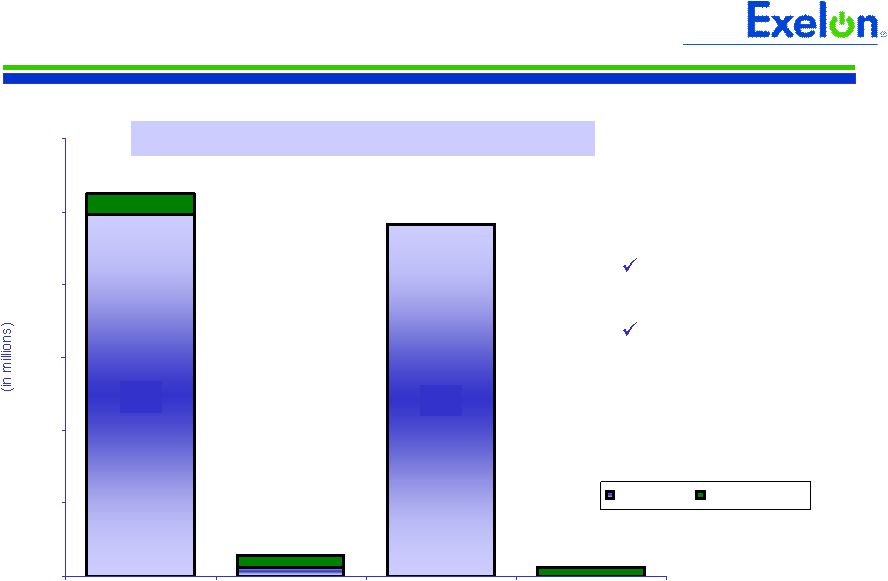
7 Exelon Generation Has Limited Counterparty Exposure Net Exposure After Credit Collateral (1) (in millions) Investment grade $582 Non-investment grade 59 No external ratings 42 Total $683 (1) As of September 30, 2008. Does not include credit risk exposure from uranium procurement contracts or exposure through Regional Transmission Organizations, Independent System Operators and New York Mercantile Exchange and Intercontinental Exchange commodity exchanges. Additionally, does not include receivables related to the supplier forward agreements with ComEd and the PPA with PECO. As of September 30 , no one counterparty represented more than 10% of Exelon Generation’s net exposure from power marketing activities Exelon Generation – Ample Liquidity Aggregate credit facility commitments of $4.8 billion that extend through 2012 – $4.7 billion available as of 10/20/08 Strong balance sheet – A3/BBB Senior Unsecured Rating Net Exposure by Type of Counterparty (1) Coal Producers 13% Financial Institutions 45% Investor-Owned Utilities, Marketers, and Power Producers 38% Other 4% th |
8 3Q YTD Key Drivers – Q3 ’08 vs. Q3 ’07* Weather – ($0.03) Write-offs associated with final distribution rate order – ($0.02) Uncollectible accounts expense – ($0.02) Transmission revenues +$0.01 ComEd Operating EPS Contribution 2008 2007 *Refer to the Earnings Release Attachments for additional details and to the Appendix for a reconciliation of adjusted (non-GAAP) operating EPS to GAAP EPS $0.10 $0.05 $0.17 $0.17 |
9 3Q YTD PECO Operating EPS Contribution Key Drivers – Q3 ’08 vs. Q3 ’07* Uncollectible accounts expense – ($0.04) 2007 reduction in reserve for property taxes – ($0.03) Weather – ($0.02) CTC amortization – ($0.02) 2008 2007 *Refer to the Earnings Release Attachments for additional details and to the Appendix for a reconciliation of adjusted (non-GAAP) operating EPS to GAAP EPS $0.25 $0.14 $0.37 $0.58 |
10 Well-Positioned in These Challenging Times Nuclear – profitable under almost any conceivable set of market conditions Hedging program largely protects against commodity movements in the near term – over 90% financially hedged in 2009 and over 80% financially hedged in 2010 Hedged Against Short-Term Volatility in Commodities $7.3 billion in aggregate credit facility commitments that extend largely through 2012 – $6.8 billion available as of 10/20/08 24 banks committed to the facility – with each bank having less than 10% of the aggregate commitments at Exelon No debt maturities for the remainder of 2008 and $29 million, in total, in FY2009 (1) Sufficient Liquidity Power marketing activities are governed by tight risk management policies – proprietary trading activities are minimal Diversified, high quality counterparties Daily monitoring of positions, exposure and financial condition of counterparties Collateral required from non-investment grade counterparties Financially Disciplined World-class nuclear operations – 94% capacity factor YTD 2008 Constructive rate cases at ComEd and PECO Final ComEd rate order provides for $273.6 million increase in annual distribution revenues PAPUC approval of PECO gas rate agreement provides for $76.5 million increase in annual gas revenues Strong Operations Exelon Position (1) Excludes securitization debt, which is repaid through customer-collected revenues, and includes capital leases. |
11 Generating Strong Cash Flows from Operations… (1) Primarily includes net cash flows provided by operating activities, excluding counterparty collateral activity, and including net cash flows used in investing activities other than capital expenditures. (2) Net Financing (excluding Dividend) = Net cash flows used in financing activities excluding dividends paid on common and preferred stock. (3) Assumes 2008 Dividend of $2.025 per share. (4) Excludes securitization debt, which is repaid through customer-collected revenues, and includes capital leases. 2008 Projected Sources and Uses of Cash $115 Cash available after Dividend ($1,335) Dividend (3) $1,450 Cash available before Dividend ($500) Net Financing (excluding Dividend) (2) ($3,250) Capital Expenditures $5,200 Cash Flow from Operations (1) Exelon $ Millions Our operations are expected to generate over $5 billion of cash flow this year 2008 Financing Plan is complete No required financings or additional maturities remain in 2008 (4) |
12 …with Sufficient Liquidity… (1) Excludes previous commitment from Lehman Brothers Bank. (2) Available Capacity Under Facility represents the unused bank commitments under the borrower’s credit agreements net of outstanding letters of credit. The amount of commercial paper outstanding does not reduce the available capacity under the credit agreements. (3) Includes cash flow activity from Holding Company, eliminations, and other corporate entities. ($160) -- -- ($160) Outstanding Facility Draws ($347) ($175) -- ($166) Outstanding Letters of Credit $7,317 $4,834 $574 $952 Aggregate Bank Commitments (1) $6,810 $4,659 $574 $626 Available Capacity Under Facility (2) ($35) -- ($35) -- Outstanding Commercial Paper $6,775 $4,659 $539 $626 Available Capacity Less Outstanding Commercial Paper Exelon (3) ($ in Millions) We have minimal commercial paper outstanding and our bank facility is largely untapped Available Capacity Under Bank Facility as of October 20, 2008 |
13 …and Minimal Debt Maturities Note: Balances shown for securitization debt represent for ComEd the expected amortization of the transition bonds issued by ComEd Transitional Funding Trust, for PECO the expected amortization of the transition bonds or PECO Energy Transition Trust and for Exelon the aggregate of the expected amortization of such transition bonds. $483 $495 $12 $29 $17 $12 $0 $100 $200 $300 $400 $500 $600 Exelon ComEd PECO Exelon Generation Securitized Nonsecuritized 4Q2008 - FY2009 Debt Maturities No debt maturities remaining in 2008 Excluding securitization debt, only $29 million of debt maturities in 2009 |
14 Appendix |
15 ComEd PECO Q3 YTD Q3 YTD Customer Growth 0.3% 0.7% 0.5% 0.4% Utilization (UPC Growth) (1.1%) 0.1% 1.9% 2.1% Weather (9.0%) (4.9%) (4.7%) (3.7%) Change in Residential Deliveries (9.8%) (4.1%) (2.3%) (1.2%) ComEd and PECO Facing Lower than Forecasted Load Growth Residential Load Growth Statistics ComEd 2008 Weather- Normalized Total Deliveries 0.8% 0.2% 0.7% 2.3% Q3 1.1% Total Deliveries 0.9% Large C&I (0.5%) Small C&I 2.5% Residential YTD (0.2%) 1.3% (1.1%) (0.8%) Q3 0.3% Total Deliveries (0.1%) Large C&I 0.5% Small C&I 0.8% Residential YTD PECO 2008 Weather- Normalized Total Deliveries |
16 Constructive Outcome in ComEd Distribution Rate Case The ICC issued a final Order in ComEd’s distribution rate case – granting a revenue increase of $273.6 million that took effect on September 16, 2008: (14) 345 359 Depreciation and Amortization $(87) 274 361 Total Revenue Increase 3 129 132 Other Revenues (11) 987 998 O&M Expenses (22) 10.30% ROE / 45.04% Equity 10.75% ROE / 45.11% Equity ROE / Cap Structure $(43) $6,694 $7,071 Rate Base Impact on Revenue Increase ICC Order ComEd Original Request ($ in millions) The final order in ComEd’s distribution rate case was a constructive outcome, providing for an annual increase in distribution revenues of $274 million |
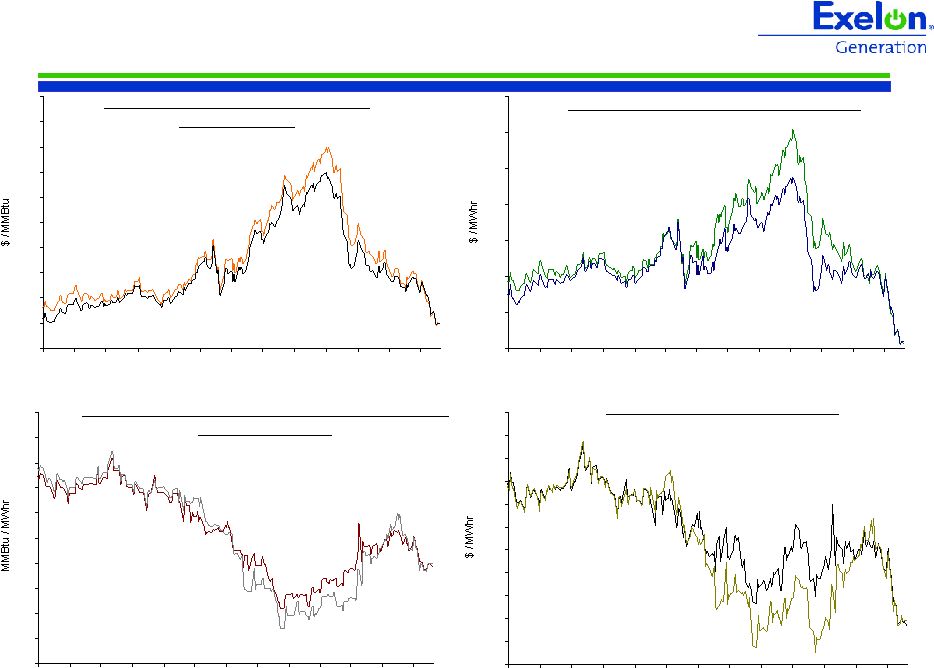
17 Market Price Snapshot Rolling 12 months, as of October 20, 2008. Source: OTC quotes and electronic trading system. Quotes are daily. 50 60 70 80 90 100 110 10/07 11/07 12/07 1/08 2/08 3/08 4/08 5/08 6/08 7/08 8/08 9/08 10/08 50 60 70 80 90 100 110 120 130 140 150 10/07 11/07 12/07 1/08 2/08 3/08 4/08 5/08 6/08 7/08 8/08 9/08 10/08 7 7.5 8 8.5 9 9.5 10 10.5 11 11.5 12 10/07 11/07 12/07 1/08 2/08 3/08 4/08 5/08 6/08 7/08 8/08 9/08 10/08 30 35 40 45 50 55 60 65 70 75 10/07 11/07 12/07 1/08 2/08 3/08 4/08 5/08 6/08 7/08 8/08 9/08 10/08 Forward NYMEX Natural Gas PJM-West and Ni-Hub On-Peak Forward Prices PJM-West and Ni-Hub Wrap Forward Prices 2010 Ni-Hub 2011 Ni-Hub 2011 PJM-West 2010 PJM-West 2010 2011 2010 Ni-Hub 2011 Ni-Hub 2011 PJM-West 2010 PJM-West Forward NYMEX Coal 2010 2011 $7.83 $7.83 $81.25 $76.50 $73.45 $73.15 $56.00 $37.25 $53.77 $53.90 $34.95 $55.75 |
18 Market Price Snapshot Rolling 12 months, as of October 20, 2008. Source: OTC quotes and electronic trading system. Quotes are daily. 7.5 8.5 9.5 10.5 11.5 12.5 13.5 14.5 15.5 16.5 17.5 18.5 10/07 11/07 12/07 1/08 2/08 3/08 4/08 5/08 6/08 7/08 8/08 9/08 10/08 8 8.2 8.4 8.6 8.8 9 9.2 9.4 9.6 9.8 10 10/07 11/07 12/07 1/08 2/08 3/08 4/08 5/08 6/08 7/08 8/08 9/08 10/08 7 7.5 8 8.5 9 9.5 10 10.5 11 11.5 12 10/07 11/07 12/07 1/08 2/08 3/08 4/08 5/08 6/08 7/08 8/08 9/08 10/08 65 70 75 80 85 90 95 100 10/07 11/07 12/07 1/08 2/08 3/08 4/08 5/08 6/08 7/08 8/08 9/08 10/08 2011 2010 2010 2011 2010 2011 Houston Ship Channel Natural Gas Forward Prices ERCOT North On-Peak Forward Prices ERCOT North On-Peak v. Houston Ship Channel Implied Heat Rate 2010 2011 ERCOT On Peak Spark Spread Assumes a 7.2 Heat Rate, $1.50 O&M, and $.15 adder $7.48 $7.50 $65.97 $65.59 $8.77 $8.80 $9.15 $9.39 |
19 Large and Diverse Bank Group Exelon has a large and diverse bank group with over $7.3 billion in aggregate credit facility commitments – 24 banks committed to the facility with each bank having less than 10% of the aggregate commitments at Exelon • Bank of America, N.A. / Merrill Lynch USA (2) • The Royal Bank of Scotland PLC (RBS) • Barclays Bank PLC • JP Morgan Chase Bank, N.A. • The Bank of Nova Scotia (Scotia) • Wachovia Bank, N.A. • Citibank, N.A. • Commerzbank AG • BNP Paribas • Deutsche Bank AG, New York Branch • Credit Suisse, Cayman Islands Branch • Morgan Stanley Bank • UBS Loan Finance LLC • The Bank of New York / Mellon Bank, N.A. • Mizuho Corporate Bank, LTD • Goldman Sachs (3) • The Bank of Tokyo-Mitsubishi UFJ, LTD • KeyBank N.A. • U.S. Bank, N.A. • SunTrust Bank • Union Bank of California, N.A. • The Northern Trust Company • Malayan Banking Berhad (May Bank) • National City Bank (1) As of October 20, 2008. (2) Assumes that Bank of America assumes Merrill Lynch’s previous commitment. (3) Includes funding commitments by Williams Street Commitment Corporation, Williams Street Credit Corporation, Goldman Sachs Credit Partners, L.P. Banks Committed to Exelon’s Facilities (1) |
20 Projected 2008 Key Credit Measures A3 A2 Baa2 Baa1 Moody’s Credit Ratings (3) BBB A- BBB+ BBB- S&P Credit Ratings (3) 2.9x 3.1x FFO / Interest ComEd: 14% 13% FFO / Debt 54% 58% Rating Agency Debt Ratio 5.6x 4.3x FFO / Interest PECO: 30% 16% FFO / Debt 60% 54% Rating Agency Debt Ratio 39% 59% Rating Agency Debt Ratio 127% 60% FFO / Debt 23.1x 9.2x FFO / Interest Exelon Generation: 64% 38% 6.7x Without PPA & Pension / OPEB (2) 69% Rating Agency Debt Ratio 28% FFO / Debt 5.4x FFO / Interest Exelon Consolidated: With PPA & Pension / OPEB (1) Notes: Projected credit measures reflect impact of Illinois electric rates and policy settlement. Exelon, ComEd and PECO metrics exclude securitization debt. See following slide for FFO (Funds from Operations)/Interest, FFO/Debt and Adjusted Book Debt Ratio reconciliations to GAAP. (1) Reflects S&P updated guidelines, which include imputed debt and interest related to purchased power agreements (PPA), unfunded pension and other postretirement benefits (OPEB) obligations, capital adequacy for energy trading, operating lease obligations, and other off-balance sheet debt. Debt is imputed for estimated pension and OPEB obligations by operating company. (2) Excludes items listed in note (1) above. (3) Current senior unsecured ratings for Exelon and Generation and senior secured ratings for ComEd and PECO as of 10/21/08. On October 21, 2008, S&P put Exelon, ComEd, PECO and Exelon Generation on Creditwatch with negative implications. |
21 FFO Calculation and Ratios FFO Calculation = FFO - PECO Transition Bond Principal Paydown + Gain on Sale, Extraordinary Items and Other Non-Cash Items (3) + Change in Deferred Taxes + Depreciation, amortization (including nucl fuel amortization), AFUDC/Cap. Interest Add back non-cash items: Net Income Adjusted Interest FFO + Adjusted Interest = Adjusted Interest + 7% of Present Value (PV) of Operating Leases + Interest on imputed debt related to PV of Purchased Power Agreements (PPA), unfunded Pension and Other Postretirement Benefits (OPEB) obligations, and Capital Adequacy for Energy Trading (2) , as applicable - PECO Transition Bond Interest Expense Net Interest Expense (Before AFUDC & Cap. Interest) FFO Interest Coverage + Capital Adequacy for Energy Trading (2) FFO = Adjusted Debt + PV of Operating Leases + 100% of PV of Purchased Power Agreements (2) + Unfunded Pension and OPEB obligations (2) + A/R Financing Add off-balance sheet debt equivalents: - PECO Transition Bond Principal Balance + STD + LTD Debt: Adjusted Debt (1) FFO Debt Coverage Rating Agency Capitalization Rating Agency Debt Total Adjusted Capitalization Adjusted Book Debt = Total Rating Agency Capitalization + Off-balance sheet debt equivalents (2) - Goodwill Total Adjusted Capitalization = Rating Agency Debt + ComEd Transition Bond Principal Balance + Off-balance sheet debt equivalents (2) Adjusted Book Debt = Total Adjusted Capitalization + Adjusted Book Debt + Preferred Securities of Subsidiaries + Total Shareholders' Equity Capitalization: = Adjusted Book Debt - Transition Bond Principal Balance + STD + LTD Debt: Debt to Total Cap Note: Reflects S&P guidelines and company forecast. FFO and Debt related to non-recourse debt are excluded from the calculations. (1) Uses current year-end adjusted debt balance. (2) Metrics are calculated in presentation unadjusted and adjusted for debt equivalents and related interest for PPAs, unfunded Pension and OPEB obligations, and Capital Adequacy for Energy Trading. (3) Reflects depreciation adjustment for PPAs and decommissioning interest income and contributions. |
22 Q3 GAAP EPS Reconciliation 0.03 0.03 - - - Investments in synthetic fuel-producing facilities 0.03 - - - 0.03 Nuclear decommissioning obligation reduction $1.15 ($0.01) $0.25 $0.10 $0.81 Q3 2007 GAAP Earnings (Loss) Per Share $1.21 ($0.04) $0.25 $0.10 $0.90 2007 Adjusted (non-GAAP) Operating Earnings (Loss) Per Share (0.12) - - - (0.12) 2007 Illinois Electric Rate Settlement Exelon Other PECO ComEd ExGen Three Months Ended September 30, 2007 NOTE: All amounts shown are per Exelon share and represent contributions to Exelon's EPS. 0.02 - - - 0.02 Nuclear decommissioning obligation reduction $1.06 (0.09) $0.14 $0.05 $0.96 Q3 2008 GAAP Earnings (Loss) Per Share $1.07 $(0.04) $0.14 $0.05 $0.92 2008 Adjusted (non-GAAP) Operating Earnings (Loss) Per Share (0.04) - - - (0.04) 2007 Illinois Electric Rate Settlement 0.10 (0.05) - - 0.15 Mark-to-market adjustments from economic hedging activities (0.09) - - - (0.09) Unrealized gains and losses related to nuclear decommissioning trust funds Exelon Other PECO ComEd ExGen Three Months Ended September 30, 2008 |
23 YTD GAAP EPS Reconciliation 0.01 - - - 0.01 Settlement of a tax matter at Generation related to Sithe (0.14) - - (0.03) (0.11) 2007 Illinois Electric Rate Settlement 0.03 - - - 0.03 Nuclear decommissioning obligation reduction $3.20 ($0.01) $0.58 $0.14 $2.49 YTD 2007 GAAP Earnings (Loss) Per Share $3.31 $(0.11) $0.58 $0.17 $2.67 2007 Adjusted (non-GAAP) Operating Earnings (Loss) Per Share 0.01 - - - 0.01 Sale of Generation's investments in TEG and TEP $0.10 $0.10 - - - Investments in synthetic fuel-producing facilities (0.12) - - - (0.12) Mark-to-market adjustments from economic hedging activities Exelon Other PECO ComEd ExGen Nine Months Ended September 30, 2007 NOTE: All amounts shown are per Exelon share and represent contributions to Exelon's EPS. 0.02 - - - 0.02 Nuclear decommissioning obligation reduction $3.06 (0.07) $0.37 $0.16 $2.60 Q3 2008 GAAP Earnings (Loss) Per Share $3.13 $(0.07) $0.37 $0.17 $2.66 2008 Adjusted (non-GAAP) Operating Earnings (Loss) Per Share (0.18) - - (0.01) (0.17) 2007 Illinois Electric Rate Settlement 0.27 - - - 0.27 Mark-to-market adjustments from economic hedging activities (0.18) - - - (0.18) Unrealized gains and losses related to nuclear decommissioning trust funds Exelon Other PECO ComEd ExGen Nine Months Ended September 30, 2008 |