 Earnings Conference Call • 4 th Quarter 2009 January 22, 2010 EXHIBIT 99.2 |
 2 Forward-Looking Statements This presentation includes forward-looking statements within the meaning of the Private Securities Litigation Reform Act of 1995, that are subject to risks and uncertainties. The factors that could cause actual results to differ materially from these forward-looking statements include those discussed herein as well as those discussed in (1) Exelon’s 2008 Annual Report on Form 10-K in (a) ITEM 1A. Risk Factors, (b) ITEM 7. Management’s Discussion and Analysis of Financial Condition and Results of Operations and (c) ITEM 8. Financial Statements and Supplementary Data: Note 18; (2) Exelon’s Third Quarter 2009 Quarterly Report on Form 10-Q in (a) Part II, Other Information, ITEM 1A. Risk Factors and (b) Part I, Financial Information, ITEM 1. Financial Statements: Note 14 and (3) other factors discussed in filings with the Securities and Exchange Commission (SEC) by Exelon Corporation, Commonwealth Edison Company, PECO Energy Company and Exelon Generation Company, LLC (Companies). Readers are cautioned not to place undue reliance on these forward-looking statements, which apply only as of the date of this presentation. None of the Companies undertakes any obligation to publicly release any revision to its forward-looking statements to reflect events or circumstances after the date of this presentation. This presentation includes references to adjusted (non-GAAP) operating earnings and non- GAAP cash flows that exclude the impact of certain factors. We believe that these adjusted operating earnings and cash flows are representative of the underlying operational results of the Companies. Please refer to the attachments to the earnings release and the appendix to this presentation for a reconciliation of adjusted (non-GAAP) operating earnings to GAAP earnings. Please refer to the footnotes of the following slides for a reconciliation non-GAAP cash flows to GAAP cash flows. |
 3 Nuclear Uprates Deploying Capital for Shareholder Value Smart Grid Carbon Price Recovery Transmission - 1,300–1,500 MW of new Exelon nuclear capacity by 2017, the equivalent of a new nuclear plant at roughly half the cost of a new plant and no incremental operating costs - Approximately $725 million in investments to build smart grid infrastructure over the coming years with a regulated return on investment - Lowest carbon intensity in the sector, significant upside if and when legislation enacted or regulations promulgated, and enhancing industry-leading position with Exelon 2020 - Positioned to benefit from our fundamental view of recovery in natural gas and coal prices, heat rates, and demand growth - Leveraging transmission expertise to build Exelon Transmission Company with the goal of improving reliability, reducing congestion and moving renewable energy to population centers |
 4 Key Financial Messages Operating results • Operating earnings of $0.92/share for 4Q09 and $4.12/share for 2009 (1) • 93.6% nuclear capacity factor for 2009 • 2009 cash flow from operations (2) of $5.78 billion, $1 billion over original plan Far exceeded cost savings expectations in 2009 to offset unfavorable drivers • Realized an additional $200 million of cost savings over plan Reaffirming 2010 operating earnings guidance of $3.60 - $4.00/share (1) • Committed to 2010 O&M target of $4.35 billion, offsetting inflation and $35 million of higher pension and OPEB expense with additional cost savings • Initial signs that load stabilization will begin in 2010 • 91-94% of 2010 expected generation hedged (3) (1) Refer to Earnings Release Attachments for additional details and to the Appendix for a reconciliation of adjusted (non-GAAP) operating EPS to GAAP EPS. (2) Cash Flow from Operations primarily includes net cash flows provided by operating activities (excluding counterparty collateral activity) and net cash flows used in investing activities other than capital expenditures. (3) As of December 31, 2009. Note: Data contained on this slide is rounded. |
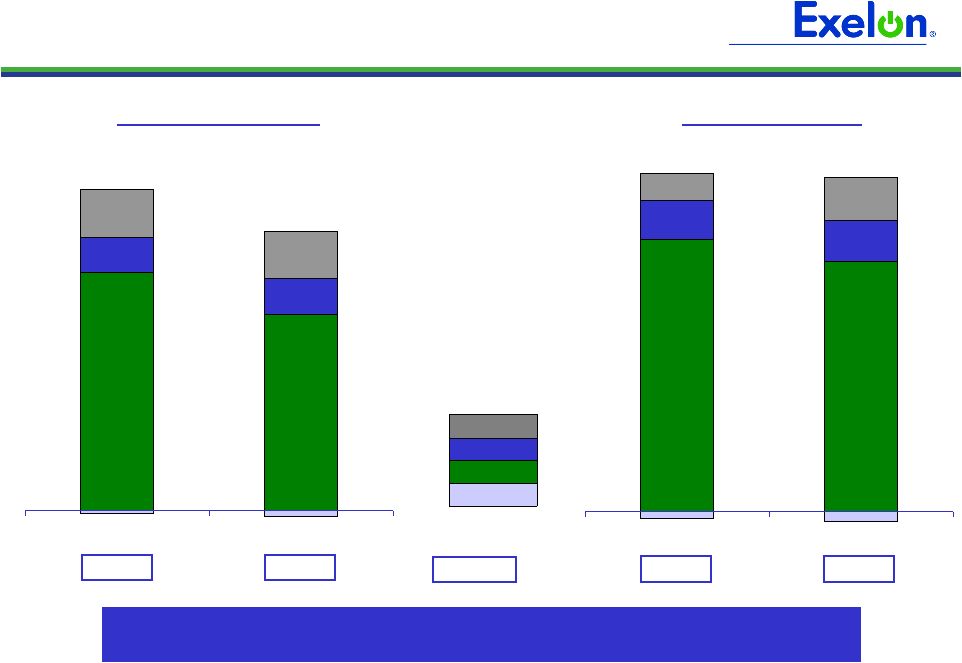 5 $0.80 $0.12 $0.66 $0.12 $0.16 $0.16 2008 2009 Operating EPS $3.46 $3.16 $0.49 $0.54 $0.33 $0.54 2008 2009 HoldCo/Other ExGen PECO ComEd 4 th Quarter (4Q) (1) Exceeding cost savings target allowed Exelon to deliver results well within our original guidance range of $4.00 - $4.30/share (1) Refer to Earnings Release Attachments for additional details and to the Appendix for a reconciliation of adjusted (non-GAAP) operating EPS to GAAP EPS. $1.07 $0.88 GAAP EPS Full Year (FY) (1) $4.12 $4.20 $4.13 $4.09 $0.92 $1.07 |
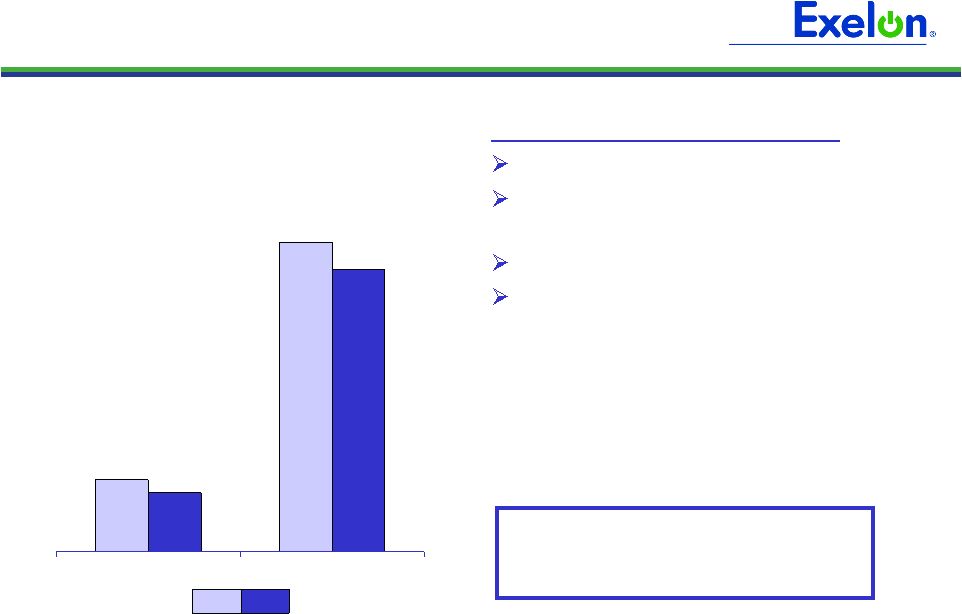 6 Exelon Generation Operating EPS Contribution 2009 2008 Key Drivers – 4Q09 vs. 4Q08 (1) Lower nuclear volume: $(0.04) Unfavorable market/portfolio conditions: $(0.03) Higher nuclear fuel costs: $(0.02) Higher O&M due to pension and OPEB expense and 2008 nuclear insurance credit, partially offset by cost savings initiatives: $(0.02) (1) Refer to the Earnings Release Attachments for additional details and to the Appendix for a reconciliation of adjusted (non-GAAP) operating EPS to GAAP EPS. (2) Outage days exclude Salem. 136 80 Refueling 23 22 Non-refueling 4Q09 4Q08 Outage Days (2) 4Q FY $0.80 $0.66 $3.16 $3.46 |
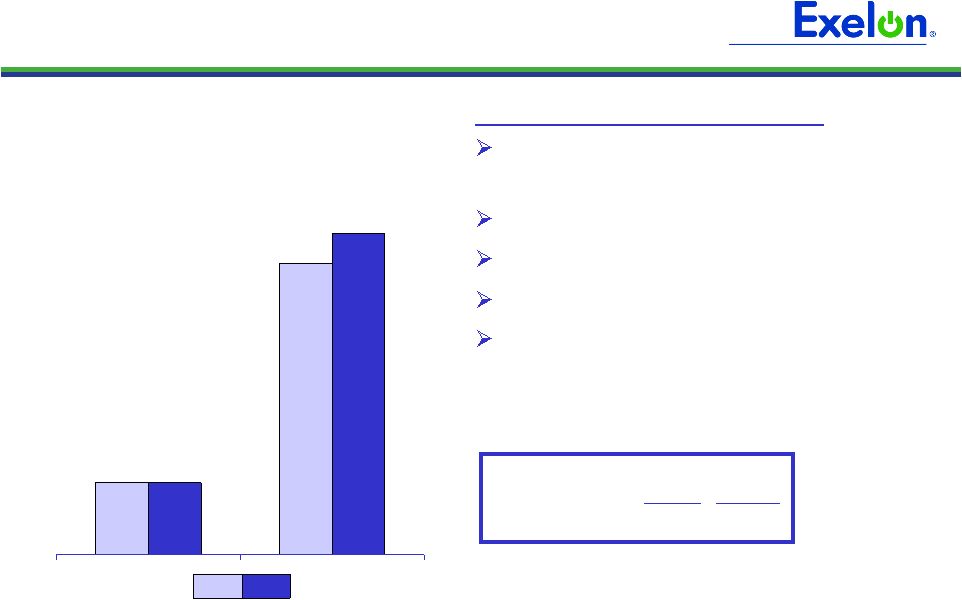
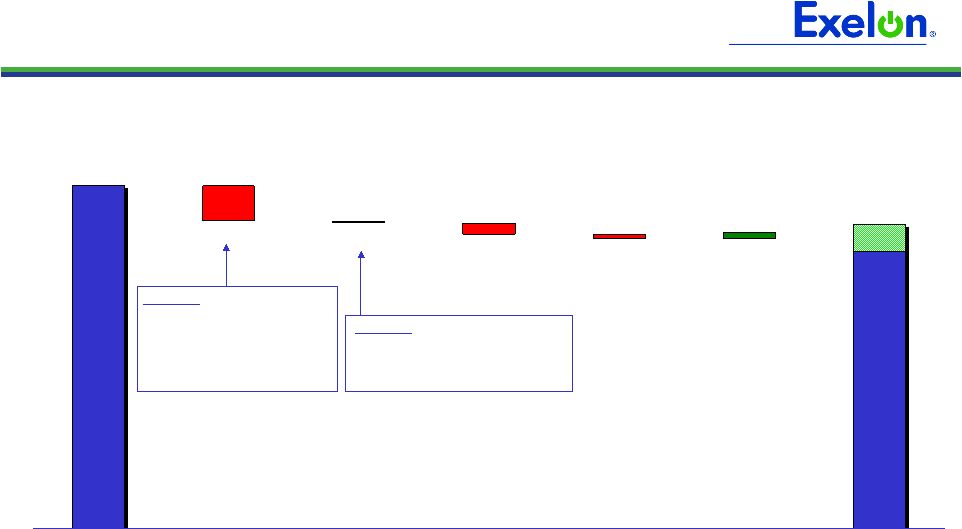
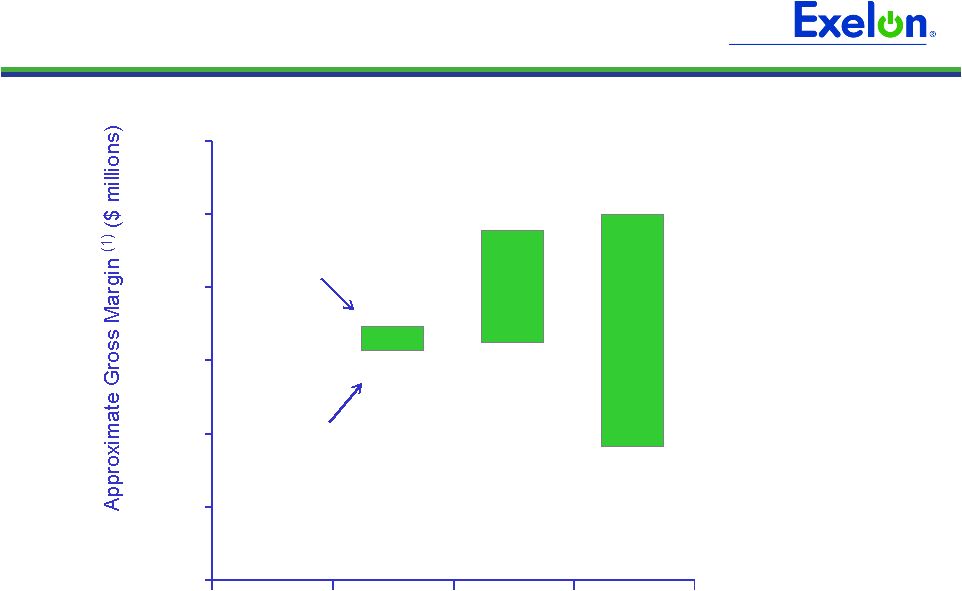
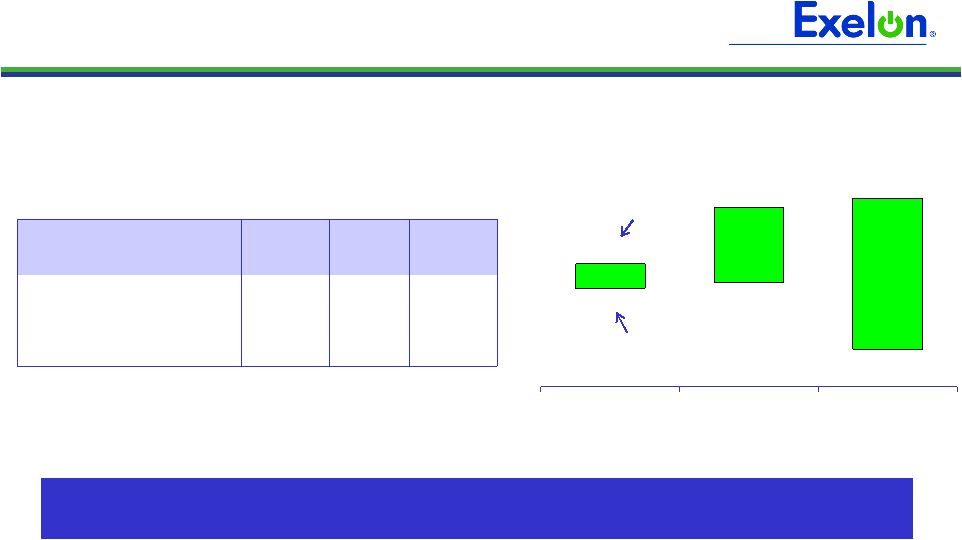 7 2010 2011 2012 Hedging Update 2010 2011 2012 Percentage of Expected Generation Hedged (1) 91-94% 69-72% 37-40% Midwest 89-92 71-74 43-46 Mid-Atlantic 93-96 65-68 25-28 South 97-100 66-69 39-42 95% case 5% case $6,500 $6,100 $4,800 $7,800 $6,200 $8,000 By design, our hedging program allows us to weather short-term, adverse market conditions, while positioning us to participate in long-term upside potential Exelon Generation Gross Margin Upside/Risk (2) Expected Generation Hedged (1) Percent of expected generation hedged represents how many equivalent MW have been hedged at forward market prices as of December 31, 2009; all hedge products used are converted to an equivalent average MW volume and the calculation considers whether hedges are power sales or financial products. Reflects decision to permanently retire Cromby Station and Eddystone Units 1&2 as of May 31, 2011, pending PJM approval. (2) Represents an approximate range of expected gross margin, taking into account hedges in place, between the 5th and 95th percent confidence levels assuming all unhedged supply is sold into the spot market. Approximate gross margin ranges are based upon an internal simulation model and are subject to change based upon market inputs, future transactions and potential modeling changes. These ranges of approximate gross margin in 2011 and 2012 do not represent earnings guidance or a forecast of future results as Exelon has not completed its planning or optimization processes for those years. The price distributions that generate this range are calibrated to market quotes for power, fuel, load following products, and options as of December 31, 2009. ($ millions) |
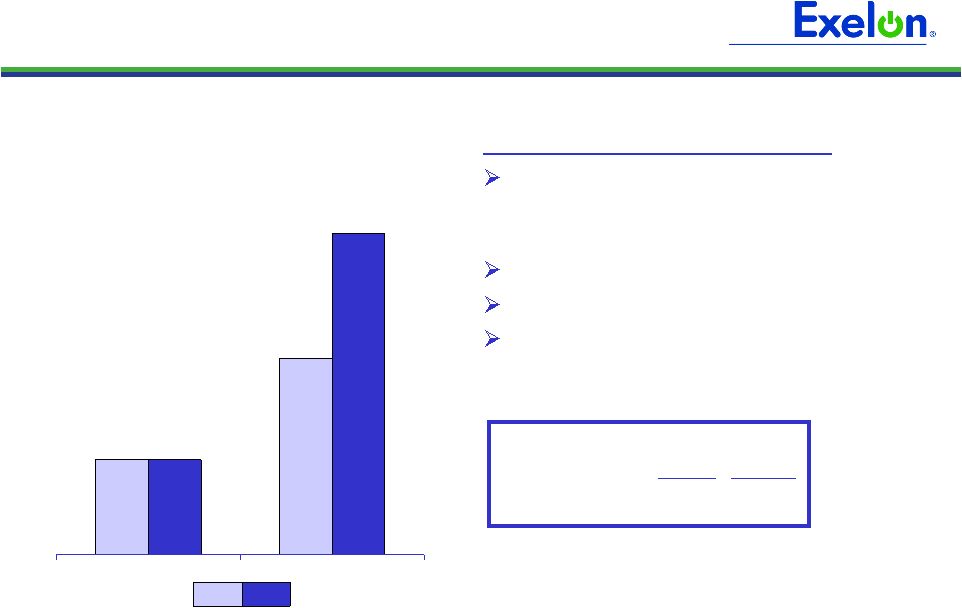 8 Key Drivers – 4Q09 vs. 4Q08 (1) Lower O&M due to cost savings initiatives, partially offset by higher pension and OPEB expense: +$0.03 Reduced load: $(0.01) Weather: $(0.01) ’08 tax method change: $(0.02) ComEd Operating EPS Contribution (1) Refer to the Earnings Release Attachments for additional details and to the Appendix for a reconciliation of adjusted (non-GAAP) operating EPS to GAAP EPS. 2009 2008 4Q FY $0.16 $0.16 $0.54 $0.33 4Q09 Actual Normal Heating Degree Days 2,264 2,278 |
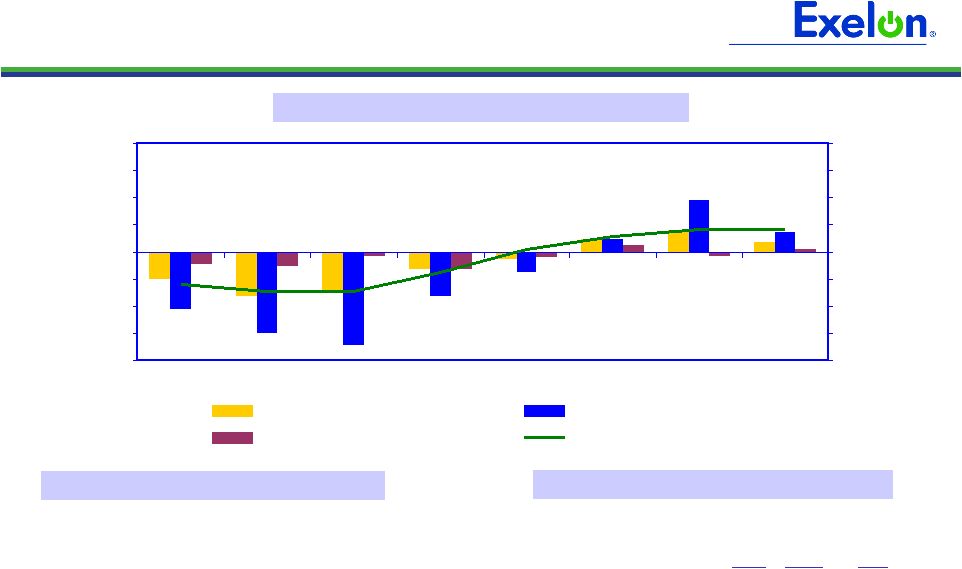 9 ComEd Load Trends Weather-Normalized Load Key Economic Indicators Note: C&I = Commercial & Industrial Weather-Normalized Load Year-over-Year (4) Chicago U.S. Unemployment rate (1) 10.9% 10.0% 2009 annualized growth in gross domestic/metro product (2) (3.1)% (2.5)% 10/09 Home price index (3) (10.1)% (7.3)% (1) Source: Illinois Dept. of Employment Security (November 2009) and U.S. Dept. of Labor (December 2009) (2) Source: Moody’s Economy.com (December 2009) (3) Source: S&P Case-Shiller Index (4) Not adjusted for leap year effect 4Q09 2009 (4) 2010E Customer Growth (0.5)% (0.4)% 0.1% Average Use-Per-Customer (1.1)% (1.0)% 0.0% Total Residential (1.6)% (1.4)% Small C&I 0.1% (2.2)% 0.8% Large C&I (4.0)% (6.7)% 1.5% All Customer Classes (1.6)% (3.3)% 0.8% -10.0% -7.5% -5.0% -2.5% 0.0% 2.5% 5.0% 7.5% 10.0% 1Q09 2Q09 3Q09 4Q09 1Q10E 2Q10E 3Q10E 4Q10E -10.0% -7.5% -5.0% -2.5% 0.0% 2.5% 5.0% 7.5% 10.0% All Customer Classes Large C&I Residential Gross Metro Product |
 10 PECO Operating EPS Contribution Key Drivers – 4Q09 vs. 4Q08 (1) Higher other revenue net fuel, including gas distribution revenues: +$0.02 Lower bad debt expense: +$0.02 Reduced load: $(0.01) Weather: $(0.01) Competitive Transition Charge (CTC) amortization: $(0.02) 2009 2008 (1) Refer to the Earnings Release Attachments for additional details and to the Appendix for a reconciliation of adjusted (non-GAAP) operating EPS to GAAP EPS. 4Q FY $0.12 $0.12 $0.54 $0.49 4Q09 Actual Normal Heating Degree Days 1,567 1,634 |
 11 PECO Load Trends Weather-Normalized Electric Load Key Economic Indicators Weather-Normalized Load Year-over-Year (3) Philadelphia U.S. Unemployment rate (1) 8.5% 10.0% 2009 annualized growth in gross domestic/metro product (2) (3.6)% (2.5)% (1) Source: U.S Dept. of Labor (PHL - November 2009, US – December 2009) (2) Source: Moody’s Economy.com (December 2009) (3) Not adjusted for leap year effect Note: C&I = Commercial & Industrial 4Q09 2009 (3) 2010E Customer Growth (0.4)% (0.2)% (0.1)% Average Use-Per-Customer 0.2% (2.1)% (1.2)% Total Residential (0.2)% (2.3)% (1.3)% Small C&I (2.5)% (2.7)% (0.7)% Large C&I (1.4)% (3.0)% (2.4)% All Customer Classes (1.3)% (2.6)% (1.5)% -10.0% -7.5% -5.0% -2.5% 0.0% 2.5% 5.0% 7.5% 10.0% 1Q09 2Q09 3Q09 4Q09 1Q10E 2Q10E 3Q10E 4Q10E -10.0% -7.5% -5.0% -2.5% 0.0% 2.5% 5.0% 7.5% 10.0% All Customer Classes Large C&I Residential Gross Metro Product |
 12 Pension and OPEB Expense and Contributions Pension Assets $7,840 Obligations $11,480 2010E 2009 $210 $250 $205 $200 $440 $260 $155 $155 2010E 2009 (1) (2) (3) OPEB Assets $1,475 Obligations $3,660 Key Metrics 2009 asset return 12/31/09 discount rate Assumed long-term EROA Pension and OPEB expense is increasing by $35 million pre-tax Pre-Tax Expense (4) $0 $50 $100 $150 $200 $250 $300 Pension OPEB Pension and OPEB Plans Key Metrics – 12/31/09E ($ in millions) (1) Includes settlement charges. (2) Contributions reflect the application of recently issued U.S. Treasury Department guidance and cover both the qualified and non-qualified plans. 2009 contributions include a $350 million discretionary contribution. 2010 pension contributions are based on minimum regulatory requirements and additional amounts required to avoid benefit restrictions. Management may elect to make additional discretionary contributions. (3) Approximately $100 million of the 2009/2010 OPEB contributions is discretionary. Management has not yet made a decision regarding its 2010 OPEB contributions. Contributions shown above include amounts paid out of corporate assets. (4) Assumes an ~20% overall capitalization rate for pension and OPEB costs. Note: OPEB = other postretirement benefits; EROA = expected return on assets. Data contained on this slide is rounded. 21% 5.83% 8.50% Cash Contributions $0 $100 $200 $300 $400 Pension OPEB |
 13 Delivering on Cost Savings Commitments Holding O&M below 2008 levels for second consecutive year Committed to 2010 O&M target of $4.35 billion, offsetting inflation and $35 million of higher pension and OPEB expense with additional cost savings • Reduced positions by 500 (400 in corporate support and 100 at ComEd) in 2009 • Freezing executive salaries and reducing other compensation benefits for 2010 Note: Data contained on this slide is rounded. ($ millions) $0.7 $0.6 PECO (1) $1.0 $1.0 ComEd (1) $2.7 $2.7 Generation 2010E 2009A $ billions (2) (2) (2) O&M Expense (1) (1) Reflects operating O&M data and excludes decommissioning effect. ComEd and PECO operating O&M exclude energy efficiency and smart meter costs recoverable under a rider. (2) Exelon Consolidated includes operating O&M expense from Holding Company. $4,500 $4,300 $4,350 $450 $415 $245 2008A 2009A 2010E Total O&M Pension/OPEB Expense |
   14 2010 Operating Earnings Guidance 2010E 2009A $0.54 $3.16 $4.12 (1) ComEd PECO Exelon Generation 2010 Earnings Drivers ComEd PECO Exelon Generation Holdco Holdco Exelon $0.54 Exelon $3.60 - $4.00 (1) $0.60 - $0.70 $0.40 - $0.50 $2.55 - $2.80 Reaffirming 2010 operating earnings guidance of $3.60 – $4.00/share (1) – expect 1Q10 results between $0.85 – $0.95/share (1) Depreciation and Amortization O&M Cost Savings Initiative Inflation Pension/OPEB ComEd RNF PECO RNF Generation RNF (1) Refer to Earnings Release Attachments for additional details and to the Appendix for a reconciliation of adjusted (non-GAAP) operating EPS to GAAP EPS. |
 15 Appendix |
 16 2010 Projected Sources and Uses of Cash (325) n/a (100) (225) Utility Growth CapEx (4) ($ millions) Exelon (9) Beginning Cash Balance (1) $1,050 Cash Flow from Operations (1)(2) 1,025 900 2,325 4,250 CapEx (excluding Nuclear Fuel, Nuclear Uprates and Solar Project, Utility Growth CapEx) (625) (400) (750) (1,825) Nuclear Fuel n/a n/a (850) (850) Dividend (3) (1,400) Nuclear Uprates and Solar Project n/a n/a (375) (375) Net Financing (excluding Dividend): Planned Debt Issuances (5,6) 250 -- 300 550 Planned Debt Retirements (7) (225) (400) -- (1,025) Other (8) 25 175 -- 125 Ending Cash Balance (1) $175 (1) Excludes counterparty collateral activity. (2) Cash Flow from Operations primarily includes net cash flows provided by operating activities and net cash flows used in investing activities other than capital expenditures. Cash Flow from Operations for PECO and Exelon includes $572 million for competitive transition charges. Net cash flow from operations includes $225 million of timing differences from 2009. (3) Assumes 2010 dividend of $2.10/share. Dividends are subject to declaration by the Board of Directors. (4) Represents new business and smart grid/smart meter investment. (5) Excludes Exelon Generation’s $213 million and ComEd’s $191 million tax-exempt bonds that are backed by letters of credit (LOCs). Excludes PECO’s $225 million Accounts Receivable (A/R) Agreement with Bank of Tokyo. Assumes PECO’s A/R Agreement is extended in accordance with its terms beyond September 16, 2010. (6) Exelon Generation’s $300 million financing includes a $50 million DOE loan for the City Solar Project and $250 million of debt to refinance a portion of Exelon Corp’s $400 million maturity. (7) PECO’s planned debt retirement of $400 million represents the final retirement of the PECO Energy Transition Trust. (8) “Other” includes PECO Parent Receivable, proceeds from options and expected changes in short-term debt. (9) Includes cash flow activity from Holding Company, eliminations, and other corporate entities. |
 17 Sufficient Liquidity (1) Excludes previous commitment from Lehman Brothers Bank and commitments from Exelon’s Community and Minority Bank Credit Facility. (2) Available Capacity Under Facilities represents the unused bank commitments under the borrower’s credit agreements net of outstanding letters of credit and facility draws. The amount of commercial paper outstanding does not reduce the available capacity under the credit agreements. (3) Includes other corporate entities. (45) -- -- (45) Outstanding Facility Draws (447) (171) (10) (261) Outstanding Letters of Credit $7,317 $4,834 $574 $952 Aggregate Bank Commitments (1) 6,825 4,663 564 646 Available Capacity Under Facilities (2) -- -- -- -- Outstanding Commercial Paper $6,825 $4,663 $564 $646 Available Capacity Less Outstanding Commercial Paper Exelon (3) ($ millions) Exelon has no commercial paper outstanding and its bank facilities are largely untapped Available Capacity Under Bank Facilities as of January 14, 2010 |
 18 Projected 2010 Key Credit Measures 13.8x 8.1x FFO / Interest Generation / Corp: 62% 34% FFO / Debt 53% 68% Rating Agency Debt Ratio BBB A- A- BBB- S&P Credit Ratings (3) BBB+ A BBB BBB+ Fitch Credit Ratings (3) A3 A2 Baa1 Baa1 Moody’s Credit Ratings (3) 3.7x 3.8x FFO / Interest ComEd: 18% 14% FFO / Debt 42% 49% Rating Agency Debt Ratio 5.2x 5.0x FFO / Interest PECO: 28% 23% FFO / Debt 46% 50% Rating Agency Debt Ratio 29% 47% Rating Agency Debt Ratio 87% 44% FFO / Debt 18.6x 9.9x FFO / Interest Generation: 46% 37% 7.2x Without PPA & Pension / OPEB (2) 57% Rating Agency Debt Ratio 25% FFO / Debt 6.0x FFO / Interest Exelon Consolidated: With PPA & Pension / OPEB (1) Notes: Exelon and PECO metrics exclude securitization debt. See following slide for FFO (Funds from Operations)/Interest, FFO/Debt and Adjusted Book Debt Ratio reconciliations to GAAP. (1) FFO/Debt metrics include the following standard adjustments: imputed debt and interest related to purchased power agreements (PPA), unfunded pension and other postretirement benefits (OPEB) obligations, capital adequacy for energy trading, operating lease obligations, and other off-balance sheet debt. Debt is imputed for estimated pension and OPEB obligations by operating company. (2) Excludes items listed in note (1) above. (3) Current senior unsecured ratings for Exelon and Exelon Generation and senior secured ratings for ComEd and PECO as of January 20, 2010. |
 19 FFO Calculation and Ratios FFO Calculation = FFO - PECO Transition Bond Principal Paydown + Gain on Sale, Extraordinary Items and Other Non-Cash Items (3) + Change in Deferred Taxes + Depreciation, Amortization (including nucl fuel amortization), AFUDC/Cap. Interest Add back non-cash items: Net Income Adjusted Interest FFO + Adjusted Interest = Adjusted Interest + 7% of Present Value (PV) of Operating Leases + Interest on imputed debt related to PV of Purchased Power Agreements (PPA), unfunded Pension and Other Postretirement Benefits (OPEB) obligations, and Capital Adequacy for Energy Trading (2) , as applicable - PECO Transition Bond Interest Expense Net Interest Expense (Before AFUDC & Cap. Interest) FFO Interest Coverage + Capital Adequacy for Energy Trading (2) FFO = Adjusted Debt + PV of Operating Leases + 100% of PV of Purchased Power Agreements (2) + Unfunded Pension and OPEB obligations (2) + A/R Financing Add off-balance sheet debt equivalents: - PECO Transition Bond Principal Balance + STD + LTD Debt: Adjusted Debt (1) FFO Debt Coverage Rating Agency Capitalization Rating Agency Debt Total Adjusted Capitalization Adjusted Book Debt = Total Rating Agency Capitalization + Off-balance sheet debt equivalents (2) Total Adjusted Capitalization = Rating Agency Debt + ComEd Transition Bond Principal Balance + Off-balance sheet debt equivalents (2) Adjusted Book Debt = Total Adjusted Capitalization + Adjusted Book Debt + Preferred Securities of Subsidiaries + Total Shareholders' Equity Capitalization: = Adjusted Book Debt - Transition Bond Principal Balance + STD + LTD Debt: Debt to Total Cap (1) Uses current year-end adjusted debt balance. (2) Metrics are calculated in presentation unadjusted and adjusted for debt equivalents and related interest for PPAs, unfunded Pension and OPEB obligations, and Capital Adequacy for Energy Trading. (3) Reflects depreciation adjustment for PPAs and decommissioning interest income and contributions. |
 20 Q4 GAAP EPS Reconciliation 0.04 - - - 0.04 Mark-to-market adjustments from economic hedging activities (0.01) - - (0.01) - City of Chicago settlement with ComEd (0.02) (0.01) - - (0.01) Costs associated with early debt retirements (0.02) - - - (0.02) 2007 Illinois electric rate settlement (0.05) - - - (0.05) Retirement of fossil generating units 0.02 - - - 0.02 Unrealized gains related to nuclear decommissioning trust funds $0.88 $(0.03) $0.12 $0.15 $0.64 4Q 2009 GAAP Earnings (Loss) Per Share $0.92 $(0.02) $0.12 $0.16 $0.66 2009 Adjusted (non-GAAP) Operating Earnings (Loss) Per Share Exelon Other PECO ComEd ExGen Three Months Ended December 31, 2009 NOTE: All amounts shown are per Exelon share and represent contributions to Exelon's EPS. Amounts may not add due to rounding. 0.03 - - - 0.03 Settlement of tax matter at Generation related to Sithe (0.02) - - (0.02) - City of Chicago settlement with ComEd (0.02) (0.02) - - - NRG acquisition costs $1.07 $(0.03) $0.12 $0.14 $0.84 4Q 2008 GAAP Earnings (Loss) Per Share $1.07 $(0.01) $0.12 $0.16 $0.80 2008 Adjusted (non-GAAP) Operating Earnings (Loss) Per Share (0.04) - - - (0.04) 2007 Illinois electric rate settlement 0.15 - - - 0.15 Mark-to-market adjustments from economic hedging activities (0.10) - - - (0.10) Unrealized losses related to nuclear decommissioning trust funds Exelon Other PECO ComEd ExGen Three Months Ended December 31, 2008 |
 21 YTD GAAP EPS Reconciliation 0.16 - - - 0.16 Mark-to-market adjustments from economic hedging activities (0.05) - - - (0.05) Retirement of fossil generating units (0.01) - - (0.01) - City of Chicago settlement with ComEd (0.10) - - (0.01) (0.09) 2007 Illinois electric rate settlement (0.11) (0.04) - - (0.07) Costs associated with early debt retirements (0.20) - - - (0.20) Impairment of certain generating assets (0.03) - (0.00) (0.02) (0.01) 2009 severance charges 0.05 - - - 0.05 Nuclear decommissioning obligation reduction (0.03) (0.03) - - - NRG acquisition costs 0.19 - - - 0.19 Unrealized gains related to nuclear decommissioning trust funds 0.10 (0.02) - 0.06 0.06 Non-cash remeasurement of income tax uncertainties and reassessment of state deferred income taxes $4.09 $(0.21) $0.53 $0.56 $3.21 FY 2009 GAAP Earnings (Loss) Per Share $4.12 $(0.12) $0.54 $0.54 $3.16 2009 Adjusted (non-GAAP) Operating Earnings (Loss) Per Share Exelon Other PECO ComEd ExGen Twelve Months Ended December 31, 2009 NOTE: All amounts shown are per Exelon share and represent contributions to Exelon's EPS. Amounts may not add due to rounding. (0.02) - - (0.02) - City of Chicago settlement with ComEd (0.02) (0.02) - - - NRG acquisition costs 0.03 - - - 0.03 Settlement of tax matter at Generation related to Sithe 0.02 - - - 0.02 Decommissioning obligation reduction $4.13 $(0.10) $0.49 $0.30 $3.44 YTD 2008 GAAP Earnings (Loss) Per Share $4.20 $(0.08) $0.49 $0.33 $3.46 2008 Adjusted (non-GAAP) Operating Earnings (Loss) Per Share (0.22) - - (0.01) (0.21) 2007 Illinois electric rate settlement 0.41 - - - 0.41 Mark-to-market adjustments from economic hedging activities (0.27) - - - (0.27) Unrealized losses related to nuclear decommissioning trust funds Exelon Other PECO ComEd ExGen Twelve Months Ended December 31, 2008 |
 22 Exelon Generation 2010 EPS Contribution (1) Estimated contribution to Exelon’s operating earnings guidance. $ / Share $(0.32) $0.06 RNF O&M Other Depreciation & Amortization $(0.09) Key Items: Inflation $(0.05) Pension/OPEB $(0.03) Cost Savings Initiative $0.11 2009A 2010E (1) $2.55 - $2.80 $3.16 Key Items: Market/Portfolio Conditions/Generation $(0.29) Nuclear Fuel Expense $(0.12) PECO CTC $(0.11) Capacity Market Prices $0.19 $(0.01) $(0.04) Interest Expense |
 23 ComEd 2010 EPS Contribution (1) Estimated contribution to Exelon’s operating earnings guidance. (2) Excludes estimated impact of Rider EDA (Energy Efficiency and Demand Response Adjustment) of $0.05/share and Rider AMI (Advanced Metering Infrastructure) of $0.01/share in 2010. (3) Primarily recovery of 2008 and 2009 uncollectible expense. Approximately $0.06/share we anticipate will be included in 1Q10 earnings. 2009A Depreciation & Amortization Interest Expense $0.60 - $0.70 $0.54 $0.15 $0.04 $(0.02) 2010E (1) $ / Share $(0.02) $(0.03) Other RNF (2) O&M (2) Key Items: Uncollectible Rider (3) $0.05 Weather $0.04 Key Items: Cost Savings Initiative $0.05 Bad Debt (3) $0.05 Inflation $(0.02) Pension/OPEB $(0.01) |
 24 PECO 2010 EPS Contribution $ / Share RNF $(0.12) $0.54 (1) Depreciation & Amortization 2010E (2) Key Items: CTC $0.11 Weather $0.04 Load $(0.03) Key Items: Inflation $(0.02) Bad Debt $(0.02) $0.08 O&M (3) $0.04 $0.40 - $0.50 (1) Key Items: CTC Amortization $(0.11) Interest $(0.09) Key Items: CTC Interest Expense $0.06 2009A (1) Excludes preferred dividends. (2) Estimated contribution to Exelon’s operating earnings guidance. (3) Excludes estimated impact of energy efficiency and smart meter costs recoverable under a rider of $0.10/share. |
 25 25 Key Assumptions for 2010 Earnings Guidance (1) 2008 Actual 2009 Actual 2010 Est. Nuclear Capacity Factor (%) (2) 93.9 93.6 93.5 Total Generation Sales Excluding Trading (GWh) 176,174 173,065 171,400 Total Generation Sales to PECO (GWh) 40,966 39,897 39,900 Total Generation Market and Retail Sales (GWh) (3) 135,208 133,168 131,500 Henry Hub Gas Price ($/mmBtu) 8.85 3.92 6.21 PJM West Hub ATC Price ($/MWh) 68.52 38.30 48.40 Tetco M3 Gas Price ($/mmBtu) 9.83 4.64 6.95 PJM West Hub Implied ATC Heat Rate (mmbtu/MWh) 6.97 8.25 6.96 NI Hub ATC Price ($/MWh) 49.00 28.85 32.57 Chicago City Gate Gas Price ($/mmBtu) 8.79 3.92 6.23 NI Hub Implied ATC Heat Rate (mmbtu/MWh) 5.57 7.36 5.22 PJM East Capacity Price ($/MW-day) 169.09 173.73 181.34 PJM West Capacity Price ($/MW-day) 82.39 106.13 144.40 Electric Delivery Growth (%) (4) PECO 0.6 (2.6) (1.3) ComEd (0.1) (3.3) 0.8 Effective Tax Rate (%) (5) 36.1 37.2 35.8 (1) Reflects assumptions used in original 2010 Earnings Guidance provided on November 2, 2009; 2010 prices reflect observable prices as of September 30, 2009. (2) Excludes Salem. . (3) Includes Illinois auction sales and ComEd swap. (4) Weather-normalized retail load growth. (5) Starting on January 1, 2011, effective tax rate is expected to increase to 37.1% due to lower tax benefit related to the PECO PPA roll off. |
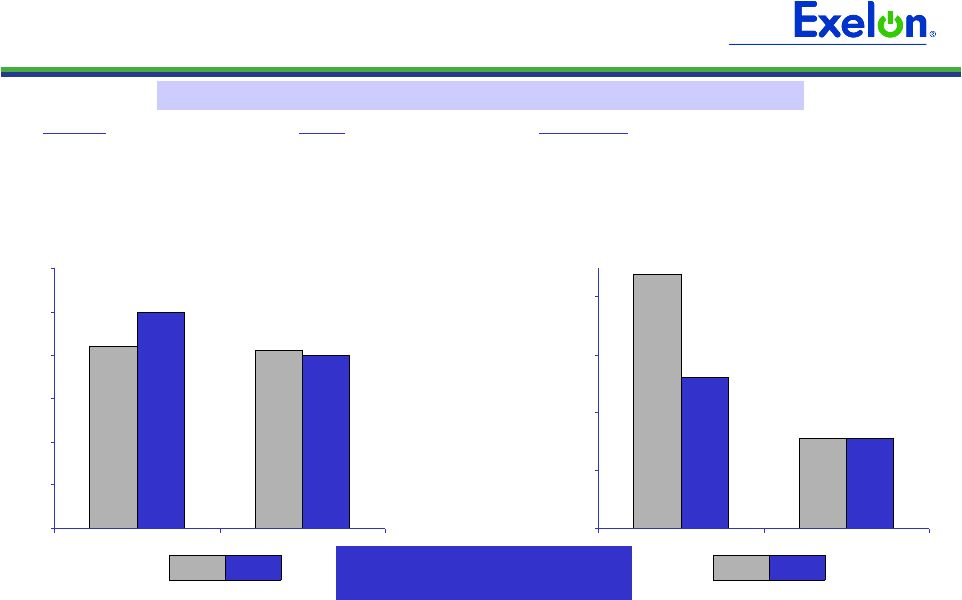
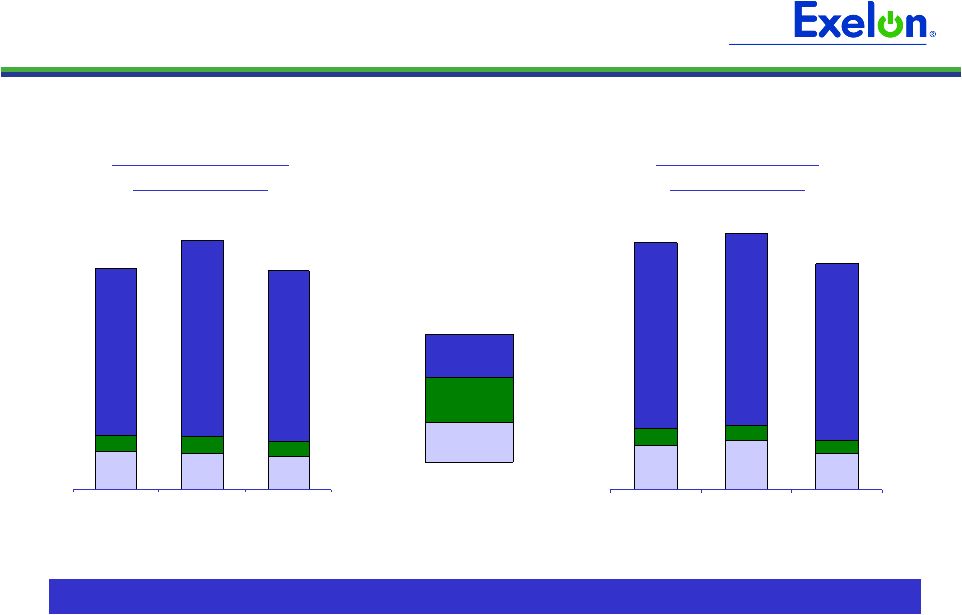 26 4Q07 4Q08 4Q09 ComEd and PECO Accounts Receivable ComEd Accounts Receivable (1) Both ComEd and PECO have experienced an improvement in accounts receivable aging 4Q07 4Q08 4Q09 PECO Accounts Receivable (1) % of AR $755M $749M $850M $832M $864M $759M (1) Accounts receivable amounts include unbilled receivables and are gross of allowance for uncollectible accounts at ComEd and PECO and long-term receivables at PECO. >60 days 31-60 days 0-30 days |
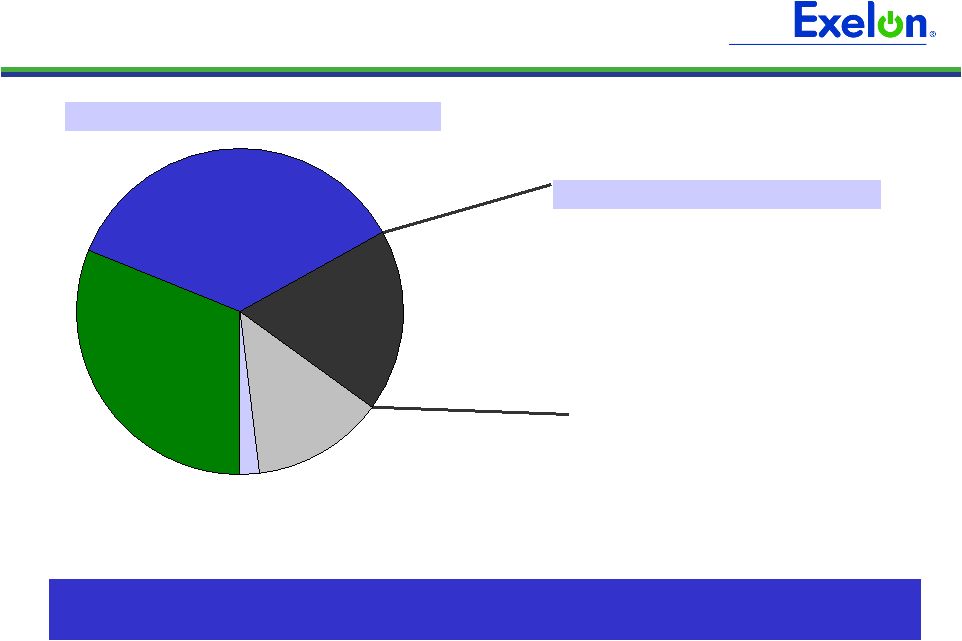 27 ComEd Customer Usage Breakdown Customer Usage by Revenue Class Top 380 Customer Usage by Segment Other 2% Residential 31% Small C&I 36% 380 Large C&I 18% Other Large C&I 13% 3% Leisure & Hospitality 9% Trade, Transportation & Utilities 11% Finance, Professional & Business Services 12% Health & Educational Services 13% Government 52% Manufacturing ComEd’s territory is largely manufacturing focused, which is beginning to see increases in production due to improved economic conditions |
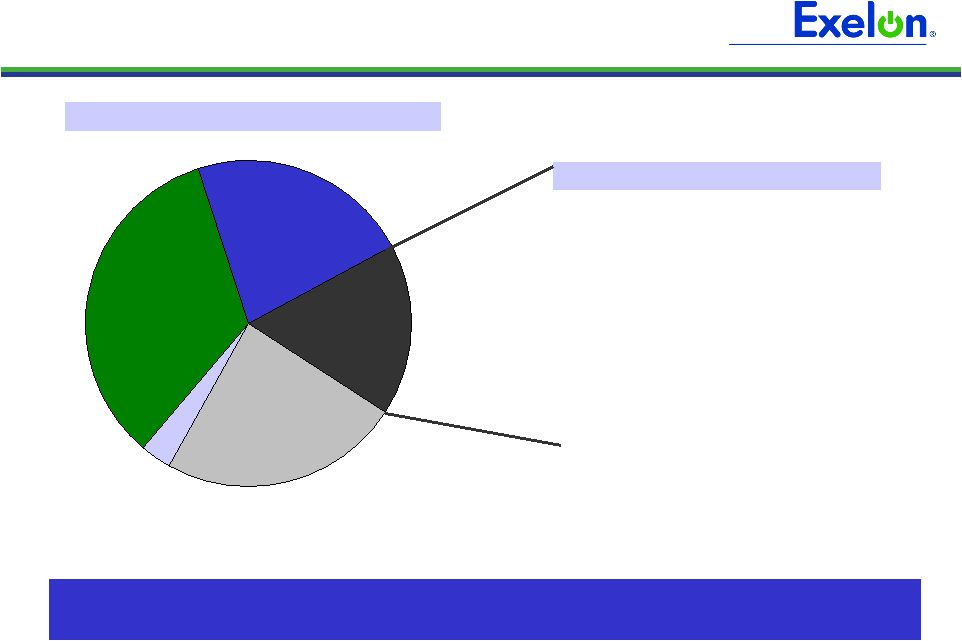 28 PECO Customer Usage Breakdown Other 3% Other Large C&I 24% 150 Large C&I 17% Small C&I 22% Residential 34% Customer Usage by Revenue Class Top 150 Customer Usage by Segment 7% Other 13% Transportation, Communication & Utilities 18% Health & Educational Services 18% Manufacturing 22% Petroleum 2% Retail Trade 9% Finance, Insurance & Real Estate 12% Pharmaceuticals PECO’s load is relatively diversified by customer class and industry, a slow recovery in the second half of 2010 is expected |
 29 2010 Earnings Outlook • Exelon’s 2010 adjusted (non-GAAP) operating earnings outlook excludes the earnings effects of the following: • Mark-to-market adjustments from economic hedging activities • Unrealized gains and losses from nuclear decommissioning trust fund investments • Significant impairments of assets, including goodwill • Changes in decommissioning obligation estimates • Costs associated with the 2007 Illinois electric rate settlement agreement • Costs associated with ComEd’s 2007 settlement with the City of Chicago • Costs associated with the retirement of fossil generating units • Other unusual items • Significant future changes to GAAP • Operating earnings guidance assumes normal weather for the year |
 30 30 Important Information The following slides are intended to provide additional information regarding the hedging program at Exelon Generation and to serve as an aid for the purposes of modeling Exelon Generation’s gross margin (operating revenues less purchased power and fuel expense). The information on the following slides is not intended to represent earnings guidance or a forecast of future events. In fact, many of the factors that ultimately will determine Exelon Generation’s actual gross margin are based upon highly variable market factors outside of our control. The information on the following slides is as of December 31, 2009. Going forward, we plan to update the information on a quarterly basis. Certain information on the following slides is based upon an internal simulation model that incorporates assumptions regarding future market conditions, including power and commodity prices, heat rates, and demand conditions, in addition to operating performance and dispatch characteristics of our generating fleet. Our simulation model and the assumptions therein are subject to change. For example, actual market conditions and the dispatch profile of our generation fleet in future periods will likely differ – and may differ significantly – from the assumptions underlying the simulation results included in the slides. In addition, the forward-looking information included in the following slides will likely change over time due to continued refinement of our simulation model and changes in our views on future market conditions. |
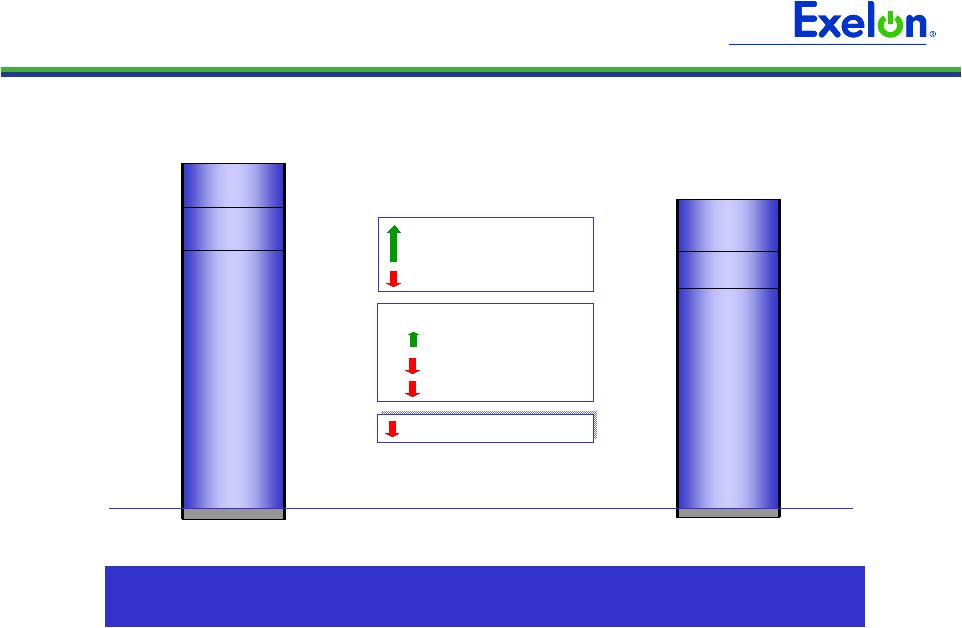
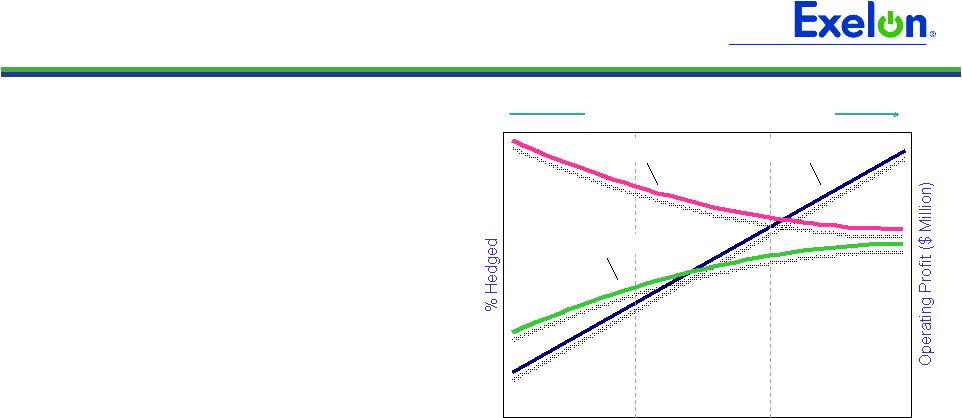 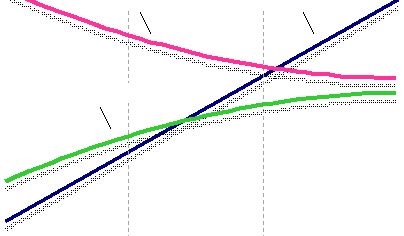     31 31 Portfolio Management Objective Align Hedging Activities with Financial Commitments • Power Team utilizes several product types and channels to market • Wholesale and retail sales • Block products • Load-following products and load auctions • Put/call options • Exelon’s hedging program is designed to protect the long-term value of our generating fleet and maintain an investment-grade balance sheet • Hedge enough commodity risk to meet future cash requirements if prices drop • Consider: financing policy (credit rating objectives, capital structure, liquidity); spending (capital and O&M); shareholder value return policy • Consider market, credit, operational risk • Approach to managing volatility • Increase hedging as delivery approaches • Have enough supply to meet peak load • Purchase fossil fuels as power is sold • Choose hedging products based on generation portfolio – sell what we own • Heat rate options • Fuel products • Capacity • Renewable credits % Hedged High End of Profit Low End of Profit Open Generation with LT Contracts Portfolio Optimization Portfolio Management Portfolio Management Over Time |
 32 32 32 Percentage of Expected Generation Hedged • How many equivalent MW have been hedged at forward market prices; all hedge products used are converted to an equivalent average MW volume • Takes ALL hedges into account whether they are power sales or financial products Equivalent MWs Sold Expected Generation = • Our normal practice is to hedge commodity risk on a ratable basis over the three years leading to the spot market • Carry operational length into spot market to manage forced outage and load-following risks • By using the appropriate product mix, expected generation hedged approaches the mid-90s percentile as the delivery period approaches • Participation in larger procurement events, such as utility auctions, and some flexibility in the timing of hedging may mean the hedge program is not strictly ratable from quarter to quarter Exelon Generation Hedging Program |
 33 33 33 2010 2011 2012 Estimated Open Gross Margin ($ millions) (1,2) $5,900 $5,800 $5,750 Open gross margin assumes all expected generation is sold at the Reference Prices listed below Reference Prices (1) Henry Hub Natural Gas ($/MMBtu) NI-Hub ATC Energy Price ($/MWh) PJM-W ATC Energy Price ($/MWh) ERCOT North ATC Spark Spread ($/MWh) (3) $5.79 $33.83 $48.04 $(0.53) $6.33 $34.75 $49.42 $(0.44) $6.53 $36.13 $50.43 $0.89 Exelon Generation Open Gross Margin and Reference Prices (1) Based on December 31, 2009 market conditions. (2) Gross margin is defined as operating revenues less fuel expense and purchased power expense, excluding the impact of decommissioning and other incidental revenues. Open gross margin is estimated based upon an internal model that is developed by dispatching our expected generation to current market power and fossil fuel prices. Open gross margin assumes there is no hedging in place other than fixed assumptions for capacity cleared in the RPM auctions and uranium costs for nuclear power plants. Open gross margin contains assumptions for other gross margin line items such as various ISO bill and ancillary revenues and costs and PPA capacity revenues and payments. The estimation of open gross margin incorporates management discretion and modeling assumptions that are subject to change. (3) ERCOT North ATC spark spread using Houston Ship Channel Gas, 7,200 heat rate, $2.50 variable O&M. |
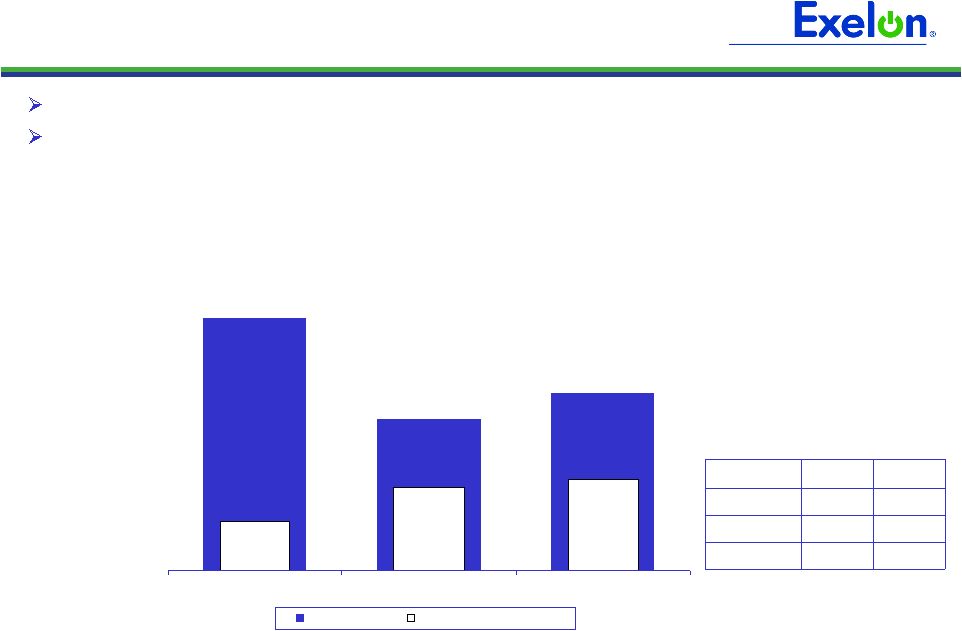
 34 34 34 2010 2011 2012 Expected Generation (GWh) (1) 167,100 163,000 162,600 Midwest 99,000 98,400 97,400 Mid-Atlantic 59,600 57,200 56,600 South 8,500 7,400 8,600 Percentage of Expected Generation Hedged (2) 91-94% 69-72% 37-40% Midwest 89-92 71-74 43-46 Mid-Atlantic 93-96 65-68 25-28 South 97-100 66-69 39-42 Effective Realized Energy Price ($/MWh) (3) Midwest $46.50 $45.00 $46.00 Mid-Atlantic $35.50 $60.00 $53.50 ERCOT North ATC Spark Spread $(1.00) $(0.50) $(7.00) Generation Profile (1) Expected generation represents the amount of energy estimated to be generated or purchased through owned or contracted for capacity. Expected generation is based upon a simulated dispatch model that makes assumptions regarding future market conditions, which are calibrated to market quotes for power, fuel, load following products, and options. Expected generation assumes 10 refueling outages in 2010 and 11 refueling outages in 2011 and 2012 at Exelon-operated nuclear plants and Salem. Expected generation assumes capacity factors of 93.5%, 92.8% and 92.8% in 2010, 2011 and 2012 at Exelon-operated nuclear plants. These estimates of expected generation in 2011 and 2012 do not represent guidance or a forecast of future results as Exelon has not completed its planning or optimization processes for those years. (2) Percent of expected generation hedged is the amount of equivalent sales divided by the expected generation. Includes all hedging products, such as wholesale and retail sales of power, options, and swaps. Uses expected value on options. Reflects decision to permanently retire Cromby Station and Eddystone Units 1&2 as of May 31, 2011, pending PJM approval. (3) Effective realized energy price is representative of an all-in hedged price, on a per MWh basis, at which expected generation has been hedged. It is developed by considering the energy revenues and costs associated with our hedges and by considering the fossil fuel that has been purchased to lock in margin. It excludes uranium costs and RPM capacity revenue, but includes the mark-to-market value of capacity contracted at prices other than RPM clearing prices including our load obligations. It can be compared with the reference prices used to calculate open gross margin in order to determine the mark-to-market value of Exelon Generation's energy hedges. |
 35 35 35 Gross Margin Sensitivities with Existing Hedges ($ millions) (1) Henry Hub Natural Gas + $1/MMBtu - $1/MMBtu NI-Hub ATC Energy Price +$5/MWH -$5/MWH PJM-W ATC Energy Price +$5/MWH -$5/MWH Nuclear Capacity Factor +1% / -1% 2010 $40 $(40) $30 $(25) $20 $(15) +/- $50 2011 $190 $(160) $165 $(155) $135 $(130) +/- $50 2012 $395 $(395) $275 $(270) $230 $(230) +/- $50 Exelon Generation Gross Margin Sensitivities (with Existing Hedges) (1) Based on December 31, 2009 market conditions and hedged position. Gas price sensitivities are based on an assumed gas-power relationship derived from an internal model that is updated periodically. Power prices sensitivities are derived by adjusting the power price assumption while keeping all other prices inputs constant. Due to correlation of the various assumptions, the hedged gross margin impact calculated by aggregating individual sensitivities may not be equal to the hedged gross margin impact calculated when correlations between the various assumptions are also considered. |
 36 36 36 95% case 5% case $6,500 $6,100 $4,800 $7,800 $6,200 $8,000 Exelon Generation Gross Margin Upside / Risk (with Existing Hedges) $3,000 $4,000 $5,000 $6,000 $7,000 $8,000 $9,000 2010 2011 2012 (1) Represents an approximate range of expected gross margin, taking into account hedges in place, between the 5th and 95th percent confidence levels assuming all unhedged supply is sold into the spot market. Approximate gross margin ranges are based upon an internal simulation model and are subject to change based upon market inputs, future transactions and potential modeling changes. These ranges of approximate gross margin in 2011 and 2012 do not represent earnings guidance or a forecast of future results as Exelon has not completed its planning or optimization processes for those years. The price distributions that generate this range are calibrated to market quotes for power, fuel, load following products, and options as of December 31, 2009. |
 37 37 37 Midwest Mid-Atlantic ERCOT Step 1 Start with fleetwide open gross margin $5.90 billion Step 2 Determine the mark-to-market value of energy hedges 99,000GWh * 90% * ($46.50/MWh-$33.83/MWh) = $1.13 billion 59,600GWh * 94% * ($35.50/MWh-$48.04/MWh) = $(0.70 billion) 8,500GWh * 98% * ($(1.00)/MWh- $(0.53)/MWh) = $0.00 billion Step 3 Estimate hedged gross margin by adding open gross margin to mark-to- market value of energy hedges Open gross margin: MTM value of energy hedges: Estimated hedged gross margin: Illustrative Example of Modeling Exelon Generation 2010 Gross Margin (with Existing Hedges) $1.13 billion + $(0.70 billion) + $0.00 billion $5.90 billion $6.33 billion |
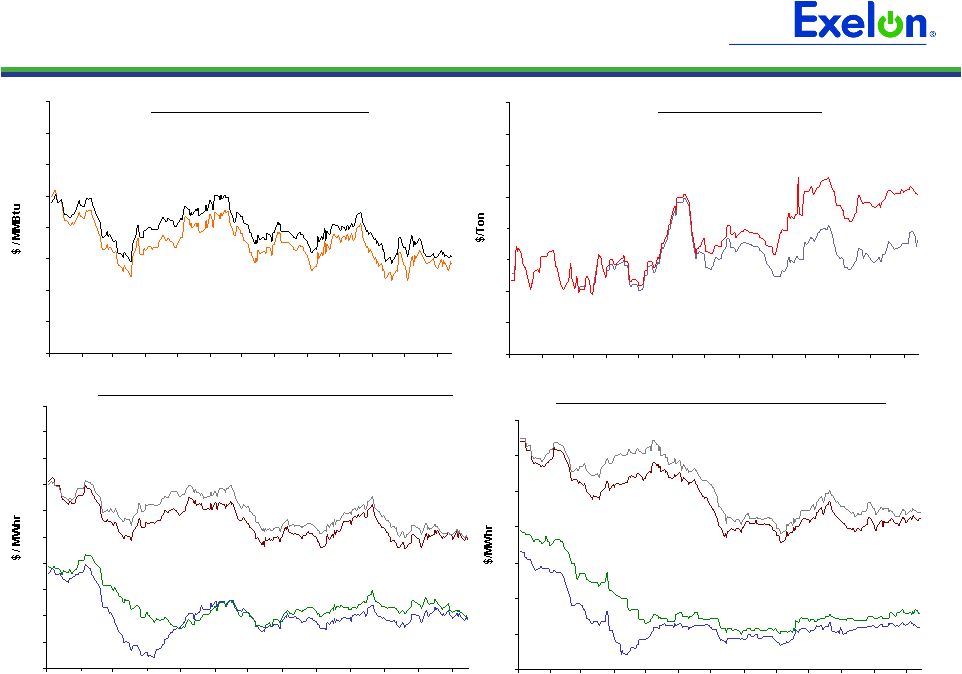 38 38 38 38 38 50 55 60 65 70 75 80 85 90 1/09 2/09 3/09 4/09 5/09 6/09 7/09 8/09 9/09 10/09 11/09 12/09 1/10 20 25 30 35 40 45 50 55 1/09 2/09 3/09 4/09 5/09 6/09 7/09 8/09 9/09 10/09 11/09 12/09 1/10 35 40 45 50 55 60 65 70 75 80 85 1/09 2/09 3/09 4/09 5/09 6/09 7/09 8/09 9/09 10/09 11/09 12/09 1/10 5 5.5 6 6.5 7 7.5 8 8.5 9 1/09 2/09 3/09 4/09 5/09 6/09 7/09 8/09 9/09 10/09 11/09 12/09 1/10 38 Market Price Snapshot Forward NYMEX Natural Gas PJM-West and Ni-Hub On-Peak Forward Prices PJM-West and Ni-Hub Wrap Forward Prices 2011 $6.41 2012 $6.54 Rolling 12 months, as of January 14, 2010. Source: OTC quotes and electronic trading system. Quotes are daily. Forward NYMEX Coal 2011 $68.00 2012 $75.45 2011 Ni-Hub $44.27 2012 Ni-Hub $44.58 2012 PJM-West $59.90 2011 PJM-West $59.57 2011 Ni-Hub $25.95 2012 Ni-Hub $27.87 2012 PJM-West $41.99 2011 PJM-West $41.17 |
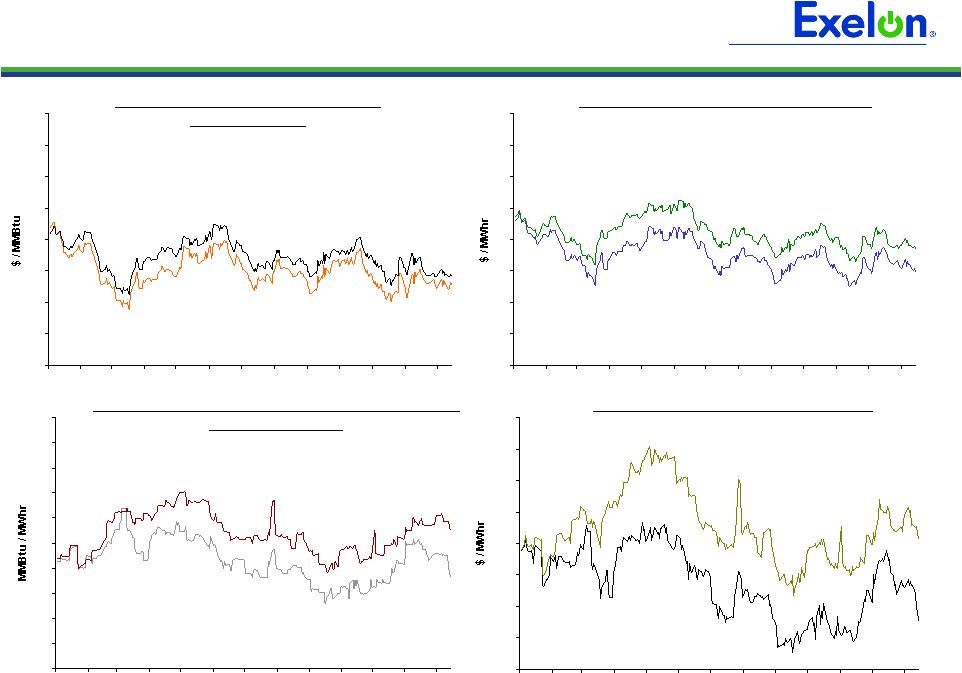 39 39 39 39 39 5.5 6.5 7.5 8.5 9.5 10.5 11.5 12.5 13.5 1/09 2/09 3/09 4/09 5/09 6/09 7/09 8/09 9/09 10/09 11/09 12/09 1/10 8 8.2 8.4 8.6 8.8 9 9.2 9.4 9.6 9.8 10 1/09 2/09 3/09 4/09 5/09 6/09 7/09 8/09 9/09 10/09 11/09 12/09 1/10 40 45 50 55 60 65 70 75 80 1/09 2/09 3/09 4/09 5/09 6/09 7/09 8/09 9/09 10/09 11/09 12/09 1/10 5 5.5 6 6.5 7 7.5 8 8.5 9 1/09 2/09 3/09 4/09 5/09 6/09 7/09 8/09 9/09 10/09 11/09 12/09 1/10 39 Market Price Snapshot 2012 $9.10 2011 $8.73 2011 $54.83 2012 $58.40 2011 $6.28 2012 $6.43 Houston Ship Channel Natural Gas Forward Prices ERCOT North On-Peak Forward Prices ERCOT North On-Peak v. Houston Ship Channel Implied Heat Rate 2011 $7.02 2012 $9.64 ERCOT North On Peak Spark Spread Assumes a 7.2 Heat Rate, $1.50 O&M, and $.15 adder Rolling 12 months, as of January 14, 2010. Source: OTC quotes and electronic trading system. Quotes are daily. |