![]() Clean in Competitive Markets Chris Crane, President Edison Electric Institute Financial Conference November 1-2, 2010 Exhibit 99.1 |
![]() 2 Forward-Looking Statements This presentation includes forward-looking statements within the meaning of the Private Securities Litigation Reform Act of 1995, that are subject to risks and uncertainties. The factors that could cause actual results to differ materially from these forward-looking statements include those discussed herein as well as those discussed in (1) Exelon’s 2009 Annual Report on Form 10-K in (a) ITEM 1A. Risk Factors, (b) ITEM 7. Management’s Discussion and Analysis of Financial Condition and Results of Operations and (c) ITEM 8. Financial Statements and Supplementary Data: Note 18; (2) Exelon’s Third Quarter 2010 Quarterly Report on Form 10-Q in (a) Part II, Other Information, ITEM 1A. Risk Factors, (b) Part 1, Financial Information, ITEM 2. Management’s Discussion and Analysis of Financial Condition and Results of Operations and (c) Part I , Financial Information, ITEM 1. Financial Statements: Note 13 and (3) other factors discussed in filings with the Securities and Exchange Commission (SEC) by Exelon Corporation, Commonwealth Edison Company, PECO Energy Company and Exelon Generation Company, LLC (Companies). Readers are cautioned not to place undue reliance on these forward-looking statements, which apply only as of the date of this presentation. None of the Companies undertakes any obligation to publicly release any revision to its forward-looking statements to reflect events or circumstances after the date of this presentation. This presentation includes references to adjusted (non-GAAP) operating earnings and non-GAAP cash flows that exclude the impact of certain factors. We believe that these adjusted operating earnings and cash flows are representative of the underlying operational results of the Companies. Please refer to the appendix to this presentation for a reconciliation of adjusted (non-GAAP) operating earnings to GAAP earnings. Please refer to the footnotes of the following slides for a reconciliation non-GAAP cash flows to GAAP cash flows. |
![]() 3 Exelon’s Protect and Grow strategy considers existing and potential energy policy to create long-term value Advocacy and generation optimization around environmental regulations Largest nuclear uprate program in the industry Utility investment and regulated recovery Renewables acquisition at attractive valuation Transmission investment across the business Exelon 2020 identifies the most rational economic options to deliver shareholder value as energy policy turns toward clean energy and affects competitive markets |
![]() 4 None, 51% SCR/SNCR, 20% FGD & SCR/SNCR, 15% FGD Only, 14% 0 5,000 10,000 15,000 20,000 25,000 30,000 > 300 MW (54 GW) < 300 MW (21 GW) 4 Older, smaller coal units are likely to retire as EPA implementation dates approach EPA regulations make retirement economically rational for approximately 11 GW of PJM coal plants, beginning the transition to clean energy PJM Coal Capacity by Age 75 GW Total Environmental Controls on PJM units < 300 MW (1) (1) Includes flue gas desulfurization (FGD), selective catalytic reduction (SCR), and selective noncatalytic reduction (SNCR); status will vary based on data source. Sources: Energy Velocity, Exelon estimates ~11 GW Year in Service |
![]() 5 5 A shift in the PJM dispatch stack as coal retires benefits Exelon’s clean nuclear fleet Sources: CEMS, Energy Velocity, SNL, Exelon estimates Note: PJM Supply Stack based on existing capacity and expected retirements. Environmental costs and coal retirements will shift the dispatch stack causing energy prices to rise $5-7/MWh |
![]() 6 $134 $74 $110 $174 0 200 400 600 800 1,000 1,200 1,400 1,600 1,800 2,000 2010/2011 2011/2012 2012/2013 2013/2014 2014/2015E 0 50 100 150 200 250 300 PJM capacity auction will also send market price signals to incent new, clean generation RPM = Reliability Pricing Model, RTO = Regional Transmission Organization (i.e. Rest of Pool), MAAC = Mid-Atlantic Area Council, EMAAC = Eastern Mid-Atlantic Area Council Note: Data contained on this slide is rounded. PJM RPM Capacity Prices and Revenues (1) Capacity by Region Eligible for 2014/15 RPM Base Residual Auction (2) 7% 42% 51% RTO EMAAC MAAC 8,700 MW 1,500 MW 10,300 MW (3) While results are largely dependent on bidding behavior, Exelon expects increasing capacity prices beginning in the 2014/15 planning year as coal generators evaluate environmental compliance costs ~$400 – $800M Increase Revenue (Left axis) $180 - 240 (1) Weighted average $/MW-Day would apply if all owned generation cleared. Prices are rounded. (2) All generation values are approximate and not inclusive of wholesale transactions; All capacity values are in installed capacity terms (summer ratings) located in the areas and adjusted for mid-year PPA roll-offs. John Deere Renewables’ capacity is not included. (3) Reflects decision in December 2009 to permanently retire Cromby Station and Eddystone Units 1&2 as of 5/31/11. None of these 933 MW cleared in the 2011/2012 or 2012/2013 auctions. |
![]() 7 Post-MACT Real Required ATC Price (Energy + Capacity) $0 $20 $40 $60 $80 $100 $120 $140 $160 0 20 40 60 80 100 120 140 160 180 200 220 240 260 280 TWh Energy Efficiency Uprates Coal Retirement CCGT Coal-to-Gas Redispatch Merchant Wind New Nuclear Solar Clean Coal Exelon 2020 Supply Curve shows how PJM can clean the dispatch stack Supply Curve shows the increasing energy and capacity prices needed to make clean energy investments economic Exelon is focused on the lowest cost alternatives The supply curve is guiding Exelon’s strategy and investment decisions, including nuclear uprates, energy efficiency and coal retirements 1 1 2 3 3 Note: Represents a single economic and power market outlook, which is indicative of a range of scenarios. See slide 40 for additional details. CCGT = Combined Cycle Gas Turbine, HAPs MACT = Hazardous Air Pollutant Maximum Achievable Control Technology as designated by the EPA. 1 Energy efficiency 2 Exelon’s uprate investments Exelon Investments 3 Coal retirements resulting from Transport Rule and HAPs MACT, respectively; includes Eddystone and Cromby |
![]() 8 Post-MACT Real Required ATC Price (Energy + Capacity) $0 $20 $40 $60 $80 $100 $120 $140 $160 0 20 40 60 80 100 120 140 160 180 200 220 240 260 280 TWh Energy Efficiency Uprates Coal Retirement CCGT Coal-to-Gas Redispatch Merchant Wind New Nuclear Solar Clean Coal Exelon’s nuclear uprate program is one of the most economically attractive ways to add clean generation in PJM 1,300 – 1,500 2015-17 325 2012 405 2013 430 2014 200 2011 Uprate MWs to be brought on line (cumulative) (1) Year Unique: Size and scale of nuclear fleet is a competitive advantage Economic: IRRs meet hurdle rate under a number of gas and power price scenarios Flexible: A series of 19 separate projects across all but 1 of our nuclear plants Low Risk: Not contingent on loan guarantees to merchant plants Earnings Accretive: For EPUs only, annual EPS impact of $0.30 - $0.50 per share once all MW online Exelon’s nuclear uprates are another example in Exelon’s long history of effective capital stewardship (1) Includes TMI and Clinton Extended Power Uprates, which are currently under review. |
![]() 9 ComEd and PECO play a key role in support of clean, competitive markets West Loop Phase II – supporting reliability • Ensures reliable service to the Chicago Central Business District in the event that Fisk and Crawford stations (1) become unavailable • Estimated cost of $178M • Late 2011 expected in-service date • Immediate benefits including redundancy Electric Vehicles – exploring opportunities for infrastructure investment • ~$3M in Federal stimulus funds to expand green fleet • Deploy vehicle smart charging stations • Study vehicle performance, environmental and electrical load effects Upgrades related to ExGen’s Cromby and Eddystone retirements (2) – ensuring reliability of the grid • Facilities identified and plans approved by PJM • Total estimated cost of $44M • All projects under construction or in engineering status Smart Grid – delivering customer-valued services • ~$200M in Federal stimulus funds for deployment • Operational improvements and efficiency gains will allow continued cost savings • Programs will enable customers more control over usage and rate structures Our utilities are advancing regulatory recovery for Smart Grid investments and investing in system improvements to protect and grow value (1) Crawford and Fisk generating stations are owned and operated by Midwest Generation, a subsidiary of Edison International. (2) Cromby Units 1 and 2 to retire effective 5/31/11 and 12/31/11, respectively. Eddystone Units 1 and 2 to retire effective 5/31/11 and 6/01/12, respectively. Investing in Transmission Investing in New Technologies |
![]() 10 RPS Requirements and Wind Projections 0 5,000 10,000 15,000 20,000 2010 2011 2012 2013 0 5,000 10,000 15,000 20,000 Wind Projection - East MISO and PJM Wind Projection - West MISO and ComEd Existing Wind - East MISO and PJM Existing Wind - West MISO and ComEd Required Wind MW of State RPS 10 Acquisition of John Deere Renewables (JDR) positions Exelon as a key player in the US wind market Exelon’s future development of our wind pipeline will be compatible with the price signals of the Exelon 2020 supply curve and will require PPAs to be in place $150M/year EBITDA run-rate from JDR (1) Only moderate wind growth expected through 2013 • Additional 4 GW in PJM and MISO from 2011-13 • Renewable Portfolio Standards (RPS) are met through 2013 Incremental development largely dependent on transmission and cost allocation Federal RPS could accelerate transmission development decisions JDR Acquisition Key Dates: Texas regulatory approval filed 9/17 FERC/HSR approval filed 9/30 Financing completed 9/30 Projected closing December 2010 (1) Including Production Tax Credits and Michigan development projects. |
![]() 11 11 Exelon is pursuing backbone high-voltage transmission investment in the Midwest First anchor project from the SMARTransmission Study Memorandum of Understanding signed with ETA (AEP & MidAmerican joint venture company) to pursue the project ~420 miles of 765kV transmission stretches from Northern Illinois to Ohio. The RITE Line will be built from the existing 765kV system in Ohio in the East to the West Ensures reliability, enables states to meet RPS standards, and supports the integration of more renewables Total Investment ~$1.6 billion • ComEd/Exelon ~$1.1 billion • AEP/ETA ~$500 million FERC incentive rate joint filing anticipated for 1Q 2011 Transmission investment via the “RITE Line” creates value for Exelon and supports further clean energy development Note: ETA = Electric Transmission America |
![]() 12 Corporate $100 , 1% Regulated - Base Capital (incl. New Business) $5,725 , 45% ExGen Base Capex (excl. Nuclear Fuel) $3,225, 26% Regulated - Smart Grid/Energy Efficiency $375 , 3% Investment in Renewables $1,400 , 11% Uprates $1,775, 14% Exelon’s investments in clean energy and competitive markets create value Nearly 30% of total non-fuel capital expenditures supports our goal of being clean in competitive markets When combined with proactive efforts to inform and shape policy, Exelon has allocated resources to the areas where its long-term value is maximized Note: Uprates excludes TMI and Clinton Extended Power Uprates, which are under review. Investment in Renewables includes $900 million acquisition of John Deere Renewables, which is expected to close in 4Q10, and related development capital expenditures. 2010 – 2013 Exelon Investment $ millions • IRRs range from 11 – 16% • John Deere Renewables contributing $150M run- rate EBITDA (1) • Regulated returns at ComEd and PECO (1) Including Production Tax Credits and Michigan development projects. |
![]() 13 $1.76 $0.85 $0.88 $0.96 $1.26 $1.60 $1.60 $2.03 $2.10 $2.10 2001 2002 2003 2004 2005 2006 2007 2008 2009 2010E Strong, stable dividend remains a key component of shareholder value return Note: CAGR= Compound Annual Growth Rate. Chart represents dividends per share paid by Exelon for 2001-2009 and expected dividend for 2010, which is subject to Board approval. (1) Dividend yield as of October 25, 2010. Competitive Integrated Yield average includes AYE, CEG, EIX, ETR, FE, NEE, PPL, and PEG. Regulated Integrated Yield average includes AEP, AEE, D, DTE, DUK, PCG, PGN, SO, WEC, and XEL. (2) 2001 dividend excludes $0.065 per share pro-rata dividend related to the Unicom-PECO merger. Exelon currently offers one of the highest yields among its peers Dividend Yield (1) Exelon: 5.1% Competitive Integrateds: 4.4% Regulated Integrateds: 4.6% Historical CAGR (2001-2010) ~10% (2) |
![]() 14 Financial and Operating Data * * * * * * * * * * * |
![]() 15 The Exelon Companies ’09 Earnings: $2,092M ’09 EPS: $3.16 Total Debt: (1) $3.7B Credit Rating: (2) BBB Nuclear, Fossil, Hydro & Renewable Generation Power Marketing ‘09 Operating Earnings: $2.7B ‘09 EPS: $4.12 Assets: (1) $50.9B Total Debt: (1) $12.9B Credit Rating: (2) BBB- Note: All ’09 income numbers represent adjusted (Non-GAAP) Operating Earnings and EPS. Refer to slide 91 for reconciliation of adjusted (non-GAAP) operating EPS to GAAP EPS. (1) As of September 30, 2010. (2) Standard & Poor’s senior unsecured debt ratings for Exelon and Generation and senior secured debt ratings for ComEd and PECO as of October 26, 2010. Pennsylvania Utility Illinois Utility ’09 Earnings: $356M $354M ’09 EPS: $0.54 $0.54 Total Debt: (1) $5.3B $2.6B Credit Ratings: (2) A- A- |
![]() 16 Mid-Atlantic Capacity Owned: 11,034 MW Contracted: 336 MW Total: 11,370 MW 16 Multi-Regional, Diverse Company Note: Owned megawatts as of December 31, 2009 based on Generation’s ownership, using annual mean ratings for nuclear units (excluding Salem) and summer ratings for Salem and the fossil and hydro units. Does not include megawatts from acquisition of John Deere Renewables announced on August 31, 2010. Midwest Capacity Owned: 11,412 MW Contracted: 2,900 MW Total: 14,321 MW ERCOT/South Capacity Owned: 2,222 MW Contracted: 2,917 MW Total: 5,139 MW New England Capacity Owned: 182 MW Electricity Customers: 1.6M Gas Customers: 0.5M Electricity Customers: 3.8M Generating Plants Nuclear Hydro Coal Gas/Oil Intermediate Peakers Wind Solar/Methane Total Capacity Owned: 24,850 MW Contracted: 6,153 MW Total: 31,003 MW |
![]() 17 Operating Earnings Guidance ComEd PECO Exelon Generation Holdco Exelon $3.95 - $4.10 (1) $0.65 - $0.70 $0.50 - $0.55 $2.90 - $3.00 (1) Refer to slide 92 for reconciliation of (non-GAAP) operating EPS to GAAP EPS. 2010 operating earnings guidance is $3.95-$4.10/share (1) ; 2011 guidance to be provided in early 2011 Guidance to be provided in early 2011, which will include: • Operating EPS – Consolidated and by Operating Company • Key earnings drivers • O&M guidance, including pension and OPEB expense • Cash flow and credit metrics outlook • Load forecast for ComEd and PECO service territories 2011 2010 |
![]() 18 Capital Expenditures Expectations (1) Nuclear fuel shown at ownership, including Salem. (2) Excludes TMI and Clinton EPUs, which are under review. (3) Does not include $900 million related to acquisition of John Deere Renewables. (4) ComEd not plan to move forward with these Smart Grid/Meter investments unless appropriate cost recovery mechanisms are in place. Note: Capital investment related to RITE Transmission Line is not included. $ millions 1,925 2,025 2,125 1,900 2,050 900 850 1,025 1,075 1,050 275 200 650 875 475 75 50 75 150 75 200 300 275 200 175 $0 $750 $1,500 $2,250 $3,000 $3,750 $4,500 2009 2010E 2011E 2012E 2013E Base CapEx Nuclear Fuel Nuclear Uprates and Solar/Wind Smart Grid New Business at Utilities Exelon $3,275 $3,400 $4,075 $4,275 2009 2010E 2011E 2012E 2013E Exelon Generation Base CapEx 875 800 825 800 800 Nuclear Fuel (1) 900 850 1,025 1,075 1,050 Nuclear Uprates (2) 150 275 475 550 475 Solar / Wind (3) 50 - 175 325 - Total ExGen 1,975 1,925 2,500 2,750 2,325 ComEd Base CapEx 650 775 850 650 800 Smart Grid/Meter (4) 50 50 25 100 25 New Business 150 125 125 200 225 Total ComEd 850 950 1,000 950 1,050 PECO Base CapEx 350 425 425 425 425 Smart Grid/Meter - 25 50 50 50 New Business 50 50 75 75 75 Total PECO 400 500 550 550 550 Corporate 50 25 25 25 25 $3,950 Note: Data contained on this slide is rounded. |
![]() ![]() 19 Credit Metric Outlook Financing plans, including incremental debt, designed to maintain credit metrics and investment grade rating, while funding growth projects and meeting future obligations, including uprates, dividend and pension Evaluated under a variety of economic scenarios, including a low gas stress case environment Evaluate the credit of each company on a stand-alone basis ExGen/Corp FFO/Debt credit metrics are expected to be within target range through 2013 without an equity issuance, based on 9/30 forward prices 0% 10% 20% 30% 40% 2007 2008 2009 2010E ExGen/Corp ComEd PECO Base Case FFO / Debt (3) Company FFO/Debt Target Range (1) ExGen/Corp (2) 30-35% ComEd 15-18% PECO 15-18% (1) See slide 28 for FFO/Debt reconciliations to GAAP. FFO/Debt metrics include the following standard adjustments: debt equivalents for PV of Operating Leases, PPAs, unfunded Pension and OPEB obligations (after-tax) and other minor debt equivalents. Debt is imputed for estimated pension and OPEB obligations by operating company. (2) FFO/Debt Target Range reflects Generation FFO/Debt in addition to the debt obligations of Exelon Corp. (3) Reflects impacts of preliminary agreement with IRS to settle involuntary conversion and Competitive Transition Charge (CTC) positions ($420M) at ComEd. Expected to return to target levels in 2011. For additional information see “Other Income Tax Matters” under Footnote 10 of the Q3 2010 Form 10-Q. |
![]() 20 Projected 2010 Key Credit Measures 14.2x 9.5x FFO / Interest Generation / Corp: 62% 35% FFO / Debt 54% 69% Rating Agency Debt Ratio BBB A- A- BBB- S&P Credit Ratings (3) BBB+ A BBB+ BBB+ Fitch Credit Ratings (3) A3 A1 Baa1 Baa1 Moody’s Credit Ratings (3) 2.0x 2.4x FFO / Interest ComEd: 7% (4) 8% (4) FFO / Debt 43% 52% Rating Agency Debt Ratio 4.6x 5.1x FFO / Interest PECO: 25% 23% FFO / Debt 47% 50% Rating Agency Debt Ratio 31% 48% Rating Agency Debt Ratio 85% 43% FFO / Debt 21.3x 11.7x FFO / Interest Generation: 48% 32% 6.2x Without PPA & Pension / OPEB (2) 59% Rating Agency Debt Ratio 23% FFO / Debt 5.9x FFO / Interest Exelon Consolidated: With PPA & Pension / OPEB (1) Notes: Exelon and PECO metrics exclude securitization debt. See slide 28 for FFO (Funds from Operations)/Interest, FFO/Debt and Adjusted Book Debt Ratio reconciliations to GAAP. (1) FFO/Debt metrics include the following standard adjustments: debt equivalents for PV of Operating Leases, PPAs, unfunded Pension and OPEB obligations (after-tax) and other minor debt equivalents. (2) Excludes items listed in note (1) above. (3) Current senior unsecured ratings for Exelon and Exelon Generation and senior secured ratings for ComEd and PECO as of October 26, 2010. (4) Reflects impacts of preliminary agreement with IRS to settle involuntary conversion and CTC positions ($420M). Expected to return to target levels in 2011. For additional information see “Other Income Tax Matters” under Footnote 10 of the Q3 2010 Form 10-Q. |
![]() 21 Committed to Investment Grade Ratings Exelon believes that solid investment grade ratings are critical for managing and operating both regulated utilities and a commodity-based generation company Our investment grade rating increases the pool of lenders, provides access to a broad range of trading counterparties, and enhances our strategic options Commercial Business Opportunities Asset acquisitions Ability to participate in or to bid competitively for PPAs and long- term transactions Increased liquidity for energy trading: counterparties’ costs would increase for non-investment grade transactions, thereby reducing market participation Manageable Liquidity Requirements Lower collateral requirements for energy trading Ability to secure sizeable and sufficient bank credit facilities (currently $7.4B) Use of guarantees (versus letters of credit) to fulfill NRC requirements for Nuclear Decommissioning Trust obligations Business and Financial Flexibility Reliable access to long-term debt markets to meet sizeable capital program Lower cost and ability to extend debt maturity profile Access to commercial paper market Efficient Capital Markets Access Avoid prepayments on long-term contracts (such as uranium), which reduce working capital requirements Avoid restrictive bond covenants and secured financing transactions Limits regulatory friction |
![]() 22 Sufficient Liquidity -- -- -- -- Outstanding Facility Draws (430) (226) (1) (196) Outstanding Letters of Credit $7,365 $4,834 $574 $1,000 Aggregate Bank Commitments (1) 6,935 4,608 573 804 Available Capacity Under Facilities (2) -- -- -- -- Outstanding Commercial Paper $6,935 $4,608 $573 $804 Available Capacity Less Outstanding Commercial Paper Exelon (3) ($ millions) Available Capacity Under Bank Facilities as of October 25, 2010 Exelon bank facilities are largely untapped (1) Excludes previous commitment from Lehman Brothers Bank and commitments from Exelon’s Community and Minority Bank Credit Facility. (2) Available Capacity Under Facilities represents the unused bank commitments under the borrower’s credit agreements net of outstanding letters of credit and facility draws. The amount of commercial paper outstanding does not reduce the available capacity under the credit agreements. (3) Includes other corporate entities. |
![]() 23 23 23 Credit Facility Plans Exelon’s primary sources of short-term liquidity include credit facilities, commercial paper, the money pool (1) and cash on hand Current total credit facility size is $7.4 billion, the largest in the power sector Large and diverse bank group – 23 banks committed to the facilities with each bank having less than 10% of the aggregate commitments Bank market continues to improve and facility costs are tightening Exelon Corp + Exelon Generation • $5.8 billion facilities largely expire October 26, 2012 - plan to extend/refinance the facilities in first half of 2011 • Continued use of non-margining transactions and currently evaluating alternatives to reduce reliance on bank credit PECO • $574 million facility largely expires on October 26, 2012 - plan to extend/refinance the facility in first half of 2011 ComEd • Successfully executed $1 billion revolving credit facility agreement which will expire on March 25, 2013 Replaces previous $952 million facility that was due to expire on 2/16/11 • Reflects strong relationships with large, diverse bank group 22 banks in facility – none with exposure of more than 6% Recently closed on a $94 million 364-day credit facility with a group of 29 community and minority-owned banks (1) ComEd does not participate in the money pool. |
![]() 24 Pension and OPEB Funding Pension Protection Act of 2006 ("PPA 2006") generally requires funding of qualified pension plans over a seven year period; OPEB plans do not have a required funding level (1) Pension unfunded amounts are imputed as debt by S&P and Moody’s in the FFO/Debt calculation; S&P also imputes debt for OPEB Exelon monitors economic conditions, funding election options and pension funding relief to ensure efficient funding policies are employed $2,736 $4,460 Unfunded Status $30 / $250 $5 OPEB $85 / $950 $45 Sensitivities to a 50 basis point change (3) Discount rate (cost / obligation) EROA (cost) (4) Pension As of 9/30/10 ($ millions) Pension Framework Exelon’s Position Exelon’s estimated pension contributions include the minimum amount required under ERISA, including amounts necessary to avoid benefit restrictions and at-risk status as defined by PPA 2006 (2) OPEB contributions are based on various factors, including tax deductibility and levels of benefit claims Plan to fund obligations with combination of cash and debt (1) PECO is subject to certain contribution requirements established by the PAPUC. (2) PPA 2006 requires attainment of certain funding levels to avoid benefit restrictions (such as an inability to pay lump sums or to accrue benefits) and at-risk status (which triggers higher minimum contribution requirements and participant notification). (3) Sensitivities are averages meant to provide directional guidance and are not necessarily symmetrical for increases and decreases in rates. Cost sensitivities shown include ~25% overall capitalization of pension costs. (4) EROA = Expected return on assets; represents impact on cost. The expected return on assets assumption for pension is 8.00% and 7.37% for OPEB for 2011 and 2012. |
![]() 25 Potential Variability in Future Pension Expense and Contributions $1,330 $3,345 $355 $1,235 $4,595 $450 5.83% in 2010 4.22% in 2011 4.57% in 2012 4.00% in 2010 8.00% in 2011 12.59% in 2012 Alternative II V-Shaped Recovery Unfunded balance – end of year $835 $1,120 $220 $735 $2,180 $305 5.83% in 2010 5.38% in 2011 6.40% in 2012 4.00% in 2010 7.60% in 2011 5.22% in 2012 Alternative I Mild Stagflation Unfunded balance – end of year $900 $2,870 $320 $910 $3,800 $350 5.83% in 2010 5.01% in 2011 5.15% in 2012 4.00% in 2010 8.00% in 2011 8.00% in 2012 Baseline as of September 30, 2010 Unfunded balance – end of year Expected contribution Pre-tax expense Expected contribution Pre-tax expense Discount Rate Asset Return Experience ($ in millions) Illustrative Scenario Assumptions 2011 2012 2010: Exelon estimates pre-tax 2010 pension expense of $245 million and 2010 pension contributions of $765 million. (1) Pension expenses include settlement charges. (2) The contributions shown above include estimated pension contributions required under ERISA, as amended, and contributions necessary to avoid benefit restrictions and at-risk status, as defined by the Pension Protection Act of 2006. (3) The expected return on assets assumption for all scenarios above is 8.00% for 2011 and 2012. Note: Slide provided for illustrative purposes and not intended to represent a forecast of future outcomes. Assumes ~25% overall capitalization of pension costs. |
![]() 26 Potential Variability in Future OPEB Expense and Contributions 2010: Exelon estimates pre-tax 2010 OPEB expense of $190 million and 2010 OPEB contributions of $190 million. (1) Expense estimates do not include the impact of health care reform legislation (including excise tax). (2) The contributions shown above are subject to change. (3) The expected return on assets assumption for all scenarios above is 7.37% for 2011 and 2012. Note: Slide provided for illustrative purposes and not intended to represent a forecast of future outcomes. Assumes ~25% overall capitalization of OPEB costs. $205 $2,820 $260 $200 $2,730 $265 5.83% in 2010 4.22% in 2011 4.57% in 2012 3.52% in 2010 7.37% in 2011 11.58% in 2012 Alternative II V-Shaped Recovery Unfunded balance – end of year $205 $1,755 $190 $200 $1,910 $210 5.83% in 2010 5.38% in 2011 6.40% in 2012 3.52% in 2010 6.99% in 2011 4.80% in 2012 Alternative I Mild Stagflation Unfunded balance – end of year $195 $2,430 $240 $190 $2,440 $230 5.83% in 2010 5.01% in 2011 5.15% in 2012 3.52% in 2010 7.37% in 2011 7.37% in 2012 Baseline as of September 30, 2010 Unfunded balance – end of year Expected contribution Pre-tax expense Expected contribution Pre-tax expense Discount Rate Asset Return Experience ($ in millions) Illustrative Scenario Assumptions 2011 2012 |
![]() 27 Debt Maturity Profile Note: Balances shown exclude securitized debt and include capital leases. Debt maturities over the next several years are manageable Exelon Corp Exelon Generation ComEd PECO As of October 1, 2010 $0 $200 $400 $600 $800 $1,000 $1,200 $1,400 2011 2013 2015 2017 2019 2021 2023 2025 2027 2029 2031 2033 2035 2037 2039 2041 |
![]() 28 FFO Calculation and Ratios + Other Non-Cash items (1) - AFUDC/Cap. Interest - Decommissioning activity +/- Change in Working Capital FFO Calculation = FFO - PECO Transition Bond Principal Paydown Net Cash Flows provided by Operating Activities Net Interest Expense Adjusted Interest FFO + Adjusted Interest = Adjusted Interest + Interest on Present Value (PV) of Operating Leases + Interest on imputed debt related to PV of Purchased Power Agreements (PPA) + AFUDC & Capitalized interest - PECO Transition Bond Interest Expense FFO Interest Coverage FFO = Adjusted Debt + Off-balance sheet debt equivalents (2) - PECO Transition Bond Principal Balance + Short-term Debt + Long-term Debt Debt: Adjusted Debt (3) FFO Debt Coverage Rating Agency Capitalization Rating Agency Debt Total Adjusted Capitalization Adjusted Book Debt = Total Rating Agency Capitalization + Off-balance sheet debt equivalents (2) Total Adjusted Capitalization = Rating Agency Debt + Off-balance sheet debt equivalents (2) Adjusted Book Debt = Total Adjusted Capitalization + Adjusted Book Debt + Preferred Securities of Subsidiaries + Total Shareholders' Equity Capitalization: = Adjusted Book Debt - Transition Bond Principal Balance + Short-term Debt + Long-term Debt Debt: Debt to Total Cap (1) Reflects depreciation adjustment for PPAs and operating leases and pension/OPEB contribution normalization. (2) Metrics are calculated in presentation unadjusted and adjusted for debt equivalents for PV of Operating Leases, PPAs, unfunded Pension and OPEB obligations (after-tax), Capital Adequacy for Energy Trading and other minor debt equivalents. (3) Uses current year-end adjusted debt balance. |
![]() 29 Environmental * * * * * * * * * * * * |
![]() ![]() ![]() ![]() 30 Recognition for Sustainability and Environmental Leadership Named to the 2010 Carbon Disclosure Leadership Index Included in the Dow Jones Sustainability North America Index for the fifth consecutive year Exelon’s 2020 Plan: a low carbon roadmap Exelon continues to be recognized for our 2020 plan to reduce, offset or displace our company’s 2001 carbon footprint by the year 2020 |
![]() 31 EPA Regulations – Market Implications Leading up to 2012 Compliance Notes: RPM auctions take place annually in May. For definition of the EPA regulations referred to on this slide, please see the EPA’s Terms of Environment (http://www.epa.gov/OCEPAterms/). |
![]() 32 0 200 400 600 800 1,000 0 50 100 150 200 Source: M.J. Bradley & Associates (2010). Benchmarking Air Emissions of the 100 Largest Electric Power Producers in the United States. Bubble size represents sulfur dioxide intensity, expressed in terms of metric tons of SO2 per TWh generated 2008 Gross Generation (TWh) Clean, Efficient Fleet Well Positioned for Environmental Regulations SO2 Emissions of Largest U.S. Electricity Generators Using SO2 emissions as a proxy for hazardous air pollutants, Exelon well positioned for Hazardous Air Pollutant ruling in 2011 Exelon Competitive Integrated / IPP Regulated Integrated |
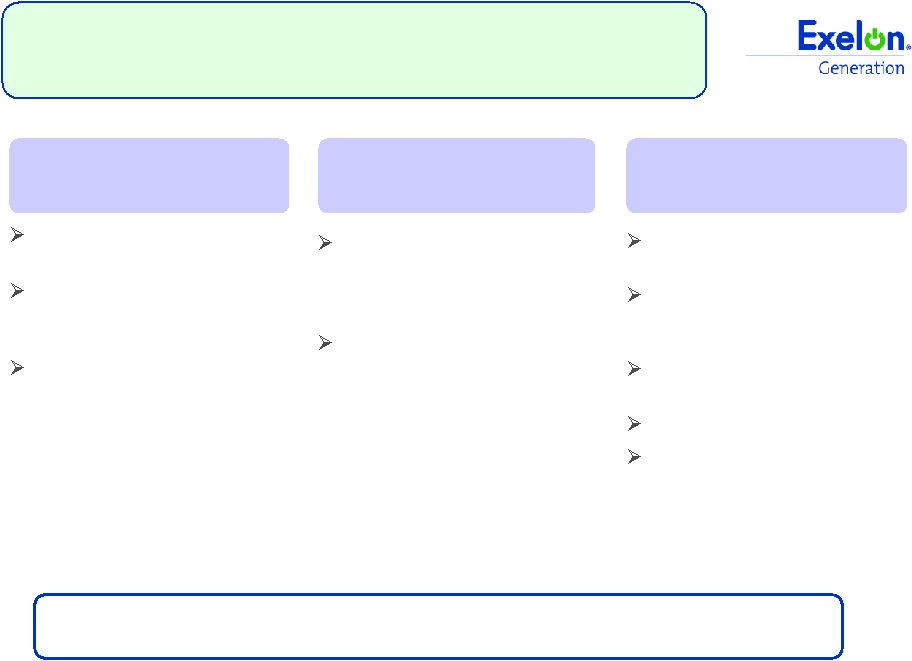
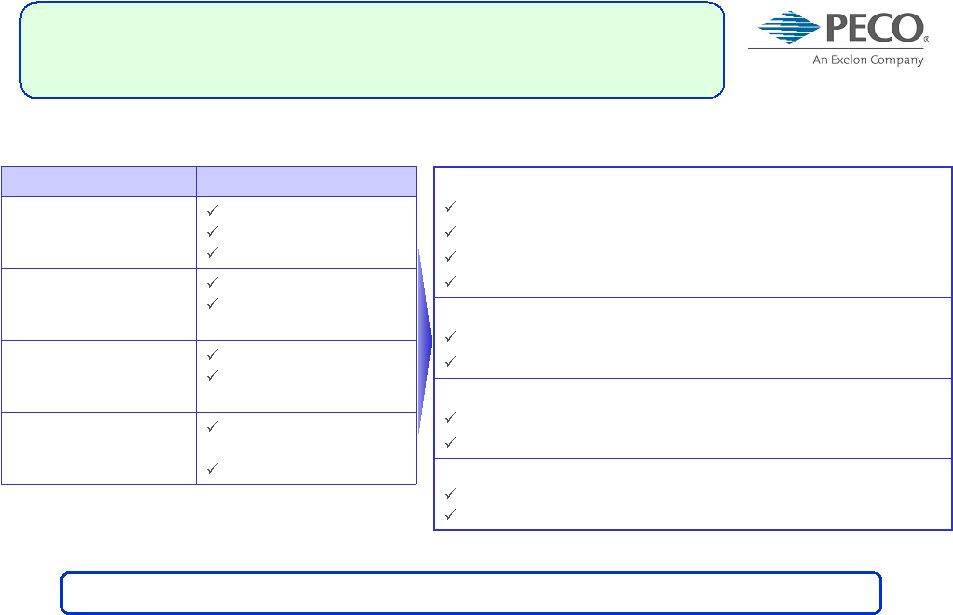
![]() 33 Why EPA Regulations Will Not Be Delayed Opposition will have a voice, but the framework and timetable have been set Each NERC region has excess capacity, totaling over 100 GW nationwide Between 2001-2003, industry built over 160 GW of new generation – four times what is projected will retire over next 5 years EPA's modeling indicates that only 14 GW of additional capacity would need to be retrofitted with flue gas desulfurization (FGD) for Phase 2 of the Transport rule (2014) Industry has already demonstrated ability to schedule and sequence outages to comply Well over half of existing units have already installed pollution controls EPA estimates in 2014 that the proposed Transport Rule will have annual net benefits (in 2006$) of $120-290 billion using a 3% discount rate Up to 1 year extension by EPA only if necessary for installation of controls President has only used exemption two times in history (only for national security interests) Supporting Facts Electric system reliability will not be compromised if the industry and its regulators manage the transition Retirements will cause reliability issues on the grid Recent industry trends suggest that it is reasonable to install this quantity of scrubbers according to the proposed timeframe. Timeline is too tight for compliance Proven technologies are commercially available and have already been installed demonstrating that the costs can be managed Total savings to consumer, including healthcare impacts Costs are prohibitive for industry and consumer Federal court would have to determine that the rules are inconsistent with applicable law, which is unlikely to occur because the amended rules are aligned with the court’s expectations Courts will suspend the rules or the President will intervene Reality Opposing Argument |
![]() 34 34 Providing Relief in Extreme Cases: Statutory and Regulatory Safeguards Override CAA-derived control requirements in limited emergency circumstances. Section 202(c) of the Federal Power Act U.S. Department of Energy Agency Source of Authority Supporting Language EPA Section 112(i)(3)(B) of the Clean Air Act The Administrator (or a State with a program approved under subchapter V of this chapter) may issue a permit that grants an extension permitting an existing source up to 1 additional year to comply with standards under subsection (d) of this section if such additional period is necessary for the installation of controls. U.S. President Section 112(i)(4) of the Clean Air Act The President may exempt any stationary source from compliance with any standard or limitation under this section for a period of not more than 2 years if the President determines that the technology to implement such standard is not available and that it is in the national security interests of the United States to do so. An exemption under this paragraph may be extended for 1 or more additional periods, each period not to exceed 2 years. The President shall report to Congress with respect to each exemption (or extension thereof) made under this paragraph. Extensions for plants to comply will be on a plant-by-plant basis, for a limited time period, and only if specific “tests” are met |
![]() 35 EPA Clean Air Standards Will Not Threaten Electric System Reliability (1) M.J. Bradley & Associates, LLC and Analysis Group 2010. Ensuring a Clean, Modern Electric Generating Fleet while Maintaining Electric System Reliability. Full study available at www.mjbradley.com/documents/MJBAandAnalysisGroupReliabilityReportAugust2010.pdf. Proactive steps by EPA, the industry and other agencies will allow orderly plant retirements without impacting system reliability M.J. Bradley and Analysis Group report (1) in August 2010 concluded industry is well-positioned to respond to proposed standards • System has >100 GW of excess capacity • Regulators have tools to address localized reliability concerns, including appropriate price signals from capacity markets • Industry has proven track record of adding generation capacity and transmission solutions New clean air standards will help modernize US power generation infrastructure • Proven technologies for controls are commercially available: >50% of coal units have installed controls demonstrating that compliance costs can be managed • Pollution-intensive plant retirements will create room for cleaner, more efficient generation |
![]() 36 Retiring Cromby Station and Eddystone Units 1&2 Agreed to delay deactivation of two units to maintain reliability (1) , provided receipt of required environmental permits and adequate cost-based compensation • Maintained scheduled retirement date of 5/31/11 for Cromby 1 and Eddystone 1 • Revised retirement dates for Cromby 2 to 12/31/11 and Eddystone 2 to 6/01/12 RMR filed with FERC in 2Q10 • Establishes terms and conditions under which Cromby 2 and Eddystone 2 will operate during RMR period • Allows Exelon to recover costs of operating and maintaining units under Cost of Service Recovery Rate – Estimated at $2.6 million per RMR-month for Cromby Unit 2 and $8.8 million per RMR-month for Eddystone Unit 2, plus recovery of project investment • In September 2010, FERC issued order accepting RMR filing, but set matter for hearing to review additional information to justify Cost of Service mentioned above • Currently in settlement discussions with interveners; targeting final approval by 4Q10 RMR Unit Operating Limitations • Dispatched and operated solely for reliability purposes • Unable to bid into PJM RPM capacity auctions (1) See PJM’s website (http://www.pjm.com/planning/generation-retirements/gr-study-results.aspx) for additional details regarding PJM’s Deactivation Study and Exelon’s response. Note: RMR = reliability must-run agreement. Exelon’s experience with Cromby Station & Eddystone units 1 and 2 is an example of how to work with stakeholders to reliably retire uneconomic coal |
![]() 37 37 Exelon’s Exposure to EPA Regulations Significant, primarily fossil fuel-fired generation None None (5) GHG Tailoring Rule Compliance costs of up to $2.8 billion / year ~$100 million None anticipated Keystone & Conemaugh (3) Fossil-fuel fired units >25 MW: ~4,000 MW (4) Criteria Pollutants / CATR Significant, primarily fossil fuel-fired generation Included in CATR costs Impact to be determined Keystone & Conemaugh (3) Oil-Fired Units >25 MW: ~935 MW Hazardous Air Pollutants Significant, impacts all fuel types including large base load and intermediate units Compliance costs up to $20 billion Industry Impact (2) EPA Regulation Units Affected Exelon Investment Needed (1) Coal combustion waste Keystone & Conemaugh (3) Subtitle C: < $100 million (6) Subtitle D: no impact 316(b) or Cooling Water Facilities without closed-cycle recirculating systems (e.g. cooling towers) POWER: Schuylkill, Eddystone 3 & 4, Fairless Hills, Mountain Creek, Handley NUCLEAR: Clinton, Dresden, Quad Cities, Oyster Creek, Peach Bottom, Salem Impact to be determined once rule is promulgated; Cost to retrofit Oyster Creek and Salem estimated at $700-800 million and $500 million, respectively (3) (1) These rules are in the proposed or pre-proposed stage and estimates are based on published cost studies used as inputs to IPM modeling. (2) EPA’s estimated costs, where applicable. (3) Investment needed shown is Exelon’s share of the cost. Exelon owns 21% share in Keystone and Conemaugh and 42.59% share in Salem. Keystone & Conemaugh units all have scrubbers and Keystone units have SCRs. Oyster Creek and Salem investment estimates based on 2006 studies. (4) Exelon’s existing coal-fired units will be retired before this rule will take effect. (5) This rule applies only to new sources or major modifications of existing sources. (6) Excludes Eddystone 1 and 2 and Cromby, which are scheduled to retire in 2011 and 2012. |
![]() 38 Clean Air Transport Rule EPA proposed the Transport Rule on July 6, 2010 to replace CAIR (Clean Air Interstate Rule) • Exelon filed comments in support of Transport Rule on October 1 • Final rule expected from EPA by June 2011 Would require 31 states and the District of Columbia to significantly improve air quality by reducing power plant emissions that contribute to ozone and fine particle pollution in other states • Requires significant reductions in sulfur dioxide (SO2) and nitrogen oxide (NOx) EPA estimates annual compliance cost at $2.8 billion, but would yield healthcare savings of $120 - $290 billion in 2014 EPA has proposed three implementation alternatives for public comment, but its preference is the "State Budgets/Limited Trading" option that establishes state- specific emission budgets and allows for intrastate and limited interstate trading Compliance set to begin on January 1, 2012 Source: EPA |
![]() 39 Exelon’s View on FERC NOPR On June 17, 2010, FERC issued a Notice of Proposed Rulemaking (NOPR) on Transmission Planning and Cost Allocation. NOPR proposals include: • Modify planning processes for public policy mandates, such as renewable energy standards (RES) • Increase intra- and inter-regional planning coordination • Eliminate existing preferences in FERC tariffs for incumbent transmission facility developers to build needed transmission • Embrace broad application of “beneficiary pays” standard for cost allocation Exelon generally supports the NOPR and proposes the following: • Mandate stronger inter-regional planning requirements, such as PJM coordination with MISO to accommodate new transmission • Maintain the right of first refusal by incumbent transmission owners for local reliability projects • Require planning for enforceable state public policy mandates, as well as EPA rules that affect capacity requirements • Allocate costs to loads that benefit Exelon continues to advocate for fair and appropriate planning rules for new transmission to address state and federal policy |
![]() ![]() ![]() 40 Post-MACT Real Required ATC Price (Energy + Capacity) $0 $20 $40 $60 $80 $100 $120 $140 $160 0 20 40 60 80 100 120 140 160 180 200 220 240 260 280 TWh Energy Efficiency Uprates Coal Retirement CCGT Coal-to-Gas Redispatch Merchant Wind New Nuclear Solar Clean Coal Exelon 2020 Supply Curve – Supporting Details Note: Represents a single economic and power market outlook, which is indicative of a range of scenarios. Category Explanation Energy Efficiency (EE) The first 1% of a 4.25% total EE target, which would be in line with a 17% RPS target that allows up to a quarter of the target to be met with EE. Uprates Exelon's MURs and LP Turbines. Coal Retirement Capacity expected to retire due to power prices (based on low gas) and CATR. Eddy and Cromby are representative of this bucket. Uprates Exelon's EPUs EE The next 2% of a 4.25% total EE target. Coal Retirement Additional capacity that retires as a result of HAPs MACT regulation. Total of 11 GW of coal expected to retire between this bar and the first coal retirement bar. CCGT New CCGTs that get built in PJM by 2020 due to expected impact from MACT and nominal demand growth. Coal Retirement Incremental retirements that would result from CATR + a carbon price (no MACT assumed). Coal-to-Gas Redispatch Incremental gas-fired generation -- displacing generation that would otherwise come from coal (not coal retirements) EE The last 1.25% of a 4.25% total EE target Coal-to-Gas Redispatch Incremental gas-fired generation resulting from a higher carbon price. Uprates Uprates at nuclear plants that are not currently planned. Assumed to be subsidized cost of a new nuclear plant. Coal Retirement Incremental retirements that would result from CATR + MACT + carbon price. Coal-to-Gas Redispatch Incremental gas-fired generation resulting from a higher carbon price. Wind Western PJM half of total new wind build of 13 GW resulting from 17% RPS target (wind is assumed to meet this target, less the 25% contribution from EE). Wind Eastern PJM half of total new wind build of 13 GW resulting from 17% RPS target (wind is assumed to meet this target, less the 25% contribution from EE). New Nuclear Estimate of constructing new nuclear unit Clean Coal Estimate of constructing a clean coal plant Solar Solar installation in the Pennsylvania market. |
![]() 41 * * * * * * ************ ************ ************ ************ ************ ************ ************ ************ ************ |
![]() 42 75 80 85 90 95 100 Range 5-Year Average World-Class Nuclear Operator Nuclear Production Cost ($/MWh) (1) Among major nuclear plant fleet operators, Exelon is consistently one of the lowest-cost producers of electricity in the nation Range of Fleet 2-Yr Avg Capacity Factor (2005-2009) (2) EXC 93.8% Operator (1) Source: 2009 Electric Utility Cost Group (EUCG) survey. Includes Fuel Cost plus Direct O&M divided by net generation. (2) Source: Platts Nuclear News, Nuclear Energy Institute and Energy Information Administration (Department of Energy). $10.00 $12.00 $14.00 $16.00 $18.00 $20.00 $22.00 $24.00 $26.00 $28.00 $30.00 Range 5-Year Average EXC Operator |
![]() 43 0 10 20 30 40 50 60 2000 2001 2002 2003 2004 2005 2006 2007 2008 2009 Industry (w/o Exelon) Exelon Impact of Refueling Outages Note: Data includes Salem. Net nuclear generation data based on ownership interest. All Exelon owned units on a 24 month cycle except for Braidwood U1/U2, Byron U1/U2 and Salem U1/U2, which are on 18 month cycles Average Outage Duration (2008-9): ~29 days (1) Nuclear Refueling Cycle 11 planned refueling outages, including 2 at Salem 6 refueling outages planned for the Spring and 5 refueling outages planned for the Fall 2011 Refueling Outage Impact 10 planned refueling outages, including 1 at Salem Completed 6 refueling outages in the Spring with an average duration of 25 days 4 planned Fall refueling outages (Peach Bottom 2, Oyster Creek, Braidwood 1 and Dresden 3) 2010 Refueling Outage Impact (1) Includes Salem and 23 days of TMI 2009 outage that extended into 2010 reflecting steam generator replacement. 125 127 129 131 133 135 137 139 141 143 145 2004 2005 2006 2007 2008 2009 2010 2011 2012 2013 2014 2015 7 8 9 10 11 12 13 Refueling Outage Duration Nuclear Output Actual Target # of Outages Note: Exelon data includes Salem. 2009 average includes 23 days of TMI outage that extended into 2010 reflecting steam generator replacement. |
![]() 44 Projected Total Nuclear Fuel Spend $750 $850 $950 $1,000 $1,075 $1,150 0 200 400 600 800 1,000 1,200 1,400 2010 2011 2012 2013 2014 2015 Nuclear Fuel Expense (Amortization + Spent Fuel) Nuclear Fuel Capex Note: At 100%, excluding Salem. Excludes costs reimbursed under the settlement agreement with the DOE. Nuclear fuel expense is amortized over three refueling outage cycles Nuclear fuel capital expenditures are recognized in the period of investment Exelon Generation is the largest uranium user in the U.S. and uses diverse sources and contract terms to manage supply |
![]() 45 Effectively Managing Nuclear Fuel Costs Uranium 29% Conversion 3% Tax/Interest 1% Nuclear Waste Fund 17% Fabrication 16% Enrichment 34% Components of Fuel Expense in 2010 Projected Exelon Average Uranium Cost vs. Market Projected Exelon Uranium Demand 2010 – 2015: 100% hedged in volume 0.0 2.0 4.0 6.0 8.0 10.0 2010 2011 2012 2013 2014 2015 Exelon Nuclear’s uranium demand is 100% physically hedged for 2010-2015 Contracted prices continue to be below market prices Uranium prices were volatile over last 5 years, but have stabilized in the $40-$60/lb range All charts exclude Salem 0% 10% 20% 30% 40% 50% 60% 70% 80% 90% 100% 2010 2011 2012 2013 2014 2015 Exelon Average Reload Price Projected Market Price |
![]() 46 Nuclear Uprates Offer Sustainable Value Key component of Exelon 2020 low carbon roadmap Creates additional low- carbon generation capacity Uprates equivalent in size to a new nuclear plant but significantly lower cost, shorter timeline, and more predictable expenditures No ongoing incremental O&M expense Capitalizes on Exelon’s proven track record of uprate execution Dedicated project management team Proven technology design Allows us to adjust timing to respond to market conditions Straightforward regulatory and environmental licenses, permits and approvals Potential for uprates to meet state alternative energy standards Strategic Value Regulatory Feasibility Execution Feasibility Uprate projects enable cost-effective growth and leverage Exelon’s operation excellence |
![]() 47 Three Major Categories of Exelon Uprates Uprates Overnight Cost (1) MUR (Measurement Uncertainty Recapture) • Through the use of advanced techniques and more precise instrumentation, reactor power can be more accurately calculated • Can achieve up to 1.7% additional output • Requires NRC approval 190–233 MW $310M 2 years 899–1,015 MW $2,550M EPU (Extended Power Uprate) (2) • Through a combination of more sophisticated analysis and upgrades to plant equipment, uprates can increase output by as much as 20% of original licensed power level • Requires NRC approval 3 - 6 years 239–260 MW $790M Megawatt Recovery and Component Upgrades • Replacement of major components in the plant occur in the normal life cycle process – with newer technology, replacements result in increased efficiency • Equipment includes generators, turbines, motors and transformers • Megawatt Recovery and Component Upgrades must conform to NRC standards, but do not require additional NRC approval 3-4 years ~1,300–1,500 MW $3,650M Project Duration (1) In 2010 dollars. Overnight costs do not include financing costs or cost escalation. (2) Includes TMI and Clinton EPUs; which are currently under review. Estimated Internal Rate of Return 12-14% 14-16% 11-14% Refined scenario analysis highlights that uprates continue to be economic, although TMI and Clinton are under review |
![]() 48 Multi-Regional Nuclear Uprate Program 94 2 19 12 61 MW Online to Date 2011 / 2012 32 25 Peach Bottom 2011 / 2010 104 97 Quad Cities 2014 15 12 TMI 2014 / 2013 31 25 Dresden 2013 / 2013 23 19 Quad Cities 2012 / 2012 42 34 Byron 2012 / 2012 42 34 Braidwood 2011 / 2011 41 33 Limerick 2011 / 2011 39 35 LaSalle 2014 / 2015 3 3 Peach Bottom MUR: 2012 / 2013 6 6 Limerick 2012 / 2013 110 103 Dresden 2011 / 2012 5 5 Dresden EPU: MW Recovery & Component Upgrades: 2016 / 2017 340 306 Limerick 1,508 1,331 Total 172 336 17 148 2 Max Potential MW 2016 138 TMI 2016 / 2015 303 LaSalle 2016 17 Clinton 2015 / 2016 134 Peach Bottom 2010 2 Clinton Year of Full Operation by Unit Base Case MW Station TMI Limerick Peach Bottom Total Midwest Uprates: 674-751 MW Total Mid-Atlantic Uprates: 657-757 MW Quad Cities Dresden Byron LaSalle Clinton Braidwood Notes: MW shown at ownership. An additional 23 MW expected to come online by end of 2010 at Limerick 1 and Dresden 3. Executing uprate projects across our geographically diverse nuclear fleet Under review |
![]() 49 Phased Execution Lowers Risk Note: MW shown at ownership. Data contained in this slide is rounded. (1) Dollars shown are nominal, reflecting 6% escalation, in millions. (2) Excludes TMI and Clinton EPUs, which are currently under review. Exelon's Uprate Plan Expenditures $0 $100 $200 $300 $400 $500 $600 $700 2008A 2009A 2010E 2011E 2012E 2013E 2014E 2015E 2016E 2017E 0 200 400 600 800 1,000 1,200 1,400 1,600 Megawatt Recovery MUR EPU MW Online (Cumulative) $150 $275 $475 $550 $475 $600 $625 $425 $200 $ millions Highest return projects are being completed in the early years Leverages Exelon’s substantial experience managing successful uprate projects – 1,100 MW completed between 1999 - 2008 $50 Approximately 117 MW scheduled to be completed in 2009 and 2010; total expenditures expected to be $3,825 million from 2008 – 2017 (1)(2) |
![]() 50 Quad Cities Uprate Program MW Recovery • Unit 2 Low Pressure Turbine Retrofit completed April 2010, increase of 50 MW achieved • Unit 1 Low Pressure Retrofit planned for Spring 2011 • Partial completion of Unit 1 work has resulted in an increase of 11 MW MUR • Planned start date of project will be in 2011 • Timing of uprate will be dependent on NRC approval of license amendment EPU • Completed in 2002 Scheduled start in 2011 1Q2013 9 2Q2013 9 MUR * Capital investment and MW uprate numbers represent Exelon’s 75% ownership stake in Quad Cities Station. In progress 2Q2010 50 3Q2011 47 MW Recovery (Low Pressure Turbine Retrofit) Status Online Date MW Increase* Online Date MW Increase* Uprate Project Unit 2 Unit 1 Quad Cities Uprate Projects are underway – additional MWs will come on line between 2010 and 2013 Capital Investment $M* $0 $50 $100 2009 2010 2011 2012 2013 2014 2015 2016 MW Recovery and Component Upgrade MUR |
![]() 51 Peach Bottom Uprate Program MW Recovery • Project in progress with Low Pressure Turbine Retrofit installations expected in 2011 and 2012 • Replace Reactor Recirculation Pump Motor Generator sets with energy efficient Adjustable Speed Drives in 2014 and 2015 MUR • Completed in 2003 EPU • Funding approved for design work • Will review in 2011 before authorizing installation funding for physical plant modifications and purchase of materials Peach Bottom Uprate Projects are underway – additional MWs will come online between 2011 and 2016 Capital Investment $M* $0 $50 $100 $150 2009 2010 2011 2012 2013 2014 2015 2016 2017 MW Recovery and Component Upgrade EPU * Capital investment and MW uprate numbers represent Exelon’s 50% ownership stake in Peach Bottom Station. In progress 4Q2011 11 4Q2012 14 MW Recovery (Low Pressure Turbine Retrofit) Design phase in progress 1Q2016 67 1Q2015 67 EPU Scheduled to start in 2012 4Q2015 2 4Q2014 2 MW Recovery (Adjustable Speed Drives) Status Online Date MW Increase* Online Date MW Increase* Uprate Project Unit 3 Unit 2 |
![]() 52 Dresden Uprate Program MW Recovery • Project in progress with Low Pressure Turbine Retrofit installations expected in 2011 and 2012 • Partial completion of Unit 2 work has resulted in an increase of 12 MW • Replace Reactor Recirculation Pump Motor Generator sets with energy efficient Adjustable Speed Drives in 2011 and 2012 MUR • Planned start date of project will be in 2011 • Timing of uprate will be dependent on NRC approval of license amendment EPU • Completed in 2002 Dresden Uprate Projects are underway – additional MWs will come online between 2011 and 2014 Capital Investment $M $0 $50 $100 $150 $200 2009 2010 2011 2012 2013 2014 2015 2016 2017 MW Recovery and Component Upgrade MUR In progress 4Q2012 3 4Q2011 3 MW Recovery (Adjustable Speed Drives) Scheduled start in 2011 1Q2013 12 1Q2014 12 MUR In progress 1Q2013 51 1Q2012 52 MW Recovery (Low Pressure Turbine Retrofit) Status Online Date MW Increase Online Date MW Increase Uprate Project Unit 3 Unit 2 |
![]() 53 Zion Station Decommissioning On September 1, 2010, Exelon transferred license to EnergySolutions, which will dismantle the Zion Nuclear Generating Station • Located in Northeast Illinois, Zion ceased operations in 1998 • Commercial operations began in 1973 for Unit 1 and 1974 for Unit 2 $1 billion, 10-year project will be the largest nuclear dismantling ever undertaken in the U.S. • Entire cost of decommissioning will be funded through the station’s decommissioning trust fund • No operating income statement impact for Exelon Approval received from Nuclear Regulatory Commission in first-of-its kind agreement Exelon will retain ownership of the plant’s spent nuclear fuel, which must remain on the property in a secure facility Once decommissioning is completed, responsibility for the site will be transferred back to Exelon |
![]() 54 Exelon Nuclear Fleet Overview Note: Fleet also includes 4 shutdown units: Peach Bottom 1, Dresden 1, Zion 1 & 2. Average in-service time = 29 years 2011 42.6% Exelon, 57.4% PSEG In process (decision in 2011- 2012): 2016, 2020 503, 500 (2) W PWR 2 Salem, NJ 2025 100% Renewed: 2034 837 B&W PWR 1 TMI-1, PA Dry cask 100% Renewed: 2029 625 GE BWR 1 Oyster Creek, NJ Dry cask 50% Exelon, 50% PSEG Renewed: 2033, 2034 574, 571 (2) GE BWR 2 Peach Bottom, PA Dry cask 75% Exelon, 25% Mid- American Holdings Renewed: 2032 655, 662 (2) GE BWR 2 Quad Cities, IL Dry cask 100% Renewed: 2029, 2031 869, 871 GE BWR 2 Dresden, IL 2010 100% 2022, 2023 1138, 1150 GE BWR 2 LaSalle, IL Dry cask 100% 2024, 2029 1148, 1145 GE BWR 2 Limerick, PA 2018 2011 2013 Spent Fuel Storage/ Date to lose full core discharge capacity (3) GE W W Vendor BWR PWR PWR Type 1 2 2 Units 100% 2026 1065 Clinton, IL 100% 2024, 2026 1183, 1153 Byron, IL 100% 2026, 2027 1194, 1166 Braidwood, IL Ownership License Status / Expiration (1) Net Annual Mean Rating MW 2009 Plant, Location (1) Operating license renewal process takes approximately 4-5 years from commencement until completion of NRC review. (2) Capacity based on ownership interest. (3) The date for loss of full core reserve identifies when the on-site storage pool will no longer have sufficient space to receive a full complement of fuel from the reactor core. Dry cask storage will be in operation at those sites prior to the closing of their on-site storage pools. License extensions will be pursued for all units not already renewed |
![]() 55 John Deere Renewables Acquisition – Transaction Summary Deal Structure 735 MW operating portfolio spread across 36 projects located in eight states with 230 MW in Michigan in late stage development $860M purchase price plus up to $40M for Michigan development projects, funded by $900 million debt issuance at Exelon Generation 75% of the operating portfolio is sold under long-term power purchase arrangements; 86% of contracted portfolio has PPAs through 2026 or beyond Additional 1,238 MW in development pipeline EBITDA run-rate of ~$150M/year including Production Tax Credits (and including Michigan development projects) Strategic Rationale Diversify with clean generation – unique entry point into wind generation Contracted portfolio with option for future growth Attractive economics and good fit Expect to close transaction in 4Q 2010 |
![]() 56 John Deere Renewables Acquisition Asset Profile Geographic Distribution TX, 26% MO, 22% MI, 17% ID, 12% MN, 11% OR, 10% KS, 2% IL, 1% Note: There is ongoing litigation with Southwest Public Service related to PURPA contracts which could affect the price at which the generation from these units is sold. Cracking issues experienced by Deere on certain Suzlon turbine blades have been addressed to our satisfaction. We have factored both items into our valuation. Project State MW # of Wind Projects Ownership Placed in Service Date PPA End Date Federal Incentive Off-Taker Idaho 88.2 3 100% 2009/2010 2028/2030 ITC Grant Idaho Power Illinois 8.4 1 99% 2008 2018 PTC Wabash Valley Power Kansas 12.5 1 100% 2010 2030 PTC Kansas Power Pool Michigan 121.8 2 100% 2008 2018/2028 PTC Wolverine Power Supply / Consumers Energy Minnesota 77.7 9 94%-100% 2003/2008 2018/2028 PTC Various Missouri 162.5 4 99%-100% 2008 2027 PTC Associated Electric / MO Joint Municipal Oregon 74.5 4 99%-100% 2009 2029 ITC Grant PacifiCorp Texas 189.8 12 100% 2006/2009 N/A PTC Southwest Public Service Total 735.4 36 Additional 1,238 MW development pipeline includes wind projects ranging from 20 MW to 300 MW Development of projects to be considered on a case- by-case basis Projects to be Developed by Exelon 230 Total 81 Blissfield (MW IV) MI 59 Harvest II MI 90 MW Michigan Wind II MI Project Name State Operating Assets |
![]() 57 Natural Gas Outlook The economic recovery has increased natural gas demand, but this has been met by sufficient supply Shale gas has proven itself to be a low cost and abundant resource, but not the only resource • Most production growth is expected to come from shale resulting in a flatter gas supply curve • Non-core shale, tight sands and coal bed methane resources are higher cost and will remain part of the total supply mix A flatter supply curve provides market stability, but increased drilling costs, environmental concerns and uncertainty regarding shale decline rates could put upward pressure on the marginal cost of gas and therefore prices Sources: Wood Mackenzie, PIRA, NYMEX Current fundamentals support a forward natural gas price in the $5-$6.50/MMBtu range Higher Cost Gas Resources |
![]() 58 0% 10% 20% 30% 40% 50% 60% 70% 80% 90% 100% 2011 2012 2013 Underlying Options Q3 2010 Ratable Exelon Generation Hedging Program 2012 hedging levels currently above ratable • Increased rate of 2012 sales in 2nd Quarter of 2010 to capture higher prices in Mid-Atlantic, and slowed down in Q3 as prices fell • Participation in long-term procurements Normal practice is to hedge commodity risk on a ratable basis over three years • Maintain flexibility from quarter to quarter • Use of gas and power options to capture potential upside while providing downside price protection Note: % values represent amount above ratable plan 1% 8% Exelon’s ratable hedging program provides flexibility to time sales based on fundamental view of the market (1) Data as of end of 3Q 2010. 2012 Historical Power & Gas Prices Current Hedge Level vs. Ratable Plan (1) 9% 30.00 35.00 40.00 45.00 50.00 55.00 1/4/10 2/3/10 3/5/10 4/4/10 5/4/10 6/3/10 7/3/10 8/2/10 9/1/10 10/1/10 4.50 4.75 5.00 5.25 5.50 5.75 6.00 6.25 6.50 6.75 7.00 PJMW Hub NiHub Henry Hub Nat Gas |
![]() 59 (1) Represents values as of September 30, 2010. A diverse set of customers and products is important for Exelon Generation’s hedging program • Reduces and diversifies our collateral exposure • Improves portfolio product fit (load following) and sales closer to assets • Increases opportunities for margin via retail, utility solicitations and mid–marketing channels • Long term transactions provide extended price certainty and monetize environmental upside • Use of alternate channels and locations help minimize liquidity constraints Multiple sales channels to market enhances value and maximizes liquidity and credit diversity 2011 - 2013 Sales as a Percentage of Expected Generation (1) Open Generation 37% Options 8% Retail 5% Utility Procurements 23% Standard Product Sales 27% Multiple Channels To Market |
![]() 60 Exelon Energy – Competitive Retail Supplies a wide range of energy and natural gas products directly to commercial and industrial customers in Illinois, Pennsylvania, Michigan and Ohio Managed as a part of the overall Exelon Generation hedging strategy • Retail load profile complements generation portfolio • Long term sales agreements with creditworthy customers reduces portfolio price and earnings risk • Projected sales growing from ~10% to 20% of expected generation over the next 3 years Channel to build relationship with end-use customers • Partner with customers to meet their energy supply needs • Products support Exelon 2020 and provide access to Exelon Generation’s low-emission generation fleet – Renewable Energy Credits (RECs), including John Deere wind resources – Low Carbon Energy Certificates (EFECs) Nuclear energy attributes transferred through PJM Generation Attribute Tracking System Exelon Energy complements Exelon Generation footprint by leveraging broad experience in wholesale markets and asset management Electric Volumes - 5 10 15 20 25 30 35 2008 2009 2010E 2011E 2012E 2013E MWh - Millions COMED / Ameren PECO/PPL Other |
![]() 61 61 Reliability Pricing Model (RPM) Auction Note: Data contained on this slide is rounded. (1) All generation values are approximate and not inclusive of wholesale transactions. (2) All capacity values are in installed capacity terms (summer ratings) located in the areas and capacity values have been adjusted for mid-year PPA roll-offs. JDR assets are not included in the capacity position. (3) Obligation consists of load obligations from PECO. PECO PPA expires December 2010. (4) Reflects decision in December 2009 to permanently retire Cromby Station and Eddystone Units 1&2 as of 5/31/11. None of these 933 MW cleared in the 2011/2012 or 2012/2013 auctions. (5) Weighted average $/MW-Day would apply if all generation cleared in the highlighted zones. 2010/2011 2011/2012 2012/2013 2013/2014 in MW Capacity (2) Obligation Capacity (2) Capacity (2) Capacity (2) RTO 23,900 9,300 - 9,400 (3) 22,300 11,600 10,300 $174.29 $110.00 $16.46 $27.73 EMAAC 8,700 (4) 8,700 (4) $174.29 $110.00 $139.73 $245.00 MAAC 1,500 1,500 $174.29 $110.00 $133.37 $226.15 Avg ($/MW-Day) (5) $174.29 $110.00 $74.00 $134.00 Exelon Generation Eligible Capacity within PJM Reliability Pricing Model (1) |
![]() 62 PA Gross Receipts Tax (5.90%) Distribution Losses (7.35%) Full Requirements Cost PJM Whub ATC Forward Energy Price Estimated Build-Up of PECO Average Residential Full Requirements Price – Fall 2010 $76.50/MWh $23.75 - $26.25 $41.50 - $42.50 Full Requirements Costs ($/MWh) Average Full Requirements Retail Sales Price (1) Load Shape & Ancillary Services $5.75 - $6.25 Capacity $11.50 - $12.00 Transmission & Congestion $3.50 - $4.50 Renewable Energy Credits $0.25 Migration, Volumetric Risk & Other $2.75 - $3.25 ~$5.00 ~$4.50 (1) As provided by Exelon Generation. (2) On October 14, 2010 the Independent Evaluator (NERA) announced a wholesale winning bid of $66.83/MWh for PECO’s Fall 2010 RFP Residential Price. (1) As provided by Exelon Generation. (2) On October 14, 2010 the Independent Evaluator (NERA) announced a wholesale winning bid of $66.83/MWh for PECO’s Fall 2010 RFP Residential Price. Average Wholesale Energy Price $66.83 (2) |
![]() 63 Exelon Generation Hedging Disclosures (as of September 30, 2010) * * * * * * * ****** ****** ****** ****** ****** ****** ****** ****** |
![]() 64 64 Important Information The following slides are intended to provide additional information regarding the hedging program at Exelon Generation and to serve as an aid for the purposes of modeling Exelon Generation’s gross margin (operating revenues less purchased power and fuel expense). The information on the following slides is not intended to represent earnings guidance or a forecast of future events. In fact, many of the factors that ultimately will determine Exelon Generation’s actual gross margin are based upon highly variable market factors outside of our control. The information on the following slides is as of September 30, 2010. We update this information on a quarterly basis. Certain information on the following slides is based upon an internal simulation model that incorporates assumptions regarding future market conditions, including power and commodity prices, heat rates, and demand conditions, in addition to operating performance and dispatch characteristics of our generating fleet. Our simulation model and the assumptions therein are subject to change. For example, actual market conditions and the dispatch profile of our generation fleet in future periods will likely differ – and may differ significantly – from the assumptions underlying the simulation results included in the slides. In addition, the forward- looking information included in the following slides will likely change over time due to continued refinement of our simulation model and changes in our views on future market conditions. |
![]() ![]() ![]() ![]() ![]() ![]() 65 65 Portfolio Management Objective Align Hedging Activities with Financial Commitments Power Team utilizes several product types and channels to market • Wholesale and retail sales • Block products • Load-following products and load auctions • Put/call options Exelon’s hedging program is designed to protect the long-term value of our generating fleet and maintain an investment-grade balance sheet • Hedge enough commodity risk to meet future cash requirements if prices drop • Consider: financing policy (credit rating objectives, capital structure, liquidity); spending (capital and O&M); shareholder value return policy Consider market, credit, operational risk Approach to managing volatility • Increase hedging as delivery approaches • Have enough supply to meet peak load • Purchase fossil fuels as power is sold • Choose hedging products based on generation portfolio – sell what we own • Heat rate options • Fuel products • Capacity • Renewable credits % Hedged High End of Profit Low End of Profit Open Generation with LT Contracts Portfolio Optimization Portfolio Management Portfolio Management Over Time |
![]() 66 66 Percentage of Expected Generation Hedged • How many equivalent MW have been hedged at forward market prices; all hedge products used are converted to an equivalent average MW volume • Takes ALL hedges into account whether they are power sales or financial products Equivalent MWs Sold Expected Generation = Our normal practice is to hedge commodity risk on a ratable basis over the three years leading to the spot market • Carry operational length into spot market to manage forced outage and load-following risks • By using the appropriate product mix, expected generation hedged approaches the mid-90s percentile as the delivery period approaches • Participation in larger procurement events, such as utility auctions, and some flexibility in the timing of hedging may mean the hedge program is not strictly ratable from quarter to quarter Exelon Generation Hedging Program |
![]() 67 67 2011 2012 2013 Estimated Open Gross Margin ($ millions) (1)(2) $4,800 $4,700 $5,300 Open gross margin assumes all expected generation is sold at the Reference Prices listed below Reference Prices (1) Henry Hub Natural Gas ($/MMBtu) NI-Hub ATC Energy Price ($/MWh) PJM-W ATC Energy Price ($/MWh) ERCOT North ATC Spark Spread ($/MWh) (3) $4.44 $29.92 $41.07 $(0.37) $5.07 $31.89 $43.10 $0.31 $5.29 $34.04 $45.02 $1.52 Exelon Generation Open Gross Margin and Reference Prices (1) Based on September 30, 2010 market conditions. (2) Gross margin is defined as operating revenues less fuel expense and purchased power expense, excluding the impact of decommissioning and other incidental revenues. Open gross margin is estimated based upon an internal model that is developed by dispatching our expected generation to current market power and fossil fuel prices. Open gross margin assumes there is no hedging in place other than fixed assumptions for capacity cleared in the RPM auctions and uranium costs for nuclear power plants. Open gross margin contains assumptions for other gross margin line items such as various ISO bill and ancillary revenues and costs and PPA capacity revenues and payments. The estimation of open gross margin incorporates management discretion and modeling assumptions that are subject to change. (3) ERCOT North ATC spark spread using Houston Ship Channel Gas, 7,200 heat rate, $2.50 variable O&M. |
![]() 68 2011 2012 2013 Expected Generation (GWh) (1) 163,400 162,700 161,100 Midwest 99,100 96,900 95,300 Mid-Atlantic 56,500 57,100 56,400 South 7,800 8,700 9,400 Percentage of Expected Generation Hedged (2) 87-90% 62-65% 31-34% Midwest 86-89 61-64 28-31 Mid-Atlantic 93-96 66-69 36-39 South 62-65 49-52 35-38 Effective Realized Energy Price ($/MWh) (3) Midwest $44.00 $43.50 $43.00 Mid-Atlantic $57.50 $50.50 $52.00 ERCOT North ATC Spark Spread $(1.00) $(4.50) $(7.50) Generation Profile (1) Expected generation represents the amount of energy estimated to be generated or purchased through owned or contracted for capacity. Expected generation is based upon a simulated dispatch model that makes assumptions regarding future market conditions, which are calibrated to market quotes for power, fuel, load following products and options. Expected generation assumes 11 refueling outages in 2011 and 2012 and 9 refueling outages in 2013 at Exelon-operated nuclear plants and Salem. Expected generation assumes capacity factors of 93.3%, 93.1% and 93.3% in 2011, 2012 and 2013 at Exelon-operated nuclear plants. These estimates of expected generation in 2011, 2012 and 2013 do not represent guidance or a forecast of future results as Exelon has not completed its planning or optimization processes for those years. (2) Percent of expected generation hedged is the amount of equivalent sales divided by the expected generation. Includes all hedging products, such as wholesale and retail sales of power, options and swaps. Uses expected value on options. Reflects decision to permanently retire Cromby Station and Eddystone Units 1&2 as of May 31, 2011. Current RMR discussions do not impact metrics presented in the hedging disclosure. (3) Effective realized energy price is representative of an all-in hedged price, on a per MWh basis, at which expected generation has been hedged. It is developed by considering the energy revenues and costs associated with our hedges and by considering the fossil fuel that has been purchased to lock in margin. It excludes uranium costs and RPM capacity revenue, but includes the mark-to-market value of capacity contracted at prices other than RPM clearing prices including our load obligations. It can be compared with the reference prices used to calculate open gross margin in order to determine the mark-to-market value of Exelon Generation's energy hedges. |
![]() 69 69 Gross Margin Sensitivities with Existing Hedges ($ millions) (1) Henry Hub Natural Gas + $1/MMBtu - $1/MMBtu NI-Hub ATC Energy Price +$5/MWH -$5/MWH PJM-W ATC Energy Price +$5/MWH -$5/MWH Nuclear Capacity Factor +1% / -1% 2011 $30 $(15) $60 $(50) $20 $(15) +/- $40 2012 $225 $(175) $205 $(195) $120 $(115) +/- $40 2013 $455 $(420) $345 $(340) $200 $(195) +/- $45 Exelon Generation Gross Margin Sensitivities (with Existing Hedges) (1) Based on September 30, 2010 market conditions and hedged position. Gas price sensitivities are based on an assumed gas-power relationship derived from an internal model that is updated periodically. Power price sensitivities are derived by adjusting the power price assumption while keeping all other prices inputs constant. Due to correlation of the various assumptions, the hedged gross margin impact calculated by aggregating individual sensitivities may not be equal to the hedged gross margin impact calculated when correlations between the various assumptions are also considered. |
![]() 70 70 95% case 5% case $5,100 $7,200 $6,600 $6,400 Exelon Generation Gross Margin Upside / Risk (with Existing Hedges) $3,000 $4,000 $5,000 $6,000 $7,000 $8,000 $9,000 2011 2012 2013 $6,900 $4,700 (1) Represents an approximate range of expected gross margin, taking into account hedges in place, between the 5th and 95th percent confidence levels assuming all unhedged supply is sold into the spot market. Approximate gross margin ranges are based upon an internal simulation model and are subject to change based upon market inputs, future transactions and potential modeling changes. These ranges of approximate gross margin do not represent earnings guidance or a forecast of future results as Exelon has not completed its planning or optimization processes for those years. The price distributions that generate this range are calibrated to market quotes for power, fuel, load following products and options as of September 30, 2010. |
![]() 71 71 Midwest Mid-Atlantic ERCOT Step 1 Start with fleetwide open gross margin $4.80 billion Step 2 Determine the mark-to-market value of energy hedges 99,100GWh * 87% * ($44.00/MWh-$29.92MWh) = $1.21 billion 56,500GWh * 94% * ($57.50/MWh-$41.07/MWh) = $0.87 billion 7,800GWh * 63% * ($(1.00)/MWh-$(0.37)/MWh) = $(0.00) billion Step 3 Estimate hedged gross margin by adding open gross margin to mark-to- market value of energy hedges Open gross margin: $4.80 billion MTM value of energy hedges: $1.21billion + $0.87billion + $(0.00) billion Estimated hedged gross margin: $6.88 billion Illustrative Example of Modeling Exelon Generation 2011 Gross Margin (with Existing Hedges) |
![]() 72 Current Market Prices Units 2008 (1) 2009 (1) 2010 (5) 2011 (6) 2012 (6) 2013 (6) PRICES (as of September 30, 2010) PJM West Hub ATC ($/MWh) 68.52 (2) 38.30 (2) 44.38 41.06 43.09 45.01 PJM NiHub ATC ($/MWh) 49.00 (2) 28.86 (2) 32.82 29.91 31.88 34.05 NEPOOL MASS Hub ATC ($/MWh) 80.56 (2) 42.02 (2) 48.33 44.73 47.99 50.43 ERCOT North On-Peak ($/MWh) 73.36 (3) 33.50 (3) 40.13 39.21 45.23 48.19 Henry Hub Natural Gas ($/MMBTU) 8.85 (4) 3.94 (4) 4.42 4.44 5.07 5.29 WTI Crude Oil ($/bbl) 104.49 (4) 61.56 (4) 77.28 84.35 87.12 88.22 PRB 8800 ($/Ton) 12.17 9.20 12.62 14.93 15.56 16 NAPP 3.0 ($/Ton) 105.36 50.98 65.37 70 72 70 ATC HEAT RATES (as of September 30, 2010) PJM West Hub / Tetco M3 (MMBTU/MWh) 6.97 8.26 10.15 8.33 7.83 7.92 PJM NiHub / Chicago City Gate (MMBTU/MWh) 5.57 7.36 7.31 6.70 6.31 6.47 ERCOT North / Houston Ship Channel (MMBTU/MWh) 7.42 7.95 7.23 7.69 7.77 7.98 (1) 2008 and 2009 are actual settled prices. (2) Real Time LMP (Locational Marginal Price). (3) Next day over-the-counter market. (4) Average NYMEX settled prices. (5) 2010 information is a combination of actual prices through September 30, 2010 and market prices for the balance of the year. (6) 2011, 2012 and 2013 are forward market prices as of September 30, 2010. |
![]() 73 35 40 45 50 55 60 65 70 75 10/09 11/09 12/09 1/10 2/10 3/10 4/10 5/10 6/10 7/10 8/10 9/10 10/10 4.0 4.5 5.0 5.5 6.0 6.5 7.0 7.5 8.0 10/09 11/09 12/09 1/10 2/10 3/10 4/10 5/10 6/10 7/10 8/10 9/10 10/10 73 73 20 25 30 35 40 45 50 10/09 11/09 12/09 1/10 2/10 3/10 4/10 5/10 6/10 7/10 8/10 9/10 10/10 50 55 60 65 70 75 80 85 90 10/09 11/09 12/09 1/10 2/10 3/10 4/10 5/10 6/10 7/10 8/10 9/10 10/10 Market Price Snapshot Forward NYMEX Natural Gas PJM-West and Ni-Hub On-Peak Forward Prices PJM-West and Ni-Hub Wrap Forward Prices 2011 $5.55 2012 $5.93 Forward NYMEX Coal 2011 $67.29 2012 $74.50 2011 Ni-Hub $40.83 2012 Ni-Hub $42.55 2012 PJM-West $55.20 2011 PJM-West $53.61 2011 Ni-Hub $24.76 2012 Ni-Hub $26.25 2012 PJM-West $39.57 2011 PJM-West $38.26 Rolling 12 months, as of October 25th, 2010. Source: OTC quotes and electronic trading system. Quotes are daily. |
![]() 74 74 74 4.5 5.5 6.5 7.5 8.5 9.5 10.5 11.5 12.5 13.5 10/09 11/09 12/09 1/10 2/10 3/10 4/10 5/10 6/10 7/10 8/10 9/10 10/10 8.0 8.2 8.4 8.6 8.8 9.0 9.2 9.4 9.6 9.8 10.0 10/09 11/09 12/09 1/10 2/10 3/10 4/10 5/10 6/10 7/10 8/10 9/10 10/10 35 40 45 50 55 60 65 70 10/09 11/09 12/09 1/10 2/10 3/10 4/10 5/10 6/10 7/10 8/10 9/10 10/10 3.5 4.0 4.5 5.0 5.5 6.0 6.5 7.0 7.5 8.0 10/09 11/09 12/09 1/10 2/10 3/10 4/10 5/10 6/10 7/10 8/10 9/10 10/10 Market Price Snapshot 2012 9.07 2011 8.92 2011 $48.56 2012 $52.71 2011 $5.44 2012 $5.81 Houston Ship Channel Natural Gas Forward Prices ERCOT North On-Peak Forward Prices ERCOT North On-Peak v. Houston Ship Channel Implied Heat Rate 2011 $6.73 2012 $8.27 ERCOT North On Peak Spark Spread Assumes a 7.2 Heat Rate, $1.50 O&M, and $.15 adder Rolling 12 months, as of October 25th, 2010. Source: OTC quotes and electronic trading system. Quotes are daily. |
![]() 75 * * * * * * ********* ********* ********* ********* ********* ********* |
![]() 76 ComEd Load Trends Note: C&I = Commercial & Industrial Weather-Normalized Load Year-over-Year (1) A gradually improving economy is expected in 2011 as incremental improvements in the labor market – led by hiring in the manufacturing and professional/business services sectors – build economic momentum 2011 will be more of a transition year than a recovery year as the inventory and fiscal stimulus boosts are fading in late 2010 to be replaced by growth in 2011 from a cautious private sector. Housing conditions will weigh on the economy. There is little reason for significant increases in either 2011 housing starts or home prices. 2011 Outlook -10.0% -7.5% -5.0% -2.5% 0.0% 2.5% 5.0% 7.5% 10.0% 1Q09 2Q09 3Q09 4Q09 1Q10 2Q10 3Q10 4Q10E -10.0% -7.5% -5.0% -2.5% 0.0% 2.5% 5.0% 7.5% 10.0% All Customer Classes Large C&I Residential Gross Metro Product (1) Not adjusted for leap year effect. |
![]() 77 ComEd 2010 Delivery Service Rate Case Filing Summary $396 Total ($2,337 million revenue requirement) (6) $45 Other adjustments (5) $22 Bad debt costs (resets base level of bad debt to 2009 test year) $55 Pension and Post-retirement health care expenses (4) $95 Capital Structure (3) : ROE – 11.50% / Common Equity – 47.33% / ROR – 8.99% $179 (1)(2) Rate Base: $7,717 million (1) Requested Revenue Increase ($ in millions) Primary drivers of rate request are new plant investment, pension/retiree health care and cost of capital (1) Filed June 30, 2010 based on 2009 test year, including pro forma capital additions through June 2011, and certain other 2010 pro forma adjustments. Updating the depreciation and deferred tax reserves to June 2011 would reduce rate base by an estimated $667 million and would reduce the revenue requirement by approximately $85 million. (2) Includes increased depreciation expense. (3) Requested capital structure does not include goodwill; ICC docket 07-0566 allowed 10.3% ROE, 45.04% equity ratio and 8.36% ROR. ROE includes 0.40% adder for energy efficiency incentive. (4) Reflects 2010 expense levels, compared to 2007 expense levels allowed in last rate case. (5) Includes reductions to O&M and taxes other than income, offset by wage increases, normalization of storm costs and the Illinois Electric Distribution Tax, other O&M increasess and decreases in load. (6) Net of Other Revenues. ICC Docket No. 10-0467 |
![]() 78 ComEd 2010 Rate Case Update ComEd Request (6/30/10) $396M increase requested 11.50% ROE / 47.33% equity ratio Rate base $7,717M 2009 test year with pro forma plant additions thru 6/30/11 ICC Staff Testimony (10/26/10) $78M increase recommended 10.00% ROE / 47.11% equity ratio Rate base $6,663M Pro forma additions and depreciation reserve thru 9/30/10 (ICC Docket No. 10-0467) $ millions ComEd Request 396 $ Staff Adjustments: Plant Additions / Depreciation Reserve (122) ROE / Capital Structure (97) Pension Asset (33) Incentive Compensation / Severance (23) Cash Working Capital (9) Amortization of Regulatory Assets (8) Pension and OPEB Expense (4) Other Items (22) ICC Staff Recommendation 78 $ Reconciliation of ICC Staff to ComEd |
![]() 79 3.82 4.73 7.44 7.03 0.73 0.73 0.65 0.60 ComEd Delivery Rate Case Residential Rate Impacts 2010 to 2011 (1) (1) Reflects change in distribution rates only. Assumes Energy, Transmission and all other components remain constant as of June 2010, except as noted above. (2) "All Other" includes impact of riders that are applicable to residential bills. Unit rates: cents / kWh All Other (2) Transmission Energy Distribution Approximately 4% increase July 1, 2010 July 1, 2011 Transmission: Subject to FERC formula rate annual update Comments Energy: Reflects reduced PJM capacity price that PJM has published for the June 2011 – May 2012 planning period. Energy component may vary Distribution: As proposed 12.63 13.09 Note: Amounts may not add due to rounding. Proposed residential rate impact of 7% will be mitigated by impact of lower capacity prices resulting in an increase of 4% Straight Fixed/Variable Rate Design: Move delivery bill from current 37% fixed/ 63% variable to 80% fixed/ 20% variable by 2013 |
![]() 80 ComEd Delivery Rate Case Alternative Regulation (Alt Reg) Proposal ComEd filed a companion Alt Reg filing on August 31, 2010 proposing to recover the costs of pre-approved smart grid and other projects outside of the traditional rate case process • 9-month statutory process Proposal would allow for accelerated modernization of the distribution system, increased assistance to low-income households and the purchase of electric vehicles Initial series of proposed programs is $60 million, but would create a collaborative framework for increased investments in the future implementation of ICC-approved Smart Grid investments The proposal includes a “flow-through mechanism” to recover capital carrying costs and incremental O&M, as incurred Assured savings to customers – $2 million on capped O&M costs for program costs (excluding CARE) Includes an incentive/penalty mechanism for performance above or under budget Alt Reg Proposal is permitted under section 9-244 of the IL Public Utilities Act $30 $15 Man-hole refurbishment and cable replacement - $10 Expanded funding for low income CARE programs (1) $5 - Electric Vehicle Fleet Purchase Capital O&M $ millions (1) CARE = Customers’ Affordable Reliable Energy. Total CARE amount for two-year proposal is $20 million. |
![]() 81 ComEd Delivery Service Rate Case Tentative Schedule Delivery Service Rate Case Filed – June 30, 2010 Alt Reg Proposal Filed – August 31, 2010 Staff and Intervenor Direct Testimony – October 26, 2010 (Rate Case), November 19 (Alt Reg) ComEd Rebuttal Testimony – November 22 (Rate Case), December 8 (Alt Reg) Staff and Intervenor Rebuttal Testimony - December 23, 2010 (Rate Case), December 30 (Alt Reg) ComEd Surrebuttal Testimony – January 3, 2011 (Rate Case), January 5 (Alt Reg) Hearings – January 2011 Administrative Law Judge Order – March 31, 2011 Final Order Expected – May 2011 New Rates Effective – June 2011 |
![]() 82 6.7 7.7 1.9 2.0 6.7 1.9 Transmission Distribution ComEd Rate Base Growth June 1, 2011 October 1, 2008 Rates Effective 47.33% 45.04% Equity % 11.5% 10.3% ROE $7,717 million $6,694 million Rate Base 2009 pro forma 2006 pro forma Test Year Current Filing 6/30/2010 Prior Rate Case ELECTRIC DISTRIBUTION June 1, 2010 Rates Effective 56% Equity % 11.5% ROE $1,949 million Rate Base 2009 pro forma Test Year FERC Formula rate TRANSMISSION Distribution rate cases expected every ~2-3 years Transmission: FERC formula rate adjusted every year on June 1 $8.6 $8.6 2009 2010E 2011E $9.7 ComEd executing on regulatory recovery plan Rate Base in Rates End of Year ($ in billions) (1) Recent Rate Cases 8.5% Earned ROE ~45% Target ~46% Equity 2009 (1) Amounts include pro forma adjustments. On September 30, 2010, the Illinois Appellate Court ruled with regard to ComEd’s 2007 distribution rate case and held that the ICC abused its discretion in not reducing ComEd’s rate base to account for an additional 18 months of accumulated depreciation while including pro forma plant additions post-test year through that period. The Court remanded the case to the ICC. For the 2007 rate case, the Court’s ruling would reduce the $6,694 million rate base by ~$500 - $670 million resulting in a revenue reduction between $57 and $77 million. For the current rate case, updating the depreciation and deferred tax reserves to June 2011 would reduce the $7,717 million rate base by an estimated $667 million and would reduce the revenue requirement by approximately $85 million. Note: Amounts may not add due to rounding. 10% |
![]() 83 Illinois Power Agency (IPA) RFP Procurement Note: Chart is for illustrative purposes only. REC = Renewable Energy Credit; RFP = request for proposal Auction Contract June 2010 June 2011 June 2012 June 2013 June 2014 Financial Swap Agreement with ExGen (ATC baseload energy only – notional quantity 3,000 MW) Term Fixed Price 6/1/10-12/31/10 $50.15/MWh 1/1/11-12/31/11 $51.26 1/1/12-12/31/12 $52.37 1/1/13-5/31/13 $53.48 Long-Term REC Procurement Scheduled for November 2010 • 1.4 million MWh of renewable resources annually beginning in June 2012 under 20-year contracts • RFP bids due on November 19 th with contracts signed early December Spring 2011 Procurement Plan • IPA proposal submitted with a number of issues to be resolved. Final ICC decision expected by year end • Provisions that appear likely to continue: Annual energy procurements over a three-year time frame Target a 35%/35%/30% laddered procurement approach • Other items being discussed: Additional energy efficiency, demand response purchases More long-term contracts for renewables 2009 RFP 2010 RFP 2011 RFP 2011 RFP 2012 RFP 2012 RFP 2013 RFP 2010 RFP 2011 RFP Financial Swap |
![]() 84 * * * * * * |
![]() 85 PECO Load Trends Weather-Normalized Load Year-over-Year (1) 2011 Outlook Economically driven load growth will be significantly offset by mandated energy efficiency initiatives. 2011 GMP will show a gradual improvement over 2010, but not a robust recovery, where both non- manufacturing employment and income see growth of less than 1.5% Manufacturing employment is expected to remain nearly flat The housing market will offer neither a real drag nor a real boost in 2011 (1) Not adjusted for leap year effect -10.0% -7.5% -5.0% -2.5% 0.0% 2.5% 5.0% 7.5% 10.0% 1Q09 2Q09 3Q09 4Q09 1Q10 2Q10 3Q10 4Q10E -10.0% -7.5% -5.0% -2.5% 0.0% 2.5% 5.0% 7.5% 10.0% All Cust. Classes Large C&I Residential Gross Metro Product Note: C&I = Commercial & Industrial |
![]() 86 PECO – Electric & Gas Distribution Rate Case Settlements Joint settlement filed with the PAPUC on August 31, 2010 for both electric and gas rate cases Settlements are subject to administrative law judges review and PAPUC approval by mid-December 2010 $20 million $225 million Revenue Requirement Increase in Settlement (1) R-2010-2161592 R-2010-2161575 Docket # ~7% Electric ~4% 2011 Distribution Price Increase as % of Overall Customer Bill for Residential customers Gas Rate Case Details (1) Settlements are on an overall revenue requirement basis, meaning no details are provided for allowed ROE, rate base or capital structure. Note: Electric and gas rate case filings available on Pennsylvania Public Utility Commission (PAPUC) website (www.puc.state.pa.us) or www.peco.com/know. New rates scheduled to go into effect on January 1, 2011 |
![]() 87 5.03 6.26 5.84 0.69 0.51 2.57 8.40 PECO Electric Residential Rate Increases 2010 to 2011 January 1, 2011 January 1, 2010 Total = 14.7¢ Unit Rates (¢/kWh) Proposed Total Bill Increase ~5.1 % Total = 15.4¢ AEPS ~0.7% Smart Meter ~0.6% Default Service Surcharge Mechanism ~(2.9)% Transmission and Distribution ~7% Transmission Surcharge Mechanism ~1.2% Distribution Rate Case ~5.5% Energy / Capacity Competitive Transition Charge (CTC) Transmission Distribution 0.47 Energy Efficiency Surcharge Breakdown of 2010 to 2011 ~5.1% Increase (On Total Bill) Notes: • Rates effective January 1, 2010 include Act 129 Energy Efficiency surcharge of 2%. • Represents average of all residential rates including the effect of discounted rates provided to low income customers. • AEPS = Alternative Electric Portfolio Standard 0.29 |
![]() 88 3.0 3.3 3.5 0.6 0.6 0.6 1.1 1.1 1.1 0.9 Electric Distribution Electric Transmission CTC Gas PECO Executing on Transition Plan $225 million Revenue Increase January 1, 2011 Rates Effective 2010 Test Year Filing 3/31/2010 ELECTRIC DISTRIBUTION $20 million Revenue Increase January 1, 2011 Rates Effective 2010 Test Year Filing 3/31/2010 GAS DELIVERY 14.8% 53% 2009 Target 51-53% Earned ROE Equity (1) $5.6 $5.0 2009 2010E (1) As determined for rate-making purposes. Amounts reflect pro forma adjustments that may be made to determine rate base for rate case filing purposes. $5.2 2011E PECO is managing through its transition period and is positioned for continued strong financial performance post-2010 Rate Base in Rates End of Year Balance ($ in billions) (1) Recent Rate Cases (1) Stated rate; no recent rate cases TRANSMISSION Periodic rate cases going forward 10% |
![]() 89 PECO Procurement (1) See PECO Procurement website (http://www.pecoprocurement.com) for additional details regarding PECO’s procurement plan and RFP results. (2) Wholesale prices. No Small/Medium Commercial products were procured in the June 2009 RFP. (3) For Large C&I customers who previously opted to participate in the 2011 fixed-priced full requirements product. (4) Large Hourly price includes ancillary services and supplier-provided AEPS cost. Large Commercial and Industrial Large Fixed May ’10 RFP - average price of $77.55/MWh (2)(3) Large Hourly Sept ‘10 RFP - average price of $4.83/MWh (4) Medium Commercial Sept ’09 / May ’10 RFP aggregate result $77.89/MWh (2) Sept ‘10 RFP average price of $70.36/MWh (2) Residential June ’09 RFP average price of $88.61/MWh (2) Sept ’09 RFP average price of $79.96/MWh (2) May ‘10 RFP average price of $69.38/MWh (2) Sept ’10 RFP average price of $66.83/MWh (2) Small Commercial Sept ’09 / May ’10 RFP aggregate result $77.65/MWh (2) Sept ‘10 RFP average price of $70.82/MWh (2) 85% full requirements 15% full requirements spot Medium Commercial (peak demand >100 kW but <= 500 kW) Fixed-priced full requirements (3) Hourly full requirements Large Commercial & Industrial (peak demand >500 kW) 90% full requirements 10% full requirements spot 75% full requirements 20% block energy 5% energy only spot Products Small Commercial (peak demand <100 kW) Residential Customer Class PECO Procurement Plan (1) 2011 Supply Procured 2011 supply procured, two procurement events per year moving forward |
![]() 90 PECO Smart Grid/Smart Meter ($ millions pre-tax) 2010 2011 2012 2013 Total Act 129 Smart Meter Expanded Initial Deployment (1) 39 $ 86 $ 116 $ 59 $ 300 $ Smart Grid Stimulus Case 40 45 15 100 Total Stimulus Case 79 131 131 59 400 Stimulus Grant (40) (66) (66) (30) (200) Total Expenditures net of Stimulus grant 40 $ 66 $ 66 $ 30 $ 200 $ (1) Includes approximately $20 million/yr of O&M in 2010-2012. Data contained in this slide is rounded. 2010- 2013 Projected Expenditures • ACT 129 required Smart Meter technology in 15 years • DOE $200M assistance agreement completed in May – Accelerated Smart Meter deployment to 10 years • PA PUC Smart Meter Plan approval received in April • PECO to spend $650M in total (including stimulus grant) – $550M for Smart Meter – $100M for Smart Grid • Surcharge mechanism with 10% allowed return • Letters of Intent with vendors for Automated Metering Infrastructure (AMI) communications network, smart meters and meter installation; projects underway • Significant field work on Smart Grid projects to enhance reliability in progress • Implemented DOE compliance reporting • Sub-applicant agreements signed with Drexel and Liberty Partners • Dynamic Pricing Plan filing in progress • Complete limited test of our Smart Meter and communications system technologies • Continue to integrate supporting AMI systems (e.g., meter data management, billing, middleware) • Continue Smart Grid Distribution Automation and Intelligent Substations Implementation • Complete Distribution Management and Geographical Information System Vendor Selections • Finalize communications and customer experience plan Background Near-Term Focus Key Accomplishments |
![]() 91 2009 GAAP EPS Reconciliation 0.16 - - - 0.16 Mark-to-market adjustments from economic hedging activities (0.05) - - - (0.05) Retirement of fossil generating units (0.01) - - (0.01) - City of Chicago settlement with ComEd (0.10) - - (0.01) (0.09) 2007 Illinois electric rate settlement (0.11) (0.04) - - (0.07) Costs associated with early debt retirements (0.20) - - - (0.20) Impairment of certain generating assets (0.03) - (0.00) (0.02) (0.01) 2009 restructuring charges 0.05 - - - 0.05 Decommissioning obligation reduction (0.03) (0.03) - - - NRG Energy, Inc. acquisition costs 0.19 - - - 0.19 Unrealized gains related to nuclear decommissioning trust funds 0.10 (0.02) - 0.06 0.06 Non-cash remeasurement of income tax uncertainties and reassessment of state deferred income taxes $4.09 $(0.21) $0.53 $0.56 $3.21 FY 2009 GAAP Earnings (Loss) Per Share $4.12 $(0.12) $0.54 $0.54 $3.16 2009 Adjusted (non-GAAP) Operating Earnings (Loss) Per Share Exelon Other PECO ComEd ExGen 2009 GAAP EPS Reconciliation (1) (1) All amounts shown are per Exelon share and represent contributions to Exelon's EPS. Note: Amounts may not add due to rounding. |
![]() 92 2010 Earnings Outlook Exelon’s 2010 adjusted (non-GAAP) operating earnings outlook excludes the earnings effects of the following: • Mark-to-market adjustments from economic hedging activities • Unrealized gains and losses from nuclear decommissioning trust fund investments to the extent not offset by contractual accounting as described in the notes to the consolidated financial statements • Significant impairments of assets, including goodwill • Costs associated with the 2007 Illinois electric rate settlement agreement • Costs associated with ComEd’s 2007 settlement with the City of Chicago • Costs associated with the retirement of fossil generating units • Non-cash charge resulting from passage of Federal health care legislation • Non-cash remeasurement of income tax uncertainties • External costs associated with Exelon’s proposed acquisition of John Deere Renewables • Impairment of certain emission allowances • Other unusual items • Significant future changes to GAAP Operating earnings guidance assumes normal weather for remainder of the year Operating O&M target excludes the following items: • Exelon Generation: Decommissioning accretion expense • ComEd and PECO: Impact of regulatory riders |
![]() 93 Exelon Investor Relations Contacts Exelon Investor Relations 10 South Dearborn Street Chicago, Illinois 60603 312-394-2345 312-394-4082 (Fax) For copies of other presentations, annual/quarterly reports, or to be added to our email distribution list please contact: Martha Chavez, Executive Admin Coordinator 312-394-4069 Martha.Chavez@ExelonCorp.com Investor Relations Contacts: Stacie Frank, Vice President 312-394-3094 Stacie.Frank@ExelonCorp.com Melissa Sherrod, Director 312-394-8351 Melissa.Sherrod@ExelonCorp.com Paul Mountain, Manager 312-394-2407 Paul.Mountain@ExelonCorp.com Marybeth Flater, Manager 312-394-8354 Marybeth.Flater@ExelonCorp.com Sandeep Menon, Principal Analyst 312-394-7279 Sandeep.Menon@ExelonCorp.com |