 Credit Suisse 2011 Energy Summit William A. Von Hoene, Jr., EVP Finance & Legal February 9, 2011 Exhibit 99.1 |
 2 Forward-Looking Statements This presentation includes forward-looking statements within the meaning of the Private Securities Litigation Reform Act of 1995, that are subject to risks and uncertainties. The factors that could cause actual results to differ materially from these forward-looking statements include those discussed herein as well as those discussed in (1) Exelon’s 2009 Annual Report on Form 10-K in (a) ITEM 1A. Risk Factors, (b) ITEM 7. Management’s Discussion and Analysis of Financial Condition and Results of Operations and (c) ITEM 8. Financial Statements and Supplementary Data: Note 18; (2) Exelon’s Third Quarter 2010 Quarterly Report on Form 10-Q in (a) Part II, Other Information, ITEM 1A. Risk Factors, (b) Part 1, Financial Information, ITEM 2. Management’s Discussion and Analysis of Financial Condition and Results of Operations and (c) Part I , Financial Information, ITEM 1. Financial Statements: Note 13 and (3) other factors discussed in filings with the Securities and Exchange Commission (SEC) by Exelon Corporation, Commonwealth Edison Company, PECO Energy Company and Exelon Generation Company, LLC (Companies). Readers are cautioned not to place undue reliance on these forward-looking statements, which apply only as of the date of this presentation. None of the Companies undertakes any obligation to publicly release any revision to its forward-looking statements to reflect events or circumstances after the date of this presentation. This presentation includes references to adjusted (non-GAAP) operating earnings and non-GAAP cash flows that exclude the impact of certain factors. We believe that these adjusted operating earnings and cash flows are representative of the underlying operational results of the Companies. Please refer to the appendix to this presentation for a reconciliation of adjusted (non-GAAP) operating earnings to GAAP earnings. Please refer to the footnotes of the following slides for a reconciliation non-GAAP cash flows to GAAP cash flows. |
 3 (1) Refer to 1/26/11 Earnings Release Attachments for additional details and to the Appendix for a reconciliation of adjusted (non-GAAP) operating EPS to GAAP EPS. (2) Cash from operations primarily includes net cash flows provided by operating activities, excludes counterparty collateral and includes net cash from investing activities other than capital expenditures, acquisition of Exelon Wind (in 2010) and change in restricted cash. 2011: Expect a Solid Year EPS guidance of $3.90-$4.20 (1) Strong cash flow – expect to generate cash from operations of $4.3 billion (2) Increasing investment in growth projects at ExGen and Utilities Efficient use of cash benefits from bonus depreciation Key Financial Messages 2010: Another Strong Year Financial and operational performance • Operating earnings of $4.06/share (1) • 2010 cash from operations of $5.3 billion (2) • Returned $1.4 billion in cash to shareholders through dividends • 93.9% capacity factor at Nuclear Continuing to position Exelon for cleaner energy future |
 4 Largest merchant nuclear fleet in the U.S. Consistent world-class performance in nuclear operations Utilities serving two of the largest metropolitan areas in the U.S. Stable dividend that has yielded ~5% on average over the past year Why Is Exelon a Good Investment? Commitment to investment grade credit ratings and financial discipline Exelon is able to execute from a position of strength based on solid fundamentals |
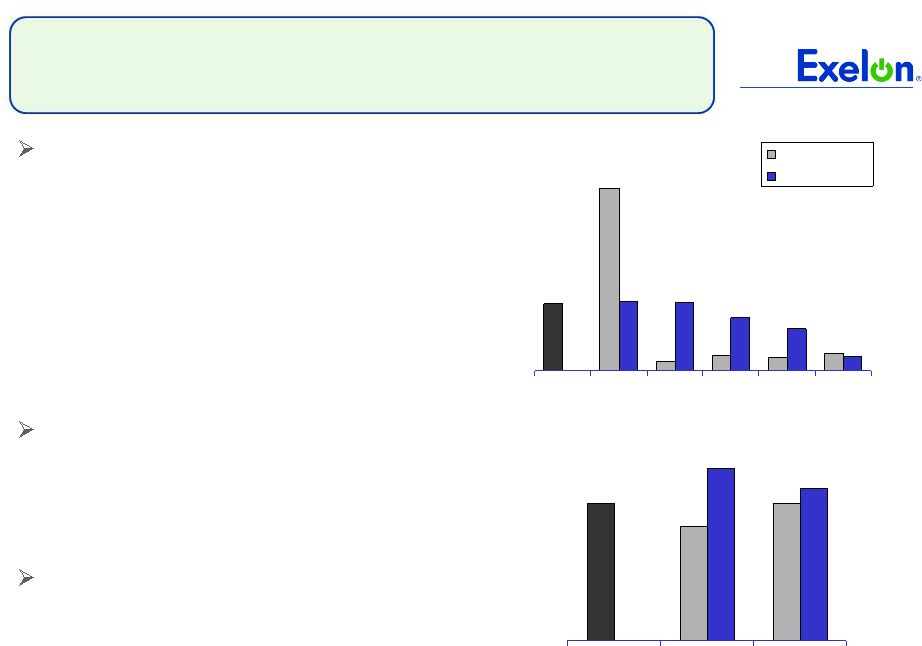
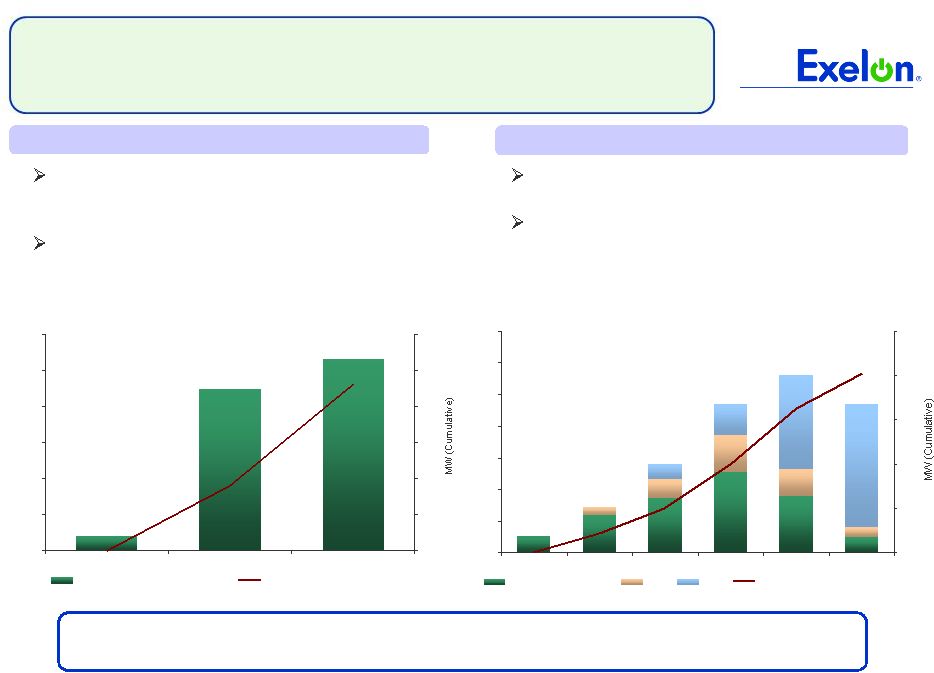 5 Exelon Wind Expenditures (Advanced Development Projects) $0 $50 $100 $150 $200 $250 $300 2010A 2011E 2012E 0 50 100 150 200 250 300 Annual Project CapEx MW Online (Cumulative) Growing Our Clean Generation (1) Dollars shown are nominal, reflecting 6% escalation, in millions and exclude TMI and Clinton extended power uprates, which are currently under review. MW shown at ownership. Note: PPA = power purchase agreement; MUR = measurement uncertainty recapture; EPU = extended power uprate. Data contained in this slide is rounded. $150 $275 $550 $475 $475 $ millions $50 Exelon is positioned as a key player in the US wind market and has the largest size and scale for nuclear uprates $ millions Wind Development Projects Nuclear Uprates Program Highest return projects are being completed in early years Leverages Exelon’s substantial experience managing successful uprate projects – 1,100 MW completed from 1999 to 2008, 101 MWs added in 2009-2010 Attractive economics for both operating and advanced development projects – PPAs already executed Provides diversity in geographic presence and generation type $225 $265 $20 Exelon's Uprate Plan Expenditures (1) $0 $100 $200 $300 $400 $500 $600 $700 2008A 2009A 2010A 2011E 2012E 2013E 0 100 200 300 400 500 Megawatt Recovery MUR EPU MW Online (Cumulative) |
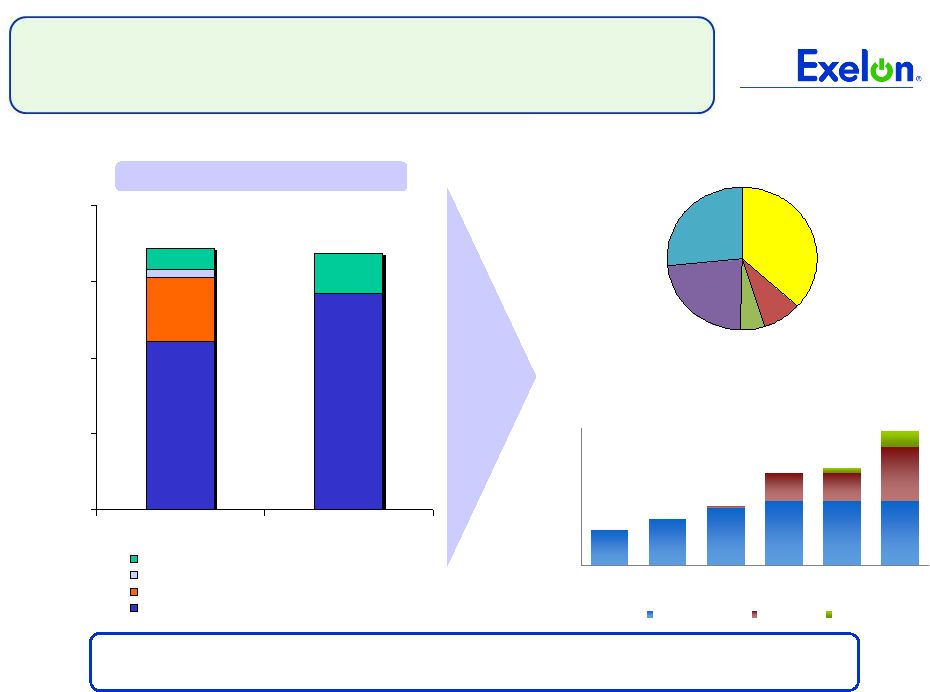 6 6 Moving Generation to Market 110,594 142,400 42,003 5,295 13,897 26,300 0 50,000 100,000 150,000 200,000 2010 2011E ComEd Swap IL Auction PECO Load Actual Forward Hedges & Open Position 171,789 168,700 (1) Represents values as of December 31, 2010. Transition to market at PECO provides additional channels to market for Exelon Generation, including opportunities at Exelon Energy Exelon Energy Electric Volumes - 5 10 15 20 25 30 2008 2009 2010 2011E 2012E 2013E MWh - Millions COMED / Ameren PECO/PPL Other Expected Total Sales (GWh) (1) 2011-2013 Sales as % of Expected Generation (1) Exelon Energy 6% Standard Product Sales 29% Open Generation 36% Options 5% Utility Procurements 24% |
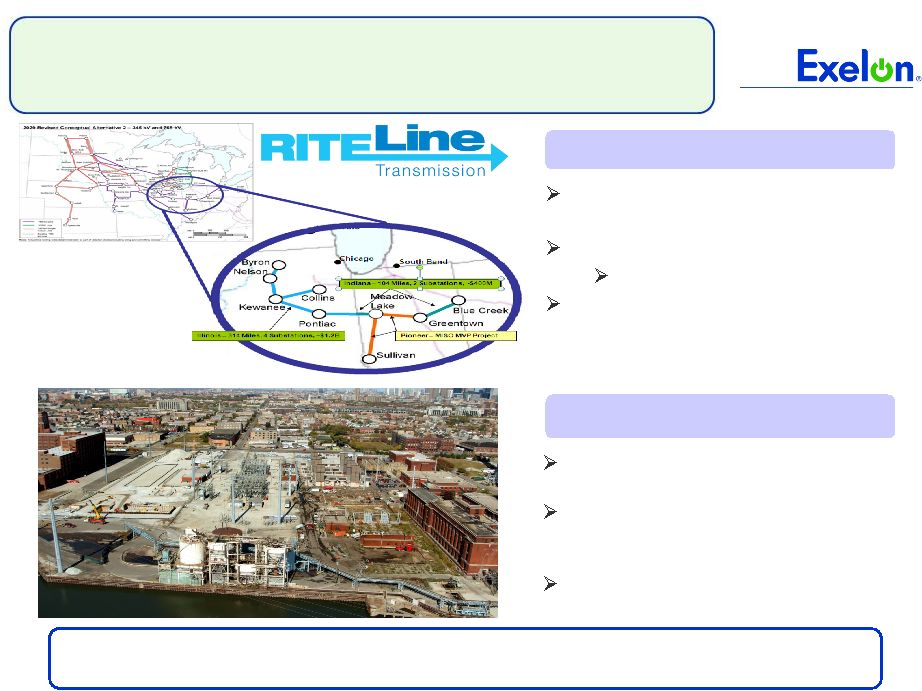 7 7 Pursuing Transmission Investment Moving forward on project planning with partner ETA Total Investment ~$1.6 billion ComEd/Exelon ~$1.1 billion FERC incentive rate joint filing expected late 1Q or early 2Q 2011 Exelon companies are investing in projects that ensure reliability and support further clean energy development Note: Electric Transmission America (ETA) is an American Electric Power & MidAmerican Energy Holdings joint venture company. RITE Line Ensures reliable service to the Chicago central business district Estimated cost of ~$170 million recoverable under ComEd’s FERC formula rate Expected in-service December 2011 West Loop Phase II |
 8 Driving Financial Discipline Going to market to refinance 2012 maturities in the first half of this year (in millions) Generation PECO Corporate ComEd Total Unsecured Revolving Credit Facilities (4) $4,834 $574 $957 $1,000 $7,365 Expiration date Oct 2012 Oct 2012 Oct 2012 March 2013 Maintaining a strong balance sheet and liquidity position $2.1B Pension Contribution in 2011 Credit Facilities Continued Strong Balance Sheet FFO / Debt (1)(2) Pension Contributions 615 2,100 765 110 175 160 195 780 790 170 485 2010 2011 2012 2013 2014 2015 With $2.1B Original Plan* ($ millions) * Original Plan reflects preliminary 2010 underlying assumptions (including discount rate and asset returns). 0% 5% 10% 15% 20% 25% 30% 35% 40% 45% 50% 2009A 2010A 2011E 2012E 2013E ExGen/Corp ComEd PECO (3) S&P Target Range S&P Target Range (1) Reflects FFO / Debt as calculated by S&P. (2) Dashed lines represent S&P Target Ranges (30-35% for ExGen/Corp and 15-18% for ComEd and PECO). See slide 24 for reconciliations to GAAP. (3) FFO/Debt Target Range reflects ExGen FFO/Debt in addition to the debt obligations of Exelon Corp. (4) Excludes $94 million of credit facility agreements arranged with minority and community banks on 10/22/10 that are utilized solely to issue letters of credit. |
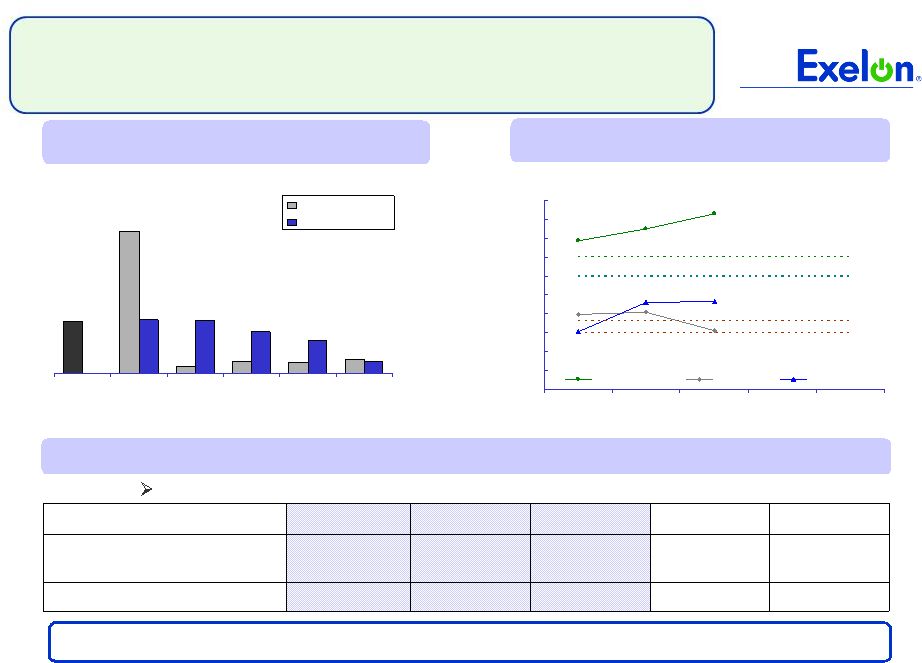
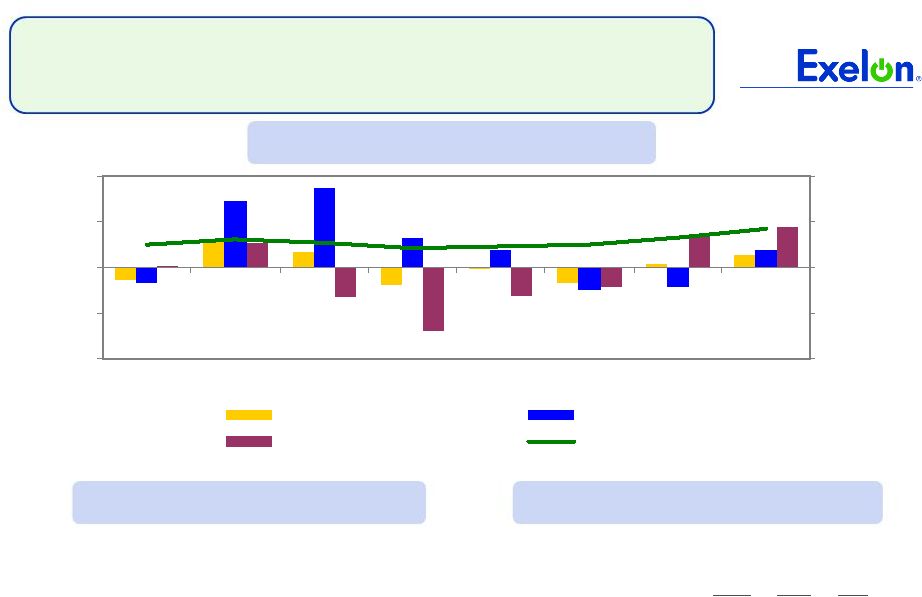
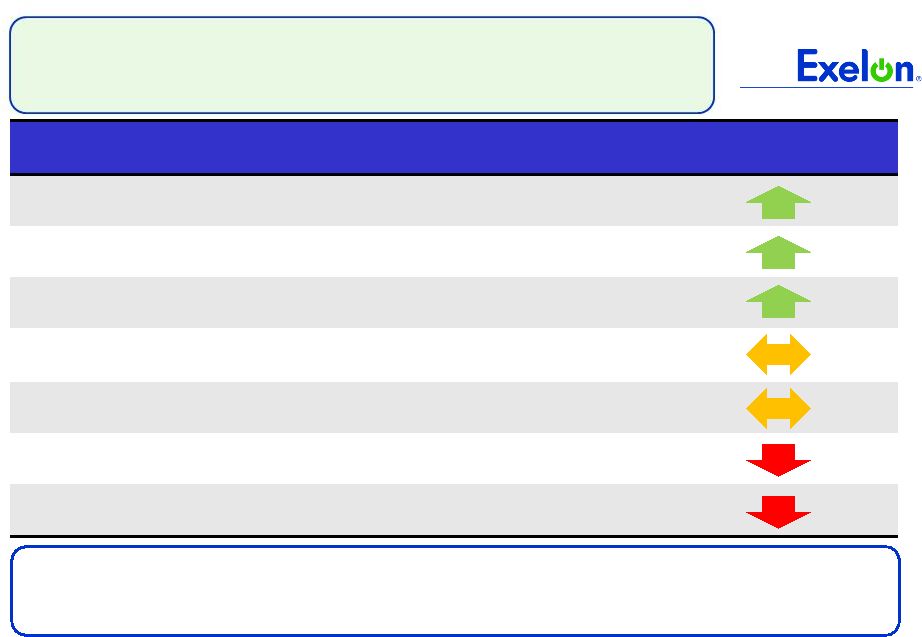 9 9 Factors Influencing PJM RPM Capacity Auction (Comparison of PY 14/15 and PY 13/14 Price Drivers) Exelon Price Impact Cost of Environmental Upgrades (1) Higher Net CONE (2) Higher Net ACRs For Coal Units (3) Import Transmission Limits And Objectives (muted impact on portfolio revenues due to regional diversification) NJ CCGT Proposal / PJM Minimum Offer Price Rules Peak Load (4) Demand Response Growth 2014/15 PJM Capacity Auction: Expected Changes Since Planning Year 2013/14 Exelon’s capacity position, split almost evenly between the west and the east, dampens the volatility to portfolio revenues from changes to transmission limits while retaining upside across the fleet from upcoming EPA regulations (1) We expect generators to reflect cost of capital expenditures into their cost based offers at the upcoming auction. (2) Cost of new entry (CONE) increased by 7.6% (for RTO) and 5.3% to 6.5% (within Locational Deliverability Areas (LDAs)). (3) Replacing 2007 net revenues with significantly lower 2010 revenues in the Net ACR (avoidable cost rate) calculations for coal generators may increase offer caps for certain coal generators in the next auction. However, some coal units may not be affecteddue to high net revenues compared to avoidable costs. (4) Peak load reduced by approx. 1% in RTO (excluding the impact from Duke Ohio integration). Note: RPM = Reliability Pricing Model; CCGT = combined cycle gas turbine |
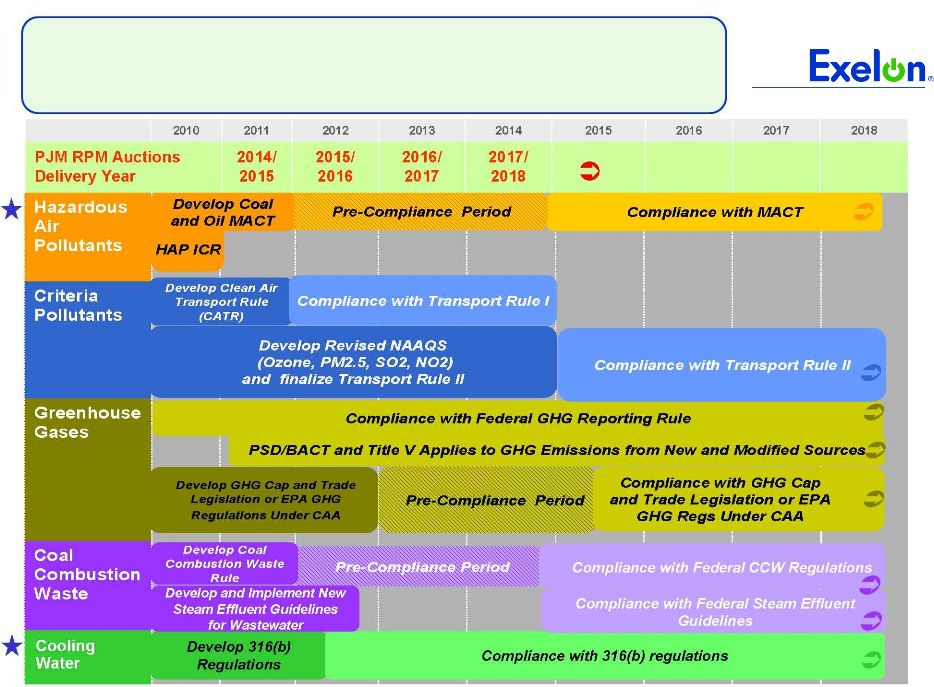 10 EPA Regulations Will Move Forward in 2011 Note: RPM auctions take place annually in May. For definition of the EPA regulations referred to on this slide, please see the EPA’s Terms of Environment (http://www.epa.gov/OCEPAterms/). |
  11 Q&A |
  12 Appendix |
 13 2011 Events of Interest Q1 Q2 Q3 Q4 RPM Auction results (5/13) Illinois Power Agency RFP (April) ALJ Proposed Order – DST Rate Case (3/31) Procurement RFP (bids due 5/23; results by 6/23) DST Rate Case Final Order (by 5/31) EPA Final HAP Rule (November) Retirement of Cromby 1 & Eddystone 1 units (5/31) Proposed HAP EPA Regulation (by 3/16) Procurement RFP (bids due 9/19; results by 10/19) Retirement of Cromby 2 unit (12/31) Proposed 316(b) EPA Regulation (by 3/14) For definition of the EPA regulations referred to on this slide, please see the EPA’s Terms of Environment (http://www.epa.gov/OCEPAterms/). Note: ALJ = administrative law judge; DST = delivery service tariff EPA Final Transport Rule (June) |
 14 2011 Operating Earnings Guidance 2011E (2) 2010A $0.54 $2.91 $4.06 (1) ComEd PECO Exelon Generation ComEd PECO Exelon Generation Holdco Holdco Exelon $0.68 Exelon $3.90 - $4.20 (1) $0.55 - $0.65 $0.50 - $0.55 $2.85 - $3.05 (1) Refer to 1/26/11 Earnings Release Attachments for additional details and to the Appendix for a reconciliation of adjusted (non-GAAP) operating EPS to GAAP EPS. (2) Earnings guidance for OpCos may not add up to consolidated EPS guidance. Key Drivers of FY Guidance + Generation margins driven by PECO PPA roll-off, partially offset by lower capacity revenues + Higher PECO gross margin driven by new distribution rates effective 1/1/11 - Higher O&M expense - Higher depreciation & amortization expense 2011 operating earnings guidance of $3.90 – $4.20/share and 1Q 2011 guidance of $1.00 – $1.10/share (1) |
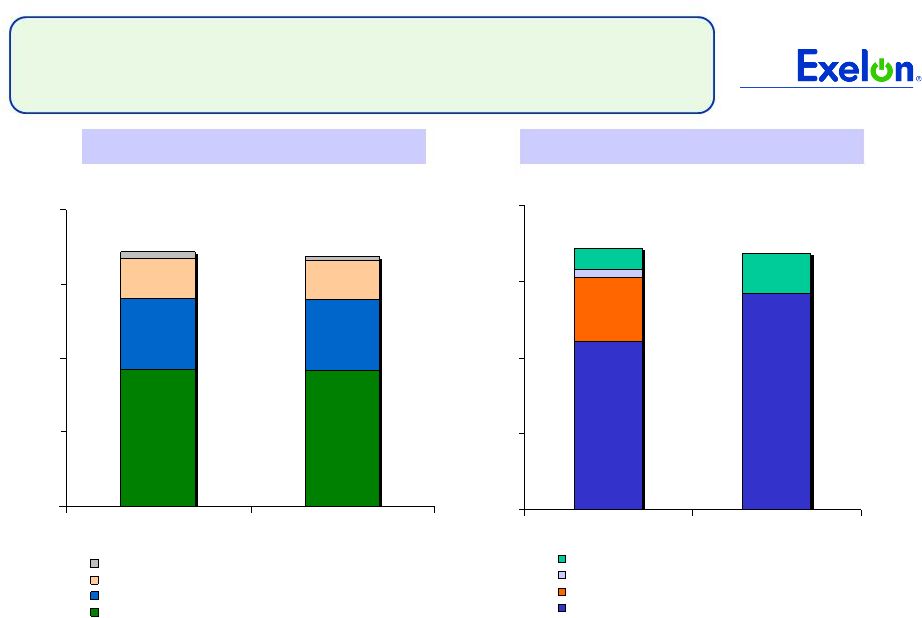
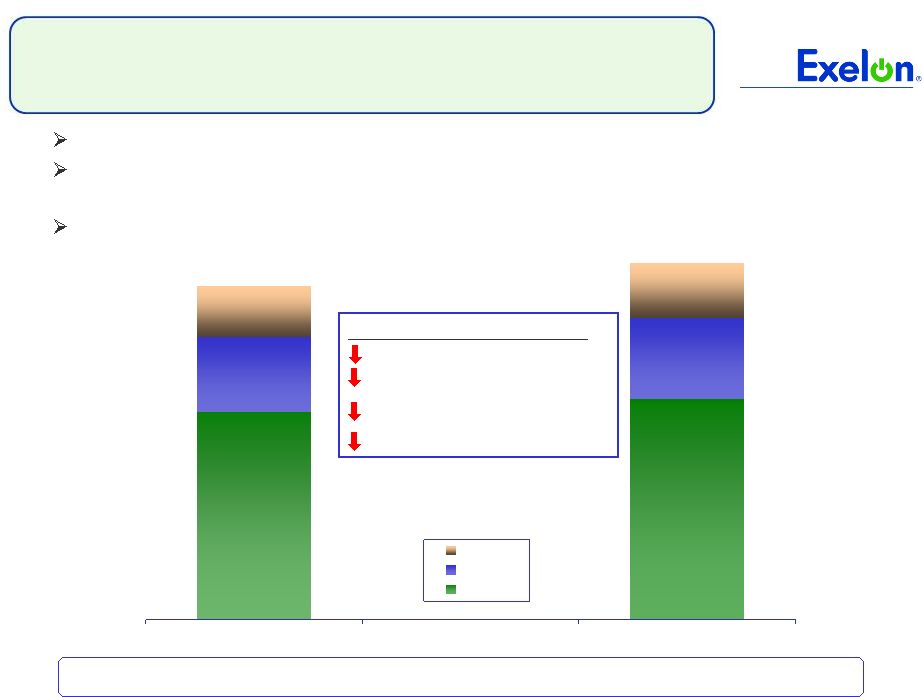 15 $0.98 $0.68 $2.74 $2.91 $1.07 $0.71 2010A 2011E PECO ComEd ExGen Operating O&M Outlook 2010 to 2011 Drivers (per share) Inflation $(0.08) Full year of Exelon Wind $(0.05) Two additional nuclear refueling outages $(0.05) ComEd uncollectibles $(0.04) Estimated 2011 O&M represents a new “base” level for operating O&M $4.39B $4.68B 2010 Operating O&M below 2008 levels for second consecutive year One-time savings in 2010 included executive salary freezes and reduced compensation benefits Anticipate annual O&M growth rate of ~2% for 2011-2013 (1) Amounts may not add due to rounding. Refer to slide 43 for a reconciliation of GAAP O&M to Operating O&M. (1) (1) |
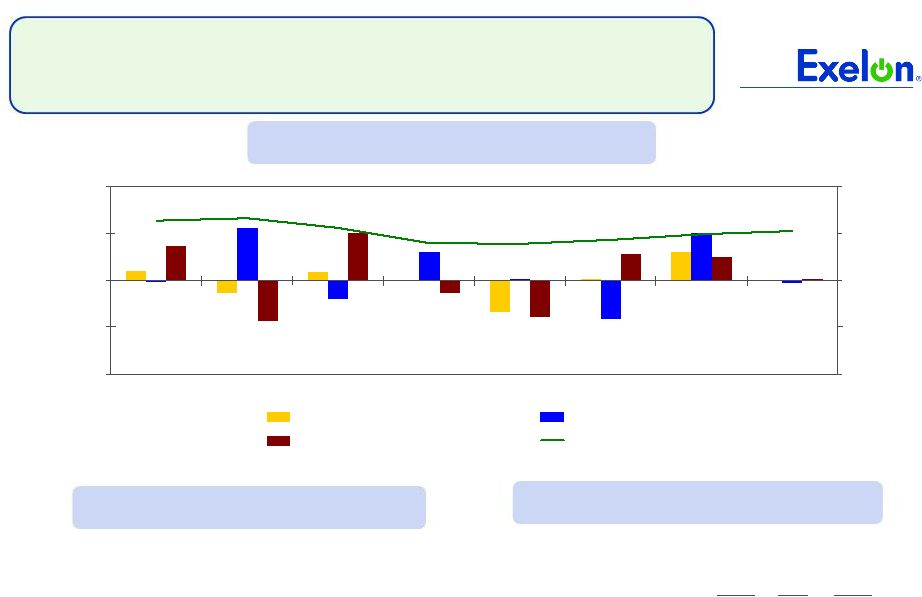
 16 Exelon Generation 2011 EPS Contribution (1) Estimated contribution to Exelon’s operating earnings guidance. RNF = revenue net fuel $ / Share $0.35 $(0.03) RNF O&M Other Depreciation & Amortization $(0.08) Key Items: Inflation Exelon Wind Nuclear Outages 2010A 2011E (1) $2.85 - $3.05 $2.91 Key Items: PECO PPA Exelon Wind Capacity Market Prices Nuclear Fuel Market/portfolio conditions and Exelon Energy $(0.17) $(0.03) Interest Expense Note: Drivers add up to mid-point of 2011 EPS range. $0.62 $0.08 $(0.29) $(0.09) $0.07 $(0.05) $(0.05) $(0.05) |
 17 ComEd 2011 EPS Contribution 2010A Depreciation & Amortization Interest Expense $0.55 - $0.65 $0.03 $(0.08) $(0.03) 2011E (3) $ / Share $(0.02) $0.02 Other RNF (1) O&M (1) Key Items: Weather Uncollectibles Appellate Court ruling Distribution revenue (2) Key Items: Uncollectibles Inflation Note: Drivers add up to mid-point of 2011 EPS range. $0.68 (1) Excludes estimated impact of Rider EDA (Energy Efficiency and Demand Response Adjustment) of +/-$0.05/share. 2010 net income includes a one-time benefit for collections of under-recovered 2008 and 2009 bad debt costs, as provided by the uncollectible expense rider approved by the ICC in February 2010. Going forward, the rider provides for full recovery of all bad debt costs. (2) Distribution rate case currently pending, new rates will be effective in June 2011. Earnings guidance assumes mid-point of ComEd’s requested revenue increase. (3) Estimated contribution to Exelon’s operating earnings guidance. $(0.04) $(0.02) $(0.01) $0.08 $(0.04) $(0.02) |
 18 PECO 2011 EPS Contribution $ / Share RNF (2) $(0.03) $0.54 (1) CTC,net 2011E (3) Key Items: Electric & Gas Distribution Rate $0.19 Weather $(0.05) Key Items: Inflation $(0.01) Bad Debt $(0.01) $0.14 O&M (2) $0.50 - $0.55 (1) $(0.04) 2010A (1) Excludes preferred dividends. (2) Excludes items that are income statement neutral and estimated impact of energy efficiency and smart meter costs recoverable under a rider of $0.10/share. (3) Estimated contribution to Exelon’s operating earnings guidance. CTC = competitive transition charge Note: Drivers add up to mid-point of 2011 EPS range. $(0.03) Depreciation $(0.05) Income Taxes Key Items: Revenue net $(0.06) of amortization Interest on PECO transition bonds $0.02 |
 19 Key Assumptions 38.0 31.1 29.5 PECO 40.8 39.7 37.9 ComEd 37.1 37.5 38.3 Exelon Generation 38.1 36.7 37.2 Effective Tax Rate - Operating (%) 136.59 144.40 106.13 RTO Capacity Price ($/MW-day) 2009 Actual 2010 Actual 2011 Est. (3) Nuclear Capacity Factor (%) (1) 93.6 93.9 93.0 Total Generation Sales Excluding Trading (GWh) 173,065 171,789 168,700 Henry Hub Gas Price ($/mmBtu) 3.92 4.37 4.56 PJM West Hub ATC Price ($/MWh) 38.30 45.93 45.45 Tetco M3 Gas Price ($/mmBtu) 4.64 5.10 5.32 PJM West Hub Implied ATC Heat Rate (mmbtu/MWh) 8.25 9.01 8.54 NI Hub ATC Price ($/MWh) 28.85 33.09 30.69 Chicago City Gate Gas Price ($/mmBtu) 3.92 4.46 4.61 NI Hub Implied ATC Heat Rate (mmbtu/MWh) 7.36 7.42 6.66 MAAC Capacity Price ($/MW-day) 158.48 181.34 136.59 EMAAC Capacity Price ($/MW-day) 173.73 181.34 136.59 Electric Delivery Growth (%) (2) PECO 0.6 0.1 0.0 ComEd (0.1) 0.2 0.0 (1) Excludes Salem. . (2) Weather-normalized retail load growth. (3) Reflects forward market prices as of December 31, 2010. Note: The estimates of planned generation do not represent guidance or a forecast of future results as Exelon has not completed its planning or optimization processes. |
 20 Pension and OPEB Expense and Contributions – As of 12/31/10 $190 $240 Pre-tax expense $205 $1,655 $3,875 $2,220 $765 $8,860 $12,525 $3,665 Actual contribution $210 $2,140 $225 $185 $2,180 $210 5.83% in 2010 5.30% in 2011 5.52% in 2012 11.6% in 2010 7.08% in 2011 7.08% in 2012 OPEB Assets Obligations Unfunded balance – end of year $110 $1,015 $240 $2,100 $1,305 $200 5.83% in 2010 5.26% in 2011 5.48% in 2012 11.9% in 2010 8.0% in 2011 7.5% in 2012 Pension Assets Obligations Unfunded balance – end of year Expected contribution Pre-tax expense Expected contribution Pre-tax expense Discount Rate (used for expense) Asset Returns (actual for 2010 and expected for 2011 and 2012) ($ in millions) Assumptions 2011 2012 2010 The decrease in pension expense in 2011 is primarily due to the $2.1 billion pension contribution, partially offset by the effects of lower discount rates and a decrease in EROA (1) Pension expense amounts exclude settlement charges. (2) Management considers various factors when making pension funding decisions, including actuarially determined minimum contribution requirements under ERISA, contributions required to avoid benefit restrictions and at-risk status as defined by the Pension Protection Act of 2006 (the Act), management of the pension obligation and regulatory implications. The Act requires the attainment of certain funding levels to avoid benefit restrictions (such as an inability to pay lump sums or to accrue benefits prospectively), and at-risk status (which triggers higher minimum contribution requirements and participant notification). Note: Slide provided for illustrative purposes and not intended to represent a forecast of future outcomes. Assumes an ~25% capitalization of pension and OPEB costs. EROA = earned return on assets The decrease in pension expense in 2011 is primarily due to the $2.1 billion pension contribution, partially offset by the effects of lower discount rates and a decrease in EROA |
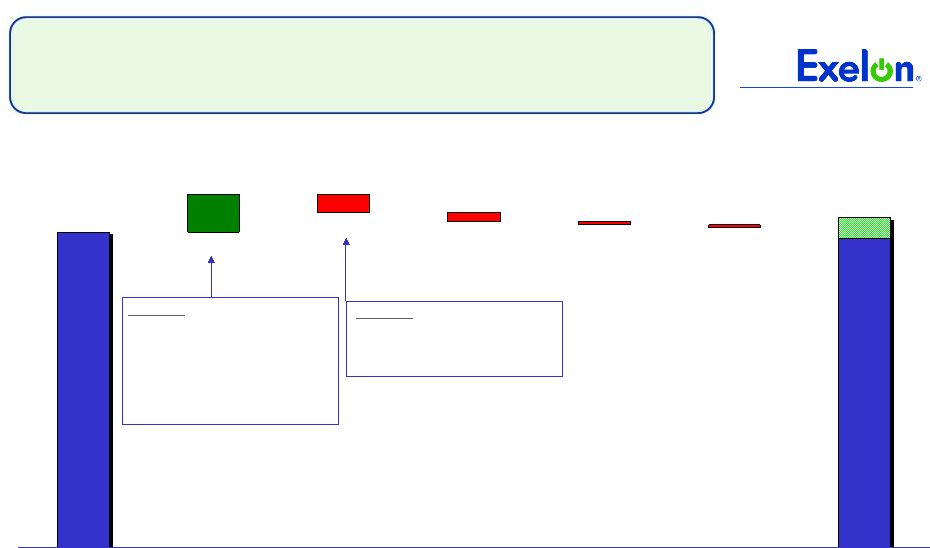
 21 2011 Pension Contribution $2.1 billion contribution to pension in 2011 • Timing: ~$850 million funded by the accelerated cash benefits generated as a result of bonus depreciation • Tax efficient: Income tax deduction of pension contribution creates $750 million of cash benefit • Economic: Reduces estimated future pension expense, lowers future minimum funding requirements and reduces volatility Improves financial flexibility • Creates debt capacity for future growth • Improves ability to weather commodity cycle in 2012 and 2013 and maintain the dividend Contributes to improved pension funded status of 71% at 12/31/10, projected to be 89% at 12/31/11 Pension Contributions 615 2,100 765 110 175 160 195 780 790 170 485 2010 2011 2012 2013 2014 2015 With $2.1B Original Plan* (1) Assumes an ~25% capitalization rate. $ millions $ millions * Original Plan reflects preliminary 2010 underlying assumptions (including discount rate and asset returns) Pre-Tax Pension Expense (1) 240 300 265 200 240 2010 2011 2012 |
 22 2011 Projected Sources and Uses of Cash (1) Excludes counterparty collateral activity. (2) Cash Flow from Operations primarily includes net cash flows provided by operating activities and net cash flows used in investing activities other than capital expenditures. (3) Assumes 2011 dividend of $2.10/share. Dividends are subject to declaration by the Board of Directors. (4) Includes $475 million in Nuclear Uprates and $225 million for Exelon Wind. (5) Represents new business, smart grid/smart meter investment and transmission growth projects. (6) Excludes ComEd’s $191 million of tax-exempt bonds that are backed by letters of credit (LOCs). Excludes PECO’s $225 million Accounts Receivable (A/R) Agreement with Bank of Tokyo. PECO’s A/R Agreement was extended in accordance with its terms through September 6, 2011. (7) “Other” includes proceeds from options and expected changes in short-term debt. (8) Includes cash flow activity from Holding Company, eliminations, and other corporate entities. ($ millions) Exelon (8) Beginning Cash Balance (1) $800 Cash Flow from Operations (2) 425 775 3,150 4,325 CapEx (excluding Nuclear Fuel, Nuclear Uprates, Exelon Wind, Utility Growth CapEx) (700) (325) (850) (1,875) Nuclear Fuel n/a n/a (1,025) (1,025) Dividend (3) (1,400) Nuclear Uprates and Exelon Wind (4) n/a n/a (700) (700) Utility Growth CapEx (5) (325) (125) n/a (450) Net Financing (excluding Dividend): Planned Debt Issuances (6) 1,000 -- -- 1,000 Planned Debt Retirements (350) (250) -- (600) Other (7) 250 -- -- 300 Ending Cash Balance (1) $375 |
 23 Key Credit Metrics 0.0x 2.0x 4.0x 6.0x 8.0x 10.0x 12.0x 2009A 2010A 2011E ExGen/Corp ComEd PECO 0% 5% 10% 15% 20% 25% 30% 35% 40% 45% 50% 2009A 2010A 2011E ExGen/Corp ComEd PECO FFO / Debt (1) (1) Reflects FFO / Debt, Interest Coverage and Debt / Cap ratios as calculated by S&P. (2) Reflects S&P Target Range. See slide 24 for reconciliations to GAAP. (3) FFO/Debt Target Range reflects Generation FFO/Debt in addition to the debt obligations of Exelon Corp. (4) Current senior unsecured ratings for Exelon and Exelon Generation and senior secured ratings for ComEd and PECO as of January 31, 2011. 30-35% (3) 15-18% 15-18% FFO / Debt Target Range (2) BBB+ A BBB+ BBB+ Fitch Credit Ratings (4) BBB A- A- BBB- S&P Credit Ratings (4) A3 A1 Baa1 Baa1 Moody’s Credit Ratings (4) ComEd: PECO: Generation: Exelon: Interest Coverage (1) 0% 10% 20% 30% 40% 50% 60% 70% 80% 90% 100% 2009A 2010A 2011E ExGen/Corp ComEd PECO Debt / Cap (1) |
 24 Metric Calculations and Ratios + Other Non-Cash items (1) - AFUDC/Cap. Interest - Decommissioning activity +/- Change in Working Capital FFO Calculation: = FFO - PECO Transition Bond Principal Paydown Net Cash Flows provided by Operating Activities Adjusted Interest: Net Interest Expense Adjusted Interest FFO + Adjusted Interest = Adjusted Interest + AFUDC & Capitalized interest + Interest on Present Value (PV) of Operating Leases + Interest on Imputed Debt Related to PV of Power Purchase Agreements (PPA) - PECO Transition Bond Interest Expense Interest Coverage: FFO = Adjusted Debt + Off-balance sheet debt equivalents (3) - PECO Transition Bond Principal Balance + STD LTD Adjusted Debt: Adjusted Debt (2) FFO / Debt: + Adjusted Debt (3) Debt / Cap: = Adjusted Capitalization Adjusted Debt (2) Adjusted Capitalization Adjusted Capitalization: Total shareholder’s equity + Preferred Securities of Subsidiaries (1) Reflects depreciation adjustment for PPAs and operating leases and pension/OPEB contribution normalization. (2) Uses current year-end adjusted debt balance. (3) Metrics are calculated in presentation adjusted for debt equivalents for PV of Operating Leases, PPAs, unfunded Pension and OPEB obligations (after-tax) and other minor debt equivalents. |
 25 ComEd 2010 Rate Case Update ComEd Surrebuttal (1/3/11) $326M increase requested 11.50% ROE / 47.28% equity ratio Rate base $7,349M 2009 test year with pro forma plant additions through 6/30/11 ICC Staff Position $116M increase proposed in Dec 2010 rebuttal testimony 10.00% ROE / 47.11% equity ratio Rate base $6,602M Pro forma plant additions and depreciation reserve through 12/31/10 (ICC Docket No. 10-0467) $ millions ComEd Original Request (6/30/10) 396 $ Adjustments: Bonus Depreciation (14) Pro forma plant adds/O&M update (4) Errata in Initial Filing (12) Reduction to Reg Asset Amortization (8) Other Items (4) ComEd Rebuttal (11/22/10) 354 $ Adjustments: New Bonus Depreciation (22) Pro forma plant adds/O&M update (4) Reduction to AMI/Other (2) ComEd Surrebuttal (1/3/2011) 326 $ Note: See slide 13 for ComEd rate case key dates. * ComEd request does not reflect Appellate Court decision relating to depreciation reserve, which we estimate would have a $85M reduction to revenue requirement. * Reconciliation of ComEd Request to ComEd Surrebuttal |
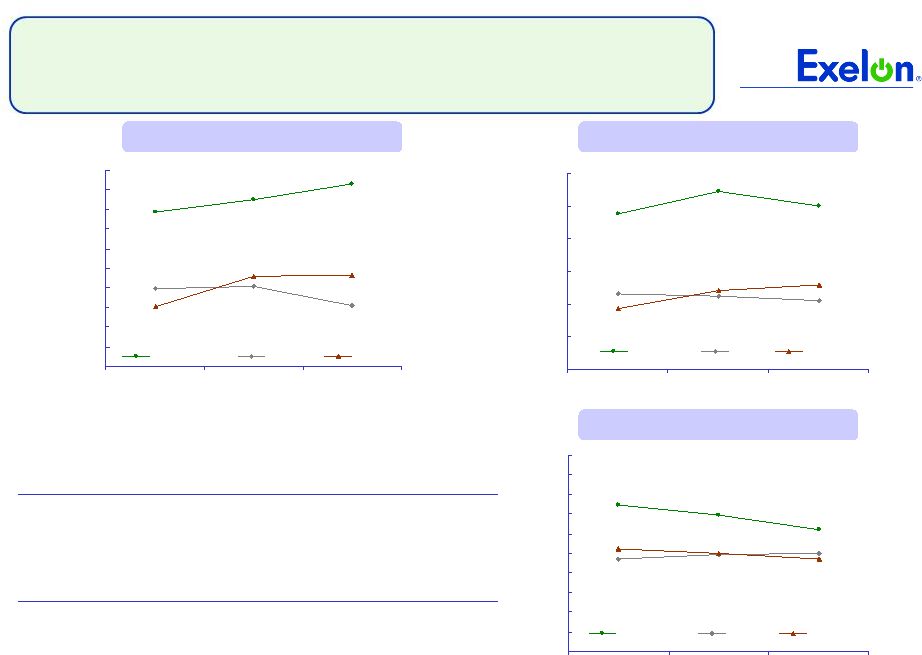
 26 26 ComEd Load Trends Chicago U.S. Unemployment rate (1) 9.3% 9.4% 2010 annualized growth in gross domestic/metro product (2) 1.6% 2.8% Note: C&I = Commercial & Industrial Weather-Normalized Load Year-over-Year 4Q10 2010 2011E Average Customer Growth 0.4% 0.2% 0.5% Average Use-Per-Customer (4.5)% (1.4)% 0.0% Total Residential (4.1)% (1.2)% 0.5% Small C&I (1.5)% (0.6)% (0.3)% Large C&I 1.9% 2.6% (0.2)% All Customer Classes (1.2)% 0.2% 0.0% (1) Source: U.S. Dept. of Labor (December 2010) and Illinois Department of Security (December 2010) (2) Source: Global Insight December 2010 -6.0% -3.0% 0.0% 3.0% 6.0% 1Q10 2Q10 3Q10 4Q10 1Q11 2Q11 3Q11 4Q11 -6.0% -3.0% 0.0% 3.0% 6.0% All Customer Classes Large C&I Residential Gross Metro Product Key Economic Indicators Weather-Normalized Load |
 27 PECO Load Trends Philadelphia U.S. Unemployment rate (1) 8.4% 9.4% 2010 annualized growth in gross domestic/metro product (2) 2.8% 2.8% Note: C&I = Commercial & Industrial 4Q10 2010 2011E Average Customer Growth 0.5% 0.3% 0.4% Average Use-Per-Customer (1.2)% 0.3% (0.3)% Total Residential (0.7)% 0.5% 0.1% Small C&I (2.0)% (1.9)% (0.5)% Large C&I 1.5% 0.8% 0.1% All Customer Classes 0.0% 0.1% 0.0% (1) Source: U.S Dept. of Labor (PHL – November 2010 preliminary data, US - December 2010) (2) Source: Global Insight December 2010 -5.0% -2.5% 0.0% 2.5% 5.0% 1Q10 2Q10 3Q10 4Q10 1Q11E 2Q11E 3Q11E 4Q11E -5.0% -2.5% 0.0% 2.5% 5.0% All Customer Classes Large C&I Residential Gross Metro Product Weather-Normalized Load Year-over-Year Key Economic Indicators Weather-Normalized Load |
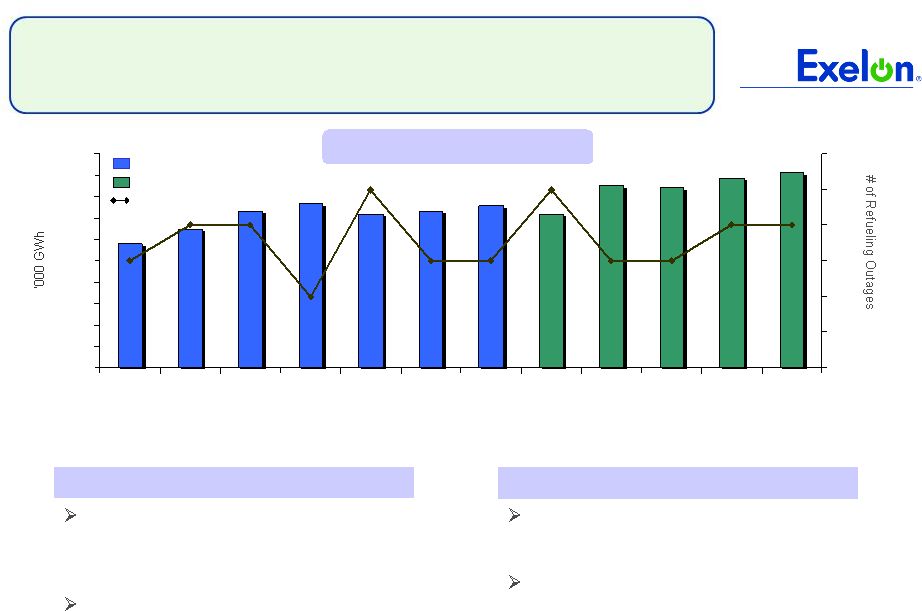 28 Refueling Outage Schedule All Exelon owned units on a 24-month cycle except for Braidwood U1/U2, Byron U1/U2 and Salem U1/U2, which are on 18-month cycles Average outage duration (2009-10): ~29 days (1) Nuclear Refueling Cycle 12 planned refueling outages, including 2 at Salem; Clinton outage was moved from 2012 to 2011 6 refueling outages planned for the spring and 6 refueling outages planned for the fall 2011 Refueling Outage Impact (1) Excludes Salem. 125 127 129 131 133 135 137 139 141 143 145 2004 2005 2006 2007 2008 2009 2010 2011 2012 2013 2014 2015 7 8 9 10 11 12 13 Nuclear Output Actual Plan # of Outages Note: Data includes Salem. Net nuclear generation data based on ownership interest. The estimates of planned generation do not represent guidance or a forecast of future results as Exelon has not completed its planning or optimization processes. |
 29 29 Total Portfolio Characteristics 110,594 142,400 42,003 5,295 13,897 26,300 0 50,000 100,000 150,000 200,000 2010 2011E ComEd Swap IL Auction PECO Load Actual Forward Hedges & Open Position 92,493 91,300 47,517 48,100 27,090 26,500 4,689 2,800 0 50,000 100,000 150,000 200,000 2010 2011E Forward / Spot Purchases Fossil and Renewables Mid-Atlantic Nuclear Midwest Nuclear 171,789 171,789 168,700 168,700 Expected Total Supply (GWh) Expected Total Sales (GWh) Notes: Represents values as of December 31, 2010. The estimates of planned generation do not represent guidance or a forecast of future results as Exelon has not completed its planning or optimization processes. |
  30 Exelon Generation Hedging Disclosures (as of December 31, 2010) |
 31 31 Important Information The following slides are intended to provide additional information regarding the hedging program at Exelon Generation and to serve as an aid for the purposes of modeling Exelon Generation’s gross margin (operating revenues less purchased power and fuel expense). The information on the following slides is not intended to represent earnings guidance or a forecast of future events. In fact, many of the factors that ultimately will determine Exelon Generation’s actual gross margin are based upon highly variable market factors outside of our control. The information on the following slides is as of December 31, 2010. We update this information on a quarterly basis. Certain information on the following slides is based upon an internal simulation model that incorporates assumptions regarding future market conditions, including power and commodity prices, heat rates, and demand conditions, in addition to operating performance and dispatch characteristics of our generating fleet. Our simulation model and the assumptions therein are subject to change. For example, actual market conditions and the dispatch profile of our generation fleet in future periods will likely differ – and may differ significantly – from the assumptions underlying the simulation results included in the slides. In addition, the forward- looking information included in the following slides will likely change over time due to continued refinement of our simulation model and changes in our views on future market conditions. |
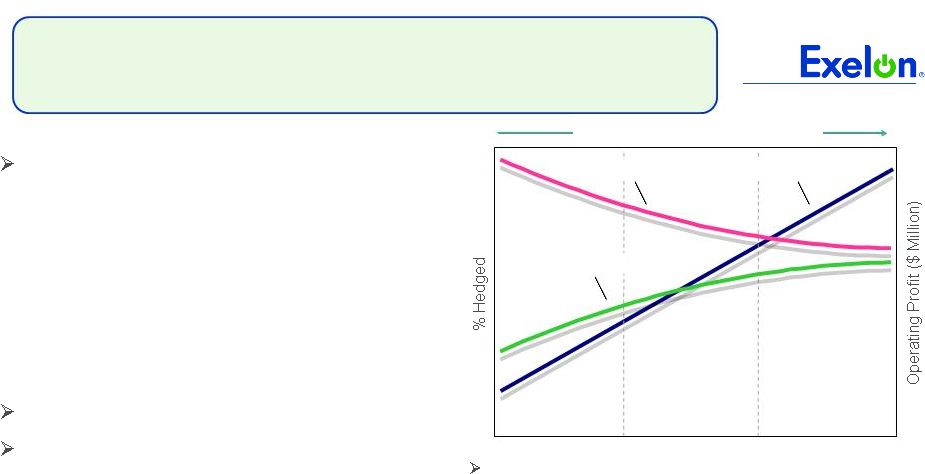 32 32 Portfolio Management Objective Align Hedging Activities with Financial Commitments Power Team utilizes several product types and channels to market • Wholesale and retail sales • Block products • Load-following products and load auctions • Put/call options Exelon’s hedging program is designed to protect the long-term value of our generating fleet and maintain an investment-grade balance sheet • Hedge enough commodity risk to meet future cash requirements if prices drop • Consider: financing policy (credit rating objectives, capital structure, liquidity); spending (capital and O&M); shareholder value return policy Consider market, credit, operational risk Approach to managing volatility • Increase hedging as delivery approaches • Have enough supply to meet peak load • Purchase fossil fuels as power is sold • Choose hedging products based on generation portfolio – sell what we own • Heat rate options • Fuel products • Capacity • Renewable credits % Hedged High End of Profit Low End of Profit Open Generation with LT Contracts Portfolio Optimization Portfolio Management Portfolio Management Over Time |
 33 33 Percentage of Expected Generation Hedged • How many equivalent MW have been hedged at forward market prices; all hedge products used are converted to an equivalent average MW volume • Takes ALL hedges into account whether they are power sales or financial products Equivalent MWs Sold Expected Generation = Our normal practice is to hedge commodity risk on a ratable basis over the three years leading to the spot market • Carry operational length into spot market to manage forced outage and load-following risks • By using the appropriate product mix, expected generation hedged approaches the mid-90s percentile as the delivery period approaches • Participation in larger procurement events, such as utility auctions, and some flexibility in the timing of hedging may mean the hedge program is not strictly ratable from quarter to quarter Exelon Generation Hedging Program |
 34 34 2011 2012 2013 Estimated Open Gross Margin ($ millions) (1)(2)(3) $5,200 $5,050 $5,700 Open gross margin assumes all expected generation is sold at the Reference Prices listed below Reference Prices (1) Henry Hub Natural Gas ($/MMBtu) NI-Hub ATC Energy Price ($/MWh) PJM-W ATC Energy Price ($/MWh) ERCOT North ATC Spark Spread ($/MWh) (4) $4.56 $30.69 $45.45 $1.12 $5.08 $32.38 $46.41 $0.82 $5.33 $35.09 $48.25 $1.84 Exelon Generation Open Gross Margin and Reference Prices (1) Based on December 31, 2010 market conditions. (2) Gross margin is defined as operating revenues less fuel expense and purchased power expense, excluding the impact of decommissioning and other incidental revenues. Open gross margin is estimated based upon an internal model that is developed by dispatching our expected generation to current market power and fossil fuel prices. Open gross margin assumes there is no hedging in place other than fixed assumptions for capacity cleared in the RPM auctions and uranium costs for nuclear power plants. Open gross margin contains assumptions for other gross margin line items such as various ISO bill and ancillary revenues and costs and PPA capacity revenues and payments. The estimation of open gross margin incorporates management discretion and modeling assumptions that are subject to change. (3) As of December 31, 2010 disclosure, Exelon Wind included. Assets in IL, MI and MN are in Midwest region and assets in ID, KS, MO, OR and TX are in South and West region. (4) ERCOT North ATC spark spread using Houston Ship Channel Gas, 7,200 heat rate, $2.50 variable O&M. |
 35 35 2011 2012 2013 Expected Generation (GWh) (1) 165,900 165,800 163,300 Midwest 99,600 98,500 96,200 Mid-Atlantic 56,800 57,200 56,500 South & West 9,500 10,100 10,600 Percentage of Expected Generation Hedged (2) 90-93% 67-70% 32-35% Midwest 91-94 69-72 31-34 Mid-Atlantic 93-96 67-70 36-39 South & West 70-73 51-54 39-42 Effective Realized Energy Price ($/MWh) (3) Midwest $43.00 $41.50 $43.50 Mid-Atlantic $57.00 $50.50 $51.50 South & West $2.50 $(1.00) $(3.50) Generation Profile (1) Expected generation represents the amount of energy estimated to be generated or purchased through owned or contracted for capacity. Expected generation is based upon a simulated dispatch model that makes assumptions regarding future market conditions, which are calibrated to market quotes for power, fuel, load following products, and options. Expected generation assumes 12 refueling outages in 2011 and 10 refueling outages in 2012 and 2013 at Exelon-operated nuclear plants and Salem. Expected generation assumes capacity factors of 93.0%, 93.6% and 93.1% in 2011, 2012 and 2013 at Exelon- operated nuclear plants. These estimates of expected generation in 2012 and 2013 do not represent guidance or a forecast of future results as Exelon has not completed its planning or optimization processes for those years. (2) Percent of expected generation hedged is the amount of equivalent sales divided by the expected generation. Includes all hedging products, such as wholesale and retail sales of power, options, and swaps. Uses expected value on options. Reflects decision to permanently retire Cromby Station and Eddystone Units 1&2 as of May 31, 2011. (3) Effective realized energy price is representative of an all-in hedged price, on a per MWh basis, at which expected generation has been hedged. It is developed by considering the energy revenues and costs associated with our hedges and by considering the fossil fuel that has been purchased to lock in margin. It excludes uranium costs and RPM capacity revenue, but includes the mark-to-market value of capacity contracted at prices other than RPM clearing prices including our load obligations. It can be compared with the reference prices used to calculate open gross margin in order to determine the mark- to-market value of Exelon Generation's energy hedges. |
 36 36 Gross Margin Sensitivities with Existing Hedges ($ millions) (1) Henry Hub Natural Gas + $1/MMBtu - $1/MMBtu NI-Hub ATC Energy Price +$5/MWH -$5/MWH PJM-W ATC Energy Price +$5/MWH -$5/MWH Nuclear Capacity Factor +1% / -1% 2011 $5 $(5) $30 $(20) $15 $(10) +/- $40 2012 $175 $(95) $185 $(165) $115 $(110) +/- $45 2013 $495 $(445) $340 $(335) $200 $(195) +/- $50 Exelon Generation Gross Margin Sensitivities (with Existing Hedges) (1) Based on December 31, 2010 market conditions and hedged position. Gas price sensitivities are based on an assumed gas-power relationship derived from an internal model that is updated periodically. Power prices sensitivities are derived by adjusting the power price assumption while keeping all other prices inputs constant. Due to correlation of the various assumptions, the hedged gross margin impact calculated by aggregating individual sensitivities may not be equal to the hedged gross margin impact calculated when correlations between the various assumptions are also considered. |
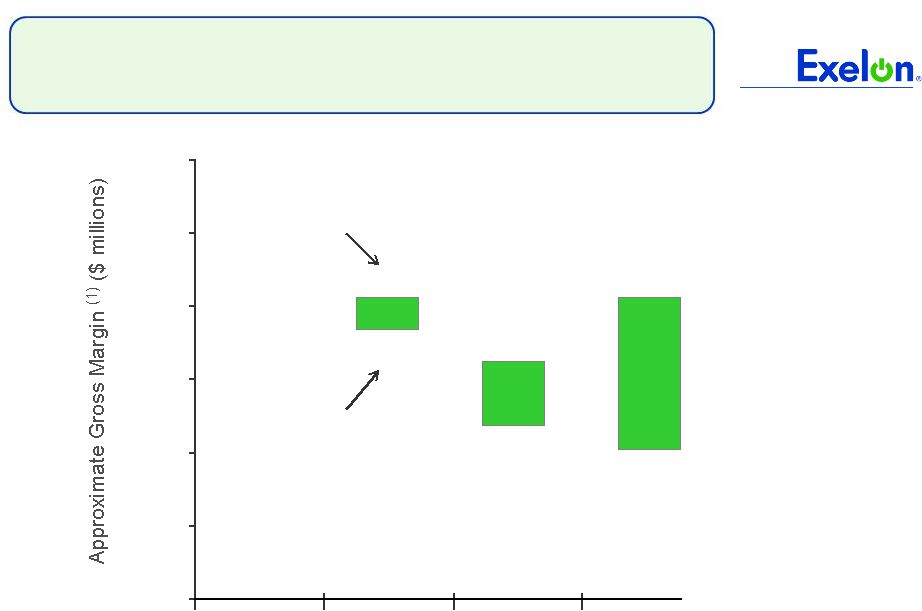 37 37 95% case 5% case $5,400 $7,100 $6,800 $6,300 Exelon Generation Gross Margin Upside / Risk (with Existing Hedges) $3,000 $4,000 $5,000 $6,000 $7,000 $8,000 $9,000 2011 2012 $7,200 $5,000 2013 (1) Represents an approximate range of expected gross margin, taking into account hedges in place, between the 5th and 95th percent confidence levels assuming all unhedged supply is sold into the spot market. Approximate gross margin ranges are based upon an internal simulation model and are subject to change based upon market inputs, future transactions and potential modeling changes. These ranges of approximate gross margin in 2012 and 2013 do not represent earnings guidance or a forecast of future results as Exelon has not completed its planning or optimization processes for those years. The price distributions that generate this range are calibrated to market quotes for power, fuel, load following products, and options as of December 31, 2010. |
 38 38 Midwest Mid-Atlantic South & West Step 1 Start with fleetwide open gross margin $5.20 billion Step 2 Determine the mark-to-market value of energy hedges 99,600GWh * 92% * ($43.00/MWh-$30.69MWh) = $1.13 billion 56,800GWh * 94% * ($57.00/MWh-$45.45MWh) = $0.62 billion 9,500GWh * 71% * ($2.50/MWh-$1.12/MWh) = $0.01 billion Step 3 Estimate hedged gross margin by adding open gross margin to mark-to- market value of energy hedges Open gross margin: $5.20 billion MTM value of energy hedges: $1.13billion + $0.62billion + $0.01 billion Estimated hedged gross margin: $6.96 billion Illustrative Example of Modeling Exelon Generation 2011 Gross Margin (with Existing Hedges) |
  39 35 40 45 50 55 60 65 70 75 2/10 3/10 4/10 5/10 6/10 7/10 8/10 9/10 10/10 11/10 12/10 1/11 2/11 4.0 4.5 5.0 5.5 6.0 6.5 7.0 7.5 8.0 2/10 3/10 4/10 5/10 6/10 7/10 8/10 9/10 10/10 11/10 12/10 1/11 2/11 50 55 60 65 70 75 80 85 90 2/10 3/10 4/10 5/10 6/10 7/10 8/10 9/10 10/10 11/10 12/10 1/11 2/11 Market Price Snapshot Forward NYMEX Natural Gas PJM-West and Ni-Hub On-Peak Forward Prices PJM-West and Ni-Hub Wrap Forward Prices 2012 $5.49 2013 $5.74 Rolling 12 months, as of February 2 2011. Source: OTC quotes and electronic trading system. Quotes are daily. Forward NYMEX Coal 2012 $75.91 2013 $79.79 2012 Ni-Hub $41.18 2013 Ni-Hub $43.29 2013 PJM-West $54.85 2012 PJM-West $52.84 2012 Ni-Hub $25.68 2013 Ni-Hub $27.95 2013 PJM-West $40.70 2012 PJM-West $38.77 20 25 30 35 40 45 2/10 3/10 4/10 5/10 6/10 7/10 8/10 9/10 10/10 11/10 12/10 1/11 2/11 nd |
  40 8.0 8.2 8.4 8.6 8.8 9.0 9.2 9.4 9.6 9.8 10.0 2/10 3/10 4/10 5/10 6/10 7/10 8/10 9/10 10/10 11/10 12/10 1/11 2/11 35 40 45 50 55 60 65 70 2/10 3/10 4/10 5/10 6/10 7/10 8/10 9/10 10/10 11/10 12/10 1/11 2/11 3.5 4.0 4.5 5.0 5.5 6.0 6.5 7.0 7.5 8.0 2/10 3/10 4/10 5/10 6/10 7/10 8/10 9/10 10/10 11/10 12/10 1/11 2/11 Market Price Snapshot 2013 9.30 2012 9.11 2012 $48.99 2013 $52.31 2012 $5.37 2013 $5.62 Houston Ship Channel Natural Gas Forward Prices ERCOT North On-Peak Forward Prices ERCOT North On-Peak v. Houston Ship Channel Implied Heat Rate 2012 $7.68 2013 $9.10 ERCOT North On Peak Spark Spread Assumes a 7.2 Heat Rate, $1.50 O&M, and $.15 adder 4.5 5.5 6.5 7.5 8.5 9.5 10.5 11.5 12.5 13.5 2/10 3/10 4/10 5/10 6/10 7/10 8/10 9/10 10/10 11/10 12/10 1/11 2/11 Rolling 12 months, as of February 2 2011. Source: OTC quotes and electronic trading system. Quotes are daily. nd |
 41 4Q GAAP EPS Reconciliation (0.01) - - - (0.01) 2007 Illinois electric rate settlement (0.01) - - - (0.01) John Deere Renewables acquisition costs 0.01 - - 0.01 - Asset Retirement Obligation reduction (0.03) - - - (0.03) Retirements of fossil generation units / plant retirements (0.17) - - - (0.17) Mark-to-market adjustments from economic hedging activities $0.79 $(0.01) $0.03 $0.14 $0.63 4Q 2010 GAAP Earnings (Loss) Per Share $0.96 $(0.01) $0.03 $0.13 $0.81 2010 Adjusted (non-GAAP) Operating Earnings (Loss) Per Share 0.04 - - - 0.04 Unrealized gains related to nuclear decommissioning trust funds Exelon Other PECO ComEd ExGen Three Months Ended December 31, 2010 NOTE: All amounts shown are per Exelon share and represent contributions to Exelon's EPS. Amounts may not add due to rounding. 0.04 - - - 0.04 Mark-to-market adjustments from economic hedging activities (0.01) - - (0.01) - City of Chicago settlement with ComEd (0.02) (0.01) - - (0.01) Costs associated with early debt retirements (0.02) - - - (0.02) 2007 Illinois electric rate settlement (0.05) - - - (0.05) Retirement of fossil generating units 0.02 - - - 0.02 Unrealized gains related to nuclear decommissioning trust funds $0.88 $(0.03) $0.12 $0.15 $0.64 4Q 2009 GAAP Earnings (Loss) Per Share $0.92 $(0.02) $0.12 $0.16 $0.66 2009 Adjusted (non-GAAP) Operating Earnings (Loss) Per Share Exelon Other PECO ComEd ExGen Three Months Ended December 31, 2009 |
 42 Full Year GAAP EPS Reconciliation NOTE: All amounts shown are per Exelon share and represent contributions to Exelon's EPS. Amounts may not add due to rounding. (0.01) - - - (0.01) John Deere Renewables acquisition costs 0.01 - - 0.01 - Asset Retirement Obligation reduction (0.10) (0.01) (0.03) (0.16) 0.10 Non-cash remeasurement of income tax uncertainties (0.10) (0.02) (0.02) (0.02) (0.04) Non-cash charge resulting from health care legislation (0.05) - - - (0.05) Impact of certain emission allowances 0.08 - - - 0.08 Mark-to-market adjustments from economic hedging activities (0.08) - - - (0.08) Retirement of fossil generating units $3.87 $(0.10) $0.49 $0.51 $2.97 FY 2010 GAAP Earnings (Loss) Per Share $4.06 $(0.07) $0.54 $0.68 $2.91 2010 Adjusted (non-GAAP) Operating Earnings (Loss) Per Share (0.02) - - - (0.02) 2007 Illinois electric rate settlement 0.08 - - - 0.08 Unrealized gains related to nuclear decommissioning trust funds Exelon Other PECO ComEd ExGen Twelve Months Ended December 31, 2010 0.16 - - - 0.16 Mark-to-market adjustments from economic hedging activities (0.05) - - - (0.05) Retirement of fossil generating units (0.01) - - (0.01) - City of Chicago settlement with ComEd (0.10) - - (0.01) (0.09) 2007 Illinois electric rate settlement (0.11) (0.04) - - (0.07) Costs associated with early debt retirements (0.20) - - - (0.20) Impairment of certain generating assets (0.03) - (0.00) (0.02) (0.01) 2009 severance charges 0.05 - - - 0.05 Nuclear decommissioning obligation reduction (0.03) (0.03) - - - NRG acquisition costs 0.19 - - - 0.19 Unrealized gains related to nuclear decommissioning trust funds 0.10 (0.02) - 0.06 0.06 Non-cash remeasurement of income tax uncertainties and reassessment of state deferred income taxes $4.09 $(0.21) $0.53 $0.56 $3.21 FY 2009 GAAP Earnings (Loss) Per Share $4.12 $(0.12) $0.54 $0.54 $3.16 2009 Adjusted (non-GAAP) Operating Earnings (Loss) Per Share Exelon Other PECO ComEd ExGen Twelve Months Ended December 31, 2009 |
 43 GAAP to Operating Adjustments Exelon’s 2011 adjusted (non-GAAP) operating earnings outlook excludes the earnings effects of the following: • Mark-to-market adjustments from economic hedging activities • Unrealized gains and losses from nuclear decommissioning trust fund investments to the extent not offset by contractual accounting as described in the notes to the consolidated financial statements • Significant impairments of assets, including goodwill • Changes in decommissioning obligation estimates • Costs associated with ComEd’s 2007 settlement with the City of Chicago • Financial impacts associated with the planned retirement of fossil generating units • Other unusual items • Significant changes to GAAP Operating earnings guidance assumes normal weather for full year O&M reconciliation: 2010 2011 ExGen ComEd PECO Other Exelon ExGen ComEd PECO Other Exelon Operating and maintenance (GAAP) 2,812 1,069 733 (14) 4,600 3,010 1,220 820 (10) 5,040 JDR acquisition costs (11) - - - (11) - - - - - Retirement of fossil generating units (3) - - - (3) (30) - - - (30) Non-cash charge resulting from health care legislation (4) (3) (2) 8 (1) - - - - - Asset retirement obligation reduction - 10 1 - 11 - - - - - Adjusted Non-GAAP O&M 2,794 1,076 732 (6) 4,596 2,980 1,220 820 (10) 5,010 Decommissioning accretion (57) - - - (57) (70) - - - (70) Regulatory required programs - (94) (53) - (147) - (150) (110) - (260) Operating O&M (as shown on slide 15) 2,737 982 679 (6) 4,392 2,910 1,070 710 (10) 4,680 ($ millions) |