 September 2011 Exelon Corporation Investor Meetings Exhibit 99.1 |
 Cautionary Statements Regarding Forward-Looking Information 2 Except for the historical information contained herein, certain of the matters discussed in this communication constitute “forward-looking statements” within the meaning of the Securities Act of 1933 and the Securities Exchange Act of 1934, both as amended by the Private Securities Litigation Reform Act of 1995. Words such as “may,” “will,” “anticipate,” “estimate,” “expect,” “project,” “intend,” “plan,” “believe,” “target,” “forecast,” and words and terms of similar substance used in connection with any discussion of future plans, actions, or events identify forward-looking statements. These forward-looking statements include, but are not limited to, statements regarding benefits of the proposed merger of Exelon Corporation (Exelon) and Constellation Energy Group, Inc. (Constellation), integration plans and expected synergies, the expected timing of completion of the transaction, anticipated future financial and operating performance and results, including estimates for growth. These statements are based on the current expectations of management of Exelon and Constellation, as applicable. There are a number of risks and uncertainties that could cause actual results to differ materially from the forward-looking statements included in this communication regarding the proposed merger. For example, (1) the companies may be unable to obtain shareholder approvals required for the merger; (2) the companies may be unable to obtain regulatory approvals required for the merger, or required regulatory approvals may delay the merger or result in the imposition of conditions that could have a material adverse effect on the combined company or cause the companies to abandon the merger; (3) conditions to the closing of the merger may not be satisfied; (4) an unsolicited offer of another company to acquire assets or capital stock of Exelon or Constellation could interfere with the merger; (5) problems may arise in successfully integrating the businesses of the companies, which may result in the combined company not operating as effectively and efficiently as expected; (6) the combined company may be unable to achieve cost-cutting synergies or it may take longer than expected to achieve those synergies; (7) the merger may involve unexpected costs, unexpected liabilities or unexpected delays, or the effects of purchase accounting may be different from the companies’ expectations; (8) the credit ratings of the combined company or its subsidiaries may be different from what the companies expect; (9) the businesses of the companies may suffer as a result of uncertainty surrounding the merger; (10) the companies may not realize the values expected to be obtained for properties expected or required to be divested; (11) the industry may be subject to future regulatory or legislative actions that could adversely affect the companies; and (12) the companies may be adversely affected by other economic, business, and/or competitive factors. Other unknown or unpredictable factors could also have material adverse effects on future results, performance or achievements of Exelon, Constellation or the combined company. |
 Cautionary Statements Regarding Forward-Looking Information (Continued) 3 Discussions of some of these other important factors and assumptions are contained in Exelon’s and Constellation’s respective filings with the Securities and Exchange Commission (SEC), and available at the SEC’s website at www.sec.gov, including: (1) Exelon’s 2010 Annual Report on Form 10-K in (a) ITEM 1A. Risk Factors, (b) ITEM 7. Management’s Discussion and Analysis of Financial Condition and Results of Operations and (c) ITEM 8. Financial Statements and Supplementary Data: Note 18; (2) Exelon’s Quarterly Report on Form 10-Q for the quarterly period ended June 30, 2011 in (a) Part II, Other Information, ITEM 1A. Risk Factors, (b) Part 1, Financial Information, ITEM 2. Management’s Discussion and Analysis of Financial Condition and Results of Operations and (c) Part I, Financial Information, ITEM 1. Financial Statements: Note 13; (3) Constellation’s 2010 Annual Report on Form 10-K in (a) ITEM 1A. Risk Factors, (b) ITEM 7. Management’s Discussion and Analysis of Financial Condition and Results of Operations and (c) ITEM 8. Financial Statements and Supplementary Data: Note 12; and (4) Constellation’s Quarterly Report on Form 10-Q for the quarterly period ended June 30, 2011 in (a) Part II, Other Information, ITEM 1A. Risk Factors and ITEM 5. Other Information, (b) Part I, Financial Information, ITEM 2. Management’s Discussion and Analysis of Financial Condition and Results of Operations and (c) Part I, Financial Information, ITEM 1. Financial Statements: Notes to Consolidated Financial Statements, Commitments and Contingencies. These risks, as well as other risks associated with the proposed merger, are more fully discussed in the preliminary joint proxy statement/prospectus included in Amendment No. 1 to the Registration Statement on Form S-4 that Exelon filed with the SEC on August 17, 2011 in connection with the proposed merger. In light of these risks, uncertainties, assumptions and factors, the forward-looking events discussed in this communication may not occur. Readers are cautioned not to place undue reliance on these forward-looking statements, which speak only as of the date of this communication. Neither Exelon nor Constellation undertake any obligation to publicly release any revision to its forward-looking statements to reflect events or circumstances after the date of this communication. Additional Information and Where to Find It This communication does not constitute an offer to sell or the solicitation of an offer to buy any securities, or a solicitation of any vote or approval, nor shall there be any sale of securities in any jurisdiction in which such offer, solicitation or sale would be unlawful prior to registration or qualification under the securities laws of any such jurisdiction. On August 17, 2011, Exelon filed with the SEC Amendment No. 1 to its Registration Statement on Form S-4 that included a preliminary joint proxy statement/prospectus and other relevant documents to be mailed by Exelon and Constellation to their respective security holders in connection with the proposed merger of Exelon and Constellation. |
 Additional Information and Where to Find It These materials are not yet final and may be amended. WE URGE INVESTORS AND SECURITY HOLDERS TO READ THE PRELIMINARY JOINT PROXY STATEMENT/PROSPECTUS AND THE DEFINITIVE JOINT PROXY STATEMENT/PROSPECTUS AND ANY OTHER RELEVANT DOCUMENTS WHEN THEY BECOME AVAILABLE, BECAUSE THEY CONTAIN OR WILL CONTAIN IMPORTANT INFORMATION about Exelon, Constellation and the proposed merger. Investors and security holders will be able to obtain these materials (when they are available) and other documents filed with the SEC free of charge at the SEC's website, www.sec.gov. In addition, a copy of the preliminary joint proxy statement/prospectus and definitive joint proxy statement/prospectus (when it becomes available) may be obtained free of charge from Exelon Corporation, Investor Relations, 10 South Dearborn Street, P.O. Box 805398, Chicago, Illinois 60680-5398, or from Constellation Energy Group, Inc., Investor Relations, 100 Constellation Way, Suite 600C, Baltimore, MD 21202. Investors and security holders may also read and copy any reports, statements and other information filed by Exelon, or Constellation, with the SEC, at the SEC public reference room at 100 F Street, N.E., Washington, D.C. 20549. Please call the SEC at 1-800-SEC-0330 or visit the SEC’s website for further information on its public reference room. Participants in the Merger Solicitation Exelon, Constellation, and their respective directors, executive officers and certain other members of management and employees may be deemed to be participants in the solicitation of proxies in respect of the proposed transaction. Information regarding Exelon’s directors and executive officers is available in its proxy statement filed with the SEC by Exelon on March 24, 2011 in connection with its 2011 annual meeting of shareholders, and information regarding Constellation’s directors and executive officers is available in its proxy statement filed with the SEC by Constellation on April 15, 2011 in connection with its 2011 annual meeting of shareholders. Other information regarding the participants in the proxy solicitation and a description of their direct and indirect interests, by security holdings or otherwise, is contained in the preliminary joint proxy statement/prospectus and will be contained in the definitive joint proxy statement/prospectus. 4 |
  5 |
 Creating Value Through a Strategic Merger Delivers financial benefits to both sets of shareholders Increases scale and scope of the business across the value chain Matches the industry’s premier clean merchant generating fleet with the leading retail and wholesale customer platform Diversifies the generation portfolio Continued upside to power market recovery Maintains a strong regulated earnings profile with large urban utilities Successful integration experience from prior mergers and acquisitions 6 Combining Exelon’s generation fleet and Constellation’s customer-facing businesses creates a strong platform for growth and delivers benefits to investors and customers |
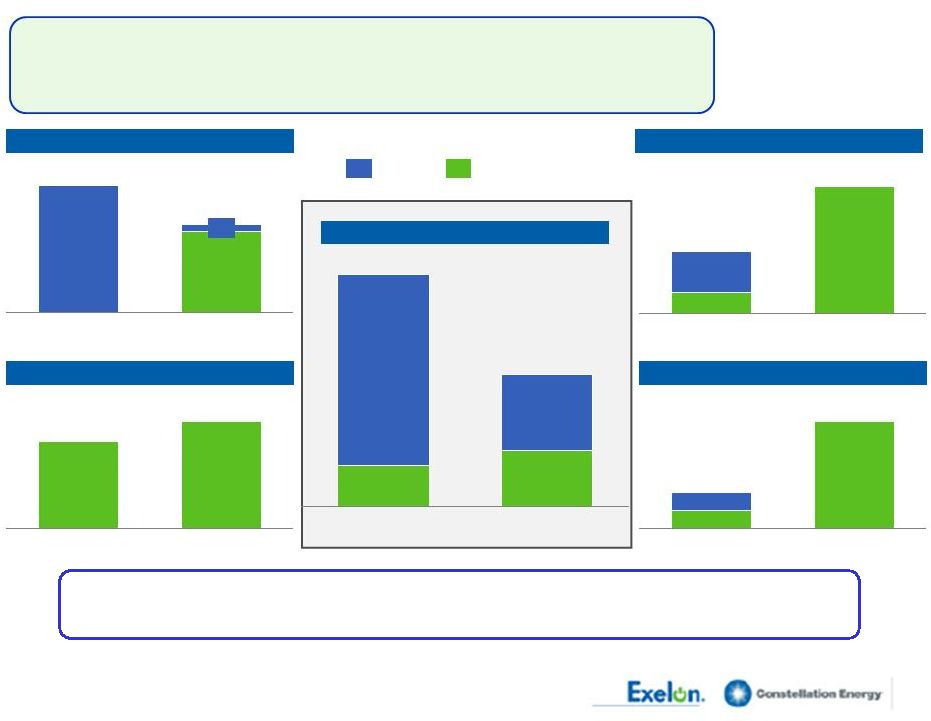
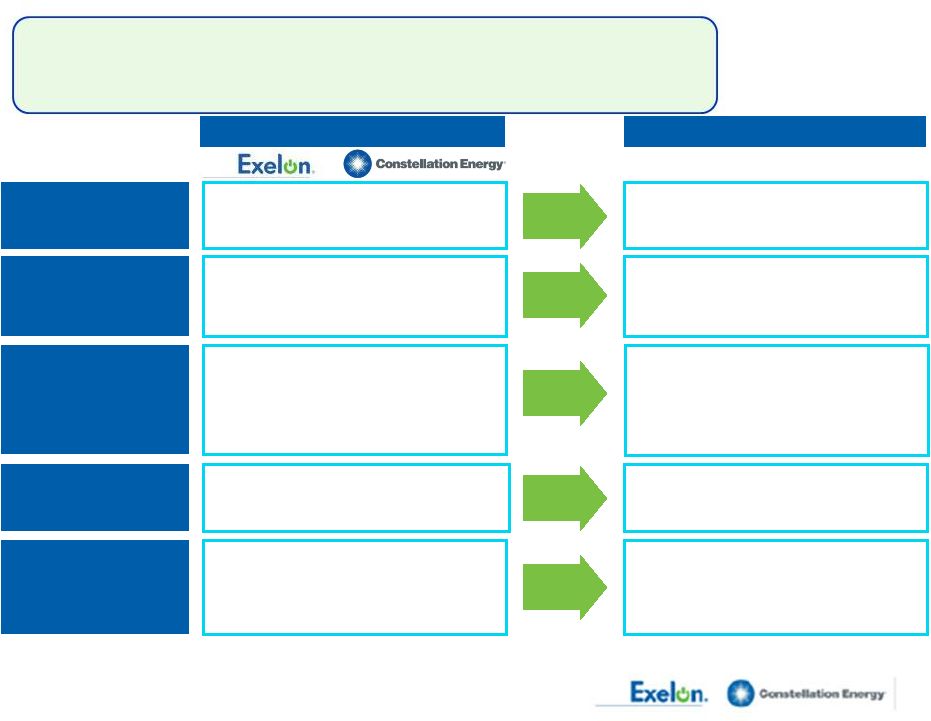 • $8 billion • $11 billion • 11,980 (Total) • 1,921 (Nuclear) • 1.2 mil. (MD) • 0.7 mil. (MD) • 44 states & D.C. (5) • ~110 TWh/yr • 29% Generation • 44% Utility • 27% NewEnergy Combination Will Result in Enhanced Scale, Scope, Flexibility and Financial Strength (1) Market Value as of 9/2/11. Enterprise Value represents Market Value plus Net Debt as of 6/30/11. (2) Data as of 12/31/10. Exelon data includes 720 MW for Wolf Hollow. Constellation data includes 2,950 MW for Boston Generation assets. (3) Net of physical market mitigation assumed to be 2,648 MW. (4) TWh/yr represents 2011 booked electric sales as of 12/31/2010. Exelon load includes ComEd swap. Data also includes 2011 partial year estimated electric sales from StarTex and MXEnergy (acquired by Constellation). (5) Competitive and wholesale business also active in Alberta, British Columbia and Ontario, Canada. (6) Exelon EBITDA estimates per equity research. Constellation EBITDA estimates per company guidance. Market Value and Enterprise Value (1) Pro forma Standalone Owned Generation (in MW) (2) Regulated Utilities Competitive Retail & Wholesale (4) Business Mix (6) • $28 billion • $41 billion • 26,339 (Total) • 17,047 (Nuclear) Electric customers • 5.4 mil. (IL, PA) Gas customers • 0.5 mil. (PA) • 4 states • ~59 TWh/yr 2011 EBITDA • 61% Generation • 39% Utilities • $36 billion • $52 billion • 44 states & D.C. (5) • ~169 TWh energy sales • Expect >50% pro forma EBITDA from competitive business • 35,671 (Total) (3) • 18,968 (Nuclear) • 6.6 million electric & gas customers in IL, PA and MD 7 |
 Transaction Overview • 100% stock – 0.930 shares of EXC for each share of CEG • Upfront transaction premium of 18.5% (1) • $2.10 per share Exelon dividend maintained • Expect to close in early 2012 • Exelon and Constellation shareholder approvals in Q4 2011 • Regulatory approvals including FERC, DOJ, MD, NY, TX • Executive Chairman: Mayo Shattuck • President and CEO: Chris Crane • Board of Directors: 16 total (12 from Exelon, 4 from Constellation) • Exelon Corporation • 78% Exelon shareholders • 22% Constellation shareholders • Corporate headquarters: Chicago, IL • Constellation headquarters: Baltimore, MD • No change to utilities’ headquarters • Significant employee presence maintained in IL, PA and MD Company Name Consideration Pro Forma Ownership Headquarters Governance Approvals & Timing (1) Based on the 30-day average Exelon and Constellation closing stock prices as of April 26, 2011. 8 |
 Exelon Transaction Rationale • Increases geographic diversity of generation, load and customers in competitive markets Shared Commitment to Competitive Markets Enhances Scalable Growth Platform Creates Shareholder Value • Expands a valuable channel to market our clean baseload generation • Enhances margins in the competitive portfolio • Diversifies portfolio across the value chain • EPS break-even in 2012 and accretive by >5% in 2013 • Maintains strong credit profile and financial discipline • Maintains earnings upside to future environmental regulations and power market recovery • Adds stability to earnings and cash flow • Adds mix of clean generation to the portfolio Clean Generation Fleet 9 This transaction meets all of Exelon’s M&A criteria and can be executed |
 Constellation Transaction Rationale • Upfront premium of 18.5% (1) • Dividend accretion of 103% post-closing • Enhances upside to power market recovery and synergies Creates Shareholder Value • Creates balance sheet capacity to pursue growth opportunities throughout the competitive portfolio • Reduces cost of capital and rating agency pressure with potential credit uplift from existing standalone rating • Rating agency reaction has been positive, with S&P and Moody’s changing Constellation rating outlook to positive Balance Sheet Strength Complementary Portfolios • Advances strategy of matching load with physical generation in key competitive markets • Lowers collateral costs of competitive businesses (1) Based on the 30-day average Exelon and Constellation closing stock prices as of April 26, 2011. 10 The transaction creates financial and strategic value that is consistent with Constellation’s existing strategy |
 11 Merger Approvals Process on Schedule (as of 9/1/11) • Filed S-4 Amended Registration Statement August 17, 2011 • Shareholder approval anticipated in Q4 2011 • Submitted Hart-Scott-Rodino filing on May 31, 2011 for review under U.S. antitrust laws • Approval expected by January 2012 • Filed merger approval application and related filings on May 20, 2011, which assesses market power- related issues • Approval expected in Q4 2011 • Filed for indirect transfer of Constellation Energy licenses on May 12, 2011 • Approval expected by January 2012 • Filed for approval with the Maryland Public Service Commission on May 25, 2011 • Approval expected by January 5, 2012 • Filed for approval with the New York State Public Service Commission on May 17, 2011 • Approval expected in Q4 2011 • Filed for approval with the Public Utility Commission of Texas on May 17, 2011 • Approval received on August 3, 2011 Stakeholder Securities and Exchange Commission (SEC) (File No. 333-175162) Department of Justice Federal Energy Regulatory Nuclear Regulatory Maryland PSC (Case No. 9271) New York PSC (Case No. 11-E-0245) Texas PUC (Case No. 39413) Status of Key Milestones Filed Approved (DOJ) Commission (FERC) (Docket No. EC 11-83) (Docket Nos. 50-317, 50-318, 50-220, Commission 50-410, 50-244, 72-8, 72-67) |
 Significant Events Date of Event • Filing of Application May 25, 2011 • Intervention Deadline June 24, 2011 • Prehearing Conference June 28, 2011 • Filing of Staff, Office of People Counsel and Intervenor Testimony September 16, 2011* • Filing of Rebuttal Testimony October 12, 2011* • Filing of Surrebuttal Testimony October 26, 2011 • Status Conference October 28, 2011 • Evidentiary Hearings October 31, 2011 - November 10, 2011 • Public Comment Hearings November 29, December 1 & December 5, 2011 • Filing of Initial Briefs December 1, 2011 • Filing of Reply Briefs December 15, 2011 • Decision Deadline January 5, 2012 12 * Initial intervenor testimony with respect to market power is due on September 23 rd for all parties except for the Independent Market Monitor, and rebuttal testimony with respect to market power is due on October 17 . th Maryland PSC Review Schedule |
 This Combination Is Good for Maryland • Maintains employee presence and platform for growth in Maryland – Exelon’s Power Team will be combined with Constellation’s wholesale and retail business under the Constellation brand and will be headquartered in Baltimore – Constellation and Exelon’s renewable energy business headquartered in Baltimore – BGE maintains independent operations headquartered in Baltimore – No involuntary merger-related job reductions at BGE for two years after close • Supports Maryland’s economic development and clean energy infrastructure – $10 million to spur development of electric vehicle infrastructure – $4 million to support EmPower Maryland Energy Efficiency Act – 25 MWs of renewable energy development in Maryland – Charitable contributions maintained for at least 10 years • Provides direct benefits to BGE customers – $5 million provided for Maryland’s Electric Universal Service Program (EUSP) – Over $110 million to BGE residential customers from $100 one-time rate credit 13 We will bring direct benefits to the State of Maryland, the City of Baltimore and BGE customers. Total investment in excess of $250 million. |
 Transaction Economics Are Attractive for Both Companies • Refined synergy run-rate and costs to achieve estimates due to greater accessibility and availability of data post-merger announcement – Higher net O&M savings over 5 years of ~$50 million • Updated synergy run-rate of ~$310 million/year – Additional synergies primarily from corporate and commercial consolidation – Most synergies to accrue to shareholders • Total costs to achieve of ~$650 million – Incremental costs to achieve attributable to employee related costs and transaction costs Financial Metrics • EPS break-even in 2012 and accretive by >5% in 2013 • Free cash flow accretive beginning in 2012 • Lower consolidated liquidity requirements, resulting in cost savings • Investment-grade ratings and credit metrics Synergies 14 Other ~20% Corporate & Commercial Consolidation ~80% |
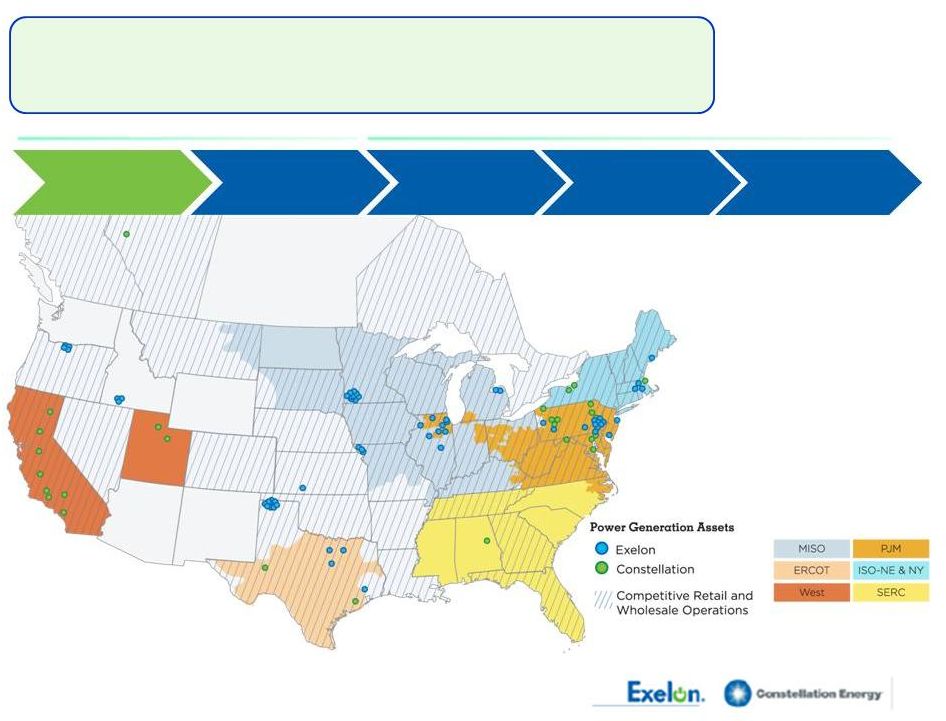 Scale, Scope and Flexibility Across the Value Chain Upstream Downstream Reserves (gas) 266 bcf Owned Generating Capacity 36 GWs (1) Electric Transmission 7,350 miles Electric & Gas Dist. 6.6 million customers Retail & Wholesale Volumes (2) (Electric & Gas) ~169 TWh, 405 bcf Note: Data as of 12/31/10 unless stated otherwise. (1) Generation capacity net of market mitigation assumed to be 2,648 MW consisting of Brandon Shores (1,273 MW), H.A. Wagner (976 MW) and CP Crane (399 MW). Exelon capacity updated to reflect Wolf Hollow. (2) Electric load includes all booked 2011E competitive retail sales, wholesale sales, and sales to load serving entities including ComEd swap. Gas load includes all booked and forecasted 2011E competitive retail sales. Data also includes 2011 partial year estimated electric sales from StarTex and MXEnergy (acquired by Constellation). 15 |
 MISO (TWh) PJM (TWh) South (1) (TWh) ISO-NE & NY ISO (2) (TWh) West (TWh) Portfolio Matches Generation with Load in Key Competitive Markets (1) Represents load and generation in ERCOT, SERC and SPP. (2) Constellation load includes ~0.7TWh of load served in Ontario. Note: Data for Exelon and Constellation represents expected generation (owned and contracted) and booked electric sales for 2011 as of 12/31/10. This data also includes 2011 partial year generation from Wolf Hollow (acquired by Exelon). Data also includes 2011 partial year estimated electric sales from StarTex and MXEnergy (acquired by Constellation). Exelon load includes ComEd Swap, load sold through affiliates, fixed and indexed load sales and load sold through POLR auctions. Constellation load includes load sold through affiliates, fixed and indexed load sales and load sold through POLR auctions. Load 102.1 43.4 58.7 Generation 179.1 31.8 147.3 Constellation Exelon Load 6.3 5.8 0.5 Generation 9.1 9.1 Load Generation 14.2 4.8 9.4 Load Generation 0.8 0.4 0.4 Load Generation 16 The combination establishes an industry-leading platform with regional diversification of the generation fleet 23.2 28.5 29.5 2.4 |
  17 |
 18 2011 Operating Earnings Guidance 2011 Prior Guidance (2) ComEd PECO Exelon Generation Holdco Exelon $3.90 - $4.20 (1) $0.55 - $0.65 $0.50 - $0.60 $2.85 - $3.05 (1) We raised 2011 earnings guidance on July 27, 2011, and we are not updating earnings guidance at this time. Earnings guidance is only reviewed in connection with our quarterly earnings announcements or if we expressly indicate that we are updating the guidance. Refer to the Appendix for a reconciliation of adjusted (non-GAAP) operating EPS to GAAP EPS. (2) Earnings guidance for OpCos may not add up to consolidated EPS guidance. 2Q 2011 operating earnings of $1.05/share Strong operating results in second quarter • Nuclear capacity factor of 89.6% largely due to a higher number of nuclear refueling outages • Strong operating results at utilities despite severe storms in ComEd service territory 2011 Revised Guidance (2) $4.05 - $4.25 (1) $0.55 - $0.65 $0.50 - $0.60 $2.95 - $3.10 Updating 2011 operating earnings guidance to $4.05 - $4.25/share from $3.90 - $4.20/share (1) |
 19 2011 Projected Sources and Uses of Cash ($ millions) Exelon (8) Beginning Cash Balance (1) $800 Cash Flow from Operations (2) 375 875 3,175 4,350 CapEx (excluding Nuclear Fuel, Nuclear Uprates, Exelon Wind, Utility Growth CapEx and Wolf Hollow) (725) (325) (850) (1,950) Nuclear Fuel n/a n/a (1,050) (1,050) Dividend (3) (1,400) Nuclear Uprates and Exelon Wind (4) n/a n/a (625) (625) Wolf Hollow Acquisition n/a n/a (300) (300) Utility Growth CapEx (5) (300) (125) n/a (425) Net Financing (excluding Dividend): Planned Debt Issuances (6) 1,000 -- -- 1,000 Planned Debt Retirements (6) (350) (250) -- (600) Other (7) 300 (125) 200 550 Ending Cash Balance (1) $350 (1) Excludes counterparty collateral activity. (2) Cash Flow from Operations primarily includes net cash flows provided by operating activities and net cash flows used in investing activities other than capital expenditures. (3) Assumes 2011 dividend of $2.10/share. Dividends are subject to declaration by the Board of Directors. (4) Includes $400 million in Nuclear Uprates and $225 million for Exelon Wind spend. (5) Represents new business, smart grid/smart meter investment and transmission growth projects. (6) Planned Issuances of $1B at ComEd reflect the $600M January 18, 2011 issuance and $400M of ComEd’s $600M September 7, 2011 issuance. Incremental $200M of financing was primarily utilized to retire $191M of tax-exempt debt at ComEd. (7) “Other” includes proceeds from options and expected changes in short-term debt. (8) Includes cash flow activity from Holding Company, eliminations, and other corporate entities. |
 20 Sufficient Liquidity ($ millions) Exelon (3) Aggregate Bank Commitments (1) $1,000 $600 $5,600 $7,700 Outstanding Facility Draws -- -- -- -- Outstanding Letters of Credit (195) (1) (121) (324) Available Capacity Under Facilities (2) 805 599 5,479 7,376 Outstanding Commercial Paper -- -- -- (139) Available Capacity Less Outstanding Commercial Paper $805 $599 $5,479 $7,237 Exelon bank facilities are largely untapped (1) Excludes commitments from Exelon’s Community and Minority Bank Credit Facility (2) Available Capacity Under Facilities represents the unused bank commitments under the borrower’s credit agreements net of outstanding letters of credit and facility draws. The amount of commercial paper outstanding does not reduce the available capacity under the credit agreements. (3) Includes Exelon Corporate’s $500M credit facility, letters of credit and commercial paper outstanding. Available Capacity Under Bank Facilities as of July 14, 2011 |
 21 Key Credit Metrics 0.0x 2.0x 4.0x 6.0x 8.0x 10.0x 12.0x 2009A 2010A 2011E ExGen/Corp ComEd PECO Exelon 0% 5% 10% 15% 20% 25% 30% 35% 40% 45% 50% 2009A 2010A 2011E ExGen/Corp ComEd PECO Exelon FFO / Debt (1) (1) See slide 53 for reconciliations to GAAP. (2) Current senior unsecured ratings for Exelon and Exelon Generation and senior secured ratings for ComEd and PECO as of September 2, 2011. (3) FFO/Debt Target Range reflects Generation FFO/Debt in addition to the debt obligations of Exelon Corp. (4) Moody’s placed Exelon and Generation under review for a possible downgrade after the proposed merger with Constellation Energy was announced. Moody’s Credit Ratings (2) S&P Credit Ratings (2) Fitch Credit Ratings (2) FFO / Debt Target Range (2) Exelon: Baa1 (4) BBB- BBB+ ComEd: Baa1 A- BBB+ 15-18% PECO: A1 A- A 15-18% Generation: A3 (4) BBB BBB+ 30-35% (3) Interest Coverage (1) 0% 10% 20% 30% 40% 50% 60% 70% 80% 90% 100% 2009A 2010A 2011E ExGen/Corp ComEd PECO Exelon Debt / Cap (1) |
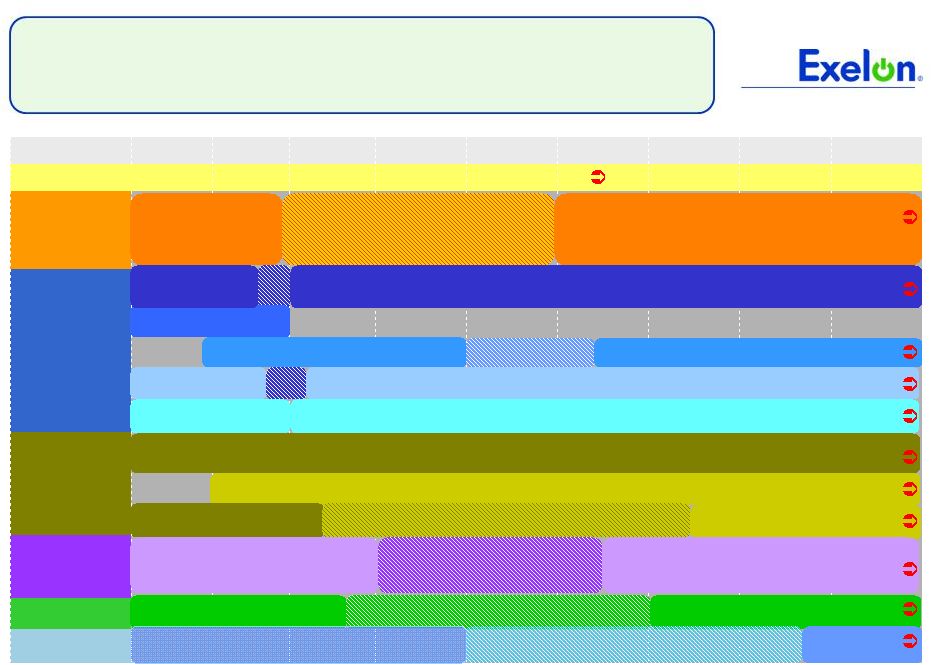 22 EPA Regulations Are Moving Forward 2010 2011 2012 2013 2014 2015 2016 2017 2018 PJM RPM Auction 14/15 15/16 16/17 17/18 Hazardous Air Pollutants Criteria Pollutants Greenhouse Gases Coal Combustion By-Products Cooling Water Effluents Develop Toxics Rule Pre Compliance Period Compliance With Toxics Rule Compliance With Cross-State Air Pollution Rule (CSAPR) Interim CAIR Develop CSAPR (2) Estimated Compliance Develop Criteria NSPS revision Compliance with Revised Criteria NSPS Develop Revised NAAQS SIP provisions developed in response to revised NAAQS (e.g., Ozone, PM2.5, SO2, NO2, NOx/SOx, CO) Compliance with Federal GHG Reporting Rule PSD/BACT and Title V Apply to GHG Emissions (PSD only for new and modified sources) Develop GHG NSPS Pre Compliance Period Compliance With GHG NSPS Develop Coal Combustion By-Products Rule Pre Compliance Period Compliance With Federal CCB Regulations Develop 316(b) Regulations Pre Compliance Period Phase In Of Compliance Develop Effluent Regulations Pre Compliance Period Phase In Of Compliance Notes: RPM auctions take place annually in May. For definition of the EPA regulations referred to on this slide, please see the EPA’s Terms of Environment (http://www.epa.gov/OCEPAterms/). Develop Cross- State Air Pollution Rule |
 23 Rule encourages future development of transmission infrastructure in the U.S. Appropriately assigns the cost of new transmission lines to customers benefitting from improved reliability Maintains the ability of transmission providers like ComEd and PECO to construct transmission upgrades in their service territories PJM tariffs will require modifications to achieve goals of the final rule FERC Transmission Ruling Supports Competitive Markets Exelon is committed to ensuring PJM’s tariff is modified to achieve the goals of the FERC Order |
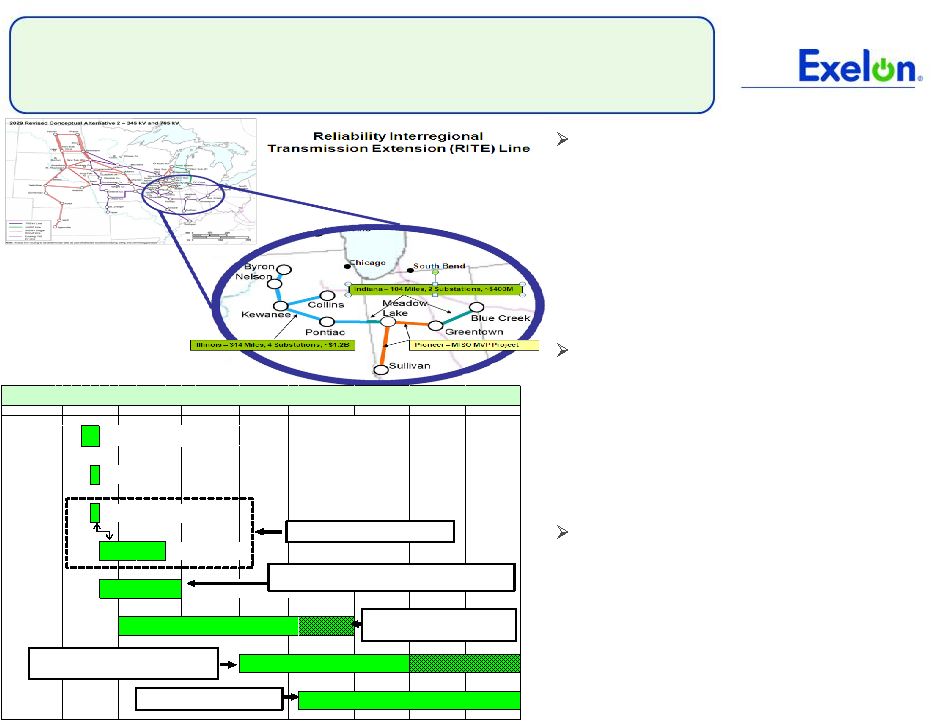 RITE Line Project Update Project Background • 420 miles of 765kV transmission stretches from Northern Illinois to Ohio. The RITE Line will be built from the existing 765kV system in Ohio in the East to the West • Estimated construction to begin 2015 pending regulatory approvals and siting Strategic and Financial Objectives • Ensures reliability, enables states to meet RPS standards, and supports the integration of more renewables • ComEd/Exelon investment ~ $1.1 billion • Requested ROE 12.70% Latest Developments • Signed partnership agreement with ETA on July 13 • Completed FERC incentive rate filing on July 18. Expect FERC ruling by October 2011. 24 Note: ETA = Electric Transmission America RPS = Renewable Portfolio Standards RTEP = Regional Transmission Expansion Planning 2014 2016 2017 2018 FERC Final Rule on NOPR PJM Compliance Filing 2010 State Local Outreach & Project Siting Establish Definitive Agreement Between Exelon & ETA 2012 FERC Incentive Filing Construction RITE Line 2013 2011 2015 In-Service Pursue PJM RTEP Approval RTEP Approval expected by 2012, depending on PJM Planning criteria Time length is dependent on: 1. Land negotiations 2. Receipt of State Line can be in-serviced in phases Construction can range from 3-5 yrs depending on the length of time needed to site the project Non-Project Specific Events |
  25 |
 26 Factors Influencing RPM Auction (PY 14/15 vs. PY 13/14) Expected Exelon Price Impact Actual Price Impact Actual Auction Results and Supplier Bidding Behavior Cost of Environmental Upgrades and Higher Net ACRs for Coal Units • 3,237 MW reduction in offered capacity (coal/oil/gas) • 7,746 MW reduction in cleared capacity (coal/oil/gas) Import Transmission Limits and Objectives (muted impact on portfolio revenues due to regional diversification) • Total revenue from PY 14/15 capacity auction close to PY 13/14 revenues for Exelon fleet • Balanced portfolio, split evenly between east and west, reduces volatility in revenues due to transmission or demand changes. Demand Response Growth • Increase in cleared DR (~4,836 MW) was close to internal estimates. • Limited DR was capped, causing price separation for premium products RPM Results: Favorable and As Expected Auction results were in line with Exelon’s expectations with EPA regulations being one of the primary drivers of bidding behavior |
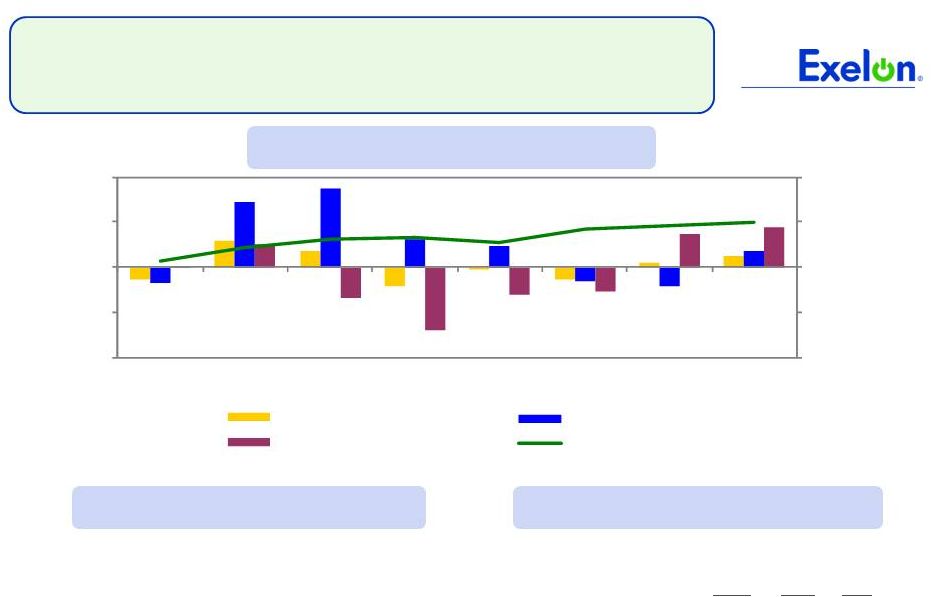
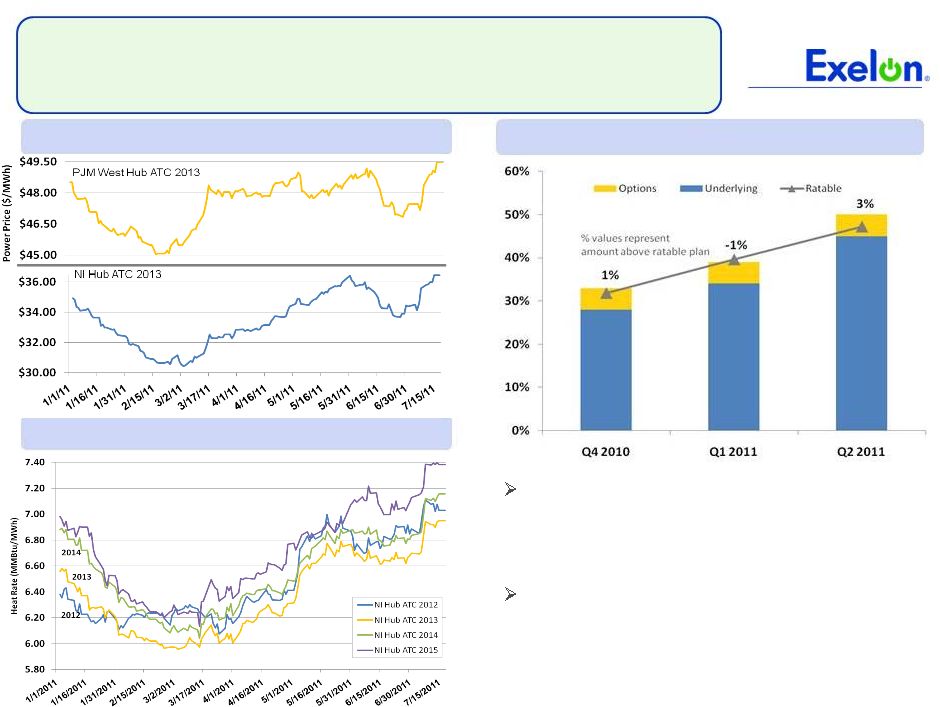 27 Exelon Generation Hedging Program Q2 provided favorable 2013 sales opportunities • Reflects successful participation in Illinois IPA procurements in the first half of May Price movements • Recovery in heat rates, especially at NI Hub • Upward move in NI Hub wrap 2015 PJM NI Hub ATC Heat Rates 2013 PJM West Hub & NI Hub ATC Prices 2013 Hedge % and Value Above Ratable |
 28 Diverse Generation and Sales Mix Exelon’s diverse portfolio is well positioned to serve a variety of products 2011-2013 Sales as a Percentage of Expected Generation Current Owned & Contracted Generation Capacity by Fuel Type Matching Exelon’s favorable asset position with a diverse set of products is an important aspect of the hedging program • Reduces and diversifies our collateral exposure • Enables sales to be made closer to assets • Increases opportunities for margin via retail, utility solicitations and mid-marketing channels • Use of alternate channels and locations help minimize liquidity and congestion risks Data as of 6/30/2011 (1) Reflects owned and contracted generation as of 6/30/2011. Excludes Cromby Station 1 & 2, Eddystone 1&2 and PPA with Tenaska Georgia Partners. Includes Wolf Hollow PPA volume only (350 MW). (1) |
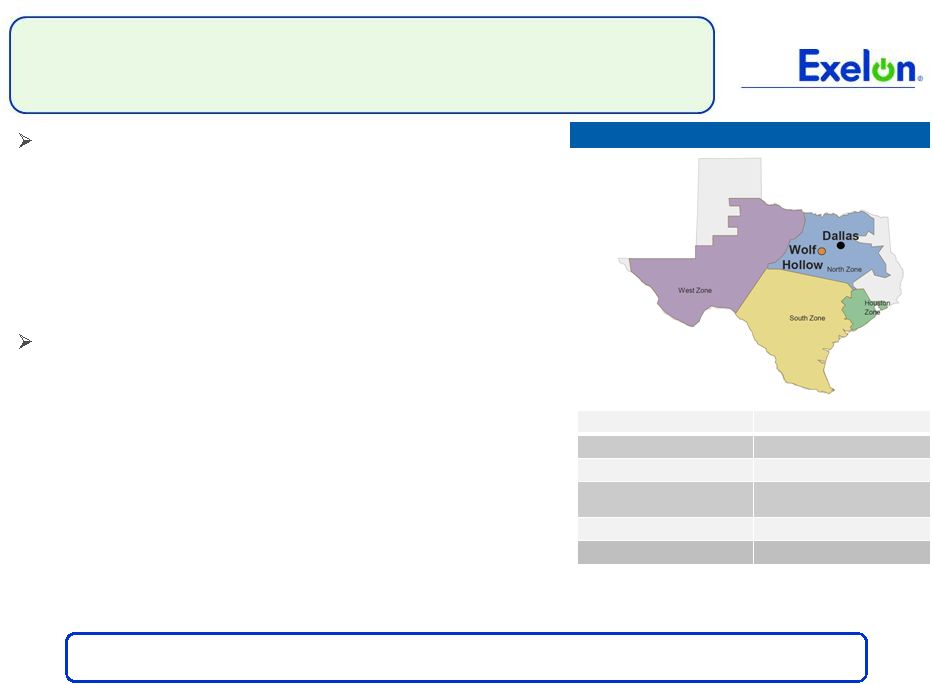 Wolf Hollow Acquisition 29 Wolf Hollow Overview Diversifies generation portfolio • Expands geographic and fuel characteristics of fleet • Advances Exelon and Constellation merger strategy of matching load with generation in key competitive markets Creates value for shareholders • $305M purchase price compares favorably to cost of other recent transactions • Free cash flow accretive beginning in 2012; earnings and credit neutral • Eliminates current above market purchase power agreement (PPA) with Wolf Hollow • Enhances opportunity to benefit from future market heat rate expansion in ERCOT Transaction closed on August 24, 2011 Location Granbury, Texas Commercial Operation Date August 2003 Nominal Net Operating Capacity 720MW Equipment Technology 2 Mitsubishi combined-cycle gas turbines Primary Fuel Natural Gas Secondary Fuel None ERCOT = Electric Reliability Council of Texas |
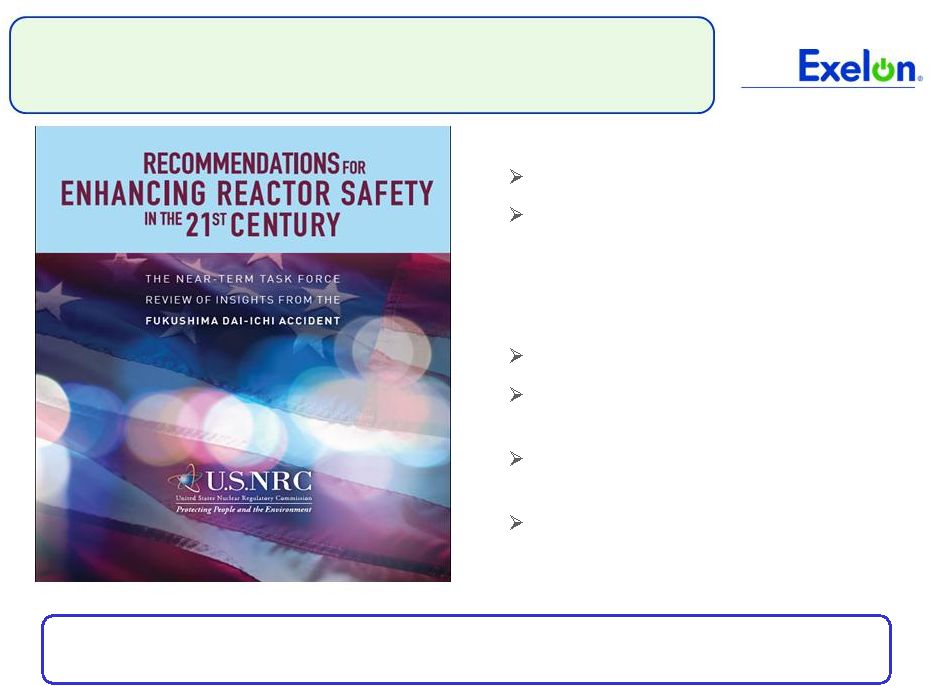 30 NRC Near-Term Task Force Recommendations Key Findings : U.S nuclear plants are safe No major changes to spent nuclear fuel storage and licensing Key Recommendations: Clarifying regulatory framework Ensuring protection and enhancing mitigation Strengthening emergency preparedness Improving efficiency of NRC programs Report was first step in systematic review that NRC will conduct; stakeholder input will be sought |
 31 Exelon Nuclear Fleet Overview – IL Plant Location Type/ Containment Water Body License Extension Status / License Expiration (1) Ownership Spent Fuel Storage/ Date to lose full core discharge capacity (2) Braidwood, IL (Units 1 and 2) PWR Concrete/Steel Lined Kankakee River Expect to file application in 2013/ 2026, 2027 100% Dry Cask (Fall 2011) Byron, IL (Units 1 and 2) PWR Concrete/Steel Lined Rock River Expect to file application in 2013/ 2024, 2026 100% Dry Cask Clinton, IL (Unit 1) BWR Concrete/Steel Lined Clinton Lake 2026 100% 2018 Dresden, IL (Units 2 and 3) BWR Steel Vessel Kankakee River Renewed / 2029, 2031 100% Dry cask LaSalle, IL (Units 1 and 2) BWR Concrete/Steel Lined Illinois River 2022, 2023 100% Dry Cask Quad Cities, IL (Units 1 and 2) BWR Steel Vessel Mississippi River Renewed / 2032 75% Exelon, 25% Mid-American Holdings Dry cask Exelon pursues license extensions well in advance of expiration to ensure adequate time for review by the NRC (1) Operating license renewal process takes approximately 4-5 years from commencement until completion of NRC review. (2) The date for loss of full core reserve identifies when the on-site storage pool will no longer have sufficient space to receive a full complement of fuel from the reactor core. Dry cask storage will be in operation at those sites prior to losing full core discharge capacity in their on-site storage pools. |
 32 Exelon Nuclear Fleet Overview – PA and NJ Plant, Location Type, Containment Water Body License Extension Status / License Expiration (1) Ownership Spent Fuel Storage/ Date to lose full core discharge capacity (2) Limerick, PA (Units 1 and 2) BWR Concrete/Steel Lined Schuylkill River Filed application in June 2011 (decision expected in 2013)/ 2024, 2029 100% Dry cask Oyster Creek, NJ (Unit 1) BWR Steel Vessel Barnegat Bay Renewed / 2029 (3) 100% Dry cask Peach Bottom, PA (Units 2 and 3) BWR Steel Vessel Susquehanna River Renewed / 2033, 2034 50% Exelon, 50% PSEG Dry cask TMI, PA (Unit 1) PWR Concrete/Steel Lined Susquehanna River Renewed / 2034 100% 2023 Salem, NJ (Units 1 and 2) PWR Concrete/Steel Lined Delaware River Renewed / 2036, 2040 42.6% Exelon, 57.4% PSEG Dry Cask (1) Operating license renewal process takes approximately 4-5 years from commencement until completion of NRC review. (2) The date for loss of full core reserve identifies when the on-site storage pool will no longer have sufficient space to receive a full complement of fuel from the reactor core. Dry cask storage will be in operation at those sites prior to losing full core discharge capacity in their on-site storage pools. (3) On December 8, 2010, Exelon announced that Generation will permanently cease generation operations at Oyster Creek by December 31, 2019. The current NRC license for Oyster Creek expires in 2029. Exelon pursues license extensions well in advance of expiration to ensure adequate time for review by the NRC |
 33 Exelon Generation Hedging Disclosures (as of June 30, 2011) |
 34 Important Information The following slides are intended to provide additional information regarding the hedging program at Exelon Generation and to serve as an aid for the purposes of modeling Exelon Generation’s gross margin (operating revenues less purchased power and fuel expense). The information on the following slides is not intended to represent earnings guidance or a forecast of future events. In fact, many of the factors that ultimately will determine Exelon Generation’s actual gross margin are based upon highly variable market factors outside of our control. The information on the following slides is as of June 30, 2011. We update this information on a quarterly basis. Certain information on the following slides is based upon an internal simulation model that incorporates assumptions regarding future market conditions, including power and commodity prices, heat rates, and demand conditions, in addition to operating performance and dispatch characteristics of our generating fleet. Our simulation model and the assumptions therein are subject to change. For example, actual market conditions and the dispatch profile of our generation fleet in future periods will likely differ – and may differ significantly – from the assumptions underlying the simulation results included in the slides. In addition, the forward-looking information included in the following slides will likely change over time due to continued refinement of our simulation model and changes in our views on future market conditions. |
 35 Portfolio Management Objective Align Hedging Activities with Financial Commitments Power Team utilizes several product types and channels to market • Wholesale and retail sales • Block products • Load-following products and load auctions • Put/call options Exelon’s hedging program is designed to protect the long-term value of our generating fleet and maintain an investment-grade balance sheet • Hedge enough commodity risk to meet future cash requirements if prices drop • Consider: financing policy (credit rating objectives, capital structure, liquidity); spending (capital and O&M); shareholder value return policy Consider market, credit, operational risk Approach to managing volatility • Increase hedging as delivery approaches • Have enough supply to meet peak load • Purchase fossil fuels as power is sold • Choose hedging products based on generation portfolio – sell what we own • Heat rate options • Fuel products • Capacity • Renewable credits % Hedged High End of Profit Low End of Profit Open Generation with LT Contracts Portfolio Optimization Portfolio Management Portfolio Management Over Time |
 36 Percentage of Expected Generation Hedged • How many equivalent MW have been hedged at forward market prices; all hedge products used are converted to an equivalent average MW volume • Takes ALL hedges into account whether they are power sales or financial products Equivalent MWs Sold Expected Generation = Our normal practice is to hedge commodity risk on a ratable basis over the three years leading to the spot market • Carry operational length into spot market to manage forced outage and load-following risks • By using the appropriate product mix, expected generation hedged approaches the mid-90s percentile as the delivery period approaches • Participation in larger procurement events, such as utility auctions, and some flexibility in the timing of hedging may mean the hedge program is not strictly ratable from quarter to quarter Exelon Generation Hedging Program |
 37 2011 2012 2013 Estimated Open Gross Margin ($ millions) (1)(2) $5,450 $5,000 $5,600 Open gross margin assumes all expected generation is sold at the Reference Prices listed below Reference Prices (1) Henry Hub Natural Gas ($/MMBtu) NI-Hub ATC Energy Price ($/MWh) PJM-W ATC Energy Price ($/MWh) ERCOT North ATC Spark Spread ($/MWh) (3) $4.37 $33.18 $46.07 $3.77 $4.84 $33.10 $46.02 $1.40 $5.16 $34.45 $47.45 $2.27 Exelon Generation Open Gross Margin and Reference Prices (1) Based on June 30, 2011 market conditions. (2) Gross margin is defined as operating revenues less fuel expense and purchased power expense, excluding the impact of decommissioning and other incidental revenues. Open gross margin is estimated based upon an internal model that is developed by dispatching our expected generation to current market power and fossil fuel prices. Open gross margin assumes there is no hedging in place other than fixed assumptions for capacity cleared in the RPM auctions and uranium costs for nuclear power plants. Open gross margin contains assumptions for other gross margin line items such as various ISO bill and ancillary revenues and costs and PPA capacity revenues and payments. The estimation of open gross margin incorporates management discretion and modeling assumptions that are subject to change. (3) ERCOT North ATC spark spread using Houston Ship Channel Gas, 7,200 heat rate, $2.50 variable O&M. |
 38 2011 2012 2013 Expected Generation (GWh) (1) 166,100 165,600 163,000 Midwest 99,000 97,900 95,800 Mid-Atlantic 56,300 57,100 56,500 South & West 10,800 10,600 10,700 Percentage of Expected Generation Hedged (2) 95-98% 82-85% 49-52% Midwest 95-98 81-84 48-51 Mid-Atlantic 96-99 85-88 50-53 South & West 86-89 63-66 45-48 Effective Realized Energy Price ($/MWh) (3) Midwest $43.00 $41.00 $40.00 Mid-Atlantic $57.00 $50.00 $50.50 South & West $4.50 $0.00 ($2.00) Generation Profile (1) Expected generation represents the amount of energy estimated to be generated or purchased through owned or contracted for capacity. Expected generation is based upon a simulated dispatch model that makes assumptions regarding future market conditions, which are calibrated to market quotes for power, fuel, load following products, and options. Expected generation assumes 12 refueling outages in 2011 and 10 refueling outages in 2012 and 2013 at Exelon-operated nuclear plants and Salem. Expected generation assumes capacity factors of 93.0%, 93.4% and 93.2% in 2011, 2012 and 2013 at Exelon-operated nuclear plants. These estimates of expected generation in 2012 and 2013 do not represent guidance or a forecast of future results as Exelon has not completed its planning or optimization processes for those years. (2) Percent of expected generation hedged is the amount of equivalent sales divided by the expected generation. Includes all hedging products, such as wholesale and retail sales of power, options, and swaps. Uses expected value on options. Reflects decision to permanently retire Cromby Station and Eddystone Units 1&2 as of May 31, 2011. (3) Effective realized energy price is representative of an all-in hedged price, on a per MWh basis, at which expected generation has been hedged. It is developed by considering the energy revenues and costs associated with our hedges and by considering the fossil fuel that has been purchased to lock in margin. It excludes uranium costs and RPM capacity revenue, but includes the mark-to-market value of capacity contracted at prices other than RPM clearing prices including our load obligations. It can be compared with the reference prices used to calculate open gross margin in order to determine the mark-to-market value of Exelon Generation's energy hedges. |
 39 Gross Margin Sensitivities with Existing Hedges ($ millions) (1) Henry Hub Natural Gas + $1/MMBtu - $1/MMBtu NI-Hub ATC Energy Price +$5/MWH -$5/MWH PJM-W ATC Energy Price +$5/MWH -$5/MWH Nuclear Capacity Factor +1% / -1% 2011 $5 $(5) $5 $(5) $5 $(5) +/- $25 2012 $85 $(35) $95 $(75) $55 $(55) +/- $45 2013 $340 $(290) $250 $(245) $155 $(150) +/- $50 Exelon Generation Gross Margin Sensitivities (with Existing Hedges) (1) Based on June 30, 2011 market conditions and hedged position. Gas price sensitivities are based on an assumed gas-power relationship derived from an internal model that is updated periodically. Power prices sensitivities are derived by adjusting the power price assumption while keeping all other prices inputs constant. Due to correlation of the various assumptions, the hedged gross margin impact calculated by aggregating individual sensitivities may not be equal to the hedged gross margin impact calculated when correlations between the various assumptions are also considered. |
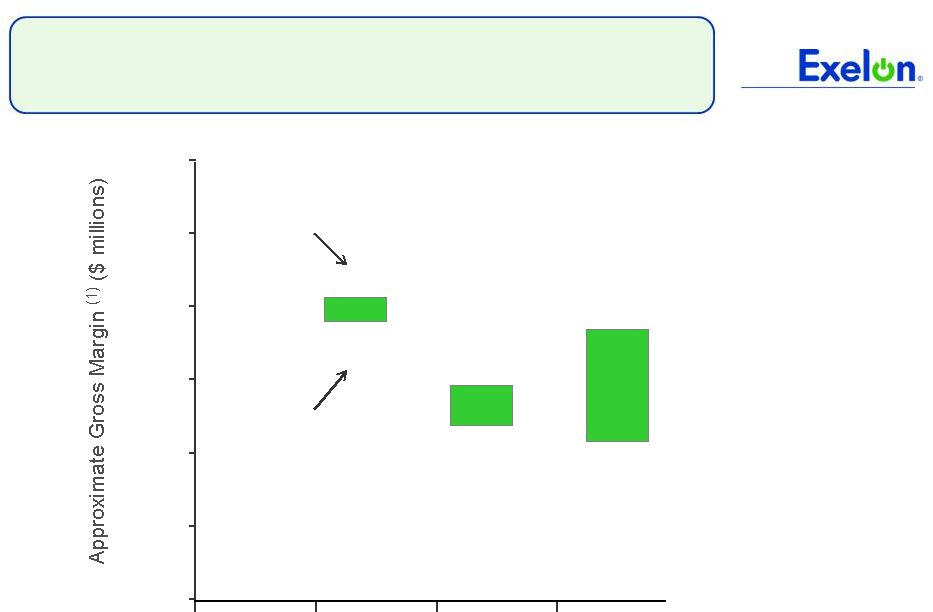 40 95% case 5% case $5,500 $7,100 $6,900 $6,000 Exelon Generation Gross Margin Upside / Risk (with Existing Hedges) $3,000 $4,000 $5,000 $6,000 $7,000 $8,000 $9,000 2011 2012 2013 $6,800 $5,200 (1) Represents an approximate range of expected gross margin, taking into account hedges in place, between the 5th and 95th percent confidence levels assuming all unhedged supply is sold into the spot market. Approximate gross margin ranges are based upon an internal simulation model and are subject to change based upon market inputs, future transactions and potential modeling changes. These ranges of approximate gross margin in 2012 and 2013 do not represent earnings guidance or a forecast of future results as Exelon has not completed its planning or optimization processes for those years. The price distributions that generate this range are calibrated to market quotes for power, fuel, load following products, and options as of June 30, 2011. |
 41 Midwest Mid-Atlantic South & West Step 1 Start with fleetwide open gross margin $5.45 billion Step 2 Determine the mark-to-market value of energy hedges 99,000GWh * 96% * ($43.00/MWh-$33.18MWh) = $0.93 billion 56,300GWh * 97% * ($57.00/MWh-$46.07MWh) = $0.60 billion 10,800GWh * 87% * ($4.50/MWh-$3.77MWh) = $0.00 billion Step 3 Estimate hedged gross margin by adding open gross margin to mark-to- market value of energy hedges Open gross margin: MTM value of energy hedges: Estimated hedged gross margin: Illustrative Example of Modeling Exelon Generation 2011 Gross Margin (with Existing Hedges) $0.93 billion + $0.60 billion + $0.00 billion $5.45 billion $6.98 billion |
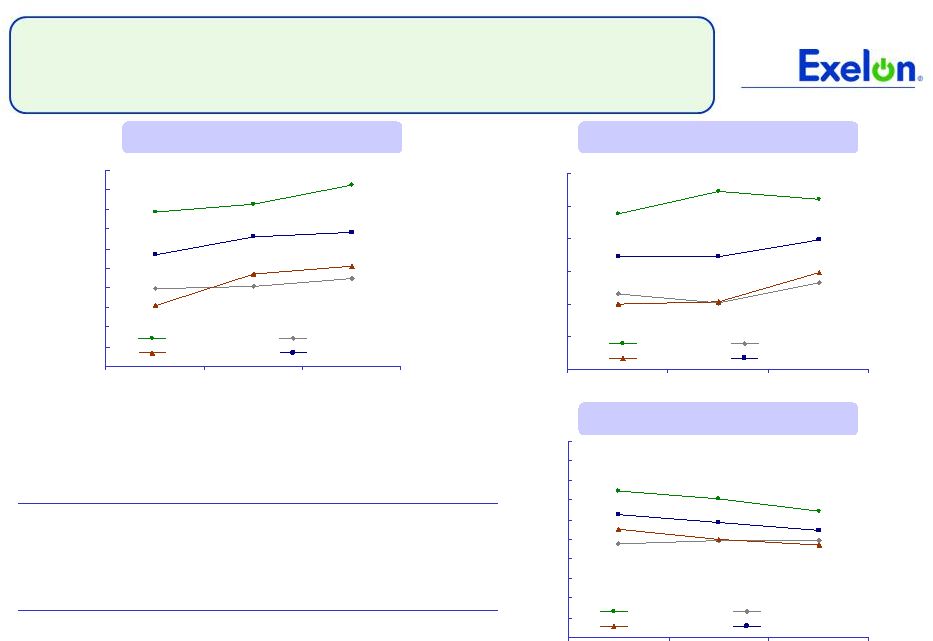
 20 25 30 35 40 45 8/10 9/10 10/10 11/10 12/10 1/11 2/11 3/11 4/11 5/11 6/11 7/11 8/11 35 40 45 50 55 60 65 70 75 8/10 9/10 10/10 11/10 12/10 1/11 2/11 3/11 4/11 5/11 6/11 7/11 8/11 4.0 4.5 5.0 5.5 6.0 6.5 7.0 8/10 9/10 10/10 11/10 12/10 1/11 2/11 3/11 4/11 5/11 6/11 7/11 8/11 50 55 60 65 70 75 80 85 90 95 8/10 9/10 10/10 11/10 12/10 1/11 2/11 3/11 4/11 5/11 6/11 7/11 8/11 Market Price Snapshot Forward NYMEX Natural Gas PJM-West and Ni-Hub On-Peak Forward Prices PJM-West and Ni-Hub Wrap Forward Prices 2012 $4.58 2013 $5.05 Forward NYMEX Coal 2012 $81.06 2013 $85.51 2012 Ni-Hub $42.62 2013 Ni-Hub $45.58 2013 PJM-West $56.91 2012 PJM-West $53.84 2012 Ni-Hub $27.61 2013 Ni-Hub $30.00 2013 PJM-West $42.07 2012 PJM-West $39.62 42 Rolling 12 months, as of August 31 2011. Source: OTC quotes and electronic trading system. Quotes are daily. st |
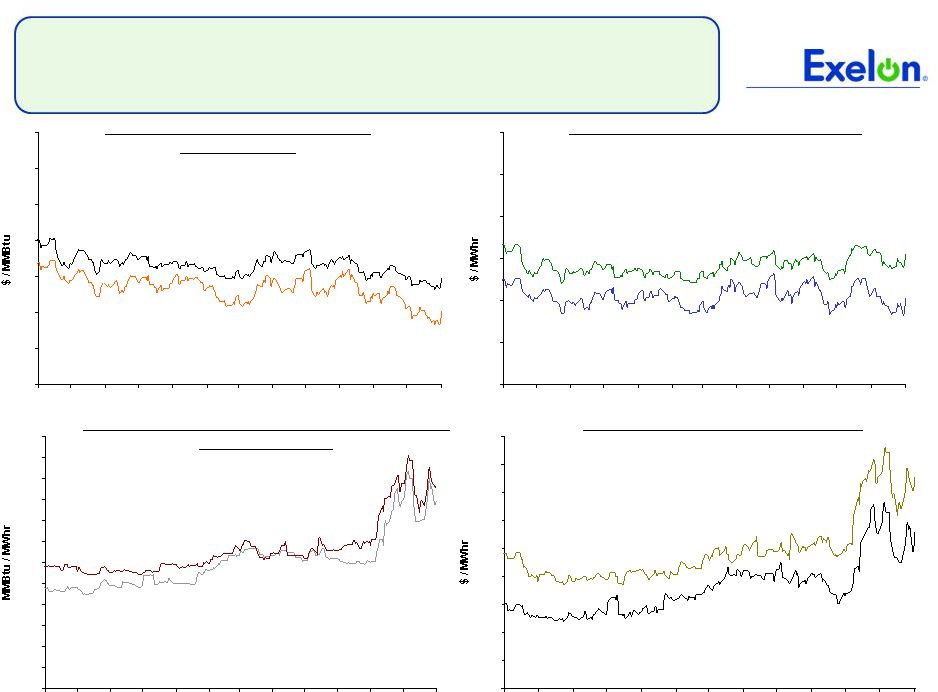 4.5 5.5 6.5 7.5 8.5 9.5 10.5 11.5 12.5 13.5 8/10 9/10 10/10 11/10 12/10 1/11 2/11 3/11 4/11 5/11 6/11 7/11 8/11 8.2 8.4 8.6 8.8 9.0 9.2 9.4 9.6 9.8 10.0 10.2 10.4 10.6 8/10 9/10 10/10 11/10 12/10 1/11 2/11 3/11 4/11 5/11 6/11 7/11 8/11 35 40 45 50 55 60 65 8/10 9/10 10/10 11/10 12/10 1/11 2/11 3/11 4/11 5/11 6/11 7/11 8/11 3.5 4.0 4.5 5.0 5.5 6.0 6.5 7.0 8/10 9/10 10/10 11/10 12/10 1/11 2/11 3/11 4/11 5/11 6/11 7/11 8/11 Market Price Snapshot 2013 10.14 2012 10.00 2012 $45.27 2013 $50.53 2012 $4.53 2013 $4.99 Houston Ship Channel Natural Gas Forward Prices ERCOT North On-Peak Forward Prices ERCOT North On-Peak v. Houston Ship Channel Implied Heat Rate 2012 $10.09 2013 $12.06 ERCOT North On Peak Spark Spread Assumes a 7.2 Heat Rate, $1.50 O&M, and $.15 adder 43 Rolling 12 months, as of August 31 2011. Source: OTC quotes and electronic trading system. Quotes are daily. st |
 44 |
 ComEd 2010 Rate Case Final Order (ICC Docket No. 10-0467) On 5/24/11, the Illinois Commerce Commission (ICC) issued an order in ComEd’s 2010 distribution rate case – new rates went into effect in June 2011 Rate Case Details ICC Order (5/24/11) ComEd Reply Brief (2/23/11) Revenue Requirement Increase $143M (1) $343M Rate Base $6,549M $7,349M ROE 10.50% 11.30% (2) Equity Ratio 47.28% 47.28% (1) Reflects ~$(13)M adjustment to ICC Order (2) Included 40 bp adder for energy efficiency, not approved by ICC 45 |
 ComEd Load Trends Chicago U.S. Unemployment rate (1) 9.3% 9.2% 2011 annualized growth in gross domestic/metro product (2) 2.5% Note: C&I = Commercial & Industrial 2010 2Q11 2011E Average Customer Growth 0.2% 0.4% 0.4% Average Use-Per-Customer (1.4)% (2.0)% 0.0% Total Residential (1.2)% (1.6)% 0.4% Small C&I (0.6)% (0.2)% (0.3)% Large C&I 2.6% (0.9)% 0.0% All Customer Classes 0.2% (0.8)% 0.0% (1) Source: U.S. Dept. of Labor (June 2011) and Illinois Department of Security (June 2011) (2) Source: Global Insight (May 2011) 46 - 6.0% - 3.0% 0.0% 3.0% 6.0% - 6.0% - 3.0% 0.0% 3.0% 6.0% 1Q10 2Q10 3Q10 4Q10 1Q11 2Q11 3Q11 4Q11 All Customer Classes Large C&I Residential Gross Metro Product Weather-Normalized Load Year-over-Year Key Economic Indicators Weather-Normalized Load 2.7% |
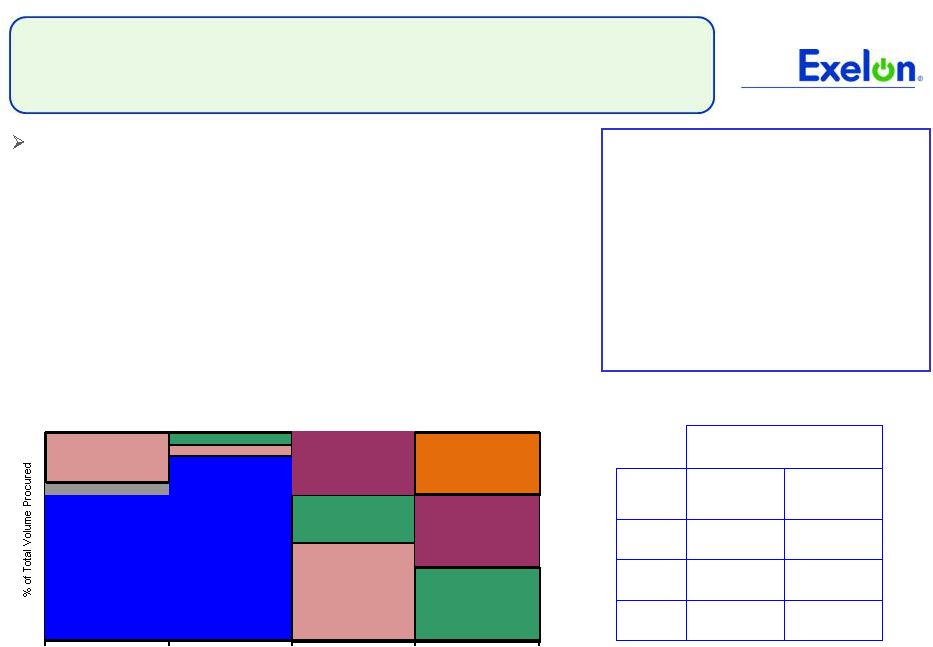 Illinois Power Agency (IPA) RFP Procurement Note: Chart is for illustrative purposes only. REC = Renewable Energy Credit; RFP = request for proposal; ATC = Around the Clock June 2012 June 2013 June 2014 Financial Swap Agreement with ExGen (ATC baseload energy – notional quantity 3,000 MW) Standard Products and Annual REC Procurement held in May 2011 – Effective ATC of $34.77/MWh for 9 winning Standard Product suppliers for the 2011-12 plan-year – 2.12 million MWh of renewable resources for the 2011-12 plan-year from 12 winning suppliers – Provisions included: • Annual energy procurements over a three-year time frame • Target a 35%/35%/30% laddered procurement approach • No additional Energy Efficiency, Demand Response purchases • No additional long-term contracts for renewables • No 10% overprocurement for summer peak energy June 2015 Delivery Period Peak Off-Peak June 2011 - May 2012 5,118 4,001 June 2012 - May 2013 1,129 358 June 2013 - May 2014 6,494 6,062 Volume procured in the 2011 IPA Procurement Event (GWh) Term Fixed Price ($/MWh) 1/1/11-12/31/11 $51.26 1/1/12-12/31/12 $52.37 1/13/13-5/31/13 $53.48 47 June 2011 Financial Swap 2010 RFP 2011 RFP 2011 RFP 2011 RFP 2012 RFP 2012 RFP 2012 RFP 2013 RFP 2013 RFP 2014 RFP |
  48 |
 49 PECO Load Trends Philadelphia U.S. Unemployment rate (1) 7.9% 9.2% 2011 annualized growth in gross domestic/metro product (2) 2.4% Note: C&I = Commercial & Industrial Key Economic Indicators Weather-Normalized Load 2010 2Q11 2011E Average Customer Growth 0.3% 0.5% 0.4% Average Use-Per-Customer 0.3% 2.8% 1.7% Total Residential 0.5% 3.2% 2.2% Small C&I (1.9)% 1.7% 0.7% Large C&I 0.8% (3.3)% (2.3)% All Customer Classes 0.1% (0.1)% (0.0)% (1) Source: U.S Dept. of Labor data June 2011 - US U.S Dept. of Labor prelim. data May 2011 - Philadelphia (2) Source: Global Insight May 2011 Weather-Normalized Load Year-over-Year -6.0% -3.0% 0.0% 3.0% 6.0% - 6.0% -3.0% 0.0% 3.0% 6.0% 1Q10 2Q10 3Q10 4Q10 1Q11 2Q11 3Q11 4Q11 All Customer Classes Large C&I Residential Gross Metro Product 2.7% |
 50 PECO Procurement Plan Customer Class Products Residential 75% full requirements 20% block energy 5% energy only spot Small Commercial (peak demand <100 kW) 90% full requirements 10% full requirements spot Medium Commercial (peak demand >100 kW but <= 500 kW) 85% full requirements 15% full requirements spot Large Commercial & Industrial (peak demand >500 kW) Fixed-Priced full requirements (2) Hourly full requirements PECO Procurement Plan (1) Residential – weighted average wholesale prices 80 MW of baseload (24x7) block energy product (for Jan-Dec 2012) – $51.52/MWh 70 MW of Jun-Aug 2011 summer on-peak block energy product – $67.24/MWh 40 MW of Dec 2011-Feb 2012 winter on-peak block energy product – $63.05/MWh Large Commercial and Industrial (Hourly) – weighted average wholesale price 36% of hourly full requirements product (for Jun 2011-May 2012) (3) – $4.97/MWh (4) May 2, 2011 RFP - Fifth in a series of nine procurements for the PUC-approved Default Service Plan Next RFP to be held on September 19, 2011 (1) See PECO Procurement website (http://www.pecoprocurement.com) for additional details regarding PECO’s procurement plan and RFP results. (2) For Large C&I customers who previously opted to participate in the 2011 fixed-priced full requirements product. (3) Large C&I tranches which were not fully subscribed in the fall 2010 procurement. (4) The price for the hourly full requirements product includes only ancillary services/Alternative Energy Portfolio Standard (AEPS) and miscellaneous costs. The price does not include energy and capacity costs. Energy costs will be based on the PECO Zone Day-Ahead locational marginal pricing (LMP) price, and capacity will be based on the PJM RPM price per day. |
 51 Appendix |
 52 Exelon Consolidated Metric Calculations and Ratios $ in millions FFO / Debt Coverage = FFO (a) Adjusted Debt (b) FFO Interest Coverage = FFO (a) + Adjusted Interest (c) Adjusted Interest (c) Adjusted Capitalization (e) = Adjusted Debt (b) + Adjusted Equity (d) = 32,606 Rating Agency Debt Ratio = Adjusted Debt (b) Adjusted Capitalization (e) 32% 7.2x 58% = = = 2010A Credit Metrics (1) Includes changes in A/R, Inventories, A/P and other accrued expenses, option premiums, counterparty collateral and income taxes. Impact to FFO is opposite of impact to cash flow (2) Reflects retirement of variable interest entity + change in restricted cash (3) Reflects net capacity payment – interest on PV of PPAs (using weighted average cost of debt) (4) Reflects employer contributions – (service costs + interest costs + expected return on assets), net of taxes at 35% (5) Reflects operating lease payments – interest on PV of future operating lease payments (using weighted average cost of debt) (6) Includes AFUDC / capitalized interest (7) Reflects PV of net capacity purchases (using weighted average cost of debt) (8) Reflects unfunded status, net of taxes at 35% (9) Reflects PV of minimum future operating lease payments (using weighted average cost of debt) (10) Nuclear decommissioning trust fund balance > asset retirement obligation. No debt imputed (11) Includes accrued interest less securities qualifying for hybrid treatment (50% debt / 50% equity) (12) Reflects interest on PV of minimum future operating lease payments (using weighted average cost of debt) (13) Reflects interest on PV of PPAs (using weighted average cost of debt) (14) Includes AFUDC / capitalized interest and interest on securities qualifying for hybrid treatment (50% debt / 50% equity) (15) Includes interest on securities qualifying for hybrid treatment (50% debt / 50% equity) Exelon 2010 YE Adjustments FFO Calculation 2010 YE Source - 2010 Form 10-K (.pdf version) Net Cash Flows provided by Operating Activities 5,244 Pg 159 - Stmt. of Cash Flows +/- Change in Working Capital 644 Pg 159 - Stmt. of Cash Flows (1) - PECO Transition Bond Principal Paydown (392) Pg 174 - Stmt. of Cash Flows (2) + PPA Depreciation Adjustment 207 Pg 295 - Commitments and Contingencies (3) +/- Pension/OPEB Contribution Normalization 448 Pg 268-269 - Post-retirement Benefits (4) + Operating Lease Depreciation Adjustment 35 Pg 299 - Commitments and Contingencies (5) +/- Decommissioning activity (143) Pg 159- Stmt. of Cash Flows +/- Other Minor FFO Adjustments (6) (54) = FFO (a) 5,989 Debt Calculation Long-term Debt (incl. Current Maturities and A/R agreement) 12,828 Pg 161 - Balance Sheet Short-term debt (incl. Notes Payable / Commercial Paper) - Pg 161 - Balance Sheet - PECO Transition Bond Principal Paydown - N/A - no debt outstanding at year-end + PPA Imputed Debt 1,680 Pg 295 - Commitments and Contingencies (7) + Pension/OPEB Imputed Debt 3,825 Pg 268 - Post-retirement benefits (8) + Operating Lease Imputed Debt 428 Pg 299 - Commitments and Contingencies (9) + Asset Retirement Obligation - Pg 261-267 - Asset Retirement Obligations (10) +/- Other Minor Debt Equivalents (11) 84 = Adjusted Debt (b) 18,845 Interest Calculation Net Interest Expense 817 Pg 158 - Statement of Operations - PECO Transition Bond Interest Expense (22) Pg 182 - Significant Accounting Policies + Interest on Present Value (PV) of Operating Leases 29 Pg 299 - Commitments and Contingencies (12) + Interest on PV of Purchased Power Agreements (PPAs) 99 Pg 295 - Commitments and Contingencies (13) +/- Other Minor Interest Adjustments (14) 37 = Adjusted Interest (c) 960 Equity Calculation Total Equity 13,563 Pg 161 - Balance Sheet + Preferred Securities of Subsidaries 87 Pg 161 - Balance Sheet +/- Other Minor Equity Equivalents (15) 111 = Adjusted Equity (d) 13,761 |
 53 YTD GAAP EPS Reconciliation Six Months Ended June 30, 2011 ExGen ComEd PECO Other Exelon 2011 Adjusted (non-GAAP) Operating Earnings (Loss) Per Share $1.69 $0.26 $0.32 $(0.04) $2.22 Mark-to-market impact of economic hedging activities (0.25) - - - (0.25) Unrealized gains related to nuclear decommissioning trust funds 0.04 - - - 0.04 Retirement of fossil generating units (0.04) - - - (0.04) Non-cash charge resulting from Illinois tax rate change legislation (0.03) (0.01) - - (0.04) Recovery of costs pursuant to distribution rate case order - 0.03 - - 0.03 Constellation merger costs - - - (0.02) (0.02) YTD 2011 GAAP Earnings (Loss) Per Share $1.41 $0.28 $0.32 $(0.06) $1.94 NOTE: All amounts shown are per Exelon share and represent contributions to Exelon's EPS. Amounts may not add due to rounding. Six Months Ended June 30, 2010 ExGen ComEd PECO Other Exelon 2010 Adjusted (non-GAAP) Operating Earnings (Loss) Per Share $1.35 $0.37 $0.31 $(0.04) $1.99 2007 Illinois electric rate settlement (0.01) - - - (0.01) Mark-to-market impact of economic hedging activities 0.10 - - - 0.10 Unrealized losses related to nuclear decommissioning trust funds (0.05) - - - (0.05) Non-cash charge resulting from health care legislation (0.04) (0.02) (0.02) (0.02) (0.10) Non-cash charge remeasurement of income tax uncertainties 0.10 (0.16) (0.03) (0.01) (0.10) Retirement of fossil generating units (0.03) - - - (0.03) YTD 2010 GAAP Earnings (Loss) Per Share $1.42 $0.19 $0.26 $(0.07) $1.80 |
 54 GAAP to Operating Adjustments Exelon’s 2011 adjusted (non-GAAP) operating earnings outlook excludes the earnings effects of the following: • Mark-to-market adjustments from economic hedging activities • Unrealized gains and losses from nuclear decommissioning trust fund investments to the extent not offset by contractual accounting as described in the notes to the consolidated financial statements • Significant impairments of assets, including goodwill • Changes in decommissioning obligation estimates • Non-cash charge to remeasure deferred taxes at higher Illinois corporate tax rates • Financial impacts associated with the planned retirement of fossil generating units • One-time benefits reflecting ComEd’s 2011 distribution rate case order for the recovery of previously incurred costs related to the 2009 restructuring plan and for the passage of Federal health care legislation in 2010 • Certain costs associated with Exelon’s proposed merger with Constellation • Other unusual items • Significant changes to GAAP Operating earnings guidance assumes normal weather for remainder of the year |
 55 Exelon Investor Relations Contacts Exelon Investor Relations 10 South Dearborn Street Chicago, Illinois 60603 312-394-2345 312-394-4082 (Fax) For copies of other presentations, annual/quarterly reports, or to be added to our email distribution list please contact: Martha Chavez, Executive Admin Coordinator 312-394-4069 Martha.Chavez@ExelonCorp.com Investor Relations Contacts: Stacie Frank, Vice President 312-394-3094 Stacie.Frank@ExelonCorp.com Melissa Sherrod, Director 312-394-8351 Melissa.Sherrod@ExelonCorp.com Ishaan Kapoor, Manager 312-394-3657 Ishaan.Kapoor@ExelonCorp.com Marybeth Flater, Manager 312-394-8354 Marybeth.Flater@ExelonCorp.com Sandeep Menon, Principal Analyst 312-394-7279 Sandeep.Menon@ExelonCorp.com |