 Sanford C. Bernstein Strategic Decisions Conference May 29, 2014 Exhibit 99.1 |
 1 Cautionary Statements Regarding Forward-Looking Information This presentation contains certain forward-looking statements within the meaning of the Private Securities Litigation Reform Act of 1995, that are subject to risks and uncertainties. The factors that could cause actual results to differ materially from the forward-looking statements made by Exelon Corporation, Commonwealth Edison Company, PECO Energy Company, Baltimore Gas and Electric Company and Exelon Generation Company, LLC (Registrants) include those factors discussed herein, as well as the items discussed in (1) Exelon’s 2013 Annual Report on Form 10-K in (a) ITEM 1A. Risk Factors, (b) ITEM 7. Management’s Discussion and Analysis of Financial Condition and Results of Operations and (c) ITEM 8. Financial Statements and Supplementary Data: Note 22; (2) Exelon’s First Quarter 2014 Quarterly Report on Form 10-Q in (a) Part II, Other Information, ITEM 1A. Risk Factors; (b) Part 1, Financial Information, ITEM 2. Management’s Discussion and Analysis of Financial Condition and Results of Operations and (c) Part I, Financial Information, ITEM 1. Financial Statements: Note 15; (3) the cautionary statements regarding the proposed merger with Pepco Holdings, Inc. included in Exelon’s Current Reports on Form 8-K regarding the transaction filed on April 30, 2014; (4) PHI’s 2013 Annual Report on Form 10-K in (a) ITEM 1A. Risk Factors, (b) ITEM 7. Management’s Discussion and Analysis of Financial Condition and Results of Operations and (c) ITEM 8. Financial Statements and Supplementary Data: Note 15; (5) PHI’s First Quarter 2014 Quarterly Report on Form 10-Q in (a) PART I, ITEM 1. Financial Statements, (b) PART I, ITEM 2. Management’s Discussion and Analysis of Financial Condition and Results of Operations and (c) PART II, ITEM 1A.and (6) other factors discussed in filings with the SEC by the Registrants. Readers are cautioned not to place undue reliance on these forward-looking statements, which apply only as of the date of this presentation. None of the Registrants undertakes any obligation to publicly release any revision to its forward-looking statements to reflect events or circumstances after the date of this presentation. |
 2 Exelon Overview Power Generation Constellation ComEd, PECO & BGE Competitive Business Regulated Business Exelon is one of the largest competitive integrated energy companies in the U.S. • One of the largest merchant fleets in the nation (~35 GW of capacity) • One of the largest and best managed nuclear fleets in the world (~19 GW) • Significant gas generation capacity (~10 GW) • Renewable portfolio (~1.5 GW), mostly contracted • Leading competitive energy provider in the U.S. • Customer-facing business, with ~1.1 M competitive customers and large wholesale business • Top-notch portfolio and risk management capabilities • Extensive suite of products including Load Response, RECs, Distributed Solar • One of the largest electric and gas distribution companies in the nation (~7.8 M customers) • Diversified across three utility jurisdictions – Illinois, Maryland and Pennsylvania • Significant investments in Smart Grid technologies • Transmission infrastructure improvement at utilities Exelon Generation Exelon Utilities 2014 Sanford C. Bernstein Strategic Decisions Conference |
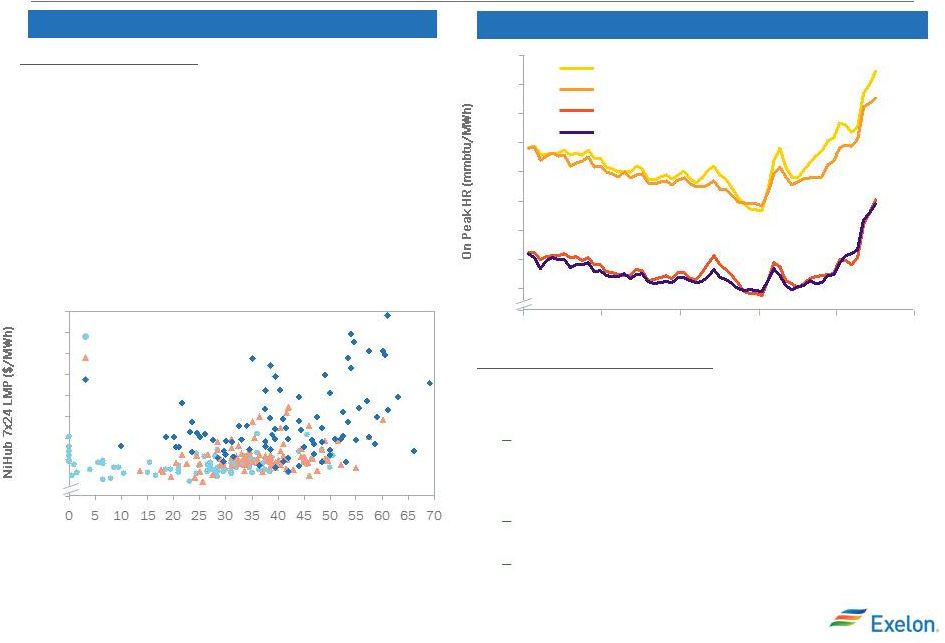 3 Spot and Forward Market Volatility Q1 2014 Saw Increased Volatility Forward Markets Reacted To Spot Prices Impacts on Forward Markets • Forward market power prices and heat rates have pushed higher year to date due to: Higher prices in the spot markets that are now beginning to be reflected in the forward markets as the stack has changed and there is more reliance on non-baseload, higher priced resources Expectation of another 15 GW of coal-fired generation to be retired between now and 2016 PJM Market design changes that are intended to improve price formation and locational marginal pricing (LMP) signals Spot Market Volatility • Spot prices in 2014 have been high and have started to reflect the changing nature of the grid and reliance on different resources such as natural gas supply, demand response, and oil peakers • Seeing higher prices at NiHub in 2014 than previous years for similar load conditions $90 $80 $70 $60 $50 $40 $30 $0 $100 Daily Heating Degree Days (HDD) Q1 2014 Q1 2013 Q1 2012 NiHub LMP per Daily HDD (Days below $100/MWh) 10.0 9.5 10.5 11.0 12.0 13.0 11.5 9.0 0.0 4/1/2014 1/1/2014 10/1/2013 7/1/2013 4/1/2013 12.5 Whub On Peak HR - 2016 Whub On Peak HR - 2015 NiHub On Peak HR - 2015 NiHub On Peak HR - 2016 2014 Sanford C. Bernstein Strategic Decisions Conference |
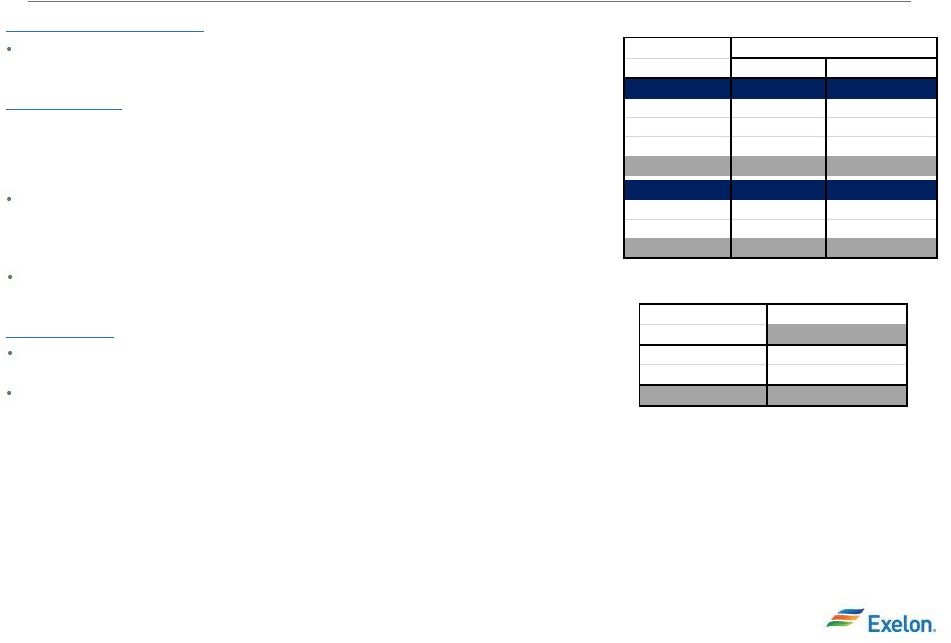
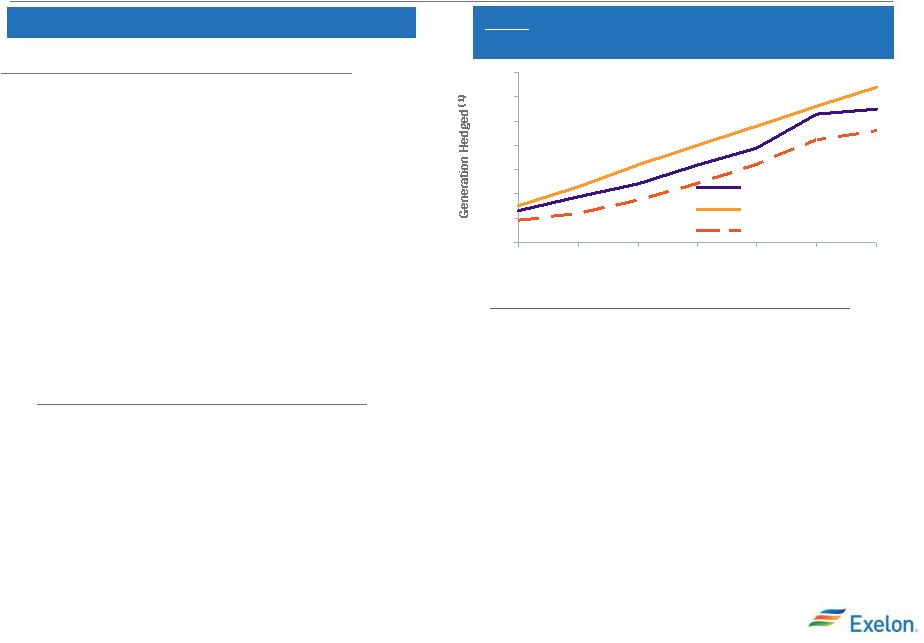 4 Portfolio Value and Positioning Changes to Gross Margin Through 4/30/14 Power prices continued to increase in April • Since the end of Q1 and thru 4/30/2014, power prices in Mid-Atlantic and Midwest regions increased nearly $5.00 per MWh in 2015 and 2016 • Open gross margin increase from this power price move and the removal of DOE nuclear disposal fee (~$150M annually) is over $1B per year for 2015 and 2016 • Net of hedges the hedged gross margin increase is $350M and $600M to $7,800M and $8,000M in 2015 and 2016, respectively, between end of Q1 and 04/30/2014 • Impact of incremental changes in power prices in May on gross margin can be approximated using the updated portfolio sensitivities given below 2015: Open Power Position Creating Value From Higher Prices (1) 2015-Actual (excl NG hedges) 2015-Ratable 2015-Actual 10% 20% 30% 40% 50% 60% 70% 80% 4Q13 3Q13 2Q13 1Q13 4Q12 3Q12 1Q14 Impacts of our view on our hedging activity • With the move higher in forward power prices and market implied heat rates, our behind ratable and cross commodity hedge strategies have created value. • As of 3/31/2014, when considering both strategies, we had a significant amount of our portfolio open to moves in the power market: • Approximately 45% open in 2015 • Approximately 70% open in 2016 Sensitivities (2) ($MM) 2015 2016 NiHub ATC Energy Price +$5/MWh $235 $360 -$5/MWh $(230) $(360) PJM-W ATC Energy Price +$5/MWh $90 $195 -$5/MWh $(85) $(190) 2014 Sanford C. Bernstein Strategic Decisions Conference (2) As of 4/30/2014 (1) As of 3/31/2014 • We are evaluating the latest market moves and the impact on our view of upside in the market. Where the market has increased, we are taking action to lock in the value that has been created from our strategies |
 5 Capacity Markets Better – Opportunity for Improvement New England Auction PJM Auction Higher clearing prices led to higher total revenues year over year, but not enough to clear financially challenged nuclear units Market design and rule changes impacted auction results – Limited product reached constraint of 2,322 MW What’s next? 2014 Sanford C. Bernstein Strategic Decisions Conference • Nuclear Asset Rationalization – continue to work regulatory and stakeholder process to bring reforms • Exelon’s nuclear units Quad Cities (U1 & U2); Byron (U1&U2) and Oyster Creek did not clear the auction • Clearing prices higher but not adequate to provide incentives to keep these clean generation assets operational • Incremental auctions or incremental PJM or local market reforms could provide avenues for incremental capacity revenues for these units • Exelon has committed not to make any retirement decisions about IL plants before June 2015 • IL House has joined effort by introducing resolution (HR1146) that calls for urgent reforms that recognize value of nuclear energy for its reliability and carbon free benefits 2016/2017 2017/2018 PJM Rest of Pool $59 $120 MAAC $119 $120 SWMAAC $119 $120 Average EXC $92 $120 New England NEMA $219 $493 Rest of Pool $90 $230 Average EXC $186 $425 Capacity prices $/MW-Day Capacity market results Financial Implications Planning Year 17/'18 vs '16/'17 PJM $150M New England $250M Total $400M (1) PJM numbers include adjustments for PPA roll-offs (1) ~ ~ ~ In Q1, 17/18 auction cleared much higher than expected indicative of tighter supply/demand after unit retirement announcements Demand response cleared 10,975 MW; ~1,400 MW lower year over year (YoY) Limits on imports into RTO drove imports lower– 4,526 MW cleared; ~3,000 MW lower YoY DR rules: Court opinion raises questions regarding demand response’s Speculation: FERC rejected PJM’s reforms to address speculation, but agreed that PJM has identified a reliability problem. FERC instituted a proceeding to determine the appropriate changes to the PJM tariff (DR) ability to participate as a resource in the future |
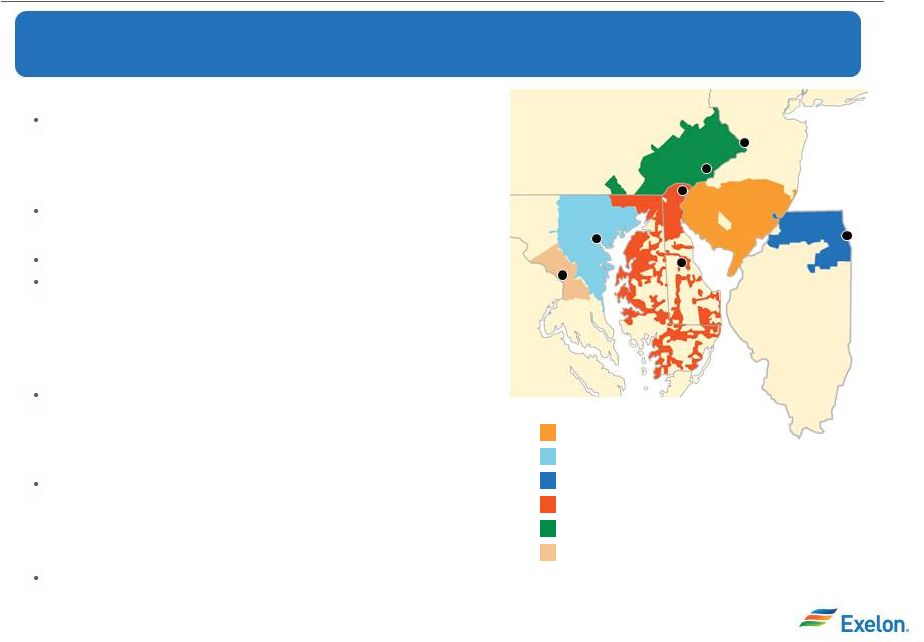 6 Pepco Holdings Acquisition Potomac Electric Power Service Territory Atlantic City Electric Co. Service Territory Delmarva Power & Light Service Territory Baltimore Gas and Electric Co. Service Territory PECO Energy Service Territory ComEd Service Territory IL Chicago DE MD PA NJ VA Philadelphia Baltimore Dover Wilmington Trenton Washington, DC 2014 Sanford C. Bernstein Strategic Decisions Conference On April 30, 2014, Exelon announced the acquisition of Pepco Holdings Inc. in an all cash transaction Strategic Rationale A strategic acquisition with a good geographic fit and economies of scale, creates opportunities for cost savings, improved customer reliability and accelerated storm response. Purchase price of $27.25 per share. Earnings composition supports incremental leverage and is expected to be highly accretive to operating earnings starting in the first full year post-close with steady-state accretion of $0.15-$0.20 per share starting in 2017 Increases Exelon’s utility derived earnings and cash flows, providing a solid base for the dividend and maintaining the upside from a recovery in power markets. Balanced financing mix allows Exelon to maintain balance sheet strength and provides flexibility to continue to invest in opportunities aligned with our growth strategy. The combination of Exelon and Pepco Holdings (PHI) will offer significant benefits to customers. The combined utility businesses will serve nearly 10 million customers, with a rate base of ~$26 billion. |
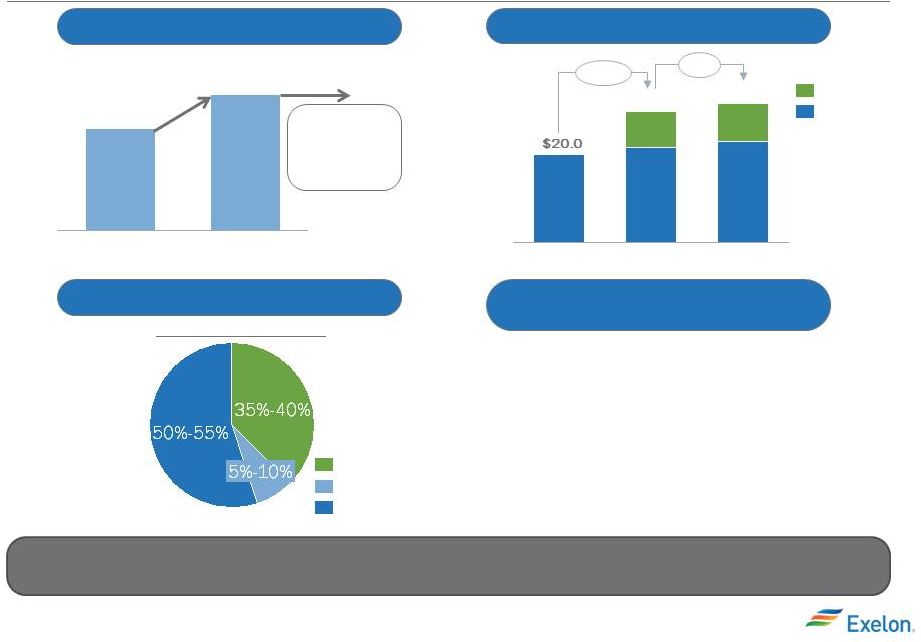 7 Earnings Accretive First Full Year (1) Transaction Economics Provides tangible benefits to the customers and shareholders The transaction is significantly EPS accretive, adds to rate base growth and further strengthens our financials 2015-2016 Operating Earnings (3) Pro Forma Business Mix PHI Unregulated PECO/BGE/ComEd Rate Base Growth ($B) (2) +6% +50% 2016 $31.8 $23.0 $8.8 2015 $30.0 $21.7 $8.3 2014 Exelon PHI 2017 2016 $0.10 - $0.15 $0.15 - $0.20 • Run-rate synergies of roughly $120 - $140 million per year • Expect 60% of synergies to return to ratepayers through rate case process • Expect 40% to flow through to shareholders • $100M customer investment fund for rate credits, low income assistance and energy efficiency programs 2014 Sanford C. Bernstein Strategic Decisions Conference (1) Assumes funding mix of assumed debt, new debt, asset sales and equity issuance with appropriate discount to market price (2) Reflects year end rate base (3) Business mix as of 3/31/14 Achieve run-rate accretion of $0.15-$0.20 starting in 2017 |
 8 Exelon is positioned for a strong future Power Market Upside Balance sheet flexibility Asset Optimization and Rationalization Public policy Advocacy Strong integrated business model Our clean, world class, merchant nuclear fleet has unparalleled upside to the current power market recovery We maintain flexibility in our balance-sheet to allow for incremental regulated and merchant investments We continue to review our asset portfolio and make decisions to optimize the value of each one of them Advocate for policies that strengthen competitive markets, limit subsidies and enhance the value of clean generation. With Pepco Holdings acquisition, we will have an even stronger regulated base of earnings that provides dividend support and potential increase in the future Core Strength Implications and Actions 2014 Sanford C. Bernstein Strategic Decisions Conference Diversification in assets, regions, businesses and keeping abreast of emerging technologies and macro trends in our industry is central to our long term strategy |