Exhibit 99.1
| Thomas J. Hughes Chief Executive Officer Keefe, Bruyette & Woods Securities Brokerage & Market Structure Conference November 30, 2011 |

| Forward-Looking Statements and Non-GAAP Financial Measures This presentation contains "forward-looking statements." These statements are not historical facts but instead represent the Company's belief or plans regarding future events, many of which, by their nature, are inherently uncertain and outside of the Company's control. The Company often, but not always, identifies forward-looking statements by using words or phrases such as "anticipate," "estimate," "plan," "project," "target," "expect," "continuing," "ongoing," "believe" and "intend." The Company's forward-looking statements are based on facts as the Company understands them at the time the Company makes any such statement as well as estimates and judgments based on these facts. The Company's forward-looking statements may turn out to be inaccurate for a variety of reasons, many of which are outside of its control. Factors that could render the Company's forward-looking statements subsequently inaccurate include the conditions of the securities markets, generally, and demand for the Company's services within those markets, the risk of further credit rating downgrades of the U.S. government by major credit rating agencies, the impact of international and domestic sovereign debt uncertainties, the possibilities of localized or global economic recession and other risks and factors identified from time to time in the Company's filings with the Securities and Exchange Commission. Moreover, the Company is implementing a strategic plan designed to improve its operating results, and this plan may not be successful. It is possible that future events will differ materially from those suggested by the Company's forward-looking statements. You are cautioned not to place undue reliance on these forward-looking statements. The Company does not undertake to update any of its forward-looking statements. The Company has included in this presentation certain financial metrics that were not prepared in accordance with accounting principles generally accepted in the United States. These non-GAAP financial measures, which include presentations of net revenues, compensation and benefits, non-compensation expenses, income before income taxes from continuing operations, provision for income taxes, net income from continuing operations, compensation expense ratios, pre-tax margin, diluted earnings per share, tangible stockholders’ equity, tangible book value per share, and return on tangible equity are presented as an additional aid in understanding and analyzing the Company's financial results. Specifically, the Company believes that the non-GAAP measures provide useful information by excluding certain items that may not be indicative of the Company's core operating results or business outlook. These non-GAAP amounts exclude charges incurred in connection with the realignment of its Investment Banking division. Also excluded is the bargain purchase gain related to the ClearPoint acquisition, compensation expenses related primarily to the terminations of former executive officers from the Company, and non-compensation expenses that are non-recurring in nature, including a loss on early extinguishment of mandatorily redeemable preferred stock, lease termination expenses related to the closure of our prior headquarters, and a partial revaluation of an indemnification receivable from former stockholders of Gleacher Partners, Inc. The Company believes these non-GAAP measures will allow for a better evaluation of the operating performance of the business and facilitate a meaningful comparison of the Company's results in the current period to those in prior periods and future periods. References to these non-GAAP measures should not be considered a substitute for results that are presented in a manner consistent with GAAP. A limitation of utilizing these non-GAAP financial measures is that the GAAP accounting effects of these excluded items do in fact reflect the underlying financial results of the Company's business, and these effects should not be ignored in evaluating and analyzing its financial results. Therefore, the Company believes that non-GAAP measures of net revenues, compensation and benefits, non-compensation expenses, income before income taxes from continuing operations, provision for income taxes, net income from continuing operations, compensation and non-compensation expense ratios, pre-tax margin and diluted earnings per share, and the same respective non-GAAP measures of the Company's financial performance, should always be considered together with their corresponding GAAP measures. Reconciliations of non-GAAP financial measures to the corresponding GAAP numbers are included in the Appendix to this presentation and can also be found on the Company’s website at www.gleacher.com. |
| Agenda Company Overview Business Overview New Initiatives Financial Highlights Investment Highlights |
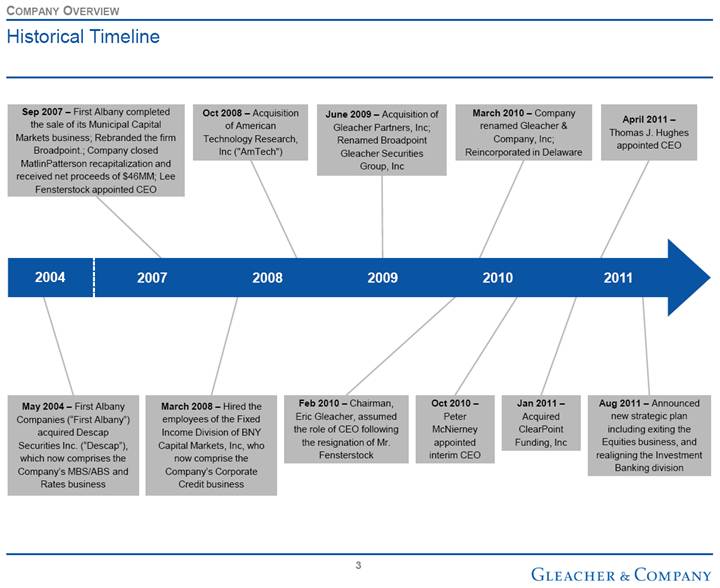
| Historical Timeline Sep 2007 – First Albany completed the sale of its Municipal Capital Markets business; Rebranded the firm Broadpoint.; Company closed MatlinPatterson recapitalization and received net proceeds of $46MM; Lee Fensterstock appointed CEO March 2008 – Hired the employees of the Fixed Income Division of BNY Capital Markets, Inc, who now comprise the Company’s Corporate Credit business June 2009 – Acquisition of Gleacher Partners, Inc; Renamed Broadpoint Gleacher Securities Group, Inc Feb 2010 – Chairman, Eric Gleacher, assumed the role of CEO following the resignation of Mr. Fensterstock March 2010 – Company renamed Gleacher & Company, Inc; Reincorporated in Delaware Jan 2011 – Acquired ClearPoint Funding, Inc April 2011 – Thomas J. Hughes appointed CEO Aug 2011 – Announced new strategic plan including exiting the Equities business, and realigning the Investment Banking division Oct 2008 – Acquisition of American Technology Research, Inc ("AmTech") May 2004 – First Albany Companies (“First Albany”) acquired Descap Securities Inc. (“Descap”), which now comprises the Company’s MBS/ABS and Rates business Oct 2010 – Peter McNierney appointed interim CEO 2007 2009 2011 2008 2004 2010 COMPANY OVERVIEW |
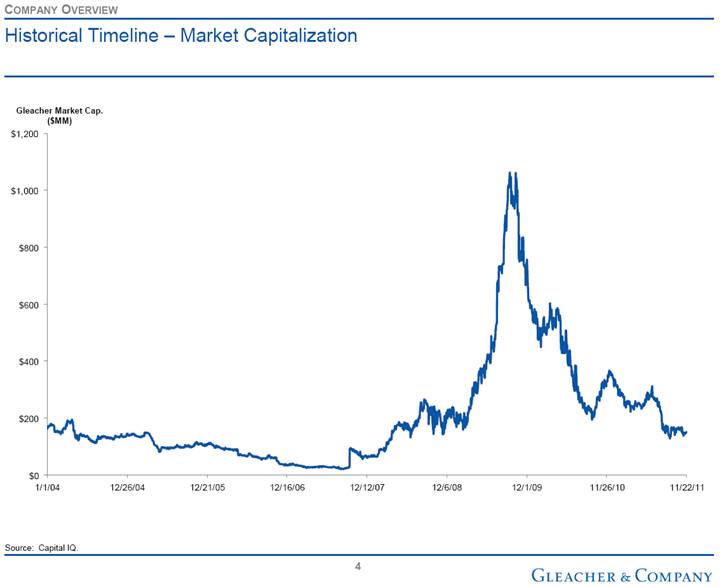
| Historical Timeline – Market Capitalization COMPANY OVERVIEW Source: Capital IQ. Gleacher Market Cap. ($MM) $0 $200 $400 $600 $800 $1,000 $1,200 1/1/04 12/26/04 12/21/05 12/16/06 12/12/07 12/6/08 12/1/09 11/26/10 11/22/11 |
| Current Business Units and Product Offerings Gleacher & Company MBS / ABS & Rates ClearPoint Funding Investment Banking Aerospace and Defense General Industrials Real Estate Technology, Media and Telecom Targeted New Verticals: Consumer Financial Institutions Group Financial Sponsors Corporate Credit High Yield / Distressed Investment Grade / Preferred, Crossover Bank Debt Convertibles Emerging Markets Reorganization Equity Single Stock Futures Under Consideration: European Operations MBS / ABS Repo Rates Group Structured Products Coverage Conforming Loan Origination Non-Conforming Loan Origination Under Consideration: Closed Loan Purchasing Loan Servicing COMPANY OVERVIEW Retail Origination |
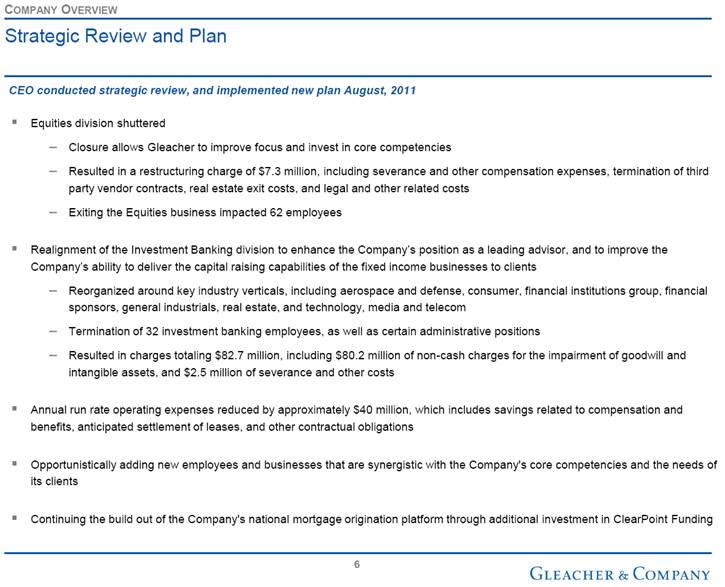
| Equities division shuttered Closure allows Gleacher to improve focus and invest in core competencies Resulted in a restructuring charge of $7.3 million, including severance and other compensation expenses, termination of third party vendor contracts, real estate exit costs, and legal and other related costs Exiting the Equities business impacted 62 employees Realignment of the Investment Banking division to enhance the Company’s position as a leading advisor, and to improve the Company’s ability to deliver the capital raising capabilities of the fixed income businesses to clients Reorganized around key industry verticals, including aerospace and defense, consumer, financial institutions group, financial sponsors, general industrials, real estate, and technology, media and telecom Termination of 32 investment banking employees, as well as certain administrative positions Resulted in charges totaling $82.7 million, including $80.2 million of non-cash charges for the impairment of goodwill and intangible assets, and $2.5 million of severance and other costs Annual run rate operating expenses reduced by approximately $40 million, which includes savings related to compensation and benefits, anticipated settlement of leases, and other contractual obligations Opportunistically adding new employees and businesses that are synergistic with the Company's core competencies and the needs of its clients Continuing the build out of the Company's national mortgage origination platform through additional investment in ClearPoint Funding Strategic Review and Plan CEO conducted strategic review, and implemented new plan August, 2011 COMPANY OVERVIEW |
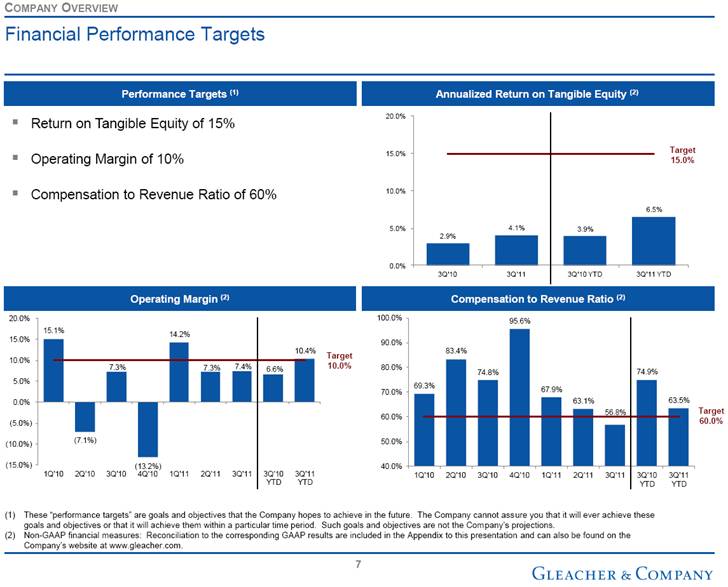
| Return on Tangible Equity of 15% Operating Margin of 10% Compensation to Revenue Ratio of 60% Financial Performance Targets Annualized Return on Tangible Equity (2) Operating Margin (2) Compensation to Revenue Ratio (2) Target 60.0% Target 10.0% Performance Targets (1) Target 15.0% These “performance targets” are goals and objectives that the Company hopes to achieve in the future. The Company cannot assure you that it will ever achieve these goals and objectives or that it will achieve them within a particular time period. Such goals and objectives are not the Company’s projections. Non-GAAP financial measures: Reconciliation to the corresponding GAAP results are included in the Appendix to this presentation and can also be found on the Company’s website at www.gleacher.com. COMPANY OVERVIEW 15.1% (7.1%) 7.3% (13.2%) 14.2% 7.3% 7.4% 6.6% 10.4% (15.0%) (10.0%) (5.0%) 0.0% 5.0% 10.0% 15.0% 20.0% 1Q'10 2Q'10 3Q'10 4Q'10 1Q'11 2Q'11 3Q'11 3Q'10 YTD 3Q'11 YTD 2.9% 4.1% 3.9% 6.5% 0.0% 5.0% 10.0% 15.0% 20.0% 3Q'10 3Q'11 3Q'10 YTD 3Q'11 YTD 69.3% 83.4% 74.8% 95.6% 67.9% 63.1% 56.8% 74.9% 63.5% 40.0% 50.0% 60.0% 70.0% 80.0% 90.0% 100.0% 1Q'10 2Q'10 3Q'10 4Q'10 1Q'11 2Q'11 3Q'11 3Q'10 YTD 3Q'11 YTD (1) (2) |
| Financial Highlights by Segment Net Revenue ($MM) (1) Pre-Tax Contribution ($MM) (1) Annualized Net Revenue per Employee ($000s) (1)(4) Compensation to Net Revenue Ratio (1) (1) (2) (3) (4) (5) (6) Excludes the results of the Equities division which is reported as discontinued operations. 3Q’10 YTD 3Q’11 YTD ClearPoint was not acquired until January 2011. Non-GAAP financial measure: Excludes $1.9MM of compensation expense and $0.3MM of non-compensation expense related to the Investment Banking division realignment in 3Q ’11. Calculated as annualized net revenues divided by the average number of employees in each division. Non-GAAP financial measure: Excludes the net revenues and employees of ClearPoint. Includes employees and annualized net revenues not allocated to the reportable segments which are aggregated under the caption “Other” within the Company’s footnote titled “Segment Analysis” contained within Item 1 of the respective Quarterly report on Form 10-Q. Net revenues for 3Q ’11 YTD were adjusted to remove the $2.3MM ClearPoint bargain purchase gain. Non-GAAP financial measure: Reconciliation to the corresponding GAAP results are included in the Appendix to this presentation and can also be found on the Company’s website at www.gleacher.com. (2) (2) (2) (2) BUSINESS OVERVIEW (3) (3) (5) (6) $715 $1,518 $862 -- $831 $803 $1,543 $684 $285 $806 $0 $200 $400 $600 $800 $1,000 $1,200 $1,400 $1,600 $1,800 Investment Banking MBS/ABS & Rates Corp. Credit ClearPoint Total $33.8 $85.0 $62.1 -- $29.7 $85.6 $48.5 $26.1 $0.0 $10.0 $20.0 $30.0 $40.0 $50.0 $60.0 $70.0 $80.0 $90.0 Investment Banking MBS/ABS & Rates Corp. Credit ClearPoint 56.6% 57.4% 84.0% -- 74.9% 54.3% 57.7% 77.8% 35.7% 63.5% 0.0% 10.0% 20.0% 30.0% 40.0% 50.0% 60.0% 70.0% 80.0% 90.0% Investment Banking MBS/ABS & Rates Corp. Credit ClearPoint Total $9.4 $28.8 $4.4 -- $8.5 $28.1 $5.1 ($2.9) ($5.0) $0.0 $5.0 $10.0 $15.0 $20.0 $25.0 $30.0 $35.0 Investment Banking MBS/ABS & Rates Corp. Credit ClearPoint |

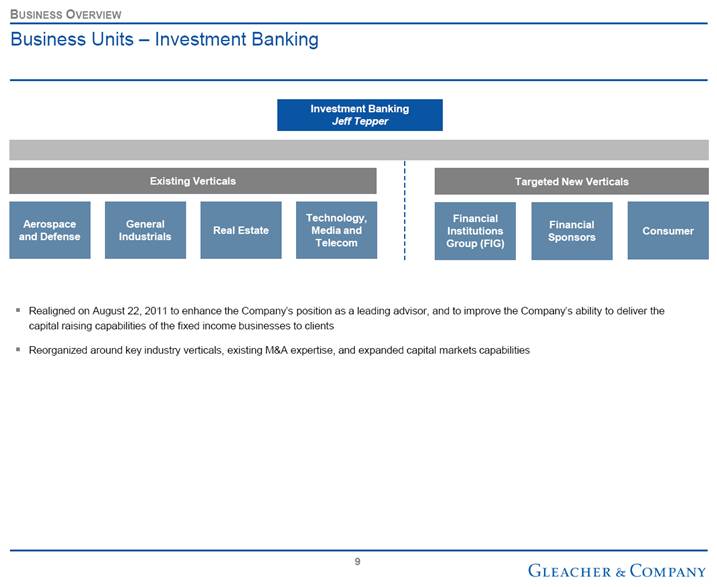
| Business Units – Investment Banking Technology, Media and Telecom Investment Banking Jeff Tepper Financial Institutions Group (FIG) Financial Sponsors Aerospace and Defense General Industrials Real Estate Existing Verticals Targeted New Verticals Consumer Realigned on August 22, 2011 to enhance the Company’s position as a leading advisor, and to improve the Company’s ability to deliver the capital raising capabilities of the fixed income businesses to clients Reorganized around key industry verticals, existing M&A expertise, and expanded capital markets capabilities BUSINESS OVERVIEW |
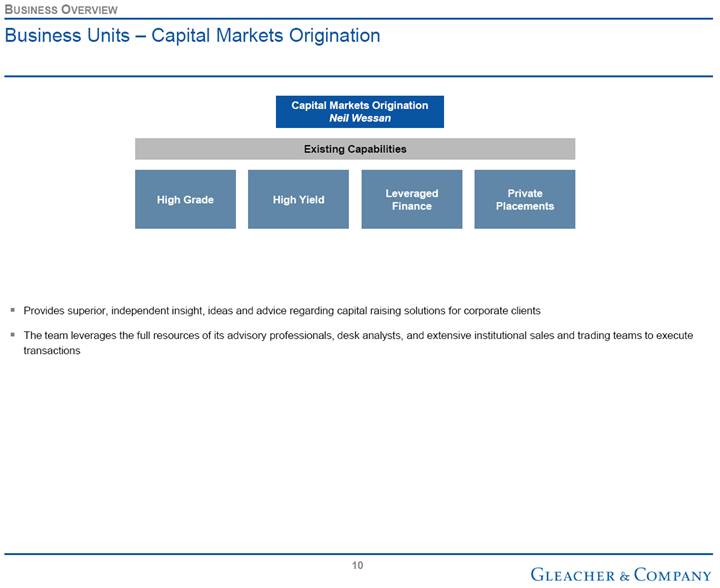
| Business Units – Capital Markets Origination Existing Capabilities Private Placements Capital Markets Origination Neil Wessan High Grade High Yield Leveraged Finance Provides superior, independent insight, ideas and advice regarding capital raising solutions for corporate clients The team leverages the full resources of its advisory professionals, desk analysts, and extensive institutional sales and trading teams to execute transactions BUSINESS OVERVIEW |
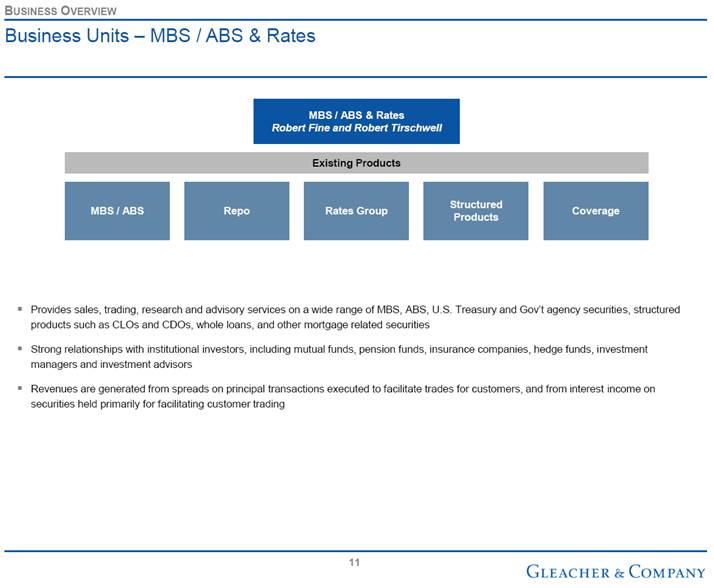
| Business Units – MBS / ABS & Rates MBS / ABS & Rates Robert Fine and Robert Tirschwell MBS / ABS Repo Rates Group Coverage Existing Products Structured Products Provides sales, trading, research and advisory services on a wide range of MBS, ABS, U.S. Treasury and Gov’t agency securities, structured products such as CLOs and CDOs, whole loans, and other mortgage related securities Strong relationships with institutional investors, including mutual funds, pension funds, insurance companies, hedge funds, investment managers and investment advisors Revenues are generated from spreads on principal transactions executed to facilitate trades for customers, and from interest income on securities held primarily for facilitating customer trading BUSINESS OVERVIEW |
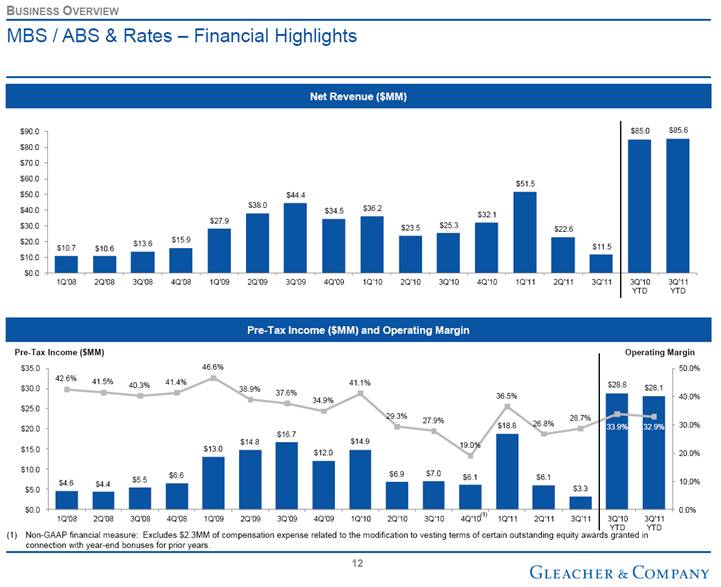
| MBS / ABS & Rates – Financial Highlights BUSINESS OVERVIEW Net Revenue ($MM) Pre-Tax Income ($MM) and Operating Margin Pre-Tax Income ($MM) Operating Margin (1) Non-GAAP financial measure: Excludes $2.3MM of compensation expense related to the modification to vesting terms of certain outstanding equity awards granted in connection with year-end bonuses for prior years. (1) $4.6 $4.4 $5.5 $6.6 $13.0 $14.8 $16.7 $12.0 $14.9 $6.9 $7.0 $6.1 $18.8 $6.1 $3.3 $28.8 $28.1 42.6% 41.5% 40.3% 41.4% 46.6% 38.9% 37.6% 34.9% 41.1% 29.3% 27.9% 19.0% 36.5% 26.8% 28.7% 33.9% 32.9% 0.0% 10.0% 20.0% 30.0% 40.0% 50.0% $0.0 $5.0 $10.0 $15.0 $20.0 $25.0 $30.0 $35.0 1Q'08 2Q'08 3Q'08 4Q'08 1Q'09 2Q'09 3Q'09 4Q'09 1Q'10 2Q'10 3Q'10 4Q'10 1Q'11 2Q'11 3Q'11 3Q'10 YTD 3Q'11 YTD $10.7 $10.6 $13.6 $15.9 $27.9 $38.0 $44.4 $34.5 $36.2 $23.5 $25.3 $32.1 $51.5 $22.6 $11.5 $85.0 $85.6 $0.0 $10.0 $20.0 $30.0 $40.0 $50.0 $60.0 $70.0 $80.0 $90.0 1Q'08 2Q'08 3Q'08 4Q'08 1Q'09 2Q'09 3Q'09 4Q'09 1Q'10 2Q'10 3Q'10 4Q'10 1Q'11 2Q'11 3Q'11 3Q'10 YTD 3Q'11 YTD |
| Business Units – Corporate Credit Corporate Credit Joseph Mannello High Yield / Distressed Investment Grade / Preferred Bank Debt Reorganization Equity Emerging Markets Existing Products Converts Crossover Single Stock Futures European Operations New Products / Initiatives Recently Added Under Consideration Provides analysis and sales and trading coverage for a wide range of debt securities and reorganization equities to corporate and institutional investor clients, and provides trade execution services, liability management, corporate debt repurchase programs and new issue distribution Revenues are generated primarily from spreads on riskless principal transactions, as well as commissions on trades executed on behalf of clients BUSINESS OVERVIEW |

| Business Units – ClearPoint Funding ClearPoint Funding Mark Pappas Origination Loan Servicing Closed Loan Purchase Existing Product New Products Conforming Loans Non-Conforming Loans Under Consideration Primary Products Originates, processes and underwrites single and multi-family residential mortgage loans in 41 states Loans are underwritten using standards prescribed by conventional mortgage lenders and loan buyers such as the FNMA and FHLMC Revenues are generated primarily from the sale of the residential mortgage loans with servicing released BUSINESS OVERVIEW Retail Origination |
| Asset Management Establishing an Asset Management business will serve to: Diversify and add stability to Gleacher’s revenue streams, and therefore enhance trading multiples Provide balance sheet for Investment Banking pursuits, including ability to invest in each layer of a client’s capital structure Allow Gleacher to serve Investment Banking clients and Fixed Income customers with additional products, including important problem solving resources Create potential for compelling investment gains using firm capital Benefit from deal flow generated by other segments Provide access to other funds in the Asset Management space and extend the Company’s tentacles Add potential compensation tool for employees There are currently four targeted fund types under consideration: Leveraged Loan Merchant Banking Real Estate Fund of Funds An Asset Management platform is synergistic with Gleacher & Company’s business pursuits. The platform will enhance institutional intelligence, and add new sources of deal flow NEW INITIATIVES |
| Non-GAAP Financial Results ($ in thousands, except per share data) (1) Non-GAAP financial measures: Reconciliation to the corresponding GAAP numbers are included in the Appendix to this presentation and can also be found on the Company’s website at www.gleacher.com. FINANCIAL HIGHLIGHTS Three Months Ended Nine Months Ended September 30, September 30, 2010 2011 2010 2011 Net revenues: MBS/ABS & Rates $25,288 $11,456 $84,995 $85,631 Corporate Credit 20,911 15,695 62,085 48,546 Investment Banking 11,765 9,359 33,779 29,724 ClearPoint 0 12,743 0 26,109 Other (1) 1,900 4,911 2,337 7,592 Total net revenue (1) $59,864 $54,164 $183,196 $197,602 Non-interest expenses: Compensation and benefits (1) $44,801 $30,738 $137,165 $125,426 Non-compensation expenses (1) 10,719 19,423 33,876 51,672 Total non-interest expense (1) $55,520 $50,161 $171,041 $177,098 Pre-tax income from continuing operations (1) $4,344 $4,003 $12,155 $20,504 Provision for income taxes (1) 3,171 1,826 7,351 10,136 Net income from continuing operations (1) $1,173 $2,177 $4,804 $10,368 Earnings per share: Diluted — continuing operations (1) $0.01 $0.02 $0.04 $0.08 As a percentage of net revenues: Compensation and benefits (1) 74.8% 56.8% 74.9% 63.5% Pre-tax income from continuing operations (1) 7.3% 7.4% 6.6% 10.4% |
| Net Revenue Composition Non-GAAP financial measure: Excludes $2.3MM bargain purchase gain related to the ClearPoint acquisition. FINANCIAL HIGHLIGHTS (1) 3Q'10 3Q'11 1Q'10 2Q'10 3Q'10 4Q'10 1Q'11 2Q'11 3Q'11 YTD YTD Commissions 0.5% 1.3% 0.2% 0.8% 0.4% 0.5% 0.4% 0.6% 0.4% Principal Transactions 62.1% 67.8% 59.3% 60.8% 72.9% 57.7% 47.1% 62.7% 61.5% Investment Banking 20.1% 14.1% 19.8% 17.8% 11.8% 17.7% 17.3% 18.4% 15.0% Investment Gains / (Losses) 0.2% (3.4%) 1.6% 0.8% (0.8%) 0.7% 5.3% (0.3%) 1.3% Fees & Other 0.1% 0.5% 0.4% 0.7% 1.3% (1) 2.4% 4.8% 0.3% 2.6% Net Interest Income 17.0% 19.7% 18.7% 19.1% 14.4% 21.0% 25.1% 18.3% 19.2% |
| Well Capitalized, Clean Balance Sheet $239.6(1) million tangible equity ($1.88 per share)(2), as of September 30, 2011 Write off of $80.2 million of Investment Banking goodwill and intangible assets in 3Q’11 $1.7 billion of highly liquid financial instruments (72% of total assets) as of September 30, 2011 Maintained primarily for customer facilitation Predominantly high credit quality and highly liquid Market risks adequately hedged with short TBAs No direct European sovereign debt exposure Modest leverage – assets to stockholders’ equity ratio of 9.0x No long-term debt Financing sources include clearing broker (primary source) and repo financing Approximately $15 million of the $25 million 10b-18 stock repurchase program remaining as of September 30, 2011 Recently completed Company self tender offer Financial Instruments by Type 9/30/11 Total Investments of $1.7BN FINANCIAL HIGHLIGHTS (1) Non-GAAP financial measures: Stockholders’ equity of $265.1MM reduced by $25.5MM of goodwill and intangible assets. (2) Non-GAAP financial measures: Tangible equity of $239.6MM divided by 127.5MM shares outstanding. Agency MBS 85%(3) US Gov't and Agency Oblig. 8% CMBS / RMBS 4% Other 3% (3) Includes loans originated by ClearPoint (6% of 9/30/11 total investments). |
| Investment Highlights Independent, full-service investment bank Compelling strategic plan Powerful fixed income sales and distribution World-class M&A capabilities Liquid, low-risk balance sheet Well-capitalized platform positioned for market share gains and stockholder return INVESTMENT HIGHLIGHTS |
| Appendix |

| Reconciliation of GAAP to Non-GAAP Financial Measures ($ in thousands, except per share data) Represents the bargain purchase gain related to the ClearPoint acquisition in the first quarter of 2011. Represents severance and stock-based compensation expense related to the Investment Banking realignment which resulted in the termination of 32 Investment Banking employees and certain administrative positions. Includes the previously mentioned $1.9MM noted in the three months ended September 30, 2011 and also includes $1.7MM due to the resignation of the former interim CEO in the second quarter of 2011. Includes goodwill and intangible impairment charges of $80.2MM and other non-compensation expenses of $0.6MM as a result of the Investment Banking realignment. The effective income tax rate of 45.6% differs from the federal statutory rate of 35% primarily due to state and local taxes. The effective income tax rate of 49.4% differs from the federal statutory rate of 35% primarily due to state and local taxes and a re-measurement of net deferred tax assets due to a change in estimate of the Company's apportioned statutory income tax rate. Non-GAAP net income divided by 129.6MM dilutive shares. Non-GAAP net income divided by 130.0MM dilutive shares. APPENDIX Three Months Ended Nine Months Ended September 30, 2011 September 30, 2011 Special Non- Special Non- GAAP Charges GAAP GAAP Charges GAAP Net Revenues $54,164 $54,164 $199,932 ($2,330) $197,602 Non-interest expenses: Compensation and benefits $32,684 ($1,946) $30,738 $129,058 ($3,632) $125,426 Non-compensation expenses 100,265 (80,842) 19,423 132,514 (80,842) 51,672 Total non-interest expense $132,949 ($82,788) $50,161 $261,572 ($84,474) $177,098 Pre-tax (loss) / income from continuing operations ($78,785) $82,788 $4,003 ($61,640) $82,144 $20,504 Provision for income taxes (3,085) 4,911 1,826 4,208 5,928 10,136 Net (loss) / income from continuing operations ($75,700) $77,877 $2,177 ($65,848) $76,216 $10,368 Earnings per share: Diluted — continuing operations ($0.61) $0.02 ($0.53) $0.08 As a percentage of net revenues: Compensation and benefits 60.3% 56.8% 64.6% 63.5% Pre-tax (loss) / income from continuing operations (145.5%) 7.4% (30.8%) 10.4% (1) (2) (3) (4) (4) (5) (6) (7 ) (8) (1) (2) (3) (4) (5) (6) (7 ) (8) |
| Reconciliation of GAAP to Non-GAAP Financial Measures (cont’d) ($ in thousands, except per share data) Represents $2.3MM related to the modification of a senior executive's unvested share based compensation awards. Includes the previously mentioned $2.3MM in the three months ended September 30, 2010 and also includes $13.3MM of severance expense related to the separations of our former CEO and former CFO from the Company recorded in the first quarter of 2010. Special charges of $2.4MM includes (i) $1.6MM loss on the extinguishment of the mandatorily redeemable preferred stock and (ii) $0.8MM related to the partial revaluation of an indemnification receivable from the former stockholders of Gleacher Partners, Inc. in connection with pre-acquisition tax liabilities. Includes the previously mentioned $2.4MM in the three months ended September 30, 2010 and also includes $3.2MM of occupancy expense related to the Company's lease termination of its prior headquarters. The effective income tax rate of 73.0% differs from the federal statutory rate of 35% primarily due to non-deductible mandatorily redeemable preferred stock dividends, a change in estimate of the Company's apportioned statutory income tax rate and state and local taxes. The effective income tax rate of 60.5% differs from the federal statutory rate of 35% primarily due to non-deductible mandatorily redeemable preferred stock dividends and state and local taxes. Non-GAAP net income divided by 127.9MM dilutive shares. Non-GAAP net income divided by 127.3MM dilutive shares. APPENDIX Three Months Ended Nine Months Ended September 30, 2010 September 30, 2010 Special Non- Special Non- GAAP Charges GAAP GAAP Charges GAAP Net Revenues $59,864 $59,864 $183,196 $183,196 Non-interest expenses: Compensation and benefits $47,057 ($2,256) $44,801 $152,727 ($15,562) $137,165 Non-compensation expenses 13,139 (2,420) 10,719 39,486 (5,610) 33,876 Total non-interest expense $60,196 ($4,676) $55,520 $192,213 ($21,172) $171,041 Pre-tax (loss) / income from continuing operations ($332) $4,676 $4,344 ($9,017) $21,172 $12,155 Provision for income taxes 1,312 1,859 3,171 (2,144) 9,495 7,351 Net (loss) / income from continuing operations ($1,644) $2,817 $1,173 ($6,873) $11,677 $4,804 Earnings per share: Diluted — continuing operations ($0.01) $0.01 ($0.06) $0.04 As a percentage of net revenues: Compensation and benefits 78.6% 74.8% 83.4% 74.9% Pre-tax (loss) / income from continuing operations (0.6%) 7.3% (4.9%) 6.6% (1) (2) (4) (3) (5) (6) (7) (8) (1) (2) (4) (3) (5) (6) (7) (8) |
| Reconciliation of GAAP to Non-GAAP Financial Measures (cont’d) ($ in thousands) APPENDIX Note: Excludes the results of the Equities division which is reported as discontinued operations. 3Q'11 1Q'11 2Q'11 3Q'11 YTD Net revenues (GAAP) $89,389 $56,379 $54,164 $199,932 Non-GAAP adjustments: Bargain purchase gain related to the ClearPoint acquisition (2,330) -- -- (2,330) Net revenues (non-GAAP) 87,059 56,379 54,164 197,602 Compensation expense (GAAP) 59,088 37,286 32,684 129,058 Non-GAAP adjustments: Severance expense related to the departure of the former interim CEO -- (1,685) -- (1,685) Severance and stock-based compensation expense related to the Investment Banking division realignment -- -- (1,946) (1,946) Compensation expense (non-GAAP) 59,088 35,601 30,738 125,426 Non-compensation expense (GAAP) 15,575 16,676 100,265 132,514 Non-GAAP adjustments Impairment of goodwill and intangible assets as a result of the Investment Banking division realignment -- -- (80,243) (80,243) Other expenses as a result of the Investment Banking division realignment -- -- (599) (599) Non-compensation expense (non-GAAP) 15,575 16,676 19,423 51,672 Pre-tax income from continuing operations (non-GAAP) $12,396 $4,102 $4,003 $20,504 Compensation to revenue ratio (non-GAAP) 67.9% 63.1% 56.8% 63.5% Operating margin (non-GAAP) 14.2% 7.3% 7.4% 10.4% |
| Reconciliation of GAAP to Non-GAAP Financial Measures (cont’d) ($ in thousands) APPENDIX Note: Excludes the results of the Equities division which is reported as discontinued operations. (1) Represents the partial revaluation of an indemnification receivable from the former shareholders of Gleacher Partners, Inc. in connection with certain pre-acquisition tax liabilities. This is offset within the income tax provision. 3Q'10 1Q'10 2Q'10 3Q'10 YTD 4Q'10 Net revenues (GAAP) $74,617 $48,716 $59,864 $183,196 $65,385 Compensation expense (GAAP) 65,043 40,627 47,057 152,727 70,108 Non-GAAP adjustments: Severance expense related to the separations of the former CEO and former CFO from the Company (13,306) -- -- (13,306) -- Modification of a senior executive's unvested stock-based compensation awards -- -- (2,256) (2,256) -- Modification to vesting terms of certain outstanding equity awards granted in connection with year-end bonuses for prior years -- -- -- -- (5,715) Restructuring of an employment arrangement -- -- -- -- (1,907) Compensation expense (non-GAAP) 51,737 40,627 44,801 137,165 62,486 Non-compensation expense (GAAP) 11,620 14,727 13,139 39,486 12,045 Non-GAAP adjustments Occupancy expense related to lease terminations associated with the consolidation of certain of the Company's offices -- (3,190) -- (3,190) (668) Loss on extinguishment of mandatorily redeemable preferred stock -- -- (1,608) (1,608) -- Indemnification receivable (1) -- -- (812) (812) 147 Non-compensation expense (non-GAAP) 11,620 11,537 10,719 33,876 11,524 Pre-tax income/(loss) from continuing operations (non-GAAP) $11,260 ($3,448) $4,344 $12,155 ($8,625) Compensation to revenue ratio (non-GAAP) 69.3% 83.4% 74.8% 74.9% 95.6% Operating margin (non-GAAP) 15.1% (7.1%) 7.3% 6.6% (13.2%) |
| Reconciliation of GAAP to Non-GAAP Financial Measures (cont’d) ($ in thousands) APPENDIX (1) Refer to slides 22 and 23 for reconciliation of GAAP to non-GAAP net income from continuing operations. 3Q'10 3Q'11 3Q'10 3Q'11 YTD YTD Return on tangible equity (non-GAAP) Net income from continuing operations (non-GAAP) (1) $1,173 $2,177 $4,804 $10,368 Plus: Amortization of intangibles, net of tax 495 255 1,656 1,126 Net income from continuing operations, adjusted (non-GAAP) 1,668 2,432 6,460 11,494 Net income from continuing operations, adjusted (non-GAAP) - annualized 6,671 9,729 8,614 15,326 Average total stockholders' equity 349,047 304,642 344,335 328,110 Less: Average intangibles (122,864) (65,877) (123,753) (93,570) Average tangible stockholders equity $226,184 $238,765 $220,582 $234,540 Annualized return on tangible equity (non-GAAP) 2.9% 4.1% 3.9% 6.5% |
| [LOGO] |