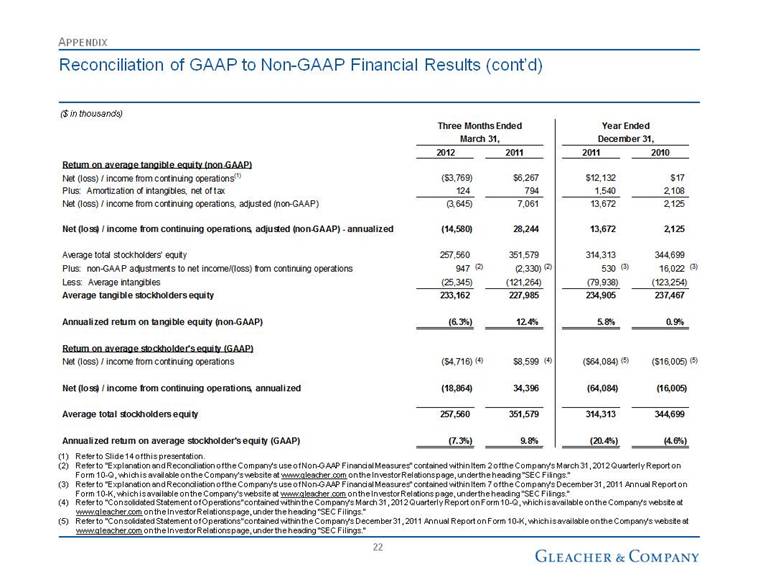
| Reconciliation of GAAP to Non-GAAP Financial Results (cont’d) ($ in thousands) APPENDIX Refer to Slide 14 of this presentation. Refer to “Explanation and Reconciliation of the Company’s use of Non-GAAP Financial Measures” contained within Item 2 of the Company’s March 31, 2012 Quarterly Report on Form 10-Q, which is available on the Company’s website at www.gleacher.com on the Investor Relations page, under the heading “SEC Filings.” Refer to “Explanation and Reconciliation of the Company’s use of Non-GAAP Financial Measures” contained within Item 7 of the Company’s December 31, 2011 Annual Report on Form 10-K, which is available on the Company’s website at www.gleacher.com on the Investor Relations page, under the heading “SEC Filings.” Refer to “Consolidated Statement of Operations” contained within the Company’s March 31, 2012 Quarterly Report on Form 10-Q, which is available on the Company’s website at www.gleacher.com on the Investor Relations page, under the heading “SEC Filings.” Refer to “Consolidated Statement of Operations” contained within the Company’s December 31, 2011 Annual Report on Form 10-K, which is available on the Company’s website at www.gleacher.com on the Investor Relations page, under the heading “SEC Filings.” Three Months Ended Year Ended March 31, December 31, 2012 2011 2011 2010 Return on average tangible equity (non-GAAP) Net (loss) / income from continuing operations (1) ($3,769) $6,267 $12,132 $17 Plus: Amortization of intangibles, net of tax 124 794 1,540 2,108 Net (loss) / income from continuing operations, adjusted (non-GAAP) (3,645) 7,061 13,672 2,125 Net (loss) / income from continuing operations, adjusted (non-GAAP) - annualized (14,580) 28,244 13,672 2,125 Average total stockholders' equity 257,560 351,579 314,313 344,699 Plus: non-GAAP adjustments to net income/(loss) from continuing operations 947 (2) (2,330) (2) 530 (3) 16,022 (3) Less: Average intangibles (25,345) (121,264) (79,938) (123,254) Average tangible stockholders equity 233,162 227,985 234,905 237,467 Annualized return on tangible equity (non-GAAP) (6.3%) 12.4% 5.8% 0.9% Return on average stockholder's equity (GAAP) Net (loss) / income from continuing operations ($4,716) (4) $8,599 (4) ($64,084) (5) ($16,005) (5) Net (loss) / income from continuing operations, annualized (18,864) 34,396 (64,084) (16,005) Average total stockholders equity 257,560 351,579 314,313 344,699 Annualized return on average stockholder's equity (GAAP) (7.3%) 9.8% (20.4%) (4.6%) |