
B of A Securities 2020 Global Real Estate Conference September 16, 2020

Forward-Looking Statement This slide presentation contains statements that constitute “forward-looking statements” within the meaning of the Securities Act of 1933 and the Securities Exchange Act of 1934 as amended by the Private Securities Litigation Reform Act of 1995. These forward-looking statements include, among others, our statements regarding (1) strategic initiatives with respect to our assets, operations and capital and (2) the assumptions underlying our expectations. Prospective investors are cautioned that any such forward-looking statements are not guarantees of future performance and involve risks and uncertainties, and that actual results may differ materially from those contemplated by such forward-looking statements. A number of important factors could cause actual results to differ materially from those contemplated by forward- looking statements in this slide presentation. Many of these factors are beyond our ability to control or predict. Factors that could cause actual results to differ materially from those contemplated in this slide presentation include the factors set forth in our filings with the Securities and Exchange Commission, including our annual report on Form10-K, quarterly reports on Form 10-Q and current reports on Form 8-K. We believe these forward-looking statements are reasonable, however, undue reliance should not be placed on any forward-looking statements, which are based on current expectations. We do not assume any obligation to update any forward-looking statements as a result of new information or future developments or otherwise. Certain of the financial measures appearing in this slide presentation are or may be considered to be non-GAAP financial measures. Management believes that these non-GAAP financial measures provide additional appropriate measures of our operating results. While we believe these non-GAAP financial measures are useful in evaluating our company, the information should be considered supplemental in nature and not a substitute for the information prepared in accordance with GAAP. We have provided for your reference supplemental financial disclosure for these measures, including the most directly comparable GAAP measure and an associated reconciliation in the appendix to this presentation as well as in our most recent quarter supplemental report and earnings release, the latter two of which are available on our website at www.dukerealty.com. Our most recent quarter supplemental report also includes the information necessary to recalculate certain operational ratios and ratios of financial position. The calculation of these non-GAAP measures may differ from the methodology used by other REITs, and therefore, may not be comparable. LEED® – an acronym for “Leadership in Energy and Environmental Design “ – is a registered trademark of the U.S. Green Building Council”. 2
Contents Who We Are | U.S. Logistics Strategy 4 Recession Resilient Portfolio | Relative Value 6 Supply and Demand Fundamentals 12 Key Net Operating Income Drivers 17 Logistics Asset Strategy 20 Development Strategy 26 Liquidity and Capital Strategy 29 Corporate Responsibility 35 Why Duke Realty & Guidance 39 Appendix: Infill Development Case Studies 42 TABLE OF CONTENTS 3
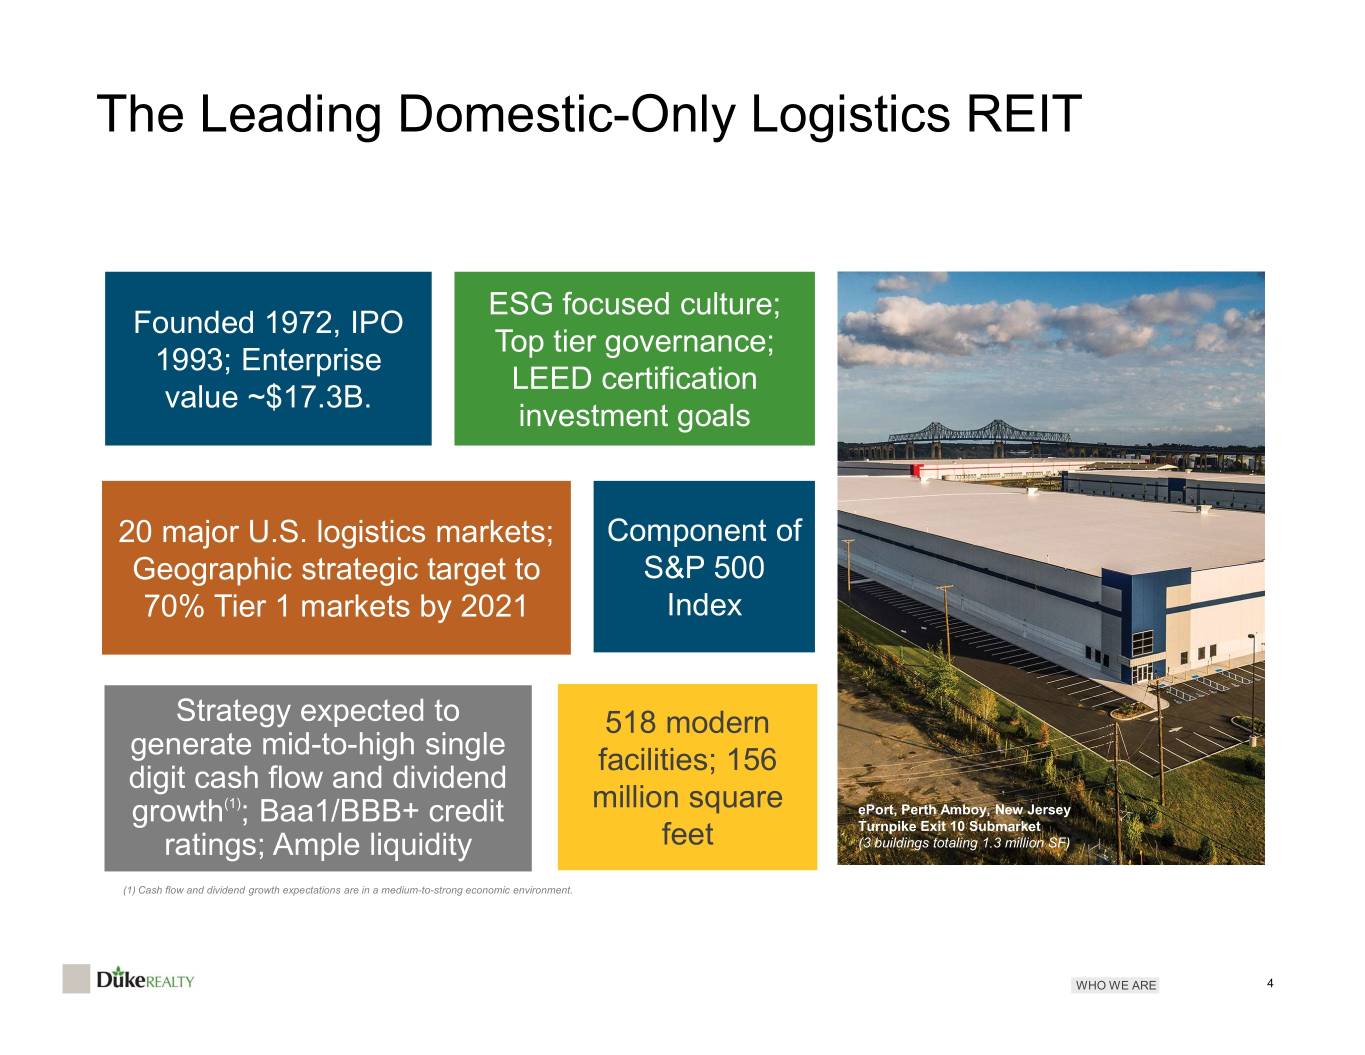
The Leading Domestic-Only Logistics REIT ESG focused culture; Founded 1972, IPO Top tier governance; 1993; Enterprise LEED certification value ~$17.3B. investment goals 20 major U.S. logistics markets; Component of Geographic strategic target to S&P 500 70% Tier 1 markets by 2021 Index Strategy expected to 518 modern generate mid-to-high single facilities; 156 digit cash flow and dividend (1) million square ePort, Perth Amboy, New Jersey growth ; Baa1/BBB+ credit Turnpike Exit 10 Submarket ratings; Ample liquidity feet (3 buildings totaling 1.3 million SF) (1) Cash flow and dividend growth expectations are in a medium-to-strong economic environment. WHO WE ARE 4

Duke Realty is the only REIT that “Checks All The Boxes” to be the Leading Pure-Play Domestic-only Logistics REIT S&P 500 (Large Cap Firm) U.S. Industrial Only / Simple Business Model Modern, High-Quality Logistics Facilities Majority Tier 1 Market Concentration Strong Development Capability Strong Recent AFFO Growth & Positioned for Future Growth High BBB-Rated Balance Sheet with Ample Liquidity ESG Embedded in Corporate Culture STRATEGIC OVERVIEW 5
RECESSION RESILIENCY / STRONG RELATIVE PORTFOLIO PERFORMANCE Legacy Commerce Center (Brownfield development), Linden, NJ

Ample Liquidity to Fund Expected Commitments in thousands in thousands ESTIMATED NEAR TERM DEBT MATURITIES 2020 LIQUIDITY REMAINING Cash at 6/30 $ 29,870 $87,957 Estimated AFFO Remaining for year 251,000 Dividends Remaining to be Paid (176,000) Estimated Funds Available for Reinvestment(1) $ 75,000 $13,050 Debt Amortization (2,404) $2,404 Cash $ 102,466 2020 2021 2022 Credit Facility Availability(2) 1,192,147 TOTAL LIQUIDITY $ 1,294,613 2020 INVESTMENT ACTIVITY CURRENT % OF UNENCUMBERED LIQUIDITY ASSETS Existing Development Pipeline Costs to Complete (281,341) Future Development Spend less Land(3) (200,000) 2% 1% Acquisitions(4) (150,000) Dispositions(4) 273,000 $1.2B $9.4B TOTAL USES $ (358,341) Liquidity Unencum- bered REMAINING FUNDING CAPACITY $ 936,272 99% 98% Credit Facility Cash Unencumbered Encumbered Notes: This analysis represents our estimate of our liquidity and is based on the assumptions listed in the notes on this page. Funds available for reinvestment may differ from actual cash flows due to timing of receivables. * See other important Capital Strategy 1) Funds Available for Reinvestment represents the midpoint of AFFO guidance, less dividends at current rate for 2020; 2) Availability represents our $1.2B Credit Facility less outstanding borrowings and letters of credit. The Credit Facility including extension options at our control, matures in January slides starting on page 29 * 2023, and contains an $800 million accordion option to increase the capacity to $2 billion in which lenders may choose to participate; 3) Estimated total spend related to potential 2020 starts after 6/30 and excludes costs related to land in inventory or acquired; 4) Based on the guidance midpoint less any closed transactions. 2020 RESILIENCY 7
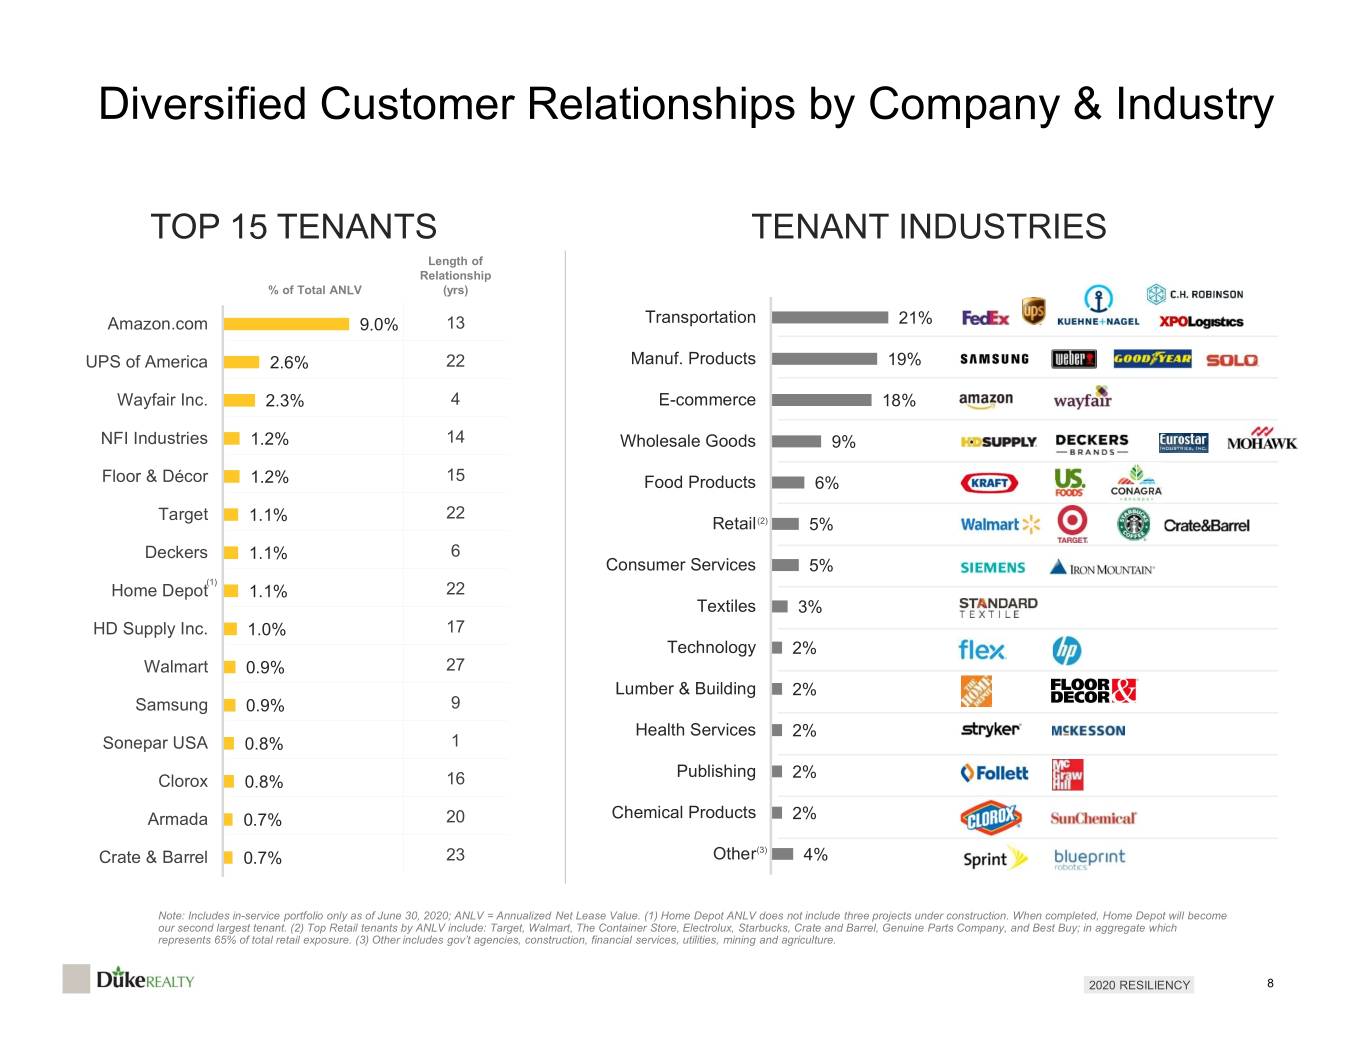
Diversified Customer Relationships by Company & Industry TOP 15 TENANTS TENANT INDUSTRIES Length of Relationship % of Total ANLV (yrs) Amazon.com 9.0% 13 Transportation 21% UPS of America 2.6% 22 Manuf. Products 19% Wayfair Inc. 2.3% 4 E-commerce 18% NFI Industries 1.2% 14 Wholesale Goods 9% Floor & Décor 1.2% 15 Food Products 6% Target 1.1% 22 Retail(2) 5% Deckers 1.1% 6 Consumer Services 5% (1) Home Depot 1.1% 22 Textiles 3% HD Supply Inc. 1.0% 17 Technology 2% Walmart 0.9% 27 Lumber & Building 2% Samsung 0.9% 9 Health Services 2% Sonepar USA 0.8% 1 Publishing 2% Clorox 0.8% 16 Armada 0.7% 20 Chemical Products 2% Crate & Barrel 0.7% 23 Other(3) 4% Note: Includes in-service portfolio only as of June 30, 2020; ANLV = Annualized Net Lease Value. (1) Home Depot ANLV does not include three projects under construction. When completed, Home Depot will become our second largest tenant. (2) Top Retail tenants by ANLV include: Target, Walmart, The Container Store, Electrolux, Starbucks, Crate and Barrel, Genuine Parts Company, and Best Buy; in aggregate which represents 65% of total retail exposure. (3) Other includes gov’t agencies, construction, financial services, utilities, mining and agriculture. 2020 RESILIENCY 8
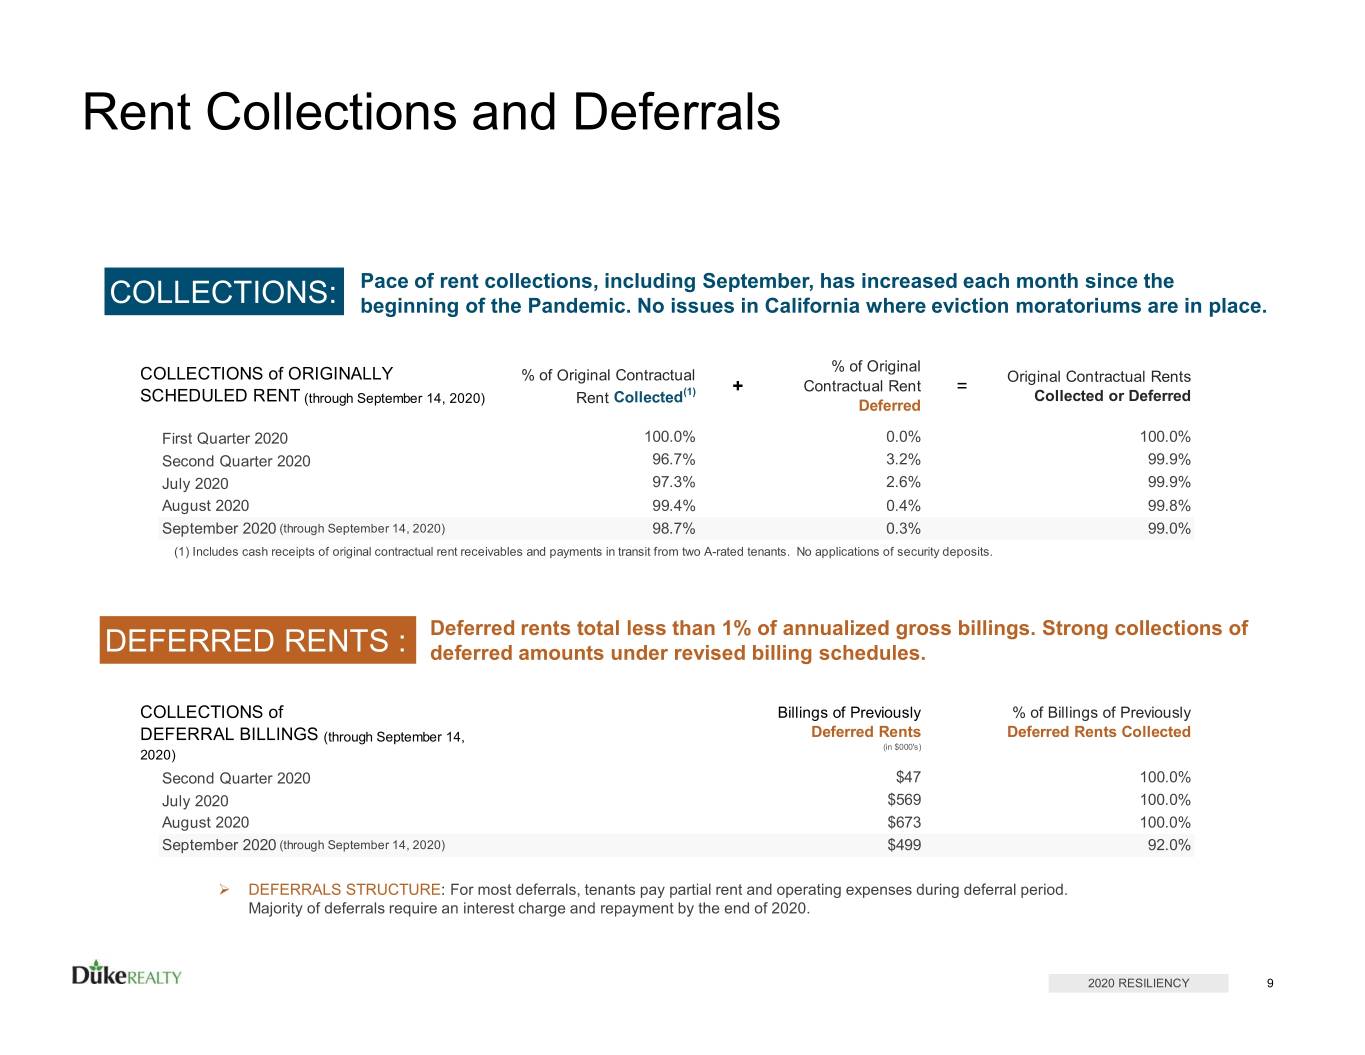
Rent Collections and Deferrals Pace of rent collections, including September, has increased each month since the COLLECTIONS: beginning of the Pandemic. No issues in California where eviction moratoriums are in place. % of Original COLLECTIONS of ORIGINALLY % of Original Contractual Original Contractual Rents + Contractual Rent = SCHEDULED RENT Collected(1) Collected or Deferred (through September 14, 2020) Rent Deferred First Quarter 2020 100.0% 0.0% 100.0% Second Quarter 2020 96.7% 3.2% 99.9% July 2020 97.3% 2.6% 99.9% August 2020 99.4% 0.4% 99.8% September 2020 (through September 14, 2020) 98.7% 0.3% 99.0% (1) Includes cash receipts of original contractual rent receivables and payments in transit from two A-rated tenants. No applications of security deposits. Deferred rents total less than 1% of annualized gross billings. Strong collections of DEFERRED RENTS : deferred amounts under revised billing schedules. COLLECTIONS of Billings of Previously % of Billings of Previously DEFERRAL BILLINGS (through September 14, Deferred Rents Deferred Rents Collected (in $000's) 2020) Second Quarter 2020 $47 100.0% July 2020 $569 100.0% August 2020 $673 100.0% September 2020 (through September 14, 2020) $499 92.0% DEFERRALS STRUCTURE: For most deferrals, tenants pay partial rent and operating expenses during deferral period. Majority of deferrals require an interest charge and repayment by the end of 2020. 2020 RESILIENCY 9

2020 YTD Metrics and Development Pre-leasing Support Outperformance through Cycles | Strong 2-Year Metrics Durable and High Performing Core Development Growth/Risk Portfolio Metrics & non-Same Property Upside Best in Class YTD SPNOI Growth YTD Rent Growth Development Pipeline as % of Assets / (Pre-leasing %) 7.3% 5.8% 35% 3.8% 3.9% 29% 30% DRE 8% (65%) 24% 2.5% 20% PLD 4% (43%) FR 2% (34%) DRE PLD FR EGP REXR DRE PLD FR EGP REXR EGP 3% (9%) Non-Same Property 2-Year SPNOI Growth 2-Year Rent Growth (8 qtr avg Q3 2018 – Q2 2020) (8 qtr avg Q3 2018 – Q2 2020) Pool Size % (2Y Avg 3Q16 – 2Q18*) 6.1% 33% 4.9% 4.6% 4.8% 4.5% 28% 27% 26% DRE 15% 18% PLD 12% FR 7% DRE PLD FR EGPREXR DRE PLD FR EGP REXR EGP 6% Source: Company reporting and DRE. “SPNOI” is “same-property NOI”, a non GAAP metric. REXR YTD SPNOI excludes deferred rent. Non-same property (“NSP”) pool on SF basis. *2016- 2018 time period for NSP property pool analysis selected due to large M&A transactions impacting PLD’s pool size % starting Q3 2018. REXR no disclosure of NSP pool. WHY DUKE REALTY 10

At or Above Average Portfolio Performance and Balance Sheet with Lower Risk – yet Discounted Relative Value AFFO Multiple NAV Premium / (Disc) 47.9x 24% 20% 13% 31.5x 30.8x 26.9x 26.2x 4% -5% DRE PLD FR EGP REXR DRE PLD FR EGP REXR FFO Multiple Debt-to-EBITDA 5.3x 36.2x 5.1x 4.7x 4.8x 26.9x 24.6x 24.3x 22.3x 3.1x DRE PLD FR EGP REXR DRE PLD FR EGP REXR S&P BBB+ A- BBB NR NR Moody’s Baa1 A3 Baa2 Baa2 NR Fitch NR A- BBB NR BBB Source: 2020 Consensus estimates per S&P GMI, as of 9/11/2020, exceptt DRE FFO is mid-point of guidance. Consensus AFFO on median basis to reduce excessive dispersion of individual analyst estimates within AFFO. Debt-to-EBITDA per WF credit research, as of Q2. WHY DUKE REALTY 11

MACROECONOMIC & SECULAR DRIVERS INDUSTRIAL SUPPLY-DEMAND FUNDAMENTALS
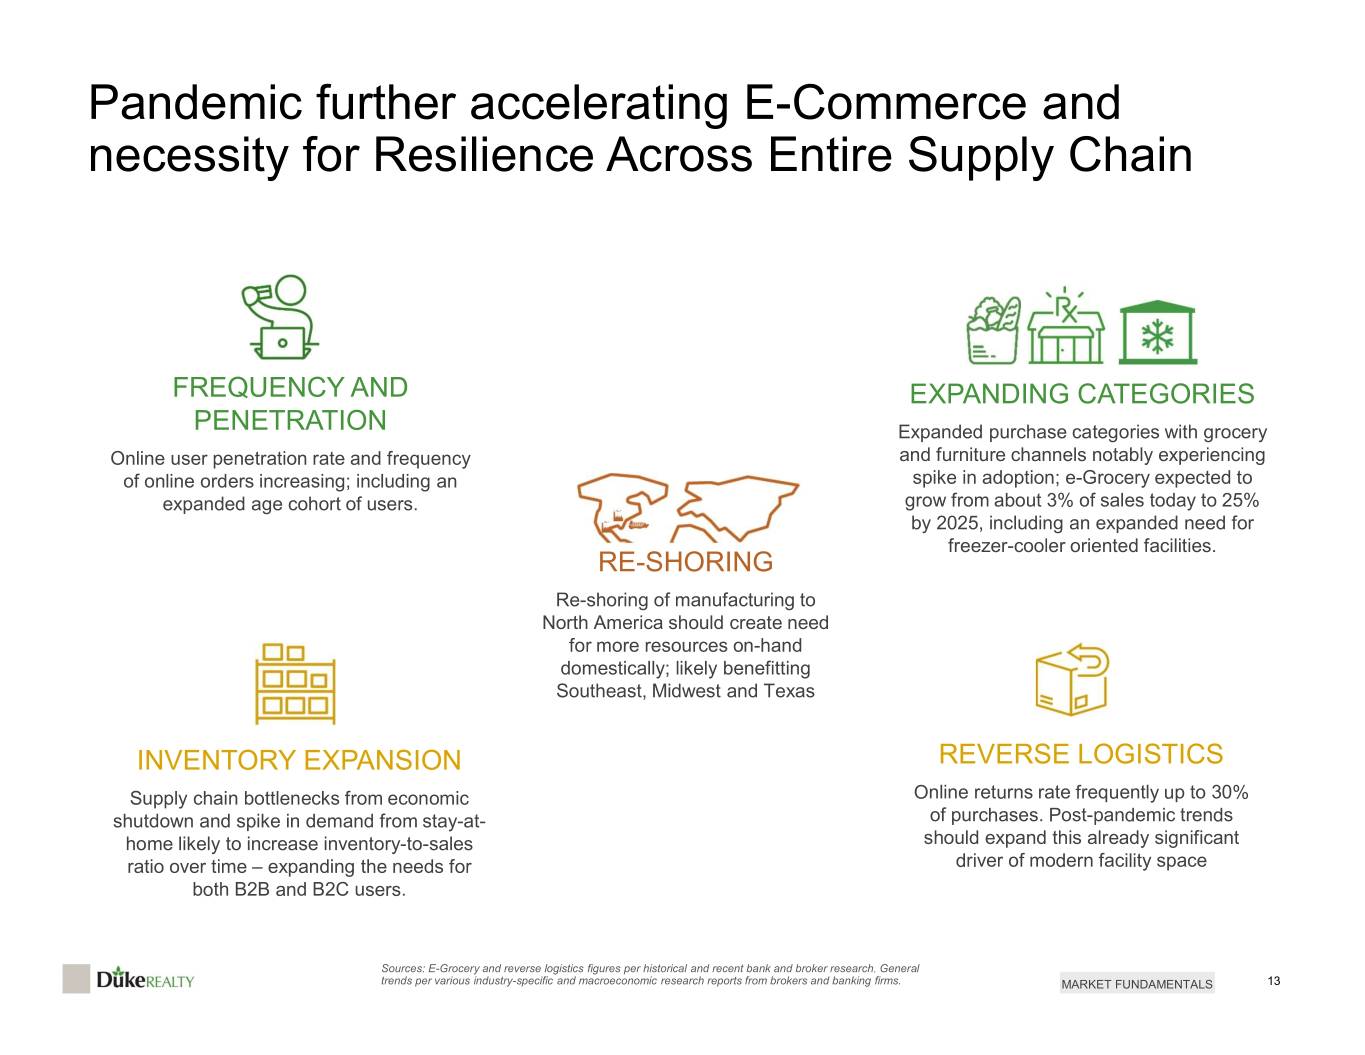
Pandemic further accelerating E-Commerce and necessity for Resilience Across Entire Supply Chain FREQUENCY AND EXPANDING CATEGORIES PENETRATION Expanded purchase categories with grocery Online user penetration rate and frequency and furniture channels notably experiencing of online orders increasing; including an spike in adoption; e-Grocery expected to expanded age cohort of users. grow from about 3% of sales today to 25% by 2025, including an expanded need for freezer-cooler oriented facilities. RE-SHORING Re-shoring of manufacturing to North America should create need for more resources on-hand domestically; likely benefitting Southeast, Midwest and Texas INVENTORY EXPANSION REVERSE LOGISTICS Supply chain bottlenecks from economic Online returns rate frequently up to 30% shutdown and spike in demand from stay-at- of purchases. Post-pandemic trends home likely to increase inventory-to-sales should expand this already significant ratio over time – expanding the needs for driver of modern facility space both B2B and B2C users. Sources: E-Grocery and reverse logistics figures per historical and recent bank and broker research. General trends per various industry-specific and macroeconomic research reports from brokers and banking firms. MARKET FUNDAMENTALS 13
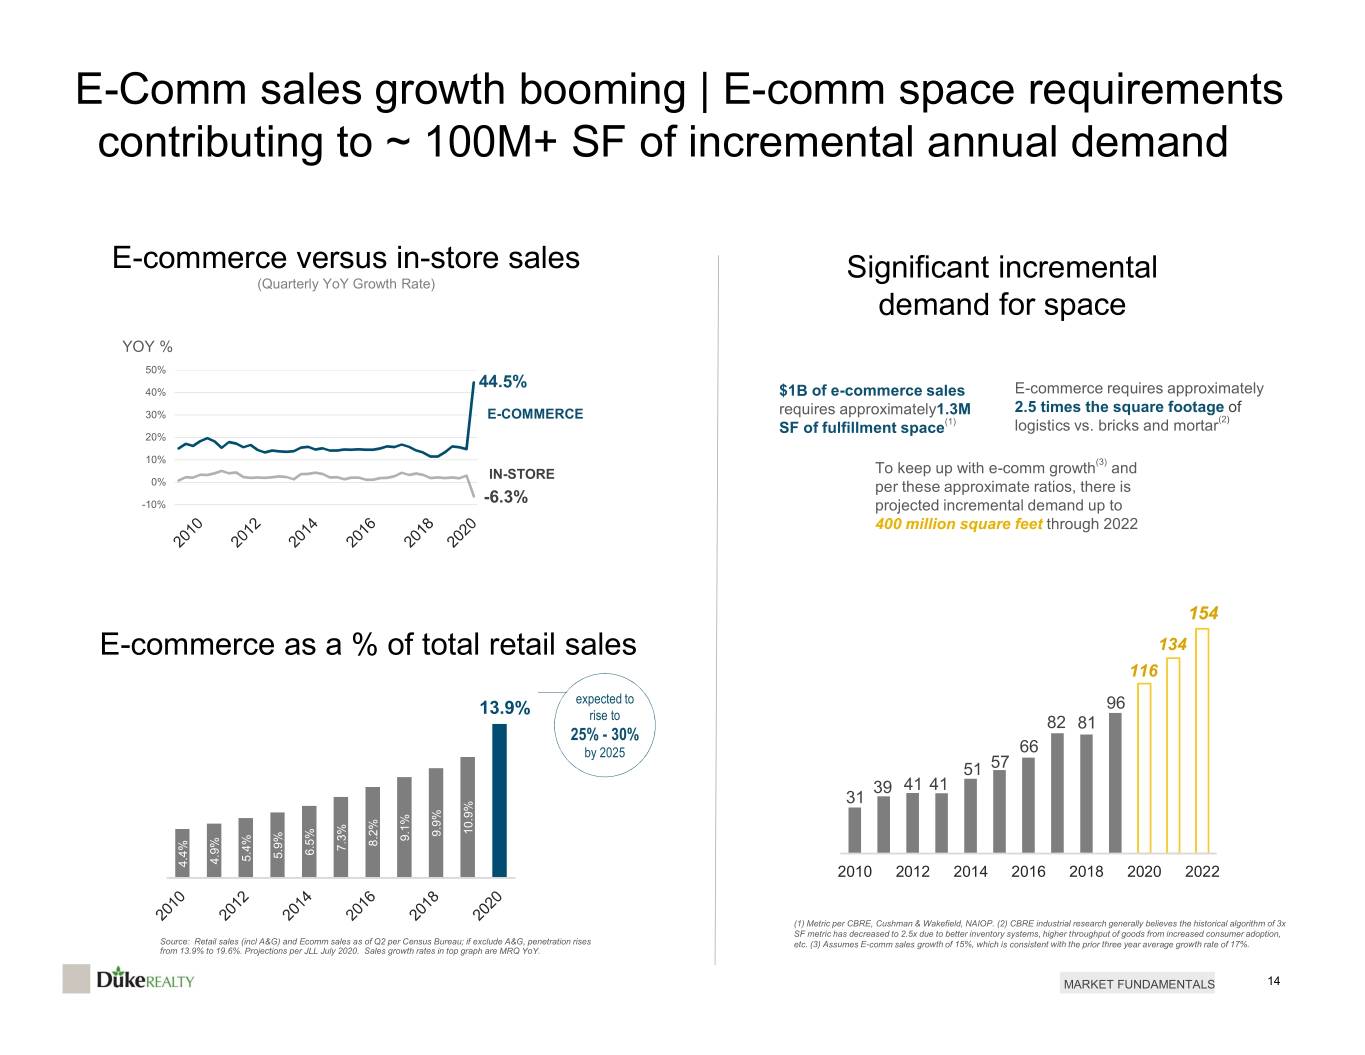
E-Comm sales growth booming | E-comm space requirements contributing to ~ 100M+ SF of incremental annual demand E-commerce versus in-store sales Significant incremental (Quarterly YoY Growth Rate) demand for space YOY % 50% 44.5% 40% $1B of e-commerce sales E-commerce requires approximately requires approximately1.3M 2.5 times the square footage of 30% E-COMMERCE (2) SF of fulfillment space(1) logistics vs. bricks and mortar 20% 10% (3) IN-STORE To keep up with e-comm growth and 0% per these approximate ratios, there is -6.3% -10% projected incremental demand up to 400 million square feet through 2022 154 E-commerce as a % of total retail sales 134 116 13.9% expected to 96 rise to 82 81 25% - 30% by 2025 66 51 57 39 41 41 31 10.9% 9.9% 9.1% 8.2% 7.3% 6.5% 5.9% 5.4% 4.9% 4.4% 2010 2012 2014 2016 2018 2020 2022 (1) Metric per CBRE, Cushman & Wakefield, NAIOP. (2) CBRE industrial research generally believes the historical algorithm of 3x SF metric has decreased to 2.5x due to better inventory systems, higher throughput of goods from increased consumer adoption, Source: Retail sales (incl A&G) and Ecomm sales as of Q2 per Census Bureau; if exclude A&G, penetration rises etc. (3) Assumes E-comm sales growth of 15%, which is consistent with the prior three year average growth rate of 17%. from 13.9% to 19.6%. Projections per JLL July 2020. Sales growth rates in top graph are MRQ YoY. MARKET FUNDAMENTALS 14
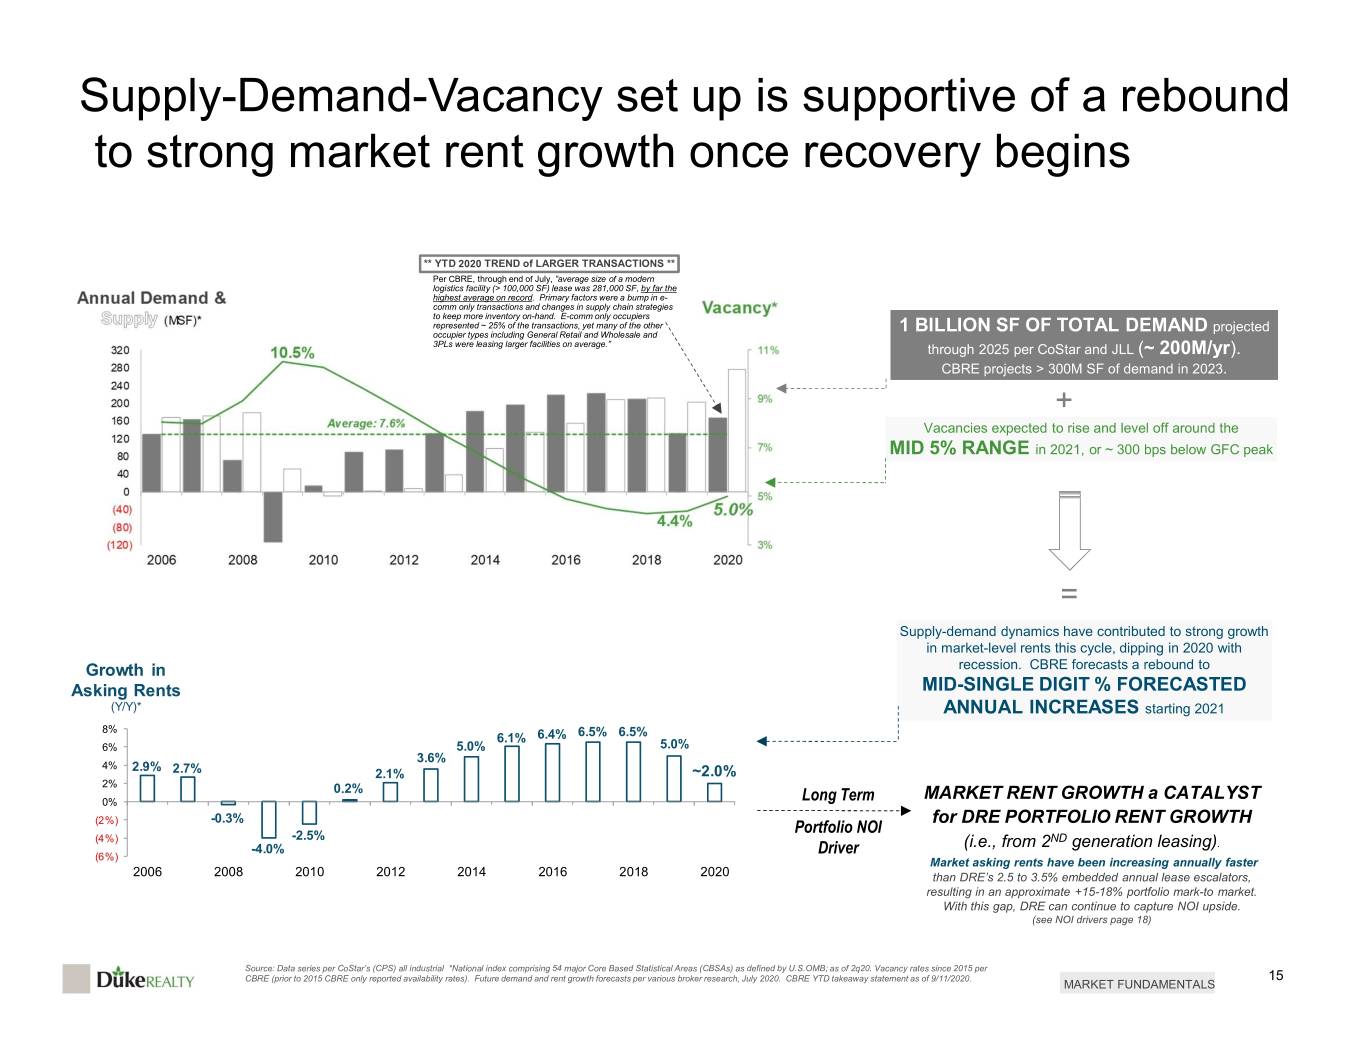
Supply-Demand-Vacancy set up is supportive of a rebound to strong market rent growth once recovery begins ** YTD 2020 TREND of LARGER TRANSACTIONS ** Per CBRE, through end of July, ”average size of a modern logistics facility (> 100,000 SF) lease was 281,000 SF, by far the highest average on record. Primary factors were a bump in e- comm only transactions and changes in supply chain strategies to keep more inventory on-hand. E-comm only occupiers represented ~ 25% of the transactions, yet many of the other projected occupier types including General Retail and Wholesale and 1 BILLION SF OF TOTAL DEMAND 3PLs were leasing larger facilities on average.” through 2025 per CoStar and JLL (~ 200M/yr). CBRE projects > 300M SF of demand in 2023. + Vacancies expected to rise and level off around the MID 5% RANGE in 2021, or ~ 300 bps below GFC peak = Supply-demand dynamics have contributed to strong growth in market-level rents this cycle, dipping in 2020 with Growth in recession. CBRE forecasts a rebound to Asking Rents MID-SINGLE DIGIT % FORECASTED (Y/Y)* ANNUAL INCREASES starting 2021 8% 6.1% 6.4% 6.5% 6.5% 6% 5.0% 5.0% 3.6% 4% 2.9% 2.7% 2.1% ~2.0% 2% 0.2% 0% Long Term MARKET RENT GROWTH a CATALYST (2%) -0.3% for DRE PORTFOLIO RENT GROWTH Portfolio NOI (4%) -2.5% ND -4.0% Driver (i.e., from 2 generation leasing). (6%) Market asking rents have been increasing annually faster 2006 2008 2010 2012 2014 2016 2018 2020 than DRE’s 2.5 to 3.5% embedded annual lease escalators, resulting in an approximate +15-18% portfolio mark-to market. With this gap, DRE can continue to capture NOI upside. (see NOI drivers page 18) Source: Data series per CoStar’s (CPS) all industrial *National index comprising 54 major Core Based Statistical Areas (CBSAs) as defined by U.S.OMB; as of 2q20. Vacancy rates since 2015 per CBRE (prior to 2015 CBRE only reported availability rates). Future demand and rent growth forecasts per various broker research, July 2020. CBRE YTD takeaway statement as of 9/11/2020. 15 MARKET FUNDAMENTALS

Evolution of Amazon Distribution Network Growth Space Added(1) (millions SF) DRE’s portfolio, development 120 platform and local/national 100 relationships are exceptionally well 80 positioned to capture e-commerce 60 growth opportunities from Amazon 40 and others, from less than 100K to 20 1.0M+ square feet. 0 2005 2007 2009 2011 2013 2015 2017 2019 “LAST MILE” (LM) FULFILLMENT CENTER SORTATION CENTER DELIVERY STATION Size & ~ 70-200K SF, 18’ - 36’ clear height (newer are 32’), Clear Height 400K – 1.2M SF, 36’-40’ clear height ~ 250K-650K SF, 32’-36’ clear height This newer prototype need 15ac of land for 600-800 cars/vans, or ~ 50% FAR Service N/A – provides zip code bundling sort for 5 to 45 minute drive time ~ 5 to 600 miles Range USPS, or to AMZ LM or Prime Now (i.e., ~ 0 to 30 miles) Source: MWPVL, CoStar, Duke Realty & Google satellite maps. (1) For annual space added, MWPVL tracks all projects, including proposed or under construction projects for the current year. Starting 2019, previous category names of “Delivery Stations” (now LM) and “Prime Now Hub” have been consolidated (bright blue color) due to significant expected expansion of newer “LM” prototype. MARKET FUNDAMENTALS 16

KEY NET OPERATING INCOME (NOI) DRIVERS Legacy Commerce Center (Brownfield development), Linden, NJ

Operating Metrics Supportive of Continued Growth NOI Drivers(1) 2020 Same-Property NOI Guidance Buildup Contributing factors include magnitude of leasing 97.3% stabilized occupancy from 2019 and a tenant space consolidation OCCUPANCY 95.3% total occupancy (incl under development) +0.5% RENT GROWTH Total +2.4% 4.0% on 2nd GEN(2) 29% GAAP | 13% cash -0.6% 6.3 years average term at signing LEASE TERMS 5.9 years average remaining 2.0-3.5% annual escalators +0.5% +1.0% SAME 5.8% 2020 actual PROPERTY (“SP”) 4.0% 2020 mid-point guidance +0.2% NON - SAME 13% of total NOI not in SP pool PROPERTY 75% occupancy in non SP pool $846M development pipeline with future NOI (~$47.6M) …. reflects substantial NOI upside (2) Refers to space that has been (1) Figures as of YTD 2020 (unless otherwise previously occupied, including condition noted). Average lease term includes 1st gen that previous tenant must have completed leases; Occupancy stats on lease-up basis. at least 12 months of lease term. NOI PERFORMANCE 18
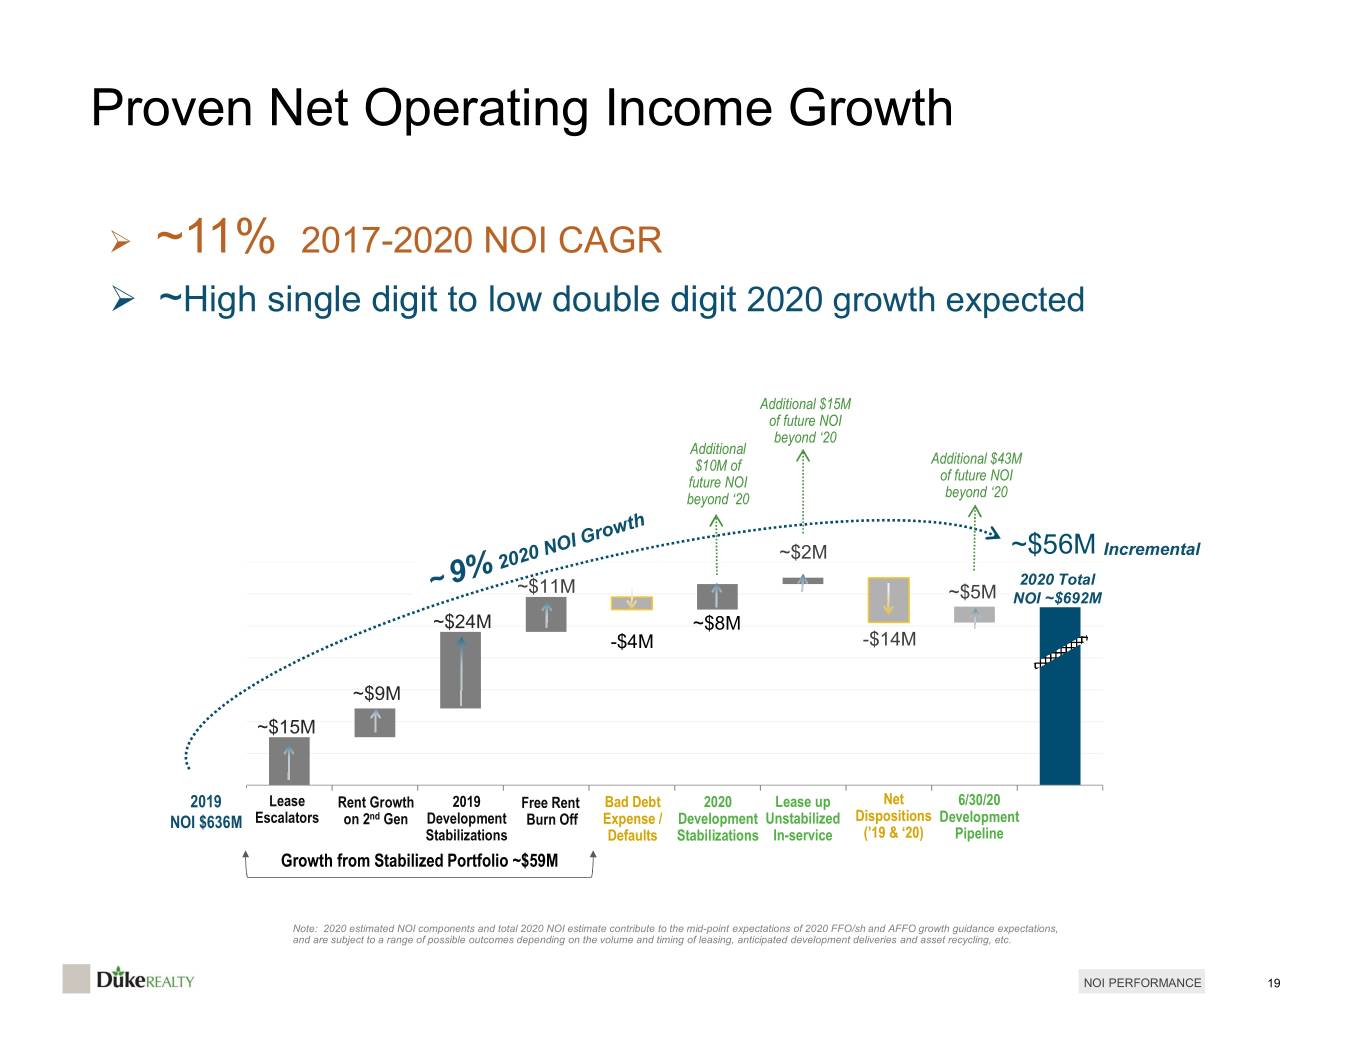
Proven Net Operating Income Growth ~11% 2017-2020 NOI CAGR ~High single digit to low double digit 2020 growth expected Additional $15M of future NOI beyond ‘20 Additional $10M of Additional $43M future NOI of future NOI beyond ‘20 beyond ‘20 ~$2M ~$56M Incremental ~$11M 2020 Total ~$5M NOI ~$692M ~$24M ~$8M -$4M -$14M ~$9M ~$15M 2019 Lease Rent Growth 2019 Free Rent Bad Debt 2020 Lease up Net 6/30/20 NOI $636M Escalators on 2nd Gen Development Burn Off Expense / Development Unstabilized Dispositions Development Stabilizations Defaults Stabilizations In-service (’19 & ‘20) Pipeline Growth from Stabilized Portfolio ~$59M Note: 2020 estimated NOI components and total 2020 NOI estimate contribute to the mid-point expectations of 2020 FFO/sh and AFFO growth guidance expectations, and are subject to a range of possible outcomes depending on the volume and timing of leasing, anticipated development deliveries and asset recycling, etc. NOI PERFORMANCE 19

17791 Perris Boulevard (Deckers Outdoor Corp) Inland Empire East Submarket, Southern California LOGISTICS ASSET STRATEGY

National Platform with Growing Diversification into Tier 1 Markets 2010 $2.3B in T1 2020 Q2 $10.3B in T1 T1 Exposure = 37% T1 = 64% T1 target approaching 70% 2021 Seattle Minneapolis-St. Paul Eastern Pennsylvania T1 New Jersey T1 Chicago T1 Columbus Washington DC/ Baltimore Northern T1 California Indianapolis St. Louis Cincinnati Raleigh Nashville T1 Atlanta Southern T1 California Savannah Dallas T1 Central Florida Houston South Florida T1 T1 = Tier 1 Distribution Market Concentration by GAV → $200MM – $399MM $400MM –$699MM$700MM – $999MM > $1B GAV = Gross Asset Value as estimated by Duke Realty using actual or estimated NOI’s and using current cap rates. “Tier 1” = major markets by population size and/or gateway port for domestic or global trade. ASSET STRATEGY 21
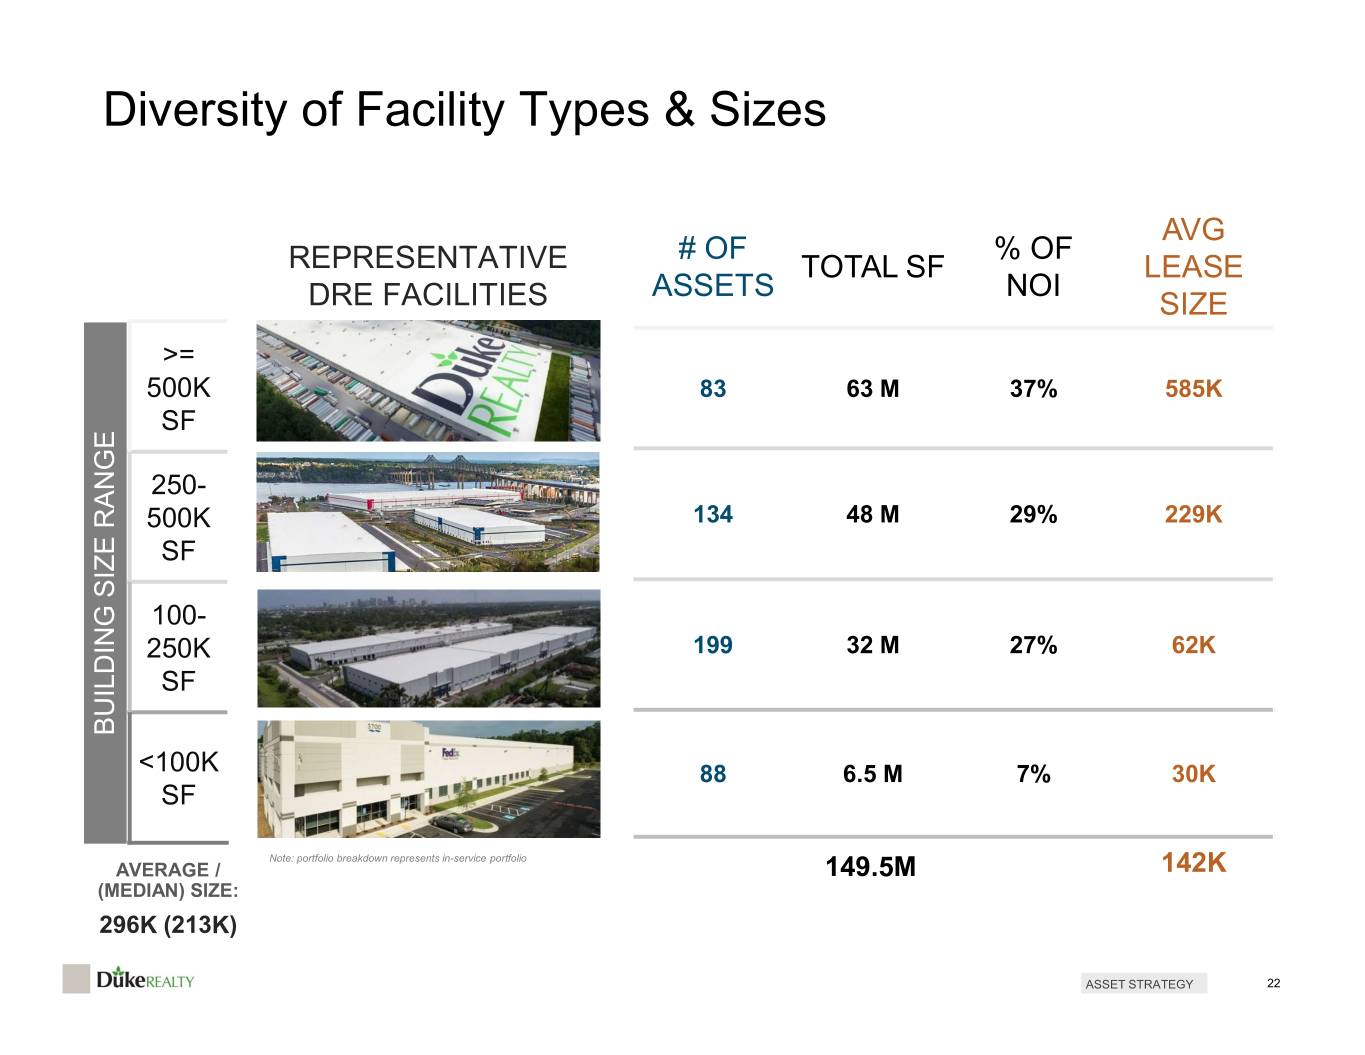
Diversity of Facility Types & Sizes AVG # OF % OF REPRESENTATIVE TOTAL SF LEASE ASSETS NOI DRE FACILITIES SIZE >= 500K 83 63 M 37% 585K SF 250- 500K 134 48 M 29% 229K SF 100- 250K 199 32 M 27% 62K SF BUILDING SIZE RANGE <100K 88 6.5 M 7% 30K SF Note: portfolio breakdown represents in-service portfolio AVERAGE / 149.5M 142K (MEDIAN) SIZE: 296K (213K) ASSET STRATEGY 22

Modern Portfolio Performs across all Sizes and Markets SIZE & SUBMARKETS Larger and mid-sized DRE assets have performed a bit better than smaller sizes, representing a selective submarket focus in major MSA’s. DRE portfolio generally larger and better geographically diversified than peer set, which in post-pandemic world appears to be an even greater strategic benefit CYCLE PERFORMANCE Proven experience that occupancy levels tend to stay higher in mid-to-large sized and newer properties in down cycle. This dynamic is playing out YTD 2020. GEOGRAPHIC EVOLUTION DRE’s recent strong rent growth almost exclusively from non-coastal markets. Significant rent growth upside when we begin to have more rollover of our coastal properties. DURABILITY & SAFETY Active build-to-suit development program drives longer lease terms. Lower capex results in lower risk, sustainable cash flow growth through all cycles. Embedded portfolio mark-to-market roughly 15% to 18%. ASSET STRATEGY 23

Focused Submarket Strategy | Modest Risk to Supply Focused within NOI exposure from high supply 79 submarkets out of 212 total < 5% submarkets1, comprising roughly nationally 20 buildings submarkets comprise lease rollover through 2021 in 51 90% of NOI < 1% high supply submarkets1 % of RENT # of DRE FOCUS TOP 6 TOTAL GROWTH2 CBRE FOCUSED SUBMARKET MARKETS DRE IN FOCUS SUBMARKETS SUBMARKETS NOI %2 NOI2 SUBMARKETS Southern California 10.3 9 3 81% 46% South Florida 8.5 23 4 83% 29% New Jersey 8.4 24 4 86% 48% Dallas 8.2 9 3 79% 35% Chicago 7.3 17 4 78% 21% Atlanta 6.7 9 3 84% 17% Subtotal 49.4% 91 21 82% 33% (1) High supply submarkets defined per a mix of current and trending metrics such as under construction % of supply, deliveries % of supply, vacancy rate, demand, labor and barriers to entry; For South Atlanta, DRE’s airport submarket assets deemed infill and substantially insulated from nearby supply statistics, same for the inner NE Atlanta submarket (i.e., Duluth). Submarkets in this classification include North Fort Worth, Central PA, Far NE Atlanta, Far S. Atlanta and to a lesser extent S. Dallas and I- 80/Joliet/Minooka (which have realized improved metrics since 2019). Lease rollover statistic on total company NOI. (2) NOI reflects stabilized NOI including projects under development. Rent growth by submarket a two year average (2018-2Q 2020). SUBMARKET STRATEGY 24
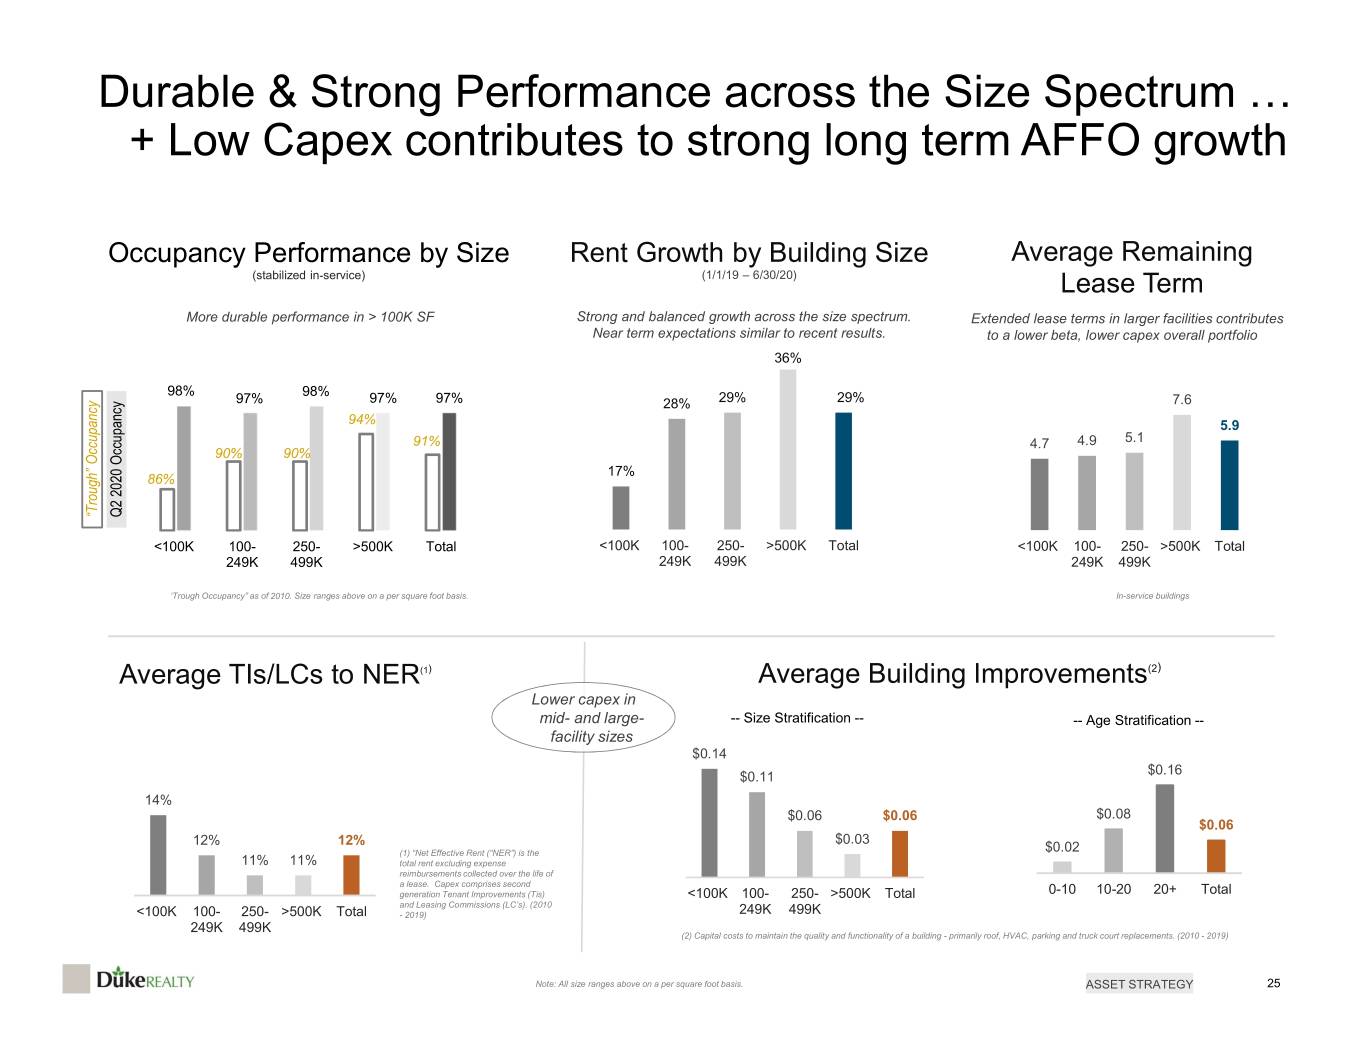
Durable & Strong Performance across the Size Spectrum … + Low Capex contributes to strong long term AFFO growth Occupancy Performance by Size Rent Growth by Building Size Average Remaining (stabilized in-service) (1/1/19 – 6/30/20) Lease Term More durable performance in > 100K SF Strong and balanced growth across the size spectrum. Extended lease terms in larger facilities contributes Near term expectations similar to recent results. to a lower beta, lower capex overall portfolio 36% 98% 98% 97% 97% 97% 28% 29% 29% 7.6 94% 5.9 91% 4.7 4.9 5.1 90% 90% 17% 86% “Trough” “Trough” Occupancy Occupancy2020 Q2 <100K 100- 250- >500K Total <100K 100- 250- >500K Total <100K 100- 250- >500K Total 249K 499K 249K 499K 249K 499K ‘Trough Occupancy” as of 2010. Size ranges above on a per square foot basis. In-service buildings Average TIs/LCs to NER(1) Average Building Improvements(2) Lower capex in mid- and large- -- Size Stratification -- -- Age Stratification -- facility sizes $0.14 $0.16 $0.11 14% $0.06 $0.06 $0.08 $0.06 12% 12% $0.03 (1) “Net Effective Rent (“NER”) is the $0.02 11% 11% total rent excluding expense reimbursements collected over the life of a lease. Capex comprises second generation Tenant Improvements (Tis) <100K 100- 250- >500K Total 0-10 10-20 20+ Total and Leasing Commissions (LC’s). (2010 <100K 100- 250- >500K Total - 2019) 249K 499K 249K 499K (2) Capital costs to maintain the quality and functionality of a building - primarily roof, HVAC, parking and truck court replacements. (2010 - 2019) Note: All size ranges above on a per square foot basis. ASSET STRATEGY 25

Turnpike Crossing Park 6 buildings totaling 802K SF West Palm Beach, FL DEVELOPMENT STRATEGY & PERFORMANCE

Development Strategic Advantages annual development $1.6B infill(3) $794M starts (since 1/1/2015) development starts SPEC: 9-mon. avg. lease up average pre-leased BTS: 13-year avg. initial lease 52% term estimated value Up to 50% value creation creation(1) margins, higher end typically $1.1B from infill projects $4.1B investment 124 development projects 6.2% yields(2) 27% profit margins(2) of land bank in repeat business; in- Coastal Tier 1 house construction & 77% markets 69% development a strategic advantage (1) Value creation uses market cap rates at start date, with cap rate sources per CBRE and internal records; (2) Based on initial stabilized cash yield (3) * INFILL” - defined as submarket locations which have characteristics such as lack of developable land, close proximity to major population center, or close proximity to a major airport or seaport. (see representative in-fill development case studies starting on page 42). Majority of statistics on a five year average basis. DEVELOPMENT 27
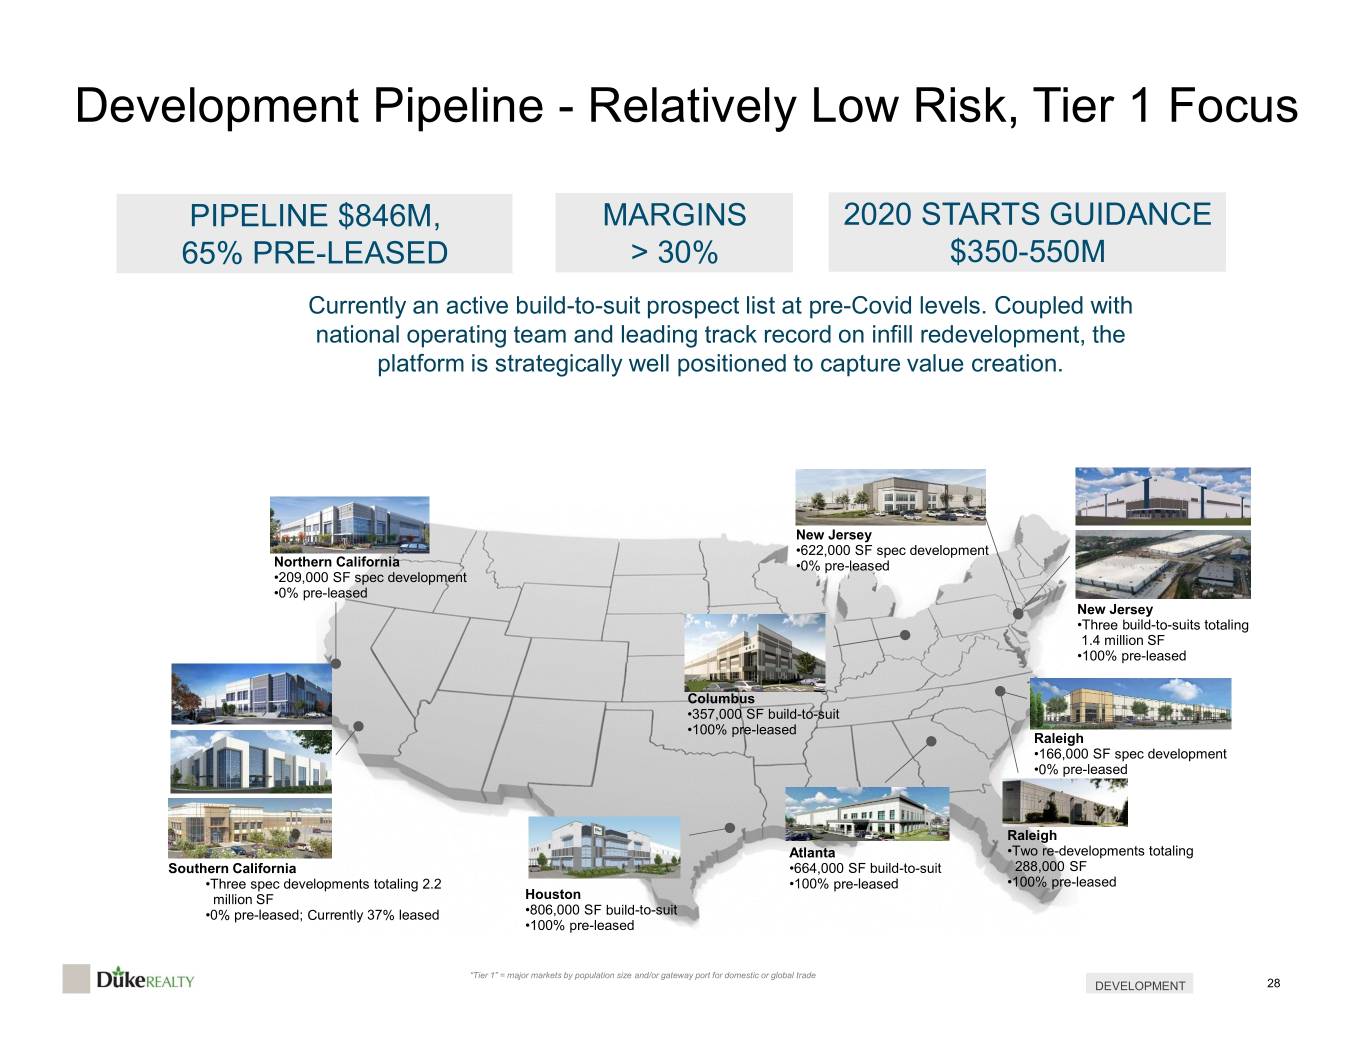
Development Pipeline - Relatively Low Risk, Tier 1 Focus PIPELINE $846M, MARGINS 2020 STARTS GUIDANCE 65% PRE-LEASED > 30% $350-550M Currently an active build-to-suit prospect list at pre-Covid levels. Coupled with national operating team and leading track record on infill redevelopment, the platform is strategically well positioned to capture value creation. New Jersey •622,000 SF spec development Northern California •0% pre-leased •209,000 SF spec development •0% pre-leased New Jersey •Three build-to-suits totaling 1.4 million SF •100% pre-leased Columbus •357,000 SF build-to-suit •100% pre-leased Raleigh •166,000 SF spec development •0% pre-leased Raleigh Atlanta •Two re-developments totaling Southern California •664,000 SF build-to-suit 288,000 SF •Three spec developments totaling 2.2 •100% pre-leased •100% pre-leased million SF Houston •0% pre-leased; Currently 37% leased •806,000 SF build-to-suit •100% pre-leased “Tier 1” = major markets by population size and/or gateway port for domestic or global trade DEVELOPMENT 28
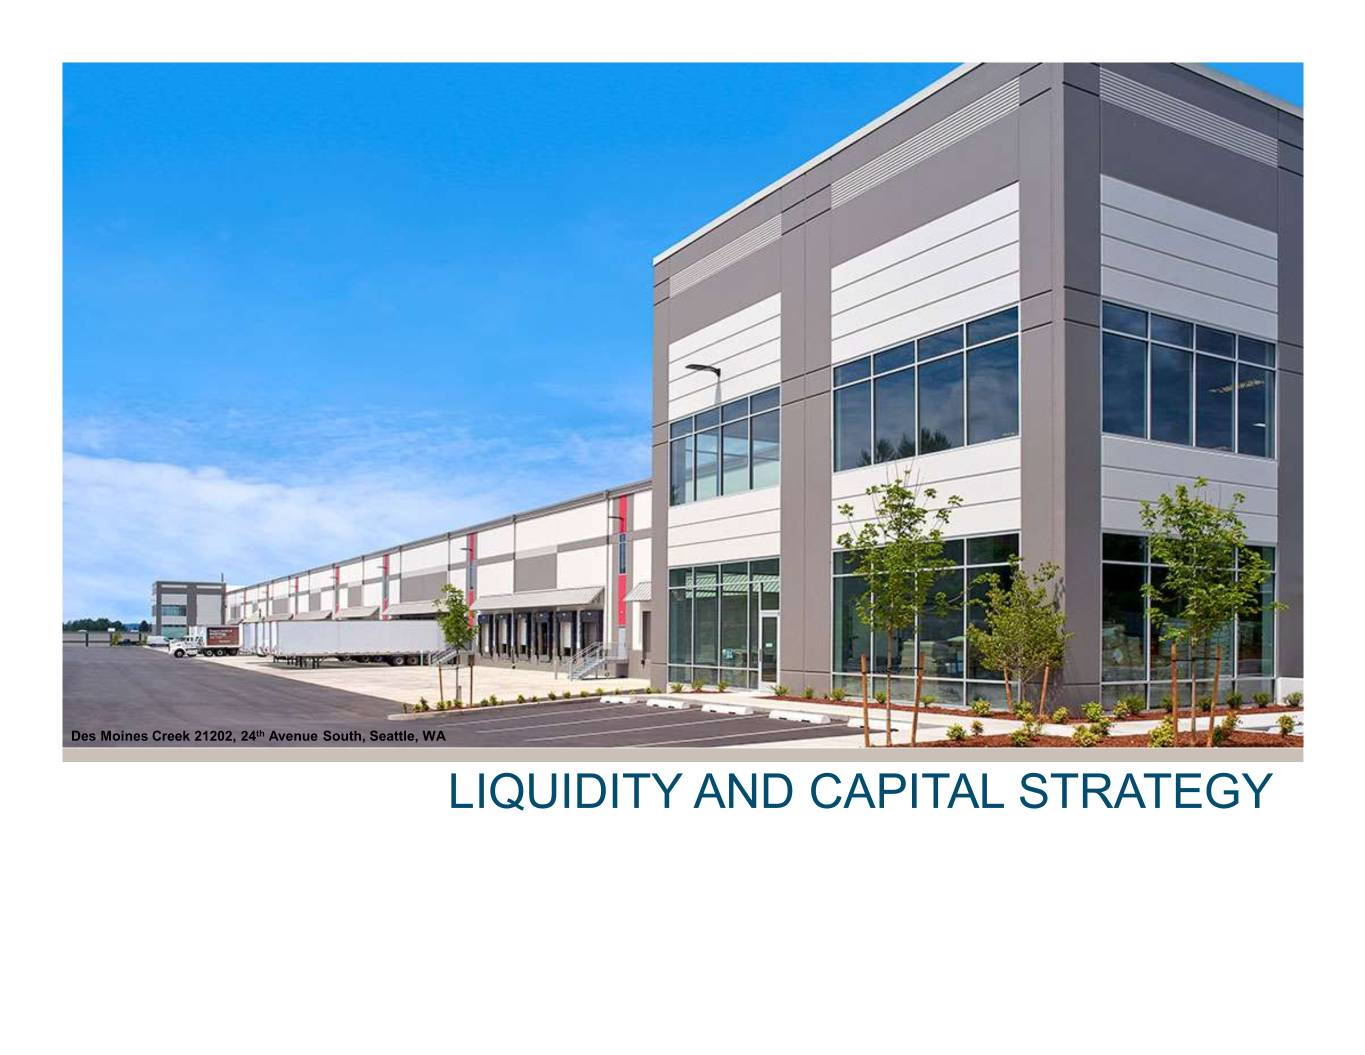
Lockport 16328 / 16410 / 16508 (3 buildings, 803,000 SF), I-55 Submarket, Chicago, IL Des Moines Creek 21202, 24th Avenue South, Seattle, WA LIQUIDITY AND CAPITAL STRATEGY
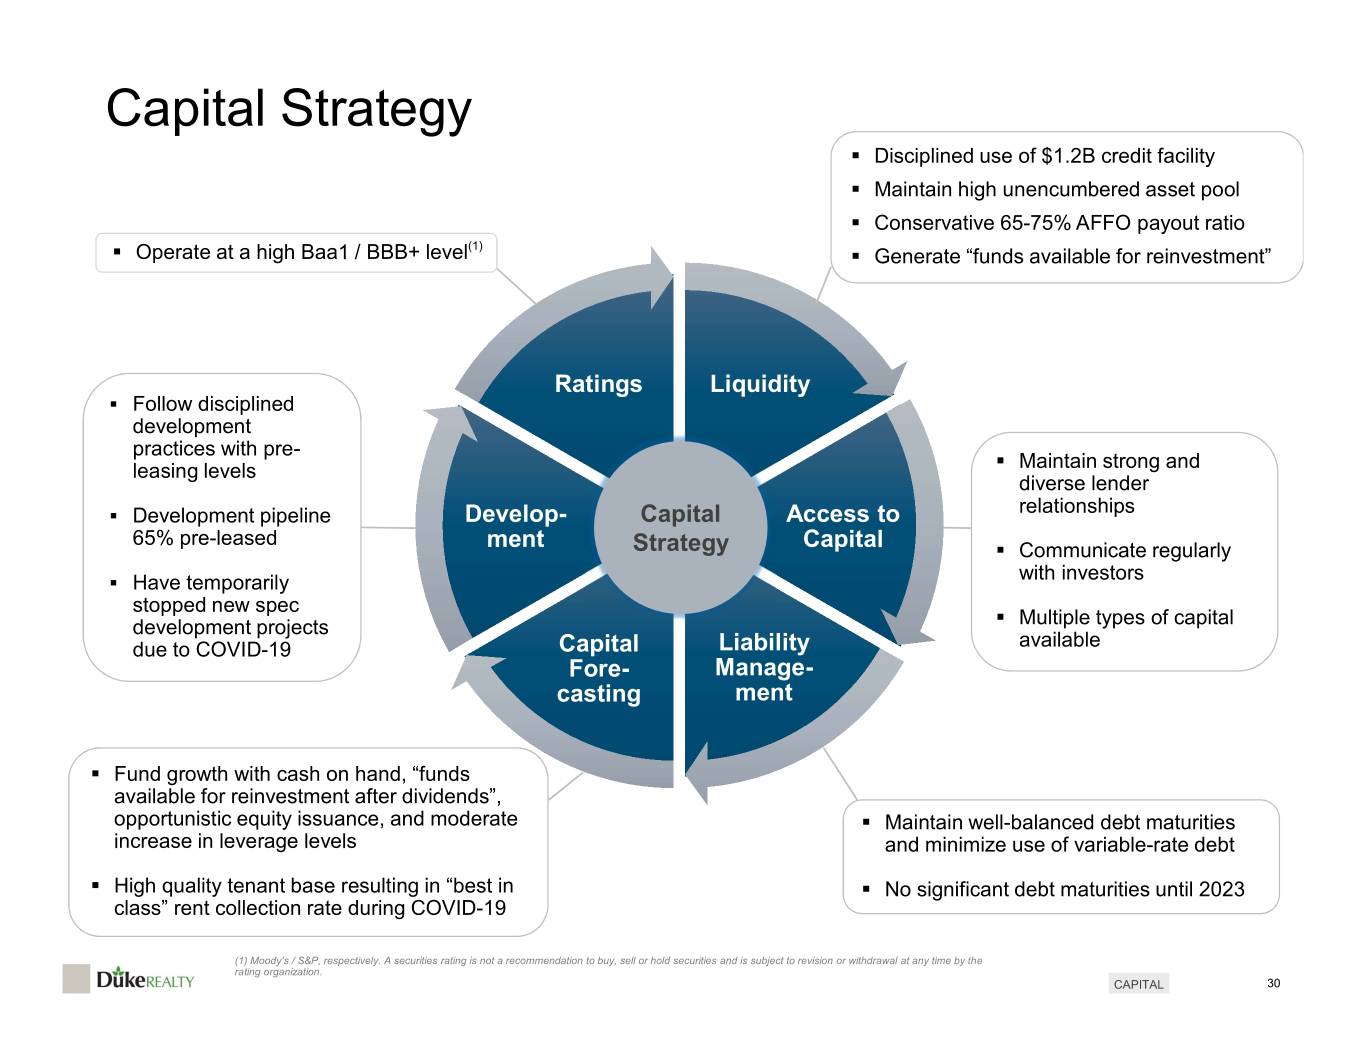
Capital Strategy . Disciplined use of $1.2B credit facility . Maintain high unencumbered asset pool . Conservative 65-75% AFFO payout ratio (1) . Operate at a high Baa1 / BBB+ level . Generate “funds available for reinvestment” Ratings Liquidity . Follow disciplined development practices with pre- leasing levels . Maintain strong and diverse lender relationships . Development pipeline Develop- Capital Access to 65% pre-leased ment Strategy Capital . Communicate regularly with investors . Have temporarily stopped new spec development projects . Multiple types of capital due to COVID-19 Capital Liability available Fore- Manage- casting ment . Fund growth with cash on hand, “funds available for reinvestment after dividends”, opportunistic equity issuance, and moderate . Maintain well-balanced debt maturities increase in leverage levels and minimize use of variable-rate debt . High quality tenant base resulting in “best in . No significant debt maturities until 2023 class” rent collection rate during COVID-19 (1) Moody’s / S&P, respectively. A securities rating is not a recommendation to buy, sell or hold securities and is subject to revision or withdrawal at any time by the rating organization. CAPITAL 30
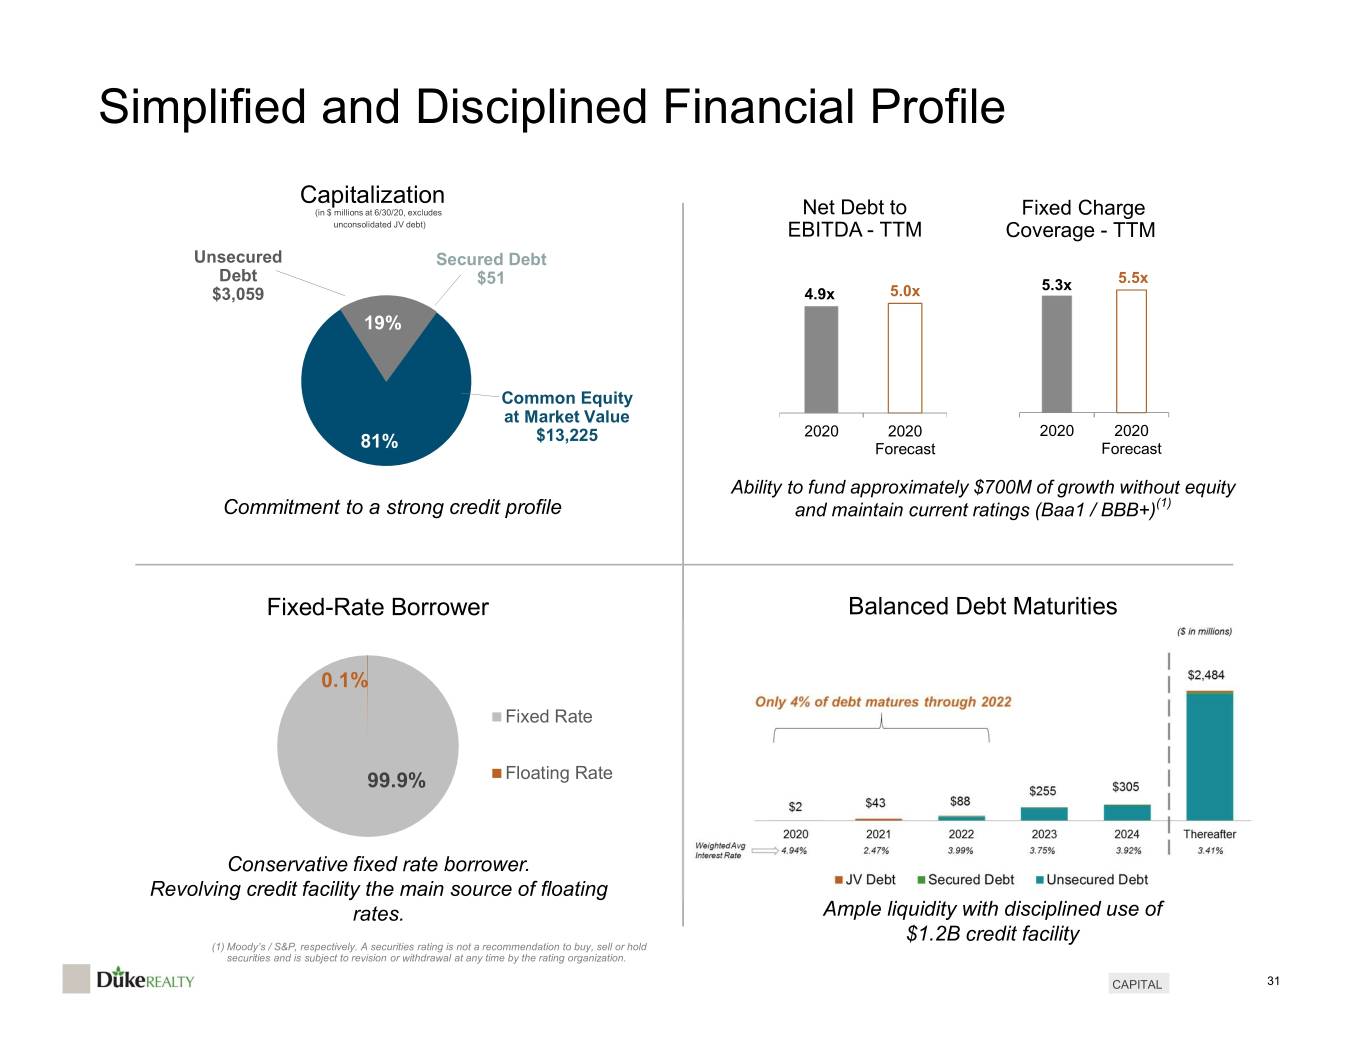
Simplified and Disciplined Financial Profile Capitalization (in $ millions at 6/30/20, excludes Net Debt to Fixed Charge unconsolidated JV debt) EBITDA - TTM Coverage - TTM Unsecured Secured Debt Debt $51 5.3x 5.5x $3,059 4.9x 5.0x 19% Common Equity at Market Value $13,225 2020 2020 2020 2020 81% Forecast Forecast Ability to fund approximately $700M of growth without equity Commitment to a strong credit profile and maintain current ratings (Baa1 / BBB+)(1) Fixed-Rate Borrower Balanced Debt Maturities 0.1% Fixed Rate 99.9% Floating Rate Conservative fixed rate borrower. Revolving credit facility the main source of floating rates. Ample liquidity with disciplined use of $1.2B credit facility (1) Moody’s / S&P, respectively. A securities rating is not a recommendation to buy, sell or hold securities and is subject to revision or withdrawal at any time by the rating organization. CAPITAL 31

Funding Growth While Controlling Leverage Funded Average 2020 Leverage (1) (2) CIP Yield Forecast(3) Embedded future $584M X 6.4% X 5.0x = $187M EBITDA creates additional debt Unstabilized capacity with no Projects In-Service(4) impact on leverage $287M X 6.6% X 5.0x = $95M “Funds Available for Annual Funds Available for Reinvestment $161M Reinvestment” and cash fund growth Cash at June 30, 2020 $30M with no leverage impact Leverage Neutral Growth Funding $473M Additional debt capacity in line with company EBITDA “Gross Up” to 5.25x $238M targets and well within current ratings level Growth funding without equity and maintain Baa1/BBB+(5) $711M (1) Construction in progress at June 30, 2020. (2) Represents average GAAP stabilized yield. (3) Represents 2020 forecast net debt to EBITDA - TTM at December 31, 2020. (4) Total occupancy of these projects is 21%. (5) Moody’s / S&P, respectively. A securities rating is not a recommendation to buy, sell or hold securities and is subject to revision or withdrawal at any time by the rating organization. CAPITAL 32

Duke Realty is Baa1/BBB+(3) Rated but Credit Metrics are at “A” Quality Levels REITs with “A” ratings: Debt + Preferred Debt + Preferred Net Debt to Fixed Charge(1)(2) to Mkt Cap(1) to GA(1) EBITDA(1)(2) PSA 16% PLD 26% PSA 0.6 PLD 8.5 PLD 18% EQR 30% DRE 4.7 PSA 6.9 DRE 19% DRE 31% CPT 4.7 AVB 5.6 AVB 26% AVB 31% PLD 4.8 DRE 5.6 CPT 26% CPT 32% EQR 4.9 CPT 5.0 EQR 27% PSA 34% AVB 5.0 EQR 4.8 O 28% O 35% O 5.3 O 4.7 FRT 42% FRT 46% SPG 7.4 SPG 4.0 SPG 59% SPG 56% FRT 9.1 FRT 2.3 1) Companies are per 6/30/20 Wells Fargo Research except PLD Net Debt to EBITDA and Fixed Charge which are per 6/30/20 company supplementals and DRE which is per our 6/30/20 Q2 supplemental report. 2) Quarter annualized; (3) Moody’s / S&P, respectively. A securities rating is not a recommendation to buy, sell or hold securities and is subject to revision or withdrawal at any time by the rating organization. CAPITAL 33

Solid AFFO Growth throughout Major Repositioning | Recent AFFO & Dividend Growth High Single Digits AFFO Growth Track Record Return of Capital Dividend Growth +8.5% 2017 – 2019 + 9.3% $2.9 Billion Regular Dividend Increase Return of Capital Q4 2019. Future increases expected to shareholders to correlate to AFFO growth since 2010 AFFO Outlook Payout Ratio AFFO / FFO Ratio Looking past 2020 and assuming a recovery, we continue to believe in 65 to 75% Best in class 90% potential for steady Conservative AFFO FFO converted to AFFO payout ratio mid-to-high Single Digit reflective of high-quality, low capex portfolio targeted range and overall operating strategy. Comparative AFFO Growth peers(2) - 800 bps lower on same ratio. Note: AFFO outlook statement assumes stable economic conditions and market fundamentals. Annual net disposition (2) Three year average AFFO / CoreFFO ratio computed on a share adjusted basis as reported in company supplementals; activity (dispos less acquisitions) expected to be lower than previous years; actual results may vary. Removed disposition gains from AFFO (from land and development projects contributed to JV’s or sold); EGP figure per - Historical or projected AFFO metrics on a share adjusted basis; 2020E based on effective DRE guidance mid-point. 2020 consensus AFFO Median / FFO consensus mean. Source: First Call. Peer Set EGP, FR, & PLD AFFO & DIVIDENDS 34
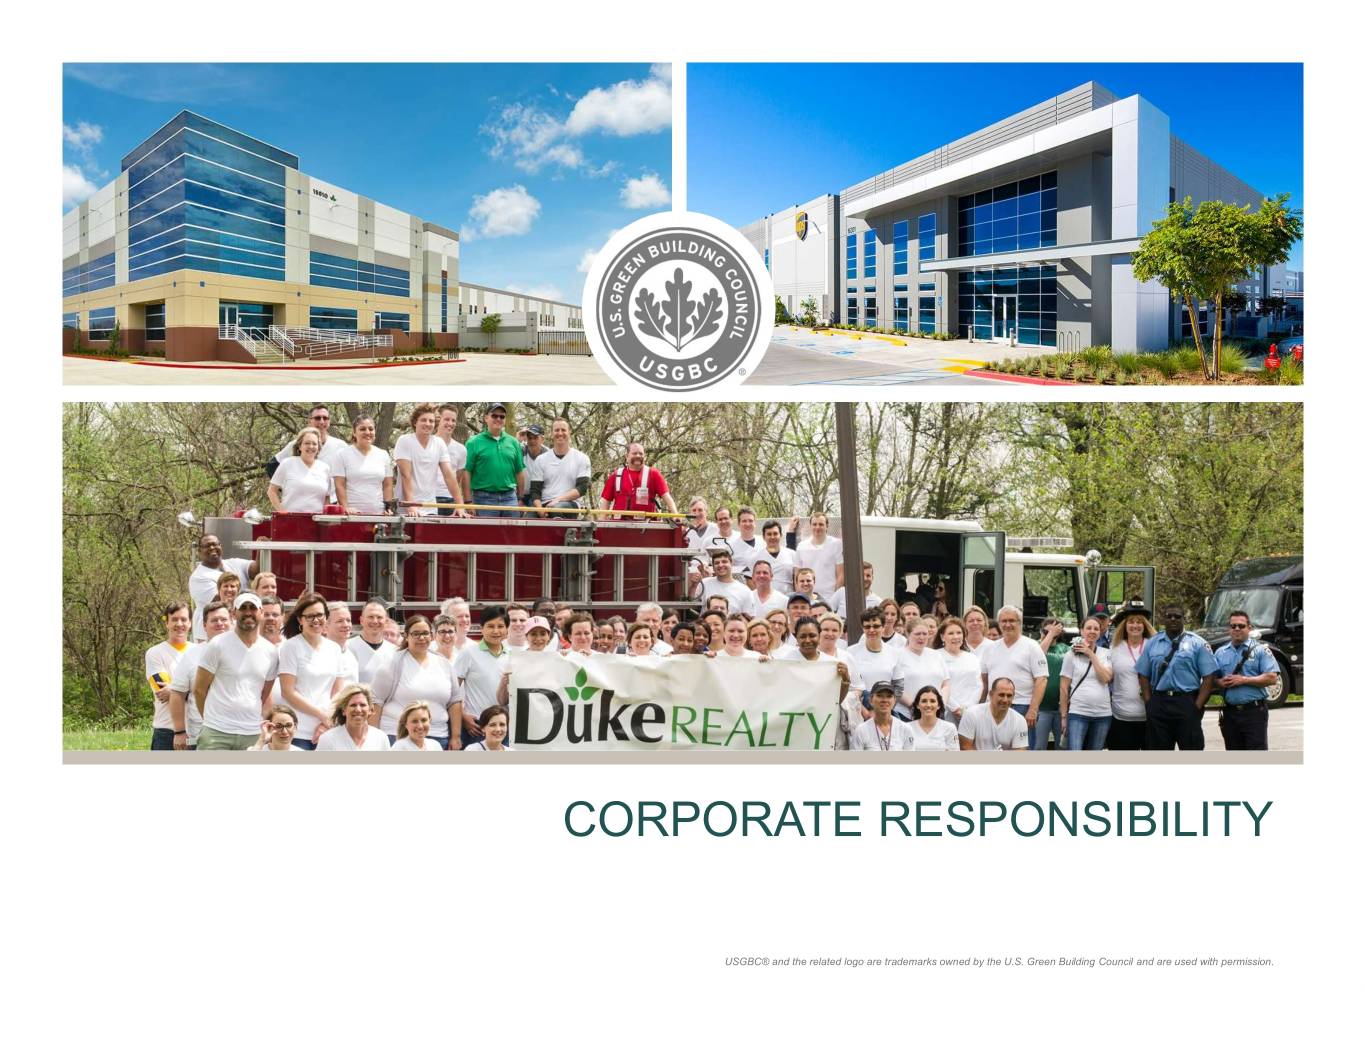
CORPORATE RESPONSIBILITY USGBC® and the related logo are trademarks owned by the U.S. Green Building Council and are used with permission.
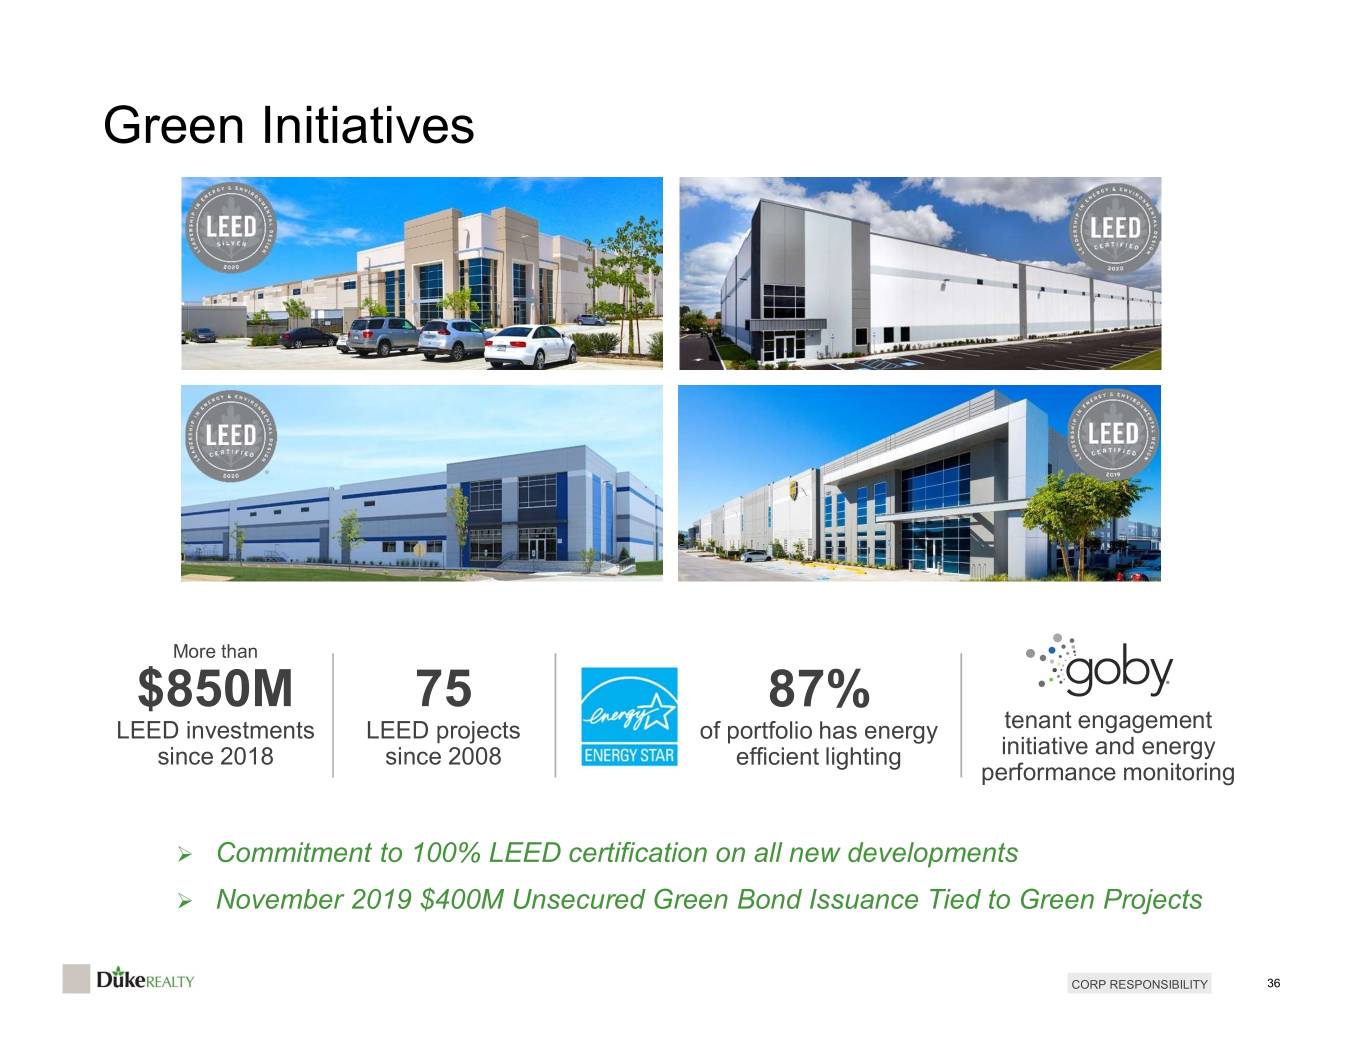
Green Initiatives More than $850M 75 87% LEED investments LEED projects of portfolio has energy tenant engagement since 2018 since 2008 efficient lighting initiative and energy performance monitoring Commitment to 100% LEED certification on all new developments November 2019 $400M Unsecured Green Bond Issuance Tied to Green Projects CORP RESPONSIBILITY 36

Commitment to Social and Governance Top 20% 50% 20% 8,400 women in upper diversity of indepen- governance and total hours management dent directors social rankings* volunteering • Annual board of directors elections ISS QualityScore** since 2002. By laws incorporate proxy access provision of “3% - 3 yrs - 20%”. Social • Incorporate elements of SASB disclosure framework in public filings. Governance • Community service, wellness and diversity & inclusion part of culture for 0 2 4 6 8 10 over 16 years. Lower Risk Higher Risk • Wellness program helps to reduce turnover and create G&A savings. Note: Figures represent 2019-2020 activities. *Ranked by Green Street Advisors and ISS. **ISS QualityScore based on four “pillars” - Board Structure, Shareholder Rights, Compensation and Audit. In aggregate, over 100 variables drive the composite score. Peer set for “G” S&P 500, for “S” is REIT GICS. CORP RESPONSIBILITY 37

Industry Recognitions & Affiliations • Gold Winner of Nareit’s Dividends Through Diversity & Inclusion corporate award and individual award for Chairman and CEO • First logistics REIT CEO to sign Action for Diversity & Inclusion pledge • Global Real Estate Sustainability Benchmark (GRESB) member • 2020 Women on Boards for nine consecutive years • Best Places to work in Chicago (1st), Pennsylvania (2nd), Orange County (4th), and Dallas (11th) • American Heart Association’s Workplace Health Achievement Gold level winner three consecutive years • American Red Cross partner and Disaster Responder member Note: Information reflects 2019-2020 recognitions. CORP RESPONSIBILITY 38
WHY DUKE REALTY?

The Leading Domestic-only Logistics REIT > 45 Years of Experience . Market leadership and trusted advisor to our customers with long-term relationships. Leading Developer and . Portfolio suited for e-commerce and traditional distribution; concentrated in Tier 1 markets with newest portfolio in sector with low capex; strong tenants. Owner of State-of-the-Art Logistics Facilities . Best-in-class, vertically integrated development platform drives incremental growth. . Expected rapid decline in supply, set up with historical lows in vacancy and secular demand Long Term Fundamentals . Shifting consumer habits creating growth ripple effect throughout the entire supply chain; Outlook Very Strong global pandemic boosting already high growth prospects . Ability to fund approximately $700 million of growth without equity and reach Duke’s Fortress Balance Sheet with target leverage level Ample Liquidity for Growth . Baa1/BBB+ with no significant debt maturities until 2023(1). . 2017 - 2019 AFFO growth 8.5%, still comfortable with mid-to-high single digit Proven Financial Performance growth in AFFO through cycles and Strong Outlook . 9.3% dividend increase Q4 2019; with future increases correlated to AFFO growth. . Recent monthly rent collections at top of peers – indicative of relative quality Responsible Corporate Citizen . Developed 55 LEED-certified facilities; 19 projects in progress of LEED certification. 100% LEED commitment. with ESG Embedded in Culture for 3 Decades . Community service, wellness and diversity programs for over 16 years. . Top-tier governance per ISS and Green Street. (1) Moody’s / S&P, respectively. A securities rating is not a recommendation to buy, sell or hold securities and is subject to revision or withdrawal at any time by the rating organization. WHY DUKE REALTY 40
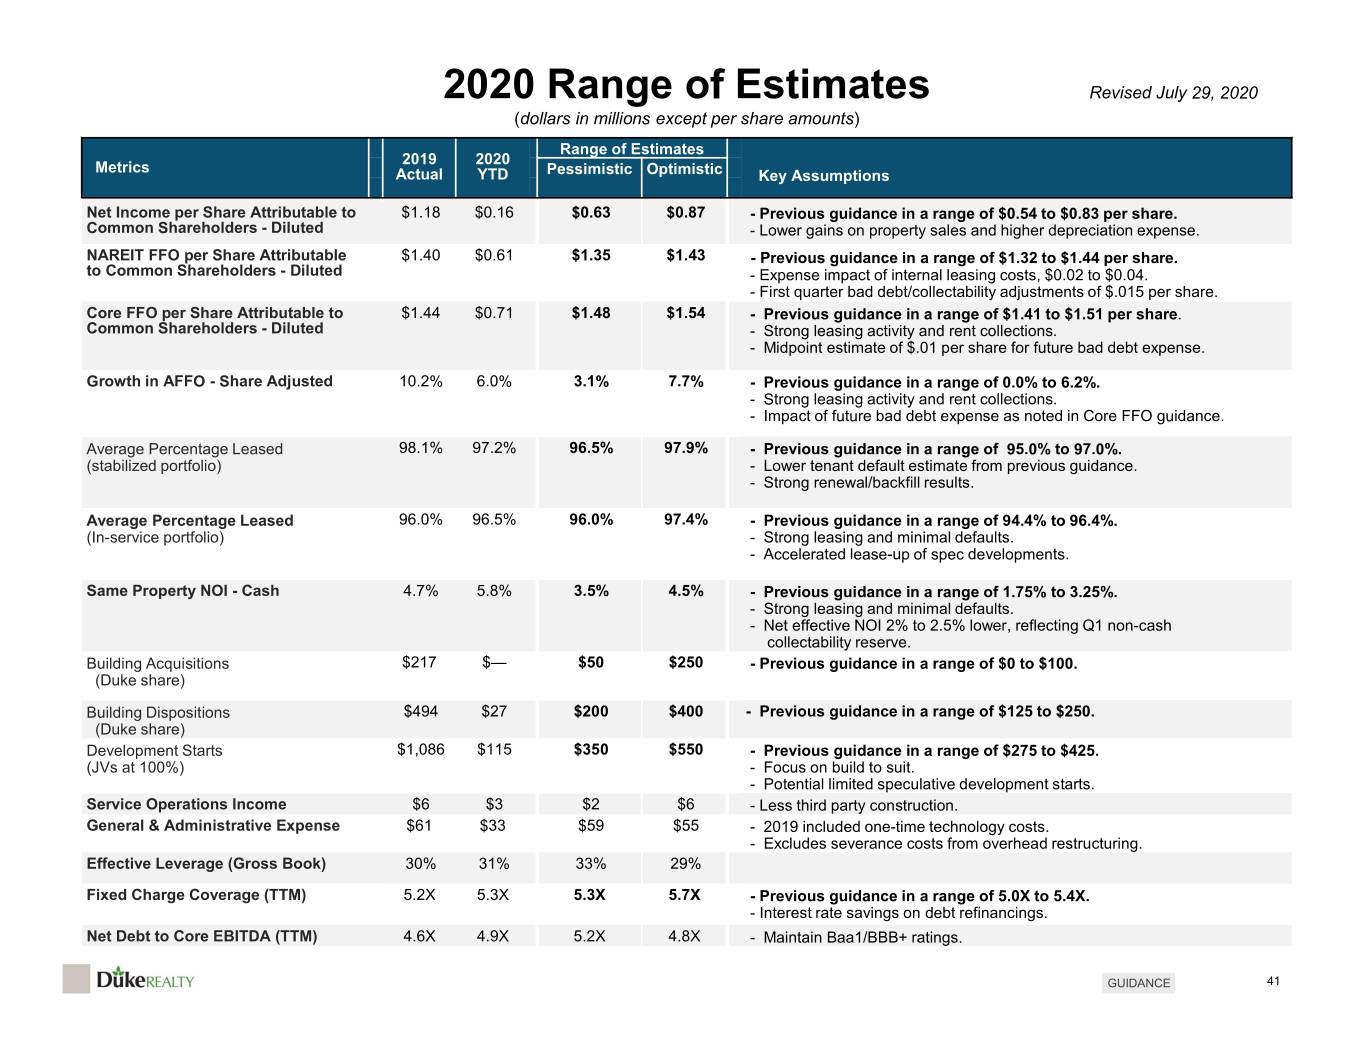
2020 Range of Estimates Revised July 29, 2020 (dollars in millions except per share amounts) Range of Estimates 2019 2020 Metrics Actual YTD Pessimistic Optimistic Key Assumptions Net Income per Share Attributable to $1.18 $0.16 $0.63 $0.87 - Previous guidance in a range of $0.54 to $0.83 per share. Common Shareholders - Diluted - Lower gains on property sales and higher depreciation expense. NAREIT FFO per Share Attributable $1.40 $0.61 $1.35 $1.43 - Previous guidance in a range of $1.32 to $1.44 per share. to Common Shareholders - Diluted - Expense impact of internal leasing costs, $0.02 to $0.04. - First quarter bad debt/collectability adjustments of $.015 per share. Core FFO per Share Attributable to $1.44 $0.71 $1.48 $1.54 - Previous guidance in a range of $1.41 to $1.51 per share. Common Shareholders - Diluted - Strong leasing activity and rent collections. - Midpoint estimate of $.01 per share for future bad debt expense. Growth in AFFO - Share Adjusted 10.2% 6.0% 3.1% 7.7% - Previous guidance in a range of 0.0% to 6.2%. - Strong leasing activity and rent collections. - Impact of future bad debt expense as noted in Core FFO guidance. Average Percentage Leased 98.1% 97.2% 96.5% 97.9% - Previous guidance in a range of 95.0% to 97.0%. (stabilized portfolio) - Lower tenant default estimate from previous guidance. - Strong renewal/backfill results. Average Percentage Leased 96.0% 96.5% 96.0% 97.4% - Previous guidance in a range of 94.4% to 96.4%. (In-service portfolio) - Strong leasing and minimal defaults. - Accelerated lease-up of spec developments. Same Property NOI - Cash 4.7% 5.8% 3.5% 4.5% - Previous guidance in a range of 1.75% to 3.25%. - Strong leasing and minimal defaults. - Net effective NOI 2% to 2.5% lower, reflecting Q1 non-cash collectability reserve. Building Acquisitions $217 $— $50 $250 - Previous guidance in a range of $0 to $100. (Duke share) Building Dispositions $494 $27 $200 $400 - Previous guidance in a range of $125 to $250. (Duke share) Development Starts $1,086 $115 $350 $550 - Previous guidance in a range of $275 to $425. (JVs at 100%) - Focus on build to suit. - Potential limited speculative development starts. Service Operations Income $6 $3 $2 $6 - Less third party construction. General & Administrative Expense $61 $33 $59 $55 - 2019 included one-time technology costs. - Excludes severance costs from overhead restructuring. Effective Leverage (Gross Book) 30% 31% 33% 29% Fixed Charge Coverage (TTM) 5.2X 5.3X 5.3X 5.7X - Previous guidance in a range of 5.0X to 5.4X. - Interest rate savings on debt refinancings. Net Debt to Core EBITDA (TTM) 4.6X 4.9X 5.2X 4.8X - Maintain Baa1/BBB+ ratings. GUIDANCE 41
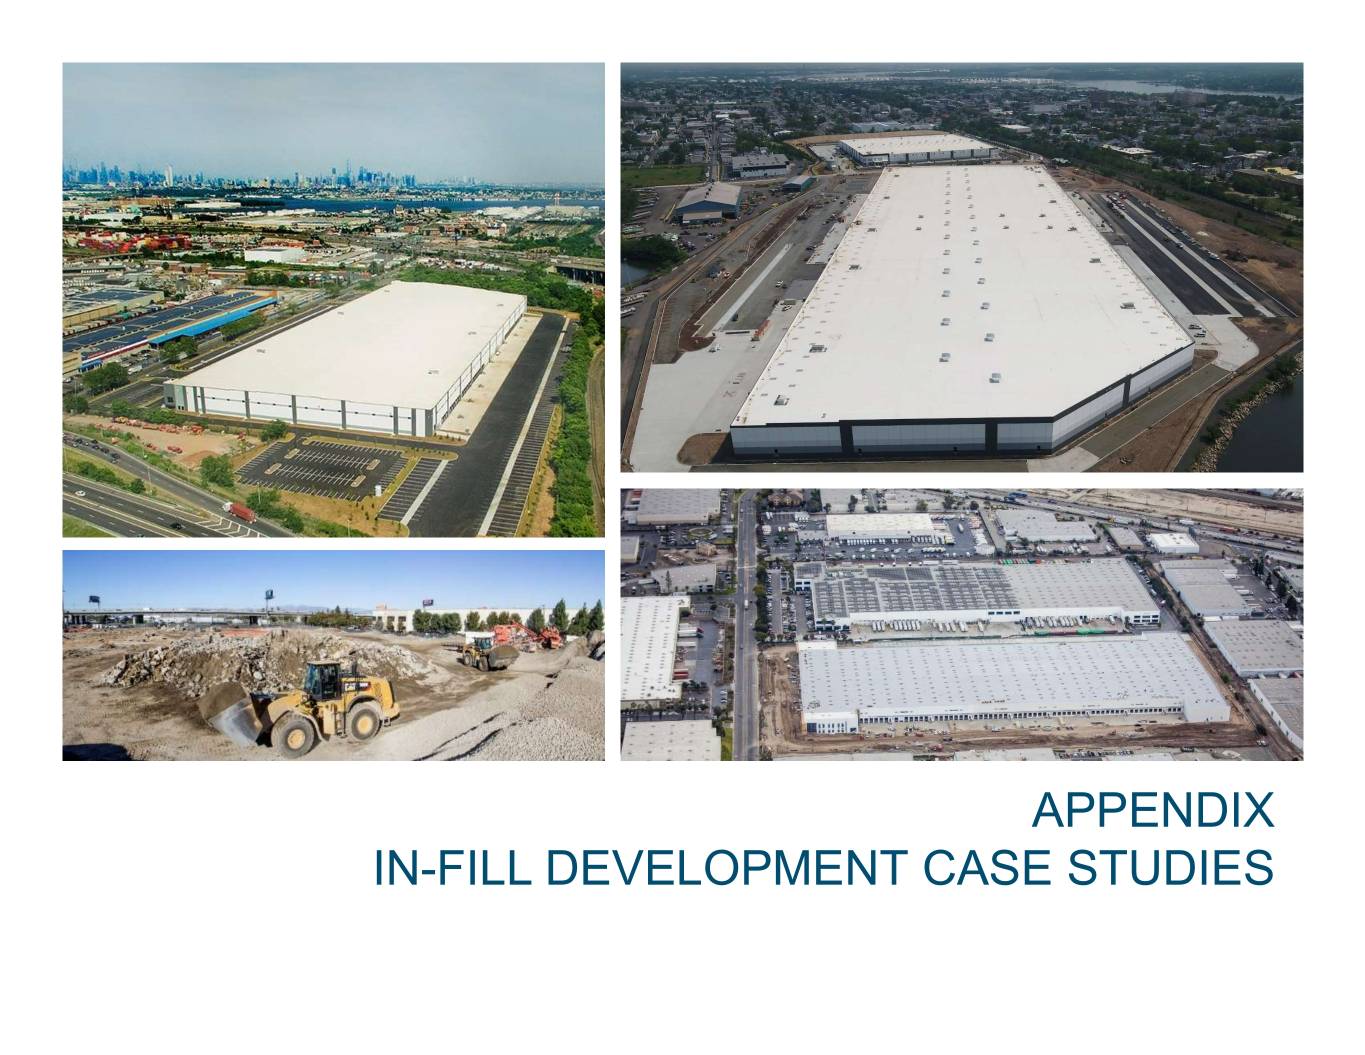
Lockport 16328 / 16410 / 16508 (3 buildings, 803,000 SF), I-55 Submarket, Chicago, IL APPENDIX IN-FILL DEVELOPMENT CASE STUDIES

Infill Redevelopment – Chicago O’Hare Submarket • Off market deal acquired in Q2 2019. In Q3 2019 commenced demolition of existing structure for a class A, 32’ clear height spec project. Delivered Q1 2020. • Contaminated soil was removed; property enrolled in a voluntary clean-up program to receive an NFR from EPA 901 Chase Avenue Elk Grove, IL • O’Hare submarket vacancy below 4%; historical 5-yr rent growth for infill properties was over 18% ORD • ~ 20% value creation expected 154,000 SF Delivered Q1 2020 901 Chase Avenue | Elk Grove Village, IL • Former manufacturing facility DEVELOPMENT 43
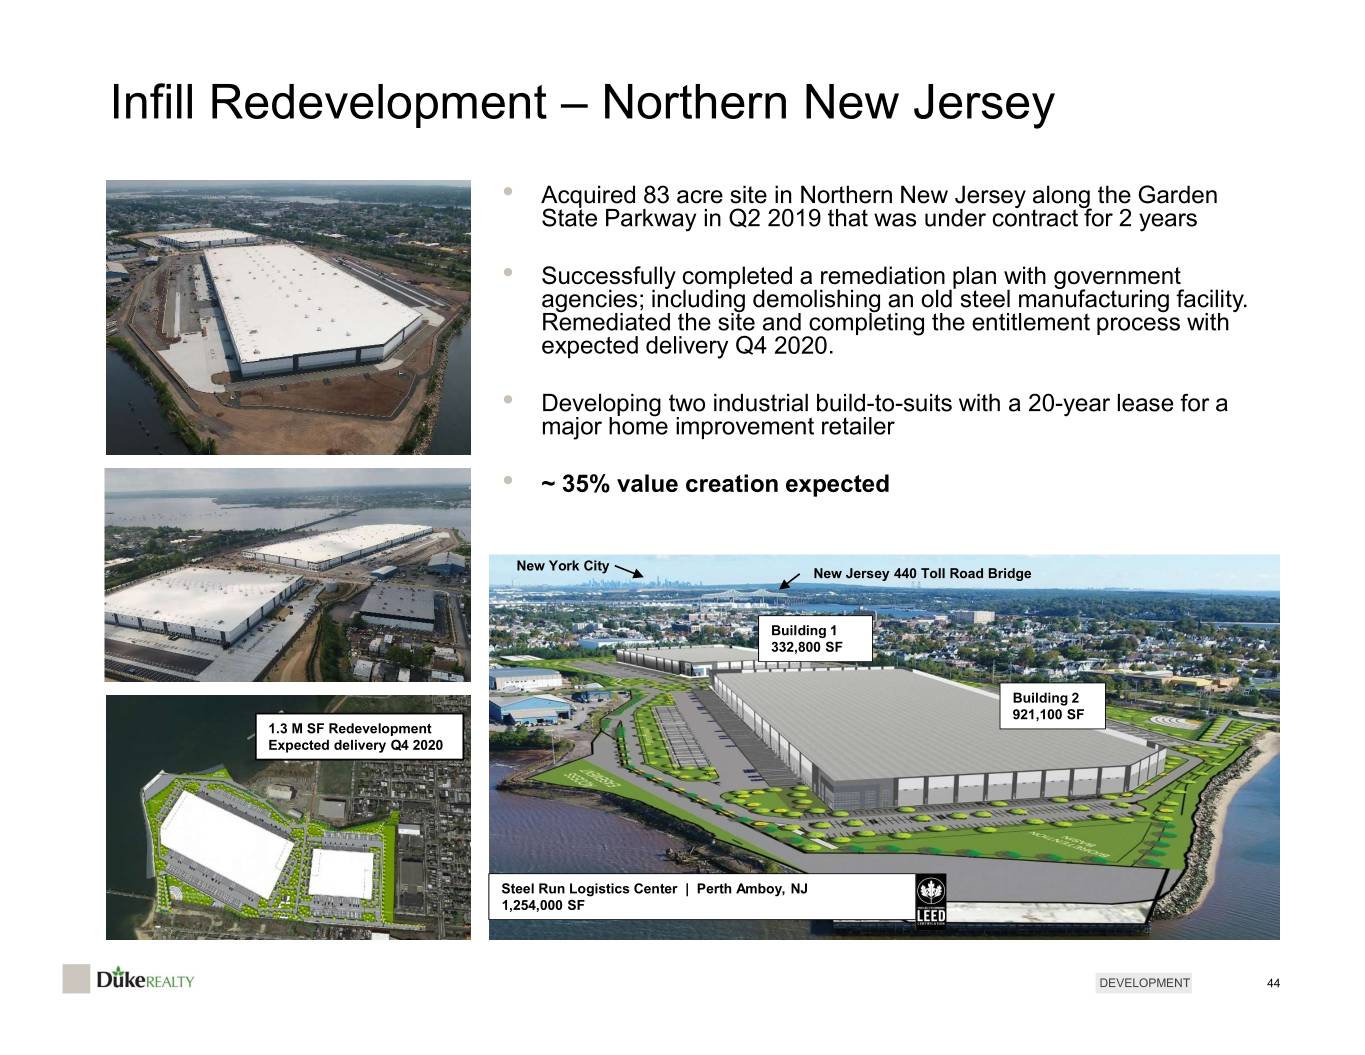
Infill Redevelopment – Northern New Jersey • Acquired 83 acre site in Northern New Jersey along the Garden State Parkway in Q2 2019 that was under contract for 2 years • Successfully completed a remediation plan with government agencies; including demolishing an old steel manufacturing facility. Remediated the site and completing the entitlement process with expected delivery Q4 2020. • Developing two industrial build-to-suits with a 20-year lease for a major home improvement retailer • ~ 35% value creation expected New York City New Jersey 440 Toll Road Bridge Building 1 332,800 SF Building 2 921,100 SF 1.3 M SF Redevelopment Expected delivery Q4 2020 Steel Run Logistics Center | Perth Amboy, NJ 1,254,000 SF DEVELOPMENT 44

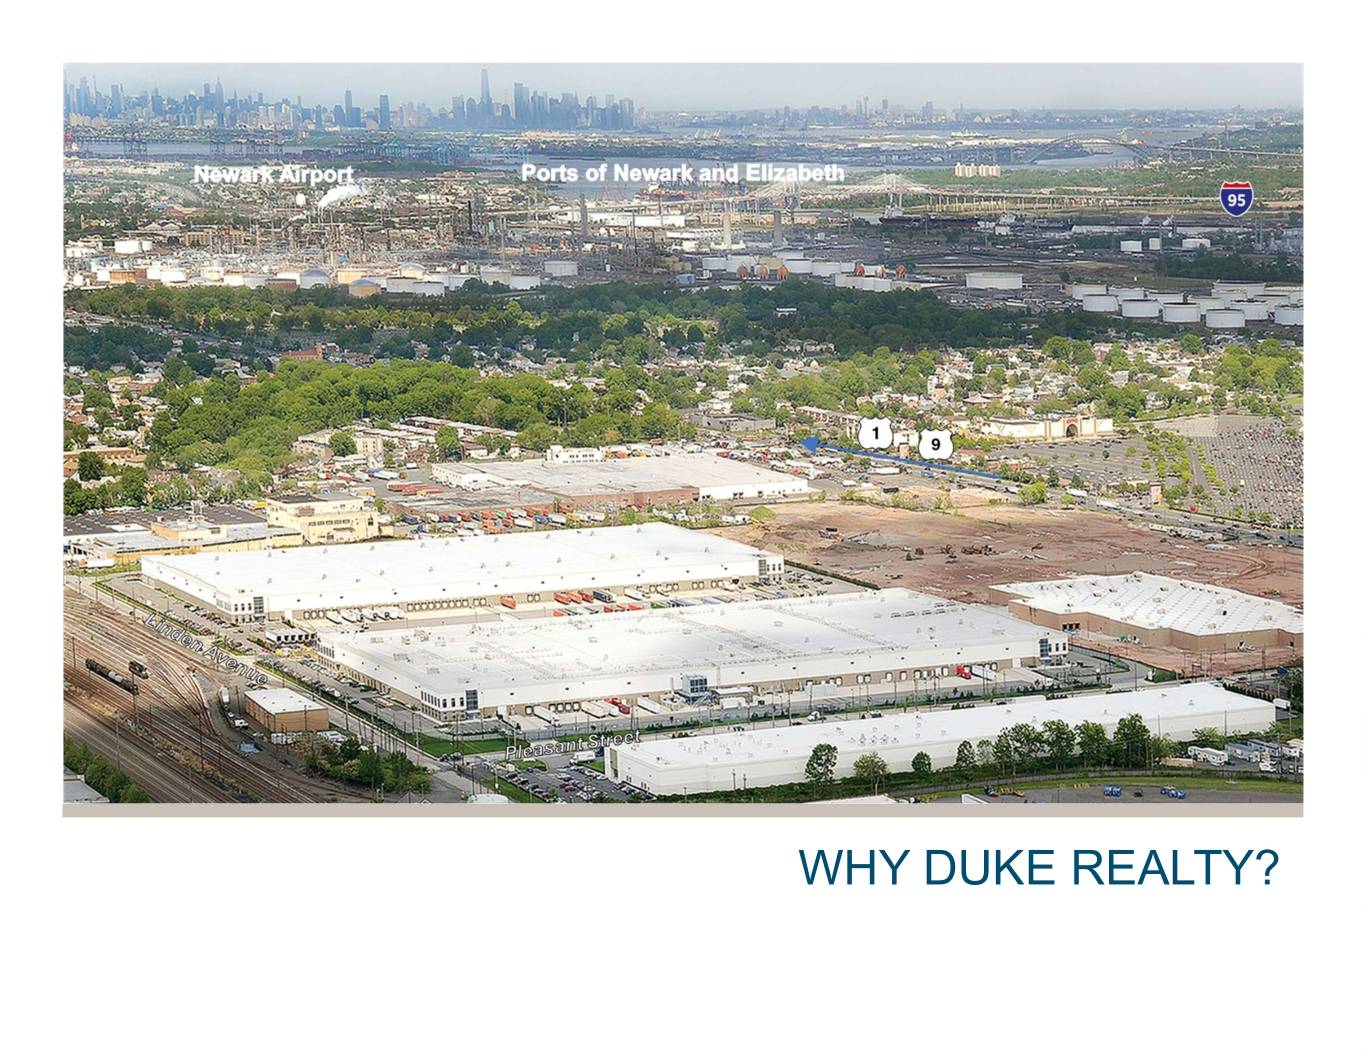
Infill Redevelopment – Northern New Jersey • As part of a large 2017 Before After portfolio acquisition, DRE acquired the right to develop a 32 acre, prime 429 Delancy Street infill “last mile” location in 662,000 SF Speculative Built Delivered Q4 2019; 100% Leased the Northern New Jersey Newark submarket • Commenced development in late 2018 for 40’ clear height, speculative facility. 2 miles from Newark Intl. Airport In Q4 2019, facility and Ports of Newark and Elizabeth delivered and leased for 12 years to a major e- commerce retailer. • 662,000 square foot fulfillment center being used for both inventory replenishment of smaller facilities and direct (B2C) order fulfillment • The modern building features are truly unique to the submarket. • In this submarket, only 7 of 733 facilities (4.1%) have > 30’ clear height and built after 1997. • Expected to achieve LEED® certification • ~ 27% value creation DEVELOPMENT 45
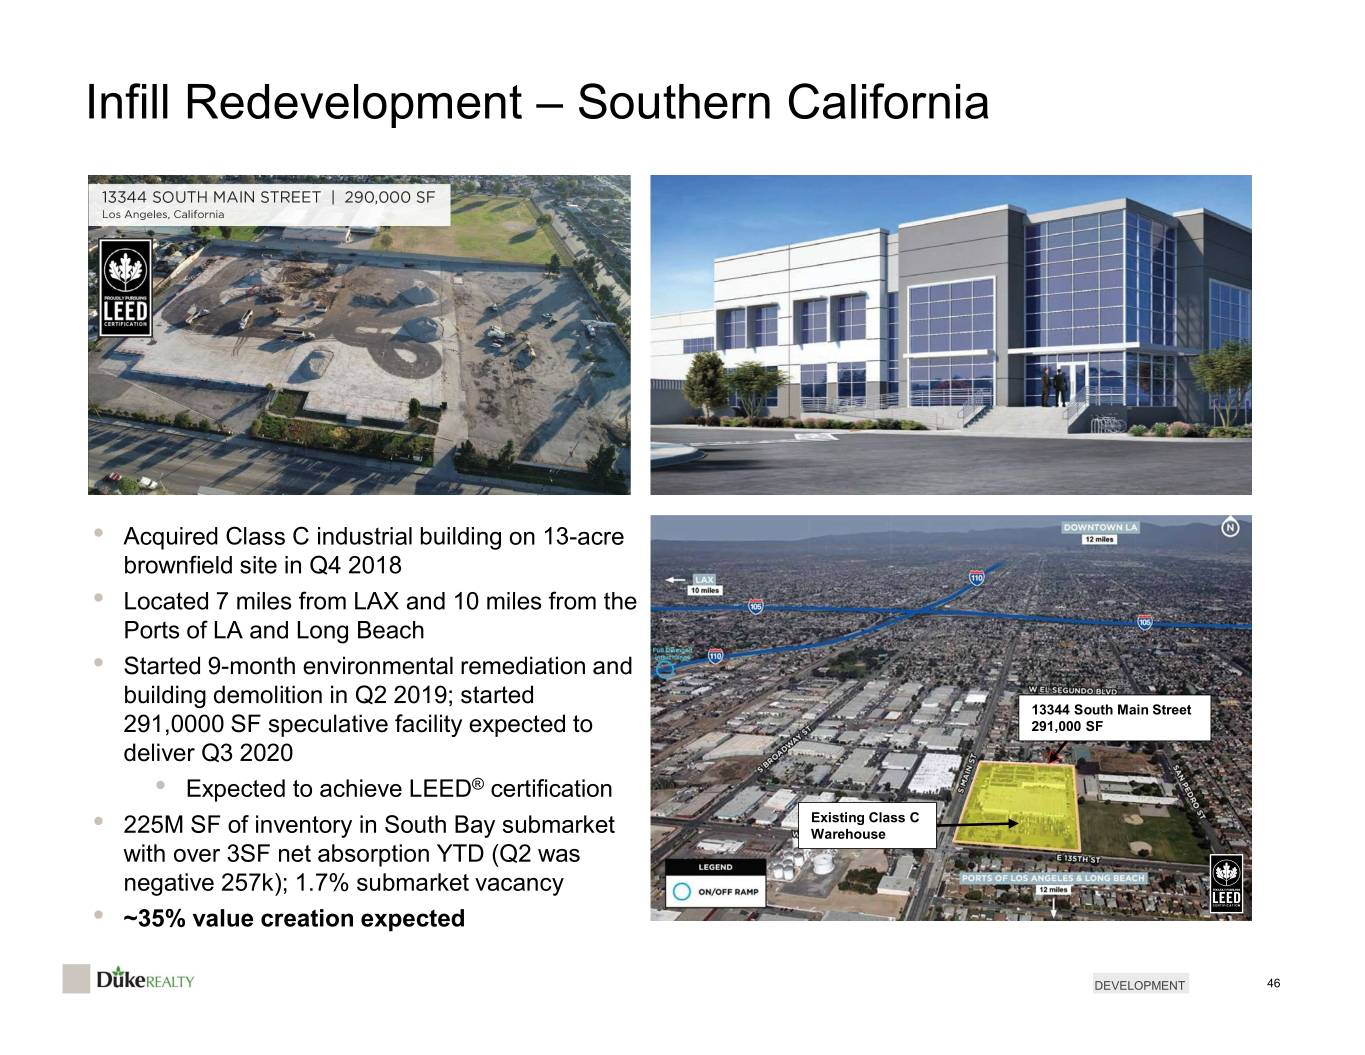
Infill Redevelopment – Southern California • Acquired Class C industrial building on 13-acre brownfield site in Q4 2018 • Located 7 miles from LAX and 10 miles from the Ports of LA and Long Beach • Started 9-month environmental remediation and building demolition in Q2 2019; started 13344 South Main Street 291,0000 SF speculative facility expected to 291,000 SF deliver Q3 2020 • Expected to achieve LEED® certification Existing Class C • 225M SF of inventory in South Bay submarket Warehouse with over 3SF net absorption YTD (Q2 was negative 257k); 1.7% submarket vacancy • ~35% value creation expected DEVELOPMENT 46

Infill Build-to-Suit Developments – Atlanta Airport 2929 ROOSEVELT HIGHWAY | 500,000 SF 1000 LOGISTICS WAY | 664,000 SF CAMP CREEK 4850 | 210,000 SF HWC Logistics Home Depot Porsche Cars NA Expected delivery Q1 2021 DEVELOPMENT 47
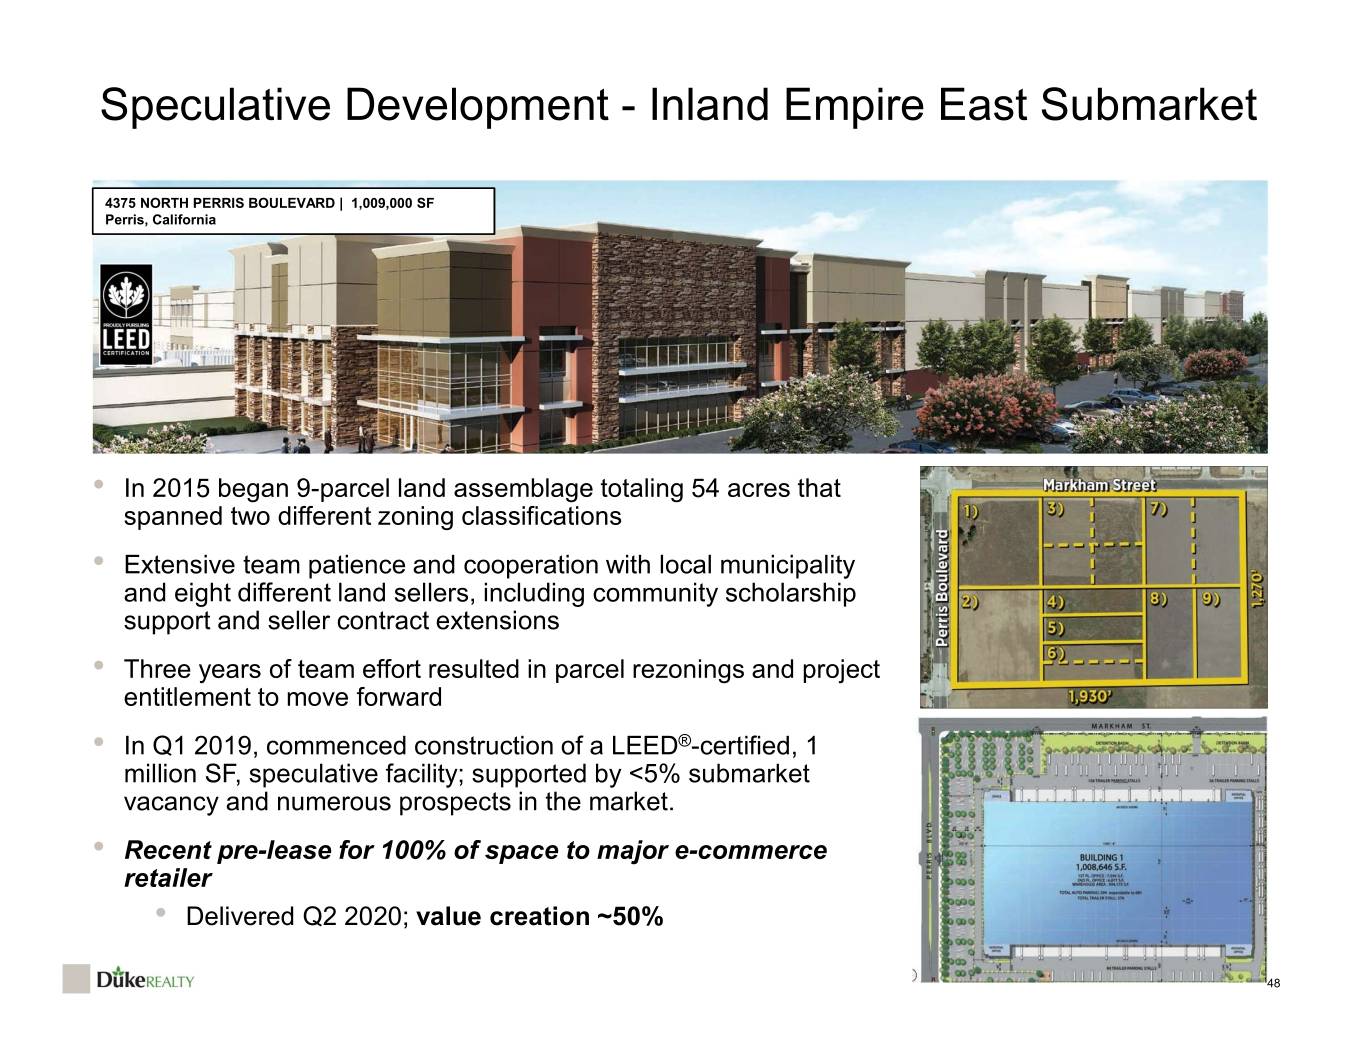
Speculative Development - Inland Empire East Submarket 4375 NORTH PERRIS BOULEVARD | 1,009,000 SF Perris, California • In 2015 began 9-parcel land assemblage totaling 54 acres that spanned two different zoning classifications • Extensive team patience and cooperation with local municipality and eight different land sellers, including community scholarship support and seller contract extensions • Three years of team effort resulted in parcel rezonings and project entitlement to move forward • In Q1 2019, commenced construction of a LEED®-certified, 1 million SF, speculative facility; supported by <5% submarket vacancy and numerous prospects in the market. • Recent pre-lease for 100% of space to major e-commerce retailer • Delivered Q2 2020; value creation ~50% 48
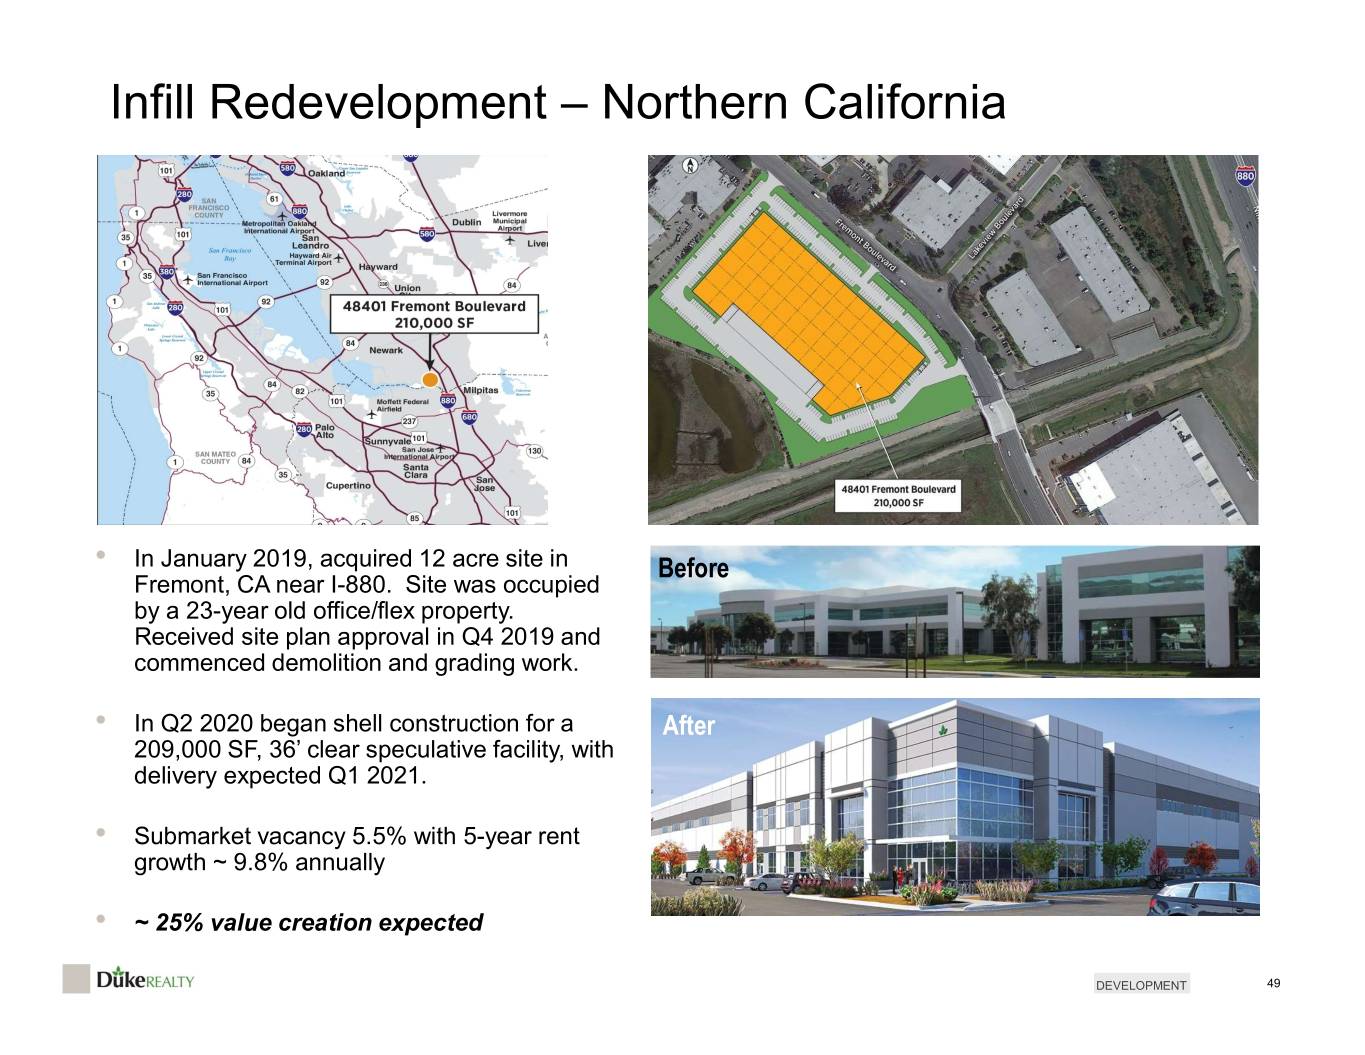
Infill Redevelopment – Northern California • In January 2019, acquired 12 acre site in Before Fremont, CA near I-880. Site was occupied by a 23-year old office/flex property. Received site plan approval in Q4 2019 and commenced demolition and grading work. • In Q2 2020 began shell construction for a After 209,000 SF, 36’ clear speculative facility, with delivery expected Q1 2021. • Submarket vacancy 5.5% with 5-year rent growth ~ 9.8% annually • ~ 25% value creation expected DEVELOPMENT 49

Infill Redevelopments – Southern California Mid-Counties & South Bay Submarkets • 2015 infill acquisition of brownfield land site adjacent to existing Duke Realty facility 11600 Alameda St • Successfully completed a remediation plan with 201,000 SF government agencies, demolished an old manufacturing facility, remediated the site and completed the entitlement process 2700 East Imperial Hwy • Estimated profit margin >80% 323,000 SF • Early 2017 commenced 201,000 SF spec development, late 2017 signed lease for 100% of space 5 7 Anaheim (7 miles) • 2015 infill acquisition of brownfield land site adjacent to existing Duke Realty facility 5 • Successfully worked through site remediation contingencies and various government approvals 16501 Trojan Way 498,000 SF • Late 2016 executed 477,000 SF build-to-suit project with UPS Logistics • Project delivered April 2018 to serve as last Ports of mile B2B and B2C facility for Orange and Los Angeles & Long Beach Los Angeles counties (15 miles) 16301 Trojan Way • Estimated profit margin >40% 477,000 SF Los Angeles International Airport (LAX) (23 miles) DEVELOPMENT 50

Infill Redevelopment — Northern New Jersey One Paddock Street | Avenel, NJ 2020 Under Development ONE PADDOCK STREET | 183,000 SF Avenel, New Jersey One Paddock St 183,000 SF DEVELOPMENT 51
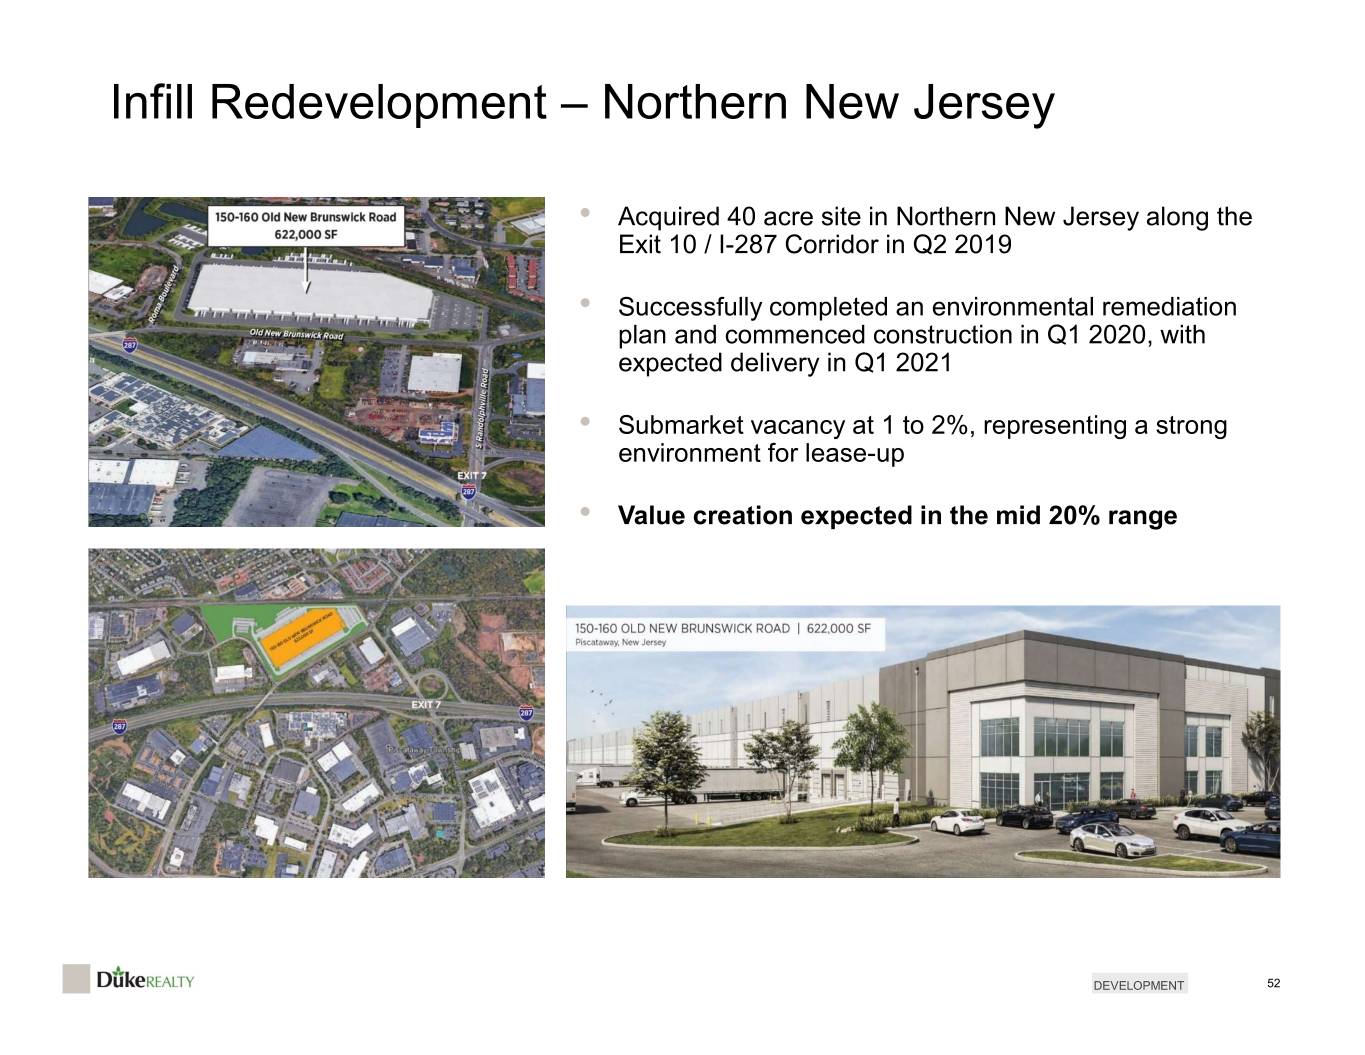
Infill Redevelopment – Northern New Jersey • Acquired 40 acre site in Northern New Jersey along the Exit 10 / I-287 Corridor in Q2 2019 • Successfully completed an environmental remediation plan and commenced construction in Q1 2020, with expected delivery in Q1 2021 • Submarket vacancy at 1 to 2%, representing a strong environment for lease-up • Value creation expected in the mid 20% range DEVELOPMENT 52
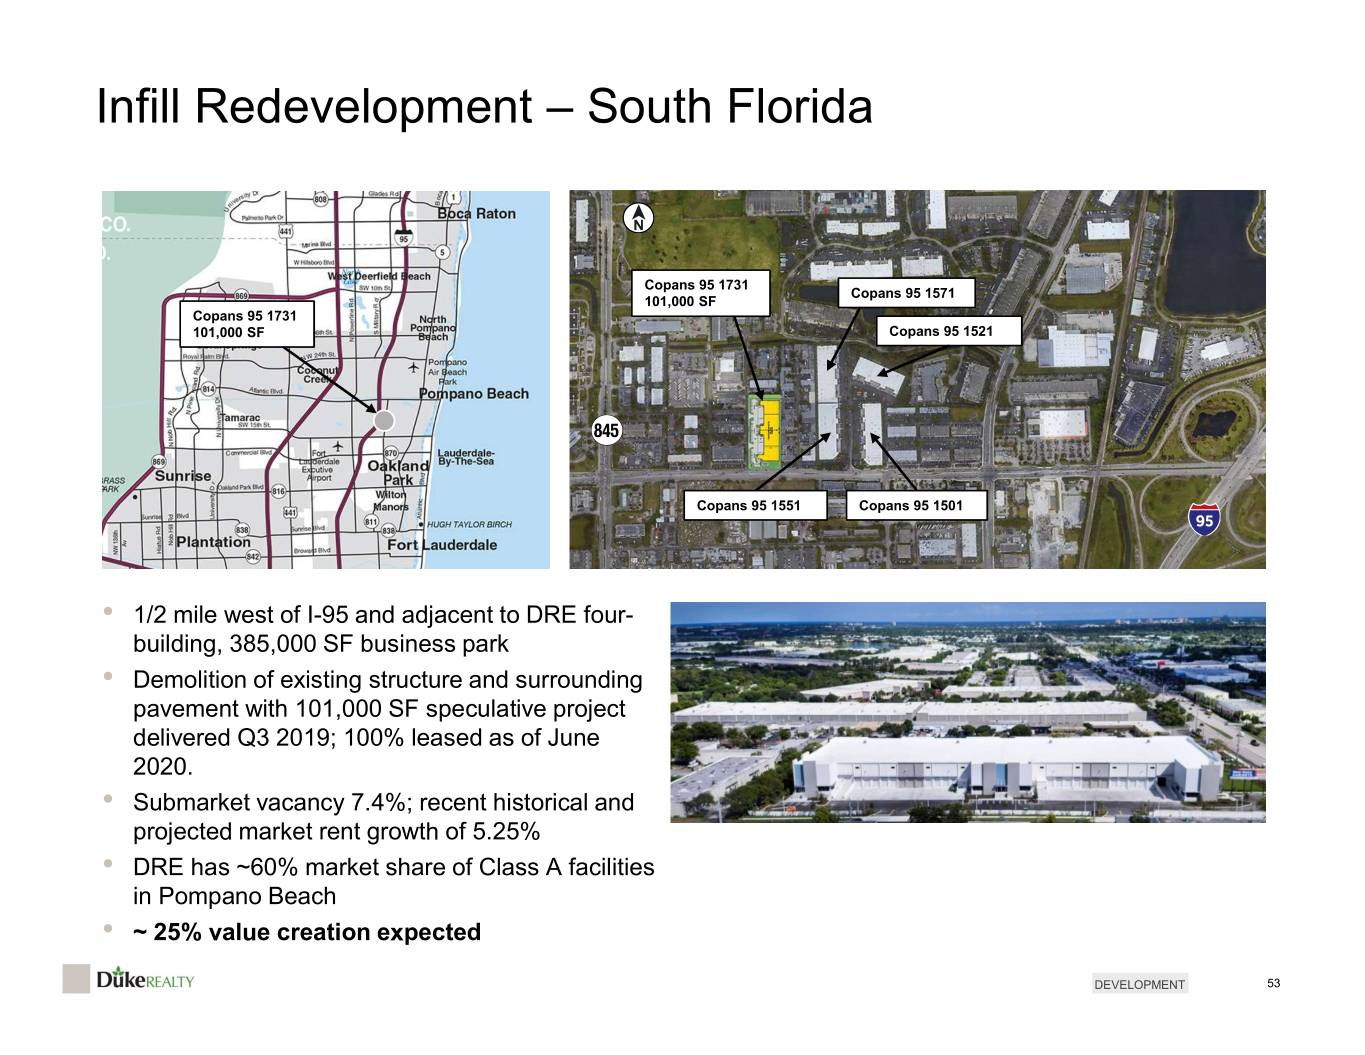
Infill Redevelopment – South Florida Copans 95 1731 Copans 95 1571 101,000 SF Copans 95 1731 101,000 SF Copans 95 1521 Powerline Powerline Road Copans 95 1551 Copans 95 1501 West Copans Road North Andrews North • 1/2 mile west of I-95 and adjacent to DRE four- building, 385,000 SF business park • Demolition of existing structure and surrounding pavement with 101,000 SF speculative project delivered Q3 2019; 100% leased as of June 2020. • Submarket vacancy 7.4%; recent historical and projected market rent growth of 5.25% • DRE has ~60% market share of Class A facilities in Pompano Beach • ~ 25% value creation expected DEVELOPMENT 53

Definitions Supplemental Performance Measures Funds from Operations (“FFO”): FFO is a non-GAAP performance measure computed in accordance with standards established by the National Association of Real Estate Investment Trusts (“NAREIT”). It is calculated as net income attributable to common shareholders computed in accordance with generally accepted accounting principles (“GAAP"), excluding depreciation and amortization related to real estate, gains and losses on sales of real estate assets (including real estate assets incidental to our business) and related taxes, gains and losses from change in control, impairment charges related to real estate assets (including real estate assets incidental to our business) and similar adjustments for unconsolidated joint ventures and partially owned consolidated entities. We believe FFO to be most directly comparable to net income attributable to common shareholders as defined by GAAP. FFO does not represent a measure of liquidity, nor is it indicative of funds available for our cash needs, including our ability to make cash distributions to shareholders. Core Funds from Operations (“Core FFO”): Core FFO is computed as FFO adjusted for certain items that are generally non-cash in nature and that can create significant earnings volatility and do not directly relate to our core business operations. The adjustments include tax expenses or benefits related to (i) changes in deferred tax asset valuation allowances, (ii) changes in tax exposure accruals that were established as the result of the previous adoption of new accounting principles, or (iii) taxable income (loss) related to other items excluded from FFO or Core FFO (collectively referred to as “other income tax items”), gains or losses on debt transactions, gains or losses from involuntary conversion from weather events or natural disasters, promote income, severance and other charges related to major overhead restructuring activities and the expense impact of costs attributable to successful leasing activities. Although our calculation of Core FFO differs from NAREIT’s definition of FFO and may not be comparable to that of other REITs and real estate companies, we believe it provides a meaningful supplemental measure of our operating performance. Adjusted Funds from Operations (“AFFO”): AFFO is defined by the Company as the Core FFO (as defined above), less recurring building improvements and total second generation capital expenditures (the leasing of vacant space that had previously been under lease by the Company is referred to as second generation lease activity) related to leases commencing during the reporting period, and adjusted for certain non-cash items including straight line rental income and expense, non-cash components of interest expense including interest rate hedge amortization, stock compensation expense and after similar adjustments for unconsolidated partnerships and joint ventures. EBITDA for Real Estate ("EBITDAre"): EBITDAre is a non-GAAP supplemental performance measure, which is defined by NAREIT as net income (computed in accordance with GAAP), before interest, taxes, depreciation and amortization ("EBITDA") adjusted to exclude gains and losses on sales of real estate assets (including real estate assets incidental to our business), gains and losses from change of control, impairment charges related to real estate assets (including real estate assets incidental to our business) and to include share of EBITDAre of unconsolidated joint ventures. We believe EBITDAre to be most directly comparable to net income computed in accordance with GAAP and consider it to be a useful supplemental performance measure for investors to evaluate our operating performance and ability to meet interest payment obligations. Core EBITDA: Core EBITDA is defined by the Company as the EBITDAre, adjusted for the same reasons as Core FFO, to exclude gains or losses on debt transactions, gains or losses from involuntary conversion from weather events or natural disasters, the expense impact of costs attributable to successful leasing activities, promote income and severance charges related to major overhead restructuring activities. Property Level Net Operating Income - Cash Basis ("PNOI"): PNOI is a non-GAAP performance measure, which is comprised of rental revenues from continuing operations (computed in accordance with GAAP) less rental expenses and real estate taxes from continuing operations, along with adjustments to exclude the straight line rental income and expense, amortization of above and below market rents, amortization of lease concessions and lease termination fees as well as an adjustment to add back intercompany rent. PNOI, as we calculate it, may not be directly comparable to similarly titled, but differently calculated, measures for other REITs. We believe that PNOI to be most directly comparable to income from continuing operations defined by GAAP and that PNOI is another useful supplemental performance measure, as it is an input in many REIT valuation models and it provides a means by which to evaluate the performance of the properties within our Rental Operations segments. Same Property Performance Net Operating Income ("SPNOI"): We evaluate the performance of our properties, including our share of properties we jointly control, on a "same property" basis, using PNOI with certain minor adjustments. The same property pool of properties is defined once a year at the beginning of the current calendar year, and includes buildings that were in the stabilized portfolio throughout both the current and prior calendar years in both periods. The same property pool is adjusted for dispositions subsequent to its initial establishment. SPNOI also excludes termination fees. SPNOI is a non-GAAP supplemental performance measure that we believe is useful because it improves comparability between periods by eliminating the effects of changes in the composition of our portfolio. . RECONCILIATION 54

FFO, Core FFO and AFFO (in thousands) 2019 2018 2017 2016 2015 Actual Actual Actual Actual Actual Net income attributable to common shareholders $ 428,972 $ 383,729 $ 1,634,431 $ 312,143 $ 615,310 Add back: Noncontrolling interest in earnings of unitholders 3,678 3,528 15,176 3,089 6,404 Net Income Attributable to Common Shareholders-Diluted $ 432,650 $ 387,257 $ 1,649,607 $ 315,232 $ 621,714 Reconciliation to Funds From Operations ("FFO") Net Income Attributable to Common Shareholders $ 428,972 $ 383,729 $ 1,634,431 $ 312,143 $ 615,310 Adjustments: Depreciation and amortization 327,223 312,217 299,472 317,818 320,846 Joint Venture share of adjustments (11,156) (734) (44,223) (49,736) 13,336 Gains on real estate asset sales, net of taxes and impairments (233,857) (210,286) (1,453,702) (162,818) (645,358) Noncontrolling interest share of adjustments (702) (923) 11,023 (1,037) 3,197 NAREIT FFO Attributable to Common Shareholders - Basic 510,480 484,003 447,001 416,370 307,331 Noncontrolling interest in income of unitholders 3,678 3,528 15,176 3,089 6,404 Noncontrolling interest share of adjustments 702 923 (11,023) 1,037 (3,197) NAREIT FFO Attributable to Common Shareholders - Diluted $ 514,860 $ 488,454 $ 451,154 $ 420,496 $ 310,538 Loss on debt extinguishment, including share of unconsolidated joint ventures 6,320 388 26,104 35,526 85,713 Gains on involuntary conversion - unconsolidated joint venture (3,559) (3,897) — — — Non-incremental costs related to successful leases 12,402 — — — — Other income tax items — — (7,685) — — Overhead restructuring charges — — — — 7,422 Promote income — — (20,007) (26,299) — Acquisition-related activity — — — 96 8,499 Core FFO Attributable to Common Shareholders - Diluted $ 530,023 $ 484,945 $ 449,566 $ 429,819 $ 412,172 Adjusted FFO Core FFO - Diluted $ 530,023 $ 484,945 $ 449,566 $ 429,819 $ 412,172 Adjustments: Straight-line rental income and expense (20,724) (26,037) (17,328) (17,107) (23,232) Amortization of above/below market rents and concessions (7,566) (2,332) 1,201 1,526 3,659 Recurring capital expenditures (51,045) (54,482) (59,051) (60,894) (61,693) Other 25,705 25,986 24,270 24,749 23,804 AFFO - Diluted $ 476,393 $ 428,080 $ 398,658 $ 378,093 $ 354,710 Dividends Paid (Excluding Special Dividends) $ 321,469 $ 294,233 $ 276,539 $ 257,820 $ 241,292 Special Dividends $ — $ — $ 305,628 $ — $ 69,055 Funds Available for Reinvestment $ 154,924 RECONCILIATION 55
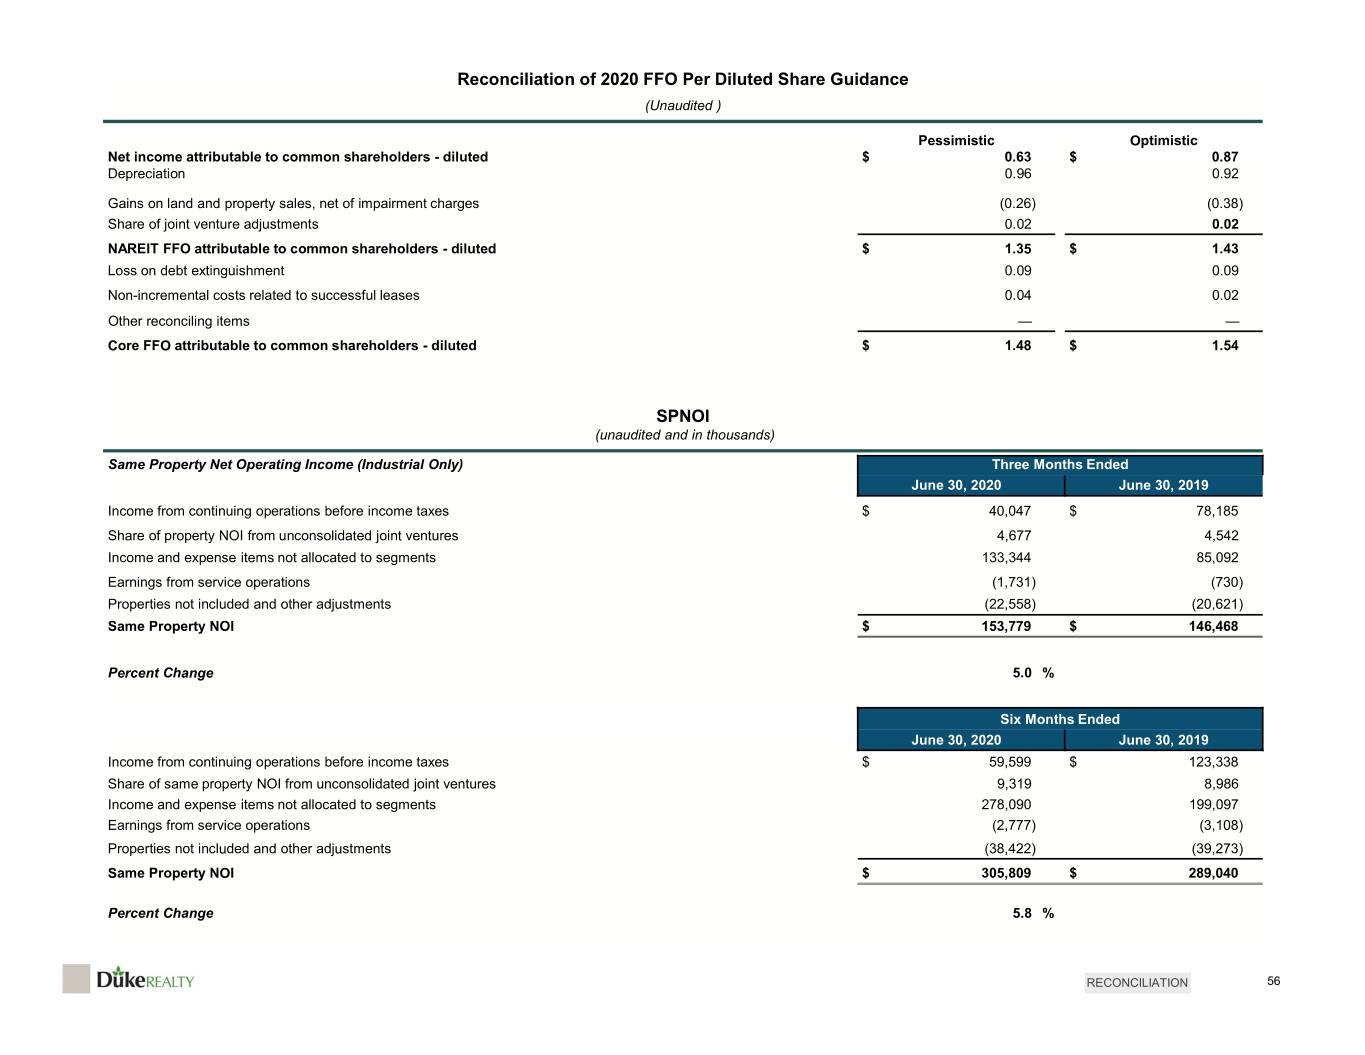
Reconciliation of 2020 FFO Per Diluted Share Guidance (Unaudited ) Pessimistic Optimistic Net income attributable to common shareholders - diluted $ 0.63 $ 0.87 Depreciation 0.96 0.92 Gains on land and property sales, net of impairment charges (0.26) (0.38) Share of joint venture adjustments 0.02 0.02 NAREIT FFO attributable to common shareholders - diluted $ 1.35 $ 1.43 Loss on debt extinguishment 0.09 0.09 Non-incremental costs related to successful leases 0.04 0.02 Other reconciling items — — Core FFO attributable to common shareholders - diluted $ 1.48 $ 1.54 SPNOI (unaudited and in thousands) Same Property Net Operating Income (Industrial Only) Three Months Ended June 30, 2020 June 30, 2019 Income from continuing operations before income taxes $ 40,047 $ 78,185 Share of property NOI from unconsolidated joint ventures 4,677 4,542 Income and expense items not allocated to segments 133,344 85,092 Earnings from service operations (1,731) (730) Properties not included and other adjustments (22,558) (20,621) Same Property NOI $ 153,779 $ 146,468 Percent Change 5.0 % Six Months Ended June 30, 2020 June 30, 2019 Income from continuing operations before income taxes $ 59,599 $ 123,338 Share of same property NOI from unconsolidated joint ventures 9,319 8,986 Income and expense items not allocated to segments 278,090 199,097 Earnings from service operations (2,777) (3,108) Properties not included and other adjustments (38,422) (39,273) Same Property NOI $ 305,809 $ 289,040 Percent Change 5.8 % RECONCILIATION 56


