RELIABLE. ANSWERS. 2011 Citigroup Investor Meeting June 28, 2011 Exhibit 99.1 |
RELIABLE. ANSWERS. © 2011 Duke Realty Corporation Denny Oklak Chairman & CEO Christie Kelly Executive VP & CFO Jim Bremner President, Healthcare Jim Connor Senior Regional EVP Sam O’Briant Regional EVP Jeff Turner Regional EVP 2 |
© 2011 Duke Realty Corporation Opening Market outlook Strategy & performance Regional overviews Medical Office Closing comments AGENDA 3 |
RELIABLE. ANSWERS. © 2011 Duke Realty Corporation 4 2009 2010 FOCUS: Liquidity More than $1.5 billion capital raised Strategy refined FOCUS: Strategy execution Operating fundamentals Balance sheet strength FOCUS: Asset quality Cash flow growth Shareholder return Where we’ve been and where we’re going… 2011 and beyond |
RELIABLE. ANSWERS. © 2011 Duke Realty Corporation Suburban Office Market Still Challenging Economic uncertainty limiting business investment and expansion decisions Continued improvements in consumer spending, corporate profits and job outlook will be catalyst Recovery will be at slower pace Medical Office Regaining Traction Operators re-visiting expansion decisions Relationships are a key driver of on campus MOB business Demographics and economics positive growth drivers 5 Market Outlook Fundamentals beginning to recover Industrial Recovery Taking Shape Net absorption in U.S. for Q1 2011 was positive for the third consecutive quarter Retailers posting good results; container traffic volumes continuing to increase Consumer confidence improving |
RELIABLE. ANSWERS. © 2011 Duke Realty Corporation Focus on: Increasing cash flow Maximizing return on assets 6 Strategy for Success Focus on: Improving coverage ratios Improving ratings Focus on: Portfolio repositioning Strategic acquisitions & dispositions Development opportunities Delivering on what we say we will do |
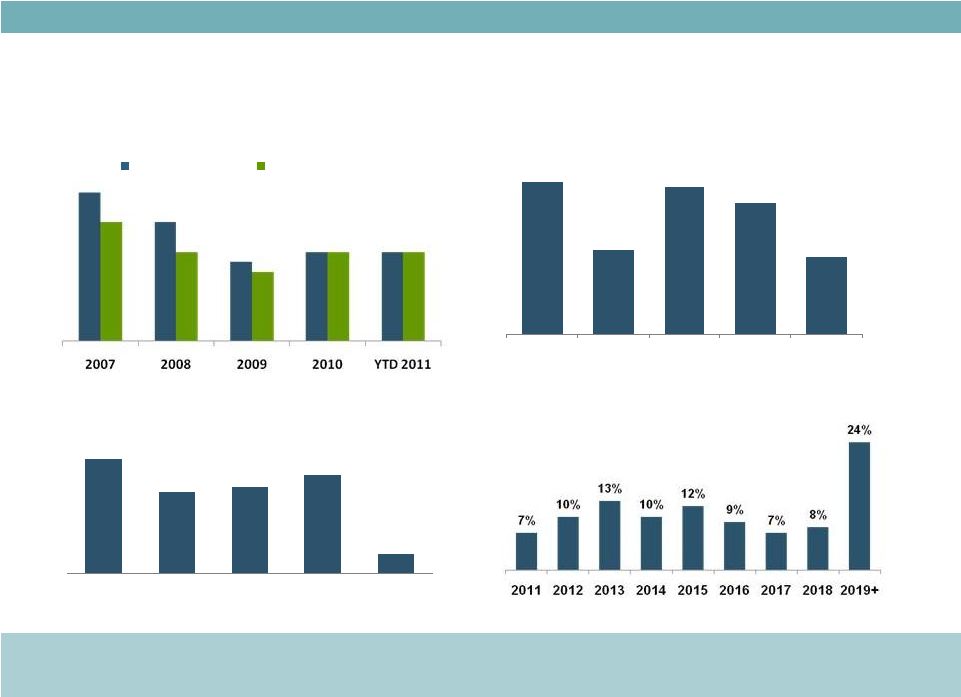
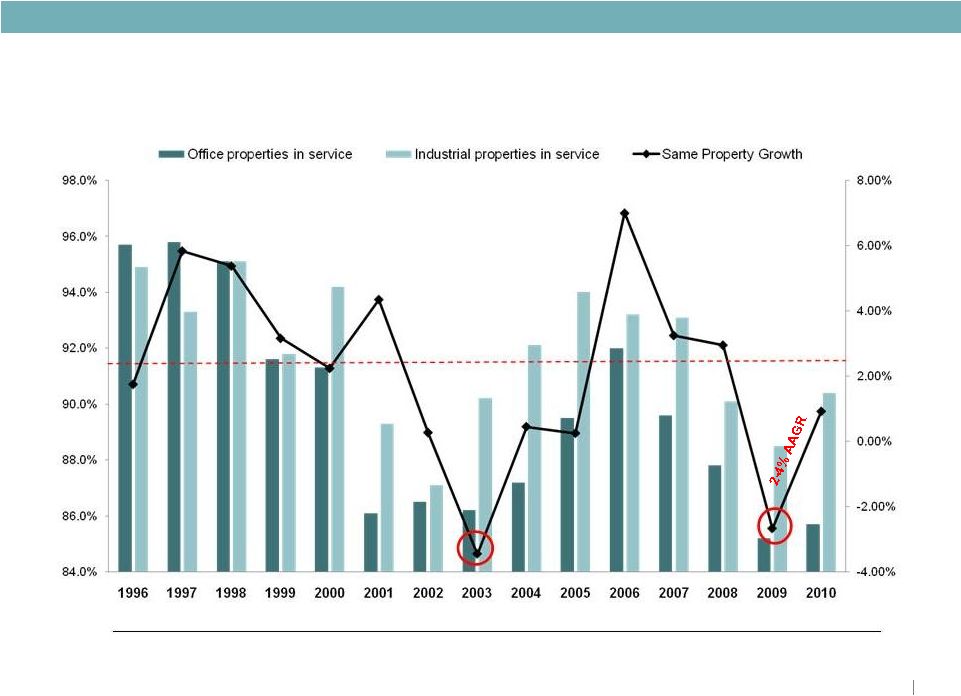
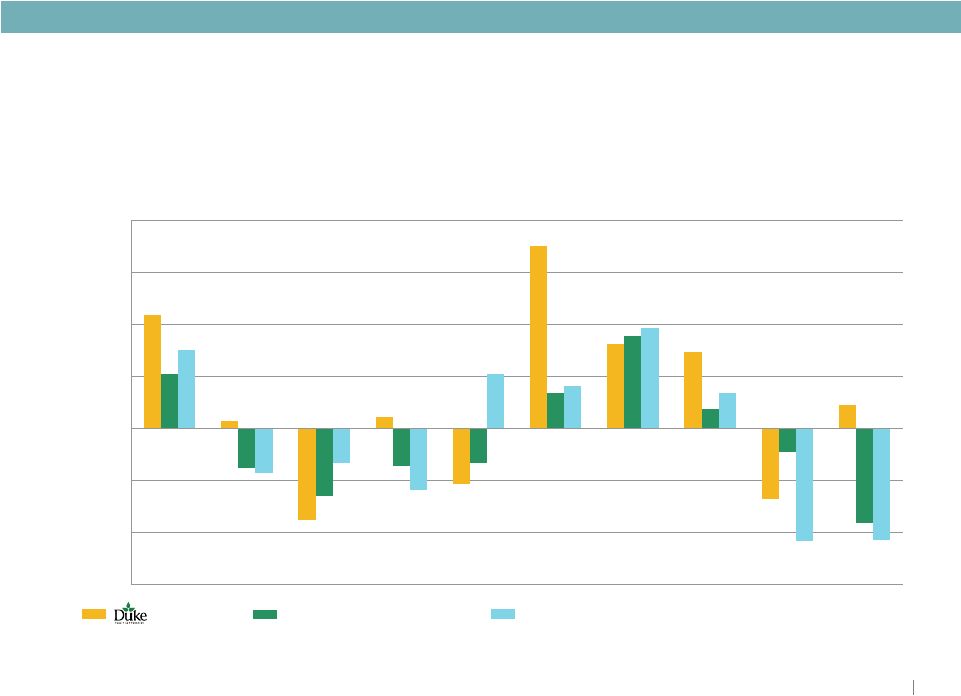
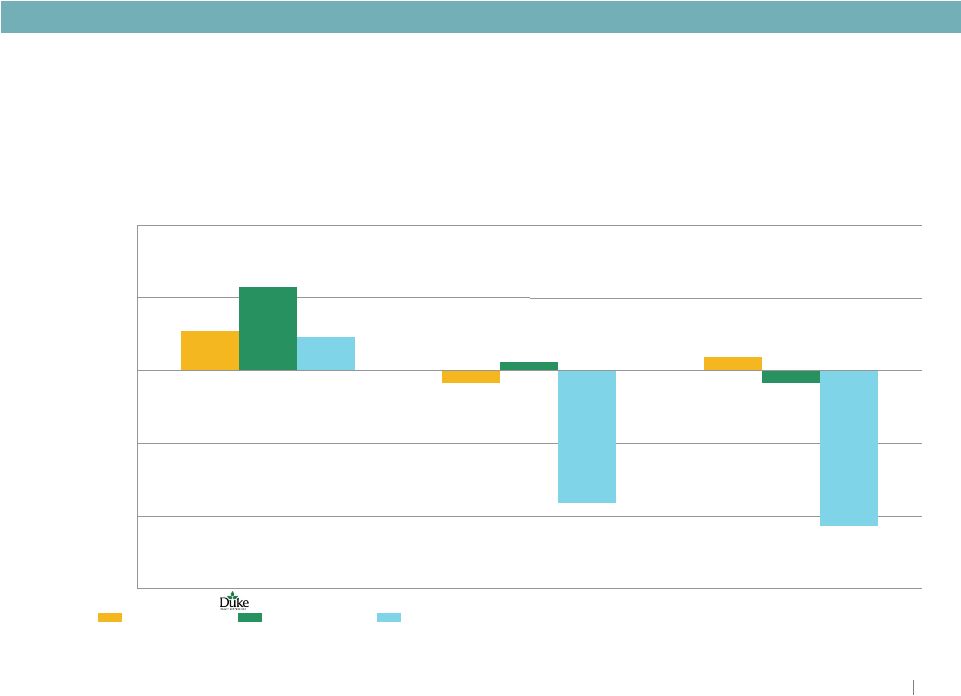
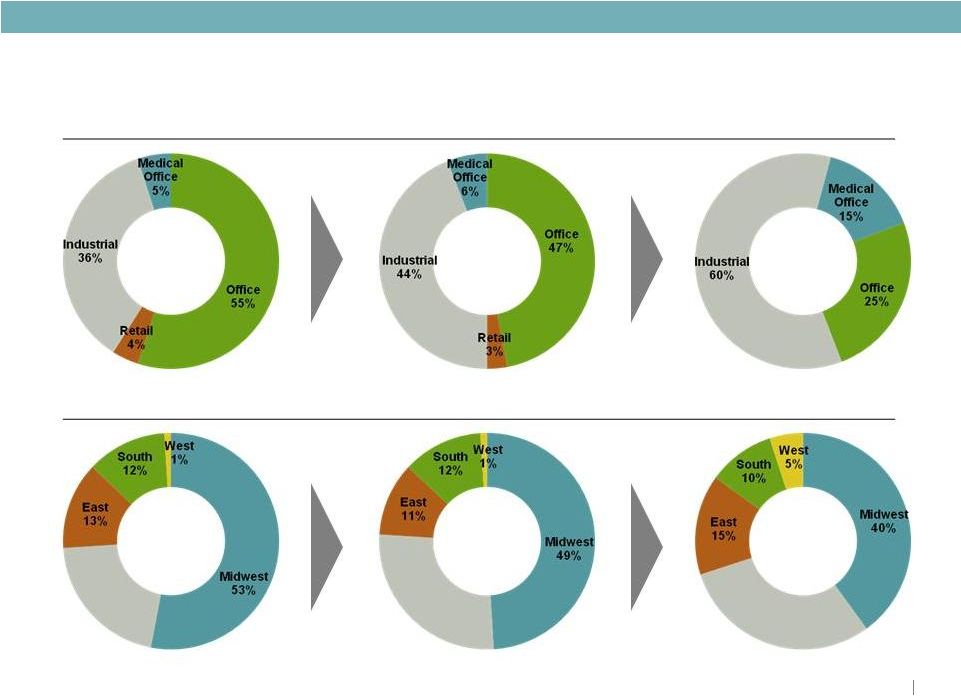
RELIABLE. ANSWERS. © 2011 Duke Realty Corporation Strategic Focus 2011 Goals and Objectives Q1 2011 Update • Lease-up portfolio, manage cap ex; reach positive same property income growth • Balance execution with capital strategy relative to level and quality of cash flow and same property NOI; Debt to EBITDA <7.0x • Development starts of $100 to $200 million focus on medical office and Build-to-Suit • Total portfolio occupancy as of March 31, 2011 of 88.9%; industrial portfolio at 90.2% • More than 5.3 million square feet of leases completed; in-line with Q1 2010 volume of 5.5 million square feet • Debt to EBITDA @ 6.7x;<6.0x by 2013; 0.9% Same Property • One medical office development project started during quarter • Continue strong momentum from 2010 on repositioning of portfolio • Pursue acquisitions of medical and industrial assets • Planned asset dispositions of primarily Midwest office • Closed on remaining $173 million of Premier assets (final closing in April) • Asset dispositions totaled $456 million, including completion of $274 million CBRERT transaction • Opportunistically access capital markets . . . push out maturity schedule further • Continue improving our coverage ratios • Maintain minimal balance on line of credit • Retired $42.5 million of unsecured bonds • Fixed charge ratio of 1.81x • Zero balance outstanding on line of credit, $167 million cash Asset Strategy Operations Strategy Capital Strategy Executing across all three aspects of our strategy 7 |
© 2011 Duke Realty Corporation ASSET STRATEGY 8 |
© 2011 Duke Realty Corporation Depth & experience of team = Consistent execution 9 Proven Performance ASSET STRATEGY Flex disposition $1 Billion 2005 2006 Savannah Washington DC 2007 Healthcare 2009 Asset Strategy 2010 Dugan CBRERT Premier |
© 2011 Duke Realty Corporation 10 Portfolio Strategy BY PRODUCT 2009 2013 BY GEOGRAPHY Q1 2011 ASSET STRATEGY 2009 2013 Q1 2011 Southeast 21% Southeast 27% Southeast 30% Industrial 36% Industrial 45% Industrial 60% Medical Office 5% Medical Office 6% Medical Office 15% Office 25% Office 46% Office 55% Retail 4% Retail 3% East 13% South 12% West 1% Midwest 53% Midwest 48% Midwest 40% West 1% West 5% South 12% South 10% East 12% East 15% |
© 2011 Duke Realty Corporation 11 Asset Strategy: Road Map ($ in millions) Investment 9/30/09 Investment 3/31/11 ACTION PLAN Investment 2013 PRODUCT TYPE Amount % Amount % Proceeds from Targeted Dispositions Acquisitions/ Developments/ Repositioning Amount % Industrial $2,930 36% $3,650 45% ($55) $1,250 $4,920 60% Office 4,515 55% 3,750 46% (500) (810) 2,050 25% Medical Office 440 5% 520 6% 0 730 1,230 15% Retail 290 4% 280 3% (305) 0 0 0% $8,175 100% $8,200 100% ($860) $1,170 $8,200 100 % REGION Midwest $4,310 53% $3,960 48% ($530) $125 $3,280 40% Southeast 1,755 21% 2,250 27% (165) 150 2,460 30% East 1,035 13% 975 12% (120) 355 1,230 15% South 970 12% 950 12% (45) 200 820 10% West 105 1% 65 1% 0 340 410 5% $8,175 100% $8,200 100% ($860) $1,170 $8,200 100% ASSET STRATEGY Significant progress to date… on target to meet 2013 goals |
© 2011 Duke Realty Corporation 12 ASSET STRATEGY Asset Strategy: Progress To Date BUILDING ACQUISITIONS BUILDING DISPOSITIONS Q4 2009 $15 Q4 2009 $144 2010 919 2010 499 2011 – Remaining Premier 139 2011 – Remaining CBRERT 456 Proforma Total $1,073 Proforma Total $1,099 PRO FORMA PROGRESS TO DATE TOTAL VALUE ASSUMED DEBT NET Dispositions $1,099 ($0) $1,099 Acquisitions $1,073 ($615) $458 Excess Cash $641 Only 50 Bps difference in Cap Rates Matching acquisitions with dispositions… limiting earnings impact $ in millions |
© 2011 Duke Realty Corporation 13 CBRERT: Suburban Office Joint Venture Portfolio Overview Columbus (22%) Geographic Footprint Asset Snapshots 3.1 million square feet Mirrors quality of remaining portfolio Continuing to manage and lease assets ASSET STRATEGY Joint ventured Midwest concentrated suburban office portfolio . . . net proceeds of $410 million Norman Pointe I and II Minneapolis Sam Houston Crossing Houston One and Two Easton Oval Columbus Regency Creek I Raleigh One Conway Park Chicago Nationwide Columbus 533 and 555 Maryville Center St. Louis Landings Building I and II Cincinnati Pointe West I Dallas Cincinnati (18%) Raleigh (4%) S. Florida (13%) St. Louis (8%) Chicago (7%) Minneapolis (17%) Dallas (6%) Houston (5%) |
© 2011 Duke Realty Corporation 14 Premier Acquisition Portfolio Overview Geographic Footprint Asset Snapshots ASSET STRATEGY Acquired $450 million primarily industrial portfolio in high barrier growth market * Based on dollars invested Pompano Beach Plantation (office) Boyton Beach Palm Beach Central Broward Bulk Industrial Service Center Office 79% 18% 3% 14% 16% A B C D E F G H I B A C D E F G H I |
© 2011 Duke Realty Corporation Asset Repositioning Analysis Making significant progress 15 ACQUISITIONS DISPOSITIONS Dugan Realty Premier Portfolio CBRERT Location Midwest/ Southeast South Florida Multi Location/ Midwest Product Type Industrial Industrial & Office Suburban Office Square feet 20.8M 4.9M 3.1M Occupancy at Closing 86.5% 87.0% 95.0% Age of Assets 14.8 years 11.2 years 9 years Purchase Price/Sales Price ($ millions) $298 $450 $413 Purchase Price / Sales Price – PSF $29 $88 $167 ASSET STRATEGY |
© 2011 Duke Realty Corporation 16 2010 PERFORMANCE $533.2 million of dispositions $919.1 million of acquisitions $130 million of development starts 2011 GOALS Strong backlog of dispositions & acquisitions $200 million of new development starts; $75 - $125 million medical office Continue to make significant progress on strategic plan ASSET STRATEGY Quality portfolio improving with asset strategy |
RELIABLE. ANSWERS. © 2011 Duke Realty Corporation OPERATIONS STRATEGY 17 |
18 Focus on Fundamentals LEASING OF PORTFOLIO STRATEGIC NEW DEVELOPMENT AND LAND DISPOSITION AFFO PAYOUT OPERATIONS STRATEGY Maximize return on assets © 2011 Duke Realty Corporation |
© 2011 Duke Realty Corporation 19 New, High Quality Portfolio with Long-term Leases Bulk Industrial Suburban Office Medical Office Property age 10.1 years 11.7 years 2.0 years Property size 212,000 SF 118,000 SF 97,000 SF Lease term 7.0 years 7.2 years 11.7 years Tenant size 70,000 SF 12,000 SF 11,000 SF OPERATIONS STRATEGY |
Operations Strategy: Consistent Operating Performance Stabilized Occupancy (%) Strong historical stabilized occupancy – fundamentals improving Lease Renewals (%) Strong lease renewal percentages Stabilized occupancy In-service occupancy 80% 72% 79% 77% 2007 2008 2009 2010 YTD 2011 70% 29.9 21.4 22.7 25.9 2007 2008 2009 2010 YTD 2011 Leasing Activity New Leases and Renewals – Consistent Execution (in millions of square feet) Lease Maturity Schedule Lease maturities are well balanced with no one year accounting for more than 13% Demonstrated ability to maintain consistency through difficult operating environments 95% 92% 92% 89% 88% 89% 89% 89% 89% 87% 20 OPERATIONS STRATEGY 5.3 |
© 2011 Duke Realty Corporation 21 Land and Development Capabilities OPERATIONS STRATEGY $495 million HELD FOR DEVELOPMENT Industrial Development - SF Midwest 26.3 million SF Indianapolis, Chicago, Columbus and St. Louis major positions East 3.1 million SF New Jersey, Baltimore and Washington D.C. Southeast 8.5 million SF Atlanta, Central Florida and South Florida Southwest 5.8 million SF Phoenix, Dallas and Houston Total 43.7 million SF Attractive positions contribute to future industrial development and value |
© 2011 Duke Realty Corporation 22 December 31 Historical Focus on Occupancy OPERATIONS STRATEGY 2.3% Avg Technology Bust Market Downturn |
© 2011 Duke Realty Corporation (2) (3) Consistent NOI Growth Outperformance 3.3% 3.0% (2.7%) 0.9% 2.1% (1.5%) (2.6%) (1.5%) (1.3%) 1.4% 3.6% 0.8% (0.9%) (3.6%) 3.0% (2.4%) 2.1% 3.9% 1.4% (4.3%) (4.3%) 7.0% (2.1%) 0.5% (3.5%) 0.3% 4.4% 1.6% (1.3%) (1.7%) (6.0%) (4.0%) (2.0%) 0% 2% 4% 6% 8% 2001 2002 2003 2004 2005 2006 2007 2008 2009 2010 Low Barrier Office Peers Industrial Peers Annual Same-Store NOI Growth (1) %, y-y Source SNL and company filings Ten-Year Comparison vs. Peers Notes 1. Based on straight-line average of year-over-year annual same-property NOI growth 2. Low barrier office (“LBO”) includes BDN, CLI, HIW, LRY and PKY; weighted by historical market cap 3. Industrial includes DCT, EGP, FR, FPO and PSB; weighted by historical market cap OPERATIONS STRATEGY 23 |
© 2011 Duke Realty Corporation Consistent NOI Growth Outperformance (cont’d) Relative Performance vs. Peers Notes 1. Based on straight-line average of year-over-year annual same-property NOI growth 2. Low barrier office (“LBO”) includes BDN, CLI, HIW, LRY and PKY; weighted by historical market cap 3. Industrial includes DCT, EGP, FR, FPO and PSB; weighted by historical market cap Source SNL and company filings OPERATIONS STRATEGY 24 2.3% 0.2% (0.3%) 0.9% (3.6%) (4.3%) 0.4% (0.4%) 1.1% (6%) (4%) (2%) 0% 2% 4% Low-Barrier Office Peers (2) Industrial Peers (3) 10-Year Avg. 5-Year Avg. 1-Year Avg. Annual Same-Store NOI Growth (1) %, y-y |
© 2011 Duke Realty Corporation 2010 PERFORMANCE Total portfolio occupancy of 89.1% Industrial at 90.5% occupancy Nearly 26 million SF leases – highest volume since 2007 2011 GOALS Leasing of portfolio Manage capital expenditures and maximize cash flow AFFO guidance 85% - 100% 25 OPERATIONS STRATEGY Quality, well-positioned assets to drive performance |
© 2011 Duke Realty Corporation MIDWEST OVERVIEW 26 |
© 2011 Duke Realty Corporation RECENT TRANSACTIONS 27 Midwest Renewal Industrial Hebron I - Cincinnati 646,000 SF 100% leased New Lease Office Atrium II - Columbus 121,000 SF Tenant: Alcatel - Lucent MARKET OVERVIEW & KEY POINTS Strong distribution base: Over 30% of U.S. population within one day’s drive 74 Fortune 500 headquarters High growth and return opportunities, particularly in Chicago, Columbus, and Indianapolis Duke Realty’s roots and a position of strength Original location – since 1972 Low basis product Dominant market position 48% of our total investment Committed to Midwest because we perform… Remains a key component to our strategy Disposition - Office (CBD) 312 Elm & 312 Plum Cincinnati 609,000 SF MIDWEST OVERVIEW |
© 2011 Duke Realty Corporation 28 Midwest Overview Location Product Type Industrial Office Average Age 11.6 years 16.3 years Average Building Size 236,000 SF 130,000 SF Total Square Footage 51.5 million 16.4 million Current Occupancy 93.0% 84.4% Indianapolis 96.7% 86.5% Chicago 96.1% 88.6% Cincinnati 86.4% 82.5% St. Louis 88.6% 79.5% Columbus 96.2% 82.0% Minneapolis 84.5% 96.8% MIDWEST OVERVIEW Note: All information as of March 31, 2011 Medical Office 5% Office 50% Industrial 45% St. Louis 14% Cincinnati 20% Columbus 13% Chicago 21% Indy 25% Minn. 7% |
© 2011 Duke Realty Corporation TRANSACTION EXAMPLES 29 Indianapolis MIDWEST OVERVIEW New Lease - Industrial Park 100 – Bldg 87 144, 000 SF – 10 year term Tenant: Hat World New Lease - Industrial Plainfield Building V 426,000 SF – 3 year term Tenant: Genco I, Inc. New Lease - Industrial AllPoints at Anson - 1 406,000 SF – 10 year term Tenant: Amazon Renewal - Industrial Lebanon Buildings 12 & 13 1.1M SF – 10 year term CNH America MARKET OVERVIEW AND KEY POINTS Largest Industrial landlord (21 million square feet) in top regional distribution market 3 Fortune 500 headquarters 12% of total investment... Premium product and submarket position Industrial JV with Browning Investments controlling approximately 1,000 acres Land for 18 million square feet of industrial development Outperforming market occupancy Strong recovery forecast by PPR State Capital and higher education add to market stability |
© 2011 Duke Realty Corporation 30 Cincinnati MIDWEST OVERVIEW Disposition – Office (CBD) 312 Plum & 312 Elm 609,000 SF New Lease - Industrial Hebron 2 598,000 SF – 5.5 year term Tenant: HK Systems New Lease - Industrial Union Centre Park 2 118,000 SF – 7 year term Tenant: Bunzl Distribution New Lease - Industrial Southpark Building 4 166,000 SF – 10.5 year term Tenant: Pratt Corrugated Holdings MARKET OVERVIEW AND KEY POINTS Duke Realty is a dominant owner and developer for both office and industrial 10 Fortune 500 headquarters Select local sub market dominance matters 9% of total investment Lease-up vacant space; drive industrial occupancy over 90% Continue non-strategic asset dispositions Approximately 1.0 million square feet of development land – 50% industrial |
© 2011 Duke Realty Corporation 31 Chicago MIDWEST OVERVIEW Acquisition – Industrial Melrose Business Center 459,000 SF 100% Leased Expansion - Office Riverway East 38,000 SF – 9 year term US Food Service, Inc. Acquisition - Industrial 175 Ambassador Drive 331,000 SF 100% leased MARKET OVERVIEW AND KEY POINTS 1.3 billion SF Industrial market – 28% of the U.S. population is within one days drive Only U.S. city with all six class 1 rail carriers 28 Fortune 500 headquarters Top 5 owner and developer in both bulk industrial and suburban office 9% of total investment Land for 2.2 million square feet of development, 92% industrial Continue asset repositioning Selectively buy industrial Sell older office 2010 NAIOP winner – Industrial Development of the Year Award for Excellence; Nominee for Industrial Developer Of the Year and Transaction of the Year Renewal - Industrial Crossroads 2 336,000 SF – 5 year term Hub One Logistics TRANSACTION EXAMPLES |
© 2011 Duke Realty Corporation 32 Columbus MIDWEST OVERVIEW Extension - Industrial 6600 Port Road 906,000 SF – 8.5 year term AS America Renewal - Office Nationwide Building 315,000 SF – 7 year term Nationwide Mutual Insurance (Building sold to CBRERT JV) New Development – Industrial Build to Suit West Jefferson Industrial Park 1.3 million SF – 10.6 year term Mars Petcare MARKET OVERVIEW AND KEY POINTS Strong Industrial market with high growth potential 6 Fortune 500 headquarters Key joint venture with Columbus Regional Airport Authority at Rickenbacker Airport and Norfolk Southern Intermodal Office market driven by major corporate headquarters, government, education and health services First Midwest market to see new development opportunities Geography and intermodal infrastructure will drive distribution growth 6% of total investment Land for 1.1 million square feet of primarily industrial development Maintain industrial performance and expand presence TRANSACTION EXAMPLES |
© 2011 Duke Realty Corporation 33 St. Louis MIDWEST OVERVIEW New Lease - Industrial Dukeport I, II, & VI 589,000 SF – 10.5 year term Tenant: Centric Group, LLC New Lease - Office Rider Trail 56,000 SF – 10 year term Tenant: Spectrum Brands Renewal - Office Maryville Centre 533 and 555 168,000 SF – 10 year term Tenant: Eveready Battery Company (Sold to CBRERT JV) MARKET OVERVIEW AND KEY POINTS Home to 9 Fortune 500 headquarters; 3 universities and an number of healthcare related firms Industrial market ranked #2 by PPR for number of infrastructure points Labor market posting gains in 2010 … first time in two years Industrial market vacancies appear to have peaked Land for 4.3 million square feet of development; 94% industrial TRANSACTION EXAMPLES |
© 2011 Duke Realty Corporation TRANSACTION EXAMPLES 34 Minneapolis MIDWEST OVERVIEW New Lease - Office Norman Pointe II 245,000 SF – 5 year term Tenant: GSA New Lease/Renewal Office 1600 Tower 90,000 SF Multiple Leases Multiple Tenants New Leases - Retail The Shops at West End 30,000 SF Multiple Leases Multiple Tenants MARKET OVERVIEW AND KEY POINTS Lowest unemployment in the Midwest at 6.5% Only Midwestern City with above average population growth projected 18 Fortune 500 headquarters Land for 2.5 million square feet of development; 44% industrial Expand industrial presence Pursue build-to-suit office opportunities at Minneapolis West Nominee Twin Cities Business Journal top office lease for GSA lease at Norman Pointe II |
© 2011 Duke Realty Corporation 35 Midwest Focus DOMINANT POSITION BULK INDUSTRIAL REDUCE OFFICE CONCENTRATION MIDWEST OVERVIEW Enhancing dominant industrial position in Midwest |
© 2011 Duke Realty Corporation 36 Midwest Team Jim Connor Regional EVP Charlie Podell Indianapolis Jon Burger Cincinnati Jim Clark Columbus Steve Schnur Chicago Toby Martin St. Louis Pat Mascia Minneapolis Midwest leaders average 10 years with Duke Realty MIDWEST OVERVIEW Years with Duke Realty 6 15 7 22 3 7 |
© 2011 Duke Realty Corporation SOUTHWEST OVERVIEW 37 |
© 2011 Duke Realty Corporation RECENT TRANSACTIONS 38 Southwest Acquisition - Industrial Estrella Buckeye – Phoenix 250,000 SF 100% Leased Disposition Office Lakeview office assets- Nashville 379,000 SF Duke Realty presence since 1999 (Weeks merger) 52 Fortune 500 headquarters Demographic drivers: modern transportation and infrastructure, population and job growth Strong industrial demand expected post-recovery Port, inland port and logistics key for bulk distribution markets 13% of our total investment Expand industrial presence by pursuing select acquisition opportunities in Houston, Phoenix and Southern California New Development - Industrial Westland II Houston 300,000 SF 73% Leased SOUTHWEST OVERVIEW MARKET OVERVIEW & KEY POINTS |
© 2011 Duke Realty Corporation 39 Southwest Overview Industrial Office Average Age 8.6 years 6.5 years Average Building Size 256,500 SF 108,600 SF Total Square Footage 20.0 million 2.1 million Current Occupancy 85.6% 91.9% Dallas 83.8% 83.3% Nashville 80.9% 95.0% Houston 98.0% 100% Phoenix 97.1% N/A SOUTHWEST OVERVIEW Note: All information as of March 31, 2011 Location Product Type |
© 2011 Duke Realty Corporation TRANSACTION EXAMPLES 40 Dallas New Development Third Party Build to Suit 1.02 million SF Whirlpool Expansion- Industrial Kingsley Distribution Ctr. 250,000 SF– 9.25 year term Plastipak Packaging Renewal Lease - Industrial Freeport III 116,000 SF- 3.5 year term Round2 Inc. New Lease - Office Duke Bridges III 49,000 SF– 7 year term Tenant: Oracle American SOUTHWEST OVERVIEW MARKET OVERVIEW & KEY POINTS Duke Realty one of top 3 owner/developers in Dallas/Ft. Worth 24 Fortune 500 headquarters Projected fastest growing metropolitan area Most active developer over last 10 years Presence in all major submarkets. DFW Airport submarket is flagship Land for 2.4 million square feet of development; 81% industrial NAIOP 2010 Developer of the Year, previously awarded to Duke Realty in 2004, 2005 and 2008 6% of total investment |
© 2011 Duke Realty Corporation TRANSACTION EXAMPLES 41 Nashville Acquisition - Industrial Four Forty Business Center II 133,000 SF 100% leased Disposition - Office Lakeview Office assets 379,000 SF SOUTHWEST OVERVIEW MARKET OVERVIEW & KEY POINTS Long-standing business relationships and 25+ year presence have built Duke Realty brand name in market Dominant industrial submarket positions Remains a strong central location for light industrial product Office occupancy has remained steady through downturn –portfolio 90% leased or higher in 2010 Diverse business base |
© 2011 Duke Realty Corporation TRANSACTION EXAMPLES 42 Phoenix Acquisition - Industrial Estrella Buckeye 250,000 SF 100% leased New Lease - Industrial Goodyear 1 118,000 SF– 10 year term Sun-Tech SOUTHWEST OVERVIEW MARKET OVERVIEW & KEY POINTS Industrial portfolio comprised of 1.9 million square feet that is 97% leased In 2010, positive absorption of 4.5 million square feet in industrial 5 Fortune 500 headquarters Market is a main logistics route from Western port locations Considered a low cost alternative to Inland Empire Land for 2.3 million square feet of industrial development Leverage local team expertise to expand into Southern California industrial markets Excellent land position in Inland Empire West Acquisition - Industrial Riverside Business Center 604,000 SF 55% leased to Ulta Salon 10.5 year term |
© 2011 Duke Realty Corporation TRANSACTION EXAMPLES 43 Houston Acquisition - Industrial Granite Portfolio/ Port of Houston 582,840 SF 100% leased New Development Industrial Westland II 300,000 SF 73% pre-leased SOUTHWEST OVERVIEW MARKET OVERVIEW & KEY POINTS 23 Fortune 500 headquarters Port of Houston: • Ranked 1 st in U.S. imports • 2 nd in the U.S. in total tonnage • Anticipated growth following completion of Panama Canal in 2014 Excellent leasing results- 1.7 million square feet of industrial assets 94% leased and 250,000 square feet of office assets100% leased Good asset position across four major submarkets and port strategy Land for 1.7 million square feet of primarily industrial development Industrial vacancy less than 10% |
© 2011 Duke Realty Corporation 44 Southwest Focus DALLAS LEASE-UP HOUSTON INDUSTRIAL PORT DALLAS INLAND PORT SOUTHERN CALIFORNIA EXPANSION SOUTHWEST OVERVIEW Grow |
© 2011 Duke Realty Corporation 45 Southwest Team Jeff Turner Regional EVP Jeff Thornton Dallas David Hudson Houston Kevin Rogus Phoenix Jeff Palmquist Nashville Southwest leaders average more than 13 years with Duke Realty SOUTHWEST OVERVIEW Years with Duke Realty 10 5 25 15 |
© 2011 Duke Realty Corporation EAST & SOUTHEAST OVERVIEW 46 |
© 2011 Duke Realty Corporation 47 East & Southeast Overview Acquisition – Office/Industrial Premier Portfolio - South Fl 4.9 million SF MARKET OVERVIEW & KEY POINTS Strong presence: entered Southeast in 1999 (Weeks merger) and East in 2006 (acquisition of Winkler portfolio) 15 Fortune 500 headquarters East and Southeast cities among top growth markets in country… strong in-migration Diversified economies; Government, healthcare, finance and education Eastern cities maintained highest employment rate through downturn Atlanta and Northeast corridor strong in bulk industrial 39% of our total investment New Leases - Office 3630 Peachtree – Atlanta Currently 44% leased EAST & SOUTHEAST OVERVIEW |
© 2011 Duke Realty Corporation 48 East and Southeast Overview Industrial Office Average Age 8.8 years 9.7 years Average Building Size 225,000 SF 110,000 SF Total Square Footage 26.9 million 13.7 million Current Occupancy 89.0% 88.5% Atlanta 85.2% 87.3% South Florida 80.5% 89.2% Raleigh 98.1% 89.5% Washington D.C./Baltimore 94.2% 90.9% Central Florida 91.0% 85.4% Savannah 88.7% NA EAST & SOUTHEAST OVERVIEW Location Product Type |
© 2011 Duke Realty Corporation TRANSACTION EXAMPLES 49 Atlanta New Lease- Industrial Camp Creek 155,000 SF– 5.3 year term National Powersport Auctions New Leases - Office 3630 Peachtree 66,000 SF Multiple tenants 44% leased EAST & SOUTHEAST OVERVIEW MARKET OVERVIEW & KEY POINTS Duke Realty a top 5 owner city-wide in office and industrial and a leading owner in best submarkets Primary bulk industrial market for the Southeast 13 Fortune 500 headquarters Suburban office performing better than Buckhead, Midtown and CBD 11% of total investment Continued strong population growth expected Land for 5.3 million square feet of primarily industrial development |
© 2011 Duke Realty Corporation 50 Savannah EAST & SOUTHEAST OVERVIEW MARKET OVERVIEW & KEY POINTS Duke Realty dominant position estimated at 35% market share Majority of portfolio within three miles of port Port activity improving – record TEU volume in 2010 Two primary types of tenants: logistics firms and national retailers Duke Realty’s buildings consistently outperform the market |
© 2011 Duke Realty Corporation 51 Central Florida (Orlando/Tampa) New Leases - Office Highland Oaks IV 44,000 SF Multiple tenants New Lease - Industrial Eagle Creek Business Ctr. 29,000 SF - 10.5 year term Mike’s Pies EAST & SOUTHEAST OVERVIEW MARKET OVERVIEW & KEY POINTS Excellent quality of life and improving affordability. Educated work force. PPR projecting solid population and job growth with recovery Orlando bulk market serves most of Florida while Tampa is more local/ Type II Land for 2.3 million square feet of development; 89% industrial New Lease - Industrial Parksouth Distribution Center 86,000 SF– 7 year term Pelliconi TRANSACTION EXAMPLES |
© 2011 Duke Realty Corporation TRANSACTION EXAMPLES 52 Raleigh New Lease – Office Crabtree Overlook 45,000 SF– 6 year term Nationwide Mutual Insurance Co. New Leases- Office Captrust Tower 65,700 SF Multiple tenants 64% leased EAST & SOUTHEAST OVERVIEW MARKET OVERVIEW & KEY POINTS Diversified economy (R&D, education, healthcare and government among the top employers) Led country in percentage population growth in 2010 Suburban office - leading product type, with the Research Triangle Park & North Raleigh suburbs showing most activity Duke Realty industrial assets well located in market focused on local distribution and pharmaceutical/ biotech 7% of total investment Land for 1.2 million square feet of office development |
© 2011 Duke Realty Corporation TRANSACTION EXAMPLES 53 South Florida Acquisition- Office Royal Palm I and II 465,500 SF New Lease - Industrial Pompano Commerce Ctr. 111,000 SF– 15 year term GSA EAST & SOUTHEAST OVERVIEW MARKET OVERVIEW & KEY POINTS Duke Realty dominant industrial and suburban office positions in Broward County High barrier market; land entitlement process long and difficult 2 Fortune 500 headquarters 9% of total investment Land for 2.1 million square feet of development; 61% industrial Nominee for 2010 NAIOP Awards of Excellence for: Top Industrial Lease – GSA lease at Pompano Commerce Center Top Office Acquisition – Royal Palm I & II Top Industrial Acquisition – Premier portfolio Acquisition – Office/Industrial Premiere Portfolio 4.9 million SF |
© 2011 Duke Realty Corporation TRANSACTION EXAMPLES 54 Washington D.C./Baltimore New Lease - Office 15006 Northridge Dr. 32,000 SF– 8 year term TASC BRAC 1.7 million SF office towers On schedule to complete in Q3 2011 EAST & SOUTHEAST OVERVIEW MARKET OVERVIEW & KEY POINTS Washington DC will lead east coast cities in population growth through 2014 Federal spending is the key driver for employment growth, but the city is well diversified with “knowledge-based” industries Strong office presence in Northern Virginia and enhanced brand awareness with development of the BRAC project Leverage BRAC capability for other government projects Pursue targeted acquisitions and build to suit opportunities 4% of total investment Land for 1.4 million square feet of development; 65% office |
© 2011 Duke Realty Corporation 55 East/Southeast Focus BULK INDUSTRIAL/PORTS LEASE UP AND RENT GROWTH ACQUISITIONS & DEVELOPMENT EAST & SOUTHEAST OVERVIEW Maximize assets and market position |
© 2011 Duke Realty Corporation 56 East & Southeast Team Sam O’Briant Regional EVP Atlanta/ Savannah Kerry Armstrong 3630 Peachtree Ed Mitchell South Florida Jeff Sheehan Raleigh John Macsherry Baltimore Peter Scholz Washington D.C. East & Southeast leaders average more than 10 years with Duke Realty Doug Irmscher Orlando/ Tampa EAST & SOUTHEAST OVERVIEW Years with Duke Realty 20 3 16 11 15 4 5 Chris Brown |
© 2011 Duke Realty Corporation MEDICAL OFFICE OVERVIEW 57 |
© 2011 Duke Realty Corporation 58 Portfolio Strategy BY PRODUCT 2009 2013 BY GEOGRAPHY 2009 2013 Focus on “core” assets (on-campus) Focus on national and regional Hospital system relationships Focus on Duke Realty office locations Focus on demographic healthcare growth cities MOB Off Campus 4% Specialty Hospital 10% MOB On Campus 86% MOB On Campus 80% MOB Off Campus 10% LTAC/ Rehab 5% Midwest 30% South 30% East 10% Southeast 30% Midwest 42% South 39% Southeast 19% Specialty Hospital 5% MEDICAL OFFICE OVERVIEW |
© 2011 Duke Realty Corporation PIEDMONT ATLANTIC Atlanta* Birmingham Charlotte Nashville* Raleigh* NORTHEAST Baltimore* Boston Philadelphia Richmond Washington, D.C.* GREAT LAKES Chicago* Columbus* Indianapolis* Louisville Minneapolis* St. Louis* FLORIDA Jacksonville Miami Orlando* Tampa* GULF COAST TEXAS TRIANGLE Austin* Dallas * Houston* San Antonio ARIZONA SUN CORRIDOR NORTHERN CALIFORNIA SOUTHERN CALIFORNIA CASCADIA Megaregions by 2050: Populations in contiguous regions with major cities that produce more than $100 billion in goods and services. Mega-regions will drive need for healthcare, transportation infrastructure and jobs through 2050 59 Duke Realty Markets: Demographic Focus * Duke Realty market Map Source: ATLANTA REGIONAL COMMISSION MEGAREGIONS REPORT MEDICAL OFFICE OVERVIEW |
© 2011 Duke Realty Corporation 60 Healthcare Data Points The nation’s largest industry • Represents more than 17% of GDP, predicted to exceed 23% by 2020 • Americans spend more than 5% of pre-tax income on healthcare. Lower income brackets pay 15% or more ($7,800 per capita health expenditures in 2008/2009) Reform • Increased number of people insured expected to increase by 30 to 50 million – increased demand for care • Number of physicians will increase – more space demand • Hospitals expect margin pressure and need to increase market share – Hospitals seeking capital partners for “non-core assets” • May reduce reimbursements – real estate efficiency a priority – larger deals and floor plates As many as 40% (20% now) of primary care physicians and 24% (10% now) of specialists will be employed by hospitals by 2012 – more Hospital credit on leases MEDICAL OFFICE OVERVIEW |
© 2011 Duke Realty Corporation 61 Demand Driver 60+ age group continues to grow at greater than 3% annually through 2030 Fact: Baby Boomers (60 + years old) seek more medical treatments than all others Growth of 60+ age group is creating demand for healthcare services through 2030 Number of Americans 60+ % of Americans 60+ THE AGING OF AMERICA MEDICAL OFFICE OVERVIEW |
© 2011 Duke Realty Corporation 62 Demand Driver MEDICAL OFFICE OVERVIEW THE OUTMIGRATION OF CARE Demand for outpatient services is projected to increase by 22% by 2019 while demand for inpatient services will remain flat Ambulatory surgery center (ASC) and diagnostic imaging center (DIC) visits increasing at a rate of 8.4 percent annually Physician office visits rising by 7.9 percent annually Outpatient care yields higher profit margins than inpatient care Outpatient services can be on or off campus Source: McKinsey & Company’s McKinsey Global Institute |
© 2011 Duke Realty Corporation 63 Development Focus ACTION PLAN National brand awareness Be “Experts” – Speak at national conferences (ASHE, BOMA) – Third party references National system relationships – Ascension – Tenet – HCA – Adventist Regional system relationships – Baylor Health – Rex Healthcare – Carolina Healthcare Systems – Advocate System Focus Regional Focus MEDICAL OFFICE OVERVIEW |
© 2011 Duke Realty Corporation 64 Example: Baylor Relationship MEDICAL OFFICE OVERVIEW BAYLOR CANCER CENTER 10-story outpatient cancer center 250 space underground parking facility 94% preleased with Baylor and McKesson (US Oncology) 460,000 sf OTHER BAYLOR PROJECTS Baylor Administrative Office Building - Dallas, TX (100% leased) Baylor Plano MOB - Plano, TX (40% leased) Baylor Orthopedic and Spine Hospital of Arlington - Arlington, TX (100% leased) Baylor Uptown Hospital- Dallas, TX (100% leased) Baylor McKinney (new development)- McKinney, TX (66% pre-leased to Baylor) |
© 2011 Duke Realty Corporation 65 Current Development Pipeline Baylor McKinney MOB McKinney, TX 113,000 SF Baylor 66% pre-leased WakeMed MOB - Sunnybrook Raleigh, NC 86,000 SF Wake Med Health and Hospital 58% pre-leased REX Holly Springs MOB Raleigh, NC 30,000 SF Rex Hospital 100% pre-leased Western Ridge MOB II Cincinnati, OH 29,000 SF TriHealth 80% pre-leased MEDICAL OFFICE OVERVIEW WakeMed MOB – Brier Creek Raleigh, NC 48,000 SF Wake Med Health and Hospital 80% pre-leased |
RELIABLE. ANSWERS. 66 Healthcare Team Jim Bremner President, Healthcare Deeni Taylor South/ Southeast Don Dunbar East/ Midwest Glenn Hoge Development Keith Konkoli Midwest Healthcare leaders average more than 13 years with Duke Realty Jason Hinkel Southeast MEDICAL OFFICE OVERVIEW Years with Duke Realty/Bremner Healthcare 5 21 23 3 13 © 2011 Duke Realty Corporation |
© 2011 Duke Realty Corporation CAPITAL STRATEGY AND 2011 GUIDANCE 67 |
© 2011 Duke Realty Corporation 68 Key Metrics & Goals 2009 Actual 2010 Actual Q1 2011 Actual Goal Debt to Gross Assets 44.5% 46.3% 46.1% 45.0% Debt + Preferred to Gross Assets 54.9% 55.5% 55.3% 50.0% Fixed Charge Coverage Ratio 1.79 : 1 1.79 : 1 1.81 : 1 2.00 : 1 Debt/EBITDA 6.65 7.31 6.66 < 6.00 Debt + Preferred/EBITDA 8.47 8.88 8.20 < 7.75 CAPITAL STRATEGY Progressing toward strategic plan goals |
© 2011 Duke Realty Corporation 69 CAPITAL STRATEGY Current Liquidity Position $460 $332 $632 $351 $2,335 $0 $1,000 $2,000 $3,000 2011 2012 2013 2014 Thereafter Debt Maturity and Amortization Schedule 3/31/2011 • Provide for $290 Million 2011 Unsecured Bond Maturities $122 million due 8/15/11 $168 million due 12/1/11 ($ in millions) |
70 CAPITAL STRATEGY Continue to execute on capital strategy objectives CAPITAL SOURCE 2007 2008 2009 2010 TOTALS Common Stock $230 - $575 $311 $1,116 Preferred Stock - $300 - - $300 Unsecured Debt $300 $325 $500 $250 $1,375 Secured Debt - - $270 - $270 Asset Dispositions $614 $426 $121 $533 $1,694 $1,144 $1,051 $1,466 $1,094 $4,755 • Investment grade rated debt for 15 years • Proven access to multiple capital sources • Current dividend payout covered by AFFO © 2011 Duke Realty Corporation Continue to strengthen balance sheet |
© 2011 Duke Realty Corporation 71 CAPITAL STRATEGY Maintain available options to advance capital strategy and growth 1st QTR 2nd QTR 3rd QTR 4THrd QTR A) Common equity Set up ATM $311MM equity issuance to fund Dugan N/A N/A B) Tender for debt... Additional unsecured to extend maturities Evaluated Market $212.2MM of bonds repurchased; $250MM unsecured offering Evaluated Market Evaluated Market C) Opportunistic open market debt repurchases $15MM of converts repurchased $48.5MM of converts repurchased $4.2MM of converts repurchased Evaluated Market D) Opportunistic open market preferred stock repurchases $55.7MM of Series O repurchased $53.7MM of Series O repurchased $2.7MM of Series O repurchased ST ND RD RD Executing according to strategy |
© 2011 Duke Realty Corporation 72 CAPITAL STRATEGY 2011 Range of Estimates 2011 RANGE Metrics 2010 Actual Pessimistic Optimistic Key Assumptions Core FFO Per Share $1.15 $1.06 $1.18 AFFO Payout Ratio 89% 100% 85% • Annual dividend maintained at $0.68 per share Average Occupancy 88.2% 87.5% 90.5% • First half expirations cause dip in occupancy • Upside to guidance driven by higher occupancy • Downside assumes “worst case” scenario from unknown bankruptcies, defaults and terminations Same Property NOI 0.9% (3.0%) 1.0% • Rental rate pressure remains • Coming off higher year Building Acquisitions $919 $200 $400 • Aligned with long-term strategy • Focus on industrial and medical office • Includes $173 million remaining acquisition of Premier Building Dispositions $499 $400 $600 • Strong backlog of non-strategic assets under contract • 2011 pipeline consists primarily of office product • Includes $275 million sale to CBRERT Land Dispositions $35 $20 $50 • Selling identified non-strategic parcels • Local market demand still sluggish Construction and Development Starts $313 $200 $400 • Anticipate medical office starts in the $75 million to $125 million range • Remaining starts from industrial build-to-suit and third party construction Construction Volume $751 $600 $800 • BRAC volume consistent with 2010 General and Administrative Expenses $41 $45 $40 • 2011 total overhead expenses flat • No severance costs in 2011 guidance Leasing actions continue to drive upside |
© 2011 Duke Realty Corporation 73 2010 PERFORMANCE $560 million of capital raised Retired $100 million of unsecured bonds Fixed charge ratio of 1.79x and debt to EBITDA of 7.31x Repurchased ~ $280 million par value of bonds and more than $112 million face amount of Series O preferred stock 2011 GOALS Opportunistically access capital markets Continue improving coverage ratios Maintain minimal balance on line of credit CAPITAL STRATEGY Strong balance sheet… Executing according to strategy |
© 2011 Duke Realty Corporation CLOSING REMARKS 74 |
© 2011 Duke Realty Corporation 75 2010 Accomplishments and 2011 Opportunities Drive Shareholder Return 2010 2011 Capital Strategy Raised nearly $1.1 billion of capital Executed Capital Strategy in alignment with operating and asset strategy Operating with minimal balance outstanding on our line of credit 2011 maturities provided for Opportunistically access capital markets . . . push out maturity schedule further Continue improving our coverage ratios Maintain minimal balance on our line of credit Operating Strategy Reduced operating overhead 6.5% Leased nearly 26 million square feet Maintained high tenant retention @ 77% renewal rate Achieved strong service operations performance Achieved $130 million development starts at attractive yields; 40% of investment medical office Balance capital strategy relative to level and quality of cash flow and same property NOI Maintain fixed charge coverage above 1.75x and Debt/EBITDA below 7.0x Lease-up portfolio; manage cap ex; reach positive same property income growth Development Expertise Third party volume totaled $619 million and exceeded budget by $57 million Increase our new development starts to $200 million Asset Strategy Made significant progress on strategic plan Continue making significant progress on strategic plan RELIABLE. ANSWERS. |
RELIABLE. ANSWERS. © 2011 Duke Realty Corporation 76 Portfolio Strategy BY PRODUCT 2009 2013 BY GEOGRAPHY 2010 2009 2013 2010 1. Includes proforma effects of remaining CBRERT and Premier assets Southeast 21% Southeast 27% Southeast 30% 1 1 |
© 2011 Duke Realty Corporation RELIABLE. ANSWERS. 77 Positioned for NAV Growth KEY NAV GROWTH DRIVERS Lease up existing vacancy Increased management/ service fees Accretive future development Upside from land holdings Portfolio occupancy of 89%; 300-400 bps below historical levels Strong leasing pipeline Demonstrated track record of 70 – 80% renewal rate Will benefit from uptick in third party and JV partners development & construction activity Property management and leasing fees dependant on portfolio occupancy – will trend higher as occupancy improves Current pipeline of 347K SF of medical office and 1.6 million SF of industrial 2011 starts in the $200 million – $400 million range Attractive basis enhances accretive developments Potential upside from impaired carrying value Will opportunistically assess development and disposition alternatives |
© 2011 Duke Realty Corporation RELIABLE. ANSWERS. 78 WHY DUKE REALTY? Quality portfolio improving with asset strategy Solid balance sheet improving with capital strategy Unmatched ability to execute on daily operations Development capabilities in place with existing land bank Talent and leadership depth to execute |
RELIABLE. ANSWERS. © 2011 Duke Realty Corporation Forward-Looking Statement 79 This slide presentation contains statements that constitute “forward-looking statements” within the meaning of the Securities Act of 1933 and the Securities Exchange Act of 1934 as amended by the Private Securities Litigation Reform Act of 1995. These forward-looking statements include, among others, our statements regarding (1) strategic initiatives with respect to our assets, operations and capital and (2) the assumptions underlying our expectations. Prospective investors are cautioned that any such forward-looking statements are not guarantees of future performance and involve risks and uncertainties, and that actual results may differ materially from those contemplated by such forward- looking statements. A number of important factors could cause actual results to differ materially from those contemplated by forward-looking statements in this slide presentation. Many of these factors are beyond our ability to control or predict. Factors that could cause actual results to differ materially from those contemplated in this slide presentation include the factors set forth in our filings with the Securities and Exchange Commission, including our annual report on Form10-K, quarterly reports on Form 10-Q and current reports on Form 8-K. We believe these forward-looking statements are reasonable, however, undue reliance should not be placed on any forward-looking statements, which are based on current expectations. We do not assume any obligation to update any forward-looking statements as a result of new information or future developments or otherwise. |