Exhibit 99.1
2011 Investor and Analyst Conference
November 14, 2011
RELIABLE. ANSWERS.
DukeREALTY
RELIABLE. ANSWERS
Denny Oklak
Chairman & CEO
Christie Kelly
Executive VP & CFO
Jim Bremner
President, Healthcare
Jim Connor
Senior Regional EVP
Sam O’Briant
Regional EVP
Jeff Turner
Regional EVP
© 2011 Duke Realty Corporation | 2
RELIABLE. ANSWERS
Ron Hubbard
VP, Investor Relations
Deeni Taylor
EVP, Healthcare
Jeff Thornton
SVP, South Region
Randy Wood
VP, South Region
© 2011 Duke Realty Corporation | 3
Opening
Market outlook
Strategic performance
Capital Strategy and 2011 guidance
Blackstone transaction overview
Medical office and Baylor overview
Dallas market overview
Closing comments
AGENDA
© 2011 Duke Realty Corporation | 4
RELIABLE. ANSWERS
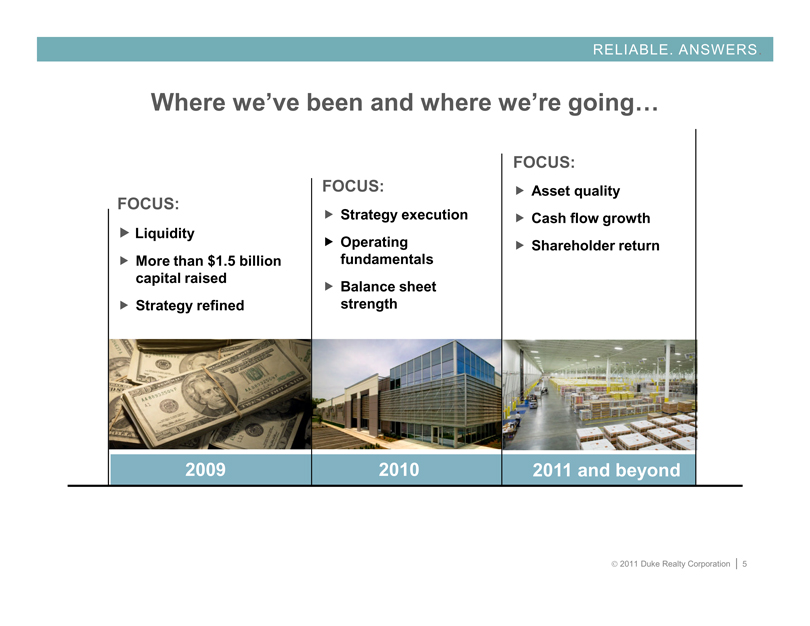
Where we’ve been and where we’re going…
FOCUS:
Liquidity
More than $1.5 billion capital raised
Strategy refined
FOCUS:
Strategy execution
Operating fundamentals
Balance sheet strength
FOCUS: Asset quality
Cash flow growth
Shareholder return
2009
2010
2011 and beyond
© 2011 Duke Realty Corporation | 5
RELIABLE. ANSWERS
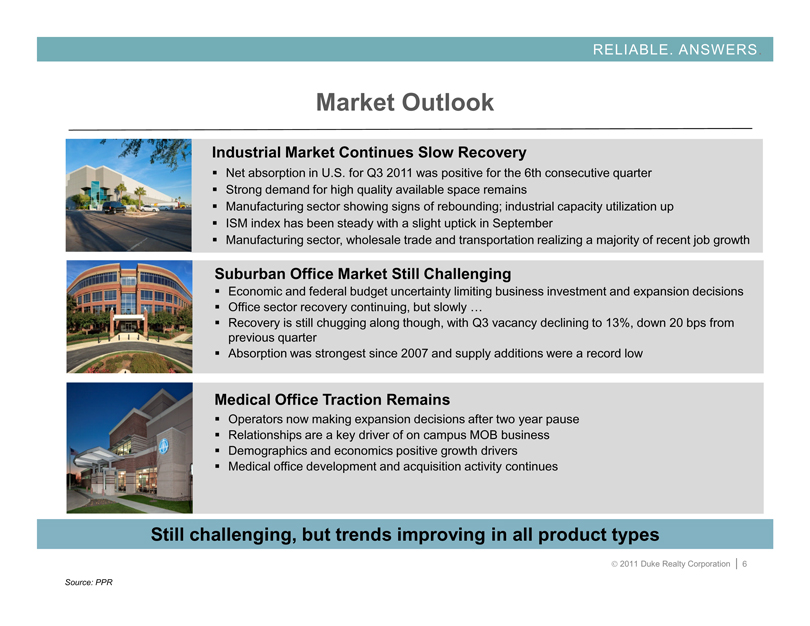
Market Outlook
Industrial Market Continues Slow Recovery
Net absorption in U.S. for Q3 2011 was positive for the 6th consecutive quarter
Strong demand for high quality available space remains
Manufacturing sector showing signs of rebounding; industrial capacity utilization up
ISM index has been steady with a slight uptick in September
Manufacturing sector, wholesale trade and transportation realizing a majority of recent job growth
Suburban Office Market Still Challenging
Economic and federal budget uncertainty limiting business investment and expansion decisions
Office sector recovery continuing, but slowly …
Recovery is still chugging along though, with Q3 vacancy declining to 13%, down 20 bps from
previous quarter
Absorption was strongest since 2007 and supply additions were a record low
Medical Office Traction Remains
Operators now making expansion decisions after two year pause
Relationships are a key driver of on campus MOB business
Demographics and economics positive growth drivers
Medical office development and acquisition activity continues
Still challenging, but trends improving in all product types
© 2011 Duke Realty Corporation | 6
Source: PPR
RELIABLE. ANSWERS
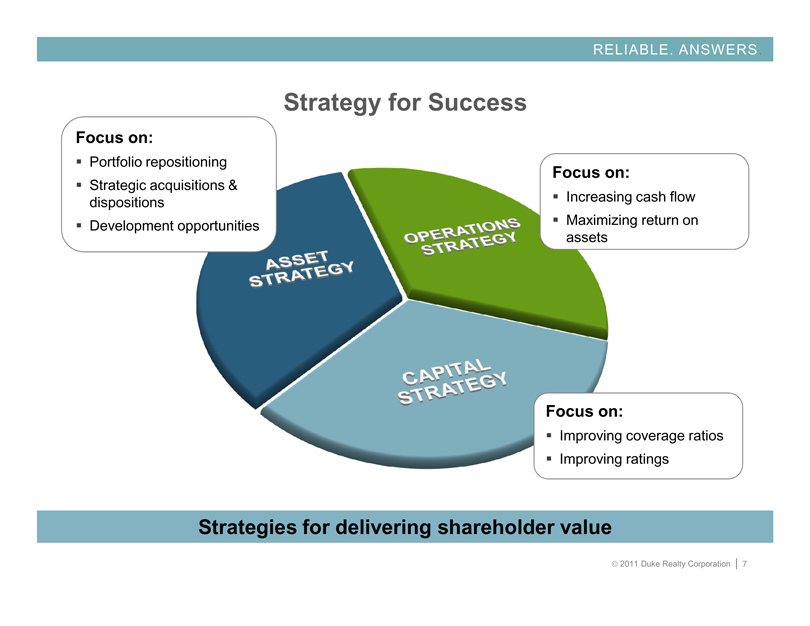
Strategy for Success
Focus on:
Portfolio repositioning
Strategic acquisitions & dispositions
Development opportunities
Focus on:
Increasing cash flow
Maximizing return on assets
Focus on:
Improving coverage ratios
Improving ratings
ASSET STRATEGY
OPERATIONS STRATEGY
CAPITAL STRATEGY
Strategies for delivering shareholder value
© 2011 Duke Realty Corporation | 7
RELIABLE. ANSWERS
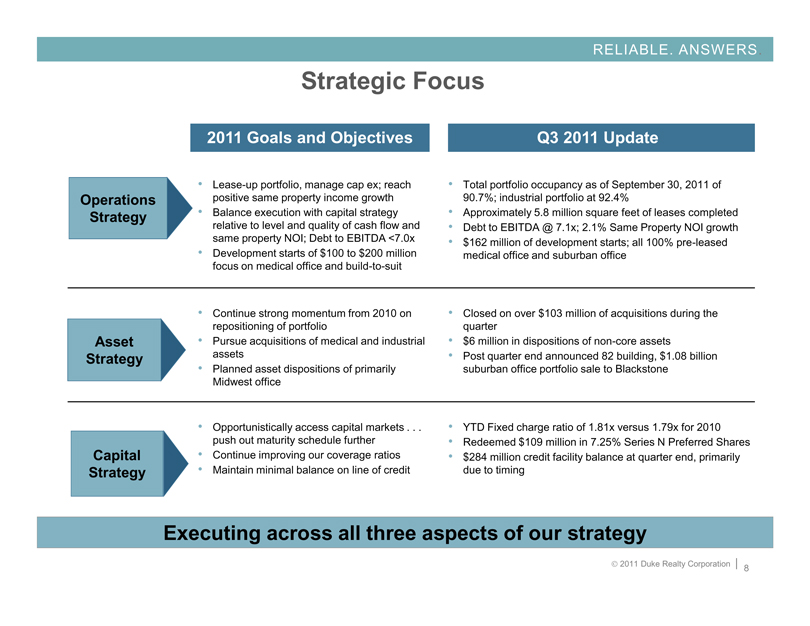
Strategic Focus
2011 Goals and Objectives
Operations Strategy
• Lease-up portfolio, manage cap ex; reach positive same property income growth
• Balance execution with capital strategy relative to level and quality of cash flow and same property NOI; Debt to EBITDA <7.0x
• Development starts of $100 to $200 million focus on medical office and build-to-suit
Q3 2011 Update
Total portfolio occupancy as of September 30, 2011 of 90.7%; industrial portfolio at 92.4%
Approximately 5.8 million square feet of leases completed
Debt to EBITDA @ 7.1x; 2.1% Same Property NOI growth
$162 million of development starts; all 100% pre-leased medical office and suburban office
Asset Strategy
Continue strong momentum from 2010 on repositioning of portfolio
Pursue acquisitions of medical and industrial assets
Planned asset dispositions of primarily Midwest office
Closed on over $103 million of acquisitions during the quarter
$6 million in dispositions of non-core assets
Post quarter end announced 82 building, $1.08 billion suburban office portfolio sale to Blackstone
Capital Strategy
Opportunistically access capital markets . . . push out maturity schedule further
Continue improving our coverage ratios
Maintain minimal balance on line of credit
YTD Fixed charge ratio of 1.81x versus 1.79x for 2010
Redeemed $109 million in 7.25% Series N Preferred Shares
$284 million credit facility balance at quarter end, primarily due to timing
Executing across all three aspects of our strategy
© 2011 Duke Realty Corporation | 8
OPERATIONS STRATEGY
© 2011 Duke Realty Corporation | 9
OPERATIONS STRATEGY
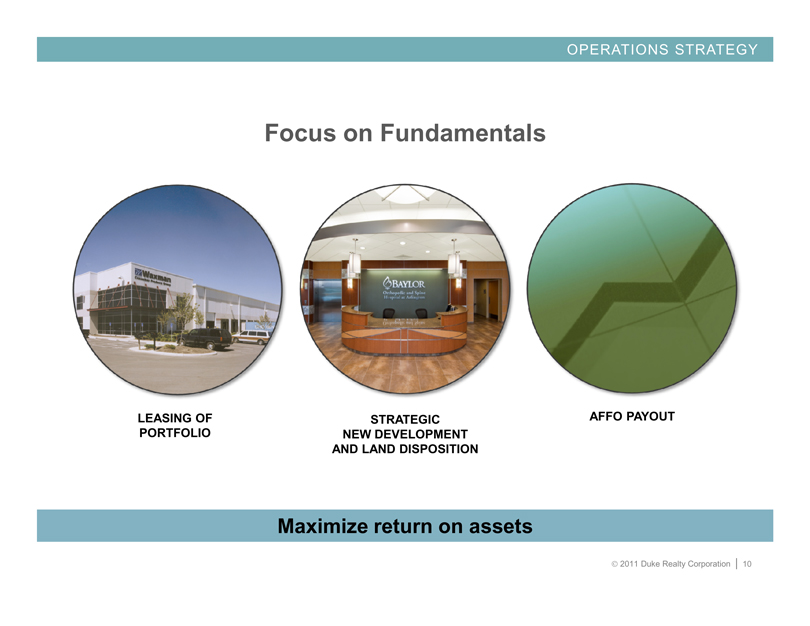
Focus on Fundamentals
LEASING OF PORTFOLIO
STRATEGIC NEW DEVELOPMENT
AND LAND DISPOSITION
AFFO PAYOUT
Maximize return on assets
© 2011 Duke Realty Corporation | 10
OPERATIONS STRATEGY
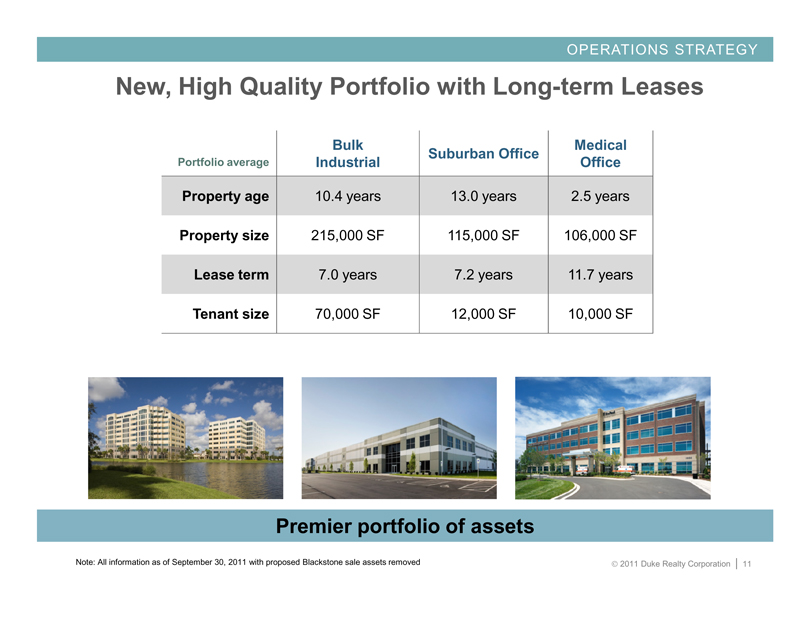
New, High Quality Portfolio with Long-term Leases
Portfolio average
Bulk Industrial
Suburban Office
Medical Office
Property age 10.4 years 13.0 years 2.5 years
Property size 215,000 SF 115,000 SF 106,000 SF
Lease term 7.0 years 7.2 years 11.7 years
Tenant size 70,000 SF 12,000 SF 10,000 SF
Premier portfolio of assets
Note: All information as of September 30, 2011 with proposed Blackstone sale assets removed
© 2011 Duke Realty Corporation | 11
OPERATIONS STRATEGY
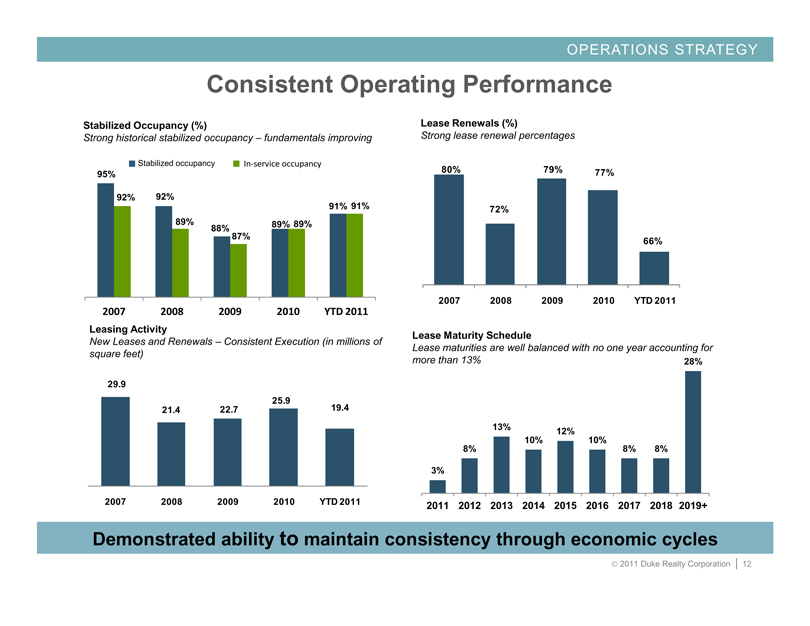
Consistent Operating Performance
Stabilized Occupancy (%)
Strong historical stabilized occupancy – fundamentals improving
Stabilized occupancy
In-service occupancy
95%
92%
92%
89%
88%
87%
89%
89%
91%
91%
2007 2008 2009 2010 YTD 2011
Lease Renewals (%)
Strong lease renewal percentages
80%
72%
79%
77%
66%
2007 2008 2009 2010 YTD 2011
Leasing Activity
New Leases and Renewals – Consistent Execution (in millions of square feet)
29.9
21.4
22.7
25.9
19.4
2007 2008 2009 2010 YTD 2011
Lease Maturity Schedule
Lease maturities are well balanced with no one year accounting for
more than 13%
3%
8%
13%
10%
12%
10%
8%
8%
28%
2011 2012 2013 2014 2015 2016 2017 2018 2019+
Demonstrated ability to maintain consistency through economic cycles
© 2011 Duke Realty Corporation | 12
RELIABLE. ANSWERS
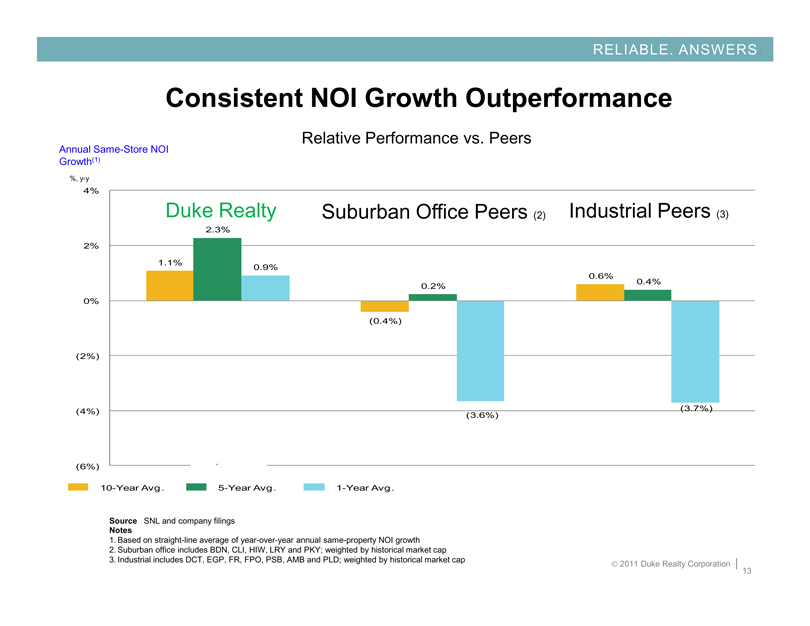
Consistent NOI Growth Outperformance
Relative Performance vs. Peers
Annual Same-Store NOI Growth(1)
%, y-y
4%
2%
0%
(2%)
(4%)
(6%)
Duke Realty
Suburban Office Peers (2)
Industrial Peers (3)
1.1%
2.3%
0.9%
(0.4%)
0.2%
(3.6%)
0.6%
0.4%
(3.7%)
10-Year Avg.
5-Year Avg.
1-Year Avg.
Source SNL and company filings
Notes
1. Based on straight-line average of year-over-year annual same-property NOI growth
2. Suburban office includes BDN, CLI, HIW, LRY and PKY; weighted by historical market cap
3. Industrial includes DCT, EGP, FR, FPO, PSB, AMB and PLD; weighted by historical market cap
© 2011 Duke Realty Corporation | 13
OPERATIONS STRATEGY
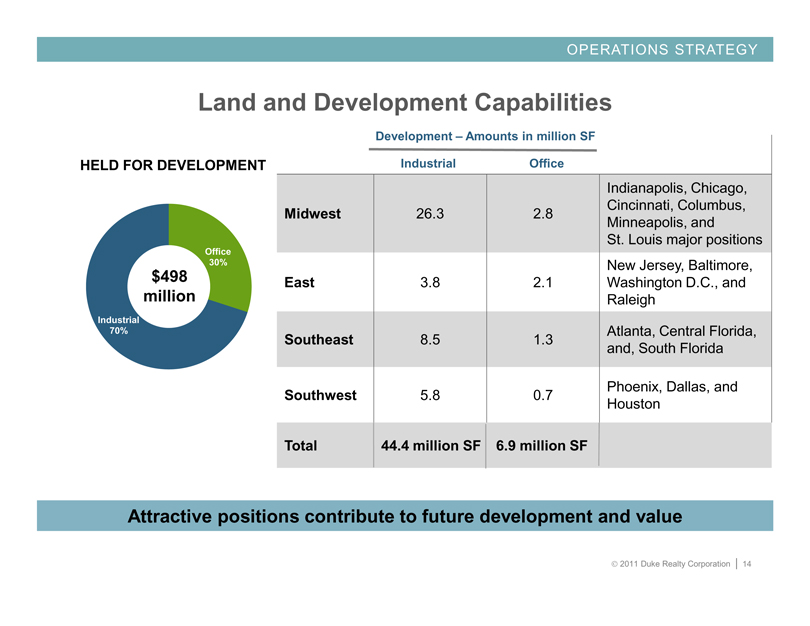
Land and Development Capabilities
HELD FOR DEVELOPMENT
$498 million
Office 30%
Industrial 70%
Development – Amounts in million SF
Industrial
Office
Midwest
26.3
2.8
Indianapolis, Chicago, Cincinnati, Columbus, Minneapolis, and St. Louis major positions
East
3.8
2.1
New Jersey, Baltimore, Washington D.C., and Raleigh
Southeast
8.5
1.3
Atlanta, Central Florida, and, South Florida
Southwest
5.8
0.7
Phoenix, Dallas, and Houston
Total
44.4 million SF
6.9 million SF
Attractive positions contribute to future development and value
© 2011 Duke Realty Corporation | 14
OPERATIONS STRATEGY
Atlanta - Office
• Headquarters Build to Suit for Primerica, A2/AA- rated financial services Company
• 345,000 square feet
• Fifteen year lease term
• Owned land at Legacy Office Park in Gwinnett County, 37 acres
• First development at this park
• $65 million project
Strategic new development on Duke Realty land
© 2011 Duke Realty Corporation | 15
OPERATIONS STRATEGY
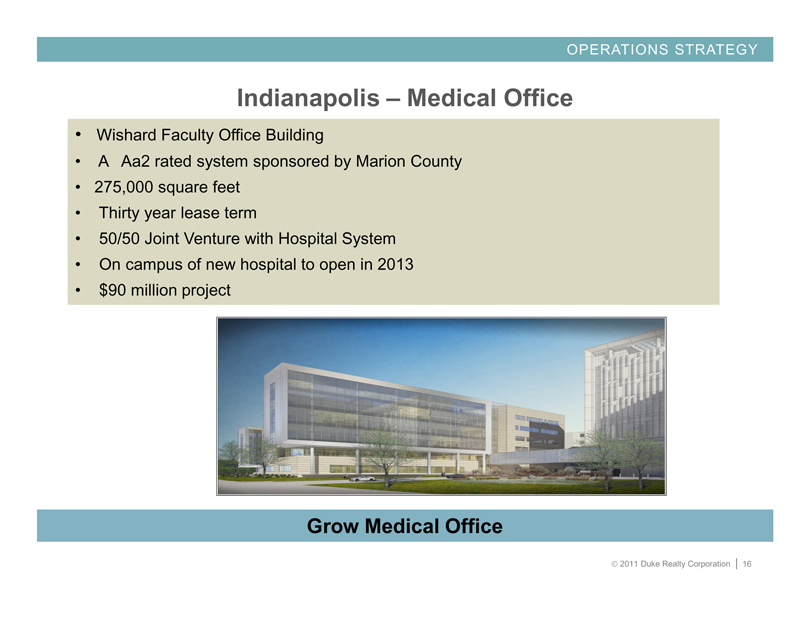
Indianapolis – Medical Office
• Wishard Faculty Office Building
• A Aa2 rated system sponsored by Marion County
• 275,000 square feet
• Thirty year lease term
• 50/50 Joint Venture with Hospital System
• On campus of new hospital to open in 2013
• $90 million project
Grow Medical Office
© 2011 Duke Realty Corporation | 16
OPERATIONS STRATEGY
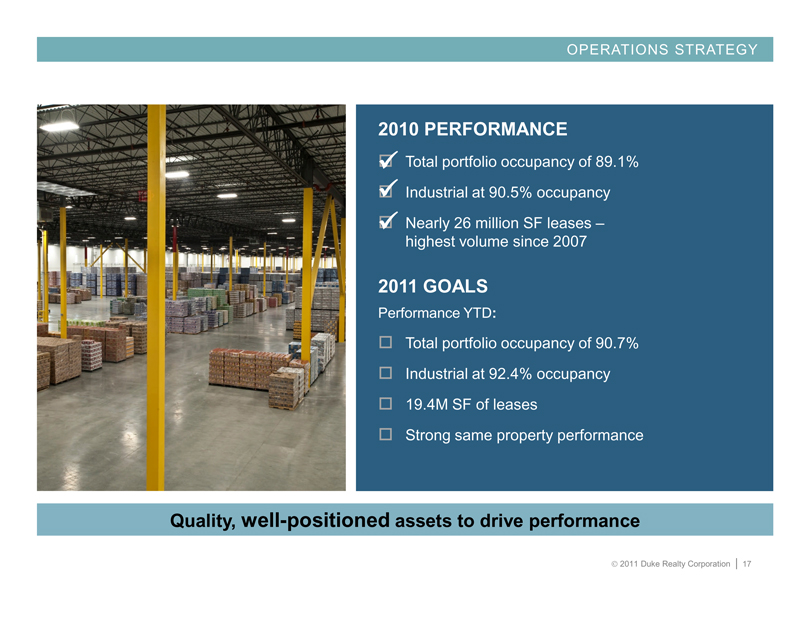
2010 PERFORMANCE
Total portfolio occupancy of 89.1%
Industrial at 90.5% occupancy
Nearly 26 million SF leases – highest volume since 2007
2011 GOALS
Performance YTD:
Total portfolio occupancy of 90.7%
Industrial at 92.4% occupancy
19.4M SF of leases
Strong same property performance
Quality, well-positioned assets to drive performance
© 2011 Duke Realty Corporation | 17
ASSET STRATEGY
© 2011 Duke Realty Corporation | 18
ASSET STRATEGY
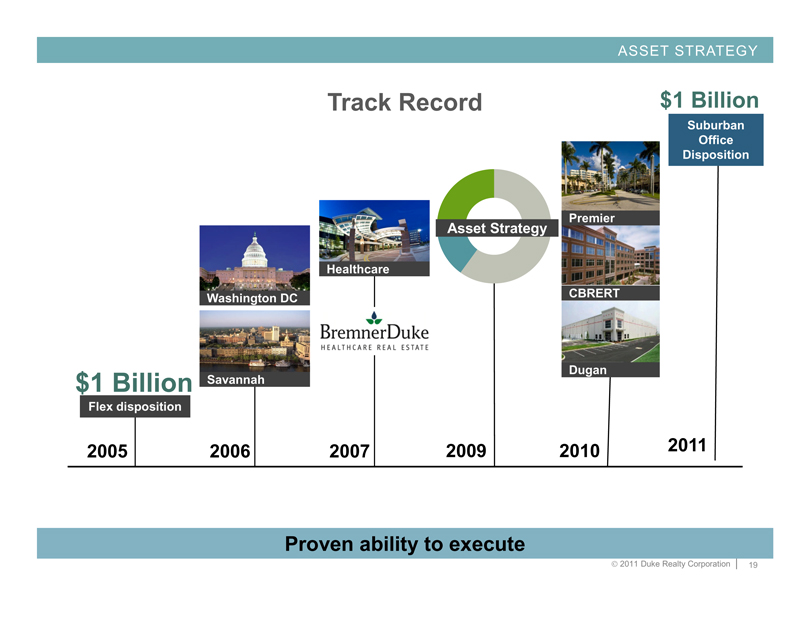
Track Record
$1 Billion
Flex disposition
Washington DC
Savannah
Healthcare
BremnerDuke
HEALTHCARE REAL ESTATE
Asset Strategy
Premier
CBRERT
Dugan
$1 Billion
Suburban Office Disposition
2005
2006
2007
2009
2010
2011
Proven ability to execute
© 2011 Duke Realty Corporation | 19
ASSET STRATEGY
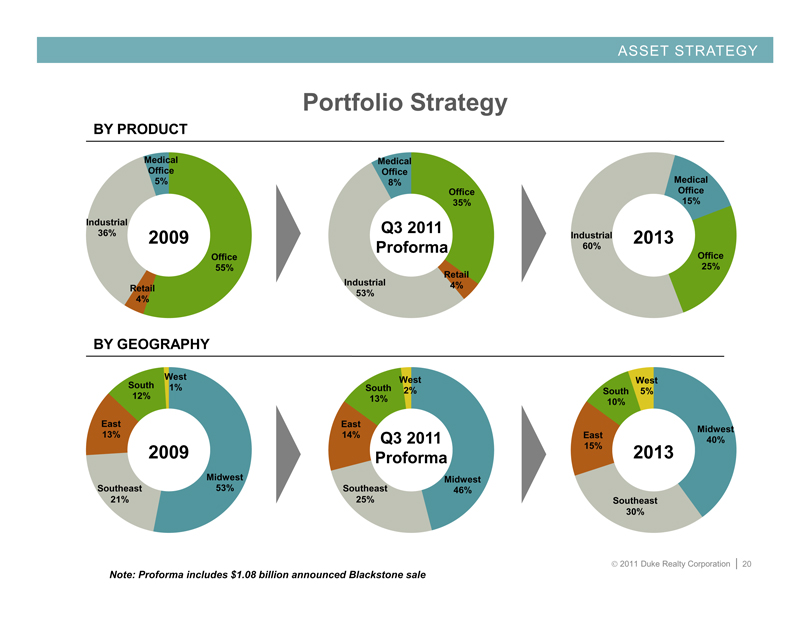
Portfolio Strategy
BY PRODUCT
Medical Office 5%
Industrial 36%
Retail 4%
Office 55%
2009
Medical Office 8%
Office 35%
Retail 4%
Industrial 53%
Q3 2011 Proforma
Medical Office 15%
Office 25%
Industrial 60%
2013
BY GEOGRAPHY
West
1%
Midwest 53%
Southeast 21%
East 13%
South 12%
2009
West
2%
Midwest 46%
Southeast 25%
East 14%
South 13%
Q3 2011 Proforma
West
5%
Midwest 40%
Southeast 30%
East 15%
South 10%
2013
Note: Proforma includes $1.08 billion announced Blackstone sale
© 2011 Duke Realty Corporation | 20
ASSET STRATEGY
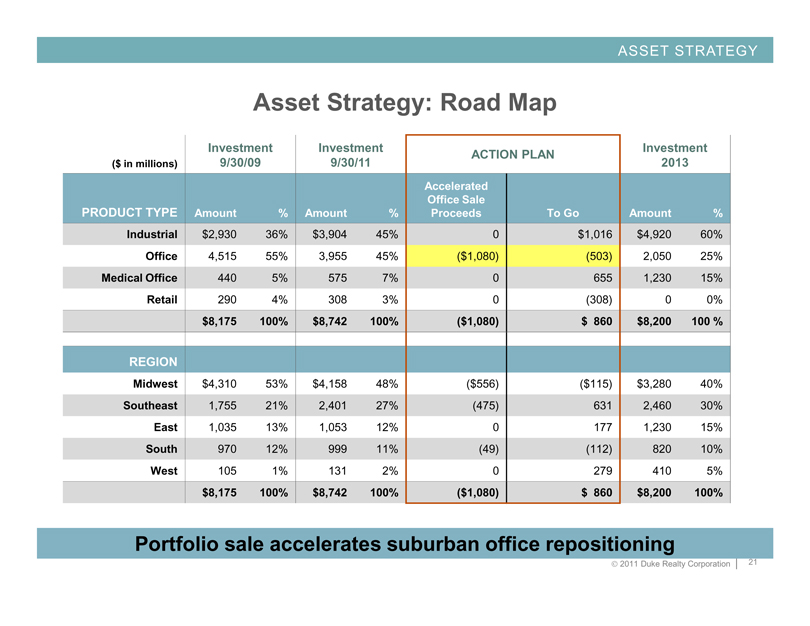
Asset Strategy: Road Map
($ in millions) Investment 9/30/09 Investment 9/30/11 ACTION PLAN Investment 2013
PRODUCT TYPE Amount % Amount % Accelerated Office Sale Proceeds To Go Amount %
Industrial $2,930 36% $3,904 45% 0 $1,016 $4,920 60%
Office 4,515 55% 3,955 45% ($1,080) (503) 2,050 25%
Medical Office 440 5% 575 7% 0 655 1,230 15%
Retail 290 4% 308 3% 0 (308) 0 0%
$8,175 100% $8,742 100% ($1,080) $860 $8,200 100%
REGION
Midwest $4,310 53% $4,158 48% ($556) ($115) $3,280 40%
Southeast 1,755 21% 2,401 27% (475) 631 2,460 30%
East 1,035 13% 1,053 12% 0 177 1,230 15%
South 970 12% 999 11% (49) (112) 820 10%
West 105 1% 131 2% 0 279 410 5%
$8,175 100% $8,742 100% ($1,080) $860 $8,200 100%
Portfolio sale accelerates suburban office repositioning
© 2011 Duke Realty Corporation | 21
ASSET STRATEGY
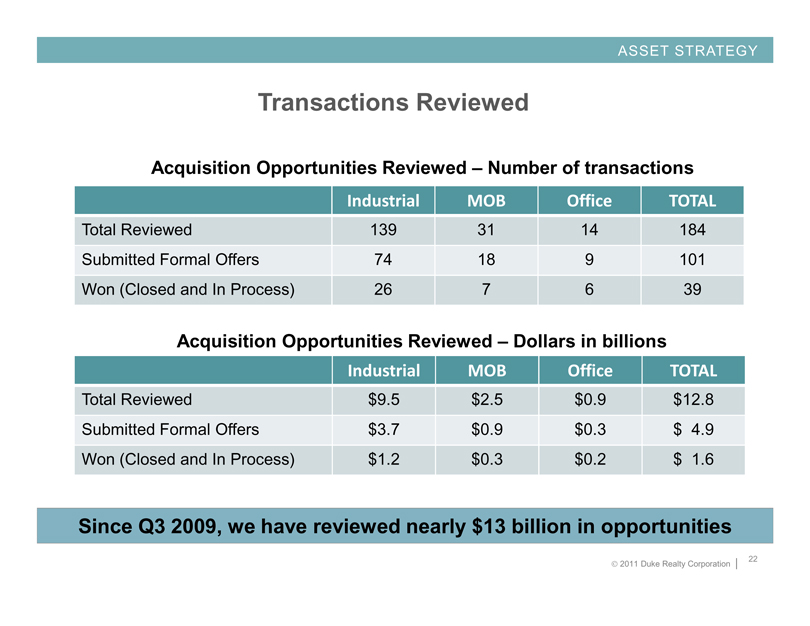
Transactions Reviewed
Acquisition Opportunities Reviewed – Number of transactions
Industrial MOB Office TOTAL
Total Reviewed 139 31 14 184
Submitted Formal Offers 74 18 9 101
Won (Closed and In Process) 26 7 6 39
Acquisition Opportunities Reviewed – Dollars in billions
Industrial MOB Office TOTAL
Total Reviewed $9.5 $2.5 $0.9 $12.8
Submitted Formal Offers $3.7 $0.9 $0.3 $4.9
Won (Closed and In Process) $1.2 $0.3 $0.2 $1.6
Since Q3 2009, we have reviewed nearly $13 billion in opportunities
© 2011 Duke Realty Corporation | 22
ASSET STRATEGY
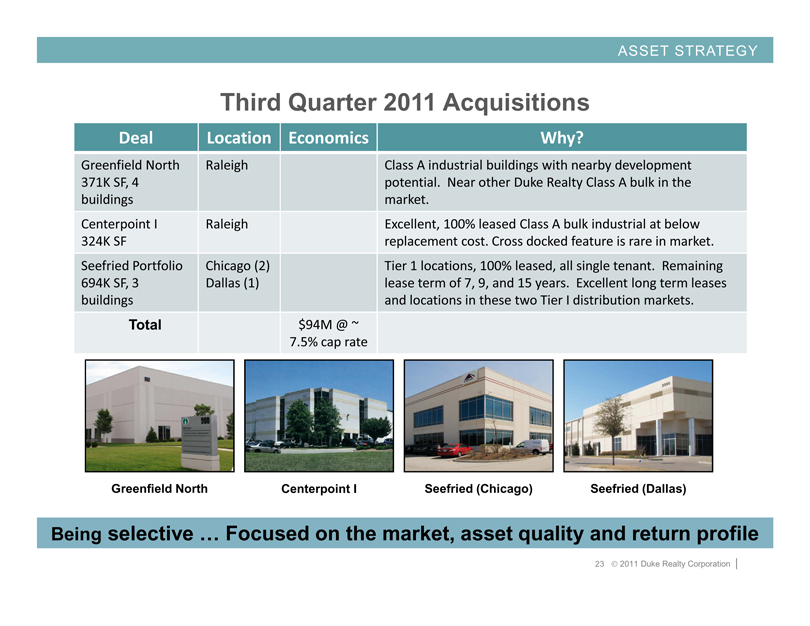
Third Quarter 2011 Acquisitions
Deal
Location
Economics
Why?
Greenfield North 371K SF, 4 buildings
Raleigh
Class A industrial buildings with nearby development potential. Near other Duke Realty Class A bulk in the market.
Centerpoint I 324K SF
Raleigh
Excellent, 100% leased Class A bulk industrial at below replacement cost. Cross docked feature is rare in market.
Seefried Portfolio 694K SF, 3 buildings
Chicago (2) Dallas (1)
Tier 1 locations, 100% leased, all single tenant. Remaining lease term of 7, 9, and 15 years. Excellent long term leases and locations in these two Tier I distribution markets.
Total
$94M @ ~ 7.5% cap rate Greenfield North Centerpoint I Seefried (Chicago) Seefried (Dallas)
Being selective … Focused on the market, asset quality and return profile
23 © 2011 Duke Realty Corporation |
ASSET STRATEGY
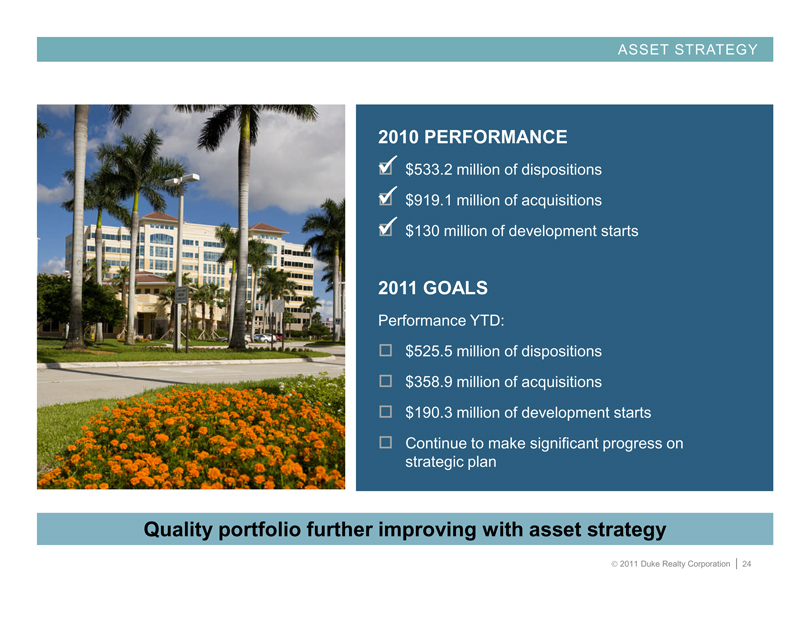
2010 PERFORMANCE
$533.2 million of dispositions
$919.1 million of acquisitions
$130 million of development starts
2011 GOALS
Performance YTD:
$525.5 million of dispositions
$358.9 million of acquisitions
$190.3 million of development starts
Continue to make significant progress on strategic plan
Quality portfolio further improving with asset strategy
© 2011 Duke Realty Corporation | 24
CAPITAL STRATEGY AND 2011 GUIDANCE
© 2011 Duke Realty Corporation | 25
CAPITAL STRATEGY
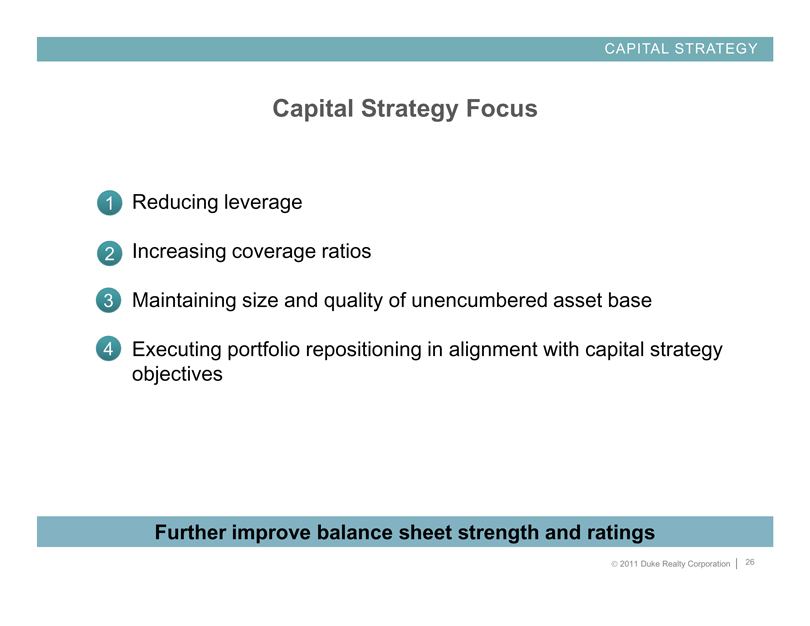
Capital Strategy Focus
1 Reducing leverage
2 Increasing coverage ratios
3 Maintaining size and quality of unencumbered asset base
4 Executing portfolio repositioning in alignment with capital strategy objectives
Further improve balance sheet strength and ratings
© 2011 Duke Realty Corporation | 26
CAPITAL STRATEGY
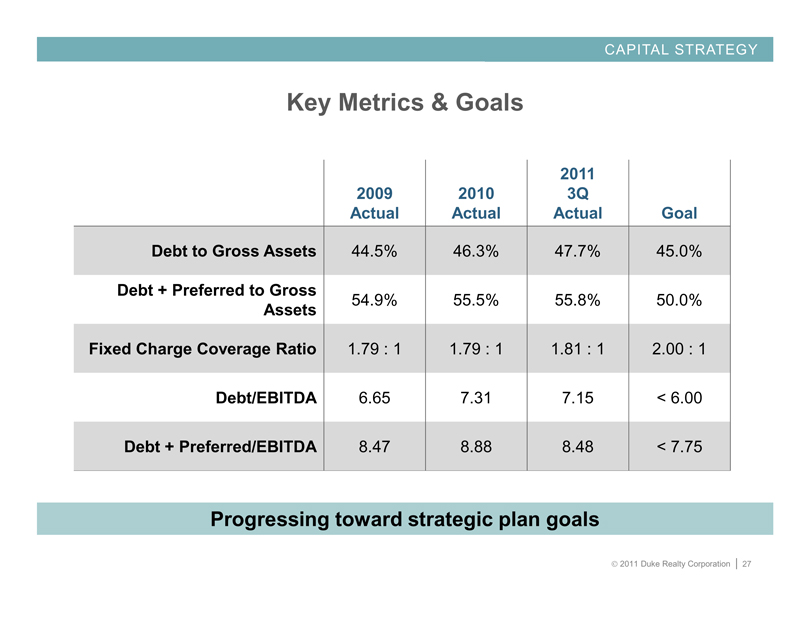
Key Metrics & Goals
2009 Actual 2010 Actual 2011 3Q Actual Goal
Debt to Gross Assets 44.5% 46.3% 47.7% 45.0%
Debt + Preferred to Gross Assets 54.9% 55.5% 55.8% 50.0%
Fixed Charge Coverage Ratio 1.79 : 1 1.79 : 1 1.81 : 1 2.00 : 1
Debt/EBITDA 6.65 7.31 7.15 < 6.00
Debt + Preferred/EBITDA 8.47 8.88 8.48 < 7.75
Progressing toward strategic plan goals
© 2011 Duke Realty Corporation | 27
CAPITAL STRATEGY
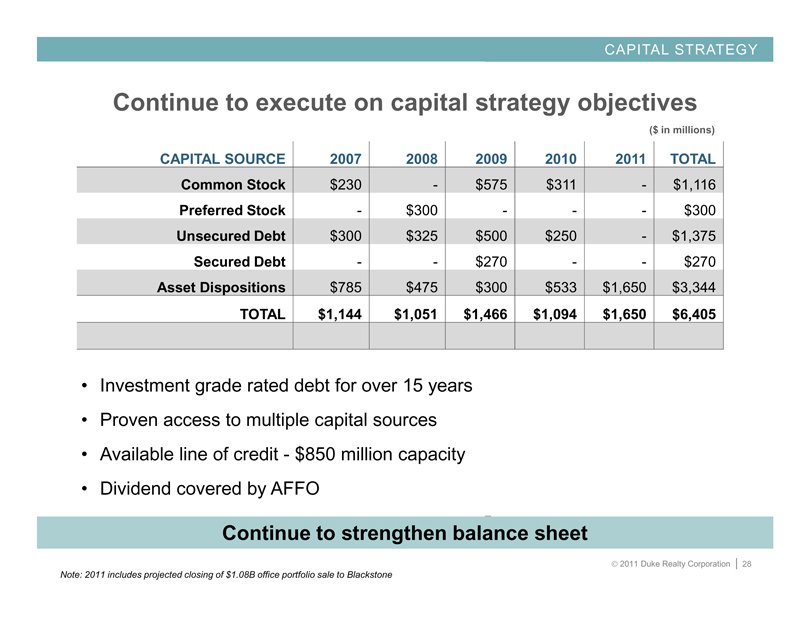
Continue to execute on capital strategy objectives
($ in millions)
CAPITAL SOURCE 2007 2008 2009 2010 2011 TOTAL
Common Stock $230 - $575 $311 - $1,116
Preferred Stock - $300 - - - $300
Unsecured Debt $300 $325 $500 $250 - $1,375
Secured Debt - - $270 - - $270
Asset Dispositions $785 $475 $300 $533 $1,650 $3,344
TOTAL $1,144 $1,051 $1,466 $1,094 $1,650 $6,405
• Investment grade rated debt for over 15 years
• Proven access to multiple capital sources
• Available line of credit - $850 million capacity
• Dividend covered by AFFO
Continue to strengthen balance sheet
Note: 2011 includes projected closing of $1.08B office portfolio sale to Blackstone
© 2011 Duke Realty Corporation | 28
CAPITAL STRATEGY
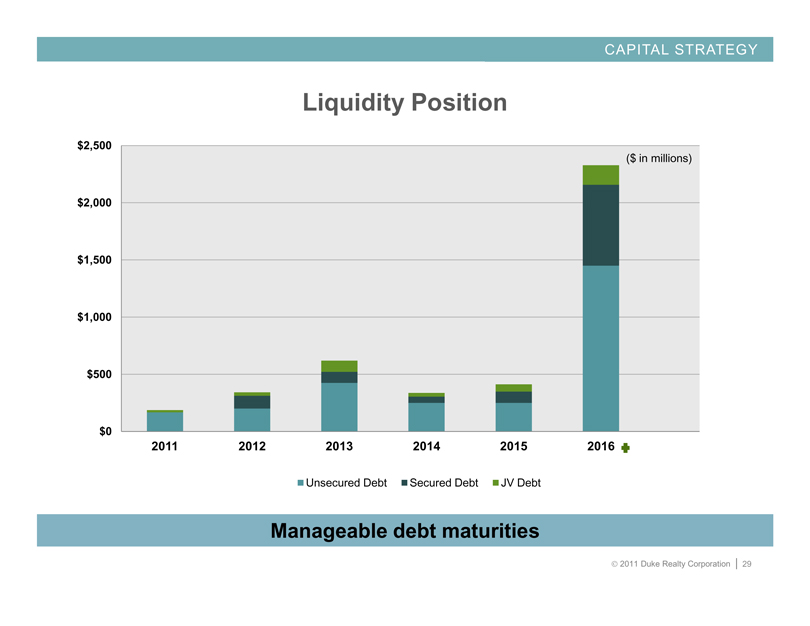
Liquidity Position
$2,500
$2,000
$1,500
$1,000
$500
$0
($ in millions)
2011 2012 2013 2014 2015 2016
Unsecured Debt
Secured Debt
JV Debt
Manageable debt maturities
© 2011 Duke Realty Corporation | 29
CAPITAL STRATEGY
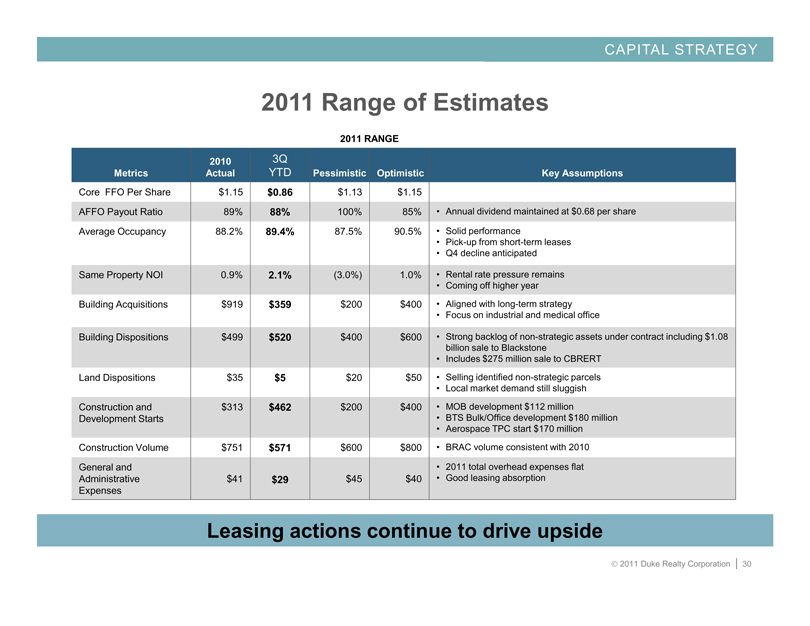
2011 Range of Estimates
2011 RANGE
Metrics 2010 Actual 3Q YTD Pessimistic Optimistic Key Assumptions
Core FFO Per Share $1.15 $0.86 $1.13 $1.15
AFFO Payout Ratio 89% 88% 100% 85%
• Annual dividend maintained at $0.68 per share
Average Occupancy 88.2% 89.4% 87.5% 90.5% • Solid performance
• Pick-up from short-term leases
• Q4 decline anticipated
Same Property NOI 0.9% 2.1% (3.0%) 1.0%
• Rental rate pressure remains
• Coming off higher year
Building Acquisitions $919 $359 $200 $400
• Aligned with long-term strategy
• Focus on industrial and medical office
Building Dispositions $499 $520 $400 $600
• Strong backlog of non-strategic assets under contract including $1.08
billion sale to Blackstone
• Includes $275 million sale to CBRERT
Land Dispositions $35 $5 $20 $50
• Selling identified non-strategic parcels
• Local market demand still sluggish
Construction and Development Starts $313 $462 $200 $400
• MOB development $112 million
• BTS Bulk/Office development $180 million
• Aerospace TPC start $170 million
Construction Volume $751 $571 $600 $800
• BRAC volume consistent with 2010
General and Administrative Expenses
$41 $29 $45 $40
• 2011 total overhead expenses flat
• Good leasing absorption
Leasing actions continue to drive upside
© 2011 Duke Realty Corporation | 30
CAPITAL STRATEGY
2010 PERFORMANCE
$560 million of capital raised
Retired $100 million of unsecured bonds
Fixed charge ratio of 1.79x and debt to EBITDA of 7.31x
Repurchased ~ $280 million par value of bonds and more than $112 million face amount of Series O preferred stock
2011 GOALS
Opportunistically access capital markets
Continue improving coverage ratios
Maintain minimal balance on line of credit
Strong balance sheet … executing according to strategy
© 2011 Duke Realty Corporation | 31
$1.08B PORTFOLIO SALE OVERVIEW
© 2011 Duke Realty Corporation | 32
RELIABLE. ANSWERS
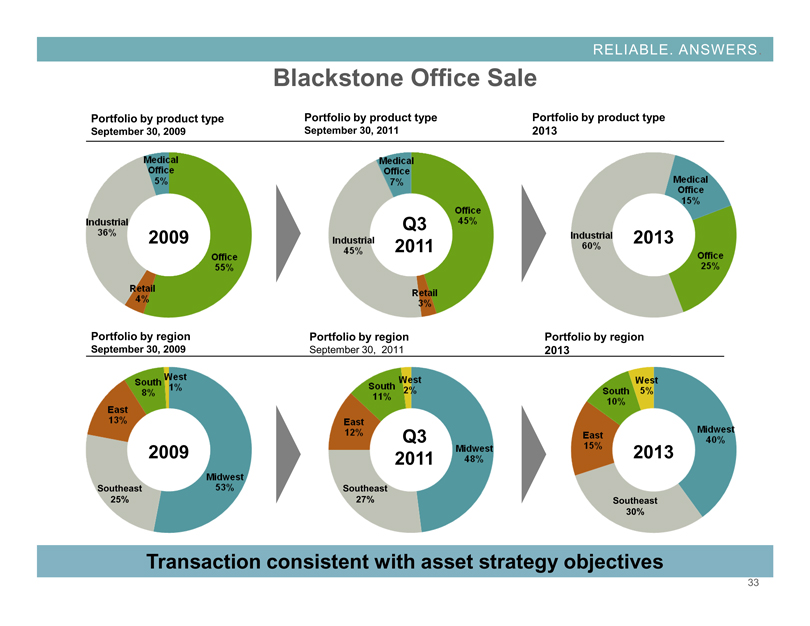
Blackstone Office Sale
Portfolio by product type September 30, 2009
Medical Office 5%
Office 55%
Retail 4%
Industrial 36%
2009
Portfolio by product type September 30, 2011
Medical Office 7%
Office 45%
Retail 3%
Industrial 45%
Q3 2011
Portfolio by product type 2013
Medical Office 15%
Office 25%
Industrial 60%
2013
Portfolio by region September 30, 2009
West 1%
Midwest 53%
Southeast 25%
East 13%
South 8%
2009
Portfolio by region
September 30, 2011
West 2%
Midwest 48%
Southeast 27%
East 12%
South 11%
Q3 2011
Portfolio by region 2013
West 5%
Midwest 40%
Southeast 30%
East 15%
South 10%
2013
Transaction consistent with asset strategy objectives
33
RELIABLE. ANSWERS
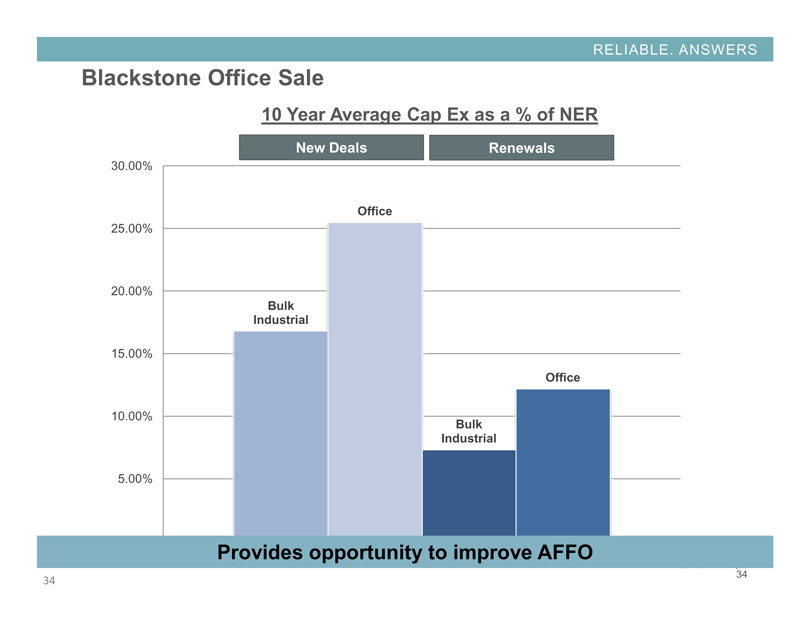
Blackstone Office Sale
10 Year Average Cap Ex as a % of NER
New Deals Renewals
30.00%
25.00%
20.00%
15.00%
10.00%
5.00%
Bulk Industrial
Office
Bulk Industrial
Office
Provides opportunity to improve AFFO
34 34
RELIABLE. ANSWERS
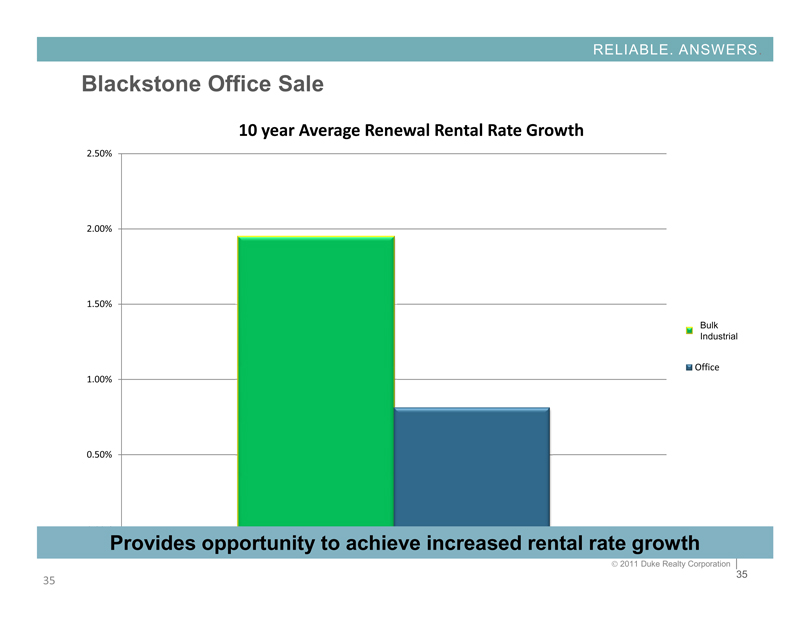
Blackstone Office Sale
10 year Average Renewal Rental Rate Growth
2.50%
2.00%
1.50%
1.00%
0.50%
Bulk
Industrial
Office
Total Bulk
Provides opportunity to achieve increased rental rate growth
© 2011 Duke Realty Corporation |
35 35
RELIABLE. ANSWERS
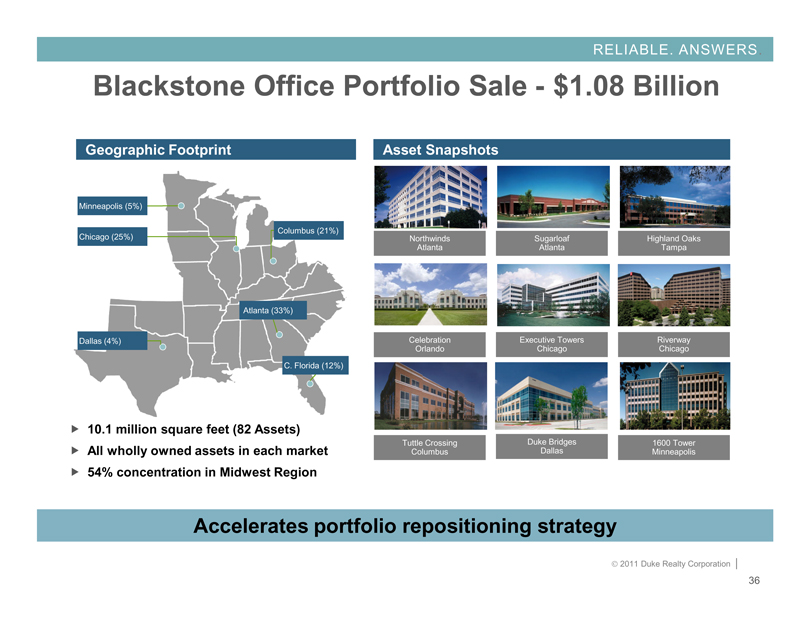
Blackstone Office Portfolio Sale - $1.08 Billion
Geographic Footprint
Minneapolis (5%)
Chicago (25%)
Dallas (4%)
Columbus (21%)
Atlanta (33%)
C. Florida (12%)
Asset Snapshots
Northwinds Atlanta
Sugarloaf Atlanta
Highland Oaks Tampa
Celebration Orlando
Executive Towers Chicago
Riverway Chicago
Tuttle Crossing Columbus
Duke Bridges Dallas
1600 Tower Minneapolis
10.1 million square feet (82 Assets)
All wholly owned assets in each market
54% concentration in Midwest Region
Accelerates portfolio repositioning strategy
© 2011 Duke Realty Corporation |
36
RELIABLE. ANSWERS
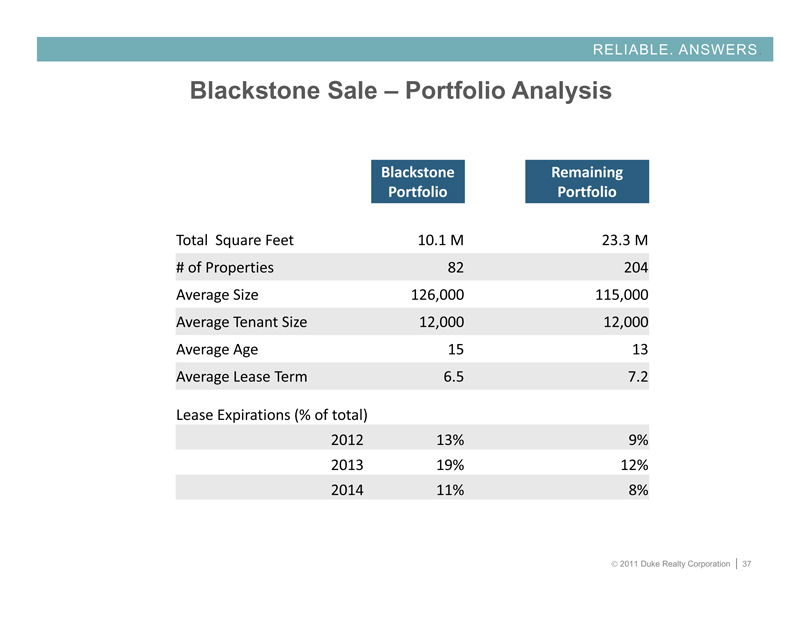
Blackstone Sale – Portfolio Analysis
Blackstone Portfolio
Remaining Portfolio
Total Square Feet 10.1 M 23.3 M
# of Properties 82 204
Average Size 126,000 115,000
Average Tenant Size 12,000 12,000
Average Age 15 13
Average Lease Term 6.5 7.2
Lease Expirations (% of total)
2012 13% 9%
2013 19% 12%
2014 11% 8%
© 2011 Duke Realty Corporation | 37
RELIABLE. ANSWERS
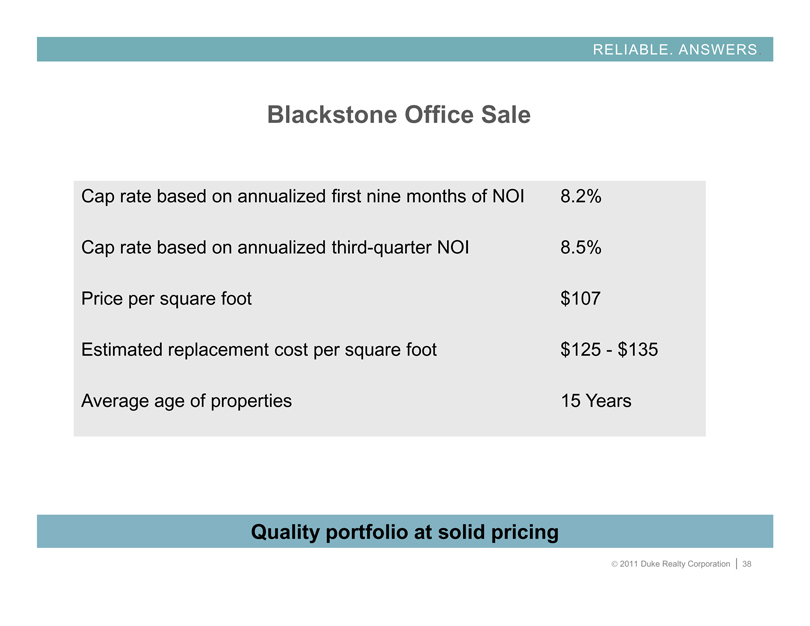
Blackstone Office Sale
Cap rate based on annualized first nine months of NOI 8.2%
Cap rate based on annualized third-quarter NOI 8.5%
Price per square foot $107
Estimated replacement cost per square foot $125 - $135
Average age of properties 15 Years
Quality portfolio at solid pricing
© 2011 Duke Realty Corporation | 38
RELIABLE. ANSWERS
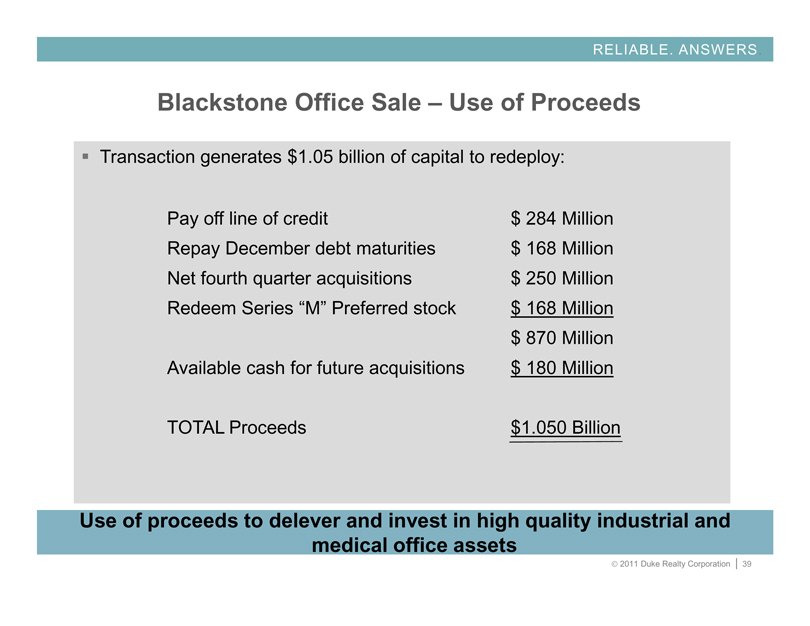
Blackstone Office Sale – Use of Proceeds
Transaction generates $1.05 billion of capital to redeploy:
Pay off line of credit $ 284 Million
Repay December debt maturities $ 168 Million
Net fourth quarter acquisitions $ 250 Million
Redeem Series “M” Preferred stock $ 168 Million
$ 870 Million
Available cash for future acquisitions $ 180 Million
TOTAL Proceeds $1.050 Billion
Use of proceeds to delever and invest in high quality industrial and medical office assets
© 2011 Duke Realty Corporation | 39
RELIABLE. ANSWERS
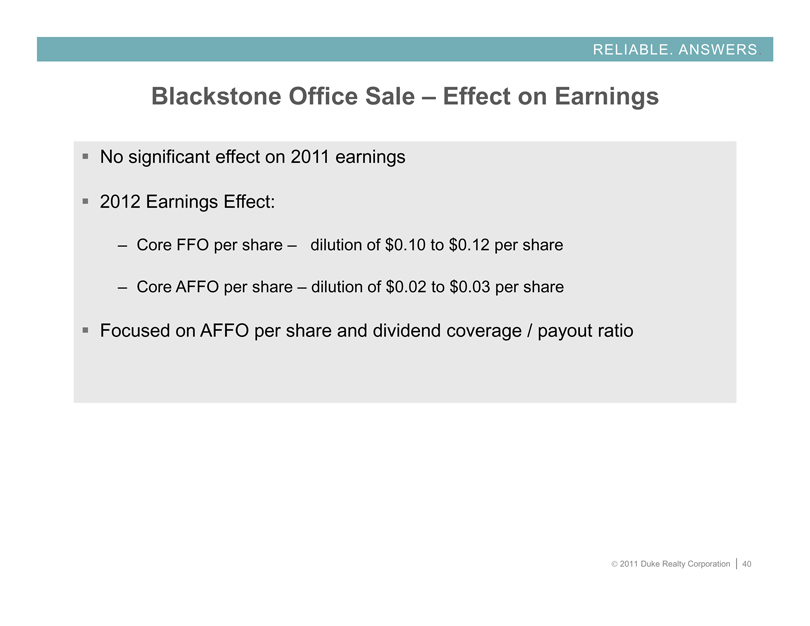
Blackstone Office Sale – Effect on Earnings
No significant effect on 2011 earnings
2012 Earnings Effect:
– Core FFO per share – dilution of $0.10 to $0.12 per share
– Core AFFO per share – dilution of $0.02 to $0.03 per share
Focused on AFFO per share and dividend coverage / payout ratio
© 2011 Duke Realty Corporation | 40
RELIABLE. ANSWERS
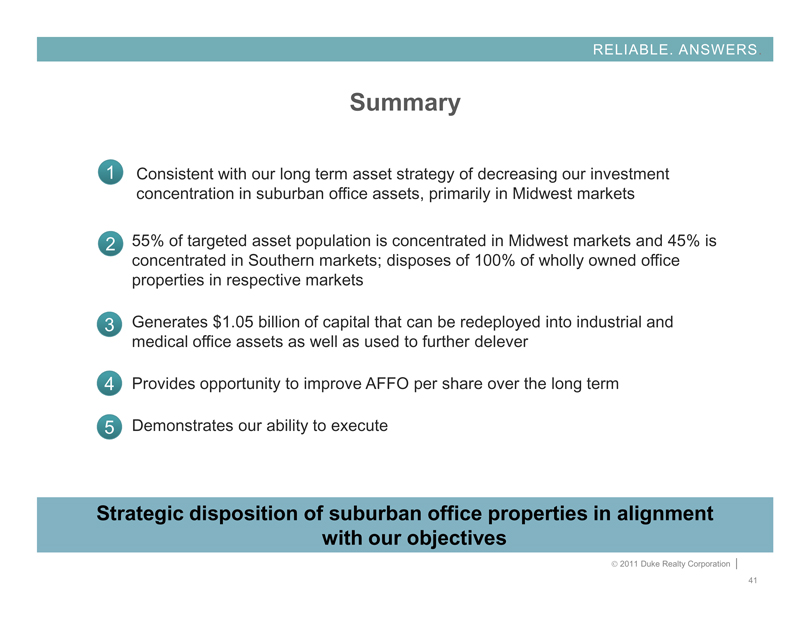
Summary
1 Consistent with our long term asset strategy of decreasing our investment concentration in suburban office assets, primarily in Midwest markets
2 55% of targeted asset population is concentrated in Midwest markets and 45% is concentrated in Southern markets; disposes of 100% of wholly owned office properties in respective markets
3 Generates $1.05 billion of capital that can be redeployed into industrial and medical office assets as well as used to further delever
4 Provides opportunity to improve AFFO per share over the long term
5 Demonstrates our ability to execute
Strategic disposition of suburban office properties in alignment with our objectives
© 2011 Duke Realty Corporation |
41
MEDICAL OFFICE STRATEGY &
Performance Update
© 2011 Duke Realty Corporation | 42
RELIABLE. ANSWERS
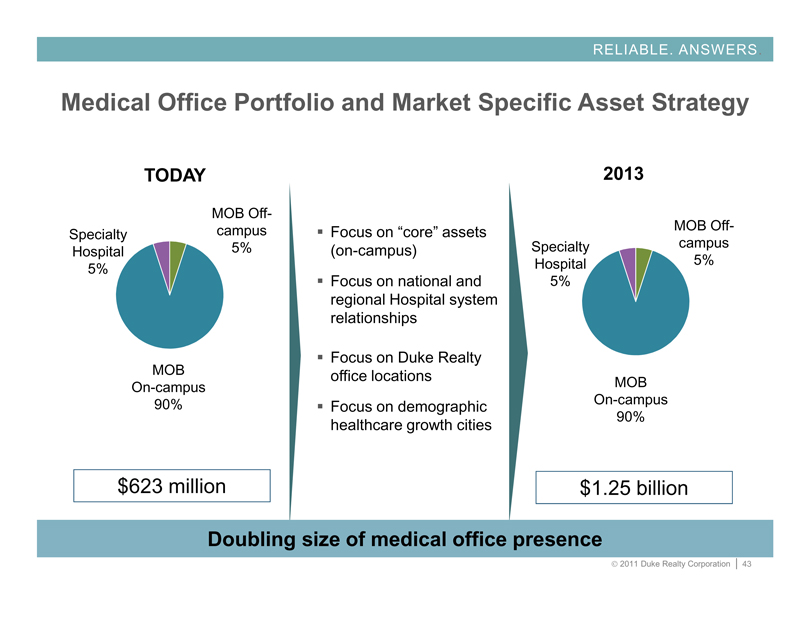
Medical Office Portfolio and Market Specific Asset Strategy
TODAY
Specialty Hospital 5%
MOB Off-campus 5%
MOB On-campus 90%
$623 million
Focus on “core” assets (on-campus)
Focus on national and regional Hospital system relationships
Focus on Duke Realty office locations
Focus on demographic healthcare growth cities
2013
Specialty Hospital 5%
MOB On-campus 90%
MOB Off-campus 5%
$1.25 billion
Doubling size of medical office presence
© 2011 Duke Realty Corporation | 43
MEDICAL OFFICE OVERVIEW
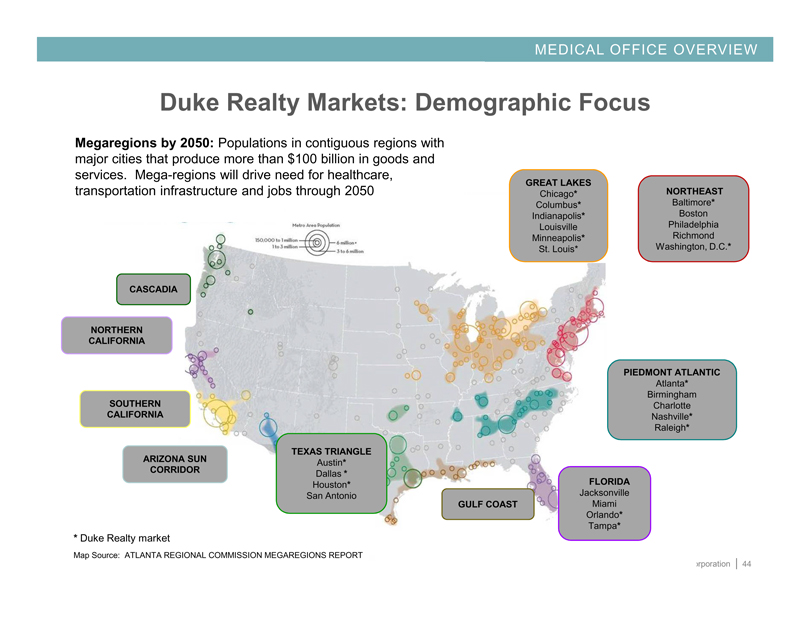
Duke Realty Markets: Demographic Focus
Megaregions by 2050: Populations in contiguous regions with major cities that produce more than $100 billion in goods and services. Mega-regions will drive need for healthcare, transportation infrastructure and jobs through 2050
Metro Area Population
150,000 to 1 million
1 to 3 million
6 million *
3 to 6 million
GREAT LAKES
Chicago* Columbus* Indianapolis* Louisville Minneapolis* St. Louis*
NORTHEAST
Baltimore* Boston Philadelphia Richmond Washington, D.C.*
PIEDMONT ATLANTIC
Atlanta* Birmingham Charlotte Nashville* Raleigh*
FLORIDA
Jacksonville Miami Orlando* Tampa*
GULF COAST
TEXAS TRIANGLE
Austin* Dallas * Houston* San Antonio
ARIZONA SUN CORRIDOR
SOUTHERN CALIFORNIA
NORTHERN CALIFORNIA
CASCADIA
* Duke Realty market
Map Source: ATLANTA REGIONAL COMMISSION MEGAREGIONS REPORT
Corporation | 44
MEDICAL OFFICE OVERVIEW
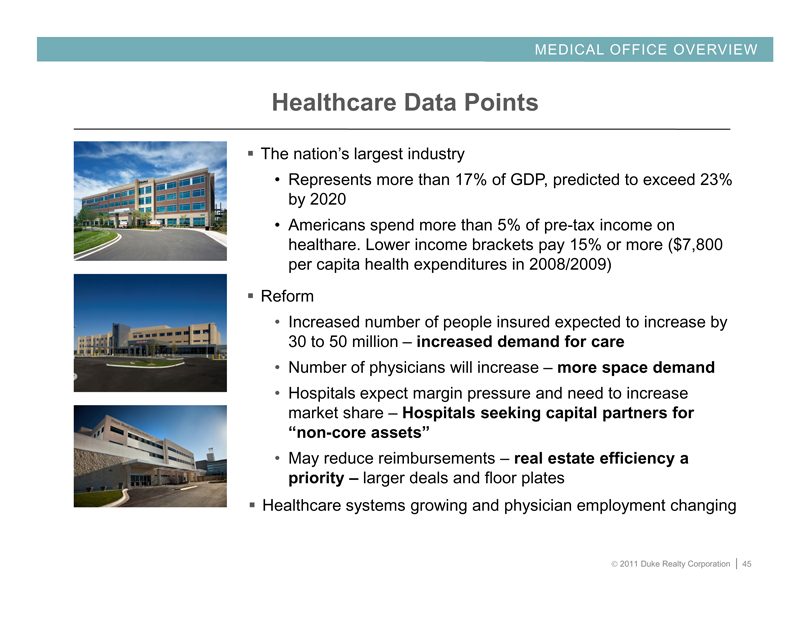
Healthcare Data Points
The nation’s largest industry
• Represents more than 17% of GDP, predicted to exceed 23% by 2020
• Americans spend more than 5% of pre-tax income on healthare. Lower income brackets pay 15% or more ($7,800 per capita health expenditures in 2008/2009)
Reform
• Increased number of people insured expected to increase by 30 to 50 million – increased demand for care
• Number of physicians will increase – more space demand
• Hospitals expect margin pressure and need to increase market share – Hospitals seeking capital partners for “non-core assets”
• May reduce reimbursements – real estate efficiency a priority – larger deals and floor plates
Healthcare systems growing and physician employment changing
© 2011 Duke Realty Corporation | 45
MEDICAL OFFICE OVERVIEW
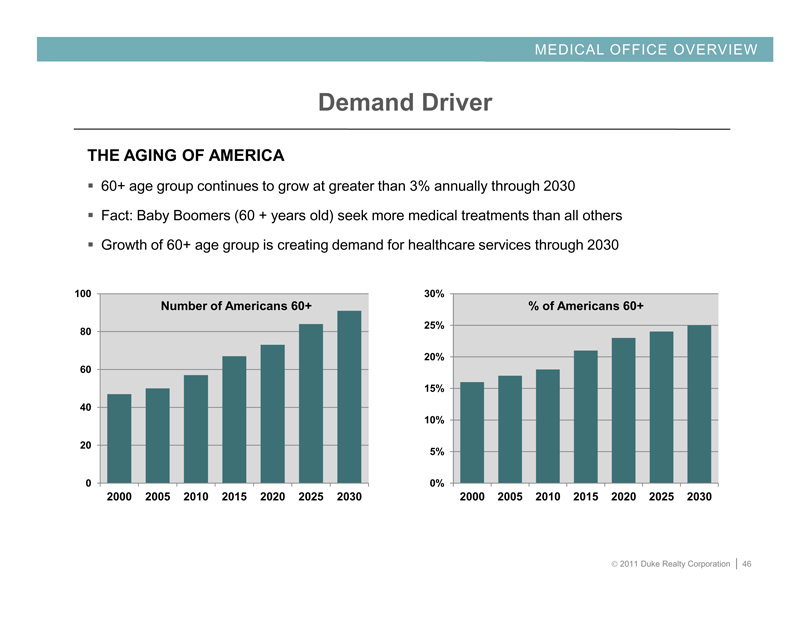
Demand Driver
THE AGING OF AMERICA
60+ age group continues to grow at greater than 3% annually through 2030
Fact: Baby Boomers (60 + years old) seek more medical treatments than all others
Growth of 60+ age group is creating demand for healthcare services through 2030
100
80
60
40
20
0
Number of Americans 60+
2000 2005 2010 2015 2020 2025 2030
30%
25%
20%
15%
10%
5%
0%
% of Americans 60+
2000 2005 2010 2015 2020 2025 2030
© 2011 Duke Realty Corporation | 46
RELIABLE. ANSWERS
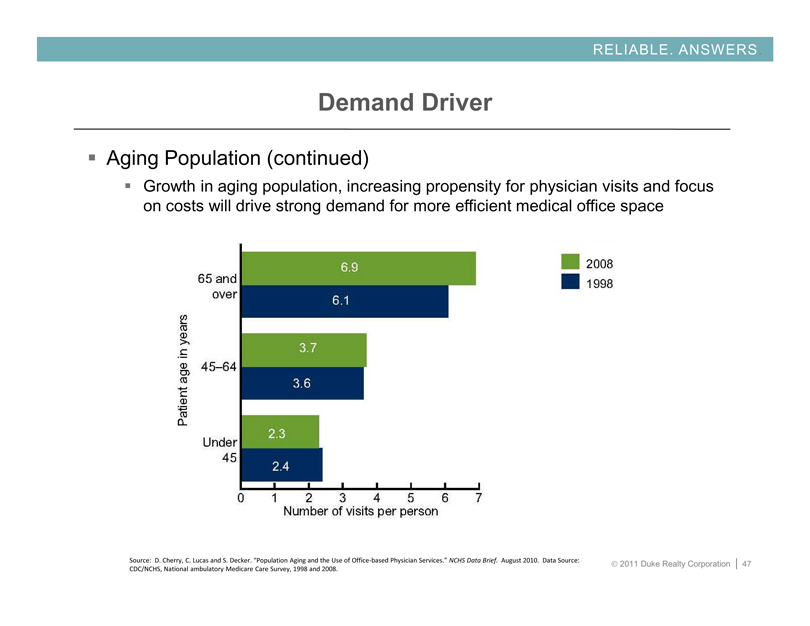
Demand Driver
Aging Population (continued)
Growth in aging population, increasing propensity for physician visits and focus on costs will drive strong demand for more efficient medical office space
Patient in years
65 and over
45-64
Under 45
6.9
6.1
3.7
3.6
2.3
2.4
0 1 2 3 4 5 6 7
Number of visits per person
2008
1998
Source: D. Cherry, C. Lucas and S. Decker. “Population Aging and the Use of Office-based Physician Services.” NCHS Data Brief. August 2010. Data Source: CDC/NCHS, National ambulatory Medicare Care Survey, 1998 and 2008.
© 2011 Duke Realty Corporation | 47
MEDICAL OFFICE OVERVIEW
Demand Driver
THE OUTMIGRATION OF CARE
Demand for outpatient services is projected to increase by 22% by 2019 while demand for inpatient services will remain flat
Ambulatory surgery center (ASC) and diagnostic imaging center (DIC) visits increasing at a rate of 8.4 percent annually
Physician office visits rising by 7.9 percent annually
Outpatient care yields higher profit margins than inpatient care
Outpatient services can be on or off campus
Source: McKinsey & Company’s McKinsey Global Institute
© 2011 Duke Realty Corporation | 48
RELIABLE. ANSWERS
Demand Drivers
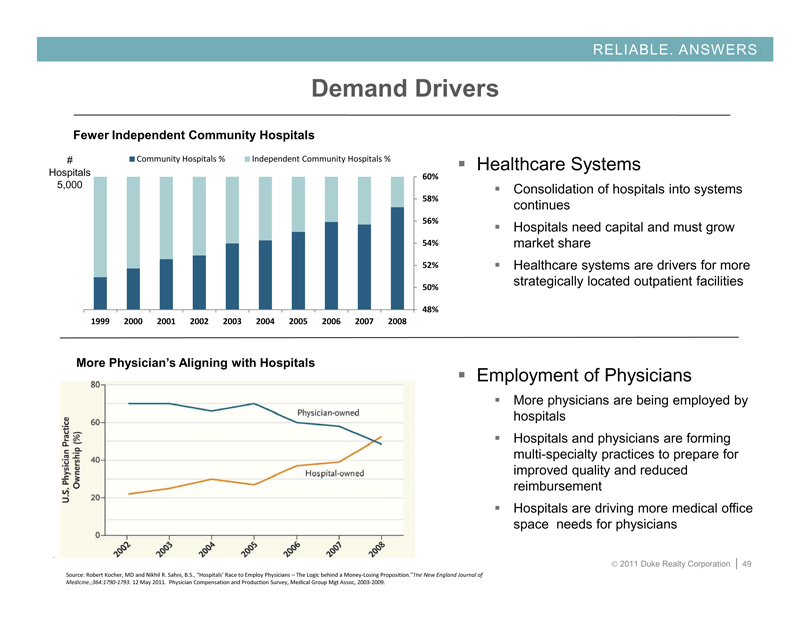
Fewer Independent Community Hospitals
# Hospitals 5,000
Community Hospitals %
Independent Community Hospitals %
60%
58%
56%
54%
52%
50%
48%
1999 2000 2001 2002 2003 2004 2005 2006 2007 2008
Healthcare Systems
Consolidation of hospitals into systems continues
Hospitals need capital and must grow market share
Healthcare systems are drivers for more strategically located outpatient facilities
More Physician’s Aligning with Hospitals
U.S. Physician Practice Ownership (%)
80 60 40 20 0
Physician-owned
Hospital-owned
2002 2003 2004 2005 2006 2007 2008
Employment of Physicians
More physicians are being employed by hospitals
Hospitals and physicians are forming multi-specialty practices to prepare for improved quality and reduced reimbursement
Hospitals are driving more medical office space needs for physicians
Source: Robert Kocher, MD and Nikhil R. Sahni, B.S., “Hospitals’ Race to Employ Physicians – The Logic behind a Money-Losing Proposition.”The New England Journal of Medicine.;364:1790-1793. 12 May 2011. Physician Compensation and Production Survey, Medical Group Mgt Assoc, 2003-2009.
© 2011 Duke Realty Corporation | 49

MEDICAL OFFICE OVERVIEW
Development Focus
ACTION PLAN
National brand awareness
Be “Experts”
– Speak at national conferences (ASHE, BOMA)
– Third party references
National system relationships
– Ascension
– Tenet
– HCA
– Adventist
Regional system relationships
– Baylor Health
– Rex Healthcare
– Carolina Healthcare Systems
– Advocate
Local 10%
National 30%
Regional 60%
System Focus
© 2011 Duke Realty Corporation | 50
RELIABLE. ANSWERS
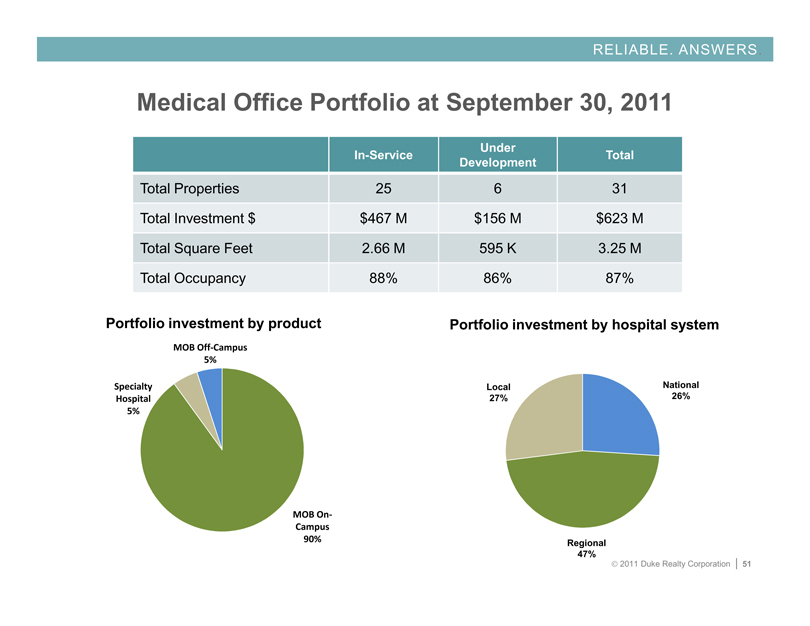
Medical Office Portfolio at September 30, 2011
In-Service Under Development Total
Total Properties 25 6 31
Total Investment $ $467 M $156 M $623 M
Total Square Feet 2.66 M 595 K 3.25 M
Total Occupancy 88% 86% 87%
Portfolio investment by product
MOB Off-Campus 5%
MOB On-Campus 90%
Specialty Hospital 5%
Portfolio investment by hospital system
National 26%
Regional 47%
Local 27%
© 2011 Duke Realty Corporation | 51
RELIABLE. ANSWERS
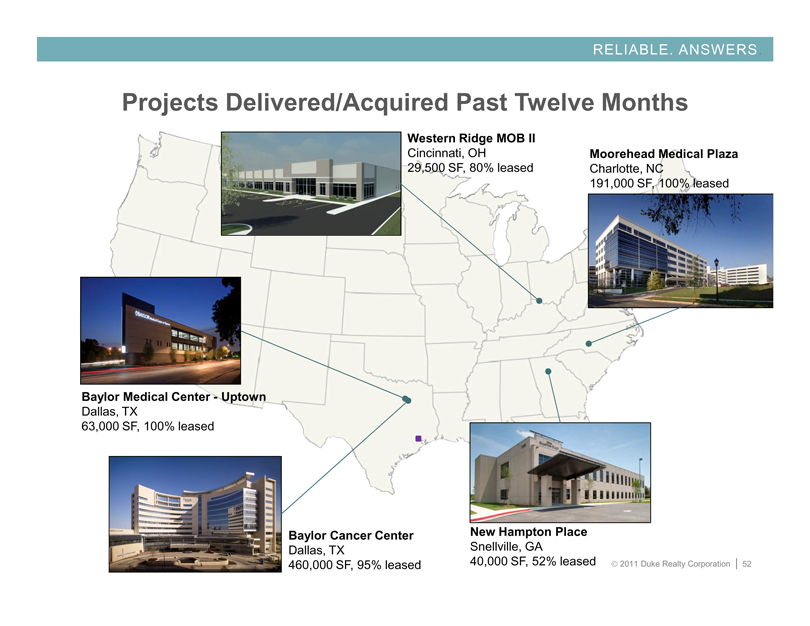
Projects Delivered/Acquired Past Twelve Months
Western Ridge MOB II
Cincinnati, OH
29,500 SF, 80% leased
Moorehead Medical Plaza
Charlotte, NC
191,000 SF, 100% leased
New Hampton Place
Snellville, GA
40,000 SF, 52% leased
Baylor Cancer Center
Dallas, TX
460,000 SF, 95% leased
Baylor Medical Center - Uptown
Dallas, TX
63,000 SF, 100% leased
© 2011 Duke Realty Corporation | 52
RELIABLE. ANSWERS
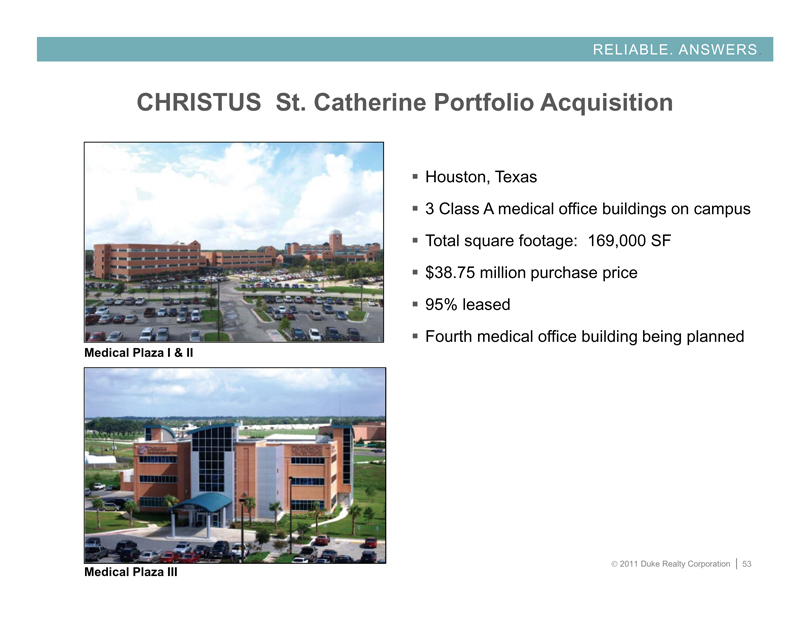
CHRISTUS St. Catherine Portfolio Acquisition
Houston, Texas
3 Class A medical office buildings on campus Total square footage: 169,000 SF
$38.75 million purchase price 95% leased
Fourth medical office building being planned
Medical Plaza I & II
Medical Plaza III
© 2011 Duke Realty Corporation | 53
RELIABLE. ANSWERS
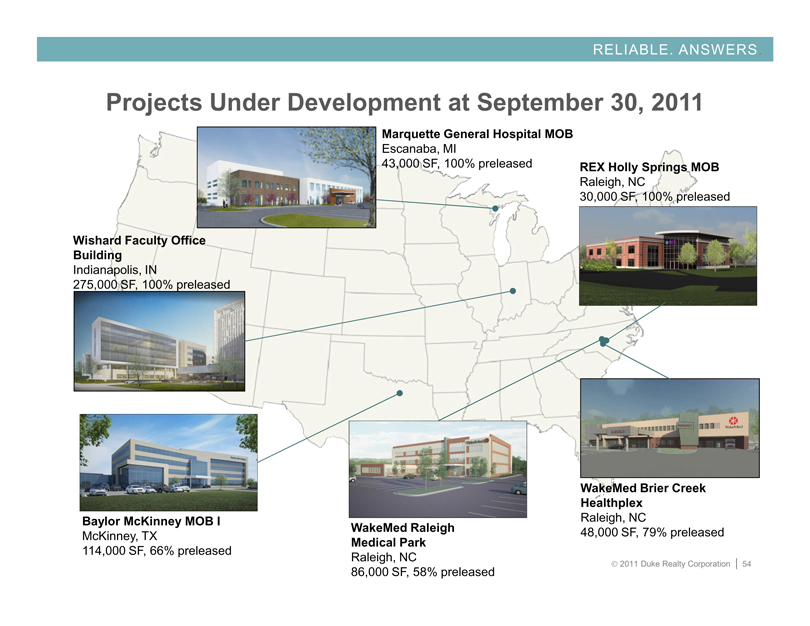
Projects Under Development at September 30, 2011
Marquette General Hospital MOB
Escanaba, MI
43,000 SF, 100% preleased
REX Holly Springs MOB
Raleigh, NC
30,000 SF, 100% preleased
WakeMed Brier Creek Healthplex
Raleigh, NC
48,000 SF, 79% preleased
WakeMed Raleigh Medical Park
Raleigh, NC
86,000 SF, 58% preleased
Baylor McKinney MOB I
McKinney, TX
114,000 SF, 66% preleased
Wishard Faculty Office Building
Indianapolis, IN
275,000 SF, 100% preleased
© 2011 Duke Realty Corporation | 54
RELIABLE. ANSWERS
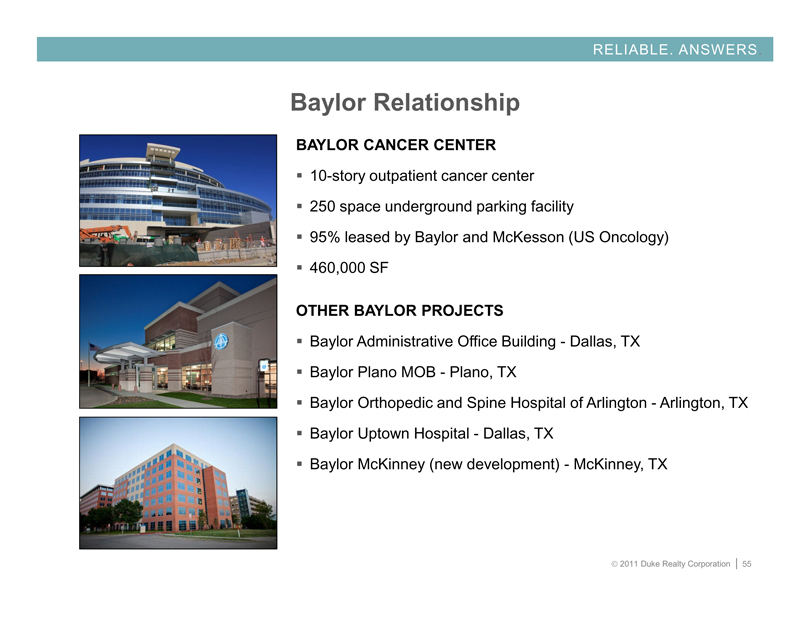
Baylor Relationship
BAYLOR CANCER CENTER
10-story outpatient cancer center
250 space underground parking facility
95% leased by Baylor and McKesson (US Oncology)
460,000 SF
OTHER BAYLOR PROJECTS
Baylor Administrative Office Building - Dallas, TX
Baylor Plano MOB - Plano, TX
Baylor Orthopedic and Spine Hospital of Arlington - Arlington, TX
Baylor Uptown Hospital - Dallas, TX
Baylor McKinney (new development) - McKinney, TX
© 2011 Duke Realty Corporation | 55
RELIABLE. ANSWERS
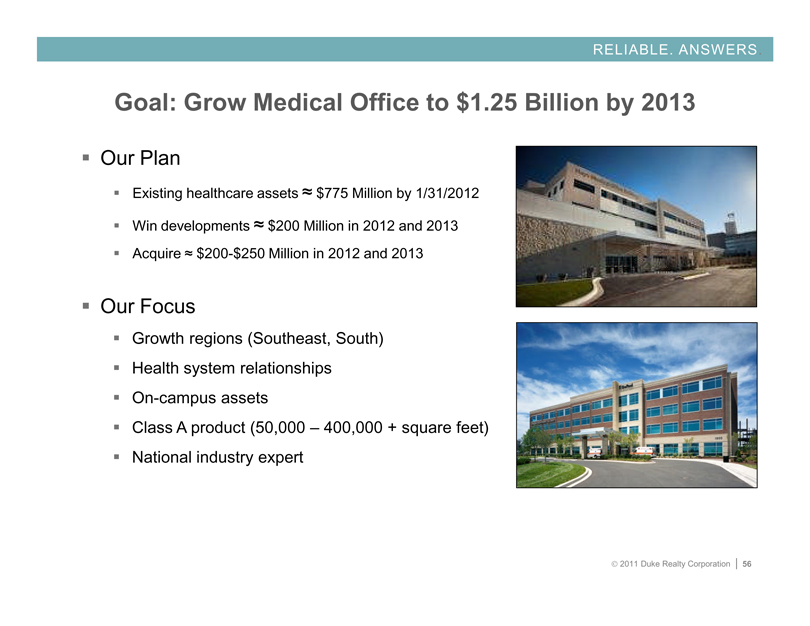
Goal: Grow Medical Office to $1.25 Billion by 2013
Our Plan
Existing healthcare assets ≈ $775 Million by 1/31/2012
Win developments ≈ $200 Million in 2012 and 2013
Acquire ≈ $200-$250 Million in 2012 and 2013
Our Focus
Growth regions (Southeast, South) Health system relationships On-campus assets
Class A product (50,000 – 400,000 + square feet)
National industry expert
© 2011 Duke Realty Corporation | 56

DALLAS MARKET OVERVIEW
© 2011 Duke Realty Corporation | 57
DALLAS OVERVIEW
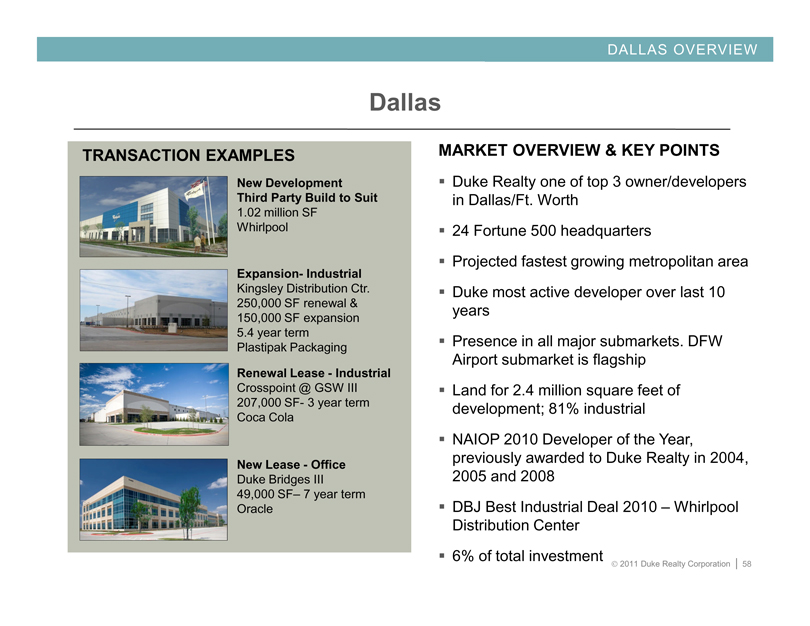
Dallas
TRANSACTION EXAMPLES
New Development Third Party Build to Suit
1.02 million SF
Whirlpool
Expansion- Industrial
Kingsley Distribution Ctr. 250,000 SF renewal & 150,000 SF expansion
5.4 year term Plastipak Packaging
Renewal Lease - Industrial
Crosspoint @ GSW III 207,000 SF- 3 year term Coca Cola
New Lease - Office
Duke Bridges III
49,000 SF– 7 year term Oracle
MARKET OVERVIEW & KEY POINTS
Duke Realty one of top 3 owner/developers in Dallas/Ft. Worth
24 Fortune 500 headquarters
Projected fastest growing metropolitan area
Duke most active developer over last 10 years
Presence in all major submarkets. DFW Airport submarket is flagship
Land for 2.4 million square feet of development; 81% industrial
NAIOP 2010 Developer of the Year, previously awarded to Duke Realty in 2004, 2005 and 2008
DBJ Best Industrial Deal 2010 – Whirlpool Distribution Center
6% of total investment
© 2011 Duke Realty Corporation | 58
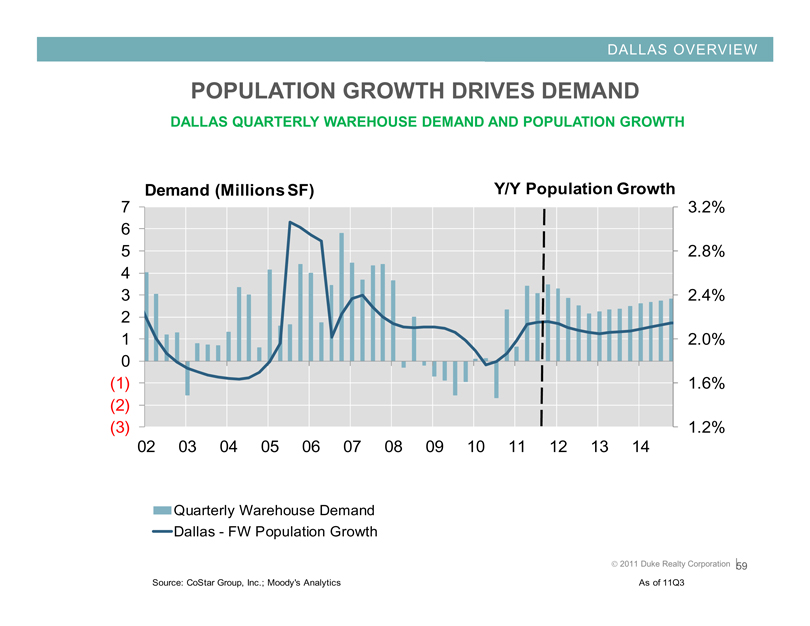
DALLAS OVERVIEW
POPULATION GROWTH DRIVES DEMAND
DALLAS QUARTERLY WAREHOUSE DEMAND AND POPULATION GROWTH
Demand (Millions SF)
Y/Y Population Growth
7
6
5
4
3
2
1
0
(1)
(2)
(3)
3.2%
2.8%
2.4%
2.0%
1.6%
1.2%
02 03 04 05 06 07 08 09 10 11 12 13 14
Quarterly Warehouse Demand Dallas - FW Population Growth
Source: CoStar Group, Inc.; Moody’s Analytics
© 2011 Duke Realty Corporation | 59
As of 11Q3
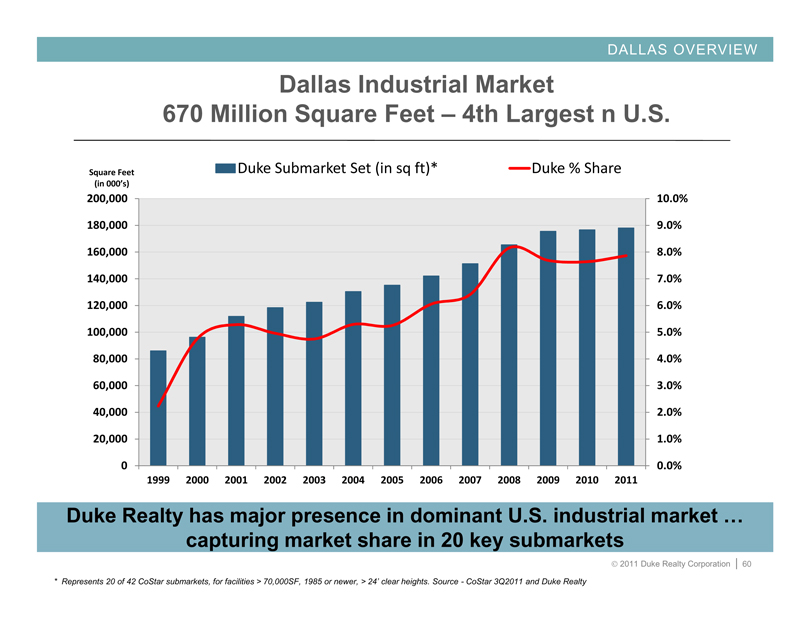
DALLAS OVERVIEW
Dallas Industrial Market
670 Million Square Feet – 4th Largest n U.S.
Duke Submarket Set (in sq ft)*
Duke % Share
Square Feet
(in 000’s)
200,000
180,000
160,000
140,000
120,000
100,000
80,000
60,000
40,000
20,000
0
10.0%
9.0%
8.0%
7.0%
6.0%
5.0%
4.0%
3.0%
2.0%
1.0%
0.0%
1999 2000 2001 2002 2003 2004 2005 2006 2007 2008 2009 2010 2011
Duke Realty has major presence in dominant U.S. industrial market … capturing market share in 20 key submarkets
* Represents 20 of 42 CoStar submarkets, for facilities > 70,000SF, 1985 or newer, > 24’ clear heights. Source - CoStar 3Q2011 and Duke Realty
© 2011 Duke Realty Corporation | 60
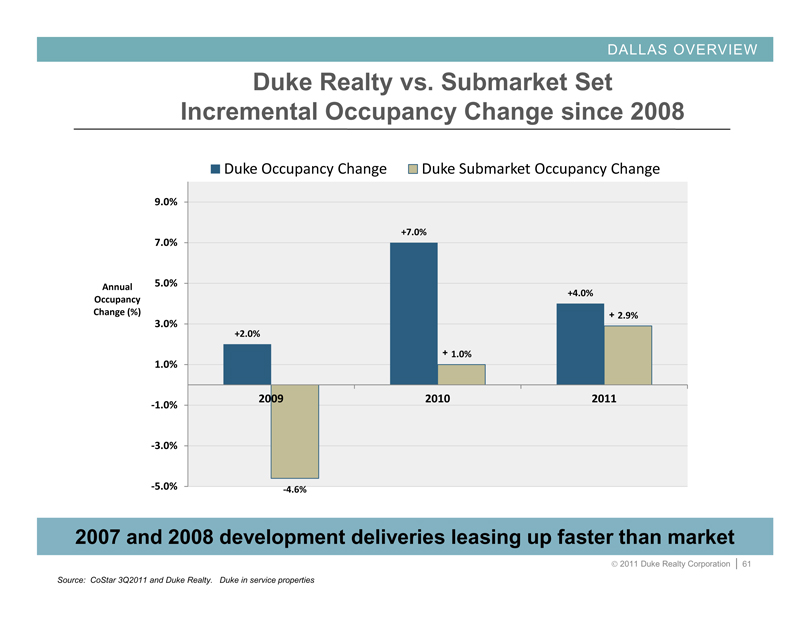
DALLAS OVERVIEW
Duke Realty vs. Submarket Set Incremental Occupancy Change since 2008
Duke Occupancy Change
Duke Submarket Occupancy Change
Annual Occupancy Change (%)
9.0%
7.0%
5.0%
3.0%
1.0%
-1.0%
-3.0%
-5.0%
+2.0%
+7.0%
+ 1.0%
+4.0%
+ 2.9%
2009
2010
2011
-4.6%
2007 and 2008 development deliveries leasing up faster than market
Source: CoStar 3Q2011 and Duke Realty. Duke in service properties
© 2011 Duke Realty Corporation | 61
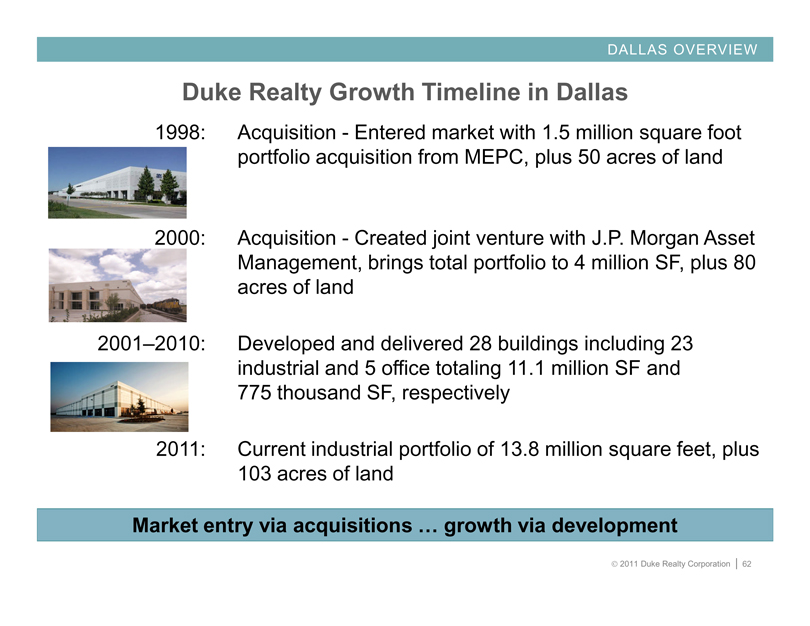
DALLAS OVERVIEW
Duke Realty Growth Timeline in Dallas
1998:
Acquisition - Entered market with 1.5 million square foot portfolio acquisition from MEPC, plus 50 acres of land
2000:
Acquisition - Created joint venture with J.P. Morgan Asset Management, brings total portfolio to 4 million SF, plus 80 acres of land
2001–2010:
Developed and delivered 28 buildings including 23 industrial and 5 office totaling 11.1 million SF and 775 thousand SF, respectively
2011:
Current industrial portfolio of 13.8 million square feet, plus 103 acres of land
Market entry via acquisitions … growth via development
© 2011 Duke Realty Corporation | 62
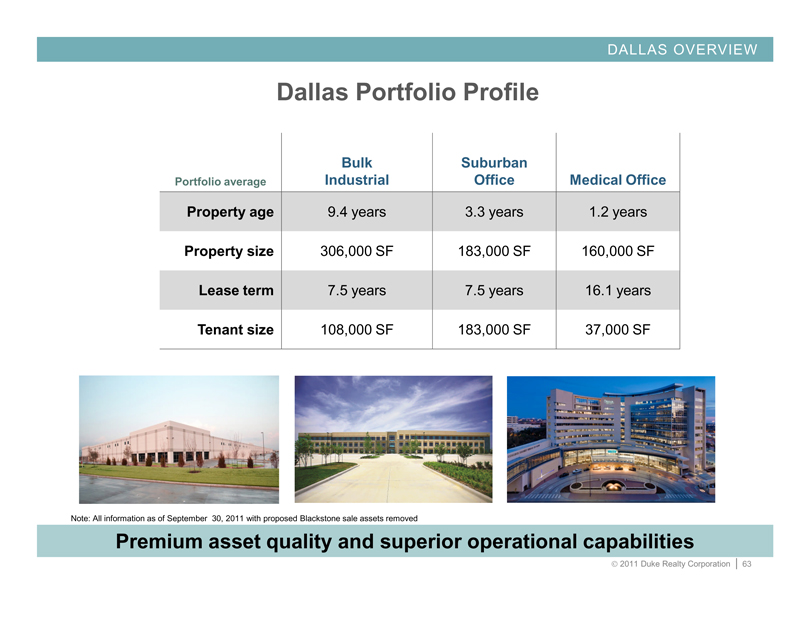
DALLAS OVERVIEW
Dallas Portfolio Profile
Portfolio average Bulk Industrial Suburban Office Medical Office
Property age 9.4 years 3.3 years 1.2 years
Property size 306,000 SF 183,000 SF 160,000 SF
Lease term 7.5 years 7.5 years 16.1 years
Tenant size 108,000 SF 183,000 SF 37,000 SF
Note: All information as of September 30, 2011 with proposed Blackstone sale assets removed
Premium asset quality and superior operational capabilities
© 2011 Duke Realty Corporation | 63
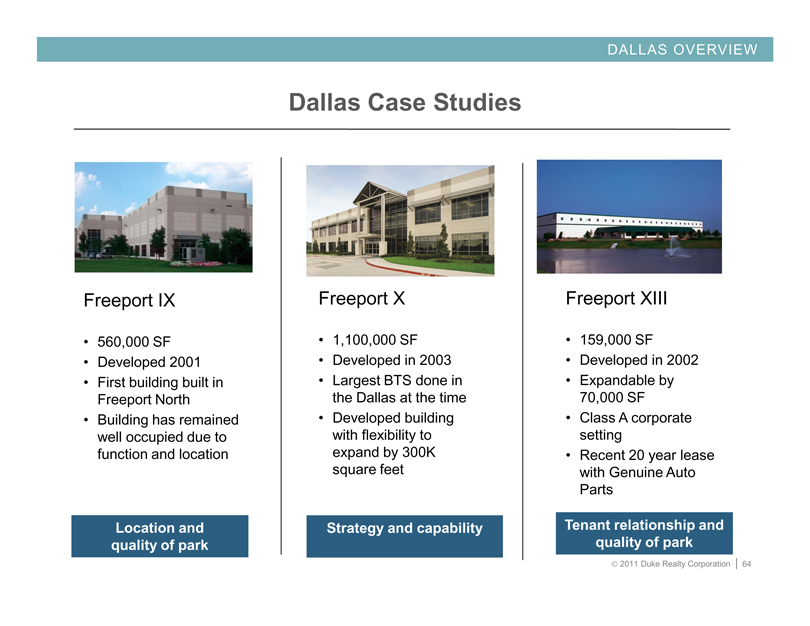
DALLAS OVERVIEW
Dallas Case Studies
Freeport IX
• 560,000 SF
• Developed 2001
• First building built in Freeport North
• Building has remained well occupied due to function and location
Location and quality of park
Freeport X
• 1,100,000 SF
• Developed in 2003
• Largest BTS done in the Dallas at the time
• Developed building with flexibility to expand by 300K square feet
Strategy and capability
Freeport XIII
• 159,000 SF
• Developed in 2002
• Expandable by 70,000 SF
• Class A corporate setting
• Recent 20 year lease with Genuine Auto Parts
Tenant relationship and quality of park
© 2011 Duke Realty Corporation | 64
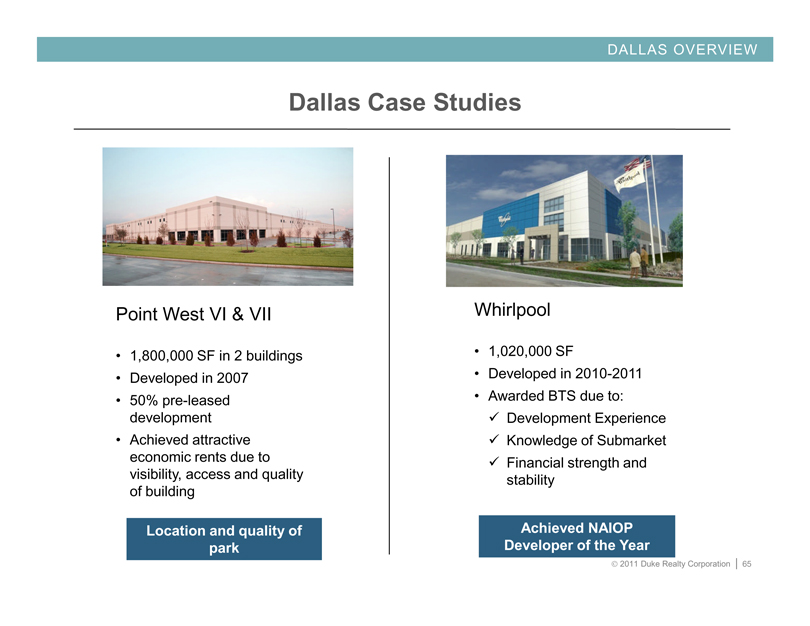
DALLAS OVERVIEW
Dallas Case Studies
Point West VI & VII
• 1,800,000 SF in 2 buildings
• Developed in 2007
• 50% pre-leased development
• Achieved attractive economic rents due to visibility, access and quality of building
Location and quality of park
Whirlpool
• 1,020,000 SF
• Developed in 2010-2011
• Awarded BTS due to:ü Development Experienceü Knowledge of Submarketü Financial strength and stability
Achieved NAIOP Developer of the Year
© 2011 Duke Realty Corporation | 65
DALLAS OVERVIEW
Dallas Summary
þ Location: Strongest metro locations among larger owner peers
þ Quality: Newest, state of the art portfolio
þ Operations: Consistent operating performance and highly regarded team
Reputation:
Ability to execute with Duke management caliber and deep/ready access to capital
© 2011 Duke Realty Corporation | 66

CLOSING REMARKS
© 2011 Duke Realty Corporation | 67

OPERATIONS STRATEGY
New, High Quality Portfolio with Long-term Leases
Portfolio average Bulk Industrial Suburban Office Medical Office
Property age 10.4 years 13.0 years 2.5 years
Property size 215,000 SF 115,000 SF 106,000 SF
Lease term 7.0 years 7.2 years 11.7 years
Tenant size 70,000 SF 12,000 SF 10,000 SF
Premier portfolio of assets
Note: All information as of September 30, 2011 with proposed Blackstone sale assets removed
© 2011 Duke Realty Corporation | 68
RELIABLE. ANSWERS
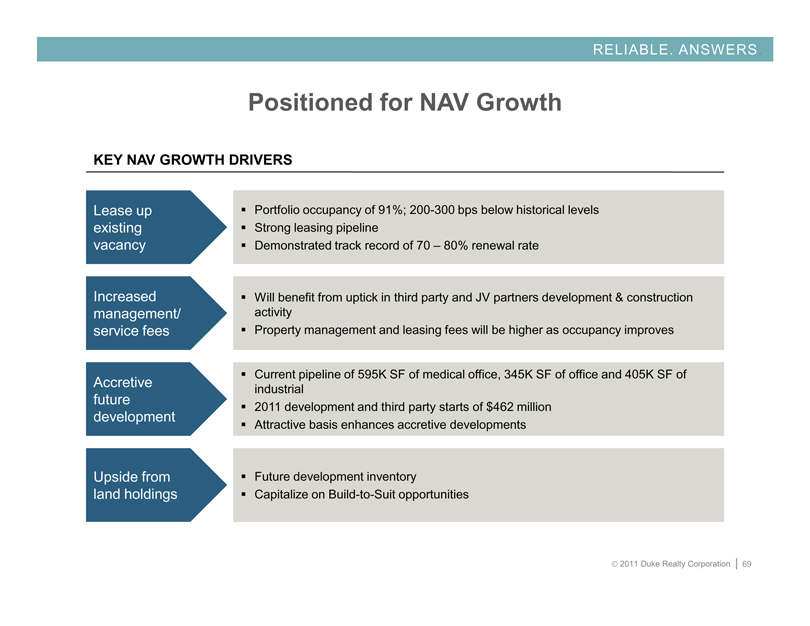
Positioned for NAV Growth
KEY NAV GROWTH DRIVERS
Lease up existing vacancy
Portfolio occupancy of 91%; 200-300 bps below historical levels Strong leasing pipeline Demonstrated track record of 70 – 80% renewal rate
Increased management/ service fees
Will benefit from uptick in third party and JV partners development & construction activity Property management and leasing fees will be higher as occupancy improves
Accretive future development
Current pipeline of 595K SF of medical office, 345K SF of office and 405K SF of industrial 2011 development and third party starts of $462 million Attractive basis enhances accretive developments
Upside from land holdings
Future development inventory
Capitalize on Build-to-Suit opportunities
© 2011 Duke Realty Corporation | 69
RELIABLE. ANSWERS
WHY DUKE REALTY?
Quality portfolio improving with asset strategy
Solid balance sheet improving with capital strategy
Unmatched ability to execute on daily operations
Development capabilities in place with existing land bank
Talent and leadership depth to execute
Delivering on what we say we will do
© 2011 Duke Realty Corporation | 70

APPENDIX
© 2011 Duke Realty Corporation | 71
MIDWEST OVERVIEW
Performance Update
© 2011 Duke Realty Corporation | 72
MIDWEST OVERVIEW
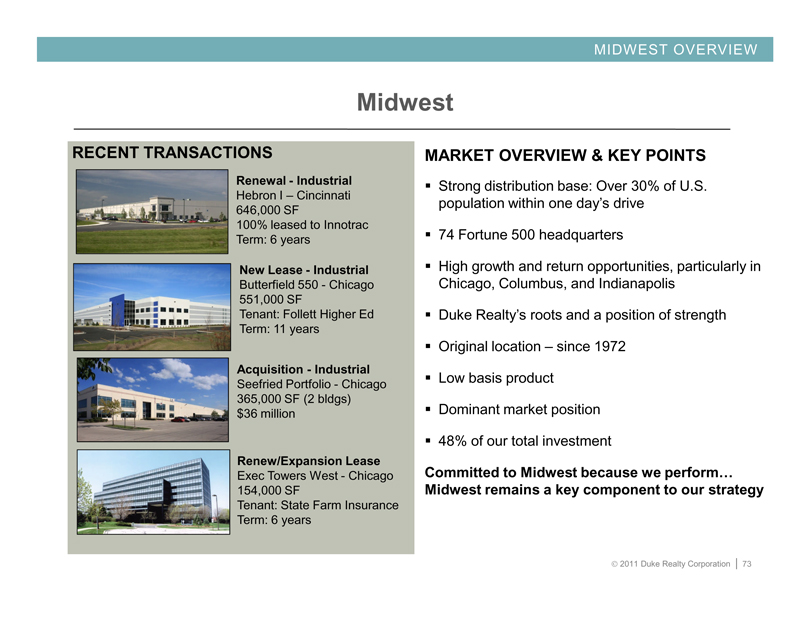
Midwest
RECENT TRANSACTIONS
Renewal - Industrial
Hebron I – Cincinnati 646,000 SF
100% leased to Innotrac Term: 6 years
New Lease - Industrial
Butterfield 550 - Chicago 551,000 SF
Tenant: Follett Higher Ed Term: 11 years
Acquisition - Industrial
Seefried Portfolio - Chicago 365,000 SF (2 bldgs) $36 million
Renew/Expansion Lease
Exec Towers West - Chicago 154,000 SF
Tenant: State Farm Insurance Term: 6 years
MARKET OVERVIEW & KEY POINTS
Strong distribution base: Over 30% of U.S. population within one day’s drive
74 Fortune 500 headquarters
High growth and return opportunities, particularly in Chicago, Columbus, and Indianapolis
Duke Realty’s roots and a position of strength Original location – since 1972 Low basis product Dominant market position 48% of our total investment
Committed to Midwest because we perform… Midwest remains a key component to our strategy
© 2011 Duke Realty Corporation | 73
MIDWEST OVERVIEW
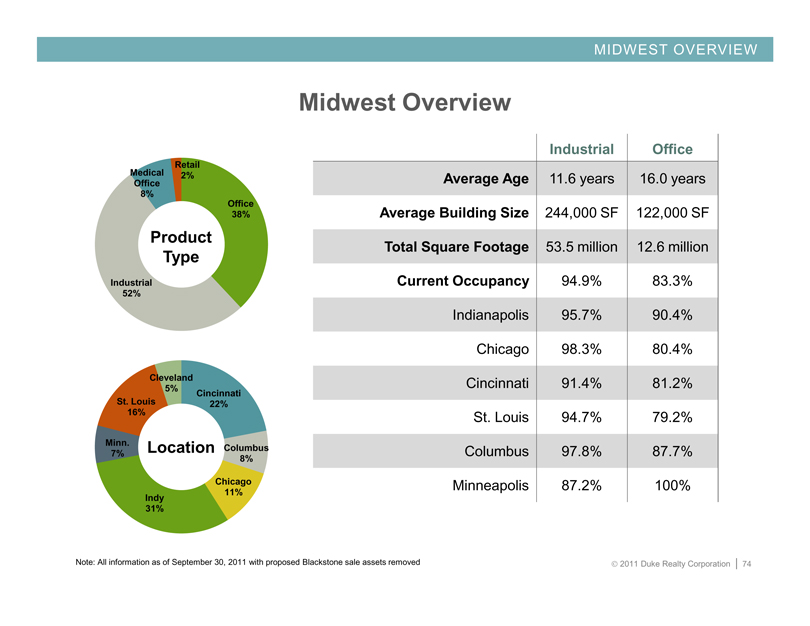
Midwest Overview
Industrial Office
Average Age 11.6 years 16.0 years
Average Building Size 244,000 SF 122,000 SF
Total Square Footage 53.5 million 12.6 million
Current Occupancy 94.9% 83.3%
Indianapolis 95.7% 90.4%
Chicago 98.3% 80.4%
Cincinnati 91.4% 81.2%
St. Louis 94.7% 79.2%
Columbus 97.8% 87.7%
Minneapolis 87.2% 100%
Retail 2%
Office 38%
Industrial 52%
Medical Office 8%
Product Type
Cleveland 5%
Cincinnati 22%
Columbus 8%
Chicago 11%
Indy 31%
Minn. 7%
St. Louis 16%
Location
Note: All information as of September 30, 2011 with proposed Blackstone sale assets removed
© 2011 Duke Realty Corporation | 74
MIDWEST OVERVIEW
Midwest Focus
DOMINANT POSITION
BULK INDUSTRIAL
REDUCE OFFICE CONCENTRATION
Enhancing dominant industrial position in Midwest
© 2011 Duke Realty Corporation | 75
EAST & SOUTHEAST OVERVIEW
Performance Update
© 2011 Duke Realty Corporation | 76
EAST & SOUTHEAST OVERVIEW
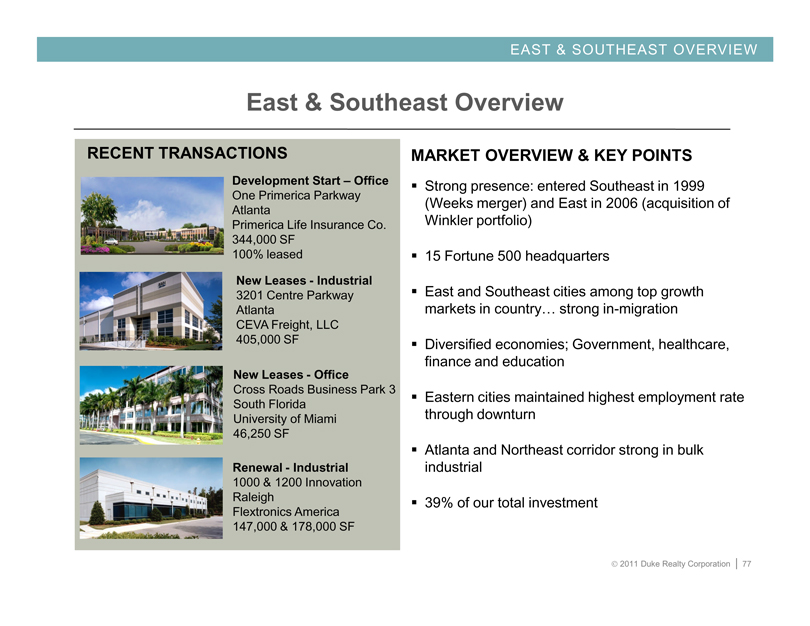
East & Southeast Overview
RECENT TRANSACTIONS
Development Start – Office
One Primerica Parkway Atlanta Primerica Life Insurance Co. 344,000 SF
100% leased
New Leases - Industrial
3201 Centre Parkway Atlanta CEVA Freight, LLC 405,000 SF
New Leases - Office
Cross Roads Business Park 3 South Florida University of Miami 46,250 SF
Renewal - Industrial
1000 & 1200 Innovation Raleigh Flextronics America 147,000 & 178,000 SF
MARKET OVERVIEW & KEY POINTS
Strong presence: entered Southeast in 1999 (Weeks merger) and East in 2006 (acquisition of Winkler portfolio)
15 Fortune 500 headquarters
East and Southeast cities among top growth markets in country… strong in-migration
Diversified economies; Government, healthcare, finance and education
Eastern cities maintained highest employment rate through downturn
Atlanta and Northeast corridor strong in bulk industrial
39% of our total investment
© 2011 Duke Realty Corporation | 77
EAST & SOUTHEAST OVERVIEW
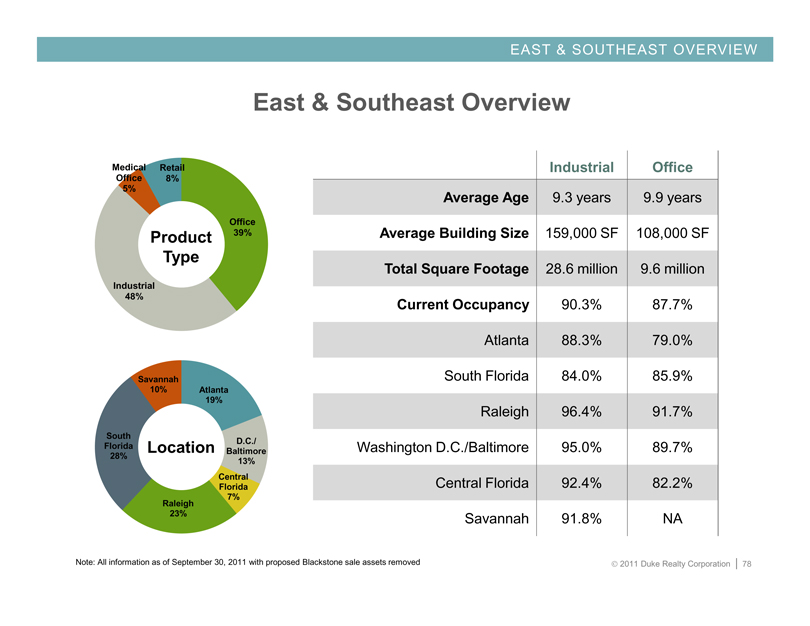
East & Southeast Overview
Industrial Office
Average Age 9.3 years 9.9 years
Average Building Size 159,000 SF 108,000 SF
Total Square Footage 28.6 million 9.6 million
Current Occupancy 90.3% 87.7%
Atlanta 88.3% 79.0%
South Florida 84.0% 85.9%
Raleigh 96.4% 91.7%
Washington D.C./Baltimore 95.0% 89.7%
Central Florida 92.4% 82.2%
Savannah 91.8% NA
Retail 8%
Office 39%
Industrial 48%
Medical Office 5%
Product Type
Atlanta 19%
D.C./ Baltimore 13%
Central Florida 7%
Raleigh 23%
South Florida 28%
Savannah 10%
Location
Note: All information as of September 30, 2011 with proposed Blackstone sale assets removed
© 2011 Duke Realty Corporation | 78
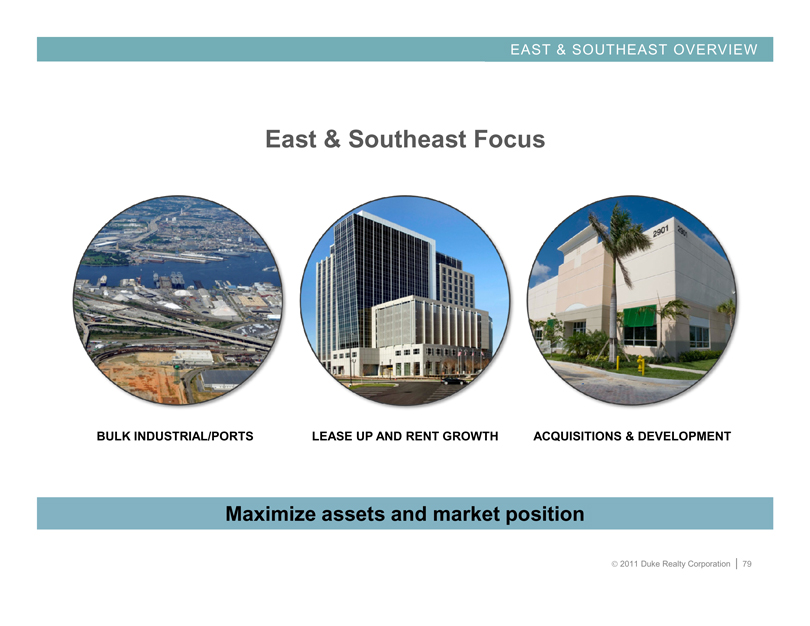
EAST & SOUTHEAST OVERVIEW
East & Southeast Focus
BULK INDUSTRIAL/PORTS
LEASE UP AND RENT GROWTH
ACQUISITIONS & DEVELOPMENT
Maximize assets and market position
© 2011 Duke Realty Corporation | 79
SOUTHWEST OVERVIEW
Performance Update
© 2011 Duke Realty Corporation | 80
SOUTHWEST OVERVIEW
Southwest
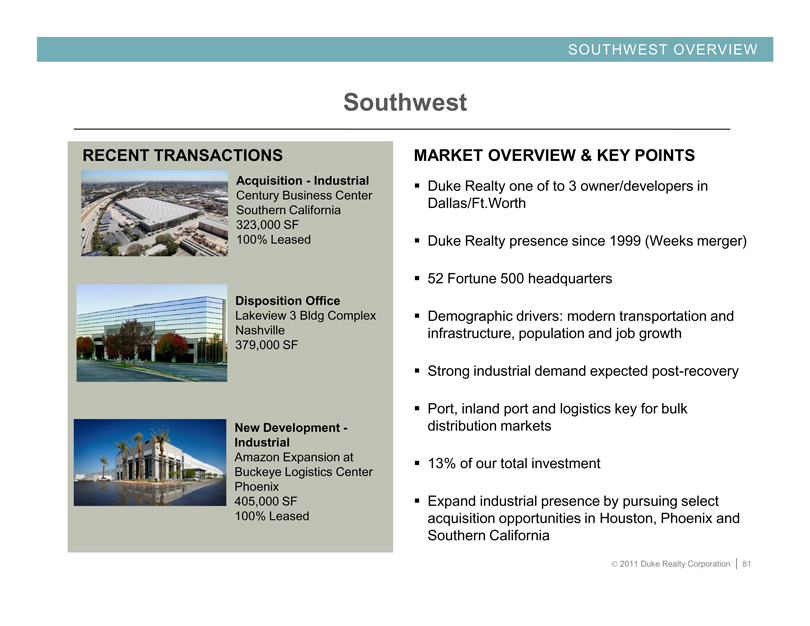
RECENT TRANSACTIONS
Acquisition - Industrial
Century Business Center Southern California 323,000 SF
100% Leased
Disposition Office
Lakeview 3 Bldg Complex Nashville 379,000 SF
New Development - Industrial
Amazon Expansion at Buckeye Logistics Center Phoenix 405,000 SF
100% Leased
MARKET OVERVIEW & KEY POINTS
Duke Realty one of to 3 owner/developers in Dallas/Ft.Worth
Duke Realty presence since 1999 (Weeks merger)
52 Fortune 500 headquarters
Demographic drivers: modern transportation and infrastructure, population and job growth
Strong industrial demand expected post-recovery
Port, inland port and logistics key for bulk distribution markets
13% of our total investment
Expand industrial presence by pursuing select acquisition opportunities in Houston, Phoenix and Southern California
© 2011 Duke Realty Corporation | 81
SOUTHWEST OVERVIEW
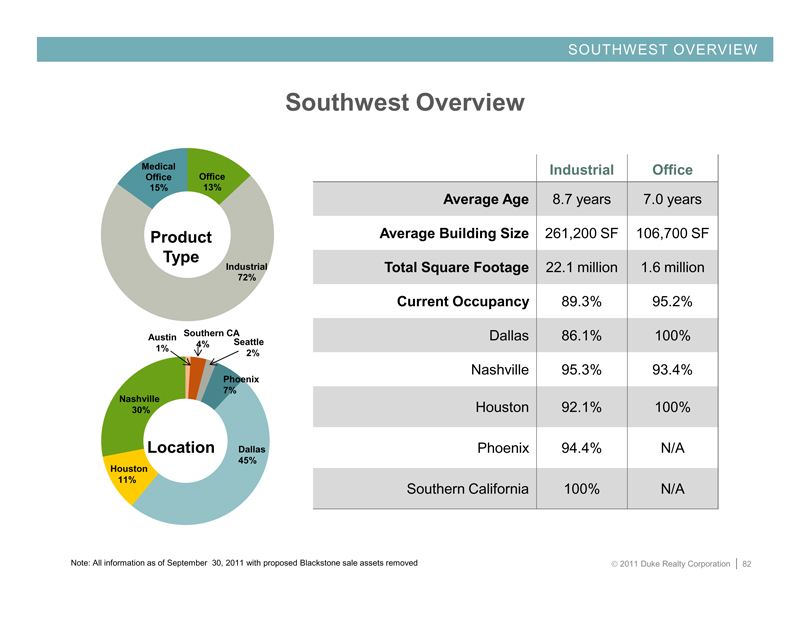
Southwest Overview
Office 13%
Industrial 72%
Medical Office 15%
Product Type
Southern 4%
CA Seattle 2%
Phoenix 7%
Dallas 45%
Houston 11%
Nashville 30%
Austin 1%
Location
Industrial Office
Average Age 8.7 years 7.0 years
Average Building Size 261,200 SF 106,700 SF
Total Square Footage 22.1 million 1.6 million
Current Occupancy 89.3% 95.2%
Dallas 86.1% 100%
Nashville 95.3% 93.4%
Houston 92.1% 100%
Phoenix 94.4% N/A
Southern California 100% N/A
Note: All information as of September 30, 2011 with proposed Blackstone sale assets removed
© 2011 Duke Realty Corporation | 82
SOUTHWEST OVERVIEW
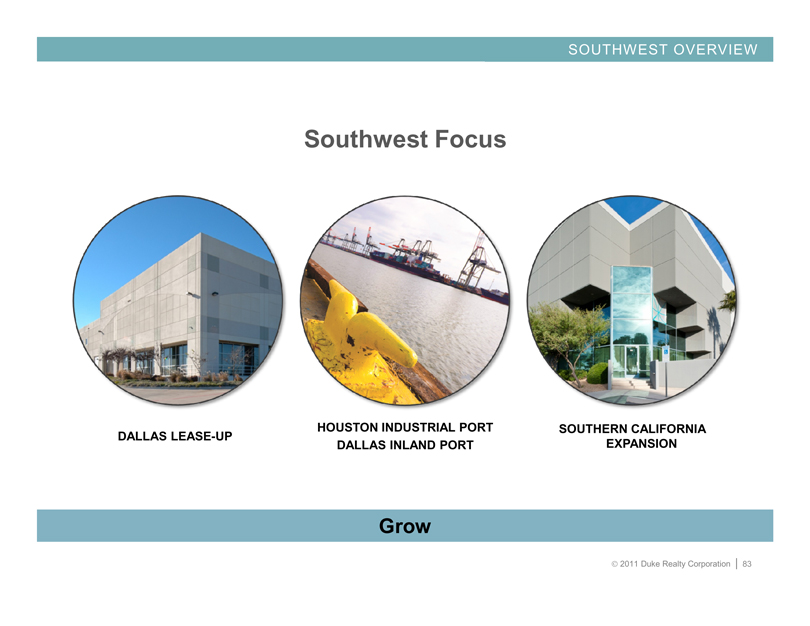
Southwest Focus
DALLAS LEASE-UP
HOUSTON INDUSTRIAL PORT DALLAS INLAND PORT
SOUTHERN CALIFORNIA EXPANSION
Grow
© 2011 Duke Realty Corporation | 83
RELIABLE. ANSWERS
Forward-Looking Statement
This slide presentation contains statements that constitute “forward-looking statements” within the meaning of the Securities Act of 1933 and the Securities Exchange Act of 1934 as amended by the Private Securities Litigation Reform Act of 1995. These forward-looking statements include, among others, our statements regarding (1) strategic initiatives with respect to our assets, operations and capital and (2) the assumptions underlying our expectations. Prospective investors are cautioned that any such forward-looking statements are not guarantees of future performance and involve risks and uncertainties, and that actual results may differ materially from those contemplated by such forward-looking statements. A number of important factors could cause actual results to differ materially from those contemplated by forward-looking statements in this slide presentation. Many of these factors are beyond our ability to control or predict. Factors that could cause actual results to differ materially from those contemplated in this slide presentation include the factors set forth in our filings with the Securities and Exchange Commission, including our annual report on Form10-K, quarterly reports on Form 10-Q and current reports on Form 8-K. We believe these forward-looking statements are reasonable, however, undue reliance should not be placed on any forward-looking statements, which are based on current expectations. We do not assume any obligation to update any forward-looking statements as a result of new information or future developments or otherwise.
© 2011 Duke Realty Corporation | 84