 RELIABLE. ANSWERS. Citi Global Property CEO Conference March 3-5, 2014 Exhibit 99.1 RELIABLE. ANSWERS. |
 RELIABLE. ANSWERS. 2 Contents Asset Strategy Operating Strategy Capital Strategy Why Duke Realty 4 9 17 20 26 33 37 42 Industrial Portfolio Office Portfolio Medical Office Portfolio Development Capabilities © 2014 Duke Realty Corporation |
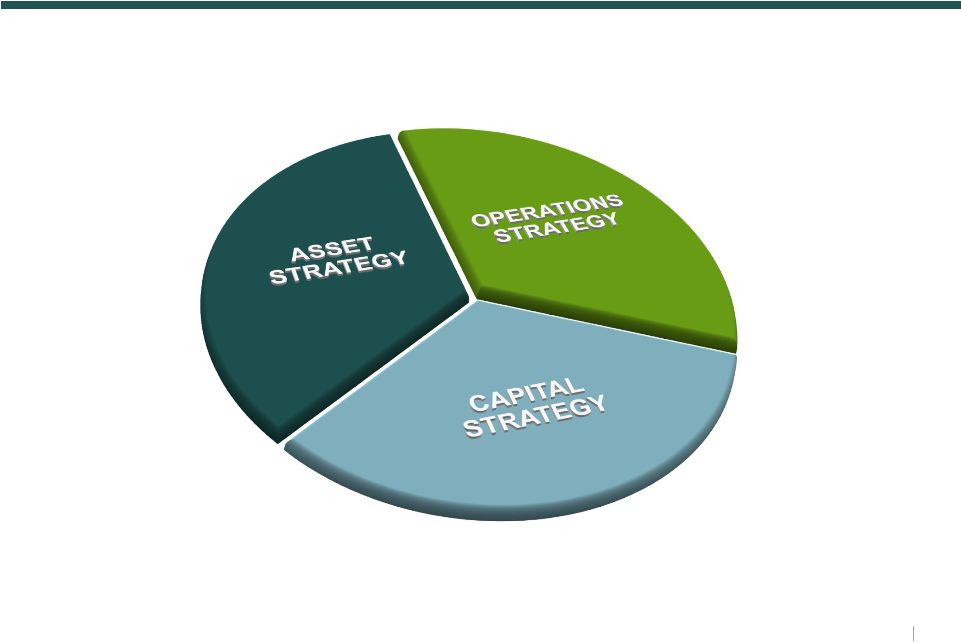 3 Three-Pronged Strategy for Success RELIABLE. ANSWERS. © 2014 Duke Realty Corporation |
 ASSET STRATEGY 4 |
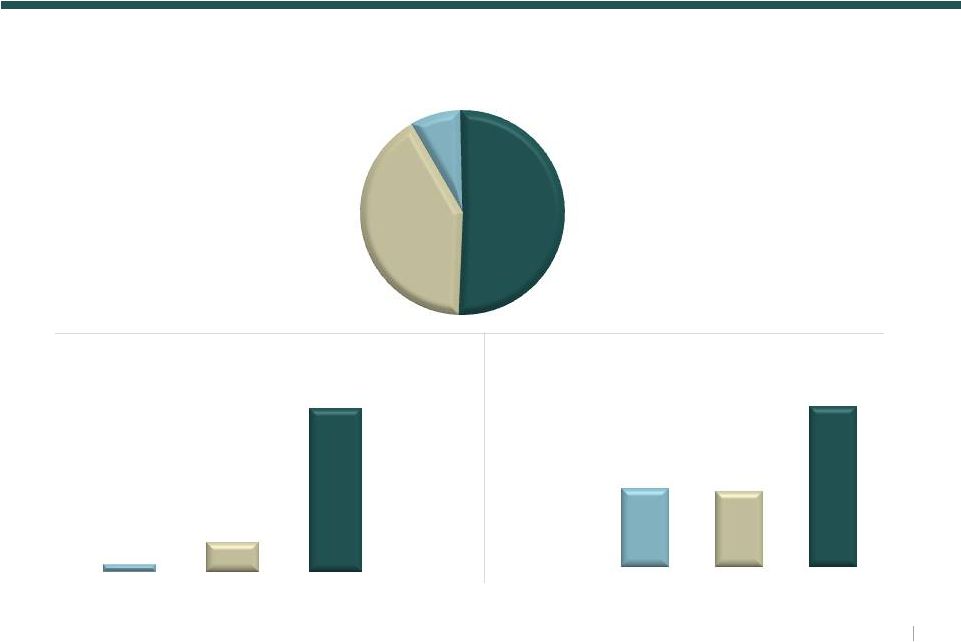
 5 $3.0B Acquisitions $3.3B Dispositions Office $2,438M (74%) Strategic Repositioning Targets Achieved* December 31, 2013 $1.5B Development Portfolio Breakdown* September 30, 2009 The Journey – Repositioning Goals Achieved Office 56% Medical Office 5% Industrial 36% Retail 3% Office $131M (4%) Medical Office $747M (25%) Retail $227M (7%) Industrial $269M (8%) Medical Office $361M (11%) Office 25% Medical Office 15% Industrial 60% Office $200M (13%) Medical Office $576M (37%) © 2014 Duke Realty Corporation ASSET STRATEGY Industrial $2,159 M (71%) Industrial $758 M (50%) *Based on NOI |
 6 2009 2010 $320M Dugan JV acquisition $413M CBRERT disposition $ 465M Premier acquisition 2011 2012 2013 $98M CapTrust Tower disposition $320M USAA portfolio acquisition $666M in new development starts $355M Seavest MOB acquisition $520M in new development starts Launch Asset Repositioning Strategy $1.1B Blackstone disposition $106M TA acquisition (Chicago / Calif) $130M in new development starts $201M in new development starts $210M MOB disposition $135M Midwest office disposition $188M Pembroke retail disposition Asset Repositioning Milestones ASSET STRATEGY $92M Harbin MOB acquisition $125M California acquisitions © 2014 Duke Realty Corporation |
 7 Accretive to Cash Flow 6.7% TTM Economic Yield * 7.6% In-place Yield 6.5% In-place Yield Accretive to Cash Flow! Repositioning & Capital Deployment Activity since 2009 ASSET STRATEGY $3.3B of Dispositions © 2014 Duke Realty Corporation Average age 13 years Primarily Midwest markets 90% pre-leased and typically monetizing Duke Realty land Name brand customers and strong risk-adjusted yields Irreplaceable bulk industrial in major markets such as California, New Jersey, Pennsylvania, Chicago and South Florida $1.5B of Development $3.0B of Acquisitions *TTM NOI less TTM TI’s, LC’s and maintenance capex |
 8 Superior Asset Quality Highest quality portfolio of large, modern bulk industrial assets in key distribution markets Best in class MOB development platform and portfolio, with newest properties and highest hospital system credit Suburban office portfolio now less than 25%, with NOI growth opportunities through lease up and growth in markets such as Raleigh, South Florida and Nashville Built-in annual rent escalations fueling same property growth ASSET STRATEGY © 2014 Duke Realty Corporation |
 ASSET STRATEGY INDUSTRIAL PORTFOLIO 9 |
 Leverage 40 years of industrial operating and development experience as primary driver of company growth Focus on larger, modern bulk distribution product which results in higher credit quality tenants with fewer overall tenants to manage Geographic strategy focused on major markets in key trucking, rail and shipping corridors Growing NOI stream with contractual rent escalations and increasing rental rates, market rent growth along with low capital expenditures Leverage expertise in e-commerce and supply chain reconfiguration along with key long term relationships with national tenants Utilize land positions in existing markets to grow platform through higher yield development Strategically seek acquisition opportunities in higher rent growth markets 10 Industrial Strategy INDUSTRIAL © 2014 Duke Realty Corporation |
 © 2014 Duke Realty Corporation 64 Million Total SF 52 Million Total SF 10 Million Total SF Building Size Breakdown I-------------Building Size------------I Premier Quality Industrial Portfolio 11 INDUSTRIAL 100K-500K SF: 51% >500K SF: 41% <100K SF: 8% Average Tenant Size (in square feet) 22K 92K 520K Occupancy 93.0% 92.8% 98.3% <100K SF 100K-500K SF >500K SF <100K SF 100K-500K SF >500K SF I-----------------Building Size----------------I |
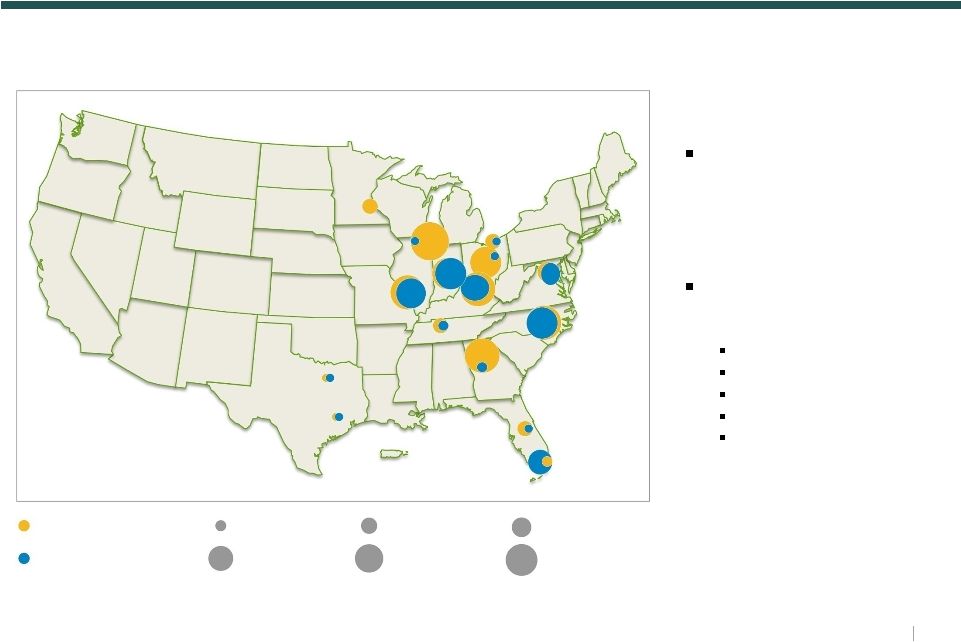
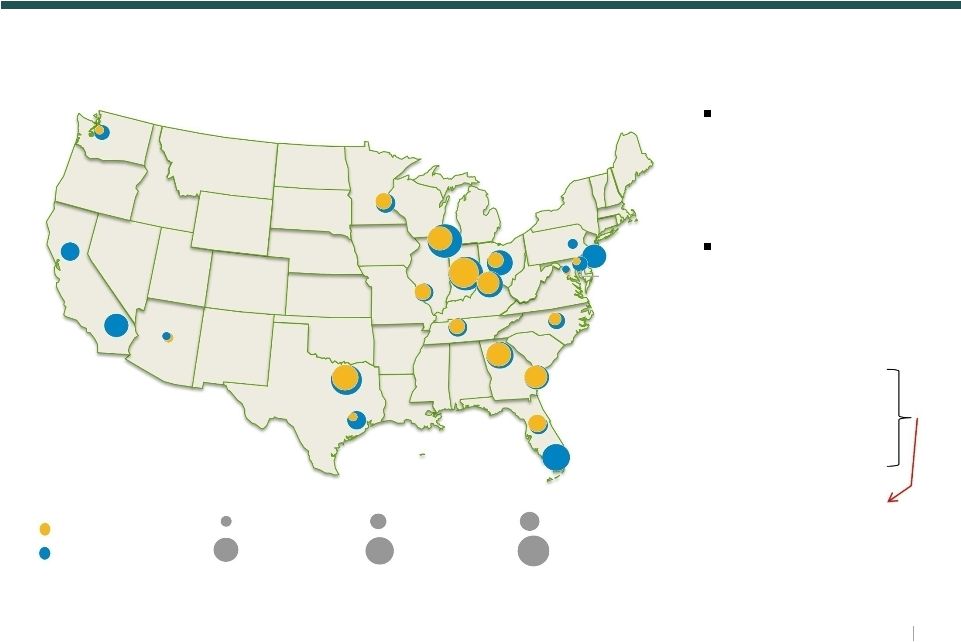 2009 Concentration Evolution of Industrial Geographic Concentration (1) 2013 Concentration Indianapolis Cincinnati South Florida Raleigh Atlanta Dallas St. Louis Nashville Columbus Central Florida Minneapolis Savannah Washington DC Houston Northern California Phoenix Chicago Baltimore Seattle New Jersey Pennsylvania Southern California Increased the size of industrial portfolio by adding $2.4B of new industrial investments Improved the quality and number of regions by expanding to crucial high growth markets, such as: – South Florida – Southern California – Northern California – New Jersey – Pennsylvania Industrial Portfolio Transformation 12 INDUSTRIAL © 2014 Duke Realty Corporation Now 15% of Industrial NOI Note 1. Does not account for “Other East” and “Other Midwest” markets < $100MM $200MM – $300MM $300MM – $450MM $100MM – $150MM $150MM – $200MM > $450MM |
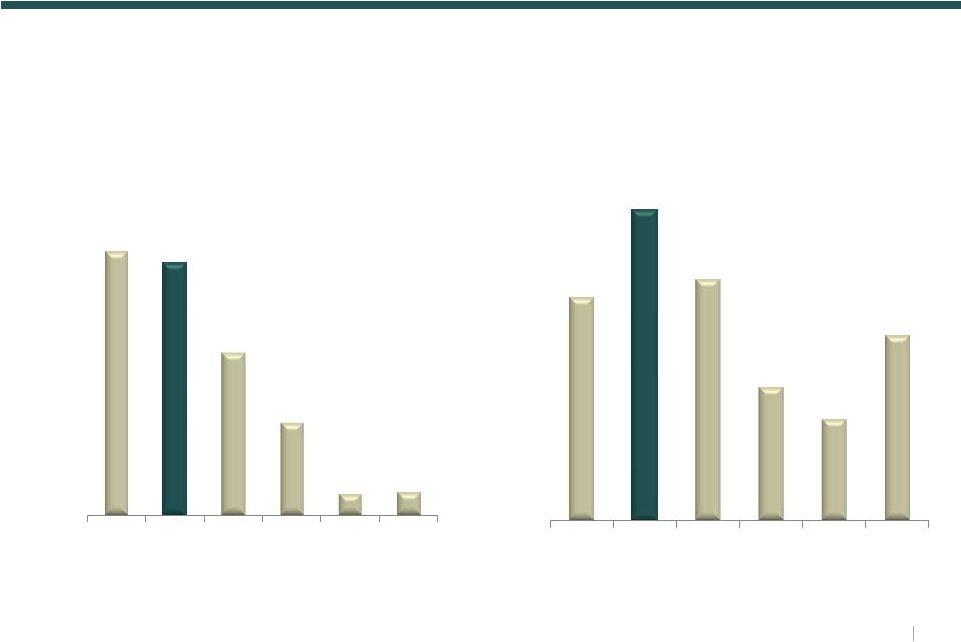
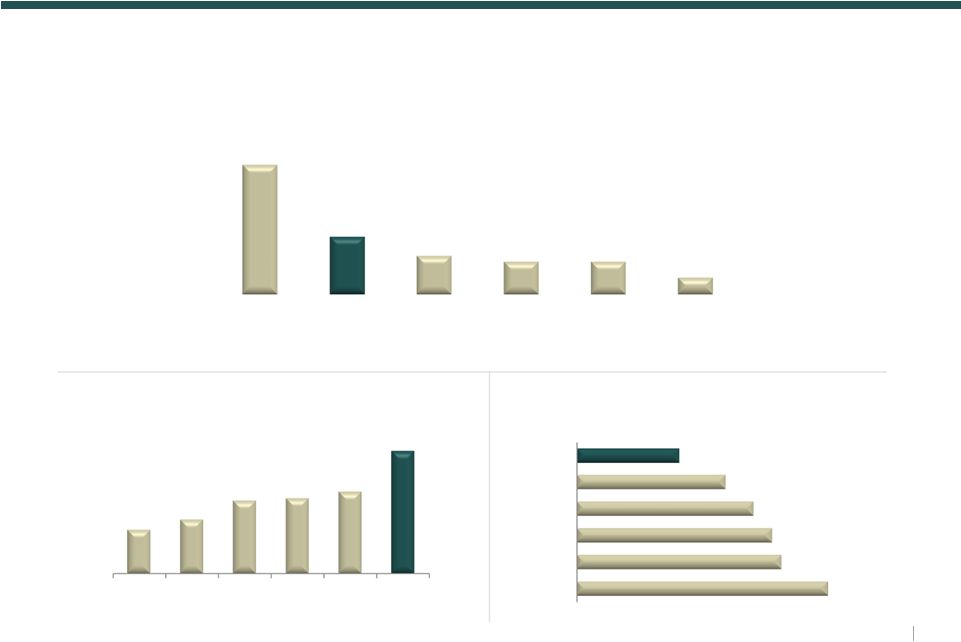 Peer U.S. Industrial Exposure (in millions of square feet¹) Well Positioned for E-Commerce and Supply Chain Trends (1) Estimates based on pro rata ownership % of domestic, industrial-only facilities. Source: Q4 2013 company supplementals. Source: Per CoStar database based on wtd avg RBA, bulk and flex categories, November 2013. LPT includes Cabot transaction, DRE internally calculated. Source: Estimates based on domestic, industrial-only facilities per Q4 2013 company supplementals Best in Class Domestic Industrial Portfolio INDUSTRIAL © 2014 Duke Realty Corporation 13 249 110 74 63 63 32 PLD DRE LPT DCT FR EGP 89 110 148 153 166 249 FR EGP LPT PLD DCT DRE Average Building Size (000’s square feet) 27 22 21 19 16 11 FR EGP PLD DCT LPT DRE Average Building Age (in years) |
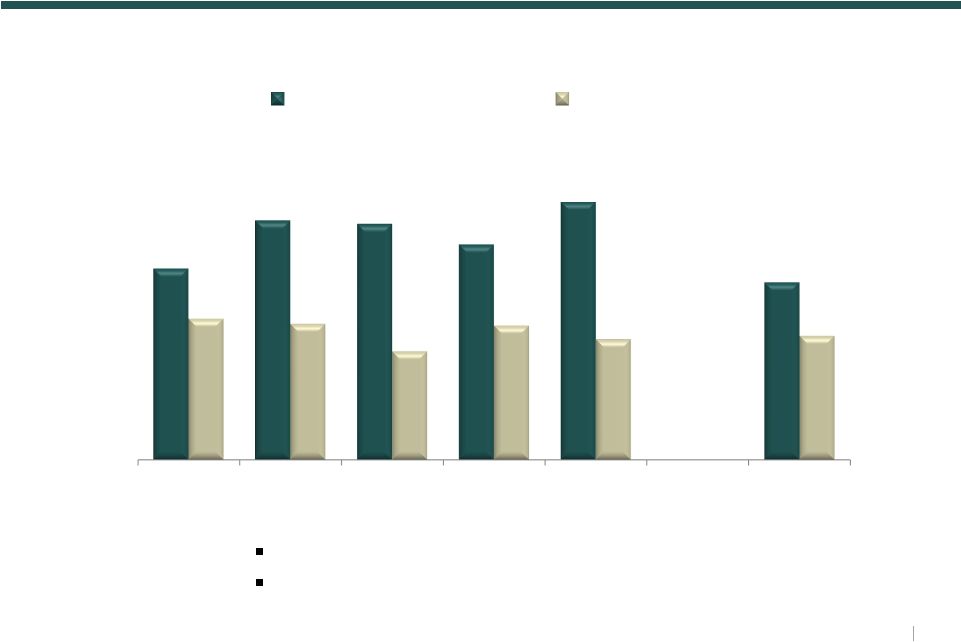 14 Source: CoStar and Duke Realty, as of 12/31/13 Industrial Portfolio Significantly Outperforms Market Q4 2013 Same Property Growth of 3.2% Q4 2013 Rental Rate Growth of 4.8% on renewal leases INDUSTRIAL © 2014 Duke Realty Corporation Duke Realty Occupancy Market Occupancy 96.1% 93.2% 98.9% 92.9% 98.7% 91.3% 97.5% 92.8% 100.0% 95.3% 92.0% 92.2% Indianapolis Chicago Columbus All DRE Markets Cincinnati Dallas |
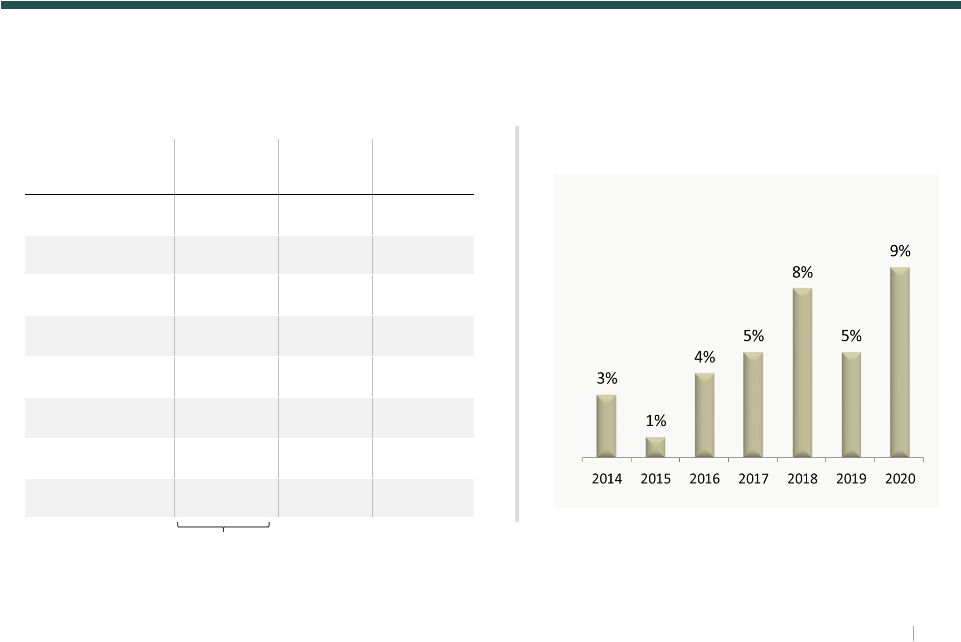
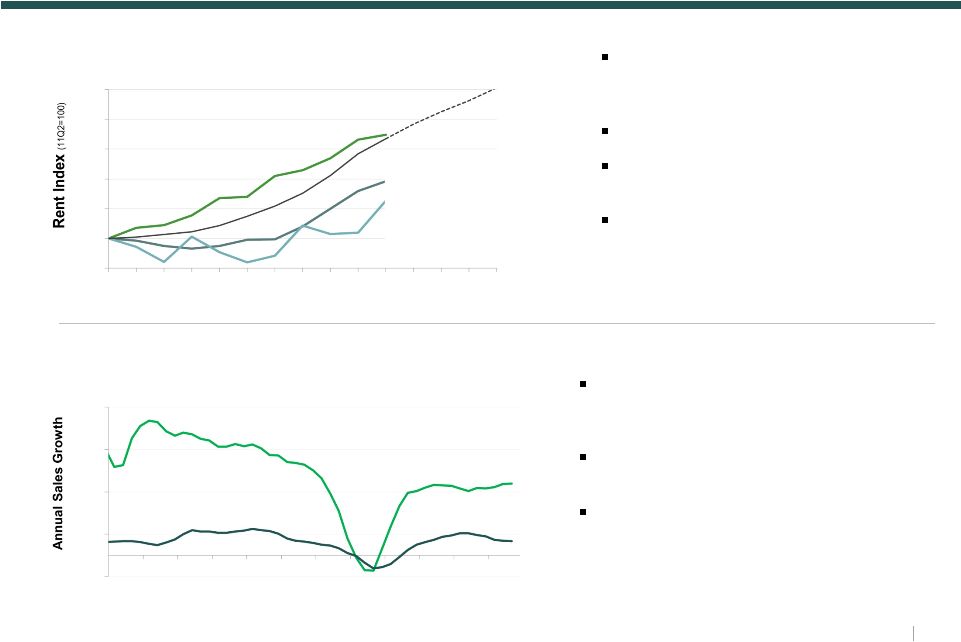 Strong Market Rent Growth Momentum E-Commerce Sales Growth Very Strong Market rent growth continues to accelerate. Projections are 3.3% average annual growth through 2017 Big box continues to outperform Duke Realty market rent growth outperforming the PPR54 Duke Realty actual net effective rent growth for industrial trending up: +4.8% for Q4 E-commerce sales growth currently growing at a double digit rate over conventional retail E-commerce currently 9% of all retail sales, trending towards 20% by 2020 Duke Realty a leading national facility operator/developer to major users of modern bulk industrial space Duke markets Big Box Duke markets all sizes & PPR Forecast Duke markets Small Box Non- Duke markets Big Box Big Box : Strong Rent Growth & E-Commerce Trends 15 INDUSTRIAL E-commerce sales growth Overall retail sales growth 98 100 102 104 106 108 110 11Q2 11Q4 12Q2 12Q4 13Q2 13Q4 14Q2 14Q4 (5%) 5% 15% 25% 35% 02 03 04 05 06 07 08 09 10 11 12 13 © 2014 Duke Realty Corporation Graph sources: CoStar / PPR; E-commerce & retail sales figures are 4Q rolling avg, total retail ex-autos, gas and fuel; *PPR54 minus 22 Duke MSAs; Big Box 1990+ & 100K SF+; Small Box <100K SF |
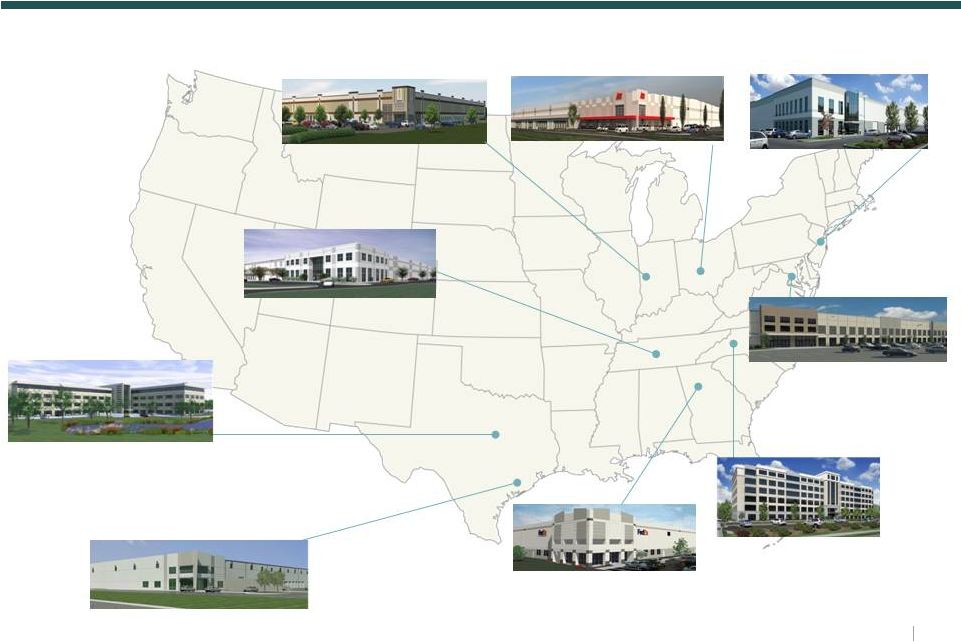
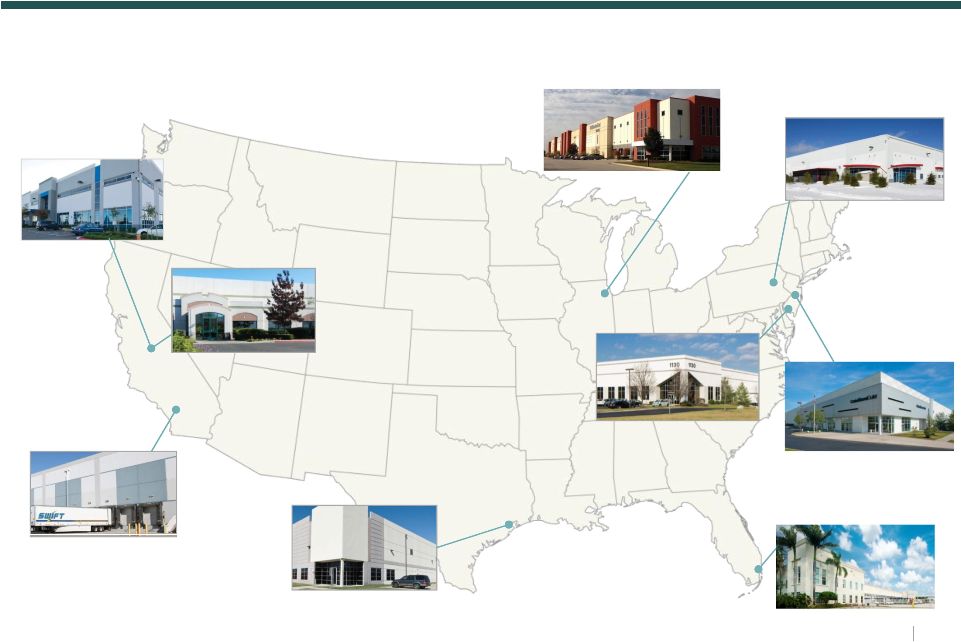 Funded from Recycling of Asset Dispositions and Accretive to AFFO Home Depot Deployment Center Central Valley, CA 660,000 SF, 100% leased JoAnne Stores Central Valley, CA 635,000 SF, 100% leased Redlands Commerce Center Inland Empire East 575,000 SF, 100% leased Interport Building I Houston, TX 600,000 SF, 100% leased 1130 Commerce Blvd Southern NJ 386,000 SF, 100% leased Sears Distribution Center Northeast PA 1,026,000 SF, 100% leased Crate & Barrel Distribution Central NJ 950,000 SF, 100% leased Electrolux Chicago, IL 965,000 SF, 100% leased Dade Paper Miami, FL 226,000 SF, 100% leased 16 Select 2013 Industrial Acquisitions INDUSTRIAL © 2014 Duke Realty Corporation |
 ASSET STRATEGY OFFICE PORTFOLIO 17 |
 Reached 25% target at year-end 2013 according to plan Continue to sell older, non-strategic assets Develop remaining office land bank primarily with build to suit projects Own highest quality assets in high growth office markets Capitalize on improving economy and quality assets by leasing up portfolio to historic levels OFFICE Office Strategy 18 © 2014 Duke Realty Corporation |
 19 Evolution of Office Geographic Concentration Reduced the size of office portfolio by disposing of ~$2.2B of investments Reduced exposure to markets such as: Atlanta Cincinnati Chicago Columbus Minneapolis 2009 Concentration 2013 Concentration < $100MM $200MM $300MM > $450MM Atlanta Chicago St. Louis Cincinnati Columbus Indianapolis Minneapolis Nashville Cleveland Dallas Houston Raleigh Washington DC Central Florida South Florida Note: Does not account for DRE “Other East” markets. Basis at owner share in investment $ dollars basis Office Portfolio Transformation OFFICE © 2014 Duke Realty Corporation – $300MM $450MM – $100MM $150MM – $150MM $200MM – |
 ASSET STRATEGY MEDICAL OFFICE PORTFOLIO 20 |
 Growth industry, recession resistant asset class Best in class development team able to produce consistent development opportunities through economic cycles Substantially all on-campus or aligned with major hospital systems Long term leases averaging over 12 years Consistent NOI growth with typical leases including 2-3% annual net rent escalations and expense increase pass- throughs MEDICAL OFFICE Medical Office Platform Enhances Risk-adjusted Returns 21 © 2014 Duke Realty Corporation |
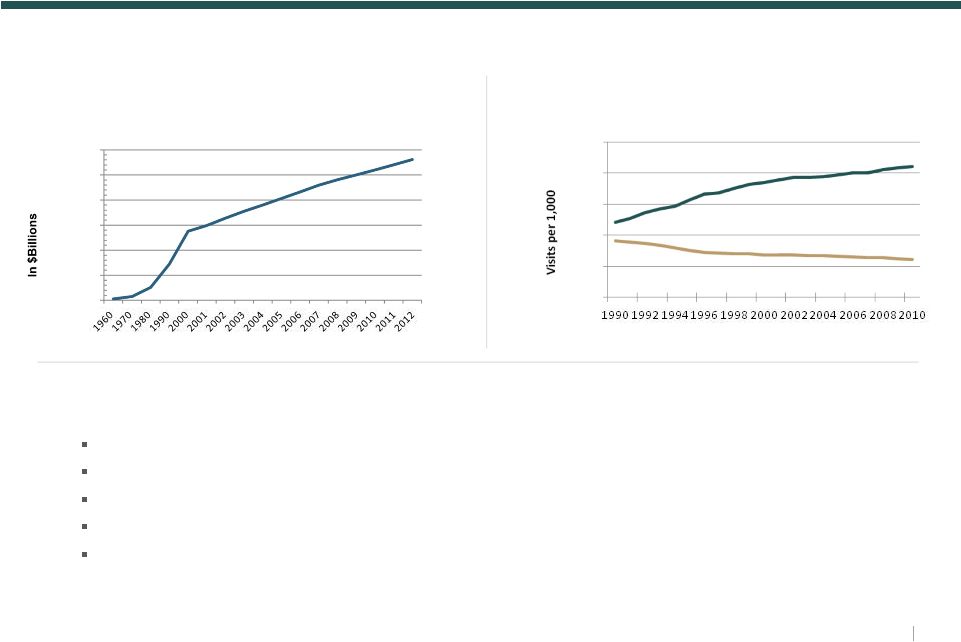 Very Well Positioned for Strong Industry Demand Trends Annual Healthcare Expenditures Source: U.S. Bureau of the Census Affordable Care Act People insured expected to increase by 30 to 50 million – increased demand for care Number of physicians expected to increase – growing MOB space demand Patient care shifting to more cost-efficient MOB settings with higher acuity of services Reduced reimbursements should make real estate efficiency a priority – larger deals and floor plates Healthcare system consolidation and physician practice acquisitions by hospitals grew 25% in the last 5 years – strong MOB demand and improving credit Inpatient and Outpatient Trends Source: Avalere Health, American Hospital Association Annual Survey, U.S. Census Bureau Outpatient Visits 22 MEDICAL OFFICE 2,500 2,000 1,500 1,000 500 0 $3,000 $2,500 $2,000 $1,500 $1,000 $500 $0 Inpatient visits © 2014 Duke Realty Corporation |
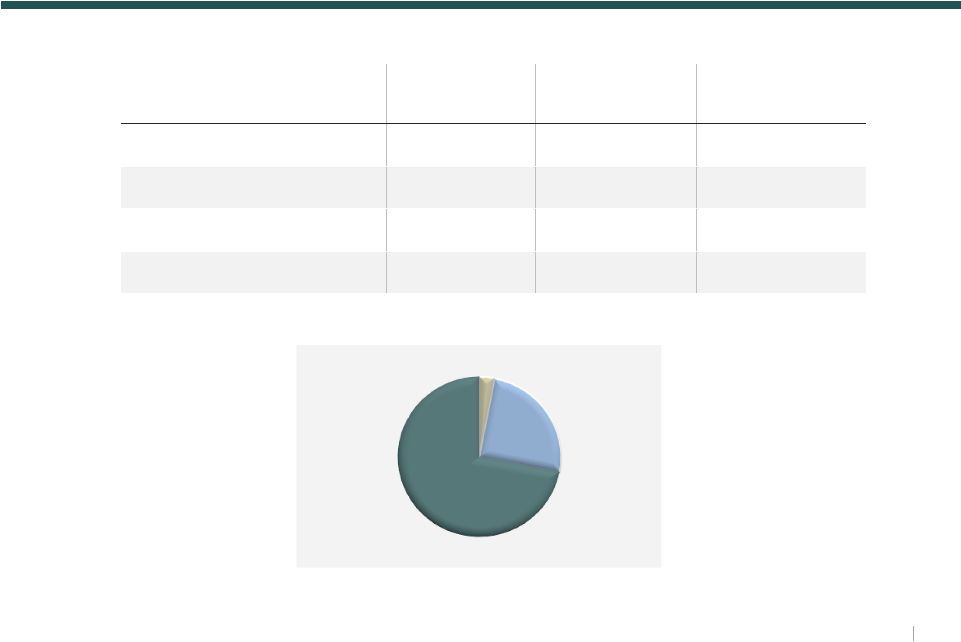 In-Service Under Development Total Properties 63 11 74 Investment $ $1.2 B $204 M $1.4 B Square Feet 5.3 M 590 K 5.9 M Leased Occupancy 94% 93% 94% MOB On-Campus MOB Off-Campus MOB Aligned w/ Health System Investment by product type As of 12/31/13 Medical Office Portfolio 23 MEDICAL OFFICE © 2014 Duke Realty Corporation 3% 25% 72% |
 As of 12/31/13 Lease Expirations (% of MOB In-Service Sq. Ft.) High Quality, Growing Cash Flow and Strong Development Opportunities Health System Credit Rating (Moody's) Rentable SF % of Tot Square Feet Veterans Administration Aaa 224,000 3.5% Ascension Health Aa1 530,000 8.2% Health & Hospital Corp Marion County Aa1 274,000 4.3% Baylor Health Care System Aa2 452,000 7.0% Catholic Health Initiatives Aa2 250,000 3.9% Franciscan Alliance, Inc. Aa3 283,000 4.4% Scott & White Healthcare A1 425,000 6.6% Adventist Health Aa3 201,000 3.1% Overall 56% of space leased to “A” or better rated tenants Top Health System Relationships 24 MEDICAL OFFICE © 2014 Duke Realty Corporation |
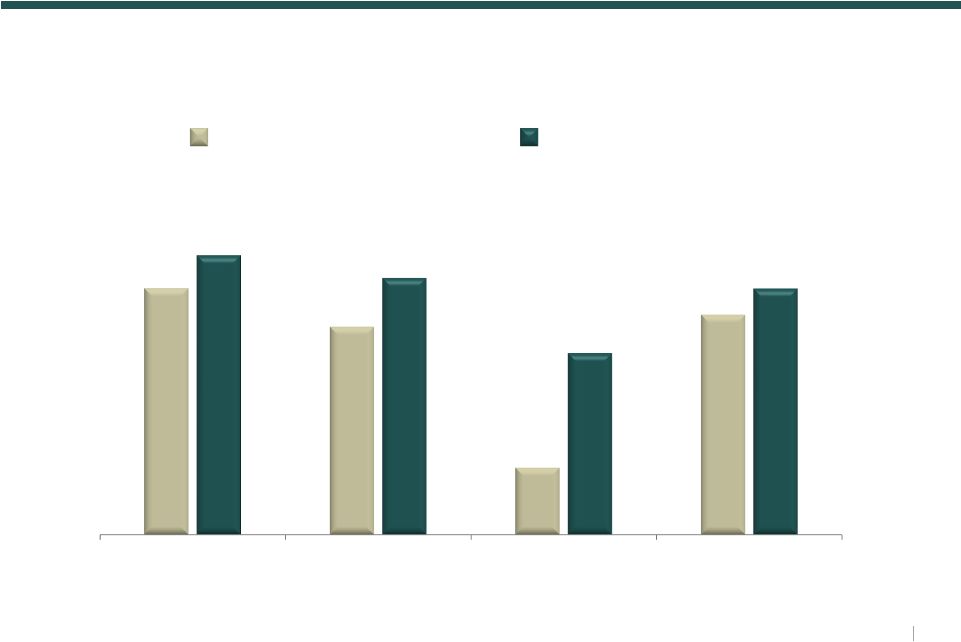
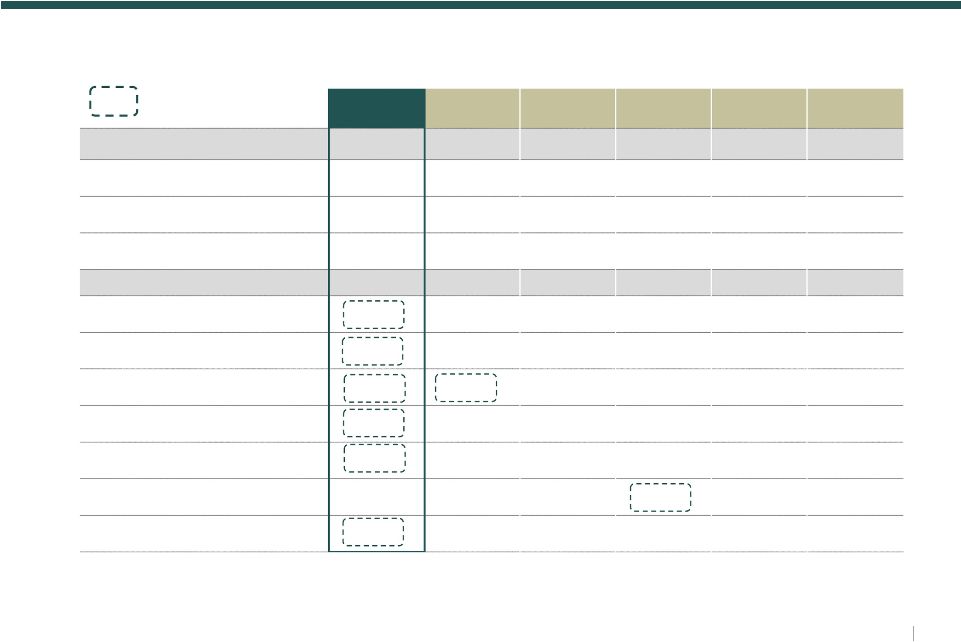 DRE HCN HCP HR HTA VTR Portfolio Size Number of Properties 74 216 206 198 288 327 Square Feet (in MM's) 5.9 14.1 14.1 13.9 14.1 18.0 Total Investment (in $MM's) $1,422 $3,496 $2,663 $3,062 $2,968 $3,768 Operating Statistics Average Age (1) 6 yrs 12 yrs 20 yrs -- 11 yrs 15 yrs Square Feet / Property 80k SF 67k SF 68k SF 70k SF 49k SF 55k SF Est'd Annualized NOI $ / SF $17.4 $17.7 $15.1 $15.7 $15.9 $15.8 In-Service Occupancy 94% 95% 90% 85% 92% 92% TTM Same Prop NOI Growth 3.3% 1.3% 2.3% 1.1% 3.0% 1.2% % Leased to Health Systems 76% -- -- 80% -- -- % of MOB’s On-Campus / Aligned (2) 97.4% 89.2% 94.4% 87.4% 96.0% 96% Peer Comparison Sources: Company filings as of Q4 2013 = #1 in metric Bold Best in Class Medical Office Platform 25 MEDICAL OFFICE © 2014 Duke Realty Corporation Notes 1. In service portfolio per disclosure or weighted on average investment basis per latest 10K filing 2. On-Campus / Aligned refers to a property that is 1) located on or adjacent to a healthcare system, 2) off-campus and leased 50% or more to a healthcare system, or 3) an ASC / specialty hospital with a hospital partnership interest |
 ASSET STRATEGY DEVELOPMENT CAPABILITIES 26 |
 40 years of experience in development Land bank in strategic locations that can support approximately 55 million square feet of development (85% bulk industrial) $611 million pipeline that is 89% leased with 8.4% GAAP yield, immediately accretive when complete. 2013 development starts projected to generate 17-18% profit margins, creating over $100 million in value Strategic relationships with national customers, with 81% of development starts since 2009 repeat business Fully staffed internal team involved in all aspects of development, including pre-construction and construction to deliver most cost effective and profitable projects Risk management policies in place to govern maximum development pipeline size and speculative development starts DEVELOPMENT Development Strategic Advantages 27 © 2014 Duke Realty Corporation |
 Strong Relative Development Pipeline 28 DEVELOPMENT Development Will Drive Value Creation and Immediately Accretive © 2014 Duke Realty Corporation PLD DRE LPT DCT FR EGP PLD DRE LPT DCT FR EGP $638 $611 $393 $222 $49 $56 64% 89% 69% 38% 29% 53% Total US Pipeline Size (in $ millions) Pre-lease % Note: Pipeline size and pre-lease % only include domestic projects under development and exclude pre-stabilized in-service developments; however, pre-lease % for PLD includes pre-stabilized developments already placed in-service due to no break-out in supplemental. Source: Q4 2013 company supplementals |
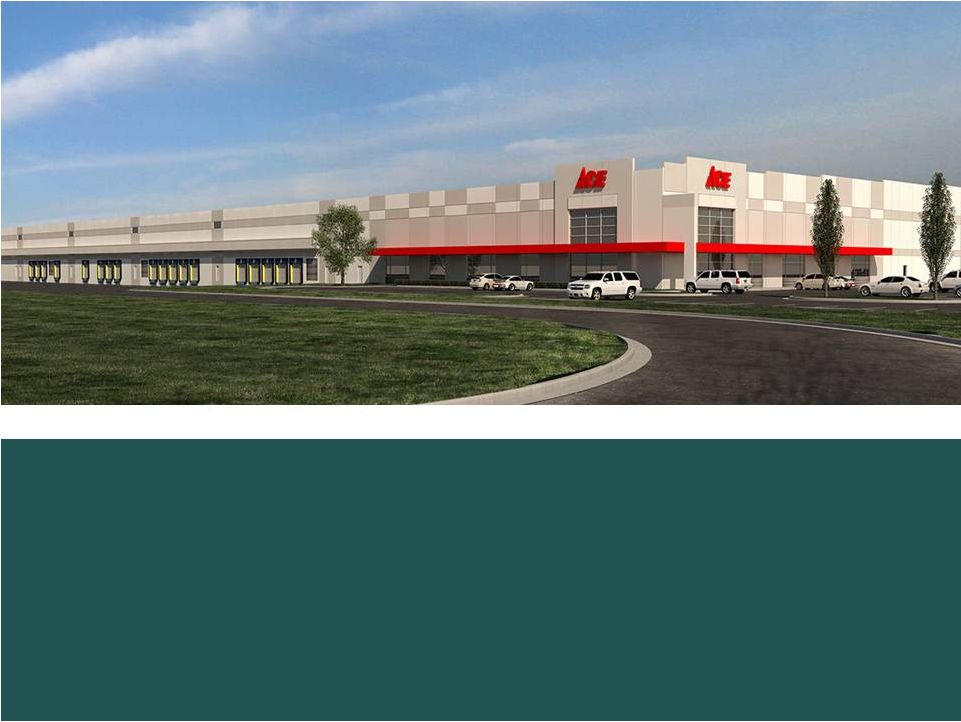
 Nashville Industrial Dallas Office Houston Industrial Raleigh Office Columbus Industrial Baltimore Industrial Indianapolis Industrial New Jersey Industrial Atlanta Industrial Select 2013 Industrial & Suburban Office Development Starts 29 DEVELOPMENT © 2014 Duke Realty Corporation Two build-to-suits on Duke Realty land 1.7 million total SF in 50% owned JV 100% pre-leased Build-to-suit on Duke Realty land for Ace Hardware 534,000 SF 100% pre-leased; 10+ year lease term Speculative development on Duke Realty land Newark airport submarket 494,000 SF Build-to-suit on Duke Realty land 200,000 SF 100% pre-leased to major healthcare services firm; 16 year lease term Speculative development on Duke Realty land Airport submarket 240,000 SF 100% pre-leased to Amazon Two build-to-suits on Duke Realty land for HH Gregg and Fedex 480,000 total SF 100% pre-leased Perimeter Two & Three on Duke Realty land 452,000 total SF 97% and 53% pre-leased, respectively Regional distribution center build-to-suit for Starbucks on Duke Realty land 680,000 SF; 8 year lease term 100% pre-leased Build-to-suit on Duke Realty land at Port of Baltimore for Amazon 1 million SF 100% pre-leased, 15 year lease term • • • • • • • • • • • • • • • • • • • • • • • • • • • • |
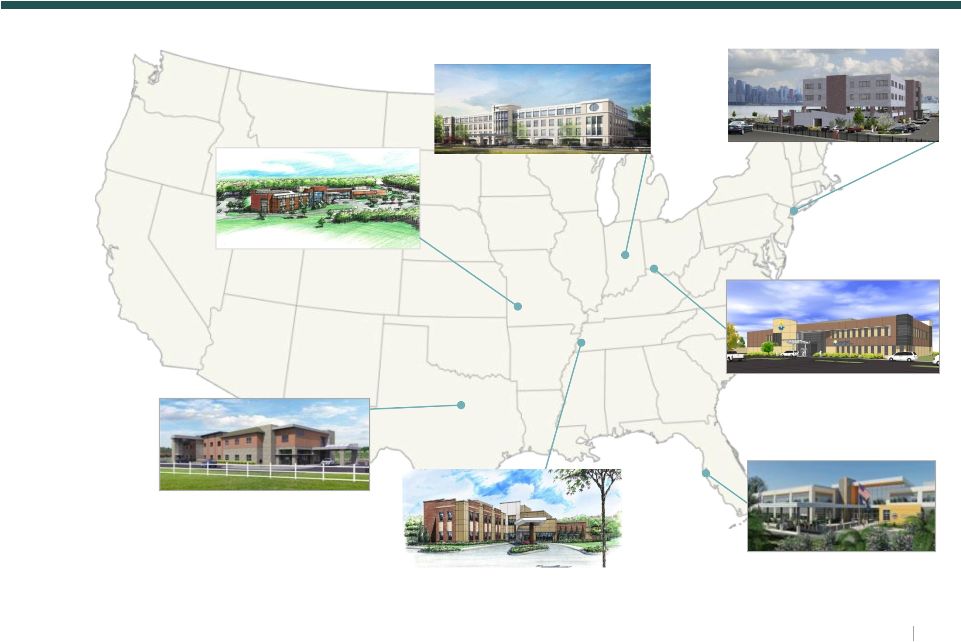 Department of Veterans Affairs Tampa, FL 117,000 SF, 100% pre-leased Palisades Healthcare North Bergen, NJ 57,000 SF, 70% pre-leased Baylor Healthcare (5 Facilities) Dallas, TX 168,000 total SF 100% pre-leased Centerre Baptist Rehab Hospital Germantown, TN 53,000 SF, 100% pre-leased Centerre/Mercy Springfield, MO 60,000 SF, 100% pre-leased TriHealth West Chester MOB Cincinnati, OH 49,000 SF, 100% pre-leased St. Vincent’s Women’s MOB Carmel, IN 86,000 SF, 72% pre-leased Healthcare Development Pipeline 30 DEVELOPMENT © 2014 Duke Realty Corporation |
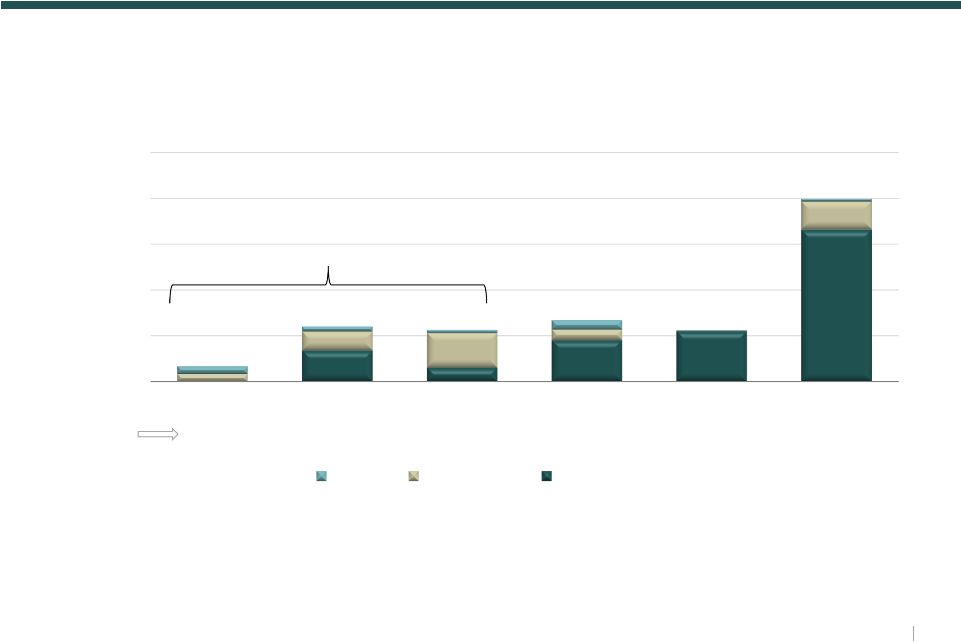
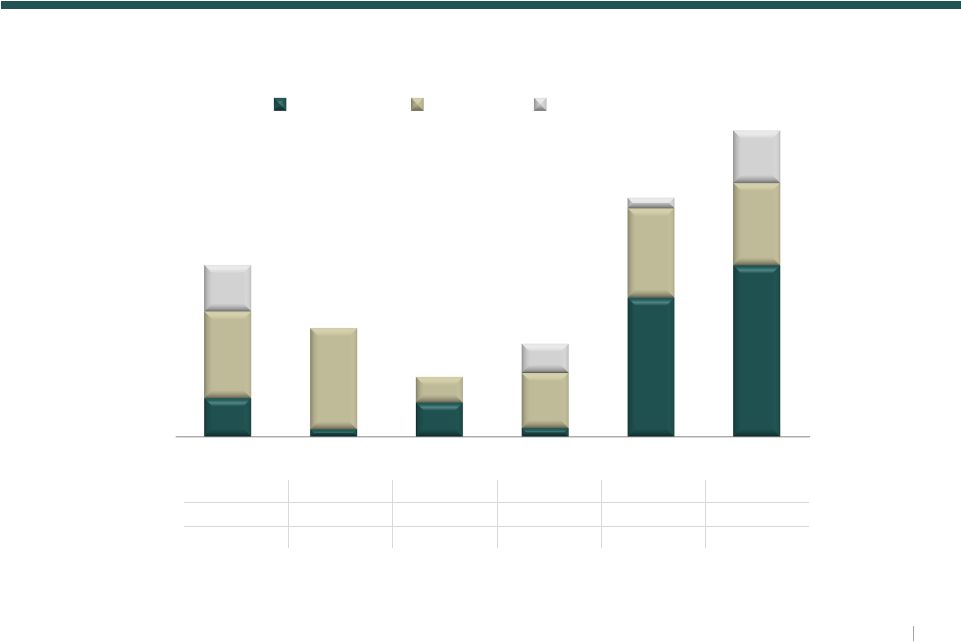 Original Pre-lease %: 35% 87% 88% 97% 77% 86% Current lease %: 91% 94% 99% 96% 87% 91% Stabilized Cash Yield: 8.2% 8.6% 8.9% 7.8% 7.3% 7.7% $373M Total $236M Total $130M Total $202M Total $520M Total $666M Total (in $ millions) Historical Development Starts 31 DEVELOPMENT © 2014 Duke Realty Corporation 84 16 74 19 302 372 188 220 56 120 194 179 101 63 23 114 2008 2009 2010 2011 2012 2013 Industrial Medical Office |
 Developable Square Feet Industrial Office Primary Markets Midwest 24.4 3.1 Indianapolis, Chicago, Cincinnati, Columbus, Minneapolis, & St. Louis East 3.3 1.7 New Jersey, Baltimore, Raleigh and Washington D.C. Southeast 9.5 1.9 Atlanta, Central Florida, South Florida and Nashville Southwest 10.0 1.5 Phoenix, Dallas and Houston Total 47.1 million SF 8.0 million SF $562 million HELD FOR DEVELOPMENT 1) Includes our share of JV land ($62MM) and excludes held for sale ($90MM) Strategically located in key distribution markets and vibrant commercial corridors Cost feasibility and development strategies completed for all land investments; Land fully zoned for intended use 2013 sales from non-strategic parcels of $52 million at a 20% gain over book basis; also monetized $62 million for development in 2013 Monetized on average $97 million per year from sales and development since 2000 Strategic Land Bank to Drive Growth 32 DEVELOPMENT Industrial 68% Office 32% © 2014 Duke Realty Corporation 1 |
 OPERATING STRATEGY 33 |
 Completed asset repositioning into higher quality, higher rental rate growth assets with minimal FFO per share dilution and annual growth in AFFO per share (6% CAGR) Proven same property NOI outperformance, well positioned for continuing same property growth through (a) occupancy upside, (b) embedded rent escalations, and (c) improving rental rate growth (5.1% growth on Q4 renewal rents) Ability to push industrial rents because of occupancy and asset quality 2014 expected AFFO payout ratio of 72%, and current AFFO multiple of approximately 17.5x at the low end of sector and well positioned for continued growth OPERATIONS Operational Success and Future Growth Opportunities 34 © 2014 Duke Realty Corporation |
 Historical Occupancy Supports Additional Upside 35 Dec ‘06 OPERATIONS Note: Peak occupancy represents Stabilized or In-Service properties greater than 1 year, to adjust for merchant development program between 2005 and 2007. Q4 2013 occupancy represents Total In-Service portfolio © 2014 Duke Realty Corporation Q4 2013 Occupancy Peak Occupancy Bulk Industrial Medical Office Suburban Office Total Portfolio 95.3% 93.7% 87.8% 94.2% 96.7% 95.8% 92.6% 95.3% June ‘07 June ‘06 June ‘07 |
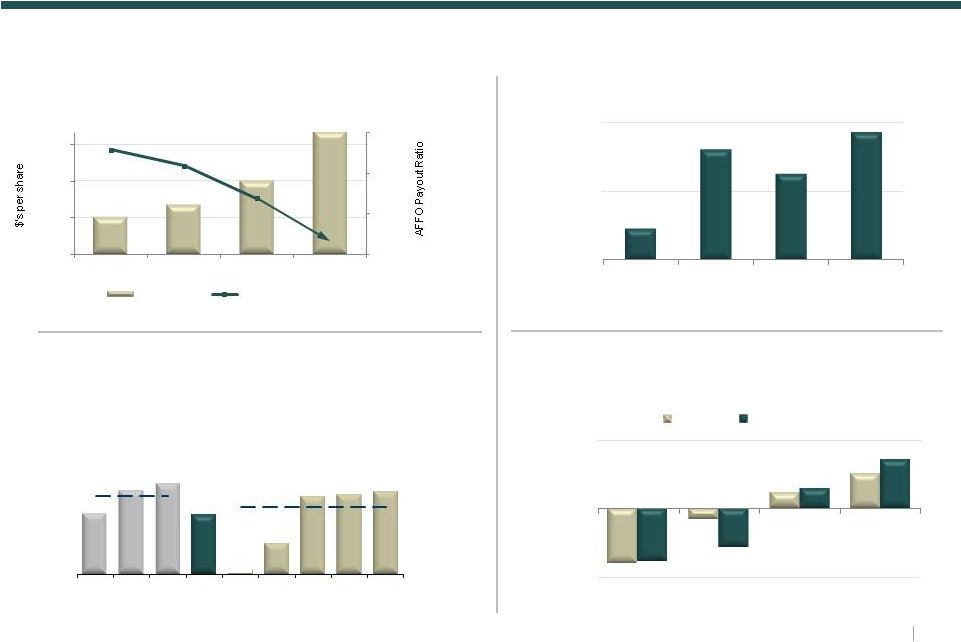 Accelerating Rent Growth (Represents growth in annual net effective rent on renewal leases) Strong Cash Flow Growth and Payout Ratio Steady Same Property NOI Growth Improving Operating Performance 36 Source: SNL, 2014 consensus,* DRE at guidance * mid-point Peer AFFO Payout Ratio Analysis Industrial Average: 77% Office Average: 83% OPERATIONS $0.76 $0.78 $0.82 $0.90 76% 74% 80% 86% 92% 0.70 0.76 0.82 0.88 2010 2011 2012 2013 AFFO/Share AFFO Payout Ratio 73% 86% 90% 72% 42% 57% 82% 84% 85% BDN HIW PKY DRE FR PSB DCT EGP PLD +0.9% +3.2% +2.5% +3.7% 2010 2011 2012 2013 -4.8% -0.9% 1.5% 3.1% -4.7% -3.4% 1.8% 4.3% 2010 2011 2012 2013 Portfolio Industrial Only © 2014 Duke Realty Corporation 82% 89% 87% |
 CAPITAL STRATEGY 37 |
 Achieved original leverage goals established in 2009 Continue to delever through assets sales and equity to fund highly pre- leased development pipeline Improved portfolio quality generating cash flow growth and improved coverage metrics Well balanced annual debt maturities Significant liquidity with $850 million LOC with little to no borrowings and low near-term maturities Low percentage of secured and variable rate debt compared to peer group Rated Baa2 by Moody’s and recent upgrade by S&P to BBB CAPITAL STRATEGY Balance Sheet Quality 38 © 2014 Duke Realty Corporation |
 Investment grade rated debt (Baa2/BBB) for over 16 years with proven access to multiple capital sources Recent actions demonstrate commitment to improved leverage profile 2010 Actual 2012 Actual 2013 Actual Debt to Gross Assets 46% 50% 46% Debt + Preferred to Gross Assets 55% 56% 50% Fixed Charge Coverage Ratio 1.8 : 1 1.8 : 1 2.3:1 (1) Debt + Preferred / EBITDA 8.9 9.3 7.7 (2) (1) Based on Q4 2013 annualized; (2) Proforma D+P / EBITDA based on Q4 2013 annualized EBITDA and adjusted for asset repositioning on a full quarter basis. Key Capital Metrics 39 CAPITAL STRATEGY © 2014 Duke Realty Corporation |
 40 CAPITAL STRATEGY Weighted Avg Interest Rate 6.00% 5.70% 6.15% 5.90% 4.00% 5.50% © 2014 Duke Realty Corporation Balanced Debt Maturities 2014 2015 2016 2017 2018 Thereafter JV Debt Secured Debt Unsecured Debt ($ in millions) $1,990 $ 559 $ 670 $565 $601 $167 Only 29% of debt matures between 12/31/13 and 12/31/2016 |
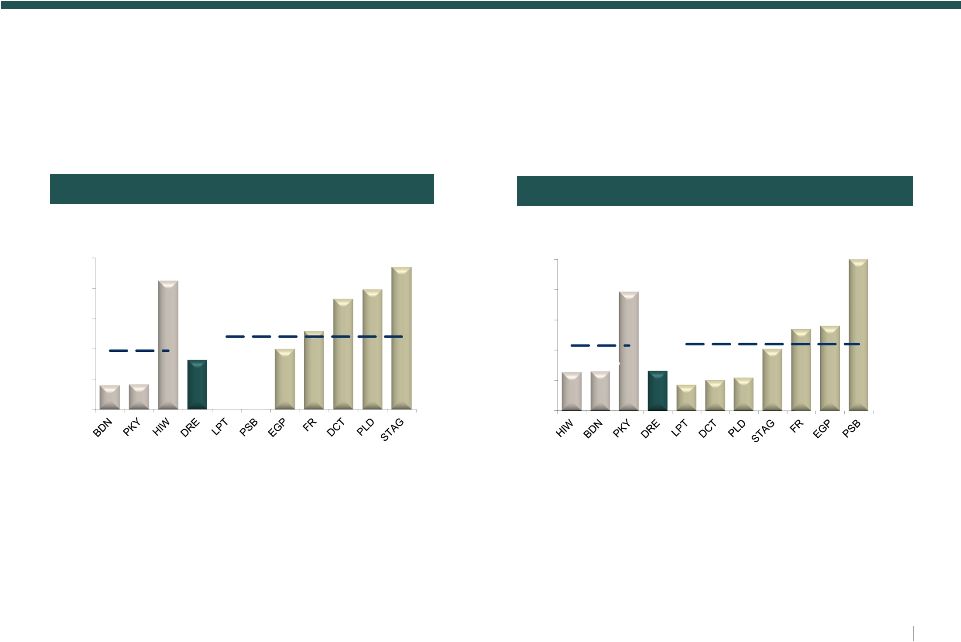 Industrial Average: 12.0% Office Average: 9.7% Industrial Average: 44.1% Office Average: 43.1% Key: Office: BDN=Brandywine; HIW=Highwoods; PKY=Parkway Industrial: DCT=DCT Industrial Trust; EGP=Eastgroup; FR=First Industrial; LPT=Liberty; PLD=Prologis; PSB= PS Business Parks; STAG= STAG Industrial Data source: SNL Financial, 2/21/14 Duke Realty Peer Debt Metrics 41 Low level of secured and variable rate debt CAPITAL STRATEGY Secured Debt / Total Debt Variable Rate Debt / Total Debt © 2014 Duke Realty Corporation 25.0% 20.0% 15.0% 10.0% 5.0% 0.0% 3.9% 4.1% 21.2% 8.1% 0.0% 0.0% 10.0% 12.9% 18.2% 19.7% 23.5% 100.0% 80.0% 60.0% 40.0% 20.0% 0.0% 25.0% 25.8% 78.4% 25.9% 16.8% 20.0% 21.5% 40.6% 53.6% 55.9% 100.0% creates flexibility and lowers volatility |
 WHY DUKE REALTY 42 RELIABLE. ANSWERS. © 2014 Duke Realty Corporation |
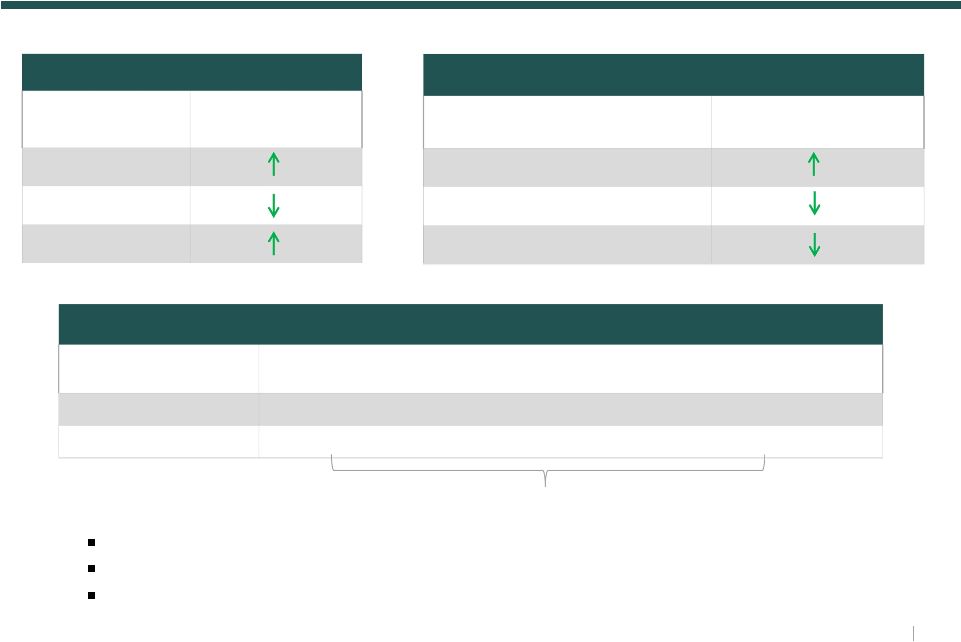 Capital Strategy Key Metrics 2010 Q4 2013 Fixed Charge Coverage 1.8 2.3 Debt Plus Preferred to EBITDA 8.9 7.7 Debt Plus Preferred to Gross Assets 55% 50% Asset Strategy Asset Concentration 2010 2013 Industrial 43% 60% Office 50% 25% Medical Office 5% 15% Operations Strategy Key Metrics 2010 2011 2012 2013 2014 Midpoint Core FFO Per Share $ 1.15 1.15 1.02 1.10 1.15 Core AFFO Per Share $ 0.76 0.78 0.82 0.90 0.94 Successfully repositioned portfolio towards industrial concentration Successfully improved all key leverage metrics Achieved consistent growth in AFFO per share of nearly 6% per year 6% CAGR Duke Realty Score Card 43 Note: On a Q4 NOI basis. 2010 column excludes retail exposure of 2% RELIABLE. ANSWERS. © 2014 Duke Realty Corporation |
 KEY: Office: BDN=Brandywine; HIW=Highwoods; PKY=Parkway; Industrial: DCT=DCT Industrial Trust; EGP=Eastgroup; FR=First Industrial; LPT=Liberty; PLD=Prologis; PSB= PS Business Parks; STAG= STAG Industrial. Data source: SNL Financial, 2/27/14; (1) Based on Street Research from 2/11/14 and 2/10/14. Implied Cap Rate methodology excludes non-earning assets. Valuation Statistics – Undervalued on Relative Basis 44 Price / 2014E FFO Implied Cap Rate Total Market Cap ($ in billions) Price / 2014E AFFO RELIABLE. ANSWERS. © 2014 Duke Realty Corporation 13.6x 13.0x 10.0x 14.4x 23.1x 18.0x 16.7x 16.4x 16.3x 15.2x 14.7x 22.3x 18.9x 17.7x 17.6x 31.0x 23.9x 23.6x 23.4x 23.0x 19.7x 15.8x $5.5 $5.3 $2.6 $10.4 $9.1 $4.1 $4.1 $3.5 $2.8 $1.9 $0.0 $2.0 $4.0 $6.0 $8.0 $10.0 7.2% 6.8% 6.6% 7.0% 7.1% 7.0% 6.7% 6.3% 5.8% 5.7% 5.4% Industrial Average: 17.2x Office Average: 12.2 x Industrial Average: 22.9x Industrial Average: 6.3% Office Average: 19.6x Office Average: 6.9% $31.6 $32.0 Industrial Average: $8.2 Office Average: $4.5 Price / 2014E FFO Implied Cap Rate Total Market Cap ($ in billions) Price / 2014E AFFO Industrial Median: $4.1 |
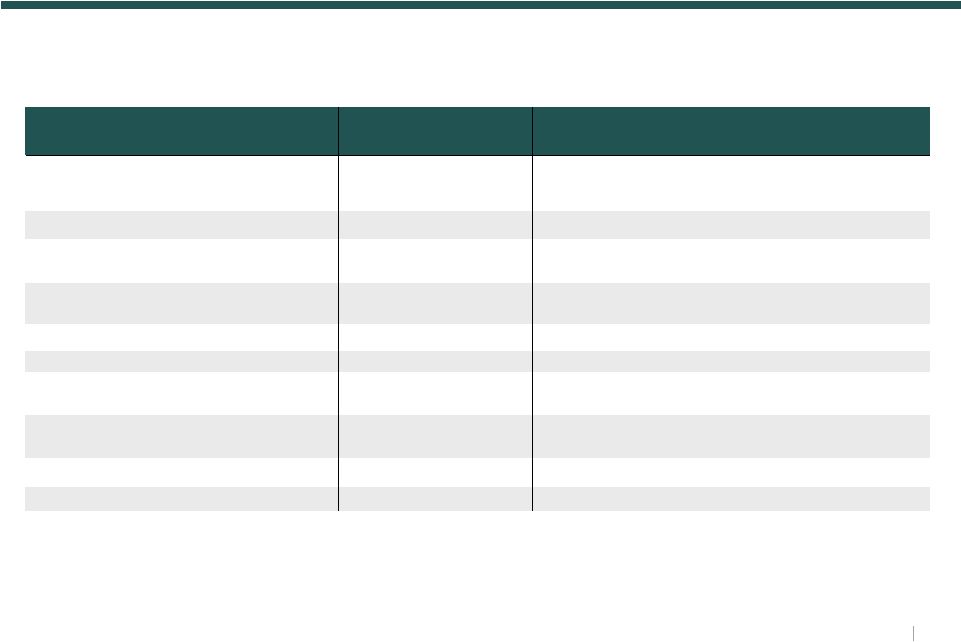 2014 Range of Estimates $ in millions 45 RELIABLE. ANSWERS. © 2014 Duke Realty Corporation Metrics 2013 Actual Pessimistic Optimistic Key Assumptions Core FFO per share $1.10 $1.11 $1.19 - Continued improvement in operating fundamentals - Development projects Core AFFO per share $0.90 $0.91 $0.97 - Continued benefits from asset repositioning strategy Average Occupancy - In-Service 93.3% 93.25% 94.75% - Positive momentum continued, although slower pace - Expirations only 8% of portfolio Same Property NOI Growth 3.7% 2.0% 4.0% - Occupancy growth slowing - Improved rental rate assumptions Building Acquisitions $555 $150 $300 - Remain highly selective in acquiring high quality industrial facilities Building Dispositions $877 $500 $700 - Continue to prune remaining office and retail Land Sale Proceeds $52 $30 $50 - Selling identified non-strategic parcels - Demand improving Development Starts $666 $350 $450 - Comprised of industrial and medical office - Substantially pre-leased Service Operations Income $27 $16 $22 - Consistent with fourth quarter 2013 levels General & Administrative expense $43 $44 $40 - Continued efficiency gains |
 Talent and Leadership with Proven Ability to Execute Superior Asset Quality Strategically Located Land Bank and Experienced Development Capabilities Proven Operational Success and Future Growth Opportunities Balance Sheet Strength Relative Value vs. Peers Top Tier to Corporate Governance * Why Duke Realty? 46 *2013 ISS “Quickscore” rank in top 10% of the average of S&P500 companies. For REIT sector, one of the leading REIT research firm’s composite corporate governance metric ranks DRE in the 97 percentile on avg 2008 thru 2013. RELIABLE. ANSWERS. © 2014 Duke Realty Corporation th |
 RELIABLE. ANSWERS. Forward-Looking Statement 47 This slide presentation contains statements that constitute “forward-looking statements” within the meaning of the Securities Act of 1933 and the Securities Exchange Act of 1934 as amended by the Private Securities Litigation Reform Act of 1995. These forward-looking statements include, among others, our statements regarding (1) strategic initiatives with respect to our assets, operations and capital and (2) the assumptions underlying our expectations. Prospective investors are cautioned that any such forward-looking statements are not guarantees of future performance and involve risks and uncertainties, and that actual results may differ materially from those contemplated by such forward-looking statements. A number of important factors could cause actual results to differ materially from those contemplated by forward-looking statements in this slide presentation. Many of these factors are beyond our ability to control or predict. Factors that could cause actual results to differ materially from those contemplated in this slide presentation include the factors set forth in our filings with the Securities and Exchange Commission, including our annual report on Form10-K, quarterly reports on Form 10-Q and current reports on Form 8-K. We believe these forward-looking statements are reasonable, however, undue reliance should not be placed on any forward-looking statements, which are based on current expectations. We do not assume any obligation to update any forward-looking statements as a result of new information or future developments or otherwise. Certain of the financial measures appearing in this slide presentation are or may be considered to be non-GAAP financial measures. Management believes that these non-GAAP financial measures provide additional appropriate measures of our operating results. While we believe these non-GAAP financial measures are useful in evaluating our company, the information should be considered supplemental in nature and not a substitute for the information prepared in accordance with GAAP. We have provided for your reference supplemental financial disclosure for these measures, including the most directly comparable GAAP measure and an associated reconciliation in our most recent quarter supplemental report, which is available on our website at www.dukerealty.com. Our most recent quarter supplemental report also includes the information necessary to recalculate certain operational ratios and ratios of financial position. The calculation of these non-GAAP measures may differ from the methodology used by other REITs, and therefore, may not be comparable. © 2014 Duke Realty Corporation |