UNITED STATES
SECURITIES AND EXCHANGE COMMISSION
Washington, D.C. 20549
FORM N-CSR
CERTIFIED SHAREHOLDER REPORT OF REGISTERED
MANAGEMENT INVESTMENT COMPANIES
Investment Company Act file Number 811-04471
Value Line Aggressive Income Trust
(Exact name of registrant as specified in charter)
7 Times Square 21st Floor, New York, N.Y. 10036-6524
(Address of principal executive offices) (Zip Code)Registrant’s telephone number, including area code: 212-907-1900
Date of fiscal year end: January 31, 2013
Date of reporting period: July 31, 2012
Value Line Core Bond Fund (formerly, Value Line Aggressive Income Trust) is filing this Amendment No. 1 (this “Amendment”) to its certified shareholder report on Form N-CSR for the period ended July 31, 2012 that was filed with the U. S. Securities and Exchange Commission on October 4, 2012 (the “Form N-CSR”). The purpose of this Amendment is to include the “Factors Considered by the Board in Approving the Continuance of the Investment Advisory Agreement of the Fund.” Except as set forth above, no other changes have been made to the Form N-CSR, and this Amendment does not amend, update or change any other items or disclosure found in the Form N-CSR. Further, the Form N-CSR does not reflect events that occurred after the filing of the Form N-CSR.
Item I. | Reports to Stockholders. | |
| A copy of the Semi -Annual Report to Stockholders for the period ended 7/31/12 is included with this Form. | ||
| INVESTMENT ADVISER | EULAV Asset Management 7 Times Square 21st Floor New York, NY 10036-6524 | S E M I – A N N U A L R E P O R T | |
| J u l y 3 1 , 2 0 1 2 | |||
| DISTRIBUTOR | EULAV Securities LLC | ||
7 Times Square 21st Floor | |||
| New York, NY 10036-6524 | |||
| CUSTODIAN BANK | State Street Bank and Trust Co. | ||
| 225 Franklin Street | |||
| Boston, MA 02110 | |||
| SHAREHOLDER | State Street Bank and Trust Co. | ||
| SERVICING AGENT | c/o BFDS | ||
| P.O. Box 219729 | |||
| Kansas City, MO 64121-9729 | |||
| INDEPENDENT | PricewaterhouseCoopers LLP | Value Line Aggressive Income Trust | |
| REGISTERED PUBLIC | 300 Madison Avenue | ||
| ACCOUNTING FIRM | New York, NY 10017 | ||
| LEGAL COUNSEL | Peter D. Lowenstein, Esq. | ||
| 496 Valley Road | |||
| Cos Cob, CT 06807-0272 | |||
| DIRECTORS | Mitchell E. Appel | ||
| Joyce E. Heinzerling | |||
| Francis C. Oakley | |||
| David H. Porter | |||
| Paul Craig Roberts | |||
| Nancy-Beth Sheerr | |||
| Daniel S. Vandivort | |||
| OFFICERS | Mitchell E. Appel | ||
| President | |||
| Michael J. Wagner | |||
| Chief Compliance Officer | |||
| Emily D. Washington | |||
| Treasurer and Secretary | |||
 | |||
| This unaudited report is issued for information to shareholders. It is not authorized for distribution to prospective investors unless preceded or accompanied by a currently effective prospectus of the Trust (obtainable from the Distributor). | |||
| #00088206 | |||
Value Line Aggressive Income Trust
| To Our Value Line Aggressive |
To Our Shareholders (unaudited):
Enclosed is your semi-annual report for the period ended July 31, 2012. I encourage you to carefully review this report, which includes economic observations, your Trust’s performance data and highlights, schedule of investments, and financial statements. For the six months ended July 31, 2012, the total return of the Value Line Aggressive Income Trust was 4.20%, versus the 6.09% of the Barclays Capital Corporate High Yield Index(1), the benchmark for the Trust.
For the recent six-month period ending July 31, 2012, high yield securities registered strong gains. A combination of a healthy equity market and historically low rates among investment grade fixed income issues, drew investors to seek the higher yields of lower rated bonds. In addition, the low default rates of high yield issuers plus a slow, but stable economy added to the attractiveness of high yield bonds. Supporting this environment was the accommodative interest rate policy of the Federal Reserve Board, which announced that it would keep interest rates low into 2014. The Trust did generate solid gains for the period, although lagging its benchmark. The Trust emphasizes higher quality credits, B to BB+, and is underweight the lowest rated issues (CCC). We continue to focus our investments in the more liquid and stronger credits available in the high-yield sector. Since the lower-rated credits outperformed during the period, the Trust underperformed. Additionally, positions held in the energy and commodities sectors hurt the Trust’s performance and the Trust has since moved to an underweight position in commodities and reduced its position in the energy sector. A subpar U.S. economy, slowing global growth and continuing pressure from the European debt crisis, prompts us to maintain our higher quality portfolio.
Maximizing income remains the primary investment objective of the Trust.
We thank you for your continued investment with the Value Line Funds and remind you to visit www.vlfunds.com to see more about your Trust and the other Value Line Funds.
| Sincerely, | |
| /s/ Mitchell Appel | |
| Mitchell Appel, President | |
| /s/ Jeff Geffen | |
| Jeff Geffen, Portfolio Manager |
| (1) | The Barclays Capital U.S. Corporate High Yield Index is representative of the broad based fixed-income market. It includes non-investment grade corporate bonds. The returns for the Index do not reflect charges, expenses, or taxes, and it is not possible to directly invest in this unmanaged Index. |
| Past performance does not guarantee future results. Investment return and principal value of an investment can fluctuate so that an investor’s shares, when redeemed, may be worth more or less than their original cost; and that current performance may be lower or higher than the performance data quoted. Investors should carefully consider the investment objectives, risks, charges and expense of a fund. This and other important information about a fund is contained in the fund’s prospectus. A copy of our fund’s prospectus can be obtained by going to our website at www.vlfunds.com or calling 800.243.2729. |
2
Value Line Aggressive Income Trust
| Income Trust Shareholders |
Economic Highlights (unaudited)
The first half of 2012 saw a robust U.S. stock market, with the S&P 500 returning 9.49% through June 30, 2012. The Index showed additional strength in July, pushing year-to-date returns to 11.01%. The strength of the market was evident despite some strong headwinds, including a weakening outlook for global economic growth. Several members of the European Union continued to face a serious debt crisis including Greece, Portugal, Italy, and Spain. Tough austerity measures have been implemented but it is still unclear as to the timetable for the resolution of the debt crisis most severely affecting southern Europe.
At home, GDP grew 2.0% for the first quarter of the year, slowing to 1.5% for the second quarter. The second quarter slowdown was not surprising given that consumer spending has been weak, the government has been cutting spending, and hiring has been tepid. A sluggish labor market remains the primary stumbling block for the U.S. economy. Employment growth averaged 75,000 per month in the second quarter, down from a monthly average of 226,000 in the first quarter. The higher jobs number of the first quarter did allow for a modest improvement in the overall unemployment rate, dropping from 8.5% at year-end 2011 to 8.3% on July 31, 2012.
Consumer confidence unexpectedly rose in July after declining much of the year. Consumers expressed greater optimism about short-term business and employment prospects. Consumer spending got off to a firm start in the third quarter, rising by the most in five months. It is critical that consumers continue to spend as they account for 70% of economic activity.
The housing market has been a bit of a bright spot for the consumer, albeit in selective areas of the country. Home prices nationwide on a year-over-year basis in July 2012 compared to July 2011 had the biggest year-over-year increase since August 2006. While homebuilding is unlikely to take off until the unemployment rate recedes, a reduction in the supply of homes may pave the way for some continued firming of housing prices.
U.S. Treasury bond prices also defied those investors expecting a weakened performance after the U.S. government’s loss of it AAA rating last year from the Standard and Poor’s rating agency. The other major rating agencies, Moody’s and Fitch, maintained their AAA ratings for U.S. government debt. Many investors were drawn to the relative safety of U.S. Treasury bonds amidst the uncertainty of world economic events. While the 10-year U.S. Treasury bond hovered around a 2% yield in the first quarter, it had touched a 1.5% yield by June.
3
Value Line Aggressive Income Trust
TRUST EXPENSES (unaudited):
Example
As a shareholder of the Trust, you incur ongoing costs, including management fees, distribution and service (12b-1) fees, and other Trust expenses. This Example is intended to help you understand your ongoing costs (in dollars) of investing in the Trust and to compare these costs with the ongoing costs of investing in other mutual funds.
The Example is based on an investment of $1,000 invested at the beginning of the period and held for the entire period (February 1, 2012 through July 31, 2012).
Actual Expenses
The first line of the table below provides information about actual account values and actual expenses. You may use the information in this line, together with the amount you invested, to estimate the expenses that you paid over the period. Simply divide your account value by $1,000 (for example an $8,600 account value divided by $1,000 = 8.6), then multiply the result by the number in the first line under the heading “Expenses Paid During Period” to estimate the expenses you paid on your account during this period.
Hypothetical Example for Comparison Purposes
The second line of the table below provides information about hypothetical account values and hypothetical expenses based on the Trust’s actual expense ratio and an assumed rate of return of 5% per year before expenses, which is not the Trust’s actual return. The hypothetical account values and expenses may not be used to estimate the actual ending account balance or expenses you paid for the period. You may use this information to compare the ongoing costs of investing in the Trust and other funds. To do so, compare this 5% hypothetical example with the 5% hypothetical examples that appear in the shareholder reports of other funds.
Please note that the expenses shown in the table are meant to highlight your ongoing costs only and do not reflect any transactional costs, such as sales charges (loads), redemption fees, or exchange fees. Therefore, the table is useful in comparing ongoing costs only and will not help you determine the relative total costs of owning different funds. In addition, if transactional costs were included, your costs would have been higher.
Beginning account value 2/1/12 | Ending account value 7/31/12 | Expenses paid during period 2/1/12 thru 7/31/12* | ||||||||
| Actual | $ | 1,000.00 | $ | 1,042.01 | $ | 6.46 | ||||
| Hypothetical (5% return before expenses) | $ | 1,000.00 | $ | 1,018.54 | $ | 6.39 | ||||
| * | Expenses are equal to the Trust’s annualized expense ratio of 1.27% multiplied by the average account value over the period, multiplied by 182/366 to reflect the one-half year period. This expense ratio may differ from the expense ratio shown in the Financial Highlights. |
4
Value Line Aggressive Income Trust
| Portfolio Highlights at July 31, 2012 (unaudited) |
Ten Largest Holdings
| Issue | Principal Amount | Value | Percentage of Net Assets | |||||||
| Briggs & Stratton Corp., Guaranteed Notes, 6.88%, 12/15/20 | $ | 500,000 | $ | 535,000 | 1.7% | |||||
| Ball Corp., Guaranteed Notes, 5.00%, 3/15/22 | 500,000 | 528,750 | 1.7% | |||||||
| Ally Financial, Inc., Guaranteed Notes, 8.00%, 3/15/20 | 400,000 | 475,500 | 1.5% | |||||||
| Constellation Brands, Inc., Guaranteed Notes, 6.00%, 5/1/22 | 400,000 | 441,500 | 1.4% | |||||||
| Peabody Energy Corp., Guaranteed Notes, 7.38%, 11/1/16 | 400,000 | 440,000 | 1.4% | |||||||
| Hertz Corp. (The), Guaranteed Notes, 7.38%, 1/15/21 | 400,000 | 431,500 | 1.4% | |||||||
| Plains Exploration & Production Co., Guaranteed Notes, 6.63%, 5/1/21 | 400,000 | 424,000 | 1.4% | |||||||
| Terex Corp., Senior Subordinated Notes, 8.00%, 11/15/17 | 400,000 | 421,000 | 1.3% | |||||||
| Bausch & Lomb, Inc., Senior Unsecured Notes, 9.88%, 11/1/15 | 400,000 | 417,500 | 1.3% | |||||||
| Cie Generale de Geophysique-Veritas, Guaranteed Notes, 7.75%, 5/15/17 | 400,000 | 416,500 | 1.3% | |||||||
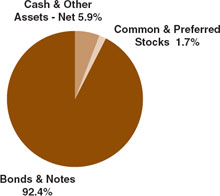
| Asset Allocation – Percentage of Total Net Assets | ||||||||||
| Sector Weightings – Percentage of Total Investment Securities* |
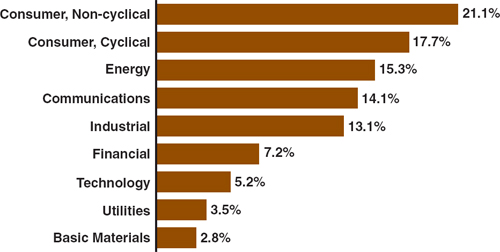
| * | Sector weightings exclude short-term investments and collateral for securities on loan. |
5
| Value Line Aggressive Income Trust | |
| Schedule of Investments (unaudited) | July 31, 2012 |
Principal Amount | Value | ||||||
| CORPORATE BONDS & NOTES (90.7%) | |||||||
| BASIC MATERIALS (2.6%) | |||||||
| $ | 200,000 | AK Steel Corp., Guaranteed | |||||
| Notes, 7.63%, 5/15/20 (1) | $ | 169,000 | |||||
| 250,000 | FMG Resources Pty Ltd., | ||||||
| Guaranteed Notes, 7.00%, | |||||||
| 11/1/15 (1) (2) | 256,250 | ||||||
| 400,000 | United States Steel Corp., Senior | ||||||
| Unsecured Notes, 6.05%, | |||||||
| 6/1/17 (1) | 398,000 | ||||||
| 823,250 | |||||||
| COMMUNICATIONS (12.2%) | |||||||
| 250,000 | Cablevision Systems Corp., | ||||||
| Senior Unsecured Notes, | |||||||
| 7.75%, 4/15/18 | 271,875 | ||||||
| 200,000 | CenturyLink, Inc., Series T, | ||||||
| Senior Unsecured Notes, | |||||||
| 5.80%, 3/15/22 | 212,242 | ||||||
| 250,000 | Cincinnati Bell, Inc., Guaranteed | ||||||
| Notes, 8.38%, 10/15/20 | 260,625 | ||||||
| 300,000 | Crown Castle International | ||||||
| Corp., Senior Unsecured | |||||||
| Notes, 9.00%, 1/15/15 | 327,187 | ||||||
| 300,000 | DISH DBS Corp., Guaranteed | ||||||
| Notes, 7.13%, 2/1/16 | 331,125 | ||||||
| 200,000 | DISH DBS Corp., Guaranteed | ||||||
| Notes, 6.75%, 6/1/21 | 218,750 | ||||||
| 150,000 | Frontier Communications Corp., | ||||||
| Senior Unsecured Notes, | |||||||
| 8.50%, 4/15/20 (1) | 162,375 | ||||||
| 150,000 | Intelsat Jackson Holdings SA, | ||||||
| Guaranteed Notes, 7.50%, | |||||||
| 4/1/21 | 160,500 | ||||||
| 350,000 | MetroPCS Wireless, Inc., | ||||||
| Guaranteed Notes, 6.63%, | |||||||
| 11/15/20 | 353,500 | ||||||
| 250,000 | Nielsen Finance LLC / Nielsen | ||||||
| Finance Co., Guaranteed | |||||||
| Notes, 7.75%, 10/15/18 | 281,250 | ||||||
| 150,000 | NII Capital Corp., Guaranteed | ||||||
| Notes, 7.63%, 4/1/21 | 114,750 | ||||||
| 350,000 | Sprint Capital Corp., Guaranteed | ||||||
| Notes, 8.75%, 3/15/32 | 348,250 | ||||||
Principal Amount | Value | ||||||
| $ | 400,000 | Virgin Media Finance PLC, | |||||
| Guaranteed Notes, 5.25%, | |||||||
| 2/15/22 (1) | $ | 414,000 | |||||
| 200,000 | Wind Acquisition Finance SA, | ||||||
| Secured Notes, 11.75%, | |||||||
| 7/15/17 (2) | 166,000 | ||||||
| 200,000 | Windstream Corp., Guaranteed | ||||||
| Notes, 7.50%, 6/1/22 | 209,000 | ||||||
| 3,831,429 | |||||||
| CONSUMER, CYCLICAL (16.3%) | |||||||
| 200,000 | American Axle & Manufacturing, | ||||||
| Inc., Guaranteed Notes, 7.88%, | |||||||
| 3/1/17 (1) | 207,500 | ||||||
| 200,000 | Boyd Gaming Corp., Senior | ||||||
| Subordinated Notes, 6.75%, | |||||||
| 4/15/14 | 199,750 | ||||||
| 250,000 | Chrysler Group LLC / | ||||||
| CG Co-Issuer, Inc., Secured | |||||||
| Notes, 8.00%, 6/15/19 (1) | 260,000 | ||||||
| 250,000 | Cooper Tire & Rubber Co., | ||||||
| Senior Unsecured Notes, | |||||||
| 7.63%, 3/15/27 | 246,562 | ||||||
| 300,000 | Dana Holding Corp., Senior | ||||||
| Unsecured Notes, 6.50%, | |||||||
| 2/15/19 | 318,375 | ||||||
| 250,000 | Ford Motor Co., Senior | ||||||
| Unsecured Notes, 7.45%, | |||||||
| 7/16/31 | 310,312 | ||||||
| 350,000 | Goodyear Tire & Rubber Co. | ||||||
| (The), Guaranteed Notes, | |||||||
| 8.25%, 8/15/20 (1) | 381,500 | ||||||
| 150,000 | Gymboree Corp., Guaranteed | ||||||
| Notes, 9.13%, 12/1/18 (1) | 140,063 | ||||||
| 300,000 | Hanesbrands, Inc., Guaranteed | ||||||
| Notes, 6.38%, 12/15/20 | 320,625 | ||||||
| 315,000 | Lear Corp., Guaranteed Notes, | ||||||
| 7.88%, 3/15/18 | 344,531 | ||||||
| 115,000 | Lennar Corp., Series B, | ||||||
| Guaranteed Notes, 6.50%, | |||||||
| 4/15/16 | 122,763 | ||||||
| 200,000 | Macy’s Retail Holdings, Inc., | ||||||
| Guaranteed Notes, 8.13%, | |||||||
| 8/15/35 | 219,210 | ||||||
| 100,000 | McJunkin Red Man Corp., | ||||||
| Senior Secured Notes, | |||||||
| 9.50%, 12/15/16 | 108,250 | ||||||
See Notes to Financial Statements.
6
| Value Line Aggressive Income Trust |
| July 31, 2012 |
Principal Amount | Value | ||||||
| $ | 300,000 | Meritor, Inc., Guaranteed Notes, | |||||
| 8.13%, 9/15/15 (1) | $ | 307,875 | |||||
| 300,000 | MGM Resorts International, | ||||||
| Guaranteed Notes, 7.75%, | |||||||
| 3/15/22 (1) | 300,750 | ||||||
| 200,000 | Navistar International Corp., | ||||||
| Guaranteed Notes, 8.25%, | |||||||
| 11/1/21 (1) | 187,500 | ||||||
| 300,000 | PEP Boys-Manny, Moe & Jack | ||||||
| (The), Guaranteed Notes, | |||||||
| 7.50%, 12/15/14 | 303,753 | ||||||
| 150,000 | Rite Aid Corp., Senior Secured | ||||||
| Notes, 9.75%, 6/12/16 | 165,375 | ||||||
| 300,000 | Royal Caribbean Cruises Ltd., | ||||||
| Senior Unsecured Notes, | |||||||
| 7.50%, 10/15/27 | 304,125 | ||||||
| 140,000 | Scientific Games Corp., | ||||||
| Guaranteed Notes, 8.13%, | |||||||
| 9/15/18 | 151,900 | ||||||
| 200,000 | Wynn Las Vegas LLC / Wynn | ||||||
| Las Vegas Capital Corp., | |||||||
| 7.75%, 8/15/20 | 222,000 | ||||||
| 5,122,719 | |||||||
CONSUMER, NON-CYCLICAL (19.6%) | |||||||
| 350,000 | Alere, Inc., Guaranteed Notes, | ||||||
| 9.00%, 5/15/16 | 363,125 | ||||||
| 150,000 | American Greetings Corp., | ||||||
| Guaranteed Notes, 7.38%, | |||||||
| 12/1/21 | 159,000 | ||||||
| 250,000 | Avis Budget Car Rental LLC / | ||||||
| Avis Budget Finance, Inc., | |||||||
| Guaranteed Notes, 8.25%, | |||||||
| 1/15/19 | 268,437 | ||||||
| 400,000 | Bausch & Lomb, Inc., Senior | ||||||
| Unsecured Notes, 9.88%, | |||||||
| 11/1/15 | 417,500 | ||||||
| 204,000 | Chiquita Brands International, | ||||||
| Inc., Senior Unsecured Notes, | |||||||
| 7.50%, 11/1/14 | 199,920 | ||||||
| 150,000 | CHS / Community Health | ||||||
| Systems, Inc., Guaranteed | |||||||
| Notes, 7.13%, 7/15/20 | 157,125 | ||||||
| 400,000 | Constellation Brands, Inc., | ||||||
| Guaranteed Notes, 6.00%, | |||||||
| 5/1/22 | 441,500 | ||||||
Principal Amount | Value | ||||||
| $ | 100,000 | CoreLogic, Inc., Guaranteed | |||||
| Notes, 7.25%, 6/1/21 | $ | 107,250 | |||||
| 77,000 | DaVita, Inc., Guaranteed | ||||||
| Notes, 6.63%, 11/1/20 | 81,620 | ||||||
| 300,000 | Dean Foods Co., Guaranteed | ||||||
| Notes, 7.00%, 6/1/16 (1) | 309,000 | ||||||
| 150,000 | Del Monte Corp., Guaranteed | ||||||
| Notes, 7.63%, 2/15/19 | 148,875 | ||||||
| 300,000 | Deluxe Corp., Guaranteed Notes, | ||||||
| 7.00%, 3/15/19 | 315,750 | ||||||
| 200,000 | Fresenius Medical Care US | ||||||
| Finance II, Inc., Guaranteed | |||||||
| Notes, 5.88%, 1/31/22 (2) | 213,750 | ||||||
| 175,000 | Harland Clarke Holdings Corp., | ||||||
| Guaranteed Notes, 9.50%, | |||||||
| 5/15/15 | 153,125 | ||||||
| 250,000 | HCA, Inc., Senior Unsecured | ||||||
| Notes, 6.50%, 2/15/16 | 273,125 | ||||||
| 400,000 | Hertz Corp. (The), Guaranteed | ||||||
| Notes, 7.38%, 1/15/21 | 431,500 | ||||||
| 200,000 | Jarden Corp., Guaranteed Notes, | ||||||
| 6.13%, 11/15/22 | 214,250 | ||||||
| 150,000 | Kinetic Concepts, Inc. / KCI | ||||||
| USA, Inc., Guaranteed | |||||||
| Notes, 10.50%, 11/1/18 (2) | 158,625 | ||||||
| 250,000 | R.R. Donnelley & Sons Co., | ||||||
| Senior Unsecured Notes, | |||||||
| 7.25%, 5/15/18 (1) | 247,500 | ||||||
| 300,000 | Reynolds Group Issuer, Inc. / | ||||||
| Reynolds Group Issuer LLC, | |||||||
| Guaranteed Notes, 8.50%, | |||||||
| 5/15/18 | 302,250 | ||||||
| 200,000 | ServiceMaster Co., Guaranteed | ||||||
| Notes, 8.00%, 2/15/20 | 221,750 | ||||||
| 200,000 | Spectrum Brands, Inc., | ||||||
| Guaranteed Notes, 6.75%, | |||||||
| 3/15/20 (2) | 209,000 | ||||||
| 150,000 | United Rentals North America, | ||||||
| Inc., Guaranteed Notes, | |||||||
| 8.38%, 9/15/20 (1) | 159,000 | ||||||
| 100,000 | UR Merger Sub Corp., | ||||||
| Guaranteed Notes, 7.63%, | |||||||
| 4/15/22 (2) | 106,375 | ||||||
| 250,000 | Valeant Pharmaceuticals | ||||||
| International, Guaranteed | |||||||
| Notes, 6.75%, 8/15/21 (1) (2) | 253,125 | ||||||
See Notes to Financial Statements.
7
| Value Line Aggressive Income Trust |
| Schedule of Investments (unaudited) |
Principal Amount | Value | ||||||
| $ | 150,000 | Vanguard Health Holding Co. | |||||
| II LLC / Vanguard Holding | |||||||
| Co. II, Inc., Guaranteed Notes, | |||||||
| 7.75%, 2/1/19 | $ | 156,000 | |||||
| 100,000 | Warner Chilcott Co. LLC / | ||||||
| Warner Chilcott Finance LLC, | |||||||
| Guaranteed Notes, 7.75%, | |||||||
| 9/15/18 | 108,125 | ||||||
| 6,176,602 | |||||||
| ENERGY (14.2%) | |||||||
| 175,000 | Atlas Pipeline Partners L.P., | ||||||
| Guaranteed Notes, 8.75%, | |||||||
| 6/15/18 | 187,688 | ||||||
| 350,000 | Bill Barrett Corp., Guaranteed | ||||||
| Notes, 7.63%, 10/1/19 | 363,125 | ||||||
| 400,000 | Cie Generale de Geophysique- | ||||||
| Veritas, Guaranteed Notes, | |||||||
| 7.75%, 5/15/17 | 416,500 | ||||||
| 250,000 | CONSOL Energy, Inc., | ||||||
| Guaranteed Notes, 8.25%, | |||||||
| 4/1/20 | 265,625 | ||||||
| 150,000 | Energy Transfer Equity L.P., | ||||||
| Senior Secured Notes, 7.50%, | |||||||
| 10/15/20 | 171,375 | ||||||
| 150,000 | Energy XXI Gulf Coast, Inc., | ||||||
| Guaranteed Notes, 7.75%, | |||||||
| 6/15/19 | 157,500 | ||||||
| 350,000 | Forest Oil Corp., Guaranteed | ||||||
| Notes, 7.25%, 6/15/19 (1) | 337,750 | ||||||
| 300,000 | Frontier Oil Corp., Guaranteed | ||||||
| Notes, 8.50%, 9/15/16 | 315,000 | ||||||
| 250,000 | Linn Energy LLC / Linn Energy | ||||||
| Finance Corp., Guaranteed | |||||||
| Notes, 7.75%, 2/1/21 | 263,750 | ||||||
| 300,000 | McMoRan Exploration Co., | ||||||
| Guaranteed Notes, 11.88%, | |||||||
| 11/15/14 | 312,750 | ||||||
| 400,000 | Peabody Energy Corp., | ||||||
| Guaranteed Notes, 7.38%, | |||||||
| 11/1/16 | 440,000 | ||||||
| 400,000 | Plains Exploration & | ||||||
| Production Co., Guaranteed | |||||||
| Notes, 6.63%, 5/1/21 | 424,000 | ||||||
| 150,000 | Samson Investment Co., Senior | ||||||
| Unsecured Notes, 9.75%, | |||||||
| 2/15/20 (2) | 155,625 | ||||||
Principal Amount | Value | ||||||
| $ | 250,000 | SandRidge Energy, Inc., | |||||
| Guaranteed Notes, 8.00%, | |||||||
| 6/1/18 (2) | $ | 260,000 | |||||
| 250,000 | SM Energy Co., Senior | ||||||
| Unsecured Notes, 6.63%, | |||||||
| 2/15/19 | 258,750 | ||||||
| 150,000 | Targa Resources Partners L.P. / | ||||||
| Targa Resources Partners | |||||||
| Finance Corp., Guaranteed | |||||||
| Notes, 6.38%, 8/1/22 (2) | 153,750 | ||||||
| 4,483,188 | |||||||
| FINANCIAL (5.5%) | |||||||
| 150,000 | Aircastle Ltd., Senior Unsecured | ||||||
| Notes, 7.63%, 4/15/20 | 160,500 | ||||||
| 400,000 | Ally Financial, Inc., Guaranteed | ||||||
| Notes, 8.00%, 3/15/20 | 475,500 | ||||||
| 135,000 | Citigroup Capital III, Guaranteed | ||||||
| Notes, 7.63%, 12/1/36 | 147,287 | ||||||
| 250,000 | Icahn Enterprises L.P. / Icahn | ||||||
| Enterprises Finance Corp., | |||||||
| Guaranteed Notes, 8.00%, | |||||||
| 1/15/18 | 265,625 | ||||||
| 250,000 | International Lease Finance | ||||||
| Corp., Senior Unsecured | |||||||
| Notes, 8.25%, 12/15/20 (1) | 293,125 | ||||||
| 250,000 | LBG Capital No.1 PLC, | ||||||
| Guaranteed Notes, 7.88%, | |||||||
| 11/1/20 (2) | 235,938 | ||||||
| 200,000 | SLM Corp., Senior Unsecured | ||||||
| Notes, 5.63%, 8/1/33 | 174,500 | ||||||
| 1,752,475 | |||||||
| INDUSTRIAL (12.4%) | |||||||
| 350,000 | Alliant Techsystems, Inc., | ||||||
| Guaranteed Notes, 6.88%, | |||||||
| 9/15/20 (1) | 376,250 | ||||||
| 500,000 | Ball Corp., Guaranteed Notes, | ||||||
| 5.00%, 3/15/22 | 528,750 | ||||||
| 200,000 | Bombardier, Inc., Senior | ||||||
| Unsecured Notes, 5.75%, | |||||||
| 3/15/22 (2) | 201,000 | ||||||
| 500,000 | Briggs & Stratton Corp., | ||||||
| Guaranteed Notes, 6.88%, | |||||||
| 12/15/20 | 535,000 | ||||||
| 260,000 | Covanta Holding Corp., Senior | ||||||
| Unsecured Notes, 7.25%, | |||||||
| 12/1/20 | 285,363 | ||||||
See Notes to Financial Statements.
8
| Value Line Aggressive Income Trust |
| July 31, 2012 |
Principal Amount | Value | ||||||
| $ | 200,000 | Crown Americas LLC / Crown | |||||
| Americas Capital Corp. III, | |||||||
| Guaranteed Notes, 6.25%, | |||||||
| 2/1/21 | $ | 221,000 | |||||
| 400,000 | General Cable Corp., Guaranteed | ||||||
| Notes, 7.13%, 4/1/17 | 412,000 | ||||||
| 200,000 | Masco Corp., Senior Unsecured | ||||||
| Notes, 7.13%, 3/15/20 | 223,418 | ||||||
| 135,000 | Navios Maritime Holdings, Inc. / | ||||||
| Navios Maritime Finance | |||||||
| US, Inc., Senior Secured | |||||||
| Notes, 8.88%, 11/1/17 | 136,350 | ||||||
| 400,000 | Terex Corp., Senior Subordinated | ||||||
| Notes, 8.00%, 11/15/17 (1) | 421,000 | ||||||
| 150,000 | TransDigm, Inc., Guaranteed | ||||||
| Notes, 7.75%, 12/15/18 | 167,250 | ||||||
| 400,000 | USG Corp., Senior Unsecured | ||||||
| Notes, 6.30%, 11/15/16 | 389,500 | ||||||
| 3,896,881 | |||||||
| TECHNOLOGY (3.3%) | |||||||
| 250,000 | Advanced Micro Devices, Inc., | ||||||
| Senior Unsecured Notes, | |||||||
| 8.13%, 12/15/17 | 263,125 | ||||||
| 81,000 | Broadridge Financial Solutions, | ||||||
| Inc., Senior Unsecured Notes, | |||||||
| 6.13%, 6/1/17 | 87,023 | ||||||
| 350,000 | First Data Corp., Guaranteed | ||||||
| Notes, 9.88%, 9/24/15 (1) | 355,250 | ||||||
| 300,000 | Seagate Technology HDD | ||||||
| Holdings, Guaranteed Notes, | |||||||
| 6.80%, 10/1/16 | 333,750 | ||||||
| 1,039,148 | |||||||
| UTILITIES (4.6%) | |||||||
| 350,000 | AES Corp. (The), Senior | ||||||
| Unsecured Notes, 8.00%, | |||||||
| 10/15/17 | 406,875 | ||||||
| 300,000 | Calpine Corp., Senior Secured | ||||||
| Notes, 7.88%, 1/15/23 (2) | 341,250 | ||||||
| 350,000 | GenOn Energy, Inc., Senior | ||||||
| Unsecured Notes, 7.63%, | |||||||
| 6/15/14 | 372,750 | ||||||
| 300,000 | NRG Energy, Inc., Guaranteed | ||||||
| Notes, 8.50%, 6/15/19 (1) | 321,000 | ||||||
| 1,441,875 | |||||||
Principal Amount | Value | ||||||
| TOTAL CORPORATE BONDS | |||||||
| & NOTES | |||||||
| (Cost $27,367,682) (90.7%) | $ | 28,567,567 | |||||
| CONVERTIBLE CORPORATE BONDS & NOTES (1.7%) | |||||||
| COMMUNICATIONS (1.1%) | |||||||
| $ | 100,000 | Anixter International, Inc., | |||||
| Senior Unsecured Notes, | |||||||
| 1.00%, 2/15/13 | 110,000 | ||||||
| 250,000 | Leap Wireless International, | ||||||
| Inc., Senior Unsecured Notes, | |||||||
| 4.50%, 7/15/14 | 235,000 | ||||||
| 345,000 | |||||||
| CONSUMER, CYCLICAL (0.3%) | |||||||
| 100,000 | Group 1 Automotive, Inc., | ||||||
| Senior Unsecured Notes, | |||||||
| 2.25%, 6/15/36 (3) | 110,000 | ||||||
| CONSUMER, NON-CYCLICAL (0.3%) | |||||||
| 89,000 | Omnicare, Inc., Guaranteed | ||||||
| Notes, 3.25%, 12/15/35 | 85,551 | ||||||
| TOTAL CONVERTIBLE | |||||||
| CORPORATE BONDS & | |||||||
| NOTES | |||||||
| (Cost $517,681) (1.7%) | 540,551 | ||||||
| Shares | Value | ||||||
| CONVERTIBLE PREFERRED STOCKS (1.1%) | |||||||
| ENERGY (0.1%) | |||||||
| 1,000 | Apache Corp., Convertible Fixed, | ||||||
| Series D, 6.00% (1) | 48,570 | ||||||
| FINANCIAL (1.0%) | |||||||
| 2,000 | Hartford Financial Services | ||||||
| Group, Inc. (The), Series F, | |||||||
| 7.25% (1) | 35,160 | ||||||
| 3,000 | Wintrust Financial Corp., | ||||||
| 7.50% | 166,358 | ||||||
| 100 | Bank of America Corp., | ||||||
| Series L, 7.25% (1) | 101,700 | ||||||
| 303,218 | |||||||
| TOTAL CONVERTIBLE | |||||||
| PREFERRED STOCKS | |||||||
| (Cost $373,586) (1.1%) | 351,788 | ||||||
See Notes to Financial Statements.
9
| Value Line Aggressive Income Trust |
| Schedule of Investments (unaudited) |
| Shares | Value | ||||||
| COMMON STOCKS (0.6%) | |||||||
| FINANCIALS (0.3%) | |||||||
| 3,000 | Hospitality Properties Trust | ||||||
| REIT | $ | 72,810 | |||||
| UTILITIES (0.3%) | |||||||
| 2,000 | FirstEnergy Corp. | 100,440 | |||||
| TOTAL COMMON STOCKS | |||||||
| (Cost $141,751) (0.6%) | 173,250 | ||||||
Principal Amount | Value | ||||||
| SHORT-TERM INVESTMENTS (4.1%) | |||||||
| REPURCHASE AGREEMENTS (4.1%) | |||||||
| $ | 1,300,000 | With Morgan Stanley, 0.15%, | |||||
| dated 07/31/12, due 08/01/12, | |||||||
| delivery value $1,300,005 | |||||||
| (collateralized by $1,150,000 | |||||||
| U.S. Treasury Notes 3.1250% | |||||||
| due 05/15/21, with a value of | |||||||
| $1,334,602) | 1,300,000 | ||||||
| TOTAL SHORT-TERM | |||||||
| INVESTMENTS | |||||||
| (Cost $1,300,000) (4.1%) | 1,300,000 | ||||||
| Shares | Value | ||||||
| COLLATERAL FOR SECURITIES ON LOAN (20.4%) | |||||||
| 6,415,067 | Value Line Funds Collateral | ||||||
| Account | 6,415,067 | ||||||
| TOTAL COLLATERAL FOR | |||||||
| SECURITIES ON LOAN | |||||||
| (Cost $6,415,067) (20.4%) | 6,415,067 | ||||||
| Value | |||||
| TOTAL INVESTMENT | |||||
| SECURITIES (118.6%) | |||||
| (Cost $36,115,767) | $ | 37,348,223 | |||
| EXCESS OF LIABILITIES OVER | |||||
| CASH AND OTHER ASSETS | |||||
| (-18.6%) | (5,855,211 | ) | |||
| NET ASSETS (100%) | $ | 31,493,012 | |||
| NET ASSET VALUE OFFERING AND | |||||
| REDEMPTION PRICE, PER | |||||
| OUTSTANDING SHARE | |||||
| ($31,493,012 ÷ 6,325,450 shares | |||||
| outstanding) | $ | 4.98 | |||
| (1) | A portion or all of the security was held on loan. As of July 31, 2012, the market value of the securities on loan was $6,301,974. |
| (2) | Pursuant to Rule 144A under the Securities Act of 1933, this security can only be sold to qualified institutional investors. |
| (3) | Step Bond - The rate shown is as of July 31, 2012 and will reset at a future date. |
| REIT | Real Estate Investment Trust. |
10
Value Line Aggressive Income Trust
Statement of Assets and Liabilities at July 31, 2012 (unaudited) | ||||
| Assets: | ||||
Investment securities, at value (Cost - $34,815,767) (securities on loan, at value, $6,301,974) | $ | 36,048,223 | ||
Repurchase agreement (Cost - $1,300,000) | 1,300,000 | |||
| Cash | 54,980 | |||
| Interest and dividends receivable | 557,312 | |||
| Receivable for securities sold | 37,267 | |||
| Prepaid expenses | 12,183 | |||
| Receivable for securities lending income | 3,277 | |||
| Receivable for trust shares sold | 205 | |||
| Other | 47 | |||
| Total Assets | 38,013,494 | |||
| Liabilities: | ||||
Payable upon return of collateral for securities on loan | 6,415,067 | |||
| Dividends payable to shareholders | 34,594 | |||
| Payable for trust shares redeemed | 30,174 | |||
| Accrued expenses: | ||||
| Advisory fee | 14,723 | |||
| Service and distribution plan fees | 4,026 | |||
| Other | 21,898 | |||
| Total Liabilities | 6,520,482 | |||
| Net Assets | $ | 31,493,012 | ||
| Net assets consist of: | ||||
Shares of beneficial interest, at $0.01 par value (authorized unlimited, outstanding 6,325,450 shares) | $ | 63,255 | ||
| Additional paid-in capital | 31,482,090 | |||
Distributions in excess of net investment income | (37,870 | ) | ||
Accumulated net realized loss on investments | (1,246,919 | ) | ||
Net unrealized appreciation of investments | 1,232,456 | |||
| Net Assets | $ | 31,493,012 | ||
Net Asset Value, Offering and Redemption Price per Outstanding Share ($31,493,012 ÷ 6,325,450 shares outstanding) | $ | 4.98 | ||
Statement of Operations for the Six Months Ended July 31, 2012 (unaudited) | ||||
| Investment Income: | ||||
| Interest | $ | 1,106,795 | ||
| Dividends | 17,267 | |||
| Securities lending income | 5,112 | |||
| Total Income | 1,129,174 | |||
| Expenses: | ||||
| Advisory fee | 118,628 | |||
| Service and distribution plan fees | 39,543 | |||
| Auditing and legal fees | 19,049 | |||
| Printing and postage | 18,332 | |||
| Transfer agent fees | 15,788 | |||
| Registration and filing fees | 15,064 | |||
| Custodian fees | 13,834 | |||
| Trustees’ fees and expenses | 3,313 | |||
| Insurance | 1,909 | |||
| Other | 3,453 | |||
Total Expenses Before Fees Waived and Custody Credits | 248,913 | |||
| Less: Advisory Fees Waived | (31,634 | ) | ||
Less: Service and Distribution Plan Fees Waived | (15,817 | ) | ||
| Less: Custody Credits | (215 | ) | ||
| Net Expenses | 201,247 | |||
| Net Investment Income | 927,927 | |||
Net Realized and Unrealized Gain/(Loss) on Investments: | ||||
| Net Realized Gain | 509,968 | |||
| Change in Net Unrealized | ||||
| Appreciation/(Depreciation) | (167,940 | ) | ||
Net Realized Gain and Change in Net Unrealized Appreciation/ (Depreciation) on Investments | 342,028 | |||
Net Increase in Net Assets from Operations | $ | 1,269,955 | ||
See Notes to Financial Statements.
11
Value Line Aggressive Income Trust
Statement of Changes in Net Assets for the Six Months Ended July 31, 2012 (unaudited) and for the Year Ended January 31, 2012 |
Six Months Ended July 31, 2012 (unaudited) | Year Ended January 31, 2012 | |||||||
| Operations: | ||||||||
| Net investment income | $ | 927,927 | $ | 1,950,280 | ||||
| Net realized gain on investments | 509,968 | 1,085,696 | ||||||
| Change in net unrealized appreciation/(depreciation) | (167,940 | ) | (1,326,754 | ) | ||||
| Net increase in net assets from operations | 1,269,955 | 1,709,222 | ||||||
| Distributions to Shareholders: | ||||||||
| Net investment income | (927,927 | ) | (1,950,884 | ) | ||||
| Trust Share Transactions: | ||||||||
| Proceeds from sale of shares | 1,037,581 | 2,010,996 | ||||||
| Proceeds from reinvestment of dividends to shareholders | 714,520 | 1,495,168 | ||||||
| Cost of shares redeemed* | (2,804,181 | ) | (5,946,471 | ) | ||||
| Net decrease in net assets from Trust share transactions | (1,052,080 | ) | (2,440,307 | ) | ||||
| Total Decrease in Net Assets | (710,052 | ) | (2,681,969 | ) | ||||
| Net Assets: | ||||||||
| Beginning of period | 32,203,064 | 34,885,033 | ||||||
| End of period | $ | 31,493,012 | $ | 32,203,064 | ||||
| Distributions in excess of net investment income, at end of period: | $ | (37,870 | ) | $ | (37,870 | ) | ||
| * | Net of redemption fees (see Note 1K and Note 2). |
See Notes to Financial Statements.
12
| Value Line Aggressive Income Trust |
| Notes to Financial Statements (unaudited) |
1. Significant Accounting Policies
Value Line Aggressive Income Trust (the “Trust”) is registered under the Investment Company Act of 1940, as amended, as a diversified, open-end management investment company. The primary investment objective of the Trust is to maximize current income through investment in a diversified portfolio of high-yield fixed-income securities. As a secondary investment objective, the Trust will seek capital appreciation, but only when consistent with its primary objective. Lower rated or unrated (i.e., high-yield) securities are more likely to react to developments affecting market risk (general market liquidity) and credit risk (issuers’ inability to meet principal and interest payments on their obligations) than are more highly rated securities, which react primarily to movements in the general level of interest rates. The ability of issuers of debt securities held by the Trust to meet their obligations may be affected by economic developments in a specific industry.
The following significant accounting policies are in conformity with generally accepted accounting principles for investment companies. Such policies are consistently followed by the Trust in the preparation of its financial statements. Generally accepted accounting principles require management to make estimates and assumptions that affect the reported amounts and disclosures in the financial statements. Actual results may differ from those estimates.
(A) Security Valuation: The Trustees have determined that the value of bonds and other fixed income corporate securities be calculated on the valuation date by reference to valuations obtained from an independent pricing service that determines valuations for normal institutional-size trading units of debt securities, without exclusive reliance upon quoted prices. This service takes into account appropriate factors such as institutional-size trading in similar groups of securities, yield, quality, coupon rate, maturity, type of issue, trading characteristics and other market data in determining valuations. Securities, other than bonds and other fixed income securities, not priced in this manner are valued at the midpoint between the latest available and representative bid and asked prices or, when stock valuations are used, at the latest quoted sale price as of the regular close of business of the New York Stock Exchange on the valuation date. Other assets and securities for which market valuations are not readily available are valued at their fair value as the Trustees may determine. In addition, the Trust may use the fair value of a security when the closing price on the primary exchange where the security is traded no longer reflects the value of a security due to factors affecting one or more relevant securities markets or the specific issuer. Short term instruments with maturities of 60 days or less, at the date of purchase, are valued at amortized cost which approximates market value.
(B) Fair Value Measurements: The Trust follows fair valuation accounting standards (FASB ASC 820-10) which establish a definition of fair value and set out a hierarchy for measuring fair value. These standards require additional disclosures about the various inputs and valuation techniques used to develop the measurements of fair value and a discussion of changes in valuation techniques and related inputs during the period. These inputs are summarized in the three broad levels listed below:
| • | Level 1– Inputs that reflect unadjusted quoted prices in active markets for identical assets or liabilities that the Trust has the ability to access at the measurement date; |
| • | Level 2 – Inputs other than quoted prices that are observable for the asset or liability either directly or indirectly, including inputs in markets that are not considered to be active; |
| • | Level 3 – Inputs that are unobservable. |
Transfers between investment levels may occur as the markets fluctuate and/or the availability of data used in an investment’s valuation changes. The inputs or methodologies used for valuing securities are not necessarily an indication of the risk associated with investing in those securities.
13
| Value Line Aggressive Income Trust |
| July 31, 2012 |
The following table summarizes the inputs used to value the Trust’s investments in securities as of July 31, 2012:
Investments in Securities: | Level 1 | Level 2 | Level 3 | Total | ||||||||||||
| Assets | ||||||||||||||||
Corporate Bonds & Notes | $ | 0 | $ | 28,567,567 | $ | 0 | $ | 28,567,567 | ||||||||
Convertible Corporate Bonds & Notes | 0 | 540,551 | 0 | 540,551 | ||||||||||||
Convertible Preferred Stocks | 351,788 | 0 | 0 | 351,788 | ||||||||||||
| Common Stocks | 173,250 | 0 | 0 | 173,250 | ||||||||||||
Short-Term Investments | 0 | 1,300,000 | 0 | 1,300,000 | ||||||||||||
Collateral for Securities on Loan | 0 | 6,415,067 | 0 | 6,415,067 | ||||||||||||
Total Investments in Securities | $ | 525,038 | $ | 36,823,185 | $ | 0 | $ | 37,348,223 | ||||||||
In May 2011, the Financial Accounting Standards Board (“FASB”) issued Accounting Standards Update No. 2011-04, “Fair Value Measurements and Disclosures (Topic 820) - Amendments to Achieve Common Fair Value Measurement and Disclosure Requirements in U.S. GAAP and IFRSs” (“ASU 2011-04”). ASU 2011-04 clarifies the application of existing fair value measurement requirements, changes in certain principles related to measuring fair value, and requires additional disclosures about fair value measurements.
Specifically, the guidance specifies that the concepts of highest and best use and valuation of premise in a fair value measurement are only relevant when measuring the fair value of nonfinancial assets whereas they are not relevant when measuring the fair value of financial assets and liabilities.
Required disclosures are expanded under the new guidance, especially for fair value measurements that are categorized within Level 3 of the fair value hierarchy, for which quantitative information about the unobservable inputs used, and a narrative description of the valuation processes in place and sensitivity of recurring Level 3 measurements to changes in unobservable inputs will be required. Entities will also be required to disclose the categorization by level of the fair value hierarchy for items that are not measured at fair value in the statement of financial position but for which the fair value is required to be disclosed.
ASU 2011-04 is effective for annual periods beginning after December 15, 2011 and is to be applied prospectively. The Trust is currently assessing the impact of this guidance on its financial statements.
The Trust follows the updated provisions surrounding fair value measurements and disclosures on transfers in and out of all levels of the fair value hierarchy on a gross basis and the reasons for the transfers as well as to disclosures about the valuation techniques and inputs used to measure fair value for investments that fall in either Level 2 or Level 3 of the fair value hierarchy.
For the six months ended July 31, 2012, there was no significant transfer activity between Level 1 and Level 2.
For the six months ended July 31, 2012, there were no Level 3 investments. The Schedule of Investments includes a breakdown of the Schedule’s investments by category.
(C) Repurchase Agreements: In connection with transactions in repurchase agreements, the Trust’s custodian takes possession of the underlying collateral securities, the value of which exceeds the principal amount of the repurchase transaction, including accrued interest. To the extent that any repurchase transaction exceeds one business day, it is the Trust’s policy to mark-to-market on a daily basis to ensure the adequacy of the collateral. In the event of default of the obligation to repurchase, the Trust has the right to liquidate the collateral and apply the proceeds in satisfaction of the obligation. Under certain circumstances, in the event of default or bankruptcy by the other party to the agreement, realization and/or retention of the collateral or proceeds may be subject to legal proceedings.
14
| Value Line Aggressive Income Trust |
| Notes to Financial Statements (unaudited) |
(D) Distributions: It is the policy of the Trust to distribute all of its net investment income to shareholders. Dividends from net investment income will be declared daily and paid monthly. Net realized capital gains, if any, are distributed to shareholders annually or more frequently if necessary to comply with the Internal Revenue Code. Income dividends and capital gains distributions are automatically reinvested in additional shares of the Trust unless the shareholder has requested otherwise. Income earned by the Trust on weekends, holidays and other days on which the Trust is closed for business is declared as a dividend on the next day on which the Trust is open for business.
(E) Federal Income Taxes: It is the Trust’s policy to comply with the requirements of the Internal Revenue Code applicable to regulated investment companies, including the distribution requirements of the Tax Reform Act of 1986, and to distribute all of its taxable income to its shareholders. Therefore, no federal income tax provision is required.
Management has analyzed the Trust’s tax positions taken on federal and state income tax returns for all open tax years (fiscal years ended January 31, 2009 through January 31, 2012), and has concluded that no provision for federal or state income tax is required in the Trust’s financial statements. The Trust’s federal and state income tax returns for tax years for which the applicable statutes of limitations have not expired are subject to examination by the Internal Revenue Service and state departments of revenue.
(F) Foreign Currency Translation: The books and records of the Trust are maintained in U.S. dollars. Assets and liabilities which are denominated in foreign currencies are translated to U.S. dollars at the prevailing rates of exchange. The Trust does not isolate changes in the value of investments caused by foreign exchange rate differences from the changes due to other circumstances.
Income and expenses are translated to U.S. dollars based upon the rates of exchange on the respective dates of such transactions.
Net realized foreign exchange gains or losses arise from currency fluctuations realized between the trade and settlement dates on securities transactions, the differences between the U.S. dollar amounts of dividends, interest, and foreign withholding taxes recorded by the Trust, and the U.S. dollar equivalent of the amounts actually received or paid. Net unrealized foreign exchange gains and losses arise from changes in the value of assets and liabilities, other than investments, at the end of the fiscal period, resulting from changes in the exchange rates. The effect of the change in foreign exchange rates on the value of investments is included in realized gain/loss on investments and change in net unrealized appreciation/(depreciation) on investments.
(G) Representations and Indemnifications: In the normal course of business, the Trust enters into contracts that contain a variety of representations and warranties which provide general indemnifications. The Trust’s maximum exposure under these arrangements is unknown, as this would involve future claims that may be made against the Trust that have not yet occurred. However, based on experience, the Trust expects the risk of loss to be remote.
(H) Security Transactions: Securities transactions are recorded on a trade date basis. Realized gains and losses from security transactions are recorded on the identified-cost basis. Interest income, adjusted for amortization of discount and premium, is earned from settlement date and recognized on the accrual basis. Dividend income is recorded on the ex-dividend date.
(I) Accounting for Real Estate Investment Trusts: The Trust owns shares of Real Estate Investment Trusts (“REITs”) which report information on the source of their distributions annually. Distributions received from REITs during the year which represent a return of capital are recorded as a reduction of cost and distributions which represent a capital gain dividend are recorded as a realized long-term capital gain on investments.
15
| Value Line Aggressive Income Trust |
| July 31, 2012 |
(J) Foreign Taxes: The Trust may be subject to foreign taxes on income, gains on investments, or currency repatriation, a portion of which may be recoverable. The Trust will accrue such taxes and recoveries as applicable, based upon its current interpretation of tax rules and regulations that exist in the markets in which it invests.
(K) Redemption Fees: The Trust charges a 2% redemption fee on shares held for less than 120 days. Such fees are retained by the Trust and accounted for as paid in capital.
(L) Securities Lending: Under an agreement with State Street Bank & Trust (“State Street”), the Trust can lend its securities to brokers, dealers and other financial institutions approved by the Board of Directors. By lending its investment securities, the Trust attempts to increase its net investment income through receipt of interest on the loan. Any gain or loss in the market price of the securities loaned that might occur and any interest or dividends declared during the term of the loan would accrue to the account of the Trust. Risks of delay in recovery of the securities or even loss of rights in the collateral may occur should the borrower of the securities fail financially. Generally, in the event of a counter-party default, the Trust has the right to use the collateral to offset the losses incurred.
Upon entering into a securities lending transaction, the Trust receives cash or other securities as collateral in an amount equal to or exceeding 102% of the current market value of the loaned securities. Any cash received as collateral is generally invested by State Street Global Advisors, acting in its capacity as securities lending agent (the “Agent”), in The Value Line Funds collateral account. A portion of the dividends received on the collateral is rebated to the borrower of the securities and the remainder is split between the Agent and the Trust.
As of July 31, 2012, the Trust loaned securities which were collateralized by cash. The value of the securities on loan and the value of the related collateral were as follows:
Value of Securities Loaned | Value of Cash Collateral | Total Collateral (including Calculated Mark) | ||
| $6,301,974 | $6,415,067 | $6,431,620 |
(M) Subsequent Events: Management has evaluated all subsequent transactions and events through the date on which these financial statements were issued, and except as already included in the notes to these financial statements, has determined that no additional items require disclosure.
2. Trust Share Transactions and Distributions to Shareholders
Transactions in shares of beneficial interest in the Trust were as follows:
Six Months Ended July 31, 2012 (unaudited) | Year Ended January 31, 2012 | |||||||
| Shares sold | 209,724 | 413,006 | ||||||
Shares issued to shareholders in reinvestment of dividends | 144,528 | 307,024 | ||||||
Shares redeemed | (570,542 | ) | (1,220,003 | ) | ||||
| Net decrease | (216,290 | ) | (499,973 | ) | ||||
Dividends per share from net investment income | $ | 0.1439 | $ | 0.2899 | ||||
Redemption fees of $560 and $1,747 were retained by the Trust for the six months ended July 31, 2012 and the year ended January 31, 2012, respectively.
16
| Value Line Aggressive Income Trust |
| Notes to Financial Statements (unaudited) |
3. Purchases and Sales of Securities
Purchases and sales of investment securities, excluding short-term securities, were as follows:
Six Months Ended July 31, 2012 (unaudited) | ||||
| Purchases: | ||||
| Investment Securities | $ | 6,023,877 | ||
| Sales: | ||||
| Investment Securities | $ | 7,560,258 | ||
4. Income Taxes
At July 31, 2012, information on the tax components of capital is as follows:
Cost of investments for tax purposes | $ | 36,115,767 | ||
| Gross tax unrealized appreciation | $ | 1,512,683 | ||
| Gross tax unrealized depreciation | (280,227 | ) | ||
Net tax unrealized appreciation on investments | $ | 1,232,456 |
5. Investment Advisory Fee, Service and Distribution Fees and Transactions With Affiliates
An advisory fee of $118,628 was paid or payable to EULAV Asset Management (the “Adviser”) for the six months ended July 31, 2012. This was computed at an annual rate of 0.75% on the first $100 million of the Trust’s average daily net assets during the period, and 0.50% on the average daily net assets in excess thereof prior to any fee waivers.
The Adviser provides research, investment programs, supervision of the investment portfolio and pays costs of administrative services and office space. The Adviser also provides persons, satisfactory to the Trust’s Trustees, to act as officers of the Trust and pays their salaries. Effective June 1, 2007 and 2008, the Adviser contractually agreed to reduce the Trust’s advisory fee by 0.40% for one year periods. Effective June 1, 2009, the Adviser contractually agreed to waive 0.30% of the advisory fee for a one year period. Effective June 1, 2010 through June 30, 2013, the Adviser contractually agreed to waive 0.20% of the advisory fee for a one year period. The fees waived amounted to $31,634 for the six months ended July 31, 2012. The Adviser has no right to recoup previously waived amounts.
The Trust has a Service and Distribution Plan (the “Plan”), adopted pursuant to Rule 12b-1 under the Investment Company Act of 1940, which compensates EULAV Securities LLC (the “Distributor”) for advertising, marketing and distributing the Trust’s shares and for servicing the Trust’s shareholders at an annual rate of 0.25% of the Trust’s average daily net assets. Fees amounting to $39,543 before fee waivers were accrued under the Plan for the six months ended July 31, 2012. Effective June 1, 2007 through June 30, 2013, the Distributor contractually agreed to reduce the 12b-1 fee by 0.10% for one year periods. The fees waived amounted to $15,817 for the six months ended July 31, 2012. The Distributor has no right to recoup previously waived amounts.
For the six months ended July 31, 2012, the Trust’s expenses were reduced by $215 under a custody credit arrangement with the custodian.
Direct expenses of the Trust are charged to the Trust while common expenses of the Value Line Funds are allocated proportionately based upon the Funds’ respective net assets. The Trust bears all other costs and expenses.
Certain officers and a Trustee of the Adviser are also officers and a Trustee of the Trust. At July 31, 2012, the officers and Trustee as a group owned 1,334 shares of beneficial interest in the Trust, representing less than 1% of the outstanding shares.
17
Value Line Aggressive Income Trust
| Financial Highlights |
Selected data for a share of beneficial interest outstanding throughout each period:
| Six Months Ended July 31, 2012 (unaudited) | ||||||||||||||||||||||||
| Years Ended January 31, | ||||||||||||||||||||||||
| 2012 | 2011 | 2010 | 2009 | 2008 | ||||||||||||||||||||
| Net asset value, beginning of period | $ | 4.92 | $ | 4.95 | $ | 4.70 | $ | 3.89 | $ | 4.83 | $ | 5.06 | ||||||||||||
| Income from investment operations: | ||||||||||||||||||||||||
| Net investment income | 0.14 | 0.29 | 0.30 | 0.28 | 0.32 | 0.34 | ||||||||||||||||||
Net gains or (losses) on securities (both realized and unrealized) | 0.06 | (0.03 | ) | 0.25 | 0.81 | (0.95 | ) | (0.23 | ) | |||||||||||||||
| Total from investment operations | 0.20 | 0.26 | 0.55 | 1.09 | (0.63 | ) | 0.11 | |||||||||||||||||
| Redemption fees | 0.00 | (1) | 0.00 | (1) | 0.00 | (1) | 0.00 | (1) | 0.00 | (1) | 0.00 | (1) | ||||||||||||
| Less distributions: | ||||||||||||||||||||||||
| Dividends from net investment income | (0.14 | ) | (0.29 | ) | (0.30 | ) | (0.28 | ) | (0.31 | ) | (0.34 | ) | ||||||||||||
| Net asset value, end of period | $ | 4.98 | $ | 4.92 | $ | 4.95 | $ | 4.70 | $ | 3.89 | $ | 4.83 | ||||||||||||
| Total return | 4.20 | %(2) | 5.48 | % | 12.01 | % | 28.92 | % | (13.42 | )% | 2.14 | % | ||||||||||||
| Ratios/Supplemental Data: | ||||||||||||||||||||||||
| Net assets, end of period (in thousands) | $ | 31,493 | $ | 32,203 | $ | 34,885 | $ | 37,787 | $ | 25,924 | $ | 32,459 | ||||||||||||
Ratio of expenses to average net assets(3) | 1.57 | %(4) | 1.55 | % | 1.48 | %(5) | 1.56 | % | 1.50 | % | 1.28 | % | ||||||||||||
Ratio of expenses to average net assets(6) | 1.27 | %(4) | 1.25 | % | 1.13 | %(7) | 1.13 | % | 0.98 | % | 0.77 | % | ||||||||||||
Ratio of net investment income to average net assets | 5.87 | %(4) | 5.95 | % | 6.20 | % | 6.51 | % | 7.17 | % | 6.76 | % | ||||||||||||
| Portfolio turnover rate | 20 | %(2) | 50 | % | 42 | % | 51 | % | 39 | % | 30 | % | ||||||||||||
| (1) | Amount is less than $.01 per share. |
| (2) | Not annualized. |
| (3) | Ratio reflects expenses grossed up for the custody credit arrangement and grossed up for the waiver of a portion of the advisory fee by the Adviser and a portion of the service and distribution plan fees by the Distributor. The ratio of expenses to average net assets, net of custody credits, but exclusive of the fee waivers would have been 1.48% for the year ended January 31, 2009, 1.27% for the year ended January 31, 2008 and would have been unchanged for the other periods shown. |
| (4) | Annualized. |
| (5) | Ratio reflects expenses grossed up for the reimbursement by Value Line, Inc. of certain expenses incurred by the Trust. |
| (6) | Ratio reflects expenses net of the custody credit arrangement and net of the waivers of a portion of the advisory fee by the Adviser and a portion of the service and distribution plan fees by the Distributor. |
| (7) | Ratio reflects expenses net of the reimbursement by Value Line, Inc. of certain expenses incurred by the Trust. |
See Notes to Financial Statements.
Semi-Annual Report
FACTORS CONSIDERED BY THE BOARD IN APPROVING CONTINUANCE OF
THE INVESTMENT ADVISORY AGREEMENT
FOR VALUE LINE AGGRESSIVE INCOME TRUST
The Investment Company Act of 1940 (the “1940 Act”) requires the Board of Trustees, including a majority of Trustees who are not “interested persons” of Value Line Aggressive Income Trust (the “Fund”), as that term is defined in the 1940 Act (the “Independent Trustees”), to annually consider the continuance of the Fund’s investment advisory agreement (“Agreement”) with its investment adviser, EULAV Asset Management.1
In considering whether the continuance of the Agreement was in the best interests of the Fund and its shareholders, the Board requested and the Adviser provided such information as the Board deemed to be reasonably necessary to evaluate the terms of the Agreement. At meetings held throughout the year, including the meeting specifically focused upon the review of the Agreement, the Independent Trustees met in executive sessions separately from the non-Independent Trustee of the Fund and any officers of the Adviser. In selecting the Adviser and approving the continuance of the Agreement, the Independent Trustees relied upon the assistance of counsel to the Independent Trustees.
Both in the meeting specifically focused upon the review of the Agreement and at other meetings, the Board, including the Independent Trustees, received materials relating to the Adviser’s investment and management services under the Agreement. These materials included information on: (i) the investment performance of the Fund, compared to a peer group of funds consisting of the Fund and all retail and institutional high yield funds, regardless of asset size or primary channel of distribution (the “Performance Universe”), and its benchmark index, each as classified and prepared by Lipper Inc., an independent evaluation service (“Lipper”); (ii) the investment process, portfolio holdings, investment restrictions, valuation procedures, and financial statements for the Fund; (iii) sales and redemption data with respect to the Fund; (iv) the general investment outlook in the markets in which the Fund invests; (v) arrangements with respect to the distribution of the Fund’s shares; (vi) the allocation and cost of the Fund’s brokerage (none of which was effected through any affiliate of the Adviser); and (vii) the overall nature, quality and extent of services provided by the Adviser.
1 For periods prior to December 23, 2010, the term “Adviser” means the Adviser’s predecessor entities that previously served as the Fund’s adviser, EULAV Asset Management, LLC and Value Line, Inc. (“VLI”). Likewise, for periods prior to December 23, 2010, the term “Distributor” refers to the predecessor entities of the Fund’s current distributor, EULAV Securities LLC (the “Distributor”), which included EULAV Securities, Inc. and Value Line Securities, Inc.
As part of their review, the Board requested, and the Adviser provided, additional information in order to evaluate the quality of the Adviser’s services and the reasonableness of its fees under the Agreement. In a separate executive session, the Independent Trustees reviewed information, which included data comparing: (i) the Fund’s management fee, transfer agent and custodian fees, 12b-1 fee, and other non-management expenses, to those incurred by a peer group of funds consisting of the Fund and 13 other high yield funds (excluding outliers), as selected objectively by Lipper (“Expense Group”), and a peer group of funds consisting of the Fund, the Expense Group and all other retail no-load high yield funds (excluding outliers), as selected objectively by Lipper (“Expense Universe”); (ii) the Fund’s expense ratio to those of its Expense Group and Expense Universe; and (iii) the Fund’s investment performance over various time periods to the average performance of the Performance Universe as well as the appropriate Lipper Index, as selected objectively by Lipper (the “Lipper Index”).
In the separate executive session, the Independent Trustees also reviewed information regarding: (a) the financial results and condition of the Adviser, and the Adviser’s and certain of its affiliates’ profitability from the services that have been performed for the Fund and the Value Line family of funds; (b) the Adviser’s investment management staffing and resources; (c) the ownership, control and day-to-day management of the Adviser, including representations of VLI that it does not “control” (as that term is defined in the 1940 Act) either the Adviser or Value Line Securities, Inc.; and (d) the Fund’s potential for achieving economies of scale. In support of its review of the statistical information, the Board was provided with a detailed description of the methodology used by Lipper to determine the Expense Group, the Expense Universe and the Performance Universe to prepare its information.
The following summarizes matters considered by the Board in connection with its continuance of the Agreement. However, the Board did not identify any single factor as all-important or controlling, and the summary does not detail all the matters that were considered.
Investment Performance. The Board reviewed the Fund’s overall investment performance and compared it to its Performance Universe and the Lipper Index. The Board noted that the Fund outperformed the Performance Universe average and the Lipper Index for the one-year period and five-year period ended March 31, 2012. The Board also noted that the Fund’s performance for the three-year and ten-year periods ended March 31, 2012 was below and, with respect to the ten-year period, slightly below the performance of both the Performance Universe average and the Lipper Index.
The Adviser’s Personnel and Methods. The Board reviewed the background of the portfolio manager responsible for the daily management of the Fund’s portfolio, seeking to achieve the Fund’s investment objective and adhering to the Fund’s investment strategies. The Independent Trustees also engaged in discussions with the Adviser’s senior management responsible for the overall functioning of the Fund’s investment operations. The Board viewed favorably (i) the Adviser’s use of analytic tools in support of the portfolio management, compliance and shareholder relation functions which the Adviser previously committed resources to acquire, (ii) continuity of the Adviser’s staff attributable in part to its actions previously taken to attract and retain personnel, including its prior improvements to employee benefit programs and increased base compensation and merit-based compensation for certain staff members to be more industry competitive, and (iii) that the Adviser continues to receive the Value Line ranking systems without cost. The Board concluded that the Fund’s management team and the Adviser’s overall resources were adequate and that the Adviser had investment management capabilities and personnel essential to performing its duties under the Agreement.
-2-
Management Fee and Expenses. The Board considered the Adviser’s management fee under the Agreement relative to the management fee applicable to the funds in the Expense Group and Expense Universe averages, both before and after applicable fee waivers. The Adviser and the Board agreed that the Adviser will extend the existing contractual waiver of a portion of the management fee for another one-year period ending June 30, 2013. This waiver is in an amount equal to 20 basis points on the first $100 million of the Fund’s average daily net assets so that the advisory fee rate payable by the Fund equals 55 basis points with respect to the first $100 million of the Fund’s average daily net assets. Such waiver cannot be changed during the contractual waiver period without the Board’s approval. Before giving effect to this fee waiver and fee waivers applicable to certain funds in the Expense Group, the Board noted that, for the most recent fiscal year for which audited financial data is available, the Fund’s management fee rate was higher than that of the Expense Group average. After giving effect to applicable fee waivers, the Board also noted that, for the most recent fiscal year for which audited financial data is available, the Fund’s management fee rate was lower than that of both the Expense Group average and the Expense Universe average. The Board concluded that the Fund’s management fee rate was satisfactory for the purpose of approving continuance of the Agreement.
The Board also considered the Fund’s total expense ratio relative to its Expense Group and Expense Universe averages. The Distributor and the Board agreed that the Distributor will extend the existing contractual waiver of a portion of the Rule 12b-1 fee for another one-year period ending June 30, 2013. This waiver effectively reduces the Fund’s Rule 12b-l fee rate from 0.25% to 0.15% of the Fund’s average daily net assets. Such waiver cannot be changed during the contractual waiver period without the Board’s approval. The Board noted that, for the most recent fiscal year for which audited financial data is available, the Fund’s expense ratio was higher than that of the Expense Group average and that of the Expense Universe average, after giving effect to fee waivers applicable to the Fund and certain funds in the Expense Group and Universe. The Board concluded that the average expense ratio was satisfactory for the purpose of approving continuance of the Agreement.
Nature, Extent and Quality of Services. The Board considered the nature, extent and quality of other services provided by the Adviser and the Distributor. At meetings held throughout the year, the Board reviewed the resources and effectiveness of the Adviser’s overall compliance program, as well as the services provided by the Distributor. The Board viewed favorably the additional resources devoted by the Adviser to enhance its and the Fund’s overall compliance program as well as steps being undertaken to enhance the shareholders’ experience with the Fund, such as a more robust website. The Board reviewed the services provided by the Adviser and its affiliates in supervising the Fund’s third party service providers. Based on this review, the Board concluded that the nature, quality, cost, and extent of such other services provided by the Adviser and its affiliates were satisfactory, reliable and beneficial to the Fund’s shareholders.
-3-
Profitability. The Board considered the level of profitability of the Adviser and its affiliates with respect to the Fund individually and in the aggregate for all the funds within the Value Line group of funds, including the impact of the restructuring and certain actions taken during prior years. These actions included the reduction (voluntary in some instances and contractual in other instances) of management and/or Rule 12b-1 fees for certain funds, the Adviser’s termination of the use of soft dollar research, and the cessation of trading through the Distributor. The Board also considered the Adviser’s continued attention to the rationalization and differentiation of funds within the Value Line group of funds to better identify opportunities for savings and efficiencies among the funds. The Board concluded that the profitability of the Adviser and its affiliates with respect to the Fund, including the financial results derived from the Fund’s Agreement, was within a range the Board considered reasonable.
Other Benefits. The Board also considered the character and amount of other direct and incidental benefits received by the Adviser and its affiliates from their association with the Fund. The Board concluded that potential “fall-out” benefits that the Adviser and its affiliates may receive, such as greater name recognition, appear to be reasonable, and may in some cases benefit the Fund.
Economies of Scale. The Board noted the Agreement includes a breakpoint applicable to the Adviser’s fee under which the first $100 million of the Fund’s average daily net assets are subject to a fee of 0.75% (0.55% after giving effect to the waiver) and any additional assets are subject to a fee of 0.50%. The Board considered that, given the current and anticipated size of the Fund, any perceived and potential economies of scale were not yet a significant consideration for the Fund and that the addition of more break points to the fee structure was not currently necessary.
Fees and Services Provided for Other Comparable Funds/Accounts Managed by the Adviser and its Affiliates. The Board was informed by the Adviser that the Adviser does not manage any non-mutual fund account that has similar objectives and policies as those of the Fund.
Conclusion. The Board examined the totality of the information it was provided at the meeting specifically addressing approval of the Agreement and at other meetings held during the past year and did not identify any single controlling factor. Based on its evaluation of all material factors deemed relevant and with the advice of independent counsel, the Board concluded that the rate at which the Fund pays a management fee to the Adviser under the Agreement does not constitute a fee that is so disproportionately large as to bear no reasonable relationship to the services rendered and that could not have been the product of arm’s-length bargaining. Further, the Board concluded that the Fund’s Agreement, and the management fee rate thereunder, is fair and reasonable and voted to continue the Agreement as in the best interest of the Fund and its shareholders.
-4-
Value Line Aggressive Income Trust
The Trust files its complete schedule of portfolio holdings with the Securities and Exchange Commission (“SEC”) for the first and third quarters of each fiscal year on Form N-Q. The Trust’s Forms N-Q are available on the SEC’s website at http://www.sec.gov and may be reviewed and copied at the SEC’s Public Reference Room in Washington, D.C. Information on the operation of the Public Reference Room may be obtained by calling 1-800-SEC-0330.
A description of the policies and procedures that the Trust uses to determine how to vote proxies relating to portfolio securities, and information regarding how the Trust voted these proxies for the 12-month period ended June 30 is available through the Trust’s website at http://www.vlfunds.com and on the SEC’s website at http://www.sec.gov. The description of the policies and procedures is also available without charge, upon request, by calling 1-800-243-2729.
Value Line Aggressive Income Trust
| Management of the Trust |
MANAGEMENT INFORMATION
The business and affairs of the Trust are managed by the Trust’s officers under the direction of the Board of Trustees. The following table sets forth information on each Trustee and Officer of the Trust. Each Trustee serves as a director or trustee of each of the 12 Value Line Funds. Each Trustee serves until his or her successor is elected and qualified.
| Name, Address, and YOB | Position | Length of Time Served | Principal Occupation During the Past 5 Years | Other Directorships Held by Trustee | ||||
| Interested Trustee* | ||||||||
Mitchell E. Appel YOB: 1970 | Trustee | Since 2010 | President of each of the Value Line Funds since June 2008; Chief Financial Officer of Value Line, Inc. (“Value Line”) from April 2008 to December 2010 and from September 2005 to November 2007; Director from February 2010 to December 2010; Chief Financial Officer of XTF Asset Management from November 2007 to April 2008; Chief Financial Officer of the Distributor since April 2008 and President since February 2009; President of the Adviser since February 2009, Trustee since December 2010 and Treasurer since January 2011. | None | ||||
| Non-Interested Trustees | ||||||||
Joyce E. Heinzerling 500 East 77th Street New York, NY 10162 YOB: 1956 | Trustee | Since 2008 | President, Meridian Fund Advisers LLC. (consultants) since April 2009; General Counsel, Archery Capital LLC (private investment fund) until April 2009. | Burnham Investors Trust, since 2004 (4 funds). | ||||
Francis C. Oakley 54 Scott Hill Road Williamstown, MA 01267 YOB: 1931 | Trustee | Since 2000 | Professor of History, Williams College, (1961-2002). Professor Emeritus since 2002; President Emeritus since 1994 and President, (1985-1994); Chairman (1993-1997) and Interim President (2002-2003) of the American Council of Learned Societies. Trustee since 1997 and Chairman of the Board since 2005, National Humanities Center. | None | ||||
David H. Porter 5 Birch Run Drive Saratoga Springs, NY 12866 YOB: 1935 | Trustee | Since 1997 | Professor, Skidmore College since 2008; Visiting Professor of Classics, Williams College, (1999-2008); President Emeritus, Skidmore College since 1999 and President, (1987-1998). | None |
20
Value Line Aggressive Income Trust
| Management of the Trust |
| Name, Address, and YOB | Position | Length of Time Served | Principal Occupation During the Past 5 Years | Other Directorships Held by Trustee | ||||
Paul Craig Roberts 169 Pompano St. Panama City Beach, FL 32413 YOB: 1939 | Trustee | Since 1986 | Chairman, Institute for Political Economy. | None | ||||
Nancy-Beth Sheerr 1409 Beaumont Drive Gladwyne, PA 19035 YOB: 1949 | Trustee | Since 1996 | Senior Financial Adviser, Veritable L.P. (Investment Adviser). | None | ||||
Daniel S. Vandivort 59 Indian Head Road Riverside, CT 06878 YOB: 1954 | Trustee (Lead Independent Trustee since 2010) | Since 2008 | President, Chief Investment Officer, Weiss, Peck and Greer/Robeco Investment Management (2005-2007); Managing Director, Weiss, Peck and Greer, (1995-2005). | None | ||||
| Officers | ||||||||
Mitchell E. Appel YOB: 1970 | President | Since 2008 | President of each of the Value Line Funds since June 2008; Chief Financial Officer of Value Line from April 2008 to December 2010 and from September 2005 to November 2007; Director from February 2010 to December 2010; Chief Financial Officer of XTF Asset Management from November 2007 to April 2008; Chief Financial Officer of the Distributor since April 2008 and President since February 2009; President of the Adviser since February 2009, Trustee since December 2010 and Treasurer since January 2011. | |||||
Michael J. Wagner YOB: 1950 | Chief Compliance Officer | Since 2009 | Chief Compliance Officer of the Value Line Funds since June 2009; President of Northern Lights Compliance Service, LLC (formerly Fund Compliance Services, LLC (2006 – present)) and Senior Vice President (2004 – 2006) and President and Chief Operations Officer (2003 – 2006) of Gemini Fund Services, LLC; Director of Constellation Trust Company until 2008. | |||||
Emily D. Washington YOB: 1979 | Treasurer and Secretary | Since 2008 | Treasurer and Chief Financial Officer (Principal Financial and Accounting Officer) of each of the Value Line Funds since August 2008 and Secretary since 2010; Associate Director of Mutual Fund Accounting at Value Line until August 2008. | |||||
| * | Mr. Appel is an “interested person” as defined in the Investment Company Act of 1940 by virtue of his position with the Adviser and Distributor. |
Unless otherwise indicated, the address for each of the above officers is c/o Value Line Funds, 7 Times Square, New York, NY 10036.
| The Trust’s Statement of Additional Information (SAI) includes additional information about the Trust’s Trustees and is available, without charge, upon request by calling 1-800-243-2729 or on the Trust’s website, www.vlfunds.com. |
21
| Value Line Aggressive Income Trust |
[This Page Intentionally Left Blank.]
22
| Value Line Aggressive Income Trust |
[This Page Intentionally Left Blank.]
23
| Value Line Aggressive Income Trust |
| The Value Line Family of Funds |
In 1950, Value Line started its first mutual fund. Since then, knowledgeable investors have been relying on the Value Line Funds to help them build their financial futures. Over the years, Value Line Funds has evolved into what we are today – a diversified family of no-load mutual funds with a wide range of investment objectives – ranging from small, mid and large capitalization equities to taxable and tax-exempt fixed income. We also provide strategies that effectively combine both equities and fixed income, diligently taking into account the potential risk and reward of each investment.
1950 — The Value Line Fund seeks long-term growth of capital. Current income is a secondary objective.
1952 — Value Line Income and Growth Fund’s primary investment objective is income, as high and dependable as is consistent with reasonable risk. Capital growth to increase total return is a secondary objective.
1956 — Value Line Premier Growth Fund seeks long-term growth of capital. No consideration is given to current income in the choice of investments.
1972 — Value Line Larger Companies Fund’s sole investment objective is to realize capital growth.
1979 — Value Line U.S. Government Money Market Fund, a money market fund, seeks to secure as high a level of current income as is consistent with maintaining liquidity and preserving capital. An investment in the Fund is not insured or guaranteed by the Federal Deposit Insurance Corporation or any other government agency. Although the Fund seeks to preserve the value of your investment at $1.00 per share, it is possible to lose money by investing in the Fund.
1981 — Value Line U.S. Government Securities Fund seeks maximum income without undue risk to capital. Under normal conditions, at least 80% of the value of its net assets will be invested in securities issued or guaranteed by the U.S. Government and its agencies and instrumentalities.
1983 — Value Line Centurion Fund* seeks long-term growth of capital.
1984 — The Value Line Tax Exempt Fund seeks to provide investors with the maximum income exempt from federal income taxes while avoiding undue risk to principal. The fund may be subject to state and local taxes and the Alternative Minimum Tax (if applicable).
1986 — Value Line Aggressive Income Trust seeks to maximize current income.
1987 — Value Line Strategic Asset Management Trust* seeks to achieve a high total investment return consistent with reasonable risk.
1993 — Value Line Emerging Opportunities Fund invests in U.S. common stocks of small capitalization companies, with its primary objective being long-term growth of capital.
1993 — Value Line Asset Allocation Fund seeks high total investment return, consistent with reasonable risk. The Fund invests in stocks, bonds and money market instruments utilizing quantitative modeling to determine the asset mix.
| * | Only available through the purchase of Guardian Investor, a tax deferred variable annuity, or ValuePlus, a variable life insurance policy. |
For more complete information about any of the Value Line Funds, including charges and expenses, send for a prospectus from EULAV Securities LLC, 7 Times Square, New York, New York 10036-6524 or call 1-800-243-2729, 9am-5pm CST, Monday-Friday, or visit us at www.vlfunds.com. Read the prospectus carefully before you invest or send money.
24
Item 11. | Controls and Procedures. | |
| (a) | The registrant’s principal executive officer and principal financial officer have concluded that the registrant’s disclosure controls and procedures (as defined in rule 30a-2(c) under the Act (17 CFR 270.30a-2(c) ) based on their evaluation of these controls and procedures as of a date within 90 days of the filing date of this report, are appropriately designed to ensure that material information relating to the registrant is made known to such officers and are operating effectively. | |
| (b) | The registrant’s principal executive officer and principal financial officer have determined that there have been no significant changes in the registrant’s internal controls or in other factors that could significantly affect these controls subsequent to the date of their evaluation, including corrective actions with regard to significant deficiencies and material weaknesses. | |
Item 12. | Exhibits. | |
| (a) | (1) Certification pursuant to Rule 30a-2(a) under the Investment Company Act of 1940 (17 CFR 270.30a-2) attached hereto as Exhibit 99.CERT. | |
(2) Certification pursuant to Section 906 of the Sarbanes-Oxley Act of 2002 attached hereto as Exhibit 99.906.CERT. | ||
SIGNATURES
Pursuant to the requirements of the Securities Exchange Act of 1934 and the Investment Company Act of 1940, the registrant has duly caused this report to be signed on its behalf by the undersigned, thereunto duly authorized.
| By: | /s/ Mitchell E. Appell | |
| Mitchell E. Appel, President | ||
| Date: | October 1, 2012 | |
| Pursuant to the requirements of the Securities Exchange Act of 1934 and the Investment Company Act of 1940, this report has been signed below by the following persons on behalf of the registrant and in the capacities and on the dates indicated. | ||
| By: | /s/ Mitchell E. Appell | |
| Mitchell E. Appel, President, Principal Executive Officer | ||
| By: | /s/ Emily D. Washington | |
| Emily D. Washington, Treasurer, Principal Financial Officer | ||
| Date: | October 1, 2012 | |