UNITED STATES
SECURITIES AND EXCHANGE COMMISSION
Washington, D.C. 20549
SECURITIES AND EXCHANGE COMMISSION
Washington, D.C. 20549
FORM N-CSR
CERTIFIED SHAREHOLDER REPORT OF REGISTERED
MANAGEMENT INVESTMENT COMPANIES
MANAGEMENT INVESTMENT COMPANIES
Investment Company Act file Number 811-04471
Value Line Core Bond Fund
(Exact name of registrant as specified in charter)
7 Times Square 21st Floor, New York, N.Y. 10036-6524
(Address of principal executive offices) (Zip Code)
Registrant’s telephone number, including area code: 212-907-1900
Date of fiscal year end: January 31, 2013
Date of reporting period: January 31, 2013
Item I. Reports to Stockholders.
A copy of the Annual Report to Stockholders for the period ended 1/31/13 is included with this Form.
| INVESTMENT ADVISER | EULAV Asset Management | A N N U A L R E P O R T | |
7 Times Square 21st Floor | J a n u a r y 3 1 , 2 0 1 3 | ||
| New York, NY 10036-6524 | |||
| DISTRIBUTOR | EULAV Securities LLC | ||
7 Times Square 21st Floor | |||
| New York, NY 10036-6524 | |||
| CUSTODIAN BANK | State Street Bank and Trust Co. | ||
| 225 Franklin Street | |||
| Boston, MA 02110 | |||
| SHAREHOLDER | State Street Bank and Trust Co. | ||
| SERVICING AGENT | c/o BFDS | ||
| P.O. Box 219729 | |||
| Kansas City, MO 64121-9729 | |||
| INDEPENDENT | PricewaterhouseCoopers LLP | Value Line Core Bond Fund (formerly, Value Line Aggressive Income Trust) | |
| REGISTERED PUBLIC | 300 Madison Avenue | ||
| ACCOUNTING FIRM | New York, NY 10017 | ||
| LEGAL COUNSEL | Peter D. Lowenstein, Esq. | ||
| 496 Valley Road | |||
| Cos Cob, CT 06807-0272 | |||
| DIRECTORS | Mitchell E. Appel | ||
| Joyce E. Heinzerling | |||
| Francis C. Oakley | |||
| David H. Porter | |||
| Paul Craig Roberts | |||
| Nancy-Beth Sheerr | |||
| Daniel S. Vandivort | |||
| OFFICERS | Mitchell E. Appel | ||
| President | |||
| Michael J. Wagner | |||
| Chief Compliance Officer | |||
| Emily D. Washington | |||
| Treasurer and Secretary | |||
 |  | ||
| This audited report is issued for information to shareholders. It is not authorized for distribution to prospective investors unless preceded or accompanied by a currently effective prospectus of the Fund (obtainable from the Distributor). | |||
| #00090996 | |||
| Value Line Core Bond Fund | |
| To Our Value Line Core |
To Our Shareholders (unaudited):
Enclosed is your annual report for the year ended January 31, 2013. We encourage you to carefully review this report which includes economic observations, your Fund’s performance data and highlights, schedule of investments, and financial statements.
On December 10, 2012, the Value Line Aggressive Income Trust was renamed the Value Line Core Bond Fund (the “Fund”). While the investment objective of maximizing income for shareholders remains the same, the strategy has changed to that of an investment grade intermediate term bond fund which has less inherent risk than a high yield fund.
For the twelve months ended January 31, 2013, the total return for the Value Line Core Bond Fund (the “Fund”) was 8.49%. The Fund’s strategy was to invest primarily in high yield securities until its strategy was amended as stated above. While it was a strong year for the Fund, performance lagged the total return for the Barclays Capital U.S. Corporate High Yield Index(1) which posted a total return for the period of 13.91%. Within the high yield sector, the riskier positions were rewarded with better performance. Our Fund held more conservative positions. Since December 10, 2012, the Fund is managed as an investment grade intermediate term bond fund and will be benchmarking against the Barclay’s Capital U.S. Aggregate Bond Index(2) in the future. For the twelve months ended January 31, 2013, the Barclay’s Capital U.S. Aggregate Bond Index returned 2.59%.
At year end, your Fund’s Management Fee is charged at an annual rate of 0.75% on the first $100 million of the Fund’s average daily net assets and 0.50% on the Fund’s average daily net assets in excess thereof. Effective February 1, 2013, your Fund’s Management Fee rate will be permanently reduced so that the Management Fee rate is 0.50% on all the Fund’s average daily net assets. Also effective February 1, 2013, your Fund’s Management Fee rate will be further reduced by waiving 0.10% of the Management Fee. This further reduction is effective through June 30, 2014 and cannot be changed or terminated during this period unless approved by your Fund’s board and investment adviser. After giving effect to both the permanent and non-permanent waivers, your Fund’s Management Fee rate will be 0.40% of your Fund’s average daily net assets.
We believe the management fee reduction is in the best interest of our shareholders. As always, your confidence in the Value Line Funds is appreciated, and we look forward to serving your future investment needs.
This report and other information are available on our website, www.vlfunds.com.
| Sincerely, | |
| /s/ Mitchell Appel | |
| Mitchell Appel, President | |
| /s/ Liane Rosenberg | |
| Liane Rosenberg, Portfolio Manager | |
| March 6, 2013 |
| Past performance does not guarantee future results. Investment return and principal value of an investment can fluctuate so that an investor’s shares, when redeemed, may be worth more or less than their original cost; and that current performance may be lower or higher than the performance data quoted. Investors should carefully consider the investment objectives, risks, charges and expense of a fund. This and other important information about a fund is contained in the fund’s prospectus. A copy of our fund’s prospectus can be obtained free of charge by going to our website at www.vlfunds.com or calling 800.243.2729. | |
| (1) | The Barclays Capital U.S. Corporate High Yield Index is representative of the broad based fixed-income market. It includes noninvestment grade corporate bonds. The returns for the Index do not reflect charges, expenses, or taxes, which are deducted from the Fund’s returns, and it is not possible to directly invest in this unmanaged Index. |
| (2) | The Barclay’s Capital U.S. Aggregate Bond Index is a broad-based benchmark that measures the investment grade, U.S. dollar denominated, fixed-rate taxable bond market, including Treasuries, government-related and corporate securities, MBS (agency fixed-rate and hybrid ARM pass-through’s), ABS, and CMBS. This is an unmanaged index and does not reflect charges, expenses or taxes. It is not possible to directly invest in this Index. |
2
Value Line Core Bond Fund
| Bond Fund Shareholders |
Economic Highlights (unaudited)
The S&P 500 continued to climb in the new year returning 5.185.25.2% for January. This was on the heels of a 16.0% total return in 2012 which was the benchmark index’s largest annual return since 2009. The U.S. economy has benefited from easy monetary policy and a sustained rise in housing prices. Consumer spending ended 2012 on a high note. There was concern that we would see a broad pullback in consumer spending due to increases in the payroll tax. However, car sales remained strong in January as did retail sales, as the consumer seemed to be buoyed by the rising real estate sector and a national unemployment rate still under 8%.
The labor market has been improving at a measured pace. The national unemployment rate stood at 7.8% at year end, though with significant variation among the states. While 15 states posted unemployment rates under 6%, there were 5 states, including California, with rates still exceeding 9%. Despite the improvement over 2011’s 8.5% unemployment rate, job creation was not strong enough for the Fed to alter its economic stimulus policy of keeping short term interest rates at extremely low levels. The Fed announced in December that future monetary tightening would be contingent on the unemployment rate falling below 6.5% or inflation breaching 2.5%.
At home, GDP grew 2.2% for the year, indicating an economy firmly in a mid-cycle expansion. Another year of economic expansion is expected in 2013, with growth slower earlier in the year and faster later in the year. Some economic weakness is expected early in the year due to tax hikes and disruption from the sequester budget cuts. Assuming fiscal policy is clarified enough by midyear to encourage a rebound in capital spending, a 3% growth rate in the U.S. is possible in late 2013.
Despite the growing economy, inflationary pressures have remained modest. Consumer prices remained in check, with headline prices rising 1.6% on a year-over-year basis in 2012, and were unchanged in January. Limited wage growth as well as a declining energy price index has contributed to the relatively benign inflationary environment.
3
Value Line Core Bond Fund
| (unaudited) |
The following graph compares the performance of the Value Line Core Bond Fund to that of the Barclays Capital U.S. Corporate High Yield Index and the Barclays Capital Aggregate Bond Index (the “Indices”). The Value Line Core Bond Fund is a professionally managed mutual fund, while the Indices are not available for investment and are unmanaged. The returns for the Indices do not reflect charges, expenses or taxes, but do include the reinvestment of dividends. The comparison is shown for illustrative purposes only.
Comparison of a Change in Value of a $10,000 Investment in the
Value Line Core Bond Fund, the Barclays Capital U.S. Corporate High Yield Index*
and the Barclays Capital Aggregate Bond Index**
Value Line Core Bond Fund, the Barclays Capital U.S. Corporate High Yield Index*
and the Barclays Capital Aggregate Bond Index**
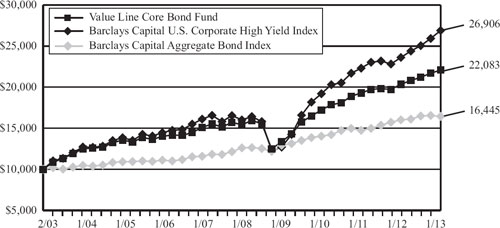
Performance Data: ***
Average Annual Total Return | Growth of an Assumed Investment of $10,000 | ||||||
| 1 year ended 1/31/13 | 8.49 | % | $ | 10,849 | |||
| 5 years ended 1/31/13 | 7.42 | % | $ | 14,305 | |||
| 10 years ended 1/31/13 | 8.24 | % | $ | 22,083 | |||
| * | The Barclays Capital U.S. Corporate High Yield Index is representative of the broad based fixed-income market. It includes non-investment grade corporate bonds. The returns for the Index do not reflect charges, expenses, or taxes, which are deducted from the Fund’s returns, and it is not possible to directly invest in this unmanaged Index. |
| ** | The Barclay’s Capital U.S. Aggregate Bond Index is a broad-based benchmark that measures the investment grade, U.S. dollar denominated, fixed-rate taxable bond market, including Treasuries, government-related and corporate securities, MBS (agency fixed-rate and hybrid ARM pass-through’s), ABS, and CMBS. This is an unmanaged index and does not reflect charges, expenses or taxes. It is not possible to directly invest in this Index. |
| *** | The performance data quoted represent past performance and are no guarantee of future performance. The average annual total returns and growth of an assumed investment of $10,000 include dividends reinvested and capital gains distributions accepted in shares. The investment return and principal value of an investment will fluctuate so that an investment, when redeemed, may be worth more or less than its original cost. The performance data and graph do not reflect the deduction of taxes that a shareholder would pay on fund distributions or the redemption of fund shares. |
4
| Value Line Core Bond Fund |
FUND EXPENSES (unaudited):
Example
As a shareholder of the Fund, you incur ongoing costs, including management fees, distribution and service (12b-1) fees, and other Fund expenses. This Example is intended to help you understand your ongoing costs (in dollars) of investing in the Fund and to compare these costs with the ongoing costs of investing in other mutual funds.
The Example is based on an investment of $1,000 invested at the beginning of the period and held for the entire period (August 1, 2012 through January 31, 2013).
Actual Expenses
The first line of the table below provides information about actual account values and actual expenses. You may use the information in this line, together with the amount you invested, to estimate the expenses that you paid over the period. Simply divide your account value by $1,000 (for example an $8,600 account value divided by $1,000 = 8.6), then multiply the result by the number in the first line under the heading “Expenses Paid During Period” to estimate the expenses you paid on your account during this period.
Hypothetical Example for Comparison Purposes
The second line of the table below provides information about hypothetical account values and hypothetical expenses based on the Fund’s actual expense ratio and an assumed rate of return of 5% per year before expenses, which is not the Fund’s actual return. The hypothetical account values and expenses may not be used to estimate the actual ending account balance or expenses you paid for the period. You may use this information to compare the ongoing costs of investing in the Fund and other funds. To do so, compare this 5% hypothetical example with the 5% hypothetical examples that appear in the shareholder reports of other funds.
Please note that the expenses shown in the table are meant to highlight your ongoing costs only and do not reflect any transactional costs, such as sales charges (loads), redemption fees, or exchange fees. Therefore, the table is useful in comparing ongoing costs only and will not help you determine the relative total costs of owning different funds. In addition, if transactional costs were included, your costs would have been higher.
Beginning account value 8/1/12 | Ending account value 1/31/13 | Expenses paid during period 8/1/12 thru 1/31/13* | ||||||||
| Actual | $ | 1,000.00 | $ | 1,041.19 | $ | 7.04 | ||||
| Hypothetical (5% return before expenses) | $ | 1,000.00 | $ | 1,018.24 | $ | 6.96 | ||||
| * | Expenses are equal to the Fund’s annualized expense ratio of 1.37% multiplied by the average account value over the period, multiplied by 184/366 to reflect the one-half year period. This expense ratio may differ from the expense ratio shown in the Financial Highlights. |
5
Value Line Core Bond Fund
| Portfolio Highlights at January 31, 2013 (unaudited) |
Ten Largest Holdings
| Issue | Principal Amount | Value | Percentage of Net Assets | ||||||
| U.S. Treasury Notes, 0.75%, 12/31/17 | $ | 3,000,000 | $ | 2,983,827 | 9.8 | % | |||
| U.S. Treasury Notes, 0.88%, 12/31/16 | 2,500,000 | 2,524,220 | 8.3 | % | |||||
| U.S. Treasury Notes, 1.38%, 9/30/18 | 1,800,000 | 1,832,765 | 6.0 | % | |||||
| Federal Home Loan Mortgage Corp. Gold Pool #C09004, 3.50%, 7/1/42 | 1,222,140 | 1,288,238 | 4.2 | % | |||||
| U.S. Treasury Notes, 2.63%, 8/15/20 | 1,000,000 | 1,080,781 | 3.5 | % | |||||
| Federal Home Loan Mortgage Corp. Gold Pool TBA, 3.50%, 2/1/43 | 1,000,000 | 1,050,938 | 3.4 | % | |||||
| U.S. Treasury Notes, 1.38%, 11/30/18 | 1,000,000 | 1,016,562 | 3.3 | % | |||||
| U.S. Treasury Notes, 1.38%, 2/28/19 | 1,000,000 | 1,013,516 | 3.3 | % | |||||
| U.S. Treasury Notes, 0.63%, 11/30/17 | 1,000,000 | 989,766 | 3.2 | % | |||||
| U.S. Treasury Notes, 1.63%, 11/15/22 | 1,000,000 | 968,125 | 3.2 | % | |||||
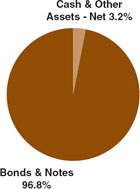
Asset Allocation – Percentage of Total Net Assets
Sector Weightings – Percentage of Total Investment Securities*
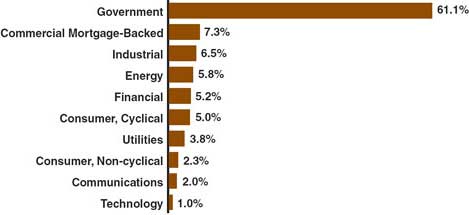
| * Sector weightings exclude short-term investments. |
6
Value Line Core Bond Fund
| Schedule of Investments | January 31, 2013 |
Principal Amount | Value | ||||||
| CORPORATE BONDS & NOTES (30.6%) | |||||||
| COMMUNICATIONS (2.0%) | |||||||
| $ | 350,000 | MetroPCS Wireless, Inc., Guaranteed Notes, 6.63%, 11/15/20 | $ | 371,000 | |||
| 200,000 | Sprint Capital Corp., Guaranteed Notes, 8.75%, 3/15/32 | 236,000 | |||||
| 607,000 | |||||||
| CONSUMER, CYCLICAL (4.8%) | |||||||
| 250,000 | Ford Motor Co., Senior Unsecured Notes, 7.45%, 7/16/31 | 318,750 | |||||
| 115,000 | Lennar Corp., Series B, Guaranteed Notes, 6.50%, 4/15/16 | 127,650 | |||||
| 200,000 | Macy’s Retail Holdings, Inc., Guaranteed Notes, 8.13%, 8/15/35 | 220,201 | |||||
| 250,000 | Marriott International, Inc., Senior Unsecured Notes, 3.25%, 9/15/22 | 245,230 | |||||
| 300,000 | Royal Caribbean Cruises Ltd., Senior Unsecured Notes, 7.50%, 10/15/27 (1) | 337,500 | |||||
| 200,000 | Wynn Las Vegas LLC / Wynn Las Vegas Capital Corp., 7.75%, 8/15/20 (1) | 225,500 | |||||
| 1,474,831 | |||||||
| CONSUMER, NON-CYCLICAL (2.2%) | |||||||
| 250,000 | Avon Products, Inc., Senior Unsecured Notes, 5.63%, 3/1/14 | 260,761 | |||||
| 150,000 | Kinetic Concepts, Inc. / KCI USA, Inc., Secured Notes, 10.50%, 11/1/18 (2) | 160,500 | |||||
| 250,000 | Valeant Pharmaceuticals International, Guaranteed Notes, 6.75%, 8/15/21 (2) | 261,875 | |||||
| 683,136 | |||||||
| ENERGY (5.6%) | |||||||
| 175,000 | Atlas Pipeline Partners L.P., Guaranteed Notes, 8.75%, 6/15/18 | 187,600 | |||||
Principal Amount | Value | ||||||
| $ | 400,000 | Cie Generale de Geophysique- Veritas, Guaranteed Notes, 7.75%, 5/15/17 | $ | 416,000 | |||
| 250,000 | CONSOL Energy, Inc., Guaranteed Notes, 8.25%, 4/1/20 | 270,625 | |||||
| 250,000 | Peabody Energy Corp., Guaranteed Notes, 7.38%, 11/1/16 | 285,000 | |||||
| 250,000 | Phillips 66, Guaranteed Notes, 4.30%, 4/1/22 | 274,059 | |||||
| 250,000 | Williams Partners L.P., Senior Unsecured Notes, 4.13%, 11/15/20 | 268,743 | |||||
| 1,702,027 | |||||||
FINANCIAL (5.0%) | |||||||
| 250,000 | Bank of America Corp. MTN, Senior Unsecured Notes, 3.30%, 1/11/23 | 246,554 | |||||
| 250,000 | BRE Properties, Inc., REIT, Senior Unsecured Notes, 3.38%, 1/15/23 | 244,817 | |||||
| 250,000 | Icahn Enterprises L.P. / Icahn Enterprises Finance Corp., Guaranteed Notes, 8.00%, 1/15/18 | 267,812 | |||||
| 250,000 | International Lease Finance Corp., Senior Unsecured Notes, 8.25%, 12/15/20 | 306,250 | |||||
| 250,000 | Morgan Stanley, Senior Unsecured Notes, 4.75%, 3/22/17 | 273,048 | |||||
| 200,000 | SLM Corp., Senior Unsecured Notes, 5.63%, 8/1/33 | 187,500 | |||||
| 1,525,981 | |||||||
INDUSTRIAL (6.3%) | |||||||
| 350,000 | Alliant Techsystems, Inc., Guaranteed Notes, 6.88%, 9/15/20 | 384,125 | |||||
| 500,000 | Briggs & Stratton Corp., Guaranteed Notes, 6.88%, 12/15/20 | 562,500 | |||||
| 260,000 | Covanta Holding Corp., Senior Unsecured Notes, 7.25%, 12/1/20 | 286,417 | |||||
See Notes to Financial Statements.
7
Value Line Core Bond Fund
| January 31, 2013 |
Principal Amount | Value | ||||||
| $ | 200,000 | Crown Americas LLC / Crown Americas Capital Corp. III, Guaranteed Notes, 6.25%, 2/1/21 | $ | 217,500 | |||
| 250,000 | General Electric Co., Senior Unsecured Notes, 4.13%, 10/9/42 | 247,075 | |||||
| 200,000 | Masco Corp., Senior Unsecured Notes, 7.13%, 3/15/20 | 231,648 | |||||
| 1,929,265 | |||||||
TECHNOLOGY (1.0%) | |||||||
| 81,000 | Broadridge Financial Solutions, Inc., Senior Unsecured Notes, 6.13%, 6/1/17 | 91,459 | |||||
| 200,000 | Nuance Communications, Inc., Guaranteed Notes, 5.38%, 8/15/20 (2) | 206,000 | |||||
| 297,459 | |||||||
UTILITIES (3.7%) | |||||||
| 350,000 | AES Corp. (The), Senior Unsecured Notes, 8.00%, 10/15/17 | 404,250 | |||||
| 350,000 | GenOn Energy, Inc., Senior Unsecured Notes, 7.63%, 6/15/14 | 374,500 | |||||
| 300,000 | NRG Energy, Inc., Guaranteed Notes, 8.50%, 6/15/19 | 332,250 | |||||
| 1,111,000 | |||||||
| TOTAL CORPORATE BONDS& NOTES (Cost $8,639,916) (30.6%) | 9,330,699 | ||||||
| COMMERCIAL MORTGAGE-BACKED SECURITIES (7.1%) | |||||||
| 500,000 | Citigroup Commercial Mortgage Trust, Series 2012-GC8, Class A4, 3.02%, 9/10/45 | 515,023 | |||||
| 454,000 | Federal National Mortgage Association, Series 2012-M3, Class 2A2, 2.43%, 1/25/19 | 478,058 | |||||
| 250,000 | Government National Mortgage Association, Series 2013-12, Class B, 2.45%, 11/16/52 (3) | 254,630 | |||||
Principal Amount | Value | ||||||
| $ | 250,000 | Morgan Stanley Bank of America Merrill Lynch Trust, Series 2012-C5, Class A4, 3.18%, 8/15/45 | $ | 260,939 | |||
| 400,000 | Morgan Stanley Bank of America Merrill Lynch Trust, Series 2012-C6, Class A4, 2.86%, 11/15/45 | 406,028 | |||||
| 250,000 | UBS-Barclays Commercial Mortgage Trust, Series 2012-C4, Class A5, 2.85%, 12/10/45 | 251,906 | |||||
| TOTAL COMMERCIAL MORTGAGE-BACKED SECURITIES (Cost $2,193,077) (7.1%) | 2,166,584 | ||||||
| FOREIGN GOVERNMENT OBLIGATION (0.8%) | |||||||
| 250,000 | Asian Development Bank MTN, Senior Unsecured Notes, 1.38%, 3/23/20 | ||||||
| 247,683 | |||||||
| TOTAL FOREIGN GOVERNMENT OBLIGATIONS (Cost $249,721) (0.8% ) | 247,683 | ||||||
| U.S. TREASURY OBLIGATIONS (45.4%) | |||||||
U.S. TREASURY NOTES & BONDS (45.4%) | |||||||
| 250,000 | U.S. Treasury Bonds, 5.38%, 2/15/31 | 344,922 | |||||
| 500,000 | U.S. Treasury Bonds, 4.38%, 5/15/40 | 624,219 | |||||
| 2,500,000 | U.S. Treasury Notes, 0.88%, 12/31/16 | 2,524,220 | |||||
| 1,000,000 | U.S. Treasury Notes, 0.63%, 11/30/17 | 989,766 | |||||
| 3,000,000 | U.S. Treasury Notes, 0.75%, 12/31/17 (1) | 2,983,827 | |||||
| 1,800,000 | U.S. Treasury Notes, 1.38%, 9/30/18 | 1,832,765 | |||||
| 1,000,000 | U.S. Treasury Notes, 1.38%, 11/30/18 | 1,016,562 | |||||
| 500,000 | U.S. Treasury Notes, 1.25%, 1/31/19 | 503,594 | |||||
| 1,000,000 | U.S. Treasury Notes, 1.38%, 2/28/19 | 1,013,516 | |||||
| 1,000,000 | U.S. Treasury Notes, 2.63%, 8/15/20 | 1,080,781 | |||||
See Notes to Financial Statements.
8
| Value Line Core Bond Fund |
| Schedule of Investments |
Principal Amount | Value | ||||||
| $ | 1,000,000 | U.S. Treasury Notes, 1.63%, 11/15/22 | $ | 968,125 | |||
| 13,882,297 | |||||||
| TOTAL U.S. TREASURY OBLIGATIONS (Cost $13,981,834) (45.4%) | 13,882,297 | ||||||
| U.S. GOVERNMENT AGENCY OBLIGATIONS AND GOVERNMENT SPONSORED OBLIGATIONS (12.9%) | |||||||
| 1,222,140 | Federal Home Loan Mortgage Corp. Gold Pool #C09004, 3.50%, 7/1/42 | 1,288,238 | |||||
| 29,769 | Federal Home Loan Mortgage Corp. Gold Pool #C91413, 3.50%, 12/1/31 | 31,412 | |||||
| 248,092 | Federal Home Loan Mortgage Corp. Gold Pool #Q08903, 3.50%, 6/1/42 | 261,510 | |||||
| 500,000 | Federal Home Loan Mortgage Corp. Gold Pool #Q11556, 3.00%, 10/1/42 | 514,525 | |||||
| 1,000,000 | Federal Home Loan Mortgage Corp. Gold Pool TBA, 3.50%, 2/1/43 | 1,050,938 | |||||
| 250,000 | Federal Home Loan Mortgage Corp. Gold Pool TBA, 4.00%, 2/1/43 | 265,039 | |||||
| 500,000 | Federal National Mortgage Association TBA, 2.50%, 2/1/28 | 517,656 | |||||
| TOTAL U.S. GOVERNMENT AGENCY OBLIGATIONS AND GOVERNMENT SPONSORED OBLIGATIONS (Cost $3,957,892) (12.9%) | 3,929,318 | ||||||
| SHORT-TERM INVESTMENTS (16.2%) | |||||||
| REPURCHASE AGREEMENTS (8.2%) | |||||||
| 2,500,000 | With Morgan Stanley, 0.11%, dated 01/31/13, due 02/01/13, delivery value $2,500,008 (collateralized by $2,520,000 U.S. Treasury Notes 1.00% due 03/31/17, with a value of $2,561,364) | 2,500,000 | |||||
Principal Amount | Value | ||||||
| INVESTMENTS OF CASH COLLATERAL FOR SECURITIES ON LOAN (8.0%) | |||||||
| JOINT REPURCHASE AGREEMENTS (8.0%) | |||||||
| $ | 887,129 | Joint Repurchase Agreement with Morgan Stanley, 0.14%, dated 01/31/13, due 02/01/13, delivery value $860,229 (collateralized by $877,509 U.S. Treasury Note 0.38% due 04/15/15, with a value of $876,535) | $ | 887,129 | |||
| 802,641 | Joint Repurchase Agreement with Barclays, 0.14%, dated 01/31/13, due 02/01/13, delivery value $778,303 (collateralized by $793,867 U.S. Treasury Note 0.25% due 07/15/15, with a value of $793,779) | 802,641 | |||||
| 760,396 | Joint Repurchase Agreement with Credit Suisse First Boston, 0.14%, dated 01/31/13, due 02/01/13, delivery value $737,340 (collateralized by $752,203 U.S. Treasury Note 0.25% due 02/28/14, with a value of $751,410) | 760,396 | |||||
| TOTAL INVESTMENTS OF CASH COLLATERAL FOR SECURITIES ON LOAN (Cost $2,450,166) (8.0%) | 2,450,166 | ||||||
| TOTAL SHORT-TERM INVESTMENTS (Cost $4,950,166) (16.2%) | 4,950,166 | ||||||
| TOTAL INVESTMENT SECURITIES (113.0%) (Cost $33,972,606) | 34,506,747 | ||||||
| EXCESS OF LIABILITIES OVER CASH AND OTHER ASSETS (-13.0%) | (3,956,370 | ) | |||||
| NET ASSETS (100%) | $ | 30,550,377 | |||||
| NET ASSET VALUE OFFERING AND REDEMPTION PRICE, PER OUTSTANDING SHARE ($30,550,377 ÷ 6,027,273 shares outstanding) | $ | 5.07 | |||||
See Notes to Financial Statements.
9
| Value Line Core Bond Fund |
| January 31, 2013 |
| (1) | A portion or all of the security was held on loan. As of January 31, 2013, the market value of the securities on loan was $2,328,558. |
| (2) | Pursuant to Rule 144A under the Securities Act of 1933, this security can only be sold to qualified institutional investors. |
| (3) | The rate shown on floating rate and discount securities represents the yield or rate at the end of the reporting period. |
| MTN | Medium Term Note. |
| REIT | Real Estate Investment Trust. |
| TBA | To Be Announced. |
See Notes to Financial Statements.
10
Value Line Core Bond Fund
| Statement of Assets and Liabilities |
| at January 31, 2013 |
| Assets: | ||||
| Investment securities, at value (Cost - $29,022,440) (securities on loan, at value, $2,328,558) | $ | 29,556,581 | ||
| Repurchase agreements (Cost - $4,950,166) | 4,950,166 | |||
| Cash | 170,903 | |||
| Interest receivable | 208,103 | |||
| Prepaid expenses | 15,595 | |||
| Receivable for capital shares sold | 11,031 | |||
| Receivable for securities lending income | 738 | |||
| Total Assets | 34,913,117 | |||
| Liabilities: | ||||
| Payable upon return of securities on loan | 2,375,863 | |||
| Payable for securities purchased | 1,846,279 | |||
| Due to custodian | 74,303 | |||
| Dividends payable to shareholders | 9,655 | |||
| Payable for capital shares redeemed | 5,962 | |||
| Accrued expenses: | ||||
| Advisory fee | 14,585 | |||
| Service and distribution plan fees | 3,988 | |||
| Directors’ fees and expenses | 148 | |||
| Other | 31,957 | |||
| Total Liabilities | 4,362,740 | |||
| Net Assets | $ | 30,550,377 | ||
| Net assets consist of: | ||||
| Capital stock, at $0.01 par value (authorized unlimited, outstanding 6,027,273 shares) | $ | 60,273 | ||
| Additional paid-in capital | 29,965,618 | |||
| Distributions in excess of net investment income | (9,655 | ) | ||
| Net unrealized appreciation of investments | 534,141 | |||
| Net Assets | $ | 30,550,377 | ||
| Net Asset Value, Offering and Redemption Price per Outstanding Share ($30,550,377 ÷ 6,027,273 shares outstanding) | $ | 5.07 |
| Statement of Operations |
| for the Year Ended January 31, 2013 |
| Investment Income: | ||||
| Interest | $ | 2,008,525 | ||
| Dividends | 27,995 | |||
| Securities lending income | 22,017 | |||
| Total Income | 2,058,537 | |||
| Expenses: | ||||
| Advisory fee | 237,606 | |||
| Service and distribution plan fees | 79,202 | |||
| Auditing and legal fees | 50,119 | |||
| Printing and postage | 42,994 | |||
| Registration and filing fees | 33,221 | |||
| Transfer agent fees | 31,422 | |||
| Custodian fees | 21,656 | |||
| Directors’ fees and expenses | 7,021 | |||
| Insurance | 3,823 | |||
| Other | 7,185 | |||
| Total Expenses Before Fees Waived and Custody Credits | 514,249 | |||
| Less: Advisory Fees Waived | (63,362 | ) | ||
| Less: Service and Distribution Plan Fees Waived | (31,681 | ) | ||
| Less: Custody Credits | (287 | ) | ||
| Net Expenses | 418,919 | |||
| Net Investment Income | 1,639,618 | |||
| Net Realized and Unrealized Gain/ (Loss) on Investments: | ||||
| Net Realized Gain | 1,779,984 | |||
| Change in Net Unrealized Appreciation/(Depreciation) | (866,255 | ) | ||
| Net Realized Gain and Change in Net Unrealized Appreciation/ (Depreciation) on Investments | 913,729 | |||
| Net Increase in Net Assets from Operations | $ | 2,553,347 |
See Notes to Financial Statements.
11
Value Line Core Bond Fund
| Statement of Changes in Net Assets |
| for the Years Ended January 31, 2013 and 2012 |
Year Ended January 31, 2013 | Year Ended January 31, 2012 | ||||||
| Operations: | |||||||
| Net investment income | $ | 1,639,618 | $ | 1,950,280 | |||
| Net realized gain on investments | 1,779,984 | 1,085,696 | |||||
| Change in net unrealized appreciation/(depreciation) | (866,255 | ) | (1,326,754 | ) | |||
| Net increase in net assets from operations | 2,553,347 | 1,709,222 | |||||
| Distributions to Shareholders: | |||||||
| Net investment income | (1,614,009 | ) | (1,950,884 | ) | |||
| Net realized gain from investment transactions | (25,662 | ) | — | ||||
| Total Distributions | (1,639,671 | ) | (1,950,884 | ) | |||
| Capital Share Transactions: | |||||||
| Proceeds from sale of shares | 2,261,091 | 2,010,996 | |||||
| Proceeds from reinvestment of dividends to shareholders | 1,273,759 | 1,495,168 | |||||
| Cost of shares redeemed* | (6,101,213 | ) | (5,946,471 | ) | |||
| Net decrease in net assets from capital share transactions | (2,566,363 | ) | (2,440,307 | ) | |||
| Total Decrease in Net Assets | (1,652,687 | ) | (2,681,969 | ) | |||
| Net Assets: | |||||||
| Beginning of year | 32,203,064 | 34,885,033 | |||||
| End of year | $ | 30,550,377 | $ | 32,203,064 | |||
| Distributions in excess of net investment income, at end of year | $ | (9,655 | ) | $ | (37,870 | ) | |
| * | Net of redemption fees (see Note 1K and Note 2). |
See Notes to Financial Statements.
12
Value Line Core Bond Fund
| Notes to Financial Statements |
| 1. | Significant Accounting Policies |
Value Line Core Bond Fund (the “Fund”), formerly Value Line Aggressive Income Trust, is registered under the Investment Company Act of 1940, as amended, as a diversified, open-end management investment company. The primary investment objective of the Fund is to maximize current income through investment in a diversified portfolio of primarily investment grade, fixed income obligations, including securities issued or guaranteed by the U.S. government, its agencies or instrumentalities (U.S. government securities), mortgage-backed securities, asset-backed securities, corporate bonds, and other fixed income securities. Sovereign debt, or securities issued or secured by non-U.S. governments, as well as securities issued by supranational agencies, may be held by the Fund, provided the investments are U.S. dollar-denominated. As a secondary investment objective, the Fund will seek capital appreciation, but only when consistent with its primary objective. The ability of issuers of debt securities held by the Fund to meet their obligations may be affected by economic developments in a specific industry.
The following significant accounting policies are in conformity with generally accepted accounting principles for investment companies. Such policies are consistently followed by the Fund in the preparation of its financial statements. Generally accepted accounting principles require management to make estimates and assumptions that affect the reported amounts and disclosures in the financial statements. Actual results may differ from those estimates.
(A) Security Valuation: The Directors have determined that the value of bonds and other fixed income corporate securities be calculated on the valuation date by reference to valuations obtained from an independent pricing service that determines valuations for normal institutional-size trading units of debt securities, without exclusive reliance upon quoted prices. This service takes into account appropriate factors such as institutional-size trading in similar groups of securities, yield, quality, coupon rate, maturity, type of issue, trading characteristics and other market data in determining valuations. Bonds and fixed income securities are valued at the evaluated bid on the date as of which the net asset value is being determined. Securities, other than bonds and other fixed income securities, not priced in this manner are valued at the midpoint between the latest available and representative bid and asked prices or, when stock valuations are used, at the latest quoted sale price as of the regular close of business of the New York Stock Exchange on the valuation date. Other assets and securities for which market valuations are not readily available are valued at their fair value as the Directors may determine. In addition, the Fund may use the fair value of a security when the closing price on the primary exchange where the security is traded no longer reflects the value of a security due to factors affecting one or more relevant securities markets or the specific issuer. Short term instruments with maturities of 60 days or less, at the date of purchase, are valued at amortized cost which approximates market value.
(B) Fair Value Measurements: The Fund follows fair valuation accounting standards (FASB ASC 820-10) which establish a definition of fair value and set out a hierarchy for measuring fair value. These standards require additional disclosures about the various inputs and valuation techniques used to develop the measurements of fair value and a discussion of changes in valuation techniques and related inputs during the period. These inputs are summarized in the three broad levels listed below:
| ● | Level 1 - Inputs that reflect unadjusted quoted prices in active markets for identical assets or liabilities that the Fund has the ability to access at the measurement date; |
| ● | Level 2 - Inputs other than quoted prices that are observable for the asset or liability either directly or indirectly, including inputs in markets that are not considered to be active; |
13
Value Line Core Bond Fund
| January 31, 2013 |
| ● | Level 3 - Inputs that are unobservable. |
Transfers between investment levels may occur as the markets fluctuate and/or the availability of data used in an investment’s valuation changes. The inputs or methodologies used for valuing securities are not necessarily an indication of the risk associated with investing in those securities.
The following table summarizes the inputs used to value the Fund’s investments in securities as of January 31, 2013:
Investments in Securities: | Level 1 | Level 2 | Level 3 | Total | |||||||||
| Assets | |||||||||||||
| Corporate Bonds & Notes | $ | 0 | $ | 9,330,699 | $ | 0 | $ | 9,330,699 | |||||
| Commercial Mortgage-Backed Securities | 0 | 2,166,584 | 0 | 2,166,584 | |||||||||
| Foreign Government Obligation | 0 | 247,683 | 0 | 247,683 | |||||||||
| U.S. Treasury Obligations | 0 | 13,882,297 | 0 | 13,882,297 | |||||||||
| U.S. Government Agency Obligations and Government Sponsored Obligations | 0 | 3,929,318 | 0 | 3,929,318 | |||||||||
| Short-Term Investments | 0 | 4,950,166 | 0 | 4,950,166 | |||||||||
| Total Investments in Securities | $ | 0 | $ | 34,506,747 | $ | 0 | $ | 34,506,747 | |||||
The Fund follows the updated provisions surrounding fair value measurements and disclosures on transfers in and out of all levels of the fair value hierarchy on a gross basis and the reasons for the transfers as well as to disclosures about the valuation techniques and inputs used to measure fair value for investments that fall in either Level 2 or Level 3 of the fair value hierarchy.
The amounts and reasons for all transfers in and out of each level within the three-tier hierarchy are disclosed when the Fund had an amount of total transfers during the reporting period that was meaningful in relation to its net assets as of the end of the reporting period.
For the year ended January 31, 2013, there were no Level 3 investments. The Schedule of Investments includes a breakdown of the Schedule’s investments by category.
(C) Repurchase Agreements: In connection with transactions in repurchase agreements, the Fund’s custodian takes possession of the underlying collateral securities, the value of which exceeds the principal amount of the repurchase transaction, including accrued interest. To the extent that any repurchase transaction exceeds one business day, it is the Fund’s policy to mark-to-market on a daily basis to ensure the adequacy of the collateral. In the event of default of the obligation to repurchase, the Fund has the right to liquidate the collateral and apply the proceeds in satisfaction of the obligation. Under certain circumstances, in the event of default or bankruptcy by the other party to the agreement, realization and/or retention of the collateral or proceeds may be subject to legal proceedings.
In December 2011, the Financial Accounting Standards Board issued Accounting Standards Update No. 2011-11 (“ASU 2011-11”), “Balance Sheet (Topic 210): Disclosures about Offsetting Assets and Liabilities.” The ASU 2011-11 requires disclosure of both gross and net balances for certain investments and transactions entered into under master netting agreements, better aligning US GAAP requirements with International Financial Reporting Standards. The ASU 2011-11 is effective for annual periods beginning on or after January 1, 2013. The Fund’s management is evaluating the effect of this guidance on the financial statements.
(D) Distributions: It is the policy of the Fund to distribute all of its net investment income to shareholders. Dividends from net investment income will be declared daily and paid monthly. Net realized capital gains, if any, are distributed to shareholders annually or more frequently if necessary to comply with the Internal Revenue Code. Income dividends and capital gains distributions are automatically reinvested in additional shares of the Fund unless the shareholder has requested otherwise. Income earned by the Fund on weekends, holidays and other days on which the Fund is closed for business is declared as a dividend on the next day on which the Fund is open for business.
14
Value Line Core Bond Fund
| Notes to Financial Statements |
(E) Federal Income Taxes: It is the Fund’s policy to comply with the requirements of the Internal Revenue Code applicable to regulated investment companies, including the distribution requirements of the Tax Reform Act of 1986, and to distribute all of its taxable income to its shareholders. Therefore, no federal income tax provision is required.
Management has analyzed the Fund’s tax positions taken on federal and state income tax returns for all open tax years (fiscal years ended January 31, 2010 through January 31, 2013), and has concluded that no provision for federal or state income tax is required in the Fund’s financial statements. The Fund’s federal and state income tax returns for tax years for which the applicable statutes of limitations have not expired are subject to examination by the Internal Revenue Service and state departments of revenue.
(F) Foreign Currency Translation: The books and records of the Fund are maintained in U.S. dollars. Assets and liabilities which are denominated in foreign currencies are translated to U.S. dollars at the prevailing rates of exchange. The Fund does not isolate changes in the value of investments caused by foreign exchange rate differences from the changes due to other circumstances.
Income and expenses are translated to U.S. dollars based upon the rates of exchange on the respective dates of such transactions.
Net realized foreign exchange gains or losses arise from currency fluctuations realized between the trade and settlement dates on securities transactions, the differences between the U.S. dollar amounts of dividends, interest, and foreign withholding taxes recorded by the Fund, and the U.S. dollar equivalent of the amounts actually received or paid. Net unrealized foreign exchange gains and losses arise from changes in the value of assets and liabilities, other than investments, at the end of the fiscal period, resulting from changes in the exchange rates. The effect of the change in foreign exchange rates on the value of investments is included in realized gain/loss on investments and change in net unrealized appreciation/ (depreciation) on investments.
(G) Representations and Indemnifications: In the normal course of business, the Fund enters into contracts that contain a variety of representations and warranties which provide general indemnifications. The Fund’s maximum exposure under these arrangements is unknown, as this would involve future claims that may be made against the Fund that have not yet occurred. However, based on experience, the Fund expects the risk of loss to be remote.
(H) Security Transactions: Securities transactions are recorded on a trade date basis. Realized gains and losses from security transactions are recorded on the identified-cost basis. Interest income, adjusted for amortization of discount and premium, is earned from settlement date and recognized on the accrual basis. Dividend income is recorded on the ex-dividend date.
(I) Accounting for Real Estate Investment Trusts: The Fund owns shares of Real Estate Investment Trusts (“REITs”) which report information on the source of their distributions annually. Distributions received from REITs during the year which represent a return of capital are recorded as a reduction of cost and distributions which represent a capital gain dividend are recorded as a realized long-term capital gain on investments.
(J) Foreign Taxes: The Fund may be subject to foreign taxes on income, gains on investments, or currency repatriation, a portion of which may be recoverable. The Fund will accrue such taxes and recoveries as applicable, based upon its current interpretation of tax rules and regulations that exist in the markets in which it invests.
15
Value Line Core Bond Fund
| January 31, 2013 |
(K) Redemption Fees: The Fund charges a 2% redemption fee on shares held for less than 120 days. Such fees are retained by the Fund and accounted for as paid in capital. During the fiscal year ended January 31, 2013, redemption fees were discontinued.
(L) Securities Lending: Under an agreement with State Street Bank & Trust (“State Street”), the Fund can lend its securities to brokers, dealers and other financial institutions approved by the Board of Directors. By lending its investment securities, the Fund attempts to increase its net investment income through receipt of interest on the loan. Any gain or loss in the market price of the securities loaned that might occur and any interest or dividends declared during the term of the loan would accrue to the account of the Fund. Risks of delay in recovery of the securities or even loss of rights in the collateral may occur should the borrower of the securities fail financially. Generally, in the event of a counter-party default, the Fund has the right to use the collateral to offset the losses incurred. The lending fees received and the Fund’s portion of the interest income earned on the cash collateral are included in the Statement of Operations.
Upon entering into a securities lending transaction, the Fund receives cash or other securities as collateral in an amount equal to or exceeding 102% of the current market value of the loaned securities. Any cash received as collateral is invested by State Street Global Advisors, acting in its capacity as securities lending agent (the “Agent”), in The Value Line Funds collateral account, which is subsequently invested into joint repurchase agreements. A portion of the dividends received on the collateral is rebated to the borrower of the securities and the remainder is split between the Agent and the Fund.
The Fund enters into joint repurchase agreements whereby its uninvested cash collateral from securities lending is deposited into a joint cash account with other funds managed by the investment adviser and is used to invest in one or more repurchase agreements. The value and face amount of the joint repurchase agreement are allocated to the funds based on their pro-rata interest. A repurchase agreement is accounted for as a loan by the fund to the seller, collateralized by securities which are delivered to the fund’s custodian. The market value, including accrued interest, of the initial collateralization is required to be at least 102% of the dollar amount invested by the funds, with the value of the underlying securities marked to market daily to maintain coverage of at least 100%. The joint repurchase agreement held by the Fund at year end had been entered into on January 31, 2013.
As of January 31, 2013, the Fund loaned securities which were collateralized by cash. The value of the securities on loan and the value of the related collateral were as follows:
| Value of Securities Loaned | Value of Collateral | Total Collateral (including Calculated Mark) | ||||||
| $ | 2,328,558 | $ | 2,375,863 | $ | 2,377,593 | |||
(M) Other: On December 13, 2012, the Board of Directors of the Fund approved an Agreement and Plan of Reorganization pursuant to which the Value Line U.S. Government Securities Fund, Inc. (the “U.S. Government Fund”), which is another fund within the Value Line Funds, would merge into the Fund and its shareholders would become shareholders of the Fund. The closing of the reorganization is expected to occur on or about March 22, 2013, subject to certain conditions, including that the U.S. Government Fund’s shareholders would also approve the Agreement and Plan of Reorganization. A special meeting of the Fund’s shareholders is scheduled to be held on March 21, 2013.
(N) Subsequent Events: Effective February 1, 2013, the Adviser permanently reduced the Management fee rate to 0.50% of the Fund’s average daily net assets. Also effective February 1, 2013, the Adviser further reduced the fee by waiving 0.10% of the management fee. After waivers the Fund’s effective rate is 0.40%.
16
| Value Line Core Bond Fund |
| Notes to Financial Statements |
| 2. | Capital Share Transactions and Distributions to Shareholders |
Transactions in capital stock were as follows:
Year Ended January 31, 2013 | Year Ended January 31, 2012 | |||||||
| Shares sold | 452,862 | 413,006 | ||||||
| Shares issued to shareholders in reinvestment of dividends | 255,621 | 307,024 | ||||||
| Shares redeemed | (1,222,950 | ) | (1,220,003 | ) | ||||
| Net decrease | (514,467 | ) | (499,973 | ) | ||||
| Dividends per share from net investment income | $ | 0.2531 | $ | 0.2899 | ||||
| Distributions per share from net realized gains | $ | 0.0040 | $ | — | ||||
Redemption fees of $1,195 and $1,747 were retained by the Fund for the year ended January 31, 2013 and the year ended January 31, 2012, respectively.
| 3. | Purchases and Sales of Securities |
Purchases and sales of investment securities, excluding short-term securities, were as follows:
Year Ended January 31, 2013 | ||||
| PURCHASES: | ||||
| U.S. Treasury & Government Agency Obligations | $ | 18,677,414 | ||
| Other Investment Securities | 11,627,070 | |||
| Total Purchases | $ | 30,304,484 | ||
| SALES: | ||||
| U.S. Treasury & Government Agency Obligations | $ | — | ||
| Other Investment Securities | 32,770,702 | |||
| Total Sales | $ | 32,770,702 | ||
| 4. | Income Taxes |
At January 31, 2013, information on the tax components of capital is as follows:
| Cost of investments for tax purposes | $ | 33,972,606 | ||
| Gross tax unrealized appreciation | $ | 719,685 | ||
| Gross tax unrealized depreciation | (185,544 | ) | ||
| Net tax unrealized appreciation on investments | $ | 534,141 |
During the year ended January 31, 2013, as permitted under federal income tax regulations, the Fund utilized $1,747,717 of capital loss carryforwards.
To the extent future capital gains are offset by capital losses, the Fund does not anticipate distributing any such gains to shareholders.
The tax composition of dividends to shareholders for the years ended January 31, 2013 and January 31, 2012 were as follows:
| 2013 | 2012 | |||||||
| Ordinary income | $ | 1,614,009 | $ | 1,950,884 | ||||
| Long-term capital gain | 25,662 | — | ||||||
| $ | 1,639,671 | $ | 1,950,884 | |||||
Permanent book-tax differences relating to the classifications of certain distributions and income in the current year were reclassified within the composition of the net asset accounts. The Fund decreased distributions in excess of net investment income by $28,268, decreased accumulated realized gain on investments by $23,097, and decreased additional paid-in-capital by $5,171. Net assets were not affected by these reclassifications. These reclassifications are primarily due to differing treatments for tax purposes of distributions and consent payments.
17
| Value Line Core Bond Fund |
| January 31, 2013 |
On December 22, 2010, the Regulated Investment Company Modernization Act of 2010 (“the Act”) was signed by the President. Under the Act, net capital losses recognized by the Fund after January 31, 2011, may get carried forward indefinitely, and retain their character as short-term and/or long term losses. Prior to this Act pre-enactment net capital losses incurred by the Fund were carried forward for eight years and treated as short-term losses. The Act requires under the transition that post-enactment net capital losses are used before pre-enactment net capital losses.
| 5. | Investment Advisory Fee, Service and Distribution Fees and Transactions With Affiliates |
An advisory fee of $237,606 was paid or payable to EULAV Asset Management (the “Adviser”) for the year ended January 31, 2013. This was computed at an annual rate of 0.75% on the first $100 million of the Fund’s average daily net assets during the period, and 0.50 % on the average daily net assets in excess thereof prior to any fee waivers. The Adviser provides research, investment programs, supervision of the investment portfolio and pays costs of administrative services and office space. The Adviser also provides persons, satisfactory to the Fund’s Directors, to act as officers of the Fund and pays their salaries. Effective June 1, 2009, the Adviser contractually agreed to waive 0.30% of the advisory fee for a one year period. Effective June 1, 2010, and renewed annually through January 31, 2013, the Adviser contractually agreed to waive 0.20% of the advisory fee. The fees waived amounted to $63,362 for the year ended January 31, 2013. The Adviser has no right to recoup previously waived amounts.
The Fund has a Service and Distribution Plan (the “Plan”), adopted pursuant to Rule 12b-1 under the Investment Company Act of 1940, which compensates EULAV Securities LLC (the “Distributor”) for advertising, marketing and distributing the Fund’s shares and for servicing the Fund’s shareholders at an annual rate of 0.25% of the Fund’s average daily net assets. Fees amounting to $79,202 before fee waivers were accrued under the Plan for the year ended January 31, 2013. Effective June 1, 2007, and renewed annually through January 31, 2013, the Distributor contractually agreed to reduce the 12b-1 fee by 0.10%. The fees waived amounted to $31,681 for the year ended January 31, 2013. The Distributor has no right to recoup previously waived amounts.
For the year ended January 31, 2013, the Fund’s expenses were reduced by $287 under a custody credit arrangement with the custodian.
Direct expenses of the Fund are charged to the Fund while common expenses of the Value Line Funds are allocated proportionately based upon the Funds’ respective net assets. The Fund bears all other costs and expenses.
Certain officers and a Trustee of the Adviser are also officers and a director of the Fund. At January 31, 2013, the officers and directors of the Fund as a group owned 1,363 shares, representing less than 1% of the outstanding shares.
18
Value Line Core Bond Fund
Financial Highlights |
Selected data for a share of capital stock outstanding throughout each year:
| Years Ended January 31, | ||||||||||||||||
| 2013 | 2012 | 2011 | 2010 | 2009 | ||||||||||||
| Net asset value, beginning of year | $ | 4.92 | $ | 4.95 | $ | 4.70 | $ | 3.89 | $ | 4.83 | ||||||
| Income from investment operations: | ||||||||||||||||
| Net investment income | 0.26 | 0.29 | 0.30 | 0.28 | 0.32 | |||||||||||
| Net gains or (losses) on securities (both realized and unrealized) | 0.15 | (0.03 | ) | 0.25 | 0.81 | (0.95 | ) | |||||||||
| Total from investment operations | 0.41 | 0.26 | 0.55 | 1.09 | (0.63 | ) | ||||||||||
| Redemption fees | 0.00 | (1) | 0.00 | (1) | 0.00 | (1) | 0.00 | (1) | 0.00 | (1) | ||||||
| Less distributions: | ||||||||||||||||
| Dividends from net investment income | (0.26 | ) | (0.29 | ) | (0.30 | ) | (0.28 | ) | (0.31 | ) | ||||||
| Distributions from net realized gains | (0.00 | )(1) | — | — | — | — | ||||||||||
| Total distributions | (0.26 | ) | (0.29 | ) | (0.30 | ) | (0.28 | ) | (0.31 | ) | ||||||
| Net asset value, end of year | $ | 5.07 | $ | 4.92 | $ | 4.95 | $ | 4.70 | $ | 3.89 | ||||||
| Total return | 8.49 | % | 5.48 | % | 12.01 | % | 28.92 | % | (13.42 | )% | ||||||
| Ratios/Supplemental Data: | ||||||||||||||||
| Net assets, end of year (in thousands) | $ | 30,550 | $ | 32,203 | $ | 34,885 | $ | 37,787 | $ | 25,924 | ||||||
Ratio of expenses to average net assets(2) | 1.62 | % | 1.55 | % | 1.48 | %(3) | 1.56 | % | 1.50 | % | ||||||
Ratio of expenses to average net assets(4) | 1.32 | % | 1.25 | % | 1.13 | %(5) | 1.13 | % | 0.98 | % | ||||||
| Ratio of net investment income to average net assets | 5.18 | % | 5.95 | % | 6.20 | % | 6.51 | % | 7.17 | % | ||||||
| Portfolio turnover rate | 103 | % | 50 | % | 42 | % | 51 | % | 39 | % | ||||||
| (1) | Amount is less than $.01 per share. |
| (2) | Ratio reflects expenses grossed up for the custody credit arrangement and grossed up for the waiver of a portion of the advisory fee by the Adviser and a portion of the service and distribution plan fees by the Distributor. The ratio of expenses to average net assets, net of custody credits, but exclusive of the fee waivers would have been 1.48% for the year ended January 31, 2009 and would have been unchanged for the other years shown. |
| (3) | Ratio reflects expenses grossed up for the reimbursement by Value Line, Inc. of certain expenses incurred by the Fund. |
| (4) | Ratio reflects expenses net of the custody credit arrangement and net of the waivers of a portion of the advisory fee by the Adviser and a portion of the service and distribution plan fees by the Distributor. |
| (5) | Ratio reflects expenses net of the reimbursement by Value Line, Inc. of certain expenses incurred by the Fund. |
See Notes to Financial Statements.
19
Value Line Core Bond Fund
Report of Independent Registered Public Accounting Firm |
To the Board of Trustees and Shareholders of Value Line Core Bond Fund (formerly, Value Line Aggressive Income Trust):
In our opinion, the accompanying statement of assets and liabilities, including the schedule of investments, and the related statements of operations and of changes in net assets and the financial highlights present fairly, in all material respects, the financial position of Value Line Core Bond Fund (formerly, Value Line Aggressive Income Trust) (the “Fund”) at January 31, 2013, the results of its operations for the year then ended, the changes in its net assets for each of the two years in the period then ended and the financial highlights for each of the five years in the period then ended, in conformity with accounting principles generally accepted in the United States of America. These financial statements and financial highlights (hereafter referred to as “financial statements”) are the responsibility of the Fund’s management. Our responsibility is to express an opinion on these financial statements based on our audits. We conducted our audits of these financial statements in accordance with the standards of the Public Company Accounting Oversight Board (United States). Those standards require that we plan and perform the audit to obtain reasonable assurance about whether the financial statements are free of material misstatement. An audit includes examining, on a test basis, evidence supporting the amounts and disclosures in the financial statements, assessing the accounting principles used and significant estimates made by management, and evaluating the overall financial statement presentation. We believe that our audits, which included confirmation of securities at January 31, 2013 by correspondence with the custodian and brokers, provide a reasonable basis for our opinion.
PricewaterhouseCoopers LLP
New York, New York
March 22, 2013
20
Value Line Core Bond Fund
| Federal Tax Notice (unaudited) |
| For corporate taxpayers 1.18% of the ordinary income distributions paid during the fiscal year ended January 31, 2013 qualify for the corporate dividends received deduction. |
| During the fiscal year ended January 31, 2013, 1.18% of the ordinary income distributions are treated as qualified dividends. |
| During the fiscal year ended January 31, 2013, the Fund distributed $25,662 from long-term capital gains. |
The Fund files its complete schedule of portfolio holdings with the Securities and Exchange Commission (“SEC”) for the first and third quarters of each fiscal year on Form N-Q. The Fund’s Forms N-Q are available on the SEC’s website at http://www.sec.gov and may be reviewed and copied at the SEC’s Public Reference Room in Washington, D.C. Information on the operation of the Public Reference Room may be obtained by calling 1-800-SEC-0330.
A description of the policies and procedures that the Fund uses to determine how to vote proxies relating to portfolio securities, and information regarding how the Fund voted these proxies for the 12-month period ended June 30 is available through the Fund’s website at http://www.vlfunds.com and on the SEC’s website at http://www.sec.gov. The description of the policies and procedures is also available without charge, upon request, by calling 1-800-243-2729.
21
Value Line Core Bond Fund
| Management of the Fund |
MANAGEMENT INFORMATION
The business and affairs of the Fund are managed by the Fund’s officers under the direction of the Board of Directors. The following table sets forth information on each Director and Officer of the Fund. Each Director serves as a director or trustee of each of the 11 Value Line Funds. Each Director serves until his or her successor is elected and qualified.
| Name, Address, and YOB | Position | Length of Time Served | Principal Occupation During the Past 5 Years | |||
| Interested Director* | ||||||
Mitchell E. Appel YOB: 1970 Other Directorships: None | Director | Since 2010 | President of each of the Value Line Funds since June 2008; Chief Financial Officer of Value Line, Inc. (“Value Line”) from April 2008 to December 2010 and from September 2005 to November 2007; Director from February 2010 to December 2010; Chief Financial Officer of XTF Asset Management from November 2007 to April 2008; Chief Financial Officer of the Distributor since April 2008 and President since February 2009; President of the Adviser since February 2009, Trustee since December 2010 and Treasurer since January 2011. | |||
| Non-Interested Directors | ||||||
Joyce E. Heinzerling 500 East 77th Street New York, NY 10162 YOB: 1956 Other Directorships: Burnham Investors Trust, since 2004 (4 funds). | Director | Since 2008 | President, Meridian Fund Advisers LLC. (consultants) since April 2009; General Counsel, Archery Capital LLC (private investment fund) until April 2009. | |||
Francis C. Oakley 54 Scott Hill Road Williamstown, MA 01267 YOB: 1931 Other Directorships: None | Director | Since 2000 | Professor of History, Williams College, (1961-2002). Professor Emeritus since 2002; President Emeritus since 1994 and President, (1985-1994); Chairman (1993-1997) and Interim President (2002-2003) of the American Council of Learned Societies. Trustee since 1997 and Chairman of the Board since 2005, National Humanities Center. | |||
David H. Porter 5 Birch Run Drive Saratoga Springs, NY 12866 YOB: 1935 Other Directorships: None | Director | Since 1997 | Professor, Skidmore College since 2008; Visiting Professor of Classics, Williams College, (1999-2008); President Emeritus, Skidmore College since 1999 and President, (1987-1998). | |||
Paul Craig Roberts 169 Pompano St. Panama City Beach, FL 32413 YOB: 1939 Other Directorships: None | Director | Since 1986 | Chairman, Institute for Political Economy. | |||
Nancy-Beth Sheerr 1409 Beaumont Drive Gladwyne, PA 19035 YOB: 1949 Other Directorships: None | Director | Since 1996 | Senior Financial Adviser, Veritable L.P. (Investment Adviser). |
22
Value Line Core Bond Fund
| Management of the Fund |
| Name, Address, and YOB | Position | Length of Time Served | Principal Occupation During the Past 5 Years | |||
Daniel S. Vandivort 59 Indian Head Road Riverside, CT 06878 YOB: 1954 Other Directorships: None | Director (Chairman of Board since 2010) | Since 2008 | President, Chief Investment Officer, Weiss, Peck and Greer/Robeco Investment Management (2005-2007); Managing Director, Weiss, Peck and Greer, (1995-2005). | |||
| Officers | ||||||
Mitchell E. Appel YOB: 1970 | President | Since 2008 | President of each of the Value Line Funds since June 2008; Chief Financial Officer of Value Line from April 2008 to December 2010 and from September 2005 to November 2007; Director from February 2010 to December 2010; Chief Financial Officer of XTF Asset Management from November 2007 to April 2008; Chief Financial Officer of the Distributor since April 2008 and President since February 2009; President of the Adviser since February 2009, Trustee since December 2010 and Treasurer since January 2011. | |||
Michael J. Wagner YOB: 1950 | Chief Compliance Officer | Since 2009 | Chief Compliance Officer of Value Line Funds since June 2009; President of Northern Lights Compliance Service, LLC (formerly Fund Compliance Services, LLC (2006 – present)) and Senior Vice President (2004 – 2006) and President and Chief Operations Officer (2003 – 2006) of Gemini Fund Services, LLC; Director of Constellation Trust Company until 2008. | |||
Emily D. Washington YOB: 1979 | Treasurer and Secretary | Since 2008 | Treasurer and Chief Financial Officer (Principal Financial and Accounting Officer) of each of the Value Line Funds since August 2008 and secretary since 2010; Associate Director of Mutual Fund Accounting at Value Line until August 2008. |
| * | Mr. Appel is an “interested person” as defined in the Investment Company Act of 1940 by virtue of his position with the Adviser and Distributor. |
Unless otherwise indicated, the address for each of the above officers is c/o Value Line Funds, 7 Times Square, New York, NY 10036.
| The Fund’s Statement of Additional Information (SAI) includes additional information about the Fund’s Directors and is available, without charge, upon request by calling 1-800-243-2729 or on the Fund’s website, www.vlfunds.com. |
23
Value Line Core Bond Fund
| The Value Line Family of Funds |
In 1950, Value Line started its first mutual fund. Since then, knowledgeable investors have been relying on the Value Line Funds to help them build their financial futures. Over the years, Value Line Funds has evolved into what we are today - a diversified family of no-load mutual funds with a wide range of investment objectives - ranging from small, mid and large capitalization equities to taxable and tax-exempt fixed income. We also provide strategies that effectively combine both equities and fixed income, diligently taking into account the potential risk and reward of each investment.
1950 — The Value Line Fund seeks long-term growth of capital. Current income is a secondary objective.
1952 — Value Line Income and Growth Fund’s primary investment objective is income, as high and dependable as is consistent with reasonable risk. Capital growth to increase total return is a secondary objective.
1956 — Value Line Premier Growth Fund seeks long-term growth of capital. No consideration is given to current income in the choice of investments.
1972 — Value Line Larger Companies Fund’s sole investment objective is to realize capital growth.
1981 — Value Line U.S. Government Securities Fund seeks maximum income without undue risk to capital. Under normal conditions, at least 80% of the value of its net assets will be invested in securities issued or guaranteed by the U.S. Government and its agencies and instrumentalities.
1983 — Value Line Centurion Fund* seeks long-term growth of capital.
1984 — The Value Line Tax Exempt Fund seeks to provide investors with the maximum income exempt from federal income taxes while avoiding undue risk to principal. The fund may be subject to state and local taxes and the Alternative Minimum Tax (if applicable).
1986 — Value Line Core Bond Fund** seeks to maximize current income.
1987 — Value Line Strategic Asset Management Trust* seeks to achieve a high total investment return consistent with reasonable risk.
1993 — Value Line Small Cap Opportunities Fund*** invests in U.S. common stocks of small capitalization companies, with its primary objective being long-term growth of capital.
1993 — Value Line Asset Allocation Fund seeks high total investment return, consistent with reasonable risk. The Fund invests in stocks, bonds and money market instruments utilizing quantitative modeling to determine the asset mix.
| * | Only available through the purchase of Guardian Investor, a tax deferred variable annuity, or ValuePlus, a variable life insurance policy. |
| ** | Formerly known as the Value Line Aggressive Income Trust. |
| *** | Formerly known as the Value Line Emerging Opportunities Fund, Inc. |
For more complete information about any of the Value Line Funds, including charges and expenses, send for a prospectus from EULAV Securities LLC, 7 Times Square, New York, New York 10036-6524 or call 1-800-243-2729, 9am–5pm CST, Monday-Friday, or visit us at www.vlfunds.com. Read the prospectus carefully before you invest or send money.
24
Item 2. Code of Ethics
(a) The Registrant has adopted a Code of Ethics that applies to its principal executive officer, and principal financial officer and principal accounting officer.
(f) Pursuant to item 12(a), the Registrant is attaching as an exhibit a copy of its Code of Ethics that applies to its principal executive officer, and principal financial officer and principal accounting officer.
Item 3. Audit Committee Financial Expert.
(a)(1) The Registrant has an Audit Committee Financial Expert serving on its Audit Committee.
(2) The Registrant’s Board has designated Daniel S. Vandivort, a member of the Registrant’s Audit Committee, as the Registrant’s Audit Committee Financial Expert. Mr. Vandivort is an independent director who has served as President, Chief Investment Officer to Weis, Peck and Greer/Robeco Investment Management. He has also previously served as Managing Director for Weis, Peck and Greer (1995-2005).
A person who is designated as an “audit committee financial expert” shall not make such person an “expert” for any purpose, including without limitation under Section 11 of the Securities Act of 1933 or under applicable fiduciary laws, as a result of being designated or identified as an audit committee financial expert. The designation or identification of a person as an audit committee financial expert does not impose on such person any duties, obligations, or liabilities that are greater than the duties, obligations, and liabilities imposed on such person as a member of the audit committee and Board of Trustees in the absence of such designation or identification.
| Item 4. | Principal Accountant Fees and Services | ||
| (a) Audit Fees 2013 $6,111 | |||
| Audit Fees 2012 $7,698 | |||
| (b) Audit-Related fees – None. | |||
| (c) Tax Preparation Fees 2013 $3,662 | |||
| Tax Preparation 2012 $3,713 | |||
| (d) All Other Fees – None | |||
(e) (1) Audit Committee Pre-Approval Policy. All services to be performed for the Registrant by PricewaterhouseCoopers LLP must be pre-approved by the audit committee. | |||
| (e) (2) Not applicable. | |||
| (f) Not applicable. | |||
| (g) Aggregate Non-Audit Fees 2013 $2,400 | |||
| Aggregate Non-Audit Fees 2012 $2,400 | |||
| (h) Not applicable. | |||
| Item 11. | Controls and Procedures. | ||
| (a) The registrant’s principal executive officer and principal financial officer have concluded that the registrant’s disclosure controls and procedures (as defined in rule 30a-2(c) under the Act (17 CFR 270.30a-2(c) ) based on their evaluation of these controls and procedures as of a date within 90 days of the filing date of this report, are appropriately designed to ensure that material information relating to the registrant is made known to such officers and are operating effectively. | |||
(b) The registrant’s principal executive officer and principal financial officer have determined that there have been no significant changes in the registrant’s internal controls or in other factors that could significantly affect these controls subsequent to the date of their evaluation, including corrective actions with regard to significant deficiencies and material weaknesses.
Item 12. Exhibits.
(a) Code of Business Conduct and Ethics for Principal Executive and Senior Financial Officers attached hereto as Exhibit 99.COE
(b) (1) Certification pursuant to Rule 30a-2(a) under the Investment Company Act of 1940 (17 CFR 270.30a-2) attached hereto as Exhibit 99.CERT.
(2) Certification pursuant to Section 906 of the Sarbanes-Oxley Act of 2002 attached hereto as Exhibit 99.906.CERT.
SIGNATURES
Pursuant to the requirements of the Securities Exchange Act of 1934 and the Investment Company Act of 1940, the registrant has duly caused this report to be signed on its behalf by the undersigned, thereunto duly authorized.
| By | /s/ Mitchell E. Appel | ||
| Mitchell E. Appel, President | |||
| Date: | April 3, 2013 | ||
Pursuant to the requirements of the Securities Exchange Act of 1934 and the Investment Company Act of 1940, this report has been signed below by the following persons on behalf of the registrant and in the capacities and on the dates indicated.
| By: | /s/ Mitchell E. Appel | ||||
| Mitchell E. Appel, President, Principal Executive Officer | |||||
| By: | /s/ Emily D. Washington | ||||
| Emily D. Washington, Treasurer, Principal Financial Officer | |||||
| Date: | April 3, 2013 | ||||