UNITED STATES
SECURITIES AND EXCHANGE COMMISSION
Washington, D.C. 20549
FORM N-CSR
CERTIFIED SHAREHOLDER REPORT OF REGISTERED
MANAGEMENT INVESTMENT COMPANIES
Investment Company Act file Number 811-04471
Value Line Core Bond Fund
(Exact name of registrant as specified in charter)
7 Times Square,21st Floor, New York, N.Y. 10036-6524
(Address of principal executive offices) (Zip Code)
Registrant’s telephone number, including area code: 212-907-1900
Date of fiscal year end: December 31, 2013
Date of reporting period: July 31, 2013
Item I. Reports to Stockholders.
A copy of the Semi -Annual Report to Stockholders for the period ended 7/31/13 is included with this Form.
| INVESTMENT ADVISER | EULAV Asset Management | S E M I – A N N U A L R E P O R T | |||
7 Times Square 21st Floor | J u l y 3 1 , 2 0 1 3 | ||||
| New York, NY 10036-6524 | |||||
| DISTRIBUTOR | EULAV Securities LLC | ||||
7 Times Square 21st Floor | |||||
| New York, NY 10036-6524 | |||||
| CUSTODIAN BANK | State Street Bank and Trust Co. | ||||
| 225 Franklin Street | |||||
| Boston, MA 02110 | |||||
| SHAREHOLDER | State Street Bank and Trust Co. | ||||
| SERVICING AGENT | c/o BFDS | ||||
| P.O. Box 219729 | |||||
| Kansas City, MO 64121-9729 | |||||
| INDEPENDENT | PricewaterhouseCoopers LLP | ||||
| REGISTERED PUBLIC | 300 Madison Avenue | ||||
| ACCOUNTING FIRM | New York, NY 10017 | ||||
| LEGAL COUNSEL | Peter D. Lowenstein, Esq. | Value Line Core Bond Fund  | |||
| 515 West Lyon Farm Drive | |||||
| Greenwich, CT 06831 | |||||
| DIRECTORS | Mitchell E. Appel | ||||
| Joyce E. Heinzerling | |||||
| Francis C. Oakley | |||||
| David H. Porter | |||||
| Paul Craig Roberts | |||||
| Nancy-Beth Sheerr | |||||
| Daniel S. Vandivort | |||||
| OFFICERS | Mitchell E. Appel | ||||
| President | |||||
| Michael J. Wagner | |||||
| Chief Compliance Officer | |||||
| Emily D. Washington | |||||
| Treasurer and Secretary | |||||
 | |||||
| This unaudited report is issued for information to shareholders. It is not authorized for distribution to prospective investors unless preceded or accompanied by a currently effective prospectus of the Fund (obtainable from the Distributor). | |||||
| #00101698 | |||||
| Value Line Core Bond Fund |
| To Our Value Line Core |
| /s/ Mitchell Appel | |
| Mitchell Appel, President |
| /s/ Liane Rosenberg | |
| Liane Rosenberg, Portfolio Manager September 9, 2013 |
| Past performance does not guarantee future results. Investment return and principal value of an investment can fluctuate so that an investor’s shares, when redeemed, may be worth more or less than their original cost; and that current performance may be lower or higher than the performance data quoted. Investors should carefully consider the investment objectives, risks, charges and expense of a fund. This and other important information about a fund is contained in the fund’s prospectus. A copy of our fund’s prospectus can be obtained free of charge by going to our website at www.vlfunds.com or calling 800.243.2729. | |
| (1) | The Barclay’s Capital U.S. Aggregate Bond Index is a broad-based benchmark that measures the investment grade, U.S. dollar-denominated, fixed-rate taxable bond market, including Treasuries, government-related and corporate securities, MBS (agency fixedrate and hybrid ARM pass-through’s), ABS, and CMBS. This is an unmanaged index and does not reflect charges, expenses or taxes, which are deducted from the Fund’s return. It is not possible to directly invest in this index. |
| 2 | |
| Value Line Core Bond Fund |
| Bond Fund Shareholders |
| Value Line Core Bond Fund |
Beginning account value 2/1/13 | Ending account value 7/31/13 | Expenses paid during period 2/1/13 thru 7/31/13* | ||||||||
| Actual | $ | 1,000.00 | $ | 973.24 | $ | 4.95 | ||||
| Hypothetical (5% return before expenses). | $ | 1,000.00 | $ | 1,019.78 | $ | 5.06 |
| * Expenses are equal to the Fund’s annualized expense ratio of 1.01% multiplied by the average account value over the period, multiplied by 181/365 to reflect the one-half year period. This expense ratio may differ from the expense ratio shown in the Financial Highlights. |
| Value Line Core Bond Fund |
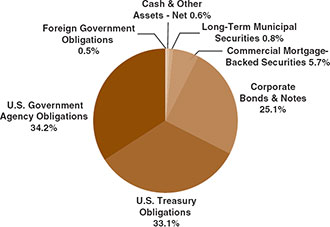
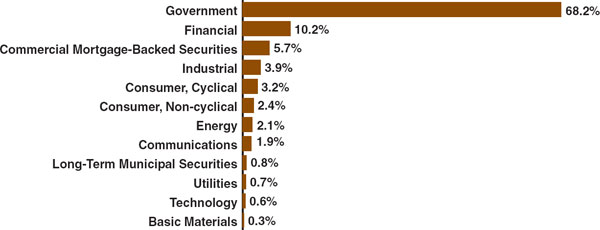
| Portfolio Highlights at July 31, 2013 (unaudited) |
| Issue | Principal Amount | Value | Percentage of Net Assets | |||||||
| U.S. Treasury Notes, 0.88%, 12/31/16 | $ | 3,800,000 | $ | 3,809,500 | 4.1 | % | ||||
| U.S. Treasury Notes, 1.25%, 4/30/19 | 2,300,000 | 2,250,587 | 2.4 | % | ||||||
| Federal Home Loan Bank, 5.00%, 12/21/15 | 2,000,000 | 2,212,302 | 2.4 | % | ||||||
| U.S. Treasury Notes, 0.75%, 12/31/17 | 2,000,000 | 1,961,094 | 2.1 | % | ||||||
| Federal Home Loan Mortgage Corporation Gold PC Pool #C09004, 3.50%, 7/1/42 | 1,946,526 | 1,959,397 | 2.1 | % | ||||||
| U.S. Treasury Notes, 1.38%, 2/28/19 | 1,700,000 | 1,680,875 | 1.8 | % | ||||||
| U.S. Treasury Notes, 1.38%, 11/30/15 | 1,500,000 | 1,533,633 | 1.7 | % | ||||||
| U.S. Treasury Notes, 1.00%, 8/31/16 | 1,500,000 | 1,515,586 | 1.6 | % | ||||||
| Federal National Mortgage Association Pool #MA1107, 3.50%, 7/1/32 | 1,463,196 | 1,499,432 | 1.6 | % | ||||||
| Federal National Mortgage Association, 7.25%, 5/15/30 | 1,000,000 | 1,422,789 | 1.5 | % | ||||||
| Value Line Core Bond Fund |
Portfolio Highlights at July 31, 2013 (unaudited) |
Percentage of Fund’s Investments | |||||
| Less than 4% | 69.1 | % | |||
| 4-4.99% | 12.7 | % | |||
| 5-5.99% | 9.5 | % | |||
| 6-6.99% | 2.7 | % | |||
| 7-7.99% | 5.1 | % | |||
| 8-8.99% | 0.9 | % | |||
| Value Line Core Bond Fund | |
| Schedule of Investments (unaudited) | July 31, 2013 |
Principal Amount | Value | ||||||
| CORPORATE BONDS & NOTES (25.1%) | |||||||
| BASIC MATERIALS (0.2%) | |||||||
| $ | 250,000 | International Flavors & Fragrances, Inc., Senior Unsecured Notes, 3.20%, 5/1/23 | $ | 235,078 | |||
| COMMUNICATIONS (1.9%) | |||||||
| 250,000 | America Movil S.A.B. de C.V., Guaranteed Notes, 5.00%, 3/30/20 | 270,327 | |||||
| 500,000 | Comcast Corp., Guaranteed Notes, 4.25%, 1/15/33 | 481,714 | |||||
| 500,000 | DIRECTV Holdings LLC / DIRECTV Financing Co., Inc., Guaranteed Notes, 3.80%, 3/15/22 | 480,640 | |||||
| 500,000 | MetroPCS Wireless, Inc., Guaranteed Notes, 6.63%, 11/15/20 | 525,000 | |||||
| 1,757,681 | |||||||
| CONSUMER, CYCLICAL (3.2%) | |||||||
| 250,000 | Ford Motor Co., Senior Unsecured Notes, 7.45%, 7/16/31 | 308,262 | |||||
| 500,000 | Home Depot, Inc. (The), Senior Unsecured Notes, 3.95%, 9/15/20 | 542,767 | |||||
| 115,000 | Lennar Corp., Series B, Guaranteed Notes, 6.50%, 4/15/16 | 123,913 | |||||
| 200,000 | Macy’s Retail Holdings, Inc., Guaranteed Notes, 8.13%, 8/15/35 | 218,862 | |||||
| 250,000 | Marriott International, Inc., Senior Unsecured Notes, 3.25%, 9/15/22 | 233,731 | |||||
| 300,000 | Royal Caribbean Cruises Ltd., Senior Unsecured Notes, 7.50%, 10/15/27 | 327,750 | |||||
| 500,000 | Starwood Hotels & Resorts Worldwide, Inc., Senior Unsecured Notes, 3.13%, 2/15/23 | 458,762 | |||||
| Principal | |||||||
| Amount | Value | ||||||
| $ | 250,000 | Toll Brothers Finance Corp., Guaranteed Notes, 4.38%, 4/15/23 | $ | 237,500 | |||
| 250,000 | Wyndham Worldwide Corp., Senior Unsecured Notes, 3.90%, 3/1/23 | 237,620 | |||||
| 200,000 | Wynn Las Vegas LLC / Wynn Las Vegas Capital Corp., 7.75%, 8/15/20 | 225,000 | |||||
| 2,914,167 | |||||||
| CONSUMER, NON-CYCLICAL (2.4%) | |||||||
| 400,000 | Amgen, Inc., Senior Unsecured Notes, 2.50%, 11/15/16 | 416,456 | |||||
| 250,000 | Constellation Brands, Inc., Guaranteed Notes, 4.25%, 5/1/23 | 235,625 | |||||
| 250,000 | Hawk Acquisition Sub, Inc., Secured Notes, 4.25%, 10/15/20 (1) | 240,000 | |||||
| 500,000 | Kimberly-Clark Corp., Senior Unsecured Notes, 2.40%, 6/1/23 | 463,961 | |||||
| 250,000 | Kroger Co. (The), Senior Unsecured Notes, 5.15%, 8/1/43 | 250,565 | |||||
| 250,000 | St Jude Medical, Inc., Senior Unsecured Notes, 4.75%, 4/15/43 | 236,856 | |||||
| 400,000 | Teva Pharmaceutical Finance IV LLC, Guaranteed Notes, 2.25%, 3/18/20 | 381,556 | |||||
| 2,225,019 | |||||||
| ENERGY (2.1%) | |||||||
| 400,000 | CGG, Guaranteed Notes, 7.75%, 5/15/17 | 410,000 | |||||
| 500,000 | Enterprise Products Operating LLC, Guaranteed Notes, 4.85%, 8/15/42 | 484,487 | |||||
| 500,000 | Kinder Morgan Energy Partners L.P., Senior Unsecured Notes, 2.65%, 2/1/19 | 502,771 | |||||
| 250,000 | Phillips 66, Guaranteed Notes, 4.30%, 4/1/22 | 257,400 |
| See Notes to Financial Statements. |
| 7 |
| Value Line Core Bond Fund | |
| July 31, 2013 |
| Principal | |||||||
| Amount | Value | ||||||
| $ | 250,000 | Williams Partners L.P., Senior Unsecured Notes, 4.13%, 11/15/20 | $ | 252,049 | |||
| 1,906,707 | |||||||
| FINANCIAL (10.1%) | |||||||
| 250,000 | ACE INA Holdings, Inc., Guaranteed Notes, 2.70%, 3/13/23 | 234,907 | |||||
| 500,000 | American International Group, Inc. MTN, Senior Unsecured Notes, 5.85%, 1/16/18 | 569,146 | |||||
| 250,000 | Bank of America Corp. MTN, Senior Unsecured Notes, 3.30%, 1/11/23 | 235,354 | |||||
| 350,000 | BlackRock, Inc., Series 2, Senior Unsecured Notes, 5.00%, 12/10/19 | 398,380 | |||||
| 250,000 | BRE Properties, Inc., REIT, Senior Unsecured Notes, 3.38%, 1/15/23 | 234,177 | |||||
| 350,000 | Capital One NA/Mclean VA, Senior Notes, 1.50%, 3/22/18 | 338,346 | |||||
| 500,000 | CIT Group, Inc., Senior Unsecured Notes, 5.00%, 8/15/22 | 495,625 | |||||
| 500,000 | Citigroup, Inc., Senior Unsecured Notes, 1.70%, 7/25/16 | 500,062 | |||||
| 250,000 | Credit Agricole SA, Senior Unsecured Notes, 2.13%, 4/17/18 (1) | 244,725 | |||||
| 250,000 | Discover Bank/Greenwood DE, Senior Unsecured Notes, 2.00%, 2/21/18 | 243,386 | |||||
| 250,000 | Fifth Third Bank, Senior Unsecured Notes, 1.45%,2/28/18 | 242,843 | |||||
| 250,000 | General Electric Capital Corp. MTN, Senior Unsecured Notes, 1.03%, 8/11/15 (2) | 250,750 | |||||
| 250,000 | General Motors Financial Co., Inc., Senior Unsecured Notes, 2.75%, 5/15/16 (1) | 249,063 | |||||
| 500,000 | Goldman Sachs Group, Inc. (The), Senior Unsecured Notes, 3.63%, 1/22/23 | 478,740 |
| Principal | |||||||
| Amount | Value | ||||||
| $ | 500,000 | HSBC Holdings PLC, Senior Unsecured Notes, 4.00%, 3/30/22 | $ | 510,506 | |||
| 250,000 | Icahn Enterprises L.P. / Icahn Enterprises Finance Corp., Guaranteed Notes, 8.00%, 1/15/18 | 264,063 | |||||
| 250,000 | International Lease Finance Corp., Senior Unsecured Notes, 8.25%, 12/15/20 | 289,375 | |||||
| 500,000 | Morgan Stanley, Senior Unsecured Notes, 4.75%, 3/22/17 | 537,336 | |||||
| 500,000 | PNC Funding Corp., Guaranteed Notes, 5.13%, 2/8/20 | 558,844 | |||||
| 1,000,000 | Private Export Funding Corp., Series GG, 2.45%, 7/15/24 | 906,567 | |||||
| 250,000 | State Street Corp., Subordinated Notes, 3.10%, 5/15/23 | 233,991 | |||||
| 500,000 | Toyota Motor Credit Corp., Senior Unsecured Notes, 0.80%, 5/17/16 | 498,688 | |||||
| 500,000 | Wells Fargo & Co., Series M, Subordinated Notes, 3.45%, 2/13/23 | 478,654 | |||||
| 250,000 | Weyerhaeuser Co., Senior Unsecured Notes, 7.38%, 10/1/19 | 301,809 | |||||
| 9,295,337 | |||||||
| INDUSTRIAL (3.9%) | |||||||
| 500,000 | Agilent Technologies, Inc., Senior Unsecured Notes, 5.50%, 9/14/15 | 544,086 | |||||
| 350,000 | Alliant Techsystems, Inc., Guaranteed Notes, 6.88%, 9/15/20 | 375,813 | |||||
| 500,000 | Briggs & Stratton Corp., Guaranteed Notes, 6.88%, 12/15/20 | 551,875 | |||||
| 350,000 | Burlington Northern Santa Fe LLC, Senior Unsecured Notes, 3.05%, 3/15/22 | 339,810 | |||||
| 500,000 | Canadian National Railway Co., Senior Unsecured Notes, 5.55%, 3/1/19 | 585,342 |
| See Notes to Financial Statements. |
| 8 |
| Value Line Core Bond Fund | |
| Schedule of Investments (unaudited) |
| Principal | |||||||
| Amount | Value | ||||||
| $ | 200,000 | Crown Americas LLC / Crown Americas Capital Corp. III, Guaranteed Notes, 6.25%, 2/1/21 | $ | 212,500 | |||
| 250,000 | General Electric Co., Senior Unsecured Notes, 4.13%, 10/9/42 | 233,116 | |||||
| 200,000 | Masco Corp., Senior Unsecured Notes, 7.13%, 3/15/20 | 226,500 | |||||
| 500,000 | Ryder System, Inc. MTN, Senior Unsecured Notes, 3.50%, 6/1/17 | 518,268 | |||||
| 3,587,310 | |||||||
| TECHNOLOGY (0.6%) | |||||||
| 500,000 | Apple, Inc., Senior Unsecured Notes, 2.40%, 5/3/23 | 458,679 | |||||
| 81,000 | Broadridge Financial Solutions, Inc., Senior Unsecured Notes, 6.13%, 6/1/17 | 88,841 | |||||
| 547,520 | |||||||
| UTILITIES (0.7%) | |||||||
| 250,000 | Alabama Power Co., Senior Unsecured Notes, 3.85%, 12/1/42 | 222,371 | |||||
| 380,000 | Florida Power & Light Co., 4.95%, 6/1/35 | 409,947 | |||||
| 632,318 | |||||||
TOTAL CORPORATE BONDS & NOTES (Cost $23,626,190) (25.1%) | 23,101,137 | ||||||
| COMMERCIAL MORTGAGE-BACKED SECURITIES (5.7%) | |||||||
| 500,000 | Citigroup Commercial Mortgage Trust, Series 2012-GC8, Class A4, 3.02%, 9/10/45 | 476,199 | |||||
| 350,000 | Commercial Mortgage Pass Through Certificates, Series 2012-CR4, Class A3, 2.85%, 10/15/45 | 326,874 | |||||
| 500,000 | Commercial Mortgage Pass Through Certificates, Series 2013-LC6, Class A4, 2.94%, 1/10/46 | 468,931 | |||||
| Principal | |||||||
| Amount | Value | ||||||
| $ | 500,000 | Federal Home Loan Mortgage Corp. Multifamily Structured Pass Through Certificates, Series K704, Class A2, 2.41%, 8/25/18 | $ | 508,249 | |||
| 454,000 | Federal National Mortgage Association, Series 2012-M3, Class 2A2, 2.43%, 1/25/19 | 460,426 | |||||
| 300,000 | Government National Mortgage Association, Series 2010-155 Class B, 2.53%, 6/16/39 | 307,962 | |||||
| 347,391 | Government National Mortgage Association, Series 2013-12 Class AB, 1.83%, 11/16/52 | 338,372 | |||||
| 600,000 | Government National Mortgage Association, Series 2013-12, Class B, 2.45%, 11/16/52 (2) | 572,834 | |||||
| 444,815 | Government National Mortgage Association, Series 2012-125 Class AB, 2.11%, 2/16/53 (2) | 431,012 | |||||
| 250,000 | Morgan Stanley Bank of America Merrill Lynch Trust, Series 2012-C5, Class A4, 3.18%, 8/15/45 | 241,542 | |||||
| 400,000 | Morgan Stanley Bank of America Merrill Lynch Trust, Series 2012-C6, Class A4, 2.86%, 11/15/45 | 375,339 | |||||
| 250,000 | Morgan Stanley Bank of America Merrill Lynch Trust, Series 2013-C8, Class A2, 1.69%, 12/15/48 | 246,276 | |||||
| 250,000 | UBS-Barclays Commercial Mortgage Trust, Series 2012-C4, Class A5, 2.85%, 12/10/45 | 231,668 | |||||
| 250,000 | UBS-Barclays Commercial Mortgage Trust, Series 2013-C5, Class A4, 3.18%, 3/10/46 | 237,339 | |||||
TOTAL COMMERCIAL MORTGAGE-BACKED SECURITIES (Cost $5,573,985) (5.7%) | 5,223,023 |
| See Notes to Financial Statements. | |
| 9 |
| Value Line Core Bond Fund |
| July 31, 2013 |
| Principal | |||||||
| Amount | Value | ||||||
| FOREIGN GOVERNMENT OBLIGATIONS (0.5%) | |||||||
| $ | 250,000 | Asian Development Bank MTN, Senior Unsecured Notes, 1.38%, 3/23/20 | $ | 238,780 | |||
| 250,000 | International Bank for Reconstruction & Development, Senior Unsecured Notes, 0.50%, 4/15/16 | 249,527 | |||||
TOTAL FOREIGN GOVERNMENT OBLIGATIONS (Cost $499,564) (0.5%) | 488,307 | ||||||
| LONG-TERM MUNICIPAL SECURITIES (0.8%) | |||||||
| CALIFORNIA (0.3%) | |||||||
| 350,000 | San Francisco California Bay Area Rapid Transit District, Series B, 4.09%, 7/1/32 | 326,211 | |||||
| TEXAS (0.5%) | |||||||
| 500,000 | Tarrant County Cultural Education Facilities Finance Corp., Hospital Revenue Baylor Health Care System Project, Series C, 4.45%, 11/15/43 | 437,345 | |||||
TOTAL LONG-TERM MUNICIPAL SECURITIES (Cost $856,282) (0.8%) | 763,556 | ||||||
| U.S. TREASURY OBLIGATIONS (33.1%) | |||||||
| U.S. TREASURY NOTES & BONDS (33.1%) | |||||||
| 800,000 | U.S. Treasury Bonds, 7.88%, 2/15/21 | 1,125,500 | |||||
| 500,000 | U.S. Treasury Bonds, 4.38%, 5/15/40 | 572,265 | |||||
| 450,000 | U.S. Treasury Bonds, 3.75%, 8/15/41 | 463,078 | |||||
| 100,000 | U.S. Treasury Notes, 0.25%, 8/15/15 | 99,836 | |||||
| 500,000 | U.S. Treasury Notes, 0.25%, 10/15/15 | 498,633 | |||||
| Principal | |||||||
| Amount | Value | ||||||
| $ | 1,500,000 | U.S. Treasury Notes, 1.38%, 11/30/15 | $ | 1,533,633 | |||
| 1,000,000 | U.S. Treasury Notes, 0.38%, 1/15/16 | 998,359 | |||||
| 100,000 | U.S. Treasury Notes, 1.50%, 6/30/16 | 102,617 | |||||
| 1,300,000 | U.S. Treasury Notes, 1.50%, 7/31/16 | 1,333,719 | |||||
| 1,500,000 | U.S. Treasury Notes, 1.00%, 8/31/16 | 1,515,586 | |||||
| 3,800,000 | U.S. Treasury Notes, 0.88%, 12/31/16 | 3,809,500 | |||||
| 1,100,000 | U.S. Treasury Notes, 1.00%, 3/31/17 | 1,103,782 | |||||
| 150,000 | U.S. Treasury Notes, 1.88%, 9/30/17 | 154,676 | |||||
| 400,000 | U.S. Treasury Notes, 0.63%, 11/30/17 | 390,781 | |||||
| 2,000,000 | U.S. Treasury Notes, 0.75%, 12/31/17 | 1,961,094 | |||||
| 1,000,000 | U.S. Treasury Notes, 2.38%, 5/31/18 | 1,048,828 | |||||
| 1,400,000 | U.S. Treasury Notes, 1.50%, 8/31/18 | 1,405,578 | |||||
| 1,250,000 | U.S. Treasury Notes, 1.38%, 9/30/18 | 1,245,312 | |||||
| 1,000,000 | U.S. Treasury Notes, 1.38%, 11/30/18 | 993,438 | |||||
| 900,000 | U.S. Treasury Notes, 1.38%, 12/31/18 | 892,406 | |||||
| 1,700,000 | U.S. Treasury Notes, 1.38%, 2/28/19 | 1,680,875 | |||||
| 2,300,000 | U.S. Treasury Notes, 1.25%, 4/30/19 | 2,250,587 | |||||
| 1,100,000 | U.S. Treasury Notes, 3.13%, 5/15/19 | 1,191,352 | |||||
| 1,000,000 | U.S. Treasury Notes, 1.38%, 1/31/20 | 969,141 | |||||
| 300,000 | U.S. Treasury Notes, 3.50%, 5/15/20 | 330,563 | |||||
| 950,000 | U.S. Treasury Notes, 2.63%, 8/15/20 | 989,484 | |||||
| 500,000 | U.S. Treasury Notes, 2.13%, 8/15/21 | 494,961 | |||||
| 600,000 | U.S. Treasury Notes, 2.00%, 2/15/22 | 582,703 | |||||
| See Notes to Financial Statements. |
| 10 |
| Value Line Core Bond Fund |
| Schedule of Investments (unaudited) |
| Principal | |||||||
| Amount | Value | ||||||
| $ | 586,795 | U.S. Treasury Notes, 2.00%, 1/15/26 (3) | $ | 678,940 | |||
| 30,417,227 | |||||||
TOTAL U.S. TREASURY OBLIGATIONS (Cost $31,097,204) (33.1%) | 30,417,227 | ||||||
| U.S. GOVERNMENT AGENCY OBLIGATIONS (34.2%) | |||||||
| FEDERAL HOME LOAN BANK | (2.4%) | ||||||
| 2,000,000 | Federal Home Loan Bank, 5.00%, 12/21/15 | 2,212,302 | |||||
| FEDERAL HOME LOAN MORTGAGE CORPORATION (13.5%) | |||||||
| 1,000,000 | Federal Home Loan Mortgage Corporation, 2.00%, 8/25/16 | 1,038,568 | |||||
| 600,000 | Federal Home Loan Mortgage Corporation, 1.25%, 5/12/17 | 603,103 | |||||
| 276,053 | Federal Home Loan Mortgage Corporation Gold PC Pool #A29526, 5.00%, 1/1/35 | 296,321 | |||||
| 85,811 | Federal Home Loan Mortgage Corporation Gold PC Pool #A29633, 5.00%, 1/1/35 | 92,112 | |||||
| 75,191 | Federal Home Loan Mortgage Corporation Gold PC Pool #A56491, 5.00%, 1/1/37 | 80,520 | |||||
| 817,370 | Federal Home Loan Mortgage Corporation Gold PC Pool #A95803, 4.00%, 12/1/40 | 851,562 | |||||
| 317,222 | Federal Home Loan Mortgage Corporation Gold PC Pool #A96409, 3.50%, 1/1/41 | 319,320 | |||||
| 206,485 | Federal Home Loan Mortgage Corporation Gold PC Pool #A97264, 4.00%, 2/1/41 | 214,251 | |||||
| 23,023 | Federal Home Loan Mortgage Corporation Gold PC Pool #B12822, 5.00%, 3/1/19 | 24,705 | |||||
| 11,032 | Federal Home Loan Mortgage Corporation Gold PC Pool #B17398, 4.50%, 12/1/19 | 11,692 | |||||
| Principal | |||||||
| Amount | Value | ||||||
| $ | 51,301 | Federal Home Loan Mortgage Corporation Gold PC Pool #B18034, 4.50%, 4/1/20 | $ | 54,435 | |||
| 486,431 | Federal Home Loan Mortgage Corporation Gold PC Pool #C03516, 4.00%, 9/1/40 | 504,749 | |||||
| 1,946,526 | Federal Home Loan Mortgage Corporation Gold PC Pool #C09004, 3.50%, 7/1/42 | 1,959,397 | |||||
| 25,374 | Federal Home Loan Mortgage Corporation Gold PC Pool #C91413, 3.50%, 12/1/31 | 26,002 | |||||
| 2,821 | Federal Home Loan Mortgage Corporation Gold PC Pool #E92226, 5.00%, 11/1/17 | 2,983 | |||||
| 3,645 | Federal Home Loan Mortgage Corporation Gold PC Pool #E92829, 5.00%, 12/1/17 | 3,855 | |||||
| 39,987 | Federal Home Loan Mortgage Corporation Gold PC Pool #E93499, 5.00%, 12/1/17 | 42,291 | |||||
| 4,255 | Federal Home Loan Mortgage Corporation Gold PC Pool #E98960, 5.00%, 9/1/18 | 4,501 | |||||
| 288,543 | Federal Home Loan Mortgage Corporation Gold PC Pool #G06224, 3.50%, 1/1/41 | 290,450 | |||||
| 55,530 | Federal Home Loan Mortgage Corporation Gold PC Pool #G08184, 5.00%, 1/1/37 | 59,465 | |||||
| 831,989 | Federal Home Loan Mortgage Corporation Gold PC Pool #G08488, 3.50%, 4/1/42 | 837,491 | |||||
| 7,641 | Federal Home Loan Mortgage Corporation Gold PC Pool #G11986, 5.00%, 4/1/21 | 8,240 | |||||
| 10,748 | Federal Home Loan Mortgage Corporation Gold PC Pool #G12319, 5.00%, 6/1/21 | 11,593 | |||||
| 553,544 | Federal Home Loan Mortgage Corporation Gold PC Pool #G14216, 3.50%, 7/1/21 | 583,321 | |||||
| 64,651 | Federal Home Loan Mortgage Corporation Gold PC Pool #G18044, 4.50%, 3/1/20 | 68,601 | |||||
| See Notes to Financial Statements. |
| 11 |
| Value Line Core Bond Fund |
| July 31, 2013 |
| Principal | |||||||
| Amount | Value | ||||||
| $ | 8,268 | Federal Home Loan Mortgage Corporation Gold PC Pool #J00118, 5.00%, 10/1/20 | $ | 8,918 | |||
| 180,592 | Federal Home Loan Mortgage Corporation Gold PC Pool #J00139, 5.00%, 10/1/20 | 191,099 | |||||
| 54,526 | Federal Home Loan Mortgage Corporation Gold PC Pool #J03233, 5.00%, 8/1/21 | 58,800 | |||||
| 478,963 | Federal Home Loan Mortgage Corporation Gold PC Pool #J11587, 4.00%, 1/1/25 | 517,585 | |||||
| 43,255 | Federal Home Loan Mortgage Corporation Gold PC Pool #Q01181, 4.50%, 6/1/41 | 45,676 | |||||
| 145,161 | Federal Home Loan Mortgage Corporation Gold PC Pool #Q06307, 3.50%, 2/1/42 | 146,121 | |||||
| 228,442 | Federal Home Loan Mortgage Corporation Gold PC Pool #Q08903, 3.50%, 6/1/42 | 229,953 | |||||
| 495,187 | Federal Home Loan Mortgage Corporation Gold PC Pool #Q11556, 3.00%, 10/1/42 | 479,145 | |||||
| 875,511 | Federal Home Loan Mortgage Corporation Gold PC Pool #Q11908, 3.50%, 10/1/42 | 881,300 | |||||
| 491,719 | Federal Home Loan Mortgage Corporation Gold PC Pool #Q14593, 3.00%, 1/1/43 | 475,790 | |||||
| 172,571 | Federal Home Loan Mortgage Corporation Pool #783022, 2.40%, 2/1/35 (2) | 183,683 | |||||
| 169,332 | Federal Home Loan Mortgage Corporation REMIC Trust Series 2643 Class ME, 3.50%, 3/15/18 | 173,873 | |||||
| 15,177 | Federal Home Loan Mortgage Corporation REMIC Trust Series 2645 Class NA, 3.50%, 9/15/31 | 15,285 | |||||
| 924,849 | Federal Home Loan Mortgage Corporation REMIC Trust Series 3632 Class AP, 3.00%, 2/15/40 | 964,910 | |||||
| 12,361,666 | |||||||
| Principal | |||||||
| Amount | Value | ||||||
| FEDERAL NATIONAL MORTGAGE ASSOCIATION (16.1%) | |||||||
| $ | 500,000 | Federal National Mortgage Association, 1.10%, 7/11/17 | $ | 493,661 | |||
| 1,000,000 | Federal National Mortgage Association, 1.10%, 3/12/18 | 970,735 | |||||
| 1,000,000 | Federal National Mortgage Association, 7.25%, 5/15/30 | 1,422,789 | |||||
| 22,207 | Federal National Mortgage Association Pool #254383, 7.50%, 6/1/32 | 26,492 | |||||
| 64,672 | Federal National Mortgage Association Pool #254476, 5.50%, 9/1/32 | 70,873 | |||||
| 58,727 | Federal National Mortgage Association Pool #254684, 5.00%, 3/1/18 | 62,582 | |||||
| 133,795 | Federal National Mortgage Association Pool #255496, 5.00%, 11/1/34 | 144,308 | |||||
| 10,676 | Federal National Mortgage Association Pool #255580, 5.50%, 2/1/35 | 11,664 | |||||
| 6,187 | Federal National Mortgage Association Pool #258149, 5.50%, 9/1/34 | 6,779 | |||||
| 36,731 | Federal National Mortgage Association Pool #412682, 6.00%, 3/1/28 | 40,587 | |||||
| 7,119 | Federal National Mortgage Association Pool #511823, 5.50%, 5/1/16 | 7,529 | |||||
| 197 | Federal National Mortgage Association Pool #568625, 7.50%, 1/1/31 | 203 | |||||
| 31,083 | Federal National Mortgage Association Pool #571090, 7.50%, 1/1/31 | 31,809 | |||||
| 1,708 | Federal National Mortgage Association Pool #573935, 7.50%, 3/1/31 | 1,833 | |||||
| 3,511 | Federal National Mortgage Association Pool #615289, 5.50%, 12/1/16 | 3,716 | |||||
| See Notes to Financial Statements. |
| 12 |
| Value Line Core Bond Fund | |
| Schedule of Investments (unaudited) |
| Principal | |||||||
| Amount | Value | ||||||
| $ | 28,630 | Federal National Mortgage Association Pool #622373, 5.50%, 12/1/16 | $ | 30,304 | |||
| 41,299 | Federal National Mortgage Association Pool #623503, 6.00%, 2/1/17 | 43,454 | |||||
| 228,923 | Federal National Mortgage Association Pool #626440, 7.50%, 2/1/32 | 262,452 | |||||
| 1,413 | Federal National Mortgage Association Pool #629297, 6.50%, 2/1/32 | 1,509 | |||||
| 22,615 | Federal National Mortgage Association Pool #631328, 5.50%, 2/1/17 | 23,948 | |||||
| 2,467 | Federal National Mortgage Association Pool #638247, 5.50%, 5/1/17 | 2,611 | |||||
| 1,804 | Federal National Mortgage Association Pool #643277, 5.50%, 4/1/17 | 1,909 | |||||
| 18,257 | Federal National Mortgage Association Pool #685183, 5.00%, 3/1/18 | 19,458 | |||||
| 2,525 | Federal National Mortgage Association Pool #688539, 5.50%, 3/1/33 | 2,764 | |||||
| 28,993 | Federal National Mortgage Association Pool #703936, 5.00%, 5/1/18 | 30,915 | |||||
| 60,256 | Federal National Mortgage Association Pool #726889, 5.50%, 7/1/33 | 65,946 | |||||
| 132,845 | Federal National Mortgage Association Pool #735224, 5.50%, 2/1/35 | 145,389 | |||||
| 43,688 | Federal National Mortgage Association Pool #763393, 5.50%, 2/1/34 | 47,813 | |||||
| 6,741 | Federal National Mortgage Association Pool #769682, 5.00%, 3/1/34 | 7,271 | |||||
| 72,376 | Federal National Mortgage Association Pool #769862, 5.50%, 2/1/34 | 79,070 | |||||
| 1,420 | Federal National Mortgage Association Pool #778141, 5.00%, 5/1/34 | 1,531 |
| Principal | |||||||
| Amount | Value | ||||||
| $ | 340,109 | Federal National Mortgage Association Pool #780956, 4.50%, 5/1/19 | $ | 369,606 | |||
| 1,003 | Federal National Mortgage Association Pool #789150, 5.00%, 10/1/34 | 1,081 | |||||
| 18,404 | Federal National Mortgage Association Pool #797154, 5.50%, 11/1/34 | 20,026 | |||||
| 44,865 | Federal National Mortgage Association Pool #801063, 5.50%, 11/1/34 | 49,015 | |||||
| 33,094 | Federal National Mortgage Association Pool #803675, 5.50%, 12/1/34 | 36,155 | |||||
| 47,010 | Federal National Mortgage Association Pool #804683, 5.50%, 12/1/34 | 51,359 | |||||
| 218,477 | Federal National Mortgage Association Pool #815813, 2.57%, 2/1/35 (2) | 231,800 | |||||
| 244,290 | Federal National Mortgage Association Pool #919584, 6.00%, 6/1/37 | 267,041 | |||||
| 35,223 | Federal National Mortgage Association Pool #AA2531, 4.50%, 3/1/39 | 37,320 | |||||
| 476,302 | Federal National Mortgage Association Pool #AB2346, 4.50%, 2/1/41 | 505,422 | |||||
| 909,899 | Federal National Mortgage Association Pool #AB5231, 2.50%, 5/1/27 | 910,429 | |||||
| 448,701 | Federal National Mortgage Association Pool #AB5716, 3.00%, 7/1/27 | 462,009 | |||||
| 41,262 | Federal National Mortgage Association Pool #AD1035, 4.50%, 2/1/40 | 43,769 | |||||
| 260,434 | Federal National Mortgage Association Pool #AD7136, 5.00%, 7/1/40 | 281,809 | |||||
| 209,083 | Federal National Mortgage Association Pool #AD8536, 5.00%, 8/1/40 | 229,417 | |||||
| 608,392 | Federal National Mortgage Association Pool #AH5575, 4.00%, 2/1/41 | 632,428 |
| See Notes to Financial Statements. | |
| 13 |
| Value Line Core Bond Fund | |
| July 31, 2013 |
| Principal | |||||||
| Amount | Value | ||||||
| $ | 637,494 | Federal National Mortgage Association Pool #AH8932, 4.50%, 4/1/41 | $ | 676,140 | |||
| 62,506 | Federal National Mortgage Association Pool #AI0620, 4.50%, 5/1/41 | 66,328 | |||||
| 279,952 | Federal National Mortgage Association Pool #AJ5888, 4.50%, 11/1/41 | 296,481 | |||||
| 935,065 | Federal National Mortgage Association Pool #AO7977, 3.00%, 6/1/27 | 962,832 | |||||
| 436,273 | Federal National Mortgage Association Pool #AQ0287, 3.00%, 10/1/42 | 423,430 | |||||
| 495,539 | Federal National Mortgage Association Pool #AR2174, 3.00%, 4/1/43 | 480,952 | |||||
| 496,274 | Federal National Mortgage Association Pool #AR6394, 3.00%, 2/1/43 | 481,665 | |||||
| 573,923 | Federal National Mortgage Association Pool #MA0641, 4.00%, 2/1/31 | 597,166 | |||||
| 1,463,196 | Federal National Mortgage Association Pool #MA1107, 3.50%, 7/1/32 | 1,499,432 | |||||
| 34,633 | Federal National Mortgage Association REMIC Trust Series 2003-17 Class ED, 4.25%, 9/25/22 | 34,931 | |||||
| 46,766 | Federal National Mortgage Association REMIC Trust Series 2003-38 Class TC, 5.00%, 3/25/23 | 49,231 | |||||
| 270,972 | Federal National Mortgage Association REMIC Trust Series 2004-60 Class LB, 5.00%, 4/25/34 | 294,483 | |||||
| 530,722 | Federal National Mortgage Association REMIC Trust Series 2009-88 Class MA, 4.50%, 10/25/39 | 572,536 | |||||
| 195,047 | Federal National Mortgage Association REMIC Trust Series 2013-18 Class AE, 2.00%, 3/25/28 | 189,240 | |||||
| 14,815,437 |
| Principal | |||||||
| Amount | Value | ||||||
GOVERNMENT NATIONAL MORTGAGE ASSOCIATION (2.2%) | |||||||
| $ | 47,599 | Government National Mortgage Association Pool #003645, 4.50%, 12/20/19 | $ | 51,011 | |||
| 2,193 | Government National Mortgage Association Pool #429786, 6.00%, 12/15/33 | 2,476 | |||||
| 42,868 | Government National Mortgage Association Pool #548880, 6.00%, 12/15/31 | 47,803 | |||||
| 29,032 | Government National Mortgage Association Pool #551762, 6.00%, 4/15/32 | 32,341 | |||||
| 3,220 | Government National Mortgage Association Pool #557681, 6.00%, 8/15/31 | 3,590 | |||||
| 16,451 | Government National Mortgage Association Pool #582415, 6.00%, 11/15/32 | 18,326 | |||||
| 72,866 | Government National Mortgage Association Pool #583008, 5.50%, 6/15/34 | 79,879 | |||||
| 66,030 | Government National Mortgage Association Pool #605025, 6.00%, 2/15/34 | 73,585 | |||||
| 18,703 | Government National Mortgage Association Pool #605245, 5.50%, 6/15/34 | 20,503 | |||||
| 48,601 | Government National Mortgage Association Pool #610944, 5.50%, 4/15/34 | 53,110 | |||||
| 64,302 | Government National Mortgage Association Pool #622603, 6.00%, 11/15/33 | 71,492 | |||||
| 6,194 | Government National Mortgage Association Pool #626480, 6.00%, 2/15/34 | 6,925 | |||||
| 716,466 | Government National Mortgage Association Series 2010-151 Class KA, 3.00%, 9/16/39 | 733,952 | |||||
| 522,529 | Government National Mortgage Association Series 2011-136 Class GB, 2.50%, 5/20/40 | 526,955 | |||||
| 294,425 | Government National Mortgage Association Series 2011-17 Class EP, 3.50%, 12/16/39 | 308,316 | |||||
| 2,030,264 |
| See Notes to Financial Statements. |
| 14 |
| Value Line Core Bond Fund | |
| Schedule of Investments (unaudited) |
| Principal | |||||||
| Amount | Value | ||||||
TOTAL U.S. GOVERNMENT AGENCY OBLIGATIONS (Cost $31,186,423) (34.2%) | $ | 31,419,669 | |||||
TOTAL INVESTMENT SECURITIES (99.4%) Cost ($92,839,648) | $ | 91,412,919 | |||||
CASH AND OTHER ASSETS IN EXCESS OF LIABILITIES (0.6%). | 547,966 | ||||||
| NET ASSETS (100%) | $ | 91,960,885 | |||||
| NET ASSET VALUE OFFERING AND REDEMPTION PRICE, PER OUTSTANDING SHARE ($91,960,885 ÷ 18,778,573 shares outstanding) | $ | 4.90 | |||||
| (1) | Pursuant to Rule 144A under the Securities Act of 1933, this security can only be sold to qualified institutional investors. |
| (2) | The rate shown on floating rate and discount securities represents the yield or rate at the end of the reporting period. |
| (3) | Treasury Inflation Protected Security (TIPS). |
| MTN | Medium Term Note. |
| REIT | Real Estate Investment Trust. |
| See Notes to Financial Statements. | |
| 15 |
| Value Line Core Bond Fund |
Statement of Assets and Liabilities at July 31, 2013 (unaudited) |
| Assets: | ||||
Investment securities, at value (Cost – $92,839,648) | $ | 91,412,919 | ||
| Receivable for securities sold | 1,008,725 | |||
| Interest receivable | 528,581 | |||
| Prepaid expenses | 12,837 | |||
| Receivable for capital shares sold | 2,376 | |||
| Receivable for securities lending income | 6 | |||
| Total Assets | 92,965,444 | |||
| Liabilities: | ||||
| Payable for securities purchased | 503,060 | |||
| Due to custodian | 395,764 | |||
| Payable for capital shares redeemed | 31,277 | |||
| Dividends payable to shareholders | 13,219 | |||
| Accrued expenses: | ||||
| Advisory fee | 31,727 | |||
| Service and distribution plan fees | 15,836 | |||
| Other | 13,676 | |||
| Total Liabilities | 1,004,559 | |||
| Net Assets | $ | 91,960,885 | ||
| Net assets consist of: | ||||
Capital stock, at $0.01 par value (authorized unlimited, outstanding 18,778,573 shares) | $ | 187,786 | ||
| Additional paid-in capital | 93,219,250 | |||
Distributions in excess of net investment income | (94,740 | ) | ||
Accumulated net realized gain on investments | 75,318 | |||
Net unrealized depreciation of investments | (1,426,729 | ) | ||
| Net Assets | $ | 91,960,885 | ||
Net Asset Value, Offering and Redemption Price per Outstanding Share ($91,960,885 ÷ 18,778,573 shares outstanding) | $ | 4.90 | ||
Statement of Operations for the Six Months Ended July 31, 2013 (unaudited) |
| Investment Income: | ||||
| Interest | $ | 860,205 | ||
| Securities lending income | 93 | |||
| Total Income | 860,298 | |||
| Expenses: | ||||
| Advisory fee | 196,636 | |||
| Service and distribution plan fees | 98,318 | |||
| Auditing and legal fees | 48,789 | |||
| Printing and postage | 33,483 | |||
| Transfer agent fees | 26,750 | |||
| Custodian fees | 23,765 | |||
| Registration and filing fees | 13,965 | |||
| Directors’ fees and expenses | 6,100 | |||
| Insurance | 2,277 | |||
| Other | 6,419 | |||
| Total Expenses Before Fees Waived | 456,502 | |||
| Less: Advisory Fees Waived | (39,327 | ) | ||
Less: Service and Distribution Plan Fees Waived | (19,664 | ) | ||
| Net Expenses | 397,511 | |||
| Net Investment Income | 462,787 | |||
Net Realized and Unrealized Gain/(Loss) on Investments: | ||||
| Net Realized Gain | 75,318 | |||
Change in Net Unrealized Appreciation/(Depreciation) | (3,444,311 | ) | ||
Net Realized Gain and Change in Net Unrealized Appreciation/(Depreciation) on Investments | (3,368,993 | ) | ||
Net Decrease in Net Assets from Operations | $ | (2,906,206 | ) | |
| See Notes to Financial Statements. |
| 16 |
| Value Line Core Bond Fund |
Statement of Changes in Net Assets for the Six Months Ended July 31, 2013 (unaudited) and for the Year Ended January 31, 2013 |
| Six Months Ended | ||||||||
| July 31, 2013 | Year Ended | |||||||
| (unaudited) | January 31, 2013 | |||||||
| Operations: | ||||||||
| Net investment income | $ | 462,787 | $ | 1,639,618 | ||||
| Net realized gain on investments | 75,318 | 1,779,984 | ||||||
| Change in net unrealized appreciation/(depreciation) | (3,444,311 | ) | (866,255 | ) | ||||
| Net increase/(decrease) in net assets from operations | (2,906,206 | ) | 2,553,347 | |||||
| Distributions to Shareholders: | ||||||||
| Net investment income | (547,872 | ) | (1,614,009 | ) | ||||
| Net realized gain from investment transactions | — | (25,662 | ) | |||||
| Total Distributions | (547,872 | ) | (1,639,671 | ) | ||||
| Capital Share Transactions: | ||||||||
| Proceeds from sale of shares | 1,353,907 | 2,261,091 | ||||||
| Net assets of shares issued in connection with merger (Note 4) | 73,396,078 | — | ||||||
Proceeds from reinvestment of dividends and distributions to shareholders | 474,362 | 1,273,759 | ||||||
| Cost of shares redeemed | (10,359,761 | ) | (6,101,213 | ) | ||||
| Net increase/(decrease) in net assets from capital share transactions | 64,864,586 | (2,566,363 | ) | |||||
| Total Increase/(Decrease) in Net Assets | 61,410,508 | (1,652,687 | ) | |||||
| Net Assets: | ||||||||
| Beginning of period | 30,550,377 | 32,203,064 | ||||||
| End of period | $ | 91,960,885 | $ | 30,550,377 | ||||
| Distributions in excess of net investment income, at end of period | $ | (94,740 | ) | $ | (9,655 | ) | ||
| See Notes to Financial Statements. |
| 17 |
Value Line Core Bond Fund |
| Notes to Financial Statements (unaudited) |
| 18 |
| Value Line Core Bond Fund |
| July 31, 2013 |
| • | Level 1 – Inputs that reflect unadjusted quoted prices in active markets for identical assets or liabilities that the Fund has the ability to access at the measurement date; |
| • | Level 2 – Inputs other than quoted prices that are observable for the asset or liability either directly or indirectly, including inputs in markets that are not considered to be active; |
| • | Level 3 – Inputs that are unobservable. |
| Value Line Core Bond Fund | Level 1 | Level 2 | Level 3 | Total | ||||||||||||
| Assets | ||||||||||||||||
| Corporate Bonds & Notes | $ | 0 | $ | 23,101,137 | $ | 0 | $ | 23,101,137 | ||||||||
| Commercial Mortgage-Backed Securities | 0 | 5,223,023 | 0 | 5,223,023 | ||||||||||||
| Foreign Government | 0 | 488,307 | 0 | 488,307 | ||||||||||||
| Long-Term Municipal Securities | 0 | 763,556 | 0 | 763,556 | ||||||||||||
| U.S. Treasury Obligations | 0 | 30,417,227 | 0 | 30,417,227 | ||||||||||||
| U.S. Government Agency Obligations | 0 | 31,419,669 | 0 | 31,419,669 | ||||||||||||
| Total | $ | 0 | $ | 91,412,919 | $ | 0 | $ | 91,412,919 | ||||||||
| 19 |
| Value Line Core Bond Fund |
Notes to Financial Statements (unaudited) |
| 20 |
| Value Line Core Bond Fund |
| July 31, 2013 |
| 21 |
| Value Line Core Bond Fund |
Notes to Financial Statements (unaudited) |
| 22 |
| Value Line Core Bond Fund |
| July 31, 2013 |
| Six Months Ended | ||||||||
July 31, 2013 (unaudited) | Year Ended January 31, 2013 | |||||||
| Shares sold | 270,476 | 452,862 | ||||||
| Shares issued in connection with merger | 14,453,737 | — | ||||||
| Shares issued to shareholders in reinvestment of dividends | 94,808 | 255,621 | ||||||
| Shares redeemed | (2,067,721 | ) | (1,222,950 | ) | ||||
| Net increase/(decrease) | 12,751,300 | (514,467 | ) | |||||
| Dividends per share from net investment income | $ | 0.0351 | $ | 0.2531 | ||||
| Distributions per share from net realized gains | $ | — | $ | 0.0040 | ||||
Date of` Reorganization | Surviving Fund | Shares Issued In Acquisition | Net Assets Before Reorganization | Net Assets After Reorganization | |||||||
| 3-22-13 | Value Line Core Bond Fund | 14,453,737 | $ | 29,565,559 | $ | 102,961,637 | |||||
Date of Reorganization | Acquired Fund | Shares Outstanding | Acquired Portfolio Net Assets | Acquired Portfolio Unrealized Depreciation | |||||||
| 3-22-13 | Value Line U.S Securities Government Fund, Inc. | 6,308,486 | $ | 3,396,078 | $ | 1,483,441 | |||||
| 23 |
| Value Line Core Bond Fund |
| Notes to Financial Statements (unaudited) |
| Net investment income | $ | 1,144,752 | ||
| Net loss on investments | $ | (3,296,374 | ) | |
| Net decrease in net assets from operations | $ | (3,368,993 | ) | |
| Because the combined investment portfolios have been managed as a single integrated portfolio since the closing of the Reorganization, it is not practicable to separate the amounts of revenue and earnings of the Acquired Fund that have been included in the Surviving Fund’s Statement of Operations since March 22, 2013. | ||||
| 5. Purchases and Sales of Securities | ||||
| Purchases and sales of investment securities, excluding short-term securities, were as follows: | ||||
| Six Months Ended | ||||
| July 31, 2013 | ||||
| (unaudited) | ||||
| PURCHASES: | ||||
| U.S. Treasury & Government Agency Obligations | $ | 8,905,429 | ||
| Other Investment Securities | 20,123,604 | |||
| Total Purchases | $ | 29,029,033 | ||
| SALES: | ||||
U.S. Treasury & Government Agency Obligations | $ | 24,846,246 | ||
| Other Investment Securities | 4,412,693 | |||
| Total Sales | $ | 29,258,939 | ||
| 6. Income Taxes | ||||
| At July 31, 2013, information on the tax components of capital is as follows: | ||||
| Cost of investments for tax purposes | $ | 92,839,648 | ||
| Gross tax unrealized appreciation | $ | 1,258,307 | ||
| Gross tax unrealized depreciation | (2,685,036 | ) | ||
| Net tax unrealized depreciation on investments | $ | (1,426,729 | ) | |
| 24 |
| Value Line Core Bond Fund |
| July 31, 2013 |
| 25 |
| Value Line Core Bond Fund |
| Financial Highlights |
| Six Months Ended | ||||||||||||||||||||||||
| July 31, 2013 | Years Ended January 31, | |||||||||||||||||||||||
| (unaudited) | 2013 | 2012 | 2011 | 2010 | 2009 | |||||||||||||||||||
| Net asset value, beginning of period | $ | 5.07 | $ | 4.92 | $ | 4.95 | $ | 4.70 | $ | 3.89 | $ | 4.83 | ||||||||||||
| Income from investment operations: | ||||||||||||||||||||||||
| Net investment income | 0.03 | 0.26 | 0.29 | 0.30 | 0.28 | 0.32 | ||||||||||||||||||
Net gains or (losses) on securities (both realized and unrealized) | (0.16 | ) | 0.15 | (0.03 | ) | 0.25 | 0.81 | (0.95 | ) | |||||||||||||||
| Total from investment operations | (0.13 | ) | 0.41 | 0.26 | 0.55 | 1.09 | (0.63 | ) | ||||||||||||||||
| Redemption fees | — | 0.00 | (1) | 0.00 | (1) | 0.00 | (1) | 0.00 | (1) | 0.00 | (1) | |||||||||||||
| Less distributions: | ||||||||||||||||||||||||
| Dividends from net investment income | (0.04 | ) | (0.26 | ) | (0.29 | ) | (0.30 | ) | (0.28 | ) | (0.31 | ) | ||||||||||||
| Distributions from net realized gains | — | (0.00 | )(1) | — | — | — | — | |||||||||||||||||
| Total distributions | (0.04 | ) | (0.26 | ) | (0.29 | ) | (0.30 | ) | (0.28 | ) | (0.31 | ) | ||||||||||||
| Net asset value, end of period | $ | 4.90 | $ | 5.07 | $ | 4.92 | $ | 4.95 | $ | 4.70 | $ | 3.89 | ||||||||||||
| Total return | (2.68 | )%(2) | 8.49 | % | 5.48 | % | 12.01 | % | 28.92 | % | (13.42 | )% | ||||||||||||
| Ratios/Supplemental Data: | ||||||||||||||||||||||||
| Net assets, end of period (in thousands) | $ | 91,961 | $ | 30,550 | $ | 32,203 | $ | 34,885 | $ | 37,787 | $ | 25,924 | ||||||||||||
Ratio of expenses to average net assets(3) | 1.16 | %(4) | 1.62 | % | 1.55 | % | 1.48 | %(5) | 1.56 | % | 1.50 | % | ||||||||||||
Ratio of expenses to average net assets(6) | 1.01 | %(4) | 1.32 | % | 1.25 | % | 1.13 | %(7) | 1.13 | % | 0.98 | % | ||||||||||||
Ratio of net investment income to average net assets | 1.18 | %(4) | 5.18 | % | 5.95 | % | 6.20 | % | 6.51 | % | 7.17 | % | ||||||||||||
| Portfolio turnover rate | 38 | %(2) | 103 | % | 50 | % | 42 | % | 51 | % | 39 | % | ||||||||||||
(1) (2) | Amount is less than $.01 per share. Not annualized. |
| (3) | Ratio reflects expenses grossed up for the custody credit arrangement and grossed up for the waiver of a portion of the advisory fee by the Adviser and a portion of the service and distribution plan fees by the Distributor. The ratio of expenses to average net assets, net of custody credits, but exclusive of the fee waivers would have been 1.48% for the year ended January 31, 2009 and would have been unchanged for the other periods shown. |
| (4) | Annualized. |
| (5) | Ratio reflects expenses grossed up for the reimbursement by Value Line, Inc. of certain expenses incurred by the Fund. |
| (6) | Ratio reflects expenses net of the custody credit arrangement and net of the waivers of a portion of the advisory fee by the Adviser and a portion of the service and distribution plan fees by the Distributor. |
| (7) | Ratio reflects expenses net of the reimbursement by Value Line, Inc. of certain expenses incurred by the Fund. |
| See Notes to Financial Statements. |
| 26 |
| FACTORS CONSIDERED BY THE BOARD IN APPROVING CONTINUANCE OF |
| THE INVESTMENT ADVISORY AGREEMENT |
| FOR VALUE LINE CORE BOND FUND |
| 27 |
| Value Line Core Bond Fund |
| Value Line Core Bond Fund |
| Value Line Core Bond Fund |
| Value Line Core Bond Fund |
| Value Line Core Bond Fund |
| The Value Line Family of Funds |
| * | Only available through the purchase of Guardian Investor, a tax deferred variable annuity, or ValuePlus, a variable life insurance policy. |
| ** | Formerly known as the Value Line Aggressive Income Trust. |
Item 5. Audit Committee of Listed Registrants
Not Applicable.
Item 6. Investments
Not Applicable
Item 7. Disclosure of Proxy Voting Policies and Procedures for Closed-End Management Investment Companies
Not Applicable
Item 8. Portfolio Managers of Closed-End Management Investment Companies
Not Applicable
Item 9. Purchases of Equity Securities by Closed-End Management Investment Company and Affiliated Purchasers
Not Applicable
Item 10. Submission of Matters to a Vote of Security Holders
Not Applicable
Item 11. Controls and Procedures.
| (a) | The registrant’s principal executive officer and principal financial officer have concluded that the registrant’s disclosure controls and procedures (as defined in rule 30a-2(c) under the Act (17 CFR 270.30a-2(c) ) based on their evaluation of these controls and procedures as of a date within 90 days of the filing date of this report, are appropriately designed to ensure that material information relating to the registrant is made known to such officers and are operating effectively. |
| (b) | The registrant’s principal executive officer and principal financial officer have determined that there have been no significant changes in the registrant’s internal controls or in other factors that could significantly affect these controls subsequent to the date of their evaluation, including corrective actions with regard to significant deficiencies and material weaknesses. |
Item 12. Exhibits.
| (a) | (1) Certification pursuant to Rule 30a-2(a) under the Investment Company Act of 1940 (17 CFR 270.30a-2) attached hereto as Exhibit 99.CERT. | |
| (2) Certification pursuant to Section 906 of the Sarbanes-Oxley Act of 2002 attached hereto as Exhibit 99.906.CERT. |
SIGNATURES
Pursuant to the requirements of the Securities Exchange Act of 1934 and the Investment Company Act of 1940, the registrant has duly caused this report to be signed on its behalf by the undersigned, thereunto duly authorized.
| By | /s/ Mitchell E. Appel | |
| Mitchell E. Appel, President | ||
| Date: | September 30, 2013 | |
| Pursuant to the requirements of the Securities Exchange Act of 1934 and the Investment Company Act of 1940, this report has been signed below by the following persons on behalf of the registrant and in the capacities and on the dates indicated. | ||
| By: | /s/ Mitchell E. Appel | |
| Mitchell E. Appel, President, Principal Executive Officer | ||
| By: | /s/ Emily D. Washington | |
| Emily D. Washington, Treasurer, Principal Financial Officer | ||
| Date: | September 30, 2013 |