FACTORS CONSIDERED BY THE BOARD IN APPROVING CONTINUANCE OF THE INVESTMENT ADVISORY AGREEMENTS FOR VALUE LINE SMALL CAP OPPORTUNITIES FUND, INC., VALUE LINE MID CAP FOCUSED FUND, INC., VALUE LINE SELECT GROWTH FUND, INC., VALUE LINE LARGER COMPANIES FOCUSED FUND, INC., VALUE LINE ASSET ALLOCATION FUND, INC., VALUE LINE CAPITAL APPRECIATION FUND, INC., AND VALUE LINE CORE BOND FUND
The Investment Company Act of 1940 (the “1940 Act”) requires the Boards of Directors (the “Board”) of Value Line Small Cap Opportunities Fund, Inc., Value Line Mid Cap Focused Fund, Inc., Value Line Select Growth Fund, Inc., Value Line Larger Companies Focused Fund, Inc., Value Line Asset Allocation Fund, Inc., Value Line Capital Appreciation Fund, Inc., and Value Line Core Bond Fund (each, a “Fund” and collectively, the “Funds”), including a majority of each Board’s Directors who are not “interested persons,” as that term is defined in the 1940 Act (the “Independent Directors”), to annually consider the continuance of each Fund’s investment advisory agreement (each, an “Agreement”) with its investment adviser, EULAV Asset Management (the “Adviser”).
As part of the process in considering the continuance of each Fund’s Agreement, the Board requested, and the Adviser provided, such information as the Board deemed to be reasonably necessary to evaluate the terms of such Agreement. At meetings held throughout the year, including the meeting specifically focused upon the review of each Agreement, the Independent Directors met in executive sessions separately from the non-Independent Director of the Funds and any officers of the Adviser. In considering the continuance of each Agreement, the Independent Directors relied upon the assistance of counsel to the Independent Directors and representatives of Broadridge Financial Solutions, Inc., an independent mutual fund board consulting service.
Both in the meeting specifically focused upon the review of the Agreements and at other meetings, the Board, including the Independent Directors, received materials relating to the Adviser’s investment and management services under the Agreements. These materials included information for each Fund regarding, among other things: (i) the Fund’s investment performance, performance-related metrics and risk-related metrics over various periods of time and comparisons thereof to similar information regarding the Fund’s benchmark index, the Fund’s category of comparable funds (the “Category”) (as objectively classified, selected and prepared by Broadridge Financial Solutions, Inc. utilizing the classification system of Morningstar, Inc., an independent evaluation service (together, “Broadridge/Morningstar”)), and the Fund’s more narrow peer group of comparable funds (the “Peer Group”) (again, as objectively classified, selected and prepared by Broadridge/Morningstar); (ii) the Fund’s investment process, portfolio holdings, investment restrictions, valuation procedures, and financial statements; (iii) purchases and redemptions of the Fund’s shares; (iv) the Adviser’s view of the general investment outlook in the markets in which the Fund invests; (v) arrangements with respect to the distribution of the Fund’s shares; (vi) the allocation and cost of the Fund’s brokerage (none of which were effected through any affiliate of the Adviser, including EULAV Securities LLC (the “Distributor”)); and (vii) the overall nature, quality and extent of services provided by the Adviser.
As part of their review, the Board requested, and the Adviser provided, additional information in order to evaluate the quality of the Adviser’s services and the reasonableness of its fees under each Fund’s Agreement. In a separate executive session, the Independent Directors reviewed information for each Fund, which included data comparing: (i) advisory, administrative, distribution, custody, accounting, audit, legal, transfer agency, and other non-management expenses incurred by the Fund to those incurred by the Fund’s Peer Group and Category; (ii) the Fund’s expense ratio to those of its Peer Group and Category; and (iii) the Fund’s investment performance, performance-related metrics and risk-related metrics over various time periods to similar information regarding the Fund’s benchmark index, Peer Group and Category.
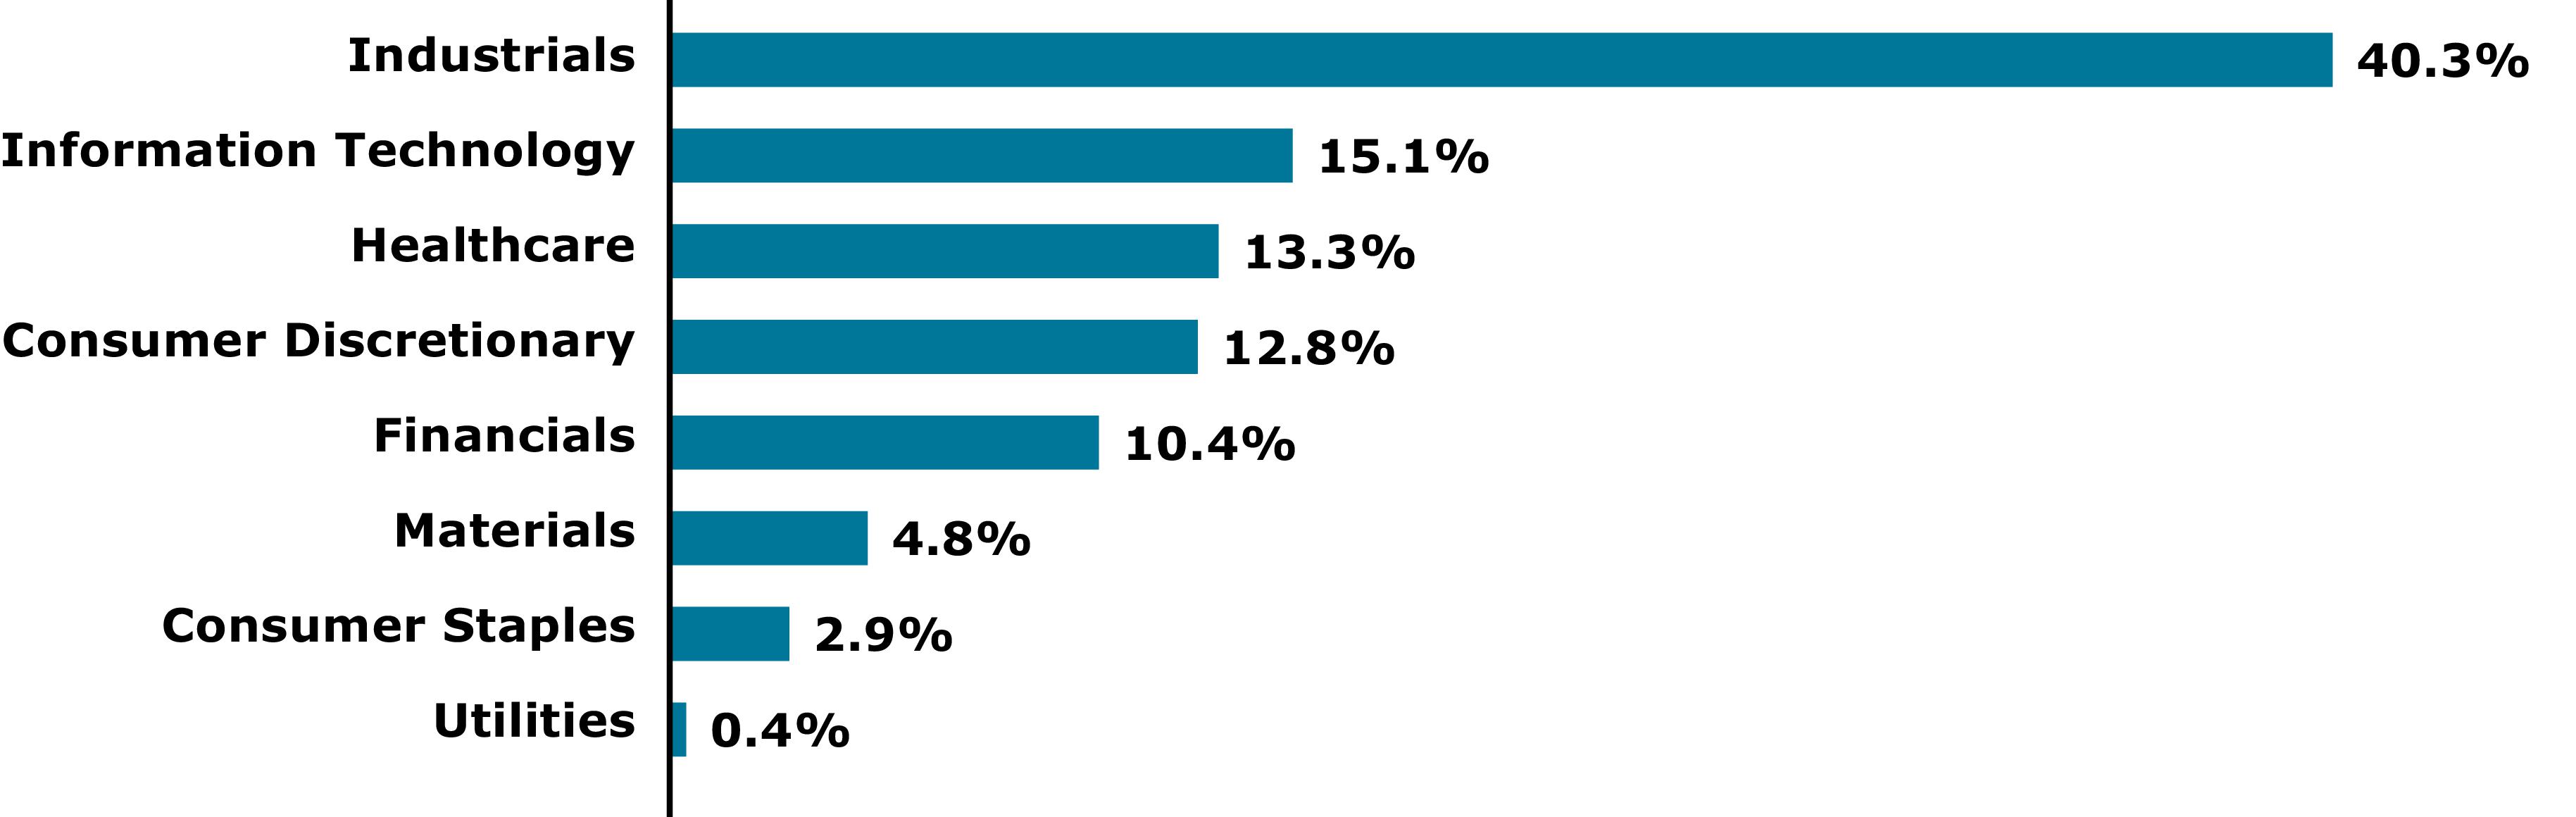
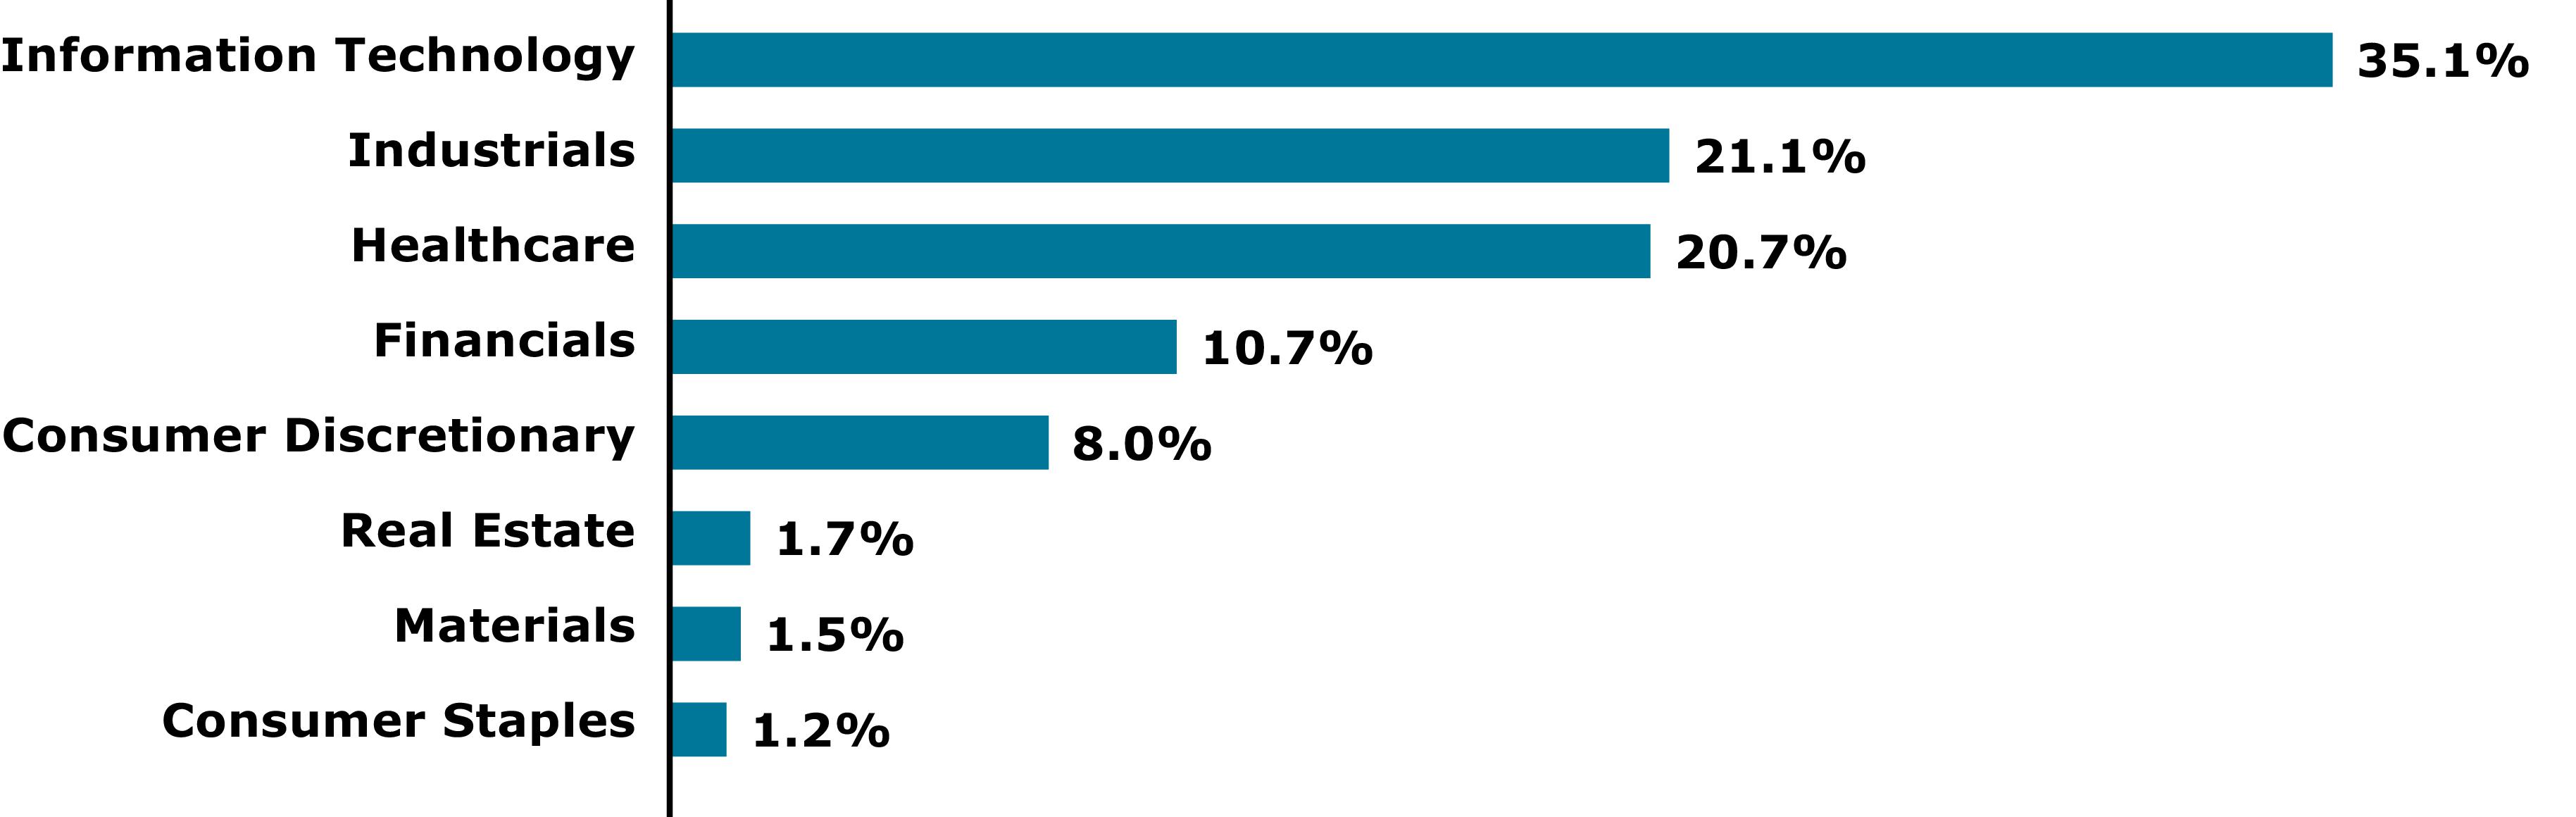
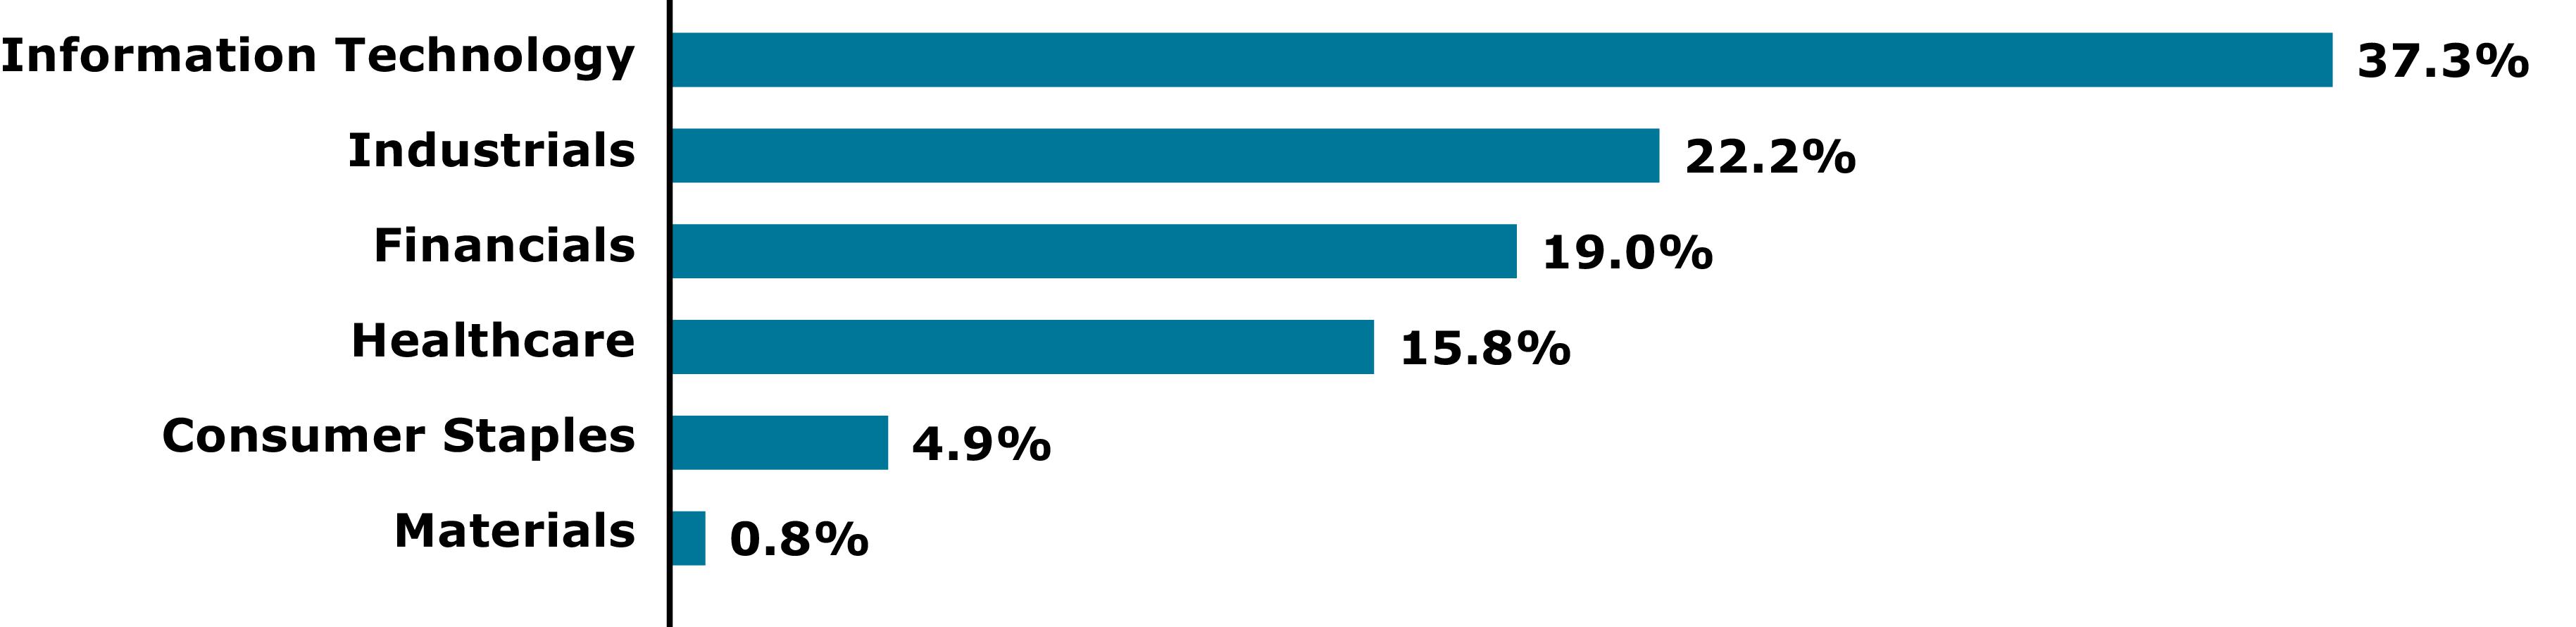
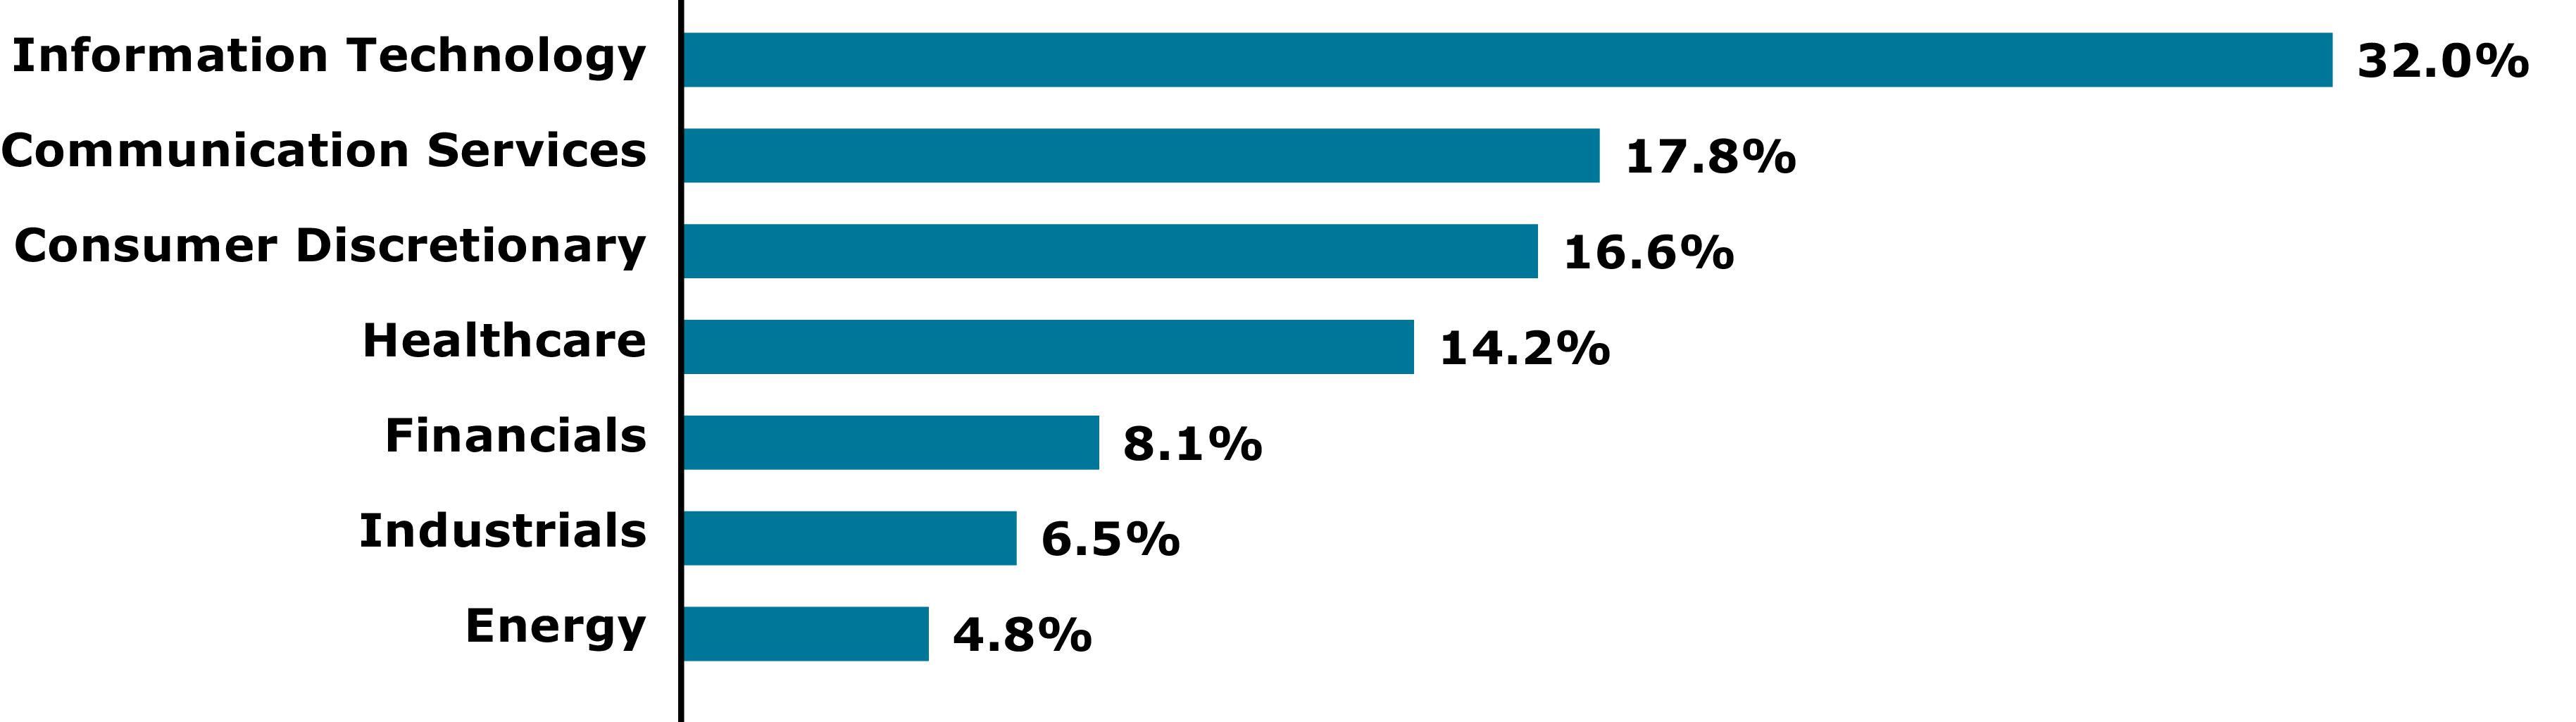
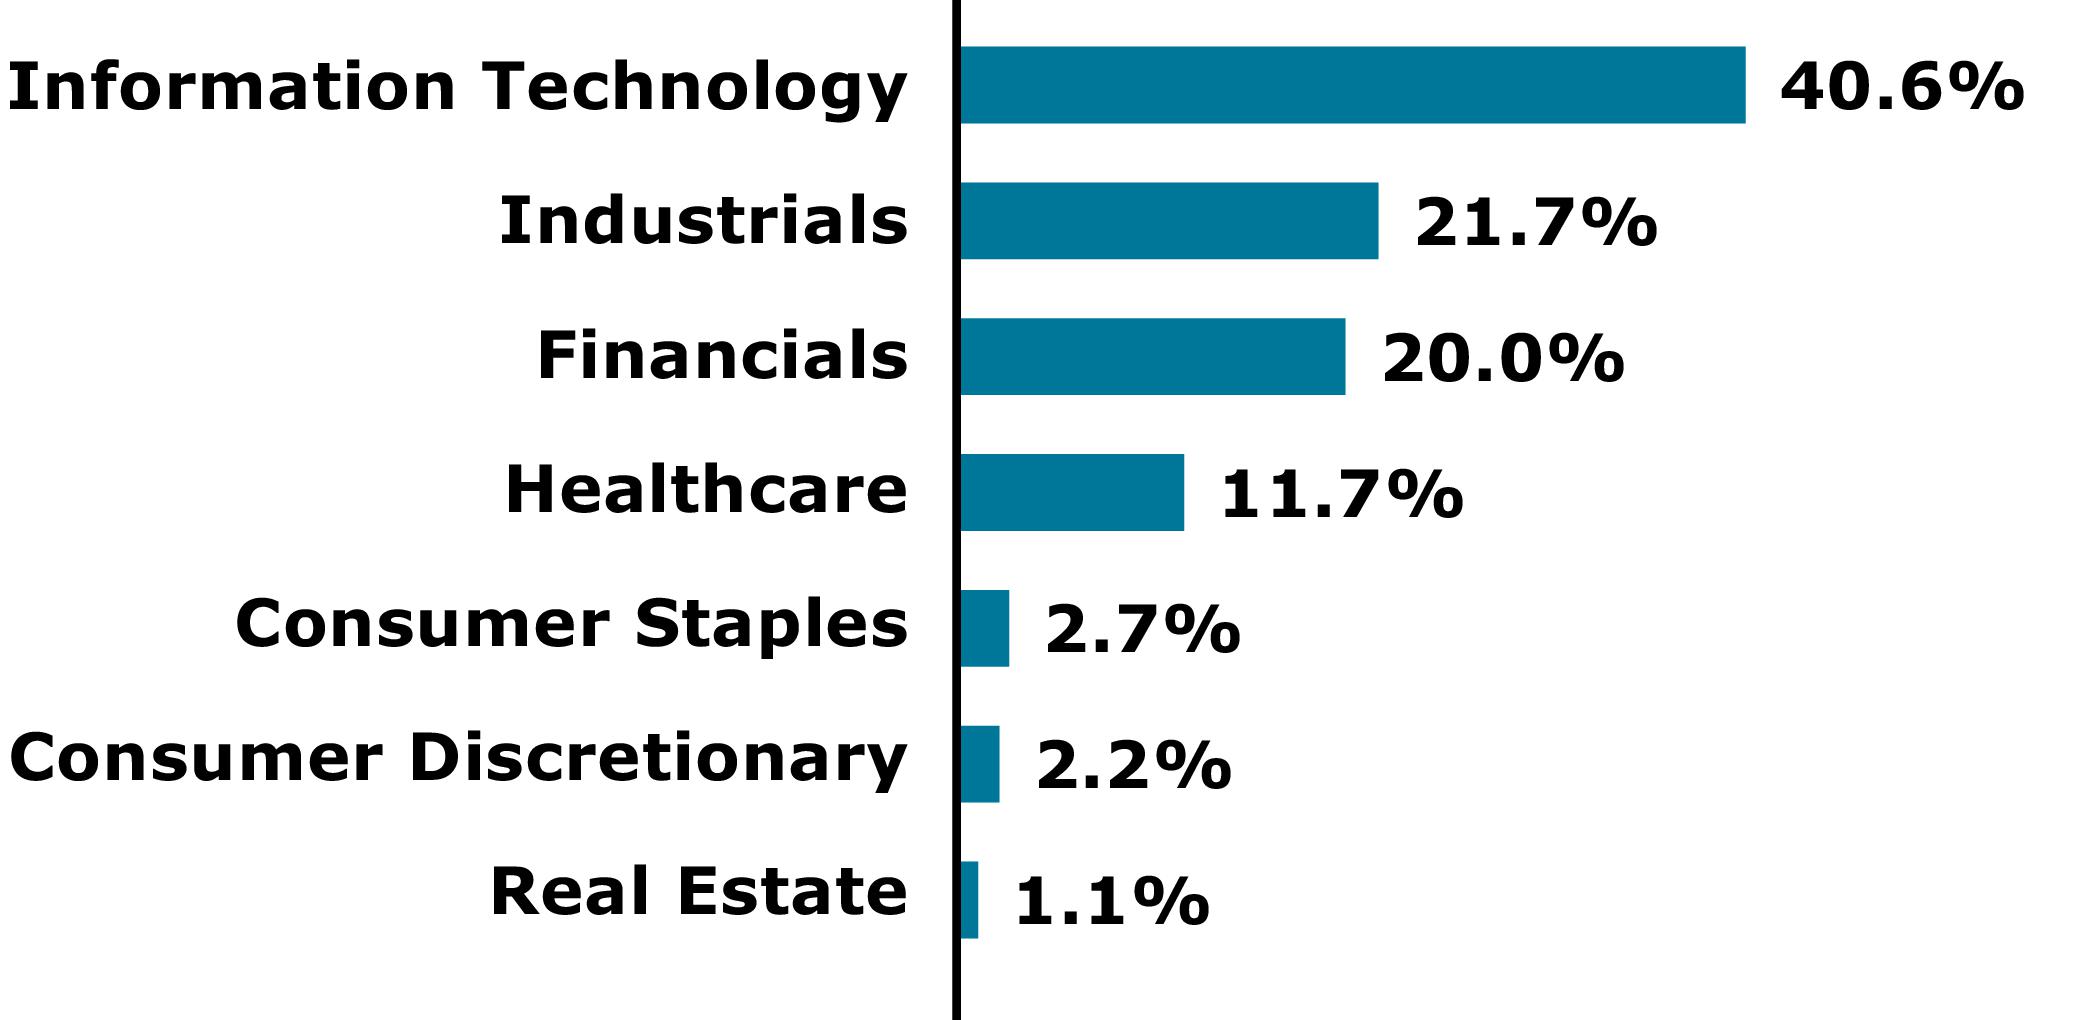
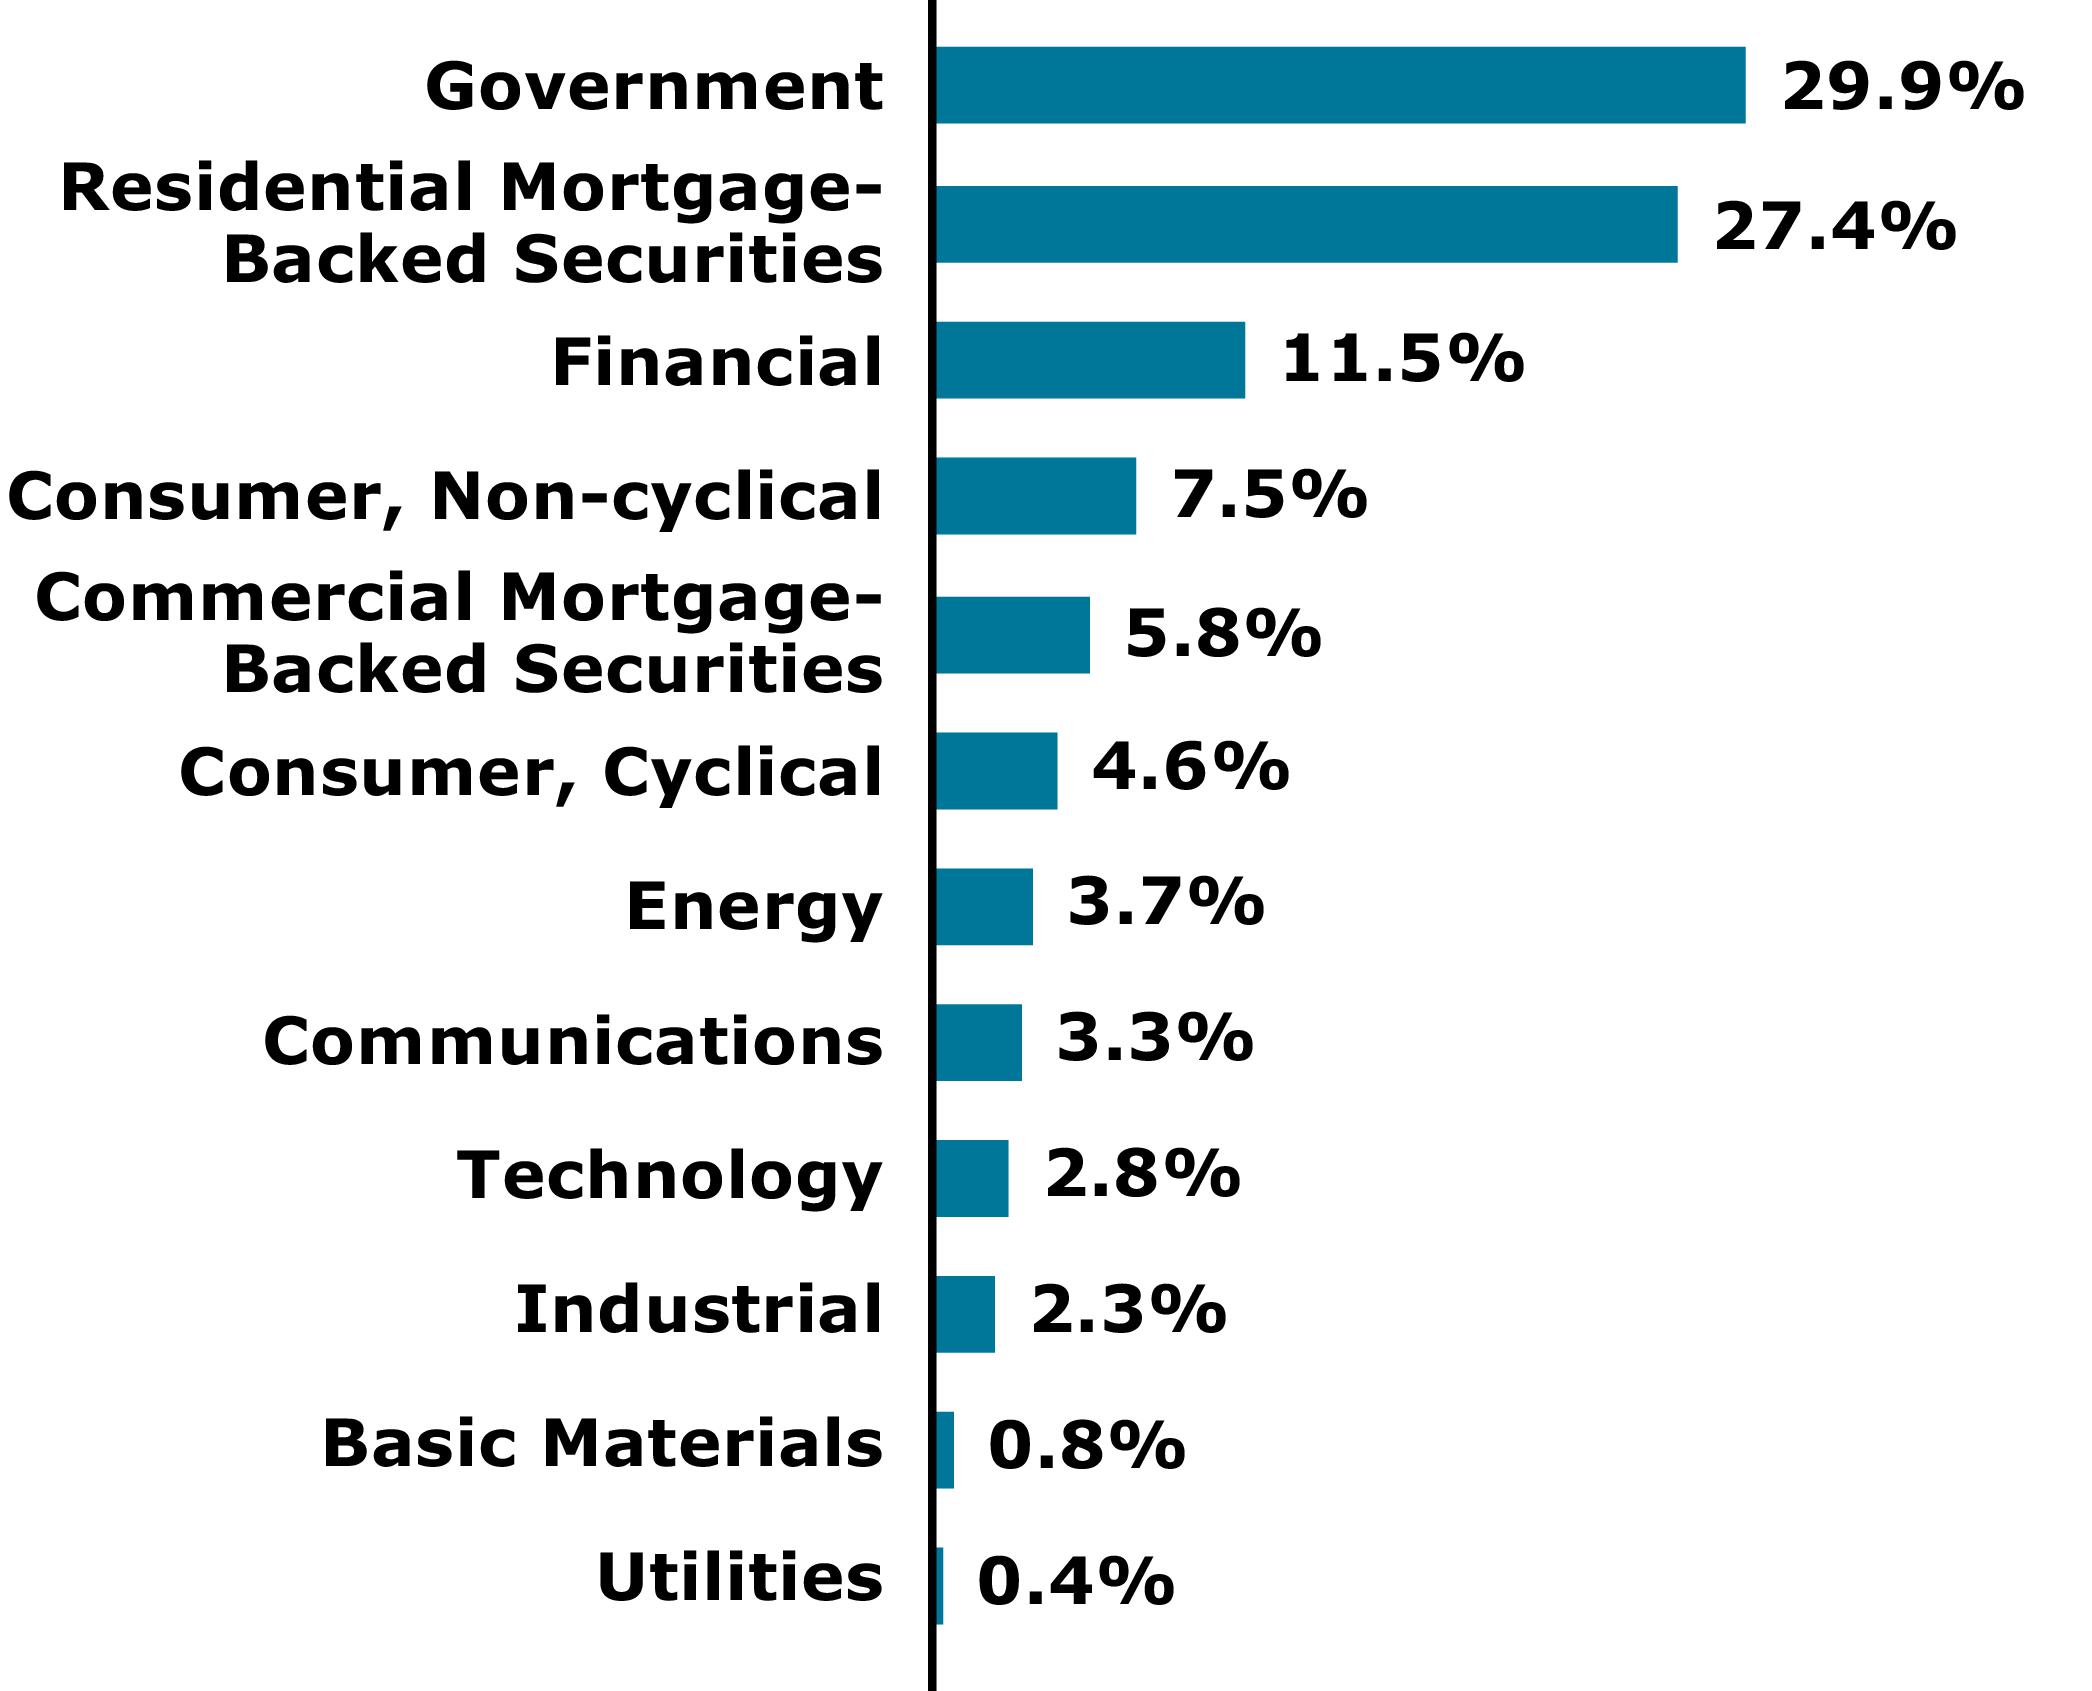
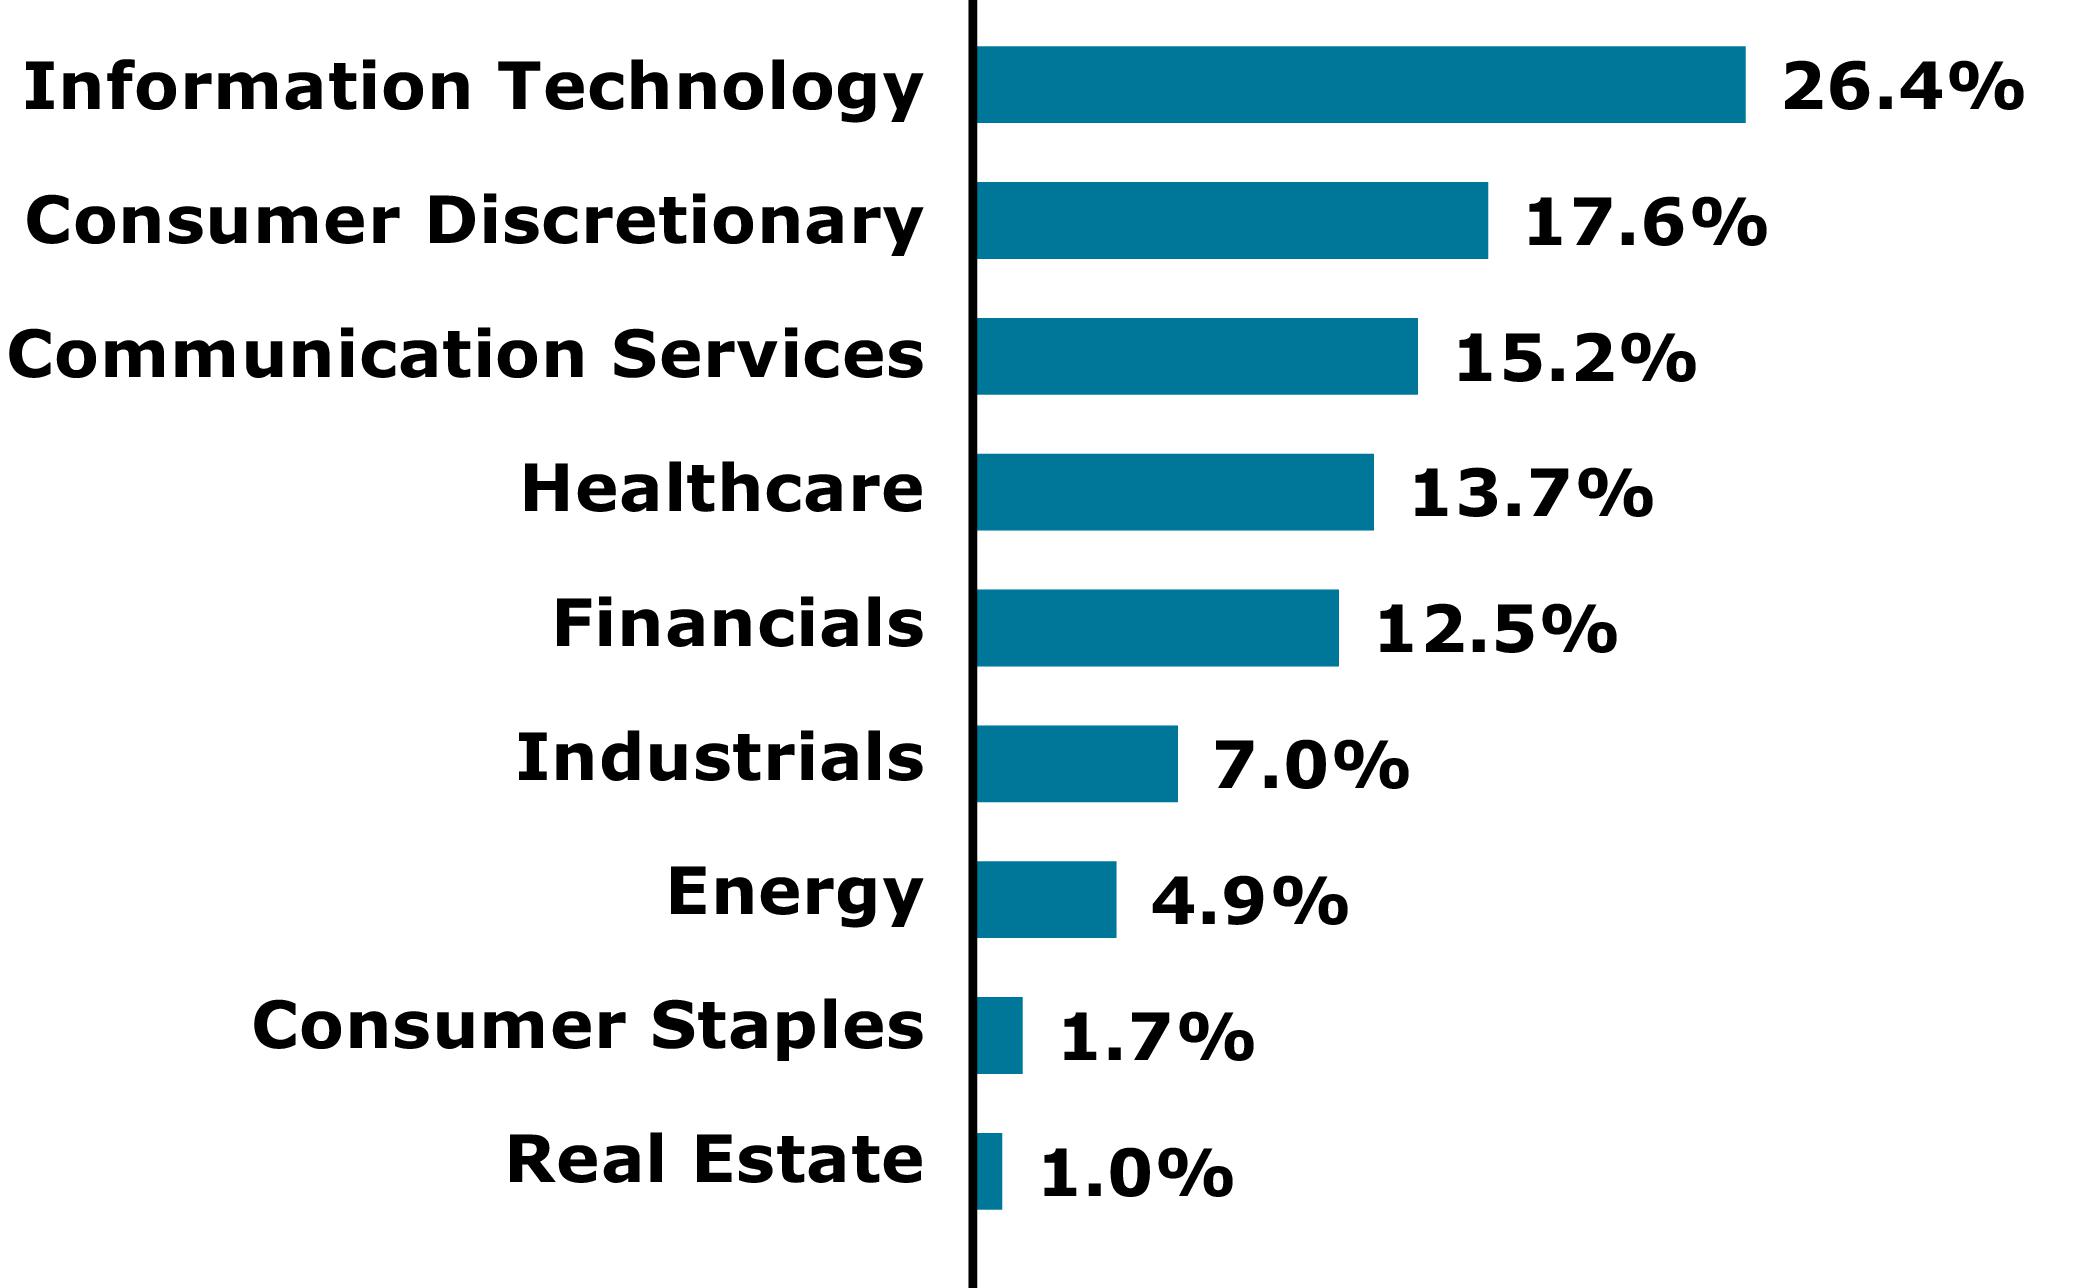
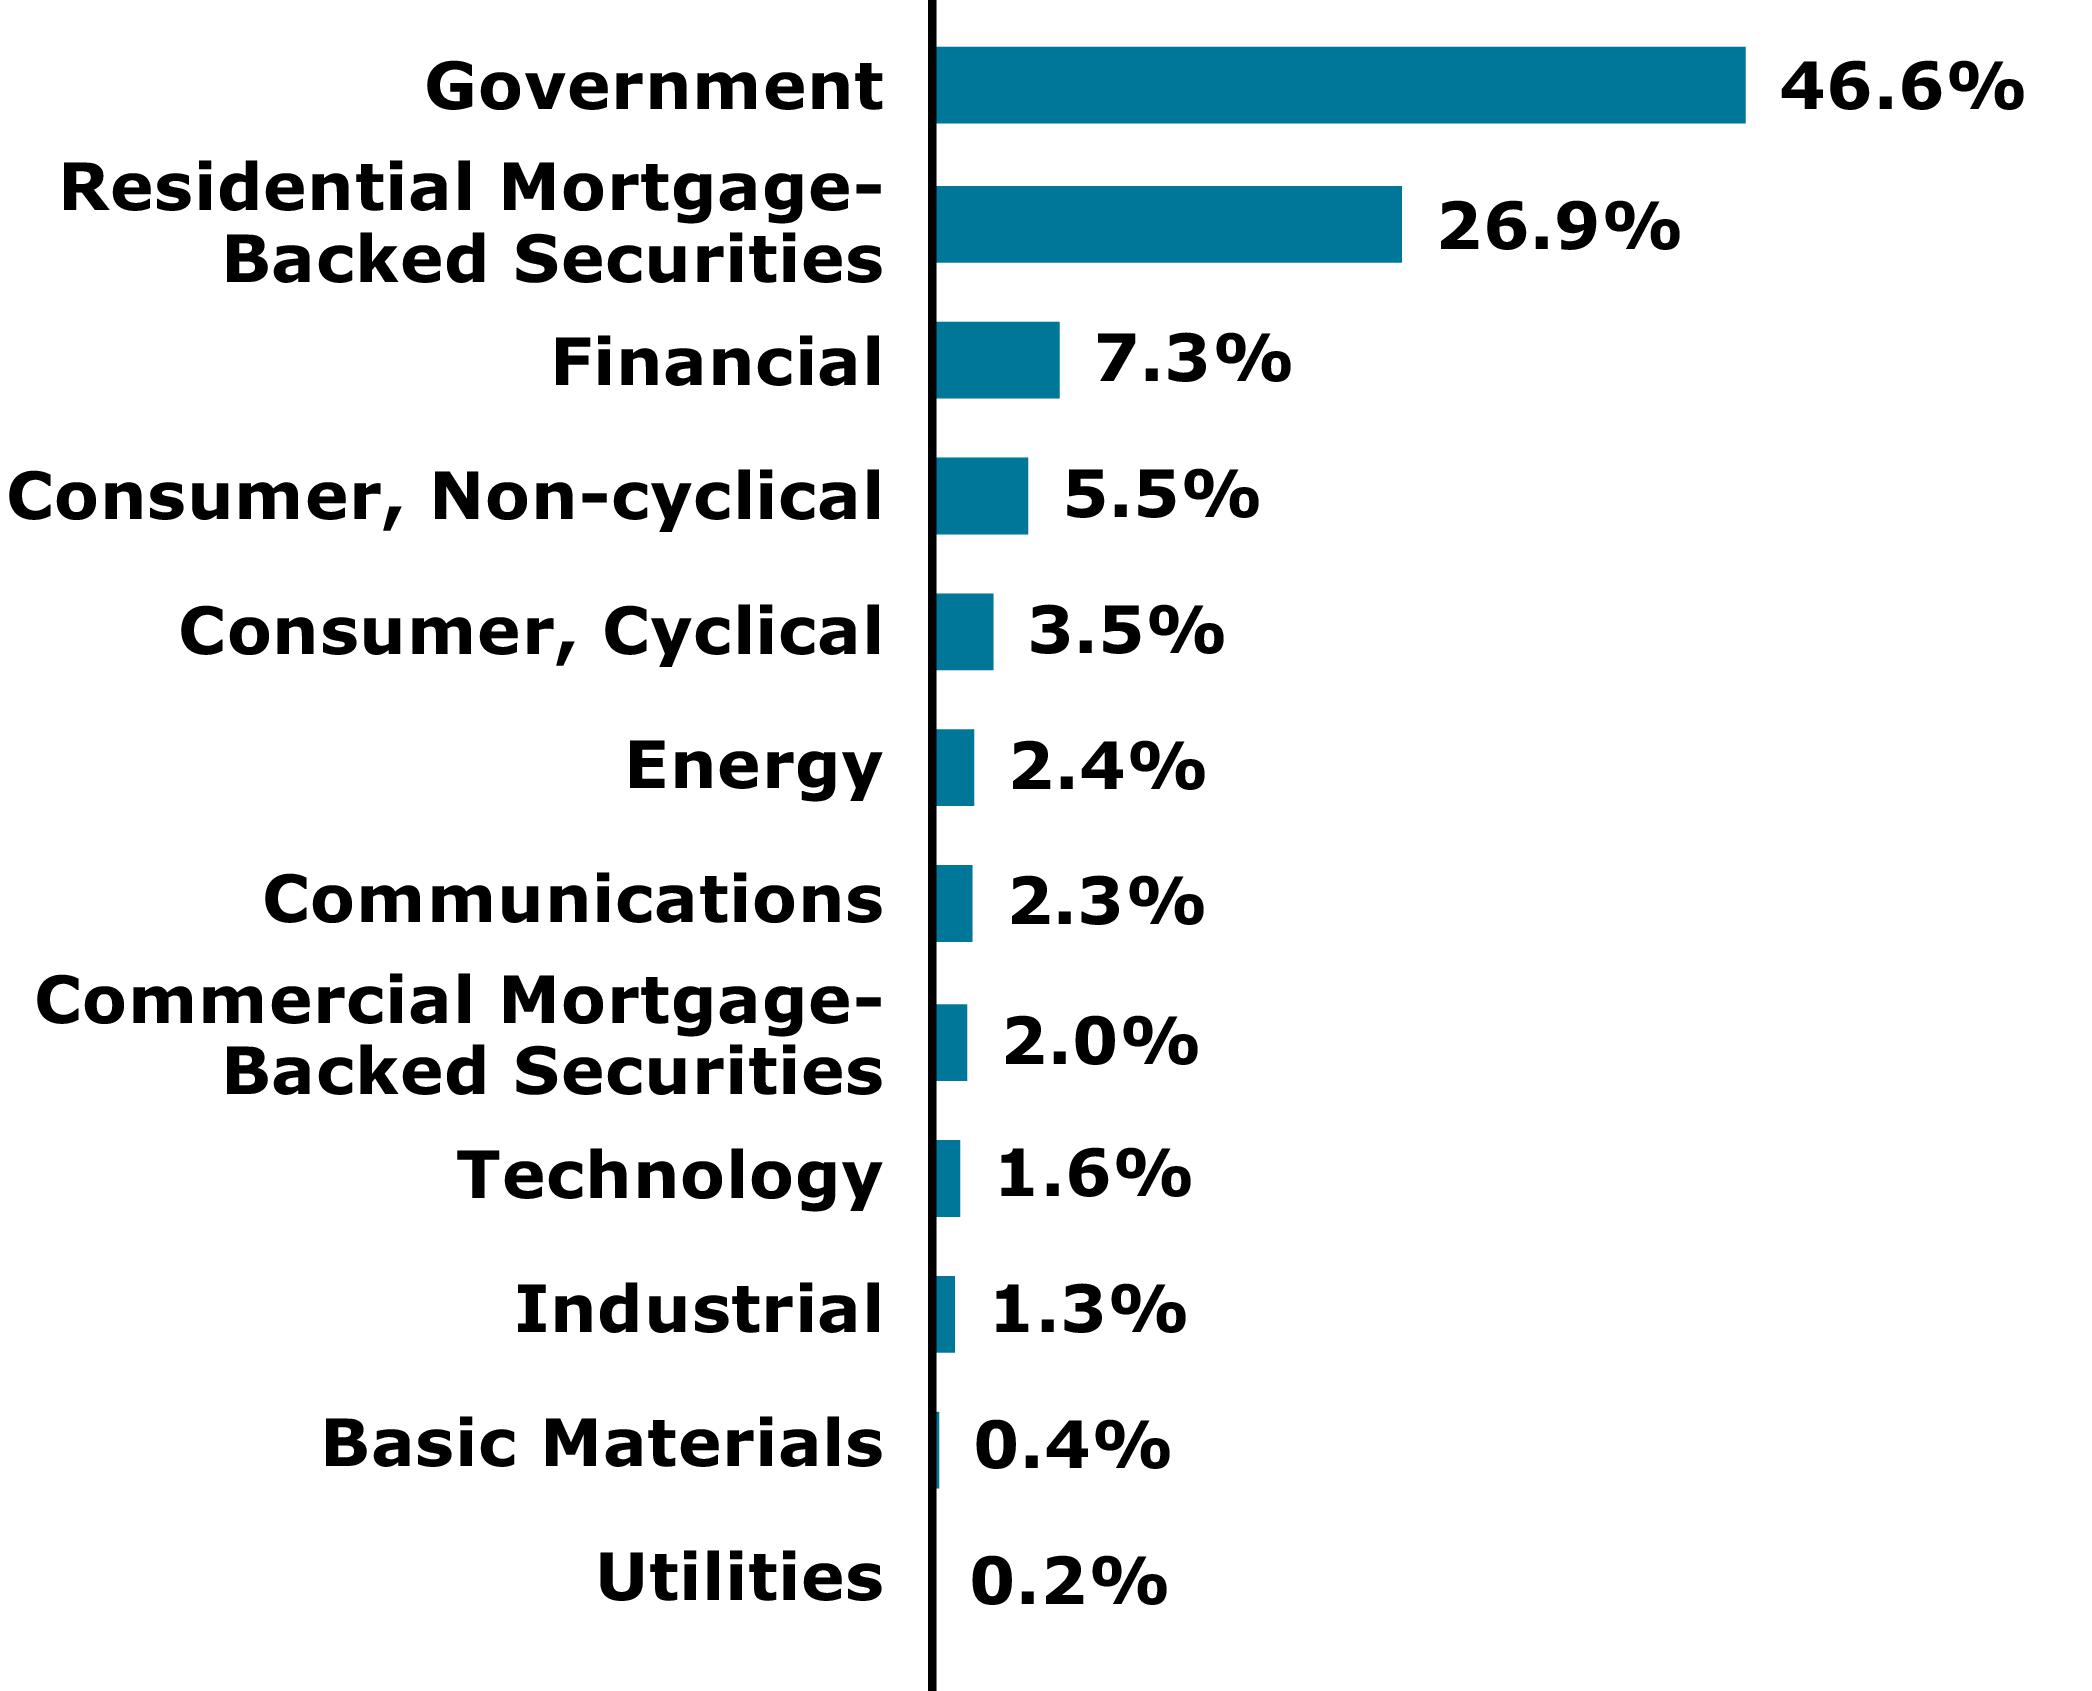
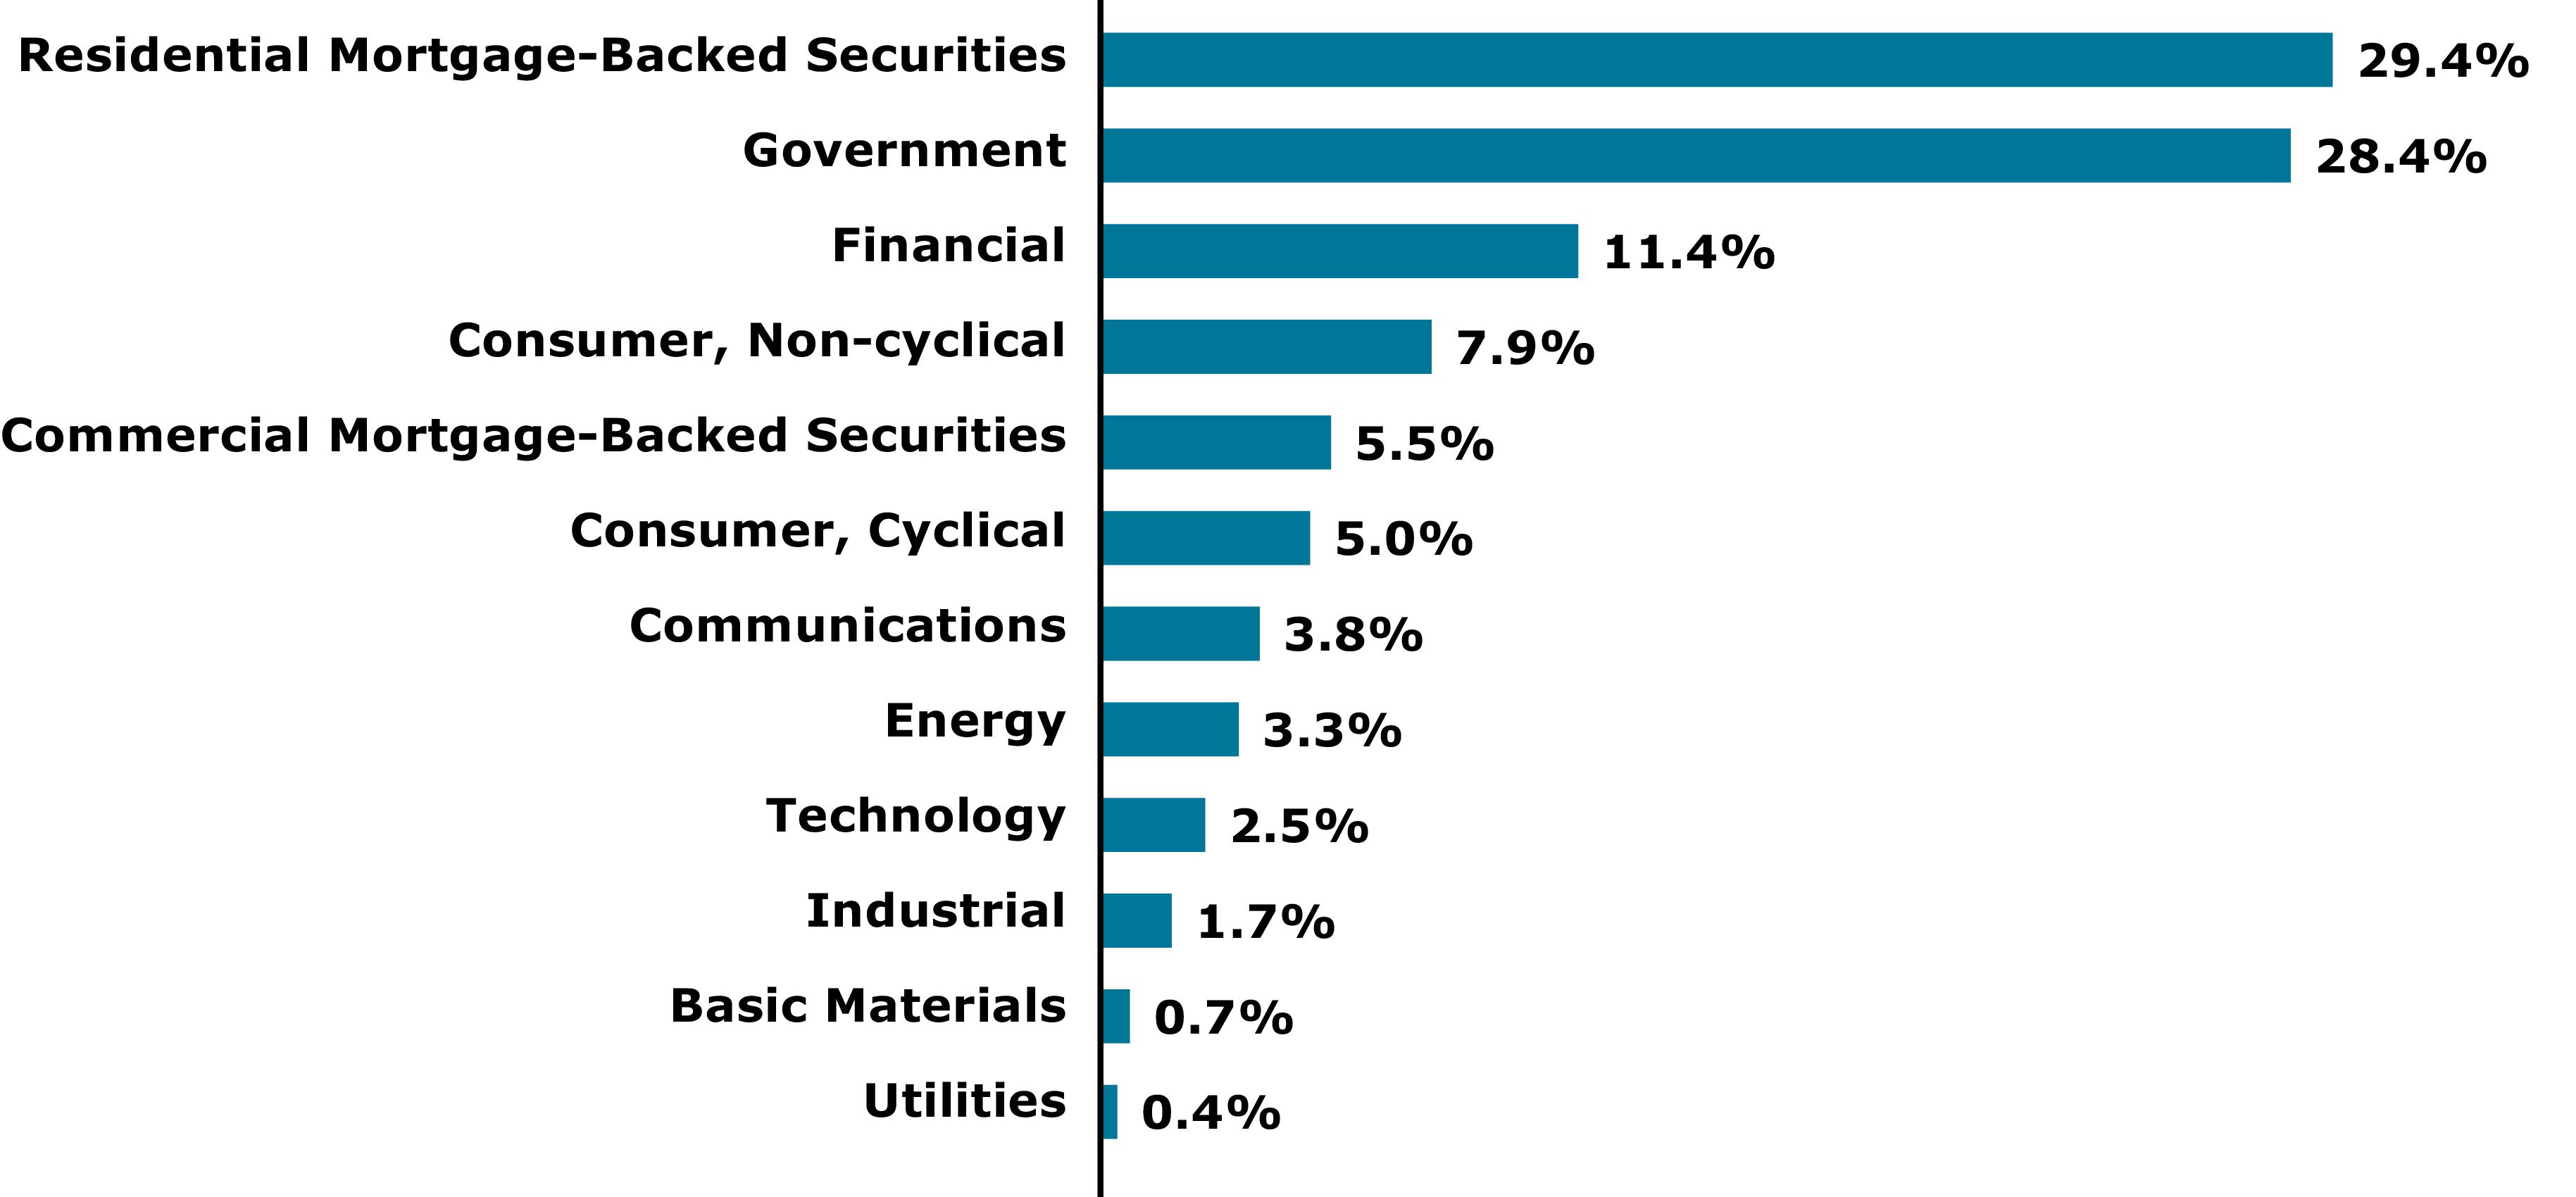
In classifying a Fund within a Category, Broadridge/Morningstar considered the characteristics of the Fund’s actual portfolio holdings over various periods of time relative to the market and other factors that distinguish a particular investment strategy under Broadridge/Morningstar’s methodology with the objective to permit meaningful comparisons. Broadridge/Morningstar classified Value Line Small Cap Opportunities Fund, Inc. within its Small Growth category and classified Value Line Mid Cap Focused Fund, Inc. within its Mid-Cap Growth category. Broadridge/Morningstar classified Value Line Select Growth Fund, Inc. and Value Line Larger Companies Focused Fund, Inc. within its Large Growth category and classified Value Line Asset Allocation Fund, Inc. within its Allocation – 50% to 70% Equity category. Broadridge/Morningstar classified Value Line Capital Appreciation Fund, Inc. within its Allocation – 85+% Equity category. Further, Broadridge/Morningstar classified Value Line Core Bond Fund within its Intermediate Core Bond category.
In preparing a Peer Group for each Fund, Broadridge/Morningstar considered the Fund’s most recent portfolio holdings in light of the same factors used in classifying a Fund within a Category, as well as additional factors including similarity of expense structure (e.g., same share class characteristics) and net asset size. Generally, Broadridge/Morningstar prefers to select peer funds that range in net assets from no less than half the size, to no more than twice the size, of the relevant Fund and to select roughly equal number of funds that are smaller and larger than the Fund. This year, Broadridge/Morningstar began considering, in the construction of each Fund’s Category and Peer Group, funds issuing A shares, which have a front-end load. As a result, the final Peer Group for each Fund is drawn from retail load and no-load funds with similar investment style, expense structure and asset size as the Fund. It consists of the relevant Fund and: 12 other funds for Value Line Small Cap Opportunities Fund, Inc.; 10 other funds for Value Line Mid Cap Focused Fund, Inc.; 13 other funds for Value Line Select Growth Fund, Inc.; 13 other funds for Value Line Larger Companies Focused Fund, Inc.; 11 other funds for Value Line Asset Allocation Fund, Inc.; 8 other funds for Value Line Capital Appreciation Fund, Inc.; and 11 other funds for Value Line Core Bond Fund.