UNITED STATES
SECURITIES AND EXCHANGE COMMISSION
Washington, D.C. 20549
FORM N-CSR
CERTIFIED SHAREHOLDER REPORT OF REGISTERED
MANAGEMENT INVESTMENT COMPANIES
Investment Company Act file Number 811- 04471
Value Line Core Bond Fund
(Exact name of registrant as specified in charter)
7 Times Square, Suite 1606, New York, N.Y. 10036
(Address of principal executive offices) (Zip Code)
Registrant’s telephone number, including area code: 212-907-1900
Date of fiscal period end: December 31, 2023
Date of reporting period: December 31, 2023
Item I Reports to Stockholders
| a) | A copy of the Annual Report to Stockholders for the period ended 12/31/23 is included with this Form. |
| b) | Not Applicable |


Annual Report |
December 31, 2023 |
Value Line Small Cap Opportunities Fund, Inc. |
Investor Class (VLEOX) |
Institutional Class (VLEIX) |
Value Line Mid Cap Focused Fund, Inc. |
Investor Class (VLIFX) |
Institutional Class (VLMIX) |
Value Line Select Growth Fund, Inc. |
Investor Class (VALSX) |
Institutional Class (VILSX) |
Value Line Larger Companies Focused Fund, Inc. |
Investor Class (VALLX) |
Institutional Class (VLLIX) |
Value Line Asset Allocation Fund, Inc. |
Investor Class (VLAAX) |
Institutional Class (VLAIX) |
Value Line Capital Appreciation Fund, Inc. |
Investor Class (VALIX) |
Institutional Class (VLIIX) |
Value Line Core Bond Fund |
Investor Class (VAGIX) |
VLFunds.com/edelivery

President of the Value Line Funds
Ten Largest Holdings* | |||
Issue | Shares | Value | Percentage of Net Assets |
SPS Commerce, Inc. | 104,500 | $20,256,280 | 3.8 % |
RLI Corp. | 131,900 | 17,558,528 | 3.3 % |
Comfort Systems USA, Inc. | 75,100 | 15,445,817 | 2.9 % |
AAON, Inc. | 208,500 | 15,401,895 | 2.9 % |
RBC Bearings, Inc. | 52,500 | 14,956,725 | 2.8 % |
Exponent, Inc. | 163,700 | 14,412,148 | 2.7 % |
ePlus, Inc. | 177,100 | 14,139,664 | 2.7 % |
Churchill Downs, Inc. | 102,272 | 13,799,561 | 2.6 % |
CACI International, Inc. | 42,500 | 13,764,050 | 2.6 % |
Watts Water Technologies, Inc. | 61,647 | 12,843,536 | 2.4 % |
Asset Allocation — Percentage of Net Assets |

Sector Weightings — Percentage of Total Investments In Securities* |
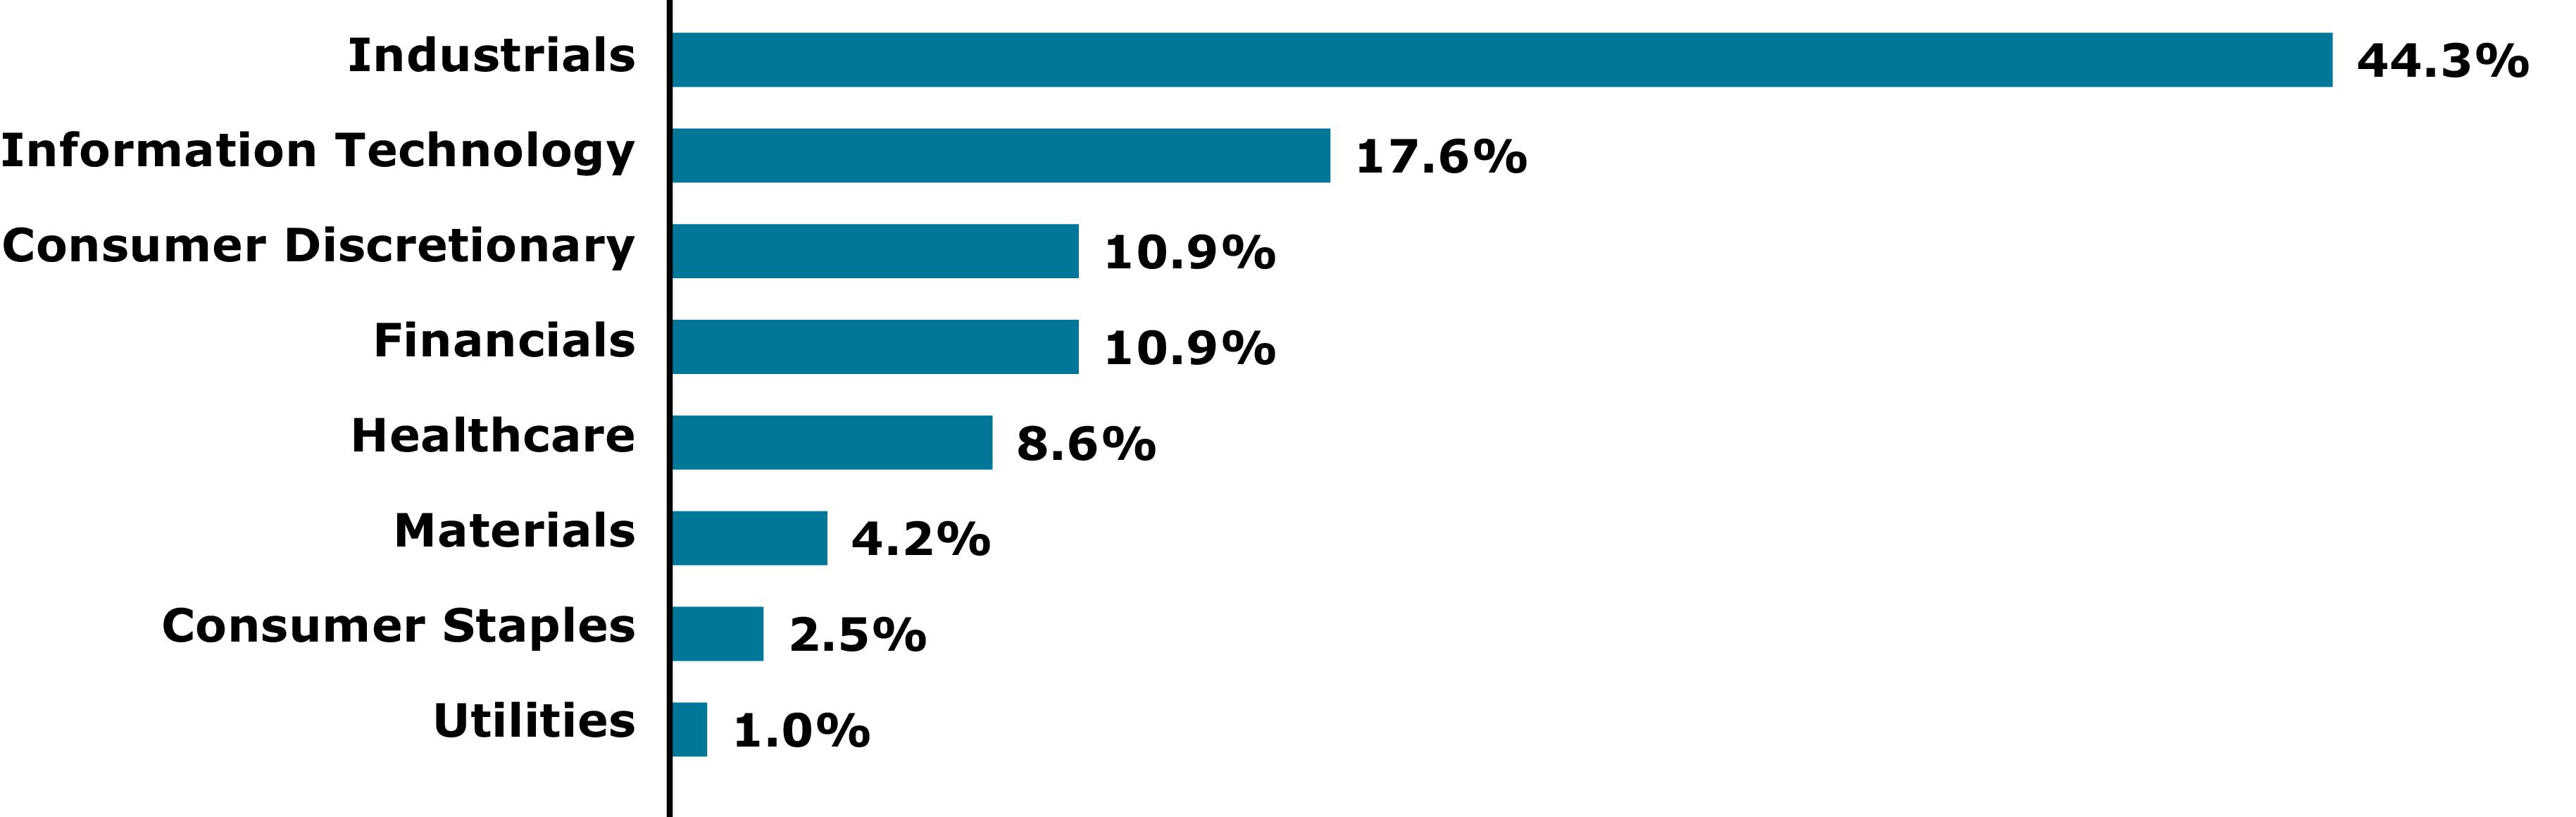
* | Excludes short-term investments, if any. |
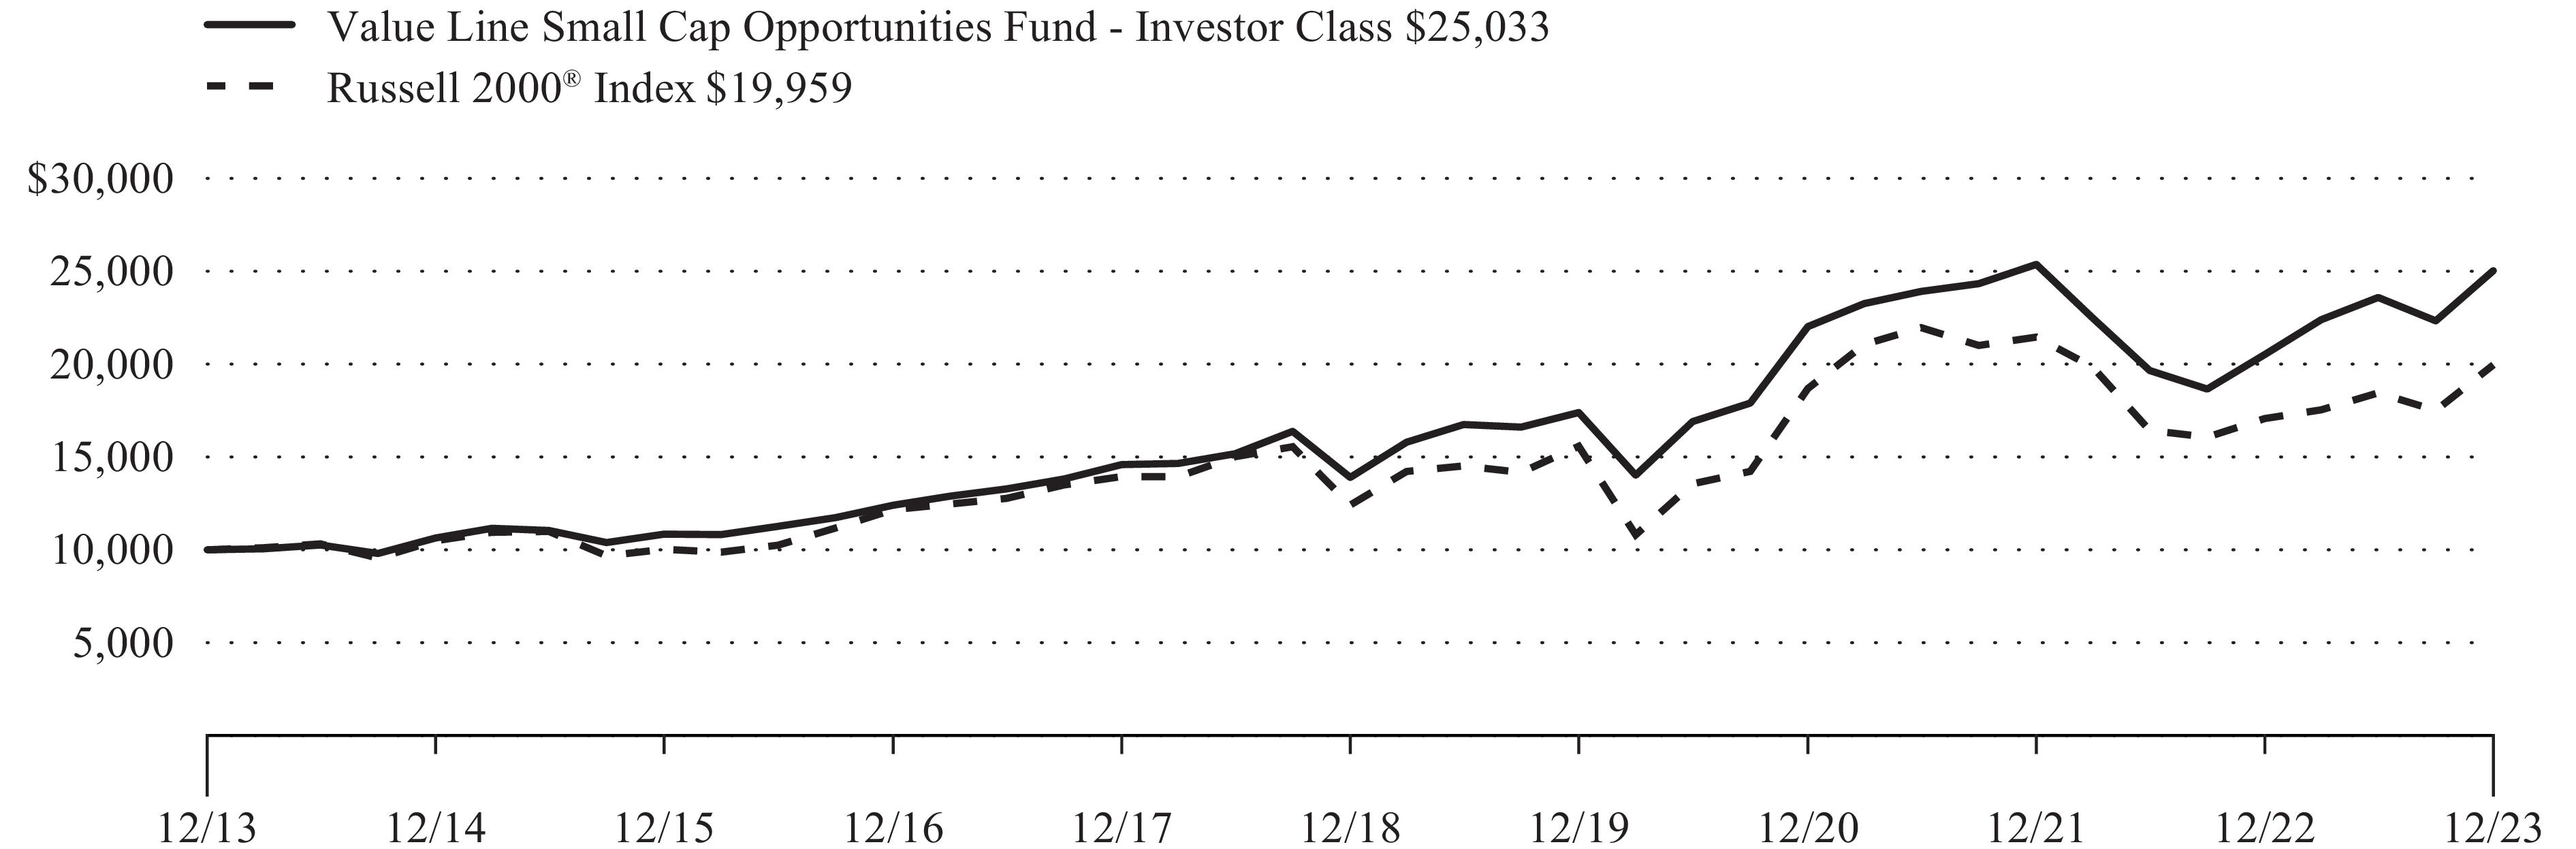
Comparison of a Change in Value of a $10,000 Investment in the Value Line Small Cap Opportunities Fund, Inc. and the Russell 2000® Index**
1 yr | 5 Yrs | 10 Yrs | ||
Investor Class | ||||
Value Line Small Cap Opportunities Fund, Inc. | 22.00 % | 12.49 % | 9.61 % | |
Russell 2000® Index*** | 16.93 % | 9.97 % | 7.16 % | |
1 yr | 5 Yrs | Since Inception 11/2/2015 | ||
Institutional Class | ||||
Value Line Small Cap Opportunities Fund, Inc. | 22.29 % | 12.77 % | 10.63 % | |
Russell 2000® Index*** | 16.93 % | 9.97 % | 8.54 % |
Shares | Value | |
COMMON STOCKS 95.1% | ||
CONSUMER DISCRETIONARY 10.4% | ||
APPAREL 1.3% | ||
71,700 | Crocs, Inc.(1) | $6,697,497 |
AUTO PARTS & EQUIPMENT 0.4% | ||
16,500 | Visteon Corp.(1) | 2,060,850 |
ENGINEERING & CONSTRUCTION 1.7% | ||
24,400 | TopBuild Corp.(1) | 9,131,944 |
ENTERTAINMENT 2.6% | ||
102,272 | Churchill Downs, Inc. | 13,799,561 |
HOME BUILDERS 1.3% | ||
20,800 | Cavco Industries, Inc.(1) | 7,209,696 |
HOUSEHOLD PRODUCTS 0.5% | ||
23,000 | Helen of Troy Ltd.(1) | 2,778,630 |
LEISURE TIME 0.6% | ||
42,700 | Planet Fitness, Inc. Class A(1) | 3,117,100 |
RETAIL 2.0% | ||
41,600 | Texas Roadhouse, Inc. | 5,084,768 |
21,800 | Wingstop, Inc. | 5,593,444 |
10,678,212 | ||
55,473,490 | ||
CONSUMER STAPLES 2.4% | ||
FOOD 2.4% | ||
69,900 | J & J Snack Foods Corp. | 11,683,086 |
5,600 | Lancaster Colony Corp. | 931,784 |
12,614,870 | ||
FINANCIALS 10.4% | ||
BANKS 2.0% | ||
206,496 | First Financial Bankshares, Inc. | 6,256,829 |
38,900 | Walker & Dunlop, Inc. | 4,318,289 |
10,575,118 | ||
DIVERSIFIED FINANCIALS 1.4% | ||
104,422 | Stifel Financial Corp. | 7,220,781 |
INSURANCE 7.0% | ||
44,400 | Primerica, Inc. | 9,135,744 |
131,900 | RLI Corp. | 17,558,528 |
108,193 | Selective Insurance Group, Inc. | 10,763,040 |
37,457,312 | ||
55,253,211 | ||
HEALTHCARE 8.2% | ||
COMMERCIAL SERVICES 0.6% | ||
40,651 | AMN Healthcare Services, Inc.(1) | 3,043,947 |
HEALTHCARE PRODUCTS 1.3% | ||
22,700 | CONMED Corp. | 2,485,877 |
18,100 | Penumbra, Inc.(1) | 4,552,874 |
7,038,751 | ||
HEALTHCARE SERVICES 6.3% | ||
19,000 | Chemed Corp. | 11,110,250 |
76,500 | Ensign Group, Inc. | 8,584,065 |
22,100 | Medpace Holdings, Inc.(1) | 6,774,313 |
Shares | Value | |
COMMON STOCKS 95.1% (continued) | ||
HEALTHCARE 8.2% (continued) | ||
HEALTHCARE SERVICES 6.3% (continued) | ||
77,800 | US Physical Therapy, Inc. | $7,246,292 |
33,714,920 | ||
43,797,618 | ||
INDUSTRIALS 42.1% | ||
BUILDING MATERIALS 6.1% | ||
208,500 | AAON, Inc. | 15,401,895 |
26,500 | Lennox International, Inc. | 11,859,280 |
64,000 | Trex Co., Inc.(1) | 5,298,560 |
32,559,735 | ||
COMMERCIAL SERVICES 4.2% | ||
20,100 | ASGN, Inc.(1) | 1,933,017 |
48,500 | FTI Consulting, Inc.(1) | 9,658,775 |
31,400 | Healthcare Services Group, Inc.(1) | 325,618 |
33,200 | Insperity, Inc. | 3,891,704 |
55,400 | TriNet Group, Inc.(1) | 6,588,722 |
22,397,836 | ||
COMPUTERS 6.1% | ||
42,500 | CACI International, Inc. Class A(1) | 13,764,050 |
397,500 | ExlService Holdings, Inc.(1) | 12,262,875 |
11,966 | MAXIMUS, Inc. | 1,003,469 |
44,900 | Science Applications International Corp. | 5,581,968 |
32,612,362 | ||
DISTRIBUTION/WHOLESALE 1.5% | ||
50,000 | SiteOne Landscape Supply, Inc.(1) | 8,125,000 |
ELECTRICAL EQUIPMENT 0.6% | ||
31,200 | EnerSys | 3,149,952 |
ELECTRONICS 2.4% | ||
93,000 | Woodward, Inc. | 12,660,090 |
ENGINEERING & CONSTRUCTION 7.3% | ||
75,100 | Comfort Systems USA, Inc. | 15,445,817 |
42,600 | EMCOR Group, Inc. | 9,177,318 |
163,700 | Exponent, Inc. | 14,412,148 |
39,035,283 | ||
HAND/MACHINE TOOLS 1.9% | ||
24,300 | Franklin Electric Co., Inc. | 2,348,595 |
45,100 | MSA Safety, Inc. | 7,614,233 |
9,962,828 | ||
MACHINERY - DIVERSIFIED 3.9% | ||
23,300 | Applied Industrial Technologies, Inc. | 4,023,677 |
13,500 | Kadant, Inc. | 3,784,185 |
61,647 | Watts Water Technologies, Inc. Class A | 12,843,536 |
20,651,398 | ||
METAL FABRICATE/HARDWARE 2.8% | ||
52,500 | RBC Bearings, Inc.(1) | 14,956,725 |
MISCELLANEOUS MANUFACTURERS 3.4% | ||
19,400 | Carlisle Cos., Inc. | 6,061,142 |
13,200 | Enpro, Inc. | 2,068,968 |
132,003 | Federal Signal Corp. | 10,129,910 |
18,260,020 | ||
Shares | Value | |
COMMON STOCKS 95.1% (continued) | ||
INDUSTRIALS 42.1% (continued) | ||
RETAIL 0.4% | ||
48,600 | Rush Enterprises, Inc. Class A | $2,444,580 |
TRANSPORTATION 1.2% | ||
33,800 | Landstar System, Inc. | 6,545,370 |
TRUCKING & LEASING 0.3% | ||
11,500 | GATX Corp. | 1,382,530 |
224,743,709 | ||
INFORMATION TECHNOLOGY 16.7% | ||
COMMERCIAL SERVICES 0.4% | ||
36,600 | Alarm.com Holdings, Inc.(1) | 2,365,092 |
COMPUTERS 2.4% | ||
60,800 | Crane NXT Co. | 3,457,696 |
29,200 | Insight Enterprises, Inc.(1) | 5,173,948 |
21,700 | Qualys, Inc.(1) | 4,259,276 |
12,890,920 | ||
ELECTRICAL EQUIPMENT 0.5% | ||
9,200 | Littelfuse, Inc. | 2,461,552 |
ELECTRONICS 2.6% | ||
76,100 | Badger Meter, Inc. | 11,747,557 |
21,400 | TD SYNNEX Corp. | 2,302,854 |
14,050,411 | ||
INTERNET 2.7% | ||
177,100 | ePlus, Inc.(1) | 14,139,664 |
MISCELLANEOUS MANUFACTURERS 2.2% | ||
61,700 | Fabrinet(1) | 11,743,361 |
SOFTWARE 5.9% | ||
45,900 | Five9, Inc.(1) | 3,611,871 |
104,500 | SPS Commerce, Inc.(1) | 20,256,280 |
76,400 | Workiva, Inc.(1) | 7,756,892 |
31,625,043 | ||
89,276,043 | ||
Shares | Value | |
COMMON STOCKS 95.1% (continued) | ||
MATERIALS 4.0% | ||
CHEMICALS 1.9% | ||
30,300 | Balchem Corp. | $4,507,125 |
26,700 | Quaker Chemical Corp. | 5,698,314 |
10,205,439 | ||
PACKAGING & CONTAINERS 2.1% | ||
28,200 | AptarGroup, Inc. | 3,486,084 |
172,600 | Silgan Holdings, Inc. | 7,810,150 |
11,296,234 | ||
21,501,673 | ||
UTILITIES 0.9% | ||
WATER 0.9% | ||
59,900 | American States Water Co. | 4,817,158 |
TOTAL COMMON STOCKS (Cost $263,723,384) | 507,477,772 | |
SHORT-TERM INVESTMENTS 4.7% | ||
MONEY MARKET FUNDS 4.7% | ||
25,216,227 | State Street Institutional U.S. Government Money Market Fund, Premier Class, 5.32%(2) | 25,216,227 |
TOTAL SHORT-TERM INVESTMENTS (Cost $25,216,227) | 25,216,227 | |
TOTAL INVESTMENTS IN SECURITIES 99.8% (Cost $288,939,611) | $532,693,999 | |
CASH AND OTHER ASSETS IN EXCESS OF LIABILITIES 0.2% | 1,254,403 | |
NET ASSETS 100.0% | $533,948,402 | |
(1) | Non-income producing. |
(2) | Rate reflects 7 day yield as of December 31, 2023. |
Investments in Securities: | Level 1 | Level 2 | Level 3 | Total |
Assets | ||||
Common Stocks* | $507,477,772 | $— | $— | $507,477,772 |
Short-Term Investments | 25,216,227 | — | — | 25,216,227 |
Total Investments in Securities | $532,693,999 | $— | $— | $532,693,999 |
* | See Schedule of Investments for further breakdown by category. |
Ten Largest Holdings* | |||
Issue | Shares | Value | Percentage of Net Assets |
Gartner, Inc. | 141,700 | $63,922,287 | 5.1 % |
CDW Corp. | 276,100 | 62,763,052 | 5.0 % |
MSCI, Inc. | 103,302 | 58,432,776 | 4.6 % |
Lennox International, Inc. | 127,700 | 57,148,304 | 4.5 % |
Tyler Technologies, Inc. | 136,041 | 56,881,463 | 4.5 % |
STERIS PLC | 245,100 | 53,885,235 | 4.3 % |
Pool Corp. | 134,961 | 53,810,300 | 4.2 % |
TransDigm Group, Inc. | 51,300 | 51,895,080 | 4.1 % |
HEICO Corp. | 285,293 | 51,030,359 | 4.1 % |
Fair Isaac Corp. | 39,900 | 46,443,999 | 3.7 % |
Asset Allocation — Percentage of Net Assets |

Sector Weightings — Percentage of Total Investments In Securities* |
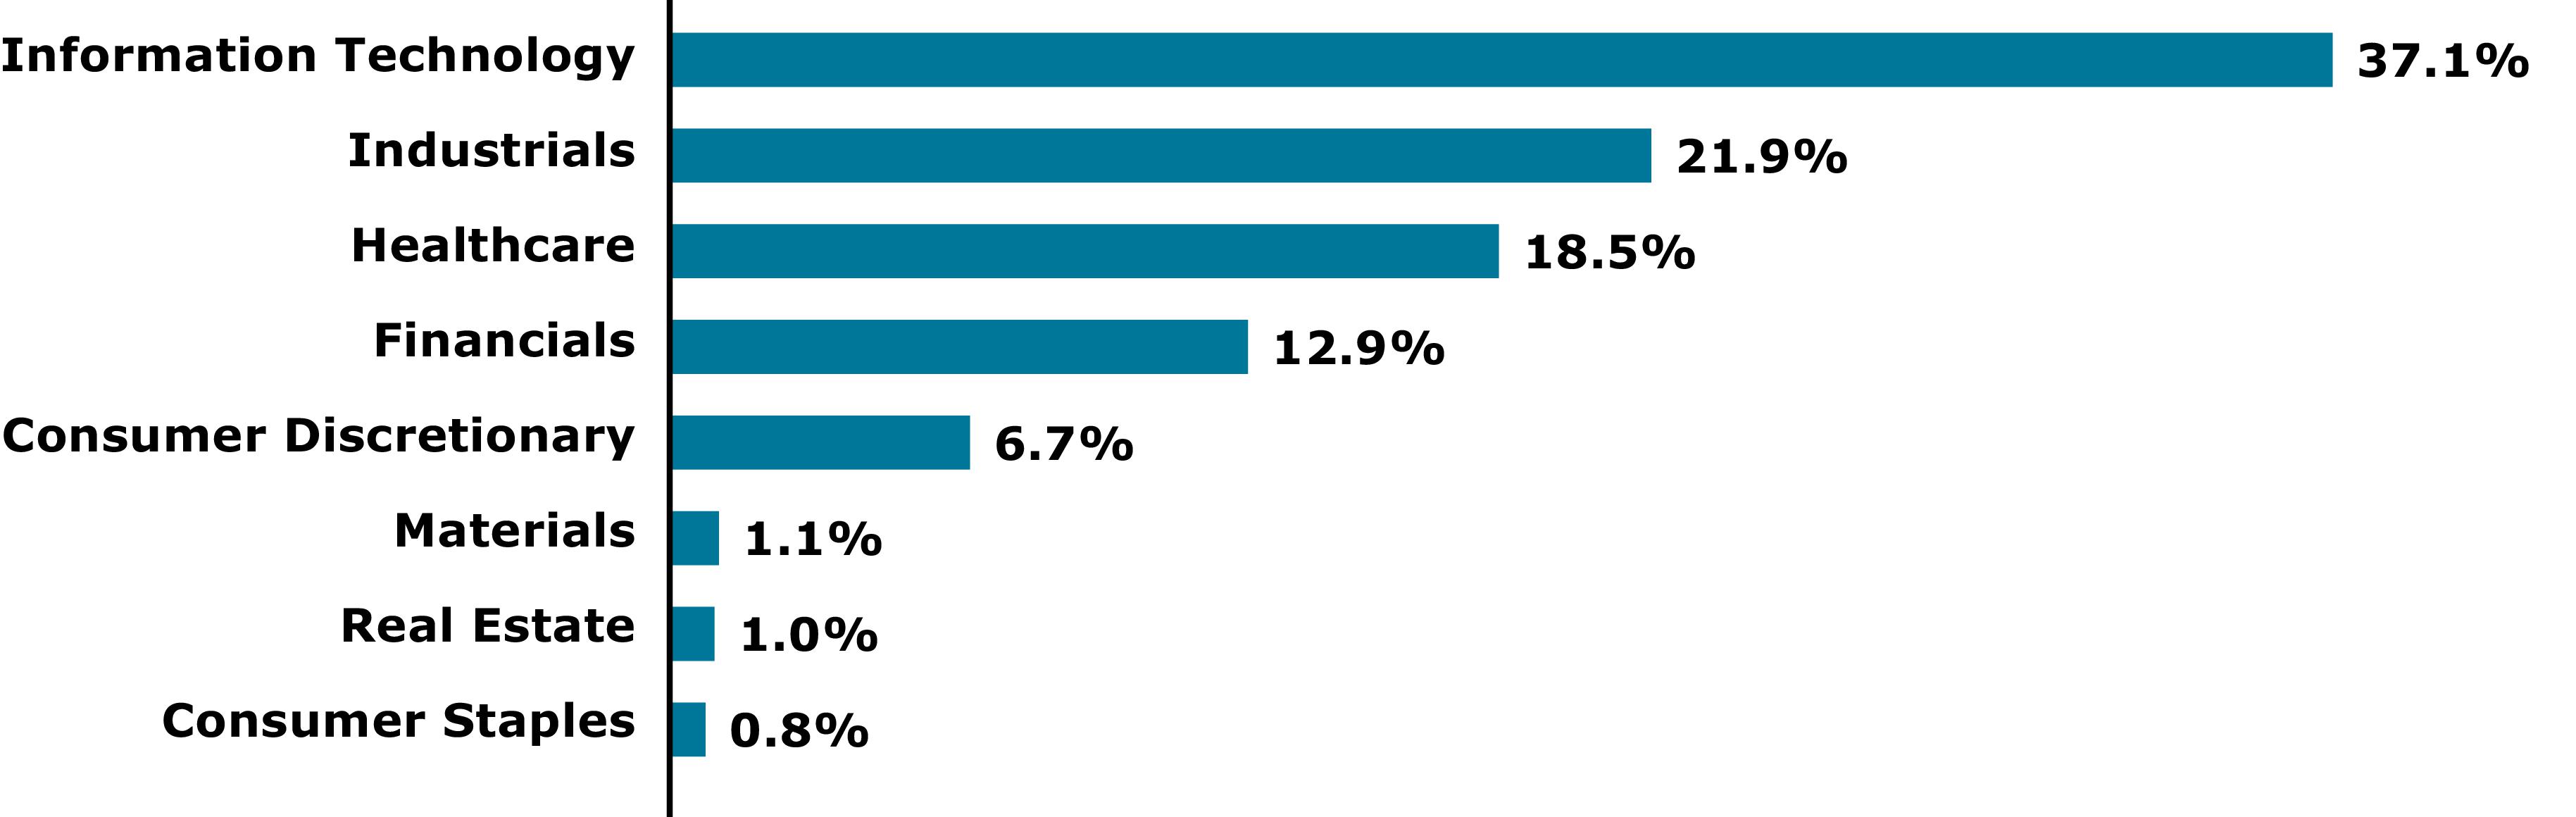
* | Excludes short-term investments, if any. |
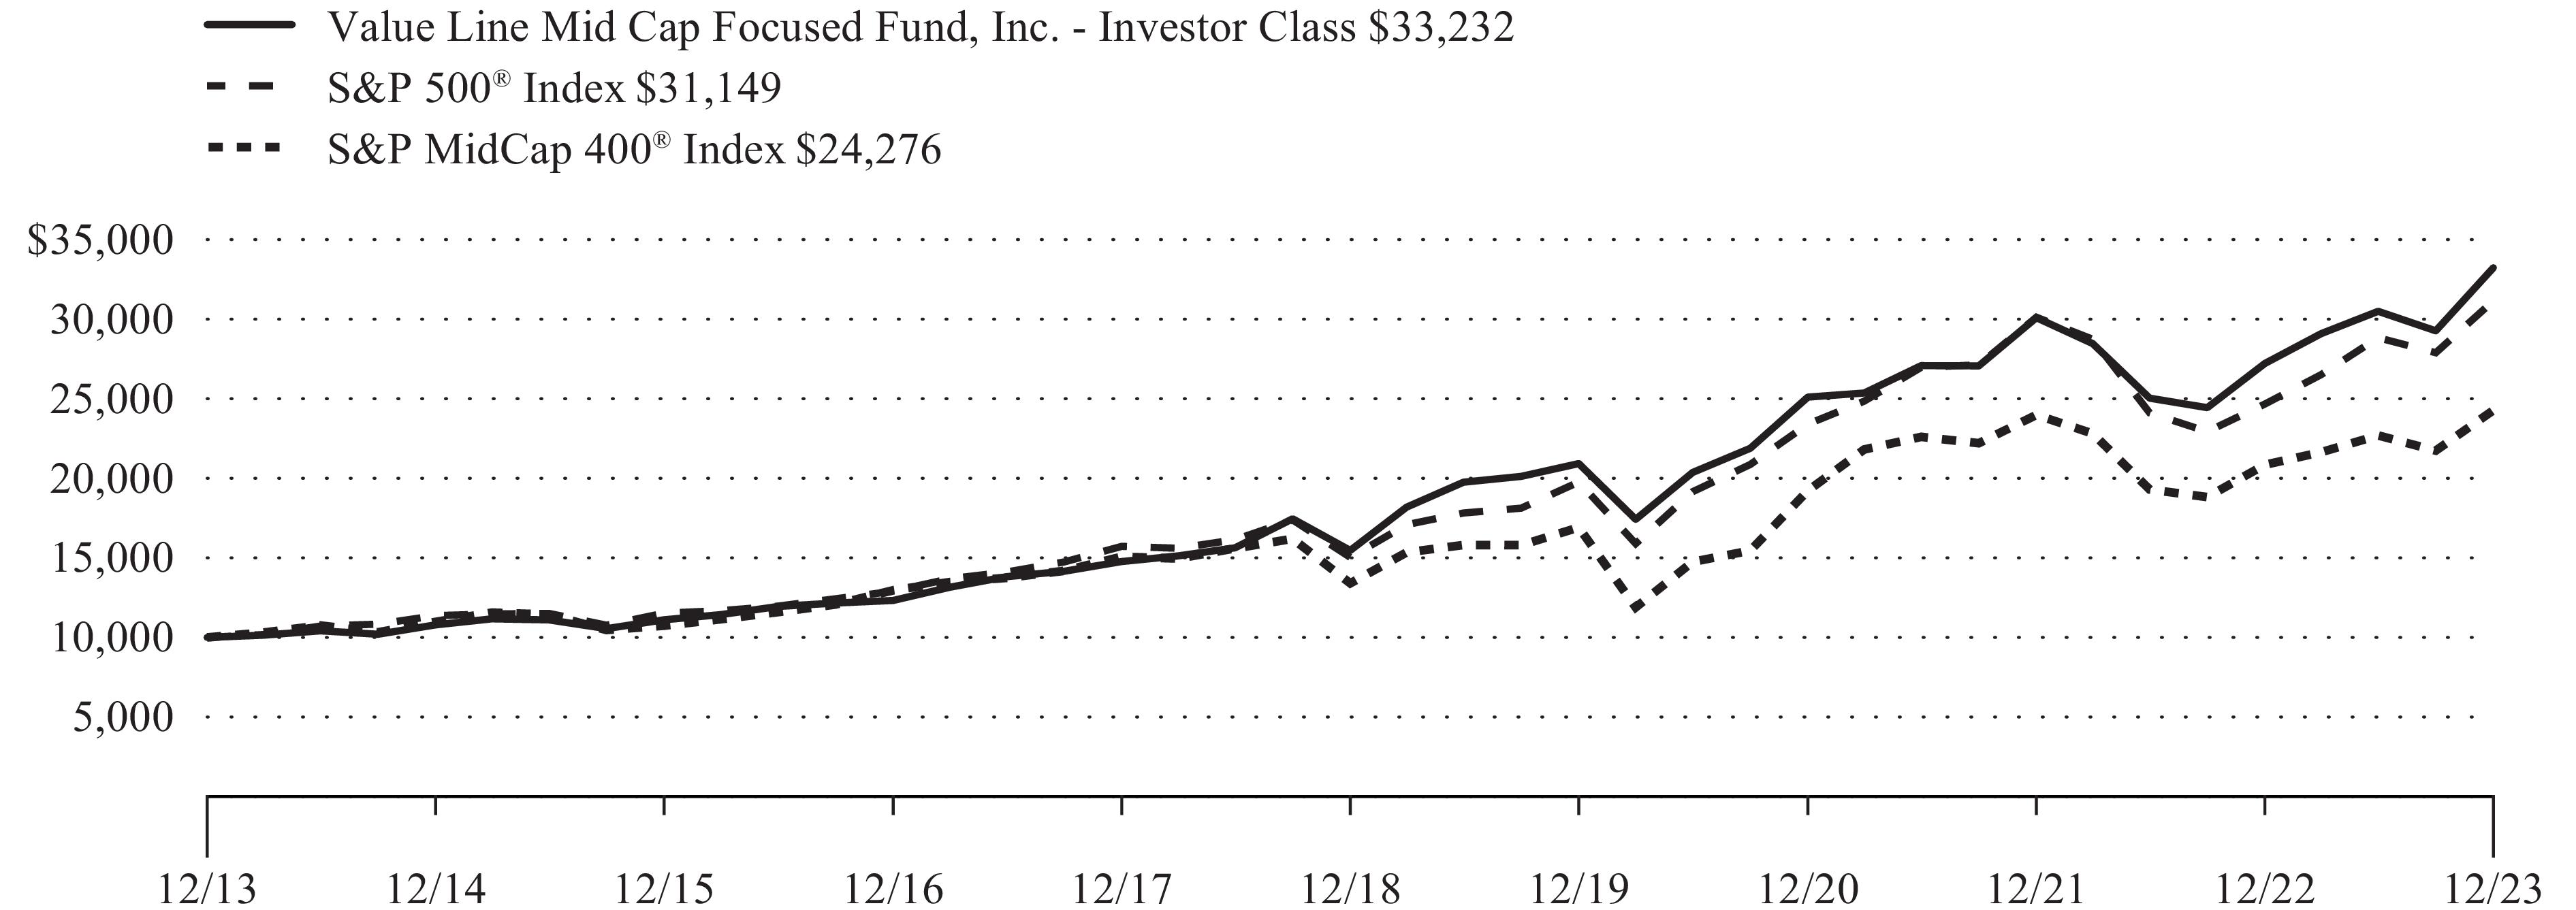
Comparison of a Change in Value of a $10,000 Investment in the Value Line Mid Cap Focused Fund, Inc., the S&P 500® Index and the S&P MidCap 400® Index**
1 Yr | 5 Yrs | 10 Yrs | ||
Investor Class | ||||
Value Line Mid Cap Focused Fund, Inc. | 22.11 % | 16.53 % | 12.76 % | |
S&P 500® Index*** | 26.29 % | 15.69 % | 12.03 % | |
S&P MidCap 400® Index**** | 16.44 % | 12.62 % | 9.27 % | |
1 Yr | 5 Yrs | Since Inception 8/14/2017 | ||
Institutional Class | ||||
Value Line Mid Cap Focused Fund, Inc. | 22.38 % | 16.83 % | 15.01 % | |
S&P 500® Index*** | 26.29 % | 15.69 % | 13.04 % | |
S&P MidCap 400® Index**** | 16.44 % | 12.62 % | 9.65 % |
Shares | Value | |
COMMON STOCKS 94.9% | ||
CONSUMER DISCRETIONARY 6.3% | ||
DISTRIBUTION/WHOLESALE 4.2% | ||
134,961 | Pool Corp. | $53,810,300 |
ENTERTAINMENT 2.1% | ||
194,490 | Churchill Downs, Inc. | 26,242,536 |
80,052,836 | ||
CONSUMER STAPLES 0.8% | ||
FOOD 0.8% | ||
59,800 | J & J Snack Foods Corp. | 9,994,972 |
FINANCIALS 12.3% | ||
INSURANCE 6.4% | ||
304,392 | American Financial Group, Inc. | 36,189,165 |
637,004 | W R Berkley Corp. | 45,048,923 |
81,238,088 | ||
SOFTWARE 5.9% | ||
32,800 | Fiserv, Inc.(1) | 4,357,152 |
66,708 | Jack Henry & Associates, Inc. | 10,900,754 |
103,302 | MSCI, Inc. | 58,432,776 |
73,690,682 | ||
154,928,770 | ||
HEALTHCARE 17.5% | ||
ELECTRONICS 1.4% | ||
14,100 | Mettler-Toledo International, Inc.(1) | 17,102,736 |
HEALTHCARE PRODUCTS 10.3% | ||
55,900 | IDEXX Laboratories, Inc.(1) | 31,027,295 |
245,100 | STERIS PLC | 53,885,235 |
128,616 | West Pharmaceutical Services, Inc. | 45,288,266 |
130,200,796 | ||
HEALTHCARE SERVICES 5.8% | ||
61,900 | Chemed Corp. | 36,196,025 |
13,800 | ICON PLC(1) | 3,906,366 |
145,000 | IQVIA Holdings, Inc.(1) | 33,550,100 |
73,652,491 | ||
220,956,023 | ||
INDUSTRIALS 20.8% | ||
AEROSPACE/DEFENSE 8.2% | ||
285,293 | HEICO Corp. | 51,030,359 |
51,300 | TransDigm Group, Inc. | 51,895,080 |
102,925,439 | ||
BUILDING MATERIALS 4.5% | ||
127,700 | Lennox International, Inc. | 57,148,304 |
COMMERCIAL SERVICES 3.5% | ||
57,193 | Cintas Corp. | 34,467,933 |
231,049 | Rollins, Inc. | 10,089,910 |
44,557,843 | ||
ENGINEERING & CONSTRUCTION 1.2% | ||
166,400 | Exponent, Inc. | 14,649,856 |
ENVIRONMENTAL CONTROL 3.4% | ||
289,506 | Waste Connections, Inc. | 43,214,561 |
262,496,003 | ||
Shares | Value | |
COMMON STOCKS 94.9% (continued) | ||
INFORMATION TECHNOLOGY 35.2% | ||
COMMERCIAL SERVICES 5.1% | ||
141,700 | Gartner, Inc.(1) | $63,922,287 |
COMPUTERS 2.9% | ||
199,510 | CGI, Inc.(1) | 21,389,467 |
53,360 | EPAM Systems, Inc.(1) | 15,866,062 |
37,255,529 | ||
INTERNET 5.0% | ||
276,100 | CDW Corp. | 62,763,052 |
MISCELLANEOUS MANUFACTURERS 2.5% | ||
72,200 | Teledyne Technologies, Inc.(1) | 32,222,138 |
SEMICONDUCTORS 3.5% | ||
69,311 | Monolithic Power Systems, Inc. | 43,719,993 |
SOFTWARE 13.6% | ||
45,400 | ANSYS, Inc.(1) | 16,474,752 |
149,600 | Cadence Design Systems, Inc.(1) | 40,746,552 |
39,900 | Fair Isaac Corp.(1) | 46,443,999 |
19,400 | Roper Technologies, Inc. | 10,576,298 |
136,041 | Tyler Technologies, Inc.(1) | 56,881,463 |
171,123,064 | ||
TELECOMMUNICATIONS 2.6% | ||
67,000 | Motorola Solutions, Inc. | 20,977,030 |
61,800 | Nice Ltd. ADR(1)(2) | 12,329,718 |
33,306,748 | ||
444,312,811 | ||
MATERIALS 1.0% | ||
PACKAGING & CONTAINERS 1.0% | ||
100,700 | AptarGroup, Inc. | 12,448,534 |
REAL ESTATE 1.0% | ||
REITS 1.0% | ||
172,300 | Equity Lifestyle Properties, Inc. REIT | 12,154,042 |
TOTAL COMMON STOCKS (Cost $871,263,668) | 1,197,343,991 | |
SHORT-TERM INVESTMENTS 4.5% | ||
MONEY MARKET FUNDS 4.5% | ||
57,506,174 | State Street Institutional U.S. Government Money Market Fund, Premier Class, 5.32%(3) | 57,506,174 |
TOTAL SHORT-TERM INVESTMENTS (Cost $57,506,174) | 57,506,174 | |
TOTAL INVESTMENTS IN SECURITIES 99.4% (Cost $928,769,842) | $1,254,850,165 | |
CASH AND OTHER ASSETS IN EXCESS OF LIABILITIES 0.6% | 7,014,224 | |
NET ASSETS 100.0% | $1,261,864,389 | |
(1) | Non-income producing. |
(2) | A portion or all of the security was held on loan. As of December 31, 2023, the market value of the securities on loan was $10,919,581. |
(3) | Rate reflects 7 day yield as of December 31, 2023. |
ADR | American Depositary Receipt. |
REITS | Real Estate Investment Trusts. |
Investments in Securities: | Level 1 | Level 2 | Level 3 | Total |
Assets | ||||
Common Stocks* | $1,197,343,991 | $— | $— | $1,197,343,991 |
Short-Term Investments | 57,506,174 | — | — | 57,506,174 |
Total Investments in Securities | $1,254,850,165 | $— | $— | $1,254,850,165 |
* | See Schedule of Investments for further breakdown by category. |
Ten Largest Holdings* | |||
Issue | Shares | Value | Percentage of Net Assets |
Cintas Corp. | 52,177 | $31,444,991 | 7.5 % |
TransDigm Group, Inc. | 24,957 | 25,246,501 | 6.1 % |
Accenture PLC | 70,200 | 24,633,882 | 5.9 % |
Costco Wholesale Corp. | 33,800 | 22,310,704 | 5.4 % |
Roper Technologies, Inc. | 38,069 | 20,754,076 | 5.0 % |
S&P Global, Inc. | 41,573 | 18,313,738 | 4.4 % |
MasterCard, Inc. | 42,100 | 17,956,071 | 4.3 % |
Union Pacific Corp. | 72,800 | 17,881,136 | 4.3 % |
ServiceNow, Inc. | 23,639 | 16,700,717 | 4.0 % |
Cadence Design Systems, Inc. | 59,000 | 16,069,830 | 3.8 % |
Asset Allocation — Percentage of Net Assets |

Sector Weightings — Percentage of Total Investments In Securities* |
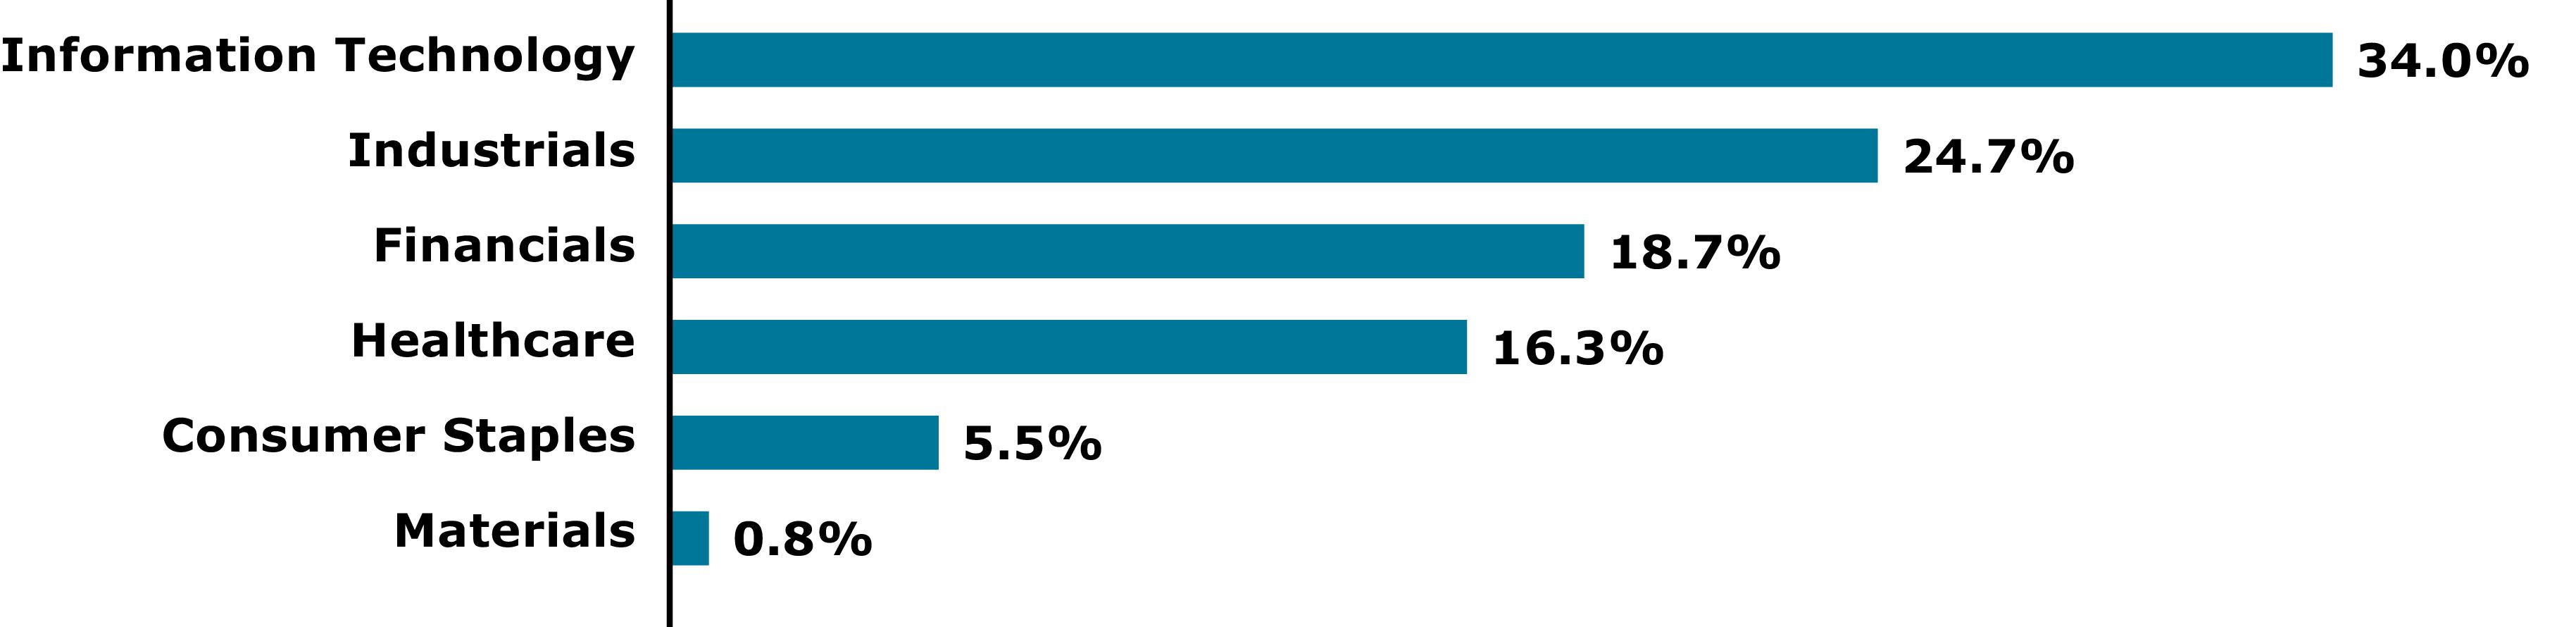
* | Excludes short-term investments, if any. |
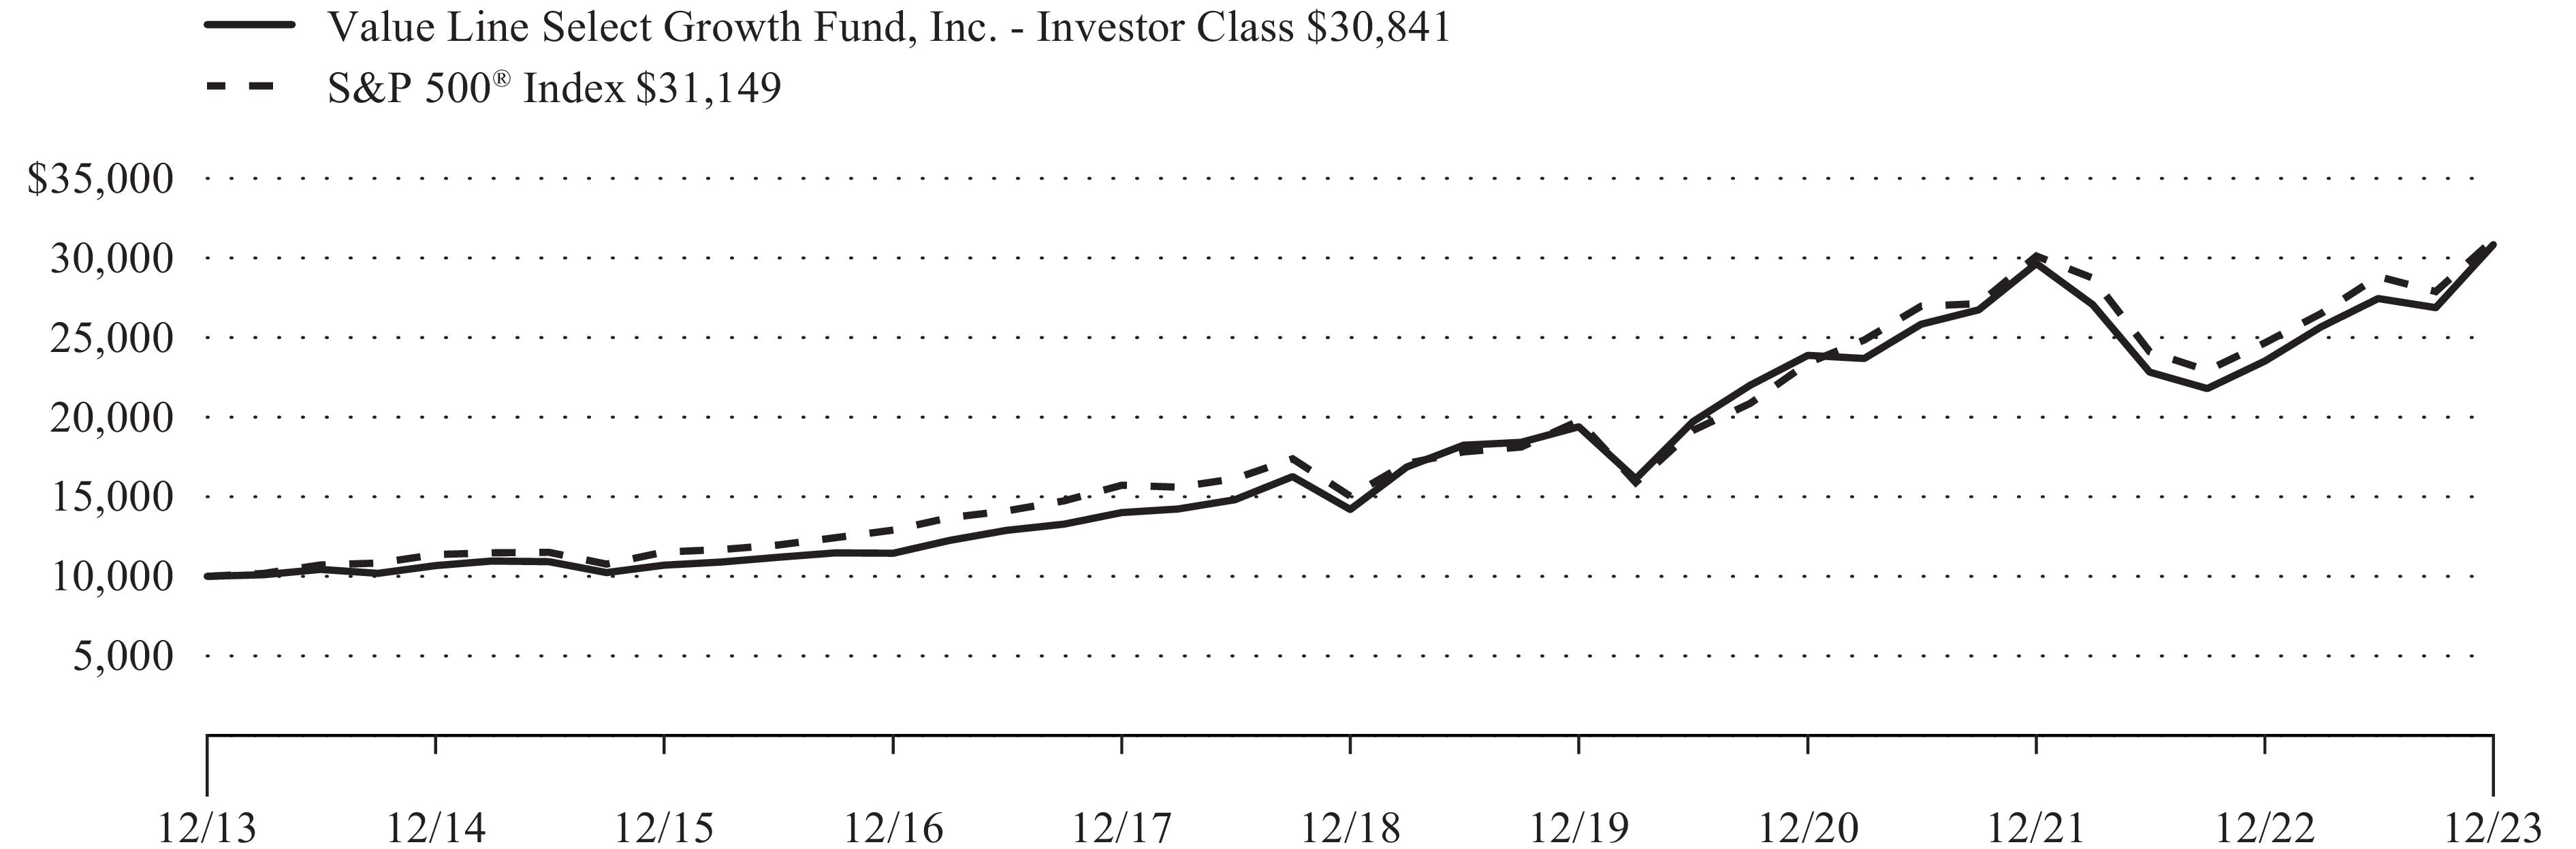
Comparison of a Change in Value of a $10,000 Investment in the Value Line Select Growth Fund, Inc. and the S&P 500® Index**
1 Yr | 5 Yrs | 10 Yrs | |||
Investor Class | |||||
Value Line Select Growth Fund, Inc. | 31.11 % | 16.78 % | 11.92 % | ||
S&P 500® Index*** | 26.29 % | 15.69 % | 12.03 % | ||
1 Yr | 3 Yrs | Since Inception 5/1/2020 | |||
Institutional Class | |||||
Value Line Select Growth Fund, Inc. | 31.41 % | 9.17 % | 15.81 % | ||
S&P 500® Index*** | 26.29 % | 10.00 % | 15.93 % |
Shares | Value | |
COMMON STOCKS 97.2% | ||
CONSUMER STAPLES 5.4% | ||
RETAIL 5.4% | ||
33,800 | Costco Wholesale Corp. | $22,310,704 |
FINANCIALS 18.1% | ||
COMMERCIAL SERVICES 4.4% | ||
41,573 | S&P Global, Inc. | 18,313,738 |
DIVERSIFIED FINANCIALS 7.9% | ||
116,889 | Intercontinental Exchange, Inc. | 15,012,054 |
42,100 | MasterCard, Inc. Class A | 17,956,071 |
32,968,125 | ||
INSURANCE 5.3% | ||
18,000 | Aon PLC Class A | 5,238,360 |
12,400 | Arthur J Gallagher & Co. | 2,788,512 |
74,700 | Marsh & McLennan Cos., Inc. | 14,153,409 |
22,180,281 | ||
SOFTWARE 0.5% | ||
4,000 | MSCI, Inc. | 2,262,600 |
75,724,744 | ||
HEALTHCARE 15.8% | ||
HEALTHCARE PRODUCTS 13.3% | ||
54,600 | Danaher Corp. | 12,631,164 |
23,400 | IDEXX Laboratories, Inc.(1) | 12,988,170 |
47,673 | Stryker Corp. | 14,276,157 |
29,400 | Thermo Fisher Scientific, Inc. | 15,605,226 |
55,500,717 | ||
PHARMACEUTICALS 2.5% | ||
53,000 | Zoetis, Inc. | 10,460,610 |
65,961,327 | ||
INDUSTRIALS 24.1% | ||
AEROSPACE/DEFENSE 6.1% | ||
24,957 | TransDigm Group, Inc. | 25,246,501 |
BUILDING MATERIALS 1.1% | ||
19,000 | Trane Technologies PLC | 4,634,100 |
COMMERCIAL SERVICES 7.5% | ||
52,177 | Cintas Corp. | 31,444,991 |
ENVIRONMENTAL CONTROL 5.1% | ||
81,800 | Republic Services, Inc. | 13,489,638 |
51,700 | Waste Connections, Inc. | 7,717,259 |
21,206,897 | ||
Shares | Value | |
COMMON STOCKS 97.2% (continued) | ||
INDUSTRIALS 24.1% (continued) | ||
TRANSPORTATION 4.3% | ||
72,800 | Union Pacific Corp. | $17,881,136 |
100,413,625 | ||
INFORMATION TECHNOLOGY 33.0% | ||
COMPUTERS 5.9% | ||
70,200 | Accenture PLC Class A | 24,633,882 |
SOFTWARE 24.3% | ||
18,000 | Adobe, Inc.(1) | 10,738,800 |
59,000 | Cadence Design Systems, Inc.(1) | 16,069,830 |
25,700 | Intuit, Inc. | 16,063,271 |
38,069 | Roper Technologies, Inc. | 20,754,076 |
44,400 | Salesforce, Inc.(1) | 11,683,416 |
23,639 | ServiceNow, Inc.(1) | 16,700,717 |
18,800 | Synopsys, Inc.(1) | 9,680,308 |
101,690,418 | ||
TELECOMMUNICATIONS 2.8% | ||
37,000 | Motorola Solutions, Inc. | 11,584,330 |
137,908,630 | ||
MATERIALS 0.8% | ||
CHEMICALS 0.8% | ||
17,100 | Ecolab, Inc. | 3,391,785 |
TOTAL COMMON STOCKS (Cost $187,190,118) | 405,710,815 | |
SHORT-TERM INVESTMENTS 2.8% | ||
MONEY MARKET FUNDS 2.8% | ||
11,721,590 | State Street Institutional U.S. Government Money Market Fund, Premier Class, 5.32%(2) | 11,721,590 |
TOTAL SHORT-TERM INVESTMENTS (Cost $11,721,590) | 11,721,590 | |
TOTAL INVESTMENTS IN SECURITIES 100.0% (Cost $198,911,708) | $417,432,405 | |
CASH AND OTHER ASSETS IN EXCESS OF LIABILITIES 0.0% | 101,817 | |
NET ASSETS 100.0% | $417,534,222 | |
(1) | Non-income producing. |
(2) | Rate reflects 7 day yield as of December 31, 2023. |
Investments in Securities: | Level 1 | Level 2 | Level 3 | Total |
Assets | ||||
Common Stocks* | $405,710,815 | $— | $— | $405,710,815 |
Short-Term Investments | 11,721,590 | — | — | 11,721,590 |
Total Investments in Securities | $417,432,405 | $— | $— | $417,432,405 |
* | See Schedule of Investments for further breakdown by category. |
Ten Largest Holdings* | |||
Issue | Shares | Value | Percentage of Net Assets |
Uber Technologies, Inc. | 355,000 | $21,857,350 | 7.0 % |
NVIDIA Corp. | 35,000 | 17,332,700 | 5.5 % |
Meta Platforms, Inc. | 47,000 | 16,636,120 | 5.3 % |
Amazon.com, Inc. | 97,000 | 14,738,180 | 4.7 % |
Alphabet, Inc. | 95,000 | 13,270,550 | 4.2 % |
Advanced Micro Devices, Inc. | 90,000 | 13,266,900 | 4.2 % |
Salesforce, Inc. | 48,000 | 12,630,720 | 4.0 % |
Exact Sciences Corp. | 170,000 | 12,576,600 | 4.0 % |
Microsoft Corp. | 32,500 | 12,221,300 | 3.9 % |
Booking Holdings, Inc. | 3,000 | 10,641,660 | 3.4 % |
Asset Allocation — Percentage of Net Assets |

Sector Weightings — Percentage of Total Investments In Securities* |
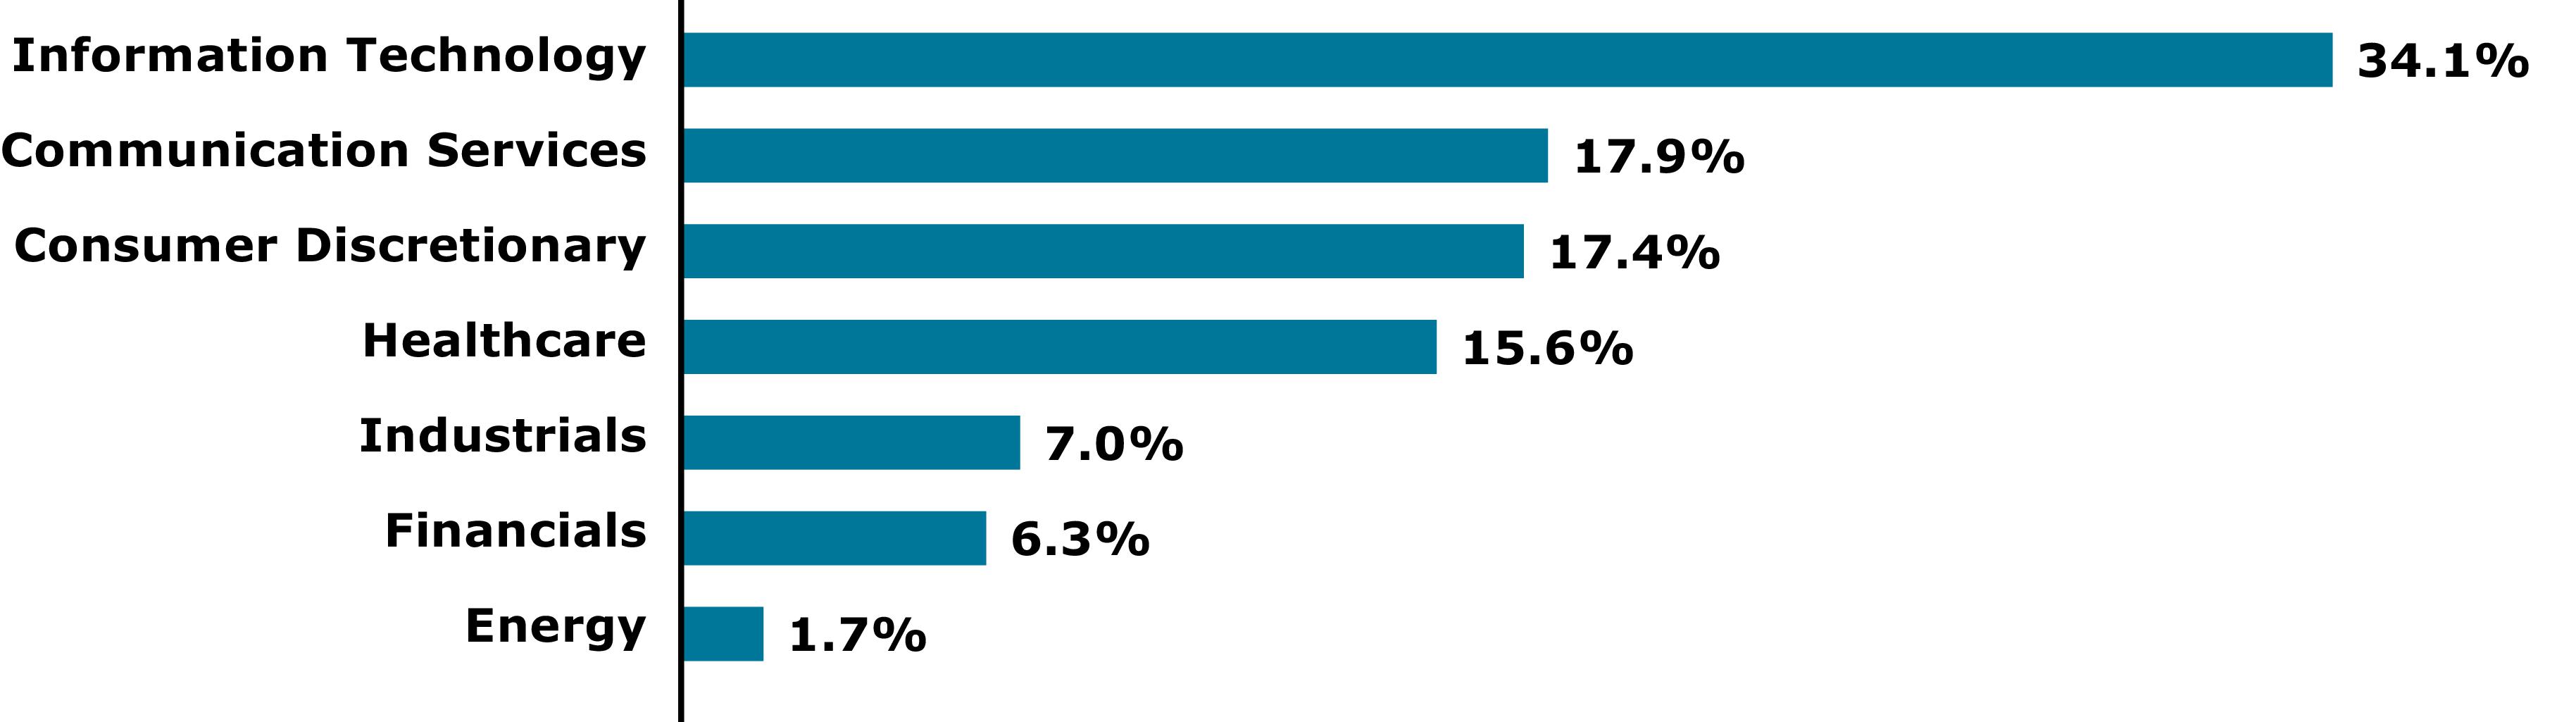
* | Excludes short-term investments, if any. |
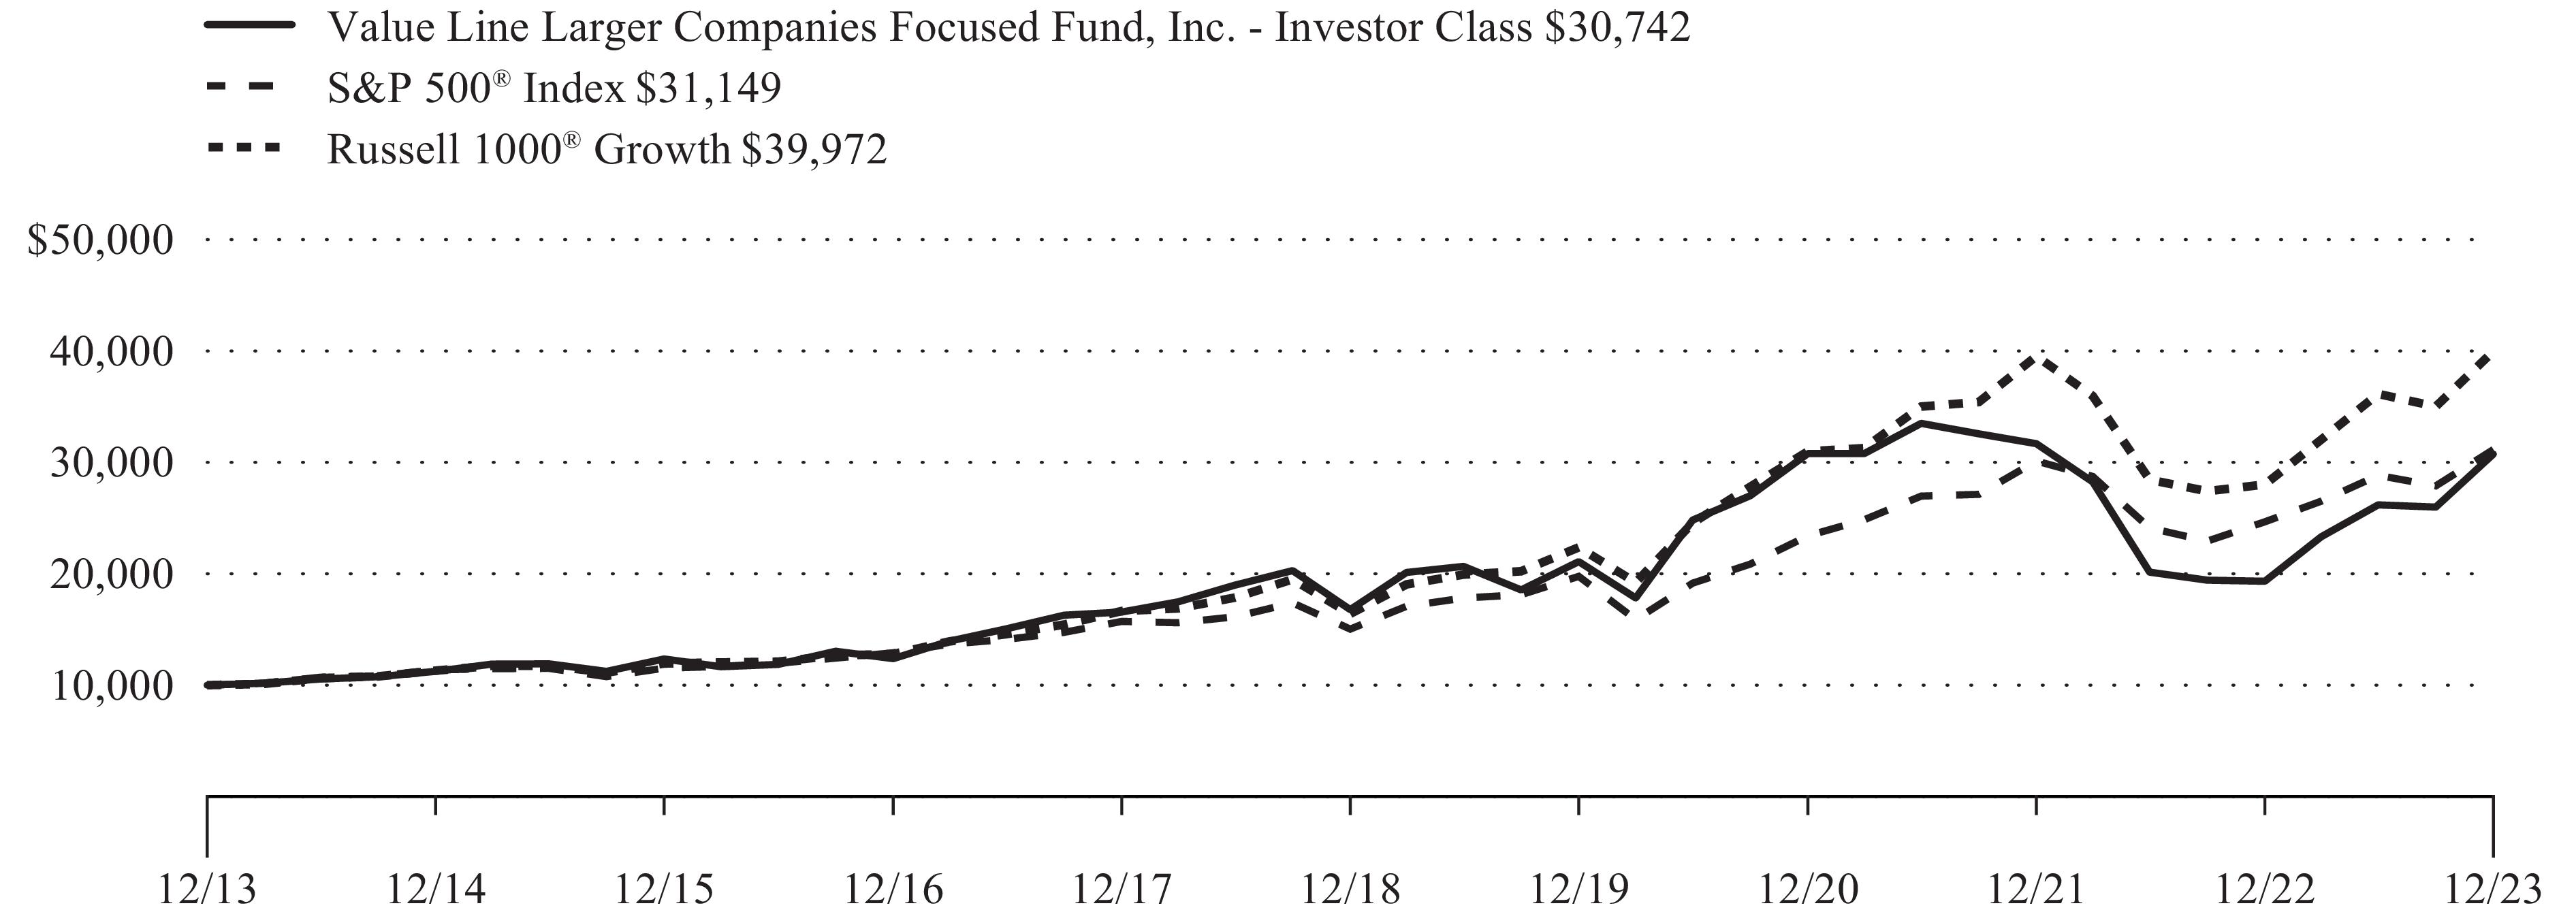
Comparison of a Change in Value of a $10,000 Investment in the Value Line Larger Companies Focused Fund, Inc., the S&P 500® Index and the Russell 1000® Growth Index**
1 Yr | 5 Yrs | 10 Yrs | ||
Investor Class | ||||
Value Line Larger Companies Focused Fund, Inc. | 59.06 % | 12.87 % | 11.89 % | |
S&P 500® Index*** | 26.29 % | 15.69 % | 12.03 % | |
Russell 1000® Growth Index**** | 42.68 % | 19.50 % | 14.86 % | |
1 Yr | 5 Yrs | Since Inception 11/1/2015 | ||
Institutional Class | ||||
Value Line Larger Companies Focused Fund, Inc. | 59.52 % | 13.14 % | 11.95 % | |
S&P 500® Index*** | 26.29 % | 15.69 % | 12.77 % | |
Russell 1000® Growth Index**** | 42.68 % | 19.50 % | 15.77 % |
Shares | Value | |
COMMON STOCKS 99.1% | ||
COMMUNICATION SERVICES 17.7% | ||
INTERNET 17.7% | ||
95,000 | Alphabet, Inc. Class A(1) | $13,270,550 |
220,000 | Match Group, Inc.(1) | 8,030,000 |
47,000 | Meta Platforms, Inc. Class A(1) | 16,636,120 |
16,000 | Netflix, Inc.(1) | 7,790,080 |
50,000 | Roku, Inc.(1) | 4,583,000 |
310,000 | Snap, Inc. Class A(1) | 5,248,300 |
55,558,050 | ||
CONSUMER DISCRETIONARY 17.2% | ||
AUTO MANUFACTURERS 4.7% | ||
350,000 | Rivian Automotive, Inc. Class A(1)(2) | 8,211,000 |
26,000 | Tesla, Inc.(1) | 6,460,480 |
14,671,480 | ||
ENTERTAINMENT 1.6% | ||
145,000 | DraftKings, Inc. Class A(1) | 5,111,250 |
INTERNET 9.3% | ||
48,000 | Alibaba Group Holding Ltd. ADR | 3,720,480 |
97,000 | Amazon.com, Inc.(1) | 14,738,180 |
3,000 | Booking Holdings, Inc.(1) | 10,641,660 |
29,100,320 | ||
RETAIL 1.6% | ||
10,000 | Lululemon Athletica, Inc.(1) | 5,112,900 |
53,995,950 | ||
ENERGY 1.7% | ||
OIL & GAS 1.7% | ||
35,000 | Diamondback Energy, Inc. | 5,427,800 |
FINANCIALS 6.2% | ||
COMMERCIAL SERVICES 1.3% | ||
65,000 | PayPal Holdings, Inc.(1) | 3,991,650 |
DIVERSIFIED FINANCIALS 3.3% | ||
40,000 | Visa, Inc. Class A | 10,414,000 |
INTERNET 1.6% | ||
400,000 | Robinhood Markets, Inc. Class A(1) | 5,096,000 |
19,501,650 | ||
HEALTHCARE 15.5% | ||
BIOTECHNOLOGY 8.1% | ||
70,000 | BioMarin Pharmaceutical, Inc.(1) | 6,749,400 |
370,000 | Exelixis, Inc.(1) | 8,876,300 |
24,000 | Vertex Pharmaceuticals, Inc.(1) | 9,765,360 |
25,391,060 | ||
HEALTHCARE PRODUCTS 4.0% | ||
170,000 | Exact Sciences Corp.(1) | 12,576,600 |
PHARMACEUTICALS 3.4% | ||
65,000 | DexCom, Inc.(1) | 8,065,850 |
290,000 | Revance Therapeutics, Inc.(1)(2) | 2,549,100 |
10,614,950 | ||
48,582,610 | ||
INDUSTRIALS 7.0% | ||
INTERNET 7.0% | ||
355,000 | Uber Technologies, Inc.(1) | 21,857,350 |
Shares | Value | |
COMMON STOCKS 99.1% (continued) | ||
INFORMATION TECHNOLOGY 33.8% | ||
COMPUTERS 4.8% | ||
23,000 | Apple, Inc. | $4,428,190 |
41,000 | Crowdstrike Holdings, Inc. Class A(1) | 10,468,120 |
14,896,310 | ||
INTERNET 3.5% | ||
65,000 | Okta, Inc.(1) | 5,884,450 |
67,000 | Shopify, Inc. Class A(1) | 5,219,300 |
11,103,750 | ||
SEMICONDUCTORS 9.7% | ||
90,000 | Advanced Micro Devices, Inc.(1) | 13,266,900 |
35,000 | NVIDIA Corp. | 17,332,700 |
30,599,600 | ||
SOFTWARE 15.8% | ||
6,700 | Intuit, Inc. | 4,187,701 |
32,500 | Microsoft Corp. | 12,221,300 |
48,000 | Salesforce, Inc.(1) | 12,630,720 |
12,700 | ServiceNow, Inc.(1) | 8,972,423 |
55,000 | Twilio, Inc. Class A(1) | 4,172,850 |
27,000 | Workday, Inc. Class A(1) | 7,453,620 |
49,638,614 | ||
106,238,274 | ||
TOTAL COMMON STOCKS (Cost $197,623,058) | 311,161,684 | |
SHORT-TERM INVESTMENTS 2.0% | ||
MONEY MARKET FUNDS 2.0% | ||
5,839,456 | State Street Institutional U.S. Government Money Market Fund, Premier Class, 5.32%(3) | 5,839,456 |
535,925 | State Street Navigator Securities Lending Government Money Market Portfolio(4) | 535,925 |
6,375,381 | ||
TOTAL SHORT-TERM INVESTMENTS (Cost $6,375,381) | 6,375,381 | |
TOTAL INVESTMENTS IN SECURITIES 101.1% (Cost $203,998,439) | $317,537,065 | |
EXCESS OF LIABILITIES OVER CASH AND OTHER ASSETS (1.1)% | (3,438,433 ) | |
NET ASSETS 100.0% | $314,098,632 | |
(1) | Non-income producing. |
(2) | A portion or all of the security was held on loan. As of December 31, 2023, the market value of the securities on loan was $9,527,742. |
(3) | Rate reflects 7 day yield as of December 31, 2023. |
(4) | Securities with an aggregate market value of $9,527,742 were out on loan in exchange for collateral including $535,925 of cash collateral as of December 31, 2023. The collateral was invested in a cash collateral reinvestment vehicle. |
ADR | American Depositary Receipt. |
Investments in Securities: | Level 1 | Level 2 | Level 3 | Total |
Assets | ||||
Common Stocks* | $311,161,684 | $— | $— | $311,161,684 |
Short-Term Investments | 6,375,381 | — | — | 6,375,381 |
Total Investments in Securities | $317,537,065 | $— | $— | $317,537,065 |
* | See Schedule of Investments for further breakdown by category. |
Ten Largest Holdings* | |||
Issue | Shares | Value | Percentage of Net Assets |
Cintas Corp. | 71,900 | $43,331,254 | 4.6 % |
TransDigm Group, Inc. | 38,400 | 38,845,440 | 4.1 % |
Roper Technologies, Inc. | 59,100 | 32,219,547 | 3.4 % |
Republic Services, Inc. | 192,627 | 31,766,119 | 3.3 % |
Fair Isaac Corp. | 24,900 | 28,983,849 | 3.1 % |
Adobe, Inc. | 42,800 | 25,534,480 | 2.7 % |
W R Berkley Corp. | 332,256 | 23,497,144 | 2.5 % |
Intercontinental Exchange, Inc. | 180,944 | 23,238,638 | 2.5 % |
Union Pacific Corp. | 91,300 | 22,425,106 | 2.4 % |
S&P Global, Inc. | 50,119 | 22,078,422 | 2.3 % |
Asset Allocation — Percentage of Net Assets |

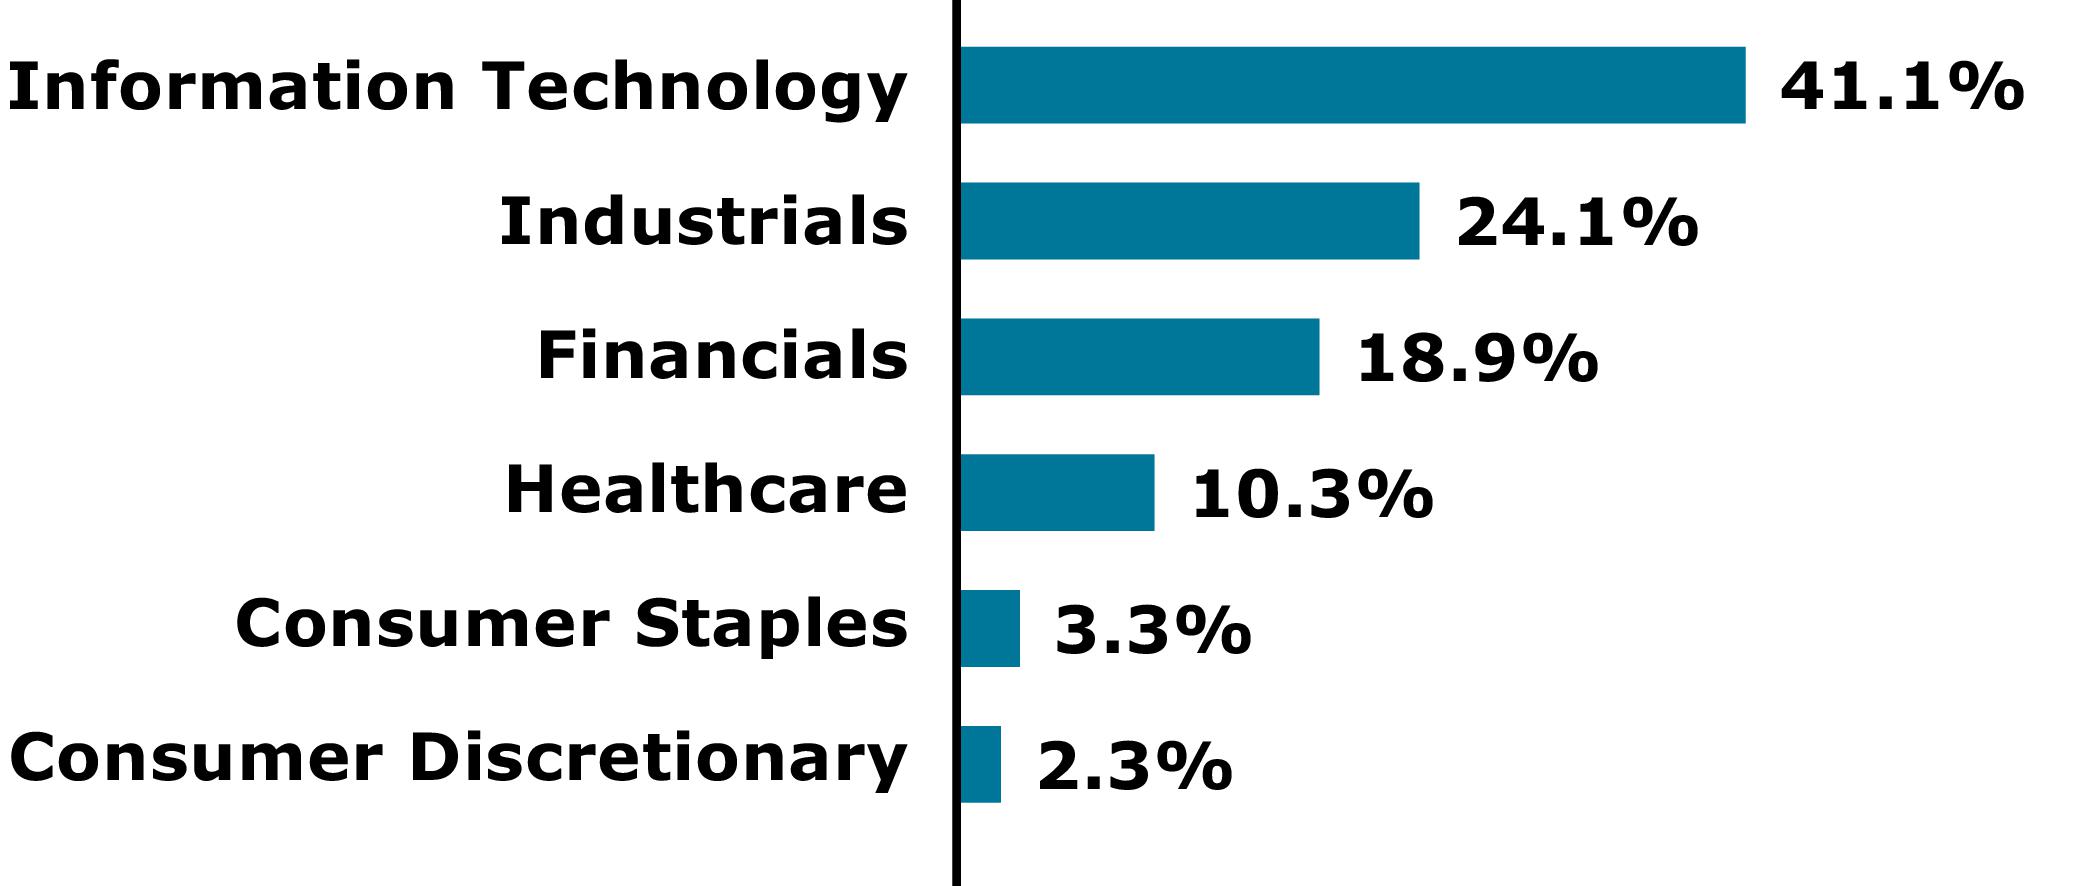
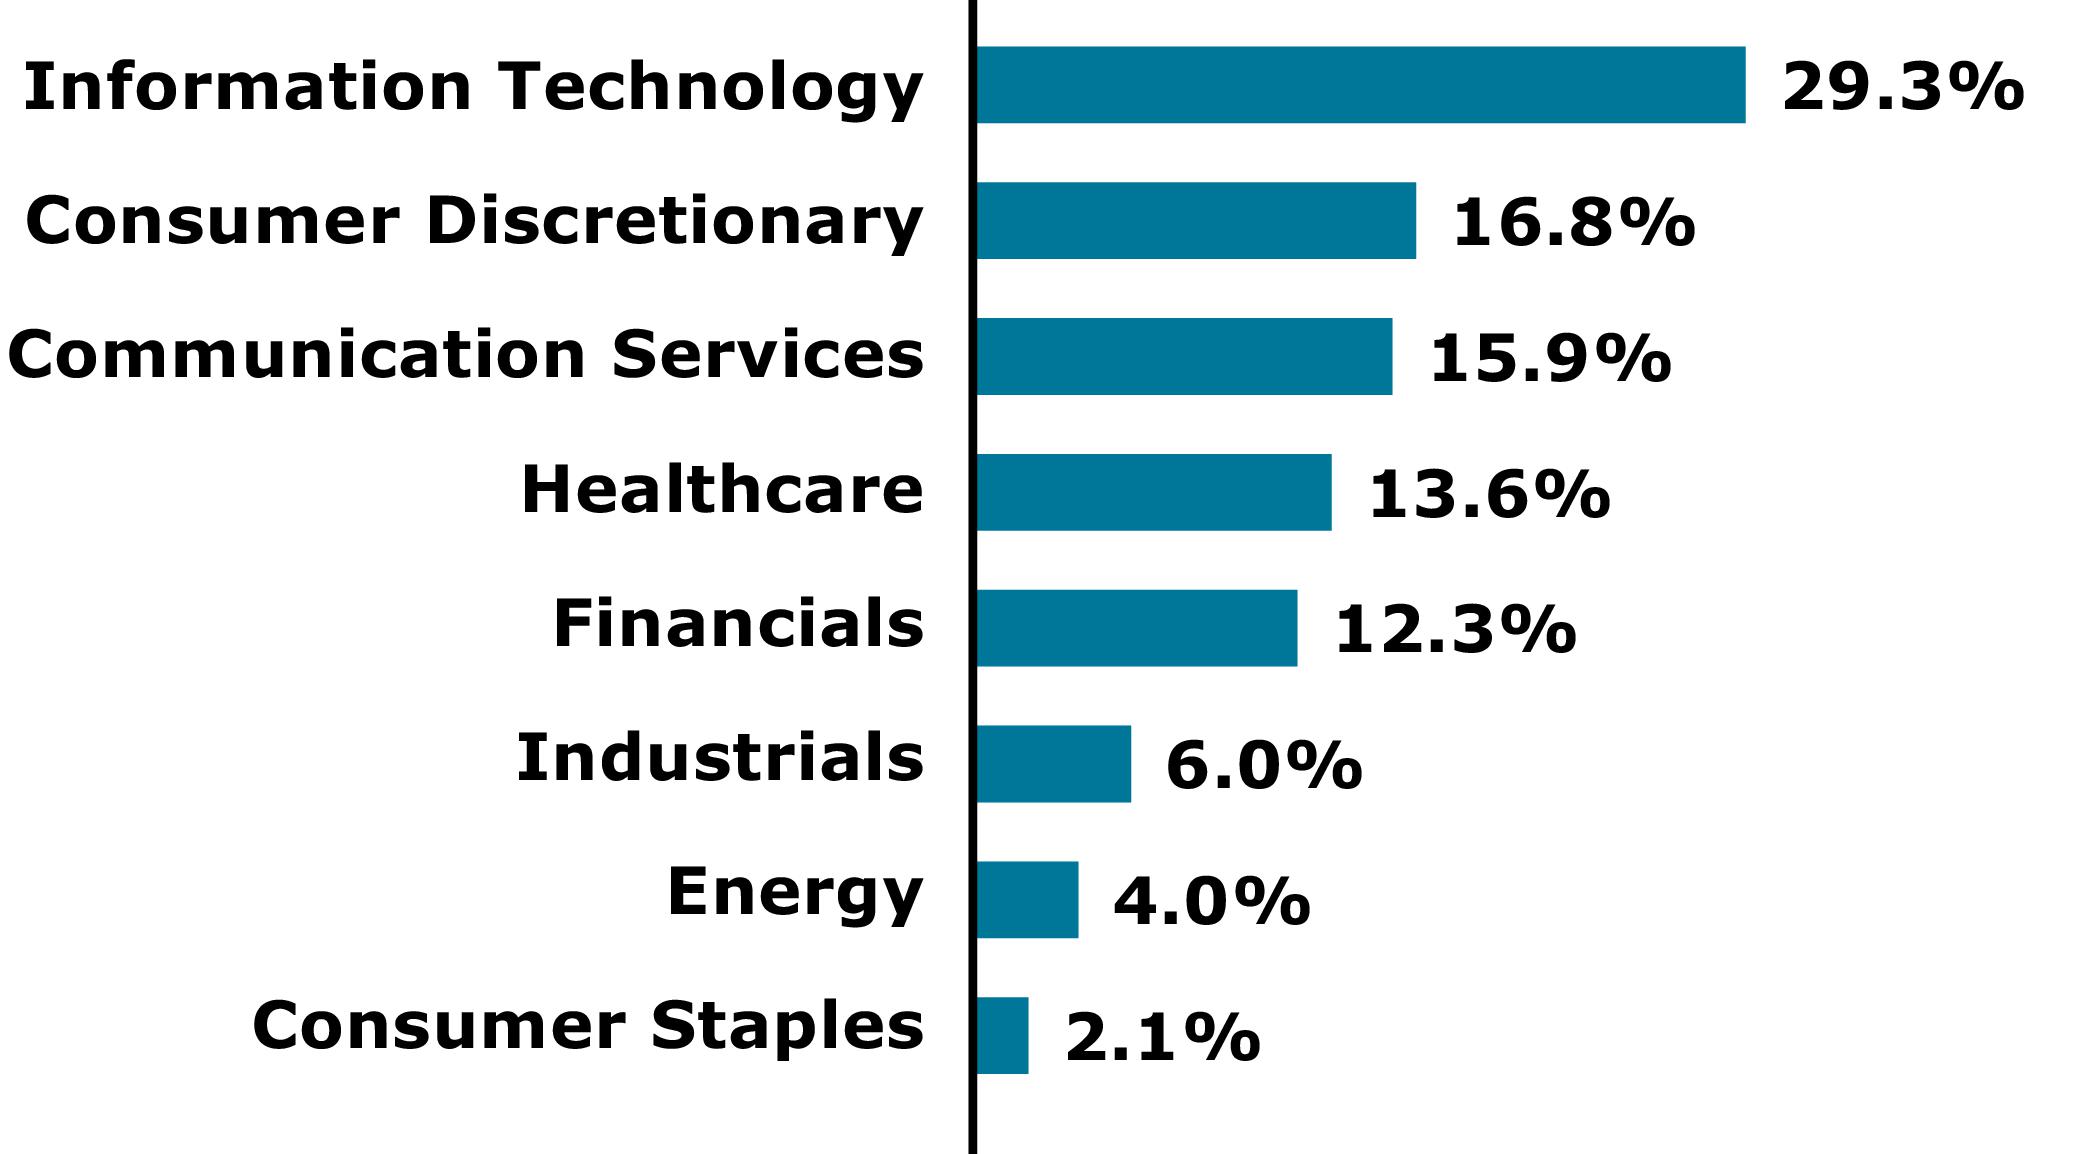
Common Stock Sectors — Percentage of Common Stocks* |
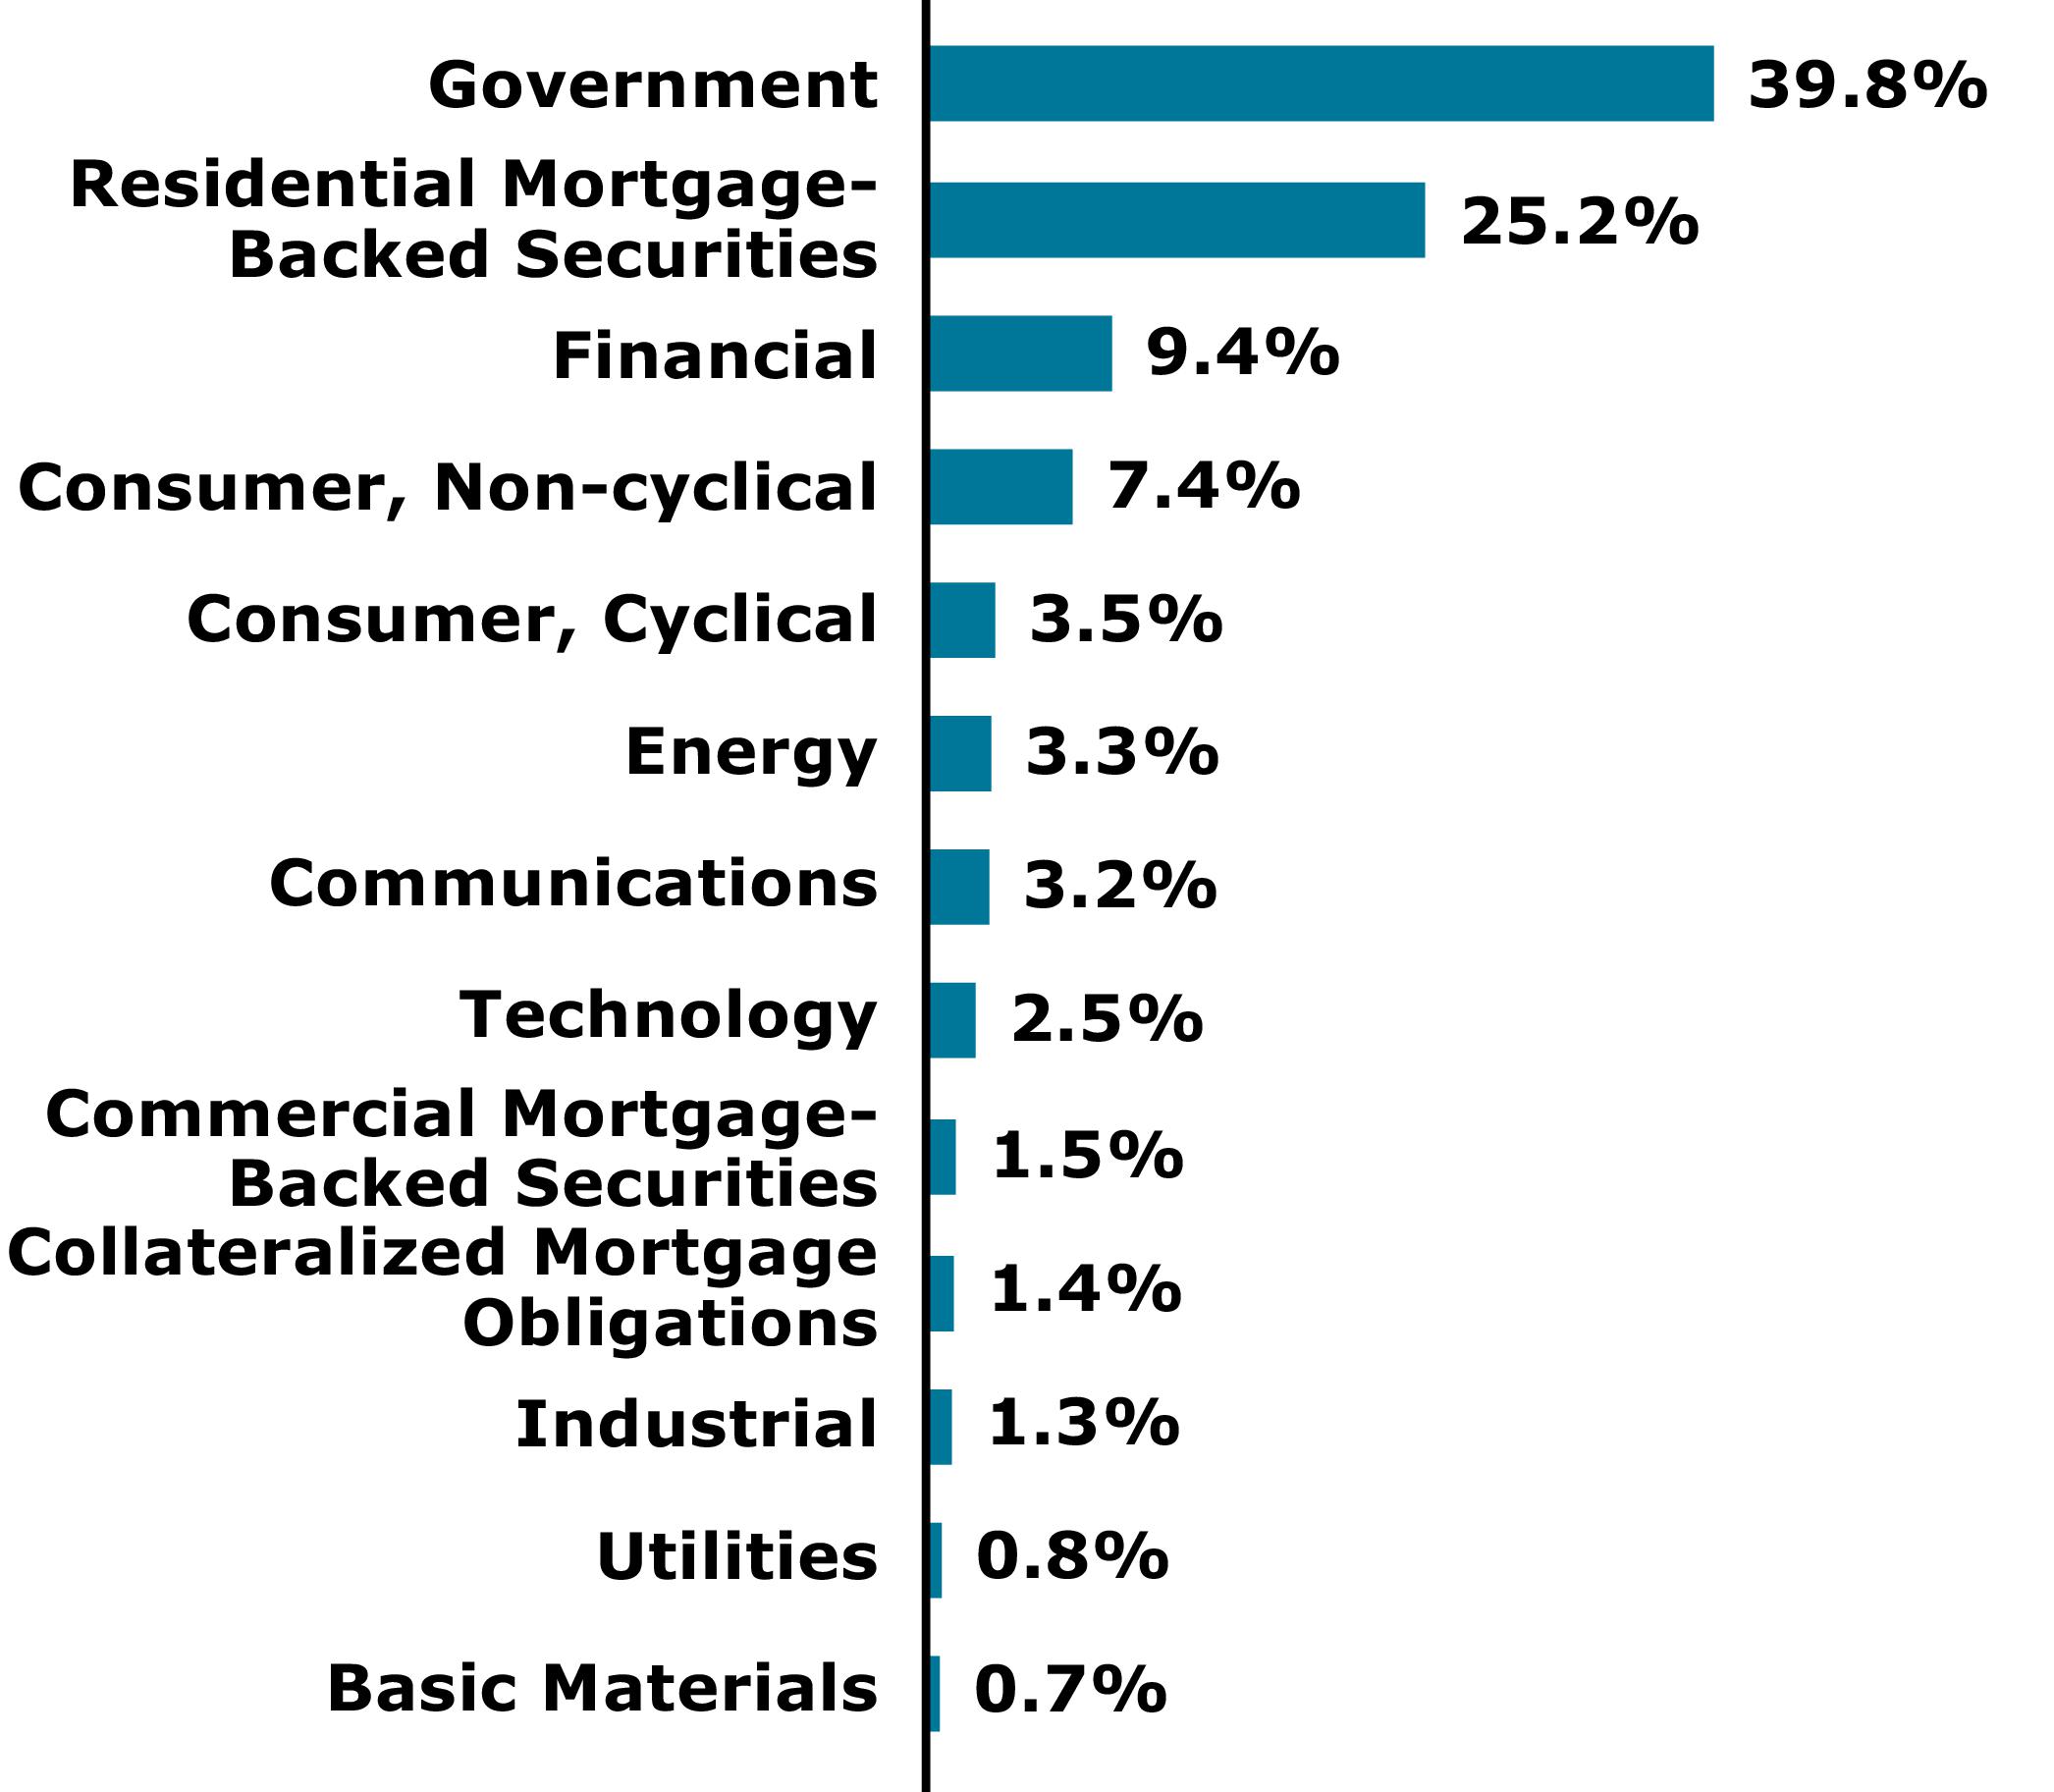
Bonds & Notes Sectors — Percentage of All Bonds & Notes* |

* | Excludes short-term investments, if any. |
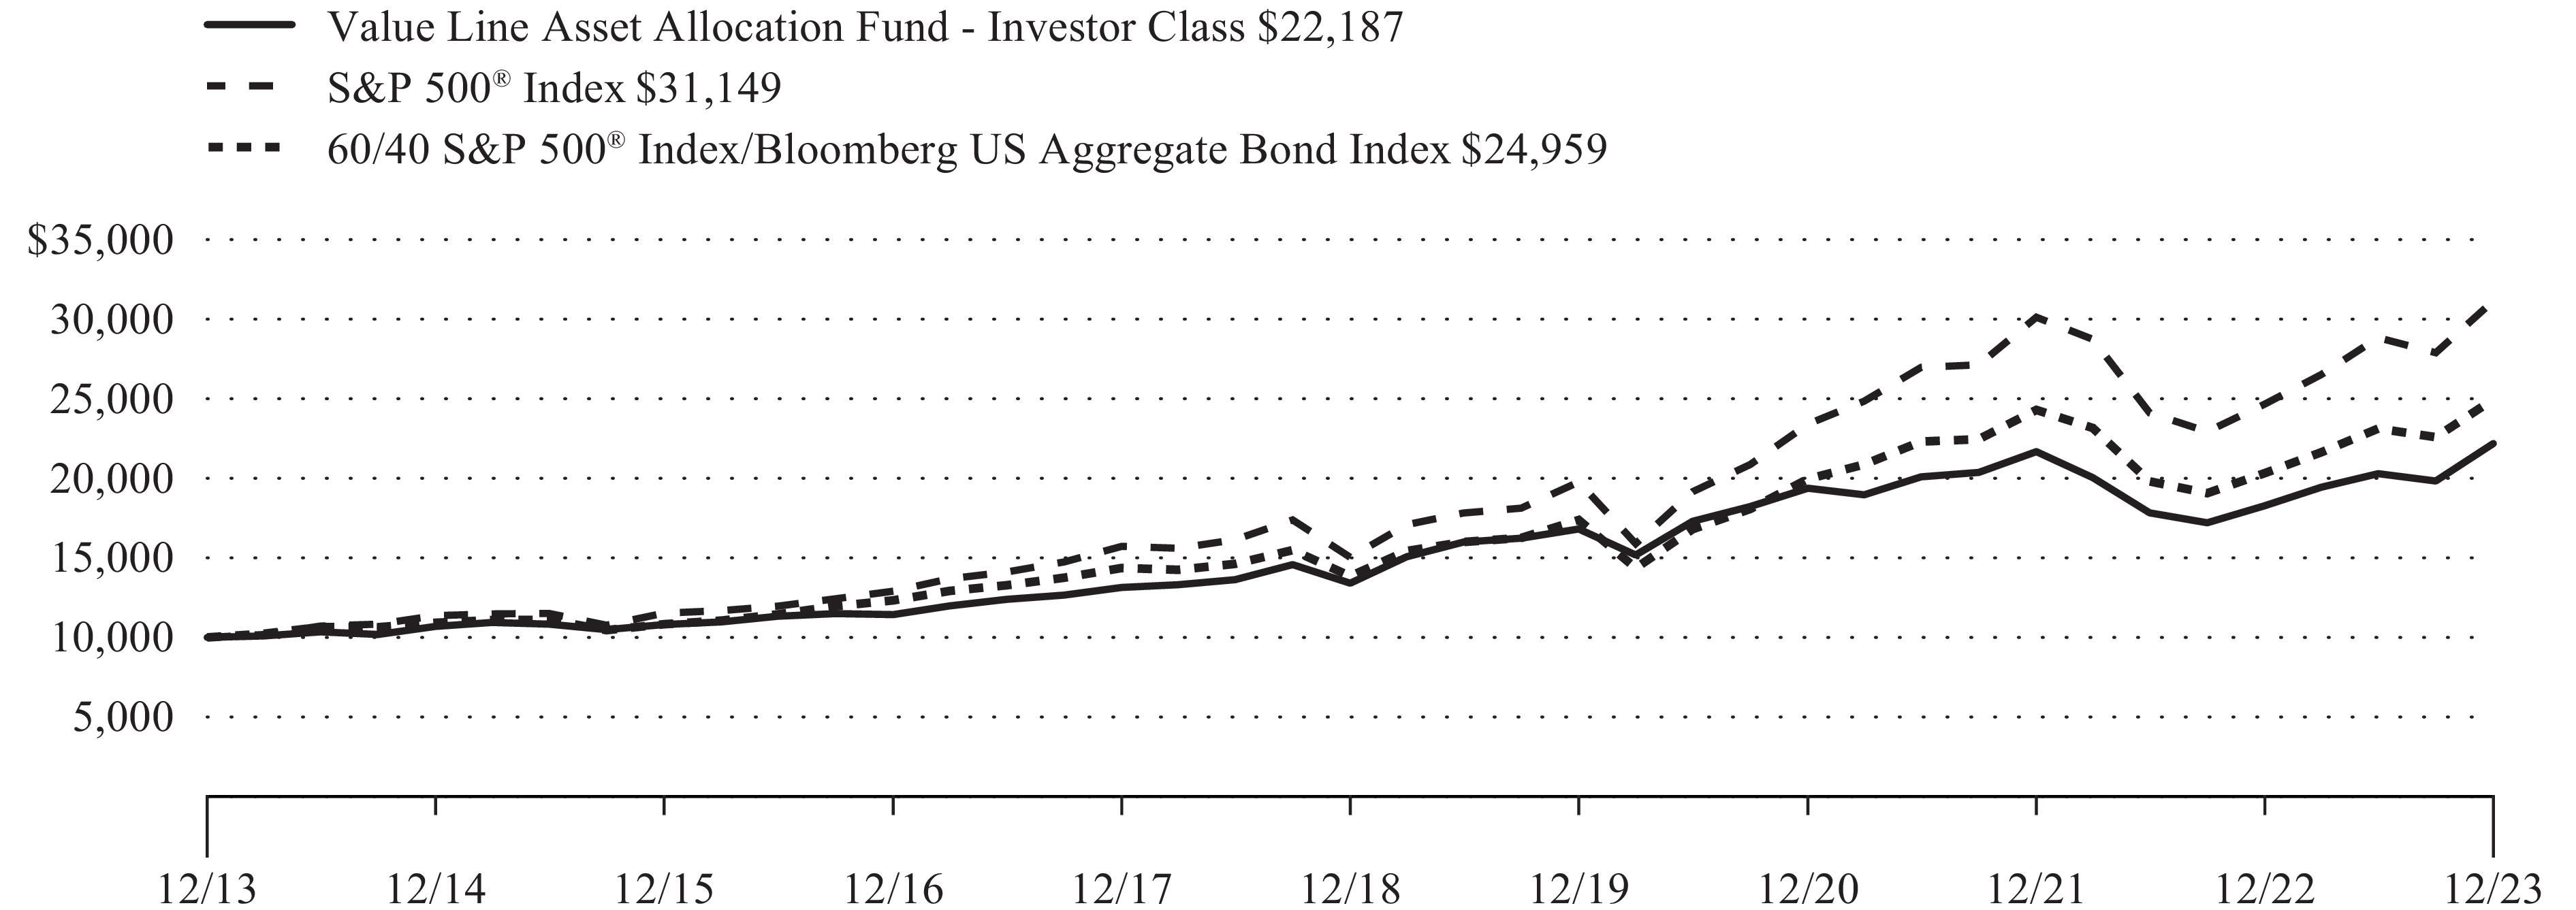
Comparison of a Change in Value of a $10,000 Investment in the Value Line Asset Allocation Fund, Inc., the S&P 500® Index and the 60/40 S&P 500® Index/Bloomberg Barclays US Aggregate Bond Index**
1 yr | 5 Yrs | 10 Yrs | ||
Investor Class | ||||
Value Line Asset Allocation Fund, Inc. | 21.39 % | 10.60 % | 8.30 % | |
S&P 500® Index*** | 26.29 % | 15.69 % | 12.03 % | |
60/40 S&P 500® Index/Bloomberg US Aggregate Bond**** | 17.98 % | 9.85 % | 7.94 % | |
1 yr | 5 Yrs | Since Inception 11/2/2015 | ||
Institutional Class | ||||
Value Line Asset Allocation Fund, Inc. | 21.68 % | 10.87 % | 9.27 % | |
S&P 500® Index*** | 26.29 % | 15.69 % | 12.77 % | |
60/40 S&P 500® Index/Bloomberg US Aggregate Bond**** | 17.98 % | 9.85 % | 8.20 % |
Shares | Value | |
COMMON STOCKS 63.1% | ||
CONSUMER DISCRETIONARY 1.5% | ||
DISTRIBUTION/WHOLESALE 1.5% | ||
34,800 | Pool Corp. | $13,875,108 |
CONSUMER STAPLES 2.1% | ||
RETAIL 2.1% | ||
30,000 | Costco Wholesale Corp. | 19,802,400 |
FINANCIALS 11.9% | ||
COMMERCIAL SERVICES 2.3% | ||
50,119 | S&P Global, Inc. | 22,078,422 |
DIVERSIFIED FINANCIALS 2.5% | ||
180,944 | Intercontinental Exchange, Inc. | 23,238,638 |
INSURANCE 7.1% | ||
70,100 | American Financial Group, Inc. | 8,334,189 |
51,700 | Aon PLC Class A | 15,045,734 |
57,300 | Marsh & McLennan Cos., Inc. | 10,856,631 |
75,100 | RLI Corp. | 9,997,312 |
332,256 | W R Berkley Corp. | 23,497,144 |
67,731,010 | ||
113,048,070 | ||
HEALTHCARE 6.5% | ||
HEALTHCARE PRODUCTS 3.9% | ||
26,812 | IDEXX Laboratories, Inc.(1) | 14,882,001 |
72,371 | Stryker Corp. | 21,672,220 |
36,554,221 | ||
HEALTHCARE SERVICES 1.4% | ||
22,699 | Chemed Corp. | 13,273,240 |
PHARMACEUTICALS 1.2% | ||
60,000 | Zoetis, Inc. | 11,842,200 |
61,669,661 | ||
INDUSTRIALS 15.2% | ||
AEROSPACE/DEFENSE 4.1% | ||
38,400 | TransDigm Group, Inc. | 38,845,440 |
BUILDING MATERIALS 0.4% | ||
9,500 | Lennox International, Inc. | 4,251,440 |
COMMERCIAL SERVICES 4.6% | ||
71,900 | Cintas Corp. | 43,331,254 |
ENGINEERING & CONSTRUCTION 0.4% | ||
39,300 | Exponent, Inc. | 3,459,972 |
ENVIRONMENTAL CONTROL 3.3% | ||
192,627 | Republic Services, Inc. | 31,766,119 |
TRANSPORTATION 2.4% | ||
91,300 | Union Pacific Corp. | 22,425,106 |
144,079,331 | ||
INFORMATION TECHNOLOGY 25.9% | ||
COMMERCIAL SERVICES 1.7% | ||
36,000 | Gartner, Inc.(1) | 16,239,960 |
COMPUTERS 3.9% | ||
43,751 | Accenture PLC Class A | 15,352,663 |
146,900 | CGI, Inc.(1) | 15,749,149 |
21,800 | EPAM Systems, Inc.(1) | 6,482,012 |
37,583,824 | ||
Shares | Value | |
COMMON STOCKS 63.1% (continued) | ||
INFORMATION TECHNOLOGY 25.9% (continued) | ||
SOFTWARE 18.9% | ||
42,800 | Adobe, Inc.(1) | $25,534,480 |
72,700 | Cadence Design Systems, Inc.(1) | 19,801,299 |
24,900 | Fair Isaac Corp.(1) | 28,983,849 |
24,810 | Intuit, Inc. | 15,506,994 |
59,100 | Roper Technologies, Inc. | 32,219,547 |
30,525 | ServiceNow, Inc.(1) | 21,565,607 |
25,800 | Synopsys, Inc.(1) | 13,284,678 |
52,737 | Tyler Technologies, Inc.(1) | 22,050,395 |
178,946,849 | ||
TELECOMMUNICATIONS 1.4% | ||
42,100 | Motorola Solutions, Inc. | 13,181,089 |
245,951,722 | ||
TOTAL COMMON STOCKS (Cost $317,386,655) | 598,426,292 | |
Principal Amount | Value | |
COLLATERALIZED MORTGAGE OBLIGATIONS 0.7% | ||
$ 2,038,457 | FHLMC, Series 2023-DNA1, Class M1A, REMIC, (SOFR30A + 2.10%), 7.44%, 3/25/43(2)(3) | 2,070,761 |
2,025,354 | FNMA, Series 2023-R02, Class 1M1, (SOFR30A + 2.30%), 7.64%, 1/25/43(2)(3) | 2,073,435 |
2,098,885 | FNMA, Series 2023-R04, Class 1M1, (SOFR30A + 2.30%), 7.64%, 5/25/43(2)(3) | 2,143,041 |
TOTAL COLLATERALIZED MORTGAGE OBLIGATIONS (Cost $6,182,409) | 6,287,237 | |
COMMERCIAL MORTGAGE-BACKED SECURITIES 0.6% | ||
1,240,000 | FHLMC Multifamily Structured Pass-Through Certificates, Series K055, Class A2, 2.67%, 3/25/26 | 1,190,622 |
1,580,000 | FHLMC Multifamily Structured Pass-Through Certificates, Series K064, Class A2, 3.22%, 3/25/27 | 1,525,335 |
750,000 | FHLMC Multifamily Structured Pass-Through Certificates, Series K084, Class A2, 3.78%, 10/25/28(3) | 729,986 |
1,609,233 | FHLMC Multifamily Structured Pass-Through Certificates, Series K089, Class A1, 3.34%, 10/25/28 | 1,560,256 |
231,257 | FREMF Mortgage Trust, Series 2015-K43, Class B, 3.73%, 2/25/48(2)(3) | 225,714 |
107,466 | GNMA, Series 2013-12, Class B, 2.07%, 11/16/52(3) | 99,624 |
1,000,000 | Morgan Stanley Capital I Trust, Series 2021-L7, Class A4, 2.32%, 10/15/54 | 828,762 |
TOTAL COMMERCIAL MORTGAGE-BACKED SECURITIES (Cost $6,917,947) | 6,160,299 | |
CORPORATE BONDS & NOTES 11.4% | ||
BASIC MATERIALS 0.2% | ||
IRON/STEEL 0.1% | ||
1,250,000 | Steel Dynamics, Inc., Senior Unsecured Notes, 3.25%, 1/15/31 | 1,126,244 |
Principal Amount | Value | |
CORPORATE BONDS & NOTES 11.4% (continued) | ||
BASIC MATERIALS 0.2% (continued) | ||
MINING 0.1% | ||
$ 1,265,000 | Freeport-McMoRan, Inc., Guaranteed Notes, 4.63%, 8/1/30 | $1,236,179 |
2,362,423 | ||
COMMUNICATIONS 1.1% | ||
INTERNET 0.3% | ||
1,350,000 | Expedia Group, Inc., Guaranteed Notes, 3.25%, 2/15/30(4) | 1,237,554 |
1,300,000 | Netflix, Inc., Senior Unsecured Notes, 4.88%, 4/15/28 | 1,317,384 |
2,554,938 | ||
MEDIA 0.2% | ||
1,200,000 | Charter Communications Operating LLC/Charter Communications Operating Capital, Senior Secured Notes, 4.91%, 7/23/25 | 1,188,592 |
1,200,000 | Comcast Corp., Guaranteed Notes, 4.15%, 10/15/28 | 1,183,285 |
2,371,877 | ||
TELECOMMUNICATIONS 0.6% | ||
1,240,000 | AT&T, Inc., Senior Unsecured Notes, 2.55%, 12/1/33 | 1,010,626 |
1,200,000 | Bell Canada Co. (The), 5.10%, 5/11/33(4) | 1,231,354 |
1,200,000 | Cisco Systems, Inc., 5.50%, 1/15/40 | 1,277,387 |
1,275,000 | T-Mobile USA, Inc., Guaranteed Notes, 3.50%, 4/15/31 | 1,165,592 |
1,250,000 | Vodafone Group PLC, Senior Unsecured Notes, 4.25%, 9/17/50 | 1,036,837 |
5,721,796 | ||
10,648,611 | ||
CONSUMER, CYCLICAL 1.4% | ||
AUTO MANUFACTURERS 0.4% | ||
1,275,000 | Cummins, Inc., Senior Unsecured Notes, 1.50%, 9/1/30 | 1,063,266 |
1,325,000 | Ford Motor Credit Co. LLC, Senior Unsecured Notes, 3.38%, 11/13/25 | 1,267,908 |
1,250,000 | General Motors Financial Co., Inc., 5.80%, 1/7/29 | 1,279,202 |
3,610,376 | ||
HOME BUILDERS 0.1% | ||
1,293,000 | PulteGroup, Inc., Guaranteed Notes, 5.00%, 1/15/27(4) | 1,299,217 |
LODGING 0.3% | ||
1,250,000 | Hyatt Hotels Corp., Senior Unsecured Notes, 1.80%, 10/1/24 | 1,212,801 |
1,250,000 | Marriott International, Inc., 4.90%, 4/15/29 | 1,258,124 |
2,470,925 | ||
RETAIL 0.6% | ||
1,250,000 | AutoZone, Inc., Senior Unsecured Notes, 3.75%, 6/1/27 | 1,213,556 |
1,225,000 | Costco Wholesale Corp., Senior Unsecured Notes, 1.75%, 4/20/32 | 1,023,304 |
Principal Amount | Value | |
CORPORATE BONDS & NOTES 11.4% (continued) | ||
CONSUMER, CYCLICAL 1.4% (continued) | ||
RETAIL 0.6% (continued) | ||
$ 1,300,000 | McDonald's Corp., Senior Unsecured Notes, 4.60%, 9/9/32(4) | $1,312,418 |
1,250,000 | O'Reilly Automotive, Inc., Senior Unsecured Notes, 3.60%, 9/1/27 | 1,204,705 |
1,200,000 | TJX Cos., Inc. (The), 2.25%, 9/15/26(4) | 1,133,384 |
5,887,367 | ||
13,267,885 | ||
CONSUMER, NON-CYCLICAL 2.5% | ||
BEVERAGES 0.5% | ||
1,275,000 | Anheuser-Busch InBev Worldwide, Inc., Guaranteed Notes, 4.90%, 1/23/31(4) | 1,326,379 |
1,225,000 | Constellation Brands, Inc., 2.25%, 8/1/31 | 1,029,327 |
1,225,000 | Constellation Brands, Inc., Guaranteed Notes, 5.25%, 11/15/48 | 1,212,593 |
1,265,000 | Diageo Capital PLC, Guaranteed Notes, 2.00%, 4/29/30 | 1,092,515 |
4,660,814 | ||
BIOTECHNOLOGY 0.4% | ||
1,210,000 | Amgen, Inc., Senior Unsecured Notes, 2.20%, 2/21/27 | 1,125,094 |
1,300,000 | Gilead Sciences, Inc., 4.60%, 9/1/35 | 1,285,855 |
1,225,000 | Regeneron Pharmaceuticals, Inc., Senior Unsecured Notes, 1.75%, 9/15/30 | 1,007,205 |
3,418,154 | ||
COMMERCIAL SERVICES 0.1% | ||
1,200,000 | PayPal Holdings, Inc., Senior Unsecured Notes, 2.65%, 10/1/26 | 1,139,706 |
HEALTHCARE PRODUCTS 0.1% | ||
1,300,000 | Stryker Corp., 3.38%, 11/1/25 | 1,265,345 |
HEALTHCARE SERVICES 0.4% | ||
1,225,000 | Centene Corp., Senior Unsecured Notes, 4.63%, 12/15/29 | 1,174,441 |
1,250,000 | Elevance Health, Inc., 4.75%, 2/15/33 | 1,250,430 |
1,250,000 | HCA, Inc., Guaranteed Notes, 5.38%, 2/1/25 | 1,248,163 |
3,673,034 | ||
PHARMACEUTICALS 1.0% | ||
1,310,000 | AbbVie, Inc., Senior Unsecured Notes, 2.95%, 11/21/26 | 1,256,156 |
1,200,000 | Astrazeneca Finance LLC, 4.88%, 3/3/28 | 1,223,423 |
1,250,000 | Becton Dickinson and Co., Senior Unsecured Notes, 3.70%, 6/6/27 | 1,211,308 |
1,375,000 | CVS Health Corp., Senior Unsecured Notes, 1.75%, 8/21/30 | 1,135,831 |
1,200,000 | Eli Lilly & Co., 4.70%, 2/27/33 | 1,230,532 |
1,200,000 | Merck & Co., Inc., Senior Unsecured Notes, 3.90%, 3/7/39 | 1,090,890 |
1,250,000 | Pfizer Investment Enterprises Pte. Ltd., 4.65%, 5/19/30 | 1,258,798 |
1,315,000 | Takeda Pharmaceutical Co. Ltd., Senior Unsecured Notes, 3.03%, 7/9/40 | 1,010,648 |
9,417,586 | ||
23,574,639 | ||
Principal Amount | Value | |
CORPORATE BONDS & NOTES 11.4% (continued) | ||
ENERGY 1.2% | ||
OIL & GAS 0.4% | ||
$ 1,175,000 | Canadian Natural Resources Ltd., Senior Unsecured Notes, 2.05%, 7/15/25 | $1,119,487 |
1,325,000 | Hess Corp., Senior Unsecured Notes, 4.30%, 4/1/27 | 1,310,962 |
1,200,000 | Occidental Petroleum Corp., Senior Unsecured Notes, 5.50%, 12/1/25 | 1,199,755 |
3,630,204 | ||
PIPELINES 0.8% | ||
1,275,000 | Boardwalk Pipelines LP, Guaranteed Notes, 4.95%, 12/15/24 | 1,266,057 |
1,250,000 | Enbridge, Inc., Guaranteed Notes, 2.50%, 8/1/33 | 1,023,641 |
1,300,000 | Energy Transfer LP, 5.25%, 4/15/29 | 1,309,724 |
1,275,000 | Enterprise Products Operating LLC, Guaranteed Notes, 4.85%, 8/15/42 | 1,222,217 |
1,250,000 | Kinder Morgan, Inc., 5.20%, 6/1/33 | 1,242,472 |
1,250,000 | Targa Resources Corp., 6.50%, 3/30/34 | 1,349,087 |
7,413,198 | ||
11,043,402 | ||
FINANCIAL 3.2% | ||
BANKS 1.5% | ||
1,250,000 | Bank of America Corp., (SOFR + 2.16%), 5.02%, 7/22/33(3) | 1,236,539 |
1,250,000 | Bank of New York Mellon Corp., (SOFR + 1.51%), 4.71%, 2/1/34(3) | 1,222,650 |
1,220,000 | Citigroup, Inc., Senior Unsecured Notes, (SOFR + 1.16%), 3.35%, 4/24/25(3) | 1,210,654 |
1,278,000 | Citigroup, Inc., Subordinated Notes, 5.30%, 5/6/44 | 1,226,257 |
1,200,000 | Goldman Sachs Group, Inc., Senior Unsecured Notes, 3.75%, 2/25/26 | 1,172,481 |
1,325,000 | JPMorgan Chase & Co., Subordinated Notes, 4.13%, 12/15/26 | 1,298,759 |
1,225,000 | JPMorgan Chase & Co., Senior Unsecured Notes, (SOFR + 1.64%), 3.96%, 11/15/48(3) | 1,025,568 |
1,250,000 | Morgan Stanley, (SOFR + 2.56%), 6.34%, 10/18/33(3) | 1,347,874 |
1,200,000 | National Australia Bank Ltd., 5.20%, 5/13/25 | 1,207,336 |
1,200,000 | NatWest Group PLC, (1 yr. CMT + 1.35%), 5.85%, 3/2/27(3) | 1,210,044 |
1,250,000 | Royal Bank of Canada, 5.00%, 2/1/33 | 1,271,124 |
1,300,000 | Wells Fargo & Co., (SOFR + 2.13%), 4.61%, 4/25/53(3) | 1,168,732 |
14,598,018 | ||
DIVERSIFIED FINANCIALS 0.6% | ||
1,275,000 | AerCap Ireland Capital DAC/AerCap Global Aviation Trust, Guaranteed Notes, 1.75%, 1/30/26 | 1,183,997 |
1,200,000 | Ally Financial, Inc., Senior Unsecured Notes, 4.75%, 6/9/27 | 1,157,950 |
1,275,000 | American Express Co., 4.90%, 2/13/26 | 1,278,070 |
Principal Amount | Value | |
CORPORATE BONDS & NOTES 11.4% (continued) | ||
FINANCIAL 3.2% (continued) | ||
DIVERSIFIED FINANCIALS 0.6% (continued) | ||
$ 1,285,000 | Discover Financial Services, Senior Unsecured Notes, 3.95%, 11/6/24 | $1,263,150 |
1,200,000 | Synchrony Financial, 4.88%, 6/13/25 | 1,179,503 |
6,062,670 | ||
INSURANCE 0.3% | ||
1,325,000 | Aflac, Inc., Senior Unsecured Notes, 3.60%, 4/1/30 | 1,251,054 |
1,200,000 | CNA Financial Corp., 3.45%, 8/15/27 | 1,148,166 |
2,399,220 | ||
REITS 0.8% | ||
1,200,000 | American Tower Corp., 5.50%, 3/15/28 | 1,226,517 |
1,300,000 | Crown Castle, Inc., Senior Unsecured Notes, 3.80%, 2/15/28 | 1,234,892 |
1,250,000 | Equinix, Inc., Senior Unsecured Notes, 2.50%, 5/15/31 | 1,061,030 |
1,250,000 | Kimco Realty Corp., Senior Unsecured Notes, 2.25%, 12/1/31 | 1,020,579 |
1,225,000 | Welltower, Inc., Senior Unsecured Notes, 4.25%, 4/15/28 | 1,201,912 |
1,300,000 | Weyerhaeuser Co., 4.75%, 5/15/26 | 1,293,741 |
7,038,671 | ||
30,098,579 | ||
INDUSTRIAL 0.7% | ||
AEROSPACE/DEFENSE 0.1% | ||
1,250,000 | RTX Corp., 4.50%, 6/1/42 | 1,135,140 |
ELECTRONICS 0.3% | ||
1,260,000 | Amphenol Corp., Senior Unsecured Notes, 2.20%, 9/15/31 | 1,060,207 |
1,250,000 | Flex Ltd., Senior Unsecured Notes, 4.75%, 6/15/25 | 1,234,276 |
2,294,483 | ||
MISCELLANEOUS MANUFACTURERS 0.1% | ||
1,200,000 | Teledyne Technologies, Inc., 2.25%, 4/1/28 | 1,086,546 |
TRANSPORTATION 0.2% | ||
1,250,000 | CSX Corp., Senior Unsecured Notes, 3.35%, 9/15/49 | 944,844 |
1,300,000 | Union Pacific Corp., Senior Unsecured Notes, 3.25%, 2/5/50 | 995,834 |
1,940,678 | ||
6,456,847 | ||
TECHNOLOGY 0.9% | ||
COMPUTERS 0.3% | ||
1,250,000 | Apple, Inc., 4.65%, 2/23/46 | 1,233,021 |
1,250,000 | Dell International LLC/EMC Corp., Senior Unsecured Notes, 4.90%, 10/1/26 | 1,251,989 |
2,485,010 | ||
SEMICONDUCTORS 0.3% | ||
1,265,000 | Analog Devices, Inc., Senior Unsecured Notes, 2.80%, 10/1/41 | 941,636 |
1,225,000 | Broadcom, Inc., 4.30%, 11/15/32 | 1,175,221 |
1,250,000 | NVIDIA Corp., 3.50%, 4/1/40 | 1,083,518 |
3,200,375 | ||
Principal Amount | Value | |
CORPORATE BONDS & NOTES 11.4% (continued) | ||
TECHNOLOGY 0.9% (continued) | ||
SOFTWARE 0.3% | ||
$ 1,250,000 | Adobe, Inc., Senior Unsecured Notes, 2.30%, 2/1/30 | $1,119,751 |
1,275,000 | Oracle Corp., 6.25%, 11/9/32 | 1,387,053 |
2,506,804 | ||
8,192,189 | ||
UTILITIES 0.2% | ||
ELECTRIC 0.2% | ||
1,275,000 | Duke Energy Corp., Senior Unsecured Notes, 4.50%, 8/15/32 | 1,234,137 |
1,200,000 | Southern Co., 5.70%, 3/15/34 | 1,261,828 |
2,495,965 | ||
TOTAL CORPORATE BONDS & NOTES (Cost $113,214,479) | 108,140,540 | |
LONG-TERM MUNICIPAL SECURITIES 0.7% | ||
CALIFORNIA 0.4% | ||
1,000,000 | City of Los Angeles, Series A, GO, 3.55%, 9/1/31 | 951,627 |
1,200,000 | Regents of the University of California Medical Center Pooled Revenue, Series Q, 4.13%, 5/15/32 | 1,151,322 |
1,250,000 | State of California, GO, 5.70%, 10/1/32 | 1,339,417 |
3,442,366 | ||
NEW YORK 0.1% | ||
1,250,000 | New York City Transitional Finance Authority Building Aid Revenue, (ST AID WITHHLDG), 4.80%, 7/15/26 | 1,251,150 |
OREGON 0.1% | ||
1,100,000 | State of Oregon, Series C, GO, 2.38%, 5/1/36 | 858,445 |
WASHINGTON 0.1% | ||
1,250,000 | City of Tacoma, GO, 5.89%, 12/1/30 | 1,329,023 |
TOTAL LONG-TERM MUNICIPAL SECURITIES (Cost $7,130,147) | 6,880,984 | |
RESIDENTIAL MORTGAGE-BACKED SECURITIES 8.5% | ||
35,710 | FHLMC, Series 4151, Class PA, 2.00%, 1/15/33 | 33,507 |
4,247 | FHLMC Gold PC Pool #G08488, 3.50%, 4/1/42 | 4,023 |
974,644 | FHLMC Pool #QB2462, 3.00%, 8/1/50 | 868,572 |
1,823,789 | FHLMC Pool #QB2958, 3.00%, 9/1/50 | 1,620,437 |
7,554,002 | FHLMC Pool #QF1236, 4.50%, 10/1/52 | 7,324,794 |
2,825,063 | FHLMC Pool #QG6306, 5.00%, 7/1/53 | 2,796,598 |
794,573 | FHLMC Pool #RA6817, 2.50%, 2/1/52 | 679,712 |
780,727 | FHLMC Pool #RB5022, 3.00%, 11/1/39 | 724,978 |
674,059 | FHLMC Pool #SD7514, 3.50%, 4/1/50 | 631,531 |
1,976,755 | FHLMC Pool #SD8108, 3.00%, 11/1/50 | 1,758,605 |
819,943 | FHLMC Pool #SD8196, 3.50%, 2/1/52 | 756,007 |
6,830,852 | FHLMC Pool #SD8256, 4.00%, 10/1/52 | 6,460,459 |
852,973 | FHLMC Pool #ZS4647, 3.50%, 1/1/46 | 796,015 |
1,353,119 | FNMA Pool #AS0516, 3.00%, 9/1/43 | 1,243,142 |
207,021 | FNMA Pool #AX9528, 3.50%, 2/1/45 | 193,210 |
28,712 | FNMA Pool #AZ6194, 3.50%, 10/1/45 | 26,856 |
Principal Amount | Value | |
RESIDENTIAL MORTGAGE-BACKED SECURITIES 8.5% (continued) | ||
$ 1,190,542 | FNMA Pool #BM3634, 3.50%, 5/1/47 | $1,111,096 |
1,044,841 | FNMA Pool #BP5709, 2.50%, 5/1/50 | 895,556 |
2,480,484 | FNMA Pool #BX7762, 5.00%, 3/1/53 | 2,454,296 |
790,031 | FNMA Pool #CA5540, 3.00%, 4/1/50 | 707,722 |
4,991,090 | FNMA Pool #CB2403, 2.50%, 12/1/51 | 4,245,420 |
7,694,814 | FNMA Pool #CB5892, 4.50%, 3/1/53 | 7,461,333 |
2,500,502 | FNMA Pool #FM2202, 4.00%, 12/1/48 | 2,407,009 |
1,038,320 | FNMA Pool #FM3254, 3.50%, 5/1/49 | 970,316 |
1,012,186 | FNMA Pool #FM4140, 2.50%, 9/1/50 | 873,271 |
1,066,797 | FNMA Pool #FM9509, 3.00%, 11/1/36 | 1,007,500 |
1,390,723 | FNMA Pool #FM9760, 3.50%, 11/1/51 | 1,282,450 |
1,849,559 | FNMA Pool #FM9834, 3.50%, 6/1/49 | 1,723,210 |
1,615,301 | FNMA Pool #FM9939, 4.00%, 1/1/52 | 1,527,433 |
908,751 | FNMA Pool #MA4055, 2.50%, 6/1/50 | 780,603 |
2,888,417 | FNMA Pool #MA4078, 2.50%, 7/1/50 | 2,477,489 |
1,231,885 | FNMA Pool #MA4222, 3.50%, 12/1/50 | 1,145,569 |
1,470,487 | FNMA Pool #MA4494, 3.00%, 12/1/51 | 1,308,234 |
2,289,719 | FNMA Pool #MA4495, 3.50%, 12/1/51 | 2,110,283 |
5,726,027 | FNMA Pool #MA5106, 5.00%, 8/1/53 | 5,664,808 |
16,917 | FNMA REMIC Trust Series 2013-18, Series 2013-18, Class AE, 2.00%, 3/25/28 | 16,200 |
34,590 | FNMA REMIC Trust Series 2013-41, Series 2013-41, Class WD, 2.00%, 11/25/42 | 31,125 |
7,690,097 | GNMA, Series 2021-98, Class IG, IO, 3.00%, 6/20/51 | 1,220,975 |
1,105,791 | GNMA II Pool #MA3937, 3.50%, 9/20/46 | 1,040,462 |
746,499 | GNMA II Pool #MA7054, 3.50%, 12/20/50 | 700,946 |
3,475,315 | GNMA II Pool #MA7651, 3.50%, 10/20/51 | 3,240,989 |
2,997,375 | GNMA II Pool #MA8945, 4.00%, 6/20/53 | 2,859,983 |
6,332,192 | Government National Mortgage Association, MBS, 2.50%, 11/20/51 | 5,536,842 |
TOTAL RESIDENTIAL MORTGAGE-BACKED SECURITIES (Cost $86,114,517) | 80,719,566 | |
U.S. TREASURY OBLIGATIONS 11.3% | ||
3,170,000 | U.S. Treasury Bonds, 5.38%, 2/15/31 | 3,473,750 |
5,500,000 | U.S. Treasury Bonds, 3.50%, 2/15/39 | 5,208,887 |
10,000,000 | U.S. Treasury Bonds, 2.75%, 11/15/42 | 8,086,328 |
7,500,000 | U.S. Treasury Bonds, 3.88%, 5/15/43 | 7,149,609 |
1,075,000 | U.S. Treasury Bonds, 3.00%, 2/15/48 | 875,999 |
11,000,000 | U.S. Treasury Bonds, 2.25%, 8/15/49 | 7,680,234 |
5,000,000 | U.S. Treasury Bonds, 2.25%, 2/15/52 | 3,466,016 |
4,250,000 | U.S. Treasury Bonds, 2.88%, 5/15/52 | 3,383,731 |
4,000,000 | U.S. Treasury Bonds, 3.63%, 5/15/53 | 3,698,125 |
1,000,000 | U.S. Treasury Notes, 2.25%, 3/31/24 | 992,539 |
8,000,000 | U.S. Treasury Notes, 2.38%, 8/15/24 | 7,869,375 |
9,500,000 | U.S. Treasury Notes, 3.00%, 9/30/25 | 9,281,055 |
3,000,000 | U.S. Treasury Notes, 1.63%, 5/15/26 | 2,830,547 |
5,000,000 | U.S. Treasury Notes, 4.50%, 7/15/26 | 5,046,484 |
17,904,300 | U.S. Treasury Notes, 2.25%, 8/15/27 | 16,885,993 |
2,000,000 | U.S. Treasury Notes, 0.63%, 11/30/27 | 1,762,734 |
2,000,000 | U.S. Treasury Notes, 1.63%, 8/15/29 | 1,779,453 |
10,000,000 | U.S. Treasury Notes, 1.50%, 2/15/30 | 8,712,109 |
3,500,000 | U.S. Treasury Notes, 1.13%, 2/15/31 | 2,921,543 |
Principal Amount | Value | |
U.S. TREASURY OBLIGATIONS 11.3% (continued) | ||
$ 2,000,000 | U.S. Treasury Notes, 2.75%, 8/15/32 | $1,831,563 |
4,000,000 | U.S. Treasury Notes, 3.38%, 5/15/33 | 3,838,750 |
TOTAL U.S. TREASURY OBLIGATIONS (Cost $107,916,693) | 106,774,824 | |
Shares | Value | |
SHORT-TERM INVESTMENTS 3.6% | ||
MONEY MARKET FUNDS 3.6% | ||
30,094,084 | State Street Institutional U.S. Government Money Market Fund, Premier Class, 5.32%(5) | 30,094,084 |
3,823,003 | State Street Navigator Securities Lending Government Money Market Portfolio(6) | 3,823,003 |
33,917,087 | ||
TOTAL SHORT-TERM INVESTMENTS (Cost $33,917,087) | 33,917,087 | |
TOTAL INVESTMENTS IN SECURITIES 99.9% (Cost $678,779,934) | $947,306,829 | |
CASH AND OTHER ASSETS IN EXCESS OF LIABILITIES 0.1% | 956,034 | |
NET ASSETS 100.0% | $948,262,863 | |
(1) | Non-income producing. |
(2) | Pursuant to Rule 144A under the Securities Act of 1933, this security can only be sold to qualified institutional investors. |
(3) | Floating or variable rate security. The rate disclosed is the rate in effect as of December 31, 2023. The information in parentheses represents the benchmark and reference rate for each relevant security and the rate adjusts based upon the reference rate and spread. The security may be further subject to interest rate floor and caps. For securities which do not indicate a reference rate and spread in their descriptions, the interest rate adjusts periodically based on current interest rates and, for mortgage-backed securities, prepayments in the underlying pool of assets. |
(4) | A portion or all of the security was held on loan. As of December 31, 2023, the market value of the securities on loan was $6,749,681. |
(5) | Rate reflects 7 day yield as of December 31, 2023. |
(6) | Securities with an aggregate market value of $6,749,681 were out on loan in exchange for collateral including $3,823,003 of cash collateral as of December 31, 2023. The collateral was invested in a cash collateral reinvestment vehicle. |
CMT | Constant Maturity Treasury |
FHLMC | Federal Home Loan Mortgage Corp. |
FNMA | Federal National Mortgage Association. |
FREMF | Freddie Mac Multifamily. |
GNMA | Government National Mortgage Association. |
REITS | Real Estate Investment Trusts. |
REMIC | Real Estate Mortgage Investment Conduit. |
SOFR | Secured Overnight Financing Rate. |
ST AID WITHHLDG | State Aid Withholding. |
Investments in Securities: | Level 1 | Level 2 | Level 3 | Total |
Assets | ||||
Common Stocks* | $598,426,292 | $— | $— | $598,426,292 |
Collateralized Mortgage Obligations | — | 6,287,237 | — | 6,287,237 |
Commercial Mortgage-Backed Securities | — | 6,160,299 | — | 6,160,299 |
Corporate Bonds & Notes* | — | 108,140,540 | — | 108,140,540 |
Long-Term Municipal Securities* | — | 6,880,984 | — | 6,880,984 |
Residential Mortgage-Backed Securities | — | 80,719,566 | — | 80,719,566 |
U.S. Treasury Obligations | — | 106,774,824 | — | 106,774,824 |
Short-Term Investments | 33,917,087 | — | — | 33,917,087 |
Total Investments in Securities | $632,343,379 | $314,963,450 | $— | $947,306,829 |
* | See Schedule of Investments for further breakdown by category. |
Ten Largest Holdings* | |||
Issue | Principal Amount/Shares | Value | Percentage of Net Assets |
Meta Platforms, Inc. | 36,000 | $12,742,560 | 2.9 % |
Alphabet, Inc. | 86,000 | 12,013,340 | 2.7 % |
Uber Technologies, Inc. | 195,000 | 12,006,150 | 2.7 % |
NVIDIA Corp. | 23,500 | 11,637,670 | 2.6 % |
Microsoft Corp. | 27,000 | 10,153,080 | 2.3 % |
Amazon.com, Inc. | 66,000 | 10,028,040 | 2.3 % |
U.S. Treasury Notes, 2.25%, 8/15/27 | $8,820,400 | 8,318,740 | 1.9 % |
Visa, Inc. | 28,000 | 7,289,800 | 1.6 % |
Apple, Inc. | 37,000 | 7,123,610 | 1.6 % |
Booking Holdings, Inc. | 2,000 | 7,094,440 | 1.6 % |
Asset Allocation — Percentage of Net Assets |

Common Stock Sectors — Percentage of Common Stocks* |
Bonds & Notes Sectors — Percentage of All Bonds & Notes* |
* | Excludes short-term investments, if any. |
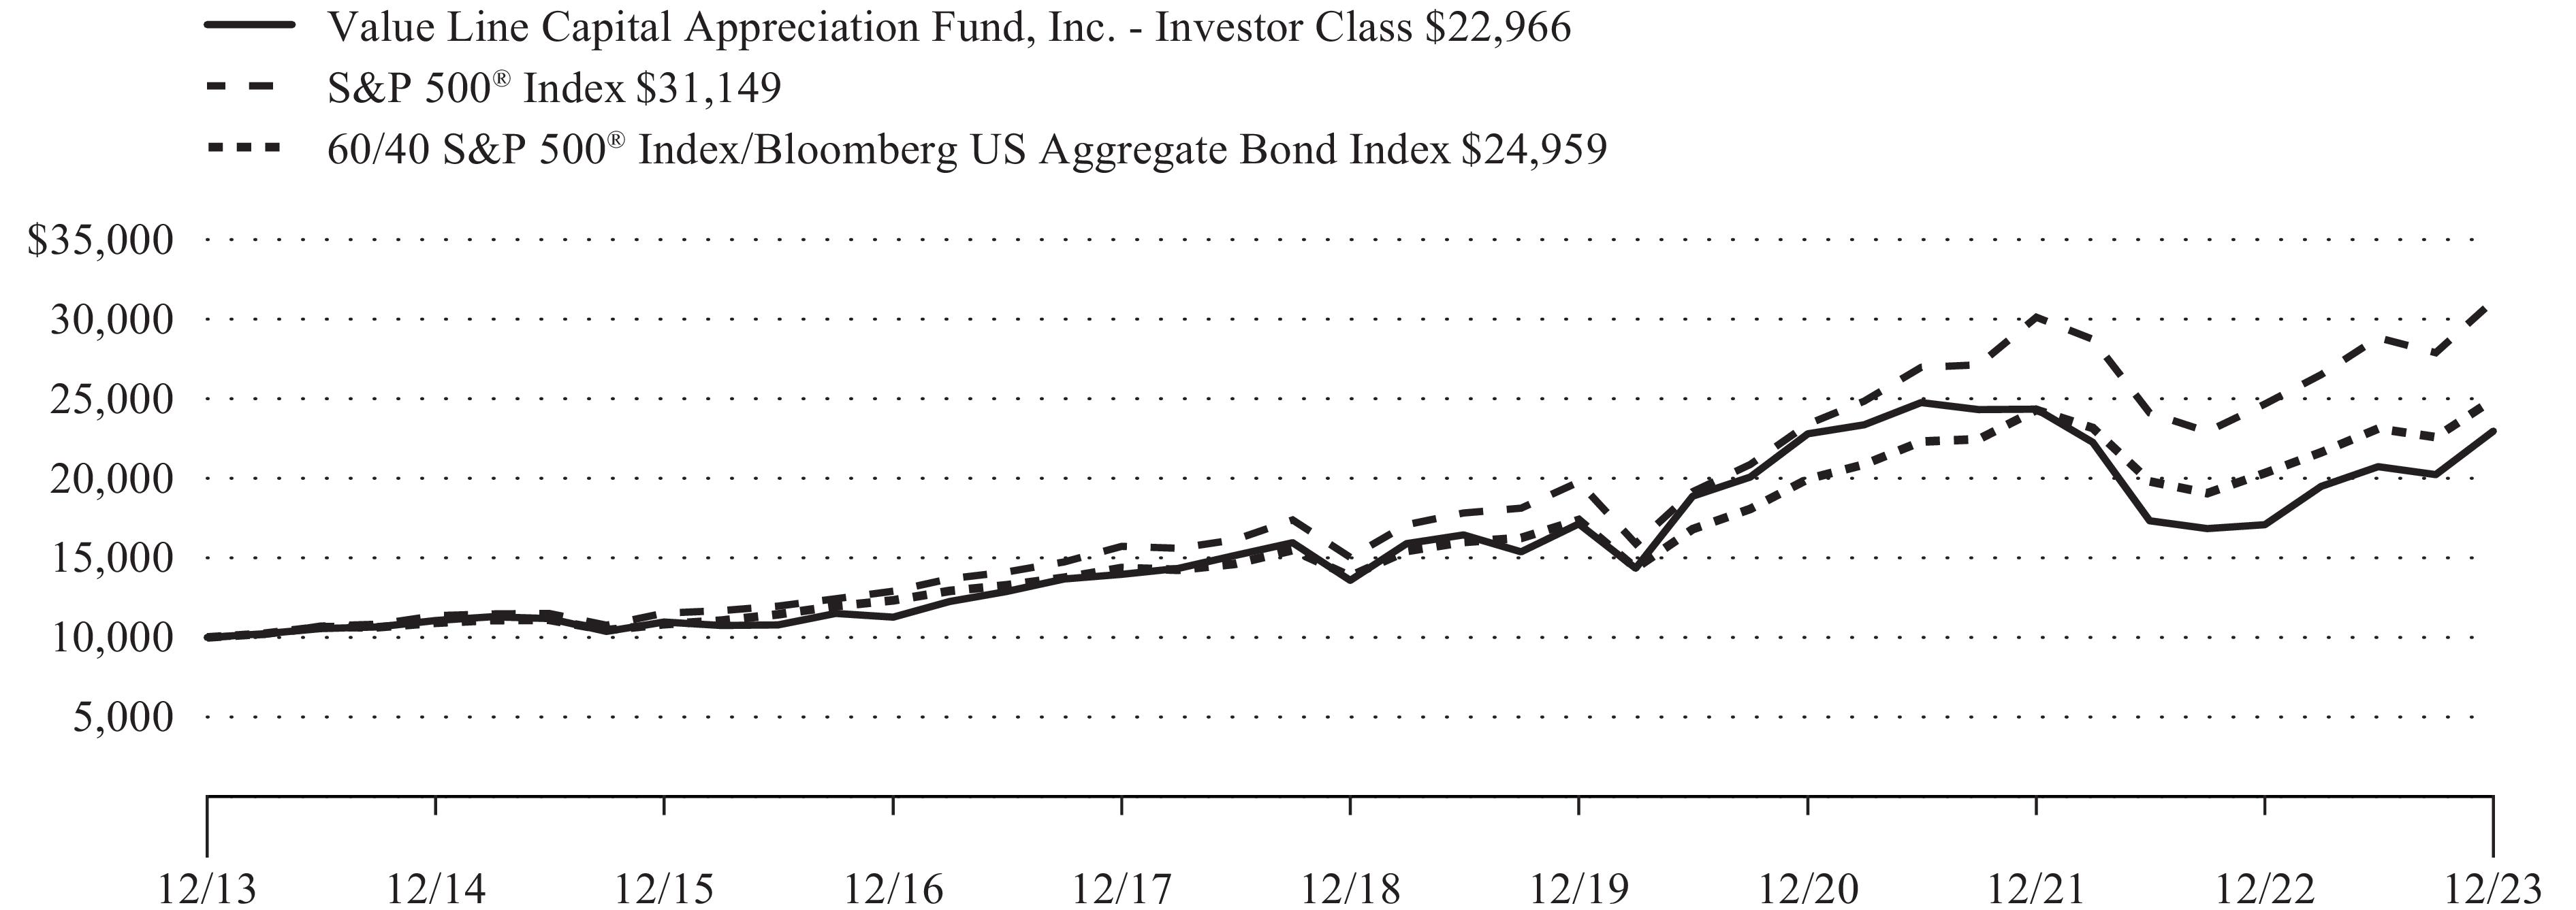
Comparison of a Change in Value of a $10,000 Investment in the Value Line Capital Appreciation Fund, Inc., the S&P 500® Index and the 60/40 S&P 500® Index/Bloomberg US Aggregate Bond Index**
1 Yr | 5 Yrs | 10 Yrs | ||
Investor Class | ||||
Value Line Capital Appreciation Fund, Inc. | 34.44 % | 11.07 % | 8.67 % | |
S&P 500® Index*** | 26.29 % | 15.69 % | 12.03 % | |
60/40 S&P 500® Index/Bloomberg US Aggregate Bond Index**** | 17.98 % | 9.85 % | 7.94 % | |
1 Yr | 5 Yrs | Since Inception 11/2/2015 | ||
Institutional Class | ||||
Value Line Capital Appreciation Fund, Inc. | 34.91 % | 11.38 % | 9.31 % | |
S&P 500® Index*** | 26.29 % | 15.69 % | 12.77 % | |
60/40 S&P 500® Index/Bloomberg US Aggregate Bond Index**** | 17.98 % | 9.85 % | 8.20 % |
Shares | Value | |
COMMON STOCKS 64.7% | ||
COMMUNICATION SERVICES 10.3% | ||
INTERNET 9.8% | ||
86,000 | Alphabet, Inc. Class A(1) | $12,013,340 |
570,000 | Getty Images Holdings, Inc.(1)(2) | 2,992,500 |
114,000 | Match Group, Inc.(1) | 4,161,000 |
36,000 | Meta Platforms, Inc. Class A(1) | 12,742,560 |
11,700 | Netflix, Inc.(1) | 5,696,496 |
26,000 | Roku, Inc.(1) | 2,383,160 |
200,000 | Snap, Inc. Class A(1) | 3,386,000 |
43,375,056 | ||
MEDIA 0.5% | ||
25,000 | Walt Disney Co. | 2,257,250 |
45,632,306 | ||
CONSUMER DISCRETIONARY 10.8% | ||
APPAREL 0.6% | ||
23,000 | NIKE, Inc. Class B | 2,497,110 |
AUTO MANUFACTURERS 1.9% | ||
160,000 | Rivian Automotive, Inc. Class A(1)(2) | 3,753,600 |
19,500 | Tesla, Inc.(1) | 4,845,360 |
8,598,960 | ||
ENTERTAINMENT 1.0% | ||
87,000 | DraftKings, Inc. Class A(1) | 3,066,750 |
7,500 | Vail Resorts, Inc. | 1,601,025 |
4,667,775 | ||
INTERNET 4.4% | ||
31,000 | Alibaba Group Holding Ltd. ADR | 2,402,810 |
66,000 | Amazon.com, Inc.(1) | 10,028,040 |
2,000 | Booking Holdings, Inc.(1) | 7,094,440 |
19,525,290 | ||
LODGING 0.7% | ||
18,000 | Hilton Worldwide Holdings, Inc. | 3,277,620 |
RETAIL 2.2% | ||
6,500 | Lululemon Athletica, Inc.(1) | 3,323,385 |
32,000 | Starbucks Corp. | 3,072,320 |
6,500 | Ulta Beauty, Inc.(1) | 3,184,935 |
9,580,640 | ||
48,147,395 | ||
CONSUMER STAPLES 1.4% | ||
BEVERAGES 1.0% | ||
18,000 | Constellation Brands, Inc. Class A | 4,351,500 |
COSMETICS/PERSONAL CARE 0.4% | ||
12,000 | Estee Lauder Cos., Inc. Class A | 1,755,000 |
6,106,500 | ||
ENERGY 2.5% | ||
OIL & GAS 2.5% | ||
38,000 | Diamondback Energy, Inc. | 5,893,040 |
24,000 | Pioneer Natural Resources Co. | 5,397,120 |
11,290,160 | ||
FINANCIALS 8.0% | ||
BANKS 3.0% | ||
150,000 | Bank of America Corp. | 5,050,500 |
Shares | Value | |
COMMON STOCKS 64.7% (continued) | ||
FINANCIALS 8.0% (continued) | ||
BANKS 3.0% (continued) | ||
8,200 | Goldman Sachs Group, Inc. | $3,163,314 |
29,000 | JPMorgan Chase & Co. | 4,932,900 |
13,146,714 | ||
COMMERCIAL SERVICES 0.7% | ||
50,000 | PayPal Holdings, Inc.(1) | 3,070,500 |
DIVERSIFIED FINANCIALS 3.5% | ||
21,000 | Blackstone, Inc. | 2,749,320 |
30,000 | Interactive Brokers Group, Inc. Class A | 2,487,000 |
7,300 | MasterCard, Inc. Class A | 3,113,523 |
28,000 | Visa, Inc. Class A | 7,289,800 |
15,639,643 | ||
INTERNET 0.8% | ||
270,000 | Robinhood Markets, Inc. Class A(1) | 3,439,800 |
35,296,657 | ||
HEALTHCARE 8.8% | ||
BIOTECHNOLOGY 4.1% | ||
60,000 | BioMarin Pharmaceutical, Inc.(1) | 5,785,200 |
280,000 | Exelixis, Inc.(1) | 6,717,200 |
14,400 | Vertex Pharmaceuticals, Inc.(1) | 5,859,216 |
18,361,616 | ||
HEALTHCARE PRODUCTS 1.8% | ||
87,000 | Exact Sciences Corp.(1) | 6,436,260 |
6,800 | Insulet Corp.(1) | 1,475,464 |
7,911,724 | ||
PHARMACEUTICALS 2.9% | ||
33,000 | DexCom, Inc.(1) | 4,094,970 |
13,000 | Madrigal Pharmaceuticals, Inc.(1)(2) | 3,007,940 |
340,000 | Revance Therapeutics, Inc.(1) | 2,988,600 |
14,000 | Zoetis, Inc. | 2,763,180 |
12,854,690 | ||
39,128,030 | ||
INDUSTRIALS 3.9% | ||
AIRLINES 0.6% | ||
64,000 | Delta Air Lines, Inc. | 2,574,720 |
INTERNET 3.3% | ||
180,000 | Lyft, Inc. Class A(1) | 2,698,200 |
195,000 | Uber Technologies, Inc.(1) | 12,006,150 |
14,704,350 | ||
17,279,070 | ||
INFORMATION TECHNOLOGY 19.0% | ||
COMPUTERS 2.8% | ||
37,000 | Apple, Inc. | 7,123,610 |
20,000 | Crowdstrike Holdings, Inc. Class A(1) | 5,106,400 |
12,230,010 | ||
INTERNET 1.3% | ||
36,000 | Okta, Inc.(1) | 3,259,080 |
35,000 | Shopify, Inc. Class A(1) | 2,726,500 |
5,985,580 | ||
Shares | Value | |
COMMON STOCKS 64.7% (continued) | ||
INFORMATION TECHNOLOGY 19.0% (continued) | ||
SEMICONDUCTORS 7.0% | ||
42,000 | Advanced Micro Devices, Inc.(1) | $6,191,220 |
3,400 | Broadcom, Inc. | 3,795,250 |
33,000 | Micron Technology, Inc. | 2,816,220 |
23,500 | NVIDIA Corp. | 11,637,670 |
14,000 | NXP Semiconductors NV | 3,215,520 |
22,000 | QUALCOMM, Inc. | 3,181,860 |
30,837,740 | ||
SOFTWARE 7.9% | ||
4,600 | Intuit, Inc. | 2,875,138 |
27,000 | Microsoft Corp. | 10,153,080 |
10,000 | MicroStrategy, Inc. Class A(1)(2) | 6,316,200 |
19,500 | Salesforce, Inc.(1) | 5,131,230 |
5,000 | ServiceNow, Inc.(1) | 3,532,450 |
33,000 | Twilio, Inc. Class A(1) | 2,503,710 |
16,500 | Workday, Inc. Class A(1) | 4,554,990 |
35,066,798 | ||
84,120,128 | ||
TOTAL COMMON STOCKS (Cost $176,829,786) | 287,000,246 | |
Principal Amount | Value | |
COLLATERALIZED MORTGAGE OBLIGATIONS 0.4% | ||
$ 612,450 | FHLMC, Series 2023-DNA1, Class M1A, REMIC, (SOFR30A + 2.10%), 7.44%, 3/25/43(3)(4) | 622,156 |
608,513 | FNMA, Series 2023-R02, Class 1M1, (SOFR30A + 2.30%), 7.64%, 1/25/43(3)(4) | 622,959 |
630,606 | FNMA, Series 2023-R04, Class 1M1, (SOFR30A + 2.30%), 7.64%, 5/25/43(3)(4) | 643,872 |
TOTAL COLLATERALIZED MORTGAGE OBLIGATIONS (Cost $1,860,633) | 1,888,987 | |
COMMERCIAL MORTGAGE-BACKED SECURITIES 0.5% | ||
100,000 | COMM Mortgage Trust, Series 2014-UBS2, Class AM, 4.20%, 3/10/47 | 99,256 |
350,000 | FHLMC Multifamily Structured Pass-Through Certificates, Series K052, Class A2, 3.15%, 11/25/25 | 340,498 |
250,000 | FHLMC Multifamily Structured Pass-Through Certificates, Series K055, Class A2, 2.67%, 3/25/26 | 240,045 |
255,000 | FHLMC Multifamily Structured Pass-Through Certificates, Series K064, Class A2, 3.22%, 3/25/27 | 246,178 |
250,000 | FHLMC Multifamily Structured Pass-Through Certificates, Series K074, Class A2, 3.60%, 1/25/28 | 242,653 |
250,000 | FHLMC Multifamily Structured Pass-Through Certificates, Series K084, Class A2, 3.78%, 10/25/28(4) | 243,328 |
466,604 | FHLMC Multifamily Structured Pass-Through Certificates, Series K728, Class A2, 3.06%, 8/25/24(4) | 459,401 |
70,240 | GNMA, Series 2013-12, Class AB, 1.83%, 11/16/52 | 64,849 |
Principal Amount | Value | |
COMMERCIAL MORTGAGE-BACKED SECURITIES 0.5% (continued) | ||
$ 107,466 | GNMA, Series 2013-12, Class B, 2.07%, 11/16/52(4) | $99,624 |
TOTAL COMMERCIAL MORTGAGE-BACKED SECURITIES (Cost $2,218,854) | 2,035,832 | |
CORPORATE BONDS & NOTES 9.6% | ||
BASIC MATERIALS 0.2% | ||
IRON/STEEL 0.1% | ||
500,000 | Steel Dynamics, Inc., Senior Unsecured Notes, 3.25%, 1/15/31(2) | 450,498 |
MINING 0.1% | ||
500,000 | Freeport-McMoRan, Inc., Guaranteed Notes, 4.63%, 8/1/30(2) | 488,608 |
939,106 | ||
COMMUNICATIONS 1.0% | ||
INTERNET 0.2% | ||
500,000 | Expedia Group, Inc., Guaranteed Notes, 3.25%, 2/15/30(2) | 458,353 |
500,000 | Netflix, Inc., Senior Unsecured Notes, 4.88%, 4/15/28 | 506,686 |
965,039 | ||
MEDIA 0.2% | ||
500,000 | Charter Communications Operating LLC/Charter Communications Operating Capital, Senior Secured Notes, 4.91%, 7/23/25 | 495,247 |
500,000 | Comcast Corp., Guaranteed Notes, 3.95%, 10/15/25 | 493,148 |
988,395 | ||
TELECOMMUNICATIONS 0.6% | ||
500,000 | AT&T, Inc., Senior Unsecured Notes, 2.55%, 12/1/33 | 407,510 |
500,000 | Bell Canada Co. (The), 5.10%, 5/11/33(2) | 513,064 |
500,000 | Cisco Systems, Inc., 5.50%, 1/15/40 | 532,245 |
500,000 | T-Mobile USA, Inc., Guaranteed Notes, 3.50%, 4/15/31 | 457,095 |
500,000 | Vodafone Group PLC, Senior Unsecured Notes, 4.25%, 9/17/50 | 414,735 |
2,324,649 | ||
4,278,083 | ||
CONSUMER, CYCLICAL 1.1% | ||
AUTO MANUFACTURERS 0.2% | ||
395,000 | Ford Motor Credit Co. LLC, Senior Unsecured Notes, 3.38%, 11/13/25 | 377,980 |
500,000 | General Motors Financial Co., Inc., 5.80%, 1/7/29 | 511,681 |
889,661 | ||
HOME BUILDERS 0.1% | ||
492,000 | PulteGroup, Inc., Guaranteed Notes, 5.00%, 1/15/27(2) | 494,366 |
LODGING 0.2% | ||
500,000 | Hyatt Hotels Corp., Senior Unsecured Notes, 1.80%, 10/1/24 | 485,121 |
500,000 | Marriott International, Inc., 4.90%, 4/15/29 | 503,249 |
988,370 | ||
Principal Amount | Value | |
CORPORATE BONDS & NOTES 9.6% (continued) | ||
CONSUMER, CYCLICAL 1.1% (continued) | ||
RETAIL 0.6% | ||
$ 500,000 | AutoZone, Inc., Senior Unsecured Notes, 3.75%, 6/1/27 | $485,422 |
500,000 | Costco Wholesale Corp., Senior Unsecured Notes, 1.75%, 4/20/32(2) | 417,675 |
500,000 | McDonald's Corp., Senior Unsecured Notes, 4.60%, 9/9/32(2) | 504,776 |
500,000 | O'Reilly Automotive, Inc., Senior Unsecured Notes, 3.60%, 9/1/27 | 481,882 |
500,000 | TJX Cos., Inc. (The), 2.25%, 9/15/26(2) | 472,244 |
2,361,999 | ||
4,734,396 | ||
CONSUMER, NON-CYCLICAL 2.2% | ||
BEVERAGES 0.4% | ||
500,000 | Anheuser-Busch InBev Worldwide, Inc., Guaranteed Notes, 4.90%, 1/23/31(2) | 520,149 |
500,000 | Constellation Brands, Inc., 2.25%, 8/1/31 | 420,133 |
500,000 | Constellation Brands, Inc., Guaranteed Notes, 5.25%, 11/15/48 | 494,936 |
500,000 | Diageo Capital PLC, Guaranteed Notes, 2.00%, 4/29/30 | 431,824 |
1,867,042 | ||
BIOTECHNOLOGY 0.3% | ||
500,000 | Amgen, Inc., Senior Unsecured Notes, 2.20%, 2/21/27 | 464,915 |
500,000 | Gilead Sciences, Inc., 4.60%, 9/1/35 | 494,560 |
500,000 | Regeneron Pharmaceuticals, Inc., Senior Unsecured Notes, 1.75%, 9/15/30 | 411,104 |
1,370,579 | ||
COMMERCIAL SERVICES 0.2% | ||
500,000 | PayPal Holdings, Inc., Senior Unsecured Notes, 2.65%, 10/1/26 | 474,877 |
500,000 | Service Corp. International, Senior Unsecured Notes, 4.00%, 5/15/31 | 447,750 |
922,627 | ||
HEALTHCARE PRODUCTS 0.1% | ||
500,000 | Stryker Corp., 3.38%, 11/1/25 | 486,671 |
HEALTHCARE SERVICES 0.3% | ||
500,000 | Centene Corp., Senior Unsecured Notes, 4.63%, 12/15/29 | 479,364 |
500,000 | Elevance Health, Inc., 4.75%, 2/15/33 | 500,172 |
500,000 | HCA, Inc., Guaranteed Notes, 5.38%, 2/1/25 | 499,265 |
1,478,801 | ||
PHARMACEUTICALS 0.9% | ||
500,000 | AbbVie, Inc., Senior Unsecured Notes, 2.95%, 11/21/26 | 479,449 |
500,000 | Astrazeneca Finance LLC, 4.88%, 3/3/28 | 509,760 |
500,000 | Becton Dickinson and Co., Senior Unsecured Notes, 3.70%, 6/6/27 | 484,523 |
500,000 | CVS Health Corp., Senior Unsecured Notes, 1.75%, 8/21/30 | 413,029 |
500,000 | Eli Lilly & Co., 4.70%, 2/27/33 | 512,722 |
Principal Amount | Value | |
CORPORATE BONDS & NOTES 9.6% (continued) | ||
CONSUMER, NON-CYCLICAL 2.2% (continued) | ||
PHARMACEUTICALS 0.9% (continued) | ||
$ 500,000 | Merck & Co., Inc., Senior Unsecured Notes, 3.90%, 3/7/39 | $454,538 |
500,000 | Pfizer Investment Enterprises Pte. Ltd., 4.65%, 5/19/30 | 503,519 |
500,000 | Takeda Pharmaceutical Co. Ltd., Senior Unsecured Notes, 3.03%, 7/9/40 | 384,277 |
3,741,817 | ||
9,867,537 | ||
ENERGY 1.0% | ||
OIL & GAS 0.3% | ||
500,000 | Canadian Natural Resources Ltd., Senior Unsecured Notes, 2.05%, 7/15/25 | 476,377 |
500,000 | Hess Corp., Senior Unsecured Notes, 4.30%, 4/1/27 | 494,703 |
500,000 | Occidental Petroleum Corp., Senior Unsecured Notes, 5.50%, 12/1/25 | 499,898 |
1,470,978 | ||
PIPELINES 0.7% | ||
500,000 | Boardwalk Pipelines LP, Guaranteed Notes, 4.95%, 12/15/24(2) | 496,493 |
500,000 | Enbridge, Inc., Guaranteed Notes, 2.50%, 8/1/33(2) | 409,456 |
500,000 | Energy Transfer LP, 5.25%, 4/15/29 | 503,740 |
500,000 | Enterprise Products Operating LLC, Guaranteed Notes, 4.85%, 8/15/42 | 479,301 |
500,000 | Kinder Morgan, Inc., 5.20%, 6/1/33(2) | 496,989 |
500,000 | Targa Resources Corp., 6.50%, 3/30/34 | 539,635 |
2,925,614 | ||
4,396,592 | ||
FINANCIAL 2.8% | ||
BANKS 1.3% | ||
500,000 | Bank of America Corp., (SOFR + 2.16%), 5.02%, 7/22/33(2)(4) | 494,615 |
500,000 | Bank of New York Mellon Corp., (SOFR + 1.51%), 4.71%, 2/1/34(4) | 489,060 |
500,000 | Citigroup, Inc., Senior Unsecured Notes, (SOFR + 1.16%), 3.35%, 4/24/25(4) | 496,170 |
500,000 | Citigroup, Inc., Subordinated Notes, 5.30%, 5/6/44 | 479,756 |
500,000 | Goldman Sachs Group, Inc., Senior Unsecured Notes, 3.75%, 2/25/26 | 488,534 |
500,000 | JPMorgan Chase & Co., Subordinated Notes, 4.13%, 12/15/26 | 490,098 |
500,000 | JPMorgan Chase & Co., Senior Unsecured Notes, (SOFR + 1.64%), 3.96%, 11/15/48(4) | 418,599 |
500,000 | Morgan Stanley, (SOFR + 2.56%), 6.34%, 10/18/33(4) | 539,150 |
500,000 | National Australia Bank Ltd., 5.20%, 5/13/25(2) | 503,056 |
500,000 | NatWest Group PLC, (1 yr. CMT + 1.35%), 5.85%, 3/2/27(2)(4) | 504,185 |
500,000 | Royal Bank of Canada, 5.00%, 2/1/33 | 508,450 |
Principal Amount | Value | |
CORPORATE BONDS & NOTES 9.6% (continued) | ||
FINANCIAL 2.8% (continued) | ||
BANKS 1.3% (continued) | ||
$ 500,000 | Wells Fargo & Co., (SOFR + 2.13%), 4.61%, 4/25/53(4) | $449,512 |
5,861,185 | ||
DIVERSIFIED FINANCIALS 0.6% | ||
500,000 | AerCap Ireland Capital DAC/AerCap Global Aviation Trust, Guaranteed Notes, 1.75%, 1/30/26 | 464,313 |
500,000 | Ally Financial, Inc., Senior Unsecured Notes, 4.75%, 6/9/27 | 482,479 |
500,000 | American Express Co., 4.90%, 2/13/26 | 501,204 |
500,000 | Discover Financial Services, Senior Unsecured Notes, 3.95%, 11/6/24 | 491,498 |
500,000 | Synchrony Financial, 4.88%, 6/13/25 | 491,459 |
2,430,953 | ||
INSURANCE 0.2% | ||
500,000 | Aflac, Inc., Senior Unsecured Notes, 3.60%, 4/1/30 | 472,095 |
500,000 | CNA Financial Corp., 3.45%, 8/15/27 | 478,402 |
950,497 | ||
REITS 0.7% | ||
500,000 | American Tower Corp., 5.50%, 3/15/28 | 511,049 |
500,000 | Crown Castle, Inc., Senior Unsecured Notes, 3.80%, 2/15/28 | 474,958 |
500,000 | Equinix, Inc., Senior Unsecured Notes, 2.50%, 5/15/31 | 424,412 |
500,000 | Extra Space Storage LP, 2.20%, 10/15/30 | 415,887 |
500,000 | Kimco Realty Corp., Senior Unsecured Notes, 2.25%, 12/1/31 | 408,232 |
500,000 | Welltower, Inc., Senior Unsecured Notes, 4.25%, 4/15/28 | 490,576 |
500,000 | Weyerhaeuser Co., 4.75%, 5/15/26 | 497,593 |
3,222,707 | ||
12,465,342 | ||
INDUSTRIAL 0.4% | ||
AEROSPACE/DEFENSE 0.1% | ||
500,000 | RTX Corp., 4.50%, 6/1/42 | 454,056 |
ELECTRONICS 0.1% | ||
500,000 | Flex Ltd., Senior Unsecured Notes, 4.75%, 6/15/25 | 493,711 |
MISCELLANEOUS MANUFACTURERS 0.1% | ||
500,000 | Teledyne Technologies, Inc., 2.25%, 4/1/28 | 452,727 |
TRANSPORTATION 0.1% | ||
500,000 | Union Pacific Corp., Senior Unsecured Notes, 3.25%, 2/5/50 | 383,013 |
1,783,507 | ||
TECHNOLOGY 0.7% | ||
COMPUTERS 0.2% | ||
500,000 | Apple, Inc., 4.65%, 2/23/46 | 493,208 |
500,000 | Dell International LLC/EMC Corp., Senior Unsecured Notes, 4.90%, 10/1/26 | 500,796 |
994,004 | ||
Principal Amount | Value | |
CORPORATE BONDS & NOTES 9.6% (continued) | ||
TECHNOLOGY 0.7% (continued) | ||
SEMICONDUCTORS 0.3% | ||
$ 500,000 | Analog Devices, Inc., Senior Unsecured Notes, 2.80%, 10/1/41 | $372,188 |
500,000 | Broadcom, Inc., 4.30%, 11/15/32 | 479,682 |
500,000 | NVIDIA Corp., 3.50%, 4/1/40 | 433,407 |
1,285,277 | ||
SOFTWARE 0.2% | ||
500,000 | Adobe, Inc., Senior Unsecured Notes, 2.30%, 2/1/30 | 447,901 |
500,000 | Oracle Corp., 6.25%, 11/9/32 | 543,942 |
991,843 | ||
3,271,124 | ||
UTILITIES 0.2% | ||
ELECTRIC 0.2% | ||
500,000 | Duke Energy Corp., Senior Unsecured Notes, 4.50%, 8/15/32 | 483,975 |
500,000 | Southern Co., 5.70%, 3/15/34(2) | 525,762 |
1,009,737 | ||
TOTAL CORPORATE BONDS & NOTES (Cost $42,725,764) | 42,745,424 | |
LONG-TERM MUNICIPAL SECURITIES 0.6% | ||
CALIFORNIA 0.2% | ||
500,000 | Regents of the University of California Medical Center Pooled Revenue, Series Q, 4.13%, 5/15/32 | 479,718 |
500,000 | State of California, GO, 5.70%, 10/1/32 | 535,767 |
1,015,485 | ||
HAWAII 0.1% | ||
500,000 | City & County Honolulu Wastewater System Revenue, Series B, 2.50%, 7/1/27 | 469,455 |
MASSACHUSETTS 0.1% | ||
350,000 | Commonwealth of Massachusetts, Series A, 3.77%, 7/15/29 | 342,118 |
NEW MEXICO 0.1% | ||
335,000 | City of Albuquerque, Series A, 2.49%, 7/1/35 | 263,411 |
TEXAS 0.0% | ||
250,000 | Tarrant County Cultural Education Facilities Finance Corp., Revenue Bonds, Baylor Health Care System Project, Series C, Series C, 4.45%, 11/15/43 | 226,456 |
WASHINGTON 0.1% | ||
250,000 | City of Tacoma, GO, 5.89%, 12/1/30 | 265,805 |
TOTAL LONG-TERM MUNICIPAL SECURITIES (Cost $2,574,433) | 2,582,730 | |
RESIDENTIAL MORTGAGE-BACKED SECURITIES 7.6% | ||
59,517 | FHLMC, Series 4151, Class PA, 2.00%, 1/15/33 | 55,845 |
6,399 | FHLMC Gold PC Pool #A47613, 5.00%, 11/1/35 | 6,512 |
79,244 | FHLMC Gold Pool #C09027, 3.00%, 2/1/43 | 72,934 |
1,524,682 | FHLMC Pool #QB9661, 2.50%, 3/1/51 | 1,296,788 |
730,687 | FHLMC Pool #QD2419, 3.00%, 12/1/51 | 658,490 |
Principal Amount | Value | |
RESIDENTIAL MORTGAGE-BACKED SECURITIES 7.6% (continued) | ||
$ 1,876,771 | FHLMC Pool #QF1236, 4.50%, 10/1/52 | $1,819,825 |
1,107,119 | FHLMC Pool #QG6306, 5.00%, 7/1/53 | 1,095,964 |
176,572 | FHLMC Pool #RA6817, 2.50%, 2/1/52 | 151,047 |
580,288 | FHLMC Pool #SB8215, 4.00%, 3/1/38 | 569,244 |
2,400,000 | FHLMC Pool #SD4553, 3.00%, 9/1/53 | 2,122,246 |
400,165 | FHLMC Pool #SD8093, 3.50%, 9/1/50 | 371,695 |
1,021,774 | FHLMC Pool #SD8108, 3.00%, 11/1/50 | 909,013 |
1,971,988 | FHLMC Pool #SD8255, 3.50%, 10/1/52 | 1,808,889 |
2,399,266 | FHLMC Pool #SD8256, 4.00%, 10/1/52 | 2,269,169 |
2,253,844 | FHLMC Pool #SD8266, MBS, 4.50%, 11/1/52 | 2,185,456 |
1,649,579 | FHLMC Pool #SD8328, 4.50%, 6/1/53 | 1,599,527 |
319 | FNMA Pool #AH3226, 5.00%, 2/1/41 | 324 |
100,310 | FNMA Pool #AL0657, 5.00%, 8/1/41 | 101,885 |
82,748 | FNMA Pool #AQ1853, 3.00%, 11/1/42 | 76,361 |
109,966 | FNMA Pool #AU5409, 3.00%, 8/1/43 | 100,529 |
526,687 | FNMA Pool #CA5540, 3.00%, 4/1/50 | 471,814 |
955,878 | FNMA Pool #CB5892, 4.50%, 3/1/53 | 926,874 |
145,822 | FNMA Pool #FM2202, 4.00%, 12/1/48 | 140,370 |
337,395 | FNMA Pool #FM4140, 2.50%, 9/1/50 | 291,090 |
106,979 | FNMA Pool #FM9760, 3.50%, 11/1/51 | 98,650 |
134,641 | FNMA Pool #FM9834, 3.50%, 6/1/49 | 125,443 |
1,450,316 | FNMA Pool #FS3526, 4.00%, 12/1/52 | 1,371,761 |
159,537 | FNMA Pool #MA4222, 3.50%, 12/1/50 | 148,359 |
2,200,938 | FNMA Pool #MA4512, 2.50%, 1/1/52 | 1,872,116 |
1,903,110 | FNMA Pool #MA4978, 5.00%, 4/1/53 | 1,882,763 |
2,113,176 | FNMA Pool #MA5106, 5.00%, 8/1/53 | 2,090,584 |
1,226,682 | FNMA Pool #MA5131, 3.50%, 7/1/53 | 1,125,113 |
28,195 | FNMA REMIC Trust Series 2013-18, Series 2013-18, Class AE, 2.00%, 3/25/28 | 27,000 |
1,281,683 | GNMA, Series 2021-98, Class IG, IO, 3.00%, 6/20/51 | 203,496 |
48,519 | GNMA II Pool #MA1521, 3.50%, 12/20/43 | 46,066 |
84,974 | GNMA II Pool #MA1839, 4.00%, 4/20/44 | 83,226 |
93,550 | GNMA II Pool #MA4836, 3.00%, 11/20/47 | 85,765 |
226,212 | GNMA II Pool #MA7054, 3.50%, 12/20/50 | 212,408 |
1,778,068 | GNMA II Pool #MA7651, 3.50%, 10/20/51 | 1,658,181 |
1,183,066 | GNMA II Pool #MA8945, 4.00%, 6/20/53 | 1,128,837 |
2,606,782 | Government National Mortgage Association, MBS, 2.50%, 11/20/51 | 2,279,359 |
TOTAL RESIDENTIAL MORTGAGE-BACKED SECURITIES (Cost $34,395,644) | 33,541,018 | |
U.S. TREASURY OBLIGATIONS 11.3% | ||
2,000,000 | U.S. Treasury Bonds, 3.50%, 2/15/39 | 1,894,141 |
1,750,000 | U.S. Treasury Bonds, 1.13%, 5/15/40 | 1,127,793 |
3,100,000 | U.S. Treasury Bonds, 2.88%, 5/15/43 | 2,544,785 |
2,000,000 | U.S. Treasury Bonds, 3.88%, 5/15/43 | 1,906,563 |
2,500,000 | U.S. Treasury Bonds, 3.00%, 2/15/48 | 2,037,207 |
1,000,000 | U.S. Treasury Bonds, 2.25%, 8/15/49 | 698,203 |
5,250,000 | U.S. Treasury Bonds, 2.25%, 2/15/52 | 3,639,316 |
2,000,000 | U.S. Treasury Bonds, 2.88%, 5/15/52 | 1,592,344 |
7,000,000 | U.S. Treasury Notes, 2.25%, 3/31/24 | 6,947,773 |
725,000 | U.S. Treasury Notes, 4.50%, 7/15/26 | 731,740 |
Principal Amount | Value | |
U.S. TREASURY OBLIGATIONS 11.3% (continued) | ||
$ 8,820,400 | U.S. Treasury Notes, 2.25%, 8/15/27 | $8,318,740 |
1,500,000 | U.S. Treasury Notes, 1.25%, 3/31/28 | 1,345,078 |
6,000,000 | U.S. Treasury Notes, 1.63%, 8/15/29 | 5,338,359 |
1,250,000 | U.S. Treasury Notes, 3.50%, 1/31/30 | 1,222,510 |
1,000,000 | U.S. Treasury Notes, 1.50%, 2/15/30 | 871,211 |
1,000,000 | U.S. Treasury Notes, 1.13%, 2/15/31 | 834,727 |
3,875,000 | U.S. Treasury Notes, 2.75%, 8/15/32 | 3,548,652 |
6,000,000 | U.S. Treasury Notes, 3.38%, 5/15/33 | 5,758,125 |
TOTAL U.S. TREASURY OBLIGATIONS (Cost $51,561,034) | 50,357,267 | |
Shares | Value | |
SHORT-TERM INVESTMENTS 7.7% | ||
MONEY MARKET FUNDS 7.7% | ||
22,566,689 | State Street Institutional U.S. Government Money Market Fund, Premier Class, 5.32%(5) | 22,566,689 |
11,680,188 | State Street Navigator Securities Lending Government Money Market Portfolio(6) | 11,680,188 |
34,246,877 | ||
TOTAL SHORT-TERM INVESTMENTS (Cost $34,246,877) | 34,246,877 | |
TOTAL INVESTMENTS IN SECURITIES 102.4% (Cost $346,413,025) | $454,398,381 | |
EXCESS OF LIABILITIES OVER CASH AND OTHER ASSETS (2.4)% | (10,629,301 ) | |
NET ASSETS 100.0% | $443,769,080 | |
(1) | Non-income producing. |
(2) | A portion or all of the security was held on loan. As of December 31, 2023, the market value of the securities on loan was $20,708,639. |
(3) | Pursuant to Rule 144A under the Securities Act of 1933, this security can only be sold to qualified institutional investors. |
(4) | Floating or variable rate security. The rate disclosed is the rate in effect as of December 31, 2023. The information in parentheses represents the benchmark and reference rate for each relevant security and the rate adjusts based upon the reference rate and spread. The security may be further subject to interest rate floor and caps. For securities which do not indicate a reference rate and spread in their descriptions, the interest rate adjusts periodically based on current interest rates and, for mortgage-backed securities, prepayments in the underlying pool of assets. |
(5) | Rate reflects 7 day yield as of December 31, 2023. |
(6) | Securities with an aggregate market value of $20,708,639 were out on loan in exchange for collateral including $11,680,188 of cash collateral as of December 31, 2023. The collateral was invested in a cash collateral reinvestment vehicle. |
ADR | American Depositary Receipt. |
CMT | Constant Maturity Treasury |
FHLMC | Federal Home Loan Mortgage Corp. |
FNMA | Federal National Mortgage Association. |
GNMA | Government National Mortgage Association. |
REITS | Real Estate Investment Trusts. |
REMIC | Real Estate Mortgage Investment Conduit. |
SOFR | Secured Overnight Financing Rate. |
Investments in Securities: | Level 1 | Level 2 | Level 3 | Total |
Assets | ||||
Common Stocks* | $287,000,246 | $— | $— | $287,000,246 |
Collateralized Mortgage Obligations | — | 1,888,987 | — | 1,888,987 |
Commercial Mortgage-Backed Securities | — | 2,035,832 | — | 2,035,832 |
Corporate Bonds & Notes* | — | 42,745,424 | — | 42,745,424 |
Long-Term Municipal Securities* | — | 2,582,730 | — | 2,582,730 |
Residential Mortgage-Backed Securities | — | 33,541,018 | — | 33,541,018 |
U.S. Treasury Obligations | — | 50,357,267 | — | 50,357,267 |
Short-Term Investments | 34,246,877 | — | — | 34,246,877 |
Total Investments in Securities | $321,247,123 | $133,151,258 | $— | $454,398,381 |
* | See Schedule of Investments for further breakdown by category. |
Ten Largest Holdings* | |||
Issue | Principal Amount | Value | Percentage of Net Assets |
U.S. Treasury Notes, 2.25%, 8/15/27 | $1,906,300 | $1,797,879 | 4.7 % |
U.S. Treasury Notes, 2.25%, 11/15/24 | 1,100,000 | 1,075,379 | 2.8 % |
FNMA Pool #BX7762, 5.00%, 3/1/53 | 1,024,756 | 1,013,937 | 2.7 % |
U.S. Treasury Bonds, 2.25%, 8/15/49 | 1,400,000 | 977,484 | 2.6 % |
FNMA Pool #FM9834, 3.50%, 6/1/49 | 1,043,464 | 972,181 | 2.6 % |
FHLMC Pool #SD8256, 4.00%, 10/1/52 | 1,002,046 | 947,712 | 2.5 % |
U.S. Treasury Bonds, 3.00%, 2/15/48 | 1,050,000 | 855,627 | 2.3 % |
U.S. Treasury Bonds, 2.88%, 5/15/43 | 1,000,000 | 820,899 | 2.2 % |
FNMA Pool #CB5892, 4.50%, 3/1/53 | 798,158 | 773,940 | 2.0 % |
FNMA Pool #MA5106, 5.00%, 8/1/53 | 779,051 | 770,722 | 2.0 % |
Asset Allocation — Percentage of Net Assets |

Sector Weightings — Percentage of Total Investments In Securities* |
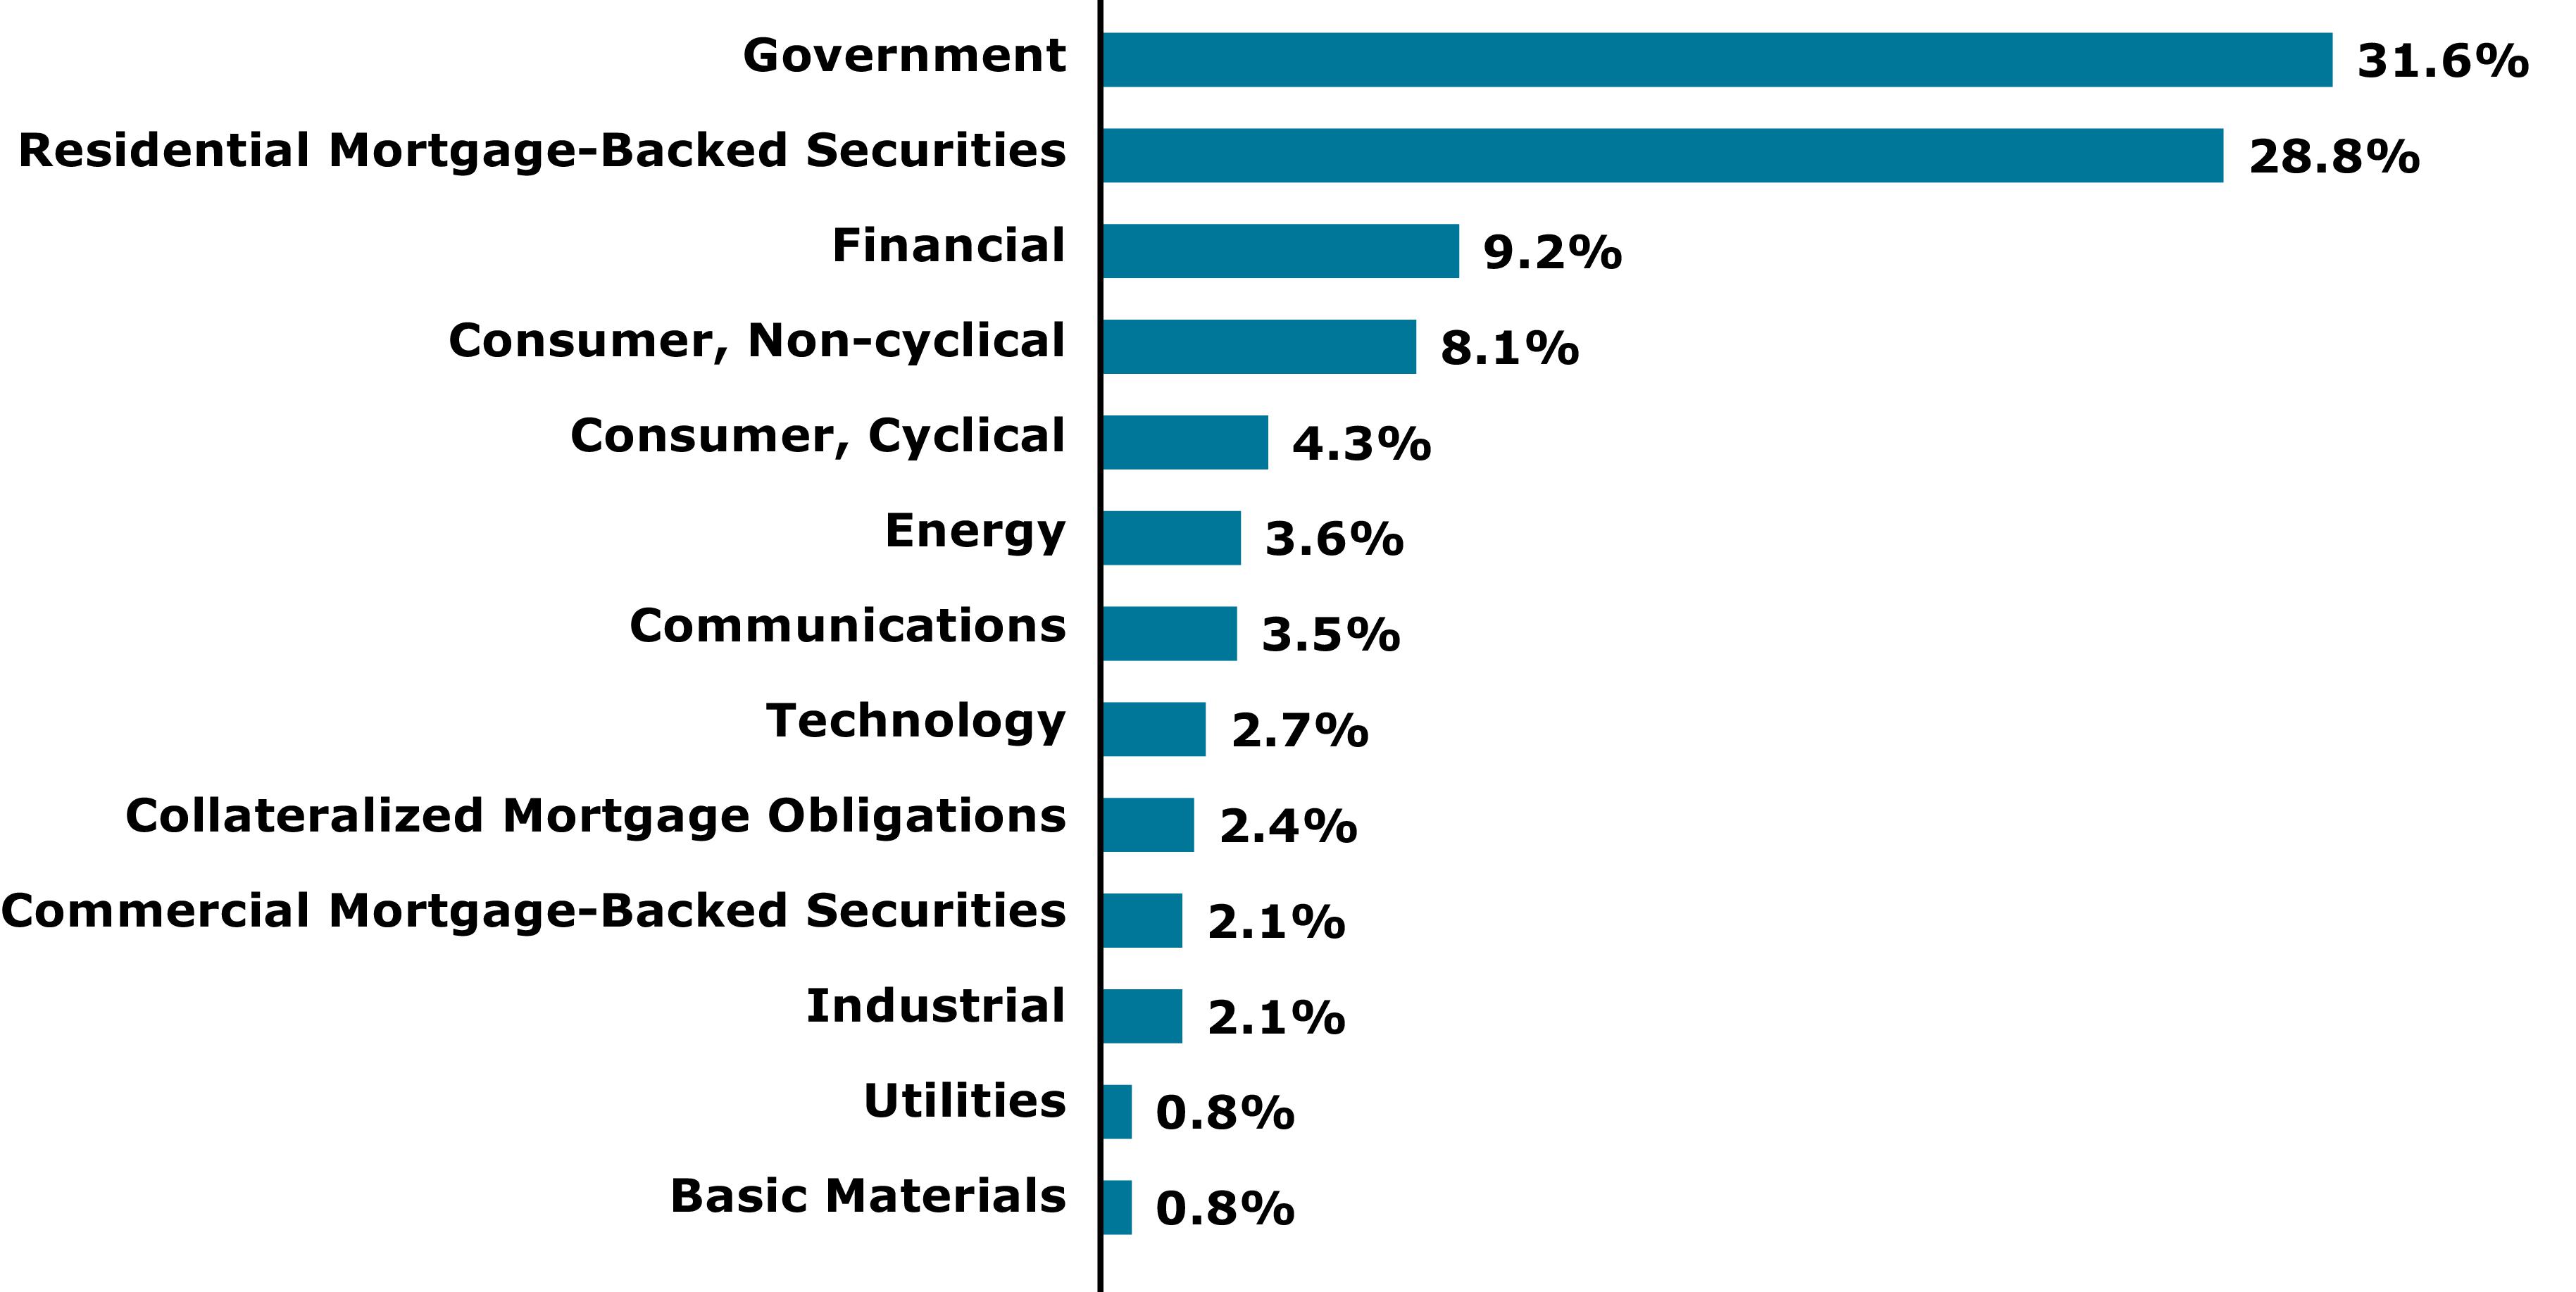
* | Excludes short-term investments, if any. |
Percentage of Total Investments In Securities* | |
Less than 4% | 58.4 % |
4 - 4.99% | 26.1 % |
5 - 5.99% | 11.8 % |
6 - 6.99% | 1.3 % |
Greater or equal to 7% | 2.4 % |
Total | 100.0 % |
* | Excludes short-term investments, if any. |
Comparison of a Change in Value of a $10,000 Investment in the Value Line Core Bond Fund and the Bloomberg US Aggregate Bond Index***
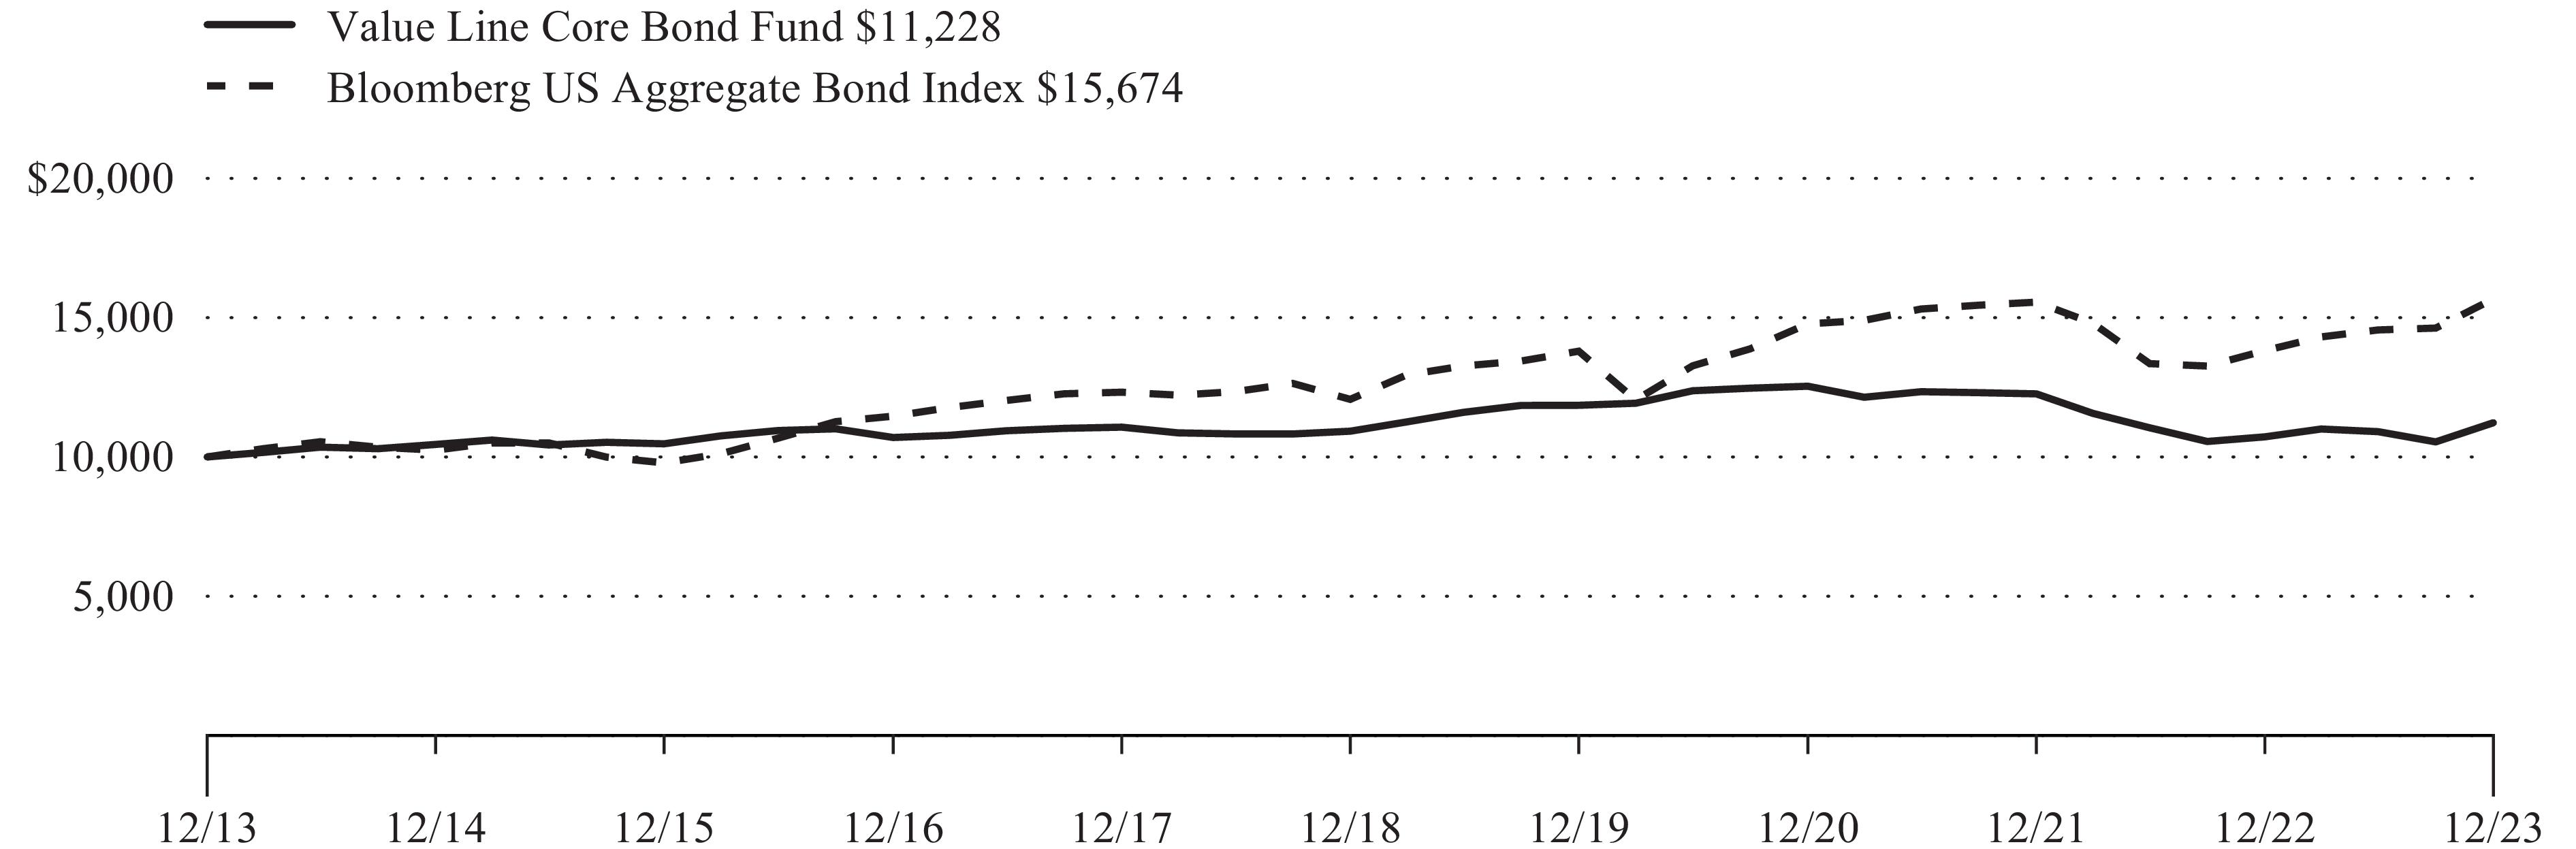
1 Yr | 5 Yrs | 10 Yrs | |
Value Line Core Bond Fund | 4.72 % | 0.55 % | 1.17 % |
Bloomberg US Aggregate Bond Index*** | 5.53 % | 1.10 % | 1.81 % |
Principal Amount | Value | |
COLLATERALIZED MORTGAGE OBLIGATIONS 2.3% | ||
$ 288,756 | FHLMC, Series 2023-DNA1, Class M1A, REMIC, (SOFR30A + 2.10%), 7.44%, 3/25/43(1)(2) | $293,332 |
286,899 | FNMA, Series 2023-R02, Class 1M1, (SOFR30A + 2.30%), 7.64%, 1/25/43(1)(2) | 293,710 |
297,315 | FNMA, Series 2023-R04, Class 1M1, (SOFR30A + 2.30%), 7.64%, 5/25/43(1)(2) | 303,570 |
TOTAL COLLATERALIZED MORTGAGE OBLIGATIONS (Cost $875,763) | 890,612 | |
COMMERCIAL MORTGAGE-BACKED SECURITIES 2.0% | ||
150,000 | COMM Mortgage Trust, Series 2014-UBS2, Class AM, 4.20%, 3/10/47 | 148,884 |
200,000 | FHLMC Multifamily Structured Pass-Through Certificates, Series K092, Class A2, 3.30%, 4/25/29 | 190,179 |
175,000 | FREMF Mortgage Trust, Series 2015-K43, Class B, 3.73%, 2/25/48(1)(2) | 170,805 |
132,977 | GNMA, Series 2012-125, Class AB, 2.11%, 2/16/53(2) | 109,472 |
98,335 | GNMA, Series 2013-12, Class AB, 1.83%, 11/16/52 | 90,789 |
31,539 | Sequoia Mortgage Trust, Series 2004-8, Class A1, (SOFR + 0.81%), 6.17%, 9/20/34(2) | 27,576 |
23,049 | Wells Fargo Commercial Mortgage Trust, Series 2015-NXS2, Class ASB, 3.46%, 7/15/58 | 22,676 |
TOTAL COMMERCIAL MORTGAGE-BACKED SECURITIES (Cost $859,686) | 760,381 | |
CORPORATE BONDS & NOTES 34.2% | ||
BASIC MATERIALS 0.8% | ||
IRON/STEEL 0.4% | ||
165,000 | Steel Dynamics, Inc., Senior Unsecured Notes, 3.25%, 1/15/31(3) | 148,664 |
MINING 0.4% | ||
145,000 | Freeport-McMoRan, Inc., Guaranteed Notes, 4.63%, 8/1/30 | 141,697 |
290,361 | ||
COMMUNICATIONS 3.4% | ||
INTERNET 0.7% | ||
150,000 | Expedia Group, Inc., Guaranteed Notes, 3.25%, 2/15/30(3) | 137,506 |
150,000 | Netflix, Inc., Senior Unsecured Notes, 4.88%, 4/15/28 | 152,006 |
289,512 | ||
MEDIA 0.8% | ||
150,000 | Charter Communications Operating LLC/Charter Communications Operating Capital, Senior Secured Notes, 4.91%, 7/23/25 | 148,574 |
150,000 | Comcast Corp., Guaranteed Notes, 4.15%, 10/15/28 | 147,911 |
296,485 | ||
Principal Amount | Value | |
CORPORATE BONDS & NOTES 34.2% (continued) | ||
COMMUNICATIONS 3.4% (continued) | ||
TELECOMMUNICATIONS 1.9% | ||
$ 150,000 | AT&T, Inc., Senior Unsecured Notes, 2.55%, 12/1/33 | $122,253 |
150,000 | Bell Canada Co. (The), 5.10%, 5/11/33(3) | 153,919 |
150,000 | Cisco Systems, Inc., 5.50%, 1/15/40 | 159,673 |
150,000 | T-Mobile USA, Inc., Guaranteed Notes, 3.50%, 4/15/31 | 137,129 |
175,000 | Vodafone Group PLC, Senior Unsecured Notes, 4.25%, 9/17/50 | 145,157 |
718,131 | ||
1,304,128 | ||
CONSUMER, CYCLICAL 4.2% | ||
AUTO MANUFACTURERS 1.1% | ||
150,000 | Cummins, Inc., Senior Unsecured Notes, 1.50%, 9/1/30(3) | 125,090 |
170,000 | Ford Motor Credit Co. LLC, Senior Unsecured Notes, 3.38%, 11/13/25 | 162,675 |
150,000 | General Motors Financial Co., Inc., 5.80%, 1/7/29 | 153,504 |
441,269 | ||
HOME BUILDERS 0.4% | ||
152,000 | PulteGroup, Inc., Guaranteed Notes, 5.00%, 1/15/27(3) | 152,731 |
LODGING 0.8% | ||
150,000 | Hyatt Hotels Corp., Senior Unsecured Notes, 1.80%, 10/1/24 | 145,536 |
150,000 | Marriott International, Inc., 4.90%, 4/15/29 | 150,975 |
296,511 | ||
RETAIL 1.9% | ||
150,000 | AutoZone, Inc., Senior Unsecured Notes, 3.75%, 6/1/27 | 145,627 |
150,000 | Costco Wholesale Corp., Senior Unsecured Notes, 1.75%, 4/20/32 | 125,302 |
150,000 | McDonald's Corp., Senior Unsecured Notes, 4.60%, 9/9/32(3) | 151,433 |
150,000 | O'Reilly Automotive, Inc., Senior Unsecured Notes, 3.60%, 9/1/27 | 144,565 |
150,000 | TJX Cos., Inc. (The), 2.25%, 9/15/26(3) | 141,673 |
708,600 | ||
1,599,111 | ||
CONSUMER, NON-CYCLICAL 7.8% | ||
BEVERAGES 1.4% | ||
150,000 | Anheuser-Busch InBev Worldwide, Inc., Guaranteed Notes, 4.90%, 1/23/31(3) | 156,045 |
150,000 | Constellation Brands, Inc., 2.25%, 8/1/31 | 126,040 |
150,000 | Constellation Brands, Inc., Guaranteed Notes, 5.25%, 11/15/48 | 148,481 |
135,000 | Diageo Capital PLC, Guaranteed Notes, 2.00%, 4/29/30 | 116,592 |
547,158 | ||
BIOTECHNOLOGY 1.1% | ||
160,000 | Amgen, Inc., Senior Unsecured Notes, 2.20%, 2/21/27 | 148,773 |
Principal Amount | Value | |
CORPORATE BONDS & NOTES 34.2% (continued) | ||
CONSUMER, NON-CYCLICAL 7.8% (continued) | ||
BIOTECHNOLOGY 1.1% (continued) | ||
$ 150,000 | Gilead Sciences, Inc., 4.60%, 9/1/35 | $148,368 |
150,000 | Regeneron Pharmaceuticals, Inc., Senior Unsecured Notes, 1.75%, 9/15/30 | 123,331 |
420,472 | ||
COMMERCIAL SERVICES 0.7% | ||
150,000 | PayPal Holdings, Inc., Senior Unsecured Notes, 2.65%, 10/1/26 | 142,463 |
155,000 | Service Corp. International, Senior Unsecured Notes, 4.00%, 5/15/31 | 138,803 |
281,266 | ||
HEALTHCARE PRODUCTS 0.4% | ||
150,000 | Stryker Corp., 3.38%, 11/1/25 | 146,001 |
HEALTHCARE SERVICES 1.2% | ||
150,000 | Centene Corp., Senior Unsecured Notes, 4.63%, 12/15/29 | 143,809 |
150,000 | Elevance Health, Inc., 4.75%, 2/15/33 | 150,052 |
150,000 | HCA, Inc., Guaranteed Notes, 5.38%, 2/1/25 | 149,779 |
443,640 | ||
PHARMACEUTICALS 3.0% | ||
150,000 | AbbVie, Inc., Senior Unsecured Notes, 2.95%, 11/21/26 | 143,835 |
150,000 | Astrazeneca Finance LLC, 4.88%, 3/3/28 | 152,928 |
150,000 | Becton Dickinson and Co., Senior Unsecured Notes, 3.70%, 6/6/27 | 145,357 |
150,000 | CVS Health Corp., Senior Unsecured Notes, 1.75%, 8/21/30 | 123,909 |
150,000 | Eli Lilly & Co., 4.70%, 2/27/33 | 153,816 |
150,000 | Merck & Co., Inc., Senior Unsecured Notes, 3.90%, 3/7/39 | 136,361 |
150,000 | Pfizer Investment Enterprises Pte. Ltd., 4.65%, 5/19/30 | 151,056 |
165,000 | Takeda Pharmaceutical Co. Ltd., Senior Unsecured Notes, 3.03%, 7/9/40 | 126,811 |
1,134,073 | ||
2,972,610 | ||
ENERGY 3.5% | ||
OIL & GAS 1.2% | ||
150,000 | Canadian Natural Resources Ltd., Senior Unsecured Notes, 2.05%, 7/15/25 | 142,913 |
150,000 | Hess Corp., Senior Unsecured Notes, 4.30%, 4/1/27 | 148,411 |
150,000 | Occidental Petroleum Corp., Senior Unsecured Notes, 5.50%, 12/1/25 | 149,969 |
441,293 | ||
PIPELINES 2.3% | ||
150,000 | Boardwalk Pipelines LP, Guaranteed Notes, 4.95%, 12/15/24 | 148,948 |
150,000 | Enbridge, Inc., Guaranteed Notes, 2.50%, 8/1/33 | 122,837 |
150,000 | Energy Transfer LP, 5.25%, 4/15/29 | 151,122 |
150,000 | Enterprise Products Operating LLC, Guaranteed Notes, 4.85%, 8/15/42 | 143,790 |
Principal Amount | Value | |
CORPORATE BONDS & NOTES 34.2% (continued) | ||
ENERGY 3.5% (continued) | ||
PIPELINES 2.3% (continued) | ||
$ 150,000 | Kinder Morgan, Inc., 5.20%, 6/1/33 | $149,097 |
150,000 | Targa Resources Corp., 6.50%, 3/30/34 | 161,890 |
877,684 | ||
1,318,977 | ||
FINANCIAL 9.0% | ||
BANKS 4.4% | ||
150,000 | Bank of America Corp., (SOFR + 2.16%), 5.02%, 7/22/33(2) | 148,385 |
150,000 | Bank of New York Mellon Corp., (SOFR + 1.51%), 4.71%, 2/1/34(2) | 146,718 |
160,000 | Citigroup, Inc., Senior Unsecured Notes, (SOFR + 1.16%), 3.35%, 4/24/25(2) | 158,774 |
165,000 | Citigroup, Inc., Subordinated Notes, 5.30%, 5/6/44 | 158,320 |
175,000 | Goldman Sachs Group, Inc., Senior Unsecured Notes, 3.75%, 2/25/26 | 170,987 |
150,000 | JPMorgan Chase & Co., Subordinated Notes, 4.13%, 12/15/26 | 147,029 |
175,000 | JPMorgan Chase & Co., Senior Unsecured Notes, (SOFR + 1.64%), 3.96%, 11/15/48(2) | 146,510 |
150,000 | Morgan Stanley, (SOFR + 2.56%), 6.34%, 10/18/33(2) | 161,745 |
150,000 | NatWest Group PLC, (1 yr. CMT + 1.35%), 5.85%, 3/2/27(2) | 151,255 |
160,000 | Royal Bank of Canada, 5.00%, 2/1/33 | 162,704 |
150,000 | Wells Fargo & Co., (SOFR + 2.13%), 4.61%, 4/25/53(2) | 134,854 |
1,687,281 | ||
DIVERSIFIED FINANCIALS 1.6% | ||
175,000 | AerCap Ireland Capital DAC/AerCap Global Aviation Trust, Guaranteed Notes, 1.75%, 1/30/26 | 162,509 |
150,000 | Ally Financial, Inc., Senior Unsecured Notes, 4.75%, 6/9/27 | 144,744 |
165,000 | Discover Financial Services, Senior Unsecured Notes, 3.95%, 11/6/24 | 162,194 |
150,000 | Synchrony Financial, 4.88%, 6/13/25 | 147,438 |
616,885 | ||
INSURANCE 0.4% | ||
150,000 | Aflac, Inc., Senior Unsecured Notes, 3.60%, 4/1/30 | 141,629 |
REITS 2.6% | ||
150,000 | American Tower Corp., 5.50%, 3/15/28 | 153,315 |
150,000 | Crown Castle, Inc., Senior Unsecured Notes, 3.80%, 2/15/28 | 142,487 |
150,000 | Equinix, Inc., Senior Unsecured Notes, 2.50%, 5/15/31 | 127,324 |
150,000 | Extra Space Storage LP, 2.20%, 10/15/30 | 124,766 |
150,000 | Kimco Realty Corp., Senior Unsecured Notes, 2.25%, 12/1/31 | 122,469 |
150,000 | Welltower, Inc., Senior Unsecured Notes, 4.25%, 4/15/28 | 147,173 |
Principal Amount | Value | |
CORPORATE BONDS & NOTES 34.2% (continued) | ||
FINANCIAL 9.0% (continued) | ||
REITS 2.6% (continued) | ||
$ 150,000 | Weyerhaeuser Co., 4.75%, 5/15/26 | $149,278 |
966,812 | ||
3,412,607 | ||
INDUSTRIAL 2.1% | ||
AEROSPACE/DEFENSE 0.4% | ||
150,000 | RTX Corp., 4.50%, 6/1/42 | 136,217 |
ELECTRONICS 0.7% | ||
160,000 | Amphenol Corp., Senior Unsecured Notes, 2.20%, 9/15/31 | 134,630 |
150,000 | Flex Ltd., Senior Unsecured Notes, 4.75%, 6/15/25 | 148,113 |
282,743 | ||
MISCELLANEOUS MANUFACTURERS 0.4% | ||
150,000 | Teledyne Technologies, Inc., 2.25%, 4/1/28 | 135,818 |
TRANSPORTATION 0.6% | ||
150,000 | CSX Corp., Senior Unsecured Notes, 3.35%, 9/15/49 | 113,381 |
150,000 | Union Pacific Corp., Senior Unsecured Notes, 3.25%, 2/5/50 | 114,904 |
228,285 | ||
783,063 | ||
TECHNOLOGY 2.6% | ||
COMPUTERS 0.8% | ||
150,000 | Apple, Inc., 4.65%, 2/23/46 | 147,962 |
150,000 | Dell International LLC/EMC Corp., Senior Unsecured Notes, 4.90%, 10/1/26 | 150,239 |
298,201 | ||
SEMICONDUCTORS 1.0% | ||
150,000 | Analog Devices, Inc., Senior Unsecured Notes, 2.80%, 10/1/41 | 111,656 |
150,000 | Broadcom, Inc., 4.30%, 11/15/32 | 143,905 |
150,000 | NVIDIA Corp., 3.50%, 4/1/40 | 130,022 |
385,583 | ||
SOFTWARE 0.8% | ||
150,000 | Adobe, Inc., Senior Unsecured Notes, 2.30%, 2/1/30 | 134,370 |
150,000 | Oracle Corp., 6.25%, 11/9/32 | 163,183 |
297,553 | ||
981,337 | ||
UTILITIES 0.8% | ||
ELECTRIC 0.8% | ||
150,000 | Duke Energy Corp., Senior Unsecured Notes, 4.50%, 8/15/32 | 145,193 |
150,000 | Southern Co., 5.70%, 3/15/34 | 157,728 |
302,921 | ||
TOTAL CORPORATE BONDS & NOTES (Cost $13,517,390) | 12,965,115 | |
Principal Amount | Value | |
LONG-TERM MUNICIPAL SECURITIES 2.3% | ||
CALIFORNIA 0.8% | ||
$ 150,000 | Regents of the University of California Medical Center Pooled Revenue, Series Q, 4.13%, 5/15/32 | $143,915 |
150,000 | State of California, GO, 5.70%, 10/1/32 | 160,730 |
304,645 | ||
OREGON 0.3% | ||
145,000 | State of Oregon, Series C, GO, 2.38%, 5/1/36 | 113,159 |
TEXAS 1.2% | ||
500,000 | Tarrant County Cultural Education Facilities Finance Corp., Revenue Bonds, Baylor Health Care System Project, Series C, Series C, 4.45%, 11/15/43 | 452,913 |
TOTAL LONG-TERM MUNICIPAL SECURITIES (Cost $944,039) | 870,717 | |
RESIDENTIAL MORTGAGE-BACKED SECURITIES 28.0% | ||
76,904 | FHLMC Gold PC Pool #C91749, 4.00%, 1/1/34 | 75,363 |
32,206 | FHLMC Gold PC Pool #G06224, 3.50%, 1/1/41 | 30,619 |
4,132 | FHLMC Gold PC Pool #J11587, 4.00%, 1/1/25 | 4,080 |
16,288 | FHLMC Gold PC Pool #Q06307, 3.50%, 2/1/42 | 15,437 |
18,820 | FHLMC Gold PC Pool #Q08656, 4.00%, 6/1/42 | 18,204 |
34,973 | FHLMC Gold PC Pool #Q08903, 3.50%, 6/1/42 | 33,111 |
110,546 | FHLMC Gold PC Pool #Q14593, 3.00%, 1/1/43 | 102,154 |
131,357 | FHLMC Gold Pool #Q34167, 4.00%, 6/1/45 | 126,814 |
28,583 | FHLMC Gold Pool #Q57991, 4.00%, 8/1/48 | 27,576 |
174,884 | FHLMC Pool #QB2958, 3.00%, 9/1/50 | 155,384 |
182,564 | FHLMC Pool #QB5314, 2.50%, 11/1/50 | 156,114 |
222,593 | FHLMC Pool #QB8153, 2.50%, 1/1/51 | 190,522 |
783,552 | FHLMC Pool #QF1236, 4.50%, 10/1/52 | 759,777 |
132,132 | FHLMC Pool #SD8023, 2.50%, 11/1/49 | 113,351 |
140,176 | FHLMC Pool #SD8163, 3.50%, 8/1/51 | 129,168 |
418,904 | FHLMC Pool #SD8173, 2.50%, 10/1/51 | 356,646 |
1,002,046 | FHLMC Pool #SD8256, 4.00%, 10/1/52 | 947,712 |
47,324 | FNMA Pool #AB2346, 4.50%, 2/1/41 | 47,263 |
23,130 | FNMA Pool #AB5231, 2.50%, 5/1/27 | 22,305 |
22,927 | FNMA Pool #AB5716, 3.00%, 7/1/27 | 22,248 |
45,983 | FNMA Pool #AI4285, 5.00%, 6/1/41 | 46,672 |
204,234 | FNMA Pool #AR6394, 3.00%, 2/1/43 | 187,725 |
56,775 | FNMA Pool #AS5892, 3.50%, 10/1/45 | 52,987 |
18,939 | FNMA Pool #AS6102, 3.50%, 11/1/45 | 17,675 |
33,107 | FNMA Pool #AS6205, 3.50%, 11/1/45 | 30,898 |
25,366 | FNMA Pool #AS6385, 4.00%, 12/1/45 | 24,454 |
63,335 | FNMA Pool #AS9562, 3.00%, 5/1/47 | 57,115 |
72,346 | FNMA Pool #AU4279, 3.00%, 9/1/43 | 66,494 |
57,652 | FNMA Pool #AV0703, 4.00%, 12/1/43 | 56,037 |
22,735 | FNMA Pool #AW7362, 2.50%, 8/1/29 | 21,618 |
66,062 | FNMA Pool #AX0416, 4.00%, 8/1/44 | 63,443 |
Principal Amount | Value | |
RESIDENTIAL MORTGAGE-BACKED SECURITIES 28.0% (continued) | ||
$ 40,125 | FNMA Pool #AY1670, 3.50%, 2/1/45 | $37,449 |
24,544 | FNMA Pool #AY4195, 4.00%, 5/1/45 | 23,670 |
31,833 | FNMA Pool #BA3885, 3.50%, 11/1/45 | 29,709 |
1,024,756 | FNMA Pool #BX7762, 5.00%, 3/1/53 | 1,013,937 |
130,806 | FNMA Pool #CA2320, 3.50%, 9/1/48 | 122,979 |
63,202 | FNMA Pool #CA5540, 3.00%, 4/1/50 | 56,618 |
716,059 | FNMA Pool #CB0856, 3.00%, 6/1/51 | 634,320 |
798,158 | FNMA Pool #CB5892, 4.50%, 3/1/53 | 773,940 |
1,043,464 | FNMA Pool #FM9834, 3.50%, 6/1/49 | 972,181 |
50,310 | FNMA Pool #MA0641, 4.00%, 2/1/31 | 49,317 |
69,323 | FNMA Pool #MA4012, 2.00%, 5/1/35 | 62,538 |
444,920 | FNMA Pool #MA4548, 2.50%, 2/1/52 | 378,677 |
779,051 | FNMA Pool #MA5106, 5.00%, 8/1/53 | 770,722 |
11,278 | FNMA REMIC Trust Series 2013-18, Series 2013-18, Class AE, 2.00%, 3/25/28 | 10,800 |
6,543 | GNMA, Series 2011-136, Class GB, 2.50%, 5/20/40 | 6,267 |
1,281,683 | GNMA, Series 2021-98, Class IG, IO, 3.00%, 6/20/51 | 203,496 |
33,254 | GNMA II Pool #5332, 4.00%, 3/20/42 | 32,594 |
122,866 | GNMA II Pool #MA3937, 3.50%, 9/20/46 | 115,607 |
113,106 | GNMA II Pool #MA7054, 3.50%, 12/20/50 | 106,204 |
121,232 | GNMA II Pool #MA7651, 3.50%, 10/20/51 | 113,058 |
401,836 | GNMA II Pool #MA8945, 4.00%, 6/20/53 | 383,417 |
864,738 | Government National Mortgage Association, MBS, 2.50%, 11/20/51 | 756,123 |
TOTAL RESIDENTIAL MORTGAGE-BACKED SECURITIES (Cost $11,338,673) | 10,612,589 | |
U.S. TREASURY OBLIGATIONS 28.4% | ||
120,000 | U.S. Treasury Bonds, 5.38%, 2/15/31 | 131,498 |
250,000 | U.S. Treasury Bonds, 4.38%, 2/15/38 | 262,695 |
650,000 | U.S. Treasury Bonds, 3.50%, 2/15/39 | 615,596 |
600,000 | U.S. Treasury Bonds, 1.13%, 5/15/40 | 386,672 |
1,000,000 | U.S. Treasury Bonds, 2.88%, 5/15/43 | 820,899 |
1,050,000 | U.S. Treasury Bonds, 3.00%, 2/15/48 | 855,627 |
1,400,000 | U.S. Treasury Bonds, 2.25%, 8/15/49 | 977,484 |
650,000 | U.S. Treasury Bonds, 2.25%, 2/15/52 | 450,582 |
1,100,000 | U.S. Treasury Notes, 2.25%, 11/15/24 | 1,075,379 |
325,000 | U.S. Treasury Notes, 3.00%, 9/30/25 | 317,510 |
575,000 | U.S. Treasury Notes, 4.50%, 7/15/26 | 580,346 |
1,906,300 | U.S. Treasury Notes, 2.25%, 8/15/27 | 1,797,879 |
450,000 | U.S. Treasury Notes, 2.75%, 2/15/28 | 430,154 |
200,000 | U.S. Treasury Notes, 3.50%, 1/31/30 | 195,602 |
300,000 | U.S. Treasury Notes, 1.50%, 2/15/30 | 261,363 |
500,000 | U.S. Treasury Notes, 1.13%, 2/15/31 | 417,363 |
525,000 | U.S. Treasury Notes, 2.75%, 8/15/32 | 480,785 |
750,000 | U.S. Treasury Notes, 3.38%, 5/15/33 | 719,766 |
TOTAL U.S. TREASURY OBLIGATIONS (Cost $11,748,024) | 10,777,200 | |
Shares | Value | |
SHORT-TERM INVESTMENTS 3.2% | ||
MONEY MARKET FUNDS 3.2% | ||
842,903 | State Street Institutional U.S. Government Money Market Fund, Premier Class, 5.32%(4) | $842,903 |
372,250 | State Street Navigator Securities Lending Government Money Market Portfolio(5) | 372,250 |
1,215,153 | ||
TOTAL SHORT-TERM INVESTMENTS (Cost $1,215,153) | 1,215,153 | |
TOTAL INVESTMENTS IN SECURITIES 100.4% (Cost $40,498,728) | $38,091,767 | |
EXCESS OF LIABILITIES OVER CASH AND OTHER ASSETS (0.4)% | (146,009 ) | |
NET ASSETS 100.0% | $37,945,758 | |
(1) | Pursuant to Rule 144A under the Securities Act of 1933, this security can only be sold to qualified institutional investors. |
(2) | Floating or variable rate security. The rate disclosed is the rate in effect as of December 31, 2023. The information in parentheses represents the benchmark and reference rate for each relevant security and the rate adjusts based upon the reference rate and spread. The security may be further subject to interest rate floor and caps. For securities which do not indicate a reference rate and spread in their descriptions, the interest rate adjusts periodically based on current interest rates and, for mortgage-backed securities, prepayments in the underlying pool of assets. |
(3) | A portion or all of the security was held on loan. As of December 31, 2023, the market value of the securities on loan was $1,168,634. |
(4) | Rate reflects 7 day yield as of December 31, 2023. |
(5) | Securities with an aggregate market value of $1,168,634 were out on loan in exchange for collateral including $372,250 of cash collateral as of December 31, 2023. The collateral was invested in a cash collateral reinvestment vehicle. |
CMT | Constant Maturity Treasury |
FHLMC | Federal Home Loan Mortgage Corp. |
FNMA | Federal National Mortgage Association. |
FREMF | Freddie Mac Multifamily. |
GNMA | Government National Mortgage Association. |
REITS | Real Estate Investment Trusts. |
REMIC | Real Estate Mortgage Investment Conduit. |
SOFR | Secured Overnight Financing Rate. |
Investments in Securities: | Level 1 | Level 2 | Level 3 | Total |
Assets | ||||
Collateralized Mortgage Obligations | $— | $890,612 | $— | $890,612 |
Commercial Mortgage-Backed Securities | — | 760,381 | — | 760,381 |
Corporate Bonds & Notes* | — | 12,965,115 | — | 12,965,115 |
Long-Term Municipal Securities* | — | 870,717 | — | 870,717 |
Residential Mortgage-Backed Securities | — | 10,612,589 | — | 10,612,589 |
U.S. Treasury Obligations | — | 10,777,200 | — | 10,777,200 |
Short-Term Investments | 1,215,153 | — | — | 1,215,153 |
Total Investments in Securities | $1,215,153 | $36,876,614 | $— | $38,091,767 |
* | See Schedule of Investments for further breakdown by category. |
Value Line Small Cap Opportunities Fund, Inc. | Value Line Mid Cap Focused Fund, Inc. | |
Assets: | ||
Investments in securities, at value* | $532,693,999 | $1,254,850,165 |
Receivable for capital shares sold | 1,582,355 | 11,679,241 |
Receivable for securities sold | 1,396,062 | — |
Dividends and interest receivable | 272,599 | 750,706 |
Prepaid expenses | 55,697 | 77,157 |
Receivable for securities lending income | 302 | 1,436 |
Total Assets | 536,001,014 | 1,267,358,705 |
Liabilities: | ||
Payable for securities purchased | 1,383,056 | 1,738,146 |
Payable for capital shares redeemed | 203,928 | 2,831,508 |
Accrued expenses: | ||
Advisory fee | 307,871 | 662,959 |
Service and distribution plan fees | 66,605 | 72,337 |
Auditing and legal fees payable | 32,420 | 58,946 |
Printing fee payable | 23,438 | 41,675 |
Transfer agent fees | 6,591 | 8,408 |
Sub-transfer agent fees | 4,715 | — |
Other | 23,988 | 80,337 |
Total Liabilities | 2,052,612 | 5,494,316 |
Commitments and contingent liabilities(1) | ||
Net Assets | $533,948,402 | $1,261,864,389 |
Net assets consist of: | ||
Capital stock, at $0.001 and $1.00 par value, respectively (authorized 300,000,000 and 50,000,000 shares, respectively) | $10,150 | $38,947,284 |
Additional paid-in capital | 296,016,668 | 895,701,519 |
Distributable Earnings/(Loss) | 237,921,584 | 327,215,586 |
Net Assets | $533,948,402 | $1,261,864,389 |
Net Asset Value Per Share | ||
Investor Class | ||
Net Assets | $321,657,771 | $424,470,885 |
Shares Outstanding | 6,184,906 | 13,165,842 |
Net Asset Value, Offering and Redemption Price per Outstanding Share | $52.01 | $32.24 |
Institutional Class | ||
Net Assets | $212,290,631 | $837,393,504 |
Shares Outstanding | 3,965,031 | 25,781,442 |
Net Asset Value, Offering and Redemption Price per Outstanding Share | $53.54 | $32.48 |
*Includes securities on loan of | $— | $10,919,581 |
Cost of investments | $288,939,611 | $928,769,842 |
(1) | See Note 5 in Notes to the Financial Statements. |
Value Line Select Growth Fund, Inc. | Value Line Larger Companies Focused Fund, Inc. | |
Assets: | ||
Investments in securities, at value* | $417,432,405 | $317,537,065 |
Dividends and interest receivable | 714,311 | 51,686 |
Prepaid expenses | 27,247 | 22,501 |
Receivable for capital shares sold | 24,393 | 348,855 |
Receivable for securities lending income | — | 1,500 |
Total Assets | 418,198,356 | 317,961,607 |
Liabilities: | ||
Payable for capital shares redeemed | 224,477 | 59,180 |
Payable upon return of securities on loan (See Note 1(K)) | — | 535,925 |
Payable for securities purchased | — | 2,948,873 |
Accrued expenses: | ||
Advisory fee | 249,778 | 180,474 |
Service and distribution plan fees | 83,139 | 62,419 |
Auditing and legal fees payable | 29,588 | 24,539 |
Transfer agent fees | 23,209 | 10,361 |
Printing fee payable | 23,175 | 16,734 |
Sub-transfer agent fees | 4,522 | 3,298 |
Directors’ fees and expenses | 2,039 | — |
Other | 24,207 | 21,172 |
Total Liabilities | 664,134 | 3,862,975 |
Commitments and contingent liabilities(1) | ||
Net Assets | $417,534,222 | $314,098,632 |
Net assets consist of: | ||
Capital stock, at $1.00 par value (authorized 100,000,000 and 50,000,000 shares, respectively) | $12,184,661 | $10,673,558 |
Additional paid-in capital | 173,052,302 | 196,468,571 |
Distributable Earnings/(Loss) | 232,297,259 | 106,956,503 |
Net Assets | $417,534,222 | $314,098,632 |
Net Asset Value Per Share | ||
Investor Class | ||
Net Assets | $397,990,382 | $304,094,481 |
Shares Outstanding | 11,621,288 | 10,339,924 |
Net Asset Value, Offering and Redemption Price per Outstanding Share | $34.25 | $29.41 |
Institutional Class | ||
Net Assets | $19,543,840 | $10,004,151 |
Shares Outstanding | 563,373 | 333,634 |
Net Asset Value, Offering and Redemption Price per Outstanding Share | $34.69 | $29.99 |
*Includes securities on loan of | $— | $9,527,742 |
Cost of investments | $198,911,708 | $203,998,439 |
(1) | See Note 5 in Notes to the Financial Statements. |
Value Line Asset Allocation Fund, Inc. | Value Line Capital Appreciation Fund, Inc. | |
Assets: | ||
Investments in securities, at value* | $947,306,829 | $454,398,381 |
Dividends and interest receivable | 3,292,286 | 1,187,910 |
Receivable for capital shares sold | 2,811,395 | 438,607 |
Prepaid expenses | 41,724 | 27,142 |
Receivable for securities lending income | 1,003 | 13,293 |
Total Assets | 953,453,237 | 456,065,333 |
Liabilities: | ||
Payable upon return of securities on loan (See Note 1(K)) | 3,823,003 | 11,680,188 |
Payable for capital shares redeemed | 603,210 | 184,942 |
Accrued expenses: | ||
Advisory fee | 506,667 | 233,876 |
Service and distribution plan fees | 81,586 | 72,457 |
Printing fee payable | 54,994 | 29,425 |
Auditing and legal fees payable | 43,864 | 29,662 |
Transfer agent fees | 22,386 | 15,737 |
Sub-transfer agent fees | 18,654 | 7,760 |
Directors’ fees and expenses | 113 | 2,271 |
Other | 35,897 | 39,935 |
Total Liabilities | 5,190,374 | 12,296,253 |
Commitments and contingent liabilities(1) | ||
Net Assets | $948,262,863 | $443,769,080 |
Net assets consist of: | ||
Capital stock, at $0.001 and $1.00 par value, respectively (authorized 300,000,000 and 75,000,000 shares, respectively) | $23,263 | $42,255,869 |
Additional paid-in capital | 653,614,736 | 327,492,920 |
Distributable Earnings/(Loss) | 294,624,864 | 74,020,291 |
Net Assets | $948,262,863 | $443,769,080 |
Net Asset Value Per Share | ||
Investor Class | ||
Net Assets | $387,503,773 | $348,141,930 |
Shares Outstanding | 9,517,278 | 33,148,019 |
Net Asset Value, Offering and Redemption Price per Outstanding Share | $40.72 | $10.50 |
Institutional Class | ||
Net Assets | $560,759,090 | $95,627,150 |
Shares Outstanding | 13,745,749 | 9,107,850 |
Net Asset Value, Offering and Redemption Price per Outstanding Share | $40.80 | $10.50 |
*Includes securities on loan of | $6,749,681 | $20,708,639 |
Cost of investments | $678,779,934 | $346,413,025 |
(1) | See Note 5 in Notes to the Financial Statements. |
Value Line Core Bond Fund | |
Assets: | |
Investments in securities, at value* | $38,091,767 |
Dividends and interest receivable | 289,372 |
Prepaid expenses | 6,805 |
Receivable for capital shares sold | 4,000 |
Receivable for securities lending income | 140 |
Total Assets | 38,392,084 |
Liabilities: | |
Payable upon return of securities on loan (See Note 1(K)) | 372,250 |
Dividends payable to shareholders | 8,842 |
Payable for capital shares redeemed | 5,965 |
Accrued expenses: | |
Printing fee payable | 14,204 |
Auditing and legal fees payable | 14,154 |
Custody and accounting fees payable | 11,878 |
Transfer agent fees | 4,987 |
Advisory fee | 4,087 |
Directors’ fees and expenses | 355 |
Other | 9,604 |
Total Liabilities | 446,326 |
Commitments and contingent liabilities(1) | |
Net Assets | $37,945,758 |
Net assets consist of: | |
Capital stock, at $0.01 par value (authorized unlimited shares) | $28,770 |
Additional paid-in capital | 43,587,916 |
Distributable Earnings/(Loss) | (5,670,928 ) |
Net Assets | $37,945,758 |
Net Asset Value Per Share | |
Investor Class | |
Net Assets | $37,945,758 |
Shares Outstanding | 2,876,983 |
Net Asset Value, Offering and Redemption Price per Outstanding Share | $13.19 |
*Includes securities on loan of | $1,168,634 |
Cost of investments | $40,498,728 |
(1) | See Note 5 in Notes to the Financial Statements. |
Value Line Small Cap Opportunities Fund, Inc. | Value Line Mid Cap Focused Fund, Inc. | |
Investment Income: | ||
Dividends (net of foreign withholding tax of $0 and $29,433, respectively) | $3,912,989 | $10,334,610 |
Securities lending income (Net) | 4,809 | 18,990 |
Total Income | 3,917,798 | 10,353,600 |
Expenses: | ||
Advisory fees | 3,250,784 | 5,393,874 |
Service and distribution plan fees | 740,432 | 834,407 |
Sub-transfer agent fees | 299,954 | 516,409 |
Auditing and legal fees | 146,934 | 262,857 |
Custody and accounting fees | 82,025 | 109,577 |
Registration and filing fees | 71,594 | 212,428 |
Transfer agent fees | 64,674 | 255,374 |
Directors’ fees and expenses | 64,164 | 116,890 |
Printing and postage fees | 39,179 | 95,124 |
Fund administration fees | 31,001 | 31,000 |
Compliance and tax service fees | 29,007 | 39,486 |
Insurance fees | 23,181 | 45,997 |
Other | 41,234 | 49,745 |
Recoupment (See Note 5) | 310 | — |
Total Expenses Before Fees Waived (See Note 5) | 4,884,473 | 7,963,168 |
Less: Fees Waived/Reimbursed by the Advisor | (76,077 ) | (18,602 ) |
Net Expenses | 4,808,396 | 7,944,566 |
Net Investment Income/(Loss) | (890,598 ) | 2,409,034 |
Net Realized and Unrealized Gain/(Loss) on Investments and Foreign Exchange Transactions: | ||
Net Realized Gain/(Loss) From: | ||
Investments in securities | (3,163,469 ) | 319,202 |
Foreign currency transactions | — | (199 ) |
(3,163,469 ) | 319,003 | |
Change in Net Unrealized Appreciation/(Depreciation) of: | ||
Investments in securities | 91,699,908 | 181,317,798 |
Net Realized Gain/(Loss) and Change in Net Unrealized Appreciation/(Depreciation) on Investments and Foreign Exchange Transactions | 88,536,439 | 181,636,801 |
Net Increase/(Decrease) in Net Assets from Operations | $87,645,841 | $184,045,835 |
Value Line Select Growth Fund, Inc. | Value Line Larger Companies Focused Fund, Inc. | |
Investment Income: | ||
Dividends (net of foreign withholding tax of $8,811 and $0, respectively) | $4,492,500 | $1,391,950 |
Securities lending income (Net) | — | 12,236 |
Total Income | 4,492,500 | 1,404,186 |
Expenses: | ||
Advisory fees | 2,749,075 | 1,875,010 |
Service and distribution plan fees | 903,559 | 633,495 |
Auditing and legal fees | 128,562 | 92,536 |
Transfer agent fees | 114,431 | 102,794 |
Sub-transfer agent fees | 90,236 | 32,542 |
Custody and accounting fees | 71,828 | 65,271 |
Registration and filing fees | 66,762 | 63,904 |
Directors’ fees and expenses | 54,834 | 33,472 |
Printing and postage fees | 37,988 | 27,482 |
Insurance fees | 34,515 | 20,518 |
Fund administration fees | 30,999 | 30,999 |
Compliance and tax service fees | 26,085 | 21,025 |
Other | 39,278 | 37,155 |
Recoupment (See Note 5) | 855 | 3,232 |
Total Expenses Before Fees Waived (See Note 5) | 4,349,007 | 3,039,435 |
Less: Fees Waived/Reimbursed by the Advisor | (28,799 ) | (70,055 ) |
Net Expenses | 4,320,208 | 2,969,380 |
Net Investment Income/(Loss) | 172,292 | (1,565,194 ) |
Net Realized and Unrealized Gain/(Loss) on Investments and Foreign Exchange Transactions: | ||
Net Realized Gain/(Loss) From: | ||
Investments in securities | 44,668,998 | 235,276 |
Foreign currency transactions | (9 ) | — |
44,668,989 | 235,276 | |
Change in Net Unrealized Appreciation/(Depreciation) of: | ||
Investments in securities | 58,069,612 | 119,054,270 |
Net Realized Gain/(Loss) and Change in Net Unrealized Appreciation/(Depreciation) on Investments and Foreign Exchange Transactions | 102,738,601 | 119,289,546 |
Net Increase/(Decrease) in Net Assets from Operations | $102,910,893 | $117,724,352 |
Value Line Asset Allocation Fund, Inc. | Value Line Capital Appreciation Fund, Inc. | |
Investment Income: | ||
Interest | $10,380,569 | $3,766,554 |
Dividends (net of foreign withholding tax of $24 and $10,647, respectively) | 9,167,556 | 3,848,014 |
Securities lending income (Net) | 18,677 | 196,401 |
Total Income | 19,566,802 | 7,810,969 |
Expenses: | ||
Advisory fees | 5,918,578 | 2,639,514 |
Service and distribution plan fees | 934,434 | 791,130 |
Sub-transfer agent fees | 533,615 | 170,112 |
Auditing and legal fees | 290,178 | 140,781 |
Transfer agent fees | 207,369 | 145,017 |
Directors’ fees and expenses | 141,235 | 60,816 |
Custody and accounting fees | 130,122 | 100,995 |
Registration and filing fees | 86,236 | 71,836 |
Printing and postage fees | 78,716 | 43,845 |
Insurance fees | 58,491 | 40,013 |
Compliance and tax service fees | 52,469 | 27,913 |
Fund administration fees | 30,999 | 31,000 |
Other | 55,438 | 42,317 |
Total Expenses Before Fees Waived (See Note 5) | 8,517,880 | 4,305,289 |
Less: Fees Waived/Reimbursed by the Advisor | — | (41,652 ) |
Net Expenses | 8,517,880 | 4,263,637 |
Net Investment Income/(Loss) | 11,048,922 | 3,547,332 |
Net Realized and Unrealized Gain/(Loss) on Investments: | ||
Net Realized Gain/(Loss) From: | ||
Investments in securities | 87,715,477 | (17,058,330 ) |
Change in Net Unrealized Appreciation/(Depreciation) of: | ||
Investments in securities | 83,142,678 | 132,715,092 |
Net Realized Gain/(Loss) and Change in Net Unrealized Appreciation/(Depreciation) on Investments | 170,858,155 | 115,656,762 |
Net Increase/(Decrease) in Net Assets from Operations | $181,907,077 | $119,204,094 |
Value Line Core Bond Fund | |
Investment Income: | |
Interest | $1,387,534 |
Dividends | 113,738 |
Securities lending income (Net) | 2,757 |
Total Income | 1,504,029 |
Expenses: | |
Advisory fees | 123,931 |
Service and distribution plan fees | 97,765 |
Custody and accounting fees | 70,918 |
Transfer agent fees | 50,559 |
Registration and filing fees | 37,275 |
Fund administration fees | 31,000 |
Auditing and legal fees | 27,220 |
Printing and postage fees | 11,373 |
Compliance and tax service fees | 10,037 |
Directors’ fees and expenses | 5,145 |
Insurance fees | 1,815 |
Other | 35,321 |
Total Expenses Before Fees Waived (See Note 5) | 502,359 |
Less: Fees Waived/Reimbursed by the Advisor | (78,228 ) |
Less: Service and Distribution Plan Fees Waived | (97,765 ) |
Net Expenses | 326,366 |
Net Investment Income/(Loss) | 1,177,663 |
Net Realized and Unrealized Gain/(Loss) on Investments: | |
Net Realized Gain/(Loss) From: | |
Investments in securities | (2,162,274 ) |
Change in Net Unrealized Appreciation/(Depreciation) of: | |
Investments in securities | 2,731,835 |
Net Realized Gain/(Loss) and Change in Net Unrealized Appreciation/(Depreciation) on Investments | 569,561 |
Net Increase/(Decrease) in Net Assets from Operations | $1,747,224 |
Value Line Small Cap Opportunities Fund, Inc. | |||
Year Ended December 31, 2023 | Period Ended December 31, 2022* | Year Ended March 31, 2022 | |
Operations: | |||
Net investment income/(loss) | $(890,598 ) | $(76,858 ) | $(2,258,286 ) |
Net realized gain/(loss) on investments and foreign currency | (3,163,469 ) | 12,566,124 | 19,499,476 |
Change in net unrealized appreciation/(depreciation) on investments | 91,699,908 | (53,121,918 ) | (31,182,773 ) |
Net increase/(decrease) in net assets from operations | 87,645,841 | (40,632,652 ) | (13,941,583 ) |
Distributions to Shareholders from: | |||
Investor Class | (2,614,949 ) | (7,459,546 ) | (21,858,560 ) |
Institutional Class | (1,588,725 ) | (2,462,064 ) | (7,681,925 ) |
(4,203,674 ) | (9,921,610 ) | (29,540,485 ) | |
Share Transactions: | |||
Proceeds from sale of shares | |||
Investor Class | 23,080,276 | 5,203,536 | 12,595,498 |
Institutional Class | 117,496,386 | 15,630,836 | 42,828,529 |
Proceeds from reinvestment of distributions to shareholders | |||
Investor Class | 2,593,186 | 7,370,018 | 21,567,199 |
Institutional Class | 1,548,328 | 2,422,886 | 7,626,154 |
Cost of shares redeemed | |||
Investor Class | (35,246,811 ) | (29,798,131 ) | (60,555,544 ) |
Institutional Class | (27,478,446 ) | (36,809,974 ) | (31,534,058 ) |
Net increase/(decrease) in net assets from capital share transactions | 81,992,919 | (35,980,829 ) | (7,472,222 ) |
Total increase/(decrease) in net assets | 165,435,086 | (86,535,091 ) | (50,954,290 ) |
Net Assets: | |||
Beginning of year | 368,513,316 | 455,048,407 | 506,002,697 |
End of year | $533,948,402 | $368,513,316 | $455,048,407 |
Capital Share Transactions: | |||
Shares sold | |||
Investor Class | 483,677 | 119,481 | 234,434 |
Institutional Class | 2,381,879 | 346,209 | 791,942 |
Shares issued to shareholders in reinvestment of distributions | |||
Investor Class | 51,067 | 166,254 | 406,698 |
Institutional Class | 29,622 | 53,239 | 140,548 |
Shares redeemed | |||
Investor Class | (747,457 ) | (680,191 ) | (1,129,530 ) |
Institutional Class | (563,699 ) | (838,716 ) | (576,331 ) |
* | For the nine month period ended December 31, 2022. |
Value Line Mid Cap Focused Fund, Inc. | Value Line Select Growth Fund, Inc. | |||
Year Ended December 31, 2023 | Year Ended December 31, 2022 | Year Ended December 31, 2023 | Year Ended December 31, 2022 | |
Operations: | ||||
Net investment income/(loss) | $2,409,034 | $889,712 | $172,292 | $(1,415,817 ) |
Net realized gain/(loss) on investments and foreign currency | 319,003 | 23,352,792 | 44,668,989 | 32,669,166 |
Change in net unrealized appreciation/(depreciation) on investments | 181,317,798 | (69,497,314 ) | 58,069,612 | (133,069,415 ) |
Net increase/(decrease) in net assets from operations | 184,045,835 | (45,254,810 ) | 102,910,893 | (101,816,066 ) |
Distributions to Shareholders from: | ||||
Investor Class | (113,528 ) | (18,517,510 ) | (36,539,060 ) | (36,873,982 ) |
Institutional Class | (1,816,376 ) | (16,342,913 ) | (1,808,302 ) | (1,192,230 ) |
(1,929,904 ) | (34,860,423 ) | (38,347,362 ) | (38,066,212 ) | |
Share Transactions: | ||||
Proceeds from sale of shares | ||||
Investor Class | 142,821,511 | 40,266,093 | 5,220,848 | 9,362,171 |
Institutional Class | 595,415,538 | 163,549,665 | 9,878,151 | 1,646,171 |
Proceeds from reinvestment of distributions to shareholders | ||||
Investor Class | 92,050 | 17,788,155 | 35,280,364 | 35,541,509 |
Institutional Class | 1,681,591 | 14,303,115 | 1,752,043 | 1,148,276 |
Cost of shares redeemed | ||||
Investor Class | (62,295,463 ) | (52,198,292 ) | (36,268,595 ) | (64,488,504 ) |
Institutional Class | (126,095,577 ) | (70,920,693 ) | (5,206,744 ) | (3,412,772 ) |
Net increase/(decrease) in net assets from capital share transactions | 551,619,650 | 112,788,043 | 10,656,067 | (20,203,149 ) |
Total increase/(decrease) in net assets | 733,735,581 | 32,672,810 | 75,219,598 | (160,085,427 ) |
Net Assets: | ||||
Beginning of year | 528,128,808 | 495,455,998 | 342,314,624 | 502,400,051 |
End of year | $1,261,864,389 | $528,128,808 | $417,534,222 | $342,314,624 |
Capital Share Transactions: | ||||
Shares sold | ||||
Investor Class | 4,938,007 | 1,456,599 | 158,664 | 264,675 |
Institutional Class | 20,515,111 | 5,931,133 | 293,538 | 48,704 |
Shares issued to shareholders in reinvestment of distributions | ||||
Investor Class | 2,846 | 651,104 | 1,033,705 | 1,189,475 |
Institutional Class | 52,583 | 519,924 | 50,681 | 38,085 |
Shares redeemed | ||||
Investor Class | (2,163,808 ) | (1,903,065 ) | (1,105,555 ) | (1,949,030 ) |
Institutional Class | (4,326,212 ) | (2,546,765 ) | (153,195 ) | (101,255 ) |
Value Line Larger Companies Focused Fund, Inc. | ||
Year Ended December 31, 2023 | Year Ended December 31, 2022 | |
Operations: | ||
Net investment income/(loss) | $(1,565,194 ) | $(780,674 ) |
Net realized gain/(loss) on investments | 235,276 | (4,928,797 ) |
Change in net unrealized appreciation/(depreciation) on investments | 119,054,270 | (136,211,646 ) |
Net increase/(decrease) in net assets from operations | 117,724,352 | (141,921,117 ) |
Distributions to Shareholders from: | ||
Investor Class | — | (25,577,632 ) |
Institutional Class | — | (504,353 ) |
— | (26,081,985 ) | |
Share Transactions: | ||
Proceeds from sale of shares | ||
Investor Class | 15,087,152 | 2,018,071 |
Institutional Class | 5,296,495 | 1,349,644 |
Proceeds from reinvestment of distributions to shareholders | ||
Investor Class | 929 | 24,534,042 |
Institutional Class | — | 504,353 |
Cost of shares redeemed | ||
Investor Class | (26,501,619 ) | (29,153,077 ) |
Institutional Class | (2,190,836 ) | (2,978,782 ) |
Net increase/(decrease) in net assets from capital share transactions | (8,307,879 ) | (3,725,749 ) |
Total increase/(decrease) in net assets | 109,416,473 | (171,728,851 ) |
Net Assets: | ||
Beginning of year | 204,682,159 | 376,411,010 |
End of year | $314,098,632 | $204,682,159 |
Capital Share Transactions: | ||
Shares sold | ||
Investor Class | 577,865 | 80,218 |
Institutional Class | 203,791 | 47,853 |
Shares issued to shareholders in reinvestment of distributions | ||
Investor Class | 44 | 1,251,795 |
Institutional Class | — | 25,306 |
Shares redeemed | ||
Investor Class | (1,088,062 ) | (1,182,637 ) |
Institutional Class | (87,129 ) | (107,126 ) |
Value Line Asset Allocation Fund, Inc. | |||
Year Ended December 31, 2023 | Period Ended December 31, 2022* | Year Ended March 31, 2022 | |
Operations: | |||
Net investment income/(loss) | $11,048,922 | $5,029,611 | $4,088,777 |
Net realized gain/(loss) on investments and foreign currency | 87,715,477 | 30,602,944 | 100,796,731 |
Change in net unrealized appreciation/(depreciation) on investments | 83,142,678 | (159,997,607 ) | (5,767,838 ) |
Net increase/(decrease) in net assets from operations | 181,907,077 | (124,365,052 ) | 99,117,670 |
Distributions to Shareholders from: | |||
Investor Class | (35,390,413 ) | (21,445,941 ) | (36,991,741 ) |
Institutional Class | (51,976,292 ) | (36,399,992 ) | (78,180,633 ) |
(87,366,705 ) | (57,845,933 ) | (115,172,374 ) | |
Share Transactions: | |||
Proceeds from sale of shares | |||
Investor Class | 16,883,889 | 11,349,157 | 74,629,812 |
Institutional Class | 61,530,093 | 55,211,793 | 255,362,228 |
Proceeds from reinvestment of distributions to shareholders | |||
Investor Class | 34,071,801 | 20,629,146 | 35,510,337 |
Institutional Class | 50,629,390 | 35,347,148 | 76,064,513 |
Cost of shares redeemed | |||
Investor Class | (73,040,376 ) | (93,642,302 ) | (232,929,799 ) |
Institutional Class | (183,840,916 ) | (318,901,827 ) | (559,927,173 ) |
Net increase/(decrease) in net assets from capital share transactions | (93,766,119 ) | (290,006,885 ) | (351,290,082 ) |
Total increase/(decrease) in net assets | 774,253 | (472,217,870 ) | (367,344,786 ) |
Net Assets: | |||
Beginning of year | 947,488,610 | 1,419,706,480 | 1,787,051,266 |
End of year | $948,262,863 | $947,488,610 | $1,419,706,480 |
Capital Share Transactions: | |||
Shares sold | |||
Investor Class | 421,586 | 290,616 | 1,628,720 |
Institutional Class | 1,536,582 | 1,410,469 | 5,536,165 |
Shares issued to shareholders in reinvestment of distributions | |||
Investor Class | 839,414 | 543,731 | 783,720 |
Institutional Class | 1,245,189 | 930,188 | 1,676,134 |
Shares redeemed | |||
Investor Class | (1,837,383 ) | (2,407,154 ) | (5,153,267 ) |
Institutional Class | (4,614,074 ) | (8,223,343 ) | (12,705,212 ) |
* | For the nine month period ended December 31, 2022. |
Value Line Capital Appreciation Fund, Inc. | ||
Year Ended December 31, 2023 | Year Ended December 31, 2022 | |
Operations: | ||
Net investment income/(loss) | $3,547,332 | $2,252,772 |
Net realized gain/(loss) on investments | (17,058,330 ) | (8,895,638 ) |
Change in net unrealized appreciation/(depreciation) on investments | 132,715,092 | (185,679,014 ) |
Net increase/(decrease) in net assets from operations | 119,204,094 | (192,321,880 ) |
Distributions to Shareholders from: | ||
Investor Class | (2,594,556 ) | (28,673,244 ) |
Institutional Class | (922,424 ) | (8,788,632 ) |
(3,516,980 ) | (37,461,876 ) | |
Share Transactions: | ||
Proceeds from sale of shares | ||
Investor Class | 42,099,683 | 11,383,375 |
Institutional Class | 29,251,689 | 35,326,737 |
Proceeds from reinvestment of distributions to shareholders | ||
Investor Class | 2,421,837 | 27,086,503 |
Institutional Class | 895,321 | 8,509,001 |
Cost of shares redeemed | ||
Investor Class | (64,132,807 ) | (100,093,807 ) |
Institutional Class | (41,161,891 ) | (86,597,207 ) |
Net increase/(decrease) in net assets from capital share transactions | (30,626,168 ) | (104,385,398 ) |
Total increase/(decrease) in net assets | 85,060,946 | (334,169,154 ) |
Net Assets: | ||
Beginning of year | 358,708,134 | 692,877,288 |
End of year | $443,769,080 | $358,708,134 |
Capital Share Transactions: | ||
Shares sold | ||
Investor Class | 4,533,441 | 1,088,702 |
Institutional Class | 3,221,824 | 3,442,690 |
Shares issued to shareholders in reinvestment of distributions | ||
Investor Class | 235,358 | 3,275,272 |
Institutional Class | 87,009 | 1,028,900 |
Shares redeemed | ||
Investor Class | (6,948,162 ) | (10,068,016 ) |
Institutional Class | (4,480,277 ) | (9,074,155 ) |
Value Line Core Bond Fund | ||
Year Ended December 31, 2023 | Year Ended December 31, 2022 | |
Operations: | ||
Net investment income/(loss) | $1,177,663 | $716,220 |
Net realized gain/(loss) on investments | (2,162,274 ) | (1,033,581 ) |
Change in net unrealized appreciation/(depreciation) on investments | 2,731,835 | (5,907,025 ) |
Net increase/(decrease) in net assets from operations | 1,747,224 | (6,224,386 ) |
Distributions to Shareholders from: | ||
Investor Class | (1,164,055 ) | (762,097 ) |
Share Transactions (Investor Class): | ||
Proceeds from sale of shares | 264,022 | 1,182,592 |
Proceeds from reinvestment of distributions to shareholders | 1,066,590 | 703,071 |
Cost of shares redeemed | (4,714,059 ) | (4,420,589 ) |
Net increase/(decrease) in net assets from capital share transactions | (3,383,447 ) | (2,534,926 ) |
Total decrease in net assets | (2,800,278 ) | (9,521,409 ) |
Net Assets: | ||
Beginning of year | 40,746,036 | 50,267,445 |
End of year | $37,945,758 | $40,746,036 |
Capital Share Transactions (Investor Class): | ||
Shares sold | 20,369 | 82,203 |
Shares issued to shareholders in reinvestment of dividends | 82,476 | 52,082 |
Shares redeemed | (365,131 ) | (320,808 ) |
Value Line Small Cap Opportunities Fund, Inc. Investor Class | ||||||
Year Ended December 31, | Period Ended December 31, | Year Ended March 31, | ||||
2023 | 2022* | 2022 | 2021 | 2020 | 2019 | |
Net asset value, beginning of year | $42.99 | $48.36 | $53.12 | $34.69 | $48.31 | $51.99 |
Income/(loss) from investment operations: | ||||||
Net investment income/(loss) | (0.14 )(1) | (0.03 )(1) | (0.28 )(1) | (0.22 )(1) | (0.12 )(1) | (0.02 ) |
Net gains/(losses) on securities (both realized and unrealized) | 9.59 | (4.15 ) | (1.21 ) | 22.68 | (3.34 ) | 3.09 |
Total from investment operations | 9.45 | (4.18 ) | (1.49 ) | 22.46 | (3.46 ) | 3.07 |
Less distributions: | ||||||
Distributions from net realized gains | (0.43 ) | (1.19 ) | (3.27 ) | (4.03 ) | (10.16 ) | (6.75 ) |
Total distributions | (0.43 ) | (1.19 ) | (3.27 ) | (4.03 ) | (10.16 ) | (6.75 ) |
Net asset value, end of year | $52.01 | $42.99 | $48.36 | $53.12 | $34.69 | $48.31 |
Total return | 22.00 % | (8.73 )%(2) | (3.34 )% | 65.92 % | (11.25 )% | 7.80 % |
Ratios/Supplemental Data: | ||||||
Net assets, end of year (in thousands) | $321,658 | $275,060 | $328,455 | $386,766 | $297,244 | $400,688 |
Ratio of expenses to average net assets | 1.18 % | 1.18 %(3) | 1.16 % | 1.18 % | 1.19 % | 1.21 % |
Ratio of net investment income/(loss) to average net assets | (0.30 )% | (0.09 )%(3) | (0.52 )% | (0.48 )% | (0.25 )% | (0.24 )% |
Portfolio turnover rate | 11 % | 4 %(2) | 3 % | 4 % | 18 % | 20 % |
Value Line Small Cap Opportunities Fund, Inc. Institutional Class | ||||||
Year Ended December 31, | Period Ended December 31, | Year Ended March 31, | ||||
2023 | 2022* | 2022 | 2021 | 2020 | 2019 | |
Net asset value, beginning of year | $44.14 | $49.52 | $54.19 | $35.25 | $48.83 | $52.34 |
Income/(loss) from investment operations: | ||||||
Net investment income/(loss) | (0.01 )(1) | 0.05 (1) | (0.14 )(1) | (0.10 )(1) | 0.00 (1)(4) | (0.02 ) |
Net gains/(losses) on securities (both realized and unrealized) | 9.84 | (4.24 ) | (1.26 ) | 23.07 | (3.42 ) | 3.26 |
Total from investment operations | 9.83 | (4.19 ) | (1.40 ) | 22.97 | (3.42 ) | 3.24 |
Less distributions: | ||||||
Distributions from net realized gains | (0.43 ) | (1.19 ) | (3.27 ) | (4.03 ) | (10.16 ) | (6.75 ) |
Total distributions | (0.43 ) | (1.19 ) | (3.27 ) | (4.03 ) | (10.16 ) | (6.75 ) |
Net asset value, end of year | $53.54 | $44.14 | $49.52 | $54.19 | $35.25 | $48.83 |
Total return | 22.29 % | (8.54 )%(2) | (3.10 )% | 66.33 % | (11.03 )% | 8.09 % |
Ratios/Supplemental Data: | ||||||
Net assets, end of year (in thousands) | $212,291 | $93,453 | $126,593 | $119,237 | $42,287 | $48,783 |
Ratio of gross expenses to average net assets | 0.98 % | 0.99 %(3) | 0.95 % | 0.96 % | 1.00 % | 1.02 % |
Ratio of net expenses to average net assets | 0.93 % | 0.93 %(3) | 0.91 % | 0.93 % | 0.94 % | 0.96 % |
Ratio of net investment income/(loss) to average net assets | (0.01 )% | 0.15 %(3) | (0.25 )% | (0.21 )% | 0.00 %(4) | 0.02 % |
Portfolio turnover rate | 11 % | 4 %(2) | 3 % | 4 % | 18 % | 20 % |
* | For the nine month period ended December 31, 2022. |
(1) | Per share amounts are calculated based on average shares outstanding during the year. |
(2) | Not annualized. |
(3) | Annualized. |
(4) | Amount is less than $0.01 per share. |
Value Line Mid Cap Focused Fund, Inc. Investor Class | |||||
Years Ended December 31, | |||||
2023 | 2022 | 2021 | 2020 | 2019 | |
Net asset value, beginning of year | $26.41 | $31.24 | $28.29 | $25.49 | $19.11 |
Income/(loss) from investment operations: | |||||
Net investment income/(loss)(1) | 0.04 | 0.03 | 0.10 (2) | (0.12 ) | 0.06 (3) |
Net gains/(losses) on securities (both realized and unrealized) | 5.80 | (2.96 ) | 5.42 | 5.13 | 6.68 |
Total from investment operations | 5.84 | (2.93 ) | 5.52 | 5.01 | 6.74 |
Less distributions: | |||||
Dividends from net investment income | (0.01 ) | (0.03 ) | — | (0.02 ) | (0.00 )(4) |
Distributions from net realized gains | — | (1.87 ) | (2.57 ) | (2.19 ) | (0.36 ) |
Total distributions | (0.01 ) | (1.90 ) | (2.57 ) | (2.21 ) | (0.36 ) |
Net asset value, end of year | $32.24 | $26.41 | $31.24 | $28.29 | $25.49 |
Total return | 22.11 % | (9.56 )% | 19.88 % | 19.96 % | 35.30 % |
Ratios/Supplemental Data: | |||||
Net assets, end of year (in thousands) | $424,471 | $274,371 | $318,184 | $332,898 | $373,341 |
Ratio of expenses to average net assets | 1.08 % | 1.07 % | 1.07 % | 1.10 % | 1.11 % |
Ratio of net investment income/(loss) to average net assets | 0.12 % | 0.10 % | 0.33 %(2) | (0.46 )% | 0.27 %(3) |
Portfolio turnover rate | 1 % | 13 % | 0 %(5) | 4 % | 19 % |
Value Line Mid Cap Focused Fund, Inc. Institutional Class | |||||
Years Ended December 31, | |||||
2023 | 2022 | 2021 | 2020 | 2019 | |
Net asset value, beginning of year | $26.60 | $31.46 | $28.39 | $25.59 | $19.17 |
Income/(loss) from investment operations: | |||||
Net investment income/(loss)(1) | 0.12 | 0.10 | 0.19 (2) | (0.04 ) | 0.20 (3) |
Net gains/(losses) on securities (both realized and unrealized) | 5.83 | (2.98 ) | 5.45 | 5.14 | 6.64 |
Total from investment operations | 5.95 | (2.88 ) | 5.64 | 5.10 | 6.84 |
Less distributions: | |||||
Dividends from net investment income | (0.07 ) | (0.11 ) | — | (0.11 ) | (0.06 ) |
Distributions from net realized gains | — | (1.87 ) | (2.57 ) | (2.19 ) | (0.36 ) |
Total distributions | (0.07 ) | (1.98 ) | (2.57 ) | (2.30 ) | (0.42 ) |
Net asset value, end of year | $32.48 | $26.60 | $31.46 | $28.39 | $25.59 |
Total return | 22.38 % | (9.35 )% | 20.24 % | 20.24 % | 35.68 % |
Ratios/Supplemental Data: | |||||
Net assets, end of year (in thousands) | $837,394 | $253,758 | $177,272 | $138,967 | $41,459 |
Ratio of gross expenses to average net assets | 0.87 % | 0.86 % | 0.86 % | 0.89 % | 1.04 % |
Ratio of net expenses to average net assets | 0.87 % | 0.82 % | 0.82 % | 0.85 % | 0.86 % |
Ratio of net investment income/(loss) to average net assets | 0.40 % | 0.35 % | 0.63 %(2) | (0.15 )% | 0.81 %(3) |
Portfolio turnover rate | 1 % | 13 % | 0 %(5) | 4 % | 19 % |
(1) | Per share amounts are calculated based on average shares outstanding during the year. |
(2) | Includes income resulting from special dividends. For the year ended December 31, 2021, without these dividends, the per share value for the Investor Class and Institutional Class would have been $(0.18) and $(0.09), respectively, and the ratio for the Investor Class and Institutional Class would have been (0.59)% and (0.30)%, respectively. |
(3) | Includes income resulting from special dividends. For the year ended December 31, 2019, without these dividends, the per share value for the Investor Class and Institutional Class would have been $(0.08) and $0.05, respectively, and the ratio for the Investor Class and Institutional Class would have been (0.33)% and 0.22%, respectively. |
(4) | Amount is less than $0.01 per share. |
(5) | Amount is less than 0.50%. |
Value Line Select Growth Fund, Inc. Investor Class | |||||
Years Ended December 31, | |||||
2023 | 2022 | 2021 | 2020 | 2019 | |
Net asset value, beginning of year | $28.74 | $40.46 | $37.49 | $38.93 | $30.47 |
Income/(loss) from investment operations: | |||||
Net investment income/(loss)(1) | 0.01 | (0.12 ) | (0.25 ) | (0.17 ) | (0.05 ) |
Net gains/(losses) on securities (both realized and unrealized) | 8.92 | (8.11 ) | 9.08 | 8.91 | 11.16 |
Total from investment operations | 8.93 | (8.23 ) | 8.83 | 8.74 | 11.11 |
Less distributions: | |||||
Distributions from net realized gains | (3.42 ) | (3.49 ) | (5.86 ) | (10.18 ) | (2.65 ) |
Total distributions | (3.42 ) | (3.49 ) | (5.86 ) | (10.18 ) | (2.65 ) |
Net asset value, end of year | $34.25 | $28.74 | $40.46 | $37.49 | $38.93 |
Total return | 31.11 % | (20.67 )% | 24.16 % | 23.12 % | 36.59 % |
Ratios/Supplemental Data: | |||||
Net assets, end of year (in thousands) | $397,990 | $331,514 | $486,661 | $451,806 | $486,392 |
Ratio of expenses to average net assets | 1.16 % | 1.13 % | 1.13 % | 1.16 % | 1.16 % |
Ratio of net investment income/(loss) to average net assets | 0.03 % | (0.37 )% | (0.62 )% | (0.43 )% | (0.12 )% |
Portfolio turnover rate | 14 % | 6 % | 3 % | 12 % | 17 % |
Value Line Select Growth Fund, Inc. Institutional Class | ||||
Year Ended December 31, | Period Ended December 31, | |||
2023 | 2022 | 2021 | 2020(2) | |
Net asset value, beginning of year | $29.01 | $40.69 | $37.58 | $36.44 |
Income/(loss) from investment operations: | ||||
Net investment income/(loss)(1) | 0.12 | (0.04 ) | (0.15 ) | 0.02 |
Net gains/(losses) on securities (both realized and unrealized) | 8.98 | (8.15 ) | 9.12 | 11.30 |
Total from investment operations | 9.10 | (8.19 ) | 8.97 | 11.32 |
Less distributions: | ||||
Distributions from net realized gains | (3.42 ) | (3.49 ) | (5.86 ) | (10.18 ) |
Total distributions | (3.42 ) | (3.49 ) | (5.86 ) | (10.18 ) |
Net asset value, end of year | $34.69 | $29.01 | $40.69 | $37.58 |
Total return | 31.41 % | (20.45 )% | 24.47 % | 31.78 %(3) |
Ratios/Supplemental Data: | ||||
Net assets, end of year (in thousands) | $19,544 | $10,801 | $15,739 | $11,963 |
Ratio of gross expenses to average net assets | 1.10 % | 1.11 % | 1.04 % | 1.96 %(4) |
Ratio of net expenses to average net assets | 0.91 % | 0.88 % | 0.88 % | 0.91 %(4) |
Ratio of net investment income/(loss) to average net assets | 0.36 % | (0.12 )% | (0.37 )% | 0.08 %(4) |
Portfolio turnover rate | 14 % | 6 % | 3 % | 12 %(3) |
(1) | Per share amounts are calculated based on average shares outstanding during the year. |
(2) | Commenced operations on May 1, 2020. |
(3) | Not annualized. |
(4) | Annualized. |
Value Line Larger Companies Focused Fund, Inc. Investor Class | |||||
Years Ended December 31, | |||||
2023 | 2022 | 2021 | 2020 | 2019 | |
Net asset value, beginning of year | $18.49 | $34.36 | $38.35 | $28.87 | $25.34 |
Income/(loss) from investment operations: | |||||
Net investment income/(loss)(1) | (0.15 ) | (0.08 ) | (0.35 ) | (0.29 ) | (0.23 ) |
Net gains/(losses) on securities (both realized and unrealized) | 11.07 | (13.17 ) | 1.29 | 13.42 | 6.64 |
Total from investment operations | 10.92 | (13.25 ) | 0.94 | 13.13 | 6.41 |
Less distributions: | |||||
Distributions from net realized gains | — | (2.62 ) | (4.93 ) | (3.65 ) | (2.88 ) |
Total distributions | — | (2.62 ) | (4.93 ) | (3.65 ) | (2.88 ) |
Net asset value, end of year | $29.41 | $18.49 | $34.36 | $38.35 | $28.87 |
Total return | 59.06 % | (38.99 )% | 2.89 % | 45.98 % | 25.67 % |
Ratios/Supplemental Data: | |||||
Net assets, end of year (in thousands) | $304,094 | $200,602 | $367,681 | $394,389 | $291,057 |
Ratio of gross expenses to average net assets | 1.16 % | 1.14 % | 1.14 % | 1.15 % | 1.16 % |
Ratio of net expenses to average net assets | 1.15 % | 1.14 % | 1.14 % | 1.15 % | 1.15 % |
Ratio of net investment income/(loss) to average net assets | (0.61 )% | (0.30 )% | (0.87 )% | (0.86 )% | (0.78 )% |
Portfolio turnover rate | 29 % | 58 % | 27 % | 54 % | 29 % |
Value Line Larger Companies Focused Fund, Inc. Institutional Class | |||||
Years Ended December 31, | |||||
2023 | 2022 | 2021 | 2020 | 2019 | |
Net asset value, beginning of year | $18.80 | $34.79 | $38.68 | $29.03 | $25.41 |
Income/(loss) from investment operations: | |||||
Net investment income/(loss)(1) | (0.09 ) | (0.02 ) | (0.26 ) | (0.21 ) | (0.15 ) |
Net gains/(losses) on securities (both realized and unrealized) | 11.28 | (13.35 ) | 1.30 | 13.51 | 6.65 |
Total from investment operations | 11.19 | (13.37 ) | 1.04 | 13.30 | 6.50 |
Less distributions: | |||||
Distributions from net realized gains | — | (2.62 ) | (4.93 ) | (3.65 ) | (2.88 ) |
Total distributions | — | (2.62 ) | (4.93 ) | (3.65 ) | (2.88 ) |
Net asset value, end of year | $29.99 | $18.80 | $34.79 | $38.68 | $29.03 |
Total return | 59.52 % | (38.85 )% | 3.12 % | 46.36 % | 25.92 % |
Ratios/Supplemental Data: | |||||
Net assets, end of year (in thousands) | $10,004 | $4,080 | $8,730 | $6,519 | $2,054 |
Ratio of gross expenses to average net assets | 1.45 % | 1.25 % | 1.36 % | 1.80 % | 2.75 % |
Ratio of net expenses to average net assets | 0.90 % | 0.89 % | 0.90 % | 0.90 % | 0.90 % |
Ratio of net investment income/(loss) to average net assets | (0.38 )% | (0.06 )% | (0.63 )% | (0.62 )% | (0.50 )% |
Portfolio turnover rate | 29 % | 58 % | 27 % | 54 % | 29 % |
(1) | Per share amounts are calculated based on average shares outstanding during the year. |
Value Line Asset Allocation Fund, Inc. Investor Class | ||||||
Year Ended December 31, | Period Ended December 31, | Year Ended March 31, | ||||
2023 | 2022* | 2022 | 2021 | 2020 | 2019 | |
Net asset value, beginning of year | $36.87 | $42.79 | $43.14 | $34.72 | $35.07 | $31.95 |
Income/(loss) from investment operations: | ||||||
Net investment income/(loss) | 0.42 (1) | 0.13 (1) | 0.03 (1) | 0.00 (1)(2) | 0.20 (1) | 0.14 |
Net gains/(losses) on securities (both realized and unrealized) | 7.46 | (3.84 ) | 2.59 | 8.65 | 0.12 | 3.95 |
Total from investment operations | 7.88 | (3.71 ) | 2.62 | 8.65 | 0.32 | 4.09 |
Less distributions: | ||||||
Dividends from net investment income | (0.44 ) | (0.33 ) | (0.01 ) | (0.01 ) | (0.16 ) | (0.13 ) |
Distributions from net realized gains | (3.59 ) | (1.88 ) | (2.96 ) | (0.22 ) | (0.51 ) | (0.84 ) |
Total distributions | (4.03 ) | (2.21 ) | (2.97 ) | (0.23 ) | (0.67 ) | (0.97 ) |
Net asset value, end of year | $40.72 | $36.87 | $42.79 | $43.14 | $34.72 | $35.07 |
Total return | 21.39 % | (8.81 )%(3) | 5.70 % | 24.93 % | 0.75 % | 13.17 % |
Ratios/Supplemental Data: | ||||||
Net assets, end of year (in thousands) | $387,504 | $372,165 | $499,220 | $621,482 | $600,102 | $384,222 |
Ratio of gross expenses to average net assets | 1.06 % | 1.04 %(4) | 1.02 % | 1.03 % | 1.08 % | 1.12 % |
Ratio of net investment income/(loss) to average net assets | 1.06 % | 0.45 %(4) | 0.07 % | 0.01 % | 0.54 % | 0.46 % |
Portfolio turnover rate | 29 % | 37 %(3) | 14 % | 19 % | 16 % | 19 % |
Value Line Asset Allocation Fund, Inc. Institutional Class | ||||||
Year Ended December 31, | Period Ended December 31, | Year Ended March 31, | ||||
2023 | 2022* | 2022 | 2021 | 2020 | 2019 | |
Net asset value, beginning of year | $36.93 | $42.89 | $43.24 | $34.82 | $35.16 | $32.03 |
Income/(loss) from investment operations: | ||||||
Net investment income/(loss) | 0.51 (1) | 0.20 (1) | 0.15 (1) | 0.11 (1) | 0.30 (1) | 0.19 |
Net gains/(losses) on securities (both realized and unrealized) | 7.49 | (3.85 ) | 2.61 | 8.68 | 0.11 | 4.00 |
Total from investment operations | 8.00 | (3.65 ) | 2.76 | 8.79 | 0.41 | 4.19 |
Less distributions: | ||||||
Dividends from net investment income | (0.54 ) | (0.43 ) | (0.15 ) | (0.15 ) | (0.24 ) | (0.22 ) |
Distributions from net realized gains | (3.59 ) | (1.88 ) | (2.96 ) | (0.22 ) | (0.51 ) | (0.84 ) |
Total distributions | (4.13 ) | (2.31 ) | (3.11 ) | (0.37 ) | (0.75 ) | (1.06 ) |
Net asset value, end of year | $40.80 | $36.93 | $42.89 | $43.24 | $34.82 | $35.16 |
Total return | 21.68 % | (8.65 )%(3) | 5.98 % | 25.24 % | 0.99 % | 13.49 % |
Ratios/Supplemental Data: | ||||||
Net assets, end of year (in thousands) | $560,759 | $575,324 | $920,487 | $1,165,569 | $500,103 | $160,075 |
Ratio of gross expenses to average net assets | 0.82 % | 0.81 %(4) | 0.77 % | 0.78 % | 0.84 % | 0.88 % |
Ratio of net expenses to average net assets | 0.82 % | 0.80 %(4) | 0.77 % | 0.78 % | 0.83 % | 0.87 % |
Ratio of net investment income/(loss) to average net assets | 1.28 % | 0.68 %(4) | 0.32 % | 0.26 % | 0.80 % | 0.74 % |
Portfolio turnover rate | 29 % | 37 %(3) | 14 % | 19 % | 16 % | 19 % |
* | For the nine month period ended December 31, 2022. |
(1) | Per share amounts are calculated based on average shares outstanding during the year. |
(2) | Amount is less than $0.01 per share. |
(3) | Not annualized. |
(4) | Annualized. |
Value Line Capital Appreciation Fund, Inc. Investor Class | |||||
Years Ended December 31, | |||||
2023 | 2022 | 2021 | 2020 | 2019 | |
Net asset value, beginning of year | $7.87 | $12.39 | $12.90 | $10.25 | $8.94 |
Income/(loss) from investment operations: | |||||
Net investment income/(loss)(1) | 0.08 | 0.04 | (0.05 ) | (0.03 ) | (0.01 ) |
Net gains/(losses) on securities (both realized and unrealized) | 2.63 | (3.69 ) | 0.88 | 3.39 | 2.32 (2) |
Total from investment operations | 2.71 | (3.65 ) | 0.83 | 3.36 | 2.31 |
Less distributions: | |||||
Dividends from net investment income | (0.08 ) | (0.05 ) | (0.00 )(3) | — | — |
Distributions from net realized gains | — | (0.82 ) | (1.34 ) | (0.71 ) | (1.00 ) |
Total distributions | (0.08 ) | (0.87 ) | (1.34 ) | (0.71 ) | (1.00 ) |
Net asset value, end of year | $10.50 | $7.87 | $12.39 | $12.90 | $10.25 |
Total return | 34.44 % | (29.83 )% | 6.79 % | 33.03 % | 26.14 % |
Ratios/Supplemental Data: | |||||
Net assets, end of year (in thousands) | $348,142 | $277,895 | $508,549 | $560,243 | $427,619 |
Ratio of expenses to average net assets | 1.10 % | 1.07 % | 1.05 % | 1.07 % | 1.09 % |
Ratio of net investment income/(loss) to average net assets | 0.81 % | 0.39 % | (0.35 )% | (0.28 )% | (0.08 )% |
Portfolio turnover rate | 52 % | 56 % | 39 % | 51 % | 34 % |
Value Line Capital Appreciation Fund, Inc. Institutional Class | |||||
Years Ended December 31, | |||||
2023 | 2022 | 2021 | 2020 | 2019 | |
Net asset value, beginning of year | $7.86 | $12.39 | $12.90 | $10.22 | $8.89 |
Income/(loss) from investment operations: | |||||
Net investment income/(loss)(1) | 0.10 | 0.06 | (0.01 ) | (0.01 ) | 0.02 |
Net gains/(losses) on securities (both realized and unrealized) | 2.64 | (3.70 ) | 0.88 | 3.40 | 2.31 (2) |
Total from investment operations | 2.74 | (3.64 ) | 0.87 | 3.39 | 2.33 |
Less distributions: | |||||
Dividends from net investment income | (0.10 ) | (0.07 ) | (0.04 ) | — | — |
Distributions from net realized gains | — | (0.82 ) | (1.34 ) | (0.71 ) | (1.00 ) |
Total distributions | (0.10 ) | (0.89 ) | (1.38 ) | (0.71 ) | (1.00 ) |
Net asset value, end of year | $10.50 | $7.86 | $12.39 | $12.90 | $10.22 |
Total return | 34.91 % | (29.74 )% | 7.13 % | 33.42 % | 26.51 % |
Ratios/Supplemental Data: | |||||
Net assets, end of year (in thousands) | $95,627 | $80,814 | $184,329 | $121,927 | $31,858 |
Ratio of gross expenses to average net assets | 0.89 % | 0.86 % | 0.86 % | 0.89 % | 0.97 % |
Ratio of net expenses to average net assets | 0.85 % | 0.82 % | 0.80 % | 0.82 % | 0.84 % |
Ratio of net investment income/(loss) to average net assets | 1.06 % | 0.64 % | (0.10 )% | (0.06 )% | 0.17 % |
Portfolio turnover rate | 52 % | 56 % | 39 % | 51 % | 34 % |
(1) | Per share amounts are calculated based on average shares outstanding during the year. |
(2) | Amount includes a non-recurring settlement paid by the Fund related to Legal Proceedings. The settlement payment impacted the realized (loss) per share by less than $0.01 per share for Investor and Institutional class. Total return was not impacted. |
(3) | Amount is less than $0.01 per share. |
Value Line Core Bond Fund Investor Class | |||||
Years Ended December 31, | |||||
2023 | 2022 | 2021 | 2020 | 2019 | |
Net asset value, beginning of year | $12.98 | $15.11 | $15.84 | $15.26 | $14.40 |
Income/(loss) from investment operations: | |||||
Net investment income/(loss) | 0.39 (1) | 0.22 (1) | 0.19 (1) | 0.25 (1) | 0.36 |
Net gains/(losses) on securities (both realized and unrealized) | 0.21 | (2.11 ) | 0.53 | 0.63 | 0.86 |
Total from investment operations | 0.60 | (1.89 ) | 0.34 | 0.88 | 1.22 |
Less distributions: | |||||
Dividends from net investment income | (0.39 ) | (0.24 ) | (0.23 ) | (0.30 ) | (0.36 ) |
Distributions from net realized gains | — | — | (0.16 ) | — | — |
Total distributions | (0.39 ) | (0.24 ) | (0.39 ) | (0.30 ) | (0.36 ) |
Net asset value, end of year | $13.19 | $12.98 | $15.11 | $15.84 | $15.26 |
Total return | 4.72 % | (12.58 )% | (2.18 )% | 5.77 % | 8.51 % |
Ratios/Supplemental Data: | |||||
Net assets, end of year (in thousands) | $37,946 | $40,746 | $50,267 | $53,854 | $53,976 |
Ratio of gross expenses to average net assets | 1.28 % | 1.20 % | 1.23 % | 1.19 % | 1.14 % |
Ratio of net expenses to average net assets | 0.83 % | 0.90 % | 0.90 % | 0.90 % | 0.93 % |
Ratio of net investment income/(loss) to average net assets | 3.01 % | 1.62 % | 1.25 % | 1.62 % | 2.26 % |
Portfolio turnover rate | 50 % | 37 % | 71 % | 70 % | 39 % |
(1) | Per share amounts are calculated based on average shares outstanding during the year. |
Fund | Investment Goal |
Value Line Small Cap Opportunities Fund, Inc. | The Fund seeks long-term capital growth. |
Value Line Mid Cap Focused Fund, Inc. | The Fund seeks long-term capital growth. |
Value Line Select Growth Fund, Inc. | The Fund seeks long-term capital growth. |
Value Line Larger Companies Focused Fund, Inc. | The Fund seeks long-term capital growth. |
Value Line Asset Allocation Fund, Inc. | The Fund seeks high total investment return. |
Value Line Capital Appreciation Fund, Inc. | The Fund seeks capital appreciation and income. |
Value Line Core Bond Fund | The Fund seeks to maximize current income and secondarily capital appreciation. |
Investor Class | Institutional Class | Total | |
Value Line Small Cap Opportunities Fund, Inc. | |||
Transfer agent fees | $38,159 | $26,515 | $64,674 |
Sub-transfer agent fees | 173,086 | 126,868 | 299,954 |
Registration and filing fees | 28,258 | 37,689 | 65,947 |
Other | 27,928 | 13,306 | 41,234 |
Investor Class | Institutional Class | Total | |
Value Line Mid Cap Focused Fund, Inc. | |||
Transfer agent fees | $99,779 | $155,595 | $255,374 |
Sub-transfer agent fees | 139,020 | 377,389 | 516,409 |
Registration and filing fees | 74,724 | 131,098 | 205,822 |
Other | 20,103 | 29,642 | 49,745 |
Investor Class | Institutional Class | Total | |
Value Line Select Growth Fund, Inc. | |||
Transfer agent fees | $114,431 | $— | $114,431 |
Sub-transfer agent fees | 82,295 | 7,941 | 90,236 |
Registration and filing fees | 32,624 | 28,774 | 61,398 |
Other | 37,008 | 2,270 | 39,278 |
Investor Class | Institutional Class | Total | |
Value Line Larger Companies Focused Fund, Inc. | |||
Transfer agent fees | $99,967 | $2,827 | $102,794 |
Sub-transfer agent fees | 27,527 | 5,015 | 32,542 |
Registration and filing fees | 32,478 | 28,272 | 60,750 |
Other | 35,513 | 1,642 | 37,155 |
Investor Class | Institutional Class | Total | |
Value Line Asset Allocation Fund, Inc. | |||
Transfer agent fees | $70,805 | $136,564 | $207,369 |
Sub-transfer agent fees | 198,120 | 335,495 | 533,615 |
Registration and filing fees | 29,566 | 41,543 | 71,109 |
Other | 22,344 | 33,094 | 55,438 |
Investor Class | Institutional Class | Total | |
Value Line Capital Appreciation Fund, Inc. | |||
Transfer agent fees | $109,390 | $35,627 | $145,017 |
Sub-transfer agent fees | 120,042 | 50,070 | 170,112 |
Registration and filing fees | 31,394 | 34,131 | 65,525 |
Other | 32,270 | 10,047 | 42,317 |
Fund | Value of Securities Loaned | Value of Collateral* |
Value Line Small Cap Opportunities Fund, Inc. | $— | $52,700 |
Value Line Mid Cap Focused Fund, Inc. | 10,919,581 | 11,233,743 |
Value Line Larger Companies Focused Fund, Inc. | 9,527,742 | 9,873,150 |
Value Line Asset Allocation Fund, Inc. | 6,749,681 | 6,887,213 |
Fund | Value of Securities Loaned | Value of Collateral* |
Value Line Capital Appreciation Fund, Inc. | $20,708,639 | $21,748,547 |
Value Line Core Bond Fund | 1,168,634 | 1,193,095 |
* | Value Line Larger Companies Focused Fund, Inc., Value Line Asset Allocation Fund, Inc., Value Line Capital Appreciation Fund, Inc. and Value Line Core Bond Fund received cash collateral of $535,925, $3,823,003, $11,680,188 and $372,250 respectively, which was subsequently invested in the State Street Navigator Securities Lending Government Money Market Portfolio as reported in the Schedule of Investments. In addition, Value Line Small Cap Opportunities Fund, Inc. received non cash-collateral of $52,700 in the form of U.S. Government obligations, for 0.01%, maturing 8/7/50, Value Line Mid Cap Focused Fund, Inc. received non cash-collateral of $11,233,743 in the form of U.S. Government obligations, ranging from 0.01% — 4.75%, maturing 7/15/24 — 11/15/52, Value Line Larger Companies Focused Fund, Inc. received non cash-collateral of $9,337,225 in the form of U.S. Government obligations, ranging from 0.01% — 4.75%, maturing 7/15/24 — 8/15/53, Value Line Asset Allocation Fund, Inc. received non cash-collateral of $3,064,210 in the form of U.S. Government obligations, ranging from 0.01% — 4.25%, maturing 1/15/25 — 8/7/50, Value Line Capital Appreciation Fund, Inc. received non cash-collateral of $10,068,359 in the form of U.S. Government obligations, ranging from 0.01% — 6.00%, maturing 1/25/24 — 8/15/53 and Value Line Core Bond Fund received non cash-collateral of $820,845 in the form of U.S. Government obligations, ranging from 0.01% — 4.25%, maturing 1/15/25 — 8/7/50. The Funds cannot sell or repledge the non-cash collateral which accordingly is not reflected in the Schedule of Investments. The value of securities loaned is determined at the close of business of the Funds and any additional required collateral is delivered to the Funds on the next business day. |
Fund | Purchases of Investment Securities Excluding U.S. Government Securities | Sales of Investment Securities Excluding U.S. Government Securities | Purchases of U.S. Government Obligations | Sales of U.S. Government Obligations |
Value Line Small Cap Opportunities Fund, Inc. | $102,545,976 | $46,940,500 | $— | $— |
Value Line Mid Cap Focused Fund, Inc. | 516,598,060 | 8,475,149 | — | — |
Value Line Select Growth Fund, Inc. | 52,397,753 | 88,320,678 | — | — |
Value Line Larger Companies Focused Fund, Inc. | 75,704,171 | 85,850,869 | — | — |
Value Line Asset Allocation Fund, Inc. | 114,177,577 | 321,246,786 | 261,318,543 | 228,608,781 |
Fund | Purchases of Investment Securities Excluding U.S. Government Securities | Sales of Investment Securities Excluding U.S. Government Securities | Purchases of U.S. Government Obligations | Sales of U.S. Government Obligations |
Value Line Capital Appreciation Fund, Inc. | $99,726,271 | $197,077,524 | $110,576,198 | $51,072,702 |
Value Line Core Bond Fund | 7,112,400 | 9,180,831 | 32,904,308 | 32,500,993 |
Fund | Cost of Investments for Tax Purposes | Gross Tax Unrealized Appreciation | Gross Tax Unrealized Depreciation | Net Tax Unrealized Appreciation/ (Depreciation) on Investments |
Value Line Small Cap Opportunities Fund, Inc. | $288,787,489 | $248,200,880 | $(4,294,370 ) | $243,906,510 |
Value Line Mid Cap Focused Fund, Inc. | 928,710,401 | 335,891,502 | (9,751,738 ) | 326,139,764 |
Value Line Select Growth Fund, Inc. | 198,924,565 | 218,726,373 | (218,533 ) | 218,507,840 |
Value Line Larger Companies Focused Fund, Inc. | 207,797,862 | 133,850,717 | (24,111,514 ) | 109,739,203 |
Value Line Asset Allocation Fund, Inc. | 679,344,657 | 284,754,526 | (16,792,354 ) | 267,962,172 |
Value Line Capital Appreciation Fund, Inc. | 356,410,583 | 128,514,103 | (30,526,305 ) | 97,987,798 |
Value Line Core Bond Fund | 40,510,265 | 277,623 | (2,696,121 ) | (2,418,498 ) |
Fund | Undistributed Ordinary Income | Undistributed Long-Term Gain | Other Timing Differences | Unrealized Appreciation (Depreciation) | Capital Loss Carryforwards | Late Year Deferrals | Distributable Earnings (Loss) |
Value Line Small Cap Opportunities Fund, Inc. | $— | $— | $— | $243,906,510 | $— | $(5,984,926 ) | $237,921,584 |
Value Line Mid Cap Focused Fund, Inc. | 748,102 | 327,720 | — | 326,139,764 | — | — | 327,215,586 |
Value Line Select Growth Fund, Inc. | 172,283 | 13,617,136 | — | 218,507,840 | — | — | 232,297,259 |
Value Line Larger Companies Focused Fund, Inc. | — | — | — | 109,739,203 | (2,782,700 ) | — | 106,956,503 |
Value Line Asset Allocation Fund, Inc. | 888,825 | 25,773,867 | — | 267,962,172 | — | — | 294,624,864 |
Value Line Capital Appreciation Fund, Inc. | 105,608 | — | — | 97,987,798 | (24,073,115 ) | — | 74,020,291 |
Value Line Core Bond Fund | 95,728 | — | — | (2,418,498 ) | (3,348,158 ) | — | (5,670,928 ) |
Total Distributable Earnings/(Loss) | |||
Fund | Undistributed Net Investment Income/(Loss) | Accumulated Net Realized Gains/(Losses) | Additional Paid-In Capital |
Value Line Small Cap Opportunities Fund, Inc. | $899,831 | $41 | $(899,872 ) |
Value Line Mid Cap Focused Fund, Inc. | (8,717 ) | 8,717 | — |
Value Line Select Growth Fund, Inc. | (9 ) | 9 | — |
Value Line Larger Companies Focused Fund, Inc. | 1,347,075 | 264,810 | (1,611,885 ) |
Value Line Asset Allocation Fund, Inc. | 396,042 | (396,042 ) | — |
Value Line Capital Appreciation Fund, Inc. | 18,663 | (18,663 ) | — |
Value Line Core Bond Fund | 45,832 | (45,832 ) | — |
Year Ended December 31, 2023 Distributions Paid from | ||||
Fund | Ordinary Income | Long-Term Capital Gain | Return of Capital | Total Distributions Paid |
Value Line Small Cap Opportunities Fund, Inc. | $— | $4,203,633 | $41 | $4,203,674 |
Value Line Mid Cap Focused Fund, Inc. | 1,929,904 | — | — | 1,929,904 |
Value Line Select Growth Fund, Inc. | — | 38,347,362 | — | 38,347,362 |
Value Line Larger Companies Focused Fund, Inc. | — | — | — | — |
Value Line Asset Allocation Fund, Inc. | 10,582,983 | 76,783,722 | — | 87,366,705 |
Value Line Capital Appreciation Fund, Inc. | 3,516,980 | — | — | 3,516,980 |
Value Line Core Bond Fund | 1,164,055 | — | — | 1,164,055 |
Year Ended December 31, 2022 Distributions Paid from | ||||
Fund | Ordinary Income | Long-Term Capital Gain | Total Distributions Paid | |
Value Line Small Cap Opportunities Fund, Inc.*, ** | $— | $9,921,610 | $9,921,610 | |
Value Line Mid Cap Focused Fund, Inc. | 1,256,185 | 33,604,238 | 34,860,423 | |
Value Line Select Growth Fund, Inc. | — | 38,066,212 | 38,066,212 | |
Value Line Larger Companies Focused Fund, Inc. | — | 26,081,985 | 26,081,985 | |
Value Line Asset Allocation Fund, Inc.*, ** | 9,741,884 | 48,104,049 | 57,845,933 | |
Year Ended December 31, 2022 Distributions Paid from | ||||
Fund | Ordinary Income | Long-Term Capital Gain | Total Distributions Paid | |
Value Line Capital Appreciation Fund, Inc. | $2,285,325 | $35,176,551 | $37,461,876 | |
Value Line Core Bond Fund | 762,097 | — | 762,097 | |
* | For the period 4/1/22-12/31/22. |
** | For the year ended March 31, 2022, Value Line Small Cap Opportunities Fund, Inc. had distributions paid from ordinary income and long-term capital gain of $0 and $29,540,485, respectively, and Value Line Asset Allocation Fund, Inc. had distributions paid from ordinary income and long-term capital gain of $5,820,859 and $109,351,515, respectively. |
Fund | Expiration for the 12 months ended | Fees Waived and Reimbursed by the Adviser | Fees Waived and Reimbursed by the Distributor |
Value Line Small Cap Opportunities Fund, Inc. | December 31, 2024 | $50,033 | $— |
Value Line Small Cap Opportunities Fund, Inc. | December 31, 2025 | 57,978 | — |
Value Line Small Cap Opportunities Fund, Inc. | December 31, 2026 | 75,767 | — |
Value Line Select Growth Fund, Inc. | December 31, 2024 | 22,388 | — |
Value Line Select Growth Fund, Inc. | December 31, 2025 | 28,912 | — |
Value Line Select Growth Fund, Inc. | December 31, 2026 | 27,944 | — |
Value Line Larger Companies Focused Fund, Inc. | December 31, 2024 | 34,925 | — |
Value Line Larger Companies Focused Fund, Inc. | December 31, 2025 | 19,795 | — |
Value Line Larger Companies Focused Fund, Inc. | December 31, 2026 | 66,823 | — |
Value Line Capital Appreciation Fund, Inc. | December 31, 2024 | 92,293 | — |
Value Line Capital Appreciation Fund, Inc. | December 31, 2025 | 53,839 | — |
Value Line Capital Appreciation Fund, Inc. | December 31, 2026 | 41,652 | — |
Value Line Core Bond Fund | December 31, 2024 | 170,756 | — |
Value Line Core Bond Fund | December 31, 2025 | 21,481 | 110,816 |
Value Line Core Bond Fund | December 31, 2026 | 78,228 | 97,765 |
New York, New York
February 15, 2024
Beginning Account Value July 1, 2023 | Ending Account Value December 31, 2023 | Expenses Paid During Period | Annualized Expense Ratio | |
Actual* | ||||
Value Line Small Cap Opportunities Fund, Inc. — Investor Class | $1,000.00 | $1,061.20 | $6.13 | 1.18 % |
Value Line Small Cap Opportunities Fund, Inc. — Institutional Class | 1,000.00 | 1,062.50 | 4.83 | 0.93 |
Value Line Mid Cap Focused Fund, Inc. — Investor Class | 1,000.00 | 1,089.90 | 5.85 | 1.11 |
Value Line Mid Cap Focused Fund, Inc. — Institutional Class | 1,000.00 | 1,090.90 | 4.69 | 0.89 |
Value Line Select Growth Fund, Inc. — Investor Class | 1,000.00 | 1,123.50 | 6.26 | 1.17 |
Value Line Select Growth Fund, Inc. — Institutional Class | 1,000.00 | 1,124.50 | 4.93 | 0.92 |
Value Line Larger Companies Focused Fund, Inc. — Investor Class | 1,000.00 | 1,174.10 | 6.30 | 1.15 |
Value Line Larger Companies Focused Fund, Inc. — Institutional Class | 1,000.00 | 1,176.10 | 4.94 | 0.90 |
Value Line Asset Allocation Fund, Inc. — Investor Class | 1,000.00 | 1,093.50 | 5.54 | 1.05 |
Value Line Asset Allocation Fund, Inc. — Institutional Class | 1,000.00 | 1,095.00 | 4.28 | 0.81 |
Value Line Capital Appreciation Fund, Inc. — Investor Class | 1,000.00 | 1,107.90 | 5.84 | 1.10 |
Value Line Capital Appreciation Fund, Inc. — Institutional Class | 1,000.00 | 1,109.20 | 4.52 | 0.85 |
Value Line Core Bond Fund — Investor Class | 1,000.00 | 1,029.40 | 4.09 | 0.80 |
Hypothetical (5% return before expenses) | ||||
Value Line Small Cap Opportunities Fund, Inc. — Investor Class | $1,000.00 | $1,019.26 | $6.01 | 1.18 % |
Value Line Small Cap Opportunities Fund, Inc. — Institutional Class | 1,000.00 | 1,020.52 | 4.74 | 0.93 |
Value Line Mid Cap Focused Fund, Inc. — Investor Class | 1,000.00 | 1,019.61 | 5.65 | 1.11 |
Value Line Mid Cap Focused Fund, Inc. — Institutional Class | 1,000.00 | 1,020.72 | 4.53 | 0.89 |
Value Line Select Growth Fund, Inc. — Investor Class | 1,000.00 | 1,019.31 | 5.96 | 1.17 |
Value Line Select Growth Fund, Inc. — Institutional Class | 1,000.00 | 1,020.57 | 4.69 | 0.92 |
Value Line Larger Companies Focused Fund, Inc. — Investor Class | 1,000.00 | 1,019.41 | 5.85 | 1.15 |
Value Line Larger Companies Focused Fund, Inc. — Institutional Class | 1,000.00 | 1,020.67 | 4.58 | 0.90 |
Value Line Asset Allocation Fund, Inc. — Investor Class | 1,000.00 | 1,019.91 | 5.35 | 1.05 |
Value Line Asset Allocation Fund, Inc. — Institutional Class | 1,000.00 | 1,021.12 | 4.13 | 0.81 |
Value Line Capital Appreciation Fund, Inc. — Investor Class | 1,000.00 | 1,019.66 | 5.60 | 1.10 |
Beginning Account Value July 1, 2023 | Ending Account Value December 31, 2023 | Expenses Paid During Period | Annualized Expense Ratio | |
Hypothetical (5% return before expenses) | ||||
Value Line Capital Appreciation Fund, Inc. — Institutional Class | $1,000.00 | $1,020.92 | $4.33 | 0.85 % |
Value Line Core Bond Fund — Investor Class | 1,000.00 | 1,021.17 | 4.08 | 0.80 |
* | Expenses are equal to the Fund's annualized expense ratio multiplied by the average account value over the period, multiplied by 184/365 (to reflect the Fund's most recent fiscal one-half year). These expense ratios may differ from the expense ratios shown in the Financial Highlights. |
Fund | % of Qualifying Dividend Income | % of Dividends Eligible for the Corporate Dividends Received Deduction | Long-Term Capital Gains |
Value Line Small Cap Opportunities Fund, Inc. | 0 % | 0 % | $4,203,633 |
Value Line Mid Cap Focused Fund, Inc. | 100 | 100 | — |
Value Line Select Growth Fund, Inc. | 0 | 0 | 38,347,362 |
Value Line Larger Companies Focused Fund, Inc. | 0 | 0 | — |
Value Line Asset Allocation Fund, Inc. | 59 | 59 | 76,783,722 |
Value Line Capital Appreciation Fund, Inc. | 74 | 74 | — |
Value Line Core Bond Fund | 0 | 0 | — |
Name, Address, and Year of Birth | Position | Length of Time Served | Principal Occupations During the Past 5 Years | Number of Portfolios in Fund Complex Overseen by Director | Other Directorships Held by Director During the Past 5 Years |
Interested Director* | |||||
Mitchell E. Appel 1970 | Director | Since 2010 | President of each of the Value Line Funds; Trustee, CEO and Treasurer of the Adviser; President and Chief Financial Officer of the Distributor. | 7 | Forethought Variable Insurance Trust |
Non-Interested Directors | |||||
Joyce E. Heinzerling 1956 | Director | Since 2008 | Retired. Managing Member, Meridian Fund Advisers LLC (consultants) until 2020. | 7 | KOP Therapeutics Corp (biotechnology) |
James E. Hillman 1957 | Director (Chair of the Board of the Value Line Funds since April 2016) | Since 2015 | Chief Financial Officer, Notre Dame School of Manhattan since 2011; Director and Principal Financial Officer, Merrill Lynch Global Wealth Management, 2006 - 2011. | 7 | Miller/Howard High Income Equity Fund |
Paul Craig Roberts 1939 | Director | Since 1983 | Chairman, Institute for Political Economy. | 7 | None |
Name, Address, and Year of Birth | Position | Length of Time Served | Principal Occupations During the Past 5 Years |
Officers | |||
Mitchell E. Appel 1970 | President | Since 2008 | President of each of the Value Line Funds; Trustee, CEO and Treasurer of the Adviser; President and Chief Financial Officer of the Distributor. |
James A. Gallo 1964 | Treasurer and Chief Financial Officer | Since 2022 | Treasurer and Chief Financial Officer (Principal Financial and Accounting Officer) of each of the Value Line Funds since June 2022. Senior Principal Consultant. Foreside Management Services, LLC, since 2022. Director Fund Services, Bank of New York Mellon, 2002 - 2021. |
Michael J. Wagner 1950 | Chief Compliance Officer | Since 2009 | Chief Compliance Officer of each of the Value Line Funds since 2009; President of Northern Lights Compliance Services, LLC 2006 – 2019. |
Emily D. Washington 1979 | Vice President and Secretary | Since 2008 | Vice President of each of the Value Line Funds since 2020 and Secretary since 2010; Treasurer and Chief Financial Officer of each of the Value Line Funds, 2008 – 2020. |
Robert Scagnelli 1961 | Vice President | Since 2020 | Vice President of each of the Value Line Funds since 2020; Vice President of the Distributor and the Adviser since 2011. |


Larger Companies Focused Fund, Small Cap
Opportunities Fund, Asset Allocation Fund
and Capital Appreciation Fund
Value Line Mid Cap Focused Fund
Value Line Select Growth Fund
For more complete information about any of the Value Line Funds, including charges and expenses, send for a prospectus from EULAV Securities LLC, 7 Times Square, Suite 1606, New York, New York 10036-6524 or call 1-800-243-2729, 9am-5pm CST, Monday-Friday, or visit us at www.vlfunds.com. Read the prospectus carefully before you invest or send money.
Item 2 Code of Ethics
(a) The Registrant has adopted a Code of Ethics that applies to its principal executive officer, and principal financial officer and principal accounting officer.
(f) Pursuant to item 12(a), the Registrant is attaching as an exhibit a copy of its Code of Ethics that applies to its principal executive officer, and principal financial officer and principal accounting officer.
Item 3 Audit Committee Financial Expert
((a)(1)The Registrant has an Audit Committee Financial Expert serving on its Audit Committee.
(2) The Registrant’s Board has designated James Hillman, member of the Registrant’s Audit Committee, as the Registrant’s Audit Committee Financial Expert. Mr. Hillman is an are independent director.
A person who is designated as an “audit committee financial expert” shall not make such person an “expert” for any purpose, including without limitation under Section 11 of the Securities Act of 1933 or under applicable fiduciary laws, as a result of being designated or identified as an audit committee financial expert. The designation or identification of a person as an audit committee financial expert does not impose on such person any duties, obligations, or liabilities that are greater than the duties, obligations, and liabilities imposed on such person as a member of the audit committee and Board of Trustees in the absence of such designation or identification.
Item 4 Principal Accountant Fees and Services
| (a) | Audit Fees 2023 - $19,317 |
Audit Fees 2022 - $20,175
| (b) | Audit-Related fees – None. |
| (c) | Tax Preparation 2023 - None |
Tax Preparation 2022 - None
| (d) | All Other Fees – None |
(e) (1) Disclose the audit committee’s pre-approval policies and procedures described in paragraph (c)(7) of Rule 2-01 of Regulation S-X
The Value Line Core Bond Fund (the “Fund”) Board has adopted policies and procedures with regard to the pre-approval of services provided by the Audit firm. Audit, audit-related and tax compliance services provided to the Fund on an annual basis require specific pre-approval by the Board. As noted above, the Board must also approve other non-audit services provided to the Fund and those non-audit services provided to the Fund’s Affiliate Service Providers that related directly to the operations and financial reporting of the Fund. Certain of these non-audit services that the Board believes are a) consistent with the SEC’s auditor independence rules and b) routine and recurring services that will not impair the independence of the independent auditors may be approved by the Board.
General Audit Committee Approval Policy:
Potential services by the auditors will be classified by officers of the Fund and the auditors into the four non-restricted service categories denoted above and this “Approval of Audit, Audit-Related, Tax and Other Services” Policy above will be applied. Any services outside the specific pre-approved service subcategories set forth in this Policy must be specifically approved by the Audit Committee (or such member or members of the Audit Committee as the Audit Committee may authorize to grant such approval).
At least quarterly, the Audit Committee shall review a report summarizing the services by service category, including fees, provided by the Audit firm as set forth in the above policy.
(e) (2) Not applicable.
(f) Not applicable.
(g) Aggregate Non-Audit 2023 - None
Aggregate Non-Audit 2022 - None
(h) Not applicable.
Item 5. Audit Committee of Listed Registrants
Not Applicable.
Item 6. Investments
Not Applicable
Item 7. Disclosure of Proxy Voting Policies and Procedures for Closed-End Management Investment Companies
Not Applicable
Item 8. Portfolio Managers of Closed-End Management Investment Companies
Not Applicable
Item 9. Purchases of Equity Securities by Closed-End Management Investment Company and Affiliated Purchasers
Not Applicable
Item 10 Submission of Matters to a Vote of Security Holders
Not Applicable
Item 11 Controls and Procedures
| (a) | The registrant’s principal executive officer and principal financial officer have concluded that the registrant’s disclosure controls and procedures (as defined in rule 30a-2(c) under the Act (17 CFR 270.30a-2(c) ) based on their evaluation of these controls and procedures as of a date within 90 days of the filing date of this report, are appropriately designed to ensure that material information relating to the registrant is made known to such officers and are operating effectively. |
| (b) | The registrant’s principal executive officer and principal financial officer have determined that there have been no significant changes in the registrant’s internal controls or in other factors that could significantly affect these controls during the period covered by this report, including corrective actions with regard to significant deficiencies and material weaknesses. |
Item 12. Disclosure of Securities Lending Activities for Closed-End Management Investment Companies
Not Applicable
Item 13. Exhibits.
| (a) |
| (b) |
| (2) |
SIGNATURES
Pursuant to the requirements of the Securities Exchange Act of 1934 and the Investment Company Act of 1940, the registrant has duly caused this report to be signed on its behalf by the undersigned, thereunto duly authorized.
| By | /s/ Mitchell E. Appel | |
| Mitchell E. Appel, President | ||
| Date: | March 1, 2024 | |
Pursuant to the requirements of the Securities Exchange Act of 1934 and the Investment Company Act of 1940, this report has been signed below by the following persons on behalf of the registrant and in the capacities and on the dates indicated.
| By: | /s/ Mitchell E. Appel | |
| Mitchell E. Appel, President, Principal Executive Officer | ||
| By: | /s/ James A. Gallo | |
| James A. Gallo, Treasurer, Principal Financial Officer | ||
| Date: | March 1, 2024 | |