UNITED STATES
SECURITIES AND EXCHANGE COMMISSION
Washington, D.C. 20549
FORM N-CSR
CERTIFIED SHAREHOLDER REPORT
OF
REGISTERED MANAGEMENT INVESTMENT COMPANIES
| | |
| Investment Company Act file number: 811-04474 |
| |
| Name of Registrant: | Vanguard California Tax-Free Funds |
| |
| Address of Registrant: | P.O. Box 2600 |
| | Valley Forge, PA 19482 |
| |
| Name and address of agent for service: | Anne E. Robinson, Esquire |
| | P.O. Box 876 |
| | Valley Forge, PA 19482 |
Registrant’s telephone number, including area code: (610) 669-1000
Date of fiscal year end: November 30
Date of reporting period: November 30, 2016 – May 31, 2017
Item 1: Reports to Shareholders
Semiannual Report | May 31, 2017
Vanguard California Tax-Exempt Funds
Vanguard California Municipal Money Market Fund
Vanguard California Intermediate-Term Tax-Exempt Fund
Vanguard California Long-Term Tax-Exempt Fund
A new format, unwavering commitment
As you begin reading this report, you’ll notice that we’ve made some improvements to the opening sections—based on feedback from you, our clients.
Page 1 starts with a new ”Your Fund’s Performance at a Glance,” a concise, handy summary of how your fund performed during the period.
In the renamed ”Chairman’s Perspective,” Bill McNabb will focus on enduring principles and investment insights.
We’ve modified some tables, and eliminated some redundancy, but we haven’t removed any information.
At Vanguard, we’re always looking for better ways to communicate and to help you make sound investment decisions. Thank you for entrusting your assets to us.
| |
| Contents | |
| Your Fund’s Performance at a Glance. | 1 |
| Chairman’s Perspective. | 3 |
| Advisor’s Report. | 7 |
| California Municipal Money Market Fund. | 11 |
| California Intermediate-Term Tax-Exempt Fund. | 30 |
| California Long-Term Tax-Exempt Fund. | 143 |
| About Your Fund’s Expenses. | 182 |
| Trustees Approve Advisory Arrangements. | 184 |
| Glossary. | 186 |
Please note: The opinions expressed in this report are just that—informed opinions. They should not be considered promises or advice. Also, please keep in mind that the information and opinions cover the period through the date on the front of this report. Of course, the risks of investing in your fund are spelled out in the prospectus.
See the Glossary for definitions of investment terms used in this report.
About the cover: No matter what language you speak, Vanguard has one consistent message and set of principles. Our primary focus is on you, our clients. We conduct our business with integrity as a faithful steward of your assets. This message is shown translated into seven languages, reflecting our expanding global presence.
Your Fund’s Performance at a Glance
• For the six months ended May 31, 2017, Vanguard California Intermediate-Term Tax-
Exempt Bond Fund returned 4.94% for Investor Shares and 4.99% for Admiral Shares.
The fund’s benchmark returned 5.15%; the average return of peer funds was 4.27%.
• Vanguard California Long-Term Tax-Exempt Bond Fund returned 5.94% for Investor
Shares and 5.99% for Admiral Shares, outpacing its benchmark index and the average
return of its peers.
• Vanguard California Municipal Money Market Fund returned 0.29%, outperforming the
average return of its peers.
• Municipal bond prices slumped in the wake of the U.S. presidential election but later
regained ground.
• Overweight positions in securities at the lower end of the investment-grade spectrum,
which benefited from spreads tightening, helped the Long- and Intermediate-Term Funds.
So, too, did greater exposure to the long end of the yield curve.
| | | | | |
| Total Returns: Six Months Ended May 31, 2017 | | | | | |
| | | Taxable- | | | |
| | SEC | Equivalent | Income | Capital | Total |
| | Yield | Yield | Returns | Returns | Returns |
| Vanguard California Municipal Money Market Fund | 0.64% | 1.30% | 0.29% | 0.00% | 0.29% |
| California Tax-Exempt Money Market Funds | | | | | |
| Average | | | | | 0.10 |
| California Tax-Exempt Money Market Funds Average: Derived from data provided by Lipper, a Thomson Reuters Company. | |
| |
| Vanguard California Intermediate-Term Tax-Exempt Fund | | | | | |
| Investor Shares | 1.75% | 3.57% | 1.35% | 3.59% | 4.94% |
| Admiral™ Shares | 1.85 | 3.77 | 1.40 | 3.59 | 4.99 |
| Bloomberg Barclays Municipal California | | | | | |
| Intermediate Bond Index | | | | | 5.15 |
| California Intermediate Municipal Debt Funds | | | | | |
| Average | | | | | 4.27 |
California Intermediate Municipal Debt Funds Average: Derived from data provided by Lipper, a Thomson Reuters Company.
1
| | | | | |
| | | Taxable- | | | |
| | SEC | Equivalent | Income | Capital | Total |
| | Yield | Yield | Returns | Returns | Returns |
| Vanguard California Long-Term Tax-Exempt Fund | | | | | |
| Investor Shares | 2.31% | 4.71% | 1.74% | 4.20% | 5.94% |
| Admiral Shares | 2.41 | 4.91 | 1.79 | 4.20 | 5.99 |
| Bloomberg Barclays CA Municipal Bond Index | | | | | 5.21 |
| California Municipal Debt Funds Average | | | | | 5.10 |
| California Municipal Debt Funds Average: Derived from data provided by Lipper, a Thomson Reuters Company. | | |
7-day SEC yield for the California Municipal Money Market Fund; 30-day SEC yield for the California Intermediate-Term Tax-Exempt Fund and California Long-Term Tax-Exempt Fund.
The calculation of taxable-equivalent yield assumes a typical itemized tax return and is based on the maximum federal tax rate of 43.4% and the maximum income tax rate for the state. Local taxes were not considered. Please see the prospectus for a detailed explanation of the calculation.
| | | |
| Admiral Shares carry lower expenses and are available to investors who meet certain account-balance requirements. | |
| |
| |
| Expense Ratios | | | |
| Your Fund Compared With Its Peer Group | | | |
| | Investor | Admiral | Peer Group |
| | Shares | Shares | Average |
| California Municipal Money Market Fund | 0.16% | — | 0.16% |
| California Intermediate-Term Tax-Exempt Fund | 0.19 | 0.09% | 0.74 |
| California Long-Term Tax-Exempt Fund | 0.19 | 0.09 | 0.92 |
The fund expense ratios shown are from the prospectus dated March 28, 2017, and represent estimated costs for the current fiscal year. For the six months ended May 31, 2017, the funds’ annualized expense ratios were: for the California Municipal Money Market Fund, 0.16%; for the California Intermediate-Term Tax-Exempt Fund, 0.19% for Investor Shares and 0.09% for Admiral Shares; and for the California Long-Term Tax-Exempt Fund, 0.19% for Investor Shares and 0.09% for Admiral Shares. Peer-group expense ratios are derived from data provided by Lipper, a Thomson Reuters Company, and capture information through year-end 2016.
Peer groups: For the California Municipal Money Market Fund, California Tax-Exempt Money Market Funds; for the California Intermediate-Term Tax-Exempt Fund, California Intermediate Municipal Debt Funds; for the California Long-Term Tax-Exempt Fund, California Municipal Debt Funds. In most, if not all, cases, the expense ratios for the funds in the peer groups are based on net operating expenses after reimbursement and/or fee waivers by fund sponsors. In contrast, the Vanguard money market funds’ expense ratios in the table above do not reflect expense reductions.
2
Chairman’s Perspective

Bill McNabb
Chairman and Chief Executive Officer
Dear Shareholder,
At the end of May, we completed the latest round of expense ratio changes for our U.S.-based funds. The estimated savings for our investors during the six-month period was more than $300 million across our fund lineup—another record for us.1
That’s a remarkable amount, but it’s also business as usual here at Vanguard. After all, we’ve been cutting costs for investors for more than 40 years. Indeed, we’ve become so synonymous with driving down costs that when other investment companies lower their fees, the financial press often refers to it as the “Vanguard effect.”
To be sure, high costs persist in some areas of the industry. But the good news is, our 40-year campaign to lower costs seems to be approaching its mathematical limits, with some fund expenses now near zero not just at Vanguard but at other investment companies as well.
What makes investors successful?
While we’ll continue our drive for cost efficiency, we’ll also keep vigorously promoting our three other linchpin investment principles:
• Goals. Create clear, appropriate investment goals.
• Balance. Develop a suitable asset allocation using broadly diversified funds.
1 This figure represents cumulative net savings from expense ratio changes for all Vanguard fund share classes announced from December 2016 through May 2017. The estimated savings is the difference between prior and current expense ratios multiplied by average assets under management (AUM). Average AUM is based on averaging one month’s daily average assets over the 12 months of each fund’s fiscal year.
3
• Discipline. Maintain perspective and long-term discipline.
Today, these tenets are more relevant than ever. They’re essential elements of our Personal Advisor Services recommendations, the model portfolios we develop for financial advisors, and our target-date funds.
We’re convinced that as investors increasingly adopt low-cost portfolios, focusing on goals, balance, and discipline could make the difference between achieving financial objectives and falling short.
Of course, there’s nothing new about our philosophy. And it seems simple enough. But unfortunately, we all have built-in behavioral biases that can make it hard to stick to the plan. We might, for example, allow natural inertia to keep us from rebalancing our portfolios to control risk, or we may become too wedded to an opinion or approach.
Lessons from the last crisis
Although it can be difficult at times to follow proven investing principles, it’s not impossible, even under the most challenging circumstances.
During the financial crisis of 2008–2009, various media outlets asked me whether our investors were pulling out of the
| | | |
| Market Barometer | | | |
| | | | Total Returns |
| | | Periods Ended May 31, 2017 |
| | Six | One | Five Years |
| | Months | Year | (Annualized) |
| Stocks | | | |
| Russell 1000 Index (Large-caps) | 10.55% | 17.48% | 15.37% |
| Russell 2000 Index (Small-caps) | 4.33 | 20.36 | 14.04 |
| Russell 3000 Index (Broad U.S. market) | 10.06 | 17.69 | 15.26 |
| FTSE All-World ex US Index (International) | 16.80 | 18.45 | 8.86 |
| |
| Bonds | | | |
| Bloomberg Barclays U.S. Aggregate Bond Index | | | |
| (Broad taxable market) | 2.52% | 1.58% | 2.24% |
| Bloomberg Barclays Municipal Bond Index | | | |
| (Broad tax-exempt market) | 5.16 | 1.46 | 3.31 |
| Citigroup Three-Month U.S. Treasury Bill Index | 0.26 | 0.41 | 0.12 |
| |
| CPI | | | |
| Consumer Price Index | 1.40% | 1.87% | 1.27% |
4
market and running for the hills. In actuality, we didn’t see that at Vanguard. Our clients were certainly nervous, and they contacted us more often. But for the most part, they didn’t engage in the excessive, panicked trading that can be so destructive to building wealth. Those who relied on financial advisors who follow our philosophy were wisely counseled to stay the course.
The accompanying chart shows the importance of patience and discipline. Investors who maintained a 60% stock/ 40% bond mix through the bear market
were amply rewarded afterward, while those who fled stocks when they hit bottom were left far behind.
It’s not different this time
Today, nearly a decade after the global financial crisis, the world seems very different. Market indexes recently hit a series of all-time highs. With the wind at their backs and the increasing availability of low-cost funds, investors may be tempted to ask, “What could go wrong?” The answer is, “A lot.” Performance chasing and market-timing won’t be any more effective with low-cost funds than they are with high-cost funds.
Reacting to volatility can hurt returns
Investors who kept a balanced portfolio through the 2008–2009 crash were rewarded
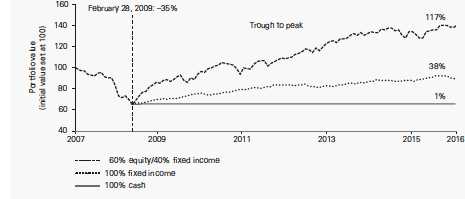
Notes: On October 31, 2007, close to the equity market’s peak, the value of a hypothetical 60/40 portfolio is set at 100. Subsequent returns are calculated relative to this starting value of 100. It is assumed that all dividends and income are reinvested in the components of the indexes. The initial allocation for the portfolios was 42% U.S. stocks, 18% international stocks, and 40% U.S. bonds. The rebalanced portfolio is returned to this allocation every month-end. Returns for the U.S. stock allocation are based on the MSCI US Broad Market Index. Returns for the international stock allocation are based on the MSCI All Country World Index ex USA. Returns for the bond allocation are based on the Bloomberg Barclays U.S. Aggregate Bond Index. Returns for the cash allocation are based on the Citigroup 3-Month U.S. Treasury Bill Index.
Sources: Vanguard, using data provided by Thomson Reuters Datastream.
5
Whether markets are sunny or stormy, investors need to stick to their investment plans, maintain balanced and diversified portfolios, and think long-term.
We strive to help investors follow the principles that lead to enduring success. I’d like to think that will be the real “Vanguard effect.”
As always, thank you for investing with Vanguard.
Sincerely,

F. William McNabb III
Chairman and Chief Executive Officer
June 14, 2017
6
Advisor’s Report
For the six months ended May 31, 2017, Vanguard California Intermediate-Term Tax-Exempt Fund returned 4.94% for Investor Shares and 4.99% for Admiral Shares, underperforming its benchmark but outperforming the average return of its peer funds. Vanguard California Long-Term Tax-Exempt Fund returned 5.94% for Investor Shares and 5.99% for Admiral Shares, outpacing both its benchmark index and the average return of its peers.
Vanguard California Municipal Money Market Fund returned 0.29%; the average return of peer funds was 0.10%.
With municipal bond prices gaining ground during the period, the Intermediate-Term Fund’s 30-day SEC yield fell from 1.80% to 1.75% for Investor Shares and from 1.92%
to 1.85% for Admiral Shares over the period. The yield for the Long-Term Fund fell from 2.35% to 2.31% for Investor Shares and from 2.47% to 2.41% for Admiral Shares. The Money Market Fund’s 7-day SEC yield rose from 0.40% to 0.64%.
The investment environment
During the period, the Federal Reserve increased interest rates twice; the second move, in March, put the federal funds rate at 0.75%–1.00% and marked just the third time the Fed has raised rates since the financial crisis.
The Fed’s decisions signaled a normalization of monetary policy and came as the U.S. economy posted mostly positive results. Fourth-quarter economic
| | |
| Yields of Municipal Securities | | |
| (AAA-Rated General Obligation Issues) | | |
| | November 30, | May 31, |
| Maturity | 2016 | 2017 |
| 2 years | 1.16% | 0.89% |
| 5 years | 1.85 | 1.22 |
| 10 years | 2.52 | 1.90 |
| 30 years | 3.26 | 2.74 |
| Source: Vanguard. | | |
7
growth was in line with estimates. But GDP growth was lackluster in the first quarter of 2017, largely because of a drop-off in consumer spending. The housing and manufacturing sectors reported decent activity during the six months under review, and in May unemployment hit 4.3%, its lowest level in 16 years. Wages ticked up and some commodities, including oil, posted price increases, helping inflation come closer to the Fed’s 2% target. Against this backdrop, the Fed signaled that further hikes could be in the offing.
Municipal bond supply was down modestly from the same period last year, largely because refunding issuance declined as interest rates climbed higher. Municipal bond fund cash flows turned negative in the wake of the U.S. elections but reversed somewhat as the period came to a close. Short- and medium-term muni bonds outperformed Treasuries.
In California, the state’s economy grew faster than the U.S. economy as a whole, according to a gauge of current economic conditions published monthly by the Federal Reserve Bank of Philadelphia. The bank’s index for California rose by about 2%, while the increase at the national level was closer to 1%. (Each state’s index incorporates data on nonfarm payroll employment, the jobless rate, average hours worked in manufacturing, and inflation-adjusted wage and salary payments.)
The most significant revenue developments at the state level were the expiration and extension of the 2012 Proposition 30 temporary taxes that had been in place since January 1, 2013. The sales tax portion (a 0.25% increase statewide) expired as expected on December 31, 2016. The income tax portion (tiered increases for single filers/ joint filers making over $250,000/$500,000 a year) had been set to expire in 2019, but Proposition 55, which passed by a large margin in November 2016, extended it through 2030. Actual revenues have been lagging the state’s rosy projections, but they are picking up: Although revenues for the ten months ended April 30, 2017, trailed the original projections by 1.9%, they were up 1.8% from the same period the year before.
At the local level, cities and counties continue to operate in an environment conducive to fiscal strength and stability. California’s extension of the Proposition 30 income tax increase ensures a solid funding source for its school districts, and its cities and counties have seen virtually no negative budget repercussions since the state put its fiscal house in order.
Because of a change in Moody’s leasebacked methodology, nearly all California cities and counties had their lease-backed obligation ratings upgraded one notch in the fourth quarter of 2016. Some of our largest exposures in the City of Los Angeles and Los Angeles County received such upgrades.
Overall credit trends continue to be positive, although there is deep concern with how federal policy may affect state and local budgets, mostly with respect to the repeal of the Affordable Care Act.
8
Issuance has been average to brisk. The state issued $2.4 billion mostly in refunding general obligation debt in March 2017 and $1.2 billion for high speed rail in April 2017. Local governments continue to use the low-rate environment to take advantage of refunding opportunities and issue new general obligation bonds from the spate of authorizations that have been granted over the past three years.
Management of the funds
Our investment process at Vanguard relies on risk management as we strive to add value through a diversified mix of strategies that include duration, yield-curve positioning, credit-quality decisions, and security selection. Vanguard’s experienced team of credit analysts perform objective and independent analyses of bonds owned by the funds.
The Intermediate-Term and Long-Term Funds’ performance compared to their state-specific benchmarks got a boost from their A-rated and Baa-rated bonds and bonds with maturities of 10–20 years. On the other hand, the funds’ bonds with maturities of 5–10 years hindered their relative performance.
For the Money Market Fund, we maintained high levels of liquidity and a short weighted average maturity. That positioning allowed us to take advantage of the increase in yields on money market-eligible securities and, along with its low expense ratio compared with peers, helped the fund outperform for the period.
The funds are permitted to invest in bonds whose income is subject to the alternative minimum tax (AMT). As of May 31, 2017, neither the Intermediate-Term Fund nor the Long-Term Fund owned bonds that would generate income distributions subject to the AMT, but the Money Market Fund did.
None of the funds had any exposure to bonds issued by Puerto Rico, whose debt relief negotiations are ongoing. (Because the commonwealth’s bonds are exempt from federal, state, and local income tax, they often appear in state and national muni bond funds.)
The outlook
After the close of the period, the Fed raised rates by 25 basis points, and it has hinted there may be another hike in 2017. That aligns with our expectations that the Fed will raise rates gradually to 1.5% in 2017, while leaving the federal funds rate below 2% through at least 2018. The pace of future rate hikes will likely depend on the rate of economic growth.
The U.S. economy looks set to continue its steady growth, with real GDP likely to be around 2% in 2017, or perhaps closer to 2.5% if the implementation of the Trump administration’s agenda actually has a positive effect on the economy. While job growth may slow given the tightening we’ve seen in the labor market, competition for labor could push up the pace of annual wage increases. That should provide some support to inflation in the short term, but not so much as to make it significantly overshoot the central bank’s 2% target.
9
If growth and inflation remain modest, the cost of borrowing shouldn’t get out of hand, especially if yields in the United States remain attractive compared with those of other developed economies. International demand should help cap how high U.S. bond yields can rise.
Of course, market conditions could change, but we are confident that our team of experienced managers, analysts, and traders can handle whatever the market brings and find opportunities that will produce competitive returns.
Christopher W. Alwine, CFA, Principal,
Head of Municipal Group
John M. Carbone, Principal,
Portfolio Manager
James M. D’Arcy, CFA, Portfolio Manager
Adam M. Ferguson, CFA,
Portfolio Manager
Vanguard Fixed Income Group
June 15, 2017
10
California Municipal Money Market Fund
Fund Profile
As of May 31, 2017
| |
| Financial Attributes | |
| Ticker Symbol | VCTXX |
| Expense Ratio1 | 0.16% |
| 7-Day SEC Yield | 0.64% |
| Average Weighted | |
| Maturity | 12 days |
1 The expense ratio shown is from the prospectus dated March 28, 2017, and represents estimated costs for the current fiscal year. For the six months ended May 31, 2017, the annualized expense ratio was 0.16%.
11
California Municipal Money Market Fund
Performance Summary
Investment returns will fluctuate. All of the returns in this report represent past performance, which is not a guarantee of future results that may be achieved by the fund. (Current performance may be lower or higher than the performance data cited. For performance data current to the most recent month-end, visit our website at vanguard.com/performance.) The returns shown do not reflect taxes that a shareholder would pay on fund distributions. The fund is only available to retail investors (natural persons). You could lose money by investing in the fund. Although the fund seeks to preserve the value of your investment at $1.00 per share, it cannot guarantee it will do so. The fund may impose a fee upon the sale of your shares or may temporarily suspend your ability to sell shares if the fund’s liquidity falls below required minimums because of market conditions or other factors. An investment in the fund is not insured or guaranteed by the Federal Deposit Insurance Corporation or any other government agency. The fund’s sponsor has no legal obligation to provide financial support to the fund, and you should not expect that the sponsor will provide financial support to the fund at any time.
The fund’s 7-day SEC yield reflects its current earnings more closely than do the average annual returns.
| | |
| Fiscal-Year Total Returns (%): November 30, 2006, Through May 31, 2017 | |
| | | CA Tax-Exempt |
| | | Money Mkt |
| | | Funds Avg |
| Fiscal Year | Total Returns | Total Returns |
| 2007 | 3.55% | 3.06% |
| 2008 | 2.21 | 1.81 |
| 2009 | 0.37 | 0.17 |
| 2010 | 0.11 | 0.01 |
| 2011 | 0.07 | 0.01 |
| 2012 | 0.03 | 0.00 |
| 2013 | 0.01 | 0.00 |
| 2014 | 0.01 | 0.00 |
| 2015 | 0.01 | 0.00 |
| 2016 | 0.25 | 0.11 |
| 2017 | 0.29 | 0.10 |
| 7-day SEC yield (5/31/2017): 0.64% | | |
| California Tax-Exempt Money Market Funds Average: Derived from data provided by Lipper, a Thomson Reuters Company. |
| Note: For 2017, performance data reflect the six months ended May 31, 2017. |
Average Annual Total Returns: Periods Ended March 31, 2017
This table presents returns through the latest calendar quarter—rather than through the end of the fiscal period.
Securities and Exchange Commission rules require that we provide this information.
| | | | |
| | Inception | One | Five | Ten |
| | Date | Year | Years | Years |
| California Municipal Money Market | | | | |
| Fund | 6/1/1987 | 0.42% | 0.10% | 0.56% |
See Financial Highlights for dividend information.
12
California Municipal Money Market Fund
Financial Statements (unaudited)
Statement of Net Assets
As of May 31, 2017
The fund reports a complete list of its holdings in various monthly and quarterly regulatory filings. The fund publishes its holdings on a monthly basis at vanguard.com and files them with the Securities and Exchange Commission on Form N-MFP. The fund’s Form N-MFP filings may be viewed at sec.gov or via a link on the “Portfolio Holdings” page on vanguard.com. For the second and fourth fiscal quarters, the lists appear in the fund’s semiannual and annual reports to shareholders. For the first and third fiscal quarters, the fund files the lists with the SEC on Form N-Q. Shareholders can look up the fund’s Forms N-Q on the SEC’s website at sec.gov. Forms N-Q may also be reviewed and copied at the SEC’s Public Reference Room (see the back cover of this report for further information).
| | | | |
| | | | Face | Market |
| | | Maturity | Amount | Value• |
| | Coupon | Date | ($000) | ($000) |
| Tax-Exempt Municipal Bonds (100.0%) | | | | |
| California (100.0%) | | | | |
| ABAG Finance Authority for Nonprofit Corps. | | | | |
| California Revenue (Branson School) VRDO | 0.770% | 6/7/17 LOC | 21,300 | 21,300 |
| ABAG Finance Authority for Nonprofit Corps. | | | | |
| California Revenue (Computer History Museum) | | | | |
| VRDO | 0.790% | 6/7/17 LOC | 7,000 | 7,000 |
| ABAG Finance Authority for Nonprofit Corps. | | | | |
| California Revenue (Lakeside Village Apartments) | | | | |
| VRDO | 0.760% | 6/7/17 LOC | 30,700 | 30,700 |
| ABAG Finance Authority for Nonprofit Corps. | | | | |
| California Revenue (Public Policy Institute) | | | | |
| VRDO | 0.780% | 6/7/17 LOC | 12,705 | 12,705 |
| Anaheim CA Housing Finance Agency Home | | | | |
| Mortgage Revenue VRDO | 0.800% | 6/7/17 LOC | 5,485 | 5,485 |
| 1 Bay Area Toll Authority California Toll Bridge | | | | |
| Revenue (San Francisco Bay Area) TOB VRDO | 0.810% | 6/7/17 | 13,330 | 13,330 |
| 1 Bay Area Toll Authority California Toll Bridge | | | | |
| Revenue (San Francisco Bay Area) TOB VRDO | 0.820% | 6/7/17 | 3,700 | 3,700 |
| Bay Area Toll Authority California Toll Bridge | | | | |
| Revenue (San Francisco Bay Area) VRDO | 0.720% | 6/7/17 LOC | 5,000 | 5,000 |
| Big Bear Lake CA Industrial Revenue (Southwest | | | | |
| Gas Corp. Project) VRDO | 0.770% | 6/7/17 LOC | 24,000 | 24,000 |
| California Department of Water Resources Water | | | | |
| System Revenue CP | 0.870% | 6/1/17 | 33,553 | 33,553 |
| California Department of Water Resources Water | | | | |
| System Revenue CP | 0.860% | 7/6/17 | 3,437 | 3,437 |
| 1 California Educational Facilities Authority Revenue | | | | |
| (California Institute of Technology) TOB VRDO | 0.810% | 6/7/17 | 3,365 | 3,365 |
| California Educational Facilities Authority Revenue | | | | |
| (California Institute of Technology) VRDO | 0.790% | 6/7/17 | 55,800 | 55,800 |
| California Educational Facilities Authority Revenue | | | | |
| (Stanford Hospital) CP | 0.950% | 7/6/17 | 36,550 | 36,550 |
| California Educational Facilities Authority Revenue | | | | |
| (Stanford University) CP | 0.800% | 6/7/17 | 30,000 | 30,000 |
| California Educational Facilities Authority Revenue | | | | |
| (Stanford University) CP | 0.800% | 6/7/17 | 1,200 | 1,200 |
13
California Municipal Money Market Fund
| | | | |
| | | | Face | Market |
| | | Maturity | Amount | Value• |
| | Coupon | Date | ($000) | ($000) |
| California Educational Facilities Authority | | | | |
| Revenue (Stanford University) CP | 0.920% | 7/12/17 | 40,000 | 40,000 |
| 1 California Educational Facilities Authority | | | | |
| Revenue (Stanford University) TOB VRDO | 0.800% | 6/7/17 | 8,000 | 8,000 |
| 1 California Educational Facilities Authority | | | | |
| Revenue (Stanford University) TOB VRDO | 0.810% | 6/7/17 | 3,000 | 3,000 |
| 1 California Educational Facilities Authority | | | | |
| Revenue (Stanford University) TOB VRDO | 0.810% | 6/7/17 | 3,590 | 3,590 |
| 1 California Educational Facilities Authority | | | | |
| Revenue (Stanford University) VRDO | 0.700% | 6/7/17 | 10,900 | 10,900 |
| 1 California Educational Facilities Authority | | | | |
| Revenue (Stanford University) VRDO | 0.700% | 6/7/17 | 14,600 | 14,600 |
| California GO CP | 0.760% | 6/5/17 LOC | 13,525 | 13,525 |
| California GO CP | 0.930% | 6/8/17 LOC | 14,190 | 14,190 |
| California GO CP | 0.870% | 7/6/17 LOC | 20,000 | 20,000 |
| California GO CP | 0.950% | 7/20/17 LOC | 25,000 | 25,000 |
| 1 California GO TOB VRDO | 0.790% | 6/7/17 | 3,000 | 3,000 |
| 1 California GO TOB VRDO | 0.800% | 6/7/17 | 2,370 | 2,370 |
| 1 California GO TOB VRDO | 0.800% | 6/7/17 | 6,815 | 6,815 |
| 1 California GO TOB VRDO | 0.800% | 6/7/17 | 4,200 | 4,200 |
| California GO VRDO | 0.680% | 6/7/17 LOC | 5,470 | 5,470 |
| California GO VRDO | 0.680% | 6/7/17 LOC | 10,160 | 10,160 |
| California GO VRDO | 0.720% | 6/7/17 LOC | 10,000 | 10,000 |
| California GO VRDO | 0.740% | 6/7/17 LOC | 10,000 | 10,000 |
| California GO VRDO | 0.750% | 6/7/17 LOC | 19,335 | 19,335 |
| California GO VRDO | 0.750% | 6/7/17 LOC | 3,530 | 3,530 |
| California Health Facilities Financing Authority | | | | |
| Revenue (Catholic Healthcare West) VRDO | 0.720% | 6/7/17 LOC | 6,725 | 6,725 |
| California Health Facilities Financing Authority | | | | |
| Revenue (Catholic Healthcare West) VRDO | 0.760% | 6/7/17 LOC | 41,000 | 41,000 |
| California Health Facilities Financing Authority | | | | |
| Revenue (Catholic Healthcare West) VRDO | 0.800% | 6/7/17 LOC | 14,000 | 14,000 |
| California Health Facilities Financing Authority | | | | |
| Revenue (Children’s Hospital of Orange County) | | | | |
| VRDO | 0.740% | 6/7/17 LOC | 9,525 | 9,525 |
| California Health Facilities Financing Authority | | | | |
| Revenue (Children’s Hospital of Orange County) | | | | |
| VRDO | 0.740% | 6/7/17 LOC | 2,400 | 2,400 |
| California Health Facilities Financing Authority | | | | |
| Revenue (Children’s Hospital of Orange County) | | | | |
| VRDO | 0.740% | 6/7/17 LOC | 22,345 | 22,345 |
| 1 California Health Facilities Financing Authority | | | | |
| Revenue (Lucile Salter Packard Children’s | | | | |
| Hospital at Stanford) TOB VRDO | 0.800% | 6/7/17 | 3,375 | 3,375 |
| 1 California Health Facilities Financing Authority | | | | |
| Revenue (Lucile Salter Packard Children’s | | | | |
| Hospital at Stanford) TOB VRDO | 0.810% | 6/7/17 | 6,665 | 6,665 |
| 1 California Health Facilities Financing Authority | | | | |
| Revenue (Lucile Salter Packard Children’s | | | | |
| Hospital at Stanford) TOB VRDO | 0.850% | 6/7/17 | 7,705 | 7,705 |
| 1 California Health Facilities Financing Authority | | | | |
| Revenue (Lucile Salter Packard Children’s | | | | |
| Hospital at Stanford) TOB VRDO | 0.850% | 6/7/17 | 2,060 | 2,060 |
14
California Municipal Money Market Fund
| | | | |
| | | | Face | Market |
| | | Maturity | Amount | Value• |
| | Coupon | Date | ($000) | ($000) |
| California Health Facilities Financing Authority | | | | |
| Revenue (Memorial Health Services) VRDO | 0.750% | 6/7/17 | 14,200 | 14,200 |
| California Health Facilities Financing Authority | | | | |
| Revenue (Memorial Health Services) VRDO | 0.750% | 6/7/17 | 42,300 | 42,300 |
| California Health Facilities Financing Authority | | | | |
| Revenue (Scripps Health) VRDO | 0.730% | 6/7/17 LOC | 8,000 | 8,000 |
| 1 California Health Facilities Financing Authority | | | | |
| Revenue (Sutter Health) TOB VRDO | 0.800% | 6/7/17 | 16,400 | 16,400 |
| 1 California Health Facilities Financing Authority | | | | |
| Revenue (Sutter Health) TOB VRDO | 0.800% | 6/7/17 | 4,675 | 4,675 |
| 1 California Health Facilities Financing Authority | | | | |
| Revenue (Sutter Health) TOB VRDO | 0.800% | 6/7/17 | 14,305 | 14,305 |
| 1 California Health Facilities Financing Authority | | | | |
| Revenue (Sutter Health) TOB VRDO | 0.810% | 6/7/17 | 3,750 | 3,750 |
| 1 California Health Facilities Financing Authority | | | | |
| Revenue (Sutter Health) TOB VRDO | 0.810% | 6/7/17 | 9,715 | 9,715 |
| 1 California Health Facilities Financing Authority | | | | |
| Revenue (Sutter Health) TOB VRDO | 0.810% | 6/7/17 | 6,650 | 6,650 |
| California Infrastructure & Economic Development | | | | |
| Bank Revenue (Pacific Gas & Electric Co.) VRDO | 0.690% | 6/1/17 LOC | 26,675 | 26,675 |
| California Infrastructure & Economic Development | | | | |
| Bank Revenue (Pacific Gas & Electric Co.) VRDO | 0.690% | 6/1/17 LOC | 10,135 | 10,135 |
| California Infrastructure & Economic Development | | | | |
| Bank Revenue (SRI International) VRDO | 0.830% | 6/7/17 LOC | 4,000 | 4,000 |
| 1 California Infrastructure & Economic Development | | | | |
| Bank Revenue TOB VRDO | 0.800% | 6/7/17 | 6,970 | 6,970 |
| California Municipal Finance Authority Multifamily | | | | |
| Housing Revenue (Copper Square Apartments) | | | | |
| VRDO | 0.730% | 6/7/17 LOC | 2,735 | 2,735 |
| California Municipal Finance Authority Pollution | | | | |
| Control Revenue (Chevron USA Inc. Project) | | | | |
| VRDO | 0.690% | 6/1/17 | 4,800 | 4,800 |
| California Municipal Finance Authority Recovery | | | | |
| Zone Revenue (Chevron USA Inc. Project) VRDO | 0.690% | 6/1/17 | 26,580 | 26,580 |
| California Pollution Control Financing Authority | | | | |
| Revenue (Pacific Gas & Electric Co.) VRDO | 0.610% | 6/1/17 LOC | 3,500 | 3,500 |
| California Pollution Control Financing Authority | | �� | | |
| Revenue (Pacific Gas & Electric Co.) VRDO | 0.640% | 6/1/17 LOC | 90,350 | 90,350 |
| California Pollution Control Financing Authority | | | | |
| Revenue (Pacific Gas & Electric Co.) VRDO | 0.800% | 6/1/17 LOC | 45,650 | 45,650 |
| 1 California State University Revenue Systemwide | | | | |
| TOB VRDO | 0.800% | 6/7/17 (Prere.) | 20,475 | 20,475 |
| 1 California State University Systemwide Revenue | | | | |
| TOB VRDO | 0.800% | 6/7/17 | 7,160 | 7,160 |
| 1 California State University Systemwide Revenue | | | | |
| TOB VRDO | 0.920% | 6/7/17 | 5,685 | 5,685 |
| California Statewide Communities Development | | | | |
| Authority Multifamily Housing Revenue (Canyon | | | | |
| Springs Apartments Project) VRDO | 0.810% | 6/7/17 LOC | 11,095 | 11,095 |
| California Statewide Communities Development | | | | |
| Authority Multifamily Housing Revenue (Irvine | | | | |
| Apartment Communities LP) VRDO | 0.820% | 6/1/17 LOC | 3,200 | 3,200 |
15
California Municipal Money Market Fund
| | | | | |
| | | | | Face | Market |
| | | | Maturity | Amount | Value• |
| | | Coupon | Date | ($000) | ($000) |
| | California Statewide Communities Development | | | | |
| | Authority Multifamily Housing Revenue | | | | |
| | (Ridgeway Apartments) VRDO | 0.770% | 6/7/17 LOC | 26,955 | 26,955 |
| | California Statewide Communities Development | | | | |
| | Authority Multifamily Housing Revenue | | | | |
| | (Wilshire Court Project) VRDO | 0.810% | 6/7/17 LOC | 11,900 | 11,900 |
| | California Statewide Communities Development | | | | |
| | Authority Pollution Control Revenue (Chevron | | | | |
| | USA Inc. Project) VRDO | 0.690% | 6/1/17 | 8,300 | 8,300 |
| | California Statewide Communities Development | | | | |
| | Authority Revenue (Community Hospital of the | | | | |
| | Monterey Peninsula) VRDO | 0.750% | 6/7/17 LOC | 40,200 | 40,200 |
| | California Statewide Communities Development | | | | |
| | Authority Revenue (Kaiser Permanente) CP | 0.970% | 7/6/17 | 16,250 | 16,250 |
| | California Statewide Communities Development | | | | |
| | Authority Revenue (Kaiser Permanente) VRDO | 0.720% | 6/7/17 | 2,100 | 2,100 |
| | California Statewide Communities Development | | | | |
| | Authority Revenue (Kaiser Permanente) VRDO | 0.720% | 6/7/17 | 21,500 | 21,500 |
| | California Statewide Communities Development | | | | |
| | Authority Revenue (Kaiser Permanente) VRDO | 0.760% | 6/7/17 | 41,985 | 41,985 |
| | California Statewide Communities Development | | | | |
| | Authority Revenue (Kaiser Permanente) VRDO | 0.760% | 6/7/17 | 30,100 | 30,100 |
| | California Statewide Communities Development | | | | |
| | Authority Revenue (Kaiser Permanente) VRDO | 0.770% | 6/7/17 | 9,600 | 9,600 |
| | California Statewide Communities Development | | | | |
| | Authority Revenue (Scripps Health) VRDO | 0.730% | 6/7/17 LOC | 8,200 | 8,200 |
| 1 | California Statewide Communities Development | | | | |
| | Authority Revenue (St. Joseph Health System) | | | | |
| | TOB VRDO | 0.840% | 6/7/17 (Prere.) | 57,233 | 57,233 |
| 1 | California Statewide Communities Development | | | | |
| | Authority Revenue (Sutter Health) TOB VRDO | 0.810% | 6/7/17 | 8,740 | 8,740 |
| 1 | California Statewide Communities Development | | | | |
| | Authority Revenue (Sutter Health) TOB VRDO | 0.810% | 6/7/17 | 12,230 | 12,230 |
| 1 | California Statewide Communities Development | | | | |
| | Authority Revenue (Sutter Health) TOB VRDO | 0.820% | 6/7/17 | 6,270 | 6,270 |
| 1 | California Statewide Communities Development | | | | |
| | Authority Revenue (Trinity Health) TOB VRDO | 0.800% | 6/7/17 | 2,175 | 2,175 |
| | Calleguas-Las Virgenes CA Public Financing | | | | |
| | Authority Revenue (Municipal Water District | | | | |
| | Project) VRDO | 0.730% | 6/7/17 LOC | 4,555 | 4,555 |
| | Chula Vista CA Multifamily Housing Revenue | | | | |
| | (Teresina Apartments) VRDO | 0.800% | 6/7/17 LOC | 27,940 | 27,940 |
| | Contra Costa CA Municipal Water District | | | | |
| | Revenue (Extendible) CP | 0.910% | 2/2/18 | 15,000 | 15,000 |
| | Contra Costa County CA Multifamily Housing | | | | |
| | Revenue (Park Regency) VRDO | 0.800% | 6/7/17 LOC | 30,000 | 30,000 |
| 1,2 | Culver City CA Unified School District GO TOB | | | | |
| | PUT | 0.850% | 6/1/17 | 4,450 | 4,450 |
| 1 | Cupertino CA Union School District GO TOB | | | | |
| | VRDO | 0.820% | 6/7/17 | 8,870 | 8,870 |
| 1 | Desert CA Community College District GO TOB | | | | |
| | VRDO | 0.800% | 6/7/17 | 6,000 | 6,000 |
| 1 | Desert CA Community College District GO TOB | | | | |
| | VRDO | 0.810% | 6/7/17 | 9,295 | 9,295 |
16
California Municipal Money Market Fund
| | | | |
| | | | Face | Market |
| | | Maturity | Amount | Value• |
| | Coupon | Date | ($000) | ($000) |
| East Bay CA Municipal Utility District Water | | | | |
| System Revenue CP | 0.750% | 6/5/17 | 10,000 | 10,000 |
| East Bay CA Municipal Utility District Water | | | | |
| System Revenue CP | 0.940% | 6/5/17 | 8,000 | 8,000 |
| East Bay CA Municipal Utility District Water | | | | |
| System Revenue CP | 0.970% | 7/6/17 | 20,000 | 20,000 |
| East Bay CA Municipal Utility District Water | | | | |
| System Revenue CP | 0.930% | 7/7/17 | 10,000 | 10,000 |
| East Bay CA Municipal Utility District Water | | | | |
| System Revenue CP | 0.970% | 7/17/17 | 10,000 | 10,000 |
| East Bay CA Municipal Utility District Water | | | | |
| System Revenue CP | 0.960% | 8/2/17 | 15,000 | 15,000 |
| 1 East Bay CA Municipal Utility District Water | | | | |
| System Revenue TOB VRDO | 0.800% | 6/7/17 | 9,260 | 9,260 |
| 1 Eastern California Municipal Water District | | | | |
| Financing Authority Water & Wastewater | | | | |
| Revenue TOB VRDO | 0.790% | 6/7/17 | 5,000 | 5,000 |
| 1 Eastern California Municipal Water District Water | | | | |
| & Sewer COP TOB VRDO | 0.800% | 6/7/17 (Prere.) | 1,595 | 1,595 |
| Eastern California Municipal Water District Water | | | | |
| & Wastewater Revenue VRDO | 0.700% | 6/7/17 | 18,700 | 18,700 |
| Eastern California Municipal Water District Water | | | | |
| & Wastewater Revenue VRDO | 0.750% | 6/7/17 LOC | 5,000 | 5,000 |
| Eastern California Municipal Water District Water | | | | |
| & Wastewater Revenue VRDO | 0.750% | 6/7/17 | 5,000 | 5,000 |
| 1 Elk Grove CA Unified School District GO TOB PUT | 0.930% | 6/1/17 | 3,200 | 3,200 |
| Elsinore Valley CA Municipal Water District COP | | | | |
| VRDO | 0.720% | 6/7/17 LOC | 4,400 | 4,400 |
| Escondido CA Community Development Multifamily | | | | |
| Revenue (Heritage Park Apartments) VRDO | 0.800% | 6/7/17 LOC | 4,250 | 4,250 |
| Grossmont CA Healthcare District GO | 5.000% | 7/15/17 (Prere.) | 15,770 | 15,849 |
| 1 Huntington Beach CA City School District GO TOB | | | | |
| PUT | 0.930% | 8/23/17 | 3,045 | 3,045 |
| Irvine CA Assessment District No. 94-13 | | | | |
| Improvement Revenue (Oak Creek) VRDO | 0.760% | 6/1/17 LOC | 4,085 | 4,085 |
| Irvine CA Assessment District No. 97-16 | | | | |
| Improvement Revenue VRDO | 0.760% | 6/1/17 LOC | 6,700 | 6,700 |
| Irvine CA Assessment District No. 97-17 | | | | |
| Improvement Revenue VRDO | 0.760% | 6/1/17 LOC | 7,214 | 7,214 |
| Irvine CA Public Facilities & Infrastructure | | | | |
| Authority Assessment Revenue VRDO | 0.760% | 6/1/17 LOC | 12,978 | 12,978 |
| 2 Irvine CA Ranch Water District Revenue PUT | 0.850% | 3/7/18 | 10,000 | 10,000 |
| 2 Irvine CA Ranch Water District Revenue PUT | 0.850% | 3/7/18 | 8,290 | 8,290 |
| Irvine CA Reassessment District No. 05-21 | | | | |
| Improvement Revenue VRDO | 0.760% | 6/1/17 LOC | 27,794 | 27,794 |
| Irvine CA Reassessment District No. 85-7A | | | | |
| Improvement Revenue VRDO | 0.760% | 6/1/17 LOC | 31,811 | 31,811 |
| 1 Irvine Ranch CA Water District Revenue TOB | | | | |
| VRDO | 0.810% | 6/7/17 | 4,160 | 4,160 |
| Livermore CA Redevelopment Agency Multi-Family | | | | |
| Housing Revenue (Livermore Independent Senior | | | | |
| Apartments) VRDO | 0.770% | 6/7/17 LOC | 13,040 | 13,040 |
| Livermore CA Redevelopment Agency Multi-Family | | | | |
| Housing Revenue (Richards Manor) VRDO | 0.800% | 6/7/17 LOC | 4,770 | 4,770 |
17
California Municipal Money Market Fund
| | | | |
| | | | Face | Market |
| | | Maturity | Amount | Value• |
| | Coupon | Date | ($000) | ($000) |
| 1 Long Beach CA Harbor Revenue TOB VRDO | 0.800% | 6/7/17 | 4,000 | 4,000 |
| 1 Long Beach CA Unified School District GO TOB | | | | |
| VRDO | 0.800% | 6/7/17 | 2,500 | 2,500 |
| 1 Long Beach CA Unified School District GO TOB | | | | |
| VRDO | 0.800% | 6/7/17 | 21,060 | 21,060 |
| 1 Los Angeles CA Community College District GO | | | | |
| TOB VRDO | 0.840% | 6/7/17 (Prere.) | 15,940 | 15,940 |
| Los Angeles CA Community Redevelopment | | | | |
| Agency Multifamily Housing Revenue | | | | |
| (Hollywood & Vine Apartments) VRDO | 0.800% | 6/7/17 LOC | 16,200 | 16,200 |
| 1 Los Angeles CA Department of Airports | | | | |
| International Airport Revenue TOB VRDO | 0.800% | 6/7/17 | 3,700 | 3,700 |
| 1 Los Angeles CA Department of Airports | | | | |
| International Airport Revenue TOB VRDO | 0.800% | 6/7/17 | 4,700 | 4,700 |
| 1 Los Angeles CA Department of Airports | | | | |
| International Airport Revenue TOB VRDO | 0.800% | 6/7/17 | 5,000 | 5,000 |
| 1 Los Angeles CA Department of Airports | | | | |
| International Airport Revenue TOB VRDO | 0.810% | 6/7/17 | 2,500 | 2,500 |
| 1 Los Angeles CA Department of Airports | | | | |
| International Airport Revenue TOB VRDO | 0.830% | 6/7/17 | 2,600 | 2,600 |
| 1 Los Angeles CA Department of Airports | | | | |
| International Airport Revenue TOB VRDO | 0.830% | 6/7/17 | 1,470 | 1,470 |
| 1 Los Angeles CA Department of Airports | | | | |
| International Airport Revenue TOB VRDO | 0.840% | 6/7/17 | 5,020 | 5,020 |
| 1 Los Angeles CA Department of Airports | | | | |
| International Airport Revenue TOB VRDO | 0.840% | 6/7/17 | 6,665 | 6,665 |
| 1 Los Angeles CA Department of Airports | | | | |
| International Airport Revenue TOB VRDO | 0.840% | 6/7/17 | 7,545 | 7,545 |
| 1 Los Angeles CA Department of Airports | | | | |
| International Airport Revenue TOB VRDO | 0.840% | 6/7/17 | 4,660 | 4,660 |
| 1 Los Angeles CA Department of Airports | | | | |
| International Airport Revenue TOB VRDO | 0.860% | 6/7/17 | 18,885 | 18,885 |
| 1 Los Angeles CA Department of Airports | | | | |
| International Airport Revenue TOB VRDO | 0.860% | 6/7/17 | 7,980 | 7,980 |
| 1 Los Angeles CA Department of Water & Power | | | | |
| Revenue TOB VRDO | 0.800% | 6/7/17 | 6,200 | 6,200 |
| 1 Los Angeles CA Department of Water & Power | | | | |
| Revenue TOB VRDO | 0.800% | 6/7/17 | 1,150 | 1,150 |
| 1 Los Angeles CA Department of Water & Power | | | | |
| Revenue TOB VRDO | 0.800% | 6/7/17 | 7,500 | 7,500 |
| 1 Los Angeles CA Department of Water & Power | | | | |
| Revenue TOB VRDO | 0.810% | 6/7/17 | 10,900 | 10,900 |
| 1 Los Angeles CA Department of Water & Power | | | | |
| Revenue TOB VRDO | 0.810% | 6/7/17 | 10,835 | 10,835 |
| 1 Los Angeles CA Department of Water & Power | | | | |
| Revenue TOB VRDO | 0.810% | 6/7/17 | 4,000 | 4,000 |
| Los Angeles CA Department of Water & Power | | | | |
| Revenue VRDO | 0.660% | 6/1/17 | 18,140 | 18,140 |
| Los Angeles CA Department of Water & Power | | | | |
| Revenue VRDO | 0.780% | 6/1/17 | 12,000 | 12,000 |
| Los Angeles CA Department of Water & Power | | | | |
| Revenue VRDO | 0.720% | 6/7/17 | 37,550 | 37,550 |
| Los Angeles CA Department of Water & Power | | | | |
| Revenue VRDO | 0.720% | 6/7/17 | 20,600 | 20,600 |
18
California Municipal Money Market Fund
| | | | |
| | | | Face | Market |
| | | Maturity | Amount | Value• |
| | Coupon | Date | ($000) | ($000) |
| Los Angeles CA Department of Water & Power | | | | |
| Revenue VRDO | 0.730% | 6/7/17 | 12,150 | 12,150 |
| Los Angeles CA Department of Water & Power | | | | |
| Revenue VRDO | 0.730% | 6/7/17 | 10,000 | 10,000 |
| Los Angeles CA Department of Water & Power | | | | |
| Revenue VRDO | 0.730% | 6/7/17 | 4,200 | 4,200 |
| 1 Los Angeles CA Department of Water & Power | | | | |
| Revenue TOB VRDO | 0.790% | 6/7/17 | 12,675 | 12,675 |
| 1 Los Angeles CA Harbor Department Revenue TOB | | | | |
| VRDO | 0.820% | 6/7/17 (Prere.) | 8,150 | 8,150 |
| 1 Los Angeles CA Harbor Department Revenue TOB | | | | |
| VRDO | 0.860% | 6/7/17 | 2,220 | 2,220 |
| Los Angeles CA Metropolitan Transportation | | | | |
| Authority CP | 0.950% | 7/12/17 LOC | 3,100 | 3,100 |
| Los Angeles CA Multifamily Housing Revenue | | | | |
| (Queen Portfolio Apartments Project) VRDO | 0.800% | 6/7/17 LOC | 6,050 | 6,050 |
| Los Angeles CA Multifamily Housing Revenue | | | | |
| (San Regis Project) VRDO | 0.810% | 6/7/17 LOC | 23,600 | 23,600 |
| Los Angeles CA Municipal Improvement Corp. | | | | |
| Lease Revenue CP | 0.950% | 7/18/17 LOC | 7,000 | 7,000 |
| Los Angeles CA Municipal Improvement Corp. | | | | |
| Lease Revenue CP A4 | 0.950% | 7/18/17 LOC | 3,000 | 3,000 |
| Los Angeles CA Municipal Improvement Corp. | | | | |
| Lease Revenue CP A4 | 0.950% | 9/20/17 | 5,500 | 5,500 |
| Los Angeles CA TRAN | 3.000% | 6/29/17 | 100,000 | 100,163 |
| Los Angeles CA Unified School District GO | 5.000% | 7/1/17 (Prere.) | 6,980 | 7,004 |
| 1 Los Angeles CA Unified School District GO TOB | | | | |
| VRDO | 0.800% | 6/7/17 | 6,665 | 6,665 |
| 1 Los Angeles CA Unified School District GO TOB | | | | |
| VRDO | 0.800% | 6/7/17 | 10,000 | 10,000 |
| Los Angeles County CA Capital Asset Leasing | | | | |
| Corp. | 0.910% | 6/8/17 LOC | 7,290 | 7,290 |
| Los Angeles County CA Capital Asset Leasing | | | | |
| Corp. | 0.960% | 6/29/17 LOC | 5,000 | 5,000 |
| Los Angeles County CA Multifamily Housing | | | | |
| Revenue (Valencia Village Project) VRDO | 0.800% | 6/7/17 LOC | 20,650 | 20,650 |
| Manteca CA Redevelopment Agency Tax | | | | |
| Allocation Revenue VRDO | 0.750% | 6/1/17 LOC | 8,705 | 8,705 |
| Metropolitan Water District of Southern | | | | |
| California Revenue VRDO | 0.720% | 6/7/17 | 39,200 | 39,200 |
| Metropolitan Water District of Southern | | | | |
| California Revenue VRDO | 0.720% | 6/7/17 | 27,150 | 27,150 |
| Metropolitan Water District of Southern | | | | |
| California Revenue VRDO | 0.730% | 6/7/17 | 34,645 | 34,645 |
| Metropolitan Water District of Southern | | | | |
| California Revenue VRDO | 0.760% | 6/7/17 | 8,965 | 8,965 |
| Modesto CA Multifamily Housing Revenue | | | | |
| (Westdale Commons Apartments) VRDO | 0.760% | 6/7/17 LOC | 3,800 | 3,800 |
| Modesto CA Water Revenue VRDO | 0.790% | 6/7/17 LOC | 9,850 | 9,850 |
| 1 Mountain View-Whisman CA School District GO | | | | |
| TOB VRDO | 0.800% | 6/7/17 | 4,800 | 4,800 |
| Napa Valley CA Unified School District GO | 2.000% | 8/1/17 | 9,135 | 9,155 |
| 1 Nuveen California AMT-Free Quality Municipal | | | | |
| Income Fund VRDP VRDO | 0.860% | 6/7/17 LOC | 39,500 | 39,500 |
19
California Municipal Money Market Fund
| | | | |
| | | | Face | Market |
| | | Maturity | Amount | Value• |
| | Coupon | Date | ($000) | ($000) |
| 1 Nuveen California AMT-Free Quality Municipal | | | | |
| Income Fund VRDP VRDO | 0.860% | 6/7/17 LOC | 16,200 | 16,200 |
| 1 Nuveen California AMT-Free Quality Municipal | | | | |
| Income Fund VRDP VRDO | 0.860% | 6/7/17 LOC | 40,000 | 40,000 |
| 1 Nuveen California AMT-Free Quality Municipal | | | | |
| Income Fund VRDP VRDO | 0.860% | 6/7/17 LOC | 5,000 | 5,000 |
| 1 Nuveen California Dividend Advantage Municipal | | | | |
| Fund VRDP VRDO | 0.900% | 6/7/17 LOC | 12,000 | 12,000 |
| 1 Nuveen California Dividend Advantage Municipal | | | | |
| Fund VRDP VRDO | 0.900% | 6/7/17 LOC | 9,000 | 9,000 |
| 1 Nuveen California Dividend Advantage Municipal | | | | |
| Fund VRDP VRDO | 0.910% | 6/7/17 LOC | 24,000 | 24,000 |
| 1 Nuveen California Dividend Advantage Municipal | | | | |
| Fund VRDP VRDO | 0.910% | 6/7/17 LOC | 26,800 | 26,800 |
| 1 Nuveen California Dividend Advantage Municipal | | | | |
| Fund VRDP VRDO | 0.910% | 6/7/17 LOC | 41,600 | 41,600 |
| 1 Nuveen California Dividend Advantage Municipal | | | | |
| Fund VRDP VRDO | 0.910% | 6/7/17 LOC | 40,900 | 40,900 |
| Oceanside CA Multifamily Housing Revenue | | | | |
| (Shadow Way Apartments Project) VRDO | 0.780% | 6/7/17 LOC | 7,425 | 7,425 |
| Orange County CA Apartment Development | | | | |
| Revenue VRDO | 0.790% | 6/7/17 LOC | 9,550 | 9,550 |
| 1 Palomar CA Community College District GO | | | | |
| TOB VRDO | 0.800% | 6/7/17 | 6,400 | 6,400 |
| Palomar Pomerado Health California GO | 5.000% | 8/1/17 (Prere.) | 11,290 | 11,367 |
| 1 Peralta CA Community College District Revenue | | | | |
| TOB VRDO | 0.810% | 6/7/17 | 15,000 | 15,000 |
| Rancho CA Water District Finance Authority | | | | |
| Revenue VRDO | 0.700% | 6/7/17 LOC | 18,000 | 18,000 |
| 1 Regents of the University of California Revenue | | | | |
| TOB VRDO | 0.800% | 6/7/17 | 5,125 | 5,125 |
| 1 Regents of the University of California Revenue | | | | |
| TOB VRDO | 0.810% | 6/7/17 | 4,109 | 4,109 |
| 1 Regents of the University of California Revenue | | | | |
| TOB VRDO | 0.850% | 6/7/17 (Prere.) | 25,293 | 25,293 |
| Riverside CA COP VRDO | 0.760% | 6/7/17 LOC | 22,100 | 22,100 |
| 1 Riverside CA Electric Revenue TOB VRDO | 0.800% | 6/7/17 | 9,700 | 9,700 |
| Riverside County CA GO | 3.000% | 6/30/17 | 33,500 | 33,559 |
| Riverside County CA Teeter Revenue | 3.000% | 10/11/17 | 8,500 | 8,564 |
| 1 Sacramento CA Area Flood Control Agency Special | | | | |
| Assessment Revenue TOB VRDO | 0.800% | 6/7/17 | 6,000 | 6,000 |
| 1 Sacramento CA Area Flood Control Agency Special | | | | |
| Assessment Revenue TOB VRDO | 0.800% | 6/7/17 | 10,000 | 10,000 |
| Sacramento CA Municipal Utility District | | | | |
| Revenue CP | 0.940% | 6/21/17 LOC | 35,000 | 35,000 |
| Sacramento CA Transportation Authority Sales Tax | | | | |
| Revenue VRDO | 0.740% | 6/7/17 | 86,100 | 86,100 |
| Sacramento County CA Multifamily Housing | | | | |
| Revenue (River Pointe Apartments) VRDO | 0.800% | 6/7/17 LOC | 12,300 | 12,300 |
| Sacramento County CA Multifamily Housing | | | | |
| Revenue (River Pointe Apartments) VRDO | 0.800% | 6/7/17 LOC | 9,700 | 9,700 |
| Sacramento County CA Sanitation Districts | | | | |
| Financing Authority Revenue VRDO | 0.730% | 6/7/17 LOC | 17,670 | 17,670 |
20
California Municipal Money Market Fund
| | | | |
| | | | Face | Market |
| | | Maturity | Amount | Value• |
| | Coupon | Date | ($000) | ($000) |
| 1 San Bernardino CA Community College District | | | | |
| GO TOB VRDO | 0.810% | 6/7/17 | 4,620 | 4,620 |
| 1 San Bernardino County CA Transportation | | | | |
| Authority Revenue TOB VRDO | 0.800% | 6/7/17 | 12,100 | 12,100 |
| 1 San Diego CA Community College District GO | | | | |
| TOB VRDO | 0.800% | 6/7/17 (Prere.) | 5,710 | 5,710 |
| 1 San Diego CA Community College District GO | | | | |
| TOB VRDO | 0.830% | 6/7/17 (Prere.) | 3,490 | 3,490 |
| San Diego CA Housing Authority Multifamily | | | | |
| Housing Revenue (Bay Vista Apartments | | | | |
| Project) VRDO | 0.810% | 6/7/17 LOC | 9,690 | 9,690 |
| 1 San Diego CA Public Facilities Financing | | | | |
| Authority Sewer Revenue TOB VRDO | 0.830% | 6/7/17 | 4,210 | 4,210 |
| 1 San Diego CA Public Facilities Financing | | | | |
| Authority Water Revenue TOB VRDO | 0.800% | 6/7/17 | 3,800 | 3,800 |
| San Diego CA Unified School District GO | 2.000% | 6/30/17 | 36,310 | 36,347 |
| San Diego County CA Regional Transportation | | | | |
| Authority Sales Tax Revenue VRDO | 0.730% | 6/7/17 | 43,100 | 43,100 |
| 1 San Diego County CA Regional Transportation | | | | |
| Commission Sales Tax Revenue TOB VRDO | 0.800% | 6/7/17 | 4,445 | 4,445 |
| San Diego County CA Regional Transportation | | | | |
| Commission Sales Tax Revenue VRDO | 0.730% | 6/7/17 | 1,600 | 1,600 |
| San Diego County CA Regional Transportation | | | | |
| Commission Sales Tax Revenue VRDO | 0.730% | 6/7/17 | 59,230 | 59,230 |
| San Diego County CA Water Authority Revenue | | | | |
| (Extendible) CP | 0.990% | 12/29/17 | 17,500 | 17,500 |
| San Diego County CA Water Authority Revenue | | | | |
| (Extendible) CP | 0.850% | 2/12/18 | 12,500 | 12,500 |
| 1 San Diego County CA Water Authority Revenue | | | | |
| COP TOB VRDO | 0.800% | 6/7/17 | 10,100 | 10,100 |
| San Diego County CA Water Authority Revenue | | | | |
| CP | 0.840% | 6/23/17 | 5,000 | 5,000 |
| San Diego Public Facilities CP | 0.970% | 7/18/17 LOC | 2,000 | 2,000 |
| San Diego Public Facilities CP | 0.990% | 8/3/17 LOC | 5,449 | 5,449 |
| San Francisco CA Bay Area Rapid Transit District | | | | |
| GO | 5.000% | 8/1/17 (Prere.) | 15,000 | 15,106 |
| 1 San Francisco CA Bay Area Rapid Transit District | | | | |
| Sales Tax Revenue TOB VRDO | 0.800% | 6/7/17 | 3,750 | 3,750 |
| 1 San Francisco CA Bay Area Rapid Transit District | | | | |
| Sales Tax Revenue TOB VRDO | 0.810% | 6/7/17 | 9,900 | 9,900 |
| San Francisco CA City & County Finance Corp. | | | | |
| Lease Revenue (Moscone Center Expansion) | | | | |
| VRDO | 0.750% | 6/7/17 LOC | 38,855 | 38,855 |
| San Francisco CA City & County Finance Corp. | | | | |
| Lease Revenue (Moscone Center Expansion) | | | | |
| VRDO | 0.750% | 6/7/17 LOC | 9,815 | 9,815 |
| San Francisco CA City & County GO | 2.000% | 6/15/17 | 47,360 | 47,383 |
| 1 San Francisco CA City & County GO TOB VRDO | 0.790% | 6/7/17 | 11,450 | 11,450 |
| San Francisco CA City & County International | | | | |
| Airport Revenue CP Series A-4 | 0.990% | 8/24/17 LOC | 10,000 | 10,000 |
| San Francisco CA City & County International | | | | |
| Airport Revenue CP Series B-1 | 0.960% | 8/23/17 LOC | 58,000 | 58,000 |
| San Francisco CA City & County International | | | | |
| Airport Revenue VRDO | 0.720% | 6/7/17 LOC | 7,750 | 7,750 |
21
California Municipal Money Market Fund
| | | | |
| | | | Face | Market |
| | | Maturity | Amount | Value• |
| | Coupon | Date | ($000) | ($000) |
| San Francisco CA City & County International | | | | |
| Airport Revenue VRDO | 0.720% | 6/7/17 LOC | 12,600 | 12,600 |
| San Francisco CA City & County International | | | | |
| Airport Revenue VRDO | 0.730% | 6/7/17 LOC | 17,600 | 17,600 |
| San Francisco CA City & County Lease Revenue | | | | |
| CP | 0.880% | 6/7/17 | 17,533 | 17,533 |
| San Francisco CA City & County Public Utilities | | | | |
| Commission Sewer Revenue CP | 0.880% | 6/6/17 | 10,121 | 10,121 |
| 1 San Francisco CA City & County Public Utilities | | | | |
| Commission Water Revenue TOB VRDO | 0.820% | 6/7/17 (Prere.) | 47,850 | 47,850 |
| San Francisco CA City & County Redevelopment | | | | |
| Agency Multifamily Housing Revenue (Third & | | | | |
| Mission Streets) VRDO | 0.790% | 6/7/17 LOC | 45,100 | 45,100 |
| San Francisco CA Public Utilities Commission CP | 0.930% | 6/7/17 LOC | 5,500 | 5,500 |
| 1 San Joaquin Delta CA Community College | | | | |
| District GO TOB VRDO | 0.880% | 6/7/17 | 4,835 | 4,835 |
| San Jose CA Multifamily Housing Revenue | | | | |
| (Cinnabar Commons) VRDO | 0.810% | 6/7/17 LOC | 15,200 | 15,200 |
| 1 San Jose CA Unified School District Santa Clara | | | | |
| County GO TOB VRDO | 0.800% | 6/7/17 | 6,000 | 6,000 |
| 1 San Jose CA Unified School District Santa Clara | | | | |
| County GO TOB VRDO | 0.900% | 6/7/17 | 7,310 | 7,310 |
| 1 San Luis Obispo County CA Financing Authority | | | | |
| Revenue (Nacimiento Water Project) TOB VRDO | 0.810% | 6/7/17 (13) | 23,570 | 23,570 |
| Santa Clara CA Electric Revenue VRDO | 0.750% | 6/7/17 LOC | 2,250 | 2,250 |
| 1 Santa Clara County CA Financing Authority Lease | | | | |
| Revenue (Multiple Facilities Projects) TOB VRDO | 1.040% | 6/7/17 (Prere.) | 7,500 | 7,500 |
| Santa Clara Valley CA Transportation Authority | | | | |
| Sales Tax Revenue VRDO | 0.740% | 6/7/17 | 15,200 | 15,200 |
| 1 Santa Monica CA Community College District GO | | | | |
| TOB VRDO | 0.800% | 6/7/17 | 1,200 | 1,200 |
| 1 Solano County CA Community College District GO | | | | |
| TOB VRDO | 0.800% | 6/7/17 | 3,000 | 3,000 |
| Sonoma County CA Junior College District GO | 3.000% | 8/1/17 | 3,350 | 3,362 |
| Southern California Public Power Authority | | | | |
| Revenue VRDO | 0.730% | 6/7/17 LOC | 22,600 | 22,600 |
| Turlock CA Irrigation District Revenue CP | 0.950% | 7/13/17 LOC | 4,997 | 4,997 |
| 1 University of California Revenue TOB VRDO | 0.800% | 6/7/17 | 5,000 | 5,000 |
| 1 University of California Revenue TOB VRDO | 0.820% | 6/7/17 | 3,040 | 3,040 |
| 1 University of California Revenue TOB VRDO | 0.820% | 6/7/17 | 2,675 | 2,675 |
| University of California Revenue VRDO | 0.740% | 6/7/17 | 19,100 | 19,100 |
| University of California Revenue VRDO | 0.750% | 6/7/17 | 90,150 | 90,150 |
| Total Tax-Exempt Municipal Bonds (Cost $3,822,746) | | | 3,822,746 |
22
California Municipal Money Market Fund
| |
| | Amount |
| | ($000) |
| Other Assets and Liabilities (0.0%) | |
| Other Assets | |
| Investments in Vanguard | 255 |
| Receivables for Investment Securities Sold | 13,200 |
| Receivables for Accrued Income | 9,013 |
| Receivables for Capital Shares Issued | 7,923 |
| Other Assets | 6,852 |
| Total Other Assets | 37,243 |
| Liabilities | |
| Payables for Investment Securities Purchased | (24,370) |
| Payables for Capital Shares Redeemed | (7,454) |
| Payables for Distributions | (116) |
| Payables to Vanguard | (5,451) |
| Other Liabilities | (1) |
| Total Liabilities | (37,392) |
| Net Assets (100%) | |
| Applicable to 3,821,874,514 outstanding $.001 par value shares of | |
| beneficial interest (unlimited authorization) | 3,822,597 |
| Net Asset Value Per Share | $1.00 |
| |
| |
| At May 31, 2017, net assets consisted of: | |
| | Amount |
| | ($000) |
| Paid-in Capital | 3,822,510 |
| Undistributed Net Investment Income | — |
| Accumulated Net Realized Gains | 87 |
| Net Assets | 3,822,597 |
• See Note A in Notes to Financial Statements.
1 Security exempt from registration under Rule 144A of the Securities Act of 1933. Such securities may be sold in transactions exempt from
registration, normally to qualified institutional buyers. At May 31, 2017, the aggregate value of these securities was $1,055,485,000,
representing 27.6% of net assets.
2 Adjustable-rate security.
A key to abbreviations and other references follows the Statement of Net Assets.
See accompanying Notes, which are an integral part of the Financial Statements.
23
California Municipal Money Market Fund
Key to Abbreviations
ARS—Auction Rate Security.
BAN—Bond Anticipation Note.
COP—Certificate of Participation.
CP—Commercial Paper.
FR—Floating Rate.
GAN—Grant Anticipation Note.
GO—General Obligation Bond.
PILOT—Payments in Lieu of Taxes.
PUT—Put Option Obligation.
RAN—Revenue Anticipation Note.
TAN—Tax Anticipation Note.
TOB—Tender Option Bond.
TRAN—Tax Revenue Anticipation Note.
VRDO—Variable Rate Demand Obligation.
VRDP—Variable Rate Demand Preferred.
(ETM)—Escrowed to Maturity.
(Prere.)—Prerefunded.
Scheduled principal and interest payments are guaranteed by:
(1) MBIA (Municipal Bond Investors Assurance).
(2) AMBAC (Ambac Assurance Corporation).
(3) FGIC (Financial Guaranty Insurance Company).
(4) AGM (Assured Guaranty Municipal Corporation).
(5) BIGI (Bond Investors Guaranty Insurance).
(6) Connie Lee Inc.
(7) FHA (Federal Housing Authority).
(8) CapMAC (Capital Markets Assurance Corporation).
(9) American Capital Access Financial Guaranty Corporation.
(10) XL Capital Assurance Inc.
(11) CIFG (CDC IXIS Financial Guaranty).
(12) AGC (Assured Guaranty Corporation).
(13) BHAC (Berkshire Hathaway Assurance Corporation).
(14) NPFG (National Public Finance Guarantee Corporation).
(15) BAM (Build America Mutual Assurance Company).
(16) MAC (Municipal Assurance Corporation).
(17) RAA (Radian Asset Assurance Inc.).
(18) SBLF (Michigan School Bond Loan Fund).
The insurance does not guarantee the market value of the municipal bonds.
LOC—Scheduled principal and interest payments are guaranteed by bank letter of credit.
24
California Municipal Money Market Fund
| |
| Statement of Operations | |
| |
| | Six Months Ended |
| | May 31, 2017 |
| | ($000) |
| Investment Income | |
| Income | |
| Interest | 13,560 |
| Total Income | 13,560 |
| Expenses | |
| The Vanguard Group—Note B | |
| Investment Advisory Services | 513 |
| Management and Administrative | 1,945 |
| Marketing and Distribution | 431 |
| Custodian Fees | 18 |
| Shareholders’ Reports | 32 |
| Trustees’ Fees and Expenses | 1 |
| Total Expenses | 2,940 |
| Net Investment Income | 10,620 |
| Realized Net Gain (Loss) on Investment Securities Sold | 97 |
| Net Increase (Decrease) in Net Assets Resulting from Operations | 10,717 |
See accompanying Notes, which are an integral part of the Financial Statements.
25
California Municipal Money Market Fund
| | |
| Statement of Changes in Net Assets | | |
| |
| | Six Months Ended | Year Ended |
| | May 31, | November 30, |
| | 2017 | 2016 |
| | ($000) | ($000) |
| Increase (Decrease) in Net Assets | | |
| Operations | | |
| Net Investment Income | 10,620 | 8,193 |
| Realized Net Gain (Loss) | 97 | (6) |
| Net Increase (Decrease) in Net Assets Resulting from Operations | 10,717 | 8,187 |
| Distributions | | |
| Net Investment Income | (10,622) | (8,191) |
| Realized Capital Gain | — | — |
| Total Distributions | (10,622) | (8,191) |
| Capital Share Transactions (at $1.00 per share) | | |
| Issued | 1,302,836 | 2,330,153 |
| Issued in Lieu of Cash Distributions | 9,967 | 7,719 |
| Redeemed | (995,368) | (2,223,425) |
| Net Increase (Decrease) from Capital Share Transactions | 317,435 | 114,447 |
| Total Increase (Decrease) | 317,530 | 114,443 |
| Net Assets | | |
| Beginning of Period | 3,505,067 | 3,390,624 |
| End of Period1 | 3,822,597 | 3,505,067 |
1 Net Assets—End of Period includes undistributed (overdistributed) net investment income of $0 and $2,000.
See accompanying Notes, which are an integral part of the Financial Statements.
26
California Municipal Money Market Fund
| | | | | | |
| Financial Highlights | | | | | | |
| |
| |
| |
| Six Months | | | | | |
| | Ended | | | | | |
| For a Share Outstanding | May 31, | Year Ended November 30, |
| Throughout Each Period | 2017 | 2016 | 2015 | 2014 | 2013 | 2012 |
| Net Asset Value, Beginning of Period | $1.00 | $1.00 | $1.00 | $1.00 | $1.00 | $1.00 |
| Investment Operations | | | | | | |
| Net Investment Income | .003 | .002 | .0001 | .0001 | .0001 | .0003 |
| Net Realized and Unrealized Gain (Loss) | | | | | | |
| on Investments | — | — | — | — | — | — |
| Total from Investment Operations | .003 | .002 | .0001 | .0001 | .0001 | .0003 |
| Distributions | | | | | | |
| Dividends from Net Investment Income | (.003) | (.002) | (.0001) | (.0001) | (.0001) | (.0003) |
| Distributions from Realized Capital Gains | — | — | — | — | — | — |
| Total Distributions | (.003) | (.002) | (.0001) | (.0001) | (.0001) | (.0003) |
| Net Asset Value, End of Period | $1.00 | $1.00 | $1.00 | $1.00 | $1.00 | $1.00 |
| |
| Total Return1 | 0.29% | 0.25% | 0.01% | 0.01% | 0.01% | 0.03% |
| |
| Ratios/Supplemental Data | | | | | | |
| Net Assets, End of Period (Millions) | $3,823 | $3,505 | $3,391 | $3,586 | $3,872 | $3,813 |
| Ratio of Total Expenses to | | | | | | |
| Average Net Assets | 0.16% | 0.13%2 | 0.06%2 | 0.07%2 | 0.11%2 | 0.15%2 |
| Ratio of Net Investment Income to | | | | | | |
| Average Net Assets | 0.58% | 0.25% | 0.01% | 0.01% | 0.01% | 0.03% |
The expense ratio and net investment income ratio for the current period have been annualized.
1 Total returns do not include account service fees that may have applied in the periods shown. Fund prospectuses provide information about
any applicable account service fees.
2 The ratio of total expenses to average net assets before an expense reduction was 0.16% for 2016, 0.16% for 2015, 0.16% for 2014, 0.16%
for 2013, and 0.16% for 2012. See Note B in Notes to Financial Statements.
See accompanying Notes, which are an integral part of the Financial Statements.
27
California Municipal Money Market Fund
Notes to Financial Statements
Vanguard California Municipal Money Market Fund is registered under the Investment Company Act of 1940 as an open-end investment company, or mutual fund. The fund invests in debt instruments of municipal issuers whose ability to meet their obligations may be affected by economic and political developments in the state. The fund changed its name from Vanguard California Tax-Exempt Money Market Fund to Vanguard California Municipal Money Market Fund in March 2017.
A. The following significant accounting policies conform to generally accepted accounting principles for U.S. investment companies. The fund consistently follows such policies in preparing its financial statements.
1. Security Valuation: Securities are valued as of the close of trading on the New York Stock Exchange (generally 4 p.m., Eastern time) on the valuation date. Securities are valued at amortized cost, which approximates market value.
2. Federal Income Taxes: The fund intends to continue to qualify as a regulated investment company and distribute all of its income. Management has analyzed the fund’s tax positions taken for all open federal income tax years (November 30, 2013–2016), and for the period ended May 31, 2017, and has concluded that no provision for federal income tax is required in the fund’s financial statements.
3. Distributions: Distributions from net investment income are declared daily and paid on the first business day of the following month.
4. Credit Facility: The fund and certain other funds managed by The Vanguard Group (“Vanguard”) participate in a $3.1 billion committed credit facility provided by a syndicate of lenders pursuant to a credit agreement that may be renewed annually; each fund is individually liable for its borrowings, if any, under the credit facility. Borrowings may be utilized for temporary and emergency purposes, and are subject to the fund’s regulatory and contractual borrowing restrictions. The participating funds are charged administrative fees and an annual commitment fee of 0.10% of the undrawn amount of the facility; these fees are allocated to the funds based on a method approved by the fund’s board of trustees and included in Management and Administrative expenses on the fund’s Statement of Operations. Any borrowings under this facility bear interest at a rate based upon the higher of the one-month London Interbank Offered Rate, federal funds effective rate, or overnight bank funding rate plus an agreed-upon spread.
The fund had no borrowings outstanding at May 31, 2017, or at any time during the period then ended.
5. Other: Interest income is accrued daily. Premiums and discounts on debt securities purchased are amortized and accreted, respectively, to interest income over the lives of the respective securities. Security transactions are accounted for on the date securities are bought or sold. Costs used to determine realized gains (losses) on the sale of investment securities are those of the specific securities sold.
B. In accordance with the terms of a Funds’ Service Agreement (the “FSA”) between Vanguard and the fund, Vanguard furnishes to the fund investment advisory, corporate management, administrative, marketing, and distribution services at Vanguard’s cost of operations (as defined by the FSA). These costs of operations are allocated to the fund based on methods and guidelines approved by the board of trustees. Vanguard does not require reimbursement in the current period for certain costs of operations (such as deferred compensation/benefits and risk/insurance costs); the fund’s liability for these costs of operations is included in Payables to Vanguard on the Statement of Net Assets.
28
California Municipal Money Market Fund
Upon the request of Vanguard, the fund may invest up to 0.40% of its net assets as capital in Vanguard. At May 31, 2017, the fund had contributed to Vanguard capital in the amount of $255,000, representing 0.01% of the fund’s net assets and 0.10% of Vanguard’s capitalization. The fund’s trustees and officers are also directors and employees, respectively, of Vanguard.
Vanguard and the board of trustees have agreed to temporarily limit certain net operating expenses in excess of the fund’s daily yield in order to maintain a zero or positive yield for the fund. Vanguard and the board of trustees may terminate the temporary expense limitation at any time. The fund is not obligated to repay this amount to Vanguard. For the period ended May 31, 2017, the fund did not receive an expense reduction from Vanguard.
C. Various inputs may be used to determine the value of the fund’s investments. These inputs are summarized in three broad levels for financial statement purposes. The inputs or methodologies used to value securities are not necessarily an indication of the risk associated with investing in those securities.
Level 1—Quoted prices in active markets for identical securities.
Level 2—Other significant observable inputs (including quoted prices for similar securities, interest rates, prepayment speeds, credit risk, etc.).
Level 3—Significant unobservable inputs (including the fund’s own assumptions used to determine the fair value of investments).
At May 31, 2017, 100% of the market value of the fund’s investments was determined using amortized cost, in accordance with rules under the Investment Company Act of 1940. Amortized cost approximates the current fair value of a security, but since the value is not obtained from a quoted price in an active market, securities valued at amortized cost are considered to be valued using Level 2 inputs.
D. The fund purchased securities from and sold securities to other Vanguard funds or accounts managed by Vanguard or its affiliates, in accordance with procedures adopted by the board of trustees in compliance with Rule 17a-7 of the Investment Act of 1940. For the six months ended May 31,2017, such purchases and sales were $267,351,000 and $198,016,000 respectively.
E. Management has determined that no material events or transactions occurred subsequent to May 31, 2017, that would require recognition or disclosure in these financial statements.
29
California Intermediate-Term Tax-Exempt Fund
| | |
| Fund Profile | | |
| As of May 31, 2017 | | |
| |
| Share-Class Characteristics | |
| | Investor | Admiral |
| | Shares | Shares |
| Ticker Symbol | VCAIX | VCADX |
| Expense Ratio1 | 0.19% | 0.09% |
| 30-Day SEC Yield | 1.75% | 1.85% |
| | |
| Volatility Measures | | |
| | Bloomberg | Bloomberg |
| | Barclays Muni | Barclays |
| | CA IT | Municipal |
| | Bond Index | Bond Index |
| R-Squared | 0.96 | 0.99 |
| Beta | 1.00 | 0.97 |
| | | |
| Financial Attributes | | |
| |
| |
| | | Bloomberg | |
| | | Barclays | |
| | | Muni | Bloomberg |
| | | CA IT | Barclays |
| | | Bond | Municipal |
| | Fund | Index | Bond Index |
| |
| Number of Bonds | 3,016 | 1,666 | 50,785 |
| |
| Yield to Maturity | | | |
| (before expenses) | 1.8% | 1.6% | 2.1% |
| |
| Average Coupon | 4.4% | 4.7% | 4.8% |
| |
| Average Duration | 5.4 years | 5.0 years | 6.2 years |
| |
| Average Stated | | | |
| Maturity | 8.9 years | 7.4 years | 12.9 years |
| |
| Short-Term | | | |
| Reserves | 2.4% | — | — |
These measures show the degree and timing of the fund’s fluctuations compared with the indexes over 36 months.
| |
| Distribution by Stated Maturity | |
| (% of portfolio) | |
| Under 1 Year | 4.7% |
| 1 - 3 Years | 12.6 |
| 3 - 5 Years | 10.9 |
| 5 - 10 Years | 26.3 |
| 10 - 20 Years | 45.1 |
| 20 - 30 Years | 0.4 |
| |
| Distribution by Credit Quality (% of portfolio) |
| AAA | 6.7% |
| AA | 71.3 |
| A | 14.6 |
| BBB | 5.6 |
| BB | 0.3 |
| B | 0.1 |
| Not Rated | 1.4 |
Credit-quality ratings are obtained from Moody's and S&P, and the higher rating for each issue is shown. "Not Rated" is used to
classify securities for which a rating is not available. Not rated securities include a fund's investment in Vanguard Market Liquidity
Fund or Vanguard Municipal Cash Management Fund, each of which invests in high-quality money market instruments and may
serve as a cash management vehicle for the Vanguard funds, trusts, and accounts. For more information about these ratings, see
the Glossary entry for Credit Quality.
1 The expense ratios shown are from the prospectus dated March 28, 2017, and represent estimated costs for the current fiscal year. For the six months ended May 31, 2017, the annualized expense ratios were 0.19% for Investor Shares and 0.09% for Admiral Shares.
30
California Intermediate-Term Tax-Exempt Fund
Investment Focus
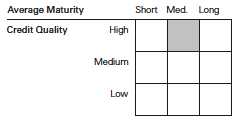
31
California Intermediate-Term Tax-Exempt Fund
Performance Summary
All of the returns in this report represent past performance, which is not a guarantee of future results that may be achieved by the fund. (Current performance may be lower or higher than the performance data cited. For performance data current to the most recent month-end, visit our website at vanguard.com/performance.) Note, too, that both investment returns and principal value can fluctuate widely, so an investor’s shares, when sold, could be worth more or less than their original cost. The returns shown do not reflect taxes that a shareholder would pay on fund distributions or on the sale of fund shares.
| | | | |
| Fiscal-Year Total Returns (%): November 30, 2006, Through May 31, 2017 | |
| | | | | Bloomberg |
| | | | | Barclays Muni |
| | | | | CA IT |
| | | | Investor Shares | Bond Index |
| Fiscal Year | Income Returns | Capital Returns | Total Returns | Total Returns |
| 2007 | 3.99% | -1.53% | 2.46% | 3.84% |
| 2008 | 3.79 | -6.50 | -2.71 | 1.84 |
| 2009 | 4.19 | 6.37 | 10.56 | 9.03 |
| 2010 | 3.79 | 0.64 | 4.43 | 6.89 |
| 2011 | 3.88 | 2.29 | 6.17 | 6.79 |
| 2012 | 3.52 | 6.62 | 10.14 | 9.08 |
| 2013 | 3.12 | -5.03 | -1.91 | -1.15 |
| 2014 | 3.23 | 4.06 | 7.29 | 6.12 |
| 2015 | 2.85 | 0.08 | 2.93 | 2.85 |
| 2016 | 2.52 | -3.14 | -0.62 | -1.16 |
| 2017 | 1.35 | 3.59 | 4.94 | 5.15 |
| Note: For 2017, performance data reflect the six months ended May 31, 2017. | | |
Average Annual Total Returns: Periods Ended March 31, 2017
This table presents returns through the latest calendar quarter—rather than through the end of the fiscal period.
Securities and Exchange Commission rules require that we provide this information.
| | | | | | |
| | | | | | | Ten Years |
| | Inception Date | One Year | Five Years | Income | Capital | Total |
| Investor Shares | 3/4/1994 | -0.41% | 3.22% | 3.45% | 0.56% | 4.01% |
| Admiral Shares | 11/12/2001 | -0.31 | 3.31 | 3.53 | 0.56 | 4.09 |
See Financial Highlights for dividend and capital gains information.
32
California Intermediate-Term Tax-Exempt Fund
Financial Statements (unaudited)
Statement of Net Assets
As of May 31, 2017
The fund reports a complete list of its holdings in regulatory filings four times in each fiscal year, at the quarter-ends. For the second and fourth fiscal quarters, the lists appear in the fund’s semiannual and annual reports to shareholders. For the first and third fiscal quarters, the fund files the lists with the Securities and Exchange Commission on Form N-Q. Shareholders can look up the fund’s Forms N-Q on the SEC’s website at sec.gov. Forms N-Q may also be reviewed and copied at the SEC’s Public Reference Room (see the back cover of this report for further information).
| | | | |
| | | | Face | Market |
| | | Maturity | Amount | Value• |
| | Coupon | Date | ($000) | ($000) |
| Tax-Exempt Municipal Bonds (99.7%) | | | | |
| California (99.4%) | | | | |
| ABAG Finance Authority for Nonprofit Corps. | | | | |
| California Revenue (Episcopal Senior | | | | |
| Communities) | 5.000% | 7/1/23 | 700 | 799 |
| ABAG Finance Authority for Nonprofit Corps. | | | | |
| California Revenue (Episcopal Senior | | | | |
| Communities) | 5.000% | 7/1/24 | 1,195 | 1,355 |
| ABAG Finance Authority for Nonprofit Corps. | | | | |
| California Revenue (Episcopal Senior | | | | |
| Communities) | 6.000% | 7/1/31 | 2,750 | 3,065 |
| ABAG Finance Authority for Nonprofit Corps. | | | | |
| California Revenue (Episcopal Senior | | | | |
| Communities) | 5.000% | 7/1/32 | 1,060 | 1,161 |
| ABAG Finance Authority for Nonprofit Corps. | | | | |
| California Revenue (Eskaton Properties Inc. | | | | |
| Obligated Group) | 5.000% | 11/15/35 | 3,250 | 3,504 |
| ABAG Finance Authority for Nonprofit Corps. | | | | |
| California Revenue (Jackson Laboratory) | 5.000% | 7/1/20 | 850 | 943 |
| ABAG Finance Authority for Nonprofit Corps. | | | | |
| California Revenue (Jackson Laboratory) | 5.000% | 7/1/22 | 555 | 646 |
| ABAG Finance Authority for Nonprofit Corps. | | | | |
| California Revenue (Jackson Laboratory) | 5.000% | 7/1/23 | 1,000 | 1,155 |
| ABAG Finance Authority for Nonprofit Corps. | | | | |
| California Revenue (Jackson Laboratory) | 5.000% | 7/1/24 | 1,265 | 1,451 |
| ABAG Finance Authority for Nonprofit Corps. | | | | |
| California Revenue (Odd Fellows Home) | 5.000% | 4/1/32 | 7,250 | 8,347 |
| ABAG Finance Authority for Nonprofit Corps. | | | | |
| California Revenue (Sharp Healthcare) | 5.000% | 8/1/21 | 1,000 | 1,152 |
| ABAG Finance Authority for Nonprofit Corps. | | | | |
| California Revenue (Sharp Healthcare) | 5.250% | 8/1/23 | 1,000 | 1,150 |
| ABAG Finance Authority for Nonprofit Corps. | | | | |
| California Revenue (Sharp Healthcare) | 5.000% | 8/1/24 | 960 | 1,103 |
| ABAG Finance Authority for Nonprofit Corps. | | | | |
| California Revenue (Sharp Healthcare) | 5.000% | 8/1/25 | 950 | 1,089 |
| ABAG Finance Authority for Nonprofit Corps. | | | | |
| California Revenue (Sharp Healthcare) | 5.000% | 8/1/26 | 2,490 | 2,837 |
| ABAG Finance Authority for Nonprofit Corps. | | | | |
| California Revenue (Sharp Healthcare) | 5.000% | 8/1/28 | 900 | 1,023 |
33
California Intermediate-Term Tax-Exempt Fund
| | | | |
| | | | Face | Market |
| | | Maturity | Amount | Value• |
| | Coupon | Date | ($000) | ($000) |
| ABAG Finance Authority for Nonprofit Corps. | | | | |
| California Revenue (Sharp Healthcare) | 6.000% | 8/1/30 | 18,120 | 21,041 |
| ABAG Finance Authority for Nonprofit Corps. | | | | |
| California Revenue (Sharp Healthcare) | 5.000% | 8/1/31 | 1,000 | 1,147 |
| ABAG Finance Authority for Nonprofit Corps. | | | | |
| California Revenue (Sharp Healthcare) | 5.000% | 8/1/32 | 1,000 | 1,144 |
| ABAG Finance Authority for Nonprofit Corps. | | | | |
| California Revenue (Sharp Healthcare) | 5.000% | 8/1/34 | 1,780 | 2,026 |
| ABAG Finance Authority for Nonprofit Corps. | | | | |
| California Revenue (Windemere Ranch | | | | |
| Infrastructure Financing Program) | 5.000% | 9/2/21 | 275 | 314 |
| ABAG Finance Authority for Nonprofit Corps. | | | | |
| California Revenue (Windemere Ranch | | | | |
| Infrastructure Financing Program) | 5.000% | 9/2/22 | 355 | 413 |
| ABAG Finance Authority for Nonprofit Corps. | | | | |
| California Revenue (Windemere Ranch | | | | |
| Infrastructure Financing Program) | 5.000% | 9/2/23 | 375 | 443 |
| ABAG Finance Authority for Nonprofit Corps. | | | | |
| California Revenue (Windemere Ranch | | | | |
| Infrastructure Financing Program) | 5.000% | 9/2/24 | 400 | 481 |
| ABAG Finance Authority for Nonprofit Corps. | | | | |
| California Revenue (Windemere Ranch | | | | |
| Infrastructure Financing Program) | 5.000% | 9/2/25 | 510 | 613 |
| ABAG Finance Authority for Nonprofit Corps. | | | | |
| California Revenue (Windemere Ranch | | | | |
| Infrastructure Financing Program) | 5.000% | 9/2/26 | 685 | 816 |
| ABAG Finance Authority for Nonprofit Corps. | | | | |
| California Revenue (Windemere Ranch | | | | |
| Infrastructure Financing Program) | 5.000% | 9/2/28 | 1,165 | 1,365 |
| ABAG Finance Authority for Nonprofit Corps. | | | | |
| California Revenue (Windemere Ranch | | | | |
| Infrastructure Financing Program) | 5.000% | 9/2/29 | 1,000 | 1,163 |
| ABAG Finance Authority for Nonprofit Corps. | | | | |
| California Revenue (Windemere Ranch | | | | |
| Infrastructure Financing Program) | 5.000% | 9/2/30 | 1,425 | 1,650 |
| ABAG Finance Authority for Nonprofit Corps. | | | | |
| California Revenue (Windemere Ranch | | | | |
| Infrastructure Financing Program) | 5.000% | 9/2/31 | 500 | 576 |
| ABAG Finance Authority for Nonprofit Corps. | | | | |
| California Revenue (Windemere Ranch | | | | |
| Infrastructure Financing Program) | 5.000% | 9/2/32 | 525 | 603 |
| Alameda CA Community Improvement | | | | |
| Commission Successor Agency Tax | | | | |
| Allocation Revenue | 5.000% | 9/1/27 (15) | 750 | 879 |
| Alameda CA Community Improvement | | | | |
| Commission Successor Agency Tax | | | | |
| Allocation Revenue | 5.000% | 9/1/28 (15) | 1,000 | 1,165 |
| Alameda CA Community Improvement | | | | |
| Commission Successor Agency Tax | | | | |
| Allocation Revenue | 5.000% | 9/1/30 (15) | 1,680 | 1,935 |
| Alameda CA Community Improvement | | | | |
| Commission Successor Agency Tax | | | | |
| Allocation Revenue | 5.000% | 9/1/31 (15) | 1,640 | 1,881 |
34
California Intermediate-Term Tax-Exempt Fund
| | | | |
| | | | Face | Market |
| | | Maturity | Amount | Value• |
| | Coupon | Date | ($000) | ($000) |
| Alameda CA Community Improvement | | | | |
| Commission Successor Agency Tax | | | | |
| Allocation Revenue | 5.000% | 9/1/32 (15) | 3,000 | 3,426 |
| Alameda CA Community Improvement | | | | |
| Commission Successor Agency Tax | | | | |
| Allocation Revenue | 5.000% | 9/1/33 (15) | 2,375 | 2,704 |
| Alameda CA Corridor Transportation Authority | | | | |
| Revenue | 5.250% | 10/1/17 (Prere.) | 2,000 | 2,030 |
| Alameda CA Corridor Transportation Authority | | | | |
| Revenue | 5.400% | 10/1/17 (Prere.) | 3,805 | 3,863 |
| Alameda CA Corridor Transportation Authority | | | | |
| Revenue | 0.000% | 10/1/18 (ETM) | 230 | 227 |
| Alameda CA Corridor Transportation Authority | | | | |
| Revenue | 0.000% | 10/1/18 (2) | 90 | 89 |
| Alameda CA Corridor Transportation Authority | | | | |
| Revenue | 0.000% | 10/1/19 (ETM) | 13,240 | 12,932 |
| Alameda CA Corridor Transportation Authority | | | | |
| Revenue | 0.000% | 10/1/19 (2) | 1,050 | 1,012 |
| Alameda CA Corridor Transportation Authority | | | | |
| Revenue | 0.000% | 10/1/20 (ETM) | 13,780 | 13,270 |
| Alameda CA Corridor Transportation Authority | | | | |
| Revenue | 0.000% | 10/1/20 (2) | 285 | 269 |
| Alameda CA Corridor Transportation Authority | | | | |
| Revenue | 4.000% | 10/1/21 | 1,485 | 1,618 |
| Alameda CA Corridor Transportation Authority | | | | |
| Revenue | 4.000% | 3/1/22 | 5,510 | 6,226 |
| Alameda CA Corridor Transportation Authority | | | | |
| Revenue | 5.000% | 10/1/22 | 2,190 | 2,570 |
| Alameda CA Corridor Transportation Authority | | | | |
| Revenue | 5.000% | 10/1/22 | 5,985 | 6,897 |
| Alameda CA Corridor Transportation Authority | | | | |
| Revenue | 4.000% | 10/1/23 | 1,145 | 1,274 |
| Alameda CA Corridor Transportation Authority | | | | |
| Revenue | 5.000% | 10/1/23 | 2,160 | 2,569 |
| Alameda CA Corridor Transportation Authority | | | | |
| Revenue | 5.000% | 10/1/24 | 1,160 | 1,379 |
| Alameda CA Corridor Transportation Authority | | | | |
| Revenue | 5.000% | 10/1/25 | 1,260 | 1,511 |
| Alameda CA Corridor Transportation Authority | | | | |
| Revenue | 0.000% | 10/1/29 (2) | 30,240 | 18,860 |
| Alameda CA Corridor Transportation Authority | | | | |
| Revenue | 0.000% | 10/1/30 (2) | 9,110 | 5,376 |
| Alameda CA Corridor Transportation Authority | | | | |
| Revenue | 5.000% | 10/1/34 | 13,425 | 15,396 |
| Alameda CA Corridor Transportation Authority | | | | |
| Revenue | 5.000% | 10/1/35 | 15,700 | 17,950 |
| Alameda CA Corridor Transportation Authority | | | | |
| Revenue | 5.000% | 10/1/36 | 13,345 | 15,212 |
| Alameda County CA Joint Powers Authority | | | | |
| Lease Revenue | 5.000% | 12/1/32 | 7,000 | 8,172 |
| Alameda County CA Joint Powers Authority | | | | |
| Lease Revenue | 5.000% | 12/1/33 | 8,415 | 9,785 |
| Alameda County CA Joint Powers Authority | | | | |
| Lease Revenue | 5.000% | 12/1/34 | 4,640 | 5,377 |
35
California Intermediate-Term Tax-Exempt Fund
| | | | |
| | | | Face | Market |
| | | Maturity | Amount | Value• |
| | Coupon | Date | ($000) | ($000) |
| Alameda County CA Unified School District GO | 5.000% | 8/1/34 | 2,890 | 3,386 |
| Alum Rock CA Union Elementary School | | | | |
| District GO | 5.000% | 8/1/22 (15) | 500 | 590 |
| Alum Rock CA Union Elementary School | | | | |
| District GO | 5.000% | 8/1/23 (15) | 800 | 963 |
| Alum Rock CA Union Elementary School | | | | |
| District GO | 5.000% | 8/1/24 (15) | 1,000 | 1,220 |
| Alum Rock CA Union Elementary School | | | | |
| District GO | 5.000% | 8/1/25 (15) | 1,000 | 1,235 |
| Alvord CA Unified School District GO | 5.900% | 2/1/21 (14) | 2,230 | 2,583 |
| Alvord CA Unified School District GO | 5.900% | 2/1/24 (4) | 3,865 | 4,582 |
| Anaheim CA Housing & Public Improvements | | | | |
| Authority Revenue (Electric Utility Distribution | | | | |
| System) | 5.000% | 10/1/31 | 4,225 | 4,800 |
| Anaheim CA Housing & Public Improvements | | | | |
| Authority Revenue (Electric Utility Distribution | | | | |
| System) | 5.000% | 10/1/32 | 2,605 | 2,944 |
| Anaheim CA Housing & Public Improvements | | | | |
| Authority Revenue (Electric Utility Distribution | | | | |
| System) | 5.000% | 10/1/33 | 4,500 | 5,076 |
| Anaheim CA Housing & Public Improvements | | | | |
| Authority Revenue (Electric Utility Distribution | | | | |
| System) | 5.000% | 10/1/34 | 7,500 | 8,437 |
| Anaheim CA Housing & Public Improvements | | | | |
| Authority Revenue (Electric Utility Distribution | | | | |
| System) | 5.000% | 10/1/36 | 1,955 | 2,197 |
| Anaheim CA Housing & Public Improvements | | | | |
| Authority Revenue (Water System Project) | 5.000% | 10/1/31 | 300 | 344 |
| Anaheim CA Housing & Public Improvements | | | | |
| Authority Revenue (Water System Project) | 5.000% | 10/1/32 | 300 | 342 |
| Anaheim CA Housing & Public Improvements | | | | |
| Authority Revenue (Water System Project) | 5.000% | 10/1/33 | 765 | 870 |
| Anaheim CA Housing & Public Improvements | | | | |
| Authority Revenue (Water System Project) | 5.000% | 10/1/34 | 1,000 | 1,132 |
| Anaheim CA Housing & Public Improvements | | | | |
| Authority Revenue (Water System Project) | 5.000% | 10/1/35 | 505 | 570 |
| Anaheim CA Housing & Public Improvements | | | | |
| Authority Revenue (Water System Project) | 5.000% | 10/1/36 | 500 | 563 |
| Anaheim CA Public Financing Authority | | | | |
| Revenue (Electric System) | 5.250% | 10/1/30 | 5,585 | 6,337 |
| Anaheim CA Public Financing Authority | | | | |
| Revenue (Electric System) | 4.000% | 10/1/31 | 12,000 | 12,995 |
| Arcadia CA Unified School District GO | 4.000% | 8/1/28 | 2,125 | 2,398 |
| Arcadia CA Unified School District GO | 4.000% | 8/1/29 | 2,675 | 2,991 |
| Bakersfield CA Wastewater Revenue | 5.000% | 9/15/17 (Prere.) | 7,600 | 7,692 |
| Bay Area Toll Authority California Toll Bridge | | | | |
| Revenue (San Francisco Bay Area) | 5.000% | 4/1/18 | 2,610 | 2,619 |
| Bay Area Toll Authority California Toll Bridge | | | | |
| Revenue (San Francisco Bay Area) | 5.000% | 4/1/19 (Prere.) | 75 | 81 |
| Bay Area Toll Authority California Toll Bridge | | | | |
| Revenue (San Francisco Bay Area) | 5.250% | 4/1/19 (Prere.) | 11,355 | 12,250 |
| Bay Area Toll Authority California Toll Bridge | | | | |
| Revenue (San Francisco Bay Area) | 5.000% | 4/1/25 | 6,275 | 7,362 |
36
California Intermediate-Term Tax-Exempt Fund
| | | | |
| | | | Face | Market |
| | | Maturity | Amount | Value• |
| | Coupon | Date | ($000) | ($000) |
| Bay Area Toll Authority California Toll Bridge | | | | |
| Revenue (San Francisco Bay Area) | 5.000% | 4/1/28 | 5,000 | 5,851 |
| Bay Area Toll Authority California Toll Bridge | | | | |
| Revenue (San Francisco Bay Area) | 5.000% | 4/1/28 | 5,000 | 5,882 |
| Bay Area Toll Authority California Toll Bridge | | | | |
| Revenue (San Francisco Bay Area) | 5.000% | 4/1/29 | 7,000 | 8,184 |
| Bay Area Toll Authority California Toll Bridge | | | | |
| Revenue (San Francisco Bay Area) | 5.000% | 4/1/29 | 8,000 | 9,384 |
| Bay Area Toll Authority California Toll Bridge | | | | |
| Revenue (San Francisco Bay Area) | 5.000% | 4/1/30 | 16,700 | 19,238 |
| Bay Area Toll Authority California Toll Bridge | | | | |
| Revenue (San Francisco Bay Area) | 4.000% | 4/1/31 | 4,000 | 4,232 |
| Bay Area Toll Authority California Toll Bridge | | | | |
| Revenue (San Francisco Bay Area) | 5.000% | 4/1/31 | 7,645 | 8,883 |
| Bay Area Toll Authority California Toll Bridge | | | | |
| Revenue (San Francisco Bay Area) | 5.000% | 4/1/31 | 16,125 | 18,576 |
| Bay Area Toll Authority California Toll Bridge | | | | |
| Revenue (San Francisco Bay Area) PUT | 1.500% | 4/2/18 | 14,275 | 14,303 |
| Bay Area Toll Authority California Toll Bridge | | | | |
| Revenue (San Francisco Bay Area) PUT | 1.875% | 4/1/19 | 4,500 | 4,553 |
| Bay Area Toll Authority California Toll Bridge | | | | |
| Revenue (San Francisco Bay Area) PUT | 1.875% | 4/1/20 | 25,000 | 25,324 |
| 1 Bay Area Toll Authority California Toll Bridge | | | | |
| Revenue (San Francisco Bay Area) PUT | 1.480% | 4/1/21 | 20,500 | 20,482 |
| Bay Area Toll Authority California Toll Bridge | | | | |
| Revenue (San Francisco Bay Area) PUT | 2.000% | 4/1/21 | 34,000 | 34,791 |
| 1 Bay Area Toll Authority California Toll Bridge | | | | |
| Revenue (San Francisco Bay Area) PUT | 1.680% | 5/1/23 | 19,000 | 19,096 |
| 1 Bay Area Toll Authority California Toll Bridge | | | | |
| Revenue (San Francisco Bay Area) PUT | 1.680% | 5/1/23 | 4,350 | 4,372 |
| 1 Bay Area Toll Authority California Toll Bridge | | | | |
| Revenue (San Francisco Bay Area) PUT | 1.880% | 4/1/24 | 6,100 | 6,192 |
| Bay Area Toll Authority California Toll Bridge | | | | |
| Revenue (San Francisco Bay Area) PUT | 2.850% | 4/1/25 | 11,250 | 11,870 |
| Brea CA Redevelopment Agency Successor | | | | |
| Agency Tax Allocation Revenue | | | | |
| (Redevelopment Project AB) | 5.000% | 8/1/21 | 5,500 | 6,295 |
| Brea CA Redevelopment Agency Successor | | | | |
| Agency Tax Allocation Revenue | | | | |
| (Redevelopment Project AB) | 5.000% | 8/1/24 | 5,110 | 6,035 |
| Brea CA Redevelopment Agency Successor | | | | |
| Agency Tax Allocation Revenue | | | | |
| (Redevelopment Project AB) | 0.000% | 8/1/29 (2) | 3,065 | 1,975 |
| Brentwood CA Infrastructure Financing | | | | |
| Authority Revenue | 5.000% | 9/2/24 (4) | 1,000 | 1,215 |
| Brentwood CA Infrastructure Financing | | | | |
| Authority Revenue | 5.000% | 9/2/25 (4) | 1,430 | 1,721 |
| Brentwood CA Infrastructure Financing | | | | |
| Authority Revenue | 5.000% | 9/2/26 (4) | 2,000 | 2,392 |
| Brentwood CA Infrastructure Financing | | | | |
| Authority Revenue | 5.000% | 9/2/27 (4) | 2,375 | 2,816 |
| Brentwood CA Infrastructure Financing | | | | |
| Authority Revenue | 5.000% | 9/2/29 (4) | 1,240 | 1,449 |
37
California Intermediate-Term Tax-Exempt Fund
| | | | |
| | | | Face | Market |
| | | Maturity | Amount | Value• |
| | Coupon | Date | ($000) | ($000) |
| Brentwood CA Infrastructure Financing | | | | |
| Authority Revenue | 5.000% | 9/2/30 (4) | 750 | 871 |
| Brentwood CA Infrastructure Financing | | | | |
| Authority Revenue | 5.000% | 9/2/32 (4) | 3,790 | 3,878 |
| Brentwood CA Infrastructure Financing | | | | |
| Authority Water Revenue | 5.000% | 7/1/23 | 400 | 481 |
| Brentwood CA Infrastructure Financing | | | | |
| Authority Water Revenue | 5.000% | 7/1/24 | 500 | 612 |
| Brentwood CA Infrastructure Financing | | | | |
| Authority Water Revenue | 5.000% | 7/1/25 | 500 | 608 |
| Brentwood CA Infrastructure Financing | | | | |
| Authority Water Revenue | 4.000% | 7/1/30 | 1,700 | 1,838 |
| Brentwood CA Infrastructure Financing | | | | |
| Authority Water Revenue | 4.000% | 7/1/31 | 1,980 | 2,132 |
| Brentwood CA Infrastructure Financing | | | | |
| Authority Water Revenue | 4.000% | 7/1/32 | 2,085 | 2,231 |
| Brentwood CA Infrastructure Financing | | | | |
| Authority Water Revenue | 4.000% | 7/1/33 | 2,165 | 2,305 |
| Brentwood CA Infrastructure Financing | | | | |
| Authority Water Revenue | 4.000% | 7/1/34 | 2,210 | 2,337 |
| Burbank CA Redevelopment Agency Tax | | | | |
| Allocation Revenue | 5.000% | 12/1/20 (15) | 1,610 | 1,819 |
| Burbank CA Redevelopment Agency Tax | | | | |
| Allocation Revenue | 5.000% | 12/1/21 (15) | 1,255 | 1,456 |
| Burbank CA Unified School District GO | 0.000% | 8/1/32 | 3,655 | 3,076 |
| California County CA Tobacco Securitization | | | | |
| Agency Revenue | 5.000% | 6/1/21 | 1,300 | 1,458 |
| California County CA Tobacco Securitization | | | | |
| Agency Revenue | 5.250% | 6/1/21 | 9,070 | 9,179 |
| California County CA Tobacco Securitization | | | | |
| Agency Revenue | 5.000% | 6/1/22 | 1,000 | 1,142 |
| California County CA Tobacco Securitization | | | | |
| Agency Revenue | 5.000% | 6/1/23 | 2,400 | 2,786 |
| California County CA Tobacco Securitization | | | | |
| Agency Revenue | 5.000% | 6/1/24 | 3,840 | 4,518 |
| California Department of Department of | | | | |
| Veterans Affairs Home Purchase Revenue | 3.500% | 12/1/45 | 4,900 | 5,208 |
| California Department of Water Resources | | | | |
| Power Supply Revenue | 5.000% | 5/1/18 (Prere.) | 1,000 | 1,039 |
| California Department of Water Resources | | | | |
| Power Supply Revenue | 5.000% | 5/1/18 (Prere.) | 10,485 | 10,892 |
| California Department of Water Resources | | | | |
| Power Supply Revenue | 5.000% | 5/1/18 (Prere.) | 11,415 | 11,858 |
| California Department of Water Resources | | | | |
| Power Supply Revenue | 5.000% | 5/1/18 (Prere.) | 4,190 | 4,352 |
| California Department of Water Resources | | | | |
| Power Supply Revenue | 5.000% | 5/1/18 | 1,810 | 1,879 |
| California Department of Water Resources | | | | |
| Power Supply Revenue | 5.000% | 5/1/19 | 1,215 | 1,310 |
| California Department of Water Resources | | | | |
| Power Supply Revenue | 5.000% | 5/1/19 | 19,590 | 21,126 |
| California Department of Water Resources | | | | |
| Power Supply Revenue | 5.000% | 5/1/20 | 43,250 | 48,286 |
38
California Intermediate-Term Tax-Exempt Fund
| | | | |
| | | | Face | Market |
| | | Maturity | Amount | Value• |
| | Coupon | Date | ($000) | ($000) |
| California Department of Water Resources | | | | |
| Power Supply Revenue | 5.000% | 5/1/20 (Prere.) | 3,100 | 3,458 |
| California Department of Water Resources | | | | |
| Power Supply Revenue | 5.000% | 5/1/20 (Prere.) | 6,715 | 7,490 |
| California Department of Water Resources | | | | |
| Power Supply Revenue | 5.000% | 5/1/20 | 23,890 | 26,672 |
| California Department of Water Resources | | | | |
| Power Supply Revenue | 5.000% | 5/1/21 | 6,500 | 7,484 |
| California Department of Water Resources | | | | |
| Power Supply Revenue | 5.000% | 5/1/21 | 15,000 | 17,270 |
| California Department of Water Resources | | | | |
| Power Supply Revenue | 5.000% | 5/1/21 | 1,910 | 2,129 |
| California Department of Water Resources | | | | |
| Power Supply Revenue | 5.000% | 5/1/22 | 31,570 | 37,265 |
| California Department of Water Resources | | | | |
| Power Supply Revenue | 5.000% | 5/1/22 | 4,110 | 4,578 |
| California Department of Water Resources Water | | | | |
| System Revenue (Central Valley Project) | 5.000% | 6/1/18 (Prere.) | 4,905 | 5,111 |
| California Department of Water Resources Water | | | | |
| System Revenue (Central Valley Project) | 5.000% | 6/1/18 (Prere.) | 8,280 | 8,627 |
| California Department of Water Resources Water | | | | |
| System Revenue (Central Valley Project) | 4.000% | 12/1/19 | 6,020 | 6,484 |
| California Department of Water Resources Water | | | | |
| System Revenue (Central Valley Project) | 5.000% | 12/1/19 (Prere.) | 7,960 | 8,760 |
| California Department of Water Resources Water | | | | |
| System Revenue (Central Valley Project) | 5.000% | 12/1/19 (ETM) | 10 | 11 |
| California Department of Water Resources Water | | | | |
| System Revenue (Central Valley Project) | 5.000% | 12/1/19 | 4,340 | 4,782 |
| California Department of Water Resources Water | | | | |
| System Revenue (Central Valley Project) | 4.000% | 12/1/20 | 4,000 | 4,416 |
| California Department of Water Resources Water | | | | |
| System Revenue (Central Valley Project) | 5.000% | 12/1/20 (ETM) | 30 | 34 |
| California Department of Water Resources Water | | | | |
| System Revenue (Central Valley Project) | 5.000% | 12/1/20 | 1,220 | 1,389 |
| California Department of Water Resources Water | | | | |
| System Revenue (Central Valley Project) | 5.250% | 12/1/20 (Prere.) | 1,850 | 2,121 |
| California Department of Water Resources Water | | | | |
| System Revenue (Central Valley Project) | 5.250% | 12/1/20 (Prere.) | 2,905 | 3,331 |
| California Department of Water Resources Water | | | | |
| System Revenue (Central Valley Project) | 5.250% | 12/1/20 (Prere.) | 3,355 | 3,847 |
| California Department of Water Resources Water | | | | |
| System Revenue (Central Valley Project) | 5.250% | 12/1/20 (Prere.) | 3,455 | 3,961 |
| California Department of Water Resources Water | | | | |
| System Revenue (Central Valley Project) | 5.250% | 12/1/20 (Prere.) | 25 | 29 |
| California Department of Water Resources Water | | | | |
| System Revenue (Central Valley Project) | 5.250% | 12/1/20 (Prere.) | 30 | 34 |
| California Department of Water Resources Water | | | | |
| System Revenue (Central Valley Project) | 5.250% | 12/1/20 (Prere.) | 30 | 34 |
| California Department of Water Resources Water | | | | |
| System Revenue (Central Valley Project) | 5.000% | 12/1/21 (Prere.) | 2,720 | 3,181 |
| California Department of Water Resources Water | | | | |
| System Revenue (Central Valley Project) | 5.000% | 12/1/21 (Prere.) | 3,910 | 4,572 |
| California Department of Water Resources Water | | | | |
| System Revenue (Central Valley Project) | 5.000% | 12/1/21 (ETM) | 1,045 | 1,221 |
39
California Intermediate-Term Tax-Exempt Fund
| | | | |
| | | | Face | Market |
| | | Maturity | Amount | Value• |
| | Coupon | Date | ($000) | ($000) |
| California Department of Water Resources Water | | | | |
| System Revenue (Central Valley Project) | 5.000% | 12/1/21 | 4,600 | 5,385 |
| California Department of Water Resources Water | | | | |
| System Revenue (Central Valley Project) | 5.000% | 12/1/21 | 2,410 | 2,822 |
| California Department of Water Resources Water | | | | |
| System Revenue (Central Valley Project) | 5.000% | 12/1/21 (Prere.) | 3,320 | 3,881 |
| California Department of Water Resources Water | | | | |
| System Revenue (Central Valley Project) | 5.000% | 12/1/21 (Prere.) | 3,500 | 4,091 |
| California Department of Water Resources Water | | | | |
| System Revenue (Central Valley Project) | 5.000% | 12/1/22 (ETM) | 1,105 | 1,323 |
| California Department of Water Resources Water | | | | |
| System Revenue (Central Valley Project) | 5.000% | 12/1/22 (Prere.) | 505 | 605 |
| California Department of Water Resources Water | | | | |
| System Revenue (Central Valley Project) | 5.000% | 12/1/22 | 4,895 | 5,873 |
| California Department of Water Resources Water | | | | |
| System Revenue (Central Valley Project) | 5.000% | 12/1/23 (ETM) | 55 | 67 |
| California Department of Water Resources Water | | | | |
| System Revenue (Central Valley Project) | 5.000% | 12/1/24 | 95 | 99 |
| California Department of Water Resources Water | | | | |
| System Revenue (Central Valley Project) | 5.000% | 12/1/24 (ETM) | 30 | 38 |
| California Department of Water Resources Water | | | | |
| System Revenue (Central Valley Project) | 5.000% | 12/1/24 (Prere.) | 5 | 6 |
| California Department of Water Resources Water | | | | |
| System Revenue (Central Valley Project) | 5.000% | 12/1/24 (Prere.) | 10 | 13 |
| California Department of Water Resources Water | | | | |
| System Revenue (Central Valley Project) | 5.000% | 12/1/24 | 9,470 | 11,820 |
| California Department of Water Resources Water | | | | |
| System Revenue (Central Valley Project) | 5.000% | 12/1/26 | 285 | 297 |
| California Department of Water Resources Water | | | | |
| System Revenue (Central Valley Project) | 5.000% | 12/1/26 | 1,945 | 2,398 |
| California Department of Water Resources Water | | | | |
| System Revenue (Central Valley Project) | 5.000% | 12/1/27 | 840 | 924 |
| California Department of Water Resources Water | | | | |
| System Revenue (Central Valley Project) | 5.000% | 12/1/27 | 4,050 | 4,958 |
| California Department of Water Resources Water | | | | |
| System Revenue (Central Valley Project) | 5.250% | 12/1/27 | 970 | 1,108 |
| California Department of Water Resources Water | | | | |
| System Revenue (Central Valley Project) | 5.000% | 12/1/28 | 30 | 35 |
| California Department of Water Resources Water | | | | |
| System Revenue (Central Valley Project) | 5.250% | 12/1/28 | 1,120 | 1,279 |
| California Department of Water Resources Water | | | | |
| System Revenue (Central Valley Project) | 5.000% | 12/1/29 | 7,750 | 9,181 |
| California Department of Water Resources Water | | | | |
| System Revenue (Central Valley Project) | 5.000% | 12/1/29 | 30 | 34 |
| California Department of Water Resources Water | | | | |
| System Revenue (Central Valley Project) | 5.250% | 12/1/29 | 1,155 | 1,319 |
| 2 California Department of Water Resources Water | | | | |
| System Revenue (Central Valley Project) TOB | | | | |
| VRDO | 0.800% | 6/7/17 (Prere.) | 3,985 | 3,985 |
| California Economic Recovery GO | 5.000% | 7/1/19 (Prere.) | 43,745 | 47,457 |
| California Economic Recovery GO | 5.000% | 7/1/19 (ETM) | 32,330 | 35,074 |
| 3 California Economic Recovery GO | 5.250% | 7/1/19 (Prere.) | 28,845 | 31,441 |
| California Economic Recovery GO | 5.250% | 7/1/19 (Prere.) | 16,540 | 18,029 |
40
California Intermediate-Term Tax-Exempt Fund
| | | | |
| | | | Face | Market |
| | | Maturity | Amount | Value• |
| | Coupon | Date | ($000) | ($000) |
| California Educational Facilities Authority | | | | |
| Revenue (Claremont McKenna College) | 4.000% | 1/1/19 | 1,085 | 1,139 |
| California Educational Facilities Authority | | | | |
| Revenue (Claremont McKenna College) | 4.000% | 1/1/20 | 1,040 | 1,122 |
| California Educational Facilities Authority | | | | |
| Revenue (Claremont McKenna College) | 4.000% | 1/1/21 | 800 | 883 |
| California Educational Facilities Authority | | | | |
| Revenue (Claremont McKenna College) | 4.000% | 1/1/22 | 1,190 | 1,340 |
| California Educational Facilities Authority | | | | |
| Revenue (Claremont McKenna College) | 4.000% | 1/1/23 | 1,800 | 2,061 |
| California Educational Facilities Authority Revenue | | | | |
| (Claremont McKenna College) | 4.000% | 1/1/24 | 1,900 | 2,203 |
| California Educational Facilities Authority Revenue | | | | |
| (Claremont McKenna College) | 4.000% | 1/1/25 | 1,035 | 1,211 |
| California Educational Facilities Authority Revenue | | | | |
| (Claremont McKenna College) | 5.000% | 1/1/26 | 1,000 | 1,255 |
| California Educational Facilities Authority Revenue | | | | |
| (Claremont McKenna College) | 5.000% | 1/1/30 | 1,750 | 2,116 |
| California Educational Facilities Authority Revenue | | | | |
| (Claremont McKenna College) | 5.000% | 1/1/31 | 1,875 | 2,246 |
| California Educational Facilities Authority Revenue | | | | |
| (Claremont McKenna College) | 5.000% | 1/1/32 | 2,000 | 2,384 |
| California Educational Facilities Authority Revenue | | | | |
| (Claremont McKenna College) | 4.000% | 1/1/33 | 3,590 | 3,871 |
| California Educational Facilities Authority Revenue | | | | |
| (Claremont McKenna College) | 4.000% | 1/1/34 | 3,350 | 3,583 |
| California Educational Facilities Authority Revenue | | | | |
| (College of Arts) | 5.000% | 6/1/20 | 790 | 850 |
| California Educational Facilities Authority Revenue | | | | |
| (College of Arts) | 5.000% | 6/1/23 | 1,195 | 1,315 |
| California Educational Facilities Authority Revenue | | | | |
| (College of Arts) | 5.000% | 6/1/24 | 380 | 415 |
| California Educational Facilities Authority Revenue | | | | |
| (College of Arts) | 5.250% | 6/1/30 | 1,125 | 1,219 |
| California Educational Facilities Authority Revenue | | | | |
| (Occidental College) | 4.000% | 10/1/18 | 270 | 281 |
| California Educational Facilities Authority Revenue | | | | |
| (Occidental College) | 4.000% | 10/1/19 | 200 | 214 |
| California Educational Facilities Authority Revenue | | | | |
| (Occidental College) | 5.000% | 10/1/20 | 290 | 328 |
| California Educational Facilities Authority Revenue | | | | |
| (Occidental College) | 5.000% | 10/1/21 | 145 | 169 |
| California Educational Facilities Authority Revenue | | | | |
| (Occidental College) | 5.000% | 10/1/22 | 125 | 149 |
| California Educational Facilities Authority Revenue | | | | |
| (Occidental College) | 5.000% | 10/1/23 | 130 | 158 |
| California Educational Facilities Authority Revenue | | | | |
| (Occidental College) | 5.000% | 10/1/24 | 340 | 421 |
| California Educational Facilities Authority Revenue | | | | |
| (Occidental College) | 5.000% | 10/1/26 | 260 | 323 |
| California Educational Facilities Authority Revenue | | | | |
| (Occidental College) | 5.000% | 10/1/27 | 250 | 309 |
| California Educational Facilities Authority Revenue | | | | |
| (Santa Clara University) | 5.000% | 4/1/31 | 1,000 | 1,195 |
41
California Intermediate-Term Tax-Exempt Fund
| | | | |
| | | | Face | Market |
| | | Maturity | Amount | Value• |
| | Coupon | Date | ($000) | ($000) |
| California Educational Facilities Authority Revenue | | | | |
| (Santa Clara University) | 5.000% | 4/1/32 | 1,000 | 1,190 |
| California Educational Facilities Authority Revenue | | | | |
| (Santa Clara University) | 5.000% | 4/1/33 | 1,545 | 1,829 |
| California Educational Facilities Authority Revenue | | | | |
| (Santa Clara University) | 5.000% | 4/1/34 | 2,625 | 3,085 |
| California Educational Facilities Authority Revenue | | | | |
| (Santa Clara University) | 5.000% | 4/1/35 | 3,100 | 3,634 |
| California Educational Facilities Authority Revenue | | | | |
| (University of Southern California) | 5.000% | 10/1/25 | 5,000 | 6,280 |
| 2 California Educational Facilities Authority Revenue | | | | |
| (University of Southern California) TOB VRDO | 0.810% | 6/7/17 | 614 | 614 |
| 2 California Educational Facilities Authority Revenue | | | | |
| (University of Southern California) TOB VRDO | 0.840% | 6/7/17 | 11,242 | 11,242 |
| California Educational Facilities Authority Revenue | | | | |
| (University of the Pacific) | 5.000% | 11/1/20 | 1,770 | 1,994 |
| California Educational Facilities Authority Revenue | | | | |
| (University of the Pacific) | 5.000% | 11/1/21 | 2,100 | 2,430 |
| California Educational Facilities Authority Revenue | | | | |
| (University of the Pacific) | 5.000% | 11/1/22 | 2,130 | 2,516 |
| California Educational Facilities Authority Revenue | | | | |
| (University of the Pacific) | 5.000% | 11/1/23 | 1,870 | 2,250 |
| California Educational Facilities Authority Revenue | | | | |
| (University of the Pacific) | 5.000% | 11/1/24 | 2,500 | 3,057 |
| California Educational Facilities Authority Revenue | | | | |
| (University of the Pacific) | 5.000% | 11/1/25 | 2,315 | 2,863 |
| California Educational Facilities Authority Revenue | | | | |
| (University of the Pacific) | 5.000% | 11/1/31 | 1,005 | 1,175 |
| California GO | 4.000% | 9/1/17 | 1,375 | 1,386 |
| California GO | 5.000% | 12/1/17 (Prere.) | 2,000 | 2,042 |
| California GO | 5.250% | 2/1/18 (14) | 8,000 | 8,238 |
| California GO | 6.000% | 2/1/18 (2) | 6,240 | 6,457 |
| California GO | 5.000% | 3/1/18 | 1,850 | 1,908 |
| California GO | 5.500% | 4/1/18 | 15,250 | 15,848 |
| California GO | 5.000% | 8/1/18 | 1,065 | 1,117 |
| California GO | 5.000% | 8/1/18 | 5 | 5 |
| California GO | 5.000% | 8/1/18 | 12,000 | 12,584 |
| California GO | 5.000% | 10/1/18 | 14,095 | 14,876 |
| California GO | 5.000% | 10/1/18 | 20,000 | 21,109 |
| California GO | 5.000% | 2/1/19 | 4,715 | 5,039 |
| California GO | 5.500% | 4/1/19 | 11,245 | 12,190 |
| California GO | 5.000% | 8/1/19 | 35,445 | 38,558 |
| California GO | 5.000% | 8/1/19 | 12,695 | 13,810 |
| California GO | 4.000% | 9/1/19 | 2,100 | 2,244 |
| California GO | 5.000% | 9/1/19 | 5,000 | 5,455 |
| California GO | 5.000% | 9/1/19 | 9,000 | 9,819 |
| California GO | 5.000% | 10/1/19 | 21,000 | 22,978 |
| California GO | 2.000% | 11/1/19 | 6,695 | 6,868 |
| California GO | 5.000% | 2/1/20 | 2,950 | 3,262 |
| California GO | 5.250% | 2/1/20 | 7,500 | 8,343 |
| California GO | 5.000% | 3/1/20 | 19,535 | 21,662 |
| California GO | 5.000% | 8/1/20 | 35 | 35 |
| California GO | 5.000% | 9/1/20 | 17,445 | 19,657 |
| California GO | 5.000% | 9/1/20 | 3,690 | 4,158 |
42
California Intermediate-Term Tax-Exempt Fund
| | | | |
| | | | Face | Market |
| | | Maturity | Amount | Value• |
| | Coupon | Date | ($000) | ($000) |
| California GO | 5.000% | 9/1/20 | 6,000 | 6,761 |
| California GO | 5.000% | 10/1/20 | 5,555 | 6,276 |
| California GO | 5.250% | 10/1/20 | 4,500 | 4,945 |
| California GO | 5.000% | 11/1/20 | 47,795 | 54,137 |
| California GO | 5.000% | 2/1/21 | 2,000 | 2,282 |
| California GO | 5.000% | 3/1/21 | 2,250 | 2,491 |
| California GO | 5.000% | 4/1/21 | 2,240 | 2,568 |
| California GO | 5.500% | 4/1/21 | 2,000 | 2,171 |
| California GO | 5.000% | 9/1/21 | 9,800 | 11,365 |
| California GO | 5.000% | 9/1/21 | 13,700 | 15,887 |
| California GO | 5.000% | 9/1/21 | 1,310 | 1,519 |
| California GO | 5.000% | 10/1/21 | 2,575 | 2,993 |
| California GO | 5.000% | 11/1/21 | 2,820 | 3,285 |
| California GO | 5.000% | 2/1/22 | 1,210 | 1,418 |
| California GO | 5.000% | 2/1/22 | 8,155 | 9,557 |
| California GO | 5.000% | 4/1/22 | 4,550 | 5,355 |
| California GO | 5.000% | 9/1/22 | 12,710 | 15,110 |
| California GO | 5.000% | 9/1/22 | 10,000 | 11,888 |
| California GO | 5.250% | 9/1/22 | 17,400 | 20,906 |
| California GO | 5.000% | 10/1/22 | 15,000 | 17,868 |
| California GO | 5.000% | 11/1/22 | 31,890 | 38,060 |
| California GO | 5.000% | 2/1/23 | 15,000 | 17,968 |
| California GO | 5.000% | 2/1/23 | 15,880 | 18,485 |
| California GO | 5.000% | 9/1/23 | 7,000 | 8,271 |
| California GO | 5.000% | 9/1/23 | 10,075 | 12,218 |
| California GO | 5.250% | 9/1/23 | 2,455 | 2,881 |
| California GO | 5.000% | 10/1/23 | 12,450 | 15,123 |
| California GO | 5.000% | 10/1/23 | 3,135 | 3,808 |
| California GO | 5.000% | 11/1/23 | 20,000 | 24,335 |
| California GO | 5.000% | 2/1/24 | 11,000 | 13,098 |
| California GO | 5.000% | 3/1/24 | 3,000 | 3,322 |
| California GO | 5.000% | 8/1/24 | 1,000 | 1,231 |
| California GO | 5.000% | 8/1/24 | 25 | 25 |
| California GO | 5.000% | 9/1/24 | 10,000 | 11,805 |
| California GO | 5.000% | 9/1/24 | 1,000 | 1,233 |
| California GO | 5.000% | 10/1/24 | 8,725 | 10,770 |
| California GO | 5.000% | 11/1/24 | 5,000 | 5,653 |
| California GO | 5.000% | 12/1/24 | 15,500 | 18,782 |
| California GO | 5.000% | 2/1/25 | 12,940 | 15,012 |
| California GO | 5.500% | 2/1/25 | 21,045 | 26,784 |
| California GO | 5.125% | 3/1/25 | 2,100 | 2,167 |
| California GO | 5.000% | 8/1/25 | 45 | 45 |
| California GO | 5.000% | 9/1/25 | 1,500 | 1,576 |
| California GO | 5.000% | 9/1/25 | 2,185 | 2,577 |
| California GO | 5.000% | 9/1/25 | 2,110 | 2,541 |
| California GO | 5.000% | 9/1/25 | 4,000 | 4,983 |
| California GO | 5.000% | 10/1/25 | 8,490 | 8,780 |
| California GO | 5.000% | 10/1/25 | 13,865 | 16,508 |
| California GO | 5.000% | 11/1/25 | 14,125 | 17,242 |
| California GO | 5.000% | 11/1/25 | 1,500 | 1,696 |
| California GO | 5.000% | 3/1/26 | 5,000 | 5,534 |
| California GO | 5.000% | 4/1/26 | 27,480 | 28,415 |
| California GO | 5.000% | 8/1/26 | 20,040 | 25,125 |
| California GO | 5.000% | 9/1/26 | 2,500 | 2,627 |
43
California Intermediate-Term Tax-Exempt Fund
| | | | |
| | | | Face | Market |
| | | Maturity | Amount | Value• |
| | Coupon | Date | ($000) | ($000) |
| California GO | 5.000% | 9/1/26 | 5,400 | 6,775 |
| California GO | 5.000% | 11/1/26 | 7,500 | 8,476 |
| California GO | 5.000% | 4/1/27 | 24,285 | 25,109 |
| California GO | 5.750% | 4/1/27 | 31,455 | 34,268 |
| California GO | 3.500% | 8/1/27 | 26,345 | 29,129 |
| California GO | 4.500% | 8/1/27 | 95 | 95 |
| California GO | 5.000% | 8/1/27 | 17,000 | 21,048 |
| California GO | 5.000% | 9/1/27 | 5,500 | 5,779 |
| California GO | 5.000% | 10/1/27 | 13,875 | 16,346 |
| California GO | 5.250% | 10/1/27 | 5,000 | 5,848 |
| California GO | 5.750% | 4/1/28 | 30,000 | 32,683 |
| California GO | 5.000% | 8/1/28 | 6,415 | 7,791 |
| California GO | 4.000% | 9/1/28 | 7,000 | 7,961 |
| California GO | 5.000% | 9/1/28 | 17,500 | 18,384 |
| California GO | 5.000% | 9/1/28 | 15,000 | 18,483 |
| California GO | 5.250% | 9/1/28 | 6,000 | 6,985 |
| California GO | 5.250% | 2/1/29 | 2,790 | 3,222 |
| California GO | 5.000% | 8/1/29 | 4,000 | 4,884 |
| California GO | 5.000% | 8/1/29 | 44,320 | 54,114 |
| California GO | 5.000% | 9/1/29 | 16,000 | 16,806 |
| California GO | 5.000% | 9/1/29 | 1,395 | 1,705 |
| California GO | 5.000% | 9/1/29 | 6,000 | 6,923 |
| California GO | 5.000% | 9/1/29 | 6,000 | 7,333 |
| California GO | 5.000% | 10/1/29 | 10,245 | 10,591 |
| California GO | 4.500% | 12/1/29 | 2,525 | 2,893 |
| California GO | 5.250% | 3/1/30 | 20,000 | 22,198 |
| California GO | 5.000% | 5/1/30 | 13,870 | 16,391 |
| California GO | 4.500% | 8/1/30 | 40 | 40 |
| California GO | 5.000% | 8/1/30 | 19,885 | 24,131 |
| California GO | 5.000% | 8/1/30 | 6,500 | 7,888 |
| California GO | 5.000% | 9/1/30 | 10,180 | 10,684 |
| California GO | 5.000% | 9/1/30 | 10,000 | 11,494 |
| California GO | 5.000% | 9/1/30 | 9,100 | 10,934 |
| California GO | 5.250% | 9/1/30 | 5,000 | 5,972 |
| California GO | 5.000% | 10/1/30 | 5,800 | 6,909 |
| California GO | 5.000% | 12/1/30 | 3,760 | 4,437 |
| California GO | 5.750% | 4/1/31 | 37,030 | 40,256 |
| California GO | 5.000% | 5/1/31 | 13,000 | 15,296 |
| California GO | 5.000% | 8/1/31 | 18,000 | 21,682 |
| California GO | 5.000% | 8/1/31 | 10,000 | 11,834 |
| California GO | 5.250% | 8/1/31 | 5,755 | 7,022 |
| California GO | 5.000% | 9/1/31 | 3,020 | 3,643 |
| California GO | 5.000% | 9/1/31 | 7,000 | 8,017 |
| California GO | 5.000% | 10/1/31 | 5,500 | 6,525 |
| California GO | 5.000% | 12/1/31 | 6,000 | 7,060 |
| California GO | 5.000% | 12/1/31 | 6,500 | 7,654 |
| California GO | 5.000% | 2/1/32 | 2,540 | 2,889 |
| California GO | 5.000% | 8/1/32 | 5,000 | 5,944 |
| California GO | 5.250% | 8/1/32 | 2,000 | 2,429 |
| California GO | 5.000% | 9/1/32 | 15,000 | 18,011 |
| California GO | 5.000% | 10/1/32 | 23,500 | 27,776 |
| California GO | 5.000% | 2/1/33 | 1,760 | 2,020 |
| California GO | 5.000% | 2/1/33 | 1,750 | 1,989 |
| California GO | 5.000% | 3/1/33 | 3,395 | 3,982 |
44
California Intermediate-Term Tax-Exempt Fund
| | | | |
| | | | Face | Market |
| | | Maturity | Amount | Value• |
| | Coupon | Date | ($000) | ($000) |
| California GO | 6.000% | 3/1/33 | 12,000 | 13,529 |
| California GO | 5.125% | 4/1/33 | 6,550 | 6,775 |
| California GO | 6.500% | 4/1/33 | 22,715 | 25,024 |
| California GO | 4.000% | 8/1/33 | 15,000 | 16,206 |
| California GO | 5.000% | 8/1/33 | 1,500 | 1,760 |
| California GO | 5.000% | 9/1/33 | 3,830 | 4,450 |
| California GO | 5.000% | 9/1/33 | 25,075 | 29,971 |
| California GO | 5.000% | 12/1/33 | 3,120 | 3,643 |
| California GO | 4.000% | 8/1/34 | 18,000 | 19,328 |
| California GO | 4.000% | 9/1/34 | 26,055 | 27,992 |
| California GO | 4.000% | 9/1/34 | 4,715 | 5,066 |
| California GO | 5.000% | 9/1/34 | 10,620 | 12,645 |
| California GO | 5.000% | 10/1/34 | 9,200 | 10,779 |
| California GO | 5.000% | 8/1/35 | 9,000 | 10,687 |
| California GO | 5.000% | 8/1/35 | 10,000 | 11,747 |
| California GO | 4.000% | 9/1/35 | 3,365 | 3,604 |
| California GO | 5.000% | 9/1/35 | 10,000 | 11,889 |
| California GO | 5.000% | 9/1/35 | 9,805 | 11,657 |
| California GO | 5.000% | 9/1/36 | 10,675 | 12,653 |
| 1 California GO PUT | 1.526% | 12/3/18 | 1,000 | 1,004 |
| California GO PUT | 3.000% | 12/1/19 | 52,000 | 53,898 |
| California GO PUT | 4.000% | 12/1/21 | 21,905 | 24,275 |
| California Health Facilities Financing Authority | | | | |
| Revenue (Adventist Health System/West) | 5.000% | 3/1/20 | 1,075 | 1,184 |
| California Health Facilities Financing Authority | | | | |
| Revenue (Adventist Health System/West) | 4.000% | 3/1/22 | 1,200 | 1,334 |
| California Health Facilities Financing Authority | | | | |
| Revenue (Adventist Health System/West) | 4.000% | 3/1/23 | 1,750 | 1,968 |
| California Health Facilities Financing Authority | | | | |
| Revenue (Adventist Health System/West) | 4.000% | 3/1/24 | 3,300 | 3,737 |
| California Health Facilities Financing Authority | | | | |
| Revenue (Adventist Health System/West) | 4.000% | 3/1/25 | 3,000 | 3,421 |
| California Health Facilities Financing Authority | | | | |
| Revenue (Adventist Health System/West) | 5.000% | 3/1/25 | 5,700 | 6,684 |
| California Health Facilities Financing Authority | | | | |
| Revenue (Adventist Health System/West) | 4.000% | 3/1/26 | 2,000 | 2,284 |
| California Health Facilities Financing Authority | | | | |
| Revenue (Adventist Health System/West) | 5.000% | 3/1/26 | 2,000 | 2,325 |
| California Health Facilities Financing Authority | | | | |
| Revenue (Adventist Health System/West) | 4.000% | 3/1/27 | 3,605 | 4,060 |
| California Health Facilities Financing Authority | | | | |
| Revenue (Adventist Health System/West) | 4.000% | 3/1/31 | 2,100 | 2,260 |
| California Health Facilities Financing Authority | | | | |
| Revenue (Adventist Health System/West) | 4.000% | 3/1/32 | 2,375 | 2,536 |
| California Health Facilities Financing Authority | | | | |
| Revenue (Adventist Health System/West) | 4.000% | 3/1/33 | 23,205 | 24,396 |
| California Health Facilities Financing Authority | | | | |
| Revenue (Adventist Health System/West) | 4.000% | 3/1/33 | 2,500 | 2,650 |
| California Health Facilities Financing Authority | | | | |
| Revenue (Adventist Health System/West) | 4.000% | 3/1/34 | 3,000 | 3,156 |
| California Health Facilities Financing Authority | | | | |
| Revenue (Adventist Health System/West) | 4.000% | 3/1/35 | 3,150 | 3,306 |
| California Health Facilities Financing Authority | | | | |
| Revenue (Catholic Healthcare West) | 5.000% | 3/1/19 | 215 | 230 |
45
California Intermediate-Term Tax-Exempt Fund
| | | | |
| | | | Face | Market |
| | | Maturity | Amount | Value• |
| | Coupon | Date | ($000) | ($000) |
| California Health Facilities Financing Authority | | | | |
| Revenue (Catholic Healthcare West) | 5.000% | 7/1/19 (ETM) | 1,000 | 1,085 |
| California Health Facilities Financing Authority | | | | |
| Revenue (Catholic Healthcare West) | 6.000% | 7/1/19 (Prere.) | 4,260 | 4,706 |
| California Health Facilities Financing Authority | | | | |
| Revenue (Catholic Healthcare West) | 5.000% | 3/1/20 | 4,750 | 5,237 |
| California Health Facilities Financing Authority | | | | |
| Revenue (Catholic Healthcare West) | 5.000% | 3/1/21 | 3,810 | 4,322 |
| California Health Facilities Financing Authority | | | | |
| Revenue (Catholic Healthcare West) | 5.250% | 3/1/22 | 8,000 | 9,092 |
| California Health Facilities Financing Authority | | | | |
| Revenue (Catholic Healthcare West) | 5.250% | 3/1/23 | 1,555 | 1,771 |
| California Health Facilities Financing Authority | | | | |
| Revenue (Catholic Healthcare West) | 5.500% | 7/1/25 | 5,300 | 5,540 |
| California Health Facilities Financing Authority | | | | |
| Revenue (Catholic Healthcare West) | 5.625% | 7/1/25 | 19,820 | 21,490 |
| California Health Facilities Financing Authority | | | | |
| Revenue (Catholic Healthcare West) | 5.250% | 3/1/27 | 7,500 | 8,471 |
| California Health Facilities Financing Authority | | | | |
| Revenue (Cedars-Sinai Medical Center) | 5.000% | 8/15/19 | 1,000 | 1,087 |
| California Health Facilities Financing Authority | | | | |
| Revenue (Cedars-Sinai Medical Center) | 5.000% | 8/15/20 | 2,100 | 2,355 |
| California Health Facilities Financing Authority | | | | |
| Revenue (Cedars-Sinai Medical Center) | 5.000% | 8/15/21 | 2,000 | 2,306 |
| California Health Facilities Financing Authority | | | | |
| Revenue (Cedars-Sinai Medical Center) | 5.000% | 11/15/26 | 6,905 | 8,493 |
| California Health Facilities Financing Authority | | | | |
| Revenue (Cedars-Sinai Medical Center) | 5.000% | 11/15/29 | 7,250 | 8,678 |
| California Health Facilities Financing Authority | | | | |
| Revenue (Cedars-Sinai Medical Center) | 5.000% | 11/15/31 | 1,600 | 1,896 |
| California Health Facilities Financing Authority | | | | |
| Revenue (Cedars-Sinai Medical Center) | 4.000% | 8/15/35 | 14,000 | 14,875 |
| California Health Facilities Financing Authority | | | | |
| Revenue (Children’s Hospital of Los Angeles) | 5.000% | 11/15/22 | 3,500 | 4,094 |
| California Health Facilities Financing Authority | | | | |
| Revenue (Children’s Hospital of Los Angeles) | 5.000% | 11/15/23 | 1,370 | 1,590 |
| California Health Facilities Financing Authority | | | | |
| Revenue (Children’s Hospital of Los Angeles) | 5.000% | 11/15/24 | 7,410 | 8,543 |
| California Health Facilities Financing Authority | | | | |
| Revenue (Children’s Hospital of Los Angeles) | 5.000% | 11/15/27 | 4,000 | 4,531 |
| California Health Facilities Financing Authority | | | | |
| Revenue (Children’s Hospital of Los Angeles) | 5.000% | 11/15/29 | 2,890 | 3,240 |
| 4 California Health Facilities Financing Authority | | | | |
| Revenue (Children’s Hospital of Los Angeles) | 5.000% | 8/15/32 | 350 | 405 |
| 4 California Health Facilities Financing Authority | | | | |
| Revenue (Children’s Hospital of Los Angeles) | 5.000% | 8/15/33 | 620 | 715 |
| 4 California Health Facilities Financing Authority | | | | |
| Revenue (Children’s Hospital of Los Angeles) | 4.000% | 8/15/34 | 215 | 220 |
| 4 California Health Facilities Financing Authority | | | | |
| Revenue (Children’s Hospital of Los Angeles) | 5.000% | 8/15/35 | 3,650 | 4,197 |
| 4 California Health Facilities Financing Authority | | | | |
| Revenue (Children’s Hospital of Los Angeles) | 5.000% | 8/15/36 | 4,000 | 4,584 |
| 4 California Health Facilities Financing Authority | | | | |
| Revenue (Children’s Hospital of Los Angeles) | 5.000% | 8/15/37 | 1,335 | 1,525 |
46
California Intermediate-Term Tax-Exempt Fund
| | | | |
| | | | Face | Market |
| | | Maturity | Amount | Value• |
| | Coupon | Date | ($000) | ($000) |
| 1 California Health Facilities Financing Authority | | | | |
| Revenue (Children’s Hospital of Los Angeles) | | | | |
| PUT | 2.580% | 7/1/17 | 5,255 | 5,255 |
| California Health Facilities Financing Authority | | | | |
| Revenue (Children’s Hospital of Orange County) | 6.250% | 11/1/29 | 5,000 | 5,609 |
| California Health Facilities Financing Authority | | | | |
| Revenue (Children’s Hospital of Orange County) | 5.000% | 11/1/31 | 2,000 | 2,223 |
| California Health Facilities Financing Authority | | | | |
| Revenue (Chinese Hospital Association) | 5.000% | 6/1/19 | 300 | 322 |
| California Health Facilities Financing Authority | | | | |
| Revenue (Chinese Hospital Association) | 5.000% | 6/1/21 | 450 | 511 |
| California Health Facilities Financing Authority | | | | |
| Revenue (Chinese Hospital Association) | 5.000% | 6/1/22 | 875 | 1,016 |
| California Health Facilities Financing Authority | | | | |
| Revenue (Chinese Hospital Association) | 5.000% | 6/1/23 | 760 | 879 |
| California Health Facilities Financing Authority | | | | |
| Revenue (Chinese Hospital Association) | 5.000% | 6/1/25 | 310 | 359 |
| California Health Facilities Financing Authority | | | | |
| Revenue (Chinese Hospital Association) | 5.000% | 6/1/26 | 805 | 912 |
| California Health Facilities Financing Authority | | | | |
| Revenue (City of Hope Medical Center) | 5.000% | 11/15/19 | 800 | 874 |
| California Health Facilities Financing Authority | | | | |
| Revenue (City of Hope Medical Center) | 4.000% | 11/15/20 | 750 | 819 |
| California Health Facilities Financing Authority | | | | |
| Revenue (City of Hope Medical Center) | 5.000% | 11/15/21 | 1,400 | 1,617 |
| California Health Facilities Financing Authority | | | | |
| Revenue (City of Hope Medical Center) | 5.000% | 11/15/23 | 1,500 | 1,763 |
| California Health Facilities Financing Authority | | | | |
| Revenue (City of Hope Medical Center) | 5.000% | 11/15/24 | 1,700 | 1,994 |
| California Health Facilities Financing Authority | | | | |
| Revenue (City of Hope Medical Center) | 5.000% | 11/15/25 | 2,250 | 2,626 |
| California Health Facilities Financing Authority | | | | |
| Revenue (City of Hope Medical Center) | 5.000% | 11/15/32 | 12,500 | 14,235 |
| California Health Facilities Financing Authority | | | | |
| Revenue (City of Hope Medical Center) | 5.000% | 11/15/35 | 3,500 | 3,984 |
| California Health Facilities Financing Authority | | | | |
| Revenue (El Camino Hospital) | 3.000% | 2/1/19 | 1,235 | 1,275 |
| California Health Facilities Financing Authority | | | | |
| Revenue (El Camino Hospital) | 4.000% | 2/1/20 | 1,715 | 1,841 |
| California Health Facilities Financing Authority | | | | |
| Revenue (El Camino Hospital) | 5.000% | 2/1/27 | 1,250 | 1,538 |
| California Health Facilities Financing Authority | | | | |
| Revenue (El Camino Hospital) | 5.000% | 2/1/28 | 1,350 | 1,640 |
| California Health Facilities Financing Authority | | | | |
| Revenue (El Camino Hospital) | 5.000% | 2/1/28 | 3,000 | 3,524 |
| California Health Facilities Financing Authority | | | | |
| Revenue (El Camino Hospital) | 5.000% | 2/1/29 | 2,500 | 3,001 |
| California Health Facilities Financing Authority | | | | |
| Revenue (El Camino Hospital) | 5.000% | 2/1/29 | 1,000 | 1,167 |
| California Health Facilities Financing Authority | | | | |
| Revenue (El Camino Hospital) | 5.000% | 2/1/30 | 2,205 | 2,545 |
| California Health Facilities Financing Authority | | | | |
| Revenue (El Camino Hospital) | 5.000% | 2/1/31 | 5,930 | 6,793 |
47
California Intermediate-Term Tax-Exempt Fund
| | | | |
| | | | Face | Market |
| | | Maturity | Amount | Value• |
| | Coupon | Date | ($000) | ($000) |
| California Health Facilities Financing Authority | | | | |
| Revenue (El Camino Hospital) | 5.000% | 2/1/32 | 2,610 | 2,971 |
| California Health Facilities Financing Authority | | | | |
| Revenue (El Camino Hospital) | 5.000% | 2/1/33 | 3,000 | 3,481 |
| California Health Facilities Financing Authority | | | | |
| Revenue (El Camino Hospital) | 5.000% | 2/1/33 | 3,295 | 3,736 |
| California Health Facilities Financing Authority | | | | |
| Revenue (El Camino Hospital) | 5.000% | 2/1/34 | 2,510 | 2,903 |
| California Health Facilities Financing Authority | | | | |
| Revenue (El Camino Hospital) | 5.000% | 2/1/34 | 2,390 | 2,703 |
| California Health Facilities Financing Authority | | | | |
| Revenue (El Camino Hospital) | 5.000% | 2/1/35 | 3,500 | 4,036 |
| California Health Facilities Financing Authority | | | | |
| Revenue (El Camino Hospital) | 5.000% | 2/1/35 | 4,020 | 4,535 |
| California Health Facilities Financing Authority | | | | |
| Revenue (El Camino Hospital) | 5.000% | 2/1/36 | 3,000 | 3,438 |
| California Health Facilities Financing Authority | | | | |
| Revenue (Kaiser Permanente) | 5.000% | 11/1/27 | 33,000 | 41,605 |
| California Health Facilities Financing Authority | | | | |
| Revenue (Kaiser Permanente) | 4.000% | 11/1/38 | 17,000 | 17,797 |
| California Health Facilities Financing Authority | | | | |
| Revenue (Kaiser Permanente) PUT | 5.000% | 11/1/22 | 5,000 | 5,904 |
| California Health Facilities Financing Authority | | | | |
| Revenue (Kaiser Permanente) PUT | 5.000% | 11/1/22 | 40,000 | 47,234 |
| 2 California Health Facilities Financing Authority | | | | |
| Revenue (Kaiser Permanente) TOB VRDO | 0.800% | 6/7/17 | 5,500 | 5,500 |
| 2 California Health Facilities Financing Authority | | | | |
| Revenue (Kaiser Permanente) TOB VRDO | 0.890% | 6/7/17 LOC | 7,435 | 7,435 |
| California Health Facilities Financing Authority | | | | |
| Revenue (Kaiser Permanente) VRDO | 0.750% | 6/7/17 | 7,700 | 7,700 |
| California Health Facilities Financing Authority | | | | |
| Revenue (Lucile Salter Packard Children’s | | | | |
| Hospital at Stanford) | 4.000% | 8/15/19 | 500 | 533 |
| California Health Facilities Financing Authority | | | | |
| Revenue (Lucile Salter Packard Children’s | | | | |
| Hospital at Stanford) | 5.000% | 8/15/21 | 800 | 924 |
| California Health Facilities Financing Authority | | | | |
| Revenue (Lucile Salter Packard Children’s | | | | |
| Hospital at Stanford) | 5.000% | 8/15/21 | 470 | 542 |
| California Health Facilities Financing Authority | | | | |
| Revenue (Lucile Salter Packard Children’s | | | | |
| Hospital at Stanford) | 5.000% | 8/15/22 | 500 | 592 |
| California Health Facilities Financing Authority | | | | |
| Revenue (Lucile Salter Packard Children’s | | | | |
| Hospital at Stanford) | 5.000% | 8/15/22 | 350 | 414 |
| California Health Facilities Financing Authority | | | | |
| Revenue (Lucile Salter Packard Children’s | | | | |
| Hospital at Stanford) | 5.000% | 8/15/23 | 300 | 362 |
| California Health Facilities Financing Authority | | | | |
| Revenue (Lucile Salter Packard Children’s | | | | |
| Hospital at Stanford) | 5.000% | 8/15/30 | 1,655 | 2,002 |
| California Health Facilities Financing Authority | | | | |
| Revenue (Lucile Salter Packard Children’s | | | | |
| Hospital at Stanford) | 5.000% | 8/15/31 | 1,300 | 1,565 |
48
California Intermediate-Term Tax-Exempt Fund
| | | | |
| | | | Face | Market |
| | | Maturity | Amount | Value• |
| | Coupon | Date | ($000) | ($000) |
| California Health Facilities Financing Authority | | | | |
| Revenue (Lucile Salter Packard Children’s | | | | |
| Hospital at Stanford) | 5.000% | 8/15/32 | 1,500 | 1,796 |
| California Health Facilities Financing Authority | | | | |
| Revenue (Lucile Salter Packard Children’s | | | | |
| Hospital at Stanford) | 5.000% | 8/15/33 | 1,610 | 1,917 |
| California Health Facilities Financing Authority | | | | |
| Revenue (Lucile Salter Packard Children’s | | | | |
| Hospital at Stanford) | 4.000% | 8/15/34 | 1,500 | 1,568 |
| California Health Facilities Financing Authority | | | | |
| Revenue (Marshall Medical Center) | 5.000% | 11/1/24 | 850 | 1,024 |
| California Health Facilities Financing Authority | | | | |
| Revenue (Marshall Medical Center) | 5.000% | 11/1/25 | 425 | 507 |
| California Health Facilities Financing Authority | | | | |
| Revenue (Marshall Medical Center) | 5.000% | 11/1/26 | 775 | 916 |
| California Health Facilities Financing Authority | | | | |
| Revenue (Memorial Health Services) | 5.000% | 10/1/18 | 1,320 | 1,393 |
| California Health Facilities Financing Authority | | | | |
| Revenue (Memorial Health Services) | 4.000% | 10/1/19 | 1,520 | 1,625 |
| California Health Facilities Financing Authority | | | | |
| Revenue (Memorial Health Services) | 5.000% | 10/1/19 | 1,000 | 1,093 |
| California Health Facilities Financing Authority | | | | |
| Revenue (Memorial Health Services) | 4.000% | 10/1/20 | 1,800 | 1,968 |
| California Health Facilities Financing Authority | | | | |
| Revenue (Memorial Health Services) | 4.000% | 10/1/21 | 1,020 | 1,136 |
| California Health Facilities Financing Authority | | | | |
| Revenue (Memorial Health Services) | 5.000% | 10/1/21 | 1,000 | 1,159 |
| California Health Facilities Financing Authority | | | | |
| Revenue (Memorial Health Services) | 4.000% | 10/1/22 | 2,250 | 2,546 |
| California Health Facilities Financing Authority | | | | |
| Revenue (Memorial Health Services) | 5.000% | 10/1/22 | 2,400 | 2,848 |
| California Health Facilities Financing Authority | | | | |
| Revenue (Memorial Health Services) | 5.000% | 10/1/24 | 5,000 | 5,840 |
| California Health Facilities Financing Authority | | | | |
| Revenue (Memorial Health Services) | 5.000% | 10/1/25 | 5,000 | 5,826 |
| California Health Facilities Financing Authority | | | | |
| Revenue (Northern California Presbyterian | | | | |
| Homes & Services) | 5.000% | 7/1/17 | 380 | 381 |
| California Health Facilities Financing Authority | | | | |
| Revenue (Northern California Presbyterian | | | | |
| Homes & Services) | 5.000% | 7/1/18 | 335 | 350 |
| California Health Facilities Financing Authority | | | | |
| Revenue (Northern California Presbyterian | | | | |
| Homes & Services) | 5.000% | 7/1/20 | 300 | 335 |
| California Health Facilities Financing Authority | | | | |
| Revenue (Northern California Presbyterian | | | | |
| Homes & Services) | 5.000% | 7/1/21 | 465 | 534 |
| California Health Facilities Financing Authority | | | | |
| Revenue (Northern California Presbyterian | | | | |
| Homes & Services) | 5.000% | 7/1/22 | 175 | 206 |
| California Health Facilities Financing Authority | | | | |
| Revenue (Northern California Presbyterian | | | | |
| Homes & Services) | 5.000% | 7/1/24 | 370 | 451 |
49
California Intermediate-Term Tax-Exempt Fund
| | | | |
| | | | Face | Market |
| | | Maturity | Amount | Value• |
| | Coupon | Date | ($000) | ($000) |
| California Health Facilities Financing Authority | | | | |
| Revenue (Northern California Presbyterian | | | | |
| Homes & Services) | 5.000% | 7/1/25 | 500 | 616 |
| California Health Facilities Financing Authority | | | | |
| Revenue (Northern California Presbyterian | | | | |
| Homes & Services) | 5.000% | 7/1/26 | 750 | 910 |
| California Health Facilities Financing Authority | | | | |
| Revenue (Northern California Presbyterian | | | | |
| Homes & Services) | 5.000% | 7/1/28 | 880 | 1,044 |
| California Health Facilities Financing Authority | | | | |
| Revenue (Northern California Presbyterian | | | | |
| Homes & Services) | 5.000% | 7/1/29 | 855 | 1,001 |
| California Health Facilities Financing Authority | | | | |
| Revenue (Northern California Presbyterian | | | | |
| Homes & Services) | 5.000% | 7/1/31 | 870 | 1,005 |
| California Health Facilities Financing Authority | | | | |
| Revenue (Providence Health & Services) | 6.250% | 10/1/18 (Prere.) | 3,030 | 3,248 |
| California Health Facilities Financing Authority | | | | |
| Revenue (Providence Health & Services) | 6.250% | 10/1/18 (Prere.) | 4,000 | 4,287 |
| California Health Facilities Financing Authority | | | | |
| Revenue (Providence Health & Services) | 5.000% | 10/1/25 | 2,610 | 3,193 |
| California Health Facilities Financing Authority | | | | |
| Revenue (Providence Health & Services) | 5.000% | 10/1/26 | 2,700 | 3,261 |
| California Health Facilities Financing Authority | | | | |
| Revenue (Providence Health & Services) | 5.000% | 10/1/28 | 1,840 | 2,187 |
| California Health Facilities Financing Authority | | | | |
| Revenue (Providence Health & Services) | 5.000% | 10/1/30 | 4,000 | 4,700 |
| California Health Facilities Financing Authority | | | | |
| Revenue (Providence Health & Services) | 5.000% | 10/1/31 | 5,000 | 5,862 |
| California Health Facilities Financing Authority | | | | |
| Revenue (Providence Health & Services) | 5.000% | 10/1/33 | 5,000 | 5,829 |
| California Health Facilities Financing Authority | | | | |
| Revenue (Providence Health & Services) | 5.000% | 10/1/34 | 5,650 | 6,566 |
| California Health Facilities Financing Authority | | | | |
| Revenue (Providence St. Joseph Health | | | | |
| Obligated Group) | 5.000% | 10/1/30 | 2,015 | 2,414 |
| California Health Facilities Financing Authority | | | | |
| Revenue (Providence St. Joseph Health | | | | |
| Obligated Group) | 5.000% | 10/1/31 | 2,000 | 2,384 |
| California Health Facilities Financing Authority | | | | |
| Revenue (Providence St. Joseph Health | | | | |
| Obligated Group) | 4.000% | 10/1/34 | 2,250 | 2,377 |
| California Health Facilities Financing Authority | | | | |
| Revenue (Providence St. Joseph Health | | | | |
| Obligated Group) | 4.000% | 10/1/35 | 8,000 | 8,427 |
| California Health Facilities Financing Authority | | | | |
| Revenue (Providence St. Joseph Health | | | | |
| Obligated Group) PUT | 1.250% | 10/1/20 | 6,420 | 6,399 |
| California Health Facilities Financing Authority | | | | |
| Revenue (Providence St. Joseph Health | | | | |
| Obligated Group) PUT | 2.000% | 10/1/25 | 18,000 | 17,532 |
| California Health Facilities Financing Authority | | | | |
| Revenue (Rady Children’s Hospital) | 5.000% | 8/15/20 | 500 | 556 |
50
California Intermediate-Term Tax-Exempt Fund
| | | | |
| | | | Face | Market |
| | | Maturity | Amount | Value• |
| | Coupon | Date | ($000) | ($000) |
| California Health Facilities Financing Authority | | | | |
| Revenue (Rady Children’s Hospital) | 5.500% | 8/15/26 | 6,000 | 6,937 |
| California Health Facilities Financing Authority | | | | |
| Revenue (Rady Children’s Hospital) | 5.000% | 8/15/31 | 2,865 | 3,206 |
| California Health Facilities Financing Authority | | | | |
| Revenue (Scripps Health) | 5.000% | 10/1/17 | 2,515 | 2,550 |
| California Health Facilities Financing Authority | | | | |
| Revenue (Scripps Health) | 5.000% | 10/1/18 | 3,000 | 3,163 |
| California Health Facilities Financing Authority | | | | |
| Revenue (Scripps Health) | 5.000% | 11/15/25 | 750 | 870 |
| California Health Facilities Financing Authority | | | | |
| Revenue (Scripps Health) | 5.000% | 11/15/27 | 850 | 978 |
| California Health Facilities Financing Authority | | | | |
| Revenue (Scripps Health) | 5.000% | 11/15/28 | 1,175 | 1,349 |
| California Health Facilities Financing Authority | | | | |
| Revenue (Scripps Health) | 5.000% | 11/15/32 | 1,000 | 1,138 |
| California Health Facilities Financing Authority | | | | |
| Revenue (St. Joseph Health System) | 5.000% | 7/1/29 | 4,970 | 5,769 |
| California Health Facilities Financing Authority | | | | |
| Revenue (St. Joseph Health System) | 5.500% | 7/1/29 | 10,000 | 10,842 |
| California Health Facilities Financing Authority | | | | |
| Revenue (St. Joseph Health System) | 5.000% | 7/1/33 | 6,250 | 7,168 |
| California Health Facilities Financing Authority | | | | |
| Revenue (St. Joseph Health System) PUT | 5.000% | 10/17/17 | 1,250 | 1,269 |
| California Health Facilities Financing Authority | | | | |
| Revenue (St. Joseph Health System) PUT | 5.000% | 10/15/20 | 12,500 | 13,991 |
| California Health Facilities Financing Authority | | | | |
| Revenue (Stanford Hospital) | 5.000% | 8/15/19 | 2,000 | 2,177 |
| California Health Facilities Financing Authority | | | | |
| Revenue (Stanford Hospital) | 4.000% | 8/15/21 | 2,250 | 2,505 |
| California Health Facilities Financing Authority | | | | |
| Revenue (Stanford Hospital) | 5.000% | 8/15/23 | 1,830 | 2,173 |
| California Health Facilities Financing Authority | | | | |
| Revenue (Stanford Hospital) | 5.250% | 11/15/31 | 2,000 | 2,234 |
| California Health Facilities Financing Authority | | | | |
| Revenue (Sutter Health) | 5.000% | 8/15/19 | 2,000 | 2,177 |
| California Health Facilities Financing Authority | | | | |
| Revenue (Sutter Health) | 5.000% | 8/15/20 | 2,200 | 2,470 |
| California Health Facilities Financing Authority | | | | |
| Revenue (Sutter Health) | 5.000% | 8/15/21 | 1,275 | 1,472 |
| California Health Facilities Financing Authority | | | | |
| Revenue (Sutter Health) | 5.000% | 11/15/21 | 500 | 580 |
| California Health Facilities Financing Authority | | | | |
| Revenue (Sutter Health) | 5.000% | 8/15/22 | 1,090 | 1,269 |
| California Health Facilities Financing Authority | | | | |
| Revenue (Sutter Health) | 5.000% | 11/15/22 | 200 | 238 |
| California Health Facilities Financing Authority | | | | |
| Revenue (Sutter Health) | 5.000% | 11/15/23 | 300 | 362 |
| California Health Facilities Financing Authority | | | | |
| Revenue (Sutter Health) | 5.000% | 11/15/24 | 400 | 490 |
| California Health Facilities Financing Authority | | | | |
| Revenue (Sutter Health) | 5.000% | 11/15/24 | 1,000 | 1,225 |
| California Health Facilities Financing Authority | | | | |
| Revenue (Sutter Health) | 5.000% | 11/15/25 | 400 | 495 |
51
California Intermediate-Term Tax-Exempt Fund
| | | | |
| | | | Face | Market |
| | | Maturity | Amount | Value• |
| | Coupon | Date | ($000) | ($000) |
| California Health Facilities Financing Authority | | | | |
| Revenue (Sutter Health) | 5.000% | 11/15/25 | 600 | 743 |
| California Health Facilities Financing Authority | | | | |
| Revenue (Sutter Health) | 5.500% | 8/15/26 | 4,750 | 5,389 |
| California Health Facilities Financing Authority | | | | |
| Revenue (Sutter Health) | 5.000% | 11/15/26 | 400 | 488 |
| California Health Facilities Financing Authority | | | | |
| Revenue (Sutter Health) | 5.000% | 11/15/26 | 1,000 | 1,243 |
| California Health Facilities Financing Authority | | | | |
| Revenue (Sutter Health) | 5.000% | 11/15/27 | 400 | 482 |
| California Health Facilities Financing Authority | | | | |
| Revenue (Sutter Health) | 5.000% | 11/15/28 | 500 | 599 |
| California Health Facilities Financing Authority | | | | |
| Revenue (Sutter Health) | 5.000% | 11/15/28 | 1,250 | 1,524 |
| California Health Facilities Financing Authority | | | | |
| Revenue (Sutter Health) | 5.000% | 11/15/29 | 850 | 1,026 |
| California Health Facilities Financing Authority | | | | |
| Revenue (Sutter Health) | 5.000% | 11/15/30 | 1,150 | 1,380 |
| California Health Facilities Financing Authority | | | | |
| Revenue (Sutter Health) | 5.250% | 8/15/31 | 5,505 | 6,341 |
| California Health Facilities Financing Authority | | | | |
| Revenue (Sutter Health) | 5.875% | 8/15/31 | 5,000 | 5,714 |
| California Health Facilities Financing Authority | | | | |
| Revenue (Sutter Health) | 5.000% | 11/15/31 | 1,110 | 1,326 |
| California Health Facilities Financing Authority | | | | |
| Revenue (Sutter Health) | 5.000% | 11/15/32 | 1,400 | 1,662 |
| California Health Facilities Financing Authority | | | | |
| Revenue (Sutter Health) | 5.000% | 11/15/33 | 3,580 | 4,224 |
| California Health Facilities Financing Authority | | | | |
| Revenue (Sutter Health) | 5.000% | 11/15/34 | 4,000 | 4,701 |
| California Health Facilities Financing Authority | | | | |
| Revenue (Sutter Health) | 5.000% | 11/15/35 | 2,500 | 2,931 |
| California Health Facilities Financing Authority | | | | |
| Revenue (Sutter Health) | 5.000% | 11/15/36 | 3,000 | 3,507 |
| California Health Facilities Financing Authority | | | | |
| Revenue (Sutter Health) PUT | 1.000% | 8/15/19 | 6,000 | 5,967 |
| California Infrastructure & Economic | | | | |
| Development Bank Revenue | 5.000% | 7/1/20 | 200 | 223 |
| California Infrastructure & Economic | | | | |
| Development Bank Revenue | 5.000% | 7/1/21 | 300 | 344 |
| California Infrastructure & Economic | | | | |
| Development Bank Revenue | 5.000% | 7/1/22 | 200 | 234 |
| California Infrastructure & Economic | | | | |
| Development Bank Revenue | 4.000% | 10/1/22 | 1,000 | 1,143 |
| California Infrastructure & Economic | | | | |
| Development Bank Revenue | 5.000% | 10/1/22 | 1,400 | 1,672 |
| California Infrastructure & Economic | | | | |
| Development Bank Revenue | 5.000% | 7/1/23 | 200 | 238 |
| California Infrastructure & Economic | | | | |
| Development Bank Revenue | 5.000% | 10/1/23 | 1,800 | 2,197 |
| California Infrastructure & Economic | | | | |
| Development Bank Revenue | 5.000% | 7/1/24 | 600 | 727 |
| California Infrastructure & Economic | | | | |
| Development Bank Revenue | 5.000% | 10/1/24 | 1,300 | 1,616 |
52
California Intermediate-Term Tax-Exempt Fund
| | | | |
| | | | Face | Market |
| | | Maturity | Amount | Value• |
| | Coupon | Date | ($000) | ($000) |
| California Infrastructure & Economic | | | | |
| Development Bank Revenue | 5.000% | 10/1/24 | 1,175 | 1,460 |
| California Infrastructure & Economic | | | | |
| Development Bank Revenue | 5.000% | 10/1/25 | 1,500 | 1,892 |
| California Infrastructure & Economic | | | | |
| Development Bank Revenue | 5.000% | 7/1/26 | 760 | 938 |
| California Infrastructure & Economic | | | | |
| Development Bank Revenue | 5.000% | 10/1/26 | 1,500 | 1,911 |
| California Infrastructure & Economic | | | | |
| Development Bank Revenue | 5.000% | 7/1/27 | 1,775 | 2,163 |
| California Infrastructure & Economic | | | | |
| Development Bank Revenue | 4.000% | 7/1/29 | 910 | 991 |
| California Infrastructure & Economic Development | | | | |
| Bank Revenue (Academy of Motion Picture Arts | | | | |
| & Sciences Obligated Group) | 5.000% | 11/1/20 | 1,000 | 1,127 |
| California Infrastructure & Economic Development | | | | |
| Bank Revenue (Academy of Motion Picture Arts | | | | |
| & Sciences Obligated Group) | 5.000% | 11/1/21 | 800 | 926 |
| California Infrastructure & Economic Development | | | | |
| Bank Revenue (Academy of Motion Picture Arts | | | | |
| & Sciences Obligated Group) | 5.000% | 11/1/29 | 1,500 | 1,772 |
| California Infrastructure & Economic Development | | | | |
| Bank Revenue (Independent System Operator | | | | |
| Corp. Project) | 5.000% | 2/1/34 | 10,000 | 11,330 |
| 1 California Infrastructure & Economic Development | | | | |
| Bank Revenue (Index-Museum Art Project) PUT | 2.473% | 8/1/18 | 6,000 | 6,035 |
| California Infrastructure & Economic Development | | | | |
| Bank Revenue (Pacific Gas & Electric Co.) VRDO | 0.690% | 6/1/17 LOC | 9,200 | 9,200 |
| California Infrastructure & Economic Development | | | | |
| Bank Revenue (Salvation Army Western Territory) | 5.000% | 9/1/26 | 825 | 1,020 |
| California Infrastructure & Economic Development | | | | |
| Bank Revenue (Salvation Army Western Territory) | 5.000% | 9/1/27 | 500 | 610 |
| California Infrastructure & Economic Development | | | | |
| Bank Revenue (Salvation Army Western Territory) | 5.000% | 9/1/28 | 555 | 671 |
| California Infrastructure & Economic Development | | | | |
| Bank Revenue (Salvation Army Western Territory) | 5.000% | 9/1/29 | 1,000 | 1,199 |
| California Infrastructure & Economic Development | | | | |
| Bank Revenue (Salvation Army Western Territory) | 4.000% | 9/1/31 | 1,760 | 1,885 |
| California Infrastructure & Economic Development | | | | |
| Bank Revenue (Salvation Army Western Territory) | 4.000% | 9/1/34 | 715 | 753 |
| California Infrastructure & Economic Development | | | | |
| Bank Revenue (Salvation Army Western Territory) | 4.000% | 9/1/35 | 750 | 790 |
| California Infrastructure & Economic Development | | | | |
| Bank Revenue (Sanford Consortium for | | | | |
| Regenerative Medicine) | 5.000% | 5/15/28 | 1,030 | 1,263 |
| California Infrastructure & Economic Development | | | | |
| Bank Revenue (Sanford Consortium for | | | | |
| Regenerative Medicine) | 5.000% | 5/15/29 | 740 | 899 |
| California Infrastructure & Economic Development | | | | |
| Bank Revenue (Sanford Consortium for | | | | |
| Regenerative Medicine) | 5.000% | 5/15/30 | 1,080 | 1,303 |
| California Infrastructure & Economic Development | | | | |
| Bank Revenue (Sanford Consortium for | | | | |
| Regenerative Medicine) | 5.000% | 5/15/31 | 1,225 | 1,469 |
53
California Intermediate-Term Tax-Exempt Fund
| | | | |
| | | | Face | Market |
| | | Maturity | Amount | Value• |
| | Coupon | Date | ($000) | ($000) |
| California Infrastructure & Economic Development | | | | |
| Bank Revenue (Sanford Consortium for | | | | |
| Regenerative Medicine) | 5.000% | 5/15/32 | 1,140 | 1,360 |
| California Infrastructure & Economic Development | | | | |
| Bank Revenue (Sanford Consortium for | | | | |
| Regenerative Medicine) | 5.000% | 5/15/33 | 1,110 | 1,318 |
| California Infrastructure & Economic Development | | | | |
| Bank Revenue (Sanford Consortium for | | | | |
| Regenerative Medicine) | 5.000% | 5/15/34 | 2,850 | 3,368 |
| California Infrastructure & Economic Development | | | | |
| Bank Revenue (Science Center Phase II Project) | 5.000% | 5/1/18 | 500 | 518 |
| California Infrastructure & Economic Development | | | | |
| Bank Revenue (Science Center Phase II Project) | 5.000% | 5/1/19 | 1,560 | 1,674 |
| California Infrastructure & Economic Development | | | | |
| Bank Revenue (Science Center Phase II Project) | 5.000% | 5/1/20 | 1,070 | 1,184 |
| California Infrastructure & Economic Development | | | | |
| Bank Revenue (Science Center Phase II Project) | 5.000% | 5/1/21 | 1,000 | 1,138 |
| California Infrastructure & Economic Development | | | | |
| Bank Revenue (Science Center Phase II Project) | 5.000% | 5/1/22 | 1,500 | 1,744 |
| California Infrastructure & Economic Development | | | | |
| Bank Revenue (Science Center Phase II Project) | 5.000% | 5/1/23 | 1,150 | 1,365 |
| California Infrastructure & Economic Development | | | | |
| Bank Revenue (Science Center Phase II Project) | 5.000% | 5/1/24 | 1,300 | 1,561 |
| California Infrastructure & Economic Development | | | | |
| Bank Revenue (Science Center Phase II Project) | 5.000% | 5/1/25 | 1,365 | 1,654 |
| California Infrastructure & Economic Development | | | | |
| Bank Revenue (Science Center Phase II Project) | 5.000% | 5/1/26 | 1,430 | 1,734 |
| California Infrastructure & Economic Development | | | | |
| Bank Revenue (Science Center Phase II Project) | 5.000% | 5/1/26 | 1,190 | 1,443 |
| California Infrastructure & Economic Development | | | | |
| Bank Revenue (Science Center Phase II Project) | 5.000% | 5/1/27 | 1,500 | 1,814 |
| California Infrastructure & Economic Development | | | | |
| Bank Revenue (Science Center Phase II Project) | 5.000% | 5/1/30 | 1,500 | 1,764 |
| California Infrastructure & Economic Development | | | | |
| Bank Revenue (Science Center Phase II Project) | 5.000% | 5/1/31 | 1,000 | 1,169 |
| California Municipal Finance Authority | | | | |
| (Community Hospitals of Central California | | | | |
| Obligated Group) COP | 5.375% | 2/1/19 (Prere.) | 16,610 | 17,839 |
| California Municipal Finance Authority Mobile | | | | |
| Home Park Revenue (Caritas Affordable | | | | |
| Housing Inc. Projects) | 5.000% | 8/15/21 | 565 | 631 |
| California Municipal Finance Authority Mobile | | | | |
| Home Park Revenue (Caritas Affordable | | | | |
| Housing Inc. Projects) | 5.000% | 8/15/23 | 400 | 459 |
| California Municipal Finance Authority Mobile | | | | |
| Home Park Revenue (Caritas Affordable | | | | |
| Housing Inc. Projects) | 5.000% | 8/15/30 | 1,000 | 1,116 |
| California Municipal Finance Authority Pollution | | | | |
| Control Revenue (Chevron USA Inc. Project) | | | | |
| VRDO | 0.690% | 6/1/17 | 3,600 | 3,600 |
| California Municipal Finance Authority Recovery | | | | |
| Zone Revenue (Chevron USA Inc. Project) VRDO | 0.690% | 6/1/17 | 25,555 | 25,555 |
| California Municipal Finance Authority Revenue | | | | |
| (Anaheim Electric Utility Distribution System) | 5.000% | 10/1/24 | 1,500 | 1,852 |
54
California Intermediate-Term Tax-Exempt Fund
| | | | |
| | | | Face | Market |
| | | Maturity | Amount | Value• |
| | Coupon | Date | ($000) | ($000) |
| California Municipal Finance Authority Revenue | | | | |
| (Anaheim Electric Utility Distribution System) | 5.000% | 10/1/26 | 5,360 | 6,636 |
| 1 California Municipal Finance Authority Revenue | | | | |
| (Anaheim Electric Utility Distribution System) | | | | |
| PUT | 1.280% | 4/2/18 | 6,000 | 5,986 |
| California Municipal Finance Authority Revenue | | | | |
| (Anaheim Water System Project Revenue) | 4.000% | 10/1/31 | 3,955 | 4,304 |
| California Municipal Finance Authority Revenue | | | | |
| (Anaheim Water System Project Revenue) | 4.000% | 10/1/32 | 4,220 | 4,562 |
| California Municipal Finance Authority Revenue | | | | |
| (Anaheim Water System Project Revenue) | 4.000% | 10/1/33 | 4,390 | 4,726 |
| California Municipal Finance Authority Revenue | | | | |
| (Azusa Pacific University) | 5.000% | 4/1/19 | 1,450 | 1,534 |
| California Municipal Finance Authority Revenue | | | | |
| (Azusa Pacific University) | 5.000% | 4/1/20 | 1,760 | 1,907 |
| California Municipal Finance Authority Revenue | | | | |
| (Azusa Pacific University) | 5.000% | 4/1/21 | 1,300 | 1,436 |
| California Municipal Finance Authority Revenue | | | | |
| (Azusa Pacific University) | 5.000% | 4/1/22 | 1,000 | 1,122 |
| California Municipal Finance Authority Revenue | | | | |
| (Azusa Pacific University) | 5.000% | 4/1/23 | 1,285 | 1,458 |
| California Municipal Finance Authority Revenue | | | | |
| (Azusa Pacific University) | 5.000% | 4/1/24 | 1,325 | 1,517 |
| California Municipal Finance Authority Revenue | | | | |
| (Azusa Pacific University) | 5.000% | 4/1/25 | 1,180 | 1,352 |
| California Municipal Finance Authority Revenue | | | | |
| (Azusa Pacific University) | 5.000% | 4/1/35 | 2,490 | 2,701 |
| California Municipal Finance Authority Revenue | | | | |
| (Biola University) | 4.000% | 10/1/19 | 205 | 218 |
| California Municipal Finance Authority Revenue | | | | |
| (Biola University) | 5.000% | 10/1/21 | 375 | 429 |
| California Municipal Finance Authority Revenue | | | | |
| (Biola University) | 5.000% | 10/1/22 | 130 | 152 |
| California Municipal Finance Authority Revenue | | | | |
| (Biola University) | 5.000% | 10/1/24 | 375 | 449 |
| California Municipal Finance Authority Revenue | | | | |
| (Biola University) | 5.000% | 10/1/25 | 305 | 368 |
| California Municipal Finance Authority Revenue | | | | |
| (Biola University) | 5.000% | 10/1/30 | 585 | 694 |
| California Municipal Finance Authority Revenue | | | | |
| (Biola University) | 5.000% | 10/1/31 | 550 | 649 |
| California Municipal Finance Authority Revenue | | | | |
| (Biola University) | 5.000% | 10/1/32 | 500 | 586 |
| California Municipal Finance Authority Revenue | | | | |
| (Biola University) | 5.000% | 10/1/34 | 570 | 661 |
| California Municipal Finance Authority Revenue | | �� | | |
| (Biola University) | 5.000% | 10/1/35 | 600 | 694 |
| California Municipal Finance Authority Revenue | | | | |
| (Biola University) | 5.000% | 10/1/36 | 625 | 720 |
| California Municipal Finance Authority Revenue | | | | |
| (Community Hospitals of Central California | | | | |
| Obligated Group) | 5.000% | 2/1/18 | 500 | 513 |
55
California Intermediate-Term Tax-Exempt Fund
| | | | |
| | | | Face | Market |
| | | Maturity | Amount | Value• |
| | Coupon | Date | ($000) | ($000) |
| California Municipal Finance Authority Revenue | | | | |
| (Community Hospitals of Central California | | | | |
| Obligated Group) | 5.000% | 2/1/19 | 500 | 531 |
| California Municipal Finance Authority Revenue | | | | |
| (Community Hospitals of Central California | | | | |
| Obligated Group) | 5.000% | 2/1/20 | 625 | 684 |
| California Municipal Finance Authority Revenue | | | | |
| (Community Hospitals of Central California | | | | |
| Obligated Group) | 5.000% | 2/1/20 | 2,005 | 2,193 |
| California Municipal Finance Authority Revenue | | | | |
| (Community Hospitals of Central California | | | | |
| Obligated Group) | 5.000% | 2/1/21 | 1,000 | 1,122 |
| California Municipal Finance Authority Revenue | | | | |
| (Community Hospitals of Central California | | | | |
| Obligated Group) | 5.000% | 2/1/21 | 1,000 | 1,122 |
| California Municipal Finance Authority Revenue | | | | |
| (Community Hospitals of Central California | | | | |
| Obligated Group) | 5.000% | 2/1/22 | 500 | 573 |
| California Municipal Finance Authority Revenue | | | | |
| (Community Hospitals of Central California | | | | |
| Obligated Group) | 5.000% | 2/1/22 | 1,000 | 1,146 |
| California Municipal Finance Authority Revenue | | | | |
| (Community Hospitals of Central California | | | | |
| Obligated Group) | 5.000% | 2/1/23 | 835 | 974 |
| California Municipal Finance Authority Revenue | | | | |
| (Community Hospitals of Central California | | | | |
| Obligated Group) | 5.000% | 2/1/23 | 1,000 | 1,166 |
| California Municipal Finance Authority Revenue | | | | |
| (Community Hospitals of Central California | | | | |
| Obligated Group) | 5.000% | 2/1/24 | 2,390 | 2,824 |
| California Municipal Finance Authority Revenue | | | | |
| (Community Hospitals of Central California | | | | |
| Obligated Group) | 5.000% | 2/1/24 | 500 | 591 |
| California Municipal Finance Authority Revenue | | | | |
| (Community Hospitals of Central California | | | | |
| Obligated Group) | 5.000% | 2/1/25 | 1,700 | 2,029 |
| California Municipal Finance Authority Revenue | | | | |
| (Community Hospitals of Central California | | | | |
| Obligated Group) | 5.000% | 2/1/25 | 650 | 776 |
| California Municipal Finance Authority Revenue | | | | |
| (Community Hospitals of Central California | | | | |
| Obligated Group) | 5.000% | 2/1/26 | 2,000 | 2,401 |
| California Municipal Finance Authority Revenue | | | | |
| (Community Hospitals of Central California | | | | |
| Obligated Group) | 5.000% | 2/1/26 | 700 | 826 |
| California Municipal Finance Authority Revenue | | | | |
| (Community Hospitals of Central California | | | | |
| Obligated Group) | 5.000% | 2/1/27 | 1,500 | 1,814 |
| California Municipal Finance Authority Revenue | | | | |
| (Community Hospitals of Central California | | | | |
| Obligated Group) | 5.000% | 2/1/27 | 600 | 700 |
| California Municipal Finance Authority Revenue | | | | |
| (Community Hospitals of Central California | | | | |
| Obligated Group) | 5.000% | 2/1/28 | 750 | 867 |
56
California Intermediate-Term Tax-Exempt Fund
| | | | |
| | | | Face | Market |
| | | Maturity | Amount | Value• |
| | Coupon | Date | ($000) | ($000) |
| California Municipal Finance Authority Revenue | | | | |
| (Community Hospitals of Central California | | | | |
| Obligated Group) | 5.000% | 2/1/29 | 1,895 | 2,171 |
| California Municipal Finance Authority Revenue | | | | |
| (Community Hospitals of Central California | | | | |
| Obligated Group) | 5.000% | 2/1/31 | 3,470 | 3,927 |
| California Municipal Finance Authority Revenue | | | | |
| (Community Hospitals of Central California | | | | |
| Obligated Group) | 5.000% | 2/1/32 | 2,100 | 2,427 |
| California Municipal Finance Authority Revenue | | | | |
| (Community Hospitals of Central California | | | | |
| Obligated Group) | 5.000% | 2/1/32 | 3,655 | 4,120 |
| California Municipal Finance Authority Revenue | | | | |
| (Community Hospitals of Central California | | | | |
| Obligated Group) | 5.000% | 2/1/33 | 3,225 | 3,710 |
| California Municipal Finance Authority Revenue | | | | |
| (Community Hospitals of Central California | | | | |
| Obligated Group) | 5.000% | 2/1/33 | 3,835 | 4,306 |
| California Municipal Finance Authority Revenue | | | | |
| (Community Hospitals of Central California | | | | |
| Obligated Group) | 5.000% | 2/1/34 | 4,250 | 4,874 |
| California Municipal Finance Authority Revenue | | | | |
| (Community Hospitals of Central California | | | | |
| Obligated Group) | 5.000% | 2/1/34 | 4,035 | 4,519 |
| California Municipal Finance Authority Revenue | | | | |
| (Community Hospitals of Central California | | | | |
| Obligated Group) | 5.000% | 2/1/35 | 4,575 | 5,230 |
| California Municipal Finance Authority Revenue | | | | |
| (Community Hospitals of Central California | | | | |
| Obligated Group) | 5.000% | 2/1/35 | 4,000 | 4,469 |
| California Municipal Finance Authority Revenue | | | | |
| (Community Hospitals of Central California | | | | |
| Obligated Group) | 5.000% | 2/1/36 | 2,000 | 2,279 |
| California Municipal Finance Authority Revenue | | | | |
| (Community Hospitals of Central California | | | | |
| Obligated Group) | 5.000% | 2/1/37 | 1,500 | 1,704 |
| California Municipal Finance Authority Revenue | | | | |
| (Eisenhower Medical Center) | 5.000% | 7/1/20 | 1,375 | 1,524 |
| California Municipal Finance Authority Revenue | | | | |
| (Eisenhower Medical Center) | 5.125% | 7/1/23 | 2,150 | 2,363 |
| California Municipal Finance Authority Revenue | | | | |
| (Eisenhower Medical Center) | 5.000% | 7/1/24 | 1,000 | 1,196 |
| California Municipal Finance Authority Revenue | | | | |
| (Eisenhower Medical Center) | 5.000% | 7/1/25 | 1,000 | 1,199 |
| California Municipal Finance Authority Revenue | | | | |
| (Eisenhower Medical Center) | 5.000% | 7/1/30 | 1,000 | 1,168 |
| California Municipal Finance Authority Revenue | | | | |
| (Eisenhower Medical Center) | 5.000% | 7/1/31 | 1,000 | 1,161 |
| California Municipal Finance Authority Revenue | | | | |
| (Eisenhower Medical Center) | 5.000% | 7/1/33 | 1,500 | 1,725 |
| California Municipal Finance Authority Revenue | | | | |
| (Eisenhower Medical Center) | 5.000% | 7/1/35 | 2,000 | 2,287 |
| California Municipal Finance Authority Revenue | | | | |
| (Eisenhower Medical Center) | 5.000% | 7/1/36 | 1,800 | 2,052 |
57
California Intermediate-Term Tax-Exempt Fund
| | | | |
| | | | Face | Market |
| | | Maturity | Amount | Value• |
| | Coupon | Date | ($000) | ($000) |
| 4 California Municipal Finance Authority Revenue | | | | |
| (Eisenhower Medical Center) | 5.000% | 7/1/37 | 1,500 | 1,704 |
| California Municipal Finance Authority Revenue | | | | |
| (Institute on Aging Project) | 5.000% | 8/15/26 | 630 | 775 |
| California Municipal Finance Authority Revenue | | | | |
| (Institute on Aging Project) | 5.000% | 8/15/28 | 940 | 1,149 |
| California Municipal Finance Authority Revenue | | | | |
| (Institute on Aging Project) | 5.000% | 8/15/30 | 1,000 | 1,199 |
| California Municipal Finance Authority Revenue | | | | |
| (Institute on Aging Project) | 5.000% | 8/15/31 | 875 | 1,041 |
| California Municipal Finance Authority Revenue | | | | |
| (Institute on Aging Project) | 5.000% | 8/15/35 | 750 | 876 |
| California Municipal Finance Authority Revenue | | | | |
| (NorthBay Healthcare Group) | 4.000% | 11/1/22 | 1,000 | 1,090 |
| California Municipal Finance Authority Revenue | | | | |
| (NorthBay Healthcare Group) | 4.000% | 11/1/23 | 2,000 | 2,191 |
| California Municipal Finance Authority Revenue | | | | |
| (NorthBay Healthcare Group) | 5.000% | 11/1/23 | 1,000 | 1,157 |
| California Municipal Finance Authority Revenue | | | | |
| (NorthBay Healthcare Group) | 5.000% | 11/1/24 | 1,000 | 1,166 |
| California Municipal Finance Authority Revenue | | | | |
| (NorthBay Healthcare Group) | 5.000% | 11/1/24 | 1,825 | 2,133 |
| California Municipal Finance Authority Revenue | | | | |
| (NorthBay Healthcare Group) | 5.000% | 11/1/25 | 1,000 | 1,174 |
| California Municipal Finance Authority Revenue | | | | |
| (NorthBay Healthcare Group) | 5.000% | 11/1/25 | 1,000 | 1,177 |
| California Municipal Finance Authority Revenue | | | | |
| (NorthBay Healthcare Group) | 5.000% | 11/1/26 | 1,000 | 1,182 |
| California Municipal Finance Authority Revenue | | | | |
| (NorthBay Healthcare Group) | 5.000% | 11/1/27 | 1,500 | 1,758 |
| California Municipal Finance Authority Revenue | | | | |
| (NorthBay Healthcare Group) | 5.000% | 11/1/28 | 1,500 | 1,746 |
| California Municipal Finance Authority Revenue | | | | |
| (NorthBay Healthcare Group) | 5.000% | 11/1/28 | 3,500 | 4,161 |
| California Municipal Finance Authority Revenue | | | | |
| (NorthBay Healthcare Group) | 5.250% | 11/1/29 | 1,250 | 1,477 |
| California Municipal Finance Authority Revenue | | | | |
| (NorthBay Healthcare Group) | 5.000% | 11/1/30 | 1,450 | 1,659 |
| California Municipal Finance Authority Revenue | | | | |
| (NorthBay Healthcare Group) | 5.250% | 11/1/31 | 1,250 | 1,461 |
| California Municipal Finance Authority Revenue | | | | |
| (NorthBay Healthcare Group) | 5.250% | 11/1/36 | 4,000 | 4,582 |
| California Municipal Finance Authority Revenue | | | | |
| (University of La Verne) | 4.000% | 6/1/18 | 250 | 258 |
| California Municipal Finance Authority Revenue | | | | |
| (University of La Verne) | 4.750% | 6/1/18 (ETM) | 2,325 | 2,417 |
| California Municipal Finance Authority Revenue | | | | |
| (University of La Verne) | 4.000% | 6/1/19 | 400 | 424 |
| California Municipal Finance Authority Revenue | | | | |
| (University of La Verne) | 5.000% | 6/1/19 (ETM) | 2,375 | 2,567 |
| California Municipal Finance Authority Revenue | | | | |
| (University of La Verne) | 5.000% | 6/1/20 | 300 | 334 |
| California Municipal Finance Authority Revenue | | | | |
| (University of La Verne) | 5.000% | 6/1/21 | 350 | 400 |
58
California Intermediate-Term Tax-Exempt Fund
| | | | |
| | | | Face | Market |
| | | Maturity | Amount | Value• |
| | Coupon | Date | ($000) | ($000) |
| California Municipal Finance Authority Revenue | | | | |
| (University of La Verne) | 5.000% | 6/1/22 | 250 | 292 |
| California Municipal Finance Authority Revenue | | | | |
| (University of La Verne) | 5.000% | 6/1/23 | 600 | 713 |
| California Municipal Finance Authority Revenue | | | | |
| (University of La Verne) | 5.000% | 6/1/24 | 350 | 422 |
| California Municipal Finance Authority Revenue | | | | |
| (University of La Verne) | 5.000% | 6/1/25 | 1,000 | 1,216 |
| California Municipal Finance Authority Water | | | | |
| Revenue (San Bernardino Municipal Water | | | | |
| Department) | 5.000% | 8/1/31 (15) | 1,455 | 1,721 |
| California Municipal Finance Authority Water | | | | |
| Revenue (San Bernardino Municipal Water | | | | |
| Department) | 5.000% | 8/1/36 (15) | 1,805 | 2,092 |
| California Pollution Control Financing Authority | | | | |
| Revenue (Pacific Gas & Electric Co.) VRDO | 0.610% | 6/1/17 LOC | 25,800 | 25,800 |
| California Public Finance Authority Revenue | | | | |
| (Henry Mayo Newhall Memorial Hospital) | 5.000% | 10/15/29 | 700 | 797 |
| California Public Finance Authority Revenue | | | | |
| (Henry Mayo Newhall Memorial Hospital) | 5.000% | 10/15/30 | 500 | 564 |
| California Public Finance Authority Revenue | | | | |
| (Henry Mayo Newhall Memorial Hospital) | 5.000% | 10/15/31 | 535 | 600 |
| California Public Finance Authority Revenue | | | | |
| (Henry Mayo Newhall Memorial Hospital) | 5.000% | 10/15/32 | 500 | 559 |
| California Public Finance Authority Revenue | | | | |
| (Henry Mayo Newhall Memorial Hospital) | 5.000% | 10/15/33 | 500 | 557 |
| California Public Works Board Lease Revenue | 5.000% | 3/1/19 | 7,155 | 7,670 |
| California Public Works Board Lease Revenue | 5.000% | 10/1/19 | 9,410 | 10,296 |
| California Public Works Board Lease Revenue | 5.000% | 3/1/20 | 7,955 | 8,819 |
| California Public Works Board Lease Revenue | 5.000% | 10/1/20 | 14,810 | 16,711 |
| California Public Works Board Lease Revenue | 5.000% | 3/1/21 | 1,800 | 2,055 |
| California Public Works Board Lease Revenue | 5.000% | 10/1/21 | 7,450 | 8,638 |
| California Public Works Board Lease Revenue | 5.000% | 3/1/22 | 1,600 | 1,872 |
| California Public Works Board Lease Revenue | 5.000% | 10/1/22 | 5,750 | 6,826 |
| California Public Works Board Lease Revenue | 5.000% | 10/1/28 | 13,610 | 16,838 |
| California Public Works Board Lease Revenue | 5.000% | 10/1/29 | 12,235 | 14,964 |
| California Public Works Board Lease Revenue | | | | |
| (Department of Corrections) | 5.000% | 6/1/18 | 11,625 | 12,112 |
| California Public Works Board Lease Revenue | | | | |
| (Department of Corrections) | 5.000% | 6/1/19 | 12,200 | 13,194 |
| California Public Works Board Lease Revenue | | | | |
| (Department of Corrections) | 5.000% | 10/1/19 | 5,380 | 5,887 |
| California Public Works Board Lease Revenue | | | | |
| (Department of Corrections) | 5.000% | 6/1/20 | 4,180 | 4,669 |
| California Public Works Board Lease Revenue | | | | |
| (Department of Corrections) | 5.000% | 9/1/20 | 13,000 | 14,632 |
| California Public Works Board Lease Revenue | | | | |
| (Department of Corrections) | 5.000% | 10/1/20 | 5,655 | 6,381 |
| California Public Works Board Lease Revenue | | | | |
| (Department of Corrections) | 5.000% | 6/1/21 | 7,375 | 8,476 |
| California Public Works Board Lease Revenue | | | | |
| (Department of Corrections) | 5.000% | 10/1/21 | 1,375 | 1,594 |
| California Public Works Board Lease Revenue | | | | |
| (Department of Corrections) | 5.000% | 10/1/21 | 5,945 | 6,893 |
59
California Intermediate-Term Tax-Exempt Fund
| | | | |
| | | | Face | Market |
| | | Maturity | Amount | Value• |
| | Coupon | Date | ($000) | ($000) |
| California Public Works Board Lease Revenue | | | | |
| (Department of Corrections) | 5.000% | 6/1/22 | 9,425 | 11,096 |
| California Public Works Board Lease Revenue | | | | |
| (Department of Corrections) | 5.000% | 10/1/22 | 1,500 | 1,781 |
| California Public Works Board Lease Revenue | | | | |
| (Department of Corrections) | 5.000% | 10/1/22 | 6,250 | 7,420 |
| California Public Works Board Lease Revenue | | | | |
| (Department of Corrections) | 5.000% | 10/1/23 | 2,350 | 2,842 |
| California Public Works Board Lease Revenue | | | | |
| (Department of Corrections) | 5.000% | 10/1/23 | 5,270 | 6,373 |
| California Public Works Board Lease Revenue | | | | |
| (Department of Corrections) | 5.000% | 9/1/24 | 4,250 | 5,207 |
| California Public Works Board Lease Revenue | | | | |
| (Department of Corrections) | 5.000% | 10/1/24 | 1,925 | 2,362 |
| California Public Works Board Lease Revenue | | | | |
| (Department of Corrections) | 5.000% | 6/1/25 | 2,935 | 3,619 |
| California Public Works Board Lease Revenue | | | | |
| (Department of Corrections) | 5.000% | 9/1/31 | 5,000 | 5,860 |
| California Public Works Board Lease Revenue | | | | |
| (Department of Corrections) | 5.750% | 10/1/31 | 6,000 | 7,038 |
| California Public Works Board Lease Revenue | | | | |
| (Department of Corrections) | 5.000% | 9/1/32 | 5,000 | 5,838 |
| California Public Works Board Lease Revenue | | | | |
| (Department of Corrections) | 5.250% | 10/1/32 | 5,000 | 5,964 |
| California Public Works Board Lease Revenue | | | | |
| (Department of Corrections) | 5.000% | 9/1/33 | 5,000 | 5,813 |
| California Public Works Board Lease Revenue | | | | |
| (Department of Corrections) | 5.250% | 10/1/33 | 3,000 | 3,563 |
| California Public Works Board Lease Revenue | | | | |
| (Department of Corrections) | 4.500% | 9/1/35 | 25,000 | 27,392 |
| California Public Works Board Lease Revenue | | | | |
| (Department of General Services) | 6.000% | 4/1/19 (Prere.) | 5,000 | 5,464 |
| California Public Works Board Lease Revenue | | | | |
| (Department of State Hospitals) | 5.000% | 6/1/28 | 5,825 | 6,792 |
| California Public Works Board Lease Revenue | | | | |
| (Department of State Hospitals) | 5.000% | 6/1/29 | 8,975 | 10,408 |
| California Public Works Board Lease Revenue | | | | |
| (Judicial Council Projects) | 5.000% | 12/1/24 | 400 | 462 |
| California Public Works Board Lease Revenue | | | | |
| (Judicial Council Projects) | 5.000% | 3/1/25 | 1,500 | 1,760 |
| California Public Works Board Lease Revenue | | | | |
| (Judicial Council Projects) | 5.250% | 12/1/25 | 1,550 | 1,803 |
| California Public Works Board Lease Revenue | | | | |
| (Judicial Council Projects) | 5.000% | 3/1/26 | 1,500 | 1,758 |
| California Public Works Board Lease Revenue | | | | |
| (Judicial Council Projects) | 5.000% | 12/1/27 | 7,000 | 8,035 |
| California Public Works Board Lease Revenue | | | | |
| (Judicial Council Projects) | 5.000% | 3/1/28 | 2,860 | 3,319 |
| California Public Works Board Lease Revenue | | | | |
| (Judicial Council Projects) | 5.000% | 12/1/28 | 4,980 | 5,708 |
| California Public Works Board Lease Revenue | | | | |
| (Judicial Council Projects) | 5.000% | 3/1/29 | 2,500 | 2,886 |
| California Public Works Board Lease Revenue | | | | |
| (Judicial Council Projects) | 5.000% | 12/1/29 | 5,000 | 5,717 |
60
California Intermediate-Term Tax-Exempt Fund
| | | | |
| | | | Face | Market |
| | | Maturity | Amount | Value• |
| | Coupon | Date | ($000) | ($000) |
| California Public Works Board Lease Revenue | | | | |
| (Judicial Council Projects) | 5.000% | 3/1/32 | 3,200 | 3,655 |
| California Public Works Board Lease Revenue | | | | |
| (Judicial Council Projects) | 5.000% | 3/1/33 | 1,650 | 1,878 |
| California Public Works Board Lease Revenue | | | | |
| (Regents of The University of California) | 5.000% | 6/1/20 (ETM) | 7,670 | 8,577 |
| California Public Works Board Lease Revenue | | | | |
| (Regents of The University of California) | 5.000% | 10/1/20 (ETM) | 2,015 | 2,279 |
| California Public Works Board Lease Revenue | | | | |
| (Regents of The University of California) | 5.000% | 10/1/21 (ETM) | 1,650 | 1,920 |
| California Public Works Board Lease Revenue | | | | |
| (Various Capital Projects) | 5.000% | 11/1/18 | 4,000 | 4,235 |
| California Public Works Board Lease Revenue | | | | |
| (Various Capital Projects) | 5.000% | 12/1/18 | 1,080 | 1,147 |
| California Public Works Board Lease Revenue | | | | |
| (Various Capital Projects) | 5.250% | 11/1/19 (Prere.) | 5,000 | 5,517 |
| California Public Works Board Lease Revenue | | | | |
| (Various Capital Projects) | 5.000% | 1/1/20 | 10,000 | 11,028 |
| California Public Works Board Lease Revenue | | | | |
| (Various Capital Projects) | 5.375% | 3/1/20 (Prere.) | 9,065 | 10,150 |
| California Public Works Board Lease Revenue | | | | |
| (Various Capital Projects) | 5.000% | 4/1/20 | 4,160 | 4,624 |
| California Public Works Board Lease Revenue | | | | |
| (Various Capital Projects) | 5.000% | 5/1/20 | 5,850 | 6,519 |
| California Public Works Board Lease Revenue | | | | |
| (Various Capital Projects) | 5.000% | 12/1/20 | 1,600 | 1,814 |
| California Public Works Board Lease Revenue | | | | |
| (Various Capital Projects) | 5.000% | 12/1/21 (Prere.) | 5,000 | 5,833 |
| California Public Works Board Lease Revenue | | | | |
| (Various Capital Projects) | 5.000% | 12/1/21 (ETM) | 5,400 | 6,310 |
| California Public Works Board Lease Revenue | | | | |
| (Various Capital Projects) | 5.000% | 12/1/21 (Prere.) | 2,645 | 3,085 |
| California Public Works Board Lease Revenue | | | | |
| (Various Capital Projects) | 5.000% | 12/1/21 | 2,965 | 3,453 |
| California Public Works Board Lease Revenue | | | | |
| (Various Capital Projects) | 5.000% | 12/1/21 | 1,110 | 1,293 |
| California Public Works Board Lease Revenue | | | | |
| (Various Capital Projects) | 5.000% | 5/1/22 | 2,670 | 3,137 |
| California Public Works Board Lease Revenue | | | | |
| (Various Capital Projects) | 5.000% | 9/1/22 (Prere.) | 3,000 | 3,563 |
| California Public Works Board Lease Revenue | | | | |
| (Various Capital Projects) | 5.000% | 9/1/22 (Prere.) | 3,000 | 3,563 |
| California Public Works Board Lease Revenue | | | | |
| (Various Capital Projects) | 5.000% | 11/1/22 | 1,500 | 1,784 |
| California Public Works Board Lease Revenue | | | | |
| (Various Capital Projects) | 5.000% | 12/1/22 | 1,195 | 1,425 |
| California Public Works Board Lease Revenue | | | | |
| (Various Capital Projects) | 5.000% | 4/1/23 | 4,180 | 4,868 |
| California Public Works Board Lease Revenue | | | | |
| (Various Capital Projects) | 5.000% | 11/1/23 | 1,000 | 1,180 |
| California Public Works Board Lease Revenue | | | | |
| (Various Capital Projects) | 5.000% | 11/1/24 | 2,000 | 2,357 |
| California Public Works Board Lease Revenue | | | | |
| (Various Capital Projects) | 5.000% | 11/1/25 | 3,560 | 4,192 |
61
California Intermediate-Term Tax-Exempt Fund
| | | | |
| | | | Face | Market |
| | | Maturity | Amount | Value• |
| | Coupon | Date | ($000) | ($000) |
| California Public Works Board Lease Revenue | | | | |
| (Various Capital Projects) | 5.000% | 5/1/28 | 4,250 | 5,052 |
| California Public Works Board Lease Revenue | | | | |
| (Various Capital Projects) | 5.000% | 5/1/29 | 1,140 | 1,343 |
| California Public Works Board Lease Revenue | | | | |
| (Various Capital Projects) | 4.000% | 4/1/30 | 14,980 | 16,428 |
| California Public Works Board Lease Revenue | | | | |
| (Various Capital Projects) | 5.000% | 5/1/30 | 1,250 | 1,464 |
| California Public Works Board Lease Revenue | | | | |
| (Various Capital Projects) | 5.500% | 11/1/30 | 5,545 | 6,738 |
| California Public Works Board Lease Revenue | | | | |
| (Various Capital Projects) | 5.000% | 11/1/31 | 1,650 | 1,914 |
| California Public Works Board Lease Revenue | | | | |
| (Various Capital Projects) | 5.500% | 11/1/31 | 7,000 | 8,487 |
| California Public Works Board Lease Revenue | | | | |
| (Various Capital Projects) | 4.000% | 4/1/32 | 14,895 | 16,061 |
| California Public Works Board Lease Revenue | | | | |
| (Various Capital Projects) | 5.000% | 11/1/32 | 11,465 | 13,254 |
| California Public Works Board Lease Revenue | | | | |
| (Various Capital Projects) | 5.500% | 11/1/33 | 4,670 | 5,628 |
| California State University Systemwide Revenue | 5.000% | 5/1/18 (Prere.) | 8,250 | 8,570 |
| California State University Systemwide Revenue | 5.000% | 5/1/18 (Prere.) | 11,225 | 11,660 |
| California State University Systemwide Revenue | 5.000% | 5/1/18 (Prere.) | 4,840 | 5,028 |
| California State University Systemwide Revenue | 5.000% | 5/1/18 (Prere.) | 7,410 | 7,697 |
| California State University Systemwide Revenue | 5.250% | 5/1/19 (Prere.) | 3,515 | 3,806 |
| California State University Systemwide Revenue | 5.000% | 11/1/19 | 2,300 | 2,527 |
| California State University Systemwide Revenue | 5.000% | 11/1/20 | 1,670 | 1,893 |
| California State University Systemwide Revenue | 5.000% | 11/1/22 | 1,500 | 1,791 |
| California State University Systemwide Revenue | 5.000% | 11/1/23 | 3,960 | 4,594 |
| California State University Systemwide Revenue | 5.000% | 11/1/24 | 2,915 | 3,382 |
| California State University Systemwide Revenue | 5.000% | 11/1/24 | 4,505 | 5,570 |
| California State University Systemwide Revenue | 5.000% | 11/1/24 | 440 | 456 |
| California State University Systemwide Revenue | 5.000% | 11/1/25 | 1,010 | 1,265 |
| California State University Systemwide Revenue | 5.000% | 11/1/25 | 595 | 617 |
| California State University Systemwide Revenue | 5.000% | 11/1/26 | 2,000 | 2,496 |
| California State University Systemwide Revenue | 5.000% | 11/1/26 | 405 | 420 |
| California State University Systemwide Revenue | 5.000% | 11/1/27 | 5,740 | 6,593 |
| California State University Systemwide Revenue | 5.000% | 11/1/27 | 2,000 | 2,458 |
| California State University Systemwide Revenue | 5.000% | 11/1/27 | 160 | 166 |
| California State University Systemwide Revenue | 5.000% | 11/1/28 | 5,000 | 6,007 |
| California State University Systemwide Revenue | 5.000% | 11/1/28 | 2,610 | 3,191 |
| California State University Systemwide Revenue | 4.000% | 11/1/29 | 3,900 | 4,280 |
| California State University Systemwide Revenue | 5.000% | 11/1/30 | 2,920 | 3,528 |
| California State University Systemwide Revenue | 5.000% | 11/1/30 | 2,000 | 2,421 |
| California State University Systemwide Revenue | 5.000% | 11/1/30 (4) | 250 | 259 |
| California State University Systemwide Revenue | 5.000% | 11/1/31 | 8,900 | 10,523 |
| California State University Systemwide Revenue | 5.000% | 11/1/31 | 10,080 | 12,109 |
| California State University Systemwide Revenue | 5.000% | 11/1/31 | 4,000 | 4,820 |
| California State University Systemwide Revenue | 5.000% | 11/1/32 | 6,000 | 7,304 |
| California State University Systemwide Revenue | 5.000% | 11/1/32 | 12,895 | 15,414 |
| California State University Systemwide Revenue | 5.000% | 11/1/32 | 5,000 | 6,002 |
| California State University Systemwide Revenue | 5.000% | 11/1/33 | 6,335 | 7,669 |
| California State University Systemwide Revenue | 5.000% | 11/1/33 | 5,775 | 6,869 |
| California State University Systemwide Revenue | 5.000% | 11/1/33 | 10,000 | 11,960 |
62
California Intermediate-Term Tax-Exempt Fund
| | | | |
| | | | Face | Market |
| | | Maturity | Amount | Value• |
| | Coupon | Date | ($000) | ($000) |
| California State University Systemwide Revenue | 4.000% | 11/1/34 | 9,875 | 10,642 |
| California State University Systemwide Revenue | 5.000% | 11/1/34 | 5,000 | 6,024 |
| California State University Systemwide Revenue | 5.000% | 11/1/34 | 5,000 | 5,838 |
| California State University Systemwide Revenue | 4.000% | 11/1/35 | 8,875 | 9,522 |
| California State University Systemwide Revenue | 5.000% | 11/1/35 | 8,000 | 9,599 |
| California State University Systemwide Revenue | 5.000% | 11/1/35 | 5,975 | 6,954 |
| California State University Systemwide Revenue | 5.000% | 11/1/35 | 13,205 | 15,587 |
| California State University Systemwide Revenue | 5.000% | 11/1/36 | 3,000 | 3,533 |
| California State University Systemwide Revenue | 5.000% | 11/1/37 | 3,640 | 4,336 |
| California State University Systemwide Revenue | | | | |
| PUT | 4.000% | 11/1/21 | 23,465 | 25,927 |
| California State University Systemwide Revenue | | | | |
| PUT | 4.000% | 11/1/23 | 19,435 | 22,104 |
| California Statewide Communities Development | | | | |
| Authority Health Facility Revenue (Catholic | | | | |
| Healthcare West) | 5.500% | 7/1/17 (Prere.) | 6,320 | 6,345 |
| California Statewide Communities Development | | | | |
| Authority Pollution Control Revenue (Southern | | | | |
| California Edison Co.) PUT | 1.375% | 4/2/18 | 2,500 | 2,510 |
| California Statewide Communities Development | | | | |
| Authority Pollution Control Revenue (Southern | | | | |
| California Edison Co.) PUT | 2.625% | 12/1/23 | 10,500 | 10,866 |
| California Statewide Communities Development | | | | |
| Authority Revenue (899 Charleston Project) | 5.000% | 11/1/19 | 550 | 569 |
| California Statewide Communities Development | | | | |
| Authority Revenue (899 Charleston Project) | 5.000% | 11/1/24 | 1,000 | 1,067 |
| California Statewide Communities Development | | | | |
| Authority Revenue (899 Charleston Project) | 5.000% | 11/1/29 | 1,650 | 1,722 |
| California Statewide Communities Development | | | | |
| Authority Revenue (899 Charleston Project) | 5.000% | 11/1/34 | 3,700 | 3,779 |
| California Statewide Communities Development | | | | |
| Authority Revenue (Adventist Health | | | | |
| System/West) | 3.000% | 3/1/18 | 450 | 457 |
| California Statewide Communities Development | | | | |
| Authority Revenue (Adventist Health | | | | |
| System/West) | 4.000% | 3/1/19 | 500 | 525 |
| California Statewide Communities Development | | | | |
| Authority Revenue (Adventist Health | | | | |
| System/West) | 4.000% | 3/1/20 | 750 | 806 |
| California Statewide Communities Development | | | | |
| Authority Revenue (Adventist Health | | | | |
| System/West) | 5.000% | 3/1/22 | 1,500 | 1,740 |
| California Statewide Communities Development | | | | |
| Authority Revenue (Adventist Health | | | | |
| System/West) | 5.000% | 3/1/23 | 1,500 | 1,774 |
| California Statewide Communities Development | | | | |
| Authority Revenue (Adventist Health | | | | |
| System/West) | 5.000% | 3/1/24 | 1,000 | 1,203 |
| California Statewide Communities Development | | | | |
| Authority Revenue (Adventist Health | | | | |
| System/West) | 5.000% | 3/1/25 | 765 | 933 |
| California Statewide Communities Development | | | | |
| Authority Revenue (Adventist Health | | | | |
| System/West) | 5.000% | 3/1/26 | 1,500 | 1,845 |
63
California Intermediate-Term Tax-Exempt Fund
| | | | |
| | | | Face | Market |
| | | Maturity | Amount | Value• |
| | Coupon | Date | ($000) | ($000) |
| California Statewide Communities Development | | | | |
| Authority Revenue (Adventist Health | | | | |
| System/West) | 5.000% | 3/1/32 | 5,000 | 5,844 |
| California Statewide Communities Development | | | | |
| Authority Revenue (Beverly Community | | | | |
| Hospital Association) | 4.000% | 11/1/21 | 215 | 231 |
| California Statewide Communities Development | | | | |
| Authority Revenue (Beverly Community | | | | |
| Hospital Association) | 5.000% | 11/1/22 | 225 | 256 |
| California Statewide Communities Development | | | | |
| Authority Revenue (Beverly Community | | | | |
| Hospital Association) | 5.000% | 11/1/23 | 235 | 270 |
| California Statewide Communities Development | | | | |
| Authority Revenue (Beverly Community | | | | |
| Hospital Association) | 3.000% | 11/1/24 | 245 | 250 |
| California Statewide Communities Development | | | | |
| Authority Revenue (Beverly Community | | | | |
| Hospital Association) | 3.000% | 11/1/25 | 260 | 263 |
| California Statewide Communities Development | | | | |
| Authority Revenue (Beverly Community | | | | |
| Hospital Association) | 3.125% | 11/1/26 | 265 | 268 |
| California Statewide Communities Development | | | | |
| Authority Revenue (Beverly Community | | | | |
| Hospital Association) | 5.000% | 11/1/27 | 270 | 316 |
| California Statewide Communities Development | | | | |
| Authority Revenue (Buck Institute for Age | | | | |
| Research) | 5.000% | 11/15/18 | 275 | 291 |
| California Statewide Communities Development | | | | |
| Authority Revenue (Buck Institute for Age | | | | |
| Research) | 5.000% | 11/15/19 (4) | 250 | 274 |
| California Statewide Communities Development | | | | |
| Authority Revenue (Buck Institute for Age | | | | |
| Research) | 5.000% | 11/15/20 (4) | 210 | 237 |
| California Statewide Communities Development | | | | |
| Authority Revenue (Buck Institute for Age | | | | |
| Research) | 5.000% | 11/15/21 (4) | 200 | 232 |
| California Statewide Communities Development | | | | |
| Authority Revenue (Buck Institute for Age | | | | |
| Research) | 5.000% | 11/15/22 (4) | 200 | 236 |
| California Statewide Communities Development | | | | |
| Authority Revenue (Buck Institute for Age | | | | |
| Research) | 5.000% | 11/15/23 (4) | 400 | 481 |
| California Statewide Communities Development | | | | |
| Authority Revenue (Buck Institute for Age | | | | |
| Research) | 5.000% | 11/15/24 (4) | 500 | 609 |
| California Statewide Communities Development | | | | |
| Authority Revenue (Buck Institute for Age | | | | |
| Research) | 5.000% | 11/15/27 (4) | 1,660 | 1,978 |
| California Statewide Communities Development | | | | |
| Authority Revenue (Buck Institute for Age | | | | |
| Research) | 5.000% | 11/15/28 (4) | 900 | 1,065 |
| California Statewide Communities Development | | | | |
| Authority Revenue (Buck Institute for Age | | | | |
| Research) | 5.000% | 11/15/34 (4) | 2,500 | 2,877 |
64
California Intermediate-Term Tax-Exempt Fund
| | | | |
| | | | Face | Market |
| | | Maturity | Amount | Value• |
| | Coupon | Date | ($000) | ($000) |
| California Statewide Communities Development | | | | |
| Authority Revenue (Cottage Health System | | | | |
| Obligated Group) | 3.000% | 11/1/17 | 750 | 757 |
| California Statewide Communities Development | | | | |
| Authority Revenue (Cottage Health System | | | | |
| Obligated Group) | 4.000% | 11/1/18 | 245 | 255 |
| California Statewide Communities Development | | | | |
| Authority Revenue (Cottage Health System | | | | |
| Obligated Group) | 4.000% | 11/1/19 | 375 | 400 |
| California Statewide Communities Development | | | | |
| Authority Revenue (Cottage Health System | | | | |
| Obligated Group) | 5.000% | 11/1/20 | 100 | 112 |
| California Statewide Communities Development | | | | |
| Authority Revenue (Cottage Health System | | | | |
| Obligated Group) | 4.000% | 11/1/21 | 345 | 383 |
| California Statewide Communities Development | | | | |
| Authority Revenue (Cottage Health System | | | | |
| Obligated Group) | 5.000% | 11/1/22 | 375 | 444 |
| California Statewide Communities Development | | | | |
| Authority Revenue (Cottage Health System | | | | |
| Obligated Group) | 5.000% | 11/1/23 | 275 | 332 |
| California Statewide Communities Development | | | | |
| Authority Revenue (Cottage Health System | | | | |
| Obligated Group) | 5.000% | 11/1/24 | 300 | 366 |
| California Statewide Communities Development | | | | |
| Authority Revenue (Cottage Health System | | | | |
| Obligated Group) | 5.000% | 11/1/25 | 355 | 429 |
| California Statewide Communities Development | | | | |
| Authority Revenue (Cottage Health System | | | | |
| Obligated Group) | 5.000% | 11/1/26 | 325 | 389 |
| California Statewide Communities Development | | | | |
| Authority Revenue (Cottage Health System | | | | |
| Obligated Group) | 5.000% | 11/1/27 | 750 | 891 |
| California Statewide Communities Development | | | | |
| Authority Revenue (Cottage Health System | | | | |
| Obligated Group) | 5.000% | 11/1/28 | 1,310 | 1,547 |
| California Statewide Communities Development | | | | |
| Authority Revenue (Cottage Health System | | | | |
| Obligated Group) | 5.000% | 11/1/29 | 700 | 821 |
| California Statewide Communities Development | | | | |
| Authority Revenue (Cottage Health System | | | | |
| Obligated Group) | 5.000% | 11/1/30 | 1,010 | 1,174 |
| California Statewide Communities Development | | | | |
| Authority Revenue (Cottage Health System | | | | |
| Obligated Group) | 5.250% | 11/1/30 | 11,500 | 12,669 |
| California Statewide Communities Development | | | | |
| Authority Revenue (Cottage Health System | | | | |
| Obligated Group) | 5.000% | 11/1/31 | 1,000 | 1,157 |
| California Statewide Communities Development | | | | |
| Authority Revenue (Cottage Health System | | | | |
| Obligated Group) | 5.000% | 11/1/32 | 1,690 | 1,948 |
| California Statewide Communities Development | | | | |
| Authority Revenue (Daughters of Charity | | | | |
| Health System - St. Francis Medical Center) | 5.500% | 7/1/22 | 3,600 | 3,547 |
65
California Intermediate-Term Tax-Exempt Fund
| | | | |
| | | | Face | Market |
| | | Maturity | Amount | Value• |
| | Coupon | Date | ($000) | ($000) |
| California Statewide Communities Development | | | | |
| Authority Revenue (Daughters of Charity Health | | | | |
| System - St. Francis Medical Center) | 5.750% | 7/1/25 | 1,405 | 1,388 |
| California Statewide Communities Development | | | | |
| Authority Revenue (Daughters of Charity Health | | | | |
| System) | 5.750% | 7/1/24 | 10,040 | 9,959 |
| California Statewide Communities Development | | | | |
| Authority Revenue (Enloe Medical Center) | 5.000% | 8/15/30 | 2,500 | 2,977 |
| California Statewide Communities Development | | | | |
| Authority Revenue (Enloe Medical Center) | 5.000% | 8/15/31 | 4,020 | 4,764 |
| California Statewide Communities Development | | | | |
| Authority Revenue (Enloe Medical Center) | 5.000% | 8/15/33 | 4,000 | 4,689 |
| California Statewide Communities Development | | | | |
| Authority Revenue (Enloe Medical Center) | 5.000% | 8/15/34 | 4,795 | 5,601 |
| California Statewide Communities Development | | | | |
| Authority Revenue (Enloe Medical Center) | 5.000% | 8/15/35 | 1,000 | 1,165 |
| California Statewide Communities Development | | | | |
| Authority Revenue (Episcopal Communities & | | | | |
| Services) | 5.000% | 5/15/18 | 610 | 632 |
| California Statewide Communities Development | | | | |
| Authority Revenue (Episcopal Communities & | | | | |
| Services) | 5.000% | 5/15/27 | 500 | 561 |
| California Statewide Communities Development | | | | |
| Authority Revenue (Episcopal Communities & | | | | |
| Services) | 5.000% | 5/15/32 | 680 | 747 |
| California Statewide Communities Development | | | | |
| Authority Revenue (Eskaton Properties Inc. | | | | |
| Obligated Group) | 5.250% | 11/15/34 | 4,350 | 4,763 |
| California Statewide Communities Development | | | | |
| Authority Revenue (Huntington Memorial | | | | |
| Hospital) | 5.000% | 7/1/18 | 500 | 521 |
| California Statewide Communities Development | | | | |
| Authority Revenue (Huntington Memorial | | | | |
| Hospital) | 5.000% | 7/1/18 | 1,035 | 1,053 |
| California Statewide Communities Development | | | | |
| Authority Revenue (Huntington Memorial | | | | |
| Hospital) | 5.000% | 7/1/19 | 500 | 538 |
| California Statewide Communities Development | | | | |
| Authority Revenue (Huntington Memorial | | | | |
| Hospital) | 5.000% | 7/1/20 | 325 | 361 |
| California Statewide Communities Development | | | | |
| Authority Revenue (Huntington Memorial | | | | |
| Hospital) | 5.000% | 7/1/21 | 275 | 313 |
| California Statewide Communities Development | | | | |
| Authority Revenue (Huntington Memorial | | | | |
| Hospital) | 5.000% | 7/1/22 | 250 | 291 |
| California Statewide Communities Development | | | | |
| Authority Revenue (Huntington Memorial | | | | |
| Hospital) | 5.000% | 7/1/23 | 650 | 768 |
| California Statewide Communities Development | | | | |
| Authority Revenue (Huntington Memorial | | | | |
| Hospital) | 5.000% | 7/1/24 | 750 | 899 |
66
California Intermediate-Term Tax-Exempt Fund
| | | | |
| | | | Face | Market |
| | | Maturity | Amount | Value• |
| | Coupon | Date | ($000) | ($000) |
| California Statewide Communities Development | | | | |
| Authority Revenue (Huntington Memorial | | | | |
| Hospital) | 5.000% | 7/1/25 | 800 | 947 |
| California Statewide Communities Development | | | | |
| Authority Revenue (Huntington Memorial | | | | |
| Hospital) | 5.000% | 7/1/26 | 1,000 | 1,173 |
| California Statewide Communities Development | | | | |
| Authority Revenue (Huntington Memorial | | | | |
| Hospital) | 5.000% | 7/1/27 | 2,000 | 2,328 |
| California Statewide Communities Development | | | | |
| Authority Revenue (Huntington Memorial | | | | |
| Hospital) | 5.000% | 7/1/28 | 3,000 | 3,463 |
| California Statewide Communities Development | | | | |
| Authority Revenue (Huntington Memorial | | | | |
| Hospital) | 5.000% | 7/1/29 | 3,000 | 3,433 |
| California Statewide Communities Development | | | | |
| Authority Revenue (Huntington Memorial | | | | |
| Hospital) | 5.000% | 7/1/30 | 4,565 | 5,181 |
| California Statewide Communities Development | | | | |
| Authority Revenue (Huntington Memorial | | | | |
| Hospital) | 5.000% | 7/1/31 | 4,000 | 4,510 |
| California Statewide Communities Development | | | | |
| Authority Revenue (Huntington Memorial | | | | |
| Hospital) | 5.000% | 7/1/32 | 3,790 | 4,250 |
| California Statewide Communities Development | | | | |
| Authority Revenue (Huntington Memorial | | | | |
| Hospital) | 5.000% | 7/1/33 | 2,500 | 2,786 |
| California Statewide Communities Development | | | | |
| Authority Revenue (Huntington Memorial | | | | |
| Hospital) | 5.000% | 7/1/34 | 2,000 | 2,224 |
| California Statewide Communities Development | | | | |
| Authority Revenue (Kaiser Permanente) | 5.000% | 4/1/19 | 3,190 | 3,423 |
| California Statewide Communities Development | | | | |
| Authority Revenue (Kaiser Permanente) VRDO | 0.720% | 6/7/17 | 900 | 900 |
| California Statewide Communities Development | | | | |
| Authority Revenue (Loma Linda University | | | | |
| Medical Center) | 5.250% | 12/1/29 | 11,215 | 12,437 |
| California Statewide Communities Development | | | | |
| Authority Revenue (Rady Children’s Hospital - | | | | |
| San Diego) | 3.000% | 8/15/17 | 1,250 | 1,256 |
| California Statewide Communities Development | | | | |
| Authority Revenue (Rady Children’s Hospital - | | | | |
| San Diego) | 5.000% | 8/15/20 | 1,400 | 1,573 |
| California Statewide Communities Development | | | | |
| Authority Revenue (Rady Children’s Hospital - | | | | |
| San Diego) | 5.000% | 8/15/21 | 1,000 | 1,155 |
| California Statewide Communities Development | | | | |
| Authority Revenue (Rady Children’s Hospital - | | | | |
| San Diego) | 5.000% | 8/15/22 | 750 | 887 |
| California Statewide Communities Development | | | | |
| Authority Revenue (Rady Children’s Hospital - | | | | |
| San Diego) | 5.000% | 8/15/23 | 500 | 602 |
67
California Intermediate-Term Tax-Exempt Fund
| | | | |
| | | | Face | Market |
| | | Maturity | Amount | Value• |
| | Coupon | Date | ($000) | ($000) |
| California Statewide Communities Development | | | | |
| Authority Revenue (Rady Children’s Hospital - | | | | |
| San Diego) | 5.000% | 8/15/24 | 760 | 930 |
| California Statewide Communities Development | | | | |
| Authority Revenue (Rady Children’s Hospital - | | | | |
| San Diego) | 5.000% | 8/15/25 | 1,000 | 1,238 |
| California Statewide Communities Development | | | | |
| Authority Revenue (Rady Children’s Hospital - | | | | |
| San Diego) | 5.000% | 8/15/26 | 1,000 | 1,248 |
| California Statewide Communities Development | | | | |
| Authority Revenue (Rady Children’s Hospital - | | | | |
| San Diego) | 5.000% | 8/15/27 | 1,000 | 1,258 |
| California Statewide Communities Development | | | | |
| Authority Revenue (Rady Children’s Hospital - | | | | |
| San Diego) | 5.000% | 8/15/28 | 750 | 952 |
| California Statewide Communities Development | | | | |
| Authority Revenue (St. Joseph Health System) | 4.500% | 7/1/18 (ETM) | 2,040 | 2,080 |
| California Statewide Communities Development | | | | |
| Authority Revenue (Sutter Health) | 5.000% | 8/15/19 | 530 | 577 |
| California Statewide Communities Development | | | | |
| Authority Revenue (Sutter Health) | 5.000% | 8/15/20 | 500 | 562 |
| California Statewide Communities Development | | | | |
| Authority Revenue (Sutter Health) | 5.000% | 8/15/22 | 1,050 | 1,242 |
| California Statewide Communities Development | | | | |
| Authority Revenue (Sutter Health) | 5.250% | 8/15/31 | 7,500 | 8,583 |
| California Statewide Communities Development | | | | |
| Authority Revenue (Sutter Health) | 5.000% | 8/15/32 | 11,820 | 13,458 |
| California Statewide Communities Development | | | | |
| Authority Senior Living Health Facility Revenue | | | | |
| (Los Angeles Jewish Home for the Aging) | 2.500% | 8/1/20 | 1,170 | 1,173 |
| California Statewide Communities Development | | | | |
| Authority Senior Living Health Facility Revenue | | | | |
| (Los Angeles Jewish Home for the Aging) | 3.000% | 8/1/21 | 2,600 | 2,604 |
| California Statewide Communities Development | | | | |
| Authority Senior Living Revenue (Southern | | | | |
| California Presbyterian Homes) | 7.000% | 11/15/29 | 2,000 | 2,229 |
| California Statewide Communities Development | | | | |
| Authority Student Housing Revenue (CHF-Irvine | | | | |
| LLC - UCI East Campus Apartments Phase II) | 5.000% | 5/15/18 | 765 | 791 |
| California Statewide Communities Development | | | | |
| Authority Student Housing Revenue (CHF-Irvine | | | | |
| LLC - UCI East Campus Apartments Phase II) | 5.000% | 5/15/18 | 1,000 | 1,034 |
| California Statewide Communities Development | | | | |
| Authority Student Housing Revenue (CHF-Irvine | | | | |
| LLC - UCI East Campus Apartments Phase II) | 5.500% | 5/15/18 (Prere.) | 5,000 | 5,226 |
| California Statewide Communities Development | | | | |
| Authority Student Housing Revenue (CHF-Irvine | | | | |
| LLC - UCI East Campus Apartments Phase II) | 5.000% | 5/15/19 | 500 | 534 |
| California Statewide Communities Development | | | | |
| Authority Student Housing Revenue (CHF-Irvine | | | | |
| LLC - UCI East Campus Apartments Phase II) | 5.000% | 5/15/20 | 500 | 548 |
| California Statewide Communities Development | | | | |
| Authority Student Housing Revenue (CHF-Irvine | | | | |
| LLC - UCI East Campus Apartments Phase II) | 5.000% | 5/15/21 | 825 | 926 |
68
California Intermediate-Term Tax-Exempt Fund
| | | | |
| | | | Face | Market |
| | | Maturity | Amount | Value• |
| | Coupon | Date | ($000) | ($000) |
| California Statewide Communities Development | | | | |
| Authority Student Housing Revenue (CHF-Irvine | | | | |
| LLC - UCI East Campus Apartments Phase II) | 5.000% | 5/15/22 | 2,515 | 2,877 |
| California Statewide Communities Development | | | | |
| Authority Student Housing Revenue (CHF-Irvine | | | | |
| LLC - UCI East Campus Apartments Phase II) | 5.000% | 5/15/23 | 1,250 | 1,456 |
| California Statewide Communities Development | | | | |
| Authority Student Housing Revenue (CHF-Irvine | | | | |
| LLC - UCI East Campus Apartments Phase II) | 5.000% | 5/15/24 | 1,250 | 1,477 |
| California Statewide Communities Development | | | | |
| Authority Student Housing Revenue (CHF-Irvine | | | | |
| LLC - UCI East Campus Apartments Phase II) | 5.000% | 5/15/25 | 1,000 | 1,195 |
| California Statewide Communities Development | | | | |
| Authority Student Housing Revenue (CHF-Irvine | | | | |
| LLC - UCI East Campus Apartments Phase II) | 5.000% | 5/15/26 | 3,410 | 4,101 |
| California Statewide Communities Development | | | | |
| Authority Student Housing Revenue (CHF-Irvine | | | | |
| LLC - UCI East Campus Apartments Phase II) | 5.000% | 5/15/27 | 2,000 | 2,384 |
| California Statewide Communities Development | | | | |
| Authority Student Housing Revenue (CHF-Irvine | | | | |
| LLC - UCI East Campus Apartments Phase II) | 5.000% | 5/15/28 | 5,000 | 5,906 |
| California Statewide Communities Development | | | | |
| Authority Student Housing Revenue (CHF-Irvine | | | | |
| LLC - UCI East Campus Apartments Phase II) | 5.000% | 5/15/29 | 2,000 | 2,342 |
| California Statewide Communities Development | | | | |
| Authority Student Housing Revenue (CHF-Irvine | | | | |
| LLC - UCI East Campus Apartments Phase II) | 5.125% | 5/15/31 | 7,000 | 7,780 |
| California Statewide Communities Development | | | | |
| Authority Student Housing Revenue (CHF-Irvine | | | | |
| LLC - UCI East Campus Apartments Phase II) | 5.000% | 5/15/32 | 2,475 | 2,846 |
| California Statewide Communities Development | | | | |
| Authority Student Housing Revenue (CHF-Irvine | | | | |
| LLC - UCI East Campus Apartments Phase II) | 5.000% | 5/15/33 | 3,375 | 3,862 |
| California Statewide Communities Development | | | | |
| Authority Student Housing Revenue (CHF-Irvine | | | | |
| LLC - UCI East Campus Apartments Phase II) | 5.000% | 5/15/34 | 1,750 | 1,994 |
| California Statewide Communities Development | | | | |
| Authority Student Housing Revenue (CHF-Irvine | | | | |
| LLC - UCI East Campus Apartments Phase II) | 5.000% | 5/15/35 | 2,000 | 2,265 |
| Capistrano CA Unified School District Special | | | | |
| Tax Revenue | 5.000% | 9/1/17 | 1,500 | 1,514 |
| Capistrano CA Unified School District Special | | | | |
| Tax Revenue | 5.000% | 9/1/18 (15) | 2,000 | 2,098 |
| Capistrano CA Unified School District Special | | | | |
| Tax Revenue | 5.000% | 9/1/19 (15) | 2,080 | 2,258 |
| Capistrano CA Unified School District Special | | | | |
| Tax Revenue | 5.000% | 9/1/21 (15) | 5,225 | 5,639 |
| Capistrano CA Unified School District Special | | | | |
| Tax Revenue | 4.000% | 9/1/22 (15) | 6,020 | 6,358 |
| Capistrano CA Unified School District Special | | | | |
| Tax Revenue | 4.000% | 9/1/24 (15) | 6,860 | 7,240 |
| Carson CA Redevelopment Agency Tax Allocation | | | | |
| Revenue (Carson Merged & Amended | | | | |
| Project Area) | 5.000% | 10/1/22 | 1,130 | 1,320 |
69
California Intermediate-Term Tax-Exempt Fund
| | | | |
| | | | Face | Market |
| | | Maturity | Amount | Value• |
| | Coupon | Date | ($000) | ($000) |
| Carson CA Redevelopment Agency Tax Allocation | | | | |
| Revenue (Carson Merged & Amended | | | | |
| Project Area) | 5.000% | 10/1/23 | 1,170 | 1,392 |
| Carson CA Redevelopment Agency Tax Allocation | | | | |
| Revenue (Redevelopment Project Area No. 1) | 5.000% | 10/1/19 (4) | 800 | 869 |
| Carson CA Redevelopment Agency Tax Allocation | | | | |
| Revenue (Redevelopment Project Area No. 1) | 5.000% | 10/1/20 (4) | 785 | 877 |
| Carson CA Redevelopment Agency Tax Allocation | | | | |
| Revenue (Redevelopment Project Area No. 1) | 5.000% | 10/1/21 (4) | 850 | 975 |
| Carson CA Redevelopment Agency Tax Allocation | | | | |
| Revenue (Redevelopment Project Area No. 1) | 5.000% | 10/1/22 (4) | 600 | 703 |
| Castro Valley CA Unified School District GO | 4.000% | 8/1/17 | 500 | 503 |
| Castro Valley CA Unified School District GO | 4.000% | 8/1/18 | 400 | 415 |
| Centinela Valley CA Union High School District GO | 4.000% | 8/1/30 (4) | 2,025 | 2,255 |
| Centinela Valley CA Union High School District GO | 4.000% | 8/1/31 (4) | 1,350 | 1,487 |
| Centinela Valley CA Union High School District GO | 4.000% | 8/1/32 (4) | 3,355 | 3,678 |
| Centinela Valley CA Union High School District GO | 4.000% | 8/1/33 (4) | 1,410 | 1,534 |
| Centinela Valley CA Union High School District GO | 4.000% | 8/1/34 (4) | 5,465 | 5,900 |
| 2 Central Basin Municipal Water District California | | | | |
| COP TOB VRDO | 0.880% | 6/7/17 (4) | 7,500 | 7,500 |
| Central CA Unified School District GO | 5.500% | 8/1/19 (Prere.) | 3,000 | 3,296 |
| Central Valley CA Financing Authority | | | | |
| Cogeneration Project Revenue (Carson | | | | |
| Ice-Gen Project) | 5.000% | 7/1/17 | 1,000 | 1,004 |
| Central Valley CA Financing Authority | | | | |
| Cogeneration Project Revenue (Carson | | | | |
| Ice-Gen Project) | 5.000% | 7/1/19 | 765 | 827 |
| Central Valley CA Financing Authority | | | | |
| Cogeneration Project Revenue (Carson | | | | |
| Ice-Gen Project) | 5.250% | 7/1/20 | 1,025 | 1,149 |
| Cerritos CA Community College District GO | 0.000% | 8/1/20 | 500 | 479 |
| Cerritos CA Community College District GO | 0.000% | 8/1/22 | 500 | 457 |
| Cerritos CA Community College District GO | 0.000% | 8/1/23 | 500 | 445 |
| Cerritos CA Community College District GO | 4.000% | 8/1/30 | 3,480 | 3,804 |
| Cerritos CA Community College District GO | 4.000% | 8/1/32 | 2,260 | 2,435 |
| Chabot-Las Positas CA Community College | | | | |
| District GO | 2.000% | 8/1/17 | 930 | 932 |
| Chabot-Las Positas CA Community College | | | | |
| District GO | 3.000% | 8/1/18 | 850 | 871 |
| Chabot-Las Positas CA Community College | | | | |
| District GO | 2.000% | 8/1/19 | 1,000 | 1,022 |
| Chabot-Las Positas CA Community College | | | | |
| District GO | 4.000% | 8/1/19 | 360 | 383 |
| Chabot-Las Positas CA Community College | | | | |
| District GO | 3.000% | 8/1/20 | 1,500 | 1,588 |
| Chabot-Las Positas CA Community College | | | | |
| District GO | 5.000% | 8/1/20 | 500 | 562 |
| Chabot-Las Positas CA Community College | | | | |
| District GO | 5.000% | 8/1/23 | 2,225 | 2,694 |
| Chabot-Las Positas CA Community College | | | | |
| District GO | 5.000% | 8/1/27 | 2,500 | 2,956 |
| Chabot-Las Positas CA Community College | | | | |
| District GO | 5.000% | 8/1/30 | 7,500 | 8,829 |
70
California Intermediate-Term Tax-Exempt Fund
| | | | |
| | | | Face | Market |
| | | Maturity | Amount | Value• |
| | Coupon | Date | ($000) | ($000) |
| Chabot-Las Positas CA Community College | | | | |
| District GO | 5.000% | 8/1/31 | 7,500 | 8,777 |
| Chabot-Las Positas CA Community College | | | | |
| District GO | 5.000% | 8/1/32 | 13,000 | 15,170 |
| Chaffey CA Community College District GO | 5.000% | 6/1/32 | 5,000 | 5,882 |
| Chaffey CA Union High School District GO | 0.000% | 8/1/20 | 400 | 383 |
| Chaffey CA Union High School District GO | 0.000% | 8/1/21 | 500 | 469 |
| Chaffey CA Union High School District GO | 0.000% | 8/1/22 | 500 | 459 |
| Chaffey CA Union High School District GO | 0.000% | 8/1/23 | 600 | 535 |
| Chaffey CA Union High School District GO | 0.000% | 8/1/24 | 500 | 433 |
| Chaffey CA Union High School District GO | 0.000% | 8/1/25 | 655 | 534 |
| Chaffey CA Union High School District GO | 0.000% | 8/1/26 | 1,430 | 1,106 |
| Chaffey CA Union High School District GO | 0.000% | 8/1/28 | 2,000 | 1,398 |
| Chico CA Unified School District GO | 3.000% | 8/1/18 | 3,145 | 3,223 |
| Chico CA Unified School District GO | 3.000% | 8/1/18 | 640 | 656 |
| Chico CA Unified School District GO | 3.000% | 8/1/19 | 1,500 | 1,566 |
| Chico CA Unified School District GO | 4.000% | 8/1/20 | 1,330 | 1,452 |
| Chico CA Unified School District GO | 4.000% | 8/1/21 | 1,200 | 1,336 |
| Chico CA Unified School District GO | 4.000% | 8/1/22 | 400 | 453 |
| Chico CA Unified School District GO | 4.000% | 8/1/23 | 450 | 516 |
| Chino Basin Regional Financing Authority | | | | |
| California Revenue (Inland Empire Utilities | | | | |
| Agency) VRDO | 0.750% | 6/7/17 LOC | 4,160 | 4,160 |
| Chino CA Public Financing Authority Special | | | | |
| Tax Revenue | 5.000% | 9/1/24 (4) | 675 | 813 |
| Chino CA Public Financing Authority Special | | | | |
| Tax Revenue | 5.000% | 9/1/25 (4) | 1,000 | 1,216 |
| Chino CA Redevelopment Agency Successor | | | | |
| Agency Tax Allocation Revenue | 5.000% | 9/1/20 (15) | 625 | 701 |
| Chino CA Redevelopment Agency Successor | | | | |
| Agency Tax Allocation Revenue | 5.000% | 9/1/27 (15) | 1,195 | 1,417 |
| Chino CA Redevelopment Agency Successor | | | | |
| Agency Tax Allocation Revenue | 5.000% | 9/1/30 (15) | 1,170 | 1,359 |
| Chula Vista CA Industrial Development Revenue | | | | |
| (San Diego Gas & Electric Co.) | 1.650% | 7/1/18 | 6,245 | 6,249 |
| Chula Vista CA Municipal Financing Authority | | | | |
| Special Tax Revenue | 4.000% | 9/1/17 | 700 | 705 |
| Chula Vista CA Municipal Financing Authority | | | | |
| Special Tax Revenue | 5.000% | 9/1/18 | 1,165 | 1,221 |
| Chula Vista CA Municipal Financing Authority | | | | |
| Special Tax Revenue | 5.000% | 9/1/19 | 2,265 | 2,454 |
| Chula Vista CA Municipal Financing Authority | | | | |
| Special Tax Revenue | 5.000% | 9/1/20 | 1,185 | 1,319 |
| Chula Vista CA Municipal Financing Authority | | | | |
| Special Tax Revenue | 5.000% | 9/1/21 | 2,500 | 2,853 |
| Chula Vista CA Municipal Financing Authority | | | | |
| Special Tax Revenue | 5.000% | 9/1/23 | 2,615 | 3,047 |
| Chula Vista CA Municipal Financing Authority | | | | |
| Special Tax Revenue | 5.250% | 9/1/24 | 3,225 | 3,778 |
| Chula Vista CA Municipal Financing Authority | | | | |
| Special Tax Revenue | 5.500% | 9/1/25 | 3,495 | 4,139 |
| Chula Vista CA Municipal Financing Authority | | | | |
| Special Tax Revenue | 5.500% | 9/1/26 | 3,685 | 4,344 |
71
California Intermediate-Term Tax-Exempt Fund
| | | | |
| | | | Face | Market |
| | | Maturity | Amount | Value• |
| | Coupon | Date | ($000) | ($000) |
| Chula Vista CA Municipal Financing Authority | | | | |
| Special Tax Revenue | 5.500% | 9/1/27 | 970 | 1,139 |
| Citrus CA Community College District GO | 0.000% | 8/1/33 | 1,000 | 847 |
| Citrus CA Community College District GO | 0.000% | 8/1/35 | 3,150 | 2,642 |
| Clovis CA Unified School District GO | 0.000% | 8/1/18 (14) | 3,645 | 3,596 |
| 2 Coachella Valley CA Unified School District TOB | | | | |
| VRDO | 0.980% | 6/7/17 | 7,500 | 7,500 |
| Coast CA Community College District GO | 0.000% | 8/1/33 | 8,000 | 4,308 |
| Coast CA Community College District GO | 5.000% | 8/1/33 | 3,000 | 3,568 |
| Colton CA Joint Unified School District GO | 5.000% | 8/1/23 (4) | 765 | 918 |
| Colton CA Joint Unified School District GO | 5.000% | 8/1/25 (4) | 1,000 | 1,199 |
| Colton CA Redevelopment Agency Successor | | | | |
| Agency Tax Allocation Revenue | 4.000% | 8/1/18 | 1,000 | 1,034 |
| Colton CA Redevelopment Agency Successor | | | | |
| Agency Tax Allocation Revenue | 5.000% | 8/1/19 | 1,040 | 1,124 |
| Colton CA Redevelopment Agency Successor | | | | |
| Agency Tax Allocation Revenue | 5.000% | 8/1/20 (15) | 1,230 | 1,368 |
| Colton CA Redevelopment Agency Successor | | | | |
| Agency Tax Allocation Revenue | 5.000% | 8/1/22 (15) | 1,215 | 1,418 |
| Conejo Valley CA Unified School District GO | 0.000% | 8/1/21 (4) | 2,000 | 1,872 |
| Conejo Valley CA Unified School District GO | 0.000% | 8/1/22 (4) | 2,750 | 2,508 |
| Conejo Valley CA Unified School District GO | 0.000% | 8/1/23 (4) | 2,500 | 2,220 |
| Conejo Valley CA Unified School District GO | 0.000% | 8/1/24 (4) | 3,000 | 2,570 |
| Conejo Valley CA Unified School District GO | 0.000% | 8/1/25 (4) | 3,380 | 2,744 |
| Conejo Valley CA Unified School District GO | 0.000% | 8/1/26 (4) | 3,500 | 2,678 |
| Conejo Valley CA Unified School District GO | 0.000% | 8/1/27 (4) | 3,000 | 2,170 |
| Conejo Valley CA Unified School District GO | 0.000% | 8/1/28 (4) | 2,290 | 1,561 |
| Contra Costa CA Community College District GO | 5.000% | 8/1/24 | 4,140 | 4,882 |
| Contra Costa CA Community College District GO | 5.000% | 8/1/32 | 3,000 | 3,501 |
| Contra Costa CA Community College District GO | 5.000% | 8/1/33 | 4,000 | 4,647 |
| Contra Costa CA Municipal Water District | | | | |
| Revenue | 3.000% | 10/1/19 | 10,000 | 10,431 |
| Contra Costa CA Transportation Authority Sales | | | | |
| Tax Revenue | 5.000% | 3/1/20 (Prere.) | 1,080 | 1,198 |
| 4 Contra Costa CA Transportation Authority Sales | | | | |
| Tax Revenue | 5.000% | 3/1/30 | 2,000 | 2,477 |
| 4 Contra Costa CA Transportation Authority Sales | | | | |
| Tax Revenue | 5.000% | 3/1/31 | 1,250 | 1,537 |
| 4 Contra Costa CA Transportation Authority Sales | | | | |
| Tax Revenue | 5.000% | 3/1/32 | 2,000 | 2,446 |
| Contra Costa CA Transportation Authority Sales | | | | |
| Tax Revenue | 5.000% | 3/1/32 | 1,600 | 1,866 |
| 4 Contra Costa CA Transportation Authority Sales | | | | |
| Tax Revenue | 5.000% | 3/1/33 | 6,060 | 7,369 |
| Contra Costa CA Transportation Authority Sales | | | | |
| Tax Revenue | 5.000% | 3/1/33 | 1,800 | 2,092 |
| 4 Contra Costa CA Transportation Authority Sales | | | | |
| Tax Revenue | 5.000% | 3/1/34 | 5,665 | 6,856 |
| Contra Costa County CA Public Financing | | | | |
| Authority Lease Revenue | 3.000% | 6/1/20 | 1,000 | 1,053 |
| Contra Costa County CA Public Financing | | | | |
| Authority Lease Revenue | 5.000% | 6/1/20 | 800 | 889 |
| Contra Costa County CA Public Financing | | | | |
| Authority Lease Revenue | 5.000% | 6/1/21 | 700 | 800 |
72
California Intermediate-Term Tax-Exempt Fund
| | | | |
| | | | Face | Market |
| | | Maturity | Amount | Value• |
| | Coupon | Date | ($000) | ($000) |
| Contra Costa County CA Public Financing | | | | |
| Authority Lease Revenue | 5.000% | 6/1/22 | 600 | 702 |
| Contra Costa County CA Public Financing | | | | |
| Authority Lease Revenue | 5.000% | 6/1/22 (14) | 10,105 | 10,105 |
| Contra Costa County CA Public Financing | | | | |
| Authority Lease Revenue | 5.000% | 6/1/23 | 1,130 | 1,350 |
| Contra Costa County CA Public Financing | | | | |
| Authority Lease Revenue | 5.000% | 6/1/23 | 2,335 | 2,789 |
| Corona-Norco CA School District Public | | | | |
| Financing Authority Special Tax Revenue | 5.000% | 9/1/21 | 500 | 572 |
| Corona-Norco CA School District Public | | | | |
| Financing Authority Special Tax Revenue | 5.000% | 9/1/23 | 500 | 593 |
| Corona-Norco CA Unified School District GO | 0.000% | 8/1/20 (12) | 1,825 | 1,746 |
| Corona-Norco CA Unified School District GO | 0.000% | 8/1/21 (12) | 2,010 | 1,886 |
| Corona-Norco CA Unified School District GO | 0.000% | 8/1/22 (12) | 1,700 | 1,555 |
| Corona-Norco CA Unified School District GO | 0.000% | 8/1/23 (12) | 1,000 | 890 |
| Corona-Norco CA Unified School District GO | 0.000% | 8/1/25 (12) | 1,325 | 1,104 |
| Corona-Norco CA Unified School District GO | 0.000% | 8/1/26 (12) | 1,530 | 1,219 |
| Corona-Norco CA Unified School District GO | 0.000% | 8/1/27 (12) | 1,500 | 1,148 |
| Corona-Norco CA Unified School District GO | 0.000% | 8/1/28 (12) | 1,290 | 935 |
| Corona-Norco CA Unified School District GO | 4.000% | 8/1/33 | 2,525 | 2,734 |
| Corona-Norco CA Unified School District GO | 4.000% | 8/1/33 | 2,000 | 2,166 |
| Corona-Norco CA Unified School District GO | 4.000% | 8/1/34 | 2,000 | 2,148 |
| Corona-Norco CA Unified School District GO | 4.000% | 8/1/34 | 3,000 | 3,221 |
| Corona-Norco CA Unified School District Special | | | | |
| Tax Revenue (Community Facilities District | | | | |
| No. 98-1) | 5.000% | 9/1/23 | 1,145 | 1,358 |
| Corona-Norco CA Unified School District Special | | | | |
| Tax Revenue (Community Facilities District | | | | |
| No. 98-1) | 5.000% | 9/1/24 | 1,325 | 1,560 |
| Corona-Norco CA Unified School District Special | | | | |
| Tax Revenue (Community Facilities District | | | | |
| No. 98-1) | 5.000% | 9/1/25 | 2,525 | 2,948 |
| Corona-Norco CA Unified School District Special | | | | |
| Tax Revenue (Community Facilities District | | | | |
| No. 98-1) | 5.000% | 9/1/27 | 1,000 | 1,150 |
| Corona-Norco CA Unified School District Special | | | | |
| Tax Revenue (Community Facilities District | | | | |
| No. 98-1) | 5.000% | 9/1/28 | 1,590 | 1,819 |
| Cupertino CA Union School District GO | 5.000% | 8/1/25 | 3,235 | 3,910 |
| Cupertino CA Union School District GO | 5.000% | 8/1/32 | 480 | 585 |
| Cupertino CA Union School District GO | 5.000% | 8/1/33 | 545 | 660 |
| Cupertino CA Union School District GO | 5.000% | 8/1/34 | 245 | 296 |
| Del Mar CA Race Track Authority Revenue | 4.000% | 10/1/21 | 1,380 | 1,457 |
| Del Mar CA Race Track Authority Revenue | 5.000% | 10/1/24 | 1,585 | 1,752 |
| Del Mar CA Race Track Authority Revenue | 5.000% | 10/1/26 | 1,745 | 1,901 |
| Del Mar CA Race Track Authority Revenue | 5.000% | 10/1/27 | 1,835 | 1,993 |
| Del Mar CA Race Track Authority Revenue | 5.000% | 10/1/29 | 1,010 | 1,093 |
| Del Mar CA Race Track Authority Revenue | 5.000% | 10/1/35 | 1,665 | 1,795 |
| Desert CA Community College District GO | 4.000% | 8/1/19 | 1,500 | 1,600 |
| Desert CA Community College District GO | 5.000% | 8/1/20 | 1,760 | 1,980 |
| East Bay CA Municipal Utility District Waste | | | | |
| Water System Revenue | 5.000% | 6/1/35 | 8,455 | 10,033 |
73
California Intermediate-Term Tax-Exempt Fund
| | | | |
| | | | Face | Market |
| | | Maturity | Amount | Value• |
| | Coupon | Date | ($000) | ($000) |
| East Bay CA Municipal Utility District Water | | | | |
| System Revenue | 5.000% | 6/1/25 | 6,265 | 7,865 |
| East Bay CA Municipal Utility District Water | | | | |
| System Revenue | 5.000% | 6/1/28 | 5,300 | 6,776 |
| East Bay CA Municipal Utility District Water | | | | |
| System Revenue | 5.000% | 6/1/30 | 2,005 | 2,229 |
| East Bay CA Municipal Utility District Water | | | | |
| System Revenue | 5.000% | 6/1/31 | 16,020 | 17,791 |
| East Bay CA Municipal Utility District Water | | | | |
| System Revenue | 5.000% | 6/1/31 | 3,975 | 4,787 |
| East Bay CA Municipal Utility District Water | | | | |
| System Revenue | 5.000% | 6/1/32 | 4,015 | 4,813 |
| East Bay CA Municipal Utility District Water | | | | |
| System Revenue | 5.000% | 6/1/33 | 4,280 | 5,103 |
| East Bay CA Municipal Utility District Water | | | | |
| System Revenue | 5.000% | 6/1/34 | 1,855 | 2,203 |
| East Bay CA Municipal Utility District Water | | | | |
| System Revenue | 5.000% | 6/1/35 | 3,050 | 3,609 |
| East Bay CA Regional Park District Revenue | 5.000% | 9/1/28 | 4,415 | 4,813 |
| East Side CA Union High School District Santa | | | | |
| Clara County GO | 5.000% | 8/1/29 | 6,000 | 7,072 |
| Eastern California Municipal Water District | | | | |
| Water & Sewer | 5.000% | 7/1/19 | 2,030 | 2,206 |
| Eastern California Municipal Water District | | | | |
| Water & Sewer | 5.000% | 7/1/20 | 2,500 | 2,812 |
| Eastern California Municipal Water District | | | | |
| Water & Sewer | 5.000% | 7/1/21 | 1,500 | 1,739 |
| Eastern California Municipal Water District | | | | |
| Water & Sewer | 5.000% | 7/1/22 | 1,000 | 1,190 |
| Eastern California Municipal Water District | | | | |
| Water & Sewer | 5.000% | 7/1/24 | 1,000 | 1,235 |
| Eastern California Municipal Water District | | | | |
| Water & Sewer | 5.000% | 7/1/25 | 1,000 | 1,248 |
| Eastern California Municipal Water District | | | | |
| Water & Sewer | 5.000% | 7/1/26 | 1,010 | 1,271 |
| Eastern California Municipal Water District | | | | |
| Water & Sewer | 5.000% | 7/1/27 | 2,445 | 3,047 |
| Eastern California Municipal Water District | | | | |
| Water & Sewer | 5.000% | 7/1/28 | 1,875 | 2,316 |
| Eastern California Municipal Water District | | | | |
| Water & Sewer | 5.000% | 7/1/29 | 3,620 | 4,435 |
| Eastern California Municipal Water District | | | | |
| Water & Sewer | 5.000% | 7/1/29 | 2,625 | 3,232 |
| Eastern California Municipal Water District | | | | |
| Water & Sewer | 5.000% | 7/1/30 | 2,500 | 3,056 |
| Eastern California Municipal Water District | | | | |
| Water & Sewer | 5.000% | 7/1/31 | 3,000 | 3,630 |
| Eastern California Municipal Water District | | | | |
| Water & Sewer | 5.000% | 7/1/31 | 5,000 | 6,058 |
| Eastern California Municipal Water District | | | | |
| Water & Sewer | 5.000% | 7/1/32 | 2,500 | 3,010 |
| Eastern California Municipal Water District | | | | |
| Water & Sewer | 5.000% | 7/1/32 | 5,000 | 6,028 |
74
California Intermediate-Term Tax-Exempt Fund
| | | | | |
| | | | | Face | Market |
| | | | Maturity | Amount | Value• |
| | | Coupon | Date | ($000) | ($000) |
| | Eastern California Municipal Water District | | | | |
| | Water & Sewer | 5.000% | 7/1/33 | 3,750 | 4,491 |
| | Eastern California Municipal Water District | | | | |
| | Water & Sewer | 5.000% | 7/1/33 | 5,000 | 5,992 |
| | Eastern California Municipal Water District | | | | |
| | Water & Sewer | 5.000% | 7/1/34 | 4,720 | 5,627 |
| | Eastern California Municipal Water District | | | | |
| | Water & Sewer | 5.000% | 7/1/35 | 4,970 | 5,903 |
| | Eastern California Municipal Water District | | | | |
| | Water & Sewer | 5.000% | 7/1/36 | 2,310 | 2,735 |
| | Eastern California Municipal Water District | | | | |
| | Water & Sewer COP | 5.000% | 7/1/18 (Prere.) | 5,245 | 5,483 |
| | Eastern California Municipal Water District | | | | |
| | Water & Sewer COP | 5.000% | 7/1/18 (Prere.) | 6,220 | 6,502 |
| | Eastern California Municipal Water District | | | | |
| | Water & Sewer COP | 5.000% | 7/1/18 (Prere.) | 1,000 | 1,045 |
| | Eastern California Municipal Water District | | | | |
| | Water & Wastewater Revenue VRDO | 0.750% | 6/7/17 LOC | 9,410 | 9,410 |
| 1,2 | Eaton Vance California Municipal Bond Fund II | 1.630% | 7/1/19 | 8,300 | 8,298 |
| | El Camino CA Community College District GO | 2.000% | 8/1/17 | 1,750 | 1,754 |
| | El Camino CA Community College District GO | 2.000% | 8/1/17 | 2,200 | 2,205 |
| | El Camino CA Community College District GO | 0.000% | 8/1/29 | 8,065 | 5,647 |
| | El Camino CA Community College District GO | 0.000% | 8/1/32 | 10,000 | 6,114 |
| | El Camino CA Community College District GO | 0.000% | 8/1/33 | 3,500 | 2,036 |
| | El Camino CA Community College District GO | 5.000% | 8/1/34 | 1,100 | 1,311 |
| | El Camino CA Community College District GO | 5.000% | 8/1/35 | 1,230 | 1,462 |
| | El Camino CA Community College District GO | 5.000% | 8/1/36 | 1,400 | 1,659 |
| | El Camino CA Healthcare District GO | 4.000% | 8/1/33 | 3,000 | 3,255 |
| | El Dorado CA Irrigation District Revenue | 4.500% | 3/1/19 (4) | 2,000 | 2,125 |
| | El Dorado CA Irrigation District Revenue | 4.750% | 3/1/20 (4) | 1,500 | 1,652 |
| | El Dorado CA Irrigation District Revenue | 5.000% | 3/1/21 (4) | 2,280 | 2,605 |
| | El Dorado CA Irrigation District Revenue | 5.000% | 3/1/28 (4) | 1,500 | 1,782 |
| | El Dorado CA Irrigation District Revenue | 5.000% | 3/1/34 (4) | 5,460 | 6,284 |
| | El Dorado County CA Community Facilities | | | | |
| | District No. 92-1 Special Tax Revenue | 5.000% | 9/1/21 | 2,000 | 2,289 |
| | Elk Grove CA Finance Authority Special Tax | | | | |
| | Revenue | 3.000% | 9/1/18 | 425 | 435 |
| | Elk Grove CA Finance Authority Special Tax | | | | |
| | Revenue | 4.000% | 9/1/19 | 655 | 695 |
| | Elk Grove CA Finance Authority Special Tax | | | | |
| | Revenue | 4.000% | 9/1/20 | 560 | 607 |
| | Elk Grove CA Finance Authority Special Tax | | | | |
| | Revenue | 5.000% | 9/1/21 | 450 | 515 |
| | Elk Grove CA Finance Authority Special Tax | | | | |
| | Revenue | 5.000% | 9/1/22 | 425 | 496 |
| | Elk Grove CA Finance Authority Special Tax | | | | |
| | Revenue | 5.000% | 9/1/33 (15) | 2,000 | 2,303 |
| | Elk Grove CA Finance Authority Special Tax | | | | |
| | Revenue | 5.000% | 9/1/34 (15) | 3,970 | 4,559 |
| | Elk Grove CA Finance Authority Special Tax | | | | |
| | Revenue | 5.000% | 9/1/35 (15) | 3,735 | 4,274 |
| | Encinitas CA Community Facilities District | | | | |
| | No. 1 Special Tax Revenue | 5.000% | 9/1/28 | 1,000 | 1,122 |
75
California Intermediate-Term Tax-Exempt Fund
| | | | | |
| | | | | Face | Market |
| | | | Maturity | Amount | Value• |
| | | Coupon | Date | ($000) | ($000) |
| | Encinitas CA Community Facilities District | | | | |
| | No. 1 Special Tax Revenue | 5.000% | 9/1/29 | 800 | 893 |
| | Escondido CA GO | 5.000% | 9/1/22 | 755 | 897 |
| | Escondido CA GO | 5.000% | 9/1/23 | 2,030 | 2,462 |
| | Escondido CA GO | 5.000% | 9/1/24 | 825 | 1,017 |
| | Escondido CA GO | 5.000% | 9/1/25 | 1,000 | 1,249 |
| | Evergreen CA School District Election GO | 3.000% | 8/1/17 | 1,500 | 1,506 |
| | Evergreen CA School District Election GO | 4.000% | 8/1/34 | 1,070 | 1,141 |
| | Evergreen CA School District Election GO | 4.000% | 8/1/36 | 1,870 | 1,981 |
| 1,2 | Fairfield-Suisun CA Unified School District GO | | | | |
| | TOB PUT | 0.840% | 6/22/17 | 16,355 | 16,355 |
| | Fontana CA Community Facilities District No. 22 | | | | |
| | Special Tax Revenue (Sierra Hills South) | 5.000% | 9/1/26 | 1,725 | 1,967 |
| | Fontana CA Community Facilities District No. 22 | | | | |
| | Special Tax Revenue (Sierra Hills South) | 5.000% | 9/1/27 | 1,810 | 2,054 |
| | Fontana CA Community Facilities District No. 22 | | | | |
| | Special Tax Revenue (Sierra Hills South) | 5.000% | 9/1/28 | 1,900 | 2,145 |
| | Fontana CA Public Financing Authority Tax | | | | |
| | Allocation Revenue | 5.000% | 10/1/21 (2) | 3,335 | 3,346 |
| | Fontana CA Public Financing Authority Tax | | | | |
| | Allocation Revenue | 5.000% | 10/1/23 (2) | 2,875 | 2,884 |
| | Fontana CA Public Financing Authority Tax | | | | |
| | Allocation Revenue | 5.000% | 10/1/24 (2) | 3,575 | 3,587 |
| | Fontana CA Public Financing Authority Tax | | | | |
| | Allocation Revenue | 5.000% | 10/1/26 (2) | 4,480 | 4,495 |
| | Fontana CA Unified School District GO | 5.250% | 8/1/18 (Prere.) | 4,350 | 4,578 |
| | Foothill-De Anza CA Community College | | | | |
| | District GO | 4.500% | 8/1/17 (Prere.) | 2,600 | 2,616 |
| | Foothill/Eastern Transportation Corridor Agency | | | | |
| | California Toll Road Revenue | 0.000% | 1/15/20 (4) | 3,930 | 3,793 |
| | Foothill/Eastern Transportation Corridor Agency | | | | |
| | California Toll Road Revenue | 0.000% | 1/15/21 (4) | 4,115 | 3,858 |
| | Foothill/Eastern Transportation Corridor Agency | | | | |
| | California Toll Road Revenue | 0.000% | 1/15/22 (4) | 12,255 | 11,181 |
| | Foothill/Eastern Transportation Corridor Agency | | | | |
| | California Toll Road Revenue | 0.000% | 1/15/23 (4) | 16,430 | 14,532 |
| | Foothill/Eastern Transportation Corridor Agency | | | | |
| | California Toll Road Revenue | 0.000% | 1/15/24 (4) | 1,880 | 1,606 |
| | Foothill/Eastern Transportation Corridor Agency | | | | |
| | California Toll Road Revenue | 0.000% | 1/15/25 | 2,130 | 1,752 |
| | Foothill/Eastern Transportation Corridor Agency | | | | |
| | California Toll Road Revenue | 0.000% | 1/15/26 | 3,000 | 2,497 |
| | Foothill/Eastern Transportation Corridor Agency | | | | |
| | California Toll Road Revenue | 0.000% | 1/15/27 | 5,000 | 4,210 |
| | Foothill/Eastern Transportation Corridor Agency | | | | |
| | California Toll Road Revenue | 0.000% | 1/15/31 (4) | 1,000 | 909 |
| | Foothill/Eastern Transportation Corridor Agency | | | | |
| | California Toll Road Revenue | 6.250% | 1/15/33 | 5,000 | 5,912 |
| | Foothill/Eastern Transportation Corridor Agency | | | | |
| | California Toll Road Revenue PUT | 5.000% | 1/15/18 | 625 | 628 |
| | Foothill/Eastern Transportation Corridor Agency | | | | |
| | California Toll Road Revenue PUT | 5.000% | 1/15/20 | 22,880 | 24,364 |
| | Foothill/Eastern Transportation Corridor Agency | | | | |
| | California Toll Road Revenue PUT | 5.500% | 1/15/23 | 25,000 | 28,958 |
76
California Intermediate-Term Tax-Exempt Fund
| | | | |
| | | | Face | Market |
| | | Maturity | Amount | Value• |
| | Coupon | Date | ($000) | ($000) |
| Fremont CA Unified School District GO | 4.000% | 8/1/29 | 1,070 | 1,178 |
| Fremont CA Unified School District GO | 4.000% | 8/1/30 | 1,415 | 1,547 |
| Fremont CA Unified School District GO | 4.000% | 8/1/31 | 1,790 | 1,936 |
| Fremont CA Unified School District GO | 4.000% | 8/1/32 | 2,195 | 2,365 |
| Fremont CA Unified School District GO | 4.000% | 8/1/33 | 2,630 | 2,816 |
| Fremont CA Unified School District GO | 4.000% | 8/1/34 | 3,105 | 3,304 |
| Fremont CA Union High School District GO | 4.000% | 8/1/17 | 3,750 | 3,771 |
| Fremont CA Union High School District GO | 4.000% | 8/1/32 | 1,000 | 1,085 |
| Fremont CA Union High School District GO | 4.000% | 8/1/34 | 2,085 | 2,234 |
| Fresno CA Joint Powers Financing Authority | | | | |
| Lease Revenue | 5.000% | 4/1/18 | 600 | 619 |
| Fresno CA Joint Powers Financing Authority | | | | |
| Lease Revenue | 5.000% | 4/1/19 | 1,130 | 1,206 |
| Fresno CA Joint Powers Financing Authority | | | | |
| Lease Revenue | 5.000% | 4/1/20 | 1,000 | 1,100 |
| Fresno CA Joint Powers Financing Authority | | | | |
| Lease Revenue | 5.000% | 4/1/21 | 1,250 | 1,409 |
| Fresno CA Joint Powers Financing Authority | | | | |
| Lease Revenue | 5.000% | 4/1/22 (4) | 425 | 492 |
| Fresno CA Joint Powers Financing Authority | | | | |
| Lease Revenue | 5.000% | 4/1/23 (4) | 800 | 942 |
| Fresno CA Joint Powers Financing Authority | | | | |
| Lease Revenue | 5.000% | 4/1/24 (4) | 675 | 805 |
| Fresno CA Joint Powers Financing Authority | | | | |
| Lease Revenue | 5.000% | 4/1/26 (4) | 1,650 | 1,996 |
| Fresno CA Joint Powers Financing Authority | | | | |
| Lease Revenue | 5.000% | 4/1/27 (4) | 1,300 | 1,588 |
| Fresno CA Joint Powers Financing Authority | | | | |
| Lease Revenue | 5.000% | 4/1/30 (4) | 675 | 804 |
| Fresno CA Joint Powers Financing Authority | | | | |
| Lease Revenue | 5.000% | 4/1/31 (4) | 1,000 | 1,183 |
| Fresno CA Joint Powers Financing Authority | | | | |
| Lease Revenue | 5.000% | 4/1/32 (4) | 1,500 | 1,765 |
| Fresno CA Joint Powers Financing Authority | | | | |
| Lease Revenue | 5.000% | 4/1/36 (4) | 2,055 | 2,380 |
| Fresno CA Joint Powers Financing Authority | | | | |
| Lease Revenue | 5.000% | 4/1/37 (4) | 1,200 | 1,386 |
| Fresno CA Sewer Revenue | 5.000% | 9/1/24 (12) | 830 | 871 |
| Fullerton CA Community Facilities District No. 1 | | | | |
| Special Tax Revenue (Amerige Heights) | 5.000% | 9/1/26 | 1,000 | 1,142 |
| Fullerton CA Community Facilities District No. 1 | | | | |
| Special Tax Revenue (Amerige Heights) | 5.000% | 9/1/32 | 1,600 | 1,789 |
| Gavilan CA Joint Community College District GO | 5.000% | 8/1/32 | 4,200 | 4,978 |
| Gilroy CA School Facilities Finance Authority | | | | |
| Revenue | 5.000% | 8/1/33 | 2,400 | 2,736 |
| Glendale CA Redevelopment Agency Successor | | | | |
| Agency Tax Allocation Revenue (Central | | | | |
| Glendale Redevelopment Project) | 4.000% | 12/1/22 (15) | 1,555 | 1,746 |
| Glendale CA Redevelopment Agency Successor | | | | |
| Agency Tax Allocation Revenue (Central | | | | |
| Glendale Redevelopment Project) | 4.000% | 12/1/23 (15) | 2,310 | 2,614 |
| Glendale CA Redevelopment Agency Successor | | | | |
| Agency Tax Allocation Revenue (Central | | | | |
| Glendale Redevelopment Project) | 5.000% | 12/1/24 (15) | 1,400 | 1,691 |
77
California Intermediate-Term Tax-Exempt Fund
| | | | |
| | | | Face | Market |
| | | Maturity | Amount | Value• |
| | Coupon | Date | ($000) | ($000) |
| Golden State Tobacco Securitization Corp. | | | | |
| California Revenue | 3.000% | 6/1/17 | 2,000 | 2,000 |
| Golden State Tobacco Securitization Corp. | | | | |
| California Revenue | 5.000% | 6/1/17 | 610 | 610 |
| Golden State Tobacco Securitization Corp. | | | | |
| California Revenue | 4.000% | 6/1/18 | 16,500 | 16,990 |
| Golden State Tobacco Securitization Corp. | | | | |
| California Revenue | 5.000% | 6/1/19 | 1,500 | 1,620 |
| Golden State Tobacco Securitization Corp. | | | | |
| California Revenue | 5.000% | 6/1/19 | 5,640 | 6,066 |
| Golden State Tobacco Securitization Corp. | | | | |
| California Revenue | 5.000% | 6/1/20 | 1,750 | 1,950 |
| Golden State Tobacco Securitization Corp. | | | | |
| California Revenue | 5.000% | 6/1/20 | 3,335 | 3,698 |
| Golden State Tobacco Securitization Corp. | | | | |
| California Revenue | 5.000% | 6/1/21 | 1,000 | 1,146 |
| Golden State Tobacco Securitization Corp. | | | | |
| California Revenue | 5.000% | 6/1/21 | 2,750 | 3,111 |
| Golden State Tobacco Securitization Corp. | | | | |
| California Revenue | 4.550% | 6/1/22 (4) | 470 | 486 |
| Golden State Tobacco Securitization Corp. | | | | |
| California Revenue | 5.000% | 6/1/22 | 3,670 | 4,235 |
| Golden State Tobacco Securitization Corp. | | | | |
| California Revenue | 5.000% | 6/1/23 | 7,500 | 8,774 |
| Golden State Tobacco Securitization Corp. | | | | |
| California Revenue | 5.000% | 6/1/24 | 11,000 | 13,032 |
| Golden State Tobacco Securitization Corp. | | | | |
| California Revenue | 5.000% | 6/1/25 | 8,000 | 9,565 |
| Golden State Tobacco Securitization Corp. | | | | |
| California Revenue | 5.000% | 6/1/26 | 11,500 | 13,793 |
| Golden State Tobacco Securitization Corp. | | | | |
| California Revenue | 0.000% | 6/1/27 (2) | 6,500 | 4,908 |
| Golden State Tobacco Securitization Corp. | | | | |
| California Revenue | 5.000% | 6/1/27 | 5,000 | 6,041 |
| Golden State Tobacco Securitization Corp. | | | | |
| California Revenue | 4.000% | 6/1/31 | 3,700 | 3,970 |
| Golden State Tobacco Securitization Corp. | | | | |
| California Revenue | 5.000% | 6/1/33 | 7,000 | 8,097 |
| Golden State Tobacco Securitization Corp. | | | | |
| California Revenue | 5.000% | 6/1/34 | 11,000 | 12,681 |
| Golden State Tobacco Securitization Corp. | | | | |
| California Revenue | 4.000% | 6/1/35 | 1,170 | 1,213 |
| Golden State Tobacco Securitization Corp. | | | | |
| California Revenue | 5.000% | 6/1/35 | 3,605 | 4,142 |
| 2 Golden State Tobacco Securitization Corp. | | | | |
| California Revenue TOB VRDO | 0.910% | 6/7/17 LOC | 12,205 | 12,205 |
| Grossmont CA Union High School District GO | 5.000% | 8/1/22 | 1,250 | 1,483 |
| Grossmont CA Union High School District GO | 0.000% | 2/1/25 (4) | 1,400 | 1,186 |
| Grossmont CA Union High School District GO | 0.000% | 8/1/26 (4) | 2,040 | 1,574 |
| Grossmont CA Union High School District GO | 0.000% | 8/1/27 (4) | 2,825 | 2,068 |
| Grossmont CA Union High School District GO | 0.000% | 8/1/28 (4) | 2,905 | 2,013 |
| Grossmont CA Union High School District GO | 0.000% | 8/1/28 | 3,210 | 2,326 |
| Grossmont CA Union High School District GO | 0.000% | 8/1/29 | 6,965 | 4,819 |
| Grossmont CA Union High School District GO | 4.000% | 8/1/33 | 10,000 | 10,749 |
78
California Intermediate-Term Tax-Exempt Fund
| | | | |
| | | | Face | Market |
| | | Maturity | Amount | Value• |
| | Coupon | Date | ($000) | ($000) |
| Grossmont-Cuyamaca CA Community College | | | | |
| District GO | 5.000% | 8/1/22 (12) | 5,480 | 5,739 |
| Grossmont-Cuyamaca CA Community College | | | | |
| District GO | 5.000% | 8/1/23 (12) | 5,000 | 5,233 |
| Grossmont-Cuyamaca CA Community College | | | | |
| District GO | 0.000% | 8/1/25 (12) | 14,010 | 11,678 |
| Grossmont-Cuyamaca CA Community College | | | | |
| District GO | 0.000% | 8/1/28 (12) | 21,875 | 15,904 |
| Hanford CA Joint Union High School District | | | | |
| Revenue | 5.000% | 8/1/26 (4) | 1,420 | 1,732 |
| Hanford CA Joint Union High School District | | | | |
| Revenue | 5.000% | 8/1/28 (4) | 2,575 | 3,083 |
| Hanford CA Joint Union High School District | | | | |
| Revenue | 5.000% | 8/1/29 (4) | 2,390 | 2,838 |
| Hanford CA Joint Union High School District | | | | |
| Revenue | 5.000% | 8/1/31 (4) | 2,385 | 2,798 |
| Hartnell CA Community College GO | 5.000% | 8/1/21 | 500 | 579 |
| Hartnell CA Community College GO | 5.000% | 8/1/22 | 500 | 593 |
| Hayward CA Redevelopment Agency Successor | | | | |
| Agency Tax Allocation Revenue | 5.000% | 9/1/27 | 1,950 | 2,352 |
| Hayward CA Redevelopment Agency Successor | | | | |
| Agency Tax Allocation Revenue | 5.000% | 9/1/33 | 1,205 | 1,403 |
| Hayward CA Unified School District GO | 5.000% | 8/1/30 (4) | 3,465 | 4,020 |
| Hayward CA Unified School District GO | 5.000% | 8/1/30 (4) | 4,930 | 5,719 |
| Hayward CA Unified School District GO | 5.000% | 8/1/31 (4) | 1,500 | 1,733 |
| Hayward CA Unified School District GO | 5.000% | 8/1/32 (4) | 4,240 | 4,880 |
| Hayward CA Unified School District GO | 5.000% | 8/1/32 (4) | 1,700 | 1,957 |
| Hayward CA Unified School District GO | 5.000% | 8/1/33 (4) | 3,045 | 3,490 |
| Hayward CA Unified School District GO | 5.000% | 8/1/33 (4) | 6,130 | 7,026 |
| Hemet CA Unified School District Financing | | | | |
| Authority Special Tax Revenue | 3.000% | 9/1/17 | 250 | 251 |
| Hemet CA Unified School District Financing | | | | |
| Authority Special Tax Revenue | 4.000% | 9/1/18 | 280 | 289 |
| Hemet CA Unified School District Financing | | | | |
| Authority Special Tax Revenue | 4.000% | 9/1/19 | 350 | 368 |
| Hemet CA Unified School District Financing | | | | |
| Authority Special Tax Revenue | 4.000% | 9/1/20 | 250 | 267 |
| Hemet CA Unified School District Financing | | | | |
| Authority Special Tax Revenue | 5.000% | 9/1/21 | 175 | 197 |
| Hemet CA Unified School District Financing | | | | |
| Authority Special Tax Revenue | 5.000% | 9/1/22 | 500 | 573 |
| Hemet CA Unified School District Financing | | | | |
| Authority Special Tax Revenue | 5.000% | 9/1/23 | 500 | 580 |
| Hemet CA Unified School District Financing | | | | |
| Authority Special Tax Revenue | 5.000% | 9/1/24 | 615 | 719 |
| Hemet CA Unified School District Financing | | | | |
| Authority Special Tax Revenue | 5.000% | 9/1/25 | 385 | 448 |
| Hemet CA Unified School District Financing | | | | |
| Authority Special Tax Revenue | 5.000% | 9/1/27 | 950 | 1,084 |
| Hemet CA Unified School District Financing | | | | |
| Authority Special Tax Revenue | 5.000% | 9/1/29 | 1,255 | 1,414 |
| Hemet CA Unified School District Financing | | | | |
| Authority Special Tax Revenue | 5.000% | 9/1/32 | 550 | 610 |
79
California Intermediate-Term Tax-Exempt Fund | | | |
| | | | Face | Market |
| | | Maturity | Amount | Value• |
| | Coupon | Date | ($000) | ($000) |
| Hemet CA Unified School District Financing | | | | |
| Authority Special Tax Revenue | 5.000% | 9/1/33 | 580 | 641 |
| Hemet CA Unified School District Financing | | | | |
| Authority Special Tax Revenue | 5.000% | 9/1/34 | 360 | 396 |
| Hollister CA Redevelopment Agency Successor | | | | |
| Agency Tax Allocation Revenue | 5.000% | 10/1/27 (15) | 1,000 | 1,187 |
| Hollister CA Redevelopment Agency Successor | | | | |
| Agency Tax Allocation Revenue | 5.000% | 10/1/28 (15) | 1,235 | 1,456 |
| Imperial CA Irrigation District Electric Revenue | 5.000% | 11/1/20 (Prere.) | 1,500 | 1,702 |
| Imperial CA Irrigation District Electric Revenue | 5.000% | 11/1/20 | 1,000 | 1,133 |
| Imperial CA Irrigation District Electric Revenue | 5.000% | 11/1/21 | 1,000 | 1,165 |
| Imperial CA Irrigation District Electric Revenue | 5.000% | 11/1/22 | 525 | 626 |
| Imperial CA Irrigation District Electric Revenue | 5.000% | 11/1/22 | 1,000 | 1,193 |
| Imperial CA Irrigation District Electric Revenue | 5.000% | 11/1/23 | 1,500 | 1,825 |
| Imperial CA Irrigation District Electric Revenue | 5.000% | 11/1/24 | 670 | 828 |
| Imperial CA Irrigation District Electric Revenue | 5.000% | 11/1/24 | 1,000 | 1,236 |
| Imperial CA Irrigation District Electric Revenue | 5.000% | 11/1/25 | 1,250 | 1,566 |
| Imperial CA Irrigation District Electric Revenue | 5.000% | 11/1/26 | 2,265 | 2,867 |
| Imperial CA Irrigation District Electric Revenue | 5.000% | 11/1/27 | 500 | 618 |
| Imperial CA Irrigation District Electric Revenue | 5.000% | 11/1/28 | 600 | 734 |
| Imperial CA Irrigation District Electric Revenue | 5.000% | 11/1/31 | 3,000 | 3,594 |
| Indian Wells CA Redevelopment Agency | | | | |
| Successor Agency Tax Allocation Revenue | 4.000% | 9/1/18 (4) | 1,000 | 1,036 |
| Indian Wells CA Redevelopment Agency | | | | |
| Successor Agency Tax Allocation Revenue | 4.000% | 9/1/19 (4) | 1,225 | 1,301 |
| Indian Wells CA Redevelopment Agency | | | | |
| Successor Agency Tax Allocation Revenue | 5.000% | 9/1/20 (4) | 1,285 | 1,433 |
| Indian Wells CA Redevelopment Agency | | | | |
| Successor Agency Tax Allocation Revenue | 5.000% | 9/1/21 (4) | 1,615 | 1,848 |
| Indian Wells CA Redevelopment Agency | | | | |
| Successor Agency Tax Allocation Revenue | 5.000% | 9/1/22 (4) | 1,195 | 1,397 |
| Indian Wells CA Redevelopment Agency | | | | |
| Successor Agency Tax Allocation Revenue | 5.000% | 9/1/23 (4) | 750 | 891 |
| Indian Wells CA Redevelopment Agency | | | | |
| Successor Agency Tax Allocation Revenue | 5.000% | 9/1/24 (4) | 610 | 734 |
| Inglewood CA Redevelopment Agency | | | | |
| Successor Agency Tax Allocation Revenue | 5.000% | 5/1/21 (15) | 500 | 566 |
| Inglewood CA Redevelopment Agency | | | | |
| Successor Agency Tax Allocation Revenue | 5.000% | 5/1/22 (15) | 350 | 405 |
| Inglewood CA Redevelopment Agency | | | | |
| Successor Agency Tax Allocation Revenue | 5.000% | 5/1/23 (15) | 1,000 | 1,172 |
| Inglewood CA Redevelopment Agency | | | | |
| Successor Agency Tax Allocation Revenue | 5.000% | 5/1/25 (15) | 1,500 | 1,800 |
| Inglewood CA Redevelopment Agency | | | | |
| Successor Agency Tax Allocation Revenue | 5.000% | 5/1/27 (15) | 500 | 608 |
| Inglewood CA Redevelopment Agency | | | | |
| Successor Agency Tax Allocation Revenue | 5.000% | 5/1/29 (15) | 1,215 | 1,448 |
| Inglewood CA Redevelopment Agency | | | | |
| Successor Agency Tax Allocation Revenue | 5.000% | 5/1/30 (15) | 1,000 | 1,185 |
| Irvine CA Assessment District No. 94-13 | | | | |
| Improvement Revenue (Oak Creek) VRDO | 0.760% | 6/1/17 LOC | 7,300 | 7,300 |
| Irvine CA Assessment District No. 97-16 | | | | |
| Improvement Revenue VRDO | 0.760% | 6/1/17 LOC | 9,668 | 9,668 |
80
California Intermediate-Term Tax-Exempt Fund
| | | | |
| | | | Face | Market |
| | | Maturity | Amount | Value• |
| | Coupon | Date | ($000) | ($000) |
| Irvine CA Assessment District No. 97-17 | | | | |
| Improvement Revenue VRDO | 0.760% | 6/1/17 LOC | 4,200 | 4,200 |
| Irvine CA Reassessment District No. 12-1 | | | | |
| Improvement Revenue | 4.000% | 9/2/18 | 1,350 | 1,398 |
| Irvine CA Reassessment District No. 12-1 | | | | |
| Improvement Revenue | 4.000% | 9/2/19 | 2,000 | 2,121 |
| Irvine CA Reassessment District No. 12-1 | | | | |
| Improvement Revenue | 4.000% | 9/2/20 | 2,425 | 2,616 |
| Irvine CA Reassessment District No. 12-1 | | | | |
| Improvement Revenue | 4.000% | 9/2/21 | 1,750 | 1,920 |
| Irvine CA Reassessment District No. 12-1 | | | | |
| Improvement Revenue | 5.000% | 9/2/23 | 400 | 463 |
| Irvine CA Reassessment District No. 13-1 | | | | |
| Improvement Revenue | 5.000% | 9/2/20 | 350 | 386 |
| Irvine CA Reassessment District No. 13-1 | | | | |
| Improvement Revenue | 5.000% | 9/2/22 | 1,125 | 1,290 |
| Irvine CA Reassessment District No. 15-1 | | | | |
| Improvement Revenue | 5.000% | 9/2/22 | 1,000 | 1,169 |
| Irvine CA Reassessment District No. 15-2 | | | | |
| Improvement Revenue | 3.000% | 9/2/17 | 400 | 402 |
| Irvine CA Reassessment District No. 15-2 | | | | |
| Improvement Revenue | 4.000% | 9/2/18 | 500 | 516 |
| Irvine CA Reassessment District No. 15-2 | | | | |
| Improvement Revenue | 4.000% | 9/2/20 | 750 | 803 |
| Irvine CA Reassessment District No. 15-2 | | | | |
| Improvement Revenue | 5.000% | 9/2/21 | 675 | 761 |
| Irvine CA Reassessment District No. 15-2 | | | | |
| Improvement Revenue | 5.000% | 9/2/22 | 650 | 745 |
| Irvine CA Reassessment District No. 15-2 | | | | |
| Improvement Revenue | 5.000% | 9/2/23 | 800 | 930 |
| Irvine CA Reassessment District No. 15-2 | | | | |
| Improvement Revenue | 5.000% | 9/2/24 | 850 | 996 |
| Irvine CA Reassessment District No. 15-2 | | | | |
| Improvement Revenue | 5.000% | 9/2/25 | 450 | 529 |
| Irvine CA Reassessment District No. 15-2 | | | | |
| Improvement Revenue | 5.000% | 9/2/26 | 800 | 931 |
| Irvine CA Reassessment District No. 85-7A | | | | |
| Improvement Revenue VRDO | 0.760% | 6/1/17 LOC | 1,800 | 1,800 |
| Irvine Ranch CA Water District COP | 5.000% | 3/1/32 | 3,630 | 4,415 |
| Irvine Ranch CA Water District COP | 5.000% | 3/1/33 | 2,790 | 3,376 |
| Irvine Ranch CA Water District COP | 5.000% | 3/1/34 | 1,300 | 1,566 |
| Irvine Ranch CA Water District COP | 5.000% | 3/1/35 | 1,540 | 1,848 |
| Irvine Ranch CA Water District COP | 5.000% | 3/1/36 | 1,000 | 1,196 |
| Irvine Ranch CA Water District Revenue | 5.000% | 2/1/33 | 1,000 | 1,205 |
| Irvine Ranch CA Water District Revenue | 5.000% | 2/1/34 | 2,000 | 2,398 |
| Irvine Ranch CA Water District Revenue | 5.000% | 2/1/35 | 2,500 | 2,986 |
| Irvine Ranch CA Water District Revenue | 5.000% | 2/1/36 | 2,665 | 3,174 |
| Jefferson CA Union High School District GO | 4.000% | 8/1/18 (15) | 750 | 777 |
| Jefferson CA Union High School District GO | 5.000% | 8/1/19 (15) | 625 | 678 |
| Jefferson CA Union High School District GO | 5.000% | 8/1/20 (15) | 500 | 560 |
| Jefferson CA Union High School District GO | 5.000% | 8/1/21 (15) | 500 | 575 |
| Jefferson CA Union High School District GO | 5.000% | 8/1/22 (15) | 700 | 824 |
| Jefferson CA Union High School District GO | 5.000% | 8/1/23 (15) | 1,000 | 1,200 |
| Jefferson CA Union High School District GO | 5.000% | 8/1/24 (15) | 875 | 1,068 |
81
California Intermediate-Term Tax-Exempt Fund
| | | | |
| | | | Face | Market |
| | | Maturity | Amount | Value• |
| | Coupon | Date | ($000) | ($000) |
| Jefferson CA Union High School District GO | 5.000% | 8/1/25 (15) | 860 | 1,062 |
| Jurupa CA Public Financing Authority Special | | | | |
| Tax Revenue | 4.000% | 9/1/18 | 770 | 794 |
| Jurupa CA Public Financing Authority Special | | | | |
| Tax Revenue | 4.000% | 9/1/19 | 1,095 | 1,154 |
| Jurupa CA Public Financing Authority Special | | | | |
| Tax Revenue | 4.000% | 9/1/20 | 1,385 | 1,484 |
| Jurupa CA Public Financing Authority Special | | | | |
| Tax Revenue | 5.000% | 9/1/21 | 500 | 564 |
| Jurupa CA Public Financing Authority Special | | | | |
| Tax Revenue | 5.000% | 9/1/22 | 1,535 | 1,764 |
| Jurupa CA Public Financing Authority Special | | | | |
| Tax Revenue | 5.000% | 9/1/23 | 1,365 | 1,592 |
| Jurupa CA Public Financing Authority Special | | | | |
| Tax Revenue | 5.000% | 9/1/24 | 620 | 732 |
| Jurupa CA Public Financing Authority Special | | | | |
| Tax Revenue | 5.000% | 9/1/25 | 1,725 | 2,053 |
| Kaweah CA Delta Health Care District Revenue | 5.000% | 6/1/17 | 1,110 | 1,110 |
| Kaweah CA Delta Health Care District Revenue | 5.000% | 6/1/18 | 3,255 | 3,381 |
| Kaweah CA Delta Health Care District Revenue | 5.000% | 6/1/19 | 3,415 | 3,667 |
| Kaweah CA Delta Health Care District Revenue | 5.000% | 6/1/20 | 1,585 | 1,754 |
| Kaweah CA Delta Health Care District Revenue | 5.000% | 6/1/21 | 3,755 | 4,265 |
| Kaweah CA Delta Health Care District Revenue | 5.000% | 6/1/22 | 3,950 | 4,587 |
| Kaweah CA Delta Health Care District Revenue | 4.000% | 6/1/36 | 4,930 | 5,083 |
| La Quinta CA Redevelopment Agency Tax | | | | |
| Allocation Revenue | 5.000% | 9/1/23 | 750 | 891 |
| La Quinta CA Redevelopment Agency Tax | | | | |
| Allocation Revenue | 5.000% | 9/1/24 | 1,250 | 1,472 |
| La Quinta CA Redevelopment Agency Tax | | | | |
| Allocation Revenue | 5.000% | 9/1/25 | 1,250 | 1,459 |
| La Quinta CA Redevelopment Agency Tax | | | | |
| Allocation Revenue | 5.000% | 9/1/28 | 1,000 | 1,171 |
| La Quinta CA Redevelopment Agency Tax | | | | |
| Allocation Revenue | 5.000% | 9/1/29 | 1,000 | 1,165 |
| La Quinta CA Redevelopment Agency Tax | | | | |
| Allocation Revenue | 5.000% | 9/1/30 | 1,500 | 1,697 |
| La Quinta CA Redevelopment Agency Tax | | | | |
| Allocation Revenue | 5.000% | 9/1/31 | 2,095 | 2,360 |
| La Quinta CA Redevelopment Agency Tax | | | | |
| Allocation Revenue | 5.000% | 9/1/32 | 1,515 | 1,743 |
| La Quinta CA Redevelopment Agency Tax | | | | |
| Allocation Revenue | 5.000% | 9/1/34 | 1,050 | 1,199 |
| La Verne CA (Brethren Hillcrest Homes) COP | 5.000% | 5/15/23 | 300 | 340 |
| La Verne CA (Brethren Hillcrest Homes) COP | 5.000% | 5/15/24 | 310 | 349 |
| La Verne CA (Brethren Hillcrest Homes) COP | 5.000% | 5/15/25 | 550 | 616 |
| La Verne CA (Brethren Hillcrest Homes) COP | 5.000% | 5/15/29 | 750 | 821 |
| Lancaster CA Redevelopment Agency Successor | | | | |
| Agency Tax Allocation Revenue | 3.000% | 8/1/18 | 325 | 332 |
| Lancaster CA Redevelopment Agency Successor | | | | |
| Agency Tax Allocation Revenue | 3.000% | 8/1/19 | 500 | 519 |
| Lancaster CA Redevelopment Agency Successor | | | | |
| Agency Tax Allocation Revenue | 3.000% | 8/1/20 | 750 | 786 |
| Lancaster CA Redevelopment Agency Successor | | | | |
| Agency Tax Allocation Revenue | 4.000% | 8/1/21 | 550 | 609 |
82
California Intermediate-Term Tax-Exempt Fund
| | | | |
| | | | Face | Market |
| | | Maturity | Amount | Value• |
| | Coupon | Date | ($000) | ($000) |
| Lancaster CA Redevelopment Agency Successor | | | | |
| Agency Tax Allocation Revenue | 5.000% | 8/1/22 | 550 | 640 |
| Lancaster CA Redevelopment Agency Successor | | | | |
| Agency Tax Allocation Revenue | 5.000% | 8/1/23 (4) | 425 | 505 |
| Lancaster CA Redevelopment Agency Successor | | | | |
| Agency Tax Allocation Revenue | 5.000% | 8/1/24 (4) | 435 | 523 |
| Lancaster CA Redevelopment Agency Successor | | | | |
| Agency Tax Allocation Revenue | 5.000% | 8/1/25 (4) | 600 | 729 |
| Lancaster CA Redevelopment Agency Successor | | | | |
| Agency Tax Allocation Revenue | 4.000% | 8/1/26 (4) | 1,355 | 1,553 |
| Lancaster CA Redevelopment Agency Successor | | | | |
| Agency Tax Allocation Revenue | 4.000% | 8/1/27 (4) | 1,890 | 2,146 |
| Lancaster CA Redevelopment Agency Successor | | | | |
| Agency Tax Allocation Revenue | 4.000% | 8/1/28 (4) | 1,800 | 2,025 |
| Lancaster CA Redevelopment Agency Successor | | | | |
| Agency Tax Allocation Revenue | 5.000% | 8/1/29 (4) | 825 | 979 |
| Lancaster CA Redevelopment Agency Successor | | | | |
| Agency Tax Allocation Revenue | 5.000% | 8/1/30 (4) | 1,000 | 1,176 |
| Lancaster CA Redevelopment Agency Successor | | | | |
| Agency Tax Allocation Revenue | 5.000% | 8/1/33 (4) | 1,200 | 1,390 |
| Lee Lake CA Public Financing Authority Revenue | 5.000% | 9/1/21 | 1,810 | 2,038 |
| Lee Lake CA Public Financing Authority Revenue | 5.000% | 9/1/23 | 2,190 | 2,552 |
| Long Beach CA Community College District GO | 0.000% | 6/1/29 (ETM) | 960 | 721 |
| Long Beach CA Community College District GO | 0.000% | 6/1/29 (4) | 5,420 | 3,774 |
| Long Beach CA Finance Authority Lease Revenue | 6.000% | 11/1/17 (2) | 620 | 630 |
| Long Beach CA Finance Authority Natural Gas | | | | |
| Purchase Revenue | 5.250% | 11/15/19 | 415 | 449 |
| Long Beach CA Finance Authority Natural Gas | | | | |
| Purchase Revenue | 5.250% | 11/15/20 | 3,255 | 3,603 |
| Long Beach CA Finance Authority Natural Gas | | | | |
| Purchase Revenue | 5.250% | 11/15/21 | 500 | 563 |
| Long Beach CA Finance Authority Natural Gas | | | | |
| Purchase Revenue | 5.250% | 11/15/22 | 260 | 298 |
| Long Beach CA Finance Authority Natural Gas | | | | |
| Purchase Revenue | 5.000% | 11/15/24 | 7,905 | 9,183 |
| Long Beach CA Finance Authority Natural Gas | | | | |
| Purchase Revenue | 2.202% | 11/15/25 | 16,845 | 16,145 |
| Long Beach CA Finance Authority Natural Gas | | | | |
| Purchase Revenue | 2.222% | 11/15/26 | 10,025 | 9,456 |
| Long Beach CA Harbor Revenue | 5.000% | 5/15/33 | 1,000 | 1,177 |
| Long Beach CA Harbor Revenue | 5.000% | 5/15/34 | 2,000 | 2,345 |
| Long Beach CA Harbor Revenue | 5.000% | 5/15/35 | 2,825 | 3,301 |
| Long Beach CA Unified School District GO | 4.000% | 8/1/17 | 2,550 | 2,564 |
| Long Beach CA Unified School District GO | 0.000% | 8/1/27 | 2,500 | 1,854 |
| Long Beach CA Unified School District GO | 5.000% | 8/1/30 | 5,000 | 5,742 |
| Los Angeles CA Community College District GO | 2.000% | 8/1/17 | 3,350 | 3,357 |
| 3 Los Angeles CA Community College District GO | 5.000% | 8/1/17 (Prere.) | 5,000 | 5,036 |
| Los Angeles CA Community College District GO | 5.000% | 8/1/18 (Prere.) | 45 | 47 |
| Los Angeles CA Community College District GO | 5.000% | 8/1/18 (Prere.) | 5 | 5 |
| Los Angeles CA Community College District GO | 5.000% | 8/1/18 (Prere.) | 6,500 | 6,816 |
| Los Angeles CA Community College District GO | 5.000% | 8/1/18 (Prere.) | 5,000 | 5,243 |
| Los Angeles CA Community College District GO | 5.000% | 8/1/18 (Prere.) | 35 | 37 |
| Los Angeles CA Community College District GO | 5.000% | 8/1/18 (Prere.) | 4,250 | 4,457 |
| Los Angeles CA Community College District GO | 5.000% | 8/1/18 (Prere.) | 20 | 21 |
83
California Intermediate-Term Tax-Exempt Fund
| | | | |
| | | | Face | Market |
| | | Maturity | Amount | Value• |
| | Coupon | Date | ($000) | ($000) |
| Los Angeles CA Community College District GO | 3.000% | 8/1/19 | 3,200 | 3,348 |
| Los Angeles CA Community College District GO | 5.000% | 8/1/19 (Prere.) | 6,960 | 7,571 |
| Los Angeles CA Community College District GO | 5.500% | 8/1/19 (Prere.) | 5,000 | 5,493 |
| Los Angeles CA Community College District GO | 4.000% | 8/1/20 | 1,000 | 1,095 |
| Los Angeles CA Community College District GO | 4.000% | 8/1/21 | 555 | 621 |
| Los Angeles CA Community College District GO | 5.000% | 8/1/22 | 3,000 | 3,567 |
| Los Angeles CA Community College District GO | 5.000% | 8/1/24 | 12,420 | 15,361 |
| Los Angeles CA Community College District GO | 5.000% | 8/1/24 | 4,735 | 5,856 |
| Los Angeles CA Community College District GO | 5.000% | 8/1/25 | 10,925 | 13,710 |
| Los Angeles CA Community College District GO | 5.000% | 8/1/27 | 7,535 | 9,151 |
| Los Angeles CA Community College District GO | 5.000% | 8/1/28 | 24,745 | 29,904 |
| Los Angeles CA Community College District GO | 5.000% | 8/1/29 | 1,390 | 1,673 |
| Los Angeles CA Community College District GO | 4.000% | 8/1/30 | 4,045 | 4,461 |
| Los Angeles CA Community College District GO | 4.000% | 8/1/30 | 1,000 | 1,090 |
| Los Angeles CA Community College District GO | 5.000% | 8/1/30 | 7,035 | 8,449 |
| Los Angeles CA Community College District GO | 4.000% | 8/1/31 | 4,320 | 4,723 |
| Los Angeles CA Community College District GO | 4.000% | 8/1/31 | 6,145 | 6,645 |
| Los Angeles CA Community College District GO | 5.000% | 8/1/31 | 20,000 | 23,861 |
| Los Angeles CA Community College District GO | 4.000% | 8/1/32 | 5,205 | 5,668 |
| Los Angeles CA Community College District GO | 4.000% | 8/1/32 | 14,500 | 15,789 |
| Los Angeles CA Community College District GO | 4.000% | 8/1/33 | 19,215 | 20,793 |
| Los Angeles CA Community College District GO | 5.000% | 8/1/36 | 8,705 | 10,336 |
| 2 Los Angeles CA Community College District GO | | | | |
| TOB VRDO | 0.800% | 6/7/17 (Prere.) | 2,800 | 2,800 |
| Los Angeles CA Community Facilities District | | | | |
| No.4 Special Tax Revenue (Playa Vista - Phase 1) | 5.000% | 9/1/23 | 800 | 933 |
| Los Angeles CA Community Facilities District | | | | |
| No.4 Special Tax Revenue (Playa Vista - Phase 1) | 5.000% | 9/1/24 | 1,000 | 1,180 |
| Los Angeles CA Community Facilities District | | | | |
| No.4 Special Tax Revenue (Playa Vista - Phase 1) | 5.000% | 9/1/25 | 1,500 | 1,753 |
| Los Angeles CA Community Facilities District | | | | |
| No.4 Special Tax Revenue (Playa Vista - Phase 1) | 5.000% | 9/1/26 | 1,200 | 1,389 |
| Los Angeles CA Community Facilities District | | | | |
| No.4 Special Tax Revenue (Playa Vista - Phase 1) | 5.000% | 9/1/27 | 2,000 | 2,300 |
| Los Angeles CA Department of Airports | | | | |
| International Airport Revenue | 5.000% | 5/15/18 (Prere.) | 4,000 | 4,162 |
| Los Angeles CA Department of Airports | | | | |
| International Airport Revenue | 5.250% | 5/15/18 (Prere.) | 3,000 | 3,129 |
| Los Angeles CA Department of Airports | | | | |
| International Airport Revenue | 4.500% | 5/15/19 | 1,305 | 1,398 |
| Los Angeles CA Department of Airports | | | | |
| International Airport Revenue | 5.000% | 5/15/21 | 1,145 | 1,314 |
| Los Angeles CA Department of Airports | | | | |
| International Airport Revenue | 5.000% | 5/15/22 | 1,000 | 1,176 |
| Los Angeles CA Department of Airports | | | | |
| International Airport Revenue | 5.000% | 5/15/23 | 950 | 1,139 |
| Los Angeles CA Department of Airports | | | | |
| International Airport Revenue | 5.000% | 5/15/23 | 1,420 | 1,662 |
| Los Angeles CA Department of Airports | | | | |
| International Airport Revenue | 5.000% | 5/15/24 | 1,700 | 1,980 |
| Los Angeles CA Department of Airports | | | | |
| International Airport Revenue | 5.000% | 5/15/25 | 1,300 | 1,602 |
| Los Angeles CA Department of Airports | | | | |
| International Airport Revenue | 5.000% | 5/15/25 | 1,500 | 1,742 |
84
California Intermediate-Term Tax-Exempt Fund
| | | | |
| | | | Face | Market |
| | | Maturity | Amount | Value• |
| | Coupon | Date | ($000) | ($000) |
| Los Angeles CA Department of Airports | | | | |
| International Airport Revenue | 5.000% | 5/15/26 | 1,500 | 1,843 |
| Los Angeles CA Department of Airports | | | | |
| International Airport Revenue | 5.000% | 5/15/26 | 5,500 | 6,138 |
| Los Angeles CA Department of Airports | | | | |
| International Airport Revenue | 5.000% | 5/15/27 | 2,000 | 2,433 |
| Los Angeles CA Department of Airports | | | | |
| International Airport Revenue | 5.000% | 5/15/28 | 2,000 | 2,416 |
| Los Angeles CA Department of Airports | | | | |
| International Airport Revenue | 5.250% | 5/15/28 | 10,000 | 11,223 |
| Los Angeles CA Department of Airports | | | | |
| International Airport Revenue | 5.000% | 5/15/29 | 1,115 | 1,308 |
| Los Angeles CA Department of Airports | | | | |
| International Airport Revenue | 5.000% | 5/15/29 | 4,385 | 4,858 |
| Los Angeles CA Department of Airports | | | | |
| International Airport Revenue | 5.250% | 5/15/29 | 10,000 | 11,220 |
| Los Angeles CA Department of Airports | | | | |
| International Airport Revenue | 5.000% | 5/15/30 | 1,200 | 1,415 |
| Los Angeles CA Department of Airports | | | | |
| International Airport Revenue | 5.000% | 5/15/30 | 1,835 | 2,019 |
| Los Angeles CA Department of Airports | | | | |
| International Airport Revenue | 5.000% | 5/15/31 | 1,190 | 1,390 |
| Los Angeles CA Department of Airports | | | | |
| International Airport Revenue | 5.000% | 5/15/32 | 1,700 | 1,980 |
| Los Angeles CA Department of Airports | | | | |
| International Airport Revenue | 5.000% | 5/15/33 | 1,510 | 1,752 |
| Los Angeles CA Department of Airports | | | | |
| International Airport Revenue | 5.000% | 5/15/34 | 4,135 | 4,783 |
| Los Angeles CA Department of Airports | | | | |
| International Airport Revenue | 5.000% | 5/15/34 | 4,750 | 5,561 |
| Los Angeles CA Department of Airports | | | | |
| International Airport Revenue | 5.000% | 5/15/35 | 2,000 | 2,338 |
| Los Angeles CA Department of Water & Power | | | | |
| Revenue | 5.000% | 7/1/17 | 5,000 | 5,018 |
| Los Angeles CA Department of Water & Power | | | | |
| Revenue | 5.000% | 7/1/21 (Prere.) | 140 | 162 |
| Los Angeles CA Department of Water & Power | | | | |
| Revenue | 4.000% | 7/1/22 | 1,000 | 1,141 |
| Los Angeles CA Department of Water & Power | | | | |
| Revenue | 5.000% | 7/1/22 | 1,000 | 1,188 |
| Los Angeles CA Department of Water & Power | | | | |
| Revenue | 5.000% | 7/1/22 | 2,500 | 2,975 |
| Los Angeles CA Department of Water & Power | | | | |
| Revenue | 5.000% | 7/1/22 | 9,870 | 11,360 |
| Los Angeles CA Department of Water & Power | | | | |
| Revenue | 5.000% | 7/1/23 | 5,605 | 6,580 |
| Los Angeles CA Department of Water & Power | | | | |
| Revenue | 5.000% | 7/1/23 | 1,335 | 1,423 |
| Los Angeles CA Department of Water & Power | | | | |
| Revenue | 5.000% | 7/1/24 | 2,770 | 2,954 |
| Los Angeles CA Department of Water & Power | | | | |
| Revenue | 5.000% | 7/1/24 | 810 | 1,003 |
| Los Angeles CA Department of Water & Power | | | | |
| Revenue | 5.000% | 7/1/24 | 3,000 | 3,704 |
85
California Intermediate-Term Tax-Exempt Fund
| | | | |
| | | | Face | Market |
| | | Maturity | Amount | Value• |
| | Coupon | Date | ($000) | ($000) |
| Los Angeles CA Department of Water & Power | | | | |
| Revenue | 5.000% | 7/1/25 | 10,000 | 11,918 |
| Los Angeles CA Department of Water & Power | | | | |
| Revenue | 5.000% | 7/1/25 | 510 | 640 |
| Los Angeles CA Department of Water & Power | | | | |
| Revenue | 5.000% | 7/1/25 | 1,375 | 1,720 |
| Los Angeles CA Department of Water & Power | | | | |
| Revenue | 5.000% | 7/1/26 | 1,500 | 1,754 |
| Los Angeles CA Department of Water & Power | | | | |
| Revenue | 5.000% | 7/1/26 | 2,350 | 2,506 |
| Los Angeles CA Department of Water & Power | | | | |
| Revenue | 5.000% | 7/1/26 | 2,000 | 2,088 |
| Los Angeles CA Department of Water & Power | | | | |
| Revenue | 5.000% | 7/1/26 | 750 | 934 |
| Los Angeles CA Department of Water & Power | | | | |
| Revenue | 5.000% | 7/1/26 | 1,670 | 2,083 |
| Los Angeles CA Department of Water & Power | | | | |
| Revenue | 5.000% | 7/1/26 | 6,000 | 7,483 |
| Los Angeles CA Department of Water & Power | | | | |
| Revenue | 5.000% | 7/1/27 | 1,655 | 1,761 |
| Los Angeles CA Department of Water & Power | | | | |
| Revenue | 5.000% | 7/1/28 | 8,000 | 9,634 |
| Los Angeles CA Department of Water & Power | | | | |
| Revenue | 5.000% | 7/1/28 | 2,000 | 2,126 |
| Los Angeles CA Department of Water & Power | | | | |
| Revenue | 5.000% | 7/1/29 | 1,500 | 1,775 |
| Los Angeles CA Department of Water & Power | | | | |
| Revenue | 5.000% | 7/1/29 | 1,670 | 1,772 |
| Los Angeles CA Department of Water & Power | | | | |
| Revenue | 5.000% | 7/1/30 | 2,000 | 2,381 |
| Los Angeles CA Department of Water & Power | | | | |
| Revenue | 5.000% | 7/1/30 | 10,000 | 11,778 |
| Los Angeles CA Department of Water & Power | | | | |
| Revenue | 5.000% | 7/1/30 | 500 | 604 |
| Los Angeles CA Department of Water & Power | | | | |
| Revenue | 5.000% | 7/1/31 | 2,500 | 2,960 |
| Los Angeles CA Department of Water & Power | | | | |
| Revenue | 5.000% | 7/1/31 | 4,690 | 5,564 |
| Los Angeles CA Department of Water & Power | | | | |
| Revenue | 5.000% | 7/1/31 | 15,000 | 17,754 |
| Los Angeles CA Department of Water & Power | | | | |
| Revenue | 5.000% | 7/1/31 | 10,000 | 12,204 |
| Los Angeles CA Department of Water & Power | | | | |
| Revenue | 5.000% | 7/1/31 | 7,000 | 8,204 |
| Los Angeles CA Department of Water & Power | | | | |
| Revenue | 5.000% | 7/1/32 | 7,000 | 8,245 |
| Los Angeles CA Department of Water & Power | | | | |
| Revenue | 5.000% | 7/1/32 | 3,300 | 3,891 |
| Los Angeles CA Department of Water & Power | | | | |
| Revenue | 5.000% | 7/1/32 | 6,080 | 7,182 |
| Los Angeles CA Department of Water & Power | | | | |
| Revenue | 5.000% | 7/1/32 | 7,500 | 8,833 |
| Los Angeles CA Department of Water & Power | | | | |
| Revenue | 5.000% | 7/1/32 | 14,205 | 16,732 |
86
California Intermediate-Term Tax-Exempt Fund
| | | | |
| | | | Face | Market |
| | | Maturity | Amount | Value• |
| | Coupon | Date | ($000) | ($000) |
| Los Angeles CA Department of Water & Power | | | | |
| Revenue | 5.000% | 7/1/32 (2) | 1,940 | 1,947 |
| Los Angeles CA Department of Water & Power | | | | |
| Revenue | 5.000% | 7/1/32 | 6,730 | 7,856 |
| Los Angeles CA Department of Water & Power | | | | |
| Revenue | 5.000% | 7/1/33 | 5,000 | 5,861 |
| Los Angeles CA Department of Water & Power | | | | |
| Revenue | 5.000% | 7/1/33 | 1,500 | 1,784 |
| Los Angeles CA Department of Water & Power | | | | |
| Revenue | 5.000% | 7/1/33 | 5,525 | 6,572 |
| Los Angeles CA Department of Water & Power | | | | |
| Revenue | 5.000% | 7/1/34 | 2,000 | 2,340 |
| Los Angeles CA Department of Water & Power | | | | |
| Revenue | 5.000% | 7/1/34 | 5,305 | 6,217 |
| Los Angeles CA Department of Water & Power | | | | |
| Revenue | 5.000% | 7/1/34 | 12,005 | 14,044 |
| Los Angeles CA Department of Water & Power | | | | |
| Revenue | 5.000% | 7/1/34 | 7,500 | 8,760 |
| Los Angeles CA Department of Water & Power | | | | |
| Revenue | 5.000% | 7/1/34 | 4,500 | 5,330 |
| Los Angeles CA Department of Water & Power | | | | |
| Revenue | 5.000% | 7/1/35 | 1,500 | 1,770 |
| Los Angeles CA Department of Water & Power | | | | |
| Revenue | 5.000% | 7/1/35 | 2,250 | 2,655 |
| Los Angeles CA Department of Water & Power | | | | |
| Revenue | 5.000% | 7/1/36 | 4,000 | 4,780 |
| Los Angeles CA Department of Water & Power | | | | |
| Revenue | 5.000% | 7/1/36 | 1,050 | 1,236 |
| Los Angeles CA Department of Water & Power | | | | |
| Revenue | 5.000% | 7/1/37 | 5,000 | 5,951 |
| Los Angeles CA Department of Water & Power | | | | |
| Revenue VRDO | 0.660% | 6/1/17 | 7,300 | 7,300 |
| Los Angeles CA Department of Water & Power | | | | |
| Revenue VRDO | 0.780% | 6/1/17 | 9,300 | 9,300 |
| Los Angeles CA GO | 5.000% | 9/1/21 (Prere.) | 5,850 | 6,815 |
| Los Angeles CA GO | 5.000% | 9/1/21 (Prere.) | 5,850 | 6,815 |
| Los Angeles CA GO | 5.000% | 9/1/22 | 10,010 | 11,658 |
| Los Angeles CA Harbor Department Revenue | 5.000% | 8/1/20 | 500 | 563 |
| Los Angeles CA Harbor Department Revenue | 5.000% | 8/1/21 | 750 | 870 |
| Los Angeles CA Harbor Department Revenue | 5.000% | 8/1/25 | 3,795 | 4,373 |
| Los Angeles CA Harbor Department Revenue | 5.000% | 8/1/30 | 4,000 | 4,878 |
| Los Angeles CA Harbor Department Revenue | 5.000% | 8/1/31 | 2,400 | 2,908 |
| Los Angeles CA Harbor Department Revenue | 5.000% | 8/1/32 | 4,300 | 5,183 |
| Los Angeles CA Harbor Department Revenue | 5.000% | 8/1/33 | 2,560 | 2,979 |
| Los Angeles CA Harbor Department Revenue | 5.000% | 8/1/33 | 3,500 | 4,197 |
| Los Angeles CA Harbor Department Revenue | 4.000% | 8/1/34 | 3,000 | 3,226 |
| Los Angeles CA Harbor Department Revenue | 4.000% | 8/1/35 | 2,660 | 2,847 |
| Los Angeles CA Harbor Department Revenue | 5.000% | 8/1/35 | 1,925 | 2,225 |
| Los Angeles CA Harbor Department Revenue | 4.000% | 8/1/36 | 2,500 | 2,664 |
| Los Angeles CA Harbor Department Revenue | 5.000% | 8/1/36 | 1,985 | 2,289 |
| Los Angeles CA Municipal Improvement Corp. | | | | |
| Lease Revenue | 5.000% | 11/1/24 | 6,275 | 7,683 |
| Los Angeles CA Municipal Improvement Corp. | | | | |
| Lease Revenue | 5.000% | 11/1/25 | 5,000 | 6,189 |
87
California Intermediate-Term Tax-Exempt Fund
| | | | |
| | | | Face | Market |
| | | Maturity | Amount | Value• |
| | Coupon | Date | ($000) | ($000) |
| Los Angeles CA Municipal Improvement Corp. | | | | |
| Lease Revenue | 5.000% | 11/1/25 | 8,000 | 9,903 |
| Los Angeles CA Municipal Improvement Corp. | | | | |
| Lease Revenue | 5.000% | 11/1/26 | 3,000 | 3,745 |
| Los Angeles CA Municipal Improvement Corp. | | | | |
| Lease Revenue | 5.000% | 11/1/27 | 4,000 | 4,938 |
| Los Angeles CA Municipal Improvement Corp. | | | | |
| Lease Revenue | 5.000% | 11/1/29 | 9,805 | 11,888 |
| Los Angeles CA Municipal Improvement Corp. | | | | |
| Lease Revenue | 4.000% | 11/1/33 | 10,400 | 11,142 |
| Los Angeles CA Municipal Improvement Corp. | | | | |
| Lease Revenue | 4.000% | 11/1/34 | 5,780 | 6,153 |
| Los Angeles CA Municipal Improvement Corp. | | | | |
| Lease Revenue | 4.000% | 11/1/35 | 15,880 | 16,866 |
| Los Angeles CA Municipal Improvement Corp. | | | | |
| Lease Revenue | 4.000% | 11/1/36 | 4,825 | 5,100 |
| Los Angeles CA Unified School District GO | 5.000% | 7/1/17 (4) | 1,000 | 1,004 |
| Los Angeles CA Unified School District GO | 5.000% | 7/1/17 (4) | 3,515 | 3,527 |
| Los Angeles CA Unified School District GO | 5.500% | 7/1/17 (3) | 2,900 | 2,912 |
| Los Angeles CA Unified School District GO | 5.000% | 7/1/19 | 4,860 | 5,272 |
| Los Angeles CA Unified School District GO | 5.000% | 7/1/19 | 12,690 | 13,767 |
| Los Angeles CA Unified School District GO | 5.000% | 7/1/19 | 8,740 | 9,482 |
| Los Angeles CA Unified School District GO | 5.000% | 7/1/19 | 53,000 | 57,498 |
| Los Angeles CA Unified School District GO | 3.000% | 7/1/20 | 16,030 | 17,011 |
| Los Angeles CA Unified School District GO | 3.000% | 7/1/20 | 13,000 | 13,796 |
| Los Angeles CA Unified School District GO | 5.000% | 7/1/20 | 15,000 | 16,827 |
| Los Angeles CA Unified School District GO | 5.000% | 7/1/20 | 28,975 | 32,504 |
| Los Angeles CA Unified School District GO | 4.000% | 7/1/21 | 10,000 | 11,155 |
| Los Angeles CA Unified School District GO | 5.000% | 7/1/21 | 12,500 | 14,441 |
| Los Angeles CA Unified School District GO | 5.000% | 7/1/21 | 9,945 | 10,787 |
| Los Angeles CA Unified School District GO | 4.000% | 7/1/22 | 18,320 | 20,789 |
| Los Angeles CA Unified School District GO | 5.000% | 7/1/23 | 3,465 | 4,191 |
| Los Angeles CA Unified School District GO | 5.000% | 7/1/23 | 5,000 | 6,048 |
| Los Angeles CA Unified School District GO | 5.000% | 7/1/24 | 10,900 | 13,405 |
| Los Angeles CA Unified School District GO | 5.000% | 7/1/24 | 4,000 | 4,611 |
| Los Angeles CA Unified School District GO | 5.000% | 7/1/24 | 13,035 | 16,031 |
| Los Angeles CA Unified School District GO | 5.000% | 7/1/25 | 17,000 | 21,206 |
| Los Angeles CA Unified School District GO | 5.000% | 7/1/25 | 6,010 | 6,923 |
| Los Angeles CA Unified School District GO | 5.000% | 7/1/25 | 1,300 | 1,594 |
| Los Angeles CA Unified School District GO | 5.250% | 7/1/25 | 1,600 | 1,742 |
| Los Angeles CA Unified School District GO | 5.000% | 7/1/26 | 9,000 | 11,348 |
| Los Angeles CA Unified School District GO | 5.000% | 7/1/26 | 5,710 | 6,185 |
| Los Angeles CA Unified School District GO | 5.000% | 7/1/26 | 2,500 | 2,875 |
| Los Angeles CA Unified School District GO | 5.000% | 7/1/27 | 1,595 | 1,727 |
| Los Angeles CA Unified School District GO | 5.000% | 7/1/27 | 8,375 | 9,791 |
| Los Angeles CA Unified School District GO | 5.000% | 1/1/28 | 8,395 | 9,792 |
| Los Angeles CA Unified School District GO | 5.000% | 7/1/28 | 2,600 | 2,987 |
| Los Angeles CA Unified School District GO | 5.000% | 7/1/28 | 12,000 | 14,446 |
| Los Angeles CA Unified School District GO | 5.250% | 7/1/28 | 5,000 | 5,635 |
| Los Angeles CA Unified School District GO | 5.000% | 7/1/29 | 2,500 | 2,870 |
| Los Angeles CA Unified School District GO | 5.000% | 7/1/29 | 17,510 | 20,963 |
| Los Angeles CA Unified School District GO | 5.000% | 7/1/30 | 3,000 | 3,434 |
| Los Angeles CA Unified School District GO | 5.000% | 7/1/30 | 1,985 | 2,395 |
| Los Angeles CA Unified School District GO | 5.000% | 7/1/31 | 3,000 | 3,427 |
88
California Intermediate-Term Tax-Exempt Fund
| | | | |
| | | | Face | Market |
| | | Maturity | Amount | Value• |
| | Coupon | Date | ($000) | ($000) |
| Los Angeles CA Unified School District GO | 5.000% | 7/1/32 | 2,700 | 3,077 |
| Los Angeles CA Unified School District GO | 5.000% | 1/1/34 | 1,385 | 1,497 |
| Los Angeles CA Unified School District GO | 5.000% | 1/1/34 | 1,580 | 1,708 |
| Los Angeles CA Wastewater System Revenue | 5.000% | 6/1/20 | 1,800 | 2,017 |
| Los Angeles CA Wastewater System Revenue | 5.000% | 6/1/21 | 2,000 | 2,310 |
| Los Angeles CA Wastewater System Revenue | 5.000% | 6/1/22 | 2,750 | 3,259 |
| Los Angeles CA Wastewater System Revenue | 5.000% | 6/1/23 | 1,250 | 1,515 |
| Los Angeles CA Wastewater System Revenue | 5.000% | 6/1/26 | 13,045 | 15,326 |
| Los Angeles CA Wastewater System Revenue | 5.000% | 6/1/29 | 10,000 | 11,696 |
| Los Angeles CA Wastewater System Revenue | 5.000% | 6/1/31 | 5,420 | 6,322 |
| Los Angeles CA Wastewater System Revenue | 5.000% | 6/1/32 | 10,880 | 12,643 |
| Los Angeles CA Wastewater System Revenue | 5.000% | 6/1/33 | 16,925 | 19,585 |
| Los Angeles CA Wastewater System Revenue | 5.000% | 6/1/33 | 1,500 | 1,787 |
| Los Angeles CA Wastewater System Revenue | 5.000% | 6/1/34 | 2,355 | 2,852 |
| Los Angeles CA Wastewater System Revenue | 5.000% | 6/1/34 | 5,000 | 5,807 |
| Los Angeles CA Wastewater System Revenue | 5.000% | 6/1/35 | 2,840 | 3,426 |
| Los Angeles CA Wastewater System Revenue | 5.000% | 6/1/35 | 2,985 | 3,601 |
| Los Angeles CA Wastewater System Revenue | 5.000% | 6/1/35 | 4,500 | 5,213 |
| Los Angeles CA Wastewater System Revenue | 5.000% | 6/1/36 | 3,000 | 3,607 |
| Los Angeles CA Wastewater System Revenue | 5.000% | 6/1/36 | 6,250 | 7,515 |
| Los Angeles CA Wastewater System Revenue | 5.000% | 6/1/37 | 7,000 | 8,382 |
| Los Angeles CA Wastewater System Revenue | 5.000% | 6/1/37 | 3,640 | 4,359 |
| Los Angeles County CA Metropolitan | | | | |
| Transportation Authority Revenue | | | | |
| (Union Station Gateway Project) | 5.000% | 7/1/25 | 1,000 | 1,251 |
| Los Angeles County CA Metropolitan | | | | |
| Transportation Authority Revenue | | | | |
| (Union Station Gateway Project) | 5.000% | 7/1/26 | 2,000 | 2,467 |
| Los Angeles County CA Metropolitan | | | | |
| Transportation Authority Sales Tax Revenue | 5.000% | 6/1/19 | 1,600 | 1,732 |
| Los Angeles County CA Metropolitan | | | | |
| Transportation Authority Sales Tax Revenue | 5.000% | 7/1/20 | 4,000 | 4,339 |
| Los Angeles County CA Metropolitan | | | | |
| Transportation Authority Sales Tax Revenue | 5.000% | 7/1/21 | 3,000 | 3,474 |
| Los Angeles County CA Metropolitan | | | | |
| Transportation Authority Sales Tax Revenue | 5.000% | 7/1/22 | 5,075 | 6,019 |
| Los Angeles County CA Metropolitan | | | | |
| Transportation Authority Sales Tax Revenue | 5.000% | 7/1/22 | 10,035 | 11,646 |
| Los Angeles County CA Metropolitan | | | | |
| Transportation Authority Sales Tax Revenue | 5.000% | 7/1/23 | 10,000 | 11,592 |
| Los Angeles County CA Metropolitan | | | | |
| Transportation Authority Sales Tax Revenue | 5.000% | 7/1/24 | 4,000 | 4,939 |
| Los Angeles County CA Metropolitan | | | | |
| Transportation Authority Sales Tax Revenue | 5.000% | 7/1/24 | 1,255 | 1,471 |
| Los Angeles County CA Metropolitan | | | | |
| Transportation Authority Sales Tax Revenue | 5.000% | 7/1/25 | 6,065 | 7,589 |
| Los Angeles County CA Metropolitan | | | | |
| Transportation Authority Sales Tax Revenue | 5.000% | 7/1/33 | 5,000 | 6,093 |
| Los Angeles County CA Metropolitan | | | | |
| Transportation Authority Sales Tax Revenue | 4.000% | 6/1/34 | 6,500 | 7,068 |
| Los Angeles County CA Metropolitan | | | | |
| Transportation Authority Sales Tax Revenue | 5.000% | 7/1/34 | 5,000 | 6,063 |
| Los Angeles County CA Metropolitan | | | | |
| Transportation Authority Sales Tax Revenue | 5.000% | 6/1/35 | 10,000 | 11,915 |
89
California Intermediate-Term Tax-Exempt Fund
| | | | |
| | | | Face | Market |
| | | Maturity | Amount | Value• |
| | Coupon | Date | ($000) | ($000) |
| Los Angeles County CA Metropolitan | | | | |
| Transportation Authority Sales Tax Revenue | 5.000% | 7/1/35 | 5,000 | 6,039 |
| Los Angeles County CA Metropolitan | | | | |
| Transportation Authority Sales Tax Revenue | 5.000% | 6/1/36 | 10,000 | 11,880 |
| Los Angeles County CA Metropolitan | | | | |
| Transportation Authority Sales Tax Revenue | 5.000% | 7/1/36 | 5,000 | 6,019 |
| Los Angeles County CA Public Works Financing | | | | |
| Authority Lease Revenue | 5.000% | 8/1/21 | 1,000 | 1,154 |
| Los Angeles County CA Public Works Financing | | | | |
| Authority Lease Revenue | 5.000% | 12/1/21 | 2,440 | 2,840 |
| Los Angeles County CA Public Works Financing | | | | |
| Authority Lease Revenue | 5.000% | 8/1/22 | 1,000 | 1,181 |
| Los Angeles County CA Public Works Financing | | | | |
| Authority Lease Revenue | 5.000% | 12/1/22 | 1,275 | 1,516 |
| Los Angeles County CA Public Works Financing | | | | |
| Authority Lease Revenue | 5.000% | 8/1/23 | 1,500 | 1,764 |
| Los Angeles County CA Public Works Financing | | | | |
| Authority Lease Revenue | 5.000% | 8/1/24 | 1,515 | 1,782 |
| Los Angeles County CA Public Works Financing | | | | |
| Authority Lease Revenue | 5.000% | 12/1/24 | 1,325 | 1,630 |
| Los Angeles County CA Public Works Financing | | | | |
| Authority Lease Revenue | 5.000% | 8/1/25 | 1,325 | 1,539 |
| Los Angeles County CA Public Works Financing | | | | |
| Authority Lease Revenue | 5.000% | 12/1/25 | 875 | 1,086 |
| Los Angeles County CA Public Works Financing | | | | |
| Authority Lease Revenue | 5.000% | 8/1/30 | 2,500 | 2,858 |
| Los Angeles County CA Public Works Financing | | | | |
| Authority Lease Revenue | 5.000% | 8/1/31 | 3,000 | 3,429 |
| Los Angeles County CA Public Works Financing | | | | |
| Authority Lease Revenue | 5.000% | 12/1/33 | 6,190 | 7,316 |
| 2 Los Angeles County CA Public Works Financing | | | | |
| Authority Lease Revenue TOB VRDO | 0.810% | 6/7/17 | 2,750 | 2,750 |
| Los Angeles County CA Public Works Financing | | | | |
| Authority Revenue (Regional Park & Open | | | | |
| Space District) | 5.250% | 10/1/17 (4) | 1,000 | 1,015 |
| Los Angeles County CA Redevelopment Authority | | | | |
| Tax Allocation Revenue (Hollywood/North | | | | |
| Hollywood Redevelopment Project) | 5.000% | 7/1/21 | 1,670 | 1,910 |
| Los Angeles County CA Redevelopment Authority | | | | |
| Tax Allocation Revenue (Hollywood/North | | | | |
| Hollywood Redevelopment Project) | 5.000% | 7/1/22 | 4,555 | 5,322 |
| Los Angeles County CA Redevelopment Authority | | | | |
| Tax Allocation Revenue (Hollywood/North | | | | |
| Hollywood Redevelopment Project) | 5.000% | 7/1/23 | 2,105 | 2,506 |
| Los Angeles County CA Redevelopment Authority | | | | |
| Tax Allocation Revenue (Hollywood/North | | | | |
| Hollywood Redevelopment Project) | 5.000% | 7/1/24 | 2,215 | 2,630 |
| Los Angeles County CA Sanitation Districts | | | | |
| Financing Authority Revenue | 5.000% | 10/1/19 | 730 | 796 |
| Los Angeles County CA Sanitation Districts | | | | |
| Financing Authority Revenue | 5.000% | 10/1/20 | 1,000 | 1,125 |
| Los Angeles County CA Sanitation Districts | | | | |
| Financing Authority Revenue | 5.000% | 10/1/29 | 1,370 | 1,637 |
90
California Intermediate-Term Tax-Exempt Fund
| | | | |
| | | | Face | Market |
| | | Maturity | Amount | Value• |
| | Coupon | Date | ($000) | ($000) |
| Los Angeles County CA Sanitation Districts | | | | |
| Financing Authority Revenue | 5.000% | 10/1/30 | 3,060 | 3,636 |
| Los Angeles County CA Sanitation Districts | | | | |
| Financing Authority Revenue | 5.000% | 10/1/31 | 4,300 | 5,086 |
| Los Angeles County CA Sanitation Districts | | | | |
| Financing Authority Revenue | 5.000% | 10/1/32 | 6,000 | 7,068 |
| Los Angeles County CA Sanitation Districts | | | | |
| Financing Authority Revenue | 5.000% | 10/1/33 | 8,350 | 9,788 |
| Los Angeles County CA Sanitation Districts | | | | |
| Financing Authority Revenue | 5.000% | 10/1/34 | 4,000 | 4,669 |
| Los Angeles County CA Sanitation Districts | | | | |
| Financing Authority Revenue | 5.000% | 10/1/35 | 3,790 | 4,412 |
| Los Angeles County CA Unified School | | | | |
| District GO | 5.000% | 7/1/21 | 12,500 | 14,441 |
| Los Angeles County CA Unified School | | | | |
| District GO | 5.000% | 7/1/28 | 15,010 | 18,621 |
| M-S-R California Energy Authority Revenue | 7.000% | 11/1/34 | 8,600 | 12,458 |
| M-S-R California Energy Authority Revenue | 7.000% | 11/1/34 | 8,765 | 12,697 |
| M-S-R California Energy Authority Revenue | 7.000% | 11/1/34 | 12,665 | 18,346 |
| Manteca CA Redevelopment Agency Tax | | | | |
| Allocation Revenue VRDO | 0.750% | 6/1/17 LOC | 6,000 | 6,000 |
| Manteca CA Unified School District GO | 5.000% | 8/1/18 | 2,215 | 2,322 |
| Manteca CA Unified School District GO | 5.000% | 8/1/19 | 2,495 | 2,714 |
| Manteca CA Unified School District GO | 5.000% | 8/1/20 | 1,000 | 1,124 |
| Manteca CA Unified School District GO | 5.000% | 8/1/21 | 1,000 | 1,157 |
| Manteca CA Unified School District GO | 5.000% | 8/1/22 | 1,000 | 1,186 |
| Manteca CA Unified School District GO | 5.000% | 8/1/23 | 1,100 | 1,332 |
| Marin CA Community College District GO | 5.000% | 8/1/23 | 550 | 667 |
| Marin CA Community College District GO | 5.000% | 8/1/24 | 445 | 549 |
| Marin CA Community College District GO | 5.000% | 8/1/25 | 550 | 689 |
| Marin CA Community College District GO | 4.000% | 8/1/32 | 1,000 | 1,096 |
| Marin CA Community College District GO | 4.000% | 8/1/34 | 1,000 | 1,080 |
| Marin CA Community College District GO | 4.000% | 8/1/36 | 665 | 712 |
| Marin CA Healthcare District GO | 5.000% | 8/1/28 | 435 | 529 |
| Marin CA Healthcare District GO | 5.000% | 8/1/30 | 500 | 600 |
| Marin CA Healthcare District GO | 5.000% | 8/1/31 | 1,000 | 1,186 |
| Marin CA Healthcare District GO | 5.000% | 8/1/32 | 1,850 | 2,193 |
| Marin CA Healthcare District GO | 5.000% | 8/1/33 | 1,350 | 1,591 |
| Marin CA Healthcare District GO | 5.000% | 8/1/34 | 1,250 | 1,464 |
| Marin CA Healthcare District GO | 4.000% | 8/1/35 | 1,750 | 1,862 |
| Marina Coast Water District California Enterprise | | | | |
| Revenue | 4.000% | 6/1/22 | 1,090 | 1,220 |
| Marysville CA Revenue (Fremont-Rideout Health | | | | |
| Group) | 5.250% | 1/1/23 | 1,780 | 1,798 |
| Marysville CA Revenue (Fremont-Rideout Health | | | | |
| Group) | 5.250% | 1/1/25 | 2,630 | 2,657 |
| Marysville CA Revenue (Fremont-Rideout Health | | | | |
| Group) | 5.250% | 1/1/28 | 1,500 | 1,516 |
| Menlo Park CA Community Development Agency | | | | |
| Successor Agency Tax Allocation Revenue | 5.000% | 10/1/19 | 445 | 484 |
| Menlo Park CA Community Development Agency | | | | |
| Successor Agency Tax Allocation Revenue | 5.000% | 10/1/20 | 400 | 448 |
| Menlo Park CA Community Development Agency | | | | |
| Successor Agency Tax Allocation Revenue | 5.000% | 10/1/21 (4) | 530 | 612 |
91
California Intermediate-Term Tax-Exempt Fund
| | | | |
| | | | Face | Market |
| | | Maturity | Amount | Value• |
| | Coupon | Date | ($000) | ($000) |
| Menlo Park CA Community Development Agency | | | | |
| Successor Agency Tax Allocation Revenue | 5.000% | 10/1/22 (4) | 500 | 589 |
| Menlo Park CA Community Development Agency | | | | |
| Successor Agency Tax Allocation Revenue | 5.000% | 10/1/26 (4) | 1,000 | 1,218 |
| Menlo Park CA Community Development Agency | | | | |
| Successor Agency Tax Allocation Revenue | 5.000% | 10/1/27 (4) | 1,250 | 1,509 |
| Menlo Park CA Community Development Agency | | | | |
| Successor Agency Tax Allocation Revenue | 5.000% | 10/1/29 (4) | 400 | 474 |
| Metropolitan Water District of Southern California | | | | |
| Revenue | 5.000% | 7/1/21 | 2,700 | 3,123 |
| Metropolitan Water District of Southern California | | | | |
| Revenue | 5.000% | 7/1/23 | 1,000 | 1,214 |
| Metropolitan Water District of Southern California | | | | |
| Revenue | 5.000% | 7/1/24 | 3,500 | 4,331 |
| Metropolitan Water District of Southern California | | | | |
| Revenue | 5.000% | 7/1/25 | 3,365 | 4,229 |
| Metropolitan Water District of Southern California | | | | |
| Revenue | 5.000% | 7/1/26 | 3,250 | 4,037 |
| Metropolitan Water District of Southern California | | | | |
| Revenue | 5.000% | 7/1/30 | 2,120 | 2,441 |
| Metropolitan Water District of Southern California | | | | |
| Revenue | 5.000% | 10/1/30 | 3,585 | 4,146 |
| Metropolitan Water District of Southern California | | | | |
| Revenue | 5.000% | 1/1/31 | 1,150 | 1,221 |
| Metropolitan Water District of Southern California | | | | |
| Revenue | 5.000% | 7/1/31 | 2,930 | 3,167 |
| Metropolitan Water District of Southern California | | | | |
| Revenue | 5.000% | 7/1/31 | 2,250 | 2,591 |
| Metropolitan Water District of Southern California | | | | |
| Revenue | 5.000% | 10/1/31 | 11,065 | 12,702 |
| Metropolitan Water District of Southern California | | | | |
| Revenue | 5.000% | 10/1/32 | 9,965 | 11,415 |
| Metropolitan Water District of Southern California | | | | |
| Revenue | 5.000% | 7/1/35 | 2,605 | 2,816 |
| Metropolitan Water District of Southern California | | | | |
| Revenue VRDO | 0.720% | 6/7/17 | 20,120 | 20,120 |
| Modesto CA Community Facilities District No. | | | | |
| 2004-1 Special Tax Revenue (Village One No. 2) | 5.000% | 9/1/29 | 1,625 | 1,846 |
| Modesto CA Community Facilities District No. | | | | |
| 2004-1 Special Tax Revenue (Village One No. 2) | 5.000% | 9/1/30 | 1,760 | 1,989 |
| Modesto CA Irrigation District COP | 5.000% | 7/1/18 (Prere.) | 3,855 | 4,031 |
| Modesto CA Irrigation District Electric Revenue | 5.000% | 10/1/18 | 5,900 | 6,227 |
| Modesto CA Irrigation District Electric Revenue | 5.000% | 7/1/21 | 1,000 | 1,151 |
| Modesto CA Irrigation District Electric Revenue | 5.000% | 7/1/22 | 1,000 | 1,176 |
| Modesto CA Irrigation District Financing Authority | | | | |
| Electric Revenue | 5.000% | 10/1/31 | 1,475 | 1,727 |
| Modesto CA Irrigation District Financing Authority | | | | |
| Electric Revenue | 5.000% | 10/1/31 | 1,840 | 2,154 |
| Morgan Hill CA Redevelopment Agency | | | | |
| Successor Agency Tax Allocation Revenue | 5.000% | 3/1/23 | 1,330 | 1,565 |
| Morgan Hill CA Redevelopment Agency | | | | |
| Successor Agency Tax Allocation Revenue | 5.000% | 9/1/23 | 2,550 | 3,011 |
| Morgan Hill CA Redevelopment Agency | | | | |
| Successor Agency Tax Allocation Revenue | 5.000% | 9/1/28 | 5,075 | 5,981 |
92
California Intermediate-Term Tax-Exempt Fund
| | | | |
| | | | Face | Market |
| | | Maturity | Amount | Value• |
| | Coupon | Date | ($000) | ($000) |
| Morgan Hill CA Redevelopment Agency | | | | |
| Successor Agency Tax Allocation Revenue | 5.000% | 9/1/29 | 5,430 | 6,363 |
| Morgan Hill CA Redevelopment Agency | | | | |
| Successor Agency Tax Allocation Revenue | 5.000% | 9/1/31 | 2,990 | 3,476 |
| Morgan Hill CA Redevelopment Agency | | | | |
| Successor Agency Tax Allocation Revenue | 5.000% | 9/1/32 | 4,315 | 5,000 |
| Morgan Hill CA Redevelopment Agency | | | | |
| Successor Agency Tax Allocation Revenue | 5.000% | 9/1/33 | 2,000 | 2,309 |
| Mount Diablo CA Unified School District GO | 5.000% | 8/1/17 | 2,000 | 2,014 |
| Mount Diablo CA Unified School District GO | 5.000% | 8/1/18 | 1,500 | 1,570 |
| Mount Diablo CA Unified School District GO | 5.000% | 8/1/19 | 650 | 707 |
| Mount Diablo CA Unified School District GO | 5.000% | 8/1/20 | 700 | 787 |
| Mount Diablo CA Unified School District GO | 5.000% | 8/1/21 | 765 | 885 |
| Mount San Antonio CA Community College | | | | |
| District GO | 0.000% | 8/1/25 | 2,000 | 1,674 |
| Mount San Antonio CA Community College | | | | |
| District GO | 0.000% | 8/1/28 | 3,000 | 2,844 |
| Mountain View-Whisman CA School District COP | 4.000% | 6/1/19 | 400 | 423 |
| Mountain View-Whisman CA School District COP | 4.000% | 6/1/20 | 500 | 542 |
| Mountain View-Whisman CA School District COP | 5.000% | 6/1/21 | 285 | 326 |
| Mountain View-Whisman CA School District COP | 5.000% | 6/1/22 | 400 | 469 |
| Mountain View-Whisman CA School District GO | 5.000% | 9/1/24 | 400 | 496 |
| Mountain View-Whisman CA School District GO | 5.000% | 9/1/25 | 610 | 768 |
| Mountain View-Whisman CA School District GO | 5.000% | 9/1/26 | 1,050 | 1,338 |
| Murrieta Valley CA Unified School District GO | 2.000% | 9/1/17 (4) | 500 | 501 |
| Murrieta Valley CA Unified School District GO | 3.000% | 9/1/18 (4) | 500 | 513 |
| Murrieta Valley CA Unified School District GO | 5.000% | 9/1/19 (4) | 575 | 626 |
| Murrieta Valley CA Unified School District GO | 5.000% | 9/1/20 (4) | 775 | 870 |
| Murrieta Valley CA Unified School District GO | 4.000% | 9/1/21 (4) | 250 | 278 |
| Murrieta Valley CA Unified School District GO | 5.000% | 9/1/21 (4) | 1,605 | 1,851 |
| Murrieta Valley CA Unified School District GO | 4.000% | 9/1/22 (4) | 320 | 360 |
| Murrieta Valley CA Unified School District GO | 4.000% | 9/1/23 (4) | 850 | 968 |
| Murrieta Valley CA Unified School District GO | 5.000% | 9/1/23 (4) | 1,450 | 1,742 |
| Murrieta Valley CA Unified School District GO | 4.000% | 9/1/24 (4) | 350 | 402 |
| Murrieta Valley CA Unified School District GO | 5.000% | 9/1/25 (4) | 700 | 856 |
| Murrieta Valley CA Unified School District GO | 5.000% | 9/1/25 (4) | 1,400 | 1,712 |
| Murrieta Valley CA Unified School District GO | 5.000% | 9/1/26 (4) | 520 | 628 |
| Murrieta Valley CA Unified School District GO | 5.000% | 9/1/26 (4) | 1,625 | 1,964 |
| Murrieta Valley CA Unified School District GO | 5.000% | 9/1/27 (4) | 465 | 557 |
| Murrieta Valley CA Unified School District GO | 5.000% | 9/1/28 (4) | 300 | 356 |
| Newport Beach CA Revenue (Hoag Memorial | | | | |
| Hospital Presbyterian) | 5.875% | 12/1/21 (Prere.) | 5,150 | 6,164 |
| Newport Mesa CA Unified School District GO | 0.000% | 8/1/29 | 4,625 | 3,270 |
| Newport Mesa CA Unified School District GO | 0.000% | 8/1/30 | 3,000 | 2,027 |
| Newport Mesa CA Unified School District GO | 0.000% | 8/1/31 | 1,500 | 969 |
| Newport Mesa CA Unified School District GO | 0.000% | 8/1/32 | 14,000 | 8,637 |
| Northern California Gas Authority No. 1 Revenue | 1.369% | 7/1/17 | 6,620 | 6,620 |
| Northern California Power Agency Capital | | | | |
| Facilities Revenue | 5.000% | 8/1/20 | 1,000 | 1,102 |
| Northern California Power Agency Revenue | | | | |
| (Hydroelectric Project) | 5.000% | 7/1/17 | 3,290 | 3,302 |
| Northern California Power Agency Revenue | | | | |
| (Hydroelectric Project) | 5.000% | 7/1/20 | 3,500 | 3,788 |
93
California Intermediate-Term Tax-Exempt Fund
| | | | |
| | | | Face | Market |
| | | Maturity | Amount | Value• |
| | Coupon | Date | ($000) | ($000) |
| Northern California Power Agency Revenue | | | | |
| (Hydroelectric Project) | 5.000% | 7/1/21 | 2,500 | 2,701 |
| Northern California Power Agency Revenue | | | | |
| (Hydroelectric Project) | 5.000% | 7/1/22 | 3,395 | 3,666 |
| Northern California Power Agency Revenue | | | | |
| (Hydroelectric Project) | 5.000% | 7/1/28 | 5,000 | 5,784 |
| Northern California Power Agency Revenue | | | | |
| (Hydroelectric Project) | 5.000% | 7/1/29 | 3,000 | 3,456 |
| Northern California Power Agency Revenue | | | | |
| (Hydroelectric Project) | 5.000% | 7/1/30 | 1,605 | 1,827 |
| Northern California Power Agency Revenue | | | | |
| (Hydroelectric Project) | 5.000% | 7/1/31 | 1,600 | 1,822 |
| Northern California Transmission Agency Revenue | 5.000% | 5/1/20 | 250 | 278 |
| Northern California Transmission Agency Revenue | 5.000% | 5/1/21 | 245 | 281 |
| Northern California Transmission Agency Revenue | 5.000% | 5/1/22 | 200 | 235 |
| Northern California Transmission Agency Revenue | 5.000% | 5/1/23 | 375 | 449 |
| Northern California Transmission Agency Revenue | 5.000% | 5/1/24 | 500 | 609 |
| Northern California Transmission Agency Revenue | 5.000% | 5/1/25 | 1,895 | 2,340 |
| Northern California Transmission Agency Revenue | 5.000% | 5/1/27 | 1,250 | 1,539 |
| Northern California Transmission Agency Revenue | 5.000% | 5/1/28 | 1,000 | 1,220 |
| Northern California Transmission Agency Revenue | 5.000% | 5/1/29 | 1,500 | 1,815 |
| Northern California Transmission Agency Revenue | 5.000% | 5/1/31 | 1,250 | 1,493 |
| Northern California Transmission Agency Revenue | 5.000% | 5/1/32 | 2,500 | 2,973 |
| Northern California Transmission Agency Revenue | 5.000% | 5/1/33 | 4,245 | 5,021 |
| Northern California Transmission Agency Revenue | 5.000% | 5/1/34 | 3,100 | 3,651 |
| Northern California Transmission Agency Revenue | 5.000% | 5/1/36 | 5,000 | 5,854 |
| Northern California Transmission Agency Revenue | 5.000% | 5/1/37 | 3,500 | 4,089 |
| Northstar Community Services District California | | | | |
| Community Facilities District No. 1 Special Tax | | | | |
| Revenue | 4.000% | 9/1/17 | 1,650 | 1,662 |
| Northstar Community Services District California | | | | |
| Community Facilities District No. 1 Special Tax | | | | |
| Revenue | 4.000% | 9/1/18 | 1,860 | 1,908 |
| Northstar Community Services District California | | | | |
| Community Facilities District No. 1 Special Tax | | | | |
| Revenue | 5.000% | 9/1/19 | 2,085 | 2,210 |
| Northstar Community Services District California | | | | |
| Community Facilities District No. 1 Special Tax | | | | |
| Revenue | 5.000% | 9/1/20 | 2,340 | 2,530 |
| Northstar Community Services District California | | | | |
| Community Facilities District No. 1 Special Tax | | | | |
| Revenue | 5.000% | 9/1/21 | 1,220 | 1,335 |
| Northstar Community Services District California | | | | |
| Community Facilities District No. 1 Special Tax | | | | |
| Revenue | 5.000% | 9/1/22 | 1,360 | 1,504 |
| Northstar Community Services District California | | | | |
| Community Facilities District No. 1 Special Tax | | | | |
| Revenue | 5.000% | 9/1/23 | 1,500 | 1,672 |
| Northstar Community Services District California | | | | |
| Community Facilities District No. 1 Special Tax | | | | |
| Revenue | 5.000% | 9/1/24 | 1,660 | 1,849 |
| 2 Nuveen California AMT-Free Quality Municipal | | | | |
| Income Fund VRDP VRDO | 0.860% | 6/7/17 LOC | 31,500 | 31,500 |
| Oakdale CA Irrigation District Water Revenue | 5.000% | 8/1/26 | 240 | 286 |
94
California Intermediate-Term Tax-Exempt Fund
| | | | |
| | | | Face | Market |
| | | Maturity | Amount | Value• |
| | Coupon | Date | ($000) | ($000) |
| Oakdale CA Irrigation District Water Revenue | 5.000% | 8/1/27 | 350 | 416 |
| Oakdale CA Irrigation District Water Revenue | 5.000% | 8/1/29 | 455 | 537 |
| Oakdale CA Irrigation District Water Revenue | 5.000% | 8/1/30 | 415 | 489 |
| Oakdale CA Irrigation District Water Revenue | 5.000% | 8/1/33 | 350 | 407 |
| Oakdale CA Irrigation District Water Revenue | 5.000% | 8/1/34 | 400 | 463 |
| Oakdale CA Irrigation District Water Revenue | 5.000% | 8/1/35 | 300 | 348 |
| Oakland CA GO | 5.000% | 1/15/23 | 5,600 | 6,705 |
| Oakland CA GO | 5.000% | 1/15/31 | 3,000 | 3,350 |
| Oakland CA Joint Powers Financing Authority | | | | |
| Lease Revenue (Administration Buildings) | 5.000% | 8/1/23 (12) | 5,000 | 5,219 |
| Oakland CA Joint Powers Financing Authority | | | | |
| Lease Revenue (Administration Buildings) | 5.000% | 8/1/24 (12) | 3,810 | 3,973 |
| Oakland CA Joint Powers Financing Authority | | | | |
| Lease Revenue (Administration Buildings) | 5.000% | 8/1/25 (12) | 5,405 | 5,630 |
| Oakland CA Joint Powers Financing Authority | | | | |
| Lease Revenue (Administration Buildings) | 5.000% | 8/1/26 (12) | 4,190 | 4,359 |
| Oakland CA Redevelopment Agency Tax | | | | |
| Allocation Revenue (Central District Project) | 5.000% | 9/1/21 | 3,000 | 3,433 |
| Oakland CA Unified School District GO | 5.000% | 8/1/17 | 2,760 | 2,780 |
| Oakland CA Unified School District GO | 5.000% | 8/1/18 | 6,145 | 6,444 |
| Oakland CA Unified School District GO | 5.000% | 8/1/19 | 6,565 | 7,143 |
| Oakland CA Unified School District GO | 5.000% | 8/1/19 (4) | 13,425 | 13,520 |
| Oakland CA Unified School District GO | 5.000% | 8/1/20 | 2,500 | 2,812 |
| Oakland CA Unified School District GO | 5.000% | 8/1/20 | 5,000 | 5,624 |
| Oakland CA Unified School District GO | 5.000% | 8/1/21 | 1,600 | 1,853 |
| Oakland CA Unified School District GO | 5.000% | 8/1/21 (4) | 3,000 | 3,474 |
| Oakland CA Unified School District GO | 6.250% | 8/1/21 (Prere.) | 2,000 | 2,418 |
| Oakland CA Unified School District GO | 5.000% | 8/1/22 | 1,300 | 1,543 |
| Oakland CA Unified School District GO | 5.000% | 8/1/22 (4) | 2,325 | 2,760 |
| Oakland CA Unified School District GO | 5.000% | 8/1/23 (14) | 3,700 | 3,726 |
| Oakland CA Unified School District GO | 5.500% | 8/1/23 | 1,000 | 1,205 |
| Oakland CA Unified School District GO | 5.000% | 8/1/24 | 1,275 | 1,570 |
| Oakland CA Unified School District GO | 5.000% | 8/1/25 (4) | 2,175 | 2,711 |
| Oakland CA Unified School District GO | 5.000% | 8/1/26 | 1,035 | 1,278 |
| Oakland CA Unified School District GO | 5.000% | 8/1/26 (4) | 1,270 | 1,572 |
| Oakland CA Unified School District GO | 5.000% | 8/1/27 | 1,295 | 1,588 |
| Oakland CA Unified School District GO | 5.000% | 8/1/27 (4) | 1,160 | 1,423 |
| Oakland CA Unified School District GO | 5.000% | 8/1/28 | 1,000 | 1,216 |
| Oakland CA Unified School District GO | 5.000% | 8/1/28 (4) | 1,230 | 1,496 |
| Oakland CA Unified School District GO | 5.000% | 8/1/29 | 1,000 | 1,208 |
| Oakland CA Unified School District GO | 5.000% | 8/1/31 | 2,350 | 2,798 |
| Oakland CA Unified School District GO | 5.000% | 8/1/32 | 1,515 | 1,796 |
| Oakland CA Unified School District GO | 5.000% | 8/1/33 | 1,245 | 1,468 |
| Oakland CA Unified School District GO | 5.000% | 8/1/34 | 2,500 | 2,929 |
| Ohlone CA Community College District GO | 5.000% | 8/1/21 (Prere.) | 1,770 | 2,051 |
| Ohlone CA Community College District GO | 5.000% | 8/1/22 | 750 | 890 |
| Ontario CA Public Financing Authority Water | | | | |
| Revenue | 5.250% | 7/1/27 | 1,285 | 1,547 |
| Ontario CA Public Financing Authority Water | | | | |
| Revenue | 5.250% | 7/1/28 | 1,765 | 2,117 |
| Ontario CA Public Financing Authority Water | | | | |
| Revenue | 5.250% | 7/1/29 | 2,280 | 2,726 |
| Ontario CA Public Financing Authority Water | | | | |
| Revenue | 5.250% | 7/1/30 | 1,400 | 1,673 |
95
California Intermediate-Term Tax-Exempt Fund
| | | | |
| | | | Face | Market |
| | | Maturity | Amount | Value• |
| | Coupon | Date | ($000) | ($000) |
| Ontario CA Public Financing Authority Water | | | | |
| Revenue | 5.250% | 7/1/31 | 2,525 | 3,000 |
| Ontario CA Public Financing Authority Water | | | | |
| Revenue | 5.250% | 7/1/32 | 2,660 | 3,153 |
| Ontario CA Public Financing Authority Water | | | | |
| Revenue | 5.250% | 7/1/33 | 2,165 | 2,557 |
| Orange County CA Development Agency Tax | | | | |
| Allocation Revenue (Santa Ana Heights Project) | 5.000% | 9/1/21 | 1,200 | 1,373 |
| Orange County CA Development Agency Tax | | | | |
| Allocation Revenue (Santa Ana Heights Project) | 5.000% | 3/1/22 | 1,230 | 1,418 |
| Orange County CA Development Agency Tax | | | | |
| Allocation Revenue (Santa Ana Heights Project) | 5.000% | 9/1/22 | 1,260 | 1,468 |
| Orange County CA Development Agency Tax | | | | |
| Allocation Revenue (Santa Ana Heights Project) | 5.000% | 3/1/23 | 1,290 | 1,516 |
| Orange County CA Development Agency Tax | | | | |
| Allocation Revenue (Santa Ana Heights Project) | 5.000% | 9/1/23 | 1,320 | 1,565 |
| Orange County CA Sanitation District Wastewater | | | | |
| Revenue | 5.000% | 2/1/30 | 9,925 | 11,954 |
| Orange County CA Transportation Authority Toll | | | | |
| Road Revenue | 5.000% | 8/15/22 | 1,000 | 1,183 |
| Orange County CA Transportation Authority Toll | | | | |
| Road Revenue | 5.000% | 8/15/27 | 2,500 | 2,958 |
| Orange County CA Transportation Authority Toll | | | | |
| Road Revenue | 5.000% | 8/15/28 | 2,545 | 2,997 |
| Orange County CA Water District COP | 5.000% | 8/15/19 (Prere.) | 6,925 | 7,544 |
| Orange County CA Water District Revenue | 5.000% | 8/15/33 | 8,000 | 9,471 |
| Palm Desert CA Redevelopment Agency Tax | | | | |
| Allocation Revenue | 5.000% | 10/1/21 (15) | 425 | 487 |
| Palm Desert CA Redevelopment Agency Tax | | | | |
| Allocation Revenue | 5.000% | 10/1/24 (15) | 1,000 | 1,201 |
| Palm Desert CA Redevelopment Agency Tax | | | | |
| Allocation Revenue | 5.000% | 10/1/25 (15) | 1,000 | 1,213 |
| Palm Desert CA Redevelopment Agency Tax | | | | |
| Allocation Revenue | 5.000% | 10/1/26 (15) | 1,100 | 1,343 |
| Palm Springs CA Unified School District GO | 5.000% | 8/1/22 | 1,565 | 1,856 |
| Palm Springs CA Unified School District GO | 5.000% | 8/1/24 | 4,270 | 5,258 |
| Palm Springs CA Unified School District GO | 5.000% | 8/1/25 | 4,775 | 5,959 |
| Palm Springs CA Unified School District GO | 5.000% | 8/1/26 | 5,800 | 7,316 |
| Palm Springs CA Unified School District GO | 5.000% | 8/1/28 | 1,000 | 1,138 |
| Palm Springs CA Unified School District GO | 5.000% | 8/1/29 | 1,500 | 1,698 |
| Palm Springs CA Unified School District GO | 5.000% | 8/1/30 | 1,500 | 1,689 |
| Palm Springs CA Unified School District GO | 5.000% | 8/1/31 | 1,500 | 1,686 |
| Palmdale CA Community Redevelopment | | | | |
| Agency Tax Allocation Revenue | 5.000% | 9/1/20 | 450 | 503 |
| Palmdale CA Community Redevelopment | | | | |
| Agency Tax Allocation Revenue | 5.000% | 9/1/21 | 350 | 402 |
| Palmdale CA Community Redevelopment | | | | |
| Agency Tax Allocation Revenue | 5.000% | 9/1/22 | 565 | 662 |
| Palmdale CA Community Redevelopment | | | | |
| Agency Tax Allocation Revenue | 5.000% | 9/1/23 | 400 | 478 |
| Palmdale CA Community Redevelopment | | | | |
| Agency Tax Allocation Revenue | 5.000% | 9/1/24 | 725 | 878 |
| Palmdale CA Community Redevelopment | | | | |
| Agency Tax Allocation Revenue | 5.000% | 9/1/25 | 475 | 579 |
96
California Intermediate-Term Tax-Exempt Fund
| | | | |
| | | | Face | Market |
| | | Maturity | Amount | Value• |
| | Coupon | Date | ($000) | ($000) |
| Palmdale CA Community Redevelopment | | | | |
| Agency Tax Allocation Revenue | 5.000% | 9/1/25 | 525 | 640 |
| Palmdale CA Community Redevelopment | | | | |
| Agency Tax Allocation Revenue | 5.000% | 9/1/26 | 555 | 685 |
| Palmdale CA Community Redevelopment | | | | |
| Agency Tax Allocation Revenue | 5.000% | 9/1/26 | 550 | 679 |
| Palmdale CA Community Redevelopment | | | | |
| Agency Tax Allocation Revenue | 5.000% | 9/1/27 | 430 | 525 |
| Palmdale CA Community Redevelopment | | | | |
| Agency Tax Allocation Revenue | 5.000% | 9/1/28 | 1,355 | 1,639 |
| Palmdale CA Community Redevelopment | | | | |
| Agency Tax Allocation Revenue | 5.000% | 9/1/29 | 1,275 | 1,529 |
| Palmdale CA Community Redevelopment | | | | |
| Agency Tax Allocation Revenue | 5.000% | 9/1/31 | 415 | 492 |
| Palmdale CA Community Redevelopment | | | | |
| Agency Tax Allocation Revenue | 5.000% | 9/1/32 | 1,435 | 1,693 |
| Palmdale CA Community Redevelopment | | | | |
| Agency Tax Allocation Revenue | 5.000% | 9/1/33 | 750 | 880 |
| Palmdale CA Community Redevelopment | | | | |
| Agency Tax Allocation Revenue | 5.000% | 9/1/34 | 500 | 584 |
| Palmdale CA Community Redevelopment | | | | |
| Agency Tax Allocation Revenue | 5.000% | 9/1/34 (14) | 2,000 | 2,335 |
| Palo Alto CA Improvement Revenue (University | | | | |
| Avenue Area Parking) | 4.000% | 9/2/19 | 1,000 | 1,052 |
| Palo Alto CA Improvement Revenue (University | | | | |
| Avenue Area Parking) | 4.000% | 9/2/20 | 250 | 267 |
| Palo Alto CA Improvement Revenue (University | | | | |
| Avenue Area Parking) | 4.000% | 9/2/21 | 400 | 433 |
| Palo Alto CA Improvement Revenue (University | | | | |
| Avenue Area Parking) | 5.000% | 9/2/27 | 1,000 | 1,115 |
| Palo Alto CA Unified School District GO | 0.000% | 8/1/24 | 15,890 | 13,817 |
| Palomar CA Community College District GO | 5.000% | 8/1/29 | 450 | 565 |
| Palomar CA Community College District GO | 5.000% | 8/1/30 | 520 | 647 |
| Palomar CA Community College District GO | 5.000% | 8/1/31 | 400 | 493 |
| Palomar CA Community College District GO | 5.000% | 8/1/32 | 300 | 368 |
| Palomar CA Community College District GO | 4.000% | 8/1/33 | 2,140 | 2,307 |
| Palomar CA Community College District GO | 5.000% | 8/1/33 | 2,750 | 3,347 |
| Palomar CA Community College District GO | 4.000% | 8/1/34 | 2,390 | 2,558 |
| Palomar CA Community College District GO | 5.000% | 8/1/34 | 4,500 | 5,446 |
| Palomar CA Community College District GO | 5.000% | 8/1/35 | 2,485 | 2,997 |
| Palomar Pomerado Health California COP | 6.625% | 11/1/19 (Prere.) | 5,000 | 5,680 |
| Palomar Pomerado Health California GO | 0.000% | 8/1/22 (14) | 7,055 | 6,392 |
| Palomar Pomerado Health California GO | 0.000% | 8/1/24 (12) | 5,130 | 4,321 |
| Palomar Pomerado Health California GO | 0.000% | 8/1/27 (12) | 3,095 | 2,253 |
| Palomar Pomerado Health California GO | 0.000% | 8/1/27 (14) | 16,165 | 11,769 |
| Palomar Pomerado Health California GO | 5.000% | 8/1/28 | 1,490 | 1,804 |
| Palomar Pomerado Health California GO | 5.000% | 8/1/28 | 7,370 | 8,921 |
| Palomar Pomerado Health California GO | 5.000% | 8/1/29 | 795 | 951 |
| Palomar Pomerado Health California GO | 5.000% | 8/1/29 | 4,000 | 4,785 |
| Palomar Pomerado Health California GO | 5.000% | 8/1/30 | 1,130 | 1,338 |
| Palomar Pomerado Health California GO | 5.000% | 8/1/31 | 775 | 910 |
| Palomar Pomerado Health California GO | 4.000% | 8/1/32 | 4,000 | 4,295 |
| Palomar Pomerado Health California GO | 5.000% | 8/1/33 | 1,200 | 1,396 |
| Palomar Pomerado Health California Revenue | 4.000% | 11/1/18 | 810 | 834 |
97
California Intermediate-Term Tax-Exempt Fund
| | | | |
| | | | Face | Market |
| | | Maturity | Amount | Value• |
| | Coupon | Date | ($000) | ($000) |
| Palomar Pomerado Health California Revenue | 4.000% | 11/1/19 | 1,250 | 1,309 |
| Palomar Pomerado Health California Revenue | 5.000% | 11/1/20 | 1,125 | 1,232 |
| Palomar Pomerado Health California Revenue | 5.000% | 11/1/21 | 1,375 | 1,531 |
| Palomar Pomerado Health California Revenue | 5.000% | 11/1/23 | 2,410 | 2,753 |
| Palomar Pomerado Health California Revenue | 5.000% | 11/1/24 | 2,390 | 2,755 |
| Palomar Pomerado Health California Revenue | 5.000% | 11/1/25 | 2,250 | 2,605 |
| Palomar Pomerado Health California Revenue | 5.000% | 11/1/26 | 1,875 | 2,177 |
| Paramount CA Redevelopment Agency Successor | | | | |
| Agency Tax Allocation Revenue (Redevelopment | | | | |
| Project Area No. 1) | 4.000% | 8/1/17 | 880 | 884 |
| Paramount CA Redevelopment Agency Successor | | | | |
| Agency Tax Allocation Revenue (Redevelopment | | | | |
| Project Area No. 1) | 5.000% | 8/1/18 | 925 | 967 |
| Paramount CA Redevelopment Agency Successor | | | | |
| Agency Tax Allocation Revenue (Redevelopment | | | | |
| Project Area No. 1) | 5.000% | 8/1/19 | 1,415 | 1,529 |
| Paramount CA Redevelopment Agency Successor | | | | |
| Agency Tax Allocation Revenue (Redevelopment | | | | |
| Project Area No. 1) | 5.000% | 8/1/20 (4) | 1,505 | 1,682 |
| Paramount CA Redevelopment Agency Successor | | | | |
| Agency Tax Allocation Revenue (Redevelopment | | | | |
| Project Area No. 1) | 5.000% | 8/1/21 (4) | 1,455 | 1,673 |
| Paramount CA Redevelopment Agency Successor | | | | |
| Agency Tax Allocation Revenue (Redevelopment | | | | |
| Project Area No. 1) | 5.000% | 8/1/22 (4) | 2,965 | 3,479 |
| Paramount CA Redevelopment Agency Successor | | | | |
| Agency Tax Allocation Revenue (Redevelopment | | | | |
| Project Area No. 1) | 5.000% | 8/1/23 (4) | 2,485 | 2,972 |
| Paramount CA Redevelopment Agency Successor | | | | |
| Agency Tax Allocation Revenue (Redevelopment | | | | |
| Project Area No. 1) | 0.000% | 8/1/26 (14) | 6,050 | 4,432 |
| Pasadena CA COP VRDO | 0.760% | 6/7/17 LOC | 7,060 | 7,060 |
| Pasadena CA Unified School District GO | 5.000% | 8/1/23 | 835 | 1,011 |
| Pasadena CA Unified School District GO | 5.000% | 8/1/24 | 1,000 | 1,231 |
| Pasadena CA Unified School District GO | 5.000% | 8/1/25 | 750 | 936 |
| Pasadena CA Unified School District GO | 5.000% | 8/1/25 | 1,000 | 1,248 |
| Pasadena CA Unified School District GO | 5.000% | 8/1/26 | 500 | 631 |
| Pasadena CA Unified School District GO | 5.000% | 8/1/26 | 1,000 | 1,261 |
| Pasadena CA Unified School District GO | 5.000% | 5/1/30 | 3,695 | 4,243 |
| Pasadena CA Unified School District GO | 5.000% | 5/1/31 | 1,500 | 1,717 |
| Pasadena CA Unified School District GO | 5.000% | 5/1/32 | 2,000 | 2,284 |
| Peralta CA Community College District Revenue | 5.000% | 8/1/23 | 1,000 | 1,211 |
| Peralta CA Community College District Revenue | 5.000% | 8/1/24 | 1,325 | 1,632 |
| Peralta CA Community College District Revenue | 5.000% | 8/1/25 | 250 | 312 |
| Peralta CA Community College District Revenue | 4.000% | 8/1/26 | 1,375 | 1,584 |
| Peralta CA Community College District Revenue | 5.000% | 8/1/27 | 815 | 1,000 |
| Peralta CA Community College District Revenue | 5.000% | 8/1/28 | 2,455 | 2,989 |
| Peralta CA Community College District Revenue | 5.000% | 8/1/29 | 2,985 | 3,610 |
| Peralta CA Community College District Revenue | 5.000% | 8/1/30 | 2,260 | 2,716 |
| Peralta CA Community College District Revenue | 5.000% | 8/1/31 | 1,490 | 1,776 |
| Peralta CA Community College District Revenue | 5.000% | 8/1/32 | 2,340 | 2,773 |
| Peralta CA Community College District Revenue | 5.000% | 8/1/34 | 2,925 | 3,427 |
98
California Intermediate-Term Tax-Exempt Fund
| | | | |
| | | | Face | Market |
| | | Maturity | Amount | Value• |
| | Coupon | Date | ($000) | ($000) |
| Pittsburg CA Redevelopment Agency Tax | | | | |
| Allocation Revenue (Los Medanos Community | | | | |
| Development Project) | 5.000% | 8/1/17 | 3,045 | 3,066 |
| Pittsburg CA Redevelopment Agency Tax | | | | |
| Allocation Revenue (Los Medanos Community | | | | |
| Development Project) | 5.000% | 8/1/19 | 3,755 | 4,063 |
| Pittsburg CA Redevelopment Agency Tax | | | | |
| Allocation Revenue (Los Medanos Community | | | | |
| Development Project) | 5.000% | 9/1/19 (4) | 6,300 | 6,828 |
| Pittsburg CA Redevelopment Agency Tax | | | | |
| Allocation Revenue (Los Medanos Community | | | | |
| Development Project) | 0.000% | 8/1/20 (2) | 2,460 | 2,328 |
| Pittsburg CA Redevelopment Agency Tax | | | | |
| Allocation Revenue (Los Medanos Community | | | | |
| Development Project) | 5.000% | 9/1/20 (4) | 5,880 | 6,555 |
| Pittsburg CA Redevelopment Agency Tax | | | | |
| Allocation Revenue (Los Medanos Community | | | | |
| Development Project) | 5.000% | 9/1/21 (4) | 2,000 | 2,289 |
| Pittsburg CA Redevelopment Agency Tax | | | | |
| Allocation Revenue (Los Medanos Community | | | | |
| Development Project) | 0.000% | 8/1/25 (2) | 2,930 | 2,348 |
| Pittsburg CA Redevelopment Agency Tax | | | | |
| Allocation Revenue (Los Medanos Community | | | | |
| Development Project) | 5.000% | 8/1/25 (4) | 855 | 1,028 |
| Pittsburg CA Redevelopment Agency Tax | | | | |
| Allocation Revenue (Los Medanos Community | | | | |
| Development Project) | 5.000% | 8/1/26 (4) | 900 | 1,075 |
| Pittsburg CA Redevelopment Agency Tax | | | | |
| Allocation Revenue (Los Medanos Community | | | | |
| Development Project) | 5.000% | 8/1/27 (4) | 1,220 | 1,444 |
| Pittsburg CA Redevelopment Agency Tax | | | | |
| Allocation Revenue (Los Medanos Community | | | | |
| Development Project) | 5.000% | 8/1/28 (4) | 1,285 | 1,511 |
| Pittsburg CA Redevelopment Agency Tax | | | | |
| Allocation Revenue (Los Medanos Community | | | | |
| Development Project) | 0.000% | 8/1/29 (2) | 355 | 232 |
| Pittsburg CA Redevelopment Agency Tax | | | | |
| Allocation Revenue (Los Medanos Community | | | | |
| Development Project) | 5.000% | 8/1/29 (4) | 1,350 | 1,576 |
| Pittsburg CA Water Revenue | 4.000% | 8/1/19 | 500 | 532 |
| Pittsburg CA Water Revenue | 4.000% | 8/1/20 | 680 | 741 |
| Pittsburg CA Water Revenue | 4.000% | 8/1/21 | 500 | 556 |
| Pittsburg CA Water Revenue | 5.000% | 8/1/22 | 250 | 297 |
| Placentia-Yorba Linda CA Unified School | | | | |
| District GO | 2.000% | 10/1/17 (4) | 250 | 251 |
| Placentia-Yorba Linda CA Unified School | | | | |
| District GO | 4.000% | 10/1/18 (4) | 300 | 312 |
| Placentia-Yorba Linda CA Unified School | | | | |
| District GO | 5.000% | 8/1/19 | 350 | 381 |
| Placentia-Yorba Linda CA Unified School | | | | |
| District GO | 5.000% | 8/1/20 | 500 | 562 |
| Placentia-Yorba Linda CA Unified School | | | | |
| District GO | 5.000% | 10/1/20 (4) | 325 | 364 |
99
California Intermediate-Term Tax-Exempt Fund
| | | | |
| | | | Face | Market |
| | | Maturity | Amount | Value• |
| | Coupon | Date | ($000) | ($000) |
| Placentia-Yorba Linda CA Unified School | | | | |
| District GO | 5.000% | 8/1/21 | 750 | 868 |
| Placentia-Yorba Linda CA Unified School | | | | |
| District GO | 5.000% | 10/1/21 (4) | 300 | 345 |
| Placentia-Yorba Linda CA Unified School | | | | |
| District GO | 5.000% | 8/1/22 | 1,315 | 1,560 |
| Placentia-Yorba Linda CA Unified School | | | | |
| District GO | 5.000% | 10/1/22 (4) | 300 | 351 |
| Placentia-Yorba Linda CA Unified School | | | | |
| District GO | 5.000% | 8/1/23 | 2,540 | 3,076 |
| Placentia-Yorba Linda CA Unified School | | | | |
| District GO | 5.000% | 10/1/23 (4) | 500 | 595 |
| Placentia-Yorba Linda CA Unified School | | | | |
| District GO | 5.000% | 8/1/24 | 1,000 | 1,231 |
| Placentia-Yorba Linda CA Unified School | | | | |
| District GO | 5.000% | 8/1/25 | 1,775 | 2,215 |
| Pomona CA Single Family Mortgage Revenue | 7.600% | 5/1/23 (ETM) | 6,435 | 7,721 |
| Pomona CA Unified School District GO | 5.000% | 8/1/22 (15) | 440 | 522 |
| Pomona CA Unified School District GO | 5.000% | 8/1/26 (15) | 450 | 542 |
| Port of Oakland CA Revenue | 5.000% | 11/1/20 (14) | 4,825 | 4,908 |
| Port of Oakland CA Revenue | 5.000% | 11/1/26 (14) | 9,800 | 9,967 |
| Poway CA Redevelopment Agency Successor | | | | |
| Agency Tax Allocation Revenue | 5.000% | 6/15/22 | 2,215 | 2,572 |
| Poway CA Redevelopment Agency Successor | | | | |
| Agency Tax Allocation Revenue | 5.000% | 12/15/22 | 3,535 | 4,144 |
| Poway CA Redevelopment Agency Successor | | | | |
| Agency Tax Allocation Revenue | 5.000% | 6/15/23 | 3,325 | 3,929 |
| Poway CA Redevelopment Agency Successor | | | | |
| Agency Tax Allocation Revenue | 5.000% | 12/15/26 | 1,370 | 1,653 |
| Poway CA Unified School District GO | 0.000% | 8/1/17 | 2,000 | 1,997 |
| Poway CA Unified School District GO | 4.000% | 9/1/17 | 250 | 252 |
| Poway CA Unified School District GO | 0.000% | 8/1/18 | 4,565 | 4,506 |
| Poway CA Unified School District GO | 4.000% | 9/1/18 | 450 | 464 |
| Poway CA Unified School District GO | 0.000% | 8/1/19 | 5,425 | 5,273 |
| Poway CA Unified School District GO | 5.000% | 9/1/19 | 980 | 1,054 |
| Poway CA Unified School District GO | 0.000% | 8/1/20 | 3,280 | 3,136 |
| Poway CA Unified School District GO | 5.000% | 9/1/20 | 610 | 673 |
| Poway CA Unified School District GO | 5.000% | 9/1/21 | 320 | 361 |
| Poway CA Unified School District GO | 5.000% | 9/1/22 | 455 | 523 |
| Poway CA Unified School District GO | 5.000% | 9/1/23 | 1,565 | 1,789 |
| Poway CA Unified School District GO | 5.000% | 8/1/26 | 5,125 | 5,901 |
| Poway CA Unified School District GO | 5.000% | 9/1/26 | 990 | 1,115 |
| Poway CA Unified School District GO | 5.000% | 8/1/27 | 1,625 | 1,966 |
| Poway CA Unified School District GO | 0.000% | 8/1/28 | 9,070 | 6,594 |
| Poway CA Unified School District GO | 5.000% | 9/1/29 | 1,195 | 1,331 |
| Poway CA Unified School District GO | 5.000% | 9/1/30 | 2,545 | 2,829 |
| Poway CA Unified School District GO | 0.000% | 8/1/31 | 1,095 | 685 |
| Poway CA Unified School District Public | | | | |
| Financing Authority Special Tax Revenue | 4.000% | 9/1/20 | 1,145 | 1,240 |
| Poway CA Unified School District Public | | | | |
| Financing Authority Special Tax Revenue | 4.000% | 9/1/21 | 1,000 | 1,103 |
| Poway CA Unified School District Public | | | | |
| Financing Authority Special Tax Revenue | 4.000% | 9/1/22 | 860 | 962 |
100
California Intermediate-Term Tax-Exempt Fund
| | | | |
| | | | Face | Market |
| | | Maturity | Amount | Value• |
| | Coupon | Date | ($000) | ($000) |
| Poway CA Unified School District Public | | | | |
| Financing Authority Special Tax Revenue | 5.000% | 9/1/22 (15) | 715 | 836 |
| Poway CA Unified School District Public | | | | |
| Financing Authority Special Tax Revenue | 4.000% | 9/15/22 | 435 | 479 |
| Poway CA Unified School District Public | | | | |
| Financing Authority Special Tax Revenue | 5.000% | 9/1/23 (15) | 1,180 | 1,405 |
| Poway CA Unified School District Public | | | | |
| Financing Authority Special Tax Revenue | 5.000% | 9/1/23 | 1,005 | 1,196 |
| Poway CA Unified School District Public | | | | |
| Financing Authority Special Tax Revenue | 5.000% | 9/1/24 (15) | 1,000 | 1,204 |
| Poway CA Unified School District Public | | | | |
| Financing Authority Special Tax Revenue | 5.000% | 9/1/24 | 1,530 | 1,842 |
| Poway CA Unified School District Public | | | | |
| Financing Authority Special Tax Revenue | 5.000% | 9/1/25 (15) | 775 | 942 |
| Poway CA Unified School District Public | | | | |
| Financing Authority Special Tax Revenue | 5.000% | 9/1/25 | 1,645 | 2,000 |
| Poway CA Unified School District Public | | | | |
| Financing Authority Special Tax Revenue | 5.000% | 9/1/26 (15) | 1,000 | 1,202 |
| Poway CA Unified School District Public | | | | |
| Financing Authority Special Tax Revenue | 5.000% | 9/1/26 | 2,520 | 3,075 |
| Poway CA Unified School District Public | | | | |
| Financing Authority Special Tax Revenue | 5.000% | 9/15/26 | 930 | 1,059 |
| Poway CA Unified School District Public | | | | |
| Financing Authority Special Tax Revenue | 5.000% | 9/15/27 | 1,005 | 1,134 |
| Poway CA Unified School District Public | | | | |
| Financing Authority Special Tax Revenue | 5.000% | 9/15/29 | 1,015 | 1,131 |
| Poway CA Unified School District Public | | | | |
| Financing Authority Special Tax Revenue | 5.000% | 9/15/30 | 1,000 | 1,131 |
| Poway CA Unified School District Public | | | | |
| Financing Authority Special Tax Revenue | 5.000% | 9/15/30 | 1,255 | 1,391 |
| Poway CA Unified School District Public | | | | |
| Financing Authority Special Tax Revenue | 5.000% | 9/15/31 | 1,315 | 1,452 |
| Poway CA Unified School District Public | | | | |
| Financing Authority Special Tax Revenue | 5.000% | 9/15/32 | 990 | 1,111 |
| Poway CA Unified School District Public | | | | |
| Financing Authority Special Tax Revenue | 5.000% | 9/15/32 | 1,430 | 1,574 |
| Poway CA Unified School District Public | | | | |
| Financing Authority Special Tax Revenue | 5.000% | 9/15/33 | 1,530 | 1,676 |
| Poway CA Unified School District Public | | | | |
| Financing Authority Special Tax Revenue | 5.000% | 9/15/34 | 1,620 | 1,770 |
| Poway CA Unified School District Public | | | | |
| Financing Authority Special Tax Revenue | 5.000% | 9/15/35 | 1,720 | 1,875 |
| Rancho Cucamonga CA Redevelopment Agency | | | | |
| Successor Agency Tax Allocation Revenue | | | | |
| (Rancho Redevelopment Project) | 5.000% | 9/1/27 (4) | 1,700 | 2,007 |
| Rancho Cucamonga CA Redevelopment Agency | | | | |
| Successor Agency Tax Allocation Revenue | | | | |
| (Rancho Redevelopment Project) | 5.000% | 9/1/28 (4) | 2,700 | 3,163 |
| Rancho Cucamonga CA Redevelopment Agency | | | | |
| Successor Agency Tax Allocation Revenue | | | | |
| (Rancho Redevelopment Project) | 5.000% | 9/1/30 (4) | 1,500 | 1,737 |
| Rancho Cucamonga CA Redevelopment Agency | | | | |
| Successor Agency Tax Allocation Revenue | | | | |
| (Rancho Redevelopment Project) | 5.000% | 9/1/31 (4) | 1,400 | 1,614 |
101
California Intermediate-Term Tax-Exempt Fund
| | | | | |
| | | | | Face | Market |
| | | | Maturity | Amount | Value• |
| | | Coupon | Date | ($000) | ($000) |
| | Rancho Cucamonga CA Redevelopment Agency | | | | |
| | Successor Agency Tax Allocation Revenue | | | | |
| | (Rancho Redevelopment Project) | 5.000% | 9/1/32 (4) | 1,710 | 1,964 |
| | Rancho Mirage CA Joint Powers Financing | | | | |
| | Authority Revenue (Eisenhower Medical Center) | 5.000% | 7/1/27 | 12,500 | 12,533 |
| | Rancho Santiago CA Community College | | | | |
| | District GO | 5.125% | 9/1/29 (4) | 5,000 | 6,453 |
| | Redding CA Electric System Revenue | 5.000% | 6/1/21 | 400 | 457 |
| | Redding CA Electric System Revenue | 5.000% | 6/1/22 | 395 | 462 |
| | Redding CA Electric System Revenue | 5.000% | 6/1/23 | 500 | 597 |
| | Redding CA Electric System Revenue | 5.000% | 6/1/24 | 1,000 | 1,211 |
| | Redding CA Electric System Revenue | 5.000% | 6/1/25 | 830 | 1,017 |
| | Redding CA Electric System Revenue | 5.000% | 6/1/26 | 1,000 | 1,236 |
| | Redding CA Electric System Revenue | 5.000% | 6/1/27 | 1,350 | 1,686 |
| | Redding CA Electric System Revenue | 5.000% | 6/1/28 | 1,275 | 1,578 |
| | Redding CA Electric System Revenue | 5.000% | 6/1/29 | 1,495 | 1,831 |
| | Redding CA Joint Powers Financing Authority | | | | |
| | Electric System Revenue | 4.000% | 6/1/23 | 325 | 364 |
| | Redding CA Joint Powers Financing Authority | | | | |
| | Electric System Revenue | 5.000% | 6/1/24 | 300 | 358 |
| | Redding CA Joint Powers Financing Authority | | | | |
| | Electric System Revenue | 5.000% | 6/1/25 | 375 | 453 |
| | Redding CA Joint Powers Financing Authority | | | | |
| | Electric System Revenue | 5.000% | 6/1/26 | 675 | 817 |
| | Redding CA Joint Powers Financing Authority | | | | |
| | Electric System Revenue | 5.000% | 6/1/27 | 1,000 | 1,199 |
| | Redding CA Joint Powers Financing Authority | | | | |
| | Electric System Revenue | 5.000% | 6/1/28 | 1,000 | 1,194 |
| | Redding CA Joint Powers Financing Authority | | | | |
| | Electric System Revenue | 5.000% | 6/1/30 | 775 | 911 |
| | Redding CA Joint Powers Financing Authority | | | | |
| | Electric System Revenue | 5.000% | 6/1/32 | 475 | 553 |
| | Redwood City CA Redevelopment Agency | | | | |
| | Redevelopment Project Area No. 2 Tax | | | | |
| | Allocation Revenue | 0.000% | 7/15/25 (2) | 3,350 | 2,631 |
| | Rio CA Elementary School District Community | | | | |
| | Facilities District Special Tax Revenue | 5.000% | 9/1/27 | 1,000 | 1,130 |
| | Rio CA Elementary School District Community | | | | |
| | Facilities District Special Tax Revenue | 5.000% | 9/1/28 | 1,000 | 1,125 |
| | Rio CA Elementary School District Community | | | | |
| | Facilities District Special Tax Revenue | 5.000% | 9/1/30 | 1,000 | 1,110 |
| | Rio CA Elementary School District Community | | | | |
| | Facilities District Special Tax Revenue | 5.000% | 9/1/35 | 2,300 | 2,511 |
| | Rio Hondo CA Community College District GO | 0.000% | 8/1/31 | 2,000 | 1,267 |
| | Riverside CA Community College District GO | 0.000% | 8/1/27 | 2,755 | 2,018 |
| | Riverside CA Community College District GO | 0.000% | 8/1/28 | 1,650 | 1,144 |
| | Riverside CA Community College District GO | 5.000% | 8/1/28 | 3,060 | 3,749 |
| | Riverside CA Electric Revenue | 5.000% | 10/1/24 (4) | 1,000 | 1,053 |
| | Riverside CA Electric Revenue | 5.000% | 10/1/25 (4) | 2,000 | 2,105 |
| | Riverside CA Electric Revenue | 5.000% | 10/1/26 (4) | 2,500 | 2,630 |
| | Riverside CA Electric Revenue | 5.000% | 10/1/27 (4) | 3,570 | 3,756 |
| 2 | Riverside CA Electric Revenue TOB VRDO | 0.800% | 6/7/17 | 2,500 | 2,500 |
| | Riverside CA Redevelopment Successor Agency | | | | |
| | Tax Allocation Revenue | 5.000% | 9/1/29 | 1,265 | 1,491 |
| |
| |
| |
| 102 |
California Intermediate-Term Tax-Exempt Fund
| | | | |
| | | | Face | Market |
| | | Maturity | Amount | Value• |
| | Coupon | Date | ($000) | ($000) |
| Riverside CA Redevelopment Successor Agency | | | | |
| Tax Allocation Revenue | 5.000% | 9/1/31 | 1,045 | 1,219 |
| Riverside CA Redevelopment Successor Agency | | | | |
| Tax Allocation Revenue | 5.000% | 10/1/31 (4) | 2,930 | 3,395 |
| Riverside CA Redevelopment Successor Agency | | | | |
| Tax Allocation Revenue | 5.000% | 10/1/32 (4) | 3,075 | 3,549 |
| Riverside CA Redevelopment Successor Agency | | | | |
| Tax Allocation Revenue | 5.000% | 9/1/33 | 1,055 | 1,221 |
| Riverside CA Redevelopment Successor Agency | | | | |
| Tax Allocation Revenue | 5.000% | 10/1/33 (4) | 1,230 | 1,414 |
| Riverside CA Sewer Revenue | 5.000% | 8/1/20 | 1,635 | 1,834 |
| Riverside CA Sewer Revenue | 5.000% | 8/1/21 | 2,000 | 2,306 |
| Riverside CA Sewer Revenue | 5.000% | 8/1/22 | 2,160 | 2,544 |
| Riverside CA Sewer Revenue | 5.000% | 8/1/23 | 3,750 | 4,497 |
| Riverside CA Sewer Revenue | 5.000% | 8/1/24 | 2,000 | 2,437 |
| Riverside CA Unified School District Financing | | | | |
| Authority Revenue | 5.000% | 9/1/19 | 1,220 | 1,328 |
| Riverside CA Unified School District Financing | | | | |
| Authority Revenue | 5.000% | 9/1/20 | 1,280 | 1,436 |
| Riverside CA Unified School District Financing | | | | |
| Authority Revenue | 5.000% | 9/1/23 | 1,410 | 1,649 |
| Riverside CA Unified School District Financing | | | | |
| Authority Revenue | 5.000% | 9/1/25 | 1,555 | 1,784 |
| Riverside CA Unified School District Financing | | | | |
| Authority Revenue | 5.000% | 9/1/26 | 1,615 | 1,835 |
| Riverside CA Unified School District Financing | | | | |
| Authority Revenue | 5.000% | 9/1/27 | 1,710 | 1,931 |
| Riverside County CA Asset Leasing Corp. | | | | |
| Leasehold Revenue (Riverside County | | | | |
| Hospital Project) | 5.000% | 6/1/19 | 3,660 | 3,936 |
| Riverside County CA Public Financing Authority | | | | |
| Lease Revenue | 5.000% | 11/1/22 | 1,800 | 2,111 |
| Riverside County CA Public Financing Authority | | | | |
| Lease Revenue | 5.000% | 11/1/23 | 2,000 | 2,388 |
| Riverside County CA Public Financing Authority | | | | |
| Lease Revenue | 5.000% | 11/1/24 | 1,600 | 1,931 |
| Riverside County CA Public Financing Authority | | | | |
| Lease Revenue | 5.000% | 11/1/30 | 9,885 | 11,581 |
| Riverside County CA Public Financing Authority | | | | |
| Lease Revenue | 5.000% | 11/1/32 | 10,620 | 12,318 |
| Riverside County CA Public Financing Authority | | | | |
| Tax Allocation Revenue | 3.000% | 9/1/17 | 1,635 | 1,644 |
| Riverside County CA Public Financing Authority | | | | |
| Tax Allocation Revenue | 3.000% | 10/1/17 | 500 | 503 |
| Riverside County CA Public Financing Authority | | | | |
| Tax Allocation Revenue | 4.000% | 9/1/18 | 2,460 | 2,551 |
| Riverside County CA Public Financing Authority | | | | |
| Tax Allocation Revenue | 4.000% | 10/1/18 | 325 | 338 |
| Riverside County CA Public Financing Authority | | | | |
| Tax Allocation Revenue | 4.000% | 9/1/19 | 2,560 | 2,720 |
| Riverside County CA Public Financing Authority | | | | |
| Tax Allocation Revenue | 5.000% | 10/1/19 | 225 | 245 |
| Riverside County CA Public Financing Authority | | | | |
| Tax Allocation Revenue | 5.000% | 9/1/20 | 2,665 | 2,976 |
103
California Intermediate-Term Tax-Exempt Fund
| | | | |
| | | | Face | Market |
| | | Maturity | Amount | Value• |
| | Coupon | Date | ($000) | ($000) |
| Riverside County CA Public Financing Authority | | | | |
| Tax Allocation Revenue | 5.000% | 10/1/20 | 375 | 419 |
| Riverside County CA Public Financing Authority | | | | |
| Tax Allocation Revenue | 5.000% | 9/1/21 (4) | 2,550 | 2,939 |
| Riverside County CA Public Financing Authority | | | | |
| Tax Allocation Revenue | 5.000% | 10/1/21 | 250 | 286 |
| Riverside County CA Public Financing Authority | | | | |
| Tax Allocation Revenue | 5.000% | 9/1/22 (4) | 1,830 | 2,151 |
| Riverside County CA Public Financing Authority | | | | |
| Tax Allocation Revenue | 5.000% | 10/1/22 | 300 | 350 |
| Riverside County CA Public Financing Authority | | | | |
| Tax Allocation Revenue | 5.000% | 9/1/23 (4) | 2,445 | 2,928 |
| Riverside County CA Redevelopment Successor | | | | |
| Agency Tax Allocation Revenue | 4.000% | 10/1/17 (4) | 375 | 379 |
| Riverside County CA Redevelopment Successor | | | | |
| Agency Tax Allocation Revenue | 4.000% | 10/1/18 (4) | 500 | 520 |
| Riverside County CA Redevelopment Successor | | | | |
| Agency Tax Allocation Revenue | 5.000% | 10/1/19 (4) | 1,000 | 1,090 |
| Riverside County CA Redevelopment Successor | | | | |
| Agency Tax Allocation Revenue | 5.000% | 10/1/21 (4) | 1,150 | 1,328 |
| Riverside County CA Redevelopment Successor | | | | |
| Agency Tax Allocation Revenue | 5.000% | 10/1/22 (4) | 1,320 | 1,554 |
| Riverside County CA Redevelopment Successor | | | | |
| Agency Tax Allocation Revenue | 5.000% | 10/1/23 (4) | 1,905 | 2,285 |
| Riverside County CA Redevelopment Successor | | | | |
| Agency Tax Allocation Revenue | 5.000% | 10/1/24 (4) | 2,005 | 2,425 |
| Riverside County CA Redevelopment Successor | | | | |
| Agency Tax Allocation Revenue | 5.000% | 10/1/25 (4) | 1,440 | 1,751 |
| Riverside County CA Redevelopment Successor | | | | |
| Agency Tax Allocation Revenue | 5.000% | 10/1/27 (4) | 1,160 | 1,392 |
| Riverside County CA Transportation Commission | | | | |
| Sales Tax Revenue | 5.250% | 6/1/30 | 3,000 | 3,570 |
| Riverside County CA Transportation Commission | | | | |
| Sales Tax Revenue | 5.250% | 6/1/31 | 4,000 | 4,742 |
| Riverside County CA Transportation Commission | | | | |
| Sales Tax Revenue | 5.250% | 6/1/32 | 3,000 | 3,547 |
| Riverside County CA Transportation Commission | | | | |
| Sales Tax Revenue | 5.250% | 6/1/33 | 2,000 | 2,356 |
| Riverside County CA Transportation Commission | | | | |
| Toll Revenue | 0.000% | 6/1/22 | 2,500 | 2,114 |
| Riverside County CA Transportation Commission | | | | |
| Toll Revenue | 0.000% | 6/1/23 | 3,630 | 2,944 |
| Riverside County CA Transportation Commission | | | | |
| Toll Revenue | 0.000% | 6/1/24 | 6,985 | 5,415 |
| Riverside County CA Transportation Commission | | | | |
| Toll Revenue | 0.000% | 6/1/31 | 5,000 | 2,719 |
| Riverside County CA Transportation Commission | | | | |
| Toll Revenue | 0.000% | 6/1/32 | 4,000 | 2,069 |
| Riverside County CA Transportation Commission | | | | |
| Toll Revenue | 0.000% | 6/1/33 | 5,500 | 2,698 |
| Riverside County CA Transportation Commission | | | | |
| Toll Revenue | 0.000% | 6/1/34 | 3,500 | 1,630 |
| Rocklin CA Unified School District GO | 0.000% | 8/1/23 (14) | 7,030 | 6,258 |
| Rocklin CA Unified School District GO | 0.000% | 8/1/24 (14) | 2,965 | 2,556 |
104
California Intermediate-Term Tax-Exempt Fund
| | | | |
| | | | Face | Market |
| | | Maturity | Amount | Value• |
| | Coupon | Date | ($000) | ($000) |
| Roseville CA Financing Authority Electric System | | | | |
| Revenue | 5.000% | 2/1/20 (Prere.) | 6,120 | 6,762 |
| Roseville CA Financing Authority Electric System | | | | |
| Revenue | 5.000% | 2/1/29 | 330 | 407 |
| Roseville CA Financing Authority Electric System | | | | |
| Revenue | 5.000% | 2/1/30 | 200 | 246 |
| Roseville CA Financing Authority Electric System | | | | |
| Revenue | 5.000% | 2/1/30 | 750 | 892 |
| Roseville CA Financing Authority Electric System | | | | |
| Revenue | 5.000% | 2/1/31 | 515 | 609 |
| Roseville CA Financing Authority Electric System | | | | |
| Revenue | 5.000% | 2/1/32 | 250 | 302 |
| Roseville CA Financing Authority Electric System | | | | |
| Revenue | 5.000% | 2/1/32 | 1,290 | 1,523 |
| Roseville CA Financing Authority Electric System | | | | |
| Revenue | 5.000% | 2/1/33 | 350 | 419 |
| Roseville CA Financing Authority Electric System | | | | |
| Revenue | 5.000% | 2/1/33 | 1,000 | 1,175 |
| Roseville CA Financing Authority Electric System | | | | |
| Revenue | 5.000% | 2/1/34 | 250 | 298 |
| Roseville CA Financing Authority Electric System | | | | |
| Revenue | 5.000% | 2/1/34 | 2,000 | 2,349 |
| Roseville CA Financing Authority Electric System | | | | |
| Revenue | 4.000% | 2/1/36 | 4,500 | 4,809 |
| Roseville CA Natural Gas Financing Authority Gas | | | | |
| Revenue | 5.000% | 2/15/18 | 4,205 | 4,304 |
| Roseville CA Natural Gas Financing Authority Gas | | | | |
| Revenue | 5.000% | 2/15/19 | 10,000 | 10,523 |
| Roseville CA Natural Gas Financing Authority Gas | | | | |
| Revenue | 5.000% | 2/15/20 | 2,160 | 2,326 |
| Roseville CA Natural Gas Financing Authority Gas | | | | |
| Revenue | 5.000% | 2/15/24 | 600 | 686 |
| Roseville CA Natural Gas Financing Authority Gas | | | | |
| Revenue | 5.000% | 2/15/27 | 200 | 233 |
| Roseville CA Special Tax Revenue | 5.000% | 9/1/20 | 1,055 | 1,160 |
| Roseville CA Special Tax Revenue | 5.000% | 9/1/21 | 500 | 562 |
| Sacramento CA Area Flood Control Agency | | | | |
| Special Assessment Revenue (Natomas | | | | |
| Basin Local Assessment) | 5.000% | 10/1/22 (15) | 445 | 524 |
| Sacramento CA Area Flood Control Agency | | | | |
| Special Assessment Revenue (Natomas | | | | |
| Basin Local Assessment) | 5.000% | 10/1/24 (15) | 300 | 365 |
| Sacramento CA Area Flood Control Agency | | | | |
| Special Assessment Revenue (Natomas | | | | |
| Basin Local Assessment) | 5.000% | 10/1/26 (15) | 280 | 337 |
| Sacramento CA Area Flood Control Agency | | | | |
| Special Assessment Revenue (Natomas | | | | |
| Basin Local Assessment) | 5.000% | 10/1/27 (15) | 425 | 508 |
| Sacramento CA Area Flood Control Agency | | | | |
| Special Assessment Revenue (Natomas | | | | |
| Basin Local Assessment) | 5.000% | 10/1/28 (15) | 250 | 297 |
| Sacramento CA Area Flood Control Agency | | | | |
| Special Assessment Revenue (Natomas | | | | |
| Basin Local Assessment) | 5.000% | 10/1/29 (15) | 500 | 589 |
105
California Intermediate-Term Tax-Exempt Fund
| | | | |
| | | | Face | Market |
| | | Maturity | Amount | Value• |
| | Coupon | Date | ($000) | ($000) |
| Sacramento CA Area Flood Control Agency | | | | |
| Special Assessment Revenue (Natomas | | | | |
| Basin Local Assessment) | 5.000% | 10/1/31 (15) | 1,160 | 1,354 |
| Sacramento CA Area Flood Control Agency | | | | |
| Special Assessment Revenue (Natomas | | | | |
| Basin Local Assessment) | 5.000% | 10/1/33 (15) | 1,280 | 1,481 |
| Sacramento CA Area Flood Control Agency | | | | |
| Special Assessment Revenue (Natomas | | | | |
| Basin Local Assessment) | 5.000% | 10/1/34 (15) | 1,340 | 1,545 |
| Sacramento CA City Financing Authority Revenue | 5.000% | 12/1/19 | 3,990 | 4,377 |
| Sacramento CA City Financing Authority Revenue | 4.000% | 12/1/20 | 3,700 | 4,056 |
| Sacramento CA City Financing Authority Revenue | 5.000% | 12/1/20 | 2,000 | 2,261 |
| Sacramento CA City Financing Authority Revenue | 5.000% | 12/1/32 (15) | 1,200 | 1,406 |
| Sacramento CA City Financing Authority Revenue | 5.000% | 12/1/33 (15) | 1,725 | 2,012 |
| Sacramento CA City Financing Authority Tax | | | | |
| Allocation Revenue | 0.000% | 12/1/25 (14) | 5,000 | 4,092 |
| Sacramento CA City Financing Authority Tax | | | | |
| Allocation Revenue | 0.000% | 12/1/27 (14) | 15,815 | 11,661 |
| Sacramento CA City Financing Authority Tax | | | | |
| Allocation Revenue | 0.000% | 12/1/31 (14) | 5,000 | 2,938 |
| Sacramento CA City Financing Authority Tax | | | | |
| Allocation Revenue | 0.000% | 12/1/34 (14) | 3,990 | 1,988 |
| Sacramento CA City Unified School District GO | 5.000% | 7/1/20 (4) | 500 | 560 |
| Sacramento CA City Unified School District GO | 5.000% | 7/1/21 (4) | 400 | 461 |
| Sacramento CA City Unified School District GO | 5.000% | 7/1/22 (4) | 700 | 826 |
| Sacramento CA Cogeneration Authority Revenue | 5.000% | 7/1/17 | 1,250 | 1,255 |
| Sacramento CA Cogeneration Authority Revenue | 5.000% | 7/1/18 | 725 | 758 |
| Sacramento CA Cogeneration Authority Revenue | 5.000% | 7/1/19 | 1,155 | 1,251 |
| Sacramento CA Cogeneration Authority Revenue | 5.250% | 7/1/20 | 1,250 | 1,405 |
| Sacramento CA Cogeneration Authority Revenue | 5.250% | 7/1/21 | 1,000 | 1,158 |
| Sacramento CA Financing Authority Lease | | | | |
| Revenue | 4.000% | 12/1/18 | 3,660 | 3,829 |
| Sacramento CA Financing Authority Lease | | | | |
| Revenue | 5.000% | 12/1/18 | 2,000 | 2,122 |
| Sacramento CA Municipal Utility District | | | | |
| Financing Authority Revenue | 5.000% | 7/1/20 | 1,405 | 1,576 |
| Sacramento CA Municipal Utility District Revenue | 5.000% | 8/15/18 (Prere.) | 2,920 | 3,069 |
| Sacramento CA Municipal Utility District Revenue | 5.000% | 8/15/18 (Prere.) | 5,895 | 6,196 |
| Sacramento CA Municipal Utility District Revenue | 5.250% | 7/1/24 (2) | 10,085 | 12,114 |
| Sacramento CA Municipal Utility District Revenue | 5.000% | 8/15/24 | 1,325 | 1,633 |
| Sacramento CA Municipal Utility District Revenue | 5.000% | 8/15/24 (4) | 4,630 | 4,862 |
| Sacramento CA Municipal Utility District Revenue | 5.000% | 8/15/25 | 2,450 | 3,062 |
| Sacramento CA Municipal Utility District Revenue | 5.000% | 8/15/25 (4) | 9,380 | 9,848 |
| Sacramento CA Municipal Utility District Revenue | 5.000% | 8/15/25 | 5,455 | 6,409 |
| Sacramento CA Municipal Utility District Revenue | 5.000% | 8/15/26 | 2,400 | 3,031 |
| Sacramento CA Municipal Utility District Revenue | 5.000% | 8/15/26 (4) | 3,070 | 3,222 |
| Sacramento CA Municipal Utility District Revenue | 5.000% | 8/15/27 | 4,905 | 5,835 |
| Sacramento CA Municipal Utility District Revenue | 5.000% | 8/15/28 | 2,000 | 2,366 |
| Sacramento CA Municipal Utility District Revenue | 5.000% | 8/15/30 | 6,435 | 7,395 |
| Sacramento CA Regional Transportation District | | | | |
| Farebox Revenue | 5.000% | 9/1/20 (Prere.) | 405 | 456 |
| Sacramento CA Regional Transportation District | | | | |
| Farebox Revenue | 5.000% | 9/1/20 (Prere.) | 925 | 1,041 |
106
California Intermediate-Term Tax-Exempt Fund
| | | | |
| | | | Face | Market |
| | | Maturity | Amount | Value• |
| | Coupon | Date | ($000) | ($000) |
| Sacramento CA Regional Transportation District | | | | |
| Farebox Revenue | 5.000% | 9/1/20 (Prere.) | 975 | 1,097 |
| Sacramento CA Regional Transportation District | | | | |
| Farebox Revenue | 5.000% | 9/1/20 (Prere.) | 1,100 | 1,238 |
| Sacramento CA Regional Transportation District | | | | |
| Farebox Revenue | 5.000% | 9/1/20 (Prere.) | 1,155 | 1,300 |
| Sacramento CA Regional Transportation District | | | | |
| Farebox Revenue | 5.000% | 3/1/22 | 680 | 757 |
| Sacramento CA Regional Transportation District | | | | |
| Farebox Revenue | 5.000% | 3/1/28 | 1,575 | 1,743 |
| Sacramento CA Regional Transportation District | | | | |
| Farebox Revenue | 5.000% | 3/1/29 | 1,660 | 1,834 |
| Sacramento CA Regional Transportation District | | | | |
| Farebox Revenue | 5.000% | 3/1/30 | 1,875 | 2,058 |
| Sacramento CA Regional Transportation District | | | | |
| Farebox Revenue | 5.000% | 3/1/31 | 1,970 | 2,163 |
| Sacramento CA Transportation Authority Sales | | | | |
| Tax Revenue | 5.000% | 10/1/21 | 2,300 | 2,667 |
| Sacramento CA Unified School District GO | 2.000% | 8/1/18 (4) | 1,545 | 1,567 |
| Sacramento CA Unified School District GO | 3.000% | 8/1/19 (4) | 1,215 | 1,269 |
| Sacramento CA Unified School District GO | 3.000% | 8/1/20 (4) | 1,000 | 1,061 |
| Sacramento CA Unified School District GO | 4.000% | 8/1/21 (4) | 1,000 | 1,115 |
| Sacramento CA Unified School District GO | 4.000% | 8/1/22 (4) | 750 | 850 |
| Sacramento CA Unified School District GO | 5.000% | 8/1/23 (4) | 1,115 | 1,346 |
| Sacramento CA Water Revenue | 5.000% | 9/1/27 | 3,210 | 3,818 |
| Sacramento County CA Airport Revenue | 5.000% | 7/1/18 (Prere.) | 265 | 277 |
| Sacramento County CA Airport Revenue | 5.000% | 7/1/18 (Prere.) | 330 | 345 |
| Sacramento County CA Airport Revenue | 5.000% | 7/1/23 (4) | 1,735 | 1,810 |
| Sacramento County CA Airport Revenue | 5.000% | 7/1/24 (4) | 2,170 | 2,263 |
| Sacramento County CA Airport Revenue | 5.000% | 7/1/24 (4) | 1,785 | 1,861 |
| Sacramento County CA Airport Revenue | 5.000% | 7/1/28 | 1,250 | 1,389 |
| Sacramento County CA Airport Revenue | 5.000% | 7/1/30 | 5,240 | 5,780 |
| Sacramento County CA Airport Revenue | 5.000% | 7/1/35 | 1,000 | 1,152 |
| Sacramento County CA Airport Revenue | 5.000% | 7/1/36 | 2,000 | 2,295 |
| Saddleback Valley CA Unified School District GO | 4.000% | 8/1/20 | 2,100 | 2,295 |
| Saddleback Valley CA Unified School District GO | 4.000% | 8/1/21 | 2,240 | 2,501 |
| Saddleback Valley CA Unified School District GO | 4.000% | 8/1/24 | 2,515 | 2,922 |
| Saddleback Valley CA Unified School District GO | 4.000% | 8/1/26 | 2,725 | 3,201 |
| San Bernardino CA City Unified School District GO | 5.000% | 8/1/18 | 2,350 | 2,457 |
| San Bernardino CA City Unified School District GO | 5.000% | 8/1/20 (4) | 765 | 856 |
| San Bernardino CA City Unified School District GO | 5.000% | 8/1/21 (4) | 1,230 | 1,416 |
| San Bernardino CA City Unified School District GO | 5.000% | 8/1/22 (4) | 1,500 | 1,765 |
| San Bernardino CA City Unified School District GO | 5.000% | 8/1/23 (4) | 1,100 | 1,320 |
| San Bernardino CA City Unified School District GO | 5.000% | 8/1/24 (4) | 1,400 | 1,673 |
| San Bernardino CA Community College | | | | |
| District GO | 0.000% | 8/1/23 (4) | 2,655 | 2,363 |
| San Bernardino CA Community College | | | | |
| District GO | 5.000% | 8/1/24 | 4,375 | 5,282 |
| San Bernardino CA Community College | | | | |
| District GO | 5.000% | 8/1/25 | 4,550 | 5,461 |
| San Bernardino CA Community College | | | | |
| District GO | 5.000% | 8/1/26 | 4,150 | 4,950 |
| San Bernardino CA Community College | | | | |
| District GO | 0.000% | 8/1/29 | 1,000 | 666 |
107
California Intermediate-Term Tax-Exempt Fund
| | | | |
| | | | Face | Market |
| | | Maturity | Amount | Value• |
| | Coupon | Date | ($000) | ($000) |
| San Bernardino CA Community College | | | | |
| District GO | 5.000% | 8/1/29 | 5,000 | 6,039 |
| San Bernardino CA Community College | | | | |
| District GO | 0.000% | 8/1/30 | 1,100 | 690 |
| San Bernardino CA Community College | | | | |
| District GO | 0.000% | 8/1/31 | 1,000 | 591 |
| San Bernardino CA Community College | | | | |
| District GO | 5.000% | 8/1/31 | 8,370 | 9,964 |
| San Bernardino CA Community College | | | | |
| District GO | 0.000% | 8/1/32 | 1,100 | 613 |
| San Bernardino CA Community College | | | | |
| District GO | 0.000% | 8/1/33 | 1,165 | 612 |
| San Bernardino County CA Medical Center COP | 5.500% | 8/1/17 (14) | 790 | 796 |
| San Bernardino County CA Medical Center COP | 6.500% | 8/1/17 (14) | 865 | 873 |
| San Bernardino County CA Medical Center COP | 5.500% | 8/1/22 (14) | 8,940 | 10,154 |
| San Bernardino County CA Transportation | | | | |
| Authority Revenue | 5.000% | 3/1/31 | 3,355 | 3,844 |
| San Diego CA Community College District GO | 5.000% | 8/1/21 (Prere.) | 8,670 | 10,054 |
| San Diego CA Community College District GO | 5.000% | 8/1/21 (Prere.) | 2,000 | 2,319 |
| San Diego CA Community College District GO | 5.000% | 8/1/21 (Prere.) | 5,000 | 5,798 |
| San Diego CA Community College District GO | 5.000% | 8/1/21 (Prere.) | 9,830 | 11,399 |
| San Diego CA Community College District GO | 5.000% | 8/1/21 (Prere.) | 3,380 | 3,920 |
| San Diego CA Community College District GO | 5.000% | 8/1/28 | 4,000 | 4,700 |
| San Diego CA Community College District GO | 5.000% | 8/1/30 | 1,250 | 1,490 |
| San Diego CA Community College District GO | 5.000% | 8/1/31 | 1,000 | 1,184 |
| San Diego CA Community College District GO | 5.000% | 8/1/32 | 2,150 | 2,535 |
| San Diego CA Community Facilities District No. 1 | | | | |
| (Miramar Ranch North) Special Tax Revenue | 4.000% | 9/1/17 | 500 | 504 |
| San Diego CA Community Facilities District No. 1 | | | | |
| (Miramar Ranch North) Special Tax Revenue | 4.000% | 9/1/18 | 3,260 | 3,378 |
| San Diego CA Community Facilities District No. 1 | | | | |
| (Miramar Ranch North) Special Tax Revenue | 5.000% | 9/1/20 | 3,465 | 3,863 |
| San Diego CA Public Facilities Financing Authority | | | | |
| Sewer Revenue | 5.000% | 5/15/19 (Prere.) | 6,000 | 6,477 |
| San Diego CA Public Facilities Financing Authority | | | | |
| Sewer Revenue | 5.000% | 5/15/19 (Prere.) | 3,000 | 3,239 |
| San Diego CA Public Facilities Financing Authority | | | | |
| Sewer Revenue | 5.000% | 5/15/19 (Prere.) | 1,825 | 1,970 |
| San Diego CA Public Facilities Financing Authority | | | | |
| Sewer Revenue | 5.250% | 5/15/19 (Prere.) | 2,000 | 2,169 |
| San Diego CA Public Facilities Financing Authority | | | | |
| Sewer Revenue | 5.000% | 5/15/20 | 9,685 | 10,833 |
| San Diego CA Public Facilities Financing Authority | | | | |
| Sewer Revenue | 5.250% | 5/15/20 (Prere.) | 5,000 | 5,618 |
| San Diego CA Public Facilities Financing Authority | | | | |
| Sewer Revenue | 5.000% | 5/15/21 | 5,750 | 6,632 |
| San Diego CA Public Facilities Financing Authority | | | | |
| Sewer Revenue | 5.000% | 5/15/23 | 10,000 | 12,115 |
| San Diego CA Public Facilities Financing Authority | | | | |
| Sewer Revenue | 5.000% | 5/15/34 | 5,000 | 5,997 |
| San Diego CA Public Facilities Financing Authority | | | | |
| Sewer Revenue | 5.000% | 5/15/35 | 5,000 | 5,980 |
| San Diego CA Public Facilities Financing Authority | | | | |
| Sewer Revenue | 5.000% | 5/15/36 | 5,000 | 5,962 |
108
California Intermediate-Term Tax-Exempt Fund
| | | | |
| | | | Face | Market |
| | | Maturity | Amount | Value• |
| | Coupon | Date | ($000) | ($000) |
| San Diego CA Public Facilities Financing Authority | | | | |
| Water Revenue | 5.000% | 8/1/19 (Prere.) | 4,215 | 4,582 |
| San Diego CA Public Facilities Financing Authority | | | | |
| Water Revenue | 5.125% | 8/1/19 (Prere.) | 5,000 | 5,449 |
| San Diego CA Public Facilities Financing Authority | | | | |
| Water Revenue | 5.250% | 8/1/20 (Prere.) | 5,355 | 6,061 |
| San Diego CA Public Facilities Financing Authority | | | | |
| Water Revenue | 5.000% | 8/1/21 | 10,000 | 11,579 |
| San Diego CA Public Facilities Financing Authority | | | | |
| Water Revenue | 5.000% | 8/1/22 | 3,200 | 3,799 |
| San Diego CA Public Facilities Financing Authority | | | | |
| Water Revenue | 5.000% | 8/1/24 | 10,010 | 12,358 |
| San Diego CA Public Facilities Financing Authority | | | | |
| Water Revenue | 5.000% | 8/1/25 | 4,080 | 5,110 |
| San Diego CA Public Facilities Financing Authority | | | | |
| Water Revenue | 5.000% | 8/1/26 | 10,680 | 13,492 |
| San Diego CA Public Facilities Financing Authority | | | | |
| Water Revenue | 5.000% | 8/1/30 | 2,000 | 2,297 |
| San Diego CA Public Facilities Financing Authority | | | | |
| Water Revenue | 5.000% | 8/1/32 | 4,190 | 4,811 |
| San Diego CA Redevelopment Agency Tax | | | | |
| Allocation | 4.000% | 9/1/18 | 2,950 | 3,068 |
| San Diego CA Redevelopment Agency Tax | | | | |
| Allocation | 5.000% | 9/1/19 | 1,000 | 1,090 |
| San Diego CA Redevelopment Agency Tax | | | | |
| Allocation | 5.000% | 9/1/20 | 1,000 | 1,126 |
| San Diego CA Redevelopment Agency Tax | | | | |
| Allocation | 5.000% | 9/1/21 | 2,000 | 2,319 |
| San Diego CA Redevelopment Agency Tax | | | | |
| Allocation | 5.000% | 9/1/22 | 1,000 | 1,191 |
| San Diego CA Redevelopment Agency Tax | | | | |
| Allocation | 5.000% | 9/1/23 | 1,000 | 1,214 |
| San Diego CA Unified School District GO | 0.000% | 7/1/18 (14) | 9,500 | 9,389 |
| San Diego CA Unified School District GO | 5.500% | 7/1/20 (4) | 9,490 | 10,796 |
| San Diego CA Unified School District GO | 5.000% | 7/1/21 | 15,000 | 17,349 |
| San Diego CA Unified School District GO | 5.000% | 7/1/22 | 1,500 | 1,780 |
| San Diego CA Unified School District GO | 5.500% | 7/1/22 (4) | 12,790 | 15,484 |
| San Diego CA Unified School District GO | 4.000% | 7/1/24 | 4,000 | 4,652 |
| San Diego CA Unified School District GO | 5.000% | 7/1/24 | 1,735 | 2,142 |
| San Diego CA Unified School District GO | 4.000% | 7/1/25 | 2,500 | 2,935 |
| San Diego CA Unified School District GO | 5.000% | 7/1/25 | 1,695 | 2,120 |
| San Diego CA Unified School District GO | 5.500% | 7/1/25 (14) | 1,000 | 1,291 |
| San Diego CA Unified School District GO | 0.000% | 7/1/26 | 8,425 | 6,699 |
| San Diego CA Unified School District GO | 5.000% | 7/1/26 | 20,040 | 24,768 |
| San Diego CA Unified School District GO | 5.500% | 7/1/26 (4) | 7,490 | 9,672 |
| San Diego CA Unified School District GO | 5.500% | 7/1/26 (4) | 20,885 | 26,969 |
| San Diego CA Unified School District GO | 0.000% | 7/1/27 | 8,500 | 6,460 |
| San Diego CA Unified School District GO | 0.000% | 7/1/28 | 8,000 | 5,814 |
| San Diego CA Unified School District GO | 5.000% | 7/1/28 | 6,535 | 7,948 |
| San Diego CA Unified School District GO | 5.000% | 7/1/28 | 700 | 851 |
| San Diego CA Unified School District GO | 0.000% | 7/1/29 | 3,250 | 2,245 |
| San Diego CA Unified School District GO | 5.000% | 7/1/29 | 3,230 | 3,968 |
| San Diego CA Unified School District GO | 5.000% | 7/1/29 | 750 | 906 |
| San Diego CA Unified School District GO | 0.000% | 7/1/30 | 9,985 | 6,600 |
109
California Intermediate-Term Tax-Exempt Fund
| | | | |
| | | | Face | Market |
| | | Maturity | Amount | Value• |
| | Coupon | Date | ($000) | ($000) |
| San Diego CA Unified School District GO | 0.000% | 7/1/30 | 2,500 | 1,652 |
| San Diego CA Unified School District GO | 5.000% | 7/1/31 | 1,200 | 1,428 |
| San Diego CA Unified School District GO | 4.000% | 7/1/32 | 1,000 | 1,091 |
| San Diego CA Unified School District GO | 4.000% | 7/1/33 | 2,000 | 2,166 |
| San Diego CA Unified School District GO | 4.000% | 7/1/34 | 3,000 | 3,225 |
| San Diego CA Unified School District GO | 4.000% | 7/1/35 | 3,500 | 3,755 |
| San Diego County CA COP | 5.000% | 10/15/24 | 2,115 | 2,620 |
| San Diego County CA COP | 5.000% | 10/15/25 | 5,225 | 6,405 |
| San Diego County CA COP | 5.000% | 10/15/26 | 2,590 | 3,174 |
| San Diego County CA COP | 5.000% | 10/15/27 | 2,000 | 2,438 |
| San Diego County CA COP | 5.000% | 10/15/28 | 1,400 | 1,698 |
| San Diego County CA COP | 5.000% | 10/15/29 | 2,000 | 2,416 |
| San Diego County CA Limited Obligation | | | | |
| Revenue (Sanford Burnham Prebys Medical | | | | |
| Discovery Institute) | 4.000% | 11/1/17 | 510 | 516 |
| San Diego County CA Limited Obligation | | | | |
| Revenue (Sanford Burnham Prebys Medical | | | | |
| Discovery Institute) | 5.000% | 11/1/18 | 460 | 485 |
| San Diego County CA Limited Obligation | | | | |
| Revenue (Sanford Burnham Prebys Medical | | | | |
| Discovery Institute) | 5.000% | 11/1/19 | 480 | 522 |
| San Diego County CA Limited Obligation | | | | |
| Revenue (Sanford Burnham Prebys Medical | | | | |
| Discovery Institute) | 5.000% | 11/1/22 | 425 | 495 |
| San Diego County CA Limited Obligation | | | | |
| Revenue (Sanford Burnham Prebys Medical | | | | |
| Discovery Institute) | 4.000% | 11/1/23 | 1,665 | 1,866 |
| San Diego County CA Limited Obligation | | | | |
| Revenue (Sanford Burnham Prebys Medical | | | | |
| Discovery Institute) | 5.000% | 11/1/24 | 750 | 895 |
| San Diego County CA Limited Obligation | | | | |
| Revenue (Sanford Burnham Prebys Medical | | | | |
| Discovery Institute) | 5.000% | 11/1/26 | 1,145 | 1,358 |
| San Diego County CA Limited Obligation | | | | |
| Revenue (Sanford Burnham Prebys Medical | | | | |
| Discovery Institute) | 5.000% | 11/1/28 | 1,450 | 1,686 |
| San Diego County CA Limited Obligation | | | | |
| Revenue (Sanford Burnham Prebys Medical | | | | |
| Discovery Institute) | 5.000% | 11/1/30 | 1,205 | 1,379 |
| San Diego County CA Regional Airport Authority | | | | |
| Revenue | 5.000% | 7/1/23 | 3,900 | 4,350 |
| San Diego County CA Regional Airport Authority | | | | |
| Revenue | 5.000% | 7/1/25 | 9,000 | 10,015 |
| San Diego County CA Regional Airport Authority | | | | |
| Revenue | 5.000% | 7/1/26 | 6,000 | 6,669 |
| San Diego County CA Regional Airport Authority | | | | |
| Revenue | 5.000% | 7/1/28 | 3,000 | 3,326 |
| San Diego County CA Regional Building Authority | | | | |
| Lease Revenue (County Operations Center & | | | | |
| Annex Redevelopment Project) | 5.000% | 2/1/19 (Prere.) | 4,285 | 4,576 |
| San Diego County CA Regional Building Authority | | | | |
| Lease Revenue (County Operations Center & | | | | |
| Annex Redevelopment Project) | 5.000% | 2/1/19 (Prere.) | 4,820 | 5,148 |
110
California Intermediate-Term Tax-Exempt Fund
| | | | |
| | | | Face | Market |
| | | Maturity | Amount | Value• |
| | Coupon | Date | ($000) | ($000) |
| San Diego County CA Regional Building Authority | | | | |
| Lease Revenue (County Operations Center & | | | | |
| Annex Redevelopment Project) | 5.000% | 2/1/19 (Prere.) | 2,420 | 2,585 |
| San Diego County CA Regional Building Authority | | | | |
| Lease Revenue (County Operations Center & | | | | |
| Annex Redevelopment Project) | 5.500% | 2/1/19 (Prere.) | 5,780 | 6,221 |
| San Diego County CA Water Authority Financing | | | | |
| Agency Water Revenue | 5.000% | 11/1/19 (Prere.) | 2,000 | 2,195 |
| San Diego County CA Water Authority Revenue | 3.000% | 5/1/21 | 5,000 | 5,352 |
| San Diego County CA Water Authority Revenue | 5.000% | 5/1/26 | 2,065 | 2,605 |
| San Diego County CA Water Authority Revenue | 5.000% | 5/1/30 | 5,000 | 5,665 |
| San Diego County CA Water Authority Revenue | 5.000% | 5/1/32 | 10,000 | 12,058 |
| San Diego County CA Water Authority Revenue | 5.000% | 5/1/35 | 13,795 | 16,415 |
| San Diego County CA Water Authority Revenue | | | | |
| COP | 5.250% | 5/1/21 (14) | 6,725 | 7,793 |
| San Diego County CA Water Authority Revenue | | | | |
| COP | 5.250% | 5/1/22 (14) | 7,075 | 8,427 |
| 2 San Diego County CA Water Authority Revenue | | | | |
| COP TOB VRDO | 0.800% | 6/7/17 | 6,315 | 6,315 |
| San Francisco CA Bay Area Rapid Transit District | | | | |
| GO | 5.000% | 8/1/28 | 1,685 | 2,072 |
| San Francisco CA Bay Area Rapid Transit District | | | | |
| GO | 4.000% | 8/1/34 | 6,580 | 7,163 |
| San Francisco CA Bay Area Rapid Transit District | | | | |
| Sales Tax Revenue | 5.000% | 7/1/20 | 1,040 | 1,168 |
| San Francisco CA Bay Area Rapid Transit District | | | | |
| Sales Tax Revenue | 5.000% | 7/1/23 | 9,560 | 10,712 |
| San Francisco CA Bay Area Rapid Transit District | | | | |
| Sales Tax Revenue | 5.000% | 7/1/23 | 1,070 | 1,263 |
| San Francisco CA Bay Area Rapid Transit District | | | | |
| Sales Tax Revenue | 5.000% | 7/1/27 | 5,350 | 6,578 |
| San Francisco CA Bay Area Rapid Transit District | | | | |
| Sales Tax Revenue | 5.000% | 7/1/28 | 2,500 | 3,058 |
| San Francisco CA Bay Area Rapid Transit District | | | | |
| Sales Tax Revenue | 5.000% | 7/1/29 | 2,555 | 2,997 |
| San Francisco CA Bay Area Rapid Transit District | | | | |
| Sales Tax Revenue | 5.000% | 7/1/30 | 2,800 | 3,284 |
| San Francisco CA Bay Area Rapid Transit District | | | | |
| Sales Tax Revenue | 5.000% | 7/1/31 | 2,215 | 2,661 |
| San Francisco CA Bay Area Rapid Transit District | | | | |
| Sales Tax Revenue | 5.000% | 7/1/32 | 1,625 | 1,943 |
| San Francisco CA Bay Area Rapid Transit District | | | | |
| Sales Tax Revenue | 5.000% | 7/1/33 | 1,500 | 1,785 |
| San Francisco CA City & County (Earthquake | | | | |
| Safety & Emergency Response) GO | 5.000% | 6/15/23 | 2,220 | 2,625 |
| San Francisco CA City & County (Earthquake | | | | |
| Safety & Emergency Response) GO | 5.000% | 6/15/23 | 4,070 | 4,813 |
| San Francisco CA City & County (Earthquake | | | | |
| Safety & Emergency Response) GO | 5.000% | 6/15/24 | 2,335 | 2,772 |
| San Francisco CA City & County (Earthquake | | | | |
| Safety & Emergency Response) GO | 5.000% | 6/15/24 | 4,270 | 5,069 |
| San Francisco CA City & County (Earthquake | | | | |
| Safety & Emergency Response) GO | 5.000% | 6/15/25 | 2,450 | 2,902 |
111
California Intermediate-Term Tax-Exempt Fund
| | | | |
| | | | Face | Market |
| | | Maturity | Amount | Value• |
| | Coupon | Date | ($000) | ($000) |
| San Francisco CA City & County (Earthquake | | | | |
| Safety & Emergency Response) GO | 5.000% | 6/15/25 | 4,485 | 5,313 |
| San Francisco CA City & County COP | 4.000% | 9/1/30 | 5,215 | 5,659 |
| San Francisco CA City & County COP | 4.000% | 9/1/31 | 5,100 | 5,492 |
| San Francisco CA City & County COP | 4.000% | 9/1/32 | 5,680 | 6,095 |
| San Francisco CA City & County COP | 4.000% | 9/1/35 | 5,170 | 5,472 |
| San Francisco CA City & County GO | 5.000% | 6/15/19 | 1,045 | 1,134 |
| San Francisco CA City & County GO | 5.000% | 6/15/20 | 500 | 562 |
| San Francisco CA City & County GO | 5.000% | 6/15/22 | 2,595 | 3,030 |
| San Francisco CA City & County GO | 5.000% | 6/15/23 | 4,000 | 4,670 |
| San Francisco CA City & County GO | 5.000% | 6/15/26 | 3,995 | 4,801 |
| San Francisco CA City & County GO | 5.000% | 6/15/27 | 5,785 | 6,919 |
| San Francisco CA City & County GO | 4.000% | 6/15/28 | 4,190 | 4,749 |
| San Francisco CA City & County GO | 4.000% | 6/15/29 | 4,545 | 5,109 |
| San Francisco CA City & County International | | | | |
| Airport Revenue | 5.000% | 5/1/18 (4) | 1,000 | 1,038 |
| San Francisco CA City & County International | | | | |
| Airport Revenue | 5.000% | 5/1/18 | 2,000 | 2,076 |
| San Francisco CA City & County International | | | | |
| Airport Revenue | 5.000% | 5/1/20 (Prere.) | 2,135 | 2,381 |
| San Francisco CA City & County International | | | | |
| Airport Revenue | 5.000% | 5/1/20 (Prere.) | 2,135 | 2,381 |
| San Francisco CA City & County International | | | | |
| Airport Revenue | 5.250% | 5/1/20 (14) | 5,000 | 5,589 |
| San Francisco CA City & County International | | | | |
| Airport Revenue | 5.000% | 5/1/21 | 5,000 | 5,755 |
| San Francisco CA City & County International | | | | |
| Airport Revenue | 5.000% | 5/1/21 | 1,150 | 1,324 |
| San Francisco CA City & County International | | | | |
| Airport Revenue | 5.000% | 5/1/21 | 2,865 | 3,192 |
| San Francisco CA City & County International | | | | |
| Airport Revenue | 5.000% | 5/3/21 (Prere.) | 550 | 633 |
| San Francisco CA City & County International | | | | |
| Airport Revenue | 5.000% | 5/3/21 (Prere.) | 1,150 | 1,324 |
| San Francisco CA City & County International | | | | |
| Airport Revenue | 5.000% | 5/3/21 (Prere.) | 1,200 | 1,381 |
| San Francisco CA City & County International | | | | |
| Airport Revenue | 5.000% | 5/1/22 | 6,000 | 7,085 |
| San Francisco CA City & County International | | | | |
| Airport Revenue | 5.000% | 5/1/22 | 1,500 | 1,771 |
| San Francisco CA City & County International | | | | |
| Airport Revenue | 5.000% | 5/1/22 | 2,865 | 3,187 |
| San Francisco CA City & County International | | | | |
| Airport Revenue | 5.000% | 5/1/23 | 5,000 | 6,037 |
| San Francisco CA City & County International | | | | |
| Airport Revenue | 5.000% | 5/1/23 | 3,000 | 3,622 |
| San Francisco CA City & County International | | | | |
| Airport Revenue | 4.000% | 5/1/24 | 5,750 | 6,654 |
| San Francisco CA City & County International | | | | |
| Airport Revenue | 5.000% | 5/1/24 | 1,800 | 2,207 |
| San Francisco CA City & County International | | | | |
| Airport Revenue | 5.000% | 5/1/24 | 3,000 | 3,679 |
| San Francisco CA City & County International | | | | |
| Airport Revenue | 4.000% | 5/1/25 | 3,625 | 4,227 |
112
California Intermediate-Term Tax-Exempt Fund
| | | | |
| | | | Face | Market |
| | | Maturity | Amount | Value• |
| | Coupon | Date | ($000) | ($000) |
| San Francisco CA City & County International | | | | |
| Airport Revenue | 5.000% | 5/1/25 | 2,050 | 2,553 |
| San Francisco CA City & County International | | | | |
| Airport Revenue | 5.000% | 5/1/25 | 6,000 | 7,473 |
| San Francisco CA City & County International | | | | |
| Airport Revenue | 5.000% | 5/1/26 | 1,580 | 1,982 |
| San Francisco CA City & County International | | | | |
| Airport Revenue | 5.000% | 5/1/27 | 1,930 | 2,392 |
| San Francisco CA City & County International | | | | |
| Airport Revenue | 5.000% | 5/1/28 | 7,525 | 8,777 |
| San Francisco CA City & County International | | | | |
| Airport Revenue | 5.000% | 5/1/28 | 2,175 | 2,667 |
| San Francisco CA City & County International | | | | |
| Airport Revenue | 5.000% | 5/1/28 | 2,305 | 2,639 |
| San Francisco CA City & County International | | | | |
| Airport Revenue | 4.900% | 5/1/29 | 8,625 | 9,388 |
| San Francisco CA City & County International | | | | |
| Airport Revenue | 5.000% | 5/1/29 | 1,755 | 2,131 |
| San Francisco CA City & County International | | | | |
| Airport Revenue | 5.000% | 5/1/30 | 1,000 | 1,203 |
| San Francisco CA City & County International | | | | |
| Airport Revenue | 5.000% | 5/1/30 | 4,790 | 5,359 |
| San Francisco CA City & County International | | | | |
| Airport Revenue | 5.000% | 5/1/31 | 635 | 758 |
| San Francisco CA City & County International | | | | |
| Airport Revenue | 5.000% | 5/1/31 | 5,030 | 5,628 |
| San Francisco CA City & County Public Utilities | | | | |
| Commission Wastewater Revenue | 5.000% | 10/1/26 | 5,865 | 7,263 |
| San Francisco CA City & County Public Utilities | | | | |
| Commission Wastewater Revenue | 5.000% | 10/1/26 | 1,795 | 2,223 |
| San Francisco CA City & County Public Utilities | | | | |
| Commission Wastewater Revenue | 5.000% | 10/1/27 | 1,885 | 2,314 |
| San Francisco CA City & County Public Utilities | | | | |
| Commission Wastewater Revenue | 5.000% | 10/1/30 | 13,170 | 15,173 |
| San Francisco CA City & County Public Utilities | | | | |
| Commission Wastewater Revenue | 5.000% | 10/1/34 | 9,495 | 11,231 |
| San Francisco CA City & County Public Utilities | | | | |
| Commission Wastewater Revenue | 5.000% | 10/1/35 | 9,980 | 11,764 |
| San Francisco CA City & County Public Utilities | | | | |
| Commission Wastewater Revenue | 5.000% | 10/1/36 | 10,495 | 12,302 |
| San Francisco CA City & County Public Utilities | | | | |
| Commission Water Revenue | 3.000% | 11/1/18 | 1,400 | 1,443 |
| San Francisco CA City & County Public Utilities | | | | |
| Commission Water Revenue | 5.000% | 11/1/19 | 1,000 | 1,099 |
| San Francisco CA City & County Public Utilities | | | | |
| Commission Water Revenue | 5.000% | 11/1/19 (Prere.) | 440 | 483 |
| San Francisco CA City & County Public Utilities | | | | |
| Commission Water Revenue | 5.000% | 11/1/19 (Prere.) | 2,555 | 2,802 |
| San Francisco CA City & County Public Utilities | | | | |
| Commission Water Revenue | 5.000% | 11/1/19 (Prere.) | 2,960 | 3,247 |
| San Francisco CA City & County Public Utilities | | | | |
| Commission Water Revenue | 5.000% | 11/1/19 (Prere.) | 2,705 | 2,967 |
| San Francisco CA City & County Public Utilities | | | | |
| Commission Water Revenue | 5.000% | 11/1/19 (Prere.) | 1,000 | 1,097 |
113
California Intermediate-Term Tax-Exempt Fund
| | | | |
| | | | Face | Market |
| | | Maturity | Amount | Value• |
| | Coupon | Date | ($000) | ($000) |
| San Francisco CA City & County Public Utilities | | | | |
| Commission Water Revenue | 5.000% | 11/1/19 (Prere.) | 10,000 | 10,969 |
| San Francisco CA City & County Public Utilities | | | | |
| Commission Water Revenue | 5.000% | 11/1/20 | 2,000 | 2,270 |
| San Francisco CA City & County Public Utilities | | | | |
| Commission Water Revenue | 5.000% | 11/1/21 | 1,100 | 1,285 |
| San Francisco CA City & County Public Utilities | | | | |
| Commission Water Revenue | 5.000% | 11/1/22 | 900 | 1,077 |
| San Francisco CA City & County Public Utilities | | | | |
| Commission Water Revenue | 5.000% | 11/1/23 | 4,185 | 5,115 |
| San Francisco CA City & County Public Utilities | | | | |
| Commission Water Revenue | 5.000% | 11/1/24 | 4,550 | 5,647 |
| San Francisco CA City & County Public Utilities | | | | |
| Commission Water Revenue | 5.000% | 11/1/25 | 6,000 | 7,460 |
| San Francisco CA City & County Public Utilities | | | | |
| Commission Water Revenue | 5.000% | 11/1/27 | 7,755 | 9,484 |
| San Francisco CA City & County Public Utilities | | | | |
| Commission Water Revenue | 5.000% | 11/1/27 | 1,000 | 1,191 |
| San Francisco CA City & County Public Utilities | | | | |
| Commission Water Revenue | 5.000% | 10/1/28 | 10,235 | 11,984 |
| San Francisco CA City & County Public Utilities | | | | |
| Commission Water Revenue | 5.000% | 11/1/28 | 5,355 | 6,500 |
| San Francisco CA City & County Public Utilities | | | | |
| Commission Water Revenue | 5.000% | 11/1/29 | 12,685 | 15,285 |
| San Francisco CA City & County Public Utilities | | | | |
| Commission Water Revenue | 5.000% | 11/1/29 | 6,530 | 7,589 |
| San Francisco CA City & County Public Utilities | | | | |
| Commission Water Revenue | 5.000% | 11/1/29 | 11,000 | 12,762 |
| San Francisco CA City & County Public Utilities | | | | |
| Commission Water Revenue | 4.000% | 11/1/30 | 3,660 | 4,080 |
| San Francisco CA City & County Public Utilities | | | | |
| Commission Water Revenue | 5.000% | 11/1/30 | 10,335 | 11,937 |
| San Francisco CA City & County Public Utilities | | | | |
| Commission Water Revenue | 5.000% | 10/1/31 | 14,015 | 16,147 |
| San Francisco CA City & County Public Utilities | | | | |
| Commission Water Revenue | 5.000% | 10/1/31 | 2,000 | 2,399 |
| San Francisco CA City & County Public Utilities | | | | |
| Commission Water Revenue | 5.000% | 11/1/31 | 1,000 | 1,161 |
| San Francisco CA City & County Public Utilities | | | | |
| Commission Water Revenue | 5.000% | 11/1/31 | 5,730 | 6,602 |
| San Francisco CA City & County Public Utilities | | | | |
| Commission Water Revenue | 5.000% | 10/1/32 | 3,000 | 3,581 |
| San Francisco CA City & County Public Utilities | | | | |
| Commission Water Revenue | 5.000% | 11/1/32 | 2,625 | 3,119 |
| San Francisco CA City & County Public Utilities | | | | |
| Commission Water Revenue | 5.000% | 11/1/33 | 9,000 | 10,351 |
| San Francisco CA City & County Public Utilities | | | | |
| Commission Water Revenue | 5.000% | 11/1/33 | 6,000 | 7,218 |
| San Francisco CA City & County Public Utilities | | | | |
| Commission Water Revenue | 5.000% | 11/1/34 | 5,000 | 5,738 |
| San Francisco CA City & County Public Utilities | | | | |
| Commission Water Revenue | 5.000% | 11/1/34 | 4,000 | 4,790 |
| San Francisco CA City & County Public Utilities | | | | |
| Commission Water Revenue | 5.000% | 11/1/35 | 7,000 | 8,350 |
114
California Intermediate-Term Tax-Exempt Fund
| | | | |
| | | | Face | Market |
| | | Maturity | Amount | Value• |
| | Coupon | Date | ($000) | ($000) |
| San Francisco CA City & County Redevelopment | | | | |
| Agency Community Facilities District No. 7 | | | | |
| Special Tax Revenue (Hunters Point Shipyard | | | | |
| Improvements) | 5.000% | 8/1/30 | 525 | 579 |
| San Francisco CA City & County Redevelopment | | | | |
| Agency Community Facilities District No. 7 | | | | |
| Special Tax Revenue (Hunters Point Shipyard | | | | |
| Improvements) | 5.000% | 8/1/33 | 680 | 742 |
| San Francisco CA City & County Redevelopment | | | | |
| Financing Authority Tax Allocation Revenue | | | | |
| (Mission Bays Redevelopment Project) | 5.000% | 8/1/17 | 100 | 101 |
| San Francisco CA City & County Redevelopment | | | | |
| Financing Authority Tax Allocation Revenue | | | | |
| (Mission Bays Redevelopment Project) | 5.000% | 8/1/19 | 220 | 238 |
| San Francisco CA City & County Redevelopment | | | | |
| Financing Authority Tax Allocation Revenue | | | | |
| (Mission Bays Redevelopment Project) | 5.000% | 8/1/20 | 130 | 145 |
| San Francisco CA City & County Redevelopment | | | | |
| Financing Authority Tax Allocation Revenue | | | | |
| (Mission Bays Redevelopment Project) | 5.000% | 8/1/21 | 160 | 183 |
| San Francisco CA City & County Redevelopment | | | | |
| Financing Authority Tax Allocation Revenue | | | | |
| (Mission Bays Redevelopment Project) | 5.000% | 8/1/22 | 125 | 146 |
| San Francisco CA City & County Redevelopment | | | | |
| Financing Authority Tax Allocation Revenue | | | | |
| (Mission Bays Redevelopment Project) | 5.000% | 8/1/23 | 120 | 143 |
| San Francisco CA City & County Redevelopment | | | | |
| Financing Authority Tax Allocation Revenue | | | | |
| (Mission Bays Redevelopment Project) | 5.000% | 8/1/24 | 135 | 162 |
| San Francisco CA City & County Redevelopment | | | | |
| Financing Authority Tax Allocation Revenue | | | | |
| (Mission Bays Redevelopment Project) | 5.000% | 8/1/24 | 440 | 531 |
| San Francisco CA City & County Redevelopment | | | | |
| Financing Authority Tax Allocation Revenue | | | | |
| (Mission Bays Redevelopment Project) | 5.000% | 8/1/24 | 860 | 1,038 |
| San Francisco CA City & County Redevelopment | | | | |
| Financing Authority Tax Allocation Revenue | | | | |
| (Mission Bays Redevelopment Project) | 5.000% | 8/1/24 | 275 | 334 |
| San Francisco CA City & County Redevelopment | | | | |
| Financing Authority Tax Allocation Revenue | | | | |
| (Mission Bays Redevelopment Project) | 5.000% | 8/1/25 | 240 | 288 |
| San Francisco CA City & County Redevelopment | | | | |
| Financing Authority Tax Allocation Revenue | | | | |
| (Mission Bays Redevelopment Project) | 5.000% | 8/1/25 | 400 | 489 |
| San Francisco CA City & County Redevelopment | | | | |
| Financing Authority Tax Allocation Revenue | | | | |
| (Mission Bays Redevelopment Project) | 5.000% | 8/1/25 | 400 | 490 |
| San Francisco CA City & County Redevelopment | | | | |
| Financing Authority Tax Allocation Revenue | | | | |
| (Mission Bays Redevelopment Project) | 5.000% | 8/1/26 | 1,405 | 1,720 |
| San Francisco CA City & County Redevelopment | | | | |
| Financing Authority Tax Allocation Revenue | | | | |
| (Mission Bays Redevelopment Project) | 5.000% | 8/1/26 | 500 | 618 |
115
California Intermediate-Term Tax-Exempt Fund
| | | | |
| | | | Face | Market |
| | | Maturity | Amount | Value• |
| | Coupon | Date | ($000) | ($000) |
| San Francisco CA City & County Redevelopment | | | | |
| Financing Authority Tax Allocation Revenue | | | | |
| (Mission Bays Redevelopment Project) | 5.000% | 8/1/27 | 140 | 165 |
| San Francisco CA City & County Redevelopment | | | | |
| Financing Authority Tax Allocation Revenue | | | | |
| (Mission Bays Redevelopment Project) | 5.000% | 8/1/27 | 500 | 610 |
| San Francisco CA City & County Redevelopment | | | | |
| Financing Authority Tax Allocation Revenue | | | | |
| (Mission Bays Redevelopment Project) | 5.000% | 8/1/27 | 500 | 610 |
| San Francisco CA City & County Redevelopment | | | | |
| Financing Authority Tax Allocation Revenue | | | | |
| (Mission Bays Redevelopment Project) | 5.000% | 8/1/28 | 710 | 859 |
| San Francisco CA City & County Redevelopment | | | | |
| Financing Authority Tax Allocation Revenue | | | | |
| (Mission Bays Redevelopment Project) | 5.000% | 8/1/29 | 460 | 534 |
| San Francisco CA City & County Redevelopment | | | | |
| Financing Authority Tax Allocation Revenue | | | | |
| (Mission Bays Redevelopment Project) | 5.000% | 8/1/29 | 745 | 893 |
| San Francisco CA City & County Redevelopment | | | | |
| Financing Authority Tax Allocation Revenue | | | | |
| (Mission Bays Redevelopment Project) | 5.000% | 8/1/30 | 550 | 655 |
| San Francisco CA City & County Redevelopment | | | | |
| Financing Authority Tax Allocation Revenue | | | | |
| (Mission Bays Redevelopment Project) | 5.000% | 8/1/31 | 400 | 460 |
| San Francisco CA City & County Redevelopment | | | | |
| Financing Authority Tax Allocation Revenue | | | | |
| (Mission Bays Redevelopment Project) | 5.000% | 8/1/31 | 710 | 841 |
| San Francisco CA City & County Redevelopment | | | | |
| Financing Authority Tax Allocation Revenue | | | | |
| (Mission Bays Redevelopment Project) | 5.000% | 8/1/32 | 525 | 602 |
| San Francisco CA City & County Redevelopment | | | | |
| Financing Authority Tax Allocation Revenue | | | | |
| (Mission Bays Redevelopment Project) | 5.000% | 8/1/32 | 450 | 531 |
| San Francisco CA City & County Redevelopment | | | | |
| Financing Authority Tax Allocation Revenue | | | | |
| (Mission Bays Redevelopment Project) | 5.000% | 8/1/32 | 1,000 | 1,179 |
| San Francisco CA City & County Redevelopment | | | | |
| Financing Authority Tax Allocation Revenue | | | | |
| (Mission Bays Redevelopment Project) | 5.000% | 8/1/32 | 860 | 1,014 |
| San Francisco CA City & County Redevelopment | | | | |
| Financing Authority Tax Allocation Revenue | | | | |
| (Mission Bays Redevelopment Project) | 5.000% | 8/1/33 | 345 | 404 |
| San Francisco CA City & County Redevelopment | | | | |
| Financing Authority Tax Allocation Revenue | | | | |
| (Mission Bays Redevelopment Project) | 5.000% | 8/1/33 | 660 | 774 |
| San Francisco CA City & County Redevelopment | | | | |
| Financing Authority Tax Allocation Revenue | | | | |
| (Mission Bays Redevelopment Project) | 5.000% | 8/1/33 | 750 | 879 |
| San Francisco CA City & County Redevelopment | | | | |
| Financing Authority Tax Allocation Revenue | | | | |
| (Mission Bays Redevelopment Project) | 5.000% | 8/1/34 | 225 | 256 |
| San Francisco CA City & County Redevelopment | | | | |
| Financing Authority Tax Allocation Revenue | | | | |
| (Mission Bays Redevelopment Project) | 5.000% | 8/1/34 | 700 | 817 |
116
California Intermediate-Term Tax-Exempt Fund
| | | | |
| | | | Face | Market |
| | | Maturity | Amount | Value• |
| | Coupon | Date | ($000) | ($000) |
| San Francisco CA City & County Redevelopment | | | | |
| Financing Authority Tax Allocation Revenue | | | | |
| (Mission Bays Redevelopment Project) | 5.000% | 8/1/34 | 660 | 770 |
| San Francisco CA City & County Redevelopment | | | | |
| Financing Authority Tax Allocation Revenue | | | | |
| (Mission Bays Redevelopment Project) | 5.000% | 8/1/34 | 555 | 648 |
| San Francisco CA City & County Redevelopment | | | | |
| Financing Authority Tax Allocation Revenue | | | | |
| (Mission Bays Redevelopment Project) | 5.000% | 8/1/35 | 400 | 464 |
| San Francisco CA City & County Redevelopment | | | | |
| Financing Authority Tax Allocation Revenue | | | | |
| (Mission Bays Redevelopment Project) | 5.000% | 8/1/35 | 900 | 1,045 |
| San Francisco CA City & County Redevelopment | | | | |
| Financing Authority Tax Allocation Revenue | | | | |
| (Mission Bays Redevelopment Project) | 5.000% | 8/1/35 | 595 | 690 |
| San Francisco CA City & County Redevelopment | | | | |
| Financing Authority Tax Allocation Revenue | | | | |
| (Mission Bays Redevelopment Project) | 5.000% | 8/1/36 | 350 | 405 |
| San Francisco CA City & County Redevelopment | | | | |
| Financing Authority Tax Allocation Revenue | | | | |
| (Mission Bays Redevelopment Project) | 5.000% | 8/1/36 | 625 | 722 |
| San Francisco CA City & County Redevelopment | | | | |
| Financing Authority Tax Allocation Revenue | | | | |
| (Mission Bays Redevelopment Project) | 5.000% | 8/1/36 | 780 | 901 |
| San Francisco CA City & County Redevelopment | | | | |
| Financing Authority Tax Allocation Revenue | | | | |
| (Redevelopment Projects) | 5.000% | 8/1/21 | 2,000 | 2,294 |
| San Francisco CA City & County Unified School | | | | |
| District GO | 5.000% | 6/15/24 | 1,080 | 1,333 |
| San Francisco CA City & County Unified School | | | | |
| District GO | 5.000% | 6/15/27 | 6,445 | 7,767 |
| San Francisco CA City & County Unified School | | | | |
| District GO | 5.000% | 6/15/28 | 10,170 | 12,189 |
| San Francisco CA City & County Unified School | | | | |
| District GO | 4.000% | 6/15/30 | 2,470 | 2,589 |
| San Francisco CA City & County Unified School | | | | |
| District GO | 5.000% | 6/15/31 | 7,965 | 8,760 |
| San Francisco CA City & County Unified School | | | | |
| District GO | 4.000% | 6/15/32 | 5,300 | 5,659 |
| San Francisco CA Community College District GO | 3.000% | 6/15/17 | 11,380 | 11,390 |
| San Francisco CA Municipal Transportation | | | | |
| Agency Revenue | 5.000% | 3/1/29 | 1,585 | 1,852 |
| San Francisco CA Municipal Transportation | | | | |
| Agency Revenue | 5.000% | 3/1/32 | 2,170 | 2,509 |
| San Francisco CA Municipal Transportation | | | | |
| Agency Revenue | 5.000% | 3/1/33 | 3,025 | 3,484 |
| San Francisco CA Municipal Transportation | | | | |
| Agency Revenue | 5.000% | 3/1/34 | 1,640 | 1,911 |
| San Joaquin County CA Delta Community | | | | |
| College District Election GO | 0.000% | 8/1/26 (4) | 15,500 | 9,774 |
| San Joaquin County CA Delta Community | | | | |
| College District Election GO | 0.000% | 8/1/27 (4) | 15,500 | 9,203 |
| San Joaquin County CA Transportation | | | | |
| Authority Revenue | 4.000% | 3/1/19 | 2,000 | 2,110 |
117
California Intermediate-Term Tax-Exempt Fund
| | | | |
| | | | Face | Market |
| | | Maturity | Amount | Value• |
| | Coupon | Date | ($000) | ($000) |
| San Joaquin County CA Transportation | | | | |
| Authority Revenue | 4.000% | 3/1/20 | 1,000 | 1,084 |
| San Joaquin County CA Transportation | | | | |
| Authority Revenue | 4.000% | 3/1/21 | 710 | 788 |
| San Joaquin County CA Transportation | | | | |
| Authority Revenue | 5.000% | 3/1/22 | 300 | 353 |
| San Joaquin County CA Transportation | | | | |
| Authority Revenue | 5.000% | 3/1/33 | 7,010 | 8,477 |
| San Joaquin County CA Transportation | | | | |
| Authority Revenue | 5.000% | 3/1/35 | 5,750 | 6,893 |
| San Joaquin Hills CA Transportation Corridor | | | | |
| Agency Toll Road Revenue | 0.000% | 1/1/23 (ETM) | 16,000 | 14,703 |
| San Joaquin Hills CA Transportation Corridor | | | | |
| Agency Toll Road Revenue | 0.000% | 1/15/24 (14) | 7,000 | 5,638 |
| San Joaquin Hills CA Transportation Corridor | | | | |
| Agency Toll Road Revenue | 0.000% | 1/1/25 (ETM) | 14,750 | 12,828 |
| San Joaquin Hills CA Transportation Corridor | | | | |
| Agency Toll Road Revenue | 5.000% | 1/15/29 | 4,375 | 4,924 |
| San Joaquin Hills CA Transportation Corridor | | | | |
| Agency Toll Road Revenue | 5.000% | 1/15/34 | 2,435 | 2,700 |
| San Jose CA Airport Revenue | 5.000% | 3/1/26 | 4,610 | 5,205 |
| San Jose CA Airport Revenue | 5.000% | 3/1/29 | 200 | 243 |
| San Jose CA Airport Revenue | 5.000% | 3/1/30 | 250 | 302 |
| San Jose CA Airport Revenue | 5.000% | 3/1/33 | 500 | 593 |
| San Jose CA Airport Revenue | 5.000% | 3/1/34 | 500 | 591 |
| San Jose CA Airport Revenue | 5.000% | 3/1/36 | 3,000 | 3,520 |
| San Jose CA Redevelopment Agency Tax | | | | |
| Allocation Revenue | 5.000% | 8/1/19 (14) | 1,150 | 1,165 |
| San Jose CA Redevelopment Agency Tax | | | | |
| Allocation Revenue | 5.000% | 8/1/20 (2) | 8,000 | 8,054 |
| San Jose CA Redevelopment Agency Tax | | | | |
| Allocation Revenue | 5.000% | 8/1/21 (2) | 2,495 | 2,512 |
| San Jose CA Redevelopment Agency Tax | | | | |
| Allocation Revenue | 5.000% | 8/1/21 | 1,270 | 1,414 |
| San Jose CA Redevelopment Agency Tax | | | | |
| Allocation Revenue | 5.000% | 8/1/22 (2) | 5,100 | 5,134 |
| San Jose CA Redevelopment Agency Tax | | | | |
| Allocation Revenue | 4.250% | 8/1/23 (10) | 50 | 50 |
| San Jose CA Redevelopment Agency Tax | | | | |
| Allocation Revenue | 5.000% | 8/1/23 | 1,140 | 1,268 |
| San Jose CA Redevelopment Agency Tax | | | | |
| Allocation Revenue | 5.000% | 8/1/24 (14) | 16,360 | 16,470 |
| San Jose CA Redevelopment Agency Tax | | | | |
| Allocation Revenue | 5.000% | 8/1/25 (14) | 11,505 | 11,582 |
| San Jose CA Redevelopment Agency Tax | | | | |
| Allocation Revenue | 5.125% | 8/1/25 | 570 | 635 |
| San Jose CA Redevelopment Agency Tax | | | | |
| Allocation Revenue | 5.250% | 8/1/26 | 800 | 894 |
| San Jose CA Redevelopment Agency Tax | | | | |
| Allocation Revenue | 5.375% | 8/1/29 | 1,355 | 1,514 |
| San Jose CA Redevelopment Agency Tax | | | | |
| Allocation Revenue (Merged Area | | | | |
| Redevelopment Project) | 5.000% | 8/1/17 (14) | 600 | 602 |
118
California Intermediate-Term Tax-Exempt Fund
| | | | |
| | | | Face | Market |
| | | Maturity | Amount | Value• |
| | Coupon | Date | ($000) | ($000) |
| San Jose CA Redevelopment Agency Tax | | | | |
| Allocation Revenue (Merged Area | | | | |
| Redevelopment Project) | 4.500% | 8/1/21 (2) | 1,000 | 1,005 |
| San Jose CA Special Hotel Tax Revenue | | | | |
| (Convention Center Expansion & | | | | |
| Renovation Project) | 6.125% | 5/1/31 | 5,000 | 5,767 |
| San Jose CA Unified School District Santa Clara | | | | |
| County GO | 5.000% | 8/1/19 | 1,000 | 1,089 |
| San Jose CA Unified School District Santa Clara | | | | |
| County GO | 5.000% | 8/1/20 | 1,000 | 1,126 |
| San Juan CA Unified School District GO | 2.000% | 8/1/18 | 2,780 | 2,818 |
| San Juan CA Unified School District GO | 2.000% | 8/1/18 | 2,850 | 2,889 |
| San Juan CA Unified School District GO | 2.000% | 8/1/18 | 6,595 | 6,686 |
| San Juan CA Unified School District GO | 2.000% | 8/1/19 | 14,365 | 14,707 |
| San Juan CA Unified School District GO | 2.500% | 8/1/19 | 9,725 | 10,061 |
| San Juan CA Unified School District GO | 0.000% | 8/1/25 (4) | 10,000 | 8,336 |
| San Juan CA Unified School District GO | 0.000% | 8/1/26 (4) | 12,215 | 9,729 |
| San Luis & Delta Mendota CA Water Authority | | | | |
| Revenue | 5.000% | 3/1/24 (15) | 855 | 1,006 |
| San Luis & Delta Mendota CA Water Authority | | | | |
| Revenue | 5.000% | 3/1/25 (15) | 970 | 1,141 |
| San Luis & Delta Mendota CA Water Authority | | | | |
| Revenue | 5.000% | 3/1/26 (15) | 500 | 587 |
| San Luis & Delta Mendota CA Water Authority | | | | |
| Revenue | 5.000% | 3/1/27 (15) | 1,070 | 1,245 |
| San Luis & Delta Mendota CA Water Authority | | | | |
| Revenue | 5.000% | 3/1/28 (15) | 600 | 694 |
| San Luis & Delta Mendota CA Water Authority | | | | |
| Revenue | 5.000% | 3/1/33 (15) | 2,790 | 3,153 |
| San Marcos CA Unified School District GO | 0.000% | 8/1/25 | 2,300 | 1,908 |
| San Marcos CA Unified School District GO | 0.000% | 8/1/30 | 2,000 | 1,325 |
| San Marcos CA Unified School District GO | 0.000% | 8/1/31 | 2,000 | 1,260 |
| San Marcos CA Unified School District GO | 0.000% | 8/1/32 | 2,500 | 1,490 |
| San Mateo CA Union High School District GO | 0.000% | 9/1/23 (Prere.) | 2,725 | 2,364 |
| San Mateo CA Union High School District GO | 5.000% | 9/1/23 (Prere.) | 1,315 | 1,600 |
| San Mateo CA Union High School District GO | 5.000% | 9/1/23 (Prere.) | 725 | 882 |
| San Mateo CA Union High School District GO | 0.000% | 9/1/24 | 2,665 | 2,248 |
| San Mateo CA Union High School District GO | 5.000% | 9/1/30 | 1,285 | 1,515 |
| San Mateo CA Union High School District GO | 5.000% | 9/1/31 | 715 | 838 |
| San Mateo CA Union High School District GO | 4.000% | 9/1/32 | 3,155 | 3,471 |
| San Mateo County CA Community College | | | | |
| District GO | 0.000% | 9/1/21 (14) | 4,645 | 4,361 |
| San Mateo County CA Community College | | | | |
| District GO | 0.000% | 9/1/22 (14) | 5,675 | 5,214 |
| San Mateo County CA Community College | | | | |
| District GO | 0.000% | 9/1/24 (14) | 2,825 | 2,451 |
| San Mateo County CA Community College | | | | |
| District GO | 0.000% | 9/1/25 (14) | 4,000 | 3,349 |
| San Mateo County CA Joint Powers Financing | | | | |
| Authority Lease Revenue (Maple Street | | | | |
| Correctional Center) | 5.000% | 6/15/23 | 1,000 | 1,202 |
| San Mateo County CA Joint Powers Financing | | | | |
| Authority Lease Revenue (Maple Street | | | | |
| Correctional Center) | 5.000% | 6/15/27 | 2,000 | 2,403 |
119
California Intermediate-Term Tax-Exempt Fund
| | | | |
| | | | Face | Market |
| | | Maturity | Amount | Value• |
| | Coupon | Date | ($000) | ($000) |
| San Mateo County CA Joint Powers Financing | | | | |
| Authority Lease Revenue (Youth Services | | | | |
| Campus) | 4.625% | 7/15/18 (Prere.) | 2,455 | 2,562 |
| San Mateo County CA Joint Powers Financing | | | | |
| Authority Lease Revenue (Youth Services | | | | |
| Campus) | 4.000% | 7/15/19 | 3,250 | 3,460 |
| San Mateo County CA Joint Powers Financing | | | | |
| Authority Lease Revenue (Youth Services | | | | |
| Campus) | 4.000% | 7/15/20 | 3,095 | 3,376 |
| San Mateo County CA Joint Powers Financing | | | | |
| Authority Lease Revenue (Youth Services | | | | |
| Campus) | 4.000% | 7/15/21 | 1,000 | 1,114 |
| San Mateo County CA Joint Powers Financing | | | | |
| Authority Lease Revenue (Youth Services | | | | |
| Campus) | 5.000% | 7/15/22 | 1,245 | 1,470 |
| San Mateo County CA Joint Powers Financing | | | | |
| Authority Lease Revenue (Youth Services | | | | |
| Campus) | 5.000% | 7/15/23 | 1,505 | 1,812 |
| San Mateo County CA Joint Powers Financing | | | | |
| Authority Lease Revenue (Youth Services | | | | |
| Campus) | 4.000% | 7/15/33 | 5,000 | 5,405 |
| San Mateo County CA Transportation Authority | | | | |
| Revenue | 4.000% | 6/1/20 | 770 | 839 |
| San Mateo County CA Transportation Authority | | | | |
| Revenue | 5.000% | 6/1/20 | 750 | 841 |
| San Mateo County CA Transportation Authority | | | | |
| Revenue | 5.000% | 6/1/21 | 1,350 | 1,561 |
| San Mateo County CA Transportation Authority | | | | |
| Revenue | 4.000% | 6/1/22 | 600 | 681 |
| San Mateo County CA Transportation Authority | | | | |
| Revenue | 5.000% | 6/1/22 | 750 | 891 |
| San Mateo County CA Transportation Authority | | | | |
| Revenue | 4.000% | 6/1/23 | 1,520 | 1,750 |
| San Mateo County CA Transportation Authority | | | | |
| Revenue | 5.000% | 6/1/23 | 840 | 1,020 |
| San Mateo County CA Transportation Authority | | | | |
| Revenue | 4.000% | 6/1/24 | 750 | 872 |
| San Mateo County CA Transportation Authority | | | | |
| Revenue | 5.000% | 6/1/24 | 1,200 | 1,483 |
| San Mateo County CA Transportation Authority | | | | |
| Revenue | 5.000% | 6/1/25 | 1,200 | 1,504 |
| San Mateo County CA Transportation Authority | | | | |
| Revenue | 5.000% | 6/1/31 | 1,365 | 1,642 |
| San Mateo-Foster City CA School District GO | 4.000% | 8/1/19 | 1,000 | 1,067 |
| San Mateo-Foster City CA School District GO | 4.000% | 8/1/34 | 1,580 | 1,694 |
| San Pablo CA Redevelopment Agency Successor | | | | |
| Agency Tax Allocation Revenue | 4.000% | 6/15/18 (4) | 925 | 954 |
| San Pablo CA Redevelopment Agency Successor | | | | |
| Agency Tax Allocation Revenue | 5.000% | 6/15/22 (4) | 1,000 | 1,170 |
| San Pablo CA Redevelopment Agency Successor | | | | |
| Agency Tax Allocation Revenue | 5.000% | 6/15/23 (4) | 1,200 | 1,432 |
| San Pablo CA Redevelopment Agency Successor | | | | |
| Agency Tax Allocation Revenue | 5.000% | 6/15/27 (4) | 1,770 | 2,091 |
120
California Intermediate-Term Tax-Exempt Fund
| | | | |
| | | | Face | Market |
| | | Maturity | Amount | Value• |
| | Coupon | Date | ($000) | ($000) |
| San Pablo CA Redevelopment Agency Successor | | | | |
| Agency Tax Allocation Revenue | 5.000% | 6/15/28 (4) | 1,860 | 2,183 |
| San Pablo CA Redevelopment Agency Successor | | | | |
| Agency Tax Allocation Revenue | 5.000% | 6/15/30 (4) | 2,275 | 2,634 |
| San Rafael CA High School District GO | 0.000% | 8/1/29 (14) | 6,505 | 4,501 |
| San Ramon CA Public Financing Authority Tax | | | | |
| Allocation Revenue | 0.000% | 2/1/25 (2) | 1,020 | 829 |
| San Ramon CA Public Financing Authority Tax | | | | |
| Allocation Revenue | 0.000% | 2/1/27 (2) | 1,700 | 1,254 |
| San Ramon CA Public Financing Authority Tax | | | | |
| Allocation Revenue | 0.000% | 2/1/28 (2) | 1,800 | 1,261 |
| San Ramon CA Redevelopment Agency | | | | |
| Successor Agency Tax Allocation Revenue | 5.000% | 2/1/25 (15) | 1,520 | 1,856 |
| San Ramon CA Redevelopment Agency | | | | |
| Successor Agency Tax Allocation Revenue | 5.000% | 2/1/26 (15) | 1,595 | 1,925 |
| San Ramon CA Redevelopment Agency | | | | |
| Successor Agency Tax Allocation Revenue | 5.000% | 2/1/27 (15) | 1,670 | 1,991 |
| San Ramon Valley CA Unified School District GO | 4.000% | 8/1/32 | 2,000 | 2,174 |
| Santa Ana CA Community Redevelopment Agency | | | | |
| Tax Allocation Revenue (South Main Street) | 5.000% | 9/1/18 (14) | 2,685 | 2,694 |
| Santa Ana CA Unified School District GO | 0.000% | 8/1/31 (14) | 3,775 | 2,345 |
| Santa Clara CA Electric Revenue | 5.000% | 7/1/30 | 1,000 | 1,135 |
| Santa Clara CA Electric Revenue | 5.250% | 7/1/32 | 2,500 | 2,868 |
| Santa Clara CA Unified School District GO | 5.000% | 7/1/21 | 2,290 | 2,646 |
| Santa Clara CA Unified School District GO | 5.000% | 7/1/22 | 2,060 | 2,441 |
| Santa Clara CA Unified School District GO | 5.000% | 7/1/23 | 2,185 | 2,647 |
| Santa Clara CA Unified School District GO | 5.000% | 7/1/25 | 3,120 | 3,811 |
| Santa Clara CA Unified School District GO | 5.000% | 7/1/25 | 3,595 | 4,392 |
| Santa Clara CA Unified School District GO | 5.000% | 7/1/28 | 3,775 | 4,210 |
| Santa Clara CA Unified School District GO | 5.000% | 7/1/29 | 4,115 | 4,590 |
| Santa Clara CA Unified School District GO | 5.000% | 7/1/30 | 4,405 | 4,892 |
| Santa Clara CA Unified School District GO | 5.000% | 7/1/31 | 4,715 | 5,237 |
| Santa Clara County CA East Side Union High | | | | |
| School District GO | 5.000% | 8/1/17 | 5,410 | 5,448 |
| Santa Clara County CA East Side Union High | | | | |
| School District GO | 5.000% | 8/1/18 | 5,690 | 5,966 |
| Santa Clara County CA Financing Authority Lease | | | | |
| Revenue (Multiple Facilities Projects) | 5.000% | 11/15/17 | 11,540 | 11,763 |
| Santa Clara County CA Financing Authority Lease | | | | |
| Revenue (Multiple Facilities Projects) | 5.000% | 5/15/18 (Prere.) | 10,000 | 10,405 |
| Santa Clara County CA Financing Authority Lease | | | | |
| Revenue (Multiple Facilities Projects) | 5.000% | 5/15/20 | 4,140 | 4,626 |
| Santa Clara County CA Financing Authority Lease | | | | |
| Revenue (Multiple Facilities Projects) | 5.000% | 5/15/21 | 5,770 | 6,643 |
| Santa Clara County CA Financing Authority Lease | | | | |
| Revenue (Multiple Facilities Projects) | 5.000% | 5/15/22 | 6,060 | 7,159 |
| Santa Clara County CA Financing Authority | | | | |
| Revenue | 5.000% | 5/15/22 | 4,090 | 4,832 |
| Santa Clara County CA Financing Authority | | | | |
| Revenue | 5.000% | 5/15/24 | 6,260 | 7,701 |
| Santa Clara County CA Financing Authority | | | | |
| Revenue | 5.000% | 5/15/25 | 6,510 | 8,127 |
| Santa Clara County CA Financing Authority | | | | |
| Revenue | 5.000% | 5/15/26 | 6,800 | 8,399 |
121
California Intermediate-Term Tax-Exempt Fund
| | | | |
| | | | Face | Market |
| | | Maturity | Amount | Value• |
| | Coupon | Date | ($000) | ($000) |
| Santa Clara County CA GO | 5.000% | 8/1/28 | 8,830 | 10,356 |
| Santa Clara Valley CA Joint Powers Authority | | | | |
| Revenue | 5.000% | 8/1/22 | 685 | 813 |
| Santa Clara Valley CA Joint Powers Authority | | | | |
| Revenue | 5.000% | 8/1/23 | 375 | 455 |
| Santa Clara Valley CA Joint Powers Authority | | | | |
| Revenue | 5.000% | 8/1/24 | 275 | 339 |
| Santa Clara Valley CA Joint Powers Authority | | | | |
| Revenue | 4.000% | 8/1/25 | 500 | 588 |
| Santa Clara Valley CA Joint Powers Authority | | | | |
| Revenue | 4.000% | 8/1/26 | 550 | 650 |
| Santa Clara Valley CA Joint Powers Authority | | | | |
| Revenue | 5.000% | 8/1/29 | 525 | 647 |
| Santa Clara Valley CA Joint Powers Authority | | | | |
| Revenue | 5.000% | 8/1/30 | 1,100 | 1,346 |
| Santa Clara Valley CA Water District COP | 4.000% | 6/1/18 | 520 | 537 |
| Santa Clara Valley CA Water District COP | 4.000% | 6/1/19 | 1,000 | 1,063 |
| Santa Clara Valley CA Water District COP | 5.000% | 6/1/20 | 575 | 644 |
| Santa Clara Valley CA Water District COP | 5.000% | 6/1/21 | 450 | 520 |
| Santa Clara Valley CA Water District COP | 5.000% | 6/1/22 | 450 | 533 |
| Santa Clara Valley CA Water District COP | 5.000% | 6/1/23 | 750 | 909 |
| Santa Clarita CA Community College District GO | 0.000% | 8/1/29 (4) | 2,480 | 1,716 |
| Santa Clarita CA Community College District GO | 5.000% | 8/1/32 | 5,450 | 6,258 |
| Santa Monica CA Community College District GO | 0.000% | 8/1/24 | 4,500 | 3,880 |
| Santa Monica CA Community College District GO | 0.000% | 8/1/26 | 11,025 | 8,845 |
| Santa Monica CA Community College District GO | 4.000% | 8/1/30 | 2,000 | 2,186 |
| Santa Monica CA Community College District GO | 4.000% | 8/1/32 | 2,565 | 2,783 |
| Santa Monica CA Community College District GO | 4.000% | 8/1/33 | 3,510 | 3,784 |
| Santa Monica-Malibu CA Unified School | | | | |
| District GO | 4.000% | 8/1/31 | 1,600 | 1,761 |
| Santa Monica-Malibu CA Unified School | | | | |
| District GO | 4.000% | 8/1/33 | 1,150 | 1,249 |
| Santa Rosa CA High School District GO | 4.000% | 5/1/18 | 2,230 | 2,294 |
| Santa Rosa CA High School District GO | 5.000% | 5/1/19 | 2,040 | 2,199 |
| Santa Rosa CA High School District GO | 5.000% | 5/1/20 | 1,150 | 1,283 |
| Santa Rosa CA Wastewater Revenue | 5.000% | 9/1/21 | 1,250 | 1,451 |
| Santa Rosa CA Wastewater Revenue | 5.000% | 9/1/22 | 1,010 | 1,201 |
| Santa Rosa CA Wastewater Revenue | 5.000% | 9/1/23 | 900 | 1,094 |
| Santa Rosa CA Wastewater Revenue | 5.000% | 9/1/24 | 800 | 988 |
| Santa Rosa CA Wastewater Revenue | 5.000% | 9/1/25 | 750 | 939 |
| Santa Rosa CA Wastewater Revenue | 5.000% | 9/1/26 | 790 | 1,000 |
| Santa Rosa CA Wastewater Revenue | 0.000% | 9/1/28 (4) | 11,095 | 7,928 |
| Santa Rosa CA Wastewater Revenue | 5.000% | 9/1/29 | 2,870 | 3,306 |
| Santa Rosa CA Wastewater Revenue | 5.000% | 9/1/30 | 3,055 | 3,514 |
| Santa Rosa CA Wastewater Revenue | 5.000% | 9/1/33 | 1,425 | 1,636 |
| Santee CA CDC Successor Agency Tax | | | | |
| Allocation Revenue | 4.000% | 8/1/20 | 590 | 638 |
| Santee CA CDC Successor Agency Tax | | | | |
| Allocation Revenue | 4.000% | 8/1/21 | 600 | 660 |
| Santee CA CDC Successor Agency Tax | | | | |
| Allocation Revenue | 5.000% | 8/1/22 | 570 | 663 |
| Signal Hill CA Redevelopment Agency | | | | |
| Successor Agency Tax Allocation Revenue | 3.000% | 10/1/17 | 1,915 | 1,928 |
122
California Intermediate-Term Tax-Exempt Fund
| | | | | |
| | | | | Face | Market |
| | | | Maturity | Amount | Value• |
| | | Coupon | Date | ($000) | ($000) |
| | Signal Hill CA Redevelopment Agency Successor | | | | |
| | Agency Tax Allocation Revenue | 4.000% | 10/1/18 | 1,960 | 2,035 |
| | Signal Hill CA Redevelopment Agency Successor | | | | |
| | Agency Tax Allocation Revenue | 5.000% | 10/1/19 | 2,040 | 2,216 |
| | Signal Hill CA Redevelopment Agency Successor | | | | |
| | Agency Tax Allocation Revenue | 5.000% | 10/1/20 (15) | 2,120 | 2,382 |
| | Silicon Valley CA Clean Water Wastewater | | | | |
| | Revenue | 5.000% | 8/1/20 | 350 | 394 |
| | Silicon Valley CA Clean Water Wastewater | | | | |
| | Revenue | 5.000% | 8/1/21 | 725 | 841 |
| | Silicon Valley CA Clean Water Wastewater | | | | |
| | Revenue | 5.000% | 8/1/24 | 1,000 | 1,236 |
| | Silicon Valley CA Clean Water Wastewater | | | | |
| | Revenue | 5.000% | 8/1/28 | 1,000 | 1,218 |
| | Silicon Valley CA Clean Water Wastewater | | | | |
| | Revenue | 5.000% | 8/1/35 | 1,000 | 1,176 |
| | Simi Valley CA Unified School District GO | 5.000% | 8/1/20 | 1,500 | 1,686 |
| | Simi Valley CA Unified School District GO | 5.000% | 8/1/21 | 1,220 | 1,412 |
| | Simi Valley CA Unified School District GO | 5.000% | 8/1/22 | 1,500 | 1,779 |
| | Simi Valley CA Unified School District GO | 5.000% | 8/1/23 | 2,500 | 3,031 |
| | Simi Valley CA Unified School District GO | 5.000% | 8/1/24 | 3,435 | 4,233 |
| | Simi Valley CA Unified School District GO | 5.000% | 8/1/25 | 2,785 | 3,481 |
| | Simi Valley CA Unified School District GO | 0.000% | 8/1/26 (4) | 3,030 | 2,402 |
| | Simi Valley CA Unified School District GO | 5.000% | 8/1/26 | 2,000 | 2,525 |
| | Simi Valley CA Unified School District GO | 0.000% | 8/1/27 (4) | 2,900 | 2,198 |
| | Solana Beach CA School District Special Tax | | | | |
| | Revenue | 5.000% | 9/1/29 | 2,125 | 2,372 |
| | Solana Beach CA School District Special Tax | | | | |
| | Revenue | 5.000% | 9/1/32 | 2,665 | 2,942 |
| | Solano County CA COP | 5.000% | 11/1/17 (14) | 4,110 | 4,178 |
| | Solano County CA COP | 5.000% | 11/1/18 (14) | 3,810 | 3,874 |
| | Solano County CA COP | 5.000% | 11/1/19 (14) | 3,995 | 4,062 |
| | Solano County CA COP | 5.000% | 11/1/20 (14) | 4,195 | 4,266 |
| | Solano County CA COP | 5.000% | 11/1/21 (14) | 4,405 | 4,479 |
| | Sonoma County CA Transportation Authority | | | | |
| | Sales Tax Revenue | 5.000% | 12/1/20 | 1,405 | 1,597 |
| | Sonoma County CA Transportation Authority | | | | |
| | Sales Tax Revenue | 5.000% | 12/1/22 | 2,445 | 2,925 |
| | South Orange County CA Public Financing | | | | |
| | Authority Special Tax Revenue | 5.000% | 8/15/23 | 1,000 | 1,142 |
| | South Orange County CA Public Financing | | | | |
| | Authority Special Tax Revenue | 5.000% | 8/15/25 | 1,250 | 1,422 |
| 1,2 | South San Francisco CA Unified School District | | | | |
| | GO TOB PUT | 0.830% | 6/22/17 | 6,490 | 6,490 |
| | Southern California Public Power Authority | | | | |
| | Revenue | 5.000% | 1/1/19 (Prere.) | 4,500 | 4,791 |
| | Southern California Public Power Authority | | | | |
| | Revenue | 5.000% | 7/1/23 | 500 | 531 |
| | Southern California Public Power Authority | | | | |
| | Revenue | 5.000% | 7/1/25 | 6,735 | 8,299 |
| | Southern California Public Power Authority | | | | |
| | Revenue | 5.000% | 7/1/28 | 10,000 | 11,147 |
| | Southern California Public Power Authority | | | | |
| | Revenue | 5.000% | 7/1/29 | 5,000 | 5,561 |
123
California Intermediate-Term Tax-Exempt Fund
| | | | |
| | | | Face | Market |
| | | Maturity | Amount | Value• |
| | Coupon | Date | ($000) | ($000) |
| Southern California Public Power Authority | | | | |
| Revenue | 5.000% | 7/1/30 | 10,750 | 11,928 |
| Southern California Public Power Authority | | | | |
| Revenue (Canyon Power Project) | 5.250% | 1/1/20 (Prere.) | 6,950 | 7,705 |
| Southern California Public Power Authority | | | | |
| Revenue (Canyon Power Project) | 5.000% | 7/1/20 | 1,250 | 1,400 |
| Southern California Public Power Authority | | | | |
| Revenue (Canyon Power Project) | 5.000% | 7/1/21 | 1,000 | 1,153 |
| Southern California Public Power Authority | | | | |
| Revenue (Canyon Power Project) | 5.000% | 7/1/23 | 4,000 | 4,626 |
| Southern California Public Power Authority | | | | |
| Revenue (Canyon Power Project) | 5.000% | 7/1/24 | 2,355 | 2,722 |
| Southern California Public Power Authority | | | | |
| Revenue (Canyon Power Project) | 5.000% | 7/1/25 | 1,500 | 1,732 |
| Southern California Public Power Authority | | | | |
| Revenue (Canyon Power Project) | 5.000% | 7/1/26 | 1,250 | 1,442 |
| Southern California Public Power Authority | | | | |
| Revenue (Canyon Power Project) | 5.000% | 7/1/27 | 1,000 | 1,153 |
| Southern California Public Power Authority | | | | |
| Revenue (Linden Wind Energy Project) | 5.000% | 7/1/28 | 3,500 | 3,901 |
| Southern California Public Power Authority | | | | |
| Revenue (Linden Wind Energy Project) | 5.000% | 7/1/29 | 2,500 | 2,780 |
| Southern California Public Power Authority | | | | |
| Revenue (Linden Wind Energy Project) | 5.000% | 7/1/30 | 2,500 | 2,774 |
| Southern California Public Power Authority | | | | |
| Revenue (Milford Wind Corridor Phase I Project) | 5.000% | 7/1/28 | 5,000 | 5,489 |
| Southern California Public Power Authority | | | | |
| Revenue (Milford Wind Corridor Phase I Project) | 5.000% | 7/1/29 | 5,000 | 5,478 |
| Southern California Public Power Authority | | | | |
| Revenue (Natural Gas Project) | 5.000% | 11/1/18 | 1,040 | 1,092 |
| Southern California Public Power Authority | | | | |
| Revenue (Natural Gas Project) | 5.250% | 11/1/23 | 5,270 | 6,168 |
| Southern California Public Power Authority | | | | |
| Revenue (Natural Gas Project) | 5.250% | 11/1/24 | 5,000 | 5,940 |
| Southern California Public Power Authority | | | | |
| Revenue (Natural Gas Project) | 5.250% | 11/1/25 | 7,000 | 8,412 |
| Southern California Public Power Authority | | | | |
| Revenue (Natural Gas Project) | 5.250% | 11/1/26 | 3,500 | 4,251 |
| Southern California Public Power Authority | | | | |
| Revenue (Natural Gas Project) | 5.000% | 11/1/28 | 2,000 | 2,371 |
| Southern California Public Power Authority | | | | |
| Revenue (Natural Gas Project) | 5.000% | 11/1/33 | 4,555 | 5,498 |
| Southern California Water Replenishment District | | | | |
| Financing Authority Revenue | 5.000% | 8/1/19 | 1,000 | 1,088 |
| Southern California Water Replenishment District | | | | |
| Financing Authority Revenue | 5.000% | 8/1/20 | 1,000 | 1,125 |
| Southern California Water Replenishment District | | | | |
| Financing Authority Revenue | 5.000% | 8/1/22 | 900 | 1,069 |
| Southern California Water Replenishment District | | | | |
| Financing Authority Revenue | 5.000% | 8/1/23 | 1,300 | 1,577 |
| Southern California Water Replenishment District | | | | |
| Financing Authority Revenue | 5.000% | 8/1/24 | 700 | 862 |
| Southern California Water Replenishment District | | | | |
| Financing Authority Revenue | 5.000% | 8/1/25 | 805 | 1,004 |
124
| California Intermediate-Term Tax-Exempt Fund | | | | |
| | | | Face | Market |
| | | Maturity | Amount | Value• |
| | Coupon | Date | ($000) | ($000) |
| Southern California Water Replenishment District | | | | |
| Financing Authority Revenue | 5.000% | 8/1/26 | 725 | 896 |
| Southern California Water Replenishment District | | | | |
| Financing Authority Revenue | 5.000% | 8/1/27 | 1,315 | 1,610 |
| Southern California Water Replenishment District | | | | |
| Financing Authority Revenue | 5.000% | 8/1/29 | 1,500 | 1,818 |
| Southern California Water Replenishment District | | | | |
| Financing Authority Revenue | 5.000% | 8/1/30 | 1,120 | 1,351 |
| Southern California Water Replenishment District | | | | |
| Financing Authority Revenue | 5.000% | 8/1/31 | 1,470 | 1,763 |
| Southern California Water Replenishment District | | | | |
| Financing Authority Revenue | 5.000% | 8/1/32 | 2,410 | 2,876 |
| Southern California Water Replenishment District | | | | |
| Financing Authority Revenue | 5.000% | 8/1/33 | 2,325 | 2,761 |
| Southern California Water Replenishment District | | | | |
| Financing Authority Revenue | 5.000% | 8/1/34 | 3,400 | 4,022 |
| Southern California Water Replenishment District | | | | |
| Financing Authority Revenue | 5.000% | 8/1/35 | 2,840 | 3,348 |
| Southern California Water Replenishment District | | | | |
| Financing Authority Revenue | 5.000% | 8/1/36 | 3,000 | 3,527 |
| Southwestern California Community College | | | | |
| District GO | 0.000% | 8/1/24 | 750 | 647 |
| Southwestern California Community College | | | | |
| District GO | 0.000% | 8/1/25 | 1,090 | 888 |
| Southwestern California Community College | | | | |
| District GO | 0.000% | 8/1/26 | 2,000 | 1,543 |
| Southwestern California Community College | | | | |
| District GO | 0.000% | 8/1/27 | 2,000 | 1,465 |
| Southwestern California Community College | | | | |
| District GO | 0.000% | 8/1/28 | 2,535 | 1,758 |
| Southwestern California Community College | | | | |
| District GO | 5.000% | 8/1/29 | 1,000 | 1,226 |
| Southwestern California Community College | | | | |
| District GO | 4.000% | 8/1/32 | 1,000 | 1,091 |
| Southwestern California Community College | | | | |
| District GO | 4.000% | 8/1/33 | 2,150 | 2,328 |
| Southwestern California Community College | | | | |
| District GO | 4.000% | 8/1/34 | 1,750 | 1,879 |
| Southwestern California Community College | | | | |
| District GO | 4.000% | 8/1/35 | 1,500 | 1,606 |
| St. Helena CA Unified School District GO | 0.000% | 8/1/27 | 4,550 | 4,081 |
| State Center California Community College | | | | |
| District GO | 5.000% | 8/1/17 (Prere.) | 5,880 | 5,921 |
| Stockton CA Public Financing Authority Revenue | 4.000% | 9/2/20 (15) | 580 | 628 |
| Stockton CA Public Financing Authority Revenue | 4.000% | 9/2/21 (15) | 450 | 496 |
| Stockton CA Public Financing Authority Revenue | 4.000% | 9/2/22 (15) | 950 | 1,059 |
| Stockton CA Public Financing Authority Revenue | 4.000% | 9/2/23 (15) | 660 | 743 |
| Stockton CA Public Financing Authority Revenue | 4.000% | 9/2/24 (15) | 1,025 | 1,163 |
| Stockton CA Public Financing Authority Revenue | 4.000% | 9/2/25 (15) | 1,075 | 1,223 |
| Stockton CA Public Financing Authority Revenue | 4.000% | 9/2/26 (15) | 1,115 | 1,267 |
| Stockton CA Public Financing Authority | | | | |
| Wastewater Revenue | 5.000% | 9/1/22 (15) | 1,000 | 1,175 |
| Stockton CA Public Financing Authority | | | | |
| Wastewater Revenue | 5.000% | 9/1/23 (15) | 1,000 | 1,198 |
125
California Intermediate-Term Tax-Exempt Fund
| | | | |
| | | | Face | Market |
| | | Maturity | Amount | Value• |
| | Coupon | Date | ($000) | ($000) |
| Stockton CA Public Financing Authority | | | | |
| Wastewater Revenue | 5.000% | 9/1/24 (15) | 1,000 | 1,215 |
| Stockton CA Public Financing Authority | | | | |
| Wastewater Revenue | 5.000% | 9/1/25 (15) | 1,250 | 1,504 |
| Stockton CA Public Financing Authority | | | | |
| Wastewater Revenue | 5.000% | 9/1/26 (15) | 1,375 | 1,645 |
| Stockton CA Public Financing Authority | | | | |
| Wastewater Revenue | 5.000% | 9/1/27 (15) | 1,250 | 1,482 |
| Stockton CA Public Financing Authority Water | | | | |
| Revenue (Delta Water Supply Project) | 6.125% | 10/1/35 | 1,000 | 1,214 |
| Stockton CA Redevelopment Agency Successor | | | | |
| Agency Tax Allocation Revenue | 5.000% | 9/1/28 (4) | 1,600 | 1,886 |
| Stockton CA Redevelopment Agency Successor | | | | |
| Agency Tax Allocation Revenue | 5.000% | 9/1/29 (4) | 1,500 | 1,753 |
| Stockton CA Redevelopment Agency Successor | | | | |
| Agency Tax Allocation Revenue | 5.000% | 9/1/33 (4) | 2,890 | 3,299 |
| Stockton CA Redevelopment Agency Successor | | | | |
| Agency Tax Allocation Revenue | 5.000% | 9/1/34 (4) | 2,000 | 2,274 |
| Stockton CA Unified School District GO | 3.000% | 8/1/17 | 700 | 703 |
| Stockton CA Unified School District GO | 4.000% | 8/1/18 | 2,500 | 2,590 |
| Stockton CA Unified School District GO | 4.000% | 8/1/19 | 3,470 | 3,683 |
| Stockton CA Unified School District GO | 5.000% | 8/1/20 | 930 | 1,041 |
| Stockton CA Unified School District GO | 5.000% | 8/1/21 | 2,185 | 2,515 |
| Stockton CA Unified School District GO | 5.000% | 8/1/22 | 2,650 | 3,119 |
| Stockton CA Unified School District GO | 5.000% | 7/1/23 (4) | 1,110 | 1,306 |
| Stockton CA Unified School District GO | 5.000% | 8/1/23 | 2,055 | 2,466 |
| Stockton CA Unified School District GO | 5.000% | 7/1/24 (4) | 1,570 | 1,843 |
| Stockton CA Unified School District GO | 5.000% | 8/1/28 (15) | 1,000 | 1,176 |
| Stockton CA Unified School District GO | 5.000% | 8/1/29 (15) | 600 | 700 |
| Stockton CA Unified School District GO | 4.000% | 8/1/30 (4) | 1,960 | 2,122 |
| Stockton CA Unified School District GO | 5.000% | 8/1/30 (15) | 1,555 | 1,804 |
| Stockton CA Unified School District GO | 5.000% | 8/1/31 (15) | 1,875 | 2,166 |
| Stockton CA Unified School District GO | 5.000% | 8/1/32 (15) | 2,060 | 2,371 |
| Stockton CA Unified School District GO | 5.000% | 8/1/33 (15) | 2,250 | 2,579 |
| Stockton CA Unified School District GO | 5.000% | 8/1/34 (15) | 2,105 | 2,404 |
| Suisun City CA Redevelopment Agency | | | | |
| Successor Agency Tax Allocation Revenue | 5.000% | 10/1/23 (15) | 1,015 | 1,217 |
| Suisun City CA Redevelopment Agency | | | | |
| Successor Agency Tax Allocation Revenue | 5.000% | 10/1/25 (15) | 1,000 | 1,205 |
| Suisun City CA Redevelopment Agency | | | | |
| Successor Agency Tax Allocation Revenue | 5.000% | 10/1/26 (15) | 1,200 | 1,437 |
| Suisun City CA Redevelopment Agency | | | | |
| Successor Agency Tax Allocation Revenue | 5.000% | 10/1/27 (15) | 1,245 | 1,478 |
| Suisun City CA Redevelopment Agency | | | | |
| Successor Agency Tax Allocation Revenue | 5.000% | 10/1/28 (15) | 1,280 | 1,509 |
| Suisun City CA Redevelopment Agency | | | | |
| Successor Agency Tax Allocation Revenue | 5.000% | 10/1/29 (15) | 2,255 | 2,638 |
| Suisun City CA Redevelopment Agency | | | | |
| Successor Agency Tax Allocation Revenue | 5.000% | 10/1/30 (15) | 1,000 | 1,163 |
| Sweetwater CA Unified School District GO | 5.000% | 8/1/23 (15) | 1,000 | 1,200 |
| Sweetwater CA Unified School District GO | 5.000% | 8/1/24 (15) | 1,000 | 1,220 |
| Sweetwater CA Unified School District GO | 5.000% | 8/1/27 (15) | 7,000 | 8,361 |
| Sweetwater CA Unified School District GO | 5.000% | 8/1/28 (15) | 8,000 | 9,492 |
| Tahoe-Truckee CA Unified School District GO | 5.000% | 8/1/24 | 100 | 123 |
126
California Intermediate-Term Tax-Exempt Fund
| | | | |
| | | | Face | Market |
| | | Maturity | Amount | Value• |
| | Coupon | Date | ($000) | ($000) |
| Tahoe-Truckee CA Unified School District GO | 5.000% | 8/1/25 | 200 | 250 |
| Tahoe-Truckee CA Unified School District GO | 5.000% | 8/1/26 | 330 | 416 |
| Temecula Valley CA Unified School District GO | 0.000% | 8/1/32 (15) | 2,000 | 2,000 |
| Tracy CA Community Development Agency | | | | |
| Successor Agency Tax Allocation Revenue | 3.000% | 8/1/17 | 275 | 276 |
| Tracy CA Community Development Agency | | | | |
| Successor Agency Tax Allocation Revenue | 4.000% | 8/1/18 | 350 | 363 |
| Tracy CA Community Development Agency | | | | |
| Successor Agency Tax Allocation Revenue | 5.000% | 8/1/19 | 250 | 271 |
| Tracy CA Community Development Agency | | | | |
| Successor Agency Tax Allocation Revenue | 5.000% | 8/1/20 | 250 | 279 |
| Tracy CA Community Development Agency | | | | |
| Successor Agency Tax Allocation Revenue | 5.000% | 8/1/21 | 900 | 1,031 |
| Tracy CA Community Development Agency | | | | |
| Successor Agency Tax Allocation Revenue | 5.000% | 8/1/23 (4) | 400 | 477 |
| Tracy CA Community Development Agency | | | | |
| Successor Agency Tax Allocation Revenue | 5.000% | 8/1/24 (4) | 400 | 484 |
| Tracy CA Community Development Agency | | | | |
| Successor Agency Tax Allocation Revenue | 5.000% | 8/1/25 (4) | 960 | 1,177 |
| Tuolumne CA Wind Project Authority Revenue | 5.250% | 1/1/19 (Prere.) | 5,115 | 5,466 |
| Turlock CA Irrigation District Revenue | 5.000% | 1/1/20 (Prere.) | 1,620 | 1,788 |
| Turlock CA Irrigation District Revenue | 5.000% | 1/1/20 (Prere.) | 2,105 | 2,324 |
| Turlock CA Irrigation District Revenue | 5.000% | 1/1/21 | 2,185 | 2,404 |
| Turlock CA Irrigation District Revenue | 5.000% | 1/1/22 | 3,310 | 3,639 |
| Turlock CA Irrigation District Revenue | 5.000% | 1/1/28 | 7,020 | 7,932 |
| Turlock CA Irrigation District Revenue | 5.000% | 1/1/29 | 6,400 | 7,224 |
| Turlock CA Irrigation District Revenue | 5.000% | 1/1/30 | 7,770 | 8,733 |
| Tustin CA Unified School District Special Tax | | | | |
| Revenue | 5.000% | 9/1/22 | 1,390 | 1,595 |
| Tustin CA Unified School District Special Tax | | | | |
| Revenue | 5.000% | 9/1/23 | 750 | 875 |
| Tustin CA Unified School District Special Tax | | | | |
| Revenue | 5.000% | 9/1/24 | 760 | 897 |
| Tustin CA Unified School District Special Tax | | | | |
| Revenue | 5.000% | 9/1/25 | 2,820 | 3,356 |
| Tustin CA Unified School District Special Tax | | | | |
| Revenue | 5.000% | 9/1/26 | 2,300 | 2,708 |
| Tustin CA Unified School District Special Tax | | | | |
| Revenue | 5.000% | 9/1/27 | 3,915 | 4,574 |
| Tustin CA Unified School District Special Tax | | | | |
| Revenue | 5.000% | 9/1/29 | 3,640 | 4,195 |
| Tustin CA Unified School District Special Tax | | | | |
| Revenue | 5.000% | 9/1/30 | 3,500 | 4,010 |
| Twin Rivers CA Unified School District GO | 4.000% | 8/1/17 | 300 | 302 |
| Twin Rivers CA Unified School District GO | 4.000% | 8/1/17 | 275 | 276 |
| Twin Rivers CA Unified School District GO | 4.000% | 8/1/18 | 625 | 648 |
| Twin Rivers CA Unified School District GO | 4.000% | 8/1/18 | 600 | 622 |
| Twin Rivers CA Unified School District GO | 5.000% | 8/1/19 | 1,645 | 1,785 |
| Twin Rivers CA Unified School District GO | 5.000% | 8/1/19 | 600 | 651 |
| Twin Rivers CA Unified School District GO | 5.000% | 8/1/20 (4) | 475 | 532 |
| Twin Rivers CA Unified School District GO | 5.000% | 8/1/20 (4) | 750 | 840 |
| Twin Rivers CA Unified School District GO | 5.000% | 8/1/21 (4) | 550 | 633 |
| Twin Rivers CA Unified School District GO | 5.000% | 8/1/21 (4) | 850 | 978 |
| Twin Rivers CA Unified School District GO | 5.000% | 8/1/22 (4) | 500 | 588 |
127
California Intermediate-Term Tax-Exempt Fund
| | | | |
| | | | Face | Market |
| | | Maturity | Amount | Value• |
| | Coupon | Date | ($000) | ($000) |
| Twin Rivers CA Unified School District GO | 5.000% | 8/1/22 (4) | 625 | 736 |
| Union City CA Community Redevelopment | | | | |
| Agency Successor Agency Tax Allocation | | | | |
| Revenue | 5.000% | 10/1/31 | 1,820 | 2,139 |
| Union City CA Community Redevelopment Agency | | | | |
| Successor Agency Tax Allocation Revenue | 5.000% | 10/1/32 | 1,360 | 1,592 |
| Union City CA Community Redevelopment Agency | | | | |
| Successor Agency Tax Allocation Revenue | 5.000% | 10/1/33 | 3,000 | 3,492 |
| Union City CA Community Redevelopment Agency | | | | |
| Successor Agency Tax Allocation Revenue | 5.000% | 10/1/35 | 1,250 | 1,446 |
| Union City CA Community Redevelopment Agency | | | | |
| Successor Agency Tax Allocation Revenue | 5.000% | 10/1/36 | 1,000 | 1,153 |
| University of California Regents Medical Center | | | | |
| Pooled Revenue | 5.000% | 5/15/24 | 6,000 | 7,340 |
| University of California Regents Medical Center | | | | |
| Pooled Revenue | 4.000% | 5/15/25 | 10,000 | 11,639 |
| University of California Regents Medical Center | | | | |
| Pooled Revenue | 4.000% | 5/15/26 | 10,000 | 11,644 |
| University of California Regents Medical Center | | | | |
| Pooled Revenue | 5.000% | 5/15/28 | 5,000 | 6,090 |
| University of California Regents Medical Center | | | | |
| Pooled Revenue | 5.000% | 5/15/29 | 5,000 | 6,030 |
| University of California Regents Medical Center | | | | |
| Pooled Revenue | 5.000% | 5/15/30 | 3,000 | 3,588 |
| University of California Regents Medical Center | | | | |
| Pooled Revenue | 5.000% | 5/15/32 | 8,440 | 9,990 |
| University of California Regents Medical Center | | | | |
| Pooled Revenue | 5.000% | 5/15/33 | 12,105 | 14,243 |
| University of California Regents Medical Center | | | | |
| Pooled Revenue | 5.000% | 5/15/34 | 14,000 | 16,400 |
| University of California Regents Medical Center | | | | |
| Pooled Revenue | 5.000% | 5/15/35 | 10,125 | 11,835 |
| University of California Regents Medical Center | | | | |
| Pooled Revenue | 4.500% | 5/15/36 | 10,000 | 11,038 |
| University of California Regents Medical Center | | | | |
| Revenue | 5.000% | 5/15/32 | 14,940 | 17,454 |
| University of California Regents Medical Center | | | | |
| Revenue | 5.000% | 5/15/33 | 5,000 | 5,820 |
| University of California Revenue | 5.000% | 5/15/19 | 5,250 | 5,678 |
| University of California Revenue | 5.000% | 5/15/19 | 15,815 | 17,092 |
| University of California Revenue | 5.750% | 5/15/19 (Prere.) | 3,000 | 3,282 |
| University of California Revenue | 5.000% | 5/15/20 | 4,360 | 4,884 |
| University of California Revenue | 5.000% | 5/15/20 | 8,250 | 9,231 |
| University of California Revenue | 5.000% | 5/15/21 | 3,000 | 3,465 |
| University of California Revenue | 5.000% | 5/15/22 | 5,420 | 6,217 |
| University of California Revenue | 5.000% | 5/15/23 | 1,865 | 2,263 |
| University of California Revenue | 5.000% | 5/15/24 | 5,010 | 6,188 |
| University of California Revenue | 5.000% | 5/15/25 | 2,400 | 2,997 |
| University of California Revenue | 5.000% | 5/15/25 | 9,030 | 11,276 |
| University of California Revenue | 5.000% | 5/15/27 | 7,000 | 8,590 |
| University of California Revenue | 5.000% | 5/15/27 | 10,900 | 12,436 |
| University of California Revenue | 5.000% | 5/15/28 | 9,125 | 11,110 |
| University of California Revenue | 5.000% | 5/15/28 | 7,080 | 8,562 |
| University of California Revenue | 5.000% | 5/15/28 | 11,680 | 13,311 |
128
California Intermediate-Term Tax-Exempt Fund
| | | | |
| | | | Face | Market |
| | | Maturity | Amount | Value• |
| | Coupon | Date | ($000) | ($000) |
| University of California Revenue | 5.000% | 5/15/30 | 1,000 | 1,215 |
| University of California Revenue | 5.000% | 5/15/30 | 1,400 | 1,654 |
| University of California Revenue | 5.000% | 5/15/31 | 2,290 | 2,717 |
| University of California Revenue | 5.000% | 5/15/32 | 14,020 | 16,138 |
| University of California Revenue | 5.000% | 5/15/32 | 8,450 | 10,151 |
| University of California Revenue | 5.250% | 5/15/32 | 5,000 | 6,007 |
| University of California Revenue | 5.000% | 5/15/33 | 15,240 | 17,795 |
| University of California Revenue | 5.000% | 5/15/33 | 10,110 | 11,805 |
| University of California Revenue | 5.000% | 5/15/33 | 5,000 | 5,975 |
| University of California Revenue | 5.000% | 5/15/33 | 6,995 | 8,277 |
| University of California Revenue | 5.000% | 5/15/34 | 15,900 | 18,507 |
| University of California Revenue | 5.000% | 5/15/34 | 3,915 | 4,658 |
| University of California Revenue | 5.000% | 5/15/35 | 1,910 | 2,264 |
| University of California Revenue | 5.000% | 5/15/36 | 5,425 | 6,412 |
| University of California Revenue PUT | 1.400% | 5/15/21 | 4,300 | 4,301 |
| University of California Revenue PUT | 5.000% | 5/15/23 | 52,095 | 62,839 |
| University of California Revenue VRDO | 0.740% | 6/7/17 | 22,000 | 22,000 |
| Upland CA Community Facilities District No. | | | | |
| 2003-2 Improvement Area No. 1 Special Tax | | | | |
| Revenue | 5.000% | 9/1/31 | 1,110 | 1,229 |
| Vacaville CA Redevelopment Agency Tax | | | | |
| Allocation Revenue | 5.000% | 9/1/22 | 600 | 701 |
| Vacaville CA Redevelopment Agency Tax | | | | |
| Allocation Revenue | 5.000% | 9/1/23 | 575 | 683 |
| Vacaville CA Redevelopment Agency Tax | | | | |
| Allocation Revenue | 5.000% | 9/1/24 | 1,325 | 1,595 |
| Vacaville CA Redevelopment Agency Tax | | | | |
| Allocation Revenue | 5.000% | 9/1/25 | 1,390 | 1,656 |
| Vacaville CA Redevelopment Agency Tax | | | | |
| Allocation Revenue | 5.000% | 9/1/26 | 1,460 | 1,722 |
| Vacaville CA Redevelopment Agency Tax | | | | |
| Allocation Revenue | 5.000% | 9/1/27 | 1,200 | 1,405 |
| Vacaville CA Redevelopment Agency Tax | | | | |
| Allocation Revenue | 5.000% | 9/1/28 | 1,200 | 1,393 |
| Ventura County CA Community College | | | | |
| District GO | 5.000% | 8/1/25 | 1,915 | 2,207 |
| Ventura County CA Community College | | | | |
| District GO | 5.000% | 8/1/27 | 2,205 | 2,539 |
| Ventura County CA Community College | | | | |
| District GO | 0.000% | 8/1/28 | 15,000 | 11,002 |
| Ventura County CA Public Financing Authority | | | | |
| Lease Revenue | 5.000% | 11/1/24 | 1,200 | 1,412 |
| Ventura County CA Public Financing Authority | | | | |
| Lease Revenue | 5.000% | 11/1/29 | 1,000 | 1,159 |
| Ventura County CA Public Financing Authority | | | | |
| Lease Revenue | 5.000% | 11/1/32 | 2,000 | 2,338 |
| Ventura County CA Public Financing Authority | | | | |
| Lease Revenue | 5.000% | 11/1/33 | 1,250 | 1,456 |
| Vista CA Joint Powers Financing Authority | | | | |
| Revenue | 4.000% | 5/1/18 | 300 | 309 |
| Vista CA Joint Powers Financing Authority | | | | |
| Revenue | 5.000% | 5/1/20 | 500 | 558 |
| Vista CA Joint Powers Financing Authority | | | | |
| Revenue | 5.000% | 5/1/21 | 325 | 373 |
129
California Intermediate-Term Tax-Exempt Fund
| | | | |
| | | | Face | Market |
| | | Maturity | Amount | Value• |
| | Coupon | Date | ($000) | ($000) |
| Vista CA Joint Powers Financing Authority | | | | |
| Revenue | 5.000% | 5/1/22 | 400 | 472 |
| Vista CA Joint Powers Financing Authority | | | | |
| Revenue | 5.250% | 5/1/35 | 5,975 | 7,129 |
| Vista CA Redevelopment Agency Successor | | | | |
| Agency Tax Allocation Revenue | 5.000% | 9/1/18 (4) | 400 | 420 |
| Vista CA Redevelopment Agency Successor | | | | |
| Agency Tax Allocation Revenue | 5.000% | 9/1/19 (4) | 300 | 325 |
| Vista CA Redevelopment Agency Successor | | | | |
| Agency Tax Allocation Revenue | 5.000% | 9/1/20 (4) | 275 | 307 |
| Vista CA Redevelopment Agency Successor | | | | |
| Agency Tax Allocation Revenue | 5.000% | 9/1/21 (4) | 265 | 303 |
| Vista CA Redevelopment Agency Successor | | | | |
| Agency Tax Allocation Revenue | 5.000% | 9/1/22 (4) | 335 | 392 |
| Vista CA Redevelopment Agency Successor | | | | |
| Agency Tax Allocation Revenue | 5.000% | 9/1/23 (4) | 400 | 476 |
| Vista CA Redevelopment Agency Successor | | | | |
| Agency Tax Allocation Revenue | 5.000% | 9/1/24 (4) | 585 | 706 |
| Vista CA Unified School District GO | 5.000% | 8/1/24 | 5,000 | 5,896 |
| Walnut CA Energy Center Authority Revenue | 5.000% | 1/1/30 | 2,000 | 2,169 |
| Walnut Valley CA Unified School District GO | 5.000% | 8/1/23 | 250 | 303 |
| Walnut Valley CA Unified School District GO | 5.000% | 8/1/24 | 350 | 431 |
| Washington Township CA Health Care District GO | 5.000% | 8/1/23 | 170 | 204 |
| Washington Township CA Health Care District GO | 4.000% | 8/1/24 | 625 | 721 |
| Washington Township CA Health Care District GO | 5.000% | 8/1/25 | 1,425 | 1,762 |
| Washington Township CA Health Care District GO | 5.000% | 8/1/26 | 1,395 | 1,735 |
| Washington Township CA Health Care District | | | | |
| Revenue | 5.000% | 7/1/17 | 760 | 762 |
| Washington Township CA Health Care District | | | | |
| Revenue | 4.000% | 7/1/18 | 325 | 334 |
| Washington Township CA Health Care District | | | | |
| Revenue | 4.000% | 7/1/19 | 445 | 467 |
| Washington Township CA Health Care District | | | | |
| Revenue | 5.000% | 7/1/19 | 500 | 535 |
| Washington Township CA Health Care District | | | | |
| Revenue | 4.000% | 7/1/20 | 375 | 401 |
| Washington Township CA Health Care District | | | | |
| Revenue | 5.000% | 7/1/20 | 465 | 511 |
| Washington Township CA Health Care District | | | | |
| Revenue | 5.000% | 7/1/21 | 350 | 393 |
| Washington Township CA Health Care District | | | | |
| Revenue | 4.000% | 7/1/22 | 540 | 590 |
| Washington Township CA Health Care District | | | | |
| Revenue | 5.000% | 7/1/22 | 725 | 827 |
| Washington Township CA Health Care District | | | | |
| Revenue | 5.000% | 7/1/23 | 400 | 463 |
| Washington Township CA Health Care District | | | | |
| Revenue | 5.000% | 7/1/23 | 570 | 660 |
| Washington Township CA Health Care District | | | | |
| Revenue | 5.000% | 7/1/24 | 750 | 876 |
| Washington Township CA Health Care District | | | | |
| Revenue | 5.000% | 7/1/24 | 610 | 713 |
| Washington Township CA Health Care District | | | | |
| Revenue | 4.000% | 7/1/25 | 650 | 716 |
130
California Intermediate-Term Tax-Exempt Fund
| | | | |
| | | | Face | Market |
| | | Maturity | Amount | Value• |
| | Coupon | Date | ($000) | ($000) |
| Washington Township CA Health Care District | | | | |
| Revenue | 5.000% | 7/1/25 | 775 | 910 |
| Washington Township CA Health Care District | | | | |
| Revenue | 5.000% | 7/1/26 | 900 | 1,043 |
| Washington Township CA Health Care District | | | | |
| Revenue | 5.000% | 7/1/26 | 785 | 923 |
| Washington Township CA Health Care District | | | | |
| Revenue | 5.000% | 7/1/27 | 430 | 508 |
| Washington Township CA Health Care District | | | | |
| Revenue | 5.000% | 7/1/29 | 1,005 | 1,163 |
| Washington Township CA Health Care District | | | | |
| Revenue | 6.000% | 7/1/29 | 1,000 | 1,080 |
| Washington Township CA Health Care District | | | | |
| Revenue | 4.000% | 7/1/32 | 1,000 | 1,032 |
| West Basin CA Municipal Water District Revenue | 5.000% | 8/1/22 | 2,000 | 2,372 |
| West Contra Costa CA Unified School District GO | 4.000% | 8/1/17 | 850 | 855 |
| West Contra Costa CA Unified School District GO | 5.000% | 8/1/18 | 1,000 | 1,048 |
| West Contra Costa CA Unified School District GO | 5.000% | 8/1/20 | 250 | 281 |
| West Contra Costa CA Unified School District GO | 6.000% | 8/1/26 | 5,000 | 6,656 |
| West Contra Costa CA Unified School District GO | 0.000% | 8/1/28 (14) | 6,400 | 4,638 |
| West Contra Costa CA Unified School District GO | 5.000% | 8/1/30 | 3,425 | 4,033 |
| West Contra Costa CA Unified School District GO | 5.000% | 8/1/31 | 5,690 | 6,652 |
| West Contra Costa CA Unified School District GO | 5.000% | 8/1/32 | 1,825 | 2,163 |
| West Contra Costa CA Unified School District GO | 5.000% | 8/1/32 | 5,560 | 6,475 |
| West Contra Costa CA Unified School District GO | 0.000% | 8/1/33 (12) | 2,650 | 1,500 |
| West Contra Costa CA Unified School District GO | 5.000% | 8/1/33 | 3,265 | 3,807 |
| West Contra Costa CA Unified School District GO | 5.000% | 8/1/33 | 915 | 1,069 |
| West Contra Costa CA Unified School District GO | 5.000% | 8/1/33 | 1,020 | 1,192 |
| West Contra Costa CA Unified School District GO | 5.000% | 8/1/34 | 2,010 | 2,334 |
| West Contra Costa CA Unified School District GO | 5.000% | 8/1/34 | 1,070 | 1,242 |
| West Contra Costa CA Unified School District GO | 5.000% | 8/1/35 | 1,400 | 1,621 |
| West Contra Costa CA Unified School District GO | 5.000% | 8/1/35 | 1,000 | 1,158 |
| West Contra Costa CA Unified School District GO | 0.000% | 8/1/30 (14) | 6,235 | 4,131 |
| Western CA Municipal Water District Revenue | | | | |
| PUT | 1.500% | 10/1/20 | 2,350 | 2,369 |
| Western Placer CA Unified School District COP | 3.000% | 8/1/21 (4) | 500 | 533 |
| Western Placer CA Unified School District COP | 3.000% | 8/1/23 (4) | 600 | 645 |
| 4 Western Placer CA Unified School District GO | 4.000% | 8/1/31 | 885 | 963 |
| 4 Western Placer CA Unified School District GO | 4.000% | 8/1/31 | 755 | 822 |
| 4 Western Placer CA Unified School District GO | 4.000% | 8/1/32 | 920 | 992 |
| 4 Western Placer CA Unified School District GO | 4.000% | 8/1/34 | 990 | 1,053 |
| 4 Western Placer CA Unified School District GO | 4.000% | 8/1/34 | 545 | 580 |
| 4 Western Placer CA Unified School District GO | 4.000% | 8/1/35 | 1,025 | 1,085 |
| 4 Western Placer CA Unified School District GO | 4.000% | 8/1/35 | 630 | 667 |
| 4 Western Placer CA Unified School District GO | 4.000% | 8/1/36 (15) | 1,070 | 1,126 |
| Westlands CA Water District Revenue | 5.000% | 9/1/21 (4) | 750 | 866 |
| Westlands CA Water District Revenue | 5.000% | 9/1/22 (4) | 750 | 885 |
| Westlands CA Water District Revenue | 5.000% | 9/1/24 (4) | 1,000 | 1,175 |
| Westlands CA Water District Revenue | 5.000% | 9/1/25 (4) | 1,250 | 1,454 |
| William S. Hart Union High School District | | | | |
| California GO | 5.000% | 9/1/25 | 1,735 | 2,043 |
| William S. Hart Union High School District | | | | |
| California GO | 5.000% | 9/1/26 | 1,085 | 1,277 |
131
California Intermediate-Term Tax-Exempt Fund
| | | | |
| | | | Face | Market |
| | | Maturity | Amount | Value• |
| | Coupon | Date | ($000) | ($000) |
| William S. Hart Union High School District | | | | |
| California GO | 5.000% | 9/1/27 | 1,500 | 1,757 |
| William S. Hart Union High School District | | | | |
| California GO | 0.000% | 8/1/34 (4) | 3,880 | 2,071 |
| Yucaipa Valley CA Water District Water System | | | | |
| Revenue | 5.000% | 9/1/18 | 500 | 526 |
| Yucaipa Valley CA Water District Water System | | | | |
| Revenue | 5.000% | 9/1/19 | 1,020 | 1,107 |
| | | | | 11,947,409 |
| Guam (0.3%) | | | | |
| Guam Government Business Privilege Tax | | | | |
| Revenue | 5.000% | 11/15/20 | 750 | 819 |
| Guam Government Business Privilege Tax | | | | |
| Revenue | 5.000% | 11/15/21 | 1,125 | 1,251 |
| Guam Government Business Privilege Tax | | | | |
| Revenue | 5.000% | 11/15/22 | 1,500 | 1,695 |
| Guam Government Waterworks Authority Water | | | | |
| & Waste Water System Revenue | 5.000% | 7/1/20 | 540 | 591 |
| Guam Government Waterworks Authority Water | | | | |
| & Waste Water System Revenue | 5.000% | 7/1/21 | 400 | 445 |
| Guam Government Waterworks Authority Water | | | | |
| & Waste Water System Revenue | 5.000% | 7/1/22 | 500 | 565 |
| Guam Government Waterworks Authority Water | | | | |
| & Waste Water System Revenue | 5.000% | 7/1/28 | 2,115 | 2,364 |
| Guam Government Waterworks Authority Water | | | | |
| & Waste Water System Revenue | 5.000% | 7/1/29 | 5,035 | 5,663 |
| Guam Government Waterworks Authority Water | | | | |
| & Waste Water System Revenue | 5.250% | 7/1/33 | 4,000 | 4,448 |
| Guam Government Waterworks Authority Water | | | | |
| & Waste Water System Revenue | 5.000% | 7/1/35 | 4,450 | 4,889 |
| Guam Government Waterworks Authority Water | | | | |
| & Waste Water System Revenue | 5.000% | 7/1/36 | 1,450 | 1,605 |
| Guam Power Authority Revenue | 5.000% | 10/1/22 | 1,605 | 1,815 |
| Guam Power Authority Revenue | 5.000% | 10/1/26 | 1,810 | 2,047 |
| Guam Power Authority Revenue | 5.000% | 10/1/30 | 1,470 | 1,623 |
| | | | | 29,820 |
| Virgin Islands (0.0%) | | | | |
| Virgin Islands Public Finance Authority Revenue | 5.000% | 10/1/17 | 1,500 | 1,499 |
| Total Tax-Exempt Municipal Bonds (Cost $11,486,480) | | | 11,978,728 |
132
California Intermediate-Term Tax-Exempt Fund
| |
| | Amount |
| | ($000) |
| Other Assets and Liabilities (0.3%) | |
| Other Assets | |
| Investment in Vanguard | 791 |
| Receivables for Investment Securities Sold | 2,815 |
| Receivables for Accrued Income | 118,964 |
| Receivables for Capital Shares Issued | 6,551 |
| Other Assets | 468 |
| Total Other Assets | 129,589 |
| Liabilities | |
| Payables for Investment Securities Purchased | (68,250) |
| Payables for Capital Shares Redeemed | (10,225) |
| Payables for Distributions | (5,993) |
| Payables to Vanguard | (7,505) |
| Other Liabilities | (483) |
| Total Liabilities | (92,456) |
| Net Assets (100%) | 12,015,861 |
| |
| |
| At May 31, 2017, net assets consisted of: | |
| | Amount |
| | ($000) |
| Paid-in Capital | 11,574,537 |
| Undistributed Net Investment Income | — |
| Accumulated Net Realized Losses | (50,617) |
| Unrealized Appreciation (Depreciation) | |
| Investment Securities | 492,248 |
| Futures Contracts | (307) |
| Net Assets | 12,015,861 |
| |
| |
| Investor Shares—Net Assets | |
| Applicable to 136,790,863 outstanding $.001 par value shares of | |
| beneficial interest (unlimited authorization) | 1,618,664 |
| Net Asset Value Per Share—Investor Shares | $11.83 |
| |
| |
| Admiral Shares—Net Assets | |
| Applicable to 878,651,904 outstanding $.001 par value shares of | |
| beneficial interest (unlimited authorization) | 10,397,197 |
| Net Asset Value Per Share—Admiral Shares | $11.83 |
• See Note A in Notes to Financial Statements.
1 Adjustable-rate security.
2 Security exempt from registration under Rule 144A of the Securities Act of 1933. Such securities may be sold in transactions exempt from
registration, normally to qualified institutional buyers. At May 31, 2017, the aggregate value of these securities was $132,989,000,
representing 1.1% of net assets.
3 Securities with a value of $3,294,000 have been segregated as initial margin for open futures contracts.
4 Security purchased on a when-issued or delayed-delivery basis for which the fund has not taken delivery as of May 31, 2017.
A key to abbreviations and other references follows the Statement of Net Assets.
See accompanying Notes, which are an integral part of the Financial Statements.
133
California Intermediate-Term Tax-Exempt Fund
Key to Abbreviations
ARS—Auction Rate Security.
BAN—Bond Anticipation Note.
COP—Certificate of Participation.
CP—Commercial Paper.
FR—Floating Rate.
GAN—Grant Anticipation Note.
GO—General Obligation Bond.
PILOT—Payments in Lieu of Taxes.
PUT—Put Option Obligation.
RAN—Revenue Anticipation Note.
TAN—Tax Anticipation Note.
TOB—Tender Option Bond.
TRAN—Tax Revenue Anticipation Note.
VRDO—Variable Rate Demand Obligation.
VRDP—Variable Rate Demand Preferred.
(ETM)—Escrowed to Maturity.
(Prere.)—Prerefunded.
Scheduled principal and interest payments are guaranteed by:
(1) MBIA (Municipal Bond Investors Assurance).
(2) AMBAC (Ambac Assurance Corporation).
(3) FGIC (Financial Guaranty Insurance Company).
(4) AGM (Assured Guaranty Municipal Corporation).
(5) BIGI (Bond Investors Guaranty Insurance).
(6) Connie Lee Inc.
(7) FHA (Federal Housing Authority).
(8) CapMAC (Capital Markets Assurance Corporation).
(9) American Capital Access Financial Guaranty Corporation.
(10) XL Capital Assurance Inc.
(11) CIFG (CDC IXIS Financial Guaranty).
(12) AGC (Assured Guaranty Corporation).
(13) BHAC (Berkshire Hathaway Assurance Corporation).
(14) NPFG (National Public Finance Guarantee Corporation).
(15) BAM (Build America Mutual Assurance Company).
(16) MAC (Municipal Assurance Corporation).
(17) RAA (Radian Asset Assurance Inc.).
(18) SBLF (Michigan School Bond Loan Fund).
The insurance does not guarantee the market value of the municipal bonds.
LOC—Scheduled principal and interest payments are guaranteed by bank letter of credit.
134
California Intermediate-Term Tax-Exempt Fund
| |
| Statement of Operations | |
| |
| | Six Months Ended |
| | May 31, 2017 |
| | ($000) |
| Investment Income | |
| Income | |
| Interest | 161,234 |
| Total Income | 161,234 |
| Expenses | |
| The Vanguard Group—Note B | |
| Investment Advisory Services | 794 |
| Management and Administrative—Investor Shares | 1,145 |
| Management and Administrative—Admiral Shares | 3,191 |
| Marketing and Distribution—Investor Shares | 181 |
| Marketing and Distribution—Admiral Shares | 466 |
| Custodian Fees | 51 |
| Shareholders’ Reports—Investor Shares | 30 |
| Shareholders’ Reports—Admiral Shares | 50 |
| Trustees’ Fees and Expenses | 3 |
| Total Expenses | 5,911 |
| Net Investment Income | 155,323 |
| Realized Net Gain (Loss) | |
| Investment Securities Sold | (2,670) |
| Futures Contracts | (2,524) |
| Realized Net Gain (Loss) | (5,194) |
| Change in Unrealized Appreciation (Depreciation) | |
| Investment Securities | 413,120 |
| Futures Contracts | (157) |
| Change in Unrealized Appreciation (Depreciation) | 412,963 |
| Net Increase (Decrease) in Net Assets Resulting from Operations | 563,092 |
See accompanying Notes, which are an integral part of the Financial Statements.
135
California Intermediate-Term Tax-Exempt Fund
| | |
| Statement of Changes in Net Assets | | |
| |
| | Six Months Ended | Year Ended |
| | May 31, | November 30, |
| | 2017 | 2016 |
| | ($000) | ($000) |
| Increase (Decrease) in Net Assets | | |
| Operations | | |
| Net Investment Income | 155,323 | 304,792 |
| Realized Net Gain (Loss) | (5,194) | 12,748 |
| Change in Unrealized Appreciation (Depreciation) | 412,963 | (427,813) |
| Net Increase (Decrease) in Net Assets Resulting from Operations | 563,092 | (110,273) |
| Distributions | | |
| Net Investment Income | | |
| Investor Shares | (20,366) | (42,106) |
| Admiral Shares | (133,470) | (262,704) |
| Realized Capital Gain | | |
| Investor Shares | — | — |
| Admiral Shares | — | — |
| Total Distributions | (153,836) | (304,810) |
| Capital Share Transactions | | |
| Investor Shares | (68,856) | 181,111 |
| Admiral Shares | 231,346 | 1,423,231 |
| Net Increase (Decrease) from Capital Share Transactions | 162,490 | 1,604,342 |
| Total Increase (Decrease) | 571,746 | 1,189,259 |
| Net Assets | | |
| Beginning of Period | 11,444,115 | 10,254,856 |
| End of Period1 | 12,015,861 | 11,444,115 |
1 Net Assets—End of Period includes undistributed (overdistributed) net investment income of $0 and ($18,000).
See accompanying Notes, which are an integral part of the Financial Statements.
136
California Intermediate-Term Tax-Exempt Fund
| | | | | | |
| Financial Highlights | | | | | | |
| |
| |
| Investor Shares | | | | | | |
| Six Months | | | | | |
| | Ended | | | | | |
| For a Share Outstanding | May 31, | | | Year Ended November 30, |
| Throughout Each Period | 2017 | 2016 | 2015 | 2014 | 2013 | 2012 |
| Net Asset Value, Beginning of Period | $11.42 | $11.79 | $11.78 | $11.32 | $11.92 | $11.18 |
| Investment Operations | | | | | | |
| Net Investment Income | .152 | .307 | .331 | .355 | .373 | .379 |
| Net Realized and Unrealized Gain (Loss) | | | | | | |
| on Investments | .409 | (.370) | .010 | .460 | (.600) | .740 |
| Total from Investment Operations | . 561 | (. 063) | . 341 | . 815 | (. 227) | 1.119 |
| Distributions | | | | | | |
| Dividends from Net Investment Income | (.151) | (. 307) | (. 331) | (. 355) | (. 373) | (. 379) |
| Distributions from Realized Capital Gains | — | — | — | — | — | — |
| Total Distributions | (.151) | (. 307) | (. 331) | (. 355) | (. 373) | (. 379) |
| Net Asset Value, End of Period | $11.83 | $11.42 | $11.79 | $11.78 | $11.32 | $11.92 |
| |
| Total Return1 | 4.94% | -0.62% | 2.93% | 7.29% | -1.91% | 10.14% |
| |
| Ratios/Supplemental Data | | | | | | |
| Net Assets, End of Period (Millions) | $1,619 | $1,631 | $1,509 | $1,444 | $1,227 | $1,375 |
| Ratio of Total Expenses to | | | | | | |
| Average Net Assets | 0.19% | 0.19% | 0.20% | 0.20% | 0.20% | 0.20% |
| Ratio of Net Investment Income to | | | | | | |
| Average Net Assets | 2.63% | 2.56% | 2.81% | 3.06% | 3.24% | 3.26% |
| Portfolio Turnover Rate | 16% | 16% | 17% | 11% | 12% | 9% |
The expense ratio, net investment income ratio, and turnover rate for the current period have been annualized.
1 Total returns do not include account service fees that may have applied in the periods shown. Fund prospectuses provide information about any applicable account service fees.
See accompanying Notes, which are an integral part of the Financial Statements.
137
California Intermediate-Term Tax-Exempt Fund
Financial Highlights
| | | | | | |
| Admiral Shares | | | | | | |
| Six Months | | | | | |
| | Ended | | | | | |
| For a Share Outstanding | May 31, | | | Year Ended November 30, |
| Throughout Each Period | 2017 | 2016 | 2015 | 2014 | 2013 | 2012 |
| Net Asset Value, Beginning of Period | $11.42 | $11.79 | $11.78 | $11.32 | $11.92 | $11.18 |
| Investment Operations | | | | | | |
| Net Investment Income | .158 | .319 | .340 | .364 | .382 | .388 |
| Net Realized and Unrealized Gain (Loss) | | | | | | |
| on Investments | .409 | (.370) | .010 | .460 | (.600) | .740 |
| Total from Investment Operations | . 567 | (. 051) | . 350 | . 824 | (. 218) | 1.128 |
| Distributions | | | | | | |
| Dividends from Net Investment Income | (.157) | (. 319) | (. 340) | (. 364) | (. 382) | (. 388) |
| Distributions from Realized Capital Gains | — | — | — | — | — | — |
| Total Distributions | (.157) | (. 319) | (. 340) | (. 364) | (. 382) | (. 388) |
| Net Asset Value, End of Period | $11.83 | $11.42 | $11.79 | $11.78 | $11.32 | $11.92 |
| |
| Total Return1 | 4.99% | -0.52% | 3.01% | 7.37% | -1.83% | 10.23% |
| |
| Ratios/Supplemental Data | | | | | | |
| Net Assets, End of Period (Millions) | $10,397 | $9,813 | $8,746 | $7,240 | $5,652 | $5,507 |
| Ratio of Total Expenses to | | | | | | |
| Average Net Assets | 0.09% | 0.09% | 0.12% | 0.12% | 0.12% | 0.12% |
| Ratio of Net Investment Income to | | | | | | |
| Average Net Assets | 2.73% | 2.66% | 2.89% | 3.14% | 3.32% | 3.34% |
| Portfolio Turnover Rate | 16% | 16% | 17% | 11% | 12% | 9% |
The expense ratio, net investment income ratio, and turnover rate for the current period have been annualized.
1 Total returns do not include account service fees that may have applied in the periods shown. Fund prospectuses provide information about any applicable account service fees.
See accompanying Notes, which are an integral part of the Financial Statements.
138
California Intermediate-Term Tax-Exempt Fund
Notes to Financial Statements
Vanguard California Intermediate-Term Tax-Exempt Fund is registered under the Investment Company Act of 1940 as an open-end investment company, or mutual fund. The fund invests in debt instruments of municipal issuers whose ability to meet their obligations may be affected by economic and political developments in the state. The fund offers two classes of shares: Investor Shares and Admiral Shares. Investor Shares are available to any investor who meets the fund’s minimum purchase requirements. Admiral Shares are designed for investors who meet certain administrative, service, and account-size criteria.
A. The following significant accounting policies conform to generally accepted accounting principles for U.S. investment companies. The fund consistently follows such policies in preparing its financial statements.
1. Security Valuation: Securities are valued as of the close of trading on the New York Stock Exchange (generally 4 p.m., Eastern time) on the valuation date. Bonds and temporary cash investments are valued using the latest bid prices or using valuations based on a matrix system (which considers such factors as security prices, yields, maturities, and ratings), both as furnished by independent pricing services. Securities for which market quotations are not readily available, or whose values have been affected by events occurring before the fund’s pricing time but after the close of the securities’ primary markets, are valued by methods deemed by the board of trustees to represent fair value.
2. Futures Contracts: The fund uses futures contracts to invest in fixed income asset classes with greater efficiency and lower cost than is possible through direct investment, to add value when these instruments are attractively priced, or to adjust sensitivity to changes in interest rates. The primary risks associated with the use of futures contracts are imperfect correlation between changes in market values of bonds held by the fund and the prices of futures contracts, and the possibility of an illiquid market. Counterparty risk involving futures is mitigated because a regulated clearinghouse is the counterparty instead of the clearing broker. To further mitigate counterparty risk, the fund trades futures contracts on an exchange, monitors the financial strength of its clearing brokers and clearinghouse, and has entered into clearing agreements with its clearing brokers. The clearinghouse imposes initial margin requirements to secure the fund’s performance and requires daily settlement of variation margin representing changes in the market value of each contract.
Futures contracts are valued at their quoted daily settlement prices. The aggregate settlement values of the contracts are not recorded in the Statement of Net Assets. Fluctuations in the value of the contracts are recorded in the Statement of Net Assets as an asset (liability) and in the Statement of Operations as unrealized appreciation (depreciation) until the contracts are closed, when they are recorded as realized futures gains (losses).
During the six months ended May 31, 2017, the fund’s average investments in long and short futures contracts represented 4% and 1% of net assets, respectively, based on the average of aggregate settlement values at each quarter-end during the period.
3. Federal Income Taxes: The fund intends to continue to qualify as a regulated investment company and distribute all of its income. Management has analyzed the fund’s tax positions taken for all open federal income tax years (November 30, 2013–2016), and for the period ended May 31, 2017, and has concluded that no provision for federal income tax is required in the fund’s financial statements.
4. Distributions: Distributions from net investment income are declared daily and paid on the first business day of the following month. Annual distributions from realized capital gains, if any, are recorded on the ex-dividend date.
139
California Intermediate-Term Tax-Exempt Fund
5. Credit Facility: The fund and certain other funds managed by The Vanguard Group (“Vanguard”) participate in a $3.1 billion committed credit facility provided by a syndicate of lenders pursuant to a credit agreement that may be renewed annually; each fund is individually liable for its borrowings, if any, under the credit facility. Borrowings may be utilized for temporary and emergency purposes, and are subject to the fund’s regulatory and contractual borrowing restrictions. The participating funds are charged administrative fees and an annual commitment fee of 0.10% of the undrawn amount of the facility; these fees are allocated to the funds based on a method approved by the fund’s board of trustees and included in Management and Administrative expenses on the fund’s Statement of Operations. Any borrowings under this facility bear interest at a rate based upon the higher of the one-month London Interbank Offered Rate, federal funds effective rate, or overnight bank funding rate plus an agreed-upon spread.
The fund had no borrowings outstanding at May 31, 2017, or at any time during the period then ended.
6. Other: Interest income is accrued daily. Premiums and discounts on debt securities purchased are amortized and accreted, respectively, to interest income over the lives of the respective securities. Security transactions are accounted for on the date securities are bought or sold. Costs used to determine realized gains (losses) on the sale of investment securities are those of the specific securities sold.
Each class of shares has equal rights as to assets and earnings, except that each class separately bears certain class-specific expenses related to maintenance of shareholder accounts (included in Management and Administrative expenses) and shareholder reporting. Marketing and distribution expenses are allocated to each class of shares based on a method approved by the board of trustees. Income, other non-class-specific expenses, and gains and losses on investments are allocated to each class of shares based on its relative net assets.
B. In accordance with the terms of a Funds’ Service Agreement (the “FSA”) between Vanguard and the fund, Vanguard furnishes to the fund investment advisory, corporate management, administrative, marketing, and distribution services at Vanguard’s cost of operations (as defined by the FSA). These costs of operations are allocated to the fund based on methods and guidelines approved by the board of trustees. Vanguard does not require reimbursement in the current period for certain costs of operations (such as deferred compensation/benefits and risk/insurance costs); the fund’s liability for these costs of operations is included in Payables to Vanguard on the Statement of Net Assets.
Upon the request of Vanguard, the fund may invest up to 0.40% of its net assets as capital in Vanguard. At May 31, 2017, the fund had contributed to Vanguard capital in the amount of $791,000, representing 0.01% of the fund’s net assets and 0.32% of Vanguard’s capitalization. The fund’s trustees and officers are also directors and employees, respectively, of Vanguard.
C. Various inputs may be used to determine the value of the fund’s investments. These inputs are summarized in three broad levels for financial statement purposes. The inputs or methodologies used to value securities are not necessarily an indication of the risk associated with investing in those securities.
Level 1—Quoted prices in active markets for identical securities.
Level 2—Other significant observable inputs (including quoted prices for similar securities, interest rates, prepayment speeds, credit risk, etc.).
Level 3—Significant unobservable inputs (including the fund’s own assumptions used to determine the fair value of investments).
140
California Intermediate-Term Tax-Exempt Fund
The following table summarizes the market value of the fund’s investments as of May 31, 2017, based on the inputs used to value them:
| | | |
| | Level 1 | Level 2 | Level 3 |
| Investments | ($000) | ($000) | ($000) |
| Tax-Exempt Municipal Bonds | — | 11,978,728 | — |
| Futures Contracts—Assets1 | 110 | — | — |
| Futures Contracts—Liabilities1 | (433) | — | — |
| Total | (323) | 11,978,728 | — |
| 1 Represents variation margin on the last day of the reporting period. |
D. At May 31, 2017, the aggregate settlement value of open futures contracts and the related unrealized appreciation (depreciation) were:
| | | | |
| | | | | ($000) |
| | | | Aggregate | |
| | | Number of | Settlement | Unrealized |
| | | Long (Short) | Value | Appreciation |
| Futures Contracts | Expiration | Contracts | Long (Short) | (Depreciation) |
| 2-Year U.S. Treasury Note | September 2017 | 1,082 | 234,236 | 206 |
| 5-Year U.S. Treasury Note | September 2017 | 1,908 | 225,740 | 325 |
| Ultra 10-Year U.S. Treasury Note | September 2017 | (1,227) | (166,546) | (809) |
| 10-Year U.S. Treasury Note | September 2017 | (254) | (32,079) | (29) |
| | | | | (307) |
Unrealized appreciation (depreciation) on open futures contracts is required to be treated as realized gain (loss) for tax purposes.
E. Capital gain distributions are determined on a tax basis and may differ from realized capital gains for financial reporting purposes. Differences may be permanent or temporary. Permanent differences are reclassified among capital accounts in the financial statements to reflect their tax character. Temporary differences arise when gains or losses are recognized in different periods for financial statement and tax purposes. These differences will reverse at some time in the future.
The fund’s tax-basis capital gains and losses are determined only at the end of each fiscal year. For tax purposes, at November 30, 2016, the fund had available capital losses totaling $45,481,000 to offset future net capital gains of $38,406,000 through November 30, 2017, $990,000 through November 30, 2018, and $6,085,000 through November 30, 2019. The fund will use these capital losses to offset net taxable capital gains, if any, realized during the year ending November 30, 2017; should the fund realize net capital losses for the year, the losses will be added to the loss carryforward balance above.
At May 31, 2017, the cost of investment securities for tax purposes was $11,486,571,000. Net unrealized appreciation of investment securities for tax purposes was $492,157,000, consisting of unrealized gains of $522,279,000 on securities that had risen in value since their purchase and $30,122,000 in unrealized losses on securities that had fallen in value since their purchase.
F. During the six months ended May 31, 2017, the fund purchased $1,183,259,000 of investment securities and sold $880,250,000 of investment securities, other than temporary cash investments.
141
California Intermediate-Term Tax-Exempt Fund
The fund purchased securities from and sold securities to other Vanguard funds or accounts managed by Vanguard or its affiliates, in accordance with procedures adopted by the board of trustees in compliance with Rule 17a-7 of the Investment Company Act of 1940. For the six months ended May 31, 2017, such purchases and sales were $198,865,000 and $326,510,000 these amounts are included in the purchases and sales of investment securities noted above.
| | | | |
| G. Capital share transactions for each class of shares were: | | | |
| | Six Months Ended | | Year Ended |
| | | May 31, 2017 | November 30, 2016 |
| | Amount | Shares | Amount | Shares |
| | ($000) | (000) | ($000) | (000) |
| Investor Shares | | | | |
| Issued | 249,094 | 21,447 | 612,863 | 51,141 |
| Issued in Lieu of Cash Distributions | 17,741 | 1,524 | 36,716 | 3,071 |
| Redeemed | (335,691) | (29,047) | (468,468) | (39,255) |
| Net Increase (Decrease)—Investor Shares | (68,856) | (6,076) | 181,111 | 14,957 |
| Admiral Shares | | | | |
| Issued | 1,675,070 | 144,481 | 2,723,838 | 227,485 |
| Issued in Lieu of Cash Distributions | 100,289 | 8,613 | 199,009 | 16,646 |
| Redeemed | (1,544,013) | (133,722) | (1,499,616) | (126,396) |
| Net Increase (Decrease)—Admiral Shares | 231,346 | 19,372 | 1,423,231 | 117,735 |
At May 31, 2017, one shareholder was the record or beneficial owner of 26% of the fund’s net assets. If the shareholder were to redeem its investment in the fund, the redemption might result in an increase in the fund’s expense ratio, cause the fund to incur higher transaction costs, or lead to the realization of taxable capital gains.
H. Management has determined that no material events or transactions occurred subsequent to May 31, 2017, that would require recognition or disclosure in these financial statements.
142
California Long-Term Tax-Exempt Fund
| | | |
| Fund Profile | | |
| As of May 31, 2017 | | |
| |
| Share-Class Characteristics | |
| | Investor | Admiral |
| | Shares | Shares |
| Ticker Symbol | | VCITX | VCLAX |
| Expense Ratio1 | 0.19% | 0.09% |
| 30-Day SEC Yield | 2.31% | 2.41% |
| |
| Financial Attributes | | |
| |
| | | Bloomberg | |
| | | Barclays | Bloomberg |
| | | CA | Barclays |
| | | Muni Bond | Municipal |
| | Fund | Index | Bond Index |
| Number of Bonds | 813 | 7,181 | 50,785 |
| Yield to Maturity | | | |
| (before expenses) | 2.3% | 2.0% | 2.1% |
| Average Coupon | 4.3% | 4.7% | 4.8% |
| Average Duration | 7.3 years | 6.3 years | 6.2 years |
| Average Stated | | | |
| Maturity | 16.9 years | 13.6 years | 12.9 years |
| Short-Term | | | |
| Reserves | 3.9% | — | — |
| | |
| Volatility Measures | | |
| | Bloomberg | Bloomberg |
| | Barclays CA | Barclays |
| | Muni Bond | Municipal |
| | Index | Bond Index |
| R-Squared | 0.98 | 0.98 |
| Beta | 1.23 | 1.25 |
These measures show the degree and timing of the fund’s fluctuations compared with the indexes over 36 months.
| |
| Distribution by Stated Maturity | |
| (% of portfolio) | |
| Under 1 Year | 4.1% |
| 1 - 3 Years | 4.1 |
| 3 - 5 Years | 2.6 |
| 5 - 10 Years | 7.6 |
| 10 - 20 Years | 42.9 |
| 20 - 30 Years | 34.5 |
| Over 30 Years | 4.2 |
Distribution by Credit Quality (% of portfolio)
| |
| AAA | 6.7% |
| AA | 70.9 |
| A | 14.2 |
| BBB | 6.4 |
| BB | 0.1 |
| B | 0.4 |
| Not Rated | 1.3 |
Credit-quality ratings are obtained from Moody's and S&P, and the higher rating for each issue is shown. "Not Rated" is used to
classify securities for which a rating is not available. Not rated securities include a fund's investment in Vanguard Market Liquidity
Fund or Vanguard Municipal Cash Management Fund, each of which invests in high-quality money market instruments and may
serve as a cash management vehicle for the Vanguard funds, trusts, and accounts. For more information about these ratings, see
the Glossary entry for Credit Quality.
1 The expense ratios shown are from the prospectus dated March 28, 2017, and represent estimated costs for the current fiscal year. For the six months ended May 31, 2017, the annualized expense ratios were 0.19% for Investor Shares and 0.09% for Admiral Shares.
143
California Long-Term Tax-Exempt Fund
Investment Focus
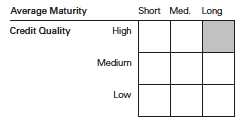
144
California Long-Term Tax-Exempt Fund
Performance Summary
All of the returns in this report represent past performance, which is not a guarantee of future results that may be achieved by the fund. (Current performance may be lower or higher than the performance data cited. For performance data current to the most recent month-end, visit our website at vanguard.com/performance.) Note, too, that both investment returns and principal value can fluctuate widely, so an investor’s shares, when sold, could be worth more or less than their original cost. The returns shown do not reflect taxes that a shareholder would pay on fund distributions or on the sale of fund shares.
| | | | |
| Fiscal-Year Total Returns (%): November 30, 2006, Through May 31, 2017 | |
| | | | | Bloomberg |
| | | | | Barclays CA |
| | | | | Muni Bond |
| | | | Investor Shares | Index |
| Fiscal Year | Income Returns | Capital Returns | Total Returns | Total Returns |
| 2007 | 4.52% | -3.37% | 1.15% | 2.17% |
| 2008 | 4.13 | -11.08 | -6.95 | -5.18 |
| 2009 | 4.96 | 7.75 | 12.71 | 13.21 |
| 2010 | 4.36 | 0.27 | 4.63 | 5.80 |
| 2011 | 4.51 | 2.09 | 6.60 | 7.49 |
| 2012 | 4.30 | 8.90 | 13.20 | 11.80 |
| 2013 | 3.64 | -7.60 | -3.96 | -2.92 |
| 2014 | 4.07 | 6.72 | 10.79 | 9.32 |
| 2015 | 3.62 | 0.41 | 4.03 | 3.30 |
| 2016 | 3.25 | -3.80 | -0.55 | -0.55 |
| 2017 | 1.74 | 4.20 | 5.94 | 5.21 |
| Note: For 2017, performance data reflect the six months ended May 31, 2017. | | |
Average Annual Total Returns: Periods Ended March 31, 2017
This table presents returns through the latest calendar quarter—rather than through the end of the fiscal period.
Securities and Exchange Commission rules require that we provide this information.
| | | | | | |
| | | | | | | Ten Years |
| | Inception Date | One Year | Five Years | Income | Capital | Total |
| Investor Shares | 4/7/1986 | -0.35% | 4.15% | 4.10% | 0.14% | 4.24% |
| Admiral Shares | 11/12/2001 | -0.24 | 4.24 | 4.19 | 0.14 | 4.33 |
See Financial Highlights for dividend and capital gains information.
145
California Long-Term Tax-Exempt Fund
Financial Statements (unaudited)
Statement of Net Assets
As of May 31, 2017
The fund reports a complete list of its holdings in regulatory filings four times in each fiscal year, at the quarter-ends. For the second and fourth fiscal quarters, the lists appear in the fund’s semiannual and annual reports to shareholders. For the first and third fiscal quarters, the fund files the lists with the Securities and Exchange Commission on Form N-Q. Shareholders can look up the fund’s Forms N-Q on the SEC’s website at sec.gov. Forms N-Q may also be reviewed and copied at the SEC’s Public Reference Room (see the back cover of this report for further information).
| | | | |
| | | | Face | Market |
| | | Maturity | Amount | Value• |
| | Coupon | Date | ($000) | ($000) |
| Tax-Exempt Municipal Bonds (100.1%) | | | | |
| California (99.9%) | | | | |
| ABAG Finance Authority for Nonprofit Corps. | | | | |
| California Revenue (Episcopal Senior | | | | |
| Communities) | 5.000% | 7/1/42 | 1,000 | 1,078 |
| ABAG Finance Authority for Nonprofit Corps. | | | | |
| California Revenue (Eskaton Properties Inc. | | | | |
| Obligated Group) | 5.000% | 11/15/35 | 3,250 | 3,504 |
| ABAG Finance Authority for Nonprofit Corps. | | | | |
| California Revenue (Jackson Laboratory) | 5.000% | 7/1/37 | 7,565 | 8,299 |
| ABAG Finance Authority for Nonprofit Corps. | | | | |
| California Revenue (Sharp Healthcare) | 5.000% | 8/1/43 | 15,830 | 17,799 |
| Alameda CA Community Improvement | | | | |
| Commission Successor Agency Tax | | | | |
| Allocation Revenue | 5.000% | 9/1/29 (15) | 1,500 | 1,735 |
| Alameda CA Corridor Transportation Authority | | | | |
| Revenue | 0.000% | 10/1/30 (2) | 30,375 | 17,925 |
| Alameda CA Corridor Transportation Authority | | | | |
| Revenue | 5.000% | 10/1/35 | 1,000 | 1,143 |
| Alameda CA Corridor Transportation Authority | | | | |
| Revenue | 5.000% | 10/1/36 | 1,000 | 1,140 |
| Alameda CA Corridor Transportation Authority | | | | |
| Revenue | 4.000% | 10/1/37 (4) | 1,500 | 1,560 |
| Alameda CA Corridor Transportation Authority | | | | |
| Revenue | 5.000% | 10/1/37 | 6,550 | 7,444 |
| Alameda County CA Unified School District GO | 0.000% | 8/1/24 (4) | 3,510 | 3,026 |
| Alameda County CA Unified School District GO | 0.000% | 8/1/29 (4) | 5,000 | 3,459 |
| Anaheim CA Housing & Public Improvements | | | | |
| Authority Revenue (Electric Utility Distribution | | | | |
| System) | 5.000% | 10/1/41 | 2,225 | 2,499 |
| Anaheim CA Housing & Public Improvements | | | | |
| Authority Revenue (Water System Project) | 5.000% | 10/1/41 | 2,250 | 2,535 |
| Anaheim CA Housing & Public Improvements | | | | |
| Authority Revenue (Water System Project) | 5.000% | 10/1/46 | 3,255 | 3,667 |
| Anaheim CA Public Financing Authority Revenue | | | | |
| (Electric System) | 4.000% | 10/1/31 | 5,080 | 5,501 |
| 1 Bay Area Toll Authority California Toll Bridge | | | | |
| Revenue (San Francisco Bay Area) | 5.625% | 4/1/19 (Prere.) | 10,000 | 10,856 |
146
California Long-Term Tax-Exempt Fund
| | | | |
| | | | Face | Market |
| | | Maturity | Amount | Value• |
| | Coupon | Date | ($000) | ($000) |
| Bay Area Toll Authority California Toll Bridge | | | | |
| Revenue (San Francisco Bay Area) | 5.000% | 4/1/31 | 4,000 | 4,648 |
| Bay Area Toll Authority California Toll Bridge | | | | |
| Revenue (San Francisco Bay Area) | 5.000% | 10/1/42 | 5,000 | 5,517 |
| Bay Area Toll Authority California Toll Bridge | | | | |
| Revenue (San Francisco Bay Area) | 5.000% | 4/1/43 | 4,000 | 4,544 |
| Bay Area Toll Authority California Toll Bridge | | | | |
| Revenue (San Francisco Bay Area) | 5.250% | 4/1/53 | 2,350 | 2,688 |
| Bay Area Toll Authority California Toll Bridge | | | | |
| Revenue (San Francisco Bay Area) | 5.000% | 10/1/54 | 25,260 | 28,249 |
| Bay Area Toll Authority California Toll Bridge | | | | |
| Revenue (San Francisco Bay Area) | 5.000% | 4/1/56 | 20,000 | 23,034 |
| Beverly Hills CA Unified School District GO | 4.000% | 8/1/40 | 5,000 | 5,348 |
| Brentwood CA Infrastructure Financing Authority | | | | |
| Revenue | 5.000% | 9/2/28 (4) | 2,135 | 2,514 |
| Cabrillo CA Community College District Revenue | 0.000% | 5/1/26 (2) | 9,000 | 6,289 |
| California County CA Tobacco Securitization | | | | |
| Agency Revenue | 5.450% | 6/1/28 | 7,500 | 7,689 |
| California Department of Water Resources Water | | | | |
| System Revenue (Central Valley Project) | 5.000% | 12/1/24 (Prere.) | 25 | 31 |
| California Department of Water Resources Water | | | | |
| System Revenue (Central Valley Project) | 5.000% | 12/1/28 | 2,500 | 3,132 |
| California Department of Water Resources Water | | | | |
| System Revenue (Central Valley Project) | 5.000% | 12/1/29 | 6,475 | 7,825 |
| California Department of Water Resources Water | | | | |
| System Revenue (Central Valley Project) | 5.000% | 12/1/33 | 2,010 | 2,438 |
| California Educational Facilities Authority Revenue | | | | |
| (Claremont McKenna College) | 5.000% | 1/1/28 | 1,250 | 1,536 |
| California Educational Facilities Authority Revenue | | | | |
| (Claremont McKenna College) | 5.000% | 1/1/29 | 1,000 | 1,219 |
| California Educational Facilities Authority Revenue | | | | |
| (Claremont McKenna College) | 4.000% | 1/1/39 | 10,000 | 10,489 |
| California Educational Facilities Authority Revenue | | | | |
| (College of Arts & Crafts) | 6.875% | 6/1/19 | 1,190 | 1,268 |
| California Educational Facilities Authority Revenue | | | | |
| (College of Arts) | 5.250% | 6/1/30 | 1,125 | 1,219 |
| California Educational Facilities Authority Revenue | | | | |
| (Occidental College) | 5.000% | 10/1/37 | 1,130 | 1,328 |
| California Educational Facilities Authority Revenue | | | | |
| (Occidental College) | 5.000% | 10/1/45 | 1,425 | 1,653 |
| California Educational Facilities Authority Revenue | | | | |
| (Pepperdine College) | 5.000% | 9/1/33 | 3,000 | 3,453 |
| California Educational Facilities Authority Revenue | | | | |
| (Pepperdine College) | 5.000% | 12/1/39 | 2,000 | 2,339 |
| California Educational Facilities Authority Revenue | | | | |
| (Pepperdine College) | 5.000% | 9/1/45 | 5,000 | 5,793 |
| California Educational Facilities Authority Revenue | | | | |
| (Santa Clara University) | 5.000% | 4/1/39 | 5,880 | 6,829 |
| California Educational Facilities Authority Revenue | | | | |
| (Santa Clara University) | 5.000% | 4/1/45 | 6,500 | 7,485 |
| California Educational Facilities Authority Revenue | | | | |
| (Stanford University) | 5.000% | 3/15/26 | 3,000 | 3,794 |
| California Educational Facilities Authority Revenue | | | | |
| (Stanford University) | 5.250% | 4/1/40 | 6,000 | 8,159 |
147
California Long-Term Tax-Exempt Fund
| | | | |
| | | | Face | Market |
| | | Maturity | Amount | Value• |
| | Coupon | Date | ($000) | ($000) |
| California Educational Facilities Authority Revenue | | | | |
| (Stanford University) | 5.000% | 6/1/43 | 3,760 | 5,029 |
| California Educational Facilities Authority Revenue | | | | |
| (Stanford University) | 5.000% | 5/1/45 | 4,000 | 5,395 |
| California Educational Facilities Authority Revenue | | | | |
| (Stanford University) | 5.000% | 6/1/46 | 9,000 | 12,192 |
| California Educational Facilities Authority Revenue | | | | |
| (University of San Francisco) | 6.125% | 10/1/36 | 1,250 | 1,477 |
| California Educational Facilities Authority Revenue | | | | |
| (University of Southern California) | 5.250% | 10/1/18 (Prere.) | 3,420 | 3,622 |
| 2 California Educational Facilities Authority Revenue | | | | |
| (University of Southern California) TOB VRDO | 0.840% | 6/7/17 | 7,388 | 7,388 |
| California Educational Facilities Authority Revenue | | | | |
| (University of the Pacific) | 5.000% | 11/1/30 | 3,225 | 3,792 |
| California Educational Facilities Authority Revenue | | | | |
| (University of the Pacific) | 5.000% | 11/1/36 | 3,235 | 3,713 |
| California GO | 5.250% | 3/1/18 (Prere.) | 5,335 | 5,513 |
| California GO | 5.250% | 8/1/18 (Prere.) | 5,115 | 5,383 |
| California GO | 6.000% | 8/1/19 (14) | 210 | 212 |
| California GO | 5.000% | 4/1/20 | 1,460 | 1,571 |
| California GO | 5.000% | 9/1/20 | 5,000 | 5,634 |
| California GO | 5.000% | 9/1/21 | 5,000 | 5,798 |
| California GO | 5.000% | 9/1/21 | 11,000 | 12,756 |
| California GO | 5.000% | 11/1/23 | 7,000 | 8,517 |
| California GO | 5.000% | 5/1/24 | 3,000 | 3,676 |
| California GO | 5.000% | 11/1/24 | 6,670 | 8,245 |
| California GO | 5.000% | 3/1/25 | 7,000 | 7,750 |
| California GO | 5.000% | 3/1/27 | 10,000 | 12,165 |
| California GO | 3.500% | 8/1/27 | 9,000 | 9,951 |
| California GO | 5.250% | 10/1/27 | 5,000 | 5,848 |
| California GO | 5.100% | 11/1/27 | 1,475 | 1,671 |
| California GO | 5.000% | 3/1/28 | 10,000 | 12,064 |
| California GO | 5.000% | 8/1/28 | 2,875 | 3,492 |
| California GO | 5.000% | 8/1/28 | 6,400 | 7,877 |
| California GO | 4.000% | 9/1/28 | 6,000 | 6,824 |
| California GO | 5.000% | 9/1/28 | 5,930 | 7,307 |
| California GO | 5.000% | 10/1/29 | 1,400 | 1,529 |
| California GO | 5.250% | 10/1/29 | 4,700 | 5,161 |
| California GO | 5.250% | 3/1/30 | 10,000 | 11,099 |
| California GO | 4.500% | 8/1/30 | 15 | 15 |
| California GO | 5.000% | 8/1/30 | 3,225 | 3,914 |
| California GO | 5.000% | 9/1/30 | 1,500 | 1,724 |
| California GO | 5.250% | 9/1/30 | 6,000 | 6,958 |
| California GO | 5.750% | 4/1/31 | 15,875 | 17,258 |
| California GO | 5.000% | 8/1/31 | 9,460 | 11,297 |
| California GO | 5.000% | 9/1/31 | 1,800 | 2,062 |
| California GO | 5.000% | 9/1/31 | 8,380 | 10,108 |
| California GO | 5.000% | 10/1/31 | 4,500 | 5,339 |
| California GO | 4.000% | 8/1/32 | 10,000 | 10,888 |
| California GO | 4.000% | 9/1/32 | 7,500 | 8,171 |
| California GO | 5.000% | 9/1/32 | 1,045 | 1,192 |
| California GO | 5.000% | 9/1/32 | 2,775 | 3,332 |
| California GO | 5.000% | 10/1/32 | 8,790 | 10,389 |
| California GO | 5.000% | 2/1/33 | 2,615 | 3,002 |
148
California Long-Term Tax-Exempt Fund
| | | | |
| | | | Face | Market |
| | | Maturity | Amount | Value• |
| | Coupon | Date | ($000) | ($000) |
| California GO | 6.000% | 3/1/33 | 7,000 | 7,892 |
| California GO | 5.125% | 4/1/33 | 8,500 | 8,792 |
| California GO | 6.500% | 4/1/33 | 33,000 | 36,354 |
| California GO | 5.000% | 8/1/33 | 2,635 | 3,091 |
| California GO | 5.000% | 8/1/33 | 5,000 | 5,968 |
| California GO | 5.000% | 10/1/33 | 4,000 | 4,707 |
| California GO | 5.250% | 4/1/35 | 5,000 | 5,752 |
| California GO | 4.000% | 8/1/35 | 10,000 | 10,705 |
| California GO | 4.000% | 9/1/35 | 9,550 | 10,228 |
| California GO | 6.000% | 11/1/35 | 5,000 | 5,597 |
| California GO | 4.000% | 8/1/36 | 10,000 | 10,672 |
| California GO | 5.000% | 9/1/36 | 8,500 | 9,769 |
| California GO | 5.000% | 4/1/37 | 5,000 | 5,712 |
| California GO | 5.250% | 3/1/38 | 2,665 | 2,747 |
| California GO | 6.000% | 4/1/38 | 21,190 | 23,152 |
| California GO | 5.250% | 8/1/38 | 4,885 | 5,116 |
| California GO | 5.000% | 10/1/39 | 7,615 | 8,828 |
| California GO | 5.500% | 11/1/39 | 3,690 | 4,049 |
| California GO | 6.000% | 11/1/39 | 2,700 | 3,023 |
| California GO | 5.500% | 3/1/40 | 11,500 | 12,777 |
| California GO | 4.000% | 12/1/40 | 5,000 | 5,204 |
| California GO | 5.000% | 10/1/41 | 5,000 | 5,597 |
| California GO | 5.000% | 4/1/42 | 2,000 | 2,260 |
| California GO | 5.000% | 9/1/42 | 8,515 | 9,713 |
| California GO | 5.000% | 2/1/43 | 6,265 | 7,095 |
| California GO | 5.000% | 4/1/43 | 6,500 | 7,384 |
| California GO | 5.000% | 11/1/43 | 12,425 | 14,272 |
| California GO | 5.000% | 12/1/43 | 5,335 | 6,138 |
| California GO | 5.000% | 5/1/44 | 5,000 | 5,735 |
| California GO | 5.000% | 8/1/45 | 11,735 | 13,608 |
| California GO | 5.000% | 8/1/46 | 10,000 | 11,688 |
| California Health Facilities Financing Authority | | | | |
| Revenue (Adventist Health System/West) | 5.000% | 3/1/25 | 3,000 | 3,518 |
| California Health Facilities Financing Authority | | | | |
| Revenue (Adventist Health System/West) | 4.000% | 3/1/33 | 1,000 | 1,051 |
| California Health Facilities Financing Authority | | | | |
| Revenue (Adventist Health System/West) | 4.000% | 3/1/39 | 10,000 | 10,374 |
| California Health Facilities Financing Authority | | | | |
| Revenue (Catholic Healthcare West) | 6.000% | 7/1/19 (Prere.) | 5,000 | 5,524 |
| California Health Facilities Financing Authority | | | | |
| Revenue (Catholic Healthcare West) | 5.625% | 7/1/25 | 5,000 | 5,421 |
| California Health Facilities Financing Authority | | | | |
| Revenue (Catholic Healthcare West) | 5.250% | 3/1/27 | 2,500 | 2,824 |
| California Health Facilities Financing Authority | | | | |
| Revenue (Catholic Healthcare West) | 5.250% | 3/1/41 | 9,000 | 9,766 |
| California Health Facilities Financing Authority | | | | |
| Revenue (Cedars-Sinai Medical Center) | 5.000% | 11/15/27 | 5,000 | 6,096 |
| California Health Facilities Financing Authority | | | | |
| Revenue (Cedars-Sinai Medical Center) | 5.000% | 11/15/30 | 2,000 | 2,383 |
| California Health Facilities Financing Authority | | | | |
| Revenue (Cedars-Sinai Medical Center) | 5.000% | 8/15/32 | 5,000 | 5,968 |
| California Health Facilities Financing Authority | | | | |
| Revenue (Cedars-Sinai Medical Center) | 5.000% | 8/15/35 | 5,000 | 5,896 |
149
California Long-Term Tax-Exempt Fund
| | | | |
| | | | Face | Market |
| | | Maturity | Amount | Value• |
| | Coupon | Date | ($000) | ($000) |
| California Health Facilities Financing Authority | | | | |
| Revenue (Cedars-Sinai Medical Center) | 4.000% | 8/15/39 | 5,000 | 5,259 |
| California Health Facilities Financing Authority | | | | |
| Revenue (Children’s Hospital of Los Angeles) | 5.000% | 11/15/29 | 3,500 | 3,924 |
| 3 California Health Facilities Financing Authority | | | | |
| Revenue (Children’s Hospital of Los Angeles) | 5.000% | 8/15/42 | 7,500 | 8,505 |
| California Health Facilities Financing Authority | | | | |
| Revenue (Children’s Hospital of Orange County) | 6.500% | 11/1/38 | 3,000 | 3,381 |
| California Health Facilities Financing Authority | | | | |
| Revenue (Children’s Hospital of Orange County) | 5.250% | 11/1/41 | 4,025 | 4,516 |
| California Health Facilities Financing Authority | | | | |
| Revenue (Chinese Hospital Association) | 5.000% | 6/1/37 | 2,000 | 2,238 |
| California Health Facilities Financing Authority | | | | |
| Revenue (Chinese Hospital Association) | 5.000% | 6/1/42 | 5,000 | 5,602 |
| California Health Facilities Financing Authority | | | | |
| Revenue (City of Hope Medical Center) | 5.000% | 11/15/32 | 4,250 | 4,840 |
| California Health Facilities Financing Authority | | | | |
| Revenue (City of Hope Medical Center) | 5.000% | 11/15/35 | 7,750 | 8,821 |
| California Health Facilities Financing Authority | | | | |
| Revenue (City of Hope Medical Center) | 5.000% | 11/15/39 | 4,465 | 5,055 |
| California Health Facilities Financing Authority | | | | |
| Revenue (El Camino Hospital) | 5.000% | 2/1/26 | 2,740 | 3,279 |
| California Health Facilities Financing Authority | | | | |
| Revenue (El Camino Hospital) | 5.000% | 2/1/27 | 1,840 | 2,184 |
| California Health Facilities Financing Authority | | | | |
| Revenue (El Camino Hospital) | 5.000% | 2/1/40 | 6,000 | 6,703 |
| California Health Facilities Financing Authority | | | | |
| Revenue (El Camino Hospital) | 5.000% | 2/1/47 | 7,000 | 7,903 |
| California Health Facilities Financing Authority | | | | |
| Revenue (Kaiser Permanente) | 5.000% | 11/1/27 | 7,000 | 8,825 |
| California Health Facilities Financing Authority | | | | |
| Revenue (Kaiser Permanente) | 4.000% | 11/1/44 | 14,000 | 14,458 |
| California Health Facilities Financing Authority | | | | |
| Revenue (Kaiser Permanente) | 5.000% | 11/1/47 | 16,800 | 21,568 |
| California Health Facilities Financing Authority | | | | |
| Revenue (Kaiser Permanente) | 4.000% | 11/1/51 | 4,000 | 4,072 |
| 2 California Health Facilities Financing Authority | | | | |
| Revenue (Kaiser Permanente) TOB VRDO | 0.800% | 6/7/17 | 15,000 | 15,000 |
| California Health Facilities Financing Authority | | | | |
| Revenue (Lucile Salter Packard Children’s | | | | |
| Hospital at Stanford) | 5.000% | 8/15/43 | 5,300 | 5,949 |
| California Health Facilities Financing Authority | | | | |
| Revenue (Lucile Salter Packard Children’s | | | | |
| Hospital at Stanford) | 5.000% | 8/15/55 | 7,000 | 7,919 |
| California Health Facilities Financing Authority | | | | |
| Revenue (Marshall Medical Center) | 5.000% | 11/1/29 | 1,000 | 1,158 |
| California Health Facilities Financing Authority | | | | |
| Revenue (Marshall Medical Center) | 5.000% | 11/1/33 | 1,100 | 1,252 |
| California Health Facilities Financing Authority | | | | |
| Revenue (Memorial Health Services) | 5.000% | 10/1/25 | 2,750 | 3,204 |
| California Health Facilities Financing Authority | | | | |
| Revenue (Memorial Health Services) | 5.000% | 10/1/26 | 5,000 | 5,803 |
| California Health Facilities Financing Authority | | | | |
| Revenue (Memorial Health Services) | 5.000% | 10/1/33 | 2,500 | 2,848 |
150
California Long-Term Tax-Exempt Fund
| | | | |
| | | | Face | Market |
| | | Maturity | Amount | Value• |
| | Coupon | Date | ($000) | ($000) |
| California Health Facilities Financing Authority | | | | |
| Revenue (Northern California Presbyterian | | | | |
| Homes & Services) | 5.000% | 7/1/34 | 645 | 735 |
| California Health Facilities Financing Authority | | | | |
| Revenue (Northern California Presbyterian | | | | |
| Homes & Services) | 5.000% | 7/1/39 | 1,600 | 1,818 |
| California Health Facilities Financing Authority | | | | |
| Revenue (Northern California Presbyterian | | | | |
| Homes & Services) | 5.000% | 7/1/44 | 1,500 | 1,697 |
| California Health Facilities Financing Authority | | | | |
| Revenue (Providence Health & Services) | 6.500% | 10/1/18 (Prere.) | 2,000 | 2,150 |
| California Health Facilities Financing Authority | | | | |
| Revenue (Providence Health & Services) | 5.000% | 10/1/29 | 2,390 | 2,823 |
| California Health Facilities Financing Authority | | | | |
| Revenue (Providence Health & Services) | 5.000% | 10/1/38 | 6,000 | 6,908 |
| California Health Facilities Financing Authority | | | | |
| Revenue (Providence Health & Services) | 5.500% | 10/1/39 | 6,500 | 7,080 |
| California Health Facilities Financing Authority | | | | |
| Revenue (Providence St. Joseph Health | | | | |
| Obligated Group) | 4.000% | 10/1/47 | 10,000 | 10,322 |
| California Health Facilities Financing Authority | | | | |
| Revenue (Rady Children’s Hospital) | 5.500% | 8/15/33 | 3,920 | 4,464 |
| California Health Facilities Financing Authority | | | | |
| Revenue (Scripps Health) | 5.000% | 11/15/40 | 8,000 | 9,033 |
| California Health Facilities Financing Authority | | | | |
| Revenue (St. Joseph Health System) | 5.750% | 7/1/39 | 7,000 | 7,593 |
| California Health Facilities Financing Authority | | | | |
| Revenue (Stanford Hospital) | 5.000% | 8/15/42 | 5,000 | 5,627 |
| California Health Facilities Financing Authority | | | | |
| Revenue (Stanford Hospital) | 5.000% | 8/15/51 | 5,000 | 5,596 |
| California Health Facilities Financing Authority | | | | |
| Revenue (Stanford Hospital) | 5.000% | 8/15/54 | 2,000 | 2,250 |
| California Health Facilities Financing Authority | | | | |
| Revenue (Sutter Health) | 5.875% | 8/15/31 | 4,000 | 4,571 |
| California Health Facilities Financing Authority | | | | |
| Revenue (Sutter Health) | 4.000% | 8/15/40 | 6,500 | 6,735 |
| California Health Facilities Financing Authority | | | | |
| Revenue (Sutter Health) | 5.000% | 8/15/43 | 9,000 | 10,202 |
| California Health Facilities Financing Authority | | | | |
| Revenue (Sutter Health) | 5.000% | 11/15/46 | 26,000 | 29,746 |
| California Health Facilities Financing Authority | | | | |
| Revenue (Sutter Health) | 5.000% | 11/15/46 | 22,000 | 25,038 |
| California Infrastructure & Economic | | | | |
| Development Bank Revenue | 5.000% | 10/1/26 | 5,000 | 6,304 |
| California Infrastructure & Economic | | | | |
| Development Bank Revenue | 5.000% | 10/1/28 | 3,400 | 4,217 |
| California Infrastructure & Economic | | | | |
| Development Bank Revenue | 5.000% | 10/1/29 | 3,445 | 4,280 |
| California Infrastructure & Economic | | | | |
| Development Bank Revenue | 5.000% | 10/1/33 | 3,000 | 3,646 |
| California Infrastructure & Economic | | | | |
| Development Bank Revenue | 5.000% | 10/1/34 | 5,000 | 5,998 |
| California Infrastructure & Economic Development | | | | |
| Bank Revenue (Academy of Motion Picture Arts | | | | |
| & Sciences Obligated Group) | 5.000% | 11/1/30 | 2,000 | 2,353 |
151
California Long-Term Tax-Exempt Fund
| | | | |
| | | | Face | Market |
| | | Maturity | Amount | Value• |
| | Coupon | Date | ($000) | ($000) |
| California Infrastructure & Economic Development | | | | |
| Bank Revenue (Academy of Motion Picture | | | | |
| Arts & Sciences Obligated Group) | 5.000% | 11/1/41 | 6,000 | 6,865 |
| California Infrastructure & Economic Development | | | | |
| Bank Revenue (Pacific Gas & Electric Co.) VRDO | 0.690% | 6/1/17 LOC | 10,000 | 10,000 |
| California Infrastructure & Economic Development | | | | |
| Bank Revenue (Science Center Phase II Project) | 5.000% | 5/1/28 | 1,220 | 1,459 |
| California Infrastructure & Economic Development | | | | |
| Bank Revenue (Science Center Phase II Project) | 5.000% | 5/1/29 | 1,290 | 1,529 |
| California Municipal Finance Authority | | | | |
| (Community Hospitals of Central California | | | | |
| Obligated Group) COP | 5.500% | 2/1/19 (Prere.) | 11,000 | 11,837 |
| California Municipal Finance Authority Pollution | | | | |
| Control Revenue (Chevron USA Inc. Project) | | | | |
| VRDO | 0.690% | 6/1/17 | 2,555 | 2,555 |
| California Municipal Finance Authority Recovery | | | | |
| Zone Revenue (Chevron USA Inc. Project) VRDO | 0.690% | 6/1/17 | 1,300 | 1,300 |
| California Municipal Finance Authority Revenue | | | | |
| (Anaheim Electric Utility Distribution System) | 5.000% | 10/1/23 | 1,200 | 1,459 |
| California Municipal Finance Authority Revenue | | | | |
| (Anaheim Electric Utility Distribution System) | 5.000% | 10/1/33 | 2,120 | 2,506 |
| California Municipal Finance Authority Revenue | | | | |
| (Anaheim Electric Utility Distribution System) | 5.000% | 10/1/34 | 1,340 | 1,574 |
| California Municipal Finance Authority Revenue | | | | |
| (Anaheim Water System Project Revenue) | 4.000% | 10/1/34 | 4,560 | 4,886 |
| California Municipal Finance Authority Revenue | | | | |
| (Azusa Pacific University) | 5.000% | 4/1/35 | 2,000 | 2,170 |
| California Municipal Finance Authority Revenue | | | | |
| (Azusa Pacific University) | 5.000% | 4/1/41 | 4,000 | 4,306 |
| California Municipal Finance Authority Revenue | | | | |
| (Biola University) | 5.000% | 10/1/33 | 625 | 729 |
| California Municipal Finance Authority Revenue | | | | |
| (Biola University) | 5.000% | 10/1/38 | 1,255 | 1,388 |
| California Municipal Finance Authority Revenue | | | | |
| (Biola University) | 5.000% | 10/1/42 | 2,500 | 2,756 |
| California Municipal Finance Authority Revenue | | | | |
| (Community Hospitals of Central California | | | | |
| Obligated Group) | 5.000% | 2/1/28 | 1,800 | 2,151 |
| California Municipal Finance Authority Revenue | | | | |
| (Community Hospitals of Central California | | | | |
| Obligated Group) | 5.000% | 2/1/31 | 2,370 | 2,761 |
| California Municipal Finance Authority Revenue | | | | |
| (Community Hospitals of Central California | | | | |
| Obligated Group) | 5.000% | 2/1/40 | 5,000 | 5,532 |
| California Municipal Finance Authority Revenue | | | | |
| (Community Hospitals of Central California | | | | |
| Obligated Group) | 5.000% | 2/1/47 | 9,200 | 10,331 |
| 3 California Municipal Finance Authority Revenue | | | | |
| (Eisenhower Medical Center) | 5.000% | 7/1/32 | 750 | 867 |
| 3 California Municipal Finance Authority Revenue | | | | |
| (Eisenhower Medical Center) | 5.000% | 7/1/34 | 1,750 | 2,006 |
| 3 California Municipal Finance Authority Revenue | | | | |
| (Eisenhower Medical Center) | 5.000% | 7/1/42 | 5,250 | 5,942 |
152
California Long-Term Tax-Exempt Fund
| | | | |
| | | | Face | Market |
| | | Maturity | Amount | Value• |
| | Coupon | Date | ($000) | ($000) |
| California Municipal Finance Authority Revenue | | | | |
| (Institute on Aging Project) | 5.000% | 8/15/37 | 930 | 1,085 |
| California Municipal Finance Authority Revenue | | | | |
| (NorthBay Healthcare Group) | 5.000% | 11/1/35 | 690 | 764 |
| California Municipal Finance Authority Revenue | | | | |
| (NorthBay Healthcare Group) | 5.250% | 11/1/41 | 5,000 | 5,671 |
| California Municipal Finance Authority Revenue | | | | |
| (NorthBay Healthcare Group) | 5.000% | 11/1/44 | 1,800 | 1,969 |
| California Municipal Finance Authority Revenue | | | | |
| (University of La Verne) | 5.250% | 6/1/20 (ETM) | 2,420 | 2,723 |
| California Municipal Finance Authority Student | | | | |
| Housing Revenue (Bowles Hall Foundation) | 5.000% | 6/1/50 | 2,580 | 2,746 |
| California Municipal Finance Authority Water | | | | |
| Revenue (San Bernardino Municipal Water | | | | |
| Department) | 5.000% | 8/1/46 (15) | 7,500 | 8,578 |
| California Pollution Control Financing Authority | | | | |
| Revenue (Pacific Gas & Electric Co.) VRDO | 0.610% | 6/1/17 LOC | 59,025 | 59,025 |
| California Pollution Control Financing Authority | | | | |
| Revenue (Pacific Gas & Electric Co.) VRDO | 0.640% | 6/1/17 LOC | 1,250 | 1,250 |
| California Pollution Control Financing Authority | | | | |
| Water Furnishing Revenue (San Diego County | | | | |
| Water Authority Desalination Project Pipeline) | 5.000% | 11/21/45 | 1,500 | 1,503 |
| California Public Works Board Lease Revenue | | | | |
| (Department of Corrections) | 4.500% | 9/1/35 | 4,000 | 4,383 |
| California Public Works Board Lease Revenue | | | | |
| (Department of General Services) | 6.000% | 4/1/19 (Prere.) | 6,000 | 6,557 |
| California Public Works Board Lease Revenue | | | | |
| (Department of General Services) | 6.250% | 4/1/19 (Prere.) | 8,250 | 9,053 |
| California Public Works Board Lease Revenue | | | | |
| (Judicial Council Projects) | 5.000% | 3/1/29 | 2,500 | 2,886 |
| California Public Works Board Lease Revenue | | | | |
| (Judicial Council Projects) | 5.000% | 3/1/34 | 1,300 | 1,475 |
| California Public Works Board Lease Revenue | | | | |
| (Judicial Council Projects) | 5.000% | 3/1/38 | 3,375 | 3,801 |
| California Public Works Board Lease Revenue | | | | |
| (Various Capital Projects) | 6.250% | 11/1/19 (Prere.) | 5,000 | 5,636 |
| California Public Works Board Lease Revenue | | | | |
| (Various Capital Projects) | 5.000% | 4/1/23 | 4,180 | 4,868 |
| California Public Works Board Lease Revenue | | | | |
| (Various Capital Projects) | 5.000% | 11/1/23 | 2,000 | 2,359 |
| California Public Works Board Lease Revenue | | | | |
| (Various Capital Projects) | 5.000% | 11/1/26 | 5,000 | 5,872 |
| California Public Works Board Lease Revenue | | | | |
| (Various Capital Projects) | 4.000% | 11/1/30 | 6,000 | 6,578 |
| California Public Works Board Lease Revenue | | | | |
| (Various Capital Projects) | 4.000% | 4/1/33 | 2,220 | 2,379 |
| California Public Works Board Lease Revenue | | | | |
| (Various Capital Projects) | 5.500% | 11/1/33 | 2,330 | 2,808 |
| California Public Works Board Lease Revenue | | | | |
| (Various Capital Projects) | 5.000% | 11/1/37 | 5,000 | 5,706 |
| California Public Works Board Lease Revenue | | | | |
| (Various Capital Projects) | 5.000% | 9/1/39 | 3,000 | 3,445 |
| California State University Systemwide Revenue | 5.250% | 5/1/19 (Prere.) | 5,000 | 5,414 |
| 1 California State University Systemwide Revenue | 5.250% | 5/1/19 (Prere.) | 3,280 | 3,551 |
153
California Long-Term Tax-Exempt Fund
| | | | |
| | | | Face | Market |
| | | Maturity | Amount | Value• |
| | Coupon | Date | ($000) | ($000) |
| California State University Systemwide Revenue | 5.750% | 5/1/19 (Prere.) | 4,500 | 4,915 |
| California State University Systemwide Revenue | 5.000% | 11/1/24 | 2,000 | 2,320 |
| California State University Systemwide Revenue | 5.000% | 11/1/26 | 3,000 | 3,714 |
| California State University Systemwide Revenue | 5.000% | 11/1/30 | 13,650 | 16,522 |
| California State University Systemwide Revenue | 5.000% | 11/1/30 | 2,500 | 3,021 |
| California State University Systemwide Revenue | 5.000% | 11/1/31 | 5,150 | 6,205 |
| California State University Systemwide Revenue | 5.000% | 11/1/31 | 7,000 | 8,277 |
| California State University Systemwide Revenue | 5.000% | 11/1/32 | 6,535 | 7,845 |
| California State University Systemwide Revenue | 5.000% | 11/1/32 | 7,000 | 8,240 |
| California State University Systemwide Revenue | 4.000% | 11/1/37 | 1,875 | 1,994 |
| California State University Systemwide Revenue | 5.000% | 11/1/37 | 10,000 | 11,346 |
| California State University Systemwide Revenue | 5.000% | 11/1/37 | 3,750 | 4,348 |
| California State University Systemwide Revenue | 4.000% | 11/1/38 | 1,385 | 1,469 |
| California State University Systemwide Revenue | 5.000% | 11/1/38 | 4,000 | 4,682 |
| California State University Systemwide Revenue | 5.000% | 11/1/42 | 1,355 | 1,527 |
| California State University Systemwide Revenue | 5.000% | 11/1/43 | 1,810 | 2,102 |
| California State University Systemwide Revenue | 5.000% | 11/1/47 | 8,620 | 9,970 |
| California State University Systemwide Revenue | 5.000% | 11/1/47 | 5,720 | 6,738 |
| California State University Systemwide Revenue | | | | |
| PUT | 3.000% | 11/1/19 | 7,000 | 7,262 |
| California Statewide Communities Development | | | | |
| Authority Pollution Control Revenue (Chevron | | | | |
| USA Inc. Project) VRDO | 0.690% | 6/1/17 | 5,100 | 5,100 |
| California Statewide Communities Development | | | | |
| Authority Revenue (899 Charleston Project) | 5.250% | 11/1/44 | 1,000 | 1,027 |
| California Statewide Communities Development | | | | |
| Authority Revenue (899 Charleston Project) | 5.375% | 11/1/49 | 2,300 | 2,376 |
| California Statewide Communities Development | | | | |
| Authority Revenue (Adventist Health | | | | |
| System/West) | 5.000% | 3/1/27 | 2,000 | 2,438 |
| California Statewide Communities Development | | | | |
| Authority Revenue (Adventist Health | | | | |
| System/West) | 5.000% | 3/1/31 | 4,745 | 5,590 |
| California Statewide Communities Development | | | | |
| Authority Revenue (Adventist Health | | | | |
| System/West) | 5.000% | 3/1/45 | 4,315 | 4,861 |
| California Statewide Communities Development | | | | |
| Authority Revenue (Buck Institute for Age | | | | |
| Research) | 5.000% | 11/15/29 (4) | 940 | 1,104 |
| California Statewide Communities Development | | | | |
| Authority Revenue (Buck Institute for Age | | | | |
| Research) | 5.000% | 11/15/44 (4) | 5,500 | 6,234 |
| California Statewide Communities Development | | | | |
| Authority Revenue (Buck Institute for Age | | | | |
| Research) | 5.000% | 11/15/49 (4) | 1,000 | 1,130 |
| California Statewide Communities Development | | | | |
| Authority Revenue (Cottage Health System | | | | |
| Obligated Group) | 5.000% | 11/1/39 | 310 | 350 |
| California Statewide Communities Development | | | | |
| Authority Revenue (Cottage Health System | | | | |
| Obligated Group) | 5.000% | 11/1/40 | 7,200 | 7,756 |
| California Statewide Communities Development | | | | |
| Authority Revenue (Cottage Health System | | | | |
| Obligated Group) | 5.000% | 11/1/43 | 13,705 | 15,370 |
154
California Long-Term Tax-Exempt Fund
| | | | |
| | | | Face | Market |
| | | Maturity | Amount | Value• |
| | Coupon | Date | ($000) | ($000) |
| California Statewide Communities Development | | | | |
| Authority Revenue (Covenant Retirement | | | | |
| Communities Inc.) | 5.625% | 12/1/36 | 4,000 | 4,553 |
| California Statewide Communities Development | | | | |
| Authority Revenue (Daughters of Charity Health | | | | |
| System) | 5.750% | 7/1/30 | 5,000 | 4,865 |
| California Statewide Communities Development | | | | |
| Authority Revenue (Daughters of Charity Health | | | | |
| System) | 5.750% | 7/1/35 | 1,515 | 1,443 |
| California Statewide Communities Development | | | | |
| Authority Revenue (Episcopal Communities & | | | | |
| Services) | 5.000% | 5/15/42 | 2,500 | 2,700 |
| California Statewide Communities Development | | | | |
| Authority Revenue (Episcopal Communities & | | | | |
| Services) | 5.000% | 5/15/47 | 2,000 | 2,150 |
| California Statewide Communities Development | | | | |
| Authority Revenue (Huntington Memorial | | | | |
| Hospital) | 5.000% | 7/1/44 | 5,800 | 6,342 |
| California Statewide Communities Development | | | | |
| Authority Revenue (John Muir Health) | 5.000% | 8/15/46 | 1,500 | 1,697 |
| California Statewide Communities Development | | | | |
| Authority Revenue (John Muir Health) | 5.000% | 8/15/51 | 3,000 | 3,389 |
| California Statewide Communities Development | | | | |
| Authority Revenue (Kaiser Permanente) | 5.000% | 4/1/42 | 15,425 | 17,185 |
| California Statewide Communities Development | | | | |
| Authority Revenue (Redlands Community | | | | |
| Hospital) | 5.000% | 10/1/46 | 1,600 | 1,762 |
| California Statewide Communities Development | | | | |
| Authority Revenue (Sutter Health) | 5.000% | 8/15/17 (Prere.) | 2,900 | 2,924 |
| California Statewide Communities Development | | | | |
| Authority Revenue (Sutter Health) | 5.250% | 8/15/31 | 2,500 | 2,861 |
| California Statewide Communities Development | | | | |
| Authority Revenue (Sutter Health) | 5.000% | 8/15/32 | 11,000 | 12,524 |
| California Statewide Communities Development | | | | |
| Authority Revenue (Sutter Health) | 5.000% | 11/15/38 | 4,250 | 4,386 |
| California Statewide Communities Development | | | | |
| Authority Revenue (The Culinary Institute of | | | | |
| America Project) | 5.000% | 7/1/41 | 800 | 884 |
| California Statewide Communities Development | | | | |
| Authority Revenue (Trinity Health) | 5.000% | 12/1/41 | 11,000 | 12,348 |
| California Statewide Communities Development | | | | |
| Authority Senior Living Revenue (Southern | | | | |
| California Presbyterian Homes) | 7.250% | 11/15/41 | 3,000 | 3,332 |
| California Statewide Communities Development | | | | |
| Authority Student Housing Revenue (CHF-Irvine | | | | |
| LLC - UCI East Campus Apartments Phase II) | 5.000% | 5/15/29 | 2,000 | 2,342 |
| California Statewide Communities Development | | | | |
| Authority Student Housing Revenue (CHF-Irvine | | | | |
| LLC - UCI East Campus Apartments Phase II) | 5.000% | 5/15/30 | 3,500 | 4,059 |
| California Statewide Communities Development | | | | |
| Authority Student Housing Revenue (CHF-Irvine | | | | |
| LLC - UCI East Campus Apartments Phase II) | 5.000% | 5/15/32 | 2,500 | 2,875 |
155
California Long-Term Tax-Exempt Fund
| | | | |
| | | | Face | Market |
| | | Maturity | Amount | Value• |
| | Coupon | Date | ($000) | ($000) |
| California Statewide Communities Development | | | | |
| Authority Student Housing Revenue (CHF-Irvine | | | | |
| LLC - UCI East Campus Apartments Phase II) | 5.000% | 5/15/40 | 4,445 | 4,979 |
| Centinela Valley CA Union High School | | | | |
| District GO | 6.000% | 8/1/23 (Prere.) | 3,000 | 3,821 |
| Centinela Valley CA Union High School | | | | |
| District GO | 4.000% | 8/1/50 (4) | 3,000 | 3,127 |
| Central School District San Bernardino | | | | |
| California GO | 5.000% | 8/1/47 | 3,000 | 3,493 |
| Cerritos CA Community College District GO | 4.000% | 8/1/33 | 2,135 | 2,286 |
| Cerritos CA Community College District GO | 0.000% | 8/1/34 | 4,000 | 2,135 |
| Cerritos CA Community College District GO | 0.000% | 8/1/35 | 1,730 | 875 |
| Cerritos CA Community College District GO | 5.000% | 8/1/38 | 7,000 | 7,912 |
| Chabot-Las Positas CA Community College | | | | |
| District GO | 5.000% | 8/1/25 | 5,000 | 5,952 |
| Chabot-Las Positas CA Community College | | | | |
| District GO | 5.000% | 8/1/30 | 3,500 | 4,120 |
| Charter Oak CA Unified School District GO | 5.000% | 8/1/31 (4) | 1,380 | 1,619 |
| Charter Oak CA Unified School District GO | 5.000% | 8/1/33 (4) | 1,755 | 2,039 |
| Chula Vista CA Redevelopment Agency | | | | |
| Successor Agency Tax Allocation Revenue | 4.000% | 10/1/25 | 2,130 | 2,453 |
| Chula Vista CA Redevelopment Agency | | | | |
| Successor Agency Tax Allocation Revenue | 4.000% | 10/1/26 | 1,175 | 1,352 |
| Citrus CA Community College District GO | 0.000% | 8/1/36 | 1,810 | 1,514 |
| Citrus CA Community College District GO | 0.000% | 8/1/37 | 2,475 | 2,063 |
| Citrus CA Community College District GO | 0.000% | 8/1/38 | 2,150 | 1,787 |
| Coast CA Community College District GO | 5.000% | 8/1/27 | 5,700 | 6,801 |
| Colton CA Joint Unified School District GO | 5.000% | 8/1/27 (4) | 2,535 | 3,007 |
| Conejo Valley CA Unified School District GO | 0.000% | 8/1/29 (4) | 2,000 | 1,281 |
| Conejo Valley CA Unified School District GO | 0.000% | 8/1/30 (4) | 1,865 | 1,120 |
| Contra Costa CA Community College District GO | 5.000% | 8/1/38 | 3,600 | 4,151 |
| 3 Contra Costa CA Transportation Authority Sales | | | | |
| Tax Revenue | 5.000% | 3/1/28 | 900 | 1,133 |
| 3 Contra Costa CA Transportation Authority Sales | | | | |
| Tax Revenue | 5.000% | 3/1/29 | 1,325 | 1,654 |
| Contra Costa CA Transportation Authority Sales | | | | |
| Tax Revenue | 5.000% | 3/1/34 | 1,970 | 2,283 |
| Cotati-Rohnert Park CA Unified School District GO | 5.000% | 8/1/44 (4) | 3,000 | 3,380 |
| Cupertino CA Union School District GO | 5.000% | 8/1/36 | 3,000 | 3,509 |
| Del Mar CA Race Track Authority Revenue | 5.000% | 10/1/38 | 1,500 | 1,502 |
| East Bay CA Municipal Utility District Water | | | | |
| System Revenue | 5.000% | 6/1/30 | 3,305 | 3,919 |
| East Bay CA Municipal Utility District Water | | | | |
| System Revenue | 5.000% | 6/1/30 | 1,500 | 1,779 |
| East Bay CA Regional Park District Revenue | 5.000% | 9/1/25 | 2,000 | 2,183 |
| Eastern California Municipal Water District Water | | | | |
| & Sewer | 5.000% | 7/1/39 | 2,030 | 2,386 |
| Eastern California Municipal Water District Water | | | | |
| & Wastewater Revenue | 4.000% | 7/1/35 | 3,780 | 4,060 |
| El Camino CA Community College District GO | 5.000% | 8/1/32 | 1,000 | 1,207 |
| El Camino CA Community College District GO | 5.000% | 8/1/33 | 1,115 | 1,338 |
| El Camino CA Community College District GO | 5.000% | 8/1/37 | 1,550 | 1,831 |
| El Camino CA Healthcare District GO | 4.000% | 8/1/34 | 5,000 | 5,378 |
| El Dorado CA Irrigation District Revenue | 5.250% | 3/1/39 (4) | 7,500 | 8,768 |
156
California Long-Term Tax-Exempt Fund
| | | | |
| | | | Face | Market |
| | | Maturity | Amount | Value• |
| | Coupon | Date | ($000) | ($000) |
| Encinitas CA Community Facilities District No. 1 | | | | |
| Special Tax Revenue | 5.000% | 9/1/27 | 1,000 | 1,128 |
| Escondido CA GO | 5.000% | 9/1/30 | 2,030 | 2,440 |
| Escondido CA Union High School District GO | 0.000% | 11/1/20 (14) | 4,000 | 3,812 |
| Fontana CA Public Financing Authority Tax | | | | |
| Allocation Revenue | 5.000% | 10/1/29 (2) | 9,450 | 9,480 |
| Fontana CA Public Financing Authority Tax | | | | |
| Allocation Revenue | 5.000% | 10/1/32 (2) | 5,000 | 5,013 |
| Foothill-De Anza CA Community College | | | | |
| District GO | 0.000% | 8/1/17 (14) | 3,000 | 2,996 |
| Foothill-De Anza CA Community College | | | | |
| District GO | 0.000% | 8/1/22 (14) | 3,850 | 3,544 |
| Foothill-De Anza CA Community College | | | | |
| District GO | 0.000% | 8/1/23 (14) | 3,590 | 3,217 |
| Foothill-De Anza CA Community College | | | | |
| District GO | 0.000% | 8/1/25 (14) | 2,390 | 2,007 |
| Foothill/Eastern Transportation Corridor Agency | | | | |
| California Toll Road Revenue | 0.000% | 1/15/42 | 9,000 | 7,720 |
| Foothill/Eastern Transportation Corridor Agency | | | | |
| California Toll Road Revenue | 6.500% | 1/15/43 | 2,200 | 2,637 |
| Foothill/Eastern Transportation Corridor Agency | | | | |
| California Toll Road Revenue | 5.750% | 1/15/46 | 13,500 | 15,545 |
| Foothill/Eastern Transportation Corridor Agency | | | | |
| California Toll Road Revenue | 6.000% | 1/15/53 | 6,675 | 7,682 |
| Fresno CA Joint Powers Financing Authority | | | | |
| Lease Revenue | 5.000% | 4/1/35 (4) | 1,000 | 1,163 |
| Gavilan CA Joint Community College District GO | 5.500% | 8/1/28 (2) | 90 | 90 |
| Gilroy CA School Facilities Finance Authority | | | | |
| Revenue | 5.000% | 8/1/46 | 5,000 | 5,610 |
| Gilroy CA Unified School District GO | 4.000% | 8/1/33 | 1,155 | 1,249 |
| Gilroy CA Unified School District GO | 4.000% | 8/1/36 | 1,000 | 1,064 |
| Gilroy CA Unified School District GO | 4.000% | 8/1/37 | 1,000 | 1,061 |
| Gilroy CA Unified School District GO | 4.000% | 8/1/41 | 3,115 | 3,264 |
| Gilroy CA Unified School District GO | 4.000% | 8/1/46 | 8,000 | 8,381 |
| Golden State Tobacco Securitization Corp. | | | | |
| California Revenue | 5.000% | 6/1/25 | 4,000 | 4,782 |
| Golden State Tobacco Securitization Corp. | | | | |
| California Revenue | 0.000% | 6/1/28 (2) | 10,000 | 7,211 |
| Golden State Tobacco Securitization Corp. | | | | |
| California Revenue | 5.000% | 6/1/35 | 5,000 | 5,745 |
| Golden State Tobacco Securitization Corp. | | | | |
| California Revenue | 5.000% | 6/1/40 | 10,000 | 11,406 |
| Grossmont CA Healthcare District GO | 6.125% | 7/15/21 (Prere.) | 2,500 | 3,007 |
| Grossmont CA Union High School District GO | 0.000% | 8/1/30 | 6,500 | 4,306 |
| Hayward CA Unified School District GO | 5.000% | 8/1/31 (4) | 3,780 | 4,367 |
| Hayward CA Unified School District GO | 5.000% | 8/1/31 (4) | 3,500 | 4,043 |
| Hemet CA Unified School District Financing | | | | |
| Authority Special Tax Revenue | 5.000% | 9/1/39 | 1,100 | 1,199 |
| Imperial CA Irrigation District Electric Revenue | 5.000% | 11/1/32 | 2,750 | 3,279 |
| Imperial CA Irrigation District Electric Revenue | 5.000% | 11/1/34 | 3,120 | 3,690 |
| Imperial CA Irrigation District Electric Revenue | 5.000% | 11/1/36 | 3,420 | 4,020 |
| Imperial CA Irrigation District Electric Revenue | 5.000% | 11/1/45 | 4,000 | 4,626 |
| Imperial CA Unified School District GO | 5.250% | 8/1/43 (15) | 5,000 | 6,023 |
| Inglewood CA Redevelopment Agency Successor | | | | |
| Agency Tax Allocation Revenue | 5.000% | 5/1/32 (15) | 1,000 | 1,171 |
157
California Long-Term Tax-Exempt Fund
| | | | |
| | | | Face | Market |
| | | Maturity | Amount | Value• |
| | Coupon | Date | ($000) | ($000) |
| Inglewood CA Redevelopment Agency Successor | | | | |
| Agency Tax Allocation Revenue | 5.000% | 5/1/34 (15) | 600 | 696 |
| Inglewood CA Redevelopment Agency Successor | | | | |
| Agency Tax Allocation Revenue | 5.000% | 5/1/38 (15) | 500 | 574 |
| Irvine CA Assessment District No. 97-17 | | | | |
| Improvement Revenue VRDO | 0.760% | 6/1/17 LOC | 240 | 240 |
| Irvine CA Public Facilities & Infrastructure | | | | |
| Authority Assessment Revenue VRDO | 0.760% | 6/1/17 LOC | 3,623 | 3,623 |
| Irvine CA Reassessment District No. 05-21 | | | | |
| Improvement Revenue VRDO | 0.760% | 6/1/17 LOC | 2,400 | 2,400 |
| Irvine Ranch CA Water District COP | 5.000% | 3/1/46 | 5,000 | 5,900 |
| Jefferson CA Union High School District GO | 5.000% | 8/1/26 (15) | 1,000 | 1,220 |
| Kern County CA GO | 5.750% | 2/1/19 (Prere.) | 2,000 | 2,161 |
| La Quinta CA Redevelopment Agency Tax | | | | |
| Allocation Revenue | 5.000% | 9/1/34 | 1,050 | 1,199 |
| La Verne CA (Brethren Hillcrest Homes) COP | 5.000% | 5/15/36 | 2,450 | 2,596 |
| Lancaster CA Redevelopment Agency Successor | | | | |
| Agency Tax Allocation Revenue | 5.000% | 8/1/29 | 1,000 | 1,173 |
| Lancaster CA Redevelopment Agency Successor | | | | |
| Agency Tax Allocation Revenue | 5.000% | 8/1/30 | 1,255 | 1,467 |
| Las Virgenes CA Unified School District GO | 0.000% | 9/1/26 (14) | 6,140 | 4,894 |
| Long Beach CA Airport Revenue | 5.000% | 6/1/40 | 4,440 | 4,848 |
| Long Beach CA Community College District GO | 0.000% | 8/1/34 | 2,520 | 1,345 |
| Long Beach CA Finance Authority Natural Gas | | | | |
| Purchase Revenue | 2.222% | 11/15/26 | 1,800 | 1,698 |
| Long Beach CA Finance Authority Natural Gas | | | | |
| Purchase Revenue | 5.000% | 11/15/29 | 1,165 | 1,386 |
| Long Beach CA Finance Authority Natural Gas | | | | |
| Purchase Revenue | 5.000% | 11/15/35 | 1,180 | 1,426 |
| Long Beach CA Finance Authority Natural Gas | | | | |
| Purchase Revenue | 5.500% | 11/15/37 | 2,600 | 3,355 |
| Long Beach CA Finance Authority Tax Revenue | 5.500% | 8/1/26 (2) | 7,570 | 9,097 |
| Long Beach CA Finance Authority Tax Revenue | 5.500% | 8/1/31 (2) | 4,015 | 5,039 |
| Long Beach CA Harbor Revenue | 5.000% | 5/15/39 | 1,500 | 1,741 |
| Long Beach CA Harbor Revenue | 5.000% | 5/15/42 | 2,000 | 2,316 |
| Long Beach CA Unified School District GO | 0.000% | 8/1/26 | 1,870 | 1,453 |
| Los Angeles CA Community College District GO | 5.250% | 8/1/20 (Prere.) | 5,000 | 5,664 |
| Los Angeles CA Community College District GO | 5.000% | 8/1/28 | 3,500 | 4,230 |
| Los Angeles CA Community College District GO | 5.000% | 8/1/28 | 6,000 | 7,251 |
| Los Angeles CA Community College District GO | 4.000% | 8/1/29 | 1,250 | 1,423 |
| Los Angeles CA Community College District GO | 5.000% | 8/1/30 | 5,500 | 6,606 |
| Los Angeles CA Community College District GO | 4.000% | 8/1/31 | 1,700 | 1,892 |
| Los Angeles CA Community College District GO | 4.000% | 8/1/33 | 3,500 | 3,787 |
| Los Angeles CA Department of Airports | | | | |
| International Airport Revenue | 5.250% | 5/15/27 | 5,000 | 5,615 |
| Los Angeles CA Department of Airports | | | | |
| International Airport Revenue | 5.000% | 5/15/29 | 5,000 | 5,572 |
| Los Angeles CA Department of Airports | | | | |
| International Airport Revenue | 5.000% | 5/15/30 | 3,195 | 3,516 |
| Los Angeles CA Department of Airports | | | | |
| International Airport Revenue | 5.000% | 5/15/30 | 14,590 | 16,092 |
| Los Angeles CA Department of Airports | | | | |
| International Airport Revenue | 5.000% | 5/15/35 | 16,000 | 18,254 |
| Los Angeles CA Department of Airports | | | | |
| International Airport Revenue | 5.000% | 5/15/35 | 4,000 | 4,419 |
158
California Long-Term Tax-Exempt Fund
| | | | |
| | | | Face | Market |
| | | Maturity | Amount | Value• |
| | Coupon | Date | ($000) | ($000) |
| Los Angeles CA Department of Airports | | | | |
| International Airport Revenue | 5.000% | 5/15/38 | 4,500 | 5,209 |
| Los Angeles CA Department of Water & Power | | | | |
| Revenue | 5.000% | 7/1/25 | 4,070 | 4,340 |
| Los Angeles CA Department of Water & Power | | | | |
| Revenue | 5.000% | 7/1/27 | 10,000 | 11,806 |
| Los Angeles CA Department of Water & Power | | | | |
| Revenue | 5.000% | 7/1/29 | 5,000 | 5,956 |
| Los Angeles CA Department of Water & Power | | | | |
| Revenue | 5.000% | 7/1/31 | 1,355 | 1,628 |
| Los Angeles CA Department of Water & Power | | | | |
| Revenue | 5.000% | 7/1/32 (2) | 5,000 | 5,017 |
| Los Angeles CA Department of Water & Power | | | | |
| Revenue | 5.250% | 7/1/32 | 7,000 | 7,335 |
| Los Angeles CA Department of Water & Power | | | | |
| Revenue | 5.000% | 7/1/33 | 2,500 | 2,935 |
| Los Angeles CA Department of Water & Power | | | | |
| Revenue | 5.375% | 7/1/34 | 3,000 | 3,216 |
| Los Angeles CA Department of Water & Power | | | | |
| Revenue | 5.000% | 7/1/35 | 3,500 | 4,082 |
| Los Angeles CA Department of Water & Power | | | | |
| Revenue | 5.000% | 7/1/36 | 3,750 | 4,413 |
| Los Angeles CA Department of Water & Power | | | | |
| Revenue | 5.000% | 7/1/36 | 5,000 | 5,582 |
| Los Angeles CA Department of Water & Power | | | | |
| Revenue | 5.000% | 7/1/36 | 10,000 | 11,412 |
| Los Angeles CA Department of Water & Power | | | | |
| Revenue | 5.000% | 7/1/37 | 1,545 | 1,759 |
| Los Angeles CA Department of Water & Power | | | | |
| Revenue | 5.000% | 7/1/38 | 1,750 | 2,048 |
| Los Angeles CA Department of Water & Power | | | | |
| Revenue | 5.000% | 7/1/38 | 12,365 | 14,143 |
| Los Angeles CA Department of Water & Power | | | | |
| Revenue | 5.250% | 7/1/38 | 1,890 | 1,980 |
| Los Angeles CA Department of Water & Power | | | | |
| Revenue | 5.000% | 7/1/39 | 4,000 | 4,626 |
| Los Angeles CA Department of Water & Power | | | | |
| Revenue | 5.250% | 7/1/39 | 2,000 | 2,273 |
| Los Angeles CA Department of Water & Power | | | | |
| Revenue | 5.000% | 7/1/40 | 2,000 | 2,335 |
| Los Angeles CA Department of Water & Power | | | | |
| Revenue | 5.000% | 7/1/41 | 5,000 | 5,919 |
| Los Angeles CA Department of Water & Power | | | | |
| Revenue | 5.000% | 7/1/42 | 4,500 | 5,247 |
| Los Angeles CA Department of Water & Power | | | | |
| Revenue | 5.000% | 7/1/43 | 10,150 | 11,494 |
| Los Angeles CA Department of Water & Power | | | | |
| Revenue | 5.000% | 7/1/43 | 5,000 | 5,649 |
| Los Angeles CA Department of Water & Power | | | | |
| Revenue | 5.000% | 7/1/43 | 5,000 | 5,702 |
| Los Angeles CA Department of Water & Power | | | | |
| Revenue | 5.000% | 7/1/44 | 13,950 | 16,035 |
| Los Angeles CA Department of Water & Power | | | | |
| Revenue | 5.000% | 7/1/46 | 2,500 | 2,905 |
159
California Long-Term Tax-Exempt Fund
| | | | |
| | | | Face | Market |
| | | Maturity | Amount | Value• |
| | Coupon | Date | ($000) | ($000) |
| Los Angeles CA Department of Water & Power | | | | |
| Revenue VRDO | 0.600% | 6/1/17 | 5,200 | 5,200 |
| Los Angeles CA Department of Water & Power | | | | |
| Revenue VRDO | 0.660% | 6/1/17 | 14,960 | 14,960 |
| Los Angeles CA Department of Water & Power | | | | |
| Revenue VRDO | 0.780% | 6/1/17 | 900 | 900 |
| Los Angeles CA Harbor Department Revenue | 4.000% | 8/1/39 | 4,500 | 4,769 |
| Los Angeles CA Municipal Improvement Corp. | | | | |
| Lease Revenue | 5.000% | 11/1/29 | 3,000 | 3,637 |
| Los Angeles CA Municipal Improvement Corp. | | | | |
| Lease Revenue | 5.000% | 11/1/30 | 2,400 | 2,890 |
| Los Angeles CA Municipal Improvement Corp. | | | | |
| Lease Revenue | 4.000% | 11/1/33 | 5,200 | 5,571 |
| Los Angeles CA Municipal Improvement Corp. | | | | |
| Lease Revenue | 4.000% | 11/1/34 | 2,500 | 2,661 |
| Los Angeles CA Unified School District GO | 5.000% | 7/1/17 (Prere.) | 8,000 | 8,028 |
| Los Angeles CA Unified School District GO | 5.250% | 7/1/24 | 6,275 | 6,833 |
| Los Angeles CA Unified School District GO | 5.250% | 7/1/25 | 5,000 | 5,444 |
| Los Angeles CA Unified School District GO | 5.000% | 7/1/26 | 5,000 | 6,087 |
| Los Angeles CA Unified School District GO | 5.000% | 7/1/27 | 3,000 | 3,818 |
| Los Angeles CA Unified School District GO | 5.000% | 7/1/28 | 8,000 | 9,630 |
| Los Angeles CA Unified School District GO | 5.250% | 7/1/28 | 5,500 | 6,199 |
| Los Angeles CA Unified School District GO | 5.000% | 7/1/30 | 2,860 | 3,415 |
| Los Angeles CA Unified School District GO | 3.000% | 7/1/31 | 8,000 | 8,111 |
| Los Angeles CA Unified School District GO | 5.000% | 1/1/34 | 5,000 | 5,405 |
| Los Angeles CA Unified School District GO | 5.250% | 7/1/34 | 10,000 | 11,123 |
| Los Angeles CA Unified School District GO | 4.000% | 7/1/35 | 5,000 | 5,334 |
| Los Angeles CA Wastewater System Revenue | 5.000% | 6/1/33 | 1,000 | 1,217 |
| Los Angeles CA Wastewater System Revenue | 5.000% | 6/1/34 | 3,250 | 3,936 |
| Los Angeles CA Wastewater System Revenue | 5.000% | 6/1/35 | 2,500 | 3,016 |
| Los Angeles CA Wastewater System Revenue | 5.000% | 6/1/36 | 1,635 | 1,966 |
| Los Angeles CA Wastewater System Revenue | 5.000% | 6/1/37 | 2,100 | 2,515 |
| Los Angeles CA Wastewater System Revenue | 5.000% | 6/1/43 | 2,840 | 3,254 |
| 2 Los Angeles CA Wastewater System Revenue | | | | |
| TOB VRDO | 0.800% | 6/7/17 | 7,500 | 7,500 |
| Los Angeles County CA Metropolitan | | | | |
| Transportation Authority Revenue (Union | | | | |
| Station Gateway Project) | 5.000% | 7/1/27 | 2,000 | 2,449 |
| Los Angeles County CA Metropolitan | | | | |
| Transportation Authority Sales Tax Revenue | 5.000% | 7/1/27 | 3,235 | 4,050 |
| Los Angeles County CA Metropolitan | | | | |
| Transportation Authority Sales Tax Revenue | 5.000% | 7/1/28 | 7,570 | 9,394 |
| Los Angeles County CA Metropolitan | | | | |
| Transportation Authority Sales Tax Revenue | 5.000% | 6/1/31 | 2,000 | 2,428 |
| Los Angeles County CA Metropolitan | | | | |
| Transportation Authority Sales Tax Revenue | 5.000% | 6/1/32 | 2,340 | 2,826 |
| Los Angeles County CA Metropolitan | | | | |
| Transportation Authority Sales Tax Revenue | 5.000% | 6/1/34 | 5,000 | 5,980 |
| Los Angeles County CA Metropolitan | | | | |
| Transportation Authority Sales Tax Revenue | 5.000% | 7/1/34 | 3,305 | 4,008 |
| Los Angeles County CA Metropolitan | | | | |
| Transportation Authority Sales Tax Revenue | 5.000% | 7/1/37 | 3,580 | 4,292 |
| Los Angeles County CA Public Works Financing | | | | |
| Authority Lease Revenue | 5.000% | 8/1/37 | 2,750 | 3,127 |
160
California Long-Term Tax-Exempt Fund
| | | | |
| | | | Face | Market |
| | | Maturity | Amount | Value• |
| | Coupon | Date | ($000) | ($000) |
| Los Angeles County CA Public Works Financing | | | | |
| Authority Lease Revenue | 5.000% | 8/1/42 | 5,940 | 6,693 |
| Los Angeles County CA Public Works Financing | | | | |
| Authority Revenue | 5.500% | 10/1/18 (4) | 620 | 640 |
| Los Angeles County CA Sanitation Districts | | | | |
| Financing Authority Revenue | 5.000% | 10/1/35 | 4,000 | 4,656 |
| Los Angeles County CA Schools Regionalized | | | | |
| Business Services Corp. COP | 0.000% | 8/1/20 (2) | 2,095 | 1,980 |
| M-S-R California Energy Authority Revenue | 7.000% | 11/1/34 | 7,000 | 10,140 |
| M-S-R California Energy Authority Revenue | 7.000% | 11/1/34 | 3,200 | 4,635 |
| M-S-R California Energy Authority Revenue | 6.500% | 11/1/39 | 3,500 | 5,004 |
| M-S-R California Energy Authority Revenue | 6.500% | 11/1/39 | 4,195 | 5,998 |
| M-S-R California Public Power Agency Revenue | | | | |
| (San Juan Project) | 6.750% | 7/1/20 (ETM) | 4,900 | 5,342 |
| Marin CA Community College District GO | 4.000% | 8/1/35 | 700 | 753 |
| Marin CA Community College District GO | 4.000% | 8/1/38 | 1,500 | 1,590 |
| Marin CA Healthcare District GO | 5.000% | 8/1/29 | 1,055 | 1,274 |
| Marina Coast Water District California Enterprise | | | | |
| Revenue | 5.000% | 6/1/37 | 4,085 | 4,637 |
| Metropolitan Water District of Southern California | | | | |
| Revenue | 5.000% | 7/1/31 | 3,000 | 3,243 |
| Metropolitan Water District of Southern California | | | | |
| Revenue | 5.000% | 10/1/33 | 6,000 | 6,858 |
| Metropolitan Water District of Southern California | | | | |
| Revenue | 5.000% | 7/1/34 | 5,000 | 5,960 |
| Metropolitan Water District of Southern California | | | | |
| Revenue | 5.000% | 10/1/35 | 2,855 | 3,270 |
| Metropolitan Water District of Southern California | | | | |
| Revenue | 5.000% | 7/1/40 | 4,500 | 5,283 |
| Milpitas CA Redevelopment Agency Successor | | | | |
| Agency Tax Allocation Revenue | 5.000% | 9/1/26 | 2,085 | 2,512 |
| Milpitas CA Redevelopment Agency Successor | | | | |
| Agency Tax Allocation Revenue | 5.000% | 9/1/30 | 4,000 | 4,682 |
| Modesto CA Irrigation District COP | 5.500% | 7/1/18 (Prere.) | 1,000 | 1,051 |
| Modesto CA Irrigation District Financing Authority | | | | |
| Electric Revenue | 5.000% | 10/1/40 | 6,000 | 6,855 |
| Modesto CA Irrigation District Financing Authority | | | | |
| Revenue (Woodland Project) | 6.500% | 10/1/22 (ETM) | 6,140 | 7,016 |
| Mountain View-Whisman CA School District COP | 4.000% | 6/1/30 | 675 | 735 |
| Mountain View-Whisman CA School District COP | 4.000% | 6/1/32 | 1,500 | 1,613 |
| New Haven CA Unified School District GO | 5.000% | 8/1/27 (15) | 3,000 | 3,599 |
| New Haven CA Unified School District GO | 5.000% | 8/1/28 (15) | 2,000 | 2,380 |
| Newark CA Unified School District GO | 5.000% | 8/1/44 | 6,000 | 6,953 |
| Newport Beach CA Revenue (Hoag Memorial | | | | |
| Hospital Presbyterian) | 6.000% | 12/1/21 (Prere.) | 3,525 | 4,239 |
| Newport Mesa CA Unified School District GO | 0.000% | 8/1/35 | 4,000 | 2,176 |
| Newport Mesa CA Unified School District GO | 0.000% | 8/1/36 | 1,000 | 522 |
| Newport Mesa CA Unified School District GO | 0.000% | 8/1/37 | 2,000 | 993 |
| Newport Mesa CA Unified School District GO | 0.000% | 8/1/38 | 1,000 | 474 |
| Northern California Power Agency Revenue | | | | |
| (Hydroelectric Project) | 6.300% | 7/1/18 (14) | 3,310 | 3,388 |
| Northern California Power Agency Revenue | | | | |
| (Hydroelectric Project) | 7.500% | 7/1/21 (Prere.) | 1,595 | 1,867 |
| Northern California Power Agency Revenue | | | | |
| (Hydroelectric Project) | 5.000% | 7/1/27 | 3,255 | 3,774 |
161
California Long-Term Tax-Exempt Fund
| | | | |
| | | | Face | Market |
| | | Maturity | Amount | Value• |
| | Coupon | Date | ($000) | ($000) |
| Northern California Transmission Agency Revenue | 5.000% | 5/1/37 | 3,610 | 4,217 |
| Northern California Transmission Agency Revenue | 5.000% | 5/1/38 | 1,790 | 2,087 |
| Northstar Community Services District California | | | | |
| Community Facilities District No. 1 Special Tax | | | | |
| Revenue | 5.000% | 9/1/25 | 1,825 | 2,004 |
| Northstar Community Services District California | | | | |
| Community Facilities District No. 1 Special Tax | | | | |
| Revenue | 5.000% | 9/1/26 | 1,995 | 2,170 |
| Novato CA Unified School District GO | 5.000% | 8/1/28 | 800 | 960 |
| Oakland CA GO | 5.000% | 1/15/29 | 1,640 | 1,966 |
| Oakland CA GO | 5.000% | 1/15/31 | 3,550 | 3,965 |
| Oakland CA Unified School District GO | 6.625% | 8/1/21 (Prere.) | 1,000 | 1,224 |
| Oakland CA Unified School District GO | 5.000% | 8/1/35 | 2,850 | 3,330 |
| Oakland CA Unified School District GO | 5.000% | 8/1/40 | 500 | 578 |
| Oceanside CA Unified School District GO | 0.000% | 8/1/25 (12) | 6,865 | 5,676 |
| Ohlone CA Community College District GO | 4.000% | 8/1/41 | 5,000 | 5,299 |
| Palm Desert CA Redevelopment Agency Tax | | �� | | |
| Allocation Revenue | 5.000% | 10/1/28 (15) | 1,100 | 1,332 |
| Palo Alto CA Improvement Revenue (University | | | | |
| Avenue Area Parking) | 4.250% | 9/2/22 | 200 | 222 |
| Palo Alto CA Improvement Revenue (University | | | | |
| Avenue Area Parking) | 5.000% | 9/2/26 | 1,000 | 1,117 |
| Palomar CA Community College District GO | 0.000% | 8/1/24 | 5,125 | 4,437 |
| Palomar CA Community College District GO | 4.000% | 8/1/45 | 3,000 | 3,161 |
| Palomar Pomerado Health California COP | 6.000% | 11/1/41 | 3,800 | 4,141 |
| Palomar Pomerado Health California GO | 4.500% | 8/1/17 (Prere.) | 12,000 | 12,075 |
| Palomar Pomerado Health California GO | 0.000% | 8/1/33 (12) | 4,000 | 2,191 |
| Palomar Pomerado Health California GO | 5.000% | 8/1/34 | 500 | 578 |
| Palomar Pomerado Health California GO | 4.000% | 8/1/35 | 4,000 | 4,243 |
| Palomar Pomerado Health California GO | 0.000% | 8/1/36 | 5,000 | 2,240 |
| Palomar Pomerado Health California Revenue | 5.000% | 11/1/39 | 5,000 | 5,438 |
| Paramount CA Redevelopment Agency Successor | | | | |
| Agency Tax Allocation Revenue (Redevelopment | | | | |
| Project Area No. 1) | 0.000% | 8/1/26 (14) | 3,000 | 2,198 |
| Pasadena CA Unified School District GO | 5.000% | 5/1/34 | 4,000 | 4,535 |
| Peralta CA Community College District Revenue | 5.000% | 8/1/19 (Prere.) | 4,000 | 4,351 |
| Pittsburg CA Redevelopment Agency Tax | | | | |
| Allocation Revenue (Los Medanos Community | | | | |
| Development Project) | 0.000% | 8/1/19 (2) | 1,800 | 1,740 |
| Pittsburg CA Redevelopment Agency Tax | | | | |
| Allocation Revenue (Los Medanos Community | | | | |
| Development Project) | 0.000% | 8/1/21 (2) | 2,920 | 2,703 |
| Pittsburg CA Redevelopment Agency Tax | | | | |
| Allocation Revenue (Los Medanos Community | | | | |
| Development Project) | 0.000% | 8/1/22 (2) | 4,125 | 3,701 |
| Pittsburg CA Redevelopment Agency Tax | | | | |
| Allocation Revenue (Los Medanos Community | | | | |
| Development Project) | 0.000% | 8/1/24 (2) | 1,000 | 836 |
| Pittsburg CA Water Revenue | 5.000% | 8/1/27 | 830 | 1,050 |
| Pittsburg CA Water Revenue | 5.000% | 8/1/28 | 585 | 733 |
| Poway CA Unified School District GO | 5.000% | 9/1/25 | 1,825 | 2,066 |
| Poway CA Unified School District GO | 5.000% | 8/1/27 | 5,575 | 6,414 |
| Poway CA Unified School District GO | 5.000% | 9/1/27 | 2,040 | 2,290 |
| Poway CA Unified School District GO | 5.000% | 9/1/31 | 1,365 | 1,514 |
| Poway CA Unified School District GO | 0.000% | 8/1/33 | 5,010 | 2,810 |
162
California Long-Term Tax-Exempt Fund
| | | | |
| | | | Face | Market |
| | | Maturity | Amount | Value• |
| | Coupon | Date | ($000) | ($000) |
| Poway CA Unified School District GO | 5.000% | 9/1/33 | 990 | 1,092 |
| Poway CA Unified School District GO | 0.000% | 8/1/34 | 8,130 | 4,304 |
| Poway CA Unified School District GO | 5.000% | 9/1/36 | 680 | 746 |
| Poway CA Unified School District GO | 0.000% | 8/1/46 | 10,000 | 2,975 |
| Poway CA Unified School District GO | 0.000% | 8/1/51 | 10,000 | 2,433 |
| Poway CA Unified School District Public Financing | | | | |
| Authority Community Facilities District No. 11 | | | | |
| Zones 2 & 3 Special Tax Revenue | 5.000% | 9/15/38 | 1,210 | 1,310 |
| Poway CA Unified School District Public Financing | | | | |
| Authority Community Facilities District No. 11 | | | | |
| Zones 2 & 3 Special Tax Revenue | 5.000% | 9/15/43 | 2,435 | 2,623 |
| Poway CA Unified School District Public Financing | | | | |
| Authority Special Tax Revenue | 5.000% | 9/15/24 | 785 | 916 |
| Poway CA Unified School District Public Financing | | | | |
| Authority Special Tax Revenue | 5.000% | 9/1/27 | 1,385 | 1,680 |
| Poway CA Unified School District Public Financing | | | | |
| Authority Special Tax Revenue | 5.000% | 9/15/27 | 1,030 | 1,179 |
| Poway CA Unified School District Public Financing | | | | |
| Authority Special Tax Revenue | 5.000% | 9/1/28 | 2,340 | 2,816 |
| Poway CA Unified School District Public Financing | | | | |
| Authority Special Tax Revenue | 5.000% | 9/1/29 | 3,485 | 4,157 |
| Poway CA Unified School District Public Financing | | | | |
| Authority Special Tax Revenue | 5.000% | 9/1/30 | 1,785 | 2,116 |
| Poway CA Unified School District Public Financing | | | | |
| Authority Special Tax Revenue | 5.000% | 9/1/33 (15) | 1,760 | 2,034 |
| Rancho Cucamonga CA Redevelopment Agency | | | | |
| Successor Agency Tax Allocation Revenue | | | | |
| (Rancho Redevelopment Project) | 5.000% | 9/1/29 (4) | 1,800 | 2,093 |
| Redding CA Electric System Revenue | 5.000% | 6/1/30 | 1,665 | 2,023 |
| Redding CA Joint Powers Financing Authority | | | | |
| Electric System Revenue | 5.000% | 6/1/29 | 1,000 | 1,184 |
| Redding CA Joint Powers Financing Authority | | | | |
| Electric System Revenue | 5.000% | 6/1/31 | 600 | 702 |
| Redwood City CA Redevelopment Agency | | | | |
| Redevelopment Project Area No. 2 Tax | | | | |
| Allocation Revenue | 0.000% | 7/15/26 (2) | 3,445 | 2,587 |
| Rio Hondo CA Community College District GO | 5.000% | 8/1/30 | 6,655 | 7,214 |
| Rio Hondo CA Community College District GO | 0.000% | 8/1/36 | 16,650 | 8,200 |
| Riverside CA COP VRDO | 0.760% | 6/7/17 LOC | 6,160 | 6,160 |
| 2 Riverside CA Electric Revenue TOB VRDO | 0.800% | 6/7/17 | 2,800 | 2,800 |
| Riverside CA Unified School District Financing | | | | |
| Authority Revenue | 5.000% | 9/1/22 | 1,335 | 1,570 |
| Riverside CA Unified School District Financing | | | | |
| Authority Revenue | 5.000% | 9/1/24 | 1,440 | 1,666 |
| Riverside CA Unified School District Financing | | | | |
| Authority Revenue | 5.000% | 9/1/28 | 1,795 | 2,014 |
| Riverside CA Unified School District Financing | | | | |
| Authority Revenue | 5.000% | 9/1/29 | 1,880 | 2,098 |
| Riverside CA Unified School District Financing | | | | |
| Authority Revenue | 5.000% | 9/1/32 | 1,375 | 1,518 |
| Riverside County CA Public Financing Authority | | | | |
| Lease Revenue | 5.000% | 11/1/33 | 5,000 | 5,779 |
| Riverside County CA Public Financing Authority | | | | |
| Lease Revenue | 5.250% | 11/1/40 | 5,000 | 5,884 |
163
California Long-Term Tax-Exempt Fund
| | | | |
| | | | Face | Market |
| | | Maturity | Amount | Value• |
| | Coupon | Date | ($000) | ($000) |
| Riverside County CA Public Financing Authority | | | | |
| Lease Revenue | 5.250% | 11/1/45 | 8,000 | 9,388 |
| Riverside County CA Redevelopment Successor | | | | |
| Agency Tax Allocation Revenue | 4.000% | 10/1/37 (4) | 1,500 | 1,578 |
| Riverside County CA Transportation Commission | | | | |
| Toll Revenue | 0.000% | 6/1/41 | 6,710 | 2,162 |
| Riverside County CA Transportation Commission | | | | |
| Toll Revenue | 0.000% | 6/1/42 | 2,975 | 901 |
| Riverside County CA Transportation Commission | | | | |
| Toll Revenue | 0.000% | 6/1/43 | 7,500 | 2,111 |
| Riverside County CA Transportation Commission | | | | |
| Toll Revenue | 5.750% | 6/1/48 | 2,000 | 2,267 |
| Roseville CA Financing Authority Electric System | | | | |
| Revenue | 5.000% | 2/1/20 (Prere.) | 4,500 | 4,972 |
| Roseville CA Financing Authority Electric System | | | | |
| Revenue | 4.000% | 2/1/37 | 7,480 | 7,955 |
| Roseville CA Natural Gas Financing Authority Gas | | | | |
| Revenue | 5.000% | 2/15/18 | 620 | 635 |
| Roseville CA Natural Gas Financing Authority Gas | | | | |
| Revenue | 5.000% | 2/15/22 | 1,610 | 1,791 |
| Roseville CA Natural Gas Financing Authority Gas | | | | |
| Revenue | 5.000% | 2/15/28 | 2,450 | 2,852 |
| Roseville CA Special Tax Revenue | 5.000% | 9/1/37 | 1,250 | 1,367 |
| Sacramento CA Area Flood Control Agency | | | | |
| Special Assessment Revenue (Natomas Basin | | | | |
| Local Assessment) | 5.000% | 10/1/39 (15) | 1,900 | 2,165 |
| Sacramento CA Area Flood Control Agency | | | | |
| Special Assessment Revenue (Natomas Basin | | | | |
| Local Assessment) | 5.000% | 10/1/44 (15) | 2,000 | 2,267 |
| Sacramento CA City Financing Authority Tax | | | | |
| Allocation Revenue | 0.000% | 12/1/30 (14) | 3,000 | 1,871 |
| Sacramento CA Financing Authority Lease | | | | |
| Revenue | 5.400% | 11/1/20 (2) | 4,760 | 5,130 |
| Sacramento CA Municipal Utility District | | | | |
| Financing Authority Revenue | 5.000% | 7/1/26 | 5,250 | 6,475 |
| Sacramento CA Municipal Utility District | | | | |
| Financing Authority Revenue | 5.000% | 7/1/27 | 5,000 | 6,123 |
| Sacramento CA Municipal Utility District Revenue | 5.000% | 8/15/28 | 2,000 | 2,366 |
| Sacramento CA Municipal Utility District Revenue | 5.000% | 8/15/31 | 1,175 | 1,350 |
| Sacramento CA Municipal Utility District Revenue | 5.000% | 8/15/32 | 1,195 | 1,373 |
| Sacramento CA Municipal Utility District Revenue | 5.000% | 8/15/33 | 1,450 | 1,666 |
| Sacramento CA Regional Transportation District | | | | |
| Farebox Revenue | 5.000% | 9/1/20 (Prere.) | 1,875 | 2,110 |
| Sacramento CA Regional Transportation District | | | | |
| Farebox Revenue | 5.000% | 9/1/20 (Prere.) | 1,630 | 1,835 |
| Sacramento CA Regional Transportation District | | | | |
| Farebox Revenue | 5.000% | 3/1/36 | 1,370 | 1,503 |
| Sacramento CA Regional Transportation District | | | | |
| Farebox Revenue | 5.000% | 3/1/42 | 3,125 | 3,418 |
| Sacramento County CA Airport Revenue | 5.000% | 7/1/41 | 7,500 | 8,563 |
| Sacramento County CA Airport Revenue | 5.000% | 7/1/41 | 3,000 | 3,415 |
| Sacramento County CA Sanitation Districts | | | | |
| Financing Authority Revenue | 5.000% | 8/1/32 | 1,000 | 1,183 |
| Sacramento County CA Sanitation Districts | | | | |
| Financing Authority Revenue | 5.000% | 12/1/35 | 4,920 | 5,750 |
164
California Long-Term Tax-Exempt Fund
| | | | |
| | | | Face | Market |
| | | Maturity | Amount | Value• |
| | Coupon | Date | ($000) | ($000) |
| San Bernardino CA City Unified School | | | | |
| District GO | 5.000% | 8/1/27 (4) | 1,060 | 1,257 |
| San Bernardino CA City Unified School | | | | |
| District GO | 0.000% | 8/1/35 (4) | 5,900 | 2,961 |
| San Bernardino CA City Unified School | | | | |
| District GO | 0.000% | 8/1/36 (4) | 5,000 | 2,375 |
| San Bernardino CA Community College | | | | |
| District GO | 0.000% | 8/1/44 | 15,000 | 4,722 |
| San Bernardino CA Community College | | | | |
| District GO | 5.000% | 8/1/45 | 3,500 | 4,034 |
| San Bernardino CA Community College | | | | |
| District GO | 0.000% | 8/1/48 | 17,770 | 4,939 |
| San Bernardino County CA Medical Center COP | 6.500% | 8/1/17 (14) | 3,090 | 3,119 |
| San Bernardino County CA Transportation | | | | |
| Authority Revenue | 5.000% | 3/1/32 | 4,035 | 4,604 |
| San Diego CA Community College District GO | 5.250% | 8/1/19 (Prere.) | 2,500 | 2,732 |
| San Diego CA Community College District GO | 5.000% | 8/1/21 (Prere.) | 2,500 | 2,899 |
| San Diego CA Community College District GO | 5.000% | 8/1/21 (Prere.) | 3,000 | 3,479 |
| San Diego CA Community College District GO | 4.000% | 8/1/32 | 3,200 | 3,533 |
| San Diego CA Community College District GO | 4.000% | 8/1/32 | 5,300 | 5,852 |
| San Diego CA Community College District GO | 0.000% | 8/1/36 | 8,000 | 4,091 |
| San Diego CA Community College District GO | 0.000% | 8/1/38 | 3,510 | 1,615 |
| San Diego CA Public Facilities Financing | | | | |
| Authority Sewer Revenue | 5.250% | 5/15/19 (Prere.) | 7,000 | 7,591 |
| San Diego CA Public Facilities Financing | | | | |
| Authority Sewer Revenue | 5.250% | 5/15/19 (Prere.) | 6,000 | 6,506 |
| San Diego CA Public Facilities Financing | | | | |
| Authority Water Revenue | 5.500% | 8/1/19 (Prere.) | 5,000 | 5,489 |
| San Diego CA Public Facilities Financing | | | | |
| Authority Water Revenue | 5.750% | 8/1/19 (Prere.) | 2,500 | 2,758 |
| San Diego CA Public Facilities Financing | | | | |
| Authority Water Revenue | 5.000% | 8/1/28 | 5,000 | 6,177 |
| San Diego CA Public Facilities Financing | | | | |
| Authority Water Revenue | 5.000% | 8/1/35 | 5,000 | 5,955 |
| San Diego CA Public Facilities Financing | | | | |
| Authority Water Revenue | 5.000% | 8/1/36 | 5,000 | 5,937 |
| San Diego CA Unified School District GO | 5.500% | 7/1/24 (14) | 5,000 | 6,343 |
| San Diego CA Unified School District GO | 5.000% | 7/1/27 | 5,000 | 6,135 |
| San Diego CA Unified School District GO | 5.000% | 7/1/28 | 7,000 | 8,514 |
| San Diego CA Unified School District GO | 0.000% | 7/1/29 | 8,150 | 5,630 |
| San Diego CA Unified School District GO | 0.000% | 7/1/30 | 1,500 | 991 |
| San Diego CA Unified School District GO | 0.000% | 7/1/31 | 1,500 | 947 |
| San Diego CA Unified School District GO | 0.000% | 7/1/32 | 1,085 | 649 |
| San Diego CA Unified School District GO | 4.000% | 7/1/34 | 1,210 | 1,301 |
| San Diego CA Unified School District GO | 5.000% | 7/1/35 | 5,000 | 5,790 |
| San Diego CA Unified School District GO | 0.000% | 7/1/38 | 4,890 | 2,234 |
| San Diego CA Unified School District GO | 4.000% | 7/1/45 | 8,000 | 8,342 |
| San Diego CA Unified School District GO | 0.000% | 7/1/46 | 10,000 | 3,284 |
| San Diego County CA COP | 5.000% | 10/15/28 | 1,445 | 1,753 |
| San Diego County CA Regional Airport | | | | |
| Authority Revenue | 5.000% | 7/1/26 | 4,000 | 4,446 |
| San Diego County CA Regional Airport | | | | |
| Authority Revenue | 5.000% | 7/1/28 | 3,200 | 3,547 |
| San Diego County CA Regional Airport | | | | |
| Authority Revenue | 5.000% | 7/1/34 | 2,715 | 2,984 |
165
California Long-Term Tax-Exempt Fund
| | | | |
| | | | Face | Market |
| | | Maturity | Amount | Value• |
| | Coupon | Date | ($000) | ($000) |
| San Diego County CA Regional Airport | | | | |
| Authority Revenue | 5.000% | 4/1/37 | 1,500 | 1,711 |
| San Diego County CA Regional Airport | | | | |
| Authority Revenue | 5.000% | 4/1/38 | 2,000 | 2,281 |
| San Diego County CA Regional Airport | | | | |
| Authority Revenue | 5.000% | 7/1/40 | 3,000 | 3,290 |
| San Diego County CA Regional Airport | | | | |
| Authority Revenue | 5.000% | 7/1/43 | 3,540 | 3,966 |
| San Diego County CA Water Authority Revenue | 5.000% | 5/1/30 | 5,000 | 6,099 |
| San Diego County CA Water Authority Revenue | 5.000% | 5/1/36 | 8,350 | 9,906 |
| 2 San Diego County CA Water Authority Revenue | | | | |
| COP TOB VRDO | 0.800% | 6/7/17 | 2,510 | 2,510 |
| San Francisco CA Bay Area Rapid Transit | | | | |
| District GO | 5.000% | 8/1/31 | 7,000 | 8,458 |
| San Francisco CA Bay Area Rapid Transit | | | | |
| District GO | 5.000% | 8/1/32 | 1,150 | 1,424 |
| San Francisco CA Bay Area Rapid Transit | | | | |
| District Sales Tax Revenue | 5.000% | 7/1/30 | 1,550 | 1,873 |
| San Francisco CA Bay Area Rapid Transit | | | | |
| District Sales Tax Revenue | 5.000% | 7/1/30 | 2,120 | 2,486 |
| San Francisco CA City & County COP | 4.000% | 9/1/33 | 5,855 | 6,248 |
| San Francisco CA City & County International | | | | |
| Airport Revenue | 5.000% | 5/3/21 (Prere.) | 1,485 | 1,709 |
| San Francisco CA City & County International | | | | |
| Airport Revenue | 5.000% | 5/1/29 | 2,250 | 2,733 |
| San Francisco CA City & County International | | | | |
| Airport Revenue | 5.000% | 5/1/29 | 2,065 | 2,405 |
| San Francisco CA City & County International | | | | |
| Airport Revenue | 5.000% | 5/1/30 | 980 | 1,179 |
| San Francisco CA City & County International | | | | |
| Airport Revenue | 5.000% | 5/1/32 | 1,000 | 1,189 |
| San Francisco CA City & County International | | | | |
| Airport Revenue | 5.000% | 5/1/43 | 8,000 | 8,912 |
| San Francisco CA City & County International | | | | |
| Airport Revenue | 5.000% | 5/1/44 | 6,000 | 6,821 |
| San Francisco CA City & County International | | | | |
| Airport Revenue | 5.000% | 5/1/46 | 15,930 | 18,352 |
| San Francisco CA City & County Public Utilities | | | | |
| Commission Wastewater Revenue | 5.000% | 10/1/27 | 3,190 | 3,916 |
| San Francisco CA City & County Public Utilities | | | | |
| Commission Wastewater Revenue | 5.000% | 10/1/34 | 2,675 | 3,155 |
| San Francisco CA City & County Public Utilities | | | | |
| Commission Wastewater Revenue | 5.000% | 10/1/35 | 2,815 | 3,309 |
| San Francisco CA City & County Public Utilities | | | | |
| Commission Wastewater Revenue | 5.000% | 10/1/36 | 2,960 | 3,470 |
| San Francisco CA City & County Public Utilities | | | | |
| Commission Water Revenue | 5.000% | 10/1/29 | 12,680 | 14,805 |
| San Francisco CA City & County Public Utilities | | | | |
| Commission Water Revenue | 5.000% | 11/1/29 | 5,000 | 5,801 |
| San Francisco CA City & County Public Utilities | | | | |
| Commission Water Revenue | 5.000% | 11/1/29 | 5,000 | 6,162 |
| San Francisco CA City & County Public Utilities | | | | |
| Commission Water Revenue | 5.000% | 11/1/31 | 1,100 | 1,262 |
| San Francisco CA City & County Public Utilities | | | | |
| Commission Water Revenue | 5.000% | 11/1/31 | 1,205 | 1,383 |
166 |
California Long-Term Tax-Exempt Fund
| | | | |
| | | | Face | Market |
| | | Maturity | Amount | Value• |
| | Coupon | Date | ($000) | ($000) |
| San Francisco CA City & County Public Utilities | | | | |
| Commission Water Revenue | 5.000% | 11/1/32 | 4,000 | 4,752 |
| San Francisco CA City & County Public Utilities | | | | |
| Commission Water Revenue | 5.000% | 11/1/32 | 1,305 | 1,510 |
| San Francisco CA City & County Public Utilities | | | | |
| Commission Water Revenue | 5.000% | 11/1/33 | 1,370 | 1,576 |
| San Francisco CA City & County Public Utilities | | | | |
| Commission Water Revenue | 5.000% | 11/1/33 | 4,000 | 4,600 |
| San Francisco CA City & County Public Utilities | | | | |
| Commission Water Revenue | 5.000% | 11/1/34 | 1,275 | 1,461 |
| San Francisco CA City & County Public Utilities | | | | |
| Commission Water Revenue | 5.000% | 11/1/34 | 5,000 | 5,738 |
| San Francisco CA City & County Public Utilities | | | | |
| Commission Water Revenue | 5.000% | 11/1/35 | 2,810 | 3,218 |
| San Francisco CA City & County Public Utilities | | | | |
| Commission Water Revenue | 5.000% | 11/1/36 | 4,000 | 4,683 |
| San Francisco CA City & County Public Utilities | | | | |
| Commission Water Revenue | 4.000% | 11/1/39 | 8,000 | 8,457 |
| San Francisco CA City & County Public Utilities | | | | |
| Commission Water Revenue | 5.000% | 11/1/43 | 10,000 | 11,400 |
| San Francisco CA City & County Redevelopment | | | | |
| Financing Authority Tax Allocation Revenue | | | | |
| (Mission Bay North) | 6.500% | 8/1/19 (Prere.) | 2,000 | 2,239 |
| San Francisco CA City & County Redevelopment | | | | |
| Financing Authority Tax Allocation Revenue | | | | |
| (Mission Bay North) | 6.750% | 2/1/21 (Prere.) | 1,000 | 1,205 |
| San Francisco CA City & County Redevelopment | | | | |
| Financing Authority Tax Allocation Revenue | | | | |
| (Mission Bays Redevelopment Project) | 5.000% | 8/1/28 | 975 | 1,179 |
| San Francisco CA City & County Redevelopment | | | | |
| Financing Authority Tax Allocation Revenue | | | | |
| (Mission Bays Redevelopment Project) | 5.000% | 8/1/30 | 1,200 | 1,429 |
| San Francisco CA City & County Redevelopment | | | | |
| Financing Authority Tax Allocation Revenue | | | | |
| (Mission Bays Redevelopment Project) | 5.000% | 8/1/37 | 850 | 983 |
| San Francisco CA City & County Redevelopment | | | | |
| Financing Authority Tax Allocation Revenue | | | | |
| (Mission Bays Redevelopment Project) | 5.000% | 8/1/43 | 3,500 | 3,927 |
| San Francisco CA City & County Unified School | | | | |
| District GO | 5.250% | 6/15/19 (Prere.) | 4,000 | 4,351 |
| San Francisco CA City & County Unified School | | | | |
| District GO | 5.000% | 6/15/32 | 8,365 | 9,220 |
| San Joaquin County CA Transportation Authority | | | | |
| Revenue | 5.000% | 3/1/37 | 7,000 | 8,332 |
| San Joaquin Hills CA Transportation Corridor | | | | |
| Agency Toll Road Revenue | 0.000% | 1/15/24 (14) | 6,000 | 4,832 |
| San Joaquin Hills CA Transportation Corridor | | | | |
| Agency Toll Road Revenue | 0.000% | 1/15/25 (14) | 6,000 | 4,607 |
| San Joaquin Hills CA Transportation Corridor | | | | |
| Agency Toll Road Revenue | 5.000% | 1/15/34 | 5,000 | 5,544 |
| San Joaquin Hills CA Transportation Corridor | | | | |
| Agency Toll Road Revenue | 5.000% | 1/15/44 | 10,000 | 11,051 |
| San Jose CA Airport Revenue | 5.000% | 3/1/42 | 2,500 | 2,915 |
| San Jose CA Redevelopment Agency Tax | | | | |
| Allocation Revenue | 5.000% | 8/1/20 (2) | 3,415 | 3,438 |
167
California Long-Term Tax-Exempt Fund
| | | | |
| | | | Face | Market |
| | | Maturity | Amount | Value• |
| | Coupon | Date | ($000) | ($000) |
| San Jose CA Redevelopment Agency Tax | | | | |
| Allocation Revenue | 5.000% | 8/1/21 (2) | 2,300 | 2,316 |
| San Jose CA Redevelopment Agency Tax | | | | |
| Allocation Revenue | 5.000% | 8/1/22 (2) | 3,375 | 3,398 |
| San Jose CA Redevelopment Agency Tax | | | | |
| Allocation Revenue | 5.500% | 8/1/30 | 850 | 937 |
| San Jose CA Redevelopment Agency Tax | | | | |
| Allocation Revenue | 5.500% | 8/1/35 | 2,750 | 3,021 |
| San Jose CA Special Hotel Tax Revenue | | | | |
| (Convention Center Expansion & Renovation | | | | |
| Project) | 6.500% | 5/1/42 | 5,000 | 5,837 |
| San Jose CA Unified School District Santa | | | | |
| Clara County GO | 5.000% | 8/1/32 | 10,000 | 11,901 |
| San Jose-Evergreen CA Community College | | | | |
| District GO | 5.000% | 9/1/40 | 3,850 | 4,479 |
| San Juan CA Unified School District GO | 0.000% | 8/1/18 (4) | 1,785 | 1,763 |
| San Juan CA Unified School District GO | 0.000% | 8/1/20 (4) | 4,930 | 4,726 |
| San Juan CA Unified School District GO | 0.000% | 8/1/23 (4) | 4,540 | 4,041 |
| San Luis Obispo County CA Community College | | | | |
| District GO | 5.000% | 8/1/28 | 890 | 1,082 |
| San Luis Obispo County CA Community College | | | | |
| District GO | 5.000% | 8/1/32 | 1,395 | 1,653 |
| San Marcos CA Unified School District GO | 0.000% | 8/1/32 | 2,600 | 1,550 |
| San Marcos CA Unified School District GO | 5.000% | 8/1/34 | 5,620 | 6,324 |
| San Marcos CA Unified School District GO | 5.000% | 8/1/38 | 2,835 | 3,186 |
| San Mateo CA Union High School District GO | 0.000% | 9/1/41 | 5,000 | 4,130 |
| San Mateo County CA Joint Powers Financing | | | | |
| Authority Lease Revenue (Capital Project | | | | |
| Program) | 5.000% | 7/1/21 (14) | 3,500 | 4,016 |
| San Mateo County CA Joint Powers Financing | | | | |
| Authority Lease Revenue (Youth Services | | | | |
| Campus) | 5.000% | 7/15/31 | 2,290 | 2,790 |
| San Mateo County CA Joint Powers Financing | | | | |
| Authority Lease Revenue (Youth Services | | | | |
| Campus) | 4.000% | 7/15/35 | 2,110 | 2,255 |
| San Mateo County CA Mid-Peninsula Water | | | | |
| District COP | 4.000% | 12/1/46 | 2,000 | 2,075 |
| San Mateo-Foster City CA School District GO | 4.000% | 8/1/44 | 3,250 | 3,431 |
| San Mateo-Foster City CA School District GO | 4.000% | 8/1/45 | 5,000 | 5,249 |
| San Pablo CA Redevelopment Agency Successor | | | | |
| Agency Tax Allocation Revenue | 5.000% | 6/15/29 (4) | 1,780 | 2,074 |
| San Ramon CA Public Financing Authority Tax | | | | |
| Allocation Revenue | 0.000% | 2/1/33 (2) | 2,000 | 1,094 |
| San Ramon Valley CA Unified School District GO | 4.000% | 8/1/34 | 3,445 | 3,693 |
| Santa Ana CA Financing Authority Police | | | | |
| Administration & Holding Facility Lease Revenue | 6.250% | 7/1/17 (14) | 1,000 | 1,004 |
| Santa Ana CA Unified School District GO | 0.000% | 8/1/32 (14) | 3,680 | 2,161 |
| Santa Barbara CA Secondary/High School | | | | |
| District GO | 0.000% | 8/1/40 | 2,050 | 797 |
| Santa Clara CA Electric Revenue | 6.000% | 7/1/31 | 3,000 | 3,553 |
| Santa Clara CA Unified School District GO | 5.000% | 7/1/34 | 4,000 | 4,423 |
| Santa Clara County CA Financing Authority | | | | |
| Revenue | 5.000% | 5/15/27 | 5,000 | 6,123 |
| Santa Clara County CA GO | 5.000% | 8/1/28 | 9,000 | 10,555 |
168
California Long-Term Tax-Exempt Fund
| | | | |
| | | | Face | Market |
| | | Maturity | Amount | Value• |
| | Coupon | Date | ($000) | ($000) |
| Santa Clara Valley CA Joint Powers Authority | | | | |
| Revenue | 5.000% | 8/1/28 | 625 | 776 |
| Santa Clara Valley CA Joint Powers Authority | | | | |
| Revenue | 5.000% | 8/1/29 | 525 | 647 |
| Santa Monica CA Community College District GO | 4.000% | 8/1/31 | 3,000 | 3,268 |
| Santa Rosa CA Wastewater Revenue | 4.000% | 9/1/27 | 1,350 | 1,552 |
| Santa Rosa CA Wastewater Revenue | 5.000% | 9/1/28 | 4,845 | 5,600 |
| Santa Rosa CA Wastewater Revenue | 5.000% | 9/1/33 | 1,000 | 1,148 |
| Silicon Valley CA Clean Water Wastewater | | | | |
| Revenue | 5.000% | 2/1/39 | 3,090 | 3,513 |
| Silicon Valley CA Clean Water Wastewater | | | | |
| Revenue | 5.000% | 8/1/45 | 1,500 | 1,738 |
| Simi Valley CA Unified School District GO | 5.000% | 8/1/27 | 1,500 | 1,913 |
| Solana Beach CA School District Special Tax | | | | |
| Revenue | 5.000% | 9/1/32 | 1,000 | 1,104 |
| Solana Beach CA School District Special Tax | | | | |
| Revenue | 5.000% | 9/1/35 | 2,500 | 2,742 |
| Sonoma County CA Junior College District GO | 5.000% | 8/1/27 | 2,000 | 2,375 |
| Sonoma-Marin Area Rail Transportation District | | | | |
| California Sales & Use Tax Revenue | 5.000% | 3/1/28 | 3,500 | 4,021 |
| Southern California Public Power Authority | | | | |
| Revenue | 5.000% | 7/1/26 | 3,500 | 4,270 |
| Southern California Public Power Authority | | | | |
| Revenue | 5.000% | 7/1/29 | 5,000 | 5,561 |
| Southern California Public Power Authority | | | | |
| Revenue (Milford Wind Corridor Phase I Project) | 5.000% | 7/1/30 | 5,000 | 5,467 |
| Southern California Public Power Authority | | | | |
| Revenue (Natural Gas Project) | 5.000% | 11/1/17 | 1,865 | 1,893 |
| Southern California Public Power Authority | | | | |
| Revenue (Natural Gas Project) | 5.000% | 11/1/28 | 3,580 | 4,245 |
| Southern California Public Power Authority | | | | |
| Revenue (Natural Gas Project) | 5.000% | 11/1/33 | 3,530 | 4,261 |
| Southern California Public Power Authority | | | | |
| Revenue (Transmission Project) | 5.750% | 7/1/21 (14) | 220 | 221 |
| Southern California Water Replenishment | | | | |
| District Financing Authority Revenue | 5.000% | 8/1/28 | 1,000 | 1,218 |
| Southern California Water Replenishment | | | | |
| District Financing Authority Revenue | 5.000% | 8/1/41 | 7,000 | 8,189 |
| Southwestern California Community College | | | | |
| District GO | 5.000% | 8/1/44 | 7,045 | 8,125 |
| State Center California Community College | | | | |
| District GO | 5.000% | 8/1/28 | 5,275 | 6,414 |
| Stockton CA Public Financing Authority | | | | |
| Wastewater Revenue | 5.000% | 9/1/29 (15) | 1,000 | 1,169 |
| Stockton CA Public Financing Authority Water | | | | |
| Revenue (Delta Water Supply Project) | 6.250% | 10/1/38 | 2,150 | 2,625 |
| Stockton CA Redevelopment Agency Successor | | | | |
| Agency Tax Allocation Revenue | 5.000% | 9/1/37 (4) | 4,220 | 4,766 |
| Stockton CA Unified School District GO | 5.000% | 8/1/38 (4) | 2,500 | 2,832 |
| Suisun City CA Redevelopment Agency | | | | |
| Successor Agency Tax Allocation Revenue | 5.000% | 10/1/31 (15) | 1,225 | 1,419 |
| Suisun City CA Redevelopment Agency | | | | |
| Successor Agency Tax Allocation Revenue | 5.000% | 10/1/32 (15) | 1,250 | 1,443 |
| Suisun City CA Redevelopment Agency | | | | |
| Successor Agency Tax Allocation Revenue | 5.000% | 10/1/33 (15) | 1,280 | 1,471 |
169
California Long-Term Tax-Exempt Fund
| | | | |
| | | | Face | Market |
| | | Maturity | Amount | Value• |
| | Coupon | Date | ($000) | ($000) |
| Sweetwater CA Unified School District GO | 5.000% | 8/1/29 (15) | 4,200 | 4,945 |
| Tahoe-Truckee CA Unified School District GO | 5.000% | 8/1/39 | 2,500 | 2,922 |
| Temecula Valley CA Unified School District GO | 0.000% | 8/1/35 (15) | 3,000 | 3,009 |
| Temecula Valley CA Unified School District GO | 0.000% | 8/1/37 (15) | 3,785 | 3,801 |
| Torrance CA Hospital Revenue (Torrance | | | | |
| Memorial Medical Center) | 5.000% | 9/1/40 | 3,000 | 3,211 |
| Tulare County CA Transportation Authority | | | | |
| Sales Tax Revenue | 4.000% | 2/1/34 | 1,540 | 1,619 |
| Turlock CA Irrigation District Revenue | 5.000% | 1/1/20 (Prere.) | 3,000 | 3,312 |
| Turlock CA Irrigation District Revenue | 5.000% | 1/1/31 | 2,000 | 2,244 |
| Turlock CA Irrigation District Revenue | 5.500% | 1/1/41 | 3,445 | 3,911 |
| Tustin CA Community Facilities District Special | | | | |
| Tax Revenue | 5.000% | 9/1/37 | 1,000 | 1,125 |
| Tustin CA Unified School District Special Tax | | | | |
| Revenue | 5.000% | 9/1/31 | 3,000 | 3,419 |
| Ukiah CA Electric Revenue | 6.250% | 6/1/18 (14) | 790 | 807 |
| Ukiah CA Unified School District GO | 0.000% | 8/1/32 (10) | 6,425 | 3,619 |
| Union CA Elementary School District GO | 0.000% | 9/1/17 (14) | 2,295 | 2,290 |
| Union CA Elementary School District GO | 0.000% | 9/1/18 (14) | 1,630 | 1,609 |
| Union CA Elementary School District GO | 0.000% | 9/1/19 (14) | 1,750 | 1,703 |
| Union CA Elementary School District GO | 0.000% | 9/1/20 (14) | 2,300 | 2,200 |
| Union CA Elementary School District GO | 0.000% | 9/1/21 (14) | 2,000 | 1,875 |
| University of California Regents Medical Center | | | | |
| Pooled Revenue | 5.000% | 5/15/35 | 1,760 | 2,057 |
| University of California Regents Medical Center | | | | |
| Pooled Revenue | 5.000% | 5/15/41 | 20,000 | 23,121 |
| University of California Regents Medical Center | | | | |
| Pooled Revenue | 4.000% | 5/15/44 | 7,500 | 7,792 |
| University of California Revenue | 5.000% | 5/15/27 | 4,245 | 5,174 |
| University of California Revenue | 5.000% | 5/15/28 | 5,000 | 5,951 |
| University of California Revenue | 5.000% | 5/15/29 | 2,000 | 2,446 |
| University of California Revenue | 5.000% | 5/15/31 | 2,000 | 2,415 |
| University of California Revenue | 5.000% | 5/15/32 | 1,000 | 1,201 |
| University of California Revenue | 5.000% | 5/15/32 | 7,925 | 9,422 |
| University of California Revenue | 5.000% | 5/15/33 | 5,000 | 5,838 |
| University of California Revenue | 4.000% | 5/15/34 | 5,000 | 5,377 |
| University of California Revenue | 5.000% | 5/15/34 | 5,205 | 5,844 |
| University of California Revenue | 5.000% | 5/15/35 | 3,640 | 4,087 |
| University of California Revenue | 5.250% | 5/15/37 | 3,500 | 4,168 |
| University of California Revenue | 5.000% | 5/15/38 | 10,000 | 11,537 |
| University of California Revenue | 5.000% | 5/15/40 | 50 | 51 |
| University of California Revenue | 5.000% | 5/15/40 | 5,000 | 5,776 |
| University of California Revenue | 5.000% | 5/15/41 | 2,400 | 2,807 |
| University of California Revenue | 5.000% | 5/15/42 | 5,000 | 5,926 |
| University of California Revenue PUT | 5.000% | 5/15/23 | 6,500 | 7,841 |
| Vallecitos CA Water District Water & Wastewater | | | | |
| Enterprise Revenue | 5.000% | 7/1/33 | 1,110 | 1,308 |
| Vallecitos CA Water District Water & Wastewater | | | | |
| Enterprise Revenue | 5.000% | 7/1/35 | 750 | 876 |
| Vallejo CA Sanitation & Flood Control COP | 5.000% | 7/1/19 (14) | 1,641 | 1,691 |
| Vista CA Redevelopment Agency Successor | | | | |
| Agency Tax Allocation Revenue | 5.000% | 9/1/28 (4) | 1,970 | 2,339 |
| Vista CA Unified School District GO | 0.000% | 8/1/28 (14) | 7,425 | 5,381 |
| Walnut CA Energy Center Authority Revenue | 5.000% | 1/1/34 | 3,100 | 3,635 |
| Walnut CA Energy Center Authority Revenue | 5.000% | 1/1/35 | 2,000 | 2,163 |
170
California Long-Term Tax-Exempt Fund
| | | | |
| | | | Face | Market |
| | | Maturity | Amount | Value• |
| | Coupon | Date | ($000) | ($000) |
| Walnut CA Energy Center Authority Revenue | 5.000% | 1/1/40 | 5,000 | 5,394 |
| Washington Township CA Health Care District GO | 5.500% | 8/1/40 | 5,000 | 5,978 |
| Washington Township CA Health Care District | | | | |
| Revenue | 5.000% | 7/1/32 | 3,000 | 3,006 |
| Washington Township CA Health Care District | | | | |
| Revenue | 5.000% | 7/1/33 | 1,080 | 1,223 |
| Washington Township CA Health Care District | | | | |
| Revenue | 5.000% | 7/1/37 | 1,750 | 1,754 |
| West Contra Costa CA Unified School District GO | 0.000% | 8/1/32 (14) | 7,650 | 4,527 |
| West Contra Costa CA Unified School District GO | 5.250% | 8/1/35 (4) | 7,000 | 7,931 |
| West Contra Costa CA Unified School District GO | 5.000% | 8/1/40 | 3,000 | 3,441 |
| West Sacramento CA Area Flood Control Agency | | | | |
| Special Assessment Revenue | 5.000% | 9/1/40 (4) | 2,050 | 2,340 |
| West Sacramento CA Area Flood Control Agency | | | | |
| Special Assessment Revenue | 5.000% | 9/1/45 (4) | 2,715 | 3,086 |
| Western Placer CA Unified School District COP | 4.000% | 8/1/41 (4) | 2,000 | 2,079 |
| 3 Western Placer CA Unified School District GO | 5.000% | 8/1/42 | 6,350 | 7,422 |
| Westminster CA Redevelopment Agency | | | | |
| (Westminster Redevelopment Project No. 1) | 5.000% | 11/1/28 (15) | 675 | 820 |
| Westminster CA Redevelopment Agency | | | | |
| (Westminster Redevelopment Project No. 1) | 5.000% | 11/1/29 (15) | 1,000 | 1,204 |
| Whittier CA Health Facilities Revenue | | | | |
| (Presbyterian Intercommunity Hospital | | | | |
| Obligated Group) | 5.000% | 6/1/44 | 4,500 | 4,972 |
| Yuba City CA Unified School District GO | 0.000% | 9/1/17 (14) | 2,060 | 2,055 |
| Yuba City CA Unified School District GO | 0.000% | 9/1/19 (14) | 2,270 | 2,207 |
| Yucaipa Valley CA Water District Water | | | | |
| System Revenue | 5.000% | 9/1/27 | 1,000 | 1,199 |
| | | | | 3,760,563 |
| Guam (0.2%) | | | | |
| Guam Government Business Privilege Tax | | | | |
| Revenue | 5.000% | 11/15/39 | 4,900 | 5,259 |
| Guam Power Authority Revenue | 5.000% | 10/1/24 | 1,000 | 1,151 |
| | | | | 6,410 |
| Total Tax-Exempt Municipal Bonds (Cost $3,555,767) | | | 3,766,973 |
171
California Long-Term Tax-Exempt Fund
| |
| | Amount |
| | ($000) |
| Other Assets and Liabilities (-0.1%) | |
| Other Assets | |
| Investment in Vanguard | 247 |
| Receivables for Investment Securities Sold | 5,930 |
| Receivables for Accrued Income | 35,647 |
| Receivables for Capital Shares Issued | 2,197 |
| Other Assets | 494 |
| Total Other Assets | 44,515 |
| Liabilities | |
| Payables for Investment Securities Purchased | (37,874) |
| Payables for Capital Shares Redeemed | (1,763) |
| Payables for Distributions | (3,390) |
| Payables to Vanguard | (3,178) |
| Other Liabilities | (376) |
| Total Liabilities | (46,581) |
| Net Assets (100%) | 3,764,907 |
| |
| |
| At May 31, 2017, net assets consisted of: | |
| | Amount |
| | ($000) |
| Paid-in Capital | 3,594,719 |
| Overdistributed Net Investment Income | (2) |
| Accumulated Net Realized Losses | (40,928) |
| Unrealized Appreciation (Depreciation) | |
| Investment Securities | 211,206 |
| Futures Contracts | (88) |
| Net Assets | 3,764,907 |
| |
| |
| Investor Shares—Net Assets | |
| Applicable to 38,896,122 outstanding $.001 par value shares of | |
| beneficial interest (unlimited authorization) | 472,628 |
| Net Asset Value Per Share—Investor Shares | $12.15 |
| |
| |
| Admiral Shares—Net Assets | |
| Applicable to 270,947,016 outstanding $.001 par value shares of | |
| beneficial interest (unlimited authorization) | 3,292,279 |
| Net Asset Value Per Share—Admiral Shares | $12.15 |
• See Note A in Notes to Financial Statements.
1 Securities with a value of $1,075,000 have been segregated as initial margin for open futures contracts.
2 Security exempt from registration under Rule 144A of the Securities Act of 1933. Such securities may be sold in transactions exempt from
registration, normally to qualified institutional buyers. At May 31, 2017, the aggregate value of these securities was $35,198,000,
representing 0.9% of net assets.
3 Security purchased on a when-issued or delayed-delivery basis for which the fund has not taken delivery as of May 31, 2017.
A key to abbreviations and other references follows the Statement of Net Assets.
See accompanying Notes, which are an integral part of the Financial Statements.
172
California Long-Term Tax-Exempt Fund
Key to Abbreviations
ARS—Auction Rate Security.
BAN—Bond Anticipation Note.
COP—Certificate of Participation.
CP—Commercial Paper.
FR—Floating Rate.
GAN—Grant Anticipation Note.
GO—General Obligation Bond.
PILOT—Payments in Lieu of Taxes.
PUT—Put Option Obligation.
RAN—Revenue Anticipation Note.
TAN—Tax Anticipation Note.
TOB—Tender Option Bond.
TRAN—Tax Revenue Anticipation Note.
VRDO—Variable Rate Demand Obligation.
VRDP—Variable Rate Demand Preferred.
(ETM)—Escrowed to Maturity.
(Prere.)—Prerefunded.
Scheduled principal and interest payments are guaranteed by:
(1) MBIA (Municipal Bond Investors Assurance).
(2) AMBAC (Ambac Assurance Corporation).
(3) FGIC (Financial Guaranty Insurance Company).
(4) AGM (Assured Guaranty Municipal Corporation).
(5) BIGI (Bond Investors Guaranty Insurance).
(6) Connie Lee Inc.
(7) FHA (Federal Housing Authority).
(8) CapMAC (Capital Markets Assurance Corporation).
(9) American Capital Access Financial Guaranty Corporation.
(10) XL Capital Assurance Inc.
(11) CIFG (CDC IXIS Financial Guaranty).
(12) AGC (Assured Guaranty Corporation).
(13) BHAC (Berkshire Hathaway Assurance Corporation).
(14) NPFG (National Public Finance Guarantee Corporation).
(15) BAM (Build America Mutual Assurance Company).
(16) MAC (Municipal Assurance Corporation).
(17) RAA (Radian Asset Assurance Inc.).
(18) SBLF (Michigan School Bond Loan Fund).
The insurance does not guarantee the market value of the municipal bonds.
LOC—Scheduled principal and interest payments are guaranteed by bank letter of credit.
173
California Long-Term Tax-Exempt Fund
| |
| Statement of Operations | |
| |
| | Six Months Ended |
| | May 31, 2017 |
| | ($000) |
| Investment Income | |
| Income | |
| Interest | 63,806 |
| Total Income | 63,806 |
| Expenses | |
| The Vanguard Group—Note B | |
| Investment Advisory Services | 252 |
| Management and Administrative—Investor Shares | 340 |
| Management and Administrative—Admiral Shares | 1,041 |
| Marketing and Distribution—Investor Shares | 50 |
| Marketing and Distribution—Admiral Shares | 125 |
| Custodian Fees | 18 |
| Shareholders’ Reports—Investor Shares | 14 |
| Shareholders’ Reports—Admiral Shares | 16 |
| Trustees’ Fees and Expenses | 1 |
| Total Expenses | 1,857 |
| Net Investment Income | 61,949 |
| Realized Net Gain (Loss) | |
| Investment Securities Sold | 2,477 |
| Futures Contracts | (556) |
| Realized Net Gain (Loss) | 1,921 |
| Change in Unrealized Appreciation (Depreciation) | |
| Investment Securities | 147,258 |
| Futures Contracts | (127) |
| Change in Unrealized Appreciation (Depreciation) | 147,131 |
| Net Increase (Decrease) in Net Assets Resulting from Operations | 211,001 |
See accompanying Notes, which are an integral part of the Financial Statements.
174
California Long-Term Tax-Exempt Fund
| | |
| Statement of Changes in Net Assets | | |
| |
| | Six Months Ended | Year Ended |
| | May 31, | November 30, |
| | 2017 | 2016 |
| | ($000) | ($000) |
| Increase (Decrease) in Net Assets | | |
| Operations | | |
| Net Investment Income | 61,949 | 123,444 |
| Realized Net Gain (Loss) | 1,921 | 15,647 |
| Change in Unrealized Appreciation (Depreciation) | 147,131 | (166,809) |
| Net Increase (Decrease) in Net Assets Resulting from Operations | 211,001 | (27,718) |
| Distributions | | |
| Net Investment Income | | |
| Investor Shares | (7,631) | (15,747) |
| Admiral Shares | (54,112) | (107,648) |
| Realized Capital Gain | | |
| Investor Shares | — | — |
| Admiral Shares | — | — |
| Total Distributions | (61,743) | (123,395) |
| Capital Share Transactions | | |
| Investor Shares | (1,354) | 49,589 |
| Admiral Shares | 99,523 | 285,502 |
| Net Increase (Decrease) from Capital Share Transactions | 98,169 | 335,091 |
| Total Increase (Decrease) | 247,427 | 183,978 |
| Net Assets | | |
| Beginning of Period | 3,517,480 | 3,333,502 |
| End of Period1 | 3,764,907 | 3,517,480 |
1 Net Assets—End of Period includes undistributed (overdistributed) net investment income of ($2,000) and $7,000.
See accompanying Notes, which are an integral part of the Financial Statements.
175
California Long-Term Tax-Exempt Fund
| | | | | | |
| Financial Highlights | | | | | | |
| |
| |
| Investor Shares | | | | | | |
| Six Months | | | | | |
| | Ended | | | | | |
| For a Share Outstanding | May 31, | | | Year Ended November 30, |
| Throughout Each Period | 2017 | 2016 | 2015 | 2014 | 2013 | 2012 |
| Net Asset Value, Beginning of Period | $11.66 | $12.12 | $12.07 | $11.31 | $12.24 | $11.24 |
| Investment Operations | | | | | | |
| Net Investment Income | .198 | .410 | .428 | .442 | .450 | .459 |
| Net Realized and Unrealized Gain (Loss) | | | | | | |
| on Investments | .489 | (.460) | .050 | .760 | (.930) | 1.000 |
| Total from Investment Operations | .687 | (.050) | .478 | 1.202 | (.480) | 1.459 |
| Distributions | | | | | | |
| Dividends from Net Investment Income | (.197) | (. 410) | (. 428) | (. 442) | (. 450) | (. 459) |
| Distributions from Realized Capital Gains | — | — | — | — | — | — |
| Total Distributions | (.197) | (. 410) | (. 428) | (. 442) | (. 450) | (. 459) |
| Net Asset Value, End of Period | $12.15 | $11.66 | $12.12 | $12.07 | $11.31 | $12.24 |
| |
| Total Return1 | 5.94% | -0.55% | 4.03% | 10.79% | -3.96% | 13.20% |
| |
| Ratios/Supplemental Data | | | | | | |
| Net Assets, End of Period (Millions) | $473 | $455 | $425 | $397 | $390 | $487 |
| Ratio of Total Expenses to | | | | | | |
| Average Net Assets | 0.19% | 0.19% | 0.20% | 0.20% | 0.20% | 0.20% |
| Ratio of Net Investment Income to | | | | | | |
| Average Net Assets | 3.34% | 3.31% | 3.55% | 3.75% | 3.86% | 3.89% |
| Portfolio Turnover Rate | 21% | 18% | 17% | 14% | 14% | 16% |
The expense ratio, net investment income ratio, and turnover rate for the current period have been annualized.
1 Total returns do not include account service fees that may have applied in the periods shown. Fund prospectuses provide information about any applicable account service fees.
See accompanying Notes, which are an integral part of the Financial Statements.
176
California Long-Term Tax-Exempt Fund
| | | | | | |
| Financial Highlights | | | | | | |
| |
| |
| Admiral Shares | | | | | | |
| Six Months | | | | | |
| | Ended | | | | | |
| For a Share Outstanding | May 31, | | | Year Ended November 30, |
| Throughout Each Period | 2017 | 2016 | 2015 | 2014 | 2013 | 2012 |
| Net Asset Value, Beginning of Period | $11.66 | $12.12 | $12.07 | $11.31 | $12.24 | $11.24 |
| Investment Operations | | | | | | |
| Net Investment Income | . 204 | .423 | .438 | .451 | .459 | .468 |
| Net Realized and Unrealized Gain (Loss) | | | | | | |
| on Investments | .489 | (.460) | .050 | .760 | (.930) | 1.000 |
| Total from Investment Operations | .693 | (.037) | .488 | 1.211 | (.471) | 1.468 |
| Distributions | | | | | | |
| Dividends from Net Investment Income | (. 203) | (. 423) | (. 438) | (. 451) | (. 459) | (. 468) |
| Distributions from Realized Capital Gains | — | — | — | — | — | — |
| Total Distributions | (. 203) | (. 423) | (. 438) | (. 451) | (. 459) | (. 468) |
| Net Asset Value, End of Period | $12.15 | $11.66 | $12.12 | $12.07 | $11.31 | $12.24 |
| |
| Total Return1 | 5.99% | -0.45% | 4.12% | 10.87% | -3.88% | 13.29% |
| |
| Ratios/Supplemental Data | | | | | | |
| Net Assets, End of Period (Millions) | $3,292 | $3,062 | $2,909 | $2,674 | $2,314 | $2,589 |
| Ratio of Total Expenses to | | | | | | |
| Average Net Assets | 0.09% | 0.09% | 0.12% | 0.12% | 0.12% | 0.12% |
| Ratio of Net Investment Income to | | | | | | |
| Average Net Assets | 3.44% | 3.41% | 3.63% | 3.83% | 3.94% | 3.97% |
| Portfolio Turnover Rate | 21% | 18% | 17% | 14% | 14% | 16% |
The expense ratio, net investment income ratio, and turnover rate for the current period have been annualized.
1 Total returns do not include account service fees that may have applied in the periods shown. Fund prospectuses provide information about any applicable account service fees.
See accompanying Notes, which are an integral part of the Financial Statements.
177
California Long-Term Tax-Exempt Fund
Notes to Financial Statements
Vanguard California Long-Term Tax-Exempt Fund is registered under the Investment Company Act of 1940 as an open-end investment company, or mutual fund. The fund invests in debt instruments of municipal issuers whose ability to meet their obligations may be affected by economic and political developments in the state. The fund offers two classes of shares: Investor Shares and Admiral Shares. Investor Shares are available to any investor who meets the fund’s minimum purchase requirements. Admiral Shares are designed for investors who meet certain administrative, service, and account-size criteria.
A. The following significant accounting policies conform to generally accepted accounting principles for U.S. investment companies. The fund consistently follows such policies in preparing its financial statements.
1. Security Valuation: Securities are valued as of the close of trading on the New York Stock Exchange (generally 4 p.m., Eastern time) on the valuation date. Bonds and temporary cash investments are valued using the latest bid prices or using valuations based on a matrix system (which considers such factors as security prices, yields, maturities, and ratings), both as furnished by independent pricing services. Securities for which market quotations are not readily available, or whose values have been affected by events occurring before the fund’s pricing time but after the close of the securities’ primary markets, are valued by methods deemed by the board of trustees to represent fair value.
2. Futures Contracts: The fund uses futures contracts to invest in fixed income asset classes with greater efficiency and lower cost than is possible through direct investment, to add value when these instruments are attractively priced, or to adjust sensitivity to changes in interest rates. The primary risks associated with the use of futures contracts are imperfect correlation between changes in market values of bonds held by the fund and the prices of futures contracts, and the possibility of an illiquid market. Counterparty risk involving futures is mitigated because a regulated clearinghouse is the counterparty instead of the clearing broker. To further mitigate counterparty risk, the fund trades futures contracts on an exchange, monitors the financial strength of its clearing brokers and clearinghouse, and has entered into clearing agreements with its clearing brokers. The clearinghouse imposes initial margin requirements to secure the fund’s performance and requires daily settlement of variation margin representing changes in the market value of each contract.
Futures contracts are valued at their quoted daily settlement prices. The aggregate settlement values of the contracts are not recorded in the Statement of Net Assets. Fluctuations in the value of the contracts are recorded in the Statement of Net Assets as an asset (liability) and in the Statement of Operations as unrealized appreciation (depreciation) until the contracts are closed, when they are recorded as realized futures gains (losses).
During the six months ended May 31, 2017, the fund’s average investments in long and short futures contracts represented 3% and 1% of net assets, respectively, based on the average of aggregate settlement values at each quarter-end during the period.
3. Federal Income Taxes: The fund intends to continue to qualify as a regulated investment company and distribute all of its income. Management has analyzed the fund’s tax positions taken for all open federal income tax years (November 30, 2013–2016), and for the period ended May 31, 2017, and has concluded that no provision for federal income tax is required in the fund’s financial statements.
4. Distributions: Distributions from net investment income are declared daily and paid on the first business day of the following month. Annual distributions from realized capital gains, if any, are recorded on the ex-dividend date.
178
California Long-Term Tax-Exempt Fund
5. Credit Facility: The fund and certain other funds managed by The Vanguard Group (“Vanguard”) participate in a $3.1 billion committed credit facility provided by a syndicate of lenders pursuant to a credit agreement that may be renewed annually; each fund is individually liable for its borrowings, if any, under the credit facility. Borrowings may be utilized for temporary and emergency purposes, and are subject to the fund’s regulatory and contractual borrowing restrictions. The participating funds are charged administrative fees and an annual commitment fee of 0.10% of the undrawn amount of the facility; these fees are allocated to the funds based on a method approved by the fund’s board of trustees and included in Management and Administrative expenses on the fund’s Statement of Operations. Any borrowings under this facility bear interest at a rate based upon the higher of the one-month London Interbank Offered Rate, federal funds effective rate, or overnight bank funding rate plus an agreed-upon spread.
The fund had no borrowings outstanding at May 31, 2017, or at any time during the period then ended.
6. Other: Interest income is accrued daily. Premiums and discounts on debt securities purchased are amortized and accreted, respectively, to interest income over the lives of the respective securities. Security transactions are accounted for on the date securities are bought or sold. Costs used to determine realized gains (losses) on the sale of investment securities are those of the specific securities sold.
Each class of shares has equal rights as to assets and earnings, except that each class separately bears certain class-specific expenses related to maintenance of shareholder accounts (included in Management and Administrative expenses) and shareholder reporting. Marketing and distribution expenses are allocated to each class of shares based on a method approved by the board of trustees. Income, other non-class-specific expenses, and gains and losses on investments are allocated to each class of shares based on its relative net assets.
B. In accordance with the terms of a Funds’ Service Agreement (the “FSA”) between Vanguard and the fund, Vanguard furnishes to the fund investment advisory, corporate management, administrative, marketing, and distribution services at Vanguard’s cost of operations (as defined by the FSA). These costs of operations are allocated to the fund based on methods and guidelines approved by the board of trustees. Vanguard does not require reimbursement in the current period for certain costs of operations (such as deferred compensation/benefits and risk/insurance costs); the fund’s liability for these costs of operations is included in Payables to Vanguard on the Statement of Net Assets.
Upon the request of Vanguard, the fund may invest up to 0.40% of its net assets as capital in Vanguard. At May 31, 2017, the fund had contributed to Vanguard capital in the amount of $247,000, representing 0.01% of the fund’s net assets and 0.10% of Vanguard’s capitalization. The fund’s trustees and officers are also directors and employees, respectively, of Vanguard.
C. Various inputs may be used to determine the value of the fund’s investments. These inputs are summarized in three broad levels for financial statement purposes. The inputs or methodologies used to value securities are not necessarily an indication of the risk associated with investing in those securities.
Level 1—Quoted prices in active markets for identical securities.
Level 2—Other significant observable inputs (including quoted prices for similar securities, interest rates, prepayment speeds, credit risk, etc.).
Level 3—Significant unobservable inputs (including the fund’s own assumptions used to determine the fair value of investments).
179
California Long-Term Tax-Exempt Fund
The following table summarizes the market value of the fund’s investments as of May 31, 2017, based on the inputs used to value them:
| | | |
| | Level 1 | Level 2 | Level 3 |
| Investments | ($000) | ($000) | ($000) |
| Tax-Exempt Municipal Bonds | — | 3,766,973 | — |
| Futures Contracts—Assets1 | 125 | — | — |
| Futures Contracts—Liabilities1 | (233) | — | — |
| Total | (108) | 3,766,973 | — |
| 1 Represents variation margin on the last day of the reporting period. | | | |
D. At May 31, 2017, the aggregate settlement value of open futures contracts and the related unrealized appreciation (depreciation) were:
| | | | |
| | | | | ($000) |
| | | | Aggregate | |
| | | Number of | Settlement | Unrealized |
| | | Long (Short) | Value | Appreciation |
| Futures Contracts | Expiration | Contracts | Long (Short) | (Depreciation) |
| 5-Year U.S. Treasury Note | September 2017 | 570 | 67,438 | 88 |
| 2-Year U.S. Treasury Note | September 2017 | 257 | 55,636 | 49 |
| Ultra 10-Year U.S. Treasury Note | September 2017 | (293) | (39,770) | (210) |
| 10-Year U.S. Treasury Note | September 2017 | 166 | 20,965 | 54 |
| Ultra Long U.S. Treasury Bond | September 2017 | (30) | (4,954) | (47) |
| 30-Year U.S. Treasury Bond | September 2017 | (21) | (3,230) | (22) |
| | | | | (88) |
Unrealized appreciation (depreciation) on open futures contracts is required to be treated as realized gain (loss) for tax purposes.
E. Capital gain distributions are determined on a tax basis and may differ from realized capital gains for financial reporting purposes. Differences may be permanent or temporary. Permanent differences are reclassified among capital accounts in the financial statements to reflect their tax character. Temporary differences arise when gains or losses are recognized in different periods for financial statement and tax purposes. These differences will reverse at some time in the future.
The fund’s tax-basis capital gains and losses are determined only at the end of each fiscal year. For tax purposes, at November 30, 2016, the fund had available capital losses totaling $41,162,000 to offset future net capital gains of $11,654,000 through November 30, 2017, $12,571,000 through November 30, 2018, and $16,937,000 through November 30, 2019.The fund will use these capital losses to offset net taxable capital gains, if any, realized during the year ending November 30, 2017; should the fund realize net capital losses for the year, the losses will be added to the loss carryforward balance above.
At May 31, 2017, the cost of investment securities for tax purposes was $3,557,415,000. Net unrealized appreciation of investment securities for tax purposes was $209,558,000, consisting of unrealized gains of $219,751,000 on securities that had risen in value since their purchase and $10,193,000 in unrealized losses on securities that had fallen in value since their purchase.
180
California Long-Term Tax-Exempt Fund
F. During the six months ended May 31, 2017, the fund purchased $436,109,000 of investment securities and sold $357,971,000 of investment securities, other than temporary cash investments.
The fund purchased securities from and sold securities to other Vanguard funds or accounts managed by Vanguard or its affiliates, in accordance with procedures adopted by the board of trustees in compliance with Rule 17a-7 of the Investment Company Act of 1940. For the six months ended May 31, 2017, such purchases and sales were $168,981,000 and $129,826,000, respectively; these amounts are included in the purchases and sales of investment securities noted above.
| | | | |
| G. Capital share transactions for each class of shares were: | | | |
| | Six Months Ended | | Year Ended |
| | | May 31, 2017 | November 30, 2016 |
| | Amount | Shares | Amount | Shares |
| | ($000) | (000) | ($000) | (000) |
| Investor Shares | | | | |
| Issued | 65,707 | 5,537 | 164,555 | 13,277 |
| Issued in Lieu of Cash Distributions | 6,641 | 557 | 13,625 | 1,103 |
| Redeemed | (73,702) | (6,225) | (128,591) | (10,407) |
| Net Increase (Decrease)—Investor Shares | (1,354) | (131) | 49,589 | 3,973 |
| Admiral Shares | | | | |
| Issued | 395,258 | 33,330 | 761,935 | 61,587 |
| Issued in Lieu of Cash Distributions | 35,447 | 2,972 | 70,089 | 5,674 |
| Redeemed | (331,182) | (28,022) | (546,522) | (44,606) |
| Net Increase (Decrease)—Admiral Shares | 99,523 | 8,280 | 285,502 | 22,655 |
H. Management has determined that no material events or transactions occurred subsequent to May 31, 2017, that would require recognition or disclosure in these financial statements.
181
About Your Fund’s Expenses
As a shareholder of the fund, you incur ongoing costs, which include costs for portfolio management, administrative services, and shareholder reports (like this one), among others. Operating expenses, which are deducted from a fund’s gross income, directly reduce the investment return of the fund.
A fund’s expenses are expressed as a percentage of its average net assets. This figure is known as the expense ratio. The following examples are intended to help you understand the ongoing costs (in dollars) of investing in your fund and to compare these costs with those of other mutual funds. The examples are based on an investment of $1,000 made at the beginning of the period shown and held for the entire period.
The accompanying table illustrates your fund’s costs in two ways:
• Based on actual fund return. This section helps you to estimate the actual expenses that you paid over the period. The ”Ending Account Value“ shown is derived from the fund‘s actual return, and the third column shows the dollar amount that would have been paid by an investor who started with $1,000 in the fund. You may use the information here, together with the amount you invested, to estimate the expenses that you paid over the period.
To do so, simply divide your account value by $1,000 (for example, an $8,600 account value divided by $1,000 = 8.6), then multiply the result by the number given for your fund under the heading ”Expenses Paid During Period.“
• Based on hypothetical 5% yearly return. This section is intended to help you compare your fund‘s costs with those of other mutual funds. It assumes that the fund had a yearly return of 5% before expenses, but that the expense ratio is unchanged. In this case—because the return used is not the fund’s actual return—the results do not apply to your investment. The example is useful in making comparisons because the Securities and Exchange Commission requires all mutual funds to calculate expenses based on a 5% return. You can assess your fund’s costs by comparing this hypothetical example with the hypothetical examples that appear in shareholder reports of other funds.
Note that the expenses shown in the table are meant to highlight and help you compare ongoing costs only and do not reflect transaction costs incurred by the fund for buying and selling securities. Further, the expenses do not include any purchase, redemption, or account service fees described in the fund prospectus. If such fees were applied to your account, your costs would be higher. Your fund does not carry a “sales load.”
The calculations assume no shares were bought or sold during the period. Your actual costs may have been higher or lower, depending on the amount of your investment and the timing of any purchases or redemptions.
You can find more information about the fund’s expenses, including annual expense ratios, in the Financial Statements section of this report. For additional information on operating expenses and other shareholder costs, please refer to your fund’s current prospectus.
182
| | | |
| Six Months Ended May 31, 2017 | | | |
| | Beginning | Ending | Expenses |
| | Account Value | Account Value | Paid During |
| | 11/30/2016 | 5/31/2017 | Period |
| Based on Actual Fund Return | | | |
| California Municipal Money Market Fund | $1,000.00 | $1,002.88 | $0.80 |
| California Intermediate-Term Tax-Exempt Fund | | | |
| Investor Shares | $1,000.00 | $1,049.40 | $0.97 |
| Admiral Shares | 1,000.00 | 1,049.91 | 0.46 |
| California Long-Term Tax-Exempt Fund | | | |
| Investor Shares | $1,000.00 | $1,059.38 | $0.98 |
| Admiral Shares | 1,000.00 | 1,059.92 | 0.46 |
| Based on Hypothetical 5% Yearly Return | | | |
| California Municipal Money Market Fund | $1,000.00 | $1,024.13 | $0.81 |
| California Intermediate-Term Tax-Exempt Fund | | | |
| Investor Shares | $1,000.00 | $1,023.98 | $0.96 |
| Admiral Shares | 1,000.00 | 1,024.48 | 0.45 |
| California Long-Term Tax-Exempt Fund | | | |
| Investor Shares | $1,000.00 | $1,023.98 | $0.96 |
| Admiral Shares | 1,000.00 | 1,024.48 | 0.45 |
The calculations are based on expenses incurred in the most recent six-month period. The funds’ annualized six-month expense ratios for that period are: for the California Municipal Money Market Fund, 0.16%; for the California Intermediate-Term Tax-Exempt Fund, 0.19% for Investor Shares and 0.09% for Admiral Shares; and for the California Long-Term Tax-Exempt Fund, 0.19% for Investor Shares and 0.09% for Admiral Shares. The dollar amounts shown as “Expenses Paid” are equal to the annualized expense ratio multiplied by the average account value over the period, multiplied by the number of days in the most recent six-month period, then divided by the number of days in the most recent 12-month period (182/365).
183
Trustees Approve Advisory Arrangements
The board of trustees of Vanguard California Municipal Money Market Fund, Vanguard California Intermediate-Term Tax-Exempt Fund, and Vanguard California Long-Term Tax-Exempt Fund has renewed each fund’s investment advisory arrangement with The Vanguard Group, Inc. (Vanguard), through its Fixed Income Group. The board determined that continuing the funds’ internalized management structure was in the best interests of each fund and its shareholders.
The board based its decision upon an evaluation of the advisor’s investment staff, portfolio management process, and performance. This evaluation included information provided to the board by Vanguard’s Portfolio Review Department, which is responsible for fund and advisor oversight and product management. The Portfolio Review Department met regularly with the advisor and made monthly presentations to the board during the fiscal year that directed the board’s focus to relevant information and topics.
The board, or an investment committee made up of board members, also received information throughout the year during advisor presentations. For each advisor presentation, the board was provided with letters and reports that included information about, among other things, the advisory firm and the advisor’s assessment of the investment environment, portfolio performance, and portfolio characteristics.
In addition, the board received monthly reports, which included a Market and Economic Report, a Fund Dashboard Monthly Summary, and a Fund Performance Report.
Prior to their meeting, the trustees were provided with a memo and materials that summarized the information they received over the course of the year. They also considered the factors discussed below, among others. However, no single factor determined whether the board approved the arrangements. Rather, it was the totality of the circumstances that drove the board’s decision.
Nature, extent, and quality of services
The board reviewed the quality of each fund’s investment management services over both the short and long term and took into account the organizational depth and stability of the advisor. The board considered that Vanguard has been managing investments for more than three decades. The Fixed Income Group adheres to a sound, disciplined investment management process; the team has considerable experience, stability, and depth.
The board concluded that Vanguard’s experience, stability, depth, and performance, among other factors, warranted continuation of each advisory arrangement.
Investment performance
The board considered the short- and long-term performance of each fund, including any periods of outperformance or underperformance compared with a benchmark index (as applicable) and peer group. The board concluded that the performance was such that each advisory arrangement should continue. Information about each fund’s most recent performance can be found in the Performance Summary sections of this report.
Cost
The board concluded that the California Intermediate-Term Tax-Exempt and California Long-Term Tax-Exempt Funds’ expense ratios were well below the average expense ratio charged by funds in their peer groups and that each fund’s advisory expenses were also well below its peer-group average. The board also concluded that the California Municipal Money Market Fund’s expense ratio was reasonable compared with the average expense ratio charged by funds in its peer group and that
184
the fund’s advisory expenses were well below its peer-group average. Information about the funds’ expenses appears in the About Your Fund’s Expenses section of this report as well as in the Financial Statements sections.
The board does not conduct a profitability analysis of Vanguard because of Vanguard’s unique “at-cost” structure. Unlike most other mutual fund management companies, Vanguard is owned by the funds it oversees and produces “profits” only in the form of reduced expenses for fund shareholders.
The benefit of economies of scale
The board concluded that each fund’s at-cost arrangement with Vanguard ensures that the funds will realize economies of scale as they grow, with the cost to shareholders declining as fund assets increase.
The board will consider whether to renew the advisory arrangements again after a one-year period.
185
Glossary
7-Day SEC Yield and 30-Day SEC Yield. A money market fund’s 7-day SEC yield is calculated by annualizing its income distributions for the previous seven days, as required by the U.S. Securities and Exchange Commission. For other funds, 30-day SEC yield is derived using a formula specified by the commission. Under the formula, data related to the fund’s security holdings in the previous 30 days are used to calculate the fund’s hypothetical net income for that period, which is then annualized and divided by the fund’s estimated average net assets over the calculation period. For the purposes of this calculation, a security’s income is based on its current market yield to maturity (for bonds), its actual income (for asset-backed securities), or its projected dividend yield (for stocks). Because the SEC yield represents hypothetical annualized income, it will differ—at times significantly—from the fund’s actual experience. As a result, the fund’s income distributions may be higher or lower than implied by the SEC yield.
Average Coupon. The average interest rate paid on the fixed income securities held by a fund. It is expressed as a percentage of face value.
Average Duration. An estimate of how much the value of the bonds held by a fund will fluctuate in response to a change in interest rates. To see how the value could change, multiply the average duration by the change in rates. If interest rates rise by 1 percentage point, the value of the bonds in a fund with an average duration of five years would decline by about 5%. If rates decrease by a percentage point, the value would rise by 5%.
Average Stated Maturity. The average length of time until fixed income securities held by a fund reach maturity and are repaid using the maturity date of the security. The figure reflects the proportion of fund assets represented by each security; it also reflects any futures contracts held. In general, the longer the average stated maturity, the more a fund’s share price will fluctuate in response to changes in market interest rates.
Average Weighted Maturity. The average length of time until fixed income securities held by a fund reach maturity and are repaid. The figure reflects the proportion of fund assets represented by each security.
Beta. A measure of the magnitude of a fund’s past share-price fluctuations in relation to the ups and downs of a given market index. The index is assigned a beta of 1.00. Compared with a given index, a fund with a beta of 1.20 typically would have seen its share price rise or fall by 12% when the index rose or fell by 10%. For this report, beta is based on returns over the past 36 months for both the fund and the index. Note that a fund’s beta should be reviewed in conjunction with its R-squared (see definition). The lower the R-squared, the less correlation there is between the fund and the index, and the less reliable beta is as an indicator of volatility.
Credit Quality. Credit-quality ratings are measured on a scale that generally ranges from AAA (highest) to D (lowest). Credit-quality ratings are obtained from Moody’s and S&P, and the higher rating for each issue is used. ”Not Rated” is used to classify securities for which a rating is not available. Not rated securities include a fund’s investment in Vanguard Market Liquidity Fund or Vanguard Municipal Cash Management Fund, each of which invests in high-quality money market instruments and may serve as a cash management vehicle for the Vanguard funds, trusts, and accounts.
186
Expense Ratio. A fund’s total annual operating expenses expressed as a percentage of the fund’s average net assets. The expense ratio includes management and administrative expenses, but does not include the transaction costs of buying and selling portfolio securities.
Inception Date. The date on which the assets of a fund (or one of its share classes) are first invested in accordance with the fund’s investment objective. For funds with a subscription period, the inception date is the day after that period ends. Investment performance is measured from the inception date.
R-Squared. A measure of how much of a fund’s past returns can be explained by the returns from the market in general, as measured by a given index. If a fund’s total returns were precisely synchronized with an index’s returns, its R-squared would be 1.00. If the fund’s returns bore no relationship to the index’s returns, its R-squared would be 0. For this report, R-squared is based on returns over the past 36 months for both the fund and the index.
Short-Term Reserves. The percentage of a fund invested in highly liquid, short-term securities that can be readily converted to cash.
Yield to Maturity. The rate of return an investor would receive if the fixed income securities held by a fund were held to their maturity dates.
187
The Vanguard Municipal Bond Funds are not sponsored, endorsed, issued, sold, or promoted by Barclays Risk Analytics and
Index Solutions Limited or any of its affiliates (“Barclays”). Barclays makes no representation or warranty, express or implied,
to the owners or purchasers of the Vanguard Municipal Bond Funds or any member of the public regarding the advisability of
investing in securities generally or in the Vanguard Municipal Bond Funds particularly or the ability of the Bloomberg Barclays
Indices to track general bond market performance. Barclays has not passed on the legality or suitability of the Vanguard
Municipal Bond Funds with respect to any person or entity. Barclays’ only relationship to Vanguard and the Vanguard Municipal
Bond Funds is the licensing of the Bloomberg Barclays Indices, which are determined, composed, and calculated by Barclays
without regard to Vanguard or the Vanguard Municipal Bond Funds or any owners or purchasers of the Vanguard Municipal
Bond Funds. Barclays has no obligation to take the needs of Vanguard, the Vanguard Municipal Bond Funds, or the owners
of the Vanguard Municipal Bond Funds into consideration in determining, composing, or calculating the Bloomberg Barclays
Indices. Barclays is not responsible for and has not participated in the determination of the timing of, prices at, or quantities of
the Vanguard Municipal Bond Funds to be issued. Barclays has no obligation or liability in connection with the administration,
marketing, or trading of the Vanguard Municipal Bond Funds.
BARCLAYS SHALL HAVE NO LIABILITY TO THIRD PARTIES FOR THE QUALITY, ACCURACY AND/OR COMPLETENESS OF THE
INDEX OR ANY DATA INCLUDED THEREIN OR FOR INTERRUPTIONS IN THE DELIVERY OF THE INDEX. BARCLAYS MAKES
NO WARRANTY, EXPRESS OR IMPLIED, AS TO RESULTS TO BE OBTAINED BY OWNERS OF THE VANGUARD MUNICIPAL
BOND FUNDS OR ANY OTHER PERSON OR ENTITY FROM THE USE OF THE INDEX OR ANY DATA INCLUDED THEREIN IN
CONNECTION WITH THE RIGHTS LICENSED HEREUNDER OR FOR ANY OTHER USE. BARCLAYS RESERVES THE RIGHT
TO CHANGE THE METHODS OF CALCULATION OR PUBLICATION, OR TO CEASE THE CALCULATION OR PUBLICATION OF
THE BLOOMBERG BARCLAYS INDICES, AND BARCLAYS SHALL NOT BE LIABLE FOR ANY MISCALCULATION OF OR ANY
INCORRECT, DELAYED OR INTERRUPTED PUBLICATION WITH RESPECT TO ANY OF THE BLOOMBERG BARCLAYS INDICES.
BARCLAYS MAKES NO EXPRESS OR IMPLIED WARRANTIES, AND HEREBY EXPRESSLY DISCLAIMS ALL WARRANTIES
OF MERCHANTABILITY OR FITNESS FOR A PARTICULAR PURPOSE OR USE WITH RESPECT TO THE INDEX OR ANY DATA
INCLUDED THEREIN. BARCLAYS SHALL NOT BE LIABLE FOR ANY DAMAGES, INCLUDING, WITHOUT LIMITATION, ANY
INDIRECT OR CONSEQUENTIAL DAMAGES RESULTING FROM THE USE OF THE INDEX OR ANY DATA INCLUDED THEREIN.
© 2017 Barclays. Used with Permission.
Source: Barclays Global Family of Indices. Copyright 2017, Barclays. All rights reserved.
188
This page intentionally left blank.
This page intentionally left blank.
This page intentionally left blank.
The People Who Govern Your Fund
The trustees of your mutual fund are there to see that the fund is operated and managed in your best interests since, as a shareholder, you are a part owner of the fund. Your fund’s trustees also serve on the board of directors of The Vanguard Group, Inc., which is owned by the Vanguard funds and provides services to them on an at-cost basis.
A majority of Vanguard’s board members are independent, meaning that they have no affiliation with Vanguard or the funds they oversee, apart from the sizable personal investments they have made as private individuals. The independent board members have distinguished backgrounds in business, academia, and public service. Each of the trustees and executive officers oversees 197 Vanguard funds.
The following table provides information for each trustee and executive officer of the fund. The mailing address of the trustees and officers is P.O. Box 876, Valley Forge, PA 19482. More information about the trustees is in the Statement of Additional Information, which can be obtained, without charge, by contacting Vanguard at 800-662-7447, or online at vanguard.com.
Interested Trustee1
F. William McNabb III
Born 1957. Trustee Since July 2009. Chairman of the Board. Principal Occupation(s) During the Past Five Years and Other Experience: Chairman of the Board of The Vanguard Group, Inc., and of each of the investment companies served by The Vanguard Group, since January 2010; Director of The Vanguard Group since 2008; Chief Executive Officer and President of The Vanguard Group, and of each of the investment companies served by The Vanguard Group, since 2008; Director of Vanguard Marketing Corporation; Managing Director of The Vanguard Group (1995–2008).
Independent Trustees
Emerson U. Fullwood
Born 1948. Trustee Since January 2008. Principal Occupation(s) During the Past Five Years and Other Experience: Executive Chief Staff and Marketing Officer for North America and Corporate Vice President (retired 2008) of Xerox Corporation (document management products and services); Executive in Residence and 2009–2010 Distinguished Minett Professor at the Rochester Institute of Technology; Lead Director of SPX FLOW, Inc. (multi-industry manufacturing); Director of the United Way of Rochester, the University of Rochester Medical Center, Monroe Community College Foundation, North Carolina A&T University, and Roberts Wesleyan College; Trustee of the University of Rochester.
Rajiv L. Gupta
Born 1945. Trustee Since December 2001.2 Principal Occupation(s) During the Past Five Years and Other Experience: Chairman and Chief Executive Officer (retired 2009) and President (2006–2008) of Rohm and Haas Co. (chemicals); Director of Arconic Inc. (diversified manufacturer), HP Inc. (printer and personal computer manufacturing), and Delphi Automotive plc (automotive components); Senior Advisor at New Mountain Capital.
Amy Gutmann
Born 1949. Trustee Since June 2006. Principal Occupation(s) During the Past Five Years and Other Experience: President of the University of Pennsylvania; Christopher H. Browne Distinguished Professor of Political Science, School of Arts and Sciences, and Professor of Communication, Annenberg School for Communication, with secondary faculty appointments in the Department of Philosophy, School of Arts and Sciences, and at the Graduate School of Education, University of Pennsylvania; Trustee of the National Constitution Center.
JoAnn Heffernan Heisen
Born 1950. Trustee Since July 1998. Principal Occupation(s) During the Past Five Years and Other Experience: Corporate Vice President and Member of the Executive Committee (1997–2008), Chief Global Diversity Officer (retired 2008), Vice President and Chief Information Officer (1997–2006), Controller (1995–1997), Treasurer (1991–1995), and Assistant Treasurer (1989–1991) of Johnson & Johnson (pharmaceuticals/medical devices/consumer products); Director of Skytop Lodge Corporation (hotels) and the Robert Wood Johnson Foundation; Member of the Advisory Board of the Institute for Women’s Leadership at Rutgers University.
F. Joseph Loughrey
Born 1949. Trustee Since October 2009. Principal Occupation(s) During the Past Five Years and Other Experience: President and Chief Operating Officer (retired 2009) of Cummins Inc. (industrial machinery); Chairman of the Board of Hillenbrand, Inc. (specialized consumer services), Oxfam America, and the Lumina Foundation for Education; Director of SKF AB (industrial machinery), Hyster-Yale Materials Handling, Inc. (forklift trucks), and the V Foundation for Cancer
Research; Member of the Advisory Council for the College of Arts and Letters and Chair of the Advisory Board to the Kellogg Institute for International Studies, both at the University of Notre Dame.
Mark Loughridge
Born 1953. Trustee Since March 2012. Principal Occupation(s) During the Past Five Years and Other Experience: Senior Vice President and Chief Financial Officer (retired 2013) at IBM (information technology services); Fiduciary Member of IBM’s Retirement Plan Committee (2004–2013); Director of the Dow Chemical Company; Member of the Council on Chicago Booth.
Scott C. Malpass
Born 1962. Trustee Since March 2012. Principal Occupation(s) During the Past Five Years and Other Experience: Chief Investment Officer and Vice President at the University of Notre Dame; Assistant Professor of Finance at the Mendoza College of Business at Notre Dame; Member of the Notre Dame 403(b) Investment Committee, the Board of Advisors for Spruceview Capital Partners, and the Investment Advisory Committee of Major League Baseball; Board Member of TIFF Advisory Services, Inc., and Catholic Investment Services, Inc. (investment advisors); Member of the Board of Superintendence of the Institute for the Works of Religion.
André F. Perold
Born 1952. Trustee Since December 2004. Principal Occupation(s) During the Past Five Years and Other Experience: George Gund Professor of Finance and Banking, Emeritus at the Harvard Business School (retired 2011); Chief Investment Officer and Co-Managing Partner of HighVista Strategies LLC (private investment firm); Overseer of the Museum of Fine Arts Boston.
Peter F. Volanakis
Born 1955. Trustee Since July 2009. Principal Occupation(s) During the Past Five Years and Other Experience: President and Chief Operating Officer (retired 2010) of Corning Incorporated (communications equipment); Chairman of the Board of Trustees of Colby-Sawyer College; Member of the Board of Hypertherm, Inc. (industrial cutting systems, software, and consumables).
Executive Officers
Glenn Booraem
Born 1967. Investment Stewardship Officer Since February 2017. Principal Occupation(s) During the Past Five Years and Other Experience: Principal of The Vanguard Group, Inc.; Treasurer (2015–2017), Controller (2010–2015), and Assistant Controller (2001–2010) of each of the investment companies served by The Vanguard Group.
Thomas J. Higgins
Born 1957. Chief Financial Officer Since September 2008. Principal Occupation(s) During the Past Five Years and Other Experience: Principal of The Vanguard Group, Inc.; Chief Financial Officer of each of the investment companies served by The Vanguard Group; Treasurer of each of the investment companies served by The Vanguard Group (1998–2008).
Peter Mahoney
Born 1974. Controller Since May 2015. Principal Occupation(s) During the Past Five Years and Other Experience: Principal of The Vanguard Group, Inc.; Controller of each of the investment companies served by The Vanguard Group; Head of International Fund Services at The Vanguard Group (2008–2014).
Anne E. Robinson
Born 1970. Secretary Since September 2016. Principal Occupation(s) During the Past Five Years and Other Experience: Managing Director of The Vanguard Group, Inc.; General Counsel of The Vanguard Group; Secretary of The Vanguard Group and of each of the investment companies served by The Vanguard Group; Director and Senior Vice President of Vanguard Marketing Corporation; Managing Director and General Counsel of Global Cards and Consumer Services at Citigroup (2014–2016); Counsel at American Express (2003–2014).
Michael Rollings
Born 1963. Treasurer Since February 2017. Principal Occupation(s) During the Past Five Years and Other Experience: Managing Director of The Vanguard Group, Inc.; Treasurer of each of the investment companies served by The Vanguard Group; Executive Vice President and Chief Financial Officer of MassMutual Financial Group (2006–2016).
| |
| Vanguard Senior ManagementTeam |
| Mortimer J. Buckley | James M. Norris |
| John James | Thomas M. Rampulla |
| Martha G. King | Glenn W. Reed |
| John T. Marcante | Karin A. Risi |
| Chris D. McIsaac | |
| |
| Chairman Emeritus and Senior Advisor |
| John J. Brennan | |
| Chairman, 1996–2009 | |
| Chief Executive Officer and President, 1996–2008 |
| |
| Founder | |
| John C. Bogle | |
| Chairman and Chief Executive Officer, 1974–1996 |
1 Mr. McNabb is considered an “interested person,” as defined in the Investment Company Act of 1940, because he is an officer of the Vanguard funds.
2 December 2002 for Vanguard Equity Income Fund, the Vanguard Municipal Bond Funds, and the Vanguard State Tax-Exempt Funds.
| |  |
| | | P.O. Box 2600 |
| | | Valley Forge, PA 19482-2600 |
| |
| |
| |
| Connect with Vanguard® > vanguard.com |
| |
| |
| |
| Fund Information > 800-662-7447 | | CFA® is a registered trademark owned by CFA Institute. |
| Direct Investor Account Services > 800-662-2739 | |
| Institutional Investor Services > 800-523-1036 | |
| Text Telephone for People | | |
| Who Are Deaf or Hard of Hearing> 800-749-7273 | |
| |
| This material may be used in conjunction | |
| with the offering of shares of any Vanguard | |
| fund only if preceded or accompanied by | |
| the fund’s current prospectus. | |
| |
| All comparative mutual fund data are from Lipper, a | |
| Thomson Reuters Company, or Morningstar, Inc., unless | |
| otherwise noted. | | |
| |
| You can obtain a free copy of Vanguard’s proxy voting | |
| guidelines by visiting vanguard.com/proxyreporting or by | |
| calling Vanguard at 800-662-2739. The guidelines are | |
| also available from the SEC’s website, sec.gov. In | |
| addition, you may obtain a free report on how your fund | |
| voted the proxies for securities it owned during the 12 | |
| months ended June 30. To get the report, visit either | |
| vanguard.com/proxyreporting or sec.gov. | |
| |
| You can review and copy information about your fund at | |
| the SEC’s Public Reference Room in Washington, D.C. To | |
| find out more about this public service, call the SEC at | |
| 202-551-8090. Information about your fund is also | |
| available on the SEC’s website, and you can receive | |
| copies of this information, for a fee, by sending a | |
| request in either of two ways: via email addressed to | |
| publicinfo@sec.gov or via regular mail addressed to the | |
| Public Reference Section, Securities and Exchange | |
| Commission, Washington, DC 20549-1520. | |
| |
| | | © 2017 The Vanguard Group, Inc. |
| | | All rights reserved. |
| | | Vanguard Marketing Corporation, Distributor. |
| |
| | | Q752 072017 |
Item 2: Code of Ethics. The Registrant has adopted a code of ethics that applies to the Registrant’s principal executive officer, principal financial officer, principal accounting officer or controller or persons performing similar functions. The Code of Ethics was amended during the reporting period covered by this report to make certain technical, non-material changes.
Item 3: Audit Committee Financial Expert.
Not Applicable.
Item 4: Principal Accountant Fees and Services.
(a) Audit Fees.
Not Applicable.
Item 5: Audit Committee of Listed Registrants.
Not Applicable.
Item 6: Investments.
Not Applicable.
Item 7: Disclosure of Proxy Voting Policies and Procedures for Closed-End Management Investment Companies.
Not Applicable.
Item 8: Portfolio Managers of Closed-End Management Investment Companies.
Not Applicable.
Item 9: Purchase of Equity Securities by Closed-End Management Investment Company and Affiliated Purchasers.
Not Applicable.
Item 10: Submission of Matters to a Vote of Security Holders.
Not Applicable.
Item 11: Controls and Procedures.
(a) Disclosure Controls and Procedures. The Principal Executive and Financial Officers concluded that the Registrant’s Disclosure Controls and Procedures are effective
based on their evaluation of the Disclosure Controls and Procedures as of a date within 90 days of the filing date of this report.
(b) Internal Control Over Financial Reporting. There were no significant changes in Registrant’s Internal Control Over Financial Reporting or in other factors that could significantly affect this control subsequent to the date of the evaluation, including any corrective actions with regard to significant deficiencies and material weaknesses.
Item 12: Exhibits. (a) Certifications.
Pursuant to the requirements of the Securities Exchange Act of 1934 and the Investment Company Act of 1940, the registrant has duly caused this report to be signed on its behalf by the undersigned, thereunto duly authorized.
| |
| | VANGUARD CALIFORNIA TAX-FREE FUNDS |
| |
| |
| BY: | /s/ F. WILLIAM MCNABB III* |
| | F. WILLIAM MCNABB III |
| | CHIEF EXECUTIVE OFFICER |
| |
| Date: July 18, 2017 |
Pursuant to the requirements of the Securities Exchange Act of 1934 and the Investment Company Act of 1940, this report has been signed below by the following persons on behalf of the registrant and in the capacities and on the dates indicated.
| |
| | VANGUARD CALIFORNIA TAX-FREE FUNDS |
| |
| |
| BY: | /s/ F. WILLIAM MCNABB III* |
| | F. WILLIAM MCNABB III |
| | CHIEF EXECUTIVE OFFICER |
| |
| Date: July 18, 2017 |
| |
| | VANGUARD CALIFORNIA TAX-FREE FUNDS |
| |
| |
| BY: | /s/ THOMAS J. HIGGINS* |
| | THOMAS J. HIGGINS |
| | CHIEF FINANCIAL OFFICER |
Date: July 18, 2017
* By: /s/ Anne E. Robinson
Anne E. Robinson, pursuant to a Power of Attorney filed on October 4, 2016 see file Number
33-32548, Incorporated by Reference.