UNITED STATES
SECURITIES AND EXCHANGE COMMISSION
Washington, D.C. 20549
FORM N-CSR
CERTIFIED SHAREHOLDER REPORT
OF
REGISTERED MANAGEMENT INVESTMENT COMPANIES
Investment Company Act file number: 811-04474
Name of Registrant: | Vanguard California Tax-Free Funds |
Address of Registrant: | P.O. Box 2600 |
| Valley Forge, PA 19482 |
| |
Name and address of agent for service: | Anne E. Robinson, Esquire |
| P.O. Box 876 |
| Valley Forge, PA 19482 |
Registrant’s telephone number, including area code: (610) 669-1000
Date of fiscal year end: November 30
Date of reporting period: December 1, 2017—November 30, 2018
Item 1: Reports to Shareholders

Annual Report | November 30, 2018 Vanguard California Tax-Exempt Funds |
Vanguard California Municipal Money Market Fund Vanguard California Intermediate-Term Tax-Exempt Fund Vanguard California Long-Term Tax-Exempt Fund See the inside front cover for important information about access to your fund’s annual and semiannual shareholder reports. |
Important information about access to shareholder reports
Beginning on January 1, 2021, as permitted by regulations adopted by the Securities and Exchange Commission, paper copies of your fund’s annual and semiannual shareholder reports will no longer be sent to you by mail, unless you specifically request them. Instead, you will be notified by mail each time a report is posted on the website and will be provided with a link to access the report.
If you have already elected to receive shareholder reports electronically, you will not be affected by this change and do not need to take any action. You may elect to receive shareholder reports and other communications from the fund electronically by contacting your financial intermediary (such as a broker-dealer or bank) or, if you invest directly with the fund, by calling Vanguard at one of the phone numbers on the back cover of this report or by logging on to vanguard.com.
You may elect to receive paper copies of all future shareholder reports free of charge. If you invest through a financial intermediary, you can contact the intermediary to request that you continue to receive paper copies. If you invest directly with the fund, you can call Vanguard at one of the phone numbers on the back cover of this report or log on to vanguard.com. Your election to receive paper copies will apply to all the funds you hold through an intermediary or directly with Vanguard.
Contents
A Note From Our CEO | 1 |
Your Fund’s Performance at a Glance | 2 |
Advisor’s Report | 3 |
About Your Fund’s Expenses | 7 |
California Municipal Money Market Fund | 9 |
California Intermediate-Term Tax-Exempt Fund | 32 |
California Long-Term Tax-Exempt Fund | 177 |
Please note: The opinions expressed in this report are just that—informed opinions. They should not be considered promises or advice. Also, please keep in mind that the information and opinions cover the period through the date on the front of this report. Of course, the risks of investing in your fund are spelled out in the prospectus.
A Note From Our CEO

Tim Buckley
President and Chief Executive Officer
Dear Shareholder,
Over the years, I’ve found that prudent investors exhibit a common trait: discipline. No matter how the markets move or what new investing fad hits the headlines, those who stay focused on their goals and tune out the noise are set up for long-term success.
The prime gateway to investing is saving, and you don’t usually become a saver without a healthy dose of discipline. Savers make the decision to sock away part of their income, which means spending less and delaying gratification, no matter how difficult that may be.
Of course, disciplined investing extends beyond diligent saving. The financial markets, in the short term especially, are unpredictable; I have yet to meet the investor who can time them perfectly. It takes discipline to resist the urge to go all-in when markets are frothy or to retreat when things look bleak.
Staying put with your investments is one strategy for handling volatility. Another, rebalancing, requires even more discipline because it means steering your money away from strong performers and toward poorer performers.
Patience—a form of discipline—is also the friend of long-term investors. Higher returns are the potential reward for weathering the market’s turbulence and uncertainty.
It’s important to be prepared for that turbulence, whenever it appears. Don’t panic. Don’t chase returns or look for answers outside the asset classes you trust. And be sure to rebalance periodically, even when there’s turmoil.
Whether you’re a master of self-control, get a boost from technology, or work with a professional advisor, know that discipline is necessary to get the most out of your investment portfolio. And know that Vanguard is with you for the entire ride.
Thank you for your continued loyalty.
Sincerely,

Mortimer J. Buckley
President and Chief Executive Officer
December 18, 2018
1
Your Fund’s Performance at a Glance
· For the 12 months ended November 30, 2018, Vanguard California Intermediate-Term Tax-Exempt Fund returned 1.00% for Investor Shares and 1.08% for Admiral™ Shares, a bit below its benchmark index, which returned 1.34%.
· Vanguard California Long-Term Tax-Exempt Fund returned 0.71% for Investor Shares and 0.80% for Admiral Shares. Its benchmark index returned 1.10%.
· Vanguard California Municipal Money Market Fund returned 1.18%, ahead of the 0.77% average return of its peer group.
· While fundamentals remained solid, municipal bonds hit a rough patch early on amid tax-law changes that affected both supply and demand. With yields rising, prices of municipal bonds finished the period down across the maturity spectrum, but particularly toward the intermediate and long end.
· An underweight to state general obligation bonds helped relative performance for both the Long-Term and Intermediate-Term Funds. The Long-Term Fund was held back by our tilt toward bonds with maturities longer than 10 years.
Market Barometer
| Average Annual Total Returns |
| Periods Ended November 30, 2018 |
| One Year | Three Years | Five Years |
Stocks | | | |
Russell 1000 Index (Large-caps) | 5.92% | 11.94% | 10.89% |
Russell 2000 Index (Small-caps) | 0.57 | 10.08 | 7.50 |
Russell 3000 Index (Broad U.S. market) | 5.53 | 11.80 | 10.62 |
FTSE All-World ex US Index (International) | -7.98 | 5.59 | 2.17 |
| | | |
Bonds | | | |
Bloomberg Barclays U.S. Aggregate Bond Index | | | |
(Broad taxable market) | -1.34% | 1.33% | 2.03% |
Bloomberg Barclays Municipal Bond Index | | | |
(Broad tax-exempt market) | 1.13 | 2.13 | 3.52 |
FTSE Three-Month U.S. Treasury Bill Index | 1.76 | 0.92 | 0.55 |
| | | |
CPI | | | |
Consumer Price Index | 2.18% | 2.02% | 1.58% |
2
Advisor’s Report
For the 12 months ended November 30, 2018, Vanguard California Intermediate-Term Tax-Exempt Fund returned 1.00% for Investor Shares and 1.08% for Admiral Shares. California Long-Term Tax-Exempt Fund returned 0.71% for Investor Shares and 0.80% for Admiral Shares. Both funds finished a bit behind their benchmark indexes.
Vanguard California Municipal Money Market Fund returned 1.18%; the average return of peer funds was 0.77%.
With municipal bond prices losing ground during the 12 months, the Intermediate-Term Fund’s 30-day SEC yield rose from 1.79% to 2.50% for Investor Shares and from 1.89% to 2.57% for Admiral Shares. The yield for the Long-Term Fund rose from 2.21% to 2.94% for Investor Shares and from 2.31% to 3.00% for Admiral Shares. The Money Market Fund’s 7-day SEC yield rose from 0.77% to 1.49%.
The investment environment
Macroeconomic fundamentals remained beneficial throughout the period. The U.S. economy continued to expand at a robust pace, boosted by tax cuts and more government spending. The unemployment rate dropped to 3.7%, nearly a 50-year low, and inflation rose to hover near the Federal Reserve’s target of 2%.
Yields of Tax-Exempt Municipal Securities
(AAA-Rated General Obligation Issues)
| November 30, | November 30, |
Maturity | 2017 | 2018 |
2 years | 1.57% | 1.98% |
5 years | 1.76 | 2.16 |
10 years | 2.15 | 2.55 |
30 years | 2.79 | 3.27 |
Source: Vanguard.
3
Given the strength of the economy, the Fed continued to normalize monetary policy during the fiscal period through further cuts to its balance sheet and four additional increases to the federal funds target rate, putting it at 2%—2.25% as of November 30. (The Fed raised the rate another quarter-percentage point in December, just after the close of the period under review.)
Despite the economic backdrop, the markets experienced periods of volatility. They swooned in late January on concerns that wage gains might push inflation higher and lead the Fed to raise rates more aggressively. October was another rough patch. Trade tensions with China intensified and investors reacted to comments from Fed Chairman Jerome Powell about how much higher rates might go, although he tamped down expectations in late November.
The municipal bond market also had to contend with the federal tax package, which was passed in December 2017. The package had a significant effect on the supply of municipal bonds. One major change is that municipalities can no longer issue bonds to advance-refund outstanding tax-exempt debt. The tax bill also included a provision—which was dropped just before passage—to eliminate the tax exemption for private activity bonds issued for airports and not-for-profit hospitals and colleges. The uncertainty about this provision resulted in a surge of private activity bond issuance at year-end.
The reduction in the statutory federal corporate tax rate to 21% also affected demand for munis. It made their tax-equivalent yields a little less attractive to a fairly narrow segment of the market composed of nontraditional buyers such as banks and insurance companies. Municipalities responded by structuring issuance more for traditional buyers, which boosted usable supply for retail investors and mutual funds. In addition, a cap on deductions for state and local taxes and mortgage interest payments has made muni bonds more attractive for residents of states with high property or other local taxes.
Bouts of volatility aside, muni bond yields largely took their cues from the U.S. Treasury market, where yields across the maturity spectrum ended the period higher.
California’s economy grew faster than the U.S. economy as a whole, according to a gauge of current economic conditions published monthly by the Federal Reserve Bank of Philadelphia. The bank’s index for California increased about 3.6% between November 2017 and October 2018, while the national index rose about 2.6%. (Each state’s index incorporates data on nonfarm payroll employment, the jobless rate, average hours worked in manufacturing, and inflation-adjusted wage and salary payments.)
The overall credit trends for the state remain solid. Once again, the state legislature approved and Governor Jerry
4
Brown signed a budget on time, with $5.8 billion earmarked for the state’s rainy-day fund. Very few programs received spending increases in the current budget. California voters’ rejection in November of Proposition 6, which would have eliminated last year’s gas tax increase, also added to the state’s reputation for fiscal responsibility. These moves prompted Moody’s Investors Service to assign a positive outlook for the state.
The state’s cities, counties, and school districts continue to operate in an environment conducive to fiscal strength and stability. School districts continue to receive their state funding on time, and cities and counties haven’t had fiscal problems for several years. One exception, which we are monitoring, is the Los Angeles Unified School District. Moody’s assigned it a negative outlook in September because of long-term structural deficits and labor issues that could lead to a teachers strike early next year and exacerbate the deficits.
Muni issuance was down significantly over the past 12 months primarily because of the elimination of advance refundings. This has contributed to a tightening of spreads. State supply is down 33% compared with only a 19% reduction at the national level. Demand for California paper remains strong particularly among individual investors. The reduction in the state and local tax deduction in last year’s federal tax legislation has made bonds issued by the state more attractive.
Management of the funds
We strive to add value through a mix of strategies that include duration, yield-curve positioning, credit-quality decisions, and security selection. Vanguard’s experienced team of credit analysts performs objective, independent bond analyses. Our investment process relies on robust risk management to monitor the funds’ positioning.
An underweight to state general obligation bonds helped relative performance in both the Long-Term and Intermediate-Term Funds while an overweight to hospital revenue bonds hurt relative performance in both funds. The Long-Term Fund was held back by our tilt toward bonds with maturities longer than 10 years.
During the period, we increased exposure in the Intermediate-Term Fund to higher-quality bonds. In the Long-Term Fund, we made several tactical shifts. These included increased exposure to 4% and other lower-coupon bonds for AA-rated bonds, increased exposure to water and sewer and public education bonds, reduced exposure to redevelopment agency and public power bonds, and a tilt toward bonds with longer maturities.
The funds are permitted to invest in securities that can generate income distributions subject to the alternative
5
minimum tax (AMT). During the fiscal year, however, only the Money Market Fund owned such securities.
The outlook
In the absence of external shocks, the U.S. economy is on pace to break above its long-term potential growth rate in 2018 and 2019—given the front-loaded effects of tax cuts and increased government spending on top of solid fundamentals—before dropping back toward 2%. That growth, along with some upward pressure on wages that reflects the tight labor market, may push the U.S. core personal consumption expenditures price index higher through the first part of 2019. Against this backdrop, the Fed is likely to keep raising rates and trimming the amount of Treasuries and mortgage-backed securities on its balance sheet this year and into 2019.
We see this bounce as cyclical, however, and still expect long-term structural pressures from an aging population, global sourcing of goods and labor, and technological disruptions to result in moderate long-run growth and inflation.
We may continue to see bouts of volatility in the bond market related to shifting expectations for inflation and interest rates. Other potential volatility triggers we’ll be watching include an intensification of trade disputes, flare-ups in geopolitical tensions, uncertainty over Brexit, and government spending in Italy.
We are anticipating a convergence in global monetary policy, with central banks in developed countries adopting less accommodative stances—some raising rates, some planning to do so, some reducing quantitative easing. Withdrawing that accommodation unexpectedly or too quickly could rattle the markets.
As always, our experienced team of portfolio managers, credit analysts, and traders will continue to seek opportunities to add to the funds’ performance whatever the markets may bring.
Paul M. Malloy, CFA, Principal,
Head of Municipal Bond Group
John M. Carbone, Principal,
Portfolio Manager
James M. D’Arcy, CFA, Portfolio Manager
Adam Ferguson, CFA, Portfolio Manager
Vanguard Fixed Income Group
December 18, 2018
6
About Your Fund’s Expenses
As a shareholder of the fund, you incur ongoing costs, which include costs for portfolio management, administrative services, and shareholder reports (like this one), among others. Operating expenses, which are deducted from a fund’s gross income, directly reduce the investment return of the fund.
A fund’s expenses are expressed as a percentage of its average net assets. This figure is known as the expense ratio. The following examples are intended to help you understand the ongoing costs (in dollars) of investing in your fund and to compare these costs with those of other mutual funds. The examples are based on an investment of $1,000 made at the beginning of the period shown and held for the entire period.
The accompanying table illustrates your fund’s costs in two ways:
· Based on actual fund return. This section helps you to estimate the actual expenses that you paid over the period. The “Ending Account Value” shown is derived from the fund’s actual return, and the third column shows the dollar amount that would have been paid by an investor who started with $1,000 in the fund. You may use the information here, together with the amount you invested, to estimate the expenses that you paid over the period.
To do so, simply divide your account value by $1,000 (for example, an $8,600 account value divided by $1,000 = 8.6), then multiply the result by the number given for your fund under the heading “Expenses Paid During Period.”
· Based on hypothetical 5% yearly return. This section is intended to help you compare your fund’s costs with those of other mutual funds. It assumes that the fund had a yearly return of 5% before expenses, but that the expense ratio is unchanged. In this case—because the return used is not the fund’s actual return—the results do not apply to your investment. The example is useful in making comparisons because the Securities and Exchange Commission requires all mutual funds to calculate expenses based on a 5% return. You can assess your fund’s costs by comparing this hypothetical example with the hypothetical examples that appear in shareholder reports of other funds.
Note that the expenses shown in the table are meant to highlight and help you compare ongoing costs only and do not reflect transaction costs incurred by the fund for buying and selling securities. Further, the expenses do not include any purchase, redemption, or account service fees described in the fund prospectus. If such fees were applied to your account, your costs would be higher. Your fund does not carry a “sales load.”
The calculations assume no shares were bought or sold during the period. Your actual costs may have been higher or lower, depending on the amount of your investment and the timing of any purchases or redemptions.
You can find more information about the fund’s expenses, including annual expense ratios, in the Financial Statements section of this report. For additional information on operating expenses and other shareholder costs, please refer to your fund’s current prospectus.
7
Six Months Ended November 30, 2018
| | Beginning
Account Value
5/31/2018 | | Ending
Account Value
11/30/2018 | | Expenses
Paid During
Period |
Based on Actual Fund Return | | | | | | |
California Municipal Money Market Fund | | $1,000.00 | | $1,006.24 | | $0.80 |
California Intermediate-Term Tax-Exempt Fund | | | | | | |
Investor Shares | | $1,000.00 | | $1,002.88 | | $0.75 |
Admiral Shares | | 1,000.00 | | 1,003.20 | | 0.45 |
California Long-Term Tax-Exempt Fund | | | | | | |
Investor Shares | | $1,000.00 | | $999.04 | | $0.80 |
Admiral Shares | | 1,000.00 | | 999.37 | | 0.45 |
Based on Hypothetical 5% Yearly Return | | | | | | |
California Municipal Money Market Fund | | $1,000.00 | | $1,024.27 | | $0.81 |
California Intermediate-Term Tax-Exempt Fund | | | | | | |
Investor Shares | | $1,000.00 | | $1,024.32 | | $0.76 |
Admiral Shares | | 1,000.00 | | 1,024.62 | | 0.46 |
California Long-Term Tax-Exempt Fund | | | | | | |
Investor Shares | | $1,000.00 | | $1,024.27 | | $0.81 |
Admiral Shares | | 1,000.00 | | 1,024.62 | | 0.46 |
The calculations are based on expenses incurred in the most recent six-month period. The funds’ annualized six-month expense ratios for that period are: for the California Municipal Money Market Fund, 0.16%; for the California Intermediate-Term Tax-Exempt Fund, 0.15% for Investor Shares and 0.09% for Admiral Shares; and for the California Long-Term Tax-Exempt Fund, 0.16% for Investor Shares and 0.09% for Admiral Shares. The dollar amounts shown as “Expenses Paid” are equal to the annualized expense ratio multiplied by the average account value over the period, multiplied by the number of days in the most recent six-month period, then divided by the number of days in the most recent 12-month period (183/365).
8
California Municipal Money Market Fund
Performance Summary
Investment returns will fluctuate. All of the returns in this report represent past performance, which is not a guarantee of future results that may be achieved by the fund. (Current performance may be lower or higher than the performance data cited. For performance data current to the most recent month-end, visit our website at vanguard.com/performance.) The returns shown do not reflect taxes that a shareholder would pay on fund distributions. The fund is only available to retail investors (natural persons). You could lose money by investing in the fund. Although the fund seeks to preserve the value of your investment at $1 per share, it cannot guarantee it will do so. The fund may impose a fee upon sale of your shares or may temporarily suspend your ability to sell shares if the fund’s liquidity falls below required minimums because of market conditions or other factors. An investment in the fund is not insured or guaranteed by the Federal Deposit Insurance Corporation or any other government agency. The fund’s sponsor has no legal obligation to provide financial support to the fund, and you should not expect that the sponsor will provide financial support to the fund at any time. The fund’s 7-day SEC yield reflects its current earnings more closely than do the average annual returns.
Cumulative Performance: November 30, 2008, Through November 30, 2018
Initial Investment of $10,000
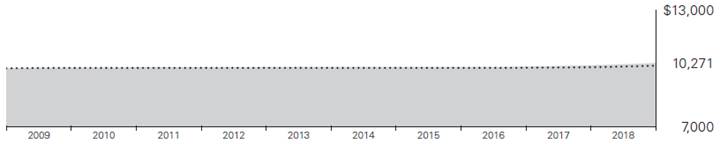
| | Average Annual Total Returns
Periods Ended November 30, 2018 | | Final Value
of a $10,000 Investment | |
| | One
Year | Five
Years |
Ten
Years
| |

| California Municipal Money Market Fund | | 1.18% | 0.42% | 0.27% | | $10,271 | |

| California Tax-Exempt Money Market Funds Average | | 0.77 | 0.22 | 0.13 | | 10,132 | |
California Tax-Exempt Money Market Funds Average: Derived from data provided by Lipper, a Thomson Reuters Company.
Average Annual Total Returns: Periods Ended September 30, 2018
This table presents returns through the latest calendar quarter—rather than through the end of the fiscal period. Securities and Exchange Commission rules require that we provide this information.
| Inception Date | One Year | Five Years | Ten Years |
California Municipal Money Market Fund | 6/1/1987 | 1.07% | 0.37% | 0.28% |
See Financial Highlights for dividend information.
9
California Municipal Money Market Fund
Distribution by Issuer
As of November 30, 2018
Tax-Exempt Securities | 100% |
10
California Municipal Money Market Fund
Financial Statements
Statement of Net Assets
As of November 30, 2018
The fund reports a complete list of its holdings in various monthly and quarterly regulatory filings. The fund publishes its holdings on a monthly basis at vanguard.com and files them with the Securities and Exchange Commission on Form N-MFP. The fund’s Form N-MFP filings may be viewed at sec.gov or via a link on the “Portfolio Holdings” page on vanguard.com. For the second and fourth fiscal quarters, the lists appear in the fund’s semiannual and annual reports to shareholders. For the first and third fiscal quarters, the fund files the lists with the SEC on Form N-Q. Shareholders can look up the fund’s Forms N-Q on the SEC’s website at sec.gov.
| | | | | | | | Face | | Market | |
| | | | | Maturity | | | Amount | | Value· | |
| | | Coupon | | Date | | | ($000 | ) | ($000 | ) |
Tax-Exempt Municipal Bonds (97.5%) | | | | | | | | | | |
California (97.5%) | | | | | | | | | | |
| ABAG Finance Authority for Nonprofit Corps. California Revenue (Computer History Museum) VRDO | | 1.700% | | 12/7/18 | LOC | | 7,000 | | 7,000 | |
| ABAG Finance Authority for Nonprofit Corps. California Revenue (Lakeside Village Apartments) VRDO | | 1.380% | | 12/7/18 | LOC | | 29,560 | | 29,560 | |
| ABAG Finance Authority for Nonprofit Corps. California Revenue (Public Policy Institute) VRDO | | 1.420% | | 12/7/18 | LOC | | 12,705 | | 12,705 | |
1 | Agency Enhanced Affordable Housing Trust CA TOB VRDO | | 1.760% | | 12/7/18 | | | 50,000 | | 50,000 | |
1 | Alameda CA Unified School District TOB VRDO | | 1.740% | | 12/7/18 | | | 4,000 | | 4,000 | |
| Alameda County CA CP | | 1.710% | | 12/5/18 | LOC | | 7,500 | | 7,500 | |
| Anaheim CA Housing Finance Agency Home Mortgage Revenue VRDO | | 1.690% | | 12/7/18 | LOC | | 5,485 | | 5,485 | |
1 | Bay Area Toll Authority California Toll Bridge Revenue (San Francisco Bay Area) TOB VRDO | | 1.670% | | 12/7/18 | | | 13,330 | | 13,330 | |
1 | Bay Area Toll Authority California Toll Bridge Revenue (San Francisco Bay Area) TOB VRDO | | 1.680% | | 12/7/18 | | | 6,710 | | 6,710 | |
1 | Bay Area Toll Authority California Toll Bridge Revenue (San Francisco Bay Area) TOB VRDO | | 1.680% | | 12/7/18 | | | 6,060 | | 6,060 | |
1 | Bay Area Toll Authority California Toll Bridge Revenue (San Francisco Bay Area) TOB VRDO | | 1.680% | | 12/7/18 | | | 8,435 | | 8,435 | |
1 | Burbank CA Unified School District GO TOB VRDO | | 1.660% | | 12/7/18 | | | 5,520 | | 5,520 | |
1 | California Coast Community College District GO TOB VRDO | | 1.690% | | 12/7/18 | | | 4,750 | | 4,750 | |
| California Department of Water Resources Water System Revenue (Central Valley Project) | | 5.000% | | 12/1/18 | | | 1,890 | | 1,890 | |
| California Department of Water Resources Water System Revenue (Central Valley Project) | | 5.000% | | 12/1/18 | | | 2,040 | | 2,040 | |
1 | California Department of Water Resources Water System Revenue (Central Valley Project) TOB VRDO | | 1.640% | | 12/1/18 | (Prere.) | | 3,985 | | 3,985 | |
11
California Municipal Money Market Fund
| | | | | | | | Face | | Market | |
| | | | | Maturity | | | Amount | | Value· | |
| | | Coupon | | Date | | | ($000 | ) | ($000 | ) |
| California Department of Water Resources Water System Revenue CP | | 1.710% | | 12/4/18 | | | 5,000 | | 5,000 | |
| California Department of Water Resources Water System Revenue CP | | 1.700% | | 12/5/18 | | | 14,800 | | 14,800 | |
| California Department of Water Resources Water System Revenue CP | | 1.700% | | 12/6/18 | | | 7,000 | | 7,000 | |
| California Department of Water Resources Water System Revenue CP | | 1.700% | | 12/11/18 | | | 15,086 | | 15,086 | |
| California Department of Water Resources Water System Revenue CP | | 1.720% | | 12/12/18 | | | 18,400 | | 18,400 | |
| California Department of Water Resources Water System Revenue CP | | 1.700% | | 12/18/18 | | | 17,755 | | 17,755 | |
| California Department of Water Resources Water System Revenue CP | | 1.700% | | 12/19/18 | | | 42,029 | | 42,029 | |
| California Department of Water Resources Water System Revenue CP | | 1.740% | | 1/2/19 | | | 2,581 | | 2,581 | |
| California Department of Water Resources Water System Revenue CP | | 1.750% | | 1/2/19 | | | 38,632 | | 38,632 | |
| California Department of Water Resources Water System Revenue CP | | 1.700% | | 1/4 /19 | | | 27,025 | | 27,025 | |
| California Department of Water Resources Water System Revenue CP | | 1.720% | | 1/10/19 | | | 25,119 | | 25,119 | |
| California Department of Water Resources Water System Revenue CP | | 1.730% | | 1/15/19 | | | 22,354 | | 22,354 | |
| California Economic Recovery GO | | 5.250% | | 7/1/19 | (Prere.) | | 15,805 | | 16,135 | |
| California Educational Facilities Authority Revenue (Stanford Hospital) CP | | 1.650% | | 1/4/19 | | | 42,050 | | 42,050 | |
| California Educational Facilities Authority Revenue (Stanford Hospital) CP | | 1.750% | | 2/6/19 | | | 14,300 | | 14,300 | |
| California Educational Facilities Authority Revenue (Stanford University) CP | | 1.530% | | 12/4/18 | | | 42,600 | | 42,600 | |
| California Educational Facilities Authority Revenue (Stanford University) CP | | 1.780% | | 1/4/19 | | | 50,000 | | 50,000 | |
| California Educational Facilities Authority Revenue (Stanford University) CP | | 1.750% | | 4/2/19 | | | 3,625 | | 3,625 | |
| California Educational Facilities Authority Revenue (Stanford University) CP | | 1.750% | | 4/4/19 | | | 6,250 | | 6,250 | |
| California Educational Facilities Authority Revenue (Stanford University) CP | | 1.810% | | 5/2/19 | | | 37,950 | | 37,950 | |
| California Educational Facilities Authority Revenue (Stanford University) CP | | 1.810% | | 5/2/19 | | | 1,200 | | 1,200 | |
1 | California Educational Facilities Authority Revenue (Stanford University) TOB VRDO | | 1.640% | | 12/7/18 | | | 8,000 | | 8,000 | |
1 | California Educational Facilities Authority Revenue (Stanford University) TOB VRDO | | 1.720% | | 12/7/18 | | | 3,000 | | 3,000 | |
1 | California Educational Facilities Authority Revenue (Stanford University) TOB VRDO | | 1.720% | | 12/7/18 | | | 3,590 | | 3,590 | |
2 | California GO | | 2.690% | | 5/1/19 | | | 4,000 | | 4,000 | |
| California GO CP | | 1.760% | | 1/23/19 | | | 39,030 | | 39,030 | |
| California GO CP A6 | | 1.780% | | 2/4/19 | | | 50,000 | | 50,000 | |
1 | California GO TOB VRDO | | 1.650% | | 12/7/18 | | | 5,300 | | 5,300 | |
1 | California GO TOB VRDO | | 1.650% | | 12/7/18 | | | 3,000 | | 3,000 | |
1 | California GO TOB VRDO | | 1.650% | | 12/7/18 | | | 8,365 | | 8,365 | |
1 | California GO TOB VRDO | | 1.690% | | 12/7/18 | | | 2,220 | | 2,220 | |
12
California Municipal Money Market Fund
| | | | | | | | Face | | Market | |
| | | | | Maturity | | | Amount | | Value· | |
| | | Coupon | | Date | | | ($000 | ) | ($000 | ) |
1 | California GO TOB VRDO | | 1.690% | | 12/7/18 | LOC | | 4,000 | | 4,000 | |
1 | California GO TOB VRDO | | 1.690% | | 12/7/18 | LOC | | 5,000 | | 5,000 | |
1 | California GO TOB VRDO | | 1.690% | | 12/7/18 | | | 3,375 | | 3,375 | |
1 | California GO TOB VRDO | | 1.700% | | 12/7/18 | | | 4,500 | | 4,500 | |
1 | California GO TOB VRDO | | 1.700% | | 12/7/18 | | | 3,335 | | 3,335 | |
| California GO VRDO | | 1.380% | | 12/3/18 | LOC | | 7,200 | | 7,200 | |
| California GO VRDO | | 1.400% | | 12/3/18 | LOC | | 1,200 | | 1,200 | |
| California GO VRDO | | 1.440% | | 12/3/18 | LOC | | 7,000 | | 7,000 | |
1 | California GO VRDO | | 1.690% | | 12/7/18 | LOC | | 2,825 | | 2,825 | |
1 | California GO VRDO | | 1.690% | | 12/7/18 | (4)LOC | | 5,005 | | 5,005 | |
1 | California Health Facilities Financing Authority (Providence St. Joseph Health Obligated Group) TOB VRDO | | 1.690% | | 12/7/18 | | | 2,295 | | 2,295 | |
| California Health Facilities Financing Authority Revenue (Catholic Healthcare West) VRDO | | 1.250% | | 12/7/18 | LOC | | 18,300 | | 18,300 | |
| California Health Facilities Financing Authority Revenue (Catholic Healthcare West) VRDO | | 1.430% | | 12/7/18 | LOC | | 35,000 | | 35,000 | |
| California Health Facilities Financing Authority Revenue (Catholic Healthcare West) VRDO | | 1.470% | | 12/7/18 | LOC | | 50,530 | | 50,530 | |
| California Health Facilities Financing Authority Revenue (Children’s Hospital of Orange County) VRDO | | 1.350% | | 12/7/18 | LOC | | 24,350 | | 24,350 | |
| California Health Facilities Financing Authority Revenue (Children’s Hospital of Orange County) VRDO | | 1.350% | | 12/7/18 | LOC | | 36,850 | | 36,850 | |
1,2 | California Health Facilities Financing Authority Revenue (Kaiser Credit Group) PUT | | 1.840% | | 5/1/19 | LOC | | 2,500 | | 2,500 | |
1 | California Health Facilities Financing Authority Revenue (Kaiser Credit Group) TOB VRDO | | 1.690% | | 12/7/18 | | | 18,040 | | 18,040 | |
| California Health Facilities Financing Authority Revenue (Kaiser Permanente) CP | | 1.450% | | 12/6/18 | | | 13,320 | | 13,319 | |
| California Health Facilities Financing Authority Revenue (Kaiser Permanente) CP | | 1.450% | | 12/6/18 | | | 18,800 | | 18,799 | |
| California Health Facilities Financing Authority Revenue (Kaiser Permanente) CP | | 1.400% | | 12/13/18 | | | 28,165 | | 28,165 | |
| California Health Facilities Financing Authority Revenue (Kaiser Permanente) CP | | 1.450% | | 1/8/19 | | | 9,600 | | 9,595 | |
| California Health Facilities Financing Authority Revenue (Kaiser Permanente) CP | | 1.700% | | 2/5/19 | | | 3,400 | | 3,400 | |
| California Health Facilities Financing Authority Revenue (Memorial Health Services) VRDO | | 1.400% | | 12/7/18 | | | 25,200 | | 25,200 | |
| California Health Facilities Financing Authority Revenue (Scripps Health) VRDO | | 1.340% | | 12/7/18 | | | 10,190 | | 10,190 | |
| California Health Facilities Financing Authority Revenue (Stanford Hospital) | | 5.000% | | 8/15/19 | | | 2,000 | | 2,046 | |
1 | California Health Facilities Financing Authority Revenue (Sutter Health) TOB VRDO | | 1.650% | | 12/7/18 | | | 2,592 | | 2,592 | |
1 | California Health Facilities Financing Authority Revenue (Sutter Health) TOB VRDO | | 1.690% | | 12/7/18 | | | 11,890 | | 11,890 | |
1 | California Health Facilities Financing Authority Revenue (Sutter Health) TOB VRDO | | 1.690% | | 12/7/18 | | | 3,100 | | 3,100 | |
1 | California Health Facilities Financing Authority Revenue (Sutter Health) TOB VRDO | | 1.700% | | 12/7/18 | | | 3,750 | | 3,750 | |
13
California Municipal Money Market Fund
| | | | | | | | Face | | Market | |
| | | | | Maturity | | | Amount | | Value· | |
| | | Coupon | | Date | | | ($000 | ) | ($000 | ) |
1 | California Health Facilities Financing Authority Revenue (Sutter Health) TOB VRDO | | 1.700% | | 12/7/18 | | | 14,305 | | 14,305 | |
1 | California Health Facilities Financing Authority Revenue (Sutter Health) TOB VRDO | | 1.710% | | 12/7/18 | | | 250 | | 250 | |
1 | California Health Facilities Financing Authority Revenue (Sutter Health) TOB VRDO | | 1.710% | | 12/7/18 | | | 9,715 | | 9,715 | |
| California Infrastructure & Economic Development Bank Revenue (Pacific Gas & Electric Co.) VRDO | | 2.060% | | 12/3/18 | LOC | | 14,360 | | 14,360 | |
1 | California Infrastructure & Economic Development Bank Revenue (University of California) TOB VRDO | | 1.670% | | 12/7/18 | | | 7,500 | | 7,500 | |
1 | California Infrastructure & Economic Development Bank Revenue TOB VRDO | | 1.710% | | 12/7/18 | | | 6,970 | | 6,970 | |
| California Municipal Finance Authority Recovery Zone Revenue (Chevron USA Inc. Project) VRDO | | 1.380% | | 12/3/18 | | | 76,615 | | 76,615 | |
1 | California Municipal Finance Authority Revenue (Pomona College) TOB VRDO | | 1.700% | | 12/7/18 | | | 3,750 | | 3,750 | |
| California Pollution Control Financing Authority Revenue (ExxonMobil Project) VRDO | | 1.520% | | 12/3/18 | | | 1,645 | | 1,645 | |
| California Pollution Control Financing Authority Revenue (Pacific Gas & Electric Co.) VRDO | | 2.050% | | 12/3/18 | LOC | | 139,650 | | 139,650 | |
| California Pollution Control Financing Authority Revenue (Pacific Gas & Electric Co.) VRDO | | 2.050% | | 12/3/18 | LOC | | 43,220 | | 43,220 | |
| California Pollution Control Financing Authority Revenue (Recology Inc.) VRDO | | 1.730% | | 12/7/18 | LOC | | 19,750 | | 19,750 | |
1 | California Public Finance Authority Revenue (Sharp Healthcare Obligated Group) TOB VRDO | | 1.650% | | 12/7/18 | | | 3,750 | | 3,750 | |
1 | California Public Finance Authority Revenue (Sharp Healthcare Obligated Group) TOB VRDO | | 1.670% | | 12/7/18 | | | 4,000 | | 4,000 | |
| California Public Finance Authority Revenue (Sharp Healthcare Obligated Group) VRDO | | 1.400% | | 12/3/18 | LOC | | 4,900 | | 4,900 | |
| California Public Finance Authority Revenue (Sharp Healthcare Obligated Group) VRDO | | 1.400% | | 12 /3/18 | LOC | | 7,400 | | 7,400 | |
| California Public Works Board Lease Revenue (Various Capital Projects) | | 5.000% | | 10/1/19 | | | 5,000 | | 5,132 | |
| California State University Institute CP | | 1.750% | | 1/8/19 | LOC | | 1,980 | | 1,980 | |
| California State University Institute CP | | 1.750% | | 2/5/19 | | | 2,967 | | 2,967 | |
1 | California State University Revenue TOB VRDO | | 1.690% | | 12/7/18 | | | 2,240 | | 2,240 | |
1 | California State University Systemwide Revenue TOB VRDO | | 1.690% | | 12/7/18 | | | 7,160 | | 7,160 | |
| California Statewide Communities Development Authority Multifamily Housing Revenue (Canyon Springs Apartments Project) VRDO | | 1.720% | | 12/7/18 | LOC | | 10,695 | | 10,695 | |
| California Statewide Communities Development Authority Multifamily Housing Revenue (Crossing Senior Apartments) VRDO | | 1.710% | | 12/7/18 | LOC | | 8,000 | | 8,000 | |
| California Statewide Communities Development Authority Multifamily Housing Revenue (Ridgeway Apartments) VRDO | | 1.400% | | 12/7/18 | LOC | | 26,525 | | 26,525 | |
| California Statewide Communities Development Authority Multifamily Housing Revenue (Steadfast River Run LP) VRDO | | 1.710% | | 12/7/18 | LOC | | 13,405 | | 13,405 | |
14
California Municipal Money Market Fund
| | | | | | | | Face | | Market | |
| | | | | Maturity | | | Amount | | Value· | |
| | | Coupon | | Date | | | ($000 | ) | ($000 | ) |
| California Statewide Communities Development Authority Multifamily Housing Revenue (Wilshire Court Project) VRDO | | 1.710% | | 12/7/18 | LOC | | 11,900 | | 11,900 | |
| California Statewide Communities Development Authority Multifamily Revenue VRDO | | 1.730% | | 12/3/18 | LOC | | 7,400 | | 7,400 | |
| California Statewide Communities Development Authority Revenue (Heritage Park Apartments) VRDO | | 1.710% | | 12/7/18 | LOC | | 30,000 | | 30,000 | |
| California Statewide Communities Development Authority Revenue (Kaiser Foundation Hospitals) PUT | | 1.790% | | 2/6/19 | | | 8,000 | | 8,000 | |
| California Statewide Communities Development Authority Revenue (Kaiser Foundation Hospitals) PUT | | 1.800% | | 2/14/19 | | | 7,000 | | 7,000 | |
| California Statewide Communities Development Authority Revenue (Kaiser Foundation Hospitals) PUT | | 1.840% | | 3/13/19 | | | 8,000 | | 8,000 | |
| California Statewide Communities Development Authority Revenue (Kaiser Permanente) CP | | 1.550% | | 12/11/18 | | | 22,000 | | 22,000 | |
| California Statewide Communities Development Authority Revenue (Kaiser Permanente) CP | | 1.400% | | 12/13/18 | | | 5,200 | | 5,200 | |
| California Statewide Communities Development Authority Revenue (Kaiser Permanente) CP | | 1.450% | | 1/8/19 | | | 29,500 | | 29,500 | |
| California Statewide Communities Development Authority Revenue (Kaiser Permanente) CP | | 1.700% | | 2/5/19 | | | 11,000 | | 11,000 | |
| California Statewide Communities Development Authority Revenue (Kaiser Permanente) CP | | 1.700% | | 2/5/19 | | | 21,090 | | 21,090 | |
| California Statewide Communities Development Authority Revenue (Kaiser Permanente) CP | | 1.650% | | 2/7/19 | | | 20,000 | | 20,000 | |
| California Statewide Communities Development Authority Revenue (Kaiser Permanente) CP | | 1.780% | | 2/14/19 | | | 25,000 | | 25,000 | |
| California Statewide Communities Development Authority Revenue (Kaiser Permanente) CP | | 1.790% | | 2/14/19 | | | 20,000 | | 20,000 | |
| California Statewide Communities Development Authority Revenue (Kaiser Permanente) CP | | 1.790% | | 2/14/19 | | | 30,000 | | 30,000 | |
| California Statewide Communities Development Authority Revenue (Kaiser Permanente) CP | | 1.800% | | 2/19/19 | | | 17,000 | | 17,000 | |
| California Statewide Communities Development Authority Revenue (Kaiser Permanente) CP | | 1.800% | | 2/19/19 | | | 30,000 | | 30,000 | |
| California Statewide Communities Development Authority Revenue (Kaiser Permanente) CP | | 1.770% | | 3/6/19 | | | 7,600 | | 7,600 | |
| California Statewide Communities Development Authority Revenue (Kaiser Permanente) CP | | 1.840% | | 3/6/19 | | | 33,750 | | 33,750 | |
| California Statewide Communities Development Authority Revenue (Kaiser Permanente) CP | | 1.830% | | 3/14/19 | | | 25,000 | | 25,000 | |
| California Statewide Communities Development Authority Revenue (Kaiser Permanente) CP | | 1.840% | | 3/25/19 | | | 40,000 | | 40,000 | |
| California Statewide Communities Development Authority Revenue (Kaiser Permanente) CP | | 1.920% | | 4/2/19 | | | 16,250 | | 16,250 | |
| California Statewide Communities Development Authority Revenue (Kaiser Permanente) CP | | 1.810% | | 4/4/19 | | | 4,790 | | 4,790 | |
| California Statewide Communities Development Authority Revenue (Kaiser Permanente) VRDO | | 1.540% | | 12/7/18 | | | 10,980 | | 10,980 | |
15
California Municipal Money Market Fund
| | | | | | | | Face | | Market | |
| | | | | Maturity | | | Amount | | Value· | |
| | | Coupon | | Date | | | ($000 | ) | ($000 | ) |
| California Statewide Communities Development Authority Revenue (Kaiser Permanente) VRDO | | 1.580% | | 12/7/18 | | | 2,400 | | 2,400 | |
| California Statewide Communities Development Authority Revenue (Kaiser Permanente) VRDO | | 1.620% | | 12/7/18 | | | 6,310 | | 6,310 | |
| California Statewide Communities Development Authority Revenue (Kaiser Permanente) VRDO | | 1.620% | | 12/7/18 | | | 5,000 | | 5,000 | |
| California Statewide Communities Development Authority Revenue (Kaiser Permanente) VRDO | | 1.620% | | 12/7/18 | | | 15,055 | | 15,055 | |
1 | California Statewide Communities Development Authority Revenue (Sutter Health) TOB VRDO | | 1.690% | | 12/7/18 | | | 3,330 | | 3,330 | |
1 | California Statewide Communities Development Authority Revenue (Trinity Health) TOB VRDO | | 1.650% | | 12/7/18 | | | 2,175 | | 2,175 | |
1 | Campbell Union High School District CA GO TOB VRDO | | 1.690% | | 12/7/18 | | | 9,000 | | 9,000 | |
| Chula Vista CA Multifamily Housing Revenue (Teresina Apartments) VRDO | | 1.630% | | 12/7/18 | LOC | | 14,940 | | 14,940 | |
1 | Coast Community College District CA GO TOB VRDO | | 1.690% | | 12/7/18 | LOC | | 5,000 | | 5,000 | |
| Contra Costa CA Municipal Water District Revenue (Extendible) CP | | 1.790% | | 8/23/19 | | | 17,000 | | 17,000 | |
| Contra Costa County CA Multifamily Housing Revenue (Park Regency) VRDO | | 1.630% | | 12/7/18 | LOC | | 60,000 | | 60,000 | |
1 | Corona-Norco Unified School District CA GO TOB VRDO | | 1.690% | | 12/7/18 | LOC | | 4,315 | | 4,315 | |
1 | Cupertino CA Union School District GO TOB VRDO | | 1.680% | | 12/7/18 | | | 8,870 | | 8,870 | |
1 | Desert CA Community College District GO TOB VRDO | | 1.660% | | 12/7/18 | | | 6,000 | | 6,000 | |
1,2 | Dublin CA Unified School District GO TOB PUT | | 1.660% | | 12/6/18 | | | 12,000 | | 12,000 | |
| East Bay CA Municipal Utility District Water System Revenue CP | | 1.720% | | 12/3/18 | | | 20,700 | | 20,700 | |
| East Bay CA Municipal Utility District Water System Revenue CP | | 1.700% | | 12/4/18 | | | 20,000 | | 20,000 | |
| East Bay CA Municipal Utility District Water System Revenue CP | | 1.730% | | 1/3/19 | | | 10,000 | | 10,000 | |
| East Bay CA Municipal Utility District Water System Revenue CP | | 1.720% | | 1/4/19 | | | 21,700 | | 21,700 | |
| East Bay CA Municipal Utility District Water System Revenue CP | | 1.760% | | 2/4/19 | | | 12,000 | | 12,000 | |
1 | East Bay CA Municipal Utility District Water System Revenue TOB VRDO | | 1.640% | | 12/7/18 | | | 6,775 | | 6,775 | |
1 | East Bay CA Municipal Utility District Water System Revenue TOB VRDO | | 1.690% | | 12/7/18 | (Prere.) | | 10,445 | | 10,445 | |
1 | East Bay CA Municipal Utility District Water System Revenue TOB VRDO | | 1.700% | | 12/7/18 | | | 2,500 | | 2,500 | |
1 | Eastern Municipal Water District CA Financing Authority CA TOB VRDO | | 1.710% | | 12/7/18 | | | 9,000 | | 9,000 | |
1 | Elk Grove CA Unified School District GO TOB VRDO | | 1.660% | | 12/3/18 | | | 3,200 | | 3,200 | |
1 | Elk Grove CA Unified School District GO TOB VRDO | | 1.700% | | 12/7/18 | | | 2,120 | | 2,120 | |
| Escondido CA Community Development Multifamily Revenue (Heritage Park Apartments) VRDO | | 1.690% | | 12/7/18 | LOC | | 4,250 | | 4,250 | |
16
California Municipal Money Market Fund
| | | | | | | | Face | | Market | |
| | | | | Maturity | | | Amount | | Value· | |
| | | Coupon | | Date | | | ($000 | ) | ($000 | ) |
1 | Folsom Cordova CA Unified School District School Facilities Improvement Dist. No. 5 TOB VRDO | | 1.650% | | 12/7/18 | | | 3,750 | | 3,750 | |
1 | Fremont CA Union High School District TOB VRDO | | 1.690% | | 12/7/18 | | | 3,425 | | 3,425 | |
1 | Hartnell CA Community College GO TOB VRDO | | 1.710% | | 12/7/18 | | | 1,245 | | 1,245 | |
1 | Hayward CA Area Recreation & Park District GO TOB VRDO | | 1.710% | | 12/7/18 | | | 5,000 | | 5,000 | |
1 | Huntington Beach CA City School District GO TOB VRDO | | 1.660% | | 12/3/18 | | | 3,000 | | 3,000 | |
1 | Imperial CA Irrigation District Electric Revenue TOB VRDO | | 1.700% | | 12/7/18 | | | 3,590 | | 3,590 | |
2 | Irvine CA Ranch Water District Revenue PUT | | 1.680% | | 3/8/19 | | | 17,540 | | 17,540 | |
2 | Irvine CA Ranch Water District Revenue PUT | | 1.680% | | 3/8/19 | | | 14,360 | | 14,360 | |
| Irvine CA Unified School District Community Facilities District No. 09-1 Special Tax Revenue VRDO | | 1.400% | | 12/3/18 | LOC | | 7,040 | | 7,040 | |
1 | Irvine Ranch CA Water District COP TOB VRDO | | 1.690% | | 12/7/18 | | | 3,220 | | 3,220 | |
1 | Irvine Ranch CA Water District Revenue TOB VRDO | | 1.670% | | 12/7/18 | | | 4,160 | | 4,160 | |
| Kings County CA Housing Authority (Edgewater Isle Apartments) Revenue VRDO | | 1.550% | | 12/7/18 | LOC | | 11,380 | | 11,380 | |
| Livermore CA Redevelopment Agency Multi-Family Housing Revenue (Richards Manor) VRDO | | 1.690% | | 12/7/18 | LOC | | 4,770 | | 4,770 | |
1 | Long Beach CA Harbor Revenue TOB VRDO | | 1.650% | | 12/7/18 | | | 4,000 | | 4,000 | |
1 | Long Beach CA Unified School District GO TOB VRDO | | 1.710% | | 12/7/18 | | | 21,060 | | 21,060 | |
1 | Long Beach CA Unified School District GO TOB VRDO | | 1.710% | | 12/7/18 | | | 2,500 | | 2,500 | |
1 | Los Angeles CA Community College District GO TOB VRDO | | 1.690% | | 12/7/18 | (Prere.) | | 15,940 | | 15,940 | |
| Los Angeles CA Community Redevelopment Agency Multifamily Housing Revenue (Academy Village Apartments) VRDO | | 1.630% | | 12/7/18 | LOC | | 8,300 | | 8,300 | |
| Los Angeles CA Community Redevelopment Agency Multifamily Housing Revenue (Hollywood & Vine Apartments) VRDO | | 1.690% | | 12/7/18 | LOC | | 92,900 | | 92,900 | |
1 | Los Angeles CA Department of Airports International Airport Revenue TOB VRDO | | 1.670% | | 12/7/18 | | | 4,700 | | 4,700 | |
1 | Los Angeles CA Department of Airports International Airport Revenue TOB VRDO | | 1.690% | | 12/7/18 | | | 7,500 | | 7,500 | |
1 | Los Angeles CA Department of Airports International Airport Revenue TOB VRDO | | 1.690% | | 12/7/18 | | | 3,700 | | 3,700 | |
1 | Los Angeles CA Department of Airports International Airport Revenue TOB VRDO | | 1.710% | | 12/7/18 | | | 9,160 | | 9,160 | |
1 | Los Angeles CA Department of Airports International Airport Revenue TOB VRDO | | 1.720% | | 12/7/18 | | | 2,500 | | 2,500 | |
1 | Los Angeles CA Department of Airports International Airport Revenue TOB VRDO | | 1.750% | | 12/7/18 | | | 4,720 | | 4,720 | |
1 | Los Angeles CA Department of Airports International Airport Revenue TOB VRDO | | 1.750% | | 12/7/18 | | | 2,940 | | 2,940 | |
17
California Municipal Money Market Fund
| | | | | | | | Face | | Market | |
| | | | | Maturity | | | Amount | | Value· | |
| | | Coupon | | Date | | | ($000 | ) | ($000 | ) |
1 | Los Angeles CA Department of Airports International Airport Revenue TOB VRDO | | 1.750% | | 12/7/18 | | | 5,200 | | 5,200 | |
1 | Los Angeles CA Department of Airports International Airport Revenue TOB VRDO | | 1.750% | | 12/7/18 | | | 7,545 | | 7,545 | |
1 | Los Angeles CA Department of Airports International Airport Revenue TOB VRDO | | 1.750% | | 12/7/18 | | | 6,665 | | 6,665 | |
1 | Los Angeles CA Department of Airports International Airport Revenue TOB VRDO | | 1.750% | | 12/7/18 | | | 5,020 | | 5,020 | |
1 | Los Angeles CA Department of Airports Revenue TOB VRDO | | 1.650% | | 12/7/18 | | | 12,060 | | 12,060 | |
1 | Los Angeles CA Department of Airports Revenue TOB VRDO | | 1.720% | | 12/7/18 | | | 6,830 | | 6,830 | |
1 | Los Angeles CA Department of Airports Revenue TOB VRDO | | 1.740% | | 12/7/18 | | | 2,500 | | 2,500 | |
1 | Los Angeles CA Department of Airports Revenue TOB VRDO | | 1.740% | | 12/7/18 | | | 2,245 | | 2,245 | |
1 | Los Angeles CA Department of Airports TOB VRDO | | 1.740% | | 12/7/18 | | | 2,520 | | 2,520 | |
1 | Los Angeles CA Department of Airports TOB VRDO | | 1.750% | | 12/7/18 | | | 2,125 | | 2,125 | |
1 | Los Angeles CA Department of Water & Power Revenue TOB VRDO | | 1.650% | | 12/7/18 | | | 7,310 | | 7,310 | |
1 | Los Angeles CA Department of Water & Power Revenue TOB VRDO | | 1.650% | | 12/7/18 | | | 1,150 | | 1,150 | |
1 | Los Angeles CA Department of Water & Power Revenue TOB VRDO | | 1.690% | | 12/7/18 | | | 7,500 | | 7,500 | |
1 | Los Angeles CA Department of Water & Power Revenue TOB VRDO | | 1.690% | | 12/7/18 | | | 4,350 | | 4,350 | |
1 | Los Angeles CA Department of Water & Power Revenue TOB VRDO | | 1.700% | | 12/7/18 | | | 10,835 | | 10,835 | |
1 | Los Angeles CA Department of Water & Power Revenue TOB VRDO | | 1.720% | | 12/7/18 | | | 10,900 | | 10,900 | |
1 | Los Angeles CA Department of Water & Power Revenue TOB VRDO | | 1.720% | | 12/7/18 | | | 2,000 | | 2,000 | |
| Los Angeles CA Department of Water & Power Revenue VRDO | | 1.390% | | 12/3/18 | | | 9,865 | | 9,865 | |
| Los Angeles CA Department of Water & Power Revenue VRDO | | 1.450% | | 12/3/18 | | | 9,800 | | 9,800 | |
| Los Angeles CA Department of Water & Power Revenue VRDO | | 1.450% | | 12/3/18 | | | 903 | | 903 | |
| Los Angeles CA Department of Water & Power Revenue VRDO | | 1.290% | | 12/7/18 | | | 1,350 | | 1,350 | |
1 | Los Angeles CA Department of Water & Power System Revenue TOB VRDO | | 1.650% | | 12/7/18 | | | 3,665 | | 3,665 | |
1 | Los Angeles CA Department of Water & Power System Revenue TOB VRDO | | 1.650% | | 12/7/18 | | | 4,800 | | 4,800 | |
| Los Angeles CA GO | | 5.000% | | 9/1/19 | | | 5,000 | | 5,122 | |
1 | Los Angeles CA Harbor Department Revenue TOB VRDO | | 1.690% | | 12/7/18 | (Prere.) | | 8,150 | | 8,150 | |
1 | Los Angeles CA Harbor Department Revenue TOB VRDO | | 1.750% | | 12/7/18 | | | 2,220 | | 2,220 | |
| Los Angeles CA International Airport Revenue CP | | 1.710% | | 12/5/18 | LOC | | 7,317 | | 7,317 | |
18
California Municipal Money Market Fund
| | | | | | | | Face | | Market | |
| | | | | Maturity | | | Amount | | Value· | |
| | | Coupon | | Date | | | ($000 | ) | ($000 | ) |
| Los Angeles CA International Airport Revenue CP | | 1.770% | | 1/ 17/19 | LOC | | 8,972 | | 8,972 | |
| Los Angeles CA Metro Trans Tax Revenue CP | | 1.720% | | 1/8/19 | LOC | | 3,600 | | 3,600 | |
| Los Angeles CA Metro Trans Tax Revenue CP | | 1.740% | | 1/8/19 | LOC | | 3,900 | | 3,900 | |
| Los Angeles CA Metro Trans Tax Revenue CP | | 1.740% | | 1/17/19 | | | 11,940 | | 11,940 | |
| Los Angeles CA Metro Trans Tax Revenue CP | | 1.730% | | 1/29/19 | | | 9,445 | | 9,445 | |
| Los Angeles CA Metro Trans Tax Revenue CP | | 1.750% | | 2/7/19 | | | 3,967 | | 3,967 | |
| Los Angeles CA Multifamily Housing Revenue (Queen Portfolio Apartments Project) VRDO | | 1.630% | | 12/7/18 | LOC | | 6,050 | | 6,050 | |
| Los Angeles CA Municipal Improvement Corp. Lease Revenue CP | | 1.700% | | 12/5/18 | LOC | | 24,475 | | 24,475 | |
| Los Angeles CA Municipal Improvement Corp. Lease Revenue CP | | 1.770% | | 1/29/19 | LOC | | 2,000 | | 2,000 | |
| Los Angeles CA Municipal Improvement Corp. Lease Revenue CP | | 1.760% | | 2/5/19 | | | 5,000 | | 5,000 | |
| Los Angeles CA Municipal Improvement Corp. Lease Revenue CP | | 1.770% | | 2/14/19 | | | 5,000 | | 5,000 | |
| Los Angeles CA Municipal Improvement Corp. Lease Revenue CP | | 1.830% | | 2/26/19 | LOC | | 7,000 | | 7,000 | |
| Los Angeles CA Municipal Improvement Corp. Lease Revenue CP | | 1.830% | | 2/26/19 | LOC | | 11,000 | | 11,000 | |
| Los Angeles CA TRAN | | 4.000% | | 6/27/19 | | | 85,895 | | 87,050 | |
1 | Los Angeles CA Unified School District GO TOB VRDO | | 1.650% | | 12/7/18 | | | 4,000 | | 4,000 | |
1 | Los Angeles CA Unified School District GO TOB VRDO | | 1.690% | | 12/7/18 | | | 10,000 | | 10,000 | |
1 | Los Angeles CA Unified School District GO TOB VRDO | | 1.690% | | 12/7/18 | | | 6,665 | | 6,665 | |
1 | Los Angeles CA Unified School District GO TOB VRDO | | 1.690% | | 12/7/18 | | | 5,200 | | 5,200 | |
1,2 | Los Angeles CA Wastewater System Revenue TOB PUT | | 1.840% | | 12/3/18 | LOC | | 5,000 | | 5,000 | |
| Los Angeles CA Wastewater System Revenue VRDO | | 1.400% | | 12/7/18 | LOC | | 28,860 | | 28,860 | |
| Los Angeles County CA Capital Asset Leasing Corp. CP | | 1.710% | | 12/4/18 | LOC | | 25,165 | | 25,165 | |
| Los Angeles County CA Capital Asset Leasing Corp. CP | | 1.690% | | 12/12/18 | LOC | | 27,935 | | 27,935 | |
| Los Angeles County CA Capital Asset Leasing Corp. CP | | 1.740% | | 1/10/19 | | | 5,000 | | 5,000 | |
| Los Angeles County CA Schools Pooled Financing Program Revenue | | 4.000% | | 6/3/19 | | | 7,000 | | 7,086 | |
| Los Angeles County CA TRAN | | 4.000% | | 6/28/19 | | | 49,280 | | 49,917 | |
1 | Lucia Mar CA Unified School District GO TOB VRDO | | 1.690% | | 12/7/18 | | | 4,990 | | 4,990 | |
1 | Madera CA Unified School District GO TOB VRDO | | 1.660% | | 12/7/18 | | | 6,400 | | 6,400 | |
| Manteca CA Redevelopment Agency Tax Allocation Revenue VRDO | | 1.630% | | 12/3/18 | LOC | | 21,040 | | 21,040 | |
1 | Marin CA Community College District GO VRDO | | 1.690% | | 12/7/18 | LOC | | 3,125 | | 3,12 5 | |
1 | Marin CA Healthcare District GO TOB VRDO | | 1.700% | | 12/7/18 | | | 1,600 | | 1,600 | |
1 | Marin CA Healthcare District GO TOB VRDO | | 1.710% | | 12/7/18 | | | 9,335 | | 9,335 | |
1 | Marin CA Water District Financing Authority Revenue TOB VRDO | | 1.720% | | 12/7/18 | | | 6,105 | | 6,105 | |
19
California Municipal Money Market Fund
| | | | | | | | Face | | Market | |
| | | | | Maturity | | | Amount | | Value· | |
| | | Coupon | | Date | | | ($000 | ) | ($000 | ) |
2 | Metropolitan Water District of Southern California Revenue PUT | | 1.660% | | 7/25/19 | | | 30,000 | | 30,000 | |
2 | Metropolitan Water District of Southern California Revenue PUT | | 1.660% | | 7/25/19 | | | 26,500 | | 26,500 | |
2 | Metropolitan Water District of Southern California Revenue PUT | | 1.660% | | 7/25/19 | | | 76,930 | | 76,923 | |
| Metropolitan Water District of Southern California Revenue VRDO | | 1.450% | | 12/3/18 | | | 19,700 | | 19,700 | |
| Metropolitan Water District of Southern California Revenue VRDO | | 1.450% | | 12/3/18 | | | 59,230 | | 59,230 | |
| Metropolitan Water District of Southern California Revenue VRDO | | 1.290% | | 12/7/18 | | | 22,800 | | 22,800 | |
1 | Morgan Hill CA Unified School District GO TOB VRDO | | 1.670% | | 12/7/18 | | | 8,000 | | 8,000 | |
1 | Newhall CA School District GO TOB VRDO | | 1.660% | | 12/3/18 | | | 3,400 | | 3,400 | |
1 | Nuveen California AMT-Free Quality Municipal Income Fund VRDP VRDO | | 1.700% | | 12/7/18 | LOC | | 87,000 | | 87,000 | |
1 | Nuveen California AMT-Free Quality Municipal Income Fund VRDP VRDO | | 1.700% | | 12/7/18 | LOC | | 40,000 | | 40,000 | |
1 | Nuveen California AMT-Free Quality Municipal Income Fund VRDP VRDO | | 1.720% | | 12/7/18 | LOC | | 16,200 | | 16,200 | |
1 | Nuveen California Dividend Advantage Municipal Fund VRDP VRDO | | 1.830% | | 12/7/18 | LOC | | 13,600 | | 13,600 | |
1 | Nuveen California Dividend Advantage Municipal Fund VRDP VRDO | | 1.830% | | 12/7/18 | LOC | | 9,100 | | 9,100 | |
1 | Nuveen California Dividend Advantage Municipal Fund VRDP VRDO | | 1.840% | | 12/7/18 | LOC | | 1,000 | | 1,000 | |
1 | Nuveen California Dividend Advantage Municipal Fund VRDP VRDO | | 1.840% | | 12/7/18 | LOC | | 34,000 | | 34,000 | |
1 | Oakland CA GO TOB VRDO | | 1.660% | | 12/3/18 | | | 2,485 | | 2,485 | |
| Oceanside CA Multifamily Housing Revenue (Shadow Way Apartments Project) VRDO | | 1.630% | | 12/7/18 | LOC | | 15,000 | | 15,000 | |
1 | Oxnard CA School District GO TOB VRDO | | 1.690% | | 12/7/18 | (15)LOC | | 3,000 | | 3,000 | |
1 | Oxnard CA Union High School District GO TOB VRDO | | 1.680% | | 12/7/18 | | | 7,200 | | 7,200 | |
1 | Palomar CA Community College District GO TOB VRDO | | 1.650% | | 12/7/18 | | | 2,880 | | 2,880 | |
1 | Palomar CA Community College District GO TOB VRDO | | 1.710% | | 12/7/18 | | | 6,400 | | 6,400 | |
| Pasadena CA COP VRDO | | 1.540% | | 12/7/18 | LOC | | 18,920 | | 18,920 | |
| Pleasanton CA Multifamily Housing Revenue VRDO | | 1.710% | | 12/7/18 | LOC | | 13,360 | | 13,360 | |
1 | Regents of the University of California Revenue TOB VRDO | | 1.670% | | 12/7/18 | | | 5,125 | | 5,125 | |
1 | Regents of the University of California Revenue TOB VRDO | | 1.720% | | 12/7/18 | | | 4,109 | | 4,109 | |
| Richmond CA Multifamily Housing Revenue (Baycliff Apartments Project) VRDO | | 1.710% | | 12/7/18 | LOC | | 26,490 | | 26,490 | |
1 | Riverside CA Electric Revenue TOB VRDO | | 1.720% | | 12/7/18 | | | 8,580 | | 8,580 | |
| Riverside County CA Asset Leasing Corp. Leasehold Revenue (Southwest Justice Center) VRDO | | 1.400% | | 12/7/18 | (12)LOC | | 16,940 | | 16,940 | |
| Riverside County CA Teeter Revenue | | 4.000% | | 10/24/19 | | | 20,000 | | 20,378 | |
20
California Municipal Money Market Fund
| | | | | | | | Face | | Market | |
| | | | | Maturity | | | Amount | | Value· | |
| | | Coupon | | Date | | | ($000 | ) | ($000 | ) |
1 | Riverside County CA Transportation Commission TOB VRDO | | 1.720% | | 12/7/18 | (Prere.) | | 12,730 | | 12,730 | |
1 | Sacramento CA Area Flood Control Agency Special Assessment Revenue TOB VRDO | | 1.690% | | 12/7/18 | | | 10,000 | | 10,000 | |
1 | Sacramento CA Area Flood Control Agency Special Assessment Revenue TOB VRDO | | 1.690% | | 12/7/18 | | | 6,000 | | 6,000 | |
| Sacramento CA Housing Authority Multifamily Housing Revenue AMT VRDO | | 1.710% | | 12/7/18 | LOC | | 14,270 | | 14,270 | |
| Sacramento CA Municipal Utility District Revenue CP | | 1.720% | | 12/3/18 | LOC | | 35,000 | | 35,000 | |
| Sacramento CA Municipal Utility District Revenue CP | | 1.740% | | 12/4/18 | LOC | | 8,800 | | 8,800 | |
| Sacramento CA Municipal Utility District Revenue CP | | 1.720% | | 12/11/18 | LOC | | 25,000 | | 25,000 | |
| Sacramento CA Municipal Utility District Revenue CP | | 1.710% | | 1/8/19 | | | 7,500 | | 7,500 | |
| Sacramento CA Transportation Authority Sales Tax Revenue VRDO | | 1.330% | | 12/7/18 | | | 64,900 | | 64,900 | |
| Sacramento County CA Housing Authority Revenue (Ashford Heights LP) VRDO | | 1.710% | | 12/7/18 | LOC | | 12,255 | | 12,255 | |
| Sacramento County CA Housing Authority Revenue (Hasting at Antelope LP) VRDO | | 1.710% | | 12/7/18 | LOC | | 16,300 | | 16,300 | |
| Sacramento County CA Multifamily Housing Revenue (River Pointe Apartments) VRDO | | 1.690% | | 12/7/18 | LOC | | 9,700 | | 9,700 | |
1 | San Bernardino CA Community College District GO TOB VRDO | | 1.670% | | 12/7/18 | | | 4,620 | | 4,620 | |
1 | San Bernardino County CA Transportation Authority Revenue TOB VRDO | | 1.690% | | 12/7/18 | | | 12,100 | | 12,100 | |
1 | San Diego CA Community College District GO TOB VRDO | | 1.690% | | 12/7/18 | (Prere.) | | 6,445 | | 6,445 | |
1 | San Diego CA Community College District GO TOB VRDO | | 1.740% | | 12/7/18 | (Prere.) | | 3,490 | | 3,490 | |
| San Diego CA Housing Authority Multifamily Housing Revenue (Bay Vista Apartments Project) VRDO | | 1.710% | | 12/7/18 | LOC | | 24,190 | | 24,190 | |
| San Diego CA Public Facilities CP | | 1.700% | | 12/17/18 | | | 14,676 | | 14,676 | |
| San Diego CA Public Facilities CP | | 1.710% | | 12/17/18 | | | 53,968 | | 53,968 | |
| San Diego CA Public Facilities CP | | 1.730% | | 12/17/18 | | | 22,759 | | 22,759 | |
1 | San Diego CA Public Facilities Financing Authority Sewer Revenue TOB VRDO | | 1.730% | | 12/7/18 | (Prere.) | | 6,230 | | 6,230 | |
1 | San Diego CA Public Facilities Financing Authority Water Revenue TOB VRDO | | 1.690% | | 12/7/18 | (Prere.) | | 3,800 | | 3,800 | |
1 | San Diego CA Unified School District GO TOB VRDO | | 1.690% | | 12/7/18 | | | 4,000 | | 4,000 | |
1 | San Diego CA Unified School District GO TOB VRDO | | 1.690% | | 12/7/18 | LOC | | 4,500 | | 4,500 | |
1 | San Diego CA Unified School District GO TOB VRDO | | 1.690% | | 12/7/18 | | | 2,500 | | 2,500 | |
1 | San Diego CA Unified School District GO TOB VRDO | | 1.710% | | 12/7/18 | | | 2,500 | | 2,500 | |
| San Diego County & School Districts CA Tax and Revenue Anticipation Note Program Revenue | | 4.000% | | 6/28/19 | | | 3,000 | | 3,041 | |
| San Diego County CA Regional Transportation Authority Sales Tax Revenue VRDO | | 1.320% | | 12/7/18 | | | 20,000 | | 20,000 | |
21
California Municipal Money Market Fund
| | | | | | | | Face | | Market | |
| | | | | Maturity | | | Amount | | Value· | |
| | | Coupon | | Date | | | ($000 | ) | ($000 | ) |
1 | San Diego County CA Regional Transportation Commission Sales Tax Revenue TOB VRDO | | 1.690% | | 12/7/18 | | | 4,445 | | 4,445 | |
| San Diego County CA Regional Transportation Commission Sales Tax Revenue VRDO | | 1.300% | | 12/7/18 | | | 59,230 | | 59,230 | |
| San Diego County CA Regional Transportation Commission Sales Tax Revenue VRDO | | 1.370% | | 12/7/18 | | | 11,030 | | 11,030 | |
| San Diego County CA Water Authority Revenue (Extendible) CP | | 1.830% | | 8/2/19 | | | 17,500 | | 17,500 | |
| San Diego County CA Water Authority Revenue (Extendible) CP | | 1.720% | | 8 /23/19 | | | 12,500 | | 12,500 | |
| San Diego County CA Water Authority Revenue CP | | 1.720% | | 12/5/18 | | | 13,100 | | 13,100 | |
| San Diego County CA Water Authority Revenue P | | 1.720% | | 12/5/18 | | | 35,000 | | 35,000 | |
| San Diego County CA Water Authority Revenue CP | | 1.730% | | 12/6/18 | | | 21,000 | | 21,000 | |
| San Diego County CA Water Authority Revenue CP | | 1.700% | | 12/7/18 | | | 15,000 | | 15,000 | |
| San Diego County CA Water Authority Revenue CP | | 1.750% | | 2 /4/19 | | | 22,000 | | 22,000 | |
1 | San Francisco CA Bay Area Rapid Transit District Sales Tax Revenue TOB VRDO | | 1.690% | | 12/7/18 | | | 3,750 | | 3,750 | |
| San Francisco CA City & County Finance Corp. Lease Revenue (Moscone Center Expansion) VRDO | | 1.380% | | 12/7/18 | LOC | | 8,720 | | 8,720 | |
1 | San Francisco CA City & County GO TOB VRDO | | 1.690% | | 12/7/18 | | | 11,450 | | 11,450 | |
| San Francisco CA City & County International Airport Revenue CP | | 1.720% | | 12/6/18 | LOC | | 1,575 | | 1,575 | |
| San Francisco CA City & County International Airport Revenue CP | | 1.770% | | 12/6/18 | LOC | | 1,250 | | 1,250 | |
| San Francisco CA City & County International Airport Revenue CP | | 1.720% | | 1/15/19 | | | 25,235 | | 25,235 | |
| San Francisco CA City & County International Airport Revenue CP | | 1.770% | | 1/15/19 | LOC | | 30,000 | | 30,000 | |
| San Francisco CA City & County International Airport Revenue CP | | 1.790% | | 1/15/19 | LOC | | 40,000 | | 40,000 | |
| San Francisco CA City & County International Airport Revenue VRDO | | 1.440% | | 12/7/18 | LOC | | 3,395 | | 3,395 | |
| San Francisco CA City & County International Airport Revenue VRDO | | 1.450% | | 12/7/18 | LOC | | 26,345 | | 26,345 | |
| San Francisco CA City & County International Airport Revenue VRDO | | 1.500% | | 12/7/18 | LOC | | 14,800 | | 14,799 | |
| San Francisco CA City & County Lease Revenue CP | | 1.700% | | 12/6/18 | LOC | | 16,750 | | 16,750 | |
| San Francisco CA City & County Multifamily Housing Revenue (City Heights Apartments) VRDO | | 1.750% | | 12/7/18 | LOC | | 11,700 | | 11,700 | |
| San Francisco CA City & County Public Utilities Commission CP | | 1.680% | | 12/13/18 | | | 11, 336 | | 11,336 | |
| San Francisco CA City & County Public Utilities Commission Sewer Revenue CP | | 1.760% | | 1/29/19 | | | 11,708 | | 11,708 | |
| San Francisco CA City & County Public Utilities Commission Sewer Revenue CP | | 1.760% | | 1/29/19 | | | 21,499 | | 21,499 | |
22
California Municipal Money Market Fund
| | | | | | | | Face | | Market | |
| | | | | Maturity | | | Amount | | Value· | |
| | | Coupon | | Date | | | ($000 | ) | ($000 | ) |
| San Francisco CA City & County Public Utilities Commission Wastewater Revenue CP | | 1.760% | | 1/29/19 | | | 22,246 | | 22,246 | |
1 | San Francisco CA City & County Public Utilities Commission Wastewater Revenue TOB VRDO | | 1.710% | | 12/7/18 | | | 6,900 | | 6,900 | |
1 | San Francisco CA City & County Public Utilities Commission Water Revenue TOB VRDO | | 1.690% | | 12/7/18 | | | 5,555 | | 5,555 | |
1 | San Francisco CA City & County Public Utilities Commission Water Revenue TOB VRDO | | 1.690% | | 12/7/18 | (Prere.) | | 47,850 | | 47,850 | |
| San Francisco CA City & County Redevelopment Agency Multifamily Housing Revenue (Third & Mission Streets) VRDO | | 1.670% | | 12/7/18 | LOC | | 40,850 | | 40,850 | |
1 | San Joaquin Delta CA Community College District GO TOB VRDO | | 1.790% | | 12/7/18 | | | 4,835 | | 4,835 | |
| San Jose CA Multifamily Housing Revenue (Cinnabar Commons) VRDO | | 1.710% | | 12/7/18 | LOC | | 15,000 | | 15,000 | |
1 | San Jose CA Redevelopment Agency Successor Agency Tax Allocation TOB VRDO | | 1.660% | | 12/7/18 | | | 9,415 | | 9,415 | |
1 | San Jose CA Unified School District GO TOB VRDO | | 1.650% | | 12/7/18 | | | 2,120 | | 2,120 | |
1 | San Mateo CA County Community College District GO TOB VRDO | | 1.700% | | 12/7/18 | | | 2,235 | | 2,235 | |
1 | San Rafael City High School District CA GO TOB VRDO | | 1.700% | | 12/7/18 | | | 3,000 | | 3,000 | |
| Santa Clara CA Electric Revenue VRDO | | 1.390% | | 12/7/18 | LOC | | 13,255 | | 13,255 | |
1 | Santa Clara CA TOB VRDO | | 1.690% | | 12/7/18 | | | 2,985 | | 2,985 | |
1 | Santa Clara CA TOB VRDO | | 1.690% | | 12/7/18 | | | 2,500 | | 2,500 | |
1 | Santa Clara County CA GO TOB VRDO | | 1.690% | | 12/7/18 | | | 8,250 | | 8,250 | |
| Santa Clara Valley CA Water District CP | | 1.700% | | 12/4/18 | | | 9,000 | | 9,000 | |
| Santa Clara Valley CA Transportation Authority Sales Tax Revenue VRDO | | 1.380% | | 12/7/18 | | | 7,200 | | 7,200 | |
1 | Santa Monica CA Community College District GO TOB VRDO | | 1.660% | | 12/7/18 | | | 1,200 | | 1,200 | |
1 | Santa Monica CA Community College District GO TOB VRDO | | 1.690% | | 12/7/18 | | | 5,000 | | 5,000 | |
1 | Santa Monica CA Community College District GO TOB VRDO | | 1.690% | | 12/7/18 | | | 6,530 | | 6,530 | |
1 | Solano County CA Community College District GO TOB VRDO | | 1.710% | | 12/7/18 | | | 3,000 | | 3,000 | |
1 | Sonoma County Junior College District CA GO TOB VRDO | | 1.690% | | 12/7/18 | LOC | | 5,000 | | 5,000 | |
| Southern California Public Power Authority Revenue VRDO | | 1.400% | | 12/3/18 | LOC | | 23,545 | | 23,545 | |
1 | Southwestern California Community College District GO TOB VRDO | | 1.650% | | 12/7/18 | | | 6,010 | | 6,010 | |
1 | Southwestern California Community College District GO TOB VRDO | | 1.710% | | 12/7/18 | | | 3,200 | | 3,200 | |
| Turlock CA Irrigation District Revenue CP | | 1.720% | | 12/20/18 | LOC | | 4,443 | | 4,443 | |
| Turlock CA Irrigation District Revenue CP | | 1.780% | | 2/12/19 | | | 44,900 | | 44,900 | |
1 | University of California Revenue TOB VRDO | | 1.680% | | 12/7/18 | | | 1,500 | | 1,500 | |
1 | University of California Revenue TOB VRDO | | 1.690% | | 12/7/18 | | | 5,000 | | 5,000 | |
1 | University of California Revenue TOB VRDO | | 1.690% | | 12/7/18 | | | 10,945 | | 10,945 | |
1 | University of California Revenue TOB VRDO | | 1.690% | | 12/7/18 | | | 10,135 | | 10,135 | |
1 | University of California Revenue TOB VRDO | | 1.690% | | 12/7/18 | | | 5,000 | | 5,000 | |
1 | University of California Revenue TOB VRDO | | 1.690% | | 12/7/18 | | | 2,500 | | 2,500 | |
23
California Municipal Money Market Fund
| | | | | | | | Face | | Market | |
| | | | | Maturity | | | Amount | | Value· | |
| | | Coupon | | Date | | | ($000 | ) | ($000 | ) |
1 | University of California Revenue TOB VRDO | | 1.690% | | 12/7/18 | | | 2,585 | | 2,585 | |
1 | University of California Revenue TOB VRDO | | 1.690% | | 12/7/18 | | | 4,125 | | 4,125 | |
1 | University of California Revenue TOB VRDO | | 1.710% | | 12/7/18 | | | 20,870 | | 20,870 | |
1 | University of California Revenue TOB VRDO | | 1.710% | | 12/7/18 | | | 15,000 | | 15,000 | |
| University of California Revenue VRDO | | 1.470% | | 12/3/18 | | | 84,875 | | 84,875 | |
| University of California Revenue VRDO | | 1.490% | | 12/3/18 | | | 96,950 | | 96,950 | |
| University of California Revenue VRDO | | 1.500% | | 12/3/18 | | | 80,900 | | 80,900 | |
Total Tax-Exempt Municipal Bonds (Cost $5,215,635) | | | | | | | 5,215,635 | |
| | | | | | | | | | |
| | | | | | | | | Amount
($000 | ) |
Other Assets and Liabilities (2.5%) | | | | | | | | | | |
Other Assets | | | | | | | | | | |
Investment in Vanguard | | | | | | | | | 273 | |
Receivables for Investment Securities Sold | | | | | | | | | 59,650 | |
Receivables for Accrued Income | | | | | | | | | 13,550 | |
Receivables for Capital Shares Issued | | | | | | | | | 90,455 | |
Other Assets | | | | | | | | | 6,901 | |
Total Other Assets | | | | | | | | | 170,829 | |
Liabilities | | | | | | | | | | |
Payables for Investment Securities Purchased | | | | | | | | | (20,595 | ) |
Payables for Capital Shares Redeemed | | | | | | | | | (15,885 | ) |
Payables for Distributions | | | | | | | | | (579 | ) |
Payables to Vanguard | | | | | | | | | (390 | ) |
Total Liabilities | | | | | | | | | (37,449 | ) |
Net Assets (100%) | | | | | | | | | | |
Applicable to 5,348,388,103 outstanding $.001 par value shares of beneficial interest (unlimited authorization) | | | | 5,349,015 | |
Net Asset Value Per Share | | | | | | | | | $1.00 | |
| | | | | | | | | | |
| | | | | | | | | | |
At November 30, 2018, net assets consisted of: | | | | | | | | | | |
| | | | | | | | | | |
| | | | | | | | | Amount
($000 | ) |
Paid-in Capital | | | | | | | | | 5,349,079 | |
Total Distributable Earnings (Loss) | | | | | | | | | (64 | ) |
Net Assets | | | | | | | | | 5,349,015 | |
· See Note A in Notes to Financial Statements.
1 Security exempt from registration under Rule 144A of the Securities Act of 1933. Such securities may be sold in transactions exempt from registration, normally to qualified institutional buyers. At November 30, 2018, the aggregate value of these securities was $1,190,846,000, representing 22.3% of net assets.
2 Adjustable-rate security based upon SIFMA Municipal Swap Index Yield plus spread.
A key to abbreviations and other references follows the Statement of Net Assets.
See accompanying Notes, which are an integral part of the Financial Statements.
24
California Municipal Money Market Fund
Key to Abbreviations
ARS—Auction Rate Security.
BAN—Bond Anticipation Note.
COP—Certificate of Participation.
CP—Commercial Paper.
FR—Floating Rate.
GAN—Grant Anticipation Note.
GO—General Obligation Bond.
PILOT—Payments in Lieu of Taxes.
PUT—Put Option Obligation.
RAN—Revenue Anticipation Note.
TAN—Tax Anticipation Note.
TOB—Tender Option Bond.
TRAN—Tax Revenue Anticipation Note.
VRDO—Variable Rate Demand Obligation.
VRDP—Variable Rate Demand Preferred.
(ETM)—Escrowed to Maturity.
(Prere.)—Prerefunded.
Scheduled principal and interest payments are guaranteed by:
(1) MBIA (Municipal Bond Investors Assurance).
(2) AMBAC (Ambac Assurance Corporation).
(3) FGIC (Financial Guaranty Insurance Company).
(4) AGM (Assured Guaranty Municipal Corporation).
(5) BIGI (Bond Investors Guaranty Insurance).
(6) Connie Lee Inc.
(7) FHA (Federal Housing Authority).
(8) CapMAC (Capital Markets Assurance Corporation).
(9) American Capital Access Financial Guaranty Corporation.
(10) XL Capital Assurance Inc.
(11) CIFG (CDC IXIS Financial Guaranty).
(12) AGC (Assured Guaranty Corporation).
(13) BHAC (Berkshire Hathaway Assurance Corporation).
(14) NPFG (National Public Finance Guarantee Corporation).
(15) BAM (Build America Mutual Assurance Company).
(16) MAC (Municipal Assurance Corporation).
(17) RAA (Radian Asset Assurance Inc.).
(18) SBLF (Michigan School Bond Loan Fund).
(19) TPSF (Texas Permanent School Fund).
The insurance does not guarantee the market value of the municipal bonds.
LOC — Scheduled principal and interest payments are guaranteed by bank letter of credit.
25
California Municipal Money Market Fund
Statement of Operations
| | Year Ended
November 30, 2018 | |
| | ($000 | ) |
Investment Income | | | |
Income | | | |
Interest | | 63,343 | |
Total Income | | 63,343 | |
Expenses | | | |
The Vanguard Group—Note B | | | |
Investment Advisory Services | | 1,203 | |
Management and Administrative | | 5,262 | |
Marketing and Distribution | | 1,004 | |
Custodian Fees | | 41 | |
Auditing Fees | | 29 | |
Shareholders’ Reports and Proxy | | 30 | |
Trustees’ Fees and Expenses | | 3 | |
Total Expenses | | 7,572 | |
Expenses Paid Indirectly | | (22 | ) |
Net Expenses | | 7,550 | |
Net Investment Income | | 55,793 | |
Realized Net Gain (Loss) on Investment Securities Sold | | (69 | ) |
Net Increase (Decrease) in Net Assets Resulting from Operations | | 55,724 | |
See accompanying Notes, which are an integral part of the Financial Statements.
26
California Municipal Money Market Fund
Statement of Changes in Net Assets
| | Year Ended November 30, | |
| | 2018
($000 | ) | 2017
($000 | ) |
Increase (Decrease) in Net Assets | | | | | |
Operations | | | | | |
Net Investment Income | | 55,793 | | 24,428 | |
Realized Net Gain (Loss) | | (69 | ) | 11 | |
Net Increase (Decrease) in Net Assets Resulting from Operations | | 55,724 | | 24,439 | |
Distributions | | | | | |
Net Investment Income | | (55,737 | ) | (24,427 | ) |
Realized Capital Gain | | — | | — | |
Total Distributions | | (55,737 | ) | (24,427 | ) |
Capital Share Transactions (at $1.00 per share) | | | | | |
Issued | | 4,073,264 | | 2,470,709 | |
Issued in Lieu of Cash Distributions | | 51,607 | | 22,934 | |
Redeemed | | (2,818,436 | ) | (1,956,129 | ) |
Net Increase (Decrease) from Capital Share Transactions | | 1,306,435 | | 537,514 | |
Total Increase (Decrease) | | 1,306,422 | | 537,526 | |
Net Assets | | | | | |
Beginning of Period | | 4,042,593 | | 3,505,067 | |
End of Period | | 5,349,015 | | 4,042,593 | |
See accompanying Notes, which are an integral part of the Financial Statements.
27
California Municipal Money Market Fund
Financial Highlights
For a Share Outstanding
Throughout Each Period | | Year Ended November 30, | |
| 2018 | | 2017 | | 2016 | | 2015 | | 2014 | |
Net Asset Value, Beginning of Period | | $1.00 | | $1.00 | | $1.00 | | $1.00 | | $1.00 | |
Investment Operations | | | | | | | | | | | |
Net Investment Income | | .012 | 1 | .006 | 1 | .002 | | .0001 | | .0001 | |
Net Realized and Unrealized Gain (Loss) on Investments | | — | | — | | — | | — | | — | |
Total from Investment Operations | | .012 | | .006 | | .002 | | .0001 | | .0001 | |
Distributions | | | | | | | | | | | |
Dividends from Net Investment Income | | (.012 | ) | (.006 | ) | (.002 | ) | (.0001 | ) | (.0001 | ) |
Distributions from Realized Capital Gains | | — | | — | | — | | — | | — | |
Total Distributions | | (.012 | ) | (.006 | ) | (.002 | ) | (.0001 | ) | (.0001 | ) |
Net Asset Value, End of Period | | $1.00 | | $1.00 | | $1.00 | | $1.00 | | $1.00 | |
| | | | | | | | | | | |
Total Return2 | | 1.18% | | 0.64% | | 0.25% | | 0.01% | | 0.01% | |
| | | | | | | | | | | |
Ratios/Supplemental Data | | | | | | | | | | | |
Net Assets, End of Period (Millions) | | $5,349 | | $4,043 | | $3,505 | | $3,391 | | $3,586 | |
Ratio of Expenses to Average Net Assets | | 0.16% | | 0.16% | | 0.13%3 | | 0.06%3 | | 0.07%3 | |
Ratio of Net Investment Income to Average Net Assets | | 1.18% | | 0.64% | | 0.25% | | 0.01% | | 0.01% | |
1 Calculated based on average shares outstanding.
2 Total returns do not include account service fees that may have applied in the periods shown. Fund prospectuses provide information about any applicable account service fees.
3 The ratio of total expenses to average net assets before an expense reduction was 0.16% for 2016, 0.16% for 2015 and 0.16% for 2014. Vanguard and the board of trustees have agreed to temporarily limit certain net operating expenses in excess of the fund’s daily yield in order to maintain a zero or positive yield for the fund. The fund is not obligated to repay this amount to Vanguard.
See accompanying Notes, which are an integral part of the Financial Statements.
28
California Municipal Money Market Fund
Notes to Financial Statements
Vanguard California Municipal Money Market Fund is registered under the Investment Company Act of 1940 as an open-end investment company, or mutual fund. The fund invests in debt instruments of municipal issuers whose ability to meet their obligations may be affected by economic and political developments in the state.
A. The following significant accounting policies conform to generally accepted accounting principles for U.S. investment companies. The fund consistently follows such policies in preparing its financial statements.
1. Security Valuation: Securities are valued as of the close of trading on the New York Stock Exchange (generally 4 p.m., Eastern time) on the valuation date. Securities are valued at amortized cost, which approximates market value.
2. Federal Income Taxes: The fund intends to continue to qualify as a regulated investment company and distribute all of its income. Management has analyzed the fund’s tax positions taken for all open federal income tax years (November 30, 2015–2018), and has concluded that no provision for federal income tax is required in the fund’s financial statements.
3. Distributions: Distributions from net investment income are declared daily and paid on the first business day of the following month. Annual distributions from realized capital gains, if any, are recorded on the ex-dividend date. Distributions are determined on a tax basis and may differ from net investment income and realized capital gains for financial reporting purposes.
4. Credit Facility: The fund and certain other funds managed by The Vanguard Group (“Vanguard”) participate in a $3.1 billion committed credit facility provided by a syndicate of lenders pursuant to a credit agreement that may be renewed annually; each fund is individually liable for its borrowings, if any, under the credit facility. Borrowings may be utilized for temporary and emergency purposes, and are subject to the fund’s regulatory and contractual borrowing restrictions. The participating funds are charged administrative fees and an annual commitment fee of 0.10% of the undrawn amount of the facility; these fees are allocated to the funds based on a method approved by the fund’s board of trustees and included in Management and Administrative expenses on the fund’s Statement of Operations. Any borrowings under this facility bear interest at a rate based upon the higher of the one-month London Interbank Offered Rate, federal funds effective rate, or overnight bank funding rate plus an agreed-upon spread.
The fund had no borrowings outstanding at November 30, 2018, or at any time during the period then ended.
5. Other: Interest income is accrued daily. Premiums and discounts on debt securities purchased are amortized and accreted, respectively, to interest income over the lives of the respective securities. Security transactions are accounted for on the date securities are bought or sold. Costs used to determine realized gains (losses) on the sale of investment securities are those of the specific securities sold.
B. In accordance with the terms of a Funds’ Service Agreement (the “FSA”) between Vanguard and the fund, Vanguard furnishes to the fund investment advisory, corporate management, administrative, marketing, and distribution services at Vanguard’s cost of operations (as defined by the FSA). These costs of operations are allocated to the fund based on methods and guidelines approved by the board of trustees. Vanguard does not require reimbursement in the current period for certain costs of operations (such as deferred compensation/benefits and risk/insurance costs);
29
California Municipal Money Market Fund
the fund’s liability for these costs of operations is included in Payables to Vanguard on the Statement of Net Assets. All other costs of operations payable to Vanguard are generally settled twice a month.
Upon the request of Vanguard, the fund may invest up to 0.40% of its net assets as capital in Vanguard. At November 30, 2018, the fund had contributed to Vanguard capital in the amount of $273,000, representing 0.01% of the fund’s net assets and 0.11% of Vanguard’s capitalization. The fund’s trustees and officers are also directors and employees, respectively, of Vanguard.
C. The fund’s custodian bank has agreed to reduce its fees when the fund maintains cash on deposit in the non-interest-bearing custody account. For the year ended November 30, 2018, custodian fee offset arrangements reduced the fund’s expenses by $22,000 (an annual rate of 0.00% of average net assets).
D. Various inputs may be used to determine the value of the fund’s investments. These inputs are summarized in three broad levels for financial statement purposes. The inputs or methodologies used to value securities are not necessarily an indication of the risk associated with investing in those securities.
Level 1—Quoted prices in active markets for identical securities.
Level 2—Other significant observable inputs (including quoted prices for similar securities, interest rates, prepayment speeds, credit risk, etc.).
Level 3—Significant unobservable inputs (including the fund’s own assumptions used to determine the fair value of investments). Any investments valued with significant unobservable inputs are noted on the Statement of Net Assets.
At November 30, 2018, 100% of the market value of the fund’s investments was determined using amortized cost, in accordance with rules under the Investment Company Act of 1940. Amortized cost approximates the current fair value of a security, but since the value is not obtained from a quoted price in an active market, securities valued at amortized cost are considered to be valued using Level 2 inputs.
E. Permanent differences between book-basis and tax-basis components of net assets, if any, are reclassified among capital accounts in the financial statements to reflect their tax character. These reclassifications have no effect on net assets or net asset value per share.
Temporary differences between book-basis and tax-basis components of total distributable earnings (loss) arise when certain items of income, gain, or loss are recognized in different periods for financial statement and tax purposes; these differences will reverse at some time in the future. The differences are primarily related to the tax deferral of losses on wash sales and payables for distributions. As of period end, the tax-basis components of total distributable earnings (loss) are detailed in the table as follows:
| | Amount
($000 | ) |
Undistributed Ordinary Income | | — | |
Undistributed Tax-Exempt Income | | 569 | |
Undistributed Long-Term Gains | | — | |
Capital Loss Carryforwards (Non-expiring) | | (69 | ) |
Net Unrealized Gains (Losses) | | — | |
30
California Municipal Money Market Fund
As of November 30, 2018, gross unrealized appreciation and depreciation for investments based on cost for U.S. federal income tax purposes were as follows:
| | Amount
($000 | ) |
Tax Cost | | 5,215,635 | |
Gross Unrealized Appreciation | | — | |
Gross Unrealized Depreciation | | — | |
Net Unrealized Appreciation (Depreciation) | | — | |
F. The fund purchased securities from and sold securities to other Vanguard funds or accounts managed by Vanguard or its affiliates, in accordance with procedures adopted by the board of trustees in compliance with Rule 17a-7 of the Investment Company Act of 1940. For the year ended November 30, 2018, such purchases and sales were $819,491,000 and $832,715,000, respectively.
G. Management has determined that no events or transactions occurred subsequent to November 30, 2018, that would require recognition or disclosure in these financial statements.
31
California Intermediate-Term Tax-Exempt Fund
Performance Summary
All of the returns in this report represent past performance, which is not a guarantee of future results that may be achieved by the fund. (Current performance may be lower or higher than the performance data cited. For performance data current to the most recent month-end, visit our website at vanguard.com/performance.) Note, too, that both investment returns and principal value can fluctuate widely, so an investor’s shares, when sold, could be worth more or less than their original cost. The returns shown do not reflect taxes that a shareholder would pay on fund distributions or on the sale of fund shares.
Cumulative Performance: November 30, 2008, Through November 30, 2018
Initial Investment of $10,000
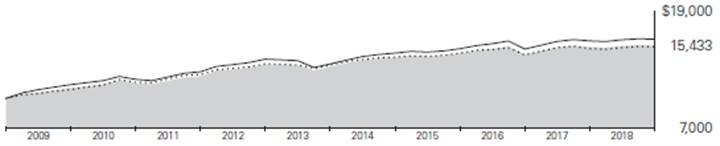
| | Average Annual Total Returns
Periods Ended November 30, 2018 | | Final Value
of a $10,000 Investment | |
| | One
Year | Five
Years |
Ten
Years
| |

| California Intermediate-Term Tax-Exempt Fund Investor Shares | | 1.00% | 3.10% | 4.43% | | $15,433 | |

| Bloomberg Barclays Municipal California Intermediate Bond Index | | 1.34 | 2.69 | 4.36 | | 15,325 | |

| Bloomberg Barclays Municipal Bond Index | | 1.13 | 3.52 | 4.88 | | 16,101 | |
| | One
Year | Five
Years |
Ten
Years
| | Final Value
of a $50,000 Investment | |
California Intermediate-Term Tax-Exempt Fund Admiral Shares | | 1.08% | 3.20% | 4.52% | | $77,815 | |
Bloomberg Barclays Municipal California Intermediate Bond Index | | 1.34 | 2.69 | 4.36 | | 76,624 | |
Bloomberg Barclays Municipal Bond Index | | 1.13 | 3.52 | 4.88 | | 80,506 | |
See Financial Highlights for dividend and capital gains information.
32
California Intermediate-Term Tax-Exempt Fund
Average Annual Total Returns: Periods Ended September 30, 2018
This table presents returns through the latest calendar quarter—rather than through the end of the fiscal period. Securities and Exchange Commission rules require that we provide this information.
| | | | | | Ten Years |
| Inception Date | One Year | Five Years | Income | Capital | Total |
Investor Shares | 3/4/1994 | 0.04% | 3.14% | 3.25% | 1.07% | 4.32% |
Admiral Shares | 11/12/2001 | 0.13 | 3.23 | 3.33 | 1.07 | 4.40 |
33
California Intermediate-Term Tax-Exempt Fund
Distribution by Stated Maturity
As of November 30, 2018
Under 1 Year | | 4.1 | % |
1 - 3 Years | | 10.9 | |
3 - 5 Years | | 11.9 | |
5 - 10 Years | | 25.6 | |
10 - 20 Years | | 47.5 | |
20 - 30 Years | | 0.0 | |
Over 30 Years | | 0.0 | |
34
California Intermediate-Term Tax-Exempt Fund
Financial Statements
Statement of Net Assets
As of November 30, 2018
The fund reports a complete list of its holdings in regulatory filings four times in each fiscal year, at the quarter-ends. For the second and fourth fiscal quarters, the lists appear in the fund’s semiannual and annual reports to shareholders. For the first and third fiscal quarters, the fund files the lists with the Securities and Exchange Commission on Form N-Q. Shareholders can look up the fund’s Forms N-Q on the SEC’s website at sec.gov.
| | | | | | | | Face | | Market | |
| | | | | Maturity | | | Amount | | Value· | |
| | | Coupon | | Date | | | ($000 | ) | ($000 | ) |
Tax-Exempt Municipal Bonds (99.2%) | | | | | | | | | | |
California (99.0%) | | | | | | | | | | |
| ABAG Finance Authority for Nonprofit Corps. California Revenue (Episcopal Senior Communities) | | 5.000% | | 7/1/23 | | | 700 | | 769 | |
| ABAG Finance Authority for Nonprofit Corps. California Revenue (Episcopal Senior Communities) | | 5.000% | | 7/1/24 | | | 1,195 | | 1,310 | |
| ABAG Finance Authority for Nonprofit Corps. California Revenue (Episcopal Senior Communities) | | 6.000% | | 7/1/31 | | | 2,750 | | 2,965 | |
| ABAG Finance Authority for Nonprofit Corps. California Revenue (Episcopal Senior Communities) | | 5.000% | | 7/1/32 | | | 1,060 | | 1,118 | |
| ABAG Finance Authority for Nonprofit Corps. California Revenue (Eskaton Properties Inc. Obligated Group) | | 5.000% | | 11/15/35 | | | 3,250 | | 3,448 | |
| ABAG Finance Authority for Nonprofit Corps. California Revenue (Jackson Laboratory) | | 5.000% | | 7/1/20 | | | 850 | | 893 | |
| ABAG Finance Authority for Nonprofit Corps. California Revenue (Jackson Laboratory) | | 5.000% | | 7/1/22 | | | 555 | | 608 | |
| ABAG Finance Authority for Nonprofit Corps. California Revenue (Jackson Laboratory) | | 5.000% | | 7/1/23 | | | 1,000 | | 1,091 | |
| ABAG Finance Authority for Nonprofit Corps. California Revenue (Jackson Laboratory) | | 5.000% | | 7/1/24 | | | 1,265 | | 1,373 | |
| ABAG Finance Authority for Nonprofit Corps. California Revenue (Odd Fellows Home) | | 5.000% | | 4/1/32 | | | 7,250 | | 7,947 | |
| ABAG Finance Authority for Nonprofit Corps. California Revenue (Sharp Healthcare) | | 5.000% | | 8/1/21 | | | 1,000 | | 1,081 | |
| ABAG Finance Authority for Nonprofit Corps. California Revenue (Sharp Healthcare) | | 5.250% | | 8/1/23 | | | 1,000 | | 1,086 | |
| ABAG Finance Authority for Nonprofit Corps. California Revenue (Sharp Healthcare) | | 5.000% | | 8/1/24 | | | 960 | | 1,042 | |
| ABAG Finance Authority for Nonprofit Corps. California Revenue (Sharp Healthcare) | | 5.000% | | 8/1/25 | | | 950 | | 1,030 | |
| ABAG Finance Authority for Nonprofit Corps. California Revenue (Sharp Healthcare) | | 5.000% | | 8/1/26 | | | 2,490 | | 2,696 | |
| ABAG Finance Authority for Nonprofit Corps. California Revenue (Sharp Healthcare) | | 5.000% | | 8/1/28 | | | 900 | | 972 | |
35
California Intermediate-Term Tax-Exempt Fund
| | | | | | | | Face | | Market | |
| | | | | Maturity | | | Amount | | Value· | |
| | | Coupon | | Date | | | ($000 | ) | ($000 | ) |
| ABAG Finance Authority for Nonprofit Corps. California Revenue (Sharp Healthcare) | | 6.000% | | 8/1/30 | | | 18,140 | | 19,982 | |
| ABAG Finance Authority for Nonprofit Corps. California Revenue (Sharp Healthcare) | | 5.000% | | 8/1/31 | | | 1,000 | | 1,109 | |
| ABAG Finance Authority for Nonprofit Corps. California Revenue (Sharp Healthcare) | | 5.000% | | 8/1/32 | | | 1,000 | | 1,108 | |
| ABAG Finance Authority for Nonprofit Corps. California Revenue (Sharp Healthcare) | | 5.000% | | 8/1/34 | | | 1,780 | | 1,962 | |
| ABAG Finance Authority for Nonprofit Corps. California Revenue (Windemere Ranch Infrastructure Financing Program) | | 5.000% | | 9/2/21 | | | 275 | | 296 | |
| ABAG Finance Authority for Nonprofit Corps. California Revenue (Windemere Ranch Infrastructure Financing Program) | | 5.000% | | 9/2/22 | | | 350 | | 385 | |
| ABAG Finance Authority for Nonprofit Corps. California Revenue (Windemere Ranch Infrastructure Financing Program) | | 5.000% | | 9/2/23 | | | 370 | | 414 | |
| ABAG Finance Authority for Nonprofit Corps. California Revenue (Windemere Ranch Infrastructure Financing Program) | | 5.000% | | 9/2/24 | | | 395 | | 449 | |
| ABAG Finance Authority for Nonprofit Corps. California Revenue (Windemere Ranch Infrastructure Financing Program) | | 5.000% | | 9/2/25 | | | 505 | | 569 | |
| ABAG Finance Authority for Nonprofit Corps. California Revenue (Windemere Ranch Infrastructure Financing Program) | | 5.000% | | 9/2/26 | | | 675 | | 763 | |
| ABAG Finance Authority for Nonprofit Corps. California Revenue (Windemere Ranch Infrastructure Financing Program) | | 5.000% | | 9/2/28 | | | 1,150 | | 1,286 | |
| ABAG Finance Authority for Nonprofit Corps. California Revenue (Windemere Ranch Infrastructure Financing Program) | | 5.000% | | 9/2/29 | | | 985 | | 1,097 | |
| ABAG Finance Authority for Nonprofit Corps. California Revenue (Windemere Ranch Infrastructure Financing Program) | | 5.000% | | 9/2/30 | | | 1,405 | | 1,560 | |
| ABAG Finance Authority for Nonprofit Corps. California Revenue (Windemere Ranch Infrastructure Financing Program) | | 5.000% | | 9/2/31 | | | 495 | | 548 | |
| ABAG Finance Authority for Nonprofit Corps. California Revenue (Windemere Ranch Infrastructure Financing Program) | | 5.000% | | 9/2/32 | | | 520 | | 577 | |
| Alameda CA Community Improvement Commission Successor Agency Tax Allocation Revenue | | 5.000% | | 9/1/27 | (15) | | 750 | | 850 | |
| Alameda CA Community Improvement Commission Successor Agency Tax Allocation Revenue | | 5.000% | | 9/1/28 | (15) | | 1,000 | | 1,129 | |
| Alameda CA Community Improvement Commission Successor Agency Tax Allocation Revenue | | 5.000% | | 9/1/30 | (15) | | 1,680 | | 1,882 | |
| Alameda CA Community Improvement Commission Successor Agency Tax Allocation Revenue | | 5.000% | | 9/1/31 | (15) | | 1,640 | | 1,830 | |
36
California Intermediate-Term Tax-Exempt Fund
| | | | | | | | Face | | Market | |
| | | | | Maturity | | | Amount | | Value· | |
| | | Coupon | | Date | | | ($000 | ) | ($000 | ) |
| Alameda CA Community Improvement Commission Successor Agency Tax Allocation Revenue | | 5.000% | | 9/1/32 | (15) | | 3,000 | | 3,337 | |
| Alameda CA Community Improvement Commission Successor Agency Tax Allocation Revenue | | 5.000% | | 9/1/33 | (15) | | 2,375 | | 2,637 | |
| Alameda CA Corridor Transportation Authority Revenue | | 0.000% | | 10/1/19 | (2)(ETM) | | 13,240 | | 13,058 | |
| Alameda CA Corridor Transportation Authority Revenue | | 0.000% | | 10/1/19 | (2) | | 1,050 | | 1,027 | |
| Alameda CA Corridor Transportation Authority Revenue | | 0.000% | | 10/1/20 | (2)(ETM) | | 13,780 | | 13,310 | |
| Alameda CA Corridor Transportation Authority Revenue | | 0.000% | | 10/1/20 | (2) | | 285 | | 270 | |
| Alameda CA Corridor Transportation Authority Revenue | | 4.000% | | 10/1/21 | | | 1,485 | | 1,546 | |
| Alameda CA Corridor Transportation Authority Revenue | | 4.000% | | 3/1/22 | | | 5,540 | | 5,926 | |
| Alameda CA Corridor Transportation Authority Revenue | | 5.000% | | 10/1/22 | | | 6,185 | | 6,722 | |
| Alameda CA Corridor Transportation Authority Revenue | | 5.000% | | 10/1/22 | | | 2,220 | | 2,461 | |
| Alameda CA Corridor Transportation Authority Revenue | | 4.000% | | 10/1/23 | | | 3,145 | | 3,332 | |
| Alameda CA Corridor Transportation Authority Revenue | | 5.000% | | 10/1/23 | | | 2,160 | | 2,445 | |
| Alameda CA Corridor Transportation Authority Revenue | | 5.000% | | 10/1/24 | | | 1,460 | | 1,635 | |
| Alameda CA Corridor Transportation Authority Revenue | | 5.000% | | 10/1/25 | | | 2,610 | | 2,956 | |
| Alameda CA Corridor Transportation Authority Revenue | | 0.000% | | 10/1/29 | (2) | | 30,240 | | 19,928 | |
| Alameda CA Corridor Transportation Authority Revenue | | 0.000% | | 10/1/30 | (2) | | 9,110 | | 5,717 | |
| Alameda CA Corridor Transportation Authority Revenue | | 5.000% | | 10/1/34 | | | 13,435 | | 14,784 | |
| Alameda CA Corridor Transportation Authority Revenue | | 5.000% | | 10/1/35 | | | 15,825 | | 17,346 | |
| Alameda CA Corridor Transportation Authority Revenue | | 5.000% | | 10/1/36 | | | 13,495 | | 14,734 | |
| Alameda County CA Joint Powers Authority Lease Revenue | | 5.000% | | 12/1/32 | | | 7,000 | | 7,834 | |
| Alameda County CA Joint Powers Authority Lease Revenue | | 5.000% | | 12/1/33 | | | 8,415 | | 9,396 | |
| Alameda County CA Joint Powers Authority Lease Revenue | | 5.000% | | 12/1/34 | | | 4,640 | | 5,163 | |
| Alameda County CA Unified School District GO | | 5.000% | | 8/1/34 | | | 2,890 | | 3,291 | |
| Alum Rock CA Union Elementary School District GO | | 5.000% | | 8/1/22 | (15) | | 500 | | 554 | |
| Alum Rock CA Union Elementary School District GO | | 5.000% | | 8/1/23 | (15) | | 800 | | 906 | |
| Alum Rock CA Union Elementary School District GO | | 5.000% | | 8/1/24 | (15) | | 1,000 | | 1,153 | |
37
California Intermediate-Term Tax-Exempt Fund
| | | | | | | | Face | | Market | |
| | | | | Maturity | | | Amount | | Value· | |
| | | Coupon | | Date | | | ($000 | ) | ($000 | ) |
| Alum Rock CA Union Elementary School District GO | | 5.000% | | 8/1/25 | (15) | | 1,275 | | 1,496 | |
| Alum Rock CA Union Elementary School District GO | | 5.000% | | 8/1/26 | (15) | | 1,180 | | 1,379 | |
| Alum Rock CA Union Elementary School District GO | | 5.000% | | 8/1/32 | (15) | | 2,745 | | 3,153 | |
| Alvord CA Unified School District GO | | 5.900% | | 2/1/21 | (14) | | 2,230 | | 2,404 | |
| Alvord CA Unified School District GO | | 5.000% | | 8/1/23 | (4) | | 530 | | 599 | |
| Alvord CA Unified School District GO | | 5.900% | | 2/1/24 | (4) | | 3,865 | | 4,298 | |
| Alvord CA Unified School District GO | | 5.000% | | 8/1/24 | (4) | | 650 | | 749 | |
| Alvord CA Unified School District GO | | 5.000% | | 8/1/27 | (4) | | 1,100 | | 1,315 | |
| Alvord CA Unified School District GO | | 5.000% | | 8/1/28 | (4) | | 1,375 | | 1,660 | |
| Alvord CA Unified School District GO | | 5.000% | | 8/1/29 | (4) | | 1,500 | | 1,797 | |
| Alvord CA Unified School District GO | | 5.000% | | 8/1/30 | (4) | | 1,950 | | 2,322 | |
| Alvord CA Unified School District GO | | 5.000% | | 8/1/31 | (4) | | 1,750 | | 2,073 | |
| Alvord CA Unified School District GO | | 5.000% | | 8/1/32 | (4) | | 1,300 | | 1,534 | |
| Anaheim CA City School District GO | | 0.000% | | 8/1/27 | (14) | | 11,075 | | 8,413 | |
| Anaheim CA Housing & Public Improvements Authority Revenue (Electric Utility Distribution System) | | 5.000% | | 10/1/21 | (Prere.) | | 830 | | 902 | |
| Anaheim CA Housing & Public Improvements Authority Revenue (Electric Utility Distribution System) | | 5.000% | | 10/1/21 | | | 1,000 | | 1,086 | |
| Anaheim CA Housing & Public Improvements Authority Revenue (Electric Utility Distribution System) | | 5.000% | | 10/1/21 | | | 3,815 | | 4,143 | |
| Anaheim CA Housing & Public Improvements Authority Revenue (Electric Utility Distribution System) | | 5.000% | | 10/1/22 | | | 2,370 | | 2,635 | |
| Anaheim CA Housing & Public Improvements Authority Revenue (Electric Utility Distribution System) | | 5.000% | | 10/1/23 | | | 3,000 | | 3,371 | |
| Anaheim CA Housing & Public Improvements Authority Revenue (Electric Utility Distribution System) | | 5.000% | | 10/1/24 | | | 1,125 | | 1,303 | |
| Anaheim CA Housing & Public Improvements Authority Revenue (Electric Utility Distribution System) | | 5.000% | | 10/1/24 | | | 4,000 | | 4,480 | |
| Anaheim CA Housing & Public Improvements Authority Revenue (Electric Utility Distribution System) | | 5.000% | | 10/1/25 | | | 5,280 | | 5,900 | |
| Anaheim CA Housing & Public Improvements Authority Revenue (Electric Utility Distribution System) | | 5.000% | | 10/1/26 | | | 5,290 | | 5,895 | |
| Anaheim CA Housing & Public Improvements Authority Revenue (Electric Utility Distribution System) | | 5.000% | | 10/1/26 | | | 3,165 | | 3,771 | |
| Anaheim CA Housing & Public Improvements Authority Revenue (Electric Utility Distribution System) | | 5.000% | | 10/1/27 | | | 2,035 | | 2,452 | |
| Anaheim CA Housing & Public Improvements Authority Revenue (Electric Utility Distribution System) | | 5.000% | | 10/1/28 | | | 4,035 | | 4,472 | |
38
California Intermediate-Term Tax-Exempt Fund
| | | | | | | | Face | | Market | |
| | | | | Maturity | | | Amount | | Value· | |
| | | Coupon | | Date | | | ($000 | ) | ($000 | ) |
| Anaheim CA Housing & Public Improvements Authority Revenue (Electric Utility Distribution System) | | 5.000% | | 10/1/28 | | | 1,250 | | 1,522 | |
| Anaheim CA Housing & Public Improvements Authority Revenue (Electric Utility Distribution System) | | 5.000% | | 10/1/31 | | | 11,000 | | 12,153 | |
| Anaheim CA Housing & Public Improvements Authority Revenue (Electric Utility Distribution System) | | 5.000% | | 10/1/31 | | | 2,500 | | 2,693 | |
| Anaheim CA Housing & Public Improvements Authority Revenue (Electric Utility Distribution System) | | 5.000% | | 10/1/32 | | | 6,000 | | 6,616 | |
| Anaheim CA Housing & Public Improvements Authority Revenue (Electric Utility Distribution System) | | 5.000% | | 10/1/32 | | | 1,495 | | 1,610 | |
| Anaheim CA Housing & Public Improvements Authority Revenue (Electric Utility Distribution System) | | 5.000% | | 10/1/33 | | | 2,590 | | 2,787 | |
| Anaheim CA Housing & Public Improvements Authority Revenue (Electric Utility Distribution System) | | 5.000% | | 10/1/34 | | | 5,380 | | 5,907 | |
| Anaheim CA Housing & Public Improvements Authority Revenue (Electric Utility Distribution System) | | 5.000% | | 10/1/34 | | | 4,350 | | 4,678 | |
| Anaheim CA Housing & Public Improvements Authority Revenue (Electric Utility Distribution System) | | 5.000% | | 10/1/36 | | | 1,125 | | 1,207 | |
| Anaheim CA Housing & Public Improvements Authority Revenue (Water System Project) | | 5.000% | | 10/1/31 | | | 300 | | 323 | |
| Anaheim CA Housing & Public Improvements Authority Revenue (Water System Project) | | 5.000% | | 10/1/32 | | | 300 | | 323 | |
| Anaheim CA Housing & Public Improvements Authority Revenue (Water System Project) | | 5.000% | | 10/1/33 | | | 765 | | 824 | |
| Anaheim CA Housing & Public Improvements Authority Revenue (Water System Project) | | 5.000% | | 10/1/34 | | | 1,000 | | 1,076 | |
| Anaheim CA Housing & Public Improvements Authority Revenue (Water System Project) | | 5.000% | | 10/1/35 | | | 505 | | 543 | |
| Anaheim CA Housing & Public Improvements Authority Revenue (Water System Project) | | 5.000% | | 10/1/36 | | | 500 | | 537 | |
| Anaheim CA Public Financing Authority Revenue (Electric System) | | 5.250% | | 4/1/21 | (Prere.) | | 5,585 | | 6,030 | |
| Anaheim CA Public Financing Authority Revenue (Electric System) | | 4.000% | | 10/1/31 | | | 12,000 | | 12,609 | |
1 | Anaheim CA Public Financing Authority TOB VRDO | | 1.790% | | 12/7/18 | | | 3,000 | | 3,000 | |
| Arcadia CA Unified School District GO | | 4.000% | | 8/1/28 | | | 2,125 | | 2,317 | |
| Arcadia CA Unified School District GO | | 4.000% | | 8/1/29 | | | 2,675 | | 2,893 | |
| Azusa CA Unified School District GO | | 5.000% | | 8/1/29 | | | 500 | | 547 | |
| Azusa CA Unified School District GO | | 5.000% | | 8/1/30 | | | 500 | | 546 | |
| Azusa CA Unified School District GO | | 4.000% | | 8/1/31 | (4) | | 3,995 | | 4,263 | |
| Azusa CA Unified School District GO | | 5.000% | | 8/1/31 | | | 515 | | 562 | |
| Azusa CA Unified School District GO | | 5.000% | | 8/1/32 | | | 600 | | 654 | |
| Azusa CA Unified School District GO | | 5.000% | | 8/1/33 | | | 950 | | 1,034 | |
| Azusa CA Unified School District GO | | 5.000% | | 8/1/34 | | | 1,055 | | 1,147 | |
39
California Intermediate-Term Tax-Exempt Fund
| | | | | | | | Face | | Market | |
| | | | | Maturity | | | Amount | | Value· | |
| | | Coupon | | Date | | | ($000 | ) | ($000 | ) |
| Azusa CA Unified School District GO | | 5.000% | | 8/1/35 | | | 1,165 | | 1,265 | |
| Azusa CA Unified School District GO | | 5.000% | | 8/1/36 | | | 1,000 | | 1,085 | |
| Azusa CA Unified School District GO | | 5.000% | | 8/1/37 | | | 650 | | 705 | |
| Bay Area Toll Authority California Toll Bridge Revenue (San Francisco Bay Area) | | 5.000% | | 4/1/19 | (Prere.) | | 75 | | 76 | |
| Bay Area Toll Authority California Toll Bridge Revenue (San Francisco Bay Area) | | 5.000% | | 4/1/23 | (Prere.) | | 7,645 | | 8,638 | |
| Bay Area Toll Authority California Toll Bridge Revenue (San Francisco Bay Area) | | 5.000% | | 4/1/23 | (Prere.) | | 5,000 | | 5,649 | |
| Bay Area Toll Authority California Toll Bridge Revenue (San Francisco Bay Area) | | 5.000% | | 4/1/23 | (Prere.) | | 7,850 | | 8,870 | |
| Bay Area Toll Authority California Toll Bridge Revenue (San Francisco Bay Area) | | 5.000% | | 4/1/25 | | | 6,300 | | 6,908 | |
| Bay Area Toll Authority California Toll Bridge Revenue (San Francisco Bay Area) | | 5.000% | | 4/1/28 | | | 5,030 | | 5,495 | |
| Bay Area Toll Authority California Toll Bridge Revenue (San Francisco Bay Area) | | 4.000% | | 4/1/29 | | | 15,535 | | 16,873 | |
| Bay Area Toll Authority California Toll Bridge Revenue (San Francisco Bay Area) | | 5.000% | | 4/1/29 | | | 7,100 | | 7,738 | |
| Bay Area Toll Authority California Toll Bridge Revenue (San Francisco Bay Area) | | 4.000% | | 4/1/30 | | | 13,000 | | 14,023 | |
| Bay Area Toll Authority California Toll Bridge Revenue (San Francisco Bay Area) | | 5.000% | | 4/1/30 | | | 16,700 | | 18,167 | |
| Bay Area Toll Authority California Toll Bridge Revenue (San Francisco Bay Area) | | 4.000% | | 4/1/31 | | | 2,220 | | 2,380 | |
| Bay Area Toll Authority California Toll Bridge Revenue (San Francisco Bay Area) | | 4.000% | | 4/1/31 | | | 4,000 | | 4,142 | |
| Bay Area Toll Authority California Toll Bridge Revenue (San Francisco Bay Area) | | 4.000% | | 4/1/34 | | | 25,395 | | 26,698 | |
| Bay Area Toll Authority California Toll Bridge Revenue (San Francisco Bay Area) | | 4.000% | | 4/1/35 | | | 22,770 | | 23,788 | |
| Bay Area Toll Authority California Toll Bridge Revenue (San Francisco Bay Area) | | 4.000% | | 4/1/37 | | | 33,750 | | 34,964 | |
| Bay Area Toll Authority California Toll Bridge Revenue (San Francisco Bay Area) | | 4.000% | | 4/1/38 | | | 9,050 | | 9,313 | |
| Bay Area Toll Authority California Toll Bridge Revenue (San Francisco Bay Area) PUT | | 1.375% | | 4/1/20 | | | 11,000 | | 10,925 | |
| Bay Area Toll Authority California Toll Bridge Revenue (San Francisco Bay Area) PUT | | 1.875% | | 4/1/20 | | | 25,000 | | 24,992 | |
| Bay Area Toll Authority California Toll Bridge Revenue (San Francisco Bay Area) PUT | | 2.000% | | 4/1/21 | | | 39,590 | | 39,476 | |
2 | Bay Area Toll Authority California Toll Bridge Revenue (San Francisco Bay Area) PUT | | 2.390% | | 4/1/21 | | | 20,500 | | 20,604 | |
2 | Bay Area Toll Authority California Toll Bridge Revenue (San Francisco Bay Area) PUT | | 2.590% | | 5/1/23 | | | 19,000 | | 19,278 | |
2 | Bay Area Toll Authority California Toll Bridge Revenue (San Francisco Bay Area) PUT | | 2.590% | | 5/1/23 | | | 4,350 | | 4,414 | |
| Bay Area Toll Authority California Toll Bridge Revenue (San Francisco Bay Area) PUT | | 2.000% | | 4/1/24 | | | 33,140 | | 32,432 | |
2 | Bay Area Toll Authority California Toll Bridge Revenue (San Francisco Bay Area) PUT | | 2.790% | | 4/1/24 | | | 6,100 | | 6,250 | |
| Bay Area Toll Authority California Toll Bridge Revenue (San Francisco Bay Area) PUT | | 2.125% | | 4/1/25 | | | 48,500 | | 46,754 | |
40
California Intermediate-Term Tax-Exempt Fund
| | | | | | | | Face | | Market | |
| | | | | Maturity | | | Amount | | Value· | |
| | | Coupon | | Date | | | ($000 | ) | ($000 | ) |
| Bay Area Toll Authority California Toll Bridge Revenue (San Francisco Bay Area) PUT | | 2.850% | | 4/1/25 | | | 11,250 | | 11,466 | |
| Bay Area Toll Authority California Toll Bridge Revenue (San Francisco Bay Area) PUT | | 2.950% | | 4/1/26 | | | 1,075 | | 1,087 | |
| Beaumont CA Public Improvement Wastewater Revenue | | 5.000% | | 9/1/24 | (4) | | 300 | | 347 | |
| Beaumont CA Public Improvement Wastewater Revenue | | 5.000% | | 9/1/26 | (4) | | 685 | | 818 | |
| Beaumont CA Public Improvement Wastewater Revenue | | 5.000% | | 9/1/28 | (4) | | 1,000 | | 1,181 | |
| Beaumont CA Public Improvement Wastewater Revenue | | 5.000% | | 9/1/29 | (4) | | 800 | | 941 | |
| Beaumont CA Public Improvement Wastewater Revenue | | 3.000% | | 9/1/31 | (4) | | 1,100 | | 1,076 | |
| Beaumont CA Public Improvement Wastewater Revenue | | 5.000% | | 9/1/32 | (4) | | 1,460 | | 1,692 | |
| Beaumont CA Public Improvement Wastewater Revenue | | 3.250% | | 9/1/34 | (4) | | 1,000 | | 983 | |
| Beaumont CA Public Improvement Wastewater Revenue | | 5.000% | | 9/1/35 | (4) | | 835 | | 959 | |
| Beaumont CA Public Improvement Wastewater Revenue | | 3.375% | | 9/1/36 | (4) | | 1,600 | | 1,570 | |
| Beaumont CA Public Improvement Wastewater Revenue | | 5.000% | | 9/1/37 | (4) | | 1,350 | | 1,541 | |
| Beaumont CA Public Improvement Wastewater Revenue | | 5.000% | | 9/1/38 | (4) | | 1,350 | | 1,537 | |
| Brea CA Redevelopment Agency Successor Agency Tax Allocation Revenue (Redevelopment Project AB) | | 5.000% | | 8/1/21 | | | 5,500 | | 5,947 | |
| Brea CA Redevelopment Agency Successor Agency Tax Allocation Revenue (Redevelopment Project AB) | | 5.000% | | 8/1/24 | | | 5,110 | | 5,780 | |
| Brea CA Redevelopment Agency Successor Agency Tax Allocation Revenue (Redevelopment Project AB) | | 0.000% | | 8/1/29 | (2) | | 3,065 | | 2,129 | |
| Brentwood CA Infrastructure Financing Authority Revenue | | 5.000% | | 9/2/24 | (4) | | 1,000 | | 1,154 | |
| Brentwood CA Infrastructure Financing Authority Revenue | | 5.000% | | 9/2/25 | (4) | | 1,445 | | 1,659 | |
| Brentwood CA Infrastructure Financing Authority Revenue | | 5.000% | | 9/2/26 | (4) | | 2,000 | | 2,285 | |
| Brentwood CA Infrastructure Financing Authority Revenue | | 5.000% | | 9/2/27 | (4) | | 2,375 | | 2,708 | |
| Brentwood CA Infrastructure Financing Authority Revenue | | 5.000% | | 9/2/29 | (4) | | 1,240 | | 1,403 | |
| Brentwood CA Infrastructure Financing Authority Revenue | | 5.000% | | 9/2/30 | (4) | | 750 | | 844 | |
| Brentwood CA Infrastructure Financing Authority Water Revenue | | 5.000% | | 7/1/23 | | | 400 | | 455 | |
| Brentwood CA Infrastructure Financing Authority Water Revenue | | 5.000% | | 7/1/24 | | | 510 | | 591 | |
| Brentwood CA Infrastructure Financing Authority Water Revenue | | 5.000% | | 7/1/25 | | | 510 | | 588 | |
41
California Intermediate-Term Tax-Exempt Fund
| | | | | | | | Face | | Market | |
| | | | | Maturity | | | Amount | | Value· | |
| | | Coupon | | Date | | | ($000 | ) | ($000 | ) |
| Brentwood CA Infrastructure Financing Authority Water Revenue | | 4.000% | | 7/1/ 30 | | | 1,700 | | 1,776 | |
| Brentwood CA Infrastructure Financing Authority Water Revenue | | 4.000% | | 7/1/31 | | | 1,980 | | 2,063 | |
| Brentwood CA Infrastructure Financing Authority Water Revenue | | 4.000% | | 7/1/32 | | | 2,085 | | 2,158 | |
| Brentwood CA Infrastructure Financing Authority Water Revenue | | 4.000% | | 7/1/33 | | | 2,165 | | 2,229 | |
| Brentwood CA Infrastructure Financing Authority Water Revenue | | 4.000% | | 7/1/34 | | | 2,210 | | 2,264 | |
| Burbank CA Redevelopment Agency Tax Allocation Revenue | | 5.000% | | 12/1/20 | (15) | | 1,610 | | 1,712 | |
| Burbank CA Redevelopment Agency Tax Allocation Revenue | | 5.000% | | 12/1/21 | (15) | | 1,350 | | 1,472 | |
| Burbank CA Unified School District GO | | 0.000% | | 8/1/20 | (14) | | 3,835 | | 3,706 | |
3 | Burbank CA Unified School District GO | | 0.000% | | 8/1/32 | | | 3,655 | | 3,241 | |
1 | CA Statewide Communities Development Authority (John Muir Health) TOB VRDO | | 1.790% | | 12/7/18 | | | 4,875 | | 4,875 | |
| California Community College Financing Authority Revenue (NCCD-Orange Coast Properties LLC) | | 5.000% | | 5/1/21 | | | 265 | | 279 | |
| California Community College Financing Authority Revenue (NCCD-Orange Coast Properties LLC) | | 5.000% | | 5/1/22 | | | 1,000 | | 1,068 | |
| California Community College Financing Authority Revenue (NCCD-Orange Coast Properties LLC) | | 5.000% | | 5/1/24 | | | 535 | | 584 | |
| California Community College Financing Authority Revenue (NCCD-Orange Coast Properties LLC) | | 5.000% | | 5/1/25 | | | 150 | | 165 | |
| California Community College Financing Authority Revenue (NCCD-Orange Coast Properties LLC) | | 5.000% | | 5/1/28 | | | 1,635 | | 1,829 | |
| California Community College Financing Authority Revenue (NCCD-Orange Coast Properties LLC) | | 5.000% | | 5/1/30 | | | 940 | | 1,039 | |
| California Community College Financing Authority Revenue (NCCD-Orange Coast Properties LLC) | | 5.000% | | 5/1/32 | | | 875 | | 960 | |
| California Community College Financing Authority Revenue (NCCD-Orange Coast Properties LLC) | | 5.000% | | 5/1/33 | | | 600 | | 655 | |
| California Community College Financing Authority Revenue (NCCD-Orange Coast Properties LLC) | | 5.000% | | 5/1/34 | | | 800 | | 869 | |
| California Community College Financing Authority Revenue (NCCD-Orange Coast Properties LLC) | | 5.000% | | 5/1/36 | | | 1,600 | | 1,720 | |
| California Community College Financing Authority Revenue (NCCD-Orange Coast Properties LLC) | | 5.000% | | 5/1/38 | | | 1,500 | | 1,607 | |
| California County CA Tobacco Securitization Agency Revenue | | 5.000% | | 6/1/21 | | | 1,300 | | 1,371 | |
42
California Intermediate-Term Tax-Exempt Fund
| | | | | | | | Face | | Market | |
| | | | | Maturity | | | Amount | | Value· | |
| | | Coupon | | Date | | | ($000 | ) | ($000 | ) |
| California County CA Tobacco Securitization Agency Revenue | | 5.250% | | 6/1/21 | | | 7,595 | | 7,604 | |
| California County CA Tobacco Securitization Agency Revenue | | 5.000% | | 6/1/22 | | | 1,000 | | 1,072 | |
| California County CA Tobacco Securitization Agency Revenue | | 5.000% | | 6/1/23 | | | 2,400 | | 2,606 | |
| California County CA Tobacco Securitization Agency Revenue | | 5.000% | | 6/1/24 | | | 3,840 | | 4,206 | |
| California Department of Veterans Affairs Home Purchase Revenue | | 3.500% | | 12/1/45 | | | 4,305 | | 4,419 | |
| California Department of Water Resources Power Supply Revenue | | 5.000% | | 5/1/19 | | | 1,215 | | 1,232 | |
| California Department of Water Resources Power Supply Revenue | | 5.000% | | 5/1/20 | (Prere.) | | 3,100 | | 3,243 | |
| California Department of Water Resources Power Supply Revenue | | 5.000% | | 5/1/20 | | | 24,410 | | 25,522 | |
| California Department of Water Resources Power Supply Revenue | | 5.000% | | 5/1/21 | | | 15,305 | | 16,487 | |
| California Department of Water Resources Power Supply Revenue | | 5.000% | | 5/1/21 | | | 1,755 | | 1,836 | |
| California Department of Water Resources Power Supply Revenue | | 5.000% | | 5/1/21 | | | 6,510 | | 7,013 | |
| California Department of Water Resources Power Supply Revenue | | 5.000% | | 5/1/22 | | | 20,000 | | 22,114 | |
| California Department of Water Resources Power Supply Revenue | | 5.000% | | 5/1/22 | | | 4,145 | | 4,333 | |
| California Department of Water Resources Water System Revenue (Central Valley Project) | | 5.000% | | 12/1/19 | (Prere.) | | 7,960 | | 8,224 | |
| California Department of Water Resources Water System Revenue (Central Valley Project) | | 5.000% | | 12/1/19 | | | 2,065 | | 2,135 | |
| California Department of Water Resources Water System Revenue (Central Valley Project) | | 5.000% | | 12/1/19 | (Prere.) | | 840 | | 868 | |
| California Department of Water Resources Water System Revenue (Central Valley Project) | | 5.000% | | 12/1/19 | (ETM) | | 10 | | 10 | |
| California Department of Water Resources Water System Revenue (Central Valley Project) | | 5.000% | | 12/1/20 | | | 1,220 | | 1,300 | |
| California Department of Water Resources Water System Revenue (Central Valley Project) | | 5.000% | | 12/1/20 | (ETM) | | 30 | | 32 | |
| California Department of Water Resources ater System Revenue (Central Valley Project) | | 5.250% | | 12/1/20 | (Prere.) | | 1,850 | | 1,978 | |
| California Department of Water Resources Water System Revenue (Central Valley Project) | | 5.250% | | 12/1/20 | (Prere.) | | 2,905 | | 3,100 | |
| California Department of Water Resources Water System Revenue (Central Valley Project) | | 5.250% | | 12/1/20 | (Prere.) | | 3,355 | | 3,580 | |
| California Department of Water Resources Water System Revenue (Central Valley Project) | | 5.250% | | 12/1/20 | (Prere.) | | 3,455 | | 3,686 | |
| California Department of Water Resources Water System Revenue (Central Valley Project) | | 5.250% | | 12/1/20 | (Prere.) | | 25 | | 27 | |
| California Department of Water Resources Water System Revenue (Central Valley Project) | | 5.250% | | 12/1/20 | (Prere.) | | 30 | | 32 | |
| California Department of Water Resources Water System Revenue (Central Valley Project) | | 5.250% | | 12/1/20 | (Prere.) | | 30 | | 32 | |
| California Department of Water Resources Water System Revenue (Central Valley Project) | | 5.250% | | 12/1/20 | (Prere.) | | 970 | | 1,037 | |
43
California Intermediate-Term Tax-Exempt Fund
| | | | | | | | Face | | Market | |
| | | | | Maturity | | | Amount | | Value· | |
| | | Coupon | | Date | | | ($000 | ) | ($000 | ) |
| California Department of Water Resources Water System Revenue (Central Valley Project) | | 5.250% | | 12/1/20 | (Prere.) | | 1,120 | | 1,197 | |
| California Department of Water Resources Water System Revenue (Central Valley Project) | | 5.250% | | 12/1/20 | (Prere.) | | 1,155 | | 1,235 | |
| California Department of Water Resources Water System Revenue (Central Valley Project) | | 5.000% | | 12/1/21 | | | 4,600 | | 5,037 | |
| California Department of Water Resources Water System Revenue (Central Valley Project) | | 5.000% | | 12/1/21 | | | 2,410 | | 2,639 | |
| California Department of Water Resources Water System Revenue (Central Valley Project) | | 5.000% | | 12/1/21 | (Prere.) | | 3,320 | | 3,614 | |
| California Department of Water Resources Water System Revenue (Central Valley Project) | | 5.000% | | 12/1/21 | (Prere.) | | 3,500 | | 3,810 | |
| California Department of Water Resources Water System Revenue (Central Valley Project) | | 5.000% | | 12/1/21 | | | 3,430 | | 3,756 | |
| California Department of Water Resources Water System Revenue (Central Valley Project) | | 5.000% | | 12/1/21 | (ETM) | | 1,045 | | 1,139 | |
| California Department of Water Resources Water System Revenue (Central Valley Project) | | 5.000% | | 12/1/21 | (Prere.) | | 2,720 | | 2,973 | |
| California Department of Water Resources Water System Revenue (Central Valley Project) | | 5.000% | | 12/1/21 | (Prere.) | | 3,910 | | 4,274 | |
| California Department of Water Resources Water System Revenue (Central Valley Project) | | 5.000% | | 12/1/22 | (Prere.) | | 505 | | 563 | |
| California Department of Water Resources Water System Revenue (Central Valley Project) | | 5.000% | | 12/1/22 | | | 4,895 | | 5,498 | |
| California Department of Water Resources Water System Revenue (Central Valley Project) | | 5.000% | | 12/1/22 | | | 3,000 | | 3,370 | |
| California Department of Water Resources Water System Revenue (Central Valley Project) | | 5.000% | | 12/1/22 | (ETM) | | 1,105 | | 1,233 | |
| California Department of Water Resources Water System Revenue (Central Valley Project) | | 5.000% | | 12/1/23 | (ETM) | | 55 | | 63 | |
| California Department of Water Resources Water System Revenue (Central Valley Project) | | 5.000% | | 12/1/23 | | | 1,450 | | 1,662 | |
| California Department of Water Resources Water System Revenue (Central Valley Project) | | 5.000% | | 12/1/24 | (ETM) | | 30 | | 35 | |
| California Department of Water Resources Water System Revenue (Central Valley Project) | | 5.000% | | 12/1/24 | (Prere.) | | 5 | | 6 | |
| California Department of Water Resources Water System Revenue (Central Valley Project) | | 5.000% | | 12/1/24 | (Prere.) | | 10 | | 12 | |
| California Department of Water Resources Water System Revenue (Central Valley Project) | | 5.000% | | 12/1/24 | | | 2,365 | | 2,768 | |
| California Department of Water Resources Water System Revenue (Central Valley Project) | | 5.000% | | 12/1/25 | | | 3,025 | | 3,610 | |
| California Department of Water Resources Water System Revenue (Central Valley Project) | | 5.000% | | 12/1/26 | | | 2,045 | | 2,389 | |
| California Department of Water Resources Water System Revenue (Central Valley Project) | | 5.000% | | 12/1/26 | | | 3,010 | | 3,653 | |
| California Department of Water Resources Water System Revenue (Central Valley Project) | | 5.000% | | 12/1/27 | | | 4,065 | | 4,736 | |
| California Department of Water Resources Water System Revenue (Central Valley Project) | | 5.000% | | 12/1/27 | | | 2,985 | | 3,669 | |
| California Department of Water Resources Water System Revenue (Central Valley Project) | | 5.000% | | 12/1/28 | | | 30 | | 33 | |
| California Department of Water Resources Water System Revenue (Central Valley Project) | | 5.000% | | 12/1/28 | | | 625 | | 762 | |
44
California Intermediate-Term Tax-Exempt Fund
| | | | | | | | Face | | Market | |
| | | | | Maturity | | | Amount | | Value· | |
| | | Coupon | | Date | | | ($000 | ) | ($000 | ) |
| California Department of Water Resources Water System Revenue (Central Valley Project) | | 5.000% | | 12/1/29 | | | 7,750 | | 8,579 | |
| California Department of Water Resources Water System Revenue (Central Valley Project) | | 5.000% | | 12/1/29 | | | 30 | | 33 | |
| California Department of Water Resources Water System Revenue (Central Valley Project) | | 5.000% | | 12/1/29 | | | 1,045 | | 1,266 | |
| California Department of Water Resources Water System Revenue (Central Valley Project) | | 5.000% | | 12/1/30 | | | 2,655 | | 3,175 | |
| California Department of Water Resources Water System Revenue (Central Valley Project) | | 4.000% | | 12/1/33 | | | 6,900 | | 7,344 | |
| California Department of Water Resources Water System Revenue (Central Valley Project) | | 5.000% | | 12/1/34 | | | 560 | | 656 | |
| California Department of Water Resources Water System Revenue (Central Valley Project) | | 5.000% | | 12/1/35 | | | 1,045 | | 1,219 | |
| California Economic Recovery GO | | 5.000% | | 7/1/19 | (Prere.) | | 43,745 | | 44,608 | |
| California Economic Recovery GO | | 5.250% | | 7/1/19 | (Prere.) | | 28,845 | | 29,455 | |
| California Economic Recovery GO | | 5.250% | | 7/1/19 | (Prere.) | | 16,540 | | 16,890 | |
| California Educational Facilities Authority Revenue (Art Center College of Design) | | 5.000% | | 12/1/22 | | | 400 | | 442 | |
| California Educational Facilities Authority Revenue (Art Center College of Design) | | 5.000% | | 12/1/24 | | | 450 | | 512 | |
| California Educational Facilities Authority Revenue (Art Center College of Design) | | 5.000% | | 12/1/26 | | | 505 | | 586 | |
| California Educational Facilities Authority Revenue (Art Center College of Design) | | 5.000% | | 12/1/27 | | | 380 | | 444 | |
| California Educational Facilities Authority Revenue (Art Center College of Design) | | 5.000% | | 12/1/28 | | | 375 | | 441 | |
| California Educational Facilities Authority Revenue (Art Center College of Design) | | 5.000% | | 12/1/29 | | | 365 | | 426 | |
| California Educational Facilities Authority Revenue (Art Center College of Design) | | 5.000% | | 12/1/30 | | | 530 | | 615 | |
| California Educational Facilities Authority Revenue (Art Center College of Design) | | 5.000% | | 12/1/31 | | | 1,330 | | 1,538 | |
| California Educational Facilities Authority Revenue (Art Center College of Design) | | 5.000% | | 12/1/32 | | | 1,420 | | 1,636 | |
| California Educational Facilities Authority Revenue (Art Center College of Design) | | 5.000% | | 12/1/34 | | | 1,210 | | 1,381 | |
| California Educational Facilities Authority Revenue (Art Center College of Design) | | 5.000% | | 12/1/35 | | | 1,335 | | 1,517 | |
| California Educational Facilities Authority Revenue (Art Center College of Design) | | 5.000% | | 12/1/37 | | | 1,265 | | 1,426 | |
| California Educational Facilities Authority Revenue (Claremont McKenna College) | | 4.000% | | 1/1/19 | | | 1,085 | | 1,087 | |
| California Educational Facilities Authority Revenue (Claremont McKenna College) | | 4.000% | | 1/1/20 | | | 1,040 | | 1,066 | |
| California Educational Facilities Authority Revenue (Claremont McKenna College) | | 4.000% | | 1/1/21 | | | 800 | | 837 | |
| California Educational Facilities Authority Revenue (Claremont McKenna College) | | 4.000% | | 1/1/22 | | | 1,215 | | 1,295 | |
| California Educational Facilities Authority Revenue (Claremont McKenna College) | | 4.000% | | 1/1/23 | | | 1,800 | | 1,949 | |
| California Educational Facilities Authority Revenue (Claremont McKenna College) | | 4.000% | | 1/1/24 | | | 1,900 | | 2,087 | |
45
California Intermediate-Term Tax-Exempt Fund
| | | | | | | | Face | | Market | |
| | | | | Maturity | | | Amount | | Value· | |
| | | Coupon | | Date | | | ($000 | ) | ($000 | ) |
| California Educational Facilities Authority Revenue (Claremont McKenna College) | | 4.000% | | 1/1/25 | | | 1,035 | | 1,149 | |
| California Educational Facilities Authority Revenue (Claremont McKenna College) | | 5.000% | | 1/1/26 | | | 1,020 | | 1,210 | |
| California Educational Facilities Authority Revenue (Claremont McKenna College) | | 5.000% | | 1/1/ 30 | | | 1,765 | | 2,044 | |
| California Educational Facilities Authority Revenue (Claremont McKenna College) | | 5.000% | | 1/1/31 | | | 1,895 | | 2,188 | |
| California Educational Facilities Authority Revenue (Claremont McKenna College) | | 5.000% | | 1/1/32 | | | 2,000 | | 2,300 | |
| California Educational Facilities Authority Revenue (Claremont McKenna College) | | 4.000% | | 1/1/33 | | | 3,590 | | 3,754 | |
| California Educational Facilities Authority Revenue (Claremont McKenna College) | | 4.000% | | 1/1/34 | | | 3,350 | | 3,489 | |
| California Educational Facilities Authority Revenue (College of Arts) | | 5.000% | | 6/1/20 | | | 790 | | 823 | |
| California Educational Facilities Authority Revenue (College of Arts) | | 5.000% | | 6/1/23 | | | 1,195 | | 1,290 | |
| California Educational Facilities Authority Revenue (College of Arts) | | 5.000% | | 6/1/24 | | | 380 | | 408 | |
| California Educational Facilities Authority Revenue (College of Arts) | | 5.250% | | 6/1/30 | | | 1,150 | | 1,239 | |
| California Educational Facilities Authority Revenue (Loyola Marymount University) | | 0.000% | | 10/1/36 | (14) | | 4,585 | | 2,251 | |
| California Educational Facilities Authority Revenue (Mount St. Mary’s University) | | 5.000% | | 10/1/24 | | | 180 | | 207 | |
| California Educational Facilities Authority Revenue (Mount St. Mary’s University) | | 5.000% | | 10/1/25 | | | 110 | | 129 | |
| California Educational Facilities Authority Revenue (Mount St. Mary’s University) | | 5.000% | | 10/1/26 | | | 110 | | 130 | |
| California Educational Facilities Authority Revenue (Mount St. Mary’s University) | | 5.000% | | 10/1/28 | | | 300 | | 360 | |
| California Educational Facilities Authority Revenue (Mount St. Mary’s University) | | 5.000% | | 10/1/31 | | | 850 | | 995 | |
| California Educational Facilities Authority Revenue (Mount St. Mary’s University) | | 5.000% | | 10/1/32 | | | 445 | | 519 | |
| California Educational Facilities Authority Revenue (Mount St. Mary’s University) | | 5.000% | | 10/1/37 | | | 885 | | 1,004 | |
| California Educational Facilities Authority Revenue (Mount St. Mary’s University) | | 5.000% | | 10/1/38 | | | 620 | | 700 | |
| California Educational Facilities Authority Revenue (Occidental College) | | 4.000% | | 10/1/19 | | | 200 | | 204 | |
| California Educational Facilities Authority Revenue (Occidental College) | | 5.000% | | 10/1/20 | | | 290 | | 307 | |
| California Educational Facilities Authority Revenue (Occidental College) | | 5.000% | | 10/1/21 | | | 145 | | 158 | |
| California Educational Facilities Authority Revenue (Occidental College) | | 5.000% | | 10/1/22 | | | 125 | | 139 | |
| California Educational Facilities Authority Revenue (Occidental College) | | 5.000% | | 10/1/23 | | | 130 | | 148 | |
| California Educational Facilities Authority Revenue (Occidental College) | | 5.000% | | 10/1/24 | | | 340 | | 395 | |
| California Educational Facilities Authority Revenue (Occidental College) | | 5.000% | | 10/1/26 | | | 260 | | 306 | |
46
California Intermediate-Term Tax-Exempt Fund
| | | | | | | | Face | | Market | |
| | | | | Maturity | | | Amount | | Value· | |
| | | Coupon | | Date | | | ($000 | ) | ($000 | ) |
| California Educational Facilities Authority Revenue (Occidental College) | | 5.000% | | 10/1/27 | | | 250 | | 293 | |
| California Educational Facilities Authority Revenue (Santa Clara University) | | 5.000% | | 4/1/28 | | | 300 | | 357 | |
| California Educational Facilities Authority Revenue (Santa Clara University) | | 5.000% | | 4/1/29 | | | 390 | | 461 | |
| California Educational Facilities Authority Revenue (Santa Clara University) | | 5.000% | | 4/1/30 | | | 485 | | 570 | |
| California Educational Facilities Authority Revenue (Santa Clara University) | | 5.000% | | 4/1/31 | | | 1,030 | | 1,177 | |
| California Educational Facilities Authority Revenue (Santa Clara University) | | 5.000% | | 4/1/31 | | | 555 | | 650 | |
| California Educational Facilities Authority Revenue (Santa Clara University) | | 5.000% | | 4/1/32 | | | 1,000 | | 1,139 | |
| California Educational Facilities Authority Revenue (Santa Clara University) | | 5.000% | | 4/1/33 | | | 1,545 | | 1,754 | |
| California Educational Facilities Authority Revenue (Santa Clara University) | | 5.000% | | 4/1/33 | | | 775 | | 901 | |
| California Educational Facilities Authority Revenue (Santa Clara University) | | 5.000% | | 4/1/34 | | | 2,625 | | 2,969 | |
| California Educational Facilities Authority evenue (Santa Clara University) | | 5.000% | | 4/1/34 | | | 905 | | 1,047 | |
| California Educational Facilities Authority Revenue (Santa Clara University) | | 5.000% | | 4/1/35 | | | 3,180 | | 3,585 | |
| California Educational Facilities Authority Revenue (Santa Clara University) | | 5.000% | | 4/1/35 | | | 430 | | 494 | |
| California Educational Facilities Authority Revenue (Santa Clara University) | | 5.000% | | 4/1/36 | | | 1,120 | | 1,281 | |
| California Educational Facilities Authority Revenue (Santa Clara University) | | 5.000% | | 4/1/37 | | | 530 | | 605 | |
| California Educational Facilities Authority Revenue (University of Southern California) | | 5.000% | | 10/1/25 | | | 5,125 | | 6,069 | |
| California Educational Facilities Authority Revenue (University of the Pacific) | | 5.000% | | 11/1/20 | | | 1,770 | | 1,876 | |
| California Educational Facilities Authority Revenue (University of the Pacific) | | 5.000% | | 11/1/21 | | | 2,100 | | 2,285 | |
| California Educational Facilities Authority Revenue (University of the Pacific) | | 5.000% | | 11/1/22 | | | 2,130 | | 2,371 | |
| California Educational Facilities Authority Revenue (University of the Pacific) | | 5.000% | | 11/1/23 | | | 1,870 | | 2,125 | |
| California Educational Facilities Authority Revenue (University of the Pacific) | | 5.000% | | 11/1/24 | | | 2,500 | | 2,890 | |
| California Educational Facilities Authority Revenue (University of the Pacific) | | 5.000% | | 11/1/25 | | | 2,365 | | 2,771 | |
| California Educational Facilities Authority Revenue (University of the Pacific) | | 5.000% | | 11/1/31 | | | 1,005 | | 1,140 | |
| California GO | | 6.500% | | 4/1/19 | (Prere.) | | 12,300 | | 12,497 | |
| California GO | | 4.000% | | 9/1/19 | | | 2,100 | | 2,137 | |
| California GO | | 5.000% | | 10/1/19 | | | 21,000 | | 21,586 | |
| California GO | | 5.000% | | 2/1/20 | | | 2,950 | | 3,062 | |
| California GO | | 5.250% | | 2/1/20 | | | 7,500 | | 7,807 | |
| California GO | | 5.000% | | 9/1/20 | | | 4,445 | | 4,692 | |
| California GO | | 5.000% | | 9/1/20 | | | 3,690 | | 3,895 | |
| California GO | | 5.000% | | 10/1/20 | | | 5,555 | | 5,877 | |
47
California Intermediate-Term Tax-Exempt Fund
| | | | | | | | Face | | Market | |
| | | | | Maturity | | | Amount | | Value· | |
| | | Coupon | | Date | | | ($000 | ) | ($000 | ) |
| California GO | | 5.250% | | 10/1/20 | | | 4,500 | | 4,634 | |
| California GO | | 5.000% | | 2/1/21 | | | 2,000 | | 2,134 | |
| California GO | | 5.000% | | 3/1/21 | | | 2,250 | | 2,338 | |
| California GO | | 5.000% | | 4/1/21 | | | 2,240 | | 2,400 | |
| California GO | | 5.500% | | 4/1/21 | | | 2,055 | | 2,080 | |
| California GO | | 5.000% | | 9/1/21 | | | 9,800 | | 10,616 | |
| California GO | | 5.000% | | 9/1/21 | | | 13,715 | | 14,856 | |
| California GO | | 5.000% | | 9/1/21 | | | 1,310 | | 1,419 | |
| California GO | | 5.000% | | 10/1/21 | | | 64,130 | | 69,612 | |
| California GO | | 5.000% | | 10/1/21 | | | 2,575 | | 2,795 | |
| California GO | | 5.000% | | 11/1/21 | | | 2,820 | | 3,067 | |
| California GO | | 5.000% | | 2/1/22 | | | 8,155 | | 8,910 | |
| California GO | | 5.000% | | 2/1/22 | | | 1,210 | | 1,322 | |
| California GO | | 5.000% | | 4/1/22 | | | 4,550 | | 4,991 | |
| California GO | | 5.000% | | 9/1/22 | | | 12,710 | | 14,077 | |
| California GO | | 5.000% | | 9/1/22 | | | 9,525 | | 10,550 | |
| California GO | | 5.250% | | 9/1/22 | | | 17,450 | | 19,484 | |
| California GO | | 5.000% | | 10/1/22 | | | 15,000 | | 16,645 | |
| California GO | | 5.000% | | 10/1/22 | | | 50,120 | | 55,617 | |
| California GO | | 5.000% | | 11/1/22 | | | 31,890 | | 35,454 | |
| California GO | | 5.000% | | 2/1/23 | | | 15,925 | | 17,450 | |
| California GO | | 5.000% | | 2/1/23 | | | 15,020 | | 16,777 | |
| California GO | | 5.000% | | 8/1/23 | | | 11,055 | | 12,478 | |
| California GO | | 5.000% | | 8/1/23 | | | 3,350 | | 3,781 | |
| California GO | | 5.000% | | 9/1/23 | | | 10,160 | | 11,487 | |
| California GO | | 5.000% | | 9/1/23 | | | 7,110 | | 7,897 | |
| California GO | | 5.250% | | 9/1/23 | | | 2,550 | | 2,776 | |
| California GO | | 5.000% | | 10/1/23 | | | 12,580 | | 14,246 | |
| California GO | | 5.000% | | 10/1/23 | | | 3,225 | | 3,652 | |
| California GO | | 5.000% | | 10/1/23 | | | 875 | | 991 | |
| California GO | | 5.000% | | 10/1/23 | | | 15,725 | | 17,808 | |
| California GO | | 5.000% | | 11/1/23 | | | 20,000 | | 22,687 | |
| California GO | | 5.000% | | 11/1/23 | | | 2,280 | | 2,586 | |
| California GO | | 5.000% | | 2/1/24 | | | 11,215 | | 12,513 | |
| California GO | | 5.000% | | 3/1/24 | | | 3,000 | | 3,115 | |
| California GO | | 5.000% | | 8/1/24 | | | 1,025 | | 1,178 | |
| California GO | | 5.000% | | 8/1/24 | | | 1,495 | | 1,718 | |
| California GO | | 5.000% | | 9/1/24 | | | 10,000 | | 11,087 | |
| California GO | | 5.000% | | 9/1/24 | | | 1,105 | | 1,271 | |
| California GO | | 5.000% | | 10/1/24 | | | 8,725 | | 10,052 | |
| California GO | | 5.000% | | 11/1/24 | | | 5,000 | | 5,292 | |
| California GO | | 5.000% | | 11/1/24 | | | 1,900 | | 2,192 | |
| California GO | | 5.000% | | 12/1/24 | | | 30,875 | | 35,033 | |
| California GO | | 5.000% | | 2/1/25 | | | 12,950 | | 14,149 | |
| California GO | | 4.000% | | 3/1/25 | | | 1,485 | | 1,636 | |
| California GO | | 5.000% | | 8/1/25 | | | 12,430 | | 14,516 | |
| California GO | | 5.000% | | 8/1/25 | | | 10,185 | | 11,894 | |
| California GO | | 5.000% | | 8/1/25 | | | 1,520 | | 1,775 | |
| California GO | | 5.000% | | 9/1/25 | | | 2,185 | | 2,419 | |
| California GO | | 5.000% | | 9/1/25 | | | 4,865 | | 5,689 | |
| California GO | | 5.000% | | 9/1/25 | | | 2,190 | | 2,471 | |
| California GO | | 5.000% | | 10/1/25 | | | 13,865 | | 15,487 | |
| California GO | | 5.000% | | 10/1/25 | | | 13,955 | | 16,341 | |
| California GO | | 5.000% | | 11/1/25 | | | 14,205 | | 16,371 | |
48
California Intermediate-Term Tax-Exempt Fund
| | | | | | | | Face | | Market | |
| | | | | Maturity | | | Amount | | Value· | |
| | | Coupon | | Date | | | ($000 | ) | ($000 | ) |
| California GO | | 5.000% | | 11/1/25 | | | 1,520 | | 1,608 | |
| California GO | | 5.000% | | 11/1/25 | | | 12,000 | | 14,071 | |
| California GO | | 5.000% | | 3/1/26 | | | 5,000 | | 5,189 | |
| California GO | | 5.000% | | 8/1/26 | | | 20,000 | | 23,603 | |
| California GO | | 5.000% | | 8/1/26 | | | 20,480 | | 24,169 | |
| California GO | | 5.000% | | 8/1/26 | | | 18,265 | | 21,555 | |
| California GO | | 5.000% | | 9/1/26 | | | 5,455 | | 6,445 | |
| California GO | | 5.000% | | 10/1/26 | | | 10,045 | | 11,773 | |
| California GO | | 4.000% | | 11/1/26 | | | 2,440 | | 2,714 | |
| California GO | | 5.000% | | 11/1/26 | | | 7,500 | | 7,934 | |
| California GO | | 5.000% | | 11/1/26 | | | 9,160 | | 10,846 | |
| California GO | | 5.750% | | 4/1/27 | | | 31,455 | | 31,844 | |
| California GO | | 3.500% | | 8/1/27 | | | 26,345 | | 28,376 | |
| California GO | | 5.000% | | 8/1/27 | | | 20,385 | | 23,926 | |
| California GO | | 5.000% | | 10/1/27 | | | 13,915 | | 15,458 | |
| California GO | | 5.000% | | 10/1/27 | | | 8,175 | | 9,531 | |
| California GO | | 5.250% | | 10/1/27 | | | 5,000 | | 5,437 | |
| California GO | | 5.000% | | 11/1/27 | | | 5,100 | | 6,107 | |
| California GO | | 5.750% | | 4/1/28 | | | 30,000 | | 30,369 | |
| California GO | | 5.000% | | 8/1/28 | | | 1,850 | | 2,160 | |
| California GO | | 5.000% | | 8/1/28 | | | 20,240 | | 24,010 | |
| California GO | | 5.000% | | 8/1/28 | | | 6,510 | | 7,477 | |
| California GO | | 4.000% | | 9/1/28 | | | 7,000 | | 7,575 | |
| California GO | | 5.000% | | 9/1/28 | | | 17,535 | | 20,492 | |
| California GO | | 5.250% | | 9/1/28 | | | 6,000 | | 6,497 | |
| California GO | | 5.000% | | 11/1/28 | | | 12,325 | | 14,657 | |
| California GO | | 5.250% | | 2/1/29 | | | 2,790 | | 3,055 | |
| California GO | | 5.000% | | 8/1/29 | | | 7,265 | | 8,447 | |
| California GO | | 5.000% | | 8/1/29 | | | 44,340 | | 51,556 | |
| California GO | | 5.000% | | 9/1/29 | | | 6,000 | | 6,448 | |
| California GO | | 5.000% | | 9/1/29 | | | 9,425 | | 10,971 | |
| California GO | | 5.000% | | 9/1/29 | | | 1,395 | | 1,624 | |
| California GO | | 5.000% | | 10/1/29 | | | 15,000 | | 16,566 | |
| California GO | | 5.000% | | 10/1/29 | | | 18,695 | | 21,605 | |
| California GO | | 5.000% | | 11/1/29 | | | 5,000 | | 5,588 | |
| California GO | | 5.000% | | 11/1/29 | | | 20,820 | | 24,676 | |
| California GO | | 4.500% | | 12/1/29 | | | 2,525 | | 2,773 | |
| California GO | | 5.250% | | 3/1/30 | | | 20,000 | | 20,797 | |
| California GO | | 5.000% | | 5/1/30 | | | 13,870 | | 15,541 | |
| California GO | | 5.000% | | 8/1/30 | | | 19,910 | | 23,060 | |
| California GO | | 5.000% | | 8/1/30 | | | 27,055 | | 31,809 | |
| California GO | | 5.000% | | 8/1/30 | | | 6,530 | | 7,563 | |
| California GO | | 5.000% | | 9/1/30 | | | 9,180 | | 10,476 | |
| California GO | | 5.000% | | 9/1/30 | | | 10,000 | | 10,732 | |
| California GO | | 5.250% | | 9/1/30 | | | 5,000 | | 5,608 | |
| California GO | | 5.000% | | 10/1/30 | | | 5,800 | | 6,543 | |
| California GO | | 4.000% | | 11/1/30 | | | 14,470 | | 15,436 | |
| California GO | | 5.000% | | 11/1/30 | | | 8,740 | | 10,303 | |
| California GO | | 5.000% | | 12/1/30 | | | 3,760 | | 4,195 | |
4 | California GO | | 5.750% | | 4/1/31 | | | 37,030 | | 37,480 | |
| California GO | | 5.000% | | 5/1/31 | | | 13,010 | | 14,536 | |
| California GO | | 5.000% | | 8/1/31 | | | 10,015 | | 11,278 | |
| California GO | | 5.000% | | 8/1/31 | | | 22,275 | | 25,711 | |
| California GO | | 5.250% | | 8/1/31 | | | 5,755 | | 6,632 | |
49
California Intermediate-Term Tax-Exempt Fund
| | | | | | | | Face | | Market | |
| | | | | Maturity | | | Amount | | Value· | |
| | | Coupon | | Date | | | ($000 | ) | ($000 | ) |
| California GO | | 5.000% | | 9/1/31 | | | 7,000 | | 7,509 | |
| California GO | | 5.000% | | 9/1/31 | | | 3,050 | | 3,524 | |
| California GO | | 5.000% | | 10/1/31 | | | 5,500 | | 6,189 | |
| California GO | | 4.000% | | 11/1/31 | | | 15,000 | | 15,919 | |
| California GO | | 5.000% | | 11/1/31 | | | 1,670 | | 1,960 | |
| California GO | | 5.000% | | 12/1/31 | | | 6,000 | | 6,679 | |
| California GO | | 5.000% | | 12/1/31 | | | 6,500 | | 7,337 | |
| California GO | | 5.000% | | 2/1/32 | | | 2,540 | | 2,745 | |
| California GO | | 5.000% | | 8/1/32 | | | 5,000 | | 5,664 | |
| California GO | | 5.000% | | 8/1/32 | | | 25,085 | | 29,226 | |
| California GO | | 5.250% | | 8/1/32 | | | 2,025 | | 2,328 | |
| California GO | | 5.000% | | 9/1/32 | | | 15,070 | | 17,339 | |
| California GO | | 5.000% | | 10/1/32 | | | 23,535 | | 26,430 | |
| California GO | | 4.000% | | 11/1/32 | | | 12,110 | | 12,817 | |
| California GO | | 5.000% | | 2/1/33 | | | 1,750 | | 1,889 | |
| California GO | | 5.000% | | 2/1/33 | | | 1,760 | | 1,922 | |
| California GO | | 5.000% | | 3/1/33 | | | 3,395 | | 3,809 | |
| California GO | | 6.000% | | 3/1/33 | | | 12,000 | | 12,609 | |
| California GO | | 6.500% | | 4/1/33 | | | 10,415 | | 10,568 | |
| California GO | | 4.000% | | 8/1/33 | | | 15,025 | | 15,841 | |
| California GO | | 5.000% | | 8/1/33 | | | 1,170 | | 1,340 | |
| California Go | | 5.000% | | 8/1/33 | | | 3,000 | | 3,481 | |
| California GO | | 5.000% | | 8/1/33 | | | 1,500 | | 1,676 | |
| California GO | | 5.000% | | 9/1/33 | | | 3,830 | | 4,233 | |
| California GO | | 5.000% | | 9/1/33 | | | 25,075 | | 28,741 | |
| California GO | | 4.000% | | 11/1/33 | | | 12,500 | | 13,162 | |
| California GO | | 5.000% | | 12/1/33 | | | 3,120 | | 3,515 | |
| California GO | | 4.000% | | 8/1/34 | | | 18,000 | | 18,888 | |
| California GO | | 5.000% | | 8/1/34 | | | 5,125 | | 5,924 | |
| California GO | | 4.000% | | 9/1/34 | | | 26,055 | | 27,344 | |
| California GO | | 4.000% | | 9/1/34 | | | 4,725 | | 4,959 | |
| California GO | | 5.000% | | 9/1/34 | | | 10,655 | | 12,172 | |
| California GO | | 5.000% | | 10/1/34 | | | 9,200 | | 10,284 | |
| California GO | | 5.000% | | 8/1/35 | | | 9,015 | | 10,250 | |
| California GO | | 5.000% | | 8/1/35 | | | 10,000 | | 11,218 | |
| California GO | | 4.000% | | 9/1/35 | | | 3,390 | | 3,542 | |
| California GO | | 5.000% | | 9/1/35 | | | 9,885 | | 11,249 | |
| California GO | | 5.000% | | 10/1/35 | | | 17,500 | | 19,794 | |
| California GO | | 5.000% | | 11/1/35 | | | 3,810 | | 4,399 | |
| California GO | | 5.000% | | 11/1/35 | | | 1,000 | | 1,155 | |
| California GO | | 5.000% | | 9/1/36 | | | 10,705 | | 12,146 | |
| California GO | | 4.000% | | 11/1/36 | | | 7,000 | | 7,248 | |
| California GO | | 5.000% | | 11/1/36 | | | 4,180 | | 4,807 | |
| California GO | | 5.000% | | 11/1/37 | | | 10,000 | | 11,471 | |
| California GO | | 3.700% | | 12/1/37 | | | 3,370 | | 3,390 | |
| California GO PUT | | 3.000% | | 12/1/19 | | | 52,000 | | 52,283 | |
| California GO PUT | | 4.000% | | 12/1/21 | | | 21,905 | | 22,802 | |
1 | California GO TOB VRDO | | 1.670% | | 12/7/18 | | | 2,825 | | 2,825 | |
| California GO VRDO | | 1.440% | | 12/3/18 | LOC | | 100 | | 100 | |
| California Health Facilities Financing Authority Revenue (Adventist Health System/West) | | 5.000% | | 3/1/20 | | | 1,075 | | 1,117 | |
| California Health Facilities Financing Authority Revenue (Adventist Health System/West) | | 4.000% | | 3/1/22 | | | 1,200 | | 1,267 | |
50
California Intermediate-Term Tax-Exempt Fund
| | | | | | | | Face | | Market | |
| | | | | Maturity | | | Amount | | Value· | |
| | | Coupon | | Date | | | ($000 | ) | ($000 | ) |
| California Health Facilities Financing Authority Revenue (Adventist Health System/West) | | 4.000% | | 3/1/23 | | | 1,810 | | 1,935 | |
| California Health Facilities Financing Authority Revenue (Adventist Health System/West) | | 4.000% | | 3/1/24 | | | 3,325 | | 3,590 | |
| California Health Facilities Financing Authority Revenue (Adventist Health System/West) | | 4.000% | | 3/1/25 | | | 3,025 | | 3,296 | |
| California Health Facilities Financing Authority Revenue (Adventist Health System/West) | | 5.000% | | 3/1/25 | | | 5,700 | | 6,305 | |
| California Health Facilities Financing Authority Revenue (Adventist Health System/West) | | 4.000% | | 3/1/26 | | | 2,190 | | 2,399 | |
| California Health Facilities Financing Authority Revenue (Adventist Health System/West) | | 5.000% | | 3/1/26 | | | 2,000 | | 2,212 | |
| California Health Facilities Financing Authority Revenue (Adventist Health System/West) | | 4.000% | | 3/1/27 | | | 4,105 | | 4,431 | |
| California Health Facilities Financing Authority Revenue (Adventist Health System/West) | | 4.000% | | 3/1/28 | | | 5,000 | | 5,194 | |
| California Health Facilities Financing Authority Revenue (Adventist Health System/West) | | 4.000% | | 3/1/28 | | | 1,240 | | 1,310 | |
| California Health Facilities Financing Authority Revenue (Adventist Health System/West) | | 4.000% | | 3/1/31 | | | 2,100 | | 2,164 | |
| California Health Facilities Financing Authority Revenue (Adventist Health System/West) | | 4.000% | | 3/1/32 | | | 2,375 | | 2,436 | |
| California Health Facilities Financing Authority Revenue (Adventist Health System/West) | | 4.000% | | 3/1/33 | | | 23,515 | | 23,826 | |
| California Health Facilities Financing Authority Revenue (Adventist Health System/West) | | 4.000% | | 3/1/33 | | | 2,500 | | 2,554 | |
| California Health Facilities Financing Authority Revenue (Adventist Health System/West) | | 4.000% | | 3/1/34 | | | 3,000 | | 3,048 | |
| California Health Facilities Financing Authority Revenue (Adventist Health System/West) | | 4.000% | | 3/1/35 | | | 3,200 | | 3,235 | |
| California Health Facilities Financing Authority Revenue (Catholic Healthcare West) | | 5.000% | | 3/1/19 | | | 215 | | 217 | |
| California Health Facilities Financing Authority Revenue (Catholic Healthcare West) | | 5.000% | | 7/1/19 | (ETM) | | 1,000 | | 1,019 | |
| California Health Facilities Financing Authority Revenue (Catholic Healthcare West) | | 6.000% | | 7/1/19 | (Prere.) | | 4,260 | | 4,367 | |
| California Health Facilities Financing Authority Revenue (Catholic Healthcare West) | | 5.000% | | 3/1/20 | | | 4,760 | | 4,937 | |
| California Health Facilities Financing Authority Revenue (Catholic Healthcare West) | | 5.000% | | 3/1/21 | | | 3,830 | | 4,070 | |
| California Health Facilities Financing Authority Revenue (Catholic Healthcare West) | | 5.250% | | 3/1/22 | | | 8,010 | | 8,523 | |
| California Health Facilities Financing Authority Revenue (Catholic Healthcare West) | | 5.250% | | 3/1/23 | | | 1,605 | | 1,708 | |
| California Health Facilities Financing Authority Revenue (Catholic Healthcare West) | | 5.500% | | 7/1/25 | | | 5,175 | | 5,191 | |
| California Health Facilities Financing Authority Revenue (Catholic Healthcare West) | | 5.625% | | 7/1/25 | | | 19,820 | | 20,210 | |
| California Health Facilities Financing Authority Revenue (Catholic Healthcare West) | | 5.250% | | 3/1/27 | | | 7,500 | | 7,994 | |
| California Health Facilities Financing Authority Revenue (Cedars-Sinai Medical Center) | | 5.000% | | 8/15/19 | | | 1,000 | | 1,023 | |
| California Health Facilities Financing Authority Revenue (Cedars-Sinai Medical Center) | | 5.000% | | 8/15/20 | | | 2,130 | | 2,243 | |
51
California Intermediate-Term Tax-Exempt Fund
| | | | | | | | Face | | Market | |
| | | | | Maturity | | | Amount | | Value· | |
| | | Coupon | | Date | | | ($000 | ) | ($000 | ) |
| California Health Facilities Financing Authority Revenue (Cedars-Sinai Medical Center) | | 5.000% | | 8/15/21 | | | 2,015 | | 2,180 | |
| California Health Facilities Financing Authority Revenue (Cedars-Sinai Medical Center) | | 5.000% | | 11/15/26 | | | 6,980 | | 8,183 | |
| California Health Facilities Financing Authority Revenue (Cedars-Sinai Medical Center) | | 5.000% | | 11/15/29 | | | 7,250 | | 8,367 | |
| California Health Facilities Financing Authority Revenue (Cedars-Sinai Medical Center) | | 5.000% | | 11/15/31 | | | 1,760 | | 2,023 | |
| California Health Facilities Financing Authority Revenue (Cedars-Sinai Medical Center) | | 4.000% | | 8/15/35 | | | 14,100 | | 14,555 | |
| California Health Facilities Financing Authority Revenue (Cedars-Sinai Medical Center) | | 4.000% | | 8/15/36 | | | 12,500 | | 12,830 | |
| California Health Facilities Financing Authority Revenue (Children’s Hospital of Los Angeles) | | 5.000% | | 11/15/22 | | | 3,500 | | 3,848 | |
| California Health Facilities Financing Authority Revenue (Children’s Hospital of Los Angeles) | | 5.000% | | 11/15/23 | | | 1,420 | | 1,561 | |
| California Health Facilities Financing Authority Revenue (Children’s Hospital of Los Angeles) | | 5.000% | | 11/15/24 | | | 7,410 | | 8,118 | |
| California Health Facilities Financing Authority Revenue (Children’s Hospital of Los Angeles) | | 5.000% | | 11/15/27 | | | 4,000 | | 4,346 | |
| California Health Facilities Financing Authority Revenue (Children’s Hospital of Los Angeles) | | 5.000% | | 11/15/29 | | | 8,790 | | 9,500 | |
| California Health Facilities Financing Authority Revenue (Children’s Hospital of Los Angeles) | | 5.000% | | 8/15/32 | | | 365 | | 413 | |
| California Health Facilities Financing Authority Revenue (Children’s Hospital of Los Angeles) | | 5.000% | | 8/15/33 | | | 620 | | 698 | |
| California Health Facilities Financing Authority Revenue (Children’s Hospital of Los Angeles) | | 4.000% | | 8/15/34 | | | 820 | | 850 | |
| California Health Facilities Financing Authority Revenue (Children’s Hospital of Los Angeles) | | 5.000% | | 8/15/35 | | | 3,650 | | 4,073 | |
| California Health Facilities Financing Authority Revenue (Children’s Hospital of Los Angeles) | | 5.000% | | 8/15/36 | | | 4,100 | | 4,547 | |
| California Health Facilities Financing Authority Revenue (Children’s Hospital of Los Angeles) | | 5.000% | | 8/15/37 | | | 1,335 | | 1,476 | |
| California Health Facilities Financing Authority Revenue (Children’s Hospital of Orange County) | | 6.250% | | 11/1/29 | | | 5,000 | | 5,205 | |
| California Health Facilities Financing Authority Revenue (Children’s Hospital of Orange County) | | 5.000% | | 11/1/31 | | | 2,000 | | 2,160 | |
| California Health Facilities Financing Authority Revenue (Chinese Hospital Association) | | 5.000% | | 6/1/19 | | | 300 | | 304 | |
| California Health Facilities Financing Authority Revenue (Chinese Hospital Association) | | 5.000% | | 6/1/21 | | | 450 | | 479 | |
| California Health Facilities Financing Authority Revenue (Chinese Hospital Association) | | 5.000% | | 6/1/22 | | | 875 | | 950 | |
| California Health Facilities Financing Authority Revenue (Chinese Hospital Association) | | 5.000% | | 6/1/23 | | | 760 | | 838 | |
| California Health Facilities Financing Authority Revenue (Chinese Hospital Association) | | 5.000% | | 6/1/25 | | | 310 | | 341 | |
| California Health Facilities Financing Authority Revenue (Chinese Hospital Association) | | 5.000% | | 6/1/26 | | | 805 | | 879 | |
| California Health Facilities Financing Authority Revenue (City of Hope Medical Center) | | 5.000% | | 11/15/19 | | | 800 | | 823 | |
| California Health Facilities Financing Authority Revenue (City of Hope Medical Center) | | 4.000% | | 11/15/20 | | | 750 | | 779 | |
52
California Intermediate-Term Tax-Exempt Fund
| | | | | | | | Face | | Market | |
| | | | | Maturity | | | Amount | | Value· | |
| | | Coupon | | Date | | | ($000 | ) | ($000 | ) |
| California Health Facilities Financing Authority Revenue (City of Hope Medical Center) | | 5.000% | | 11/15/21 | | | 1,455 | | 1,576 | |
| California Health Facilities Financing Authority Revenue (City of Hope Medical Center) | | 5.000% | | 11/15/23 | | | 1,520 | | 1,677 | |
| California Health Facilities Financing Authority Revenue (City of Hope Medical Center) | | 5.000% | | 11/15/24 | | | 1,700 | | 1,872 | |
| California Health Facilities Financing Authority Revenue (City of Hope Medical Center) | | 5.000% | | 11/15/25 | | | 2,525 | | 2,775 | |
| California Health Facilities Financing Authority Revenue (City of Hope Medical Center) | | 5.000% | | 11/15/27 | | | 2,000 | | 2,190 | |
| California Health Facilities Financing Authority Revenue (City of Hope Medical Center) | | 5.000% | | 11/15/32 | | | 12,500 | | 13,616 | |
| California Health Facilities Financing Authority Revenue (City of Hope Medical Center) | | 5.000% | | 11/15/35 | | | 3,520 | | 3,822 | |
| California Health Facilities Financing Authority Revenue (El Camino Hospital) | | 3.000% | | 2/1/19 | | | 1,235 | | 1,238 | |
| California Health Facilities Financing Authority Revenue (El Camino Hospital) | | 4.000% | | 2/1/20 | | | 1,715 | | 1,760 | |
| California Health Facilities Financing Authority Revenue (El Camino Hospital) | | 5.000% | | 2/1/27 | | | 1,250 | | 1,482 | |
| California Health Facilities Financing Authority Revenue (El Camino Hospital) | | 5.000% | | 2/1/28 | | | 3,000 | | 3,396 | |
| California Health Facilities Financing Authority Revenue (El Camino Hospital) | | 5.000% | | 2/1/28 | | | 1,350 | | 1,569 | |
| California Health Facilities Financing Authority Revenue (El Camino Hospital) | | 5.000% | | 2/1/29 | | | 1,000 | | 1,126 | |
| California Health Facilities Financing Authority Revenue (El Camino Hospital) | | 5.000% | | 2/1/29 | | | 2,525 | | 2,915 | |
| California Health Facilities Financing Authority Revenue (El Camino Hospital) | | 5.000% | | 2/1/30 | | | 2,205 | | 2,470 | |
| California Health Facilities Financing Authority Revenue (El Camino Hospital) | | 5.000% | | 2/1/30 | | | 1,500 | | 1,721 | |
| California Health Facilities Financing Authority Revenue (El Camino Hospital) | | 5.000% | | 2/1/31 | | | 5,930 | | 6,610 | |
| California Health Facilities Financing Authority Revenue (El Camino Hospital) | | 5.000% | | 2/1/32 | | | 2,610 | | 2,896 | |
| California Health Facilities Financing Authority Revenue (El Camino Hospital) | | 5.000% | | 2/1/33 | | | 3,025 | | 3,407 | |
| California Health Facilities Financing Authority Revenue (El Camino Hospital) | | 5.000% | | 2/1/33 | | | 3,295 | | 3,639 | |
| California Health Facilities Financing Authority Revenue (El Camino Hospital) | | 5.000% | | 2/1/34 | | | 2,400 | | 2,638 | |
| California Health Facilities Financing Authority Revenue (El Camino Hospital) | | 5.000% | | 2/1/34 | | | 2,510 | | 2,811 | |
| California Health Facilities Financing Authority Revenue (El Camino Hospital) | | 5.000% | | 2/1/35 | | | 4,020 | | 4,407 | |
| California Health Facilities Financing Authority Revenue (El Camino Hospital) | | 5.000% | | 2/1/35 | | | 3,500 | | 3,906 | |
| California Health Facilities Financing Authority Revenue (El Camino Hospital) | | 5.000% | | 2/1/36 | | | 3,000 | | 3,335 | |
1 | California Health Facilities Financing Authority Revenue (Kaiser Credit Group) TOB VRDO | | 1.690% | | 12/7/18 | | | 8,000 | | 8,000 | |
| California Health Facilities Financing Authority Revenue (Kaiser Permanente) | | 5.000% | | 11/1/27 | | | 33,270 | | 40,134 | |
53
California Intermediate-Term Tax-Exempt Fund
| | | | | | | | Face | | Market | |
| | | | | Maturity | | | Amount | | Value· | |
| | | Coupon | | Date | | | ($000 | ) | ($000 | ) |
| California Health Facilities Financing Authority Revenue (Kaiser Permanente) | | 4.000% | | 11/1/38 | | | 25,250 | | 25,864 | |
| California Health Facilities Financing Authority Revenue (Kaiser Permanente) PUT | | 5.000% | | 11/1/22 | | | 5,000 | | 5,545 | |
| California Health Facilities Financing Authority Revenue (Kaiser Permanente) PUT | | 5.000% | | 11/1/22 | | | 40,000 | | 44,359 | |
1 | California Health Facilities Financing Authority Revenue (Kaiser Permanente) TOB VRDO | | 1.710% | | 12/7/18 | | | 5,500 | | 5,500 | |
1 | California Health Facilities Financing Authority Revenue (Kaiser Permanente) TOB VRDO | | 1.740% | | 12/7/18 | LOC | | 7,435 | | 7,435 | |
| California Health Facilities Financing Authority Revenue (Lucile Salter Packard Children’s Hospital at Stanford) | | 4.000% | | 8/15/19 | | | 500 | | 508 | |
| California Health Facilities Financing Authority Revenue (Lucile Salter Packard Children’s Hospital at Stanford) | | 5.000% | | 8/15/21 | | | 505 | | 545 | |
| California Health Facilities Financing Authority Revenue (Lucile Salter Packard Children’s Hospital at Stanford) | | 5.000% | | 8/15/21 | | | 950 | | 1,027 | |
| California Health Facilities Financing Authority Revenue (Lucile Salter Packard Children’s Hospital at Stanford) | | 5.000% | | 8/15/22 | | | 365 | | 403 | |
| California Health Facilities Financing Authority Revenue (Lucile Salter Packard Children’s Hospital at Stanford) | | 5.000% | | 8/15/22 | | | 560 | | 620 | |
| California Health Facilities Financing Authority Revenue (Lucile Salter Packard Children’s Hospital at Stanford) | | 5.000% | | 8/15/23 | | | 340 | | 384 | |
| California Health Facilities Financing Authority Revenue (Lucile Salter Packard Children’s Hospital at Stanford) | | 5.000% | | 8/15/30 | | | 1,680 | | 1,935 | |
| California Health Facilities Financing Authority Revenue (Lucile Salter Packard Children’s Hospital at Stanford) | | 5.000% | | 8/15/31 | | | 1,300 | | 1,493 | |
| California Health Facilities Financing Authority Revenue (Lucile Salter Packard Children’s Hospital at Stanford) | | 5.000% | | 8/15/32 | | | 1,780 | | 2,035 | |
| California Health Facilities Financing Authority Revenue (Lucile Salter Packard Children’s Hospital at Stanford) | | 5.000% | | 8/15/33 | | | 1,610 | | 1,834 | |
| California Health Facilities Financing Authority Revenue (Lucile Salter Packard Children’s Hospital at Stanford) | | 4.000% | | 8/15/34 | | | 1,500 | | 1,532 | |
| California Health Facilities Financing Authority Revenue (Lucile Salter Packard Children’s Hospital at Stanford) | | 5.000% | | 11/15/34 | | | 400 | | 459 | |
| California Health Facilities Financing Authority Revenue (Lucile Salter Packard Children’s Hospital at Stanford) | | 5.000% | | 11/15/35 | | | 550 | | 628 | |
| California Health Facilities Financing Authority Revenue (Lucile Salter Packard Children’s Hospital at Stanford) | | 5.000% | | 11/15/36 | | | 1,050 | | 1,195 | |
54
California Intermediate-Term Tax-Exempt Fund
| | | | | | | | Face | | Market | |
| | | | | Maturity | | | Amount | | Value· | |
| | | Coupon | | Date | | | ($000 | ) | ($000 | ) |
1 | California Health Facilities Financing Authority Revenue (Lucile Salter Packard Children’s Hospital at Stanford) TOB VRDO | | 1.680% | | 12/7/18 | | | 2,060 | | 2,060 | |
1 | California Health Facilities Financing Authority Revenue (Lucile Salter Packard Children’s Hospital at Stanford) TOB VRDO | | 1.700% | | 12/7/18 | | | 7,705 | | 7,705 | |
1 | California Health Facilities Financing Authority Revenue (Lucile Salter Packard Children’s Hospital at Stanford) TOB VRDO | | 1.720% | | 12/7/18 | | | 6,665 | | 6,665 | |
1 | California Health Facilities Financing Authority Revenue (Lucile Salter Packard Children’s Hospital at Stanford) TOB VRDO | | 1.720% | | 12/7/18 | | | 5,410 | | 5,410 | |
1 | California Health Facilities Financing Authority Revenue (Lucile Salter Packard Children’s Hospital at Stanford) TOB VRDO | | 1.720% | | 12/7/18 | | | 4,000 | | 4,000 | |
| California Health Facilities Financing Authority Revenue (Marshall Medical Center) | | 5.000% | | 11/1/24 | | | 850 | | 989 | |
| California Health Facilities Financing Authority Revenue (Marshall Medical Center) | | 5.000% | | 11/1/25 | | | 425 | | 492 | |
| California Health Facilities Financing Authority Revenue (Marshall Medical Center) | | 5.000% | | 11/1/26 | | | 775 | | 894 | |
| California Health Facilities Financing Authority Revenue (Memorial Health Services) | | 4.000% | | 10/1/19 | | | 1,520 | | 1,548 | |
| California Health Facilities Financing Authority Revenue (Memorial Health Services) | | 5.000% | | 10/1/19 | | | 1,000 | | 1,026 | |
| California Health Facilities Financing Authority Revenue (Memorial Health Services) | | 4.000% | | 10/1/20 | | | 1,835 | | 1,905 | |
| California Health Facilities Financing Authority Revenue (Memorial Health Services) | | 4.000% | | 10/1/21 | | | 1,055 | | 1,115 | |
| California Health Facilities Financing Authority Revenue (Memorial Health Services) | | 5.000% | | 10/1/21 | | | 1,055 | | 1,144 | |
| California Health Facilities Financing Authority Revenue (Memorial Health Services) | | 4.000% | | 10/1/22 | | | 2,250 | | 2,415 | |
| California Health Facilities Financing Authority Revenue (Memorial Health Services) | | 5.000% | | 10/1/22 | | | 2,450 | | 2,720 | |
| California Health Facilities Financing Authority Revenue (Memorial Health Services) | | 5.000% | | 10/1/24 | | | 5,000 | | 5,541 | |
| California Health Facilities Financing Authority Revenue (Memorial Health Services) | | 5.000% | | 10/1/25 | | | 5,000 | | 5,537 | |
| California Health Facilities Financing Authority Revenue (Northern California Presbyterian Homes & Services) | | 5.000% | | 7/1/20 | | | 300 | | 315 | |
| California Health Facilities Financing Authority Revenue (Northern California Presbyterian Homes & Services) | | 5.000% | | 7/1/21 | | | 465 | | 502 | |
| California Health Facilities Financing Authority Revenue (Northern California Presbyterian Homes & Services) | | 5.000% | | 7/1/22 | | | 175 | | 194 | |
| California Health Facilities Financing Authority Revenue (Northern California Presbyterian Homes & Services) | | 5.000% | | 7/1/24 | | | 370 | | 428 | |
| California Health Facilities Financing Authority Revenue (Northern California Presbyterian Homes & Services) | | 5.000% | | 7/1/25 | | | 500 | | 589 | |
55
California Intermediate-Term Tax-Exempt Fund
| | | | | | | | Face | | Market | |
| | | | | Maturity | | | Amount | | Value· | |
| | | Coupon | | Date | | | ($000 | ) | ($000 | ) |
| California Health Facilities Financing Authority Revenue (Northern California Presbyterian Homes & Services) | | 5.000% | | 7/1/26 | | | 750 | | 878 | |
| California Health Facilities Financing Authority Revenue (Northern California Presbyterian Homes & Services) | | 5.000% | | 7/1/28 | | | 880 | | 1,020 | |
| California Health Facilities Financing Authority Revenue (Northern California Presbyterian Homes & Services) | | 5.000% | | 7/1/29 | | | 855 | | 987 | |
| California Health Facilities Financing Authority Revenue (Northern California Presbyterian Homes & Services) | | 5.000% | | 7/1/31 | | | 870 | | 993 | |
| California Health Facilities Financing Authority Revenue (Providence Health & Services) | | 5.000% | | 10/1/25 | | | 2,610 | | 3,018 | |
| California Health Facilities Financing Authority Revenue (Providence Health & Services) | | 5.000% | | 10/1/26 | | | 2,700 | | 3,101 | |
| California Health Facilities Financing Authority Revenue (Providence Health & Services) | | 5.000% | | 10/1/28 | | | 1,840 | | 2,098 | |
| California Health Facilities Financing Authority Revenue (Providence Health & Services) | | 5.000% | | 10/1/30 | | | 4,000 | | 4,527 | |
| California Health Facilities Financing Authority Revenue (Providence Health & Services) | | 5.000% | | 10/1/31 | | | 5,000 | | 5,639 | |
| California Health Facilities Financing Authority Revenue (Providence Health & Services) | | 5.000% | | 10/1/33 | | | 5,045 | | 5,665 | |
| California Health Facilities Financing Authority Revenue (Providence Health & Services) | | 5.000% | | 10/1/34 | | | 5,650 | | 6,331 | |
| California Health Facilities Financing Authority Revenue (Providence St. Joseph Health Obligated Group) | | 5.000% | | 10/1/30 | | | 2,015 | | 2,320 | |
| California Health Facilities Financing Authority Revenue (Providence St. Joseph Health Obligated Group) | | 5.000% | | 10/1/31 | | | 2,200 | | 2,521 | |
| California Health Facilities Financing Authority Revenue (Providence St. Joseph Health Obligated Group) | | 4.000% | | 10/1/34 | | | 2,250 | | 2,329 | |
| California Health Facilities Financing Authority Revenue (Providence St. Joseph Health Obligated Group) | | 4.000% | | 10/1/35 | | | 8,010 | | 8,258 | |
| California Health Facilities Financing Authority Revenue (Providence St. Joseph Health Obligated Group) | | 4.000% | | 10/1/36 | | | 3,425 | | 3,518 | |
| California Health Facilities Financing Authority Revenue (Providence St. Joseph Health Obligated Group) PUT | | 1.250% | | 10/1/20 | | | 19,405 | | 19,159 | |
| California Health Facilities Financing Authority Revenue (Providence St. Joseph Health Obligated Group) PUT | | 2.000% | | 10/1/25 | | | 16,000 | | 15,510 | |
| California Health Facilities Financing Authority Revenue (Rady Children’s Hospital) | | 5.000% | | 8/15/20 | | | 500 | | 525 | |
| California Health Facilities Financing Authority Revenue (Rady Children’s Hospital) | | 5.500% | | 8/15/26 | | | 6,000 | | 6,526 | |
| California Health Facilities Financing Authority Revenue (Rady Children’s Hospital) | | 5.000% | | 8/15/31 | | | 2,865 | | 3,068 | |
56
California Intermediate-Term Tax-Exempt Fund
| | | | | | | | Face | | Market | |
| | | | | Maturity | | | Amount | | Value· | |
| | | Coupon | | Date | | | ($000 | ) | ($000 | ) |
| California Health Facilities Financing Authority Revenue (Scripps Health) | | 5.000% | | 11/15/25 | | | 760 | | 825 | |
| California Health Facilities Financing Authority Revenue (Scripps Health) | | 5.000% | | 11/15/27 | | | 860 | | 933 | |
| California Health Facilities Financing Authority Revenue (Scripps Health) | | 5.000% | | 11/15/28 | | | 1,175 | | 1,274 | |
| California Health Facilities Financing Authority Revenue (Scripps Health) | | 5.000% | | 11/15/32 | | | 1,000 | | 1,082 | |
| California Health Facilities Financing Authority Revenue (St. Joseph Health System) | | 5.000% | | 7/1/29 | | | 4,995 | | 5,570 | |
| California Health Facilities Financing Authority Revenue (St. Joseph Health System) | | 5.500% | | 7/1/29 | | | 10,000 | | 10,222 | |
| California Health Facilities Financing Authority Revenue (St. Joseph Health System) | | 5.000% | | 7/1/33 | | | 6,485 | | 7,132 | |
| California Health Facilities Financing Authority Revenue (St. Joseph Health System) PUT | | 5.000% | | 10/15/20 | | | 12,500 | | 13,175 | |
| California Health Facilities Financing Authority Revenue (Stanford Hospital) | | 5.000% | | 8/15/19 | | | 2,000 | | 2,045 | |
| California Health Facilities Financing Authority Revenue (Stanford Hospital) | | 5.250% | | 11/15/20 | (Prere.) | | 2,000 | | 2,133 | |
| California Health Facilities Financing Authority Revenue (Stanford Hospital) | | 4.000% | | 8/15/21 | | | 2,250 | | 2,373 | |
| California Health Facilities Financing Authority Revenue (Stanford Hospital) | | 5.000% | | 8/15/23 | | | 1,855 | | 2,056 | |
| California Health Facilities Financing Authority Revenue (Sutter Health) | | 5.000% | | 8/15/19 | | | 2,000 | | 2,046 | |
| California Health Facilities Financing Authority Revenue (Sutter Health) | | 5.000% | | 8/15/20 | | | 2,200 | | 2,318 | |
| California Health Facilities Financing Authority Revenue (Sutter Health) | | 5.500% | | 8/15/20 | (Prere.) | | 4,750 | | 5,051 | |
| California Health Facilities Financing Authority Revenue (Sutter Health) | | 5.875% | | 8/15/20 | (Prere.) | | 5,000 | | 5,349 | |
| California Health Facilities Financing Authority Revenue (Sutter Health) | | 5.000% | | 8/15/21 | | | 1,320 | | 1,429 | |
| California Health Facilities Financing Authority Revenue (Sutter Health) | | 5.000% | | 11/15/21 | | | 3,930 | | 4,280 | |
| California Health Facilities Financing Authority Revenue (Sutter Health) | | 5.000% | | 11/15/21 | | | 500 | | 545 | |
| California Health Facilities Financing Authority Revenue (Sutter Health) | | 5.000% | | 8/15/22 | | | 1,185 | | 1,282 | |
| California Health Facilities Financing Authority Revenue (Sutter Health) | | 5.000% | | 11/15/22 | | | 2,075 | | 2,315 | |
| California Health Facilities Financing Authority Revenue (Sutter Health) | | 5.000% | | 11/15/22 | | | 200 | | 223 | |
| California Health Facilities Financing Authority Revenue (Sutter Health) | | 5.000% | | 11/15/23 | | | 2,500 | | 2,849 | |
| California Health Facilities Financing Authority Revenue (Sutter Health) | | 5.000% | | 11/15/23 | | | 300 | | 342 | |
| California Health Facilities Financing Authority Revenue (Sutter Health) | | 5.000% | | 11/15/24 | | | 420 | | 487 | |
| California Health Facilities Financing Authority Revenue (Sutter Health) | | 5.000% | | 11/15/24 | | | 1,075 | | 1,248 | |
| California Health Facilities Financing Authority Revenue (Sutter Health) | | 5.000% | | 11/15/24 | | | 2,500 | | 2,901 | |
57
California Intermediate-Term Tax-Exempt Fund
| | | | | | | | Face | | Market | |
| | | | | Maturity | | | Amount | | Value· | |
| | | Coupon | | Date | | | ($000 | ) | ($000 | ) |
| California Health Facilities Financing Authority Revenue (Sutter Health) | | 5.000% | | 11/15/25 | | | 485 | | 572 | |
| California Health Facilities Financing Authority Revenue (Sutter Health) | | 5.000% | | 11/15/25 | | | 650 | | 767 | |
| California Health Facilities Financing Authority Revenue (Sutter Health) | | 5.000% | | 11/15/25 | | | 2,510 | | 2,961 | |
| California Health Facilities Financing Authority Revenue (Sutter Health) | | 5.000% | | 11/15/26 | | | 400 | | 468 | |
| California Health Facilities Financing Authority Revenue (Sutter Health) | | 5.000% | | 11/15/26 | | | 1,085 | | 1,298 | |
| California Health Facilities Financing Authority Revenue (Sutter Health) | | 5.000% | | 11/15/26 | | | 2,750 | | 3,291 | |
| California Health Facilities Financing Authority Revenue (Sutter Health) | | 5.000% | | 11/15/27 | | | 525 | | 609 | |
| California Health Facilities Financing Authority Revenue (Sutter Health) | | 5.000% | | 11/15/27 | | | 1,000 | | 1,210 | |
| California Health Facilities Financing Authority Revenue (Sutter Health) | | 5.000% | | 11/15/28 | | | 540 | | 622 | |
| California Health Facilities Financing Authority Revenue (Sutter Health) | | 5.000% | | 11/15/28 | | | 1,250 | | 1,460 | |
| California Health Facilities Financing Authority Revenue (Sutter Health) | | 5.000% | | 11/15/28 | | | 820 | | 970 | |
| California Health Facilities Financing Authority Revenue (Sutter Health) | | 5.000% | | 11/15/29 | | | 875 | | 1,015 | |
| California Health Facilities Financing Authority Revenue (Sutter Health) | | 5.000% | | 11/15/30 | | | 1,180 | | 1,360 | |
| California Health Facilities Financing Authority Revenue (Sutter Health) | | 5.250% | | 8/15/31 | | | 5,555 | | 6,003 | |
| California Health Facilities Financing Authority Revenue (Sutter Health) | | 5.000% | | 11/15/31 | | | 1,225 | | 1,405 | |
| California Health Facilities Financing Authority Revenue (Sutter Health) | | 5.000% | | 11/15/31 | | | 1,335 | | 1,547 | |
| California Health Facilities Financing Authority Revenue (Sutter Health) | | 5.000% | | 11/15/32 | | | 1,425 | | 1,627 | |
| California Health Facilities Financing Authority Revenue (Sutter Health) | | 5.000% | | 11/15/32 | | | 1,770 | | 2,041 | |
| California Health Facilities Financing Authority Revenue (Sutter Health) | | 5.000% | | 11/15/33 | | | 3,580 | | 4,066 | |
| California Health Facilities Financing Authority Revenue (Sutter Health) | | 5.000% | | 11/15/34 | | | 4,000 | | 4,525 | |
| California Health Facilities Financing Authority Revenue (Sutter Health) | | 5.000% | | 11/15/35 | | | 5,000 | | 5,687 | |
| California Health Facilities Financing Authority Revenue (Sutter Health) | | 5.000% | | 11/15/35 | | | 3,195 | | 3,603 | |
| California Health Facilities Financing Authority Revenue (Sutter Health) | | 5.000% | | 11/15/35 | | | 7,000 | | 7,962 | |
| California Health Facilities Financing Authority Revenue (Sutter Health) | | 5.000% | | 11/15/36 | | | 3,625 | | 4,098 | |
| California Health Facilities Financing Authority Revenue (Sutter Health) | | 5.000% | | 11/15/36 | | | 3,090 | | 3,472 | |
| California Health Facilities Financing Authority Revenue (Sutter Health) | | 5.000% | | 11/15/36 | | | 6,700 | | 7,573 | |
| California Health Facilities Financing Authority Revenue (Sutter Health) | | 5.000% | | 11/15/37 | | | 3,010 | | 3,389 | |
58
California Intermediate-Term Tax-Exempt Fund
| | | | | | | | Face | | Market | |
| | | | | Maturity | | | Amount | | Value· | |
| | | Coupon | | Date | | | ($000 | ) | ($000 | ) |
| California Health Facilities Financing Authority Revenue (Sutter Health) | | 5.000% | | 11/15/37 | | | 24,295 | | 27,355 | |
| California Health Facilities Financing Authority Revenue (Sutter Health) PUT | | 1.000% | | 8/15/19 | | | 6,000 | | 5,950 | |
| California Infrastructure & Economic Development Bank Revenue | | 5.000% | | 7/1/20 | | | 200 | | 210 | |
| California Infrastructure & Economic Development Bank Revenue | | 5.000% | | 7/1/21 | | | 300 | | 323 | |
| California Infrastructure & Economic Development Bank Revenue | | 5.000% | | 7/1/22 | | | 255 | | 281 | |
| California Infrastructure & Economic Development Bank Revenue | | 4.000% | | 10/1/22 | | | 1,000 | | 1,081 | |
| California Infrastructure & Economic Development Bank Revenue | | 5.000% | | 10/1/22 | | | 7,880 | | 8,809 | |
| California Infrastructure & Economic Development Bank Revenue | | 5.000% | | 10/1/22 | | | 1,400 | | 1,565 | |
| California Infrastructure & Economic Development Bank Revenue | | 5.000% | | 7/1/23 | | | 250 | | 281 | |
| California Infrastructure & Economic Development Bank Revenue | | 5.000% | | 10/1/23 | | | 4,000 | | 4,575 | |
| California Infrastructure & Economic Development Bank Revenue | | 5.000% | | 10/1/23 | | | 1,800 | | 2,059 | |
| California Infrastructure & Economic Development Bank Revenue | | 5.000% | | 7/1/24 | | | 600 | | 686 | |
| California Infrastructure & Economic Development Bank Revenue | | 5.000% | | 10/1/24 | | | 1,175 | | 1,373 | |
| California Infrastructure & Economic Development Bank Revenue | | 5.000% | | 10/1/24 | | | 1,300 | | 1,519 | |
| California Infrastructure & Economic Development Bank Revenue | | 5.000% | | 10/1/25 | | | 5,000 | | 5,959 | |
| California Infrastructure & Economic Development Bank Revenue | | 5.000% | | 10/1/25 | | | 1,525 | | 1,818 | |
| California Infrastructure & Economic Development Bank Revenue | | 5.000% | | 7/1/26 | | | 770 | | 906 | |
| California Infrastructure & Economic Development Bank Revenue | | 5.000% | | 10/1/26 | | | 1,510 | | 1,824 | |
| California Infrastructure & Economic Development Bank Revenue | | 5.000% | | 7/1/27 | | | 1,775 | | 2,076 | |
| California Infrastructure & Economic Development Bank Revenue | | 4.000% | | 7/1/29 | | | 910 | | 976 | |
| California Infrastructure & Economic Development Bank Revenue (Academy of Motion Picture Arts & Sciences Obligated Group) | | 5.000% | | 11/1/20 | | | 1,000 | | 1,062 | |
| California Infrastructure & Economic Development Bank Revenue (Academy of Motion Picture Arts & Sciences Obligated Group) | | 5.000% | | 11/1/21 | | | 810 | | 883 | |
| California Infrastructure & Economic Development Bank Revenue (Academy of Motion Picture Arts & Sciences Obligated Group) | | 5.000% | | 11/1/29 | | | 1,500 | | 1,684 | |
59
California Intermediate-Term Tax-Exempt Fund
| | | | | | | | Face | | Market | |
| | | | | Maturity | | | Amount | | Value· | |
| | | Coupon | | Date | | | ($000 | ) | ($000 | ) |
2 | California Infrastructure & Economic Development Bank Revenue (California Academy of Sciences) PUT | | 2.005% | | 8/1/21 | | | 7,460 | | 7,459 | |
| California Infrastructure & Economic Development Bank Revenue (Independent System Operator Corp. Project) | | 5.000% | | 2/1/34 | | | 10,000 | | 10,919 | |
| California Infrastructure & Economic Development Bank Revenue (Pacific Gas & Electric Co.) PUT | | 1.750% | | 6/1/22 | | | 4,000 | | 3,596 | |
| California Infrastructure & Economic Development Bank Revenue (Pacific Gas & Electric Co.) VRDO | | 2.060% | | 12/3/18 | LOC | | 16,800 | | 16,800 | |
| California Infrastructure & Economic Development Bank Revenue (Salvation Army Western Territory) | | 5.000% | | 9/1/26 | | | 860 | | 1,015 | |
| California Infrastructure & Economic Development Bank Revenue (Salvation Army Western Territory) | | 5.000% | | 9/1/27 | | | 840 | | 984 | |
| California Infrastructure & Economic Development Bank Revenue (Salvation Army Western Territory) | | 5.000% | | 9/1/28 | | | 555 | | 646 | |
| California Infrastructure & Economic Development Bank Revenue (Salvation Army Western Territory) | | 5.000% | | 9/1/29 | | | 1,000 | | 1,159 | |
| California Infrastructure & Economic Development Bank Revenue (Salvation Army Western Territory) | | 4.000% | | 9/1/31 | | | 1,760 | | 1,871 | |
| California Infrastructure & Economic Development Bank Revenue (Salvation Army Western Territory) | | 5.000% | | 9/1/32 | | | 1,215 | | 1,392 | |
| California Infrastructure & Economic Development Bank Revenue (Salvation Army Western Territory) | | 4.000% | | 9/1/34 | | | 715 | | 749 | |
| California Infrastructure & Economic Development Bank Revenue (Salvation Army Western Territory) | | 4.000% | | 9/1/35 | | | 750 | | 782 | |
| California Infrastructure & Economic Development Bank Revenue (Sanford Consortium for Regenerative Medicine) | | 5.000% | | 5/15/28 | | | 1,055 | | 1,233 | |
| California Infrastructure & Economic Development Bank Revenue (Sanford Consortium for Regenerative Medicine) | | 5.000% | | 5/15/29 | | | 740 | | 861 | |
| California Infrastructure & Economic Development Bank Revenue (Sanford Consortium for Regenerative Medicine) | | 5.000% | | 5/15/30 | | | 1,080 | | 1,250 | |
| California Infrastructure & Economic Development Bank Revenue (Sanford Consortium for Regenerative Medicine) | | 5.000% | | 5/15/31 | | | 1,225 | | 1,410 | |
| California Infrastructure & Economic Development Bank Revenue (Sanford Consortium for Regenerative Medicine) | | 5.000% | | 5/15/32 | | | 1,140 | | 1,308 | |
| California Infrastructure & Economic Development Bank Revenue (Sanford Consortium for Regenerative Medicine) | | 5.000% | | 5/15/33 | | | 1,110 | | 1,270 | |
60
California Intermediate-Term Tax-Exempt Fund
| | | | | | | | Face | | Market | |
| | | | | Maturity | | | Amount | | Value· | |
| | | Coupon | | Date | | | ($000 | ) | ($000 | ) |
| California Infrastructure & Economic Development Bank Revenue (Sanford Consortium for Regenerative Medicine) | | 5.000% | | 5/15/34 | | | 2,850 | | 3,247 | |
| California Infrastructure & Economic Development Bank Revenue (Science Center Phase II Project) | | 5.000% | | 5/1/19 | | | 1,560 | | 1,581 | |
| California Infrastructure & Economic Development Bank Revenue (Science Center Phase II Project) | | 5.000% | | 5/1/20 | | | 1,070 | | 1,118 | |
| California Infrastructure & Economic Development Bank Revenue (Science Center Phase II Project) | | 5.000% | | 5/1/21 | | | 1,000 | | 1,070 | |
| California Infrastructure & Economic Development Bank Revenue (Science Center Phase II Project) | | 5.000% | | 5/1/22 | | | 1,500 | | 1,645 | |
| California Infrastructure & Economic Development Bank Revenue (Science Center Phase II Project) | | 5.000% | | 5/1/23 | | | 1,150 | | 1,289 | |
| California Infrastructure & Economic Development Bank Revenue (Science Center Phase II Project) | | 5.000% | | 5/1/24 | | | 1,300 | | 1,479 | |
| California Infrastructure & Economic Development Bank Revenue (Science Center Phase II Project) | | 5.000% | | 5/1/25 | | | 1,365 | | 1,577 | |
| California Infrastructure & Economic Development Bank Revenue (Science Center Phase II Project) | | 5.000% | | 5/1/26 | | | 1,190 | | 1,391 | |
| California Infrastructure & Economic Development Bank Revenue (Science Center Phase II Project) | | 5.000% | | 5/1/26 | | | 1,430 | | 1,671 | |
| California Infrastructure & Economic Development Bank Revenue (Science Center Phase II Project) | | 5.000% | | 5/1/27 | | | 1,500 | | 1,756 | |
| California Infrastructure & Economic Development Bank Revenue (Science Center Phase II Project) | | 5.000% | | 5/1/30 | | | 1,500 | | 1,719 | |
| California Infrastructure & Economic Development Bank Revenue (Science Center Phase II Project) | | 5.000% | | 5/1/31 | | | 1,000 | | 1,141 | |
| California Infrastructure & Economic Development Bank Revenue (Segerstrom Center for the Arts Project) | | 5.000% | | 1/1/25 | | | 11,050 | | 12,697 | |
| California Infrastructure & Economic Development Bank Revenue (University of California) | | 5.000% | | 5/15/37 | | | 2,500 | | 2,864 | |
| California Municipal Finance Authority (Community Hospitals of Central California Obligated Group) COP | | 5.375% | | 2/1/19 | (Prere.) | | 16,610 | | 16,710 | |
| California Municipal Finance Authority Mobile Home Park Revenue (Caritas Affordable Housing Inc. Projects) | | 4.000% | | 8/15/19 | | | 635 | | 643 | |
| California Municipal Finance Authority Mobile Home Park Revenue (Caritas Affordable Housing Inc. Projects) | | 4.000% | | 8/15/20 | | | 865 | | 887 | |
61
California Intermediate-Term Tax-Exempt Fund
| | | | | | | | Face | | Market | |
| | | | | Maturity | | | Amount | | Value· | |
| | | Coupon | | Date | | | ($000 | ) | ($000 | ) |
| California Municipal Finance Authority Mobile Home Park Revenue (Caritas Affordable Housing Inc. Projects) | | 4.000% | | 8/15/21 | | | 900 | | 933 | |
| California Municipal Finance Authority Mobile Home Park Revenue (Caritas Affordable Housing Inc. Projects) | | 5.000% | | 8/15/21 | | | 1,130 | | 1,204 | |
| California Municipal Finance Authority Mobile Home Park Revenue (Caritas Affordable Housing Inc. Projects) | | 4.000% | | 8/15/22 | | | 690 | | 721 | |
| California Municipal Finance Authority Mobile Home Park Revenue (Caritas Affordable Housing Inc. Projects) | | 5.000% | | 8/15/22 | | | 325 | | 353 | |
| California Municipal Finance Authority Mobile Home Park Revenue (Caritas Affordable Housing Inc. Projects) | | 5.000% | | 8/15/23 | | | 400 | | 440 | |
| California Municipal Finance Authority Mobile Home Park Revenue (Caritas Affordable Housing Inc. Projects) | | 5.000% | | 8/15/24 | | | 1,025 | | 1,133 | |
| California Municipal Finance Authority Mobile Home Park Revenue (Caritas Affordable Housing Inc. Projects) | | 5.000% | | 8/15/26 | | | 1,130 | | 1,269 | |
| California Municipal Finance Authority Mobile Home Park Revenue (Caritas Affordable ousing Inc. Projects) | | 5.000% | | 8/15/30 | | | 1,000 | | 1,083 | |
| California Municipal Finance Authority Mobile Home Park Revenue (Caritas Affordable Housing Inc. Projects) | | 5.000% | | 8/15/31 | | | 600 | | 661 | |
| California Municipal Finance Authority Mobile Home Park Revenue (Caritas Affordable Housing Inc. Projects) | | 4.000% | | 8/15/37 | | | 1,000 | | 993 | |
| California Municipal Finance Authority Revenue (Anaheim Electric Utility Distribution System) | | 5.000% | | 10/1/24 | | | 1,610 | | 1,867 | |
| California Municipal Finance Authority Revenue (Anaheim Electric Utility Distribution System) | | 5.000% | | 10/1/26 | | | 5,370 | | 6,281 | |
| California Municipal Finance Authority Revenue (Anaheim Water System Project Revenue) | | 4.000% | | 10/1/31 | | | 3,955 | | 4,151 | |
| California Municipal Finance Authority Revenue (Anaheim Water System Project Revenue) | | 4.000% | | 10/1/32 | | | 4,220 | | 4,420 | |
| California Municipal Finance Authority Revenue (Anaheim Water System Project Revenue) | | 4.000% | | 10/1/33 | | | 4,390 | | 4,583 | |
| California Municipal Finance Authority Revenue (Azusa Pacific University) | | 5.000% | | 4/1/19 | | | 1,450 | | 1,461 | |
| California Municipal Finance Authority Revenue (Azusa Pacific University) | | 5.000% | | 4/1/20 | | | 1,760 | | 1,810 | |
| California Municipal Finance Authority Revenue (Azusa Pacific University) | | 5.000% | | 4/1/21 | | | 1,300 | | 1,360 | |
| California Municipal Finance Authority Revenue (Azusa Pacific University) | | 5.000% | | 4/1/22 | | | 1,000 | | 1,061 | |
| California Municipal Finance Authority Revenue (Azusa Pacific University) | | 5.000% | | 4/1/23 | | | 1,285 | | 1,377 | |
| California Municipal Finance Authority Revenue (Azusa Pacific University) | | 5.000% | | 4/1/24 | | | 1,325 | | 1,429 | |
| California Municipal Finance Authority Revenue (Azusa Pacific University) | | 5.000% | | 4/1/25 | | | 1,180 | | 1,280 | |
62
California Intermediate-Term Tax-Exempt Fund
| | | | | | | | Face | | Market | |
| | | | | Maturity | | | Amount | | Value· | |
| | | Coupon | | Date | | | ($000 | ) | ($000 | ) |
| California Municipal Finance Authority Revenue (Azusa Pacific University) | | 5.000% | | 4/1/35 | | | 2,490 | | 2,594 | |
| California Municipal Finance Authority Revenue (Biola University) | | 4.000% | | 10/1/19 | | | 205 | | 208 | |
| California Municipal Finance Authority Revenue (Biola University) | | 5.000% | | 10/1/21 | | | 375 | | 403 | |
| California Municipal Finance Authority Revenue (Biola University) | | 5.000% | | 10/1/22 | | | 130 | | 143 | |
| California Municipal Finance Authority Revenue (Biola University) | | 5.000% | | 10/1/24 | | | 375 | | 425 | |
| California Municipal Finance Authority Revenue (Biola University) | | 5.000% | | 10/1/25 | | | 305 | | 350 | |
| California Municipal Finance Authority Revenue (Biola University) | | 5.000% | | 10/1/29 | | | 410 | | 471 | |
| California Municipal Finance Authority Revenue (Biola University) | | 5.000% | | 10/1/29 | | | 660 | | 720 | |
| California Municipal Finance Authority Revenue (Biola University) | | 5.000% | | 10/1/30 | | | 500 | | 543 | |
| California Municipal Finance Authority Revenue (Biola University) | | 5.000% | | 10/1/30 | | | 585 | | 668 | |
| California Municipal Finance Authority Revenue (Biola University) | | 5.000% | | 10/1/31 | | | 1,050 | | 1,192 | |
| California Municipal Finance Authority Revenue (Biola University) | | 5.000% | | 10/1/32 | | | 1,190 | | 1,347 | |
| California Municipal Finance Authority Revenue (Biola University) | | 5.000% | | 10/1/34 | | | 570 | | 639 | |
| California Municipal Finance Authority Revenue (Biola University) | | 5.000% | | 10/1/35 | | | 1,100 | | 1,230 | |
| California Municipal Finance Authority Revenue (Biola University) | | 5.000% | | 10/1/36 | | | 645 | | 718 | |
| California Municipal Finance Authority Revenue (California Lutheran University) | | 5.000% | | 10/1/23 | | | 225 | | 251 | |
| California Municipal Finance Authority Revenue (California Lutheran University) | | 5.000% | | 10/1/24 | | | 275 | | 310 | |
| California Municipal Finance Authority Revenue (California Lutheran University) | | 5.000% | | 10/1/25 | | | 275 | | 314 | |
| California Municipal Finance Authority Revenue (California Lutheran University) | | 5.000% | | 10/1/26 | | | 300 | | 344 | |
| California Municipal Finance Authority Revenue (California Lutheran University) | | 5.000% | | 10/1/27 | | | 900 | | 1,040 | |
| California Municipal Finance Authority Revenue (California Lutheran University) | | 5.000% | | 10/1/28 | | | 600 | | 698 | |
| California Municipal Finance Authority Revenue (California Lutheran University) | | 5.000% | | 10/1/29 | | | 225 | | 260 | |
| California Municipal Finance Authority Revenue (California Lutheran University) | | 5.000% | | 10/1/30 | | | 225 | | 258 | |
| California Municipal Finance Authority Revenue (California Lutheran University) | | 5.000% | | 10/1/31 | | | 225 | | 257 | |
| California Municipal Finance Authority Revenue (California Lutheran University) | | 5.000% | | 10/1/33 | | | 225 | | 255 | |
| California Municipal Finance Authority Revenue (California Lutheran University) | | 5.000% | | 10/1/35 | | | 225 | | 253 | |
| California Municipal Finance Authority Revenue (California Lutheran University) | | 5.000% | | 10/1/37 | | | 300 | | 335 | |
63
California Intermediate-Term Tax-Exempt Fund
| | | | | | | | Face | | Market | |
| | | | | Maturity | | | Amount | | Value· | |
| | | Coupon | | Date | | | ($000 | ) | ($000 | ) |
| California Municipal Finance Authority Revenue (Channing House Project) | | 5.000% | | 5/15/32 | | | 505 | | 583 | |
| California Municipal Finance Authority Revenue (Channing House Project) | | 5.000% | | 5/15/37 | | | 250 | | 285 | |
| California Municipal Finance Authority Revenue (Community Hospitals of Central California Obligated Group) | | 5.000% | | 2/1/19 | | | 500 | | 502 | |
| California Municipal Finance Authority Revenue (Community Hospitals of Central California Obligated Group) | | 5.000% | | 2/1/20 | | | 625 | | 645 | |
| California Municipal Finance Authority Revenue (Community Hospitals of Central California Obligated Group) | | 5.000% | | 2/1/20 | | | 2,005 | | 2,069 | |
| California Municipal Finance Authority Revenue (Community Hospitals of Central California Obligated Group) | | 5.000% | | 2/1/21 | | | 1,000 | | 1,056 | |
| California Municipal Finance Authority Revenue (Community Hospitals of Central California Obligated Group) | | 5.000% | | 2/1/21 | | | 1,000 | | 1,056 | |
| California Municipal Finance Authority Revenue (Community Hospitals of Central California Obligated Group) | | 5.000% | | 2/1/22 | | | 500 | | 539 | |
| California Municipal Finance Authority Revenue (Community Hospitals of Central California Obligated Group) | | 5.000% | | 2/1/22 | | | 1,000 | | 1,079 | |
| California Municipal Finance Authority Revenue (Community Hospitals of Central California Obligated Group) | | 5.000% | | 2/1/23 | | | 835 | | 919 | |
| California Municipal Finance Authority Revenue (Community Hospitals of Central California Obligated Group) | | 5.000% | | 2/1/23 | | | 1,000 | | 1,100 | |
| California Municipal Finance Authority Revenue (Community Hospitals of Central California Obligated Group) | | 5.000% | | 2/1/24 | | | 3,435 | | 3,844 | |
| California Municipal Finance Authority Revenue (Community Hospitals of Central California Obligated Group) | | 5.000% | | 2/1/24 | | | 500 | | 559 | |
| California Municipal Finance Authority Revenue (Community Hospitals of Central California Obligated Group) | | 5.000% | | 2/1/25 | | | 1,700 | | 1,930 | |
| California Municipal Finance Authority Revenue (Community Hospitals of Central California Obligated Group) | | 5.000% | | 2/1/25 | | | 650 | | 738 | |
| California Municipal Finance Authority Revenue (Community Hospitals of Central California Obligated Group) | | 5.000% | | 2/1/26 | | | 2,025 | | 2,324 | |
| California Municipal Finance Authority Revenue (Community Hospitals of Central California Obligated Group) | | 5.000% | | 2/1/26 | | | 700 | | 791 | |
| California Municipal Finance Authority Revenue (Community Hospitals of Central California Obligated Group) | | 5.000% | | 2/1/27 | | | 1,500 | | 1,732 | |
64
California Intermediate-Term Tax-Exempt Fund
| | | | | | | | Face | | Market | |
| | | | | Maturity | | | Amount | | Value· | |
| | | Coupon | | Date | | | ($000 | ) | ($000 | ) |
| California Municipal Finance Authority Revenue (Community Hospitals of Central California Obligated Group) | | 5.000% | | 2/1/27 | | | 600 | | 675 | |
| California Municipal Finance Authority Revenue (Community Hospitals of Central California Obligated Group) | | 5.000% | | 2/1/28 | | | 750 | | 839 | |
| California Municipal Finance Authority Revenue (Community Hospitals of Central California Obligated Group) | | 5.000% | | 2/1/29 | | | 1,895 | | 2,110 | |
| California Municipal Finance Authority Revenue (Community Hospitals of Central California Obligated Group) | | 5.000% | | 2/1/31 | | | 3,470 | | 3,825 | |
| California Municipal Finance Authority Revenue (Community Hospitals of Central California Obligated Group) | | 5.000% | | 2/1/32 | | | 3,620 | | 4,071 | |
| California Municipal Finance Authority Revenue (Community Hospitals of Central California Obligated Group) | | 5.000% | | 2/1/32 | | | 3,655 | | 4,016 | |
| California Municipal Finance Authority Revenue (Community Hospitals of Central California Obligated Group) | | 5.000% | | 2/1/33 | | | 3,225 | | 3,608 | |
| California Municipal Finance Authority Revenue (Community Hospitals of Central California Obligated Group) | | 5.000% | | 2/1/33 | | | 3,835 | | 4,201 | |
| California Municipal Finance Authority Revenue (Community Hospitals of Central California Obligated Group) | | 5.000% | | 2/1/34 | | | 4,250 | | 4,727 | |
| California Municipal Finance Authority Revenue (Community Hospitals of Central California Obligated Group) | | 5.000% | | 2/1/34 | | | 4,035 | | 4,404 | |
| California Municipal Finance Authority Revenue (Community Hospitals of Central California Obligated Group) | | 5.000% | | 2/1/35 | | | 4,675 | | 5,175 | |
| California Municipal Finance Authority Revenue (Community Hospitals of Central California Obligated Group) | | 5.000% | | 2/1/35 | | | 4,000 | | 4,355 | |
| California Municipal Finance Authority Revenue (Community Hospitals of Central California Obligated Group) | | 5.000% | | 2/1/36 | | | 2,000 | | 2,202 | |
| California Municipal Finance Authority Revenue (Community Hospitals of Central California Obligated Group) | | 5.000% | | 2/1/37 | | | 1,500 | | 1,646 | |
| California Municipal Finance Authority Revenue (Eisenhower Medical Center) | | 5.000% | | 7/1/20 | (ETM) | | 1,375 | | 1,442 | |
| California Municipal Finance Authority Revenue (Eisenhower Medical Center) | | 5.125% | | 7/1/20 | (Prere.) | | 2,150 | | 2,259 | |
| California Municipal Finance Authority Revenue (Eisenhower Medical Center) | | 5.000% | | 7/1/24 | | | 1,000 | | 1,115 | |
| California Municipal Finance Authority Revenue (Eisenhower Medical Center) | | 5.000% | | 7/1/25 | | | 1,350 | | 1,521 | |
| California Municipal Finance Authority Revenue (Eisenhower Medical Center) | | 5.000% | | 7/1/27 | | | 700 | | 797 | |
| California Municipal Finance Authority Revenue (Eisenhower Medical Center) | | 5.000% | | 7/1/28 | | | 1,365 | | 1,545 | |
65
California Intermediate-Term Tax-Exempt Fund
| | | | | | | | Face | | Market | |
| | | | | Maturity | | | Amount | | Value· | |
| | | Coupon | | Date | | | ($000 | ) | ($000 | ) |
| California Municipal Finance Authority Revenue (Eisenhower Medical Center) | | 5.000% | | 7/1/29 | | | 1,520 | | 1,710 | |
| California Municipal Finance Authority Revenue (Eisenhower Medical Center) | | 5.000% | | 7/1/ 30 | | | 1,000 | | 1,119 | |
| California Municipal Finance Authority Revenue (Eisenhower Medical Center) | | 5.000% | | 7/1/30 | | | 770 | | 862 | |
| California Municipal Finance Authority Revenue (Eisenhower Medical Center) | | 5.000% | | 7/1/31 | | | 1,000 | | 1,115 | |
| California Municipal Finance Authority Revenue (Eisenhower Medical Center) | | 5.000% | | 7/1/31 | | | 1,000 | | 1,115 | |
| California Municipal Finance Authority Revenue (Eisenhower Medical Center) | | 5.000% | | 7/1/32 | | | 900 | | 1,001 | |
| California Municipal Finance Authority Revenue (Eisenhower Medical Center) | | 5.000% | | 7/1/33 | | | 1,500 | | 1,661 | |
| California Municipal Finance Authority Revenue (Eisenhower Medical Center) | | 5.000% | | 7/1/33 | | | 1,030 | | 1,140 | |
| California Municipal Finance Authority Revenue (Eisenhower Medical Center) | | 5.000% | | 7/1/34 | | | 1,575 | | 1,736 | |
| California Municipal Finance Authority Revenue (Eisenhower Medical Center) | | 5.000% | | 7/1/35 | | | 1,745 | | 1,917 | |
| California Municipal Finance Authority Revenue (Eisenhower Medical Center) | | 5.000% | | 7/1/35 | | | 2,000 | | 2,197 | |
| California Municipal Finance Authority Revenue (Eisenhower Medical Center) | | 5.000% | | 7/1/36 | | | 1,900 | | 2,079 | |
| California Municipal Finance Authority Revenue (Eisenhower Medical Center) | | 5.000% | | 7/1/36 | | | 1,800 | | 1,969 | |
| California Municipal Finance Authority Revenue (Eisenhower Medical Center) | | 5.000% | | 7/1/37 | | | 1,510 | | 1,649 | |
| California Municipal Finance Authority Revenue (Emerson College) | | 5.000% | | 1/1/25 | | | 650 | | 726 | |
| California Municipal Finance Authority Revenue (Emerson College) | | 5.000% | | 1/1/26 | | | 1,975 | | 2,228 | |
| California Municipal Finance Authority Revenue (Emerson College) | | 5.000% | | 1/1/27 | | | 1,170 | | 1,329 | |
| California Municipal Finance Authority Revenue (Emerson College) | | 5.000% | | 1/1/28 | | | 680 | | 777 | |
| California Municipal Finance Authority Revenue (Emerson College) | | 5.000% | | 1/1/29 | | | 500 | | 567 | |
| California Municipal Finance Authority Revenue (Emerson College) | | 5.000% | | 1/1/30 | | | 600 | | 677 | |
| California Municipal Finance Authority Revenue (Emerson College) | | 5.000% | | 1/1/31 | | | 1,020 | | 1,147 | |
| California Municipal Finance Authority Revenue (Emerson College) | | 5.000% | | 1/1/32 | | | 645 | | 723 | |
| California Municipal Finance Authority Revenue (Emerson College) | | 5.000% | | 1/1/33 | | | 700 | | 781 | |
| California Municipal Finance Authority Revenue (Emerson College) | | 5.000% | | 1/1/34 | | | 1,000 | | 1,110 | |
| California Municipal Finance Authority Revenue (Emerson College) | | 5.000% | | 1/1/36 | | | 1,750 | | 1,925 | |
| California Municipal Finance Authority Revenue (Emerson College) | | 5.000% | | 1/1/37 | | | 1,000 | | 1,098 | |
| California Municipal Finance Authority Revenue (Institute on Aging Project) | | 5.000% | | 8/15/26 | | | 630 | | 749 | |
66
California Intermediate-Term Tax-Exempt Fund
| | | | | | | | Face | | Market | |
| | | | | Maturity | | | Amount | | Value· | |
| | | Coupon | | Date | | | ($000 | ) | ($000 | ) |
| California Municipal Finance Authority Revenue (Institute on Aging Project) | | 5.000% | | 8/15/28 | | | 940 | | 1,120 | |
| California Municipal Finance Authority Revenue (Institute on Aging Project) | | 5.000% | | 8/15/30 | | | 1,435 | | 1,684 | |
| California Municipal Finance Authority Revenue (Institute on Aging Project) | | 5.000% | | 8/15/31 | | | 1,380 | | 1,614 | |
| California Municipal Finance Authority Revenue (Institute on Aging Project) | | 5.000% | | 8/15/35 | | | 975 | | 1,123 | |
| California Municipal Finance Authority Revenue (NorthBay Healthcare Group) | | 4.000% | | 11/1/22 | | | 1,000 | | 1,040 | |
| California Municipal Finance Authority Revenue (NorthBay Healthcare Group) | | 4.000% | | 11/1/23 | | | 2,465 | | 2,577 | |
| California Municipal Finance Authority Revenue (NorthBay Healthcare Group) | | 5.000% | | 11/1/23 | | | 1,000 | | 1,091 | |
| California Municipal Finance Authority Revenue (NorthBay Healthcare Group) | | 5.000% | | 11/1/24 | | | 1,000 | | 1,103 | |
| California Municipal Finance Authority Revenue (NorthBay Healthcare Group) | | 5.000% | | 11/1/24 | | | 1,825 | | 2,013 | |
| California Municipal Finance Authority Revenue (NorthBay Healthcare Group) | | 5.000% | | 11/1/25 | | | 1,000 | | 1,113 | |
| California Municipal Finance Authority Revenue (NorthBay Healthcare Group) | | 5.000% | | 11/1/25 | | | 1,000 | | 1,113 | |
| California Municipal Finance Authority Revenue (NorthBay Healthcare Group) | | 5.000% | | 11/1/26 | | | 1,000 | | 1,119 | |
| California Municipal Finance Authority Revenue (NorthBay Healthcare Group) | | 5.000% | | 11/1/26 | | | 1,000 | | 1,119 | |
| California Municipal Finance Authority Revenue (NorthBay Healthcare Group) | | 5.000% | | 11/1/27 | | | 1,000 | | 1,123 | |
| California Municipal Finance Authority Revenue (NorthBay Healthcare Group) | | 5.000% | | 11/1/27 | | | 1,500 | | 1,663 | |
| California Municipal Finance Authority Revenue (NorthBay Healthcare Group) | | 5.000% | | 11/1/28 | | | 3,500 | | 3,941 | |
| California Municipal Finance Authority Revenue (NorthBay Healthcare Group) | | 5.000% | | 11/1/28 | | | 1,500 | | 1,650 | |
| California Municipal Finance Authority Revenue (NorthBay Healthcare Group) | | 5.250% | | 11/1/29 | | | 1,250 | | 1,384 | |
| California Municipal Finance Authority Revenue (NorthBay Healthcare Group) | | 5.000% | | 11/1/30 | | | 1,450 | | 1,575 | |
| California Municipal Finance Authority Revenue (NorthBay Healthcare Group) | | 5.250% | | 11/1/31 | | | 1,340 | | 1,467 | |
| California Municipal Finance Authority Revenue (NorthBay Healthcare Group) | | 5.250% | | 11/1/36 | | | 8,700 | | 9,337 | |
| California Municipal Finance Authority Revenue (Pomona College) | | 5.000% | | 1/1/32 | | | 1,150 | | 1,362 | |
| California Municipal Finance Authority Revenue (Pomona College) | | 5.000% | | 1/1/33 | | | 510 | | 602 | |
| California Municipal Finance Authority Revenue (Pomona College) | | 3.000% | | 1/1/34 | | | 1,250 | | 1,180 | |
| California Municipal Finance Authority Revenue (Pomona College) | | 3.125% | | 1/1/36 | | | 1,525 | | 1,436 | |
| California Municipal Finance Authority Revenue (Pomona College) | | 4.000% | | 1/1/37 | | | 1,400 | | 1,460 | |
| California Municipal Finance Authority Revenue (Pomona College) | | 4.000% | | 1/1/38 | | | 1,835 | | 1,907 | |
67
California Intermediate-Term Tax-Exempt Fund
| | | | | | | | Face | | Market | |
| | | | | Maturity | | | Amount | | Value· | |
| | | Coupon | | Date | | | ($000 | ) | ($000 | ) |
| California Municipal Finance Authority Revenue (Retirement Housing Foundation Obligated Group) | | 5.000% | | 11/15/24 | | | 300 | | 336 | |
| California Municipal Finance Authority Revenue (Retirement Housing Foundation Obligated Group) | | 5.000% | | 11/15/25 | | | 400 | | 453 | |
| California Municipal Finance Authority Revenue (Retirement Housing Foundation Obligated Group) | | 5.000% | | 11/15/26 | | | 475 | | 542 | |
| California Municipal Finance Authority Revenue (Retirement Housing Foundation Obligated Group) | | 5.000% | | 11/15/27 | | | 650 | | 746 | |
| California Municipal Finance Authority Revenue (Retirement Housing Foundation Obligated Group) | | 5.000% | | 11/15/28 | | | 450 | | 519 | |
| California Municipal Finance Authority Revenue (University of La Verne) | | 4.000% | | 6/1/19 | | | 400 | | 404 | |
| California Municipal Finance Authority Revenue (University of La Verne) | | 5.000% | | 6/1/19 | (ETM) | | 2,375 | | 2,414 | |
| California Municipal Finance Authority Revenue (University of La Verne) | | 5.000% | | 6/1/20 | | | 300 | | 314 | |
| California Municipal Finance Authority Revenue (University of La Verne) | | 5.000% | | 6/1/21 | | | 350 | | 374 | |
| California Municipal Finance Authority Revenue (University of La Verne) | | 5.000% | | 6/1/22 | | | 250 | | 273 | |
| California Municipal Finance Authority Revenue (University of La Verne) | | 5.000% | | 6/1/23 | | | 625 | | 697 | |
| California Municipal Finance Authority Revenue (University of La Verne) | | 5.000% | | 6/1/24 | | | 350 | | 397 | |
| California Municipal Finance Authority Revenue (University of La Verne) | | 5.000% | | 6/1/25 | | | 1,000 | | 1,153 | |
| California Municipal Finance Authority Revenue (University of La Verne) | | 5.000% | | 6/1/27 | | | 2,565 | | 3,023 | |
| California Municipal Finance Authority Student Housing Revenue (Bowles Hall Foundation) | | 5.000% | | 6/1/35 | | | 1,270 | | 1,356 | |
| California Municipal Finance Authority Water Revenue (San Bernardino Municipal Water Department) | | 5.000% | | 8/1/31 | (15) | | 1,455 | | 1,646 | |
| California Municipal Finance Authority Water Revenue (San Bernardino Municipal Water Department) | | 5.000% | | 8/1/36 | (15) | | 1,805 | | 2,006 | |
| California Pollution Control Financing Authority Revenue (Pacific Gas & Electric Co.) VRDO | | 2.050% | | 12/3/18 | LOC | | 56,970 | | 56,970 | |
| California Public Finance Authority Revenue (Henry Mayo Newhall Memorial Hospital) | | 5.000% | | 10/15/29 | | | 700 | | 765 | |
| California Public Finance Authority Revenue (Henry Mayo Newhall Memorial Hospital) | | 5.000% | | 10/15/30 | | | 500 | | 544 | |
| California Public Finance Authority Revenue (Henry Mayo Newhall Memorial Hospital) | | 5.000% | | 10/15/31 | | | 535 | | 580 | |
| California Public Finance Authority Revenue (Henry Mayo Newhall Memorial Hospital) | | 5.000% | | 10/15/32 | | | 500 | | 541 | |
| California Public Finance Authority Revenue (Henry Mayo Newhall Memorial Hospital) | | 5.000% | | 10/15/33 | | | 500 | | 539 | |
| California Public Works Board Lease Revenue | | 5.000% | | 3/1/20 | | | 7,955 | | 8,263 | |
68
California Intermediate-Term Tax-Exempt Fund
| | | | | | | | Face | | Market | |
| | | | | Maturity | | | Amount | | Value· | |
| | | Coupon | | Date | | | ($000 | ) | ($000 | ) |
| California Public Works Board Lease Revenue | | 5.000% | | 3/1/21 | | | 1,800 | | 1,921 | |
| California Public Works Board Lease Revenue | | 5.000% | | 10/1/21 | | | 7,510 | | 8,130 | |
| California Public Works Board Lease Revenue | | 5.000% | | 3/1/22 | | | 1,600 | | 1,746 | |
| California Public Works Board Lease Revenue | | 5.000% | | 10/1/22 | | | 5,860 | | 6,480 | |
| California Public Works Board Lease Revenue | | 5.000% | | 10/1/28 | | | 13,720 | | 16,172 | |
| California Public Works Board Lease Revenue | | 5.000% | | 10/1/29 | | | 12,260 | | 14,390 | |
| California Public Works Board Lease Revenue (Department of Corrections) | | 5.000% | | 10/1/19 | | | 5,380 | | 5,525 | |
| California Public Works Board Lease Revenue (Department of Corrections) | | 5.000% | | 6/1/20 | | | 4,180 | | 4,372 | |
| California Public Works Board Lease Revenue (Department of Corrections) | | 5.000% | | 10/1/20 | | | 5,655 | | 5,969 | |
| California Public Works Board Lease Revenue (Department of Corrections) | | 5.000% | | 6/1/21 | | | 7,375 | | 7,919 | |
| California Public Works Board Lease Revenue (Department of Corrections) | | 5.000% | | 10/1/21 | | | 1,425 | | 1,543 | |
| California Public Works Board Lease Revenue (Department of Corrections) | | 5.000% | | 10/1/21 | | | 5,945 | | 6,436 | |
| California Public Works Board Lease Revenue (Department of Corrections) | | 5.000% | | 5/1/22 | | | 4,440 | | 4,865 | |
| California Public Works Board Lease Revenue (Department of Corrections) | | 5.000% | | 6/1/22 | | | 9,425 | | 10,346 | |
| California Public Works Board Lease Revenue (Department of Corrections) | | 5.000% | | 9/1/22 | | | 3,230 | | 3,565 | |
| California Public Works Board Lease Revenue (Department of Corrections) | | 5.000% | | 10/1/22 | | | 6,250 | | 6,911 | |
| California Public Works Board Lease Revenue (Department of Corrections) | | 5.000% | | 10/1/22 | | | 1,500 | | 1,659 | |
| California Public Works Board Lease Revenue (Department of Corrections) | | 5.000% | | 5/1/23 | | | 5,295 | | 5,920 | |
| California Public Works Board Lease Revenue (Department of Corrections) | | 5.000% | | 10/1/23 | | | 3,270 | | 3,686 | |
| California Public Works Board Lease Revenue (Department of Corrections) | | 5.000% | | 10/1/23 | | | 2,350 | | 2,649 | |
| California Public Works Board Lease Revenue (Department of Corrections) | | 5.000% | | 5/1/24 | | | 5,560 | | 6,323 | |
| California Public Works Board Lease Revenue (Department of Corrections) | | 5.000% | | 9/1/24 | | | 4,270 | | 4,883 | |
| California Public Works Board Lease Revenue (Department of Corrections) | | 5.000% | | 10/1/24 | | | 1,955 | | 2,239 | |
| California Public Works Board Lease Revenue (Department of Corrections) | | 5.000% | | 6/1/25 | | | 3,080 | | 3,557 | |
| California Public Works Board Lease Revenue (Department of Corrections) | | 5.000% | | 5/1/26 | | | 5,775 | | 6,749 | |
| California Public Works Board Lease Revenue (Department of Corrections) | | 5.000% | | 5/1/27 | | | 6,435 | | 7,597 | |
| California Public Works Board Lease Revenue (Department of Corrections) | | 5.000% | | 9/1/31 | | | 5,000 | | 5,615 | |
| California Public Works Board Lease Revenue (Department of Corrections) | | 5.750% | | 10/1/31 | | | 6,000 | | 6,582 | |
| California Public Works Board Lease Revenue (Department of Corrections) | | 5.000% | | 9/1/32 | | | 5,025 | | 5,628 | |
| California Public Works Board Lease Revenue (Department of Corrections) | | 5.250% | | 10/1/32 | | | 5,015 | | 5,693 | |
69
California Intermediate-Term Tax-Exempt Fund
| | | | | | | | Face | | Market | |
| | | | | Maturity | | | Amount | | Value· | |
| | | Coupon | | Date | | | ($000 | ) | ($000 | ) |
| California Public Works Board Lease Revenue (Department of Corrections) | | 5.000% | | 9/1/33 | | | 5,000 | | 5,586 | |
| California Public Works Board Lease Revenue (Department of Corrections) | | 5.250% | | 10/1/33 | | | 3,000 | | 3,395 | |
| California Public Works Board Lease Revenue (Department of Corrections) | | 4.500% | | 9/1/35 | | | 25,000 | | 26,692 | |
| California Public Works Board Lease Revenue (Department of General Services) | | 6.000% | | 4/1/19 | (Prere.) | | 5,000 | | 5,072 | |
| California Public Works Board Lease Revenue (Department of State Hospitals) | | 5.000% | | 6/1/28 | | | 5,865 | | 6,489 | |
| California Public Works Board Lease Revenue (Department of State Hospitals) | | 5.000% | | 6/1/29 | | | 8,975 | | 9,905 | |
| California Public Works Board Lease Revenue (Judicial Council Projects) | | 5.000% | | 12/1/24 | | | 400 | | 434 | |
| California Public Works Board Lease Revenue (Judicial Council Projects) | | 5.000% | | 3/1/25 | | | 1,525 | | 1,696 | |
| California Public Works Board Lease Revenue (Judicial Council Projects) | | 5.250% | | 12/1/25 | | | 1,575 | | 1,719 | |
| California Public Works Board Lease Revenue (Judicial Council Projects) | | 5.000% | | 3/1/26 | | | 1,600 | | 1,773 | |
| California Public Works Board Lease Revenue (Judicial Council Projects) | | 5.000% | | 12/1/27 | | | 7,000 | | 7,583 | |
| California Public Works Board Lease Revenue (Judicial Council Projects) | | 5.000% | | 3/1/28 | | | 2,860 | | 3,150 | |
| California Public Works Board Lease Revenue (Judicial Council Projects) | | 5.000% | | 12/1/28 | | | 4,980 | | 5,392 | |
| California Public Works Board Lease Revenue (Judicial Council Projects) | | 5.000% | | 3/1/29 | | | 2,500 | | 2,747 | |
| California Public Works Board Lease Revenue (Judicial Council Projects) | | 5.000% | | 12/1/29 | | | 5,000 | | 5,414 | |
| California Public Works Board Lease Revenue (Judicial Council Projects) | | 5.000% | | 3/1/32 | | | 3,200 | | 3,502 | |
| California Public Works Board Lease Revenue (Judicial Council Projects) | | 5.000% | | 3/1/33 | | | 1,650 | | 1,803 | |
| California Public Works Board Lease Revenue (Regents of The University of California) | | 5.000% | | 6/1/20 | (ETM) | | 7,670 | | 8,044 | |
| California Public Works Board Lease Revenue (Regents of The University of California) | | 5.000% | | 10/1/21 | (ETM) | | 1,650 | | 1,795 | |
| California Public Works Board Lease Revenue (Riverside Campus) | | 5.000% | | 4/1/27 | | | 2,565 | | 3,025 | |
| California Public Works Board Lease Revenue (Riverside Campus) | | 5.000% | | 4/1/28 | | | 4,000 | | 4,693 | |
| California Public Works Board Lease Revenue (Riverside Campus) | | 5.000% | | 4/1/29 | | | 5,235 | | 6,110 | |
| California Public Works Board Lease Revenue (Riverside Campus) | | 5.000% | | 4/1/30 | | | 2,435 | | 2,831 | |
| California Public Works Board Lease Revenue (Riverside Campus) | | 5.000% | | 4/1/32 | | | 2,000 | | 2,306 | |
| California Public Works Board Lease Revenue (Riverside Campus) | | 5.000% | | 4/1/33 | | | 500 | | 574 | |
| California Public Works Board Lease Revenue (Riverside Campus) | | 5.000% | | 4/1/34 | | | 2,575 | | 2,942 | |
| California Public Works Board Lease Revenue (Various Capital Projects) | | 5.250% | | 11/1/19 | (Prere.) | | 5,000 | | 5,164 | |
70
California Intermediate-Term Tax-Exempt Fund
| | | | | | | | Face | | Market | |
| | | | | Maturity | | | Amount | | Value· | |
| | | Coupon | | Date | | | ($000 | ) | ($000 | ) |
| California Public Works Board Lease Revenue (Various Capital Projects) | | 5.000% | | 1/1/20 | | | 10,000 | | 10,338 | |
| California Public Works Board Lease Revenue (Various Capital Projects) | | 5.000% | | 4/1/20 | | | 4,160 | | 4,331 | |
| California Public Works Board Lease Revenue (Various Capital Projects) | | 5.000% | | 5/1/20 | | | 5,850 | | 6,105 | |
| California Public Works Board Lease Revenue (Various Capital Projects) | | 5.000% | | 12/1/20 | | | 1,600 | | 1,697 | |
| California Public Works Board Lease Revenue (Various Capital Projects) | | 5.000% | | 12/1/21 | | | 2,965 | | 3,223 | |
| California Public Works Board Lease Revenue (Various Capital Projects) | | 5.000% | | 12/1/21 | | | 1,110 | | 1,207 | |
| California Public Works Board Lease Revenue (Various Capital Projects) | | 5.000% | | 12/1/21 | (Prere.) | | 5,000 | | 5,466 | |
| California Public Works Board Lease Revenue (Various Capital Projects) | | 5.000% | | 12/1/21 | (ETM) | | 5,400 | | 5,903 | |
| California Public Works Board Lease Revenue (Various Capital Projects) | | 5.000% | | 12/1/21 | (Prere.) | | 2,645 | | 2,891 | |
| California Public Works Board Lease Revenue (Various Capital Projects) | | 5.000% | | 5/1/22 | | | 2,775 | | 3,040 | |
| California Public Works Board Lease Revenue (Various Capital Projects) | | 5.000% | | 5/1/22 | | | 2,620 | | 2,871 | |
| California Public Works Board Lease Revenue (Various Capital Projects) | | 5.000% | | 9/1/22 | (Prere.) | | 3,000 | | 3,341 | |
| California Public Works Board Lease Revenue (Various Capital Projects) | | 5.000% | | 9/1/22 | (Prere.) | | 3,000 | | 3,341 | |
| California Public Works Board Lease Revenue (Various Capital Projects) | | 5.000% | | 11/1/22 | | | 1,575 | | 1,745 | |
| California Public Works Board Lease Revenue (Various Capital Projects) | | 5.000% | | 12/1/22 | | | 1,195 | | 1,326 | |
| California Public Works Board Lease Revenue (Various Capital Projects) | | 5.000% | | 4/1/23 | | | 4,180 | | 4,568 | |
| California Public Works Board Lease Revenue (Various Capital Projects) | | 5.000% | | 5/1/23 | | | 2,765 | | 3,091 | |
| California Public Works Board Lease Revenue (Various Capital Projects) | | 5.000% | | 11/1/23 | | | 1,035 | | 1,146 | |
| California Public Works Board Lease Revenue (Various Capital Projects) | | 5.000% | | 5/1/24 | | | 2,890 | | 3,287 | |
| California Public Works Board Lease Revenue (Various Capital Projects) | | 5.000% | | 11/1/24 | | | 2,055 | | 2,272 | |
| California Public Works Board Lease Revenue (Various Capital Projects) | | 5.000% | | 11/1/25 | | | 3,610 | | 3,988 | |
| California Public Works Board Lease Revenue (Various Capital Projects) | | 5.000% | | 5/1/26 | | | 3,205 | | 3,746 | |
| California Public Works Board Lease Revenue (Various Capital Projects) | | 5.000% | | 4/1/27 | | | 5,000 | | 5,860 | |
| California Public Works Board Lease Revenue (Various Capital Projects) | | 5.000% | | 5/1/27 | | | 3,350 | | 3,955 | |
| California Public Works Board Lease Revenue (Various Capital Projects) | | 5.000% | | 11/1/27 | | | 5,020 | | 5,875 | |
| California Public Works Board Lease Revenue (Various Capital Projects) | | 5.000% | | 5/1/28 | | | 3,520 | | 4,191 | |
| California Public Works Board Lease Revenue (Various Capital Projects) | | 5.000% | | 5/1/28 | | | 4,395 | | 5,024 | |
71
California Intermediate-Term Tax-Exempt Fund
| | | | | | | | Face | | Market | |
| | | | | Maturity | | | Amount | | Value· | |
| | | Coupon | | Date | | | ($000 | ) | ($000 | ) |
| California Public Works Board Lease Revenue (Various Capital Projects) | | 5.000% | | 11/1/28 | | | 16,235 | | 18,895 | |
| California Public Works Board Lease Revenue (Various Capital Projects) | | 5.000% | | 5/1/29 | | | 3,695 | | 4,378 | |
| California Public Works Board Lease Revenue (Various Capital Projects) | | 5.000% | | 5/1/29 | | | 1,175 | | 1,338 | |
| California Public Works Board Lease Revenue (Various Capital Projects) | | 4.000% | | 4/1/30 | | | 14,980 | | 15,966 | |
| California Public Works Board Lease Revenue (Various Capital Projects) | | 5.000% | | 5/1/30 | | | 1,250 | | 1,418 | |
| California Public Works Board Lease Revenue (Various Capital Projects) | | 5.500% | | 11/1/30 | | | 5,595 | | 6,351 | |
| California Public Works Board Lease Revenue (Various Capital Projects) | | 5.000% | | 11/1/31 | | | 1,650 | | 1,806 | |
| California Public Works Board Lease Revenue (Various Capital Projects) | | 5.500% | | 11/1/31 | | | 7,150 | | 8,105 | |
| California Public Works Board Lease Revenue (Various Capital Projects) | | 4.000% | | 4/1/32 | | | 14,895 | | 15,706 | |
| California Public Works Board Lease Revenue (Various Capital Projects) | | 5.000% | | 10/1/32 | | | 4,520 | | 5,237 | |
| California Public Works Board Lease Revenue (Various Capital Projects) | | 5.000% | | 11/1/32 | | | 11,465 | | 12,552 | |
| California Public Works Board Lease Revenue (Various Capital Projects) | | 5.500% | | 11/1/33 | | | 4,670 | | 5,275 | |
| California School Finance Authority Charter School Revenue (Aspire Public Schools) | | 5.000% | | 8/1/22 | | | 1,545 | | 1,658 | |
| California School Finance Authority Charter School Revenue (Aspire Public Schools) | | 5.000% | | 8/1/23 | | | 800 | | 869 | |
| California School Finance Authority Charter School Revenue (Aspire Public Schools) | | 5.000% | | 8/1/24 | | | 350 | | 384 | |
| California School Finance Authority Revenue (Green Dot Public Schools Obligated Group) | | 5.000% | | 8/1/21 | | | 175 | | 185 | |
| California School Finance Authority Revenue (Green Dot Public Schools Obligated Group) | | 5.000% | | 8/1/22 | | | 335 | | 359 | |
| California School Finance Authority Revenue (Green Dot Public Schools Obligated Group) | | 5.000% | | 8/1/23 | | | 345 | | 374 | |
| California School Finance Authority Revenue (Green Dot Public Schools Obligated Group) | | 5.000% | | 8/1/24 | | | 320 | | 349 | |
| California School Finance Authority Revenue (Green Dot Public Schools Obligated Group) | | 5.000% | | 8/1/25 | | | 150 | | 165 | |
| California School Finance Authority Revenue (Green Dot Public Schools Obligated Group) | | 5.000% | | 8/1/26 | | | 150 | | 165 | |
| California School Finance Authority Revenue (Green Dot Public Schools Obligated Group) | | 5.000% | | 8/1/27 | | | 160 | | 177 | |
| California School Finance Authority Revenue (Green Dot Public Schools Obligated Group) | | 5.000% | | 8/1/28 | | | 190 | | 211 | |
| California School Finance Authority Revenue (Green Dot Public Schools Obligated Group) | | 5.000% | | 8/1/38 | | | 2,000 | | 2,130 | |
| California State University Systemwide Revenue | | 5.000% | | 11/1/19 | | | 2,300 | | 2,369 | |
| California State University Systemwide Revenue | | 5.000% | | 11/1/20 | | | 1,670 | | 1,774 | |
| California State University Systemwide Revenue | | 5.000% | | 11/1/22 | | | 1,500 | | 1,678 | |
| California State University Systemwide Revenue | | 5.000% | | 11/1/23 | | | 4,020 | | 4,376 | |
| California State University Systemwide Revenue | | 5.000% | | 11/1/24 | | | 4,505 | | 5,257 | |
| California State University Systemwide Revenue | | 5.000% | | 11/1/24 | | | 2,935 | | 3,188 | |
72
California Intermediate-Term Tax-Exempt Fund
| | | | | | | | Face | | Market | |
| | | | | Maturity | | | Amount | | Value· | |
| | | Coupon | | Date | | | ($000 | ) | ($000 | ) |
| California State University Systemwide Revenue | | 5.000% | | 11/1/25 | | | 1,255 | | 1,492 | |
| California State University Systemwide Revenue | | 5.000% | | 11/1/27 | | | 2,130 | | 2,503 | |
| California State University Systemwide Revenue | | 5.000% | | 11/1/27 | | | 5,740 | | 6,220 | |
| California State University Systemwide Revenue | | 5.000% | | 11/1/28 | | | 2,635 | | 3,081 | |
| California State University Systemwide Revenue | | 5.000% | | 11/1/28 | | | 5,000 | | 5,733 | |
| California State University Systemwide Revenue | | 4.000% | | 11/1/29 | | | 6,675 | | 7,037 | |
| California State University Systemwide Revenue | | 5.000% | | 11/1/30 | | | 2,920 | | 3,381 | |
| California State University Systemwide Revenue | | 5.000% | | 11/1/30 | | | 2,035 | | 2,361 | |
| California State University Systemwide Revenue | | 4.000% | | 11/1/31 | | | 8,145 | | 8,498 | |
| California State University Systemwide Revenue | | 5.000% | | 11/1/31 | | | 8,900 | | 10,094 | |
| California State University Systemwide Revenue | | 5.000% | | 11/1/31 | | | 10,080 | | 11,638 | |
| California State University Systemwide Revenue | | 5.000% | | 11/1/31 | | | 8,280 | | 9,549 | |
| California State University Systemwide Revenue | | 5.000% | | 11/1/32 | | | 6,080 | | 7,076 | |
| California State University Systemwide Revenue | | 5.000% | | 11/1/32 | | | 5,080 | | 5,841 | |
| California State University Systemwide Revenue | | 5.000% | | 11/1/32 | | | 12,995 | | 14,968 | |
| California State University Systemwide Revenue | | 5.000% | | 11/1/33 | | | 6,335 | | 7,332 | |
| California State University Systemwide Revenue | | 5.000% | | 11/1/33 | | | 10,135 | | 11,611 | |
| California State University Systemwide Revenue | | 5.000% | | 11/1/33 | | | 5,775 | | 6,632 | |
| California State University Systemwide Revenue | | 4.000% | | 11/1/34 | | | 10,025 | | 10,470 | |
| California State University Systemwide Revenue | | 5.000% | | 11/1/34 | | | 8,525 | | 9,970 | |
| California State University Systemwide Revenue | | 5.000% | | 11/1/34 | | | 5,000 | | 5,755 | |
| California State University Systemwide Revenue | | 5.000% | | 11/1/34 | | | 5,000 | | 5,630 | |
| California State University Systemwide Revenue | | 4.000% | | 11/1/35 | | | 10,890 | | 11,324 | |
| California State University Systemwide Revenue | | 5.000% | | 11/1/35 | | | 5,000 | | 5,825 | |
| California State University Systemwide Revenue | | 5.000% | | 11/1/35 | | | 8,000 | | 9,176 | |
| California State University Systemwide Revenue | | 5.000% | | 11/1/35 | | | 6,775 | | 7,609 | |
| California State University Systemwide Revenue | | 5.000% | | 11/1/35 | | | 13,205 | | 15,076 | |
| California State University Systemwide Revenue | | 5.000% | | 11/1/36 | | | 10,500 | | 12,158 | |
| California State University Systemwide Revenue | | 5.000% | | 11/1/36 | | | 1,300 | | 1,483 | |
| California State University Systemwide Revenue | | 5.000% | | 11/1/36 | | | 3,000 | | 3,393 | |
| California State University Systemwide Revenue | | 5.000% | | 11/1/37 | | | 10,405 | | 12,026 | |
| California State University Systemwide Revenue | | 5.000% | | 11/1/37 | | | 3,705 | | 4,217 | |
| California State University Systemwide Revenue | | 5.000% | | 11/1/38 | | | 5,495 | | 6,331 | |
| California State University Systemwide Revenue PUT | | 4.000% | | 11/1/21 | | | 23,465 | | 24,414 | |
| California State University Systemwide Revenue PUT | | 4.000% | | 11/1/23 | | | 19,435 | | 20,899 | |
5 | California Statewide Communities Development Authority Hospital Revenue (Methodist Hospital of Southern California) | | 5.000% | | 1/1/26 | | | 1,050 | | 1,187 | |
5 | California Statewide Communities Development Authority Hospital Revenue (Methodist Hospital of Southern California) | | 5.000% | | 1/1/27 | | | 1,900 | | 2,161 | |
5 | California Statewide Communities Development Authority Hospital Revenue (Methodist Hospital of Southern California) | | 5.000% | | 1/1/28 | | | 3,000 | | 3,430 | |
5 | California Statewide Communities Development Authority Hospital Revenue (Methodist Hospital of Southern California) | | 5.000% | | 1/1/29 | | | 3,140 | | 3,545 | |
| California Statewide Communities Development Authority Pollution Control Revenue (Southern California Edison Co.) PUT | | 2.625% | | 12/1/23 | | | 10,500 | | 10,294 | |
73
California Intermediate-Term Tax-Exempt Fund
| | | | | | | | Face | | Market | |
| | | | | Maturity | | | Amount | | Value· | |
| | | Coupon | | Date | | | ($000 | ) | ($000 | ) |
| California Statewide Communities Development Authority Revenue (899 Charleston Project) | | 5.000% | | 11/1/19 | | | 175 | | 179 | |
| California Statewide Communities Development Authority Revenue (899 Charleston Project) | | 5.000% | | 11/1/24 | | | 1,000 | | 1,058 | |
| California Statewide Communities Development Authority Revenue (899 Charleston Project) | | 5.000% | | 11/1/29 | | | 1,650 | | 1,719 | |
| California Statewide Communities Development Authority Revenue (899 Charleston Project) | | 5.000% | | 11/1/34 | | | 3,700 | | 3,810 | |
| California Statewide Communities Development Authority Revenue (Adventist Health System/West) | | 4.000% | | 3/1/19 | | | 500 | | 503 | |
| California Statewide Communities Development Authority Revenue (Adventist Health System/West) | | 4.000% | | 3/1/20 | | | 750 | | 770 | |
| California Statewide Communities Development Authority Revenue (Adventist Health System/West) | | 5.000% | | 3/1/22 | | | 1,500 | | 1,640 | |
| California Statewide Communities Development Authority Revenue (Adventist Health System/West) | | 5.000% | | 3/1/23 | | | 145 | | 162 | |
| California Statewide Communities Development Authority Revenue (Adventist Health System/West) | | 5.000% | | 3/1/23 | | | 1,535 | | 1,716 | |
| California Statewide Communities Development Authority Revenue (Adventist Health System/West) | | 5.000% | | 3/1/24 | | | 200 | | 228 | |
| California Statewide Communities Development Authority Revenue (Adventist Health System/West) | | 5.000% | | 3/1/24 | | | 1,095 | | 1,248 | |
| California Statewide Communities Development Authority Revenue (Adventist Health System/West) | | 5.000% | | 3/1/25 | | | 410 | | 475 | |
| California Statewide Communities Development Authority Revenue (Adventist Health System/West) | | 5.000% | | 3/1/25 | | | 765 | | 887 | |
| California Statewide Communities Development Authority Revenue (Adventist Health System/West) | | 5.000% | | 3/1/26 | | | 460 | | 540 | |
| California Statewide Communities Development Authority Revenue (Adventist Health System/West) | | 5.000% | | 3/1/26 | | | 1,500 | | 1,762 | |
| California Statewide Communities Development Authority Revenue (Adventist Health System/West) | | 5.000% | | 3/1/27 | | | 615 | | 729 | |
| California Statewide Communities Development Authority Revenue (Adventist Health System/West) | | 5.000% | | 3/1/28 | | | 575 | | 686 | |
| California Statewide Communities Development Authority Revenue (Adventist Health System/West) | | 5.000% | | 3/1/29 | | | 1,000 | | 1,184 | |
74
California Intermediate-Term Tax-Exempt Fund
| | | | | | | | Face | | Market | |
| | | | | Maturity | | | Amount | | Value· | |
| | | Coupon | | Date | | | ($000 | ) | ($000 | ) |
| California Statewide Communities Development Authority Revenue (Adventist Health System/West) | | 5.000% | | 3/1/30 | | | 850 | | 997 | |
| California Statewide Communities Development Authority Revenue (Adventist Health System/West) | | 5.000% | | 3/1/30 | | | 6,380 | | 7,275 | |
| California Statewide Communities Development Authority Revenue (Adventist Health System/West) | | 5.000% | | 3/1/31 | | | 700 | | 816 | |
| California Statewide Communities Development Authority Revenue (Adventist Health System/West) | | 5.000% | | 3/1/32 | | | 800 | | 927 | |
| California Statewide Communities Development Authority Revenue (Adventist Health System/West) | | 5.000% | | 3/1/32 | | | 5,000 | | 5,681 | |
| California Statewide Communities Development Authority Revenue (Adventist Health System/West) | | 5.000% | | 3/1/34 | | | 1,000 | | 1,149 | |
| California Statewide Communities Development Authority Revenue (Adventist Health System/West) | | 5.000% | | 3/1/35 | | | 1,475 | | 1,689 | |
| California Statewide Communities Development Authority Revenue (Adventist Health System/West) | | 3.500% | | 3/1/38 | | | 625 | | 582 | |
| California Statewide Communities Development Authority Revenue (Beverly Community Hospital Association) | | 4.000% | | 11/1/21 | | | 215 | | 222 | |
| California Statewide Communities Development Authority Revenue (Beverly Community Hospital Association) | | 5.000% | | 11/1/22 | | | 225 | | 242 | |
| California Statewide Communities Development Authority Revenue (Beverly Community Hospital Association) | | 5.000% | | 11/1/23 | | | 235 | | 257 | |
| California Statewide Communities Development Authority Revenue (Beverly Community Hospital Association) | | 3.000% | | 11/1/24 | | | 245 | | 244 | |
| California Statewide Communities Development Authority Revenue (Beverly Community Hospital Association) | | 3.000% | | 11/1/25 | | | 260 | | 258 | |
| California Statewide Communities Development Authority Revenue (Beverly Community Hospital Association) | | 3.125% | | 11/1/26 | | | 265 | | 263 | |
| California Statewide Communities Development Authority Revenue (Beverly Community Hospital Association) | | 5.000% | | 11/1/27 | | | 270 | | 305 | |
| California Statewide Communities Development Authority Revenue (Buck Institute for Age Research) | | 5.000% | | 11/15/19 | (4) | | 250 | | 258 | |
| California Statewide Communities Development Authority Revenue (Buck Institute for Age Research) | | 5.000% | | 11/15/20 | (4) | | 210 | | 223 | |
| California Statewide Communities Development Authority Revenue (Buck Institute for Age Research) | | 5.000% | | 11/15/21 | (4) | | 200 | | 217 | |
75
California Intermediate-Term Tax-Exempt Fund
| | | | | | | | Face | | Market | |
| | | | | Maturity | | | Amount | | Value· | |
| | | Coupon | | Date | | | ($000 | ) | ($000 | ) |
| California Statewide Communities Development Authority Revenue (Buck Institute for Age Research) | | 5.000% | | 11/15/22 | (4) | | 200 | | 222 | |
| California Statewide Communities Development Authority Revenue (Buck Institute for Age Research) | | 5.000% | | 11/15/23 | (4) | | 400 | | 454 | |
| California Statewide Communities Development Authority Revenue (Buck Institute for Age Research) | | 5.000% | | 11/15/24 | (4) | | 500 | | 578 | |
| California Statewide Communities Development Authority Revenue (Buck Institute for Age Research) | | 5.000% | | 11/15/27 | (4) | | 1,660 | | 1,877 | |
| California Statewide Communities Development Authority Revenue (Buck Institute for Age Research) | | 5.000% | | 11/15/28 | (4) | | 900 | | 1,013 | |
| California Statewide Communities Development Authority Revenue (Buck Institute for Age Research) | | 5.000% | | 11/15/34 | (4) | | 2,500 | | 2,758 | |
| California Statewide Communities Development Authority Revenue (Citrus Valley Health Partners) | | 5.900% | | 12/28/18 | (14) | | 6,800 | | 6,800 | |
| California Statewide Communities Development Authority Revenue (Cottage Health System Obligated Group) | | 4.000% | | 11/1/19 | | | 375 | | 382 | |
| California Statewide Communities Development Authority Revenue (Cottage Health System Obligated Group) | | 5.000% | | 11/1/20 | | | 100 | | 105 | |
| California Statewide Communities Development Authority Revenue (Cottage Health System Obligated Group) | | 4.000% | | 11/1/21 | | | 345 | | 363 | |
| California Statewide Communities Development Authority Revenue (Cottage Health System Obligated Group) | | 5.000% | | 11/1/22 | | | 375 | | 413 | |
| California Statewide Communities Development Authority Revenue (Cottage Health System Obligated Group) | | 5.000% | | 11/1/23 | | | 275 | | 309 | |
| California Statewide Communities Development Authority Revenue (Cottage Health System Obligated Group) | | 5.000% | | 11/1/24 | | | 320 | | 365 | |
| California Statewide Communities Development Authority Revenue (Cottage Health System Obligated Group) | | 5.000% | | 11/1/25 | | | 355 | | 404 | |
| California Statewide Communities Development Authority Revenue (Cottage Health System Obligated Group) | | 5.000% | | 11/1/26 | | | 325 | | 368 | |
| California Statewide Communities Development Authority Revenue (Cottage Health System Obligated Group) | | 5.000% | | 11/1/27 | | | 750 | | 845 | |
| California Statewide Communities Development Authority Revenue (Cottage Health System Obligated Group) | | 5.000% | | 11/1/28 | | | 1,310 | | 1,470 | |
| California Statewide Communities Development Authority Revenue (Cottage Health System Obligated Group) | | 5.000% | | 11/1/29 | | | 700 | | 782 | |
76
California Intermediate-Term Tax-Exempt Fund
| | | | | | | | Face | | Market | |
| | | | | Maturity | | | Amount | | Value· | |
| | | Coupon | | Date | | | ($000 | ) | ($000 | ) |
| California Statewide Communities Development Authority Revenue (Cottage Health System Obligated Group) | | 5.000% | | 11/1/30 | | | 1,040 | | 1,160 | |
| California Statewide Communities Development Authority Revenue (Cottage Health System Obligated Group) | | 5.250% | | 11/1/30 | | | 11,500 | | 12,158 | |
| California Statewide Communities Development Authority Revenue (Cottage Health System Obligated Group) | | 5.000% | | 11/1/31 | | | 1,100 | | 1,224 | |
| California Statewide Communities Development Authority Revenue (Cottage Health System Obligated Group) | | 5.000% | | 11/1/32 | | | 1,690 | | 1,879 | |
| California Statewide Communities Development Authority Revenue (Daughters of Charity Health System) | | 5.500% | | 7/1/22 | | | 2,480 | | 2,113 | |
| California Statewide Communities Development Authority Revenue (Daughters of Charity Health System) | | 5.750% | | 7/1/24 | | | 8,230 | | 6,979 | |
| California Statewide Communities Development Authority Revenue (Daughters of Charity Health System) | | 5.750% | | 7/1/25 | | | 1,130 | | 957 | |
| California Statewide Communities Development Authority Revenue (Enloe Medical Center) | | 5.000% | | 8/15/30 | | | 2,500 | | 2,870 | |
| California Statewide Communities Development Authority Revenue (Enloe Medical Center) | | 5.000% | | 8/15/31 | | | 4,040 | | 4,612 | |
| California Statewide Communities Development Authority Revenue (Enloe Medical Center) | | 5.000% | | 8/15/33 | | | 4,000 | | 4,540 | |
| California Statewide Communities Development Authority Revenue (Enloe Medical Center) | | 5.000% | | 8/15/34 | | | 4,795 | | 5,415 | |
| California Statewide Communities Development Authority Revenue (Enloe Medical Center) | | 5.000% | | 8/15/35 | | | 1,000 | | 1,126 | |
| California Statewide Communities Development Authority Revenue (Episcopal Communities & Services) | | 5.000% | | 5/15/27 | | | 500 | | 538 | |
| California Statewide Communities Development Authority Revenue (Episcopal Communities & Services) | | 5.000% | | 5/15/32 | | | 680 | | 722 | |
| California Statewide Communities Development Authority Revenue (Eskaton Properties Inc. Obligated Group) | | 5.000% | | 11/15/23 | | | 1,110 | | 1,213 | |
| California Statewide Communities Development Authority Revenue (Eskaton Properties Inc. Obligated Group) | | 5.250% | | 11/15/34 | | | 4,350 | | 4,618 | |
| California Statewide Communities Development Authority Revenue (Front Porch Communities) | | 5.000% | | 4/1/20 | | | 240 | | 250 | |
| California Statewide Communities Development Authority Revenue (Front Porch Communities) | | 5.000% | | 4/1/21 | | | 170 | | 181 | |
77
California Intermediate-Term Tax-Exempt Fund
| | | | | | | | Face | | Market | |
| | | | | Maturity | | | Amount | | Value· | |
| | | Coupon | | Date | | | ($000 | ) | ($000 | ) |
| California Statewide Communities Development Authority Revenue (Front Porch Communities) | | 5.000% | | 4/1/22 | | | 120 | | 130 | |
| California Statewide Communities Development Authority Revenue (Front Porch Communities) | | 5.000% | | 4/1/23 | | | 200 | | 221 | |
| California Statewide Communities Development Authority Revenue (Front Porch Communities) | | 5.000% | | 4/1/26 | | | 350 | | 403 | |
| California Statewide Communities Development Authority Revenue (Front Porch Communities) | | 5.000% | | 4/1/27 | | | 160 | | 186 | |
| California Statewide Communities Development Authority Revenue (Front Porch Communities) | | 5.000% | | 4/1/28 | | | 420 | | 485 | |
| California Statewide Communities Development Authority Revenue (Front Porch Communities) | | 5.000% | | 4/1/29 | | | 470 | | 539 | |
| California Statewide Communities Development Authority Revenue (Front Porch Communities) | | 4.000% | | 4/1/32 | | | 255 | | 265 | |
| California Statewide Communities Development Authority Revenue (Front Porch Communities) | | 4.000% | | 4/1/34 | | | 350 | | 360 | |
| California Statewide Communities Development Authority Revenue (Front Porch Communities) | | 4.000% | | 4/1/36 | | | 630 | | 644 | |
| California Statewide Communities Development Authority Revenue (Front Porch Communities) | | 4.000% | | 4/1/37 | | | 650 | | 663 | |
| California Statewide Communities Development Authority Revenue (Huntington Memorial Hospital) | | 5.000% | | 7/1/19 | | | 500 | | 509 | |
| California Statewide Communities Development Authority Revenue (Huntington Memorial Hospital) | | 5.000% | | 7/1/20 | | | 330 | | 345 | |
| California Statewide Communities Development Authority Revenue (Huntington Memorial Hospital) | | 5.000% | | 7/1/20 | | | 325 | | 340 | |
| California Statewide Communities Development Authority Revenue (Huntington Memorial Hospital) | | 5.000% | | 7/1/21 | | | 305 | | 327 | |
| California Statewide Communities Development Authority Revenue (Huntington Memorial Hospital) | | 5.000% | | 7/1/21 | | | 275 | | 295 | |
| California Statewide Communities Development Authority Revenue (Huntington Memorial Hospital) | | 5.000% | | 7/1/22 | | | 420 | | 460 | |
| California Statewide Communities Development Authority Revenue (Huntington Memorial Hospital) | | 5.000% | | 7/1/22 | | | 250 | | 274 | |
| California Statewide Communities Development Authority Revenue (Huntington Memorial Hospital) | | 5.000% | | 7/1/23 | | | 300 | | 334 | |
78
California Intermediate-Term Tax-Exempt Fund
| | | | | | | | Face | | Market | |
| | | | | Maturity | | | Amount | | Value· | |
| | | Coupon | | Date | | | ($000 | ) | ($000 | ) |
| California Statewide Communities Development Authority Revenue (Huntington Memorial Hospital) | | 5.000% | | 7/1/23 | | | 665 | | 741 | |
| California Statewide Communities Development Authority Revenue (Huntington Memorial Hospital) | | 5.000% | | 7/1/24 | | | 300 | | 339 | |
| California Statewide Communities Development Authority Revenue (Huntington Memorial Hospital) | | 5.000% | | 7/1/24 | | | 800 | | 904 | |
| California Statewide Communities Development Authority Revenue (Huntington Memorial Hospital) | | 5.000% | | 7/1/25 | | | 300 | | 343 | |
| California Statewide Communities Development Authority Revenue (Huntington Memorial Hospital) | | 5.000% | | 7/1/25 | | | 1,140 | | 1,288 | |
| California Statewide Communities Development Authority Revenue (Huntington Memorial Hospital) | | 5.000% | | 7/1/26 | | | 325 | | 375 | |
| California Statewide Communities Development Authority Revenue (Huntington Memorial Hospital) | | 5.000% | | 7/1/26 | | | 1,010 | | 1,135 | |
| California Statewide Communities Development Authority Revenue (Huntington Memorial Hospital) | | 5.000% | | 7/1/27 | | | 2,020 | | 2,261 | |
| California Statewide Communities Development Authority Revenue (Huntington Memorial Hospital) | | 5.000% | | 7/1/28 | | | 3,000 | | 3,344 | |
| California Statewide Communities Development Authority Revenue (Huntington Memorial Hospital) | | 5.000% | | 7/1/29 | | | 3,000 | | 3,330 | |
| California Statewide Communities Development Authority Revenue (Huntington Memorial Hospital) | | 5.000% | | 7/1/30 | | | 4,575 | | 5,058 | |
| California Statewide Communities Development Authority Revenue (Huntington Memorial Hospital) | | 5.000% | | 7/1/31 | | | 4,000 | | 4,406 | |
| California Statewide Communities Development Authority Revenue (Huntington Memorial Hospital) | | 5.000% | | 7/1/32 | | | 3,790 | | 4,162 | |
| California Statewide Communities Development Authority Revenue (Huntington Memorial Hospital) | | 5.000% | | 7/1/33 | | | 2,500 | | 2,735 | |
| California Statewide Communities Development Authority Revenue (Huntington Memorial Hospital) | | 5.000% | | 7/1/34 | | | 2,000 | | 2,180 | |
| California Statewide Communities Development Authority Revenue (Huntington Memorial Hospital) | | 5.000% | | 7/1/36 | | | 590 | | 661 | |
| California Statewide Communities Development Authority Revenue (Huntington Memorial Hospital) | | 5.000% | | 7/1/37 | | | 500 | | 558 | |
| California Statewide Communities Development Authority Revenue (Huntington Memorial Hospital) | | 5.000% | | 7/1/38 | | | 710 | | 790 | |
79
California Intermediate-Term Tax-Exempt Fund
| | | | | | | | Face | | Market | |
| | | | | Maturity | | | Amount | | Value· | |
| | | Coupon | | Date | | | ($000 | ) | ($000 | ) |
| California Statewide Communities Development Authority Revenue (Loma Linda University Medical Center) | | 5.000% | | 12/1/26 | | | 300 | | 331 | |
| California Statewide Communities Development Authority Revenue (Loma Linda University Medical Center) | | 5.000% | | 12/1/27 | | | 350 | | 388 | |
| California Statewide Communities Development Authority Revenue (Loma Linda University Medical Center) | | 5.000% | | 12/1/27 | | | 1,000 | | 1,078 | |
| California Statewide Communities Development Authority Revenue (Loma Linda University Medical Center) | | 5.000% | | 12/1/28 | | | 285 | | 308 | |
| California Statewide Communities Development Authority Revenue (Loma Linda University Medical Center) | | 5.250% | | 12/1/29 | | | 14,165 | | 15,228 | |
| California Statewide Communities Development Authority Revenue (Loma Linda University Medical Center) | | 5.000% | | 12/1/31 | | | 2,695 | | 2,854 | |
| California Statewide Communities Development Authority Revenue (Loma Linda University Medical Center) | | 5.000% | | 12/1/33 | | | 1,460 | | 1,543 | |
| California Statewide Communities Development Authority Revenue (Loma Linda University Medical Center) | | 5.250% | | 12/1/38 | | | 2,000 | | 2,124 | |
| California Statewide Communities Development Authority Revenue (Marin General Hospital) | | 5.000% | | 8/1/24 | | | 150 | | 171 | |
| California Statewide Communities Development Authority Revenue (Marin General Hospital) | | 5.000% | | 8/1/25 | | | 250 | | 289 | |
| California Statewide Communities Development Authority Revenue (Marin General Hospital) | | 5.000% | | 8/1/26 | | | 370 | | 432 | |
| California Statewide Communities Development Authority Revenue (Marin General Hospital) | | 5.000% | | 8/1/27 | | | 250 | | 293 | |
| California Statewide Communities Development Authority Revenue (Marin General Hospital) | | 5.000% | | 8/1/28 | | | 300 | | 353 | |
| California Statewide Communities Development Authority Revenue (Marin General Hospital) | | 5.000% | | 8/1/29 | | | 360 | | 421 | |
| California Statewide Communities Development Authority Revenue (Marin General Hospital) | | 5.000% | | 8/1/30 | | | 250 | | 291 | |
| California Statewide Communities Development Authority Revenue (Marin General Hospital) | | 5.000% | | 8/1/31 | | | 400 | | 464 | |
| California Statewide Communities Development Authority Revenue (Marin General Hospital) | | 5.000% | | 8/1/32 | | | 480 | | 555 | |
| California Statewide Communities Development Authority Revenue (Marin General Hospital) | | 5.000% | | 8/1/33 | | | 450 | | 518 | |
80
California Intermediate-Term Tax-Exempt Fund
| | | | | | | | Face | | Market | |
| | | | | Maturity | | | Amount | | Value· | |
| | | Coupon | | Date | | | ($000 | ) | ($000 | ) |
| California Statewide Communities Development Authority Revenue (Rady Children’s Hospital - San Diego) | | 5.000% | | 8/15/20 | | | 1,400 | | 1,471 | |
| California Statewide Communities Development Authority Revenue (Rady Children’s Hospital - San Diego) | | 5.000% | | 8/15/21 | | | 1,030 | | 1,111 | |
| California Statewide Communities Development Authority Revenue (Rady Children’s Hospital - San Diego) | | 5.000% | | 8/15/22 | | | 765 | | 845 | |
| California Statewide Communities Development Authority Revenue (Rady Children’s Hospital - San Diego) | | 5.000% | | 8/15/23 | | | 525 | | 592 | |
| California Statewide Communities Development Authority Revenue (Rady Children’s Hospital - San Diego) | | 5.000% | | 8/15/24 | | | 760 | | 874 | |
| California Statewide Communities Development Authority Revenue (Rady Children’s Hospital - San Diego) | | 5.000% | | 8/15/25 | | | 1,000 | | 1,170 | |
| California Statewide Communities Development Authority Revenue (Rady Children’s Hospital - San Diego) | | 5.000% | | 8/15/26 | | | 1,015 | | 1,204 | |
| California Statewide Communities Development Authority Revenue (Rady Children’s Hospital - San Diego) | | 5.000% | | 8/15/27 | | | 1,000 | | 1,197 | |
| California Statewide Communities Development Authority Revenue (Rady Children’s Hospital - San Diego) | | 5.000% | | 8/15/28 | | | 780 | | 941 | |
| California Statewide Communities Development Authority Revenue (Sutter Health) | | 5.000% | | 8/15/19 | | | 530 | | 542 | |
| California Statewide Communities Development Authority Revenue (Sutter Health) | | 5.000% | | 8/15/20 | | | 500 | | 527 | |
| California Statewide Communities Development Authority Revenue (Sutter Health) | | 5.000% | | 8/15/22 | | | 1,050 | | 1,165 | |
| California Statewide Communities Development Authority Revenue (Sutter Health) | | 5.250% | | 8/15/31 | | | 7,500 | | 8,104 | |
| California Statewide Communities Development Authority Revenue (Sutter Health) | | 5.000% | | 8/15/32 | | | 11,820 | | 12,827 | |
| California Statewide Communities Development Authority Revenue (Viamonte Senior Living 1 Inc.) | | 5.000% | | 7/1/25 | | | 100 | | 116 | |
| California Statewide Communities Development Authority Revenue (Viamonte Senior Living 1 Inc.) | | 5.000% | | 7/1/26 | | | 175 | | 207 | |
| California Statewide Communities Development Authority Revenue (Viamonte Senior Living 1 Inc.) | | 5.000% | | 7/1/27 | | | 205 | | 245 | |
| California Statewide Communities Development Authority Revenue (Viamonte Senior Living 1 Inc.) | | 5.000% | | 7/1/28 | | | 100 | | 120 | |
81
California Intermediate-Term Tax-Exempt Fund
| | | | | | | | Face | | Market | |
| | | | | Maturity | | | Amount | | Value· | |
| | | Coupon | | Date | | | ($000 | ) | ($000 | ) |
| California Statewide Communities Development Authority Revenue (Viamonte Senior Living 1 Inc.) | | 5.000% | | 7/1/29 | | | 365 | | 437 | |
| California Statewide Communities Development Authority Revenue (Viamonte Senior Living 1 Inc.) | | 5.000% | | 7/1/30 | | | 275 | | 326 | |
| California Statewide Communities Development Authority Revenue (Viamonte Senior Living Project) | | 3.000% | | 7/1/25 | | | 8,000 | | 8,084 | |
| California Statewide Communities Development Authority Revenue (Viamonte Senior Living Project) | | 3.000% | | 7/1/26 | | | 8,050 | | 8,116 | |
| California Statewide Communities Development Authority Senior Living Revenue (Southern California Presbyterian Homes) | | 7.000% | | 11/15/29 | | | 2,000 | | 2,080 | |
| California Statewide Communities Development Authority Student Housing Revenue (CHF-Irvine LLC - UCI East Campus Apartments Phase II) | | 5.000% | | 5/15/19 | | | 500 | | 506 | |
| California Statewide Communities Development Authority Student Housing Revenue (CHF-Irvine LLC - UCI East Campus Apartments Phase II) | | 5.000% | | 5/15/20 | | | 500 | | 519 | |
| California Statewide Communities Development Authority Student Housing Revenue (CHF-Irvine LLC - UCI East Campus Apartments Phase II) | | 5.000% | | 5/15/21 | | | 825 | | 874 | |
| California Statewide Communities Development Authority Student Housing Revenue (CHF-Irvine LLC - UCI East Campus Apartments Phase II) | | 5.000% | | 5/15/22 | | | 2,515 | | 2,714 | |
| California Statewide Communities Development Authority Student Housing Revenue (CHF-Irvine LLC - UCI East Campus Apartments Phase II) | | 5.000% | | 5/15/23 | | | 1,250 | | 1,371 | |
| California Statewide Communities Development Authority Student Housing Revenue (CHF-Irvine LLC - UCI East Campus Apartments Phase II) | | 5.000% | | 5/15/24 | | | 1,250 | | 1,392 | |
| California Statewide Communities Development Authority Student Housing Revenue (CHF-Irvine LLC - UCI East Campus Apartments Phase II) | | 5.000% | | 5/15/25 | | | 1,000 | | 1,128 | |
| California Statewide Communities Development Authority Student Housing Revenue (CHF-Irvine LLC - UCI East Campus Apartments Phase II) | | 5.000% | | 5/15/26 | | | 3,410 | | 3,877 | |
| California Statewide Communities Development Authority Student Housing Revenue (CHF-Irvine LLC - UCI East Campus Apartments Phase II) | | 5.000% | | 5/15/27 | | | 2,015 | | 2,274 | |
82
California Intermediate-Term Tax-Exempt Fund
| | | | | | | | Face | | Market | |
| | | | | Maturity | | | Amount | | Value· | |
| | | Coupon | | Date | | | ($000 | ) | ($000 | ) |
| California Statewide Communities Development Authority Student Housing Revenue (CHF-Irvine LLC - UCI East Campus Apartments Phase II) | | 5.000% | | 5/15/28 | | | 5,000 | | 5,613 | |
| California Statewide Communities Development Authority Student Housing Revenue (CHF-Irvine LLC - UCI East Campus Apartments Phase II) | | 5.000% | | 5/15/29 | | | 2,000 | | 2,235 | |
| California Statewide Communities Development Authority Student Housing Revenue (CHF-Irvine LLC - UCI East Campus Apartments Phase II) | | 5.125% | | 5/15/31 | | | 7,000 | | 7,382 | |
| California Statewide Communities Development Authority Student Housing Revenue (CHF-Irvine LLC - UCI East Campus Apartments Phase II) | | 5.000% | | 5/15/32 | | | 2,475 | | 2,734 | |
| California Statewide Communities Development Authority Student Housing Revenue (CHF-Irvine LLC - UCI East Campus Apartments Phase II) | | 5.000% | | 5/15/33 | | | 3,375 | | 3,714 | |
| California Statewide Communities Development Authority Student Housing Revenue (CHF-Irvine LLC - UCI East Campus Apartments Phase II) | | 5.000% | | 5/15/34 | | | 1,750 | | 1,920 | |
| California Statewide Communities Development Authority Student Housing Revenue (CHF-Irvine LLC - UCI East Campus Apartments Phase II) | | 5.000% | | 5/15/35 | | | 2,000 | | 2,186 | |
| Campbell CA Union High School District GO | | 5.000% | | 8/1/33 | | | 2,100 | | 2,424 | |
| Campbell CA Union High School District GO | | 5.000% | | 8/1/34 | | | 2,500 | | 2,870 | |
| Campbell CA Union High School District GO | | 5.000% | | 8/1/35 | | | 4,000 | | 4,574 | |
| Campbell CA Union High School District GO | | 5.000% | | 8/1/36 | | | 5,000 | | 5,690 | |
| Campbell CA Union High School District GO | | 4.000% | | 8/1/37 | | | 5,000 | | 5,157 | |
| Capistrano CA Unified School District Special Tax Revenue | | 5.000% | | 9/1/19 | (15) | | 2,080 | | 2,129 | |
| Capistrano CA Unified School District Special Tax Revenue | | 5.000% | | 9/1/21 | (15) | | 5,225 | | 5,345 | |
| Capistrano CA Unified School District Special Tax Revenue | | 4.000% | | 9/1/22 | (15) | | 6,020 | | 6,109 | |
| Capistrano CA Unified School District Special Tax Revenue | | 4.000% | | 9/1/24 | (15) | | 6,860 | | 6,959 | |
| Carlsbad CA Unified School District GO | | 4.000% | | 5/1/30 | | | 5,220 | | 5,620 | |
| Carlsbad CA Unified School District GO | | 4.000% | | 5/1/32 | | | 575 | | 611 | |
| Carlsbad CA Unified School District GO | | 4.000% | | 5/1/33 | | | 690 | | 728 | |
| Carlsbad CA Unified School District GO | | 4.000% | | 5/1/34 | | | 685 | | 717 | |
| Carson CA Redevelopment Agency Tax Allocation Revenue (Carson Merged & Amended Project Area) | | 5.000% | | 10/1/22 | | | 1,130 | | 1,251 | |
| Carson CA Redevelopment Agency Tax Allocation Revenue (Carson Merged & Amended Project Area) | | 5.000% | | 10/1/23 | | | 1,170 | | 1,322 | |
| Carson CA Redevelopment Agency Tax Allocation Revenue (Redevelopment Project Area No. 1) | | 5.000% | | 10/1/19 | (4) | | 800 | | 821 | |
83
California Intermediate-Term Tax-Exempt Fund
| | | | | | | | Face | | Market | |
| | | | | Maturity | | | Amount | | Value· | |
| | | Coupon | | Date | | | ($000 | ) | ($000 | ) |
| Carson CA Redevelopment Agency Tax Allocation Revenue (Redevelopment Project Area No. 1) | | 5.000% | | 10/1/20 | (4) | | 785 | | 829 | |
| Carson CA Redevelopment Agency Tax Allocation Revenue (Redevelopment Project Area No. 1) | | 5.000% | | 10/1/21 | (4) | | 850 | | 917 | |
| Carson CA Redevelopment Agency Tax Allocation Revenue (Redevelopment Project Area No. 1) | | 5.000% | | 10/1/22 | (4) | | 600 | | 662 | |
| Centinela Valley CA Union High School District GO | | 4.000% | | 8/1/30 | (4) | | 2,040 | | 2,184 | |
| Centinela Valley CA Union High School District GO | | 4.000% | | 8/1/31 | (4) | | 1,375 | | 1,463 | |
| Centinela Valley CA Union High School District GO | | 4.000% | | 8/1/32 | (4) | | 3,355 | | 3,553 | |
| Centinela Valley CA Union High School District GO | | 4.000% | | 8/1/33 | (4) | | 1,410 | | 1,484 | |
| Centinela Valley CA Union High School District GO | | 4.000% | | 8/1/34 | (4) | | 5,465 | | 5,712 | |
| Central CA Unified School District GO | | 5.500% | | 8/1/19 | (Prere.) | | 3,000 | | 3,076 | |
| Central Valley CA Financing Authority Cogeneration Project Revenue (Carson Ice-Gen Project) | | 5.000% | | 7/1/19 | | | 765 | | 780 | |
| Central Valley CA Financing Authority Cogeneration Project Revenue (Carson Ice-Gen Project) | | 5.250% | | 7/1/20 | | | 1,025 | | 1,081 | |
| Cerritos CA Community College District GO | | 0.000% | | 8/1/20 | | | 500 | | 484 | |
| Cerritos CA Community College District GO | | 0.000% | | 8/1/22 | | | 500 | | 461 | |
| Cerritos CA Community College District GO | | 0.000% | | 8/1/23 | | | 500 | | 448 | |
| Cerritos CA Community College District GO | | 4.000% | | 8/1/30 | | | 3,480 | | 3,667 | |
| Cerritos CA Community College District GO | | 4.000% | | 8/1/32 | | | 2,260 | | 2,351 | |
| Chabot-Las Positas CA Community College District GO | | 2.000% | | 8/1/19 | | | 1,000 | | 1,003 | |
| Chabot-Las Positas CA Community College District GO | | 3.000% | | 8/1/20 | | | 1,500 | | 1,532 | |
| Chabot-Las Positas CA Community College District GO | | 5.000% | | 8/1/20 | | | 525 | | 553 | |
| Chabot-Las Positas CA Community College District GO | | 5.000% | | 8/1/23 | | | 2,225 | | 2,524 | |
| Chabot-Las Positas CA Community College District GO | | 5.000% | | 8/1/27 | | | 2,525 | | 2,833 | |
| Chabot-Las Positas CA Community College District GO | | 5.000% | | 8/1/30 | | | 7,500 | | 8,359 | |
| Chabot-Las Positas CA Community College District GO | | 5.000% | | 8/1/31 | | | 7,500 | | 8,349 | |
| Chabot-Las Positas CA Community College District GO | | 5.000% | | 8/1/32 | | | 13,000 | | 14,453 | |
| Chabot-Las Positas CA Community College District GO | | 4.000% | | 8/1/33 | | | 450 | | 476 | |
| Chabot-Las Positas CA Community College District GO | | 4.000% | | 8/1/34 | | | 625 | | 657 | |
| Chabot-Las Positas CA Community College District GO | | 4.000% | | 8/1/34 | | | 9,940 | | 10,444 | |
84
California Intermediate-Term Tax-Exempt Fund
| | | | | | | | Face | | Market | |
| | | | | Maturity | | | Amount | | Value· | |
| | | Coupon | | Date | | | ($000 | ) | ($000 | ) |
| Chabot-Las Positas CA Community College District GO | | 4.000% | | 8/1/35 | | | 600 | | 628 | |
| Chaffey CA Community College District GO | | 5.000% | | 6/1/32 | | | 5,000 | | 5,678 | |
| Chaffey CA Union High School District GO | | 0.000% | | 8/1/20 | | | 400 | | 387 | |
| Chaffey CA Union High School District GO | | 0.000% | | 8/1/21 | | | 500 | | 473 | |
| Chaffey CA Union High School District GO | | 0.000% | | 8/1/22 | | | 500 | | 460 | |
| Chaffey CA Union High School District GO | | 0.000% | | 8/1/23 | | | 600 | | 538 | |
| Chaffey CA Union High School District GO | | 0.000% | | 8/1/24 | | | 500 | | 434 | |
| Chaffey CA Union High School District GO | | 0.000% | | 8/1/25 | | | 655 | | 545 | |
| Chaffey CA Union High School District GO | | 0.000% | | 8/1/26 | | | 1,430 | | 1,142 | |
| Chaffey CA Union High School District GO | | 0.000% | | 8/1/28 | | | 2,000 | | 1,450 | |
| Chico CA Unified School District GO | | 3.000% | | 8/1/19 | | | 1,500 | | 1,514 | |
| Chico CA Unified School District GO | | 4.000% | | 8/1/20 | | | 1,330 | | 1,380 | |
| Chico CA Unified School District GO | | 4.000% | | 8/1/21 | | | 1,200 | | 1,266 | |
| Chico CA Unified School District GO | | 4.000% | | 8/1/22 | | | 410 | | 440 | |
| Chico CA Unified School District GO | | 4.000% | | 8/1/23 | | | 450 | | 490 | |
| Chico CA Unified School District GO | | 5.000% | | 8/1/29 | | | 210 | | 243 | |
| Chico CA Unified School District GO | | 5.000% | | 8/1/30 | | | 330 | | 380 | |
| Chico CA Unified School District GO | | 5.000% | | 8/1/31 | | | 425 | | 488 | |
| Chico CA Unified School District GO | | 5.000% | | 8/1/32 | | | 385 | | 441 | |
| Chico CA Unified School District GO | | 5.000% | | 8/1/33 | | | 750 | | 857 | |
| Chico CA Unified School District GO | | 4.000% | | 8/1/36 | | | 2,025 | | 2,099 | |
| Chico CA Unified School District GO | | 4.000% | | 8/1/37 | | | 2,200 | | 2,276 | |
| Chino CA Public Financing Authority Special Tax Revenue | | 5.000% | | 9/1/24 | (4) | | 675 | | 765 | |
| Chino CA Public Financing Authority Special Tax Revenue | | 5.000% | | 9/1/25 | (4) | | 1,000 | | 1,150 | |
| Chino CA Redevelopment Agency Successor Agency Tax Allocation Revenue | | 5.000% | | 9/1/20 | (15) | | 625 | | 660 | |
| Chino CA Redevelopment Agency Successor Agency Tax Allocation Revenue | | 5.000% | | 9/1/27 | (15) | | 1,195 | | 1,343 | |
| Chino CA Redevelopment Agency Successor Agency Tax Allocation Revenue | | 5.000% | | 9/1/30 | (15) | | 1,170 | | 1,299 | |
| Chula Vista CA Municipal Financing Authority Special Tax Revenue | | 5.000% | | 9/1/19 | | | 2,265 | | 2,318 | |
| Chula Vista CA Municipal Financing Authority Special Tax Revenue | | 5.000% | | 9/1/20 | | | 1,185 | | 1,247 | |
| Chula Vista CA Municipal Financing Authority Special Tax Revenue | | 5.000% | | 9/1/21 | | | 2,500 | | 2,682 | |
| Chula Vista CA Municipal Financing Authority Special Tax Revenue | | 5.000% | | 9/1/23 | | | 2,615 | | 2,912 | |
| Chula Vista CA Municipal Financing Authority Special Tax Revenue | | 5.250% | | 9/1/24 | | | 3,225 | | 3,624 | |
| Chula Vista CA Municipal Financing Authority Special Tax Revenue | | 5.500% | | 9/1/25 | | | 3,495 | | 3,964 | |
| Chula Vista CA Municipal Financing Authority Special Tax Revenue | | 5.500% | | 9/1/26 | | | 3,685 | | 4,162 | |
| Chula Vista CA Municipal Financing Authority Special Tax Revenue | | 5.500% | | 9/1/27 | | | 970 | | 1,091 | |
6 | Citrus CA Community College District GO | | 0.000% | | 8/1/33 | | | 1,000 | | 900 | |
6 | Citrus CA Community College District GO | | 0.000% | | 8/1/35 | | | 3,150 | | 2,817 | |
| Clovis CA Unified School District GO | | 0.000% | | 8/1/32 | | | 4,185 | | 2,547 | |
| Clovis CA Unified School District GO | | 0.000% | | 8/1/33 | | | 2,700 | | 1,553 | |
| Clovis CA Unified School District GO | | 0.000% | | 8/1/34 | | | 2,000 | | 1,096 | |
85
California Intermediate-Term Tax-Exempt Fund
| | | | | | | | Face | | Market | |
| | | | | Maturity | | | Amount | | Value· | |
| | | Coupon | | Date | | | ($000 | ) | ($000 | ) |
| Clovis CA Unified School District GO | | 0.000% | | 8/1/35 | | | 2,775 | | 1,449 | |
| Clovis CA Wastewater System Revenue | | 5.000% | | 8/1/27 | (15) | | 1,015 | | 1,212 | |
| Clovis CA Wastewater System Revenue | | 5.000% | | 8/1/28 | (15) | | 1,000 | | 1,188 | |
| Clovis CA Wastewater System Revenue | | 5.000% | | 8/1/31 | (15) | | 1,380 | | 1,616 | |
| Clovis CA Wastewater System Revenue | | 5.000% | | 8/1/33 | (15) | | 1,780 | | 2,070 | |
| Clovis CA Wastewater System Revenue | | 5.000% | | 8/1/34 | (15) | | 1,000 | | 1,157 | |
| Clovis CA Wastewater System Revenue | | 5.000% | | 8/1/35 | (15) | | 1,000 | | 1,153 | |
| Clovis CA Wastewater System Revenue | | 5.000% | | 8/1/36 | (15) | | 2,000 | | 2,293 | |
| Clovis CA Wastewater System Revenue | | 5.000% | | 8/1/37 | (15) | | 1,245 | | 1,425 | |
1 | Coachella Valley CA Unified School District TOB VRDO | | 1.840% | | 12/7/18 | (15) | | 7,500 | | 7,500 | |
| Coast CA Community College District GO | | 0.000% | | 8/1/33 | | | 8,000 | | 4,521 | |
| Coast CA Community College District GO | | 5.000% | | 8/1/33 | | | 3,000 | | 3,432 | |
| Colton CA Joint Unified School District GO | | 5.000% | | 8/1/23 | (4) | | 765 | | 865 | |
| Colton CA Joint Unified School District GO | | 5.000% | | 8/1/25 | (4) | | 1,000 | | 1,123 | |
| Colton CA Redevelopment Agency Successor Agency Tax Allocation Revenue | | 5.000% | | 8/1/19 | | | 1,040 | | 1,062 | |
| Colton CA Redevelopment Agency Successor Agency Tax Allocation Revenue | | 5.000% | | 8/1/20 | (15) | | 1,230 | | 1,295 | |
| Colton CA Redevelopment Agency Successor Agency Tax Allocation Revenue | | 5.000% | | 8/1/22 | (15) | | 1,215 | | 1,337 | |
| Commerce CA Community Development Commission Successor Agency Tax Allocation Revenue | | 5.000% | | 8/1/20 | | | 915 | | 962 | |
| Commerce CA Community Development Commission Successor Agency Tax Allocation Revenue | | 5.000% | | 8/1/21 | | | 500 | | 537 | |
| Commerce CA Community Development Commission Successor Agency Tax Allocation Revenue | | 5.000% | | 8/1/22 | | | 335 | | 368 | |
| Commerce CA Community Development Commission Successor Agency Tax Allocation Revenue | | 5.000% | | 8/1/23 | (4) | | 605 | | 679 | |
| Conejo Valley CA Unified School District GO | | 0.000% | | 8/1/21 | (4) | | 2,000 | | 1,891 | |
| Conejo Valley CA Unified School District GO | | 0.000% | | 8/1/22 | (4) | | 2,750 | | 2,526 | |
| Conejo Valley CA Unified School District GO | | 0.000% | | 8/1/23 | (4) | | 2,500 | | 2,225 | |
| Conejo Valley CA Unified School District GO | | 0.000% | | 8/1/24 | (4) | | 3,000 | | 2,582 | |
| Conejo Valley CA Unified School District GO | | 0.000% | | 8/1/25 | (4) | | 3,380 | | 2,782 | |
| Conejo Valley CA Unified School District GO | | 0.000% | | 8/1/26 | (4) | | 3,500 | | 2,750 | |
| Conejo Valley CA Unified School District GO | | 0.000% | | 8/1/27 | (4) | | 3,000 | | 2,241 | |
| Conejo Valley CA Unified School District GO | | 0.000% | | 8/1/28 | (4) | | 2,290 | | 1,621 | |
| Contra Costa CA Community College District GO | | 5.000% | | 8/1/24 | | | 4,140 | | 4,581 | |
| Contra Costa CA Community College District GO | | 4.000% | | 8/1/29 | | | 2,350 | | 2,481 | |
| Contra Costa CA Community College District GO | | 5.000% | | 8/1/32 | | | 3,000 | | 3,345 | |
| Contra Costa CA Community College District GO | | 5.000% | | 8/1/33 | | | 4,000 | | 4,456 | |
| Contra Costa CA Transportation Authority Sales Tax Revenue | | 5.000% | | 3/1/30 | | | 2,000 | | 2,358 | |
| Contra Costa CA Transportation Authority Sales Tax Revenue | | 5.000% | | 3/1/31 | | | 1,275 | | 1,496 | |
86
California Intermediate-Term Tax-Exempt Fund
| | | | | | | | Face | | Market | |
| | | | | Maturity | | | Amount | | Value· | |
| | | Coupon | | Date | | | ($000 | ) | ($000 | ) |
| Contra Costa CA Transportation Authority Sales Tax Revenue | | 5.000% | | 3/1/32 | | | 1,600 | | 1,777 | |
| Contra Costa CA Transportation Authority Sales Tax Revenue | | 5.000% | | 3/1/32 | | | 2,000 | | 2,336 | |
| Contra Costa CA Transportation Authority Sales Tax Revenue | | 5.000% | | 3/1/33 | | | 1,800 | | 1,996 | |
| Contra Costa CA Transportation Authority Sales Tax Revenue | | 5.000% | | 3/1/33 | | | 6,060 | | 7,054 | |
| Contra Costa CA Transportation Authority Sales Tax Revenue | | 5.000% | | 3/1/34 | | | 5,665 | | 6,556 | |
| Contra Costa County CA Public Financing Authority Lease Revenue | | 3.000% | | 6/1/20 | | | 1,000 | | 1,020 | |
| Contra Costa County CA Public Financing Authority Lease Revenue | | 5.000% | | 6/1/20 | | | 800 | | 839 | |
| Contra Costa County CA Public Financing Authority Lease Revenue | | 5.000% | | 6/1/21 | | | 800 | | 861 | |
| Contra Costa County CA Public Financing Authority Lease Revenue | | 5.000% | | 6/1/22 | | | 600 | | 662 | |
| Contra Costa County CA Public Financing Authority Lease Revenue | | 5.000% | | 6/1/23 | | | 2,410 | | 2,721 | |
| Contra Costa County CA Public Financing Authority Lease Revenue | | 5.000% | | 6/1/23 | | | 1,130 | | 1,276 | |
| Corona-Norco CA School District Public Financing Authority Special Tax Revenue | | 5.000% | | 9/1/21 | | | 500 | | 538 | |
| Corona-Norco CA School District Public Financing Authority Special Tax Revenue | | 5.000% | | 9/1/23 | | | 500 | | 560 | |
| Corona-Norco CA Unified School District GO | | 0.000% | | 8/1/20 | (12) | | 1,825 | | 1,767 | |
| Corona-Norco CA Unified School District GO | | 0.000% | | 8/1/21 | (12) | | 2,010 | | 1,902 | |
| Corona-Norco CA Unified School District GO | | 0.000% | | 8/1/22 | (12) | | 1,700 | | 1,565 | |
| Corona-Norco CA Unified School District GO | | 0.000% | | 8/1/23 | (12) | | 1,000 | | 895 | |
| Corona-Norco CA Unified School District GO | | 0.000% | | 8/1/25 | (12) | | 1,325 | | 1,116 | |
| Corona-Norco CA Unified School District GO | | 0.000% | | 8/1/26 | (12) | | 1,530 | | 1,243 | |
| Corona-Norco CA Unified School District GO | | 0.000% | | 8/1/27 | (12) | | 1,500 | | 1,174 | |
| Corona-Norco CA Unified School District GO | | 0.000% | | 8/1/28 | (12) | | 1,290 | | 970 | |
| Corona-Norco CA Unified School District GO | | 4.000% | | 8/1/33 | | | 2,525 | | 2,678 | |
| Corona-Norco CA Unified School District GO | | 4.000% | | 8/1/33 | | | 2,000 | | 2,121 | |
| Corona-Norco CA Unified School District GO | | 4.000% | | 8/1/34 | | | 2,000 | | 2,104 | |
| Corona-Norco CA Unified School District GO | | 4.000% | | 8/1/34 | | | 3,000 | | 3,156 | |
| Corona-Norco CA Unified School District Special Tax Revenue (Community Facilities District No. 98-1) | | 5.000% | | 9/1/23 | | | 1,145 | | 1,281 | |
| Corona-Norco CA Unified School District Special Tax Revenue (Community Facilities District No. 98-1) | | 5.000% | | 9/1/24 | | | 1,325 | | 1,477 | |
| Corona-Norco CA Unified School District Special Tax Revenue (Community Facilities District No. 98-1) | | 5.000% | | 9/1/25 | | | 2,525 | | 2,805 | |
| Corona-Norco CA Unified School District Special Tax Revenue (Community Facilities District No. 98-1) | | 5.000% | | 9/1/27 | | | 1,000 | | 1,102 | |
| Corona-Norco CA Unified School District Special Tax Revenue (Community Facilities District No. 98-1) | | 5.000% | | 9/1/28 | | | 1,590 | | 1,749 | |
87
California Intermediate-Term Tax-Exempt Fund
| | | | | | | | Face | | Market | |
| | | | | Maturity | | | Amount | | Value· | |
| | | Coupon | | Date | | | ($000 | ) | ($000 | ) |
1 | Cotati-Rohnert Park CA Unified School District GO TOB VRDO | | 1.740% | | 12/7/18 | (15) | | 11,000 | | 11,000 | |
| Covina-Valley CA Unified School District GO | | 5.000% | | 8/1/29 | | | 2,000 | | 2,235 | |
| Covina-Valley CA Unified School District GO | | 5.000% | | 8/1/30 | | | 2,250 | | 2,509 | |
| Cupertino CA Union School District GO | | 5.000% | | 8/1/25 | | | 2,835 | | 3,213 | |
| Cupertino CA Union School District GO | | 5.000% | | 8/1/32 | | | 480 | | 560 | |
| Cupertino CA Union School District GO | | 5.000% | | 8/1/33 | | | 545 | | 632 | |
| Cupertino CA Union School District GO | | 5.000% | | 8/1/34 | | | 245 | | 282 | |
| Del Mar CA Race Track Authority Revenue | | 4.000% | | 10/1/21 | | | 1,380 | | 1,430 | |
| Del Mar CA Race Track Authority Revenue | | 5.000% | | 10/1/24 | | | 1,585 | | 1,778 | |
| Del Mar CA Race Track Authority Revenue | | 5.000% | | 10/1/26 | | | 1,745 | | 1,932 | |
| Del Mar CA Race Track Authority Revenue | | 5.000% | | 10/1/27 | | | 1,835 | | 2,015 | |
| Del Mar CA Race Track Authority Revenue | | 5.000% | | 10/1/29 | | | 1,010 | | 1,093 | |
| Del Mar CA Race Track Authority Revenue | | 5.000% | | 10/1/35 | | | 1,665 | | 1,771 | |
| Desert CA Community College District GO | | 5.000% | | 8/1/20 | | | 1,760 | | 1,855 | |
| Dublin CA Community Facilities District Improvement Area No. 1 Special Tax Revenue (Dublin Crossing) | | 5.000% | | 9/1/27 | | | 750 | | 815 | |
| Dublin-San Ramon CA Services District Water Revenue | | 5.000% | | 8/1/26 | | | 425 | | 506 | |
| Dublin-San Ramon CA Services District Water Revenue | | 5.000% | | 8/1/29 | | | 550 | | 654 | |
| Dublin-San Ramon CA Services District Water Revenue | | 5.000% | | 8/1/31 | | | 1,000 | | 1,177 | |
| Dublin-San Ramon CA Services District Water Revenue | | 5.000% | | 8/1/33 | | | 1,300 | | 1,516 | |
| Dublin-San Ramon CA Services District Water Revenue | | 5.000% | | 8/1/34 | | | 900 | | 1,043 | |
| Dublin-San Ramon CA Services District Water Revenue | | 5.000% | | 8/1/35 | | | 670 | | 774 | |
| Dublin-San Ramon CA Services District Water Revenue | | 5.000% | | 8/1/36 | | | 1,050 | | 1,205 | |
| Dublin-San Ramon CA Services District Water Revenue | | 5.000% | | 8/1/37 | | | 1,100 | | 1,260 | |
| East Bay CA Municipal Utility District Waste Water System Revenue | | 5.000% | | 6/1/35 | | | 8,455 | | 9,547 | |
| East Bay CA Municipal Utility District Water System Revenue | | 5.000% | | 6/1/20 | (Prere.) | | 16,020 | | 16,800 | |
| East Bay CA Municipal Utility District Water System Revenue | | 5.000% | | 6/1/20 | (Prere.) | | 2,005 | | 2,103 | |
| East Bay CA Municipal Utility District Water System Revenue | | 5.000% | | 6/1/25 | | | 6,425 | | 7,611 | |
| East Bay CA Municipal Utility District Water System Revenue | | 5.000% | | 6/1/28 | | | 5,315 | | 6,532 | |
| East Bay CA Municipal Utility District Water System Revenue | | 5.000% | | 6/1/31 | | | 3,975 | | 4,547 | |
| East Bay CA Municipal Utility District Water System Revenue | | 5.000% | | 6/1/32 | | | 4,015 | | 4,577 | |
| East Bay CA Municipal Utility District Water System Revenue | | 5.000% | | 6/1/34 | | | 1,855 | | 2,103 | |
| East Bay CA Municipal Utility District Water System Revenue | | 5.000% | | 6/1/35 | | | 8,170 | | 9,462 | |
| East Bay CA Municipal Utility District Water System Revenue | | 5.000% | | 6/1/35 | | | 3,155 | | 3,567 | |
88
California Intermediate-Term Tax-Exempt Fund
| | | | | | | | Face | | Market | |
| | | | | Maturity | | | Amount | | Value· | |
| | | Coupon | | Date | | | ($000 | ) | ($000 | ) |
| East Bay CA Municipal Utility District Water System Revenue | | 5.000% | | 6/1/36 | | | 8,050 | | 9,285 | |
| East Bay CA Regional Park District GO | | 5.000% | | 9/1/19 | (Prere.) | | 4,030 | | 4,128 | |
| East Bay CA Regional Park District GO | | 5.000% | | 9/1/28 | | | 385 | | 394 | |
| East Side CA Union High School District Santa Clara County GO | | 5.000% | | 8/1/29 | | | 6,070 | | 6,788 | |
| East Side CA Union High School District Santa Clara County GO | | 4.000% | | 8/1/33 | | | 1,425 | | 1,507 | |
| Eastern California Municipal Water District Water & Sewer | | 5.000% | | 7/1/29 | | | 2,700 | | 3,170 | |
| Eastern California Municipal Water District Water & Sewer | | 5.000% | | 7/1/30 | | | 2,600 | | 3,026 | |
| Eastern California Municipal Water District Water & Sewer | | 5.000% | | 7/1/31 | | | 5,035 | | 5,839 | |
| Eastern California Municipal Water District Water & Sewer | | 5.000% | | 7/1/32 | | | 5,060 | | 5,852 | |
| Eastern California Municipal Water District Water & Sewer | | 5.000% | | 7/1/33 | | | 5,000 | | 5,761 | |
| Eastern California Municipal Water District Water & Wastewater Revenue | | 5.000% | | 7/1/20 | | | 2,510 | | 2,641 | |
| Eastern California Municipal Water District Water & Wastewater Revenue | | 5.000% | | 7/1/22 | | | 1,035 | | 1,149 | |
| Eastern California Municipal Water District Water & Wastewater Revenue | | 5.000% | | 7/1/24 | | | 1,010 | | 1,171 | |
| Eastern California Municipal Water District Water & Wastewater Revenue | | 5.000% | | 7/1/25 | | | 1,025 | | 1,209 | |
| Eastern California Municipal Water District Water & Wastewater Revenue | | 5.000% | | 7/1/26 | | | 1,050 | | 1,257 | |
| Eastern California Municipal Water District Water & Wastewater Revenue | | 5.000% | | 7/1/27 | | | 2,455 | | 2,923 | |
| Eastern California Municipal Water District Water & Wastewater Revenue | | 5.000% | | 7/1/28 | | | 1,890 | | 2,235 | |
| Eastern California Municipal Water District Water & Wastewater Revenue | | 5.000% | | 7/1/29 | | | 3,650 | | 4,289 | |
| Eastern California Municipal Water District Water & Wastewater Revenue | | 5.000% | | 7/1/31 | | | 3,020 | | 3,514 | |
| Eastern California Municipal Water District Water & Wastewater Revenue | | 5.000% | | 7/1/32 | | | 2,500 | | 2,899 | |
| Eastern California Municipal Water District Water & Wastewater Revenue | | 5.000% | | 7/1/33 | | | 3,750 | | 4,329 | |
| Eastern California Municipal Water District Water & Wastewater Revenue | | 5.000% | | 7/1/35 | | | 4,970 | | 5,689 | |
| Eastern California Municipal Water District Water & Wastewater Revenue | | 5.000% | | 7/1/36 | | | 2,310 | | 2,635 | |
2 | Eastern California Municipal Water District Water & Wastewater Revenue PUT | | 1.940% | | 10/1/21 | | | 12,000 | | 12,000 | |
| El Camino CA Community College District GO | | 0.000% | | 8/1/29 | | | 8,085 | | 5,880 | |
| El Camino CA Community College District GO | | 0.000% | | 8/1/32 | | | 10,000 | | 6,378 | |
| El Camino CA Community College District GO | | 0.000% | | 8/1/33 | | | 3,500 | | 2,126 | |
| El Camino CA Community College District GO | | 5.000% | | 8/1/34 | | | 1,100 | | 1,261 | |
| El Camino CA Community College District GO | | 5.000% | | 8/1/36 | | | 1,400 | | 1,589 | |
| El Camino CA Healthcare District GO | | 4.000% | | 8/1/33 | | | 3,035 | | 3,203 | |
| El Dorado CA Irrigation District Revenue | | 4.500% | | 3/1/19 | (4) | | 2,000 | | 2,014 | |
| El Dorado CA Irrigation District Revenue | | 4.750% | | 3/1/20 | (4) | | 1,500 | | 1,557 | |
89
California Intermediate-Term Tax-Exempt Fund
| | | | | | | | Face | | Market | |
| | | | | Maturity | | | Amount | | Value· | |
| | | Coupon | | Date | | | ($000 | ) | ($000 | ) |
| El Dorado CA Irrigation District Revenue | | 5.000% | | 3/1/21 | (4) | | 2,280 | | 2,439 | |
| El Dorado CA Irrigation District Revenue | | 5.000% | | 3/1/28 | (4) | | 1,500 | | 1,699 | |
| El Dorado CA Irrigation District Revenue | | 5.000% | | 3/1/34 | (4) | | 5,460 | | 6,095 | |
| El Dorado County CA Community Facilities District No. 92-1 Special Tax Revenue | | 5.000% | | 9/1/21 | | | 2,000 | | 2,155 | |
| Elk Grove CA Finance Authority Special Tax Revenue | | 4.000% | | 9/1/19 | | | 655 | | 665 | |
| Elk Grove CA Finance Authority Special Tax Revenue | | 4.000% | | 9/1/20 | | | 560 | | 580 | |
| Elk Grove CA Finance Authority Special Tax Revenue | | 5.000% | | 9/1/21 | | | 465 | | 500 | |
| Elk Grove CA Finance Authority Special Tax Revenue | | 5.000% | | 9/1/22 | | | 425 | | 467 | |
| Elk Grove CA Finance Authority Special Tax Revenue | | 5.000% | | 9/1/33 | (15) | | 2,000 | | 2,247 | |
| Elk Grove CA Finance Authority Special Tax Revenue | | 5.000% | | 9/1/34 | (15) | | 3,970 | | 4,437 | |
| Elk Grove CA Finance Authority Special Tax Revenue | | 5.000% | | 9/1/35 | (15) | | 3,735 | | 4,167 | |
| Elk Grove CA Unified School District COP | | 3.000% | | 2/1/37 | (15) | | 700 | | 604 | |
| Encinitas CA Community Facilities District No. 1 Special Tax Revenue | | 5.000% | | 9/1/28 | | | 1,000 | | 1,072 | |
| Encinitas CA Community Facilities District No. 1 Special Tax Revenue | | 5.000% | | 9/1/29 | | | 800 | | 856 | |
| Escondido CA GO | | 5.000% | | 9/1/22 | | | 755 | | 839 | |
| Escondido CA GO | | 5.000% | | 9/1/23 | | | 2,030 | | 2,305 | |
| Escondido CA GO | | 5.000% | | 9/1/24 | | | 825 | | 955 | |
| Escondido CA GO | | 5.000% | | 9/1/25 | | | 1,000 | | 1,179 | |
| Evergreen CA School District Election GO | | 4.000% | | 8/1/34 | | | 1,070 | | 1,122 | |
| Evergreen CA School District Election GO | | 4.000% | | 8/1/35 | | | 335 | | 352 | |
| Evergreen CA School District Election GO | | 4.000% | | 8/1/36 | | | 1,870 | | 1,939 | |
| Evergreen CA School District Election GO | | 4.000% | | 8/1/37 | | | 1,050 | | 1,093 | |
| Fanklin-McKinley CA School District GO | | 0.000% | | 8/1/32 | (4) | | 3,000 | | 1,787 | |
| Fanklin-McKinley CA School District GO | | 0.000% | | 8/1/35 | (4) | | 1,840 | | 939 | |
| Folsom Ranch CA Financing Authority Special Tax Revenue | | 5.000% | | 9/1/27 | | | 1,000 | | 1,093 | |
| Folsom Ranch CA Financing Authority Special Tax Revenue | | 5.000% | | 9/1/32 | | | 1,820 | | 1,977 | |
| Fontana CA Community Facilities District No. 22 Special Tax Revenue (Sierra Hills South) | | 5.000% | | 9/1/26 | | | 1,725 | | 1,888 | |
| Fontana CA Community Facilities District No. 22 Special Tax Revenue (Sierra Hills South) | | 5.000% | | 9/1/27 | | | 1,810 | | 1,966 | |
| Fontana CA Community Facilities District No. 22 Special Tax Revenue (Sierra Hills South) | | 5.000% | | 9/1/28 | | | 1,900 | | 2,056 | |
| Foothill-De Anza CA Community College District GO | | 0.000% | | 8/1/32 | (14) | | 17,000 | | 10,770 | |
| Foothill/Eastern Transportation Corridor Agency California Toll Road Revenue | | 0.000% | | 1/15/20 | (4) | | 3,930 | | 3,842 | |
| Foothill/Eastern Transportation Corridor Agency California Toll Road Revenue | | 0.000% | | 1/15/21 | (4) | | 4,115 | | 3,921 | |
| Foothill/Eastern Transportation Corridor Agency California Toll Road Revenue | | 0.000% | | 1/15/22 | (4) | | 12,255 | | 11,318 | |
| Foothill/Eastern Transportation Corridor Agency California Toll Road Revenue | | 0.000% | | 1/15/23 | (4) | | 16,430 | | 14,696 | |
90
California Intermediate-Term Tax-Exempt Fund
| | | | | | | | Face | | Market | |
| | | | | Maturity | | | Amount | | Value· | |
| | | Coupon | | Date | | | ($000 | ) | ($000 | ) |
| Foothill/Eastern Transportation Corridor Agency California Toll Road Revenue | | 0.000% | | 1/15/24 | (4) | | 1,880 | | 1,619 | |
7 | Foothill/Eastern Transportation Corridor Agency California Toll Road Revenue | | 0.000% | | 1/15/25 | | | 2,130 | | 1,814 | |
8 | Foothill/Eastern Transportation Corridor Agency California Toll Road Revenue | | 0.000% | | 1/15/26 | | | 3,000 | | 2,580 | |
9 | Foothill/Eastern Transportation Corridor Agency California Toll Road Revenue | | 0.000% | | 1/15/27 | | | 5,000 | | 4,334 | |
10 | Foothill/Eastern Transportation Corridor Agency California Toll Road Revenue | | 0.000% | | 1/15/29 | (4) | | 2,000 | | 1,821 | |
11 | Foothill/Eastern Transportation Corridor Agency California Toll Road Revenue | | 0.000% | | 1/15/31 | (4) | | 1,000 | | 935 | |
| Foothill/Eastern Transportation Corridor Agency California Toll Road Revenue | | 6.250% | | 1/15/33 | | | 5,000 | | 5,711 | |
| Foothill/Eastern Transportation Corridor Agency California Toll Road Revenue PUT | | 5.000% | | 1/15/20 | | | 22,880 | | 23,251 | |
| Foothill/Eastern Transportation Corridor Agency California Toll Road Revenue PUT | | 5.500% | | 1/15/23 | | | 25,455 | | 28,050 | |
| Fremont CA Unified School District GO | | 4.000% | | 8/1/29 | | | 1,070 | | 1,142 | |
| Fremont CA Unified School District GO | | 4.000% | | 8/1/30 | | | 1,415 | | 1,503 | |
| Fremont CA Unified School District GO | | 4.000% | | 8/1/31 | | | 1,790 | | 1,895 | |
| Fremont CA Unified School District GO | | 4.000% | | 8/1/32 | | | 2,195 | | 2,317 | |
| Fremont CA Unified School District GO | | 4.000% | | 8/1/33 | | | 2,630 | | 2,765 | |
| Fremont CA Unified School District GO | | 4.000% | | 8/1/34 | | | 3,105 | | 3,251 | |
| Fremont CA Union High School District GO | | 4.000% | | 8/1/32 | | | 1,000 | | 1,051 | |
| Fremont CA Union High School District GO | | 4.000% | | 8/1/34 | | | 2,085 | | 2,172 | |
| Fresno CA Joint Powers Financing Authority Lease Revenue | | 5.000% | | 4/1/19 | | | 1,130 | | 1,141 | |
| Fresno CA Joint Powers Financing Authority Lease Revenue | | 5.000% | | 4/1/20 | | | 1,000 | | 1,037 | |
| Fresno CA Joint Powers Financing Authority Lease Revenue | | 5.000% | | 4/1/21 | | | 3,750 | | 3,991 | |
| Fresno CA Joint Powers Financing Authority Lease Revenue | | 5.000% | | 4/1/22 | (4) | | 505 | | 551 | |
| Fresno CA Joint Powers Financing Authority Lease Revenue | | 5.000% | | 4/1/23 | (4) | | 2,400 | | 2,673 | |
| Fresno CA Joint Powers Financing Authority Lease Revenue | | 5.000% | | 4/1/24 | (4) | | 1,680 | | 1,902 | |
| Fresno CA Joint Powers Financing Authority Lease Revenue | | 5.000% | | 4/1/25 | (4) | | 1,500 | | 1,716 | |
| Fresno CA Joint Powers Financing Authority Lease Revenue | | 5.000% | | 4/1/26 | (4) | | 1,650 | | 1,908 | |
| Fresno CA Joint Powers Financing Authority Lease Revenue | | 5.000% | | 4/1/27 | (4) | | 1,315 | | 1,534 | |
| Fresno CA Joint Powers Financing Authority Lease Revenue | | 5.000% | | 4/1/28 | (4) | | 1,400 | | 1,623 | |
| Fresno CA Joint Powers Financing Authority Lease Revenue | | 5.000% | | 4/1/29 | (4) | | 1,025 | | 1,181 | |
| Fresno CA Joint Powers Financing Authority Lease Revenue | | 5.000% | | 4/1/30 | (4) | | 675 | | 773 | |
| Fresno CA Joint Powers Financing Authority Lease Revenue | | 5.000% | | 4/1/31 | (4) | | 3,000 | | 3,421 | |
| Fresno CA Joint Powers Financing Authority Lease Revenue | | 5.000% | | 4/1/32 | (4) | | 1,500 | | 1,703 | |
91
California Intermediate-Term Tax-Exempt Fund
| | | | | | | | Face | | Market | |
| | | | | Maturity | | | Amount | | Value· | |
| | | Coupon | | Date | | | ($000 | ) | ($000 | ) |
| Fresno CA Joint Powers Financing Authority Lease Revenue | | 5.000% | | 4/1/34 | (4) | | 2,445 | | 2,747 | |
| Fresno CA Joint Powers Financing Authority Lease Revenue | | 5.000% | | 4/1/36 | (4) | | 2,055 | | 2,284 | |
| Fresno CA Joint Powers Financing Authority Lease Revenue | | 5.000% | | 4/1/37 | (4) | | 1,200 | | 1,331 | |
| Fresno CA Sewer Revenue | | 5.000% | | 9/1/24 | (12) | | 140 | | 140 | |
| Fullerton CA Community Facilities District No. 1 Special Tax Revenue (Amerige Heights) | | 5.000% | | 9/1/26 | | | 1,000 | | 1,082 | |
| Fullerton CA Community Facilities District No. 1 Special Tax Revenue (Amerige Heights) | | 5.000% | | 9/1/32 | | | 1,600 | | 1,727 | |
| Gavilan CA Joint Community College District GO | | 5.000% | | 8/1/32 | | | 4,200 | | 4,766 | |
| Gilroy CA School Facilities Finance Authority Revenue | | 5.000% | | 8/1/33 | | | 2,400 | | 2,659 | |
| Glendale CA Redevelopment Agency Successor Agency Tax Allocation Revenue (Central Glendale Redevelopment Project) | | 4.000% | | 12/1/22 | (15) | | 1,575 | | 1,692 | |
| Glendale CA Redevelopment Agency Successor Agency Tax Allocation Revenue (Central Glendale Redevelopment Project) | | 4.000% | | 12/1/23 | (15) | | 2,340 | | 2,543 | |
| Glendale CA Redevelopment Agency Successor Agency Tax Allocation Revenue (Central Glendale Redevelopment Project) | | 5.000% | | 12/1/24 | (15) | | 1,605 | | 1,851 | |
| Golden State Tobacco Securitization Corp. California Revenue | | 5.000% | | 6/1/19 | | | 5,640 | | 5,728 | |
| Golden State Tobacco Securitization Corp. California Revenue | | 5.000% | | 6/1/19 | | | 2,000 | | 2,031 | |
| Golden State Tobacco Securitization Corp. California Revenue | | 5.000% | | 6/1/20 | | | 1,835 | | 1,915 | |
| Golden State Tobacco Securitization Corp. California Revenue | | 5.000% | | 6/1/20 | | | 3,355 | | 3,489 | |
| Golden State Tobacco Securitization Corp. California Revenue | | 5.000% | | 6/1/21 | | | 1,000 | | 1,069 | |
| Golden State Tobacco Securitization Corp. California Revenue | | 5.000% | | 6/1/21 | | | 2,785 | | 2,961 | |
| Golden State Tobacco Securitization Corp. California Revenue | | 5.000% | | 6/1/21 | | | 5,875 | | 6,278 | |
| Golden State Tobacco Securitization Corp. California Revenue | | 5.000% | | 6/1/22 | | | 3,670 | | 3,976 | |
| Golden State Tobacco Securitization Corp. California Revenue | | 5.000% | | 6/1/22 | | | 10,020 | | 10,940 | |
| Golden State Tobacco Securitization Corp. California Revenue | | 5.000% | | 6/1/23 | | | 7,500 | | 8,258 | |
| Golden State Tobacco Securitization Corp. California Revenue | | 0.000% | | 6/1/24 | (2) | | 4,800 | | 4,172 | |
| Golden State Tobacco Securitization Corp. California Revenue | | 5.000% | | 6/1/24 | | | 11,505 | | 12,528 | |
| Golden State Tobacco Securitization Corp. California Revenue | | 5.000% | | 6/1/25 | | | 8,545 | | 9,382 | |
| Golden State Tobacco Securitization Corp. California Revenue | | 5.000% | | 6/1/26 | | | 12,470 | | 13,745 | |
| Golden State Tobacco Securitization Corp. California Revenue | | 0.000% | | 6/1/27 | (2) | | 6,500 | | 5,048 | |
92
California Intermediate-Term Tax-Exempt Fund
| | | | | | | | Face | | Market | |
| | | | | Maturity | | | Amount | | Value· | |
| | | Coupon | | Date | | | ($000 | ) | ($000 | ) |
| Golden State Tobacco Securitization Corp. California Revenue | | 5.000% | | 6/1/27 | | | 14,810 | | 16,384 | |
| Golden State Tobacco Securitization Corp. California Revenue | | 5.000% | | 6/1/28 | | | 2,500 | | 2,746 | |
| Golden State Tobacco Securitization Corp. California Revenue | | 5.000% | | 6/1/29 | | | 8,480 | | 9,311 | |
| Golden State Tobacco Securitization Corp. California Revenue | | 5.000% | | 6/1/30 | | | 19,750 | | 21,756 | |
| Golden State Tobacco Securitization Corp. California Revenue | | 4.000% | | 6/1/31 | | | 3,740 | | 3,896 | |
| Golden State Tobacco Securitization Corp. California Revenue | | 5.000% | | 6/1/32 | | | 4,605 | | 5,019 | |
| Golden State Tobacco Securitization Corp. California Revenue | | 5.000% | | 6/1/33 | | | 2,770 | | 3,005 | |
| Golden State Tobacco Securitization Corp. California Revenue | | 5.000% | | 6/1/33 | | | 9,625 | | 10,699 | |
| Golden State Tobacco Securitization Corp. California Revenue | | 5.000% | | 6/1/34 | | | 11,200 | | 12,415 | |
| Golden State Tobacco Securitization Corp. California Revenue | | 4.000% | | 6/1/35 | | | 1,170 | | 1,198 | |
| Golden State Tobacco Securitization Corp. California Revenue | | 5.000% | | 6/1/35 | | | 3,605 | | 3,980 | |
| Golden State Tobacco Securitization Corp. California Revenue | | 3.500% | | 6/1/36 | | | 29,000 | | 28,382 | |
1 | Golden State Tobacco Securitization Corp. California Revenue TOB VRDO | | 1.790% | | 12/7/18 | LOC | | 3,965 | | 3,965 | |
| Grossmont CA Union High School District GO | | 5.000% | | 8/1/22 | | | 1,275 | | 1,417 | |
| Grossmont CA Union High School District GO | | 0.000% | | 2/1/25 | (4) | | 1,400 | | 1,201 | |
| Grossmont CA Union High School District GO | | 0.000% | | 8/1/26 | (4) | | 2,040 | | 1,617 | |
| Grossmont CA Union High School District GO | | 0.000% | | 8/1/27 | (4) | | 2,825 | | 2,133 | |
| Grossmont CA Union High School District GO | | 0.000% | | 8/1/28 | | | 3,210 | | 2,410 | |
| Grossmont CA Union High School District GO | | 0.000% | | 8/1/28 | (4) | | 2,905 | | 2,085 | |
| Grossmont CA Union High School District GO | | 0.000% | | 8/1/29 | | | 6,965 | | 4,960 | |
| Grossmont CA Union High School District GO | | 4.000% | | 8/1/33 | | | 10,000 | | 10,566 | |
| Grossmont-Cuyamaca CA Community College District GO | | 0.000% | | 8/1/25 | (12) | | 14,010 | | 11,665 | |
| Grossmont-Cuyamaca CA Community College District GO | | 0.000% | | 8/1/28 | (12) | | 21,875 | | 16,114 | |
| Grossmont-Cuyamaca CA Community College District GO | | 5.000% | | 8/1/34 | | | 505 | | 596 | |
| Grossmont-Cuyamaca CA Community College District GO | | 5.000% | | 8/1/35 | | | 500 | | 587 | |
| Grossmont-Cuyamaca CA Community College District GO | | 5.000% | | 8/1/36 | | | 1,150 | | 1,342 | |
| Grossmont-Cuyamaca CA Community College District GO | | 5.000% | | 8/1/37 | | | 1,175 | | 1,367 | |
| Grossmont-Cuyamaca CA Community College District GO | | 5.000% | | 8/1/38 | | | 1,350 | | 1,564 | |
| Hanford CA Joint Union High School District Revenue | | 5.000% | | 8/1/26 | (4) | | 1,420 | | 1,651 | |
| Hanford CA Joint Union High School District Revenue | | 5.000% | | 8/1/28 | (4) | | 2,575 | | 2,957 | |
| Hanford CA Joint Union High School District Revenue | | 5.000% | | 8/1/29 | (4) | | 2,390 | | 2,729 | |
93
California Intermediate-Term Tax-Exempt Fund
| | | | | | | | Face | | Market | |
| | | | | Maturity | | | Amount | | Value· | |
| | | Coupon | | Date | | | ($000 | ) | ($000 | ) |
| Hanford CA Joint Union High School District Revenue | | 5.000% | | 8/1/31 | (4) | | 2,385 | | 2,697 | |
| Hartnell CA Community College GO | | 5.000% | | 8/1/21 | | | 525 | | 568 | |
| Hartnell CA Community College GO | | 5.000% | | 8/1/22 | | | 500 | | 554 | |
| Hayward CA Redevelopment Agency Successor Agency Tax Allocation Revenue | | 5.000% | | 9/1/27 | | | 2,000 | | 2,341 | |
| Hayward CA Redevelopment Agency Successor Agency Tax Allocation Revenue | | 5.000% | | 9/1/33 | | | 1,205 | | 1,369 | |
| Hayward CA Unified School District GO | | 0.000% | | 8/1/26 | (4) | | 640 | | 511 | |
| Hayward CA Unified School District GO | | 5.000% | | 8/1/30 | (4) | | 4,930 | | 5,538 | |
| Hayward CA Unified School District GO | | 5.000% | | 8/1/30 | (4) | | 3,465 | | 3,892 | |
| Hayward CA Unified School District GO | | 5.000% | | 8/1/31 | (4) | | 1,500 | | 1,681 | |
| Hayward CA Unified School District GO | | 5.000% | | 8/1/32 | (4) | | 1,700 | | 1,899 | |
| Hayward CA Unified School District GO | | 5.000% | | 8/1/32 | (4) | | 4,240 | | 4,737 | |
| Hayward CA Unified School District GO | | 5.000% | | 8/1/33 | (4) | | 6,130 | | 6,825 | |
| Hayward CA Unified School District GO | | 5.000% | | 8/1/33 | (4) | | 3,045 | | 3,390 | |
| Hemet CA Unified School District Financing Authority Special Tax Revenue | | 4.000% | | 9/1/19 | | | 350 | | 354 | |
| Hemet CA Unified School District Financing Authority Special Tax Revenue | | 4.000% | | 9/1/20 | | | 250 | | 257 | |
| Hemet CA Unified School District Financing Authority Special Tax Revenue | | 5.000% | | 9/1/21 | | | 175 | | 186 | |
| Hemet CA Unified School District Financing Authority Special Tax Revenue | | 5.000% | | 9/1/22 | | | 500 | | 542 | |
| Hemet CA Unified School District Financing Authority Special Tax Revenue | | 5.000% | | 9/1/23 | | | 500 | | 548 | |
| Hemet CA Unified School District Financing Authority Special Tax Revenue | | 5.000% | | 9/1/24 | | | 615 | | 680 | |
| Hemet CA Unified School District Financing Authority Special Tax Revenue | | 5.000% | | 9/1/25 | | | 385 | | 426 | |
| Hemet CA Unified School District Financing Authority Special Tax Revenue | | 5.000% | | 9/1/27 | | | 950 | | 1,040 | |
| Hemet CA Unified School District Financing Authority Special Tax Revenue | | 5.000% | | 9/1/29 | | | 1,255 | | 1,357 | |
| Hemet CA Unified School District Financing Authority Special Tax Revenue | | 5.000% | | 9/1/32 | | | 550 | | 589 | |
| Hemet CA Unified School District Financing Authority Special Tax Revenue | | 5.000% | | 9/1/33 | | | 580 | | 620 | |
| Hemet CA Unified School District Financing Authority Special Tax Revenue | | 5.000% | | 9/1/34 | | | 360 | | 383 | |
| Hollister CA Redevelopment Agency Successor Agency Tax Allocation Revenue | | 5.000% | | 10/1/27 | (15) | | 1,000 | | 1,125 | |
| Hollister CA Redevelopment Agency Successor Agency Tax Allocation Revenue | | 5.000% | | 10/1/28 | (15) | | 1,235 | | 1,387 | |
| Huntington Beach CA Union High School District GO | | 0.000% | | 8/1/34 | (4)(3) | | 5,000 | | 2,799 | |
| Imperial CA Community College District GO | | 0.000% | | 8/1/22 | (15) | | 175 | | 161 | |
| Imperial CA Community College District GO | | 0.000% | | 8/1/23 | (15) | | 250 | | 224 | |
| Imperial CA Community College District GO | | 0.000% | | 8/1/24 | (15) | | 500 | | 433 | |
| Imperial CA Community College District GO | | 0.000% | | 8/1/25 | (15) | | 725 | | 605 | |
| Imperial CA Community College District GO | | 0.000% | | 8/1/26 | (15) | | 1,005 | | 805 | |
| Imperial CA Community College District GO | | 0.000% | | 8/1/27 | (15) | | 1,580 | | 1,208 | |
| Imperial CA Community College District GO | | 0.000% | | 8/1/28 | (15) | | 1,885 | | 1,377 | |
| Imperial CA Community College District GO | | 0.000% | | 8/1/29 | (15) | | 2,000 | | 1,395 | |
94
California Intermediate-Term Tax-Exempt Fund
| | | | | | | | Face | | Market | |
| | | | | Maturity | | | Amount | | Value· | |
| | | Coupon | | Date | | | ($000 | ) | ($000 | ) |
| Imperial CA Irrigation District Electric Revenue | | 5.000% | | 11/1/20 | | | 1,000 | | 1,062 | |
| Imperial CA Irrigation District Electric Revenue | | 5.000% | | 11/1/21 | | | 1,000 | | 1,089 | |
| Imperial CA Irrigation District Electric Revenue | | 5.000% | | 11/1/22 | | | 525 | | 587 | |
| Imperial CA Irrigation District Electric Revenue | | 5.000% | | 11/1/22 | | | 1,250 | | 1,397 | |
| Imperial CA Irrigation District Electric Revenue | | 5.000% | | 11/1/23 | | | 1,500 | | 1,714 | |
| Imperial CA Irrigation District Electric Revenue | | 5.000% | | 11/1/24 | | | 670 | | 779 | |
| Imperial CA Irrigation District Electric Revenue | | 5.000% | | 11/1/24 | | | 1,025 | | 1,192 | |
| Imperial CA Irrigation District Electric Revenue | | 5.000% | | 11/1/25 | | | 1,310 | | 1,550 | |
| Imperial CA Irrigation District Electric Revenue | | 5.000% | | 11/1/26 | | | 2,265 | | 2,714 | |
| Imperial CA Irrigation District Electric Revenue | | 5.000% | | 11/1/27 | | | 500 | | 589 | |
| Imperial CA Irrigation District Electric Revenue | | 5.000% | | 11/1/28 | | | 615 | | 718 | |
| Imperial CA Irrigation District Electric Revenue | | 4.000% | | 11/1/32 | | | 2,500 | | 2,638 | |
| Imperial CA Irrigation District Electric Revenue | | 4.000% | | 11/1/33 | | | 3,000 | | 3,140 | |
| Imperial County CA Local Transportation Authority Sales Tax Revenue | | 4.000% | | 6/1/33 | (4) | | 1,365 | | 1,442 | |
| Imperial County CA Local Transportation Authority Sales Tax Revenue | | 4.000% | | 6/1/34 | (4) | | 1,470 | | 1,544 | |
| Indian Wells CA Redevelopment Agency Successor Agency Tax Allocation Revenue | | 4.000% | | 9/1/19 | (4) | | 1,225 | | 1,246 | |
| Indian Wells CA Redevelopment Agency Successor Agency Tax Allocation Revenue | | 5.000% | | 9/1/20 | (4) | | 1,285 | | 1,357 | |
| Indian Wells CA Redevelopment Agency Successor Agency Tax Allocation Revenue | | 5.000% | | 9/1/21 | (4) | | 1,615 | | 1,741 | |
| Indian Wells CA Redevelopment Agency Successor Agency Tax Allocation Revenue | | 5.000% | | 9/1/22 | (4) | | 1,195 | | 1,317 | |
| Indian Wells CA Redevelopment Agency Successor Agency Tax Allocation Revenue | | 5.000% | | 9/1/23 | (4) | | 750 | | 843 | |
| Indian Wells CA Redevelopment Agency Successor Agency Tax Allocation Revenue | | 5.000% | | 9/1/24 | (4) | | 610 | | 698 | |
| Inglewood CA Redevelopment Agency Successor Agency Tax Allocation Revenue | | 5.000% | | 5/1/21 | (15) | | 515 | | 550 | |
| Inglewood CA Redevelopment Agency Successor Agency Tax Allocation Revenue | | 5.000% | | 5/1/22 | (15) | | 375 | | 410 | |
| Inglewood CA Redevelopment Agency Successor Agency Tax Allocation Revenue | | 5.000% | | 5/1/23 | (15) | | 1,025 | | 1,144 | |
| Inglewood CA Redevelopment Agency Successor Agency Tax Allocation Revenue | | 5.000% | | 5/1/25 | (15) | | 1,600 | | 1,846 | |
| Inglewood CA Redevelopment Agency Successor Agency Tax Allocation Revenue | | 5.000% | | 5/1/27 | (15) | | 500 | | 589 | |
| Inglewood CA Redevelopment Agency Successor Agency Tax Allocation Revenue | | 5.000% | | 5/1/29 | (15) | | 1,215 | | 1,408 | |
| Inglewood CA Redevelopment Agency Successor Agency Tax Allocation Revenue | | 5.000% | | 5/1/30 | (15) | | 1,000 | | 1,148 | |
| Irvine CA Reassessment District No. 12-1 Improvement Revenue | | 4.000% | | 9/2/19 | | | 2,000 | | 2,033 | |
| Irvine CA Reassessment District No. 12-1 Improvement Revenue | | 4.000% | | 9/2/20 | | | 2,425 | | 2,514 | |
| Irvine CA Reassessment District No. 12-1 Improvement Revenue | | 4.000% | | 9/2/21 | | | 1,750 | | 1,842 | |
| Irvine CA Reassessment District No. 12-1 Improvement Revenue | | 5.000% | | 9/2/23 | | | 400 | | 442 | |
| Irvine CA Reassessment District No. 13-1 Improvement Revenue | | 5.000% | | 9/2/20 | | | 350 | | 369 | |
95
California Intermediate-Term Tax-Exempt Fund
| | | | | | | | Face | | Market | |
| | | | | Maturity | | | Amount | | Value· | |
| | | Coupon | | Date | | | ($000 | ) | ($000 | ) |
| Irvine CA Reassessment District No. 13-1 Improvement Revenue | | 5.000% | | 9/2/22 | | | 1,125 | | 1,245 | |
| Irvine CA Reassessment District No. 15-1 Improvement Revenue | | 5.000% | | 9/2/22 | | | 1,000 | | 1,107 | |
| Irvine CA Reassessment District No. 15-2 Improvement Revenue | | 4.000% | | 9/2/20 | | | 750 | | 772 | |
| Irvine CA Reassessment District No. 15-2 Improvement Revenue | | 5.000% | | 9/2/21 | | | 675 | | 722 | |
| Irvine CA Reassessment District No. 15-2 Improvement Revenue | | 5.000% | | 9/2/22 | | | 650 | | 708 | |
| Irvine CA Reassessment District No. 15-2 Improvement Revenue | | 5.000% | | 9/2/23 | | | 800 | | 887 | |
| Irvine CA Reassessment District No. 15-2 Improvement Revenue | | 5.000% | | 9/2/24 | | | 850 | | 953 | |
| Irvine CA Reassessment District No. 15-2 Improvement Revenue | | 5.000% | | 9/2/25 | | | 450 | | 508 | |
| Irvine CA Reassessment District No. 15-2 Improvement Revenue | | 5.000% | | 9/2/26 | | | 800 | | 898 | |
| Irvine CA Unified School District Community Facilities District No. 09-1 Special Tax Revenue | | 5.000% | | 9/1/21 | | | 1,500 | | 1,599 | |
| Irvine CA Unified School District Community Facilities District No. 09-1 Special Tax Revenue | | 5.000% | | 9/1/23 | | | 1,150 | | 1,261 | |
| Irvine CA Unified School District Community Facilities District No. 09-1 Special Tax Revenue | | 5.000% | | 9/1/24 | | | 1,225 | | 1,355 | |
| Irvine CA Unified School District Community Facilities District No. 09-1 Special Tax Revenue | | 5.000% | | 9/1/26 | | | 1,300 | | 1,460 | |
| Irvine CA Unified School District Community Facilities District No. 09-1 Special Tax Revenue | | 5.000% | | 9/1/28 | | | 525 | | 588 | |
| Irvine CA Unified School District Community Facilities District No. 09-1 Special Tax Revenue | | 5.000% | | 9/1/30 | | | 385 | | 427 | |
| Irvine CA Unified School District Community Facilities District No. 09-1 Special Tax Revenue | | 5.000% | | 9/1/31 | | | 200 | | 221 | |
| Irvine CA Unified School District Community Facilities District No. 09-1 Special Tax Revenue | | 5.000% | | 9/1/32 | | | 450 | | 495 | |
| Irvine CA Unified School District Community Facilities District No. 09-1 Special Tax Revenue | | 5.000% | | 9/1/32 | | | 525 | | 578 | |
| Irvine CA Unified School District Community Facilities District No. 09-1 Special Tax Revenue | | 5.000% | | 9/1/33 | | | 1,090 | | 1,196 | |
| Irvine CA Unified School District Community Facilities District No. 09-1 Special Tax Revenue | | 5.000% | | 9/1/33 | | | 250 | | 274 | |
| Irvine CA Unified School District Community Facilities District No. 09-1 Special Tax Revenue | | 5.000% | | 9/1/35 | | | 510 | | 556 | |
96
California Intermediate-Term Tax-Exempt Fund
| | | | | | | | Face | | Market | |
| | | | | Maturity | | | Amount | | Value· | |
| | | Coupon | | Date | | | ($000 | ) | ($000 | ) |
| Irvine CA Unified School District Community Facilities District No. 09-1 Special Tax Revenue | | 5.000% | | 9/1/36 | | | 350 | | 380 | |
| Irvine Ranch CA Water District COP | | 5.000% | | 3/1/32 | | | 3,630 | | 4,212 | |
| Irvine Ranch CA Water District COP | | 5.000% | | 3/1/33 | | | 2,790 | | 3,227 | |
| Irvine Ranch CA Water District COP | | 5.000% | | 3/1/34 | | | 1,300 | | 1,495 | |
| Irvine Ranch CA Water District COP | | 5.000% | | 3/1/36 | | | 1,000 | | 1,141 | |
| Irvine Ranch CA Water District Revenue | | 5.000% | | 2/1/33 | | | 1,000 | | 1,164 | |
| Irvine Ranch CA Water District Revenue | | 5.000% | | 2/1/34 | | | 2,000 | | 2,317 | |
| Irvine Ranch CA Water District Revenue | | 5.000% | | 2/1/35 | | | 2,500 | | 2,888 | |
| Irvine Ranch CA Water District Revenue | | 5.000% | | 2/1/36 | | | 2,665 | | 3,069 | |
| Jefferson CA Union High School District GO | | 5.000% | | 8/1/19 | (15) | | 625 | | 639 | |
| Jefferson CA Union High School District GO | | 5.000% | | 8/1/20 | (15) | | 500 | | 527 | |
| Jefferson CA Union High School District GO | | 5.000% | | 8/1/21 | (15) | | 500 | | 540 | |
| Jefferson CA Union High School District GO | | 5.000% | | 8/1/22 | (15) | | 700 | | 775 | |
| Jefferson CA Union High School District GO | | 5.000% | | 8/1/23 | (15) | | 1,000 | | 1,132 | |
| Jefferson CA Union High School District GO | | 5.000% | | 8/1/24 | (15) | | 875 | | 1,010 | |
| Jefferson CA Union High School District GO | | 5.000% | | 8/1/25 | (15) | | 880 | | 1,035 | |
| Jurupa CA Public Financing Authority Special Tax Revenue | | 4.000% | | 9/1/19 | | | 1,095 | | 1,113 | |
| Jurupa CA Public Financing Authority Special Tax Revenue | | 4.000% | | 9/1/20 | | | 1,385 | | 1,431 | |
| Jurupa CA Public Financing Authority Special Tax Revenue | | 5.000% | | 9/1/21 | | | 500 | | 539 | |
| Jurupa CA Public Financing Authority Special Tax Revenue | | 5.000% | | 9/1/22 | | | 1,535 | | 1,690 | |
| Jurupa CA Public Financing Authority Special Tax Revenue | | 5.000% | | 9/1/23 | | | 1,365 | | 1,530 | |
| Jurupa CA Public Financing Authority Special Tax Revenue | | 5.000% | | 9/1/24 | | | 620 | | 705 | |
| Jurupa CA Public Financing Authority Special Tax Revenue | | 5.000% | | 9/1/25 | | | 1,725 | | 1,987 | |
| Kaweah CA Delta Health Care District Revenue | | 5.000% | | 6/1/19 | | | 3,415 | | 3,463 | |
| Kaweah CA Delta Health Care District Revenue | | 5.000% | | 6/1/20 | | | 1,585 | | 1,650 | |
| Kaweah CA Delta Health Care District Revenue | | 5.000% | | 6/1/21 | | | 3,755 | | 4,000 | |
| Kaweah CA Delta Health Care District Revenue | | 5.000% | | 6/1/22 | | | 3,950 | | 4,298 | |
| Kaweah CA Delta Health Care District Revenue | | 4.000% | | 6/1/36 | | | 4,930 | | 4,909 | |
| La Quinta CA Redevelopment Agency Tax Allocation Revenue | | 5.000% | | 9/1/23 | | | 750 | | 851 | |
| La Quinta CA Redevelopment Agency Tax Allocation Revenue | | 5.000% | | 9/1/24 | | | 1,250 | | 1,411 | |
| La Quinta CA Redevelopment Agency Tax Allocation Revenue | | 5.000% | | 9/1/25 | | | 1,250 | | 1,404 | |
| La Quinta CA Redevelopment Agency Tax Allocation Revenue | | 5.000% | | 9/1/28 | | | 1,000 | | 1,142 | |
| La Quinta CA Redevelopment Agency Tax Allocation Revenue | | 5.000% | | 9/1/29 | | | 1,000 | | 1,140 | |
| La Quinta CA Redevelopment Agency Tax Allocation Revenue | | 5.000% | | 9/1/30 | | | 1,500 | | 1,666 | |
| La Quinta CA Redevelopment Agency Tax Allocation Revenue | | 5.000% | | 9/1/31 | | | 2,095 | | 2,321 | |
| La Quinta CA Redevelopment Agency Tax Allocation Revenue | | 5.000% | | 9/1/32 | | | 1,515 | | 1,715 | |
97
California Intermediate-Term Tax-Exempt Fund
| | | | | | | | Face | | Market | |
| | | | | Maturity | | | Amount | | Value· | |
| | | Coupon | | Date | | | ($000 | ) | ($000 | ) |
| La Quinta CA Redevelopment Agency Tax Allocation Revenue | | 5.000% | | 9/1/34 | | | 1,050 | | 1,182 | |
| La Verne CA (Brethren Hillcrest Homes) COP | | 5.000% | | 5/15/23 | | | 300 | | 322 | |
| La Verne CA (Brethren Hillcrest Homes) COP | | 5.000% | | 5/15/24 | | | 310 | | 331 | |
| La Verne CA (Brethren Hillcrest Homes) COP | | 5.000% | | 5/15/25 | | | 550 | | 585 | |
| La Verne CA (Brethren Hillcrest Homes) COP | | 5.000% | | 5/15/29 | | | 750 | | 782 | |
| Lancaster CA Redevelopment Agency Successor Agency Tax Allocation Revenue | | 3.000% | | 8/1/19 | | | 500 | | 504 | |
| Lancaster CA Redevelopment Agency Successor Agency Tax Allocation Revenue | | 3.000% | | 8/1/20 | | | 750 | | 764 | |
| Lancaster CA Redevelopment Agency Successor Agency Tax Allocation Revenue | | 4.000% | | 8/1/21 | | | 625 | | 654 | |
| Lancaster CA Redevelopment Agency Successor Agency Tax Allocation Revenue | | 5.000% | | 8/1/22 | | | 575 | | 630 | |
| Lancaster CA Redevelopment Agency Successor Agency Tax Allocation Revenue | | 5.000% | | 8/1/23 | (4) | | 425 | | 477 | |
| Lancaster CA Redevelopment Agency Successor Agency Tax Allocation Revenue | | 5.000% | | 8/1/24 | (4) | | 435 | | 497 | |
| Lancaster CA Redevelopment Agency Successor Agency Tax Allocation Revenue | | 5.000% | | 8/1/25 | (4) | | 600 | | 697 | |
| Lancaster CA Redevelopment Agency Successor Agency Tax Allocation Revenue | | 4.000% | | 8/1/26 | (4) | | 1,355 | | 1,501 | |
| Lancaster CA Redevelopment Agency Successor Agency Tax Allocation Revenue | | 4.000% | | 8/1/27 | (4) | | 1,890 | | 2,078 | |
| Lancaster CA Redevelopment Agency Successor Agency Tax Allocation Revenue | | 4.000% | | 8/1/28 | (4) | | 1,830 | | 1,973 | |
| Lancaster CA Redevelopment Agency Successor Agency Tax Allocation Revenue | | 5.000% | | 8/1/29 | (4) | | 865 | | 997 | |
| Lancaster CA Redevelopment Agency Successor Agency Tax Allocation Revenue | | 5.000% | | 8/1/30 | (4) | | 1,000 | | 1,147 | |
| Lancaster CA Redevelopment Agency Successor Agency Tax Allocation Revenue | | 5.000% | | 8/1/33 | (4) | | 1,200 | | 1,361 | |
| Lee Lake CA Public Financing Authority Revenue | | 5.000% | | 9/1/21 | | | 1,810 | | 1,954 | |
| Lee Lake CA Public Financing Authority Revenue | | 5.000% | | 9/1/23 | | | 2,190 | | 2,480 | |
| Liberty CA Union High School District GO | | 4.000% | | 8/1/30 | | | 750 | | 813 | |
| Liberty CA Union High School District GO | | 4.000% | | 8/1/31 | | | 565 | | 607 | |
| Lincoln CA Special Tax Revenue (Lincoln Crossing Project) | | 4.000% | | 9/1/21 | | | 650 | | 684 | |
| Lincoln CA Special Tax Revenue (Lincoln Crossing Project) | | 4.000% | | 9/1/22 | | | 450 | | 481 | |
| Lincoln CA Special Tax Revenue (Lincoln Crossing Project) | | 4.000% | | 9/1/23 | | | 450 | | 486 | |
| Lincoln CA Special Tax Revenue (Lincoln Crossing Project) | | 4.000% | | 9/1/24 | | | 600 | | 655 | |
| Lincoln CA Special Tax Revenue (Lincoln Crossing Project) | | 5.000% | | 9/1/25 | | | 550 | | 640 | |
| Lincoln CA Special Tax Revenue (Lincoln Crossing Project) | | 5.000% | | 9/1/26 | (4) | | 1,000 | | 1,181 | |
| Lincoln CA Special Tax Revenue (Lincoln Crossing Project) | | 5.000% | | 9/1/27 | (4) | | 1,000 | | 1,193 | |
| Lincoln CA Special Tax Revenue (Lincoln Crossing Project) | | 5.000% | | 9/1/28 | (4) | | 1,250 | | 1,503 | |
| Lincoln CA Special Tax Revenue (Lincoln Crossing Project) | | 5.000% | | 9/1/29 | (4) | | 2,285 | | 2,715 | |
98
California Intermediate-Term Tax-Exempt Fund
| | | | | | | | Face | | Market | |
| | | | | Maturity | | | Amount | | Value· | |
| | | Coupon | | Date | | | ($000 | ) | ($000 | ) |
| Lincoln CA Special Tax Revenue (Lincoln Crossing Project) | | 5.000% | | 9/1/30 | (4) | | 2,215 | | 2,612 | |
| Lincoln CA Special Tax Revenue (Lincoln Crossing Project) | | 5.000% | | 9/1/31 | (4) | | 2,500 | | 2,934 | |
| Lincoln CA Special Tax Revenue (Lincoln Crossing Project) | | 3.125% | | 9/1/33 | (4) | | 2,500 | | 2,424 | |
| Lincoln CA Special Tax Revenue (Lincoln Crossing Project) | | 5.000% | | 9/1/33 | (4) | | 1,625 | | 1,889 | |
| Lincoln CA Special Tax Revenue (Lincoln Crossing Project) | | 3.250% | | 9/1/34 | (4) | | 1,375 | | 1,338 | |
| Livermore Valley CA Water Financing Authority Revenue | | 5.000% | | 7/1/29 | | | 500 | | 592 | |
| Livermore Valley CA Water Financing Authority Revenue | | 5.000% | | 7/1/31 | | | 575 | | 670 | |
| Livermore Valley CA Water Financing Authority Revenue | | 5.000% | | 7/1/32 | | | 700 | | 813 | |
| Livermore Valley CA Water Financing Authority Revenue | | 5.000% | | 7/1/33 | | | 700 | | 810 | |
| Livermore Valley CA Water Financing Authority Revenue | | 5.000% | | 7/1/35 | | | 600 | | 688 | |
| Lodi CA Public Financing Authority Electric Revenue | | 5.000% | | 9/1/19 | (4) | | 400 | | 410 | |
| Lodi CA Public Financing Authority Electric Revenue | | 5.000% | | 9/1/22 | (4) | | 1,000 | | 1,104 | |
| Lodi CA Public Financing Authority Electric Revenue | | 5.000% | | 9/1/25 | (4) | | 1,300 | | 1,519 | |
| Lodi CA Public Financing Authority Electric Revenue | | 5.000% | | 9/1/28 | (4) | | 1,330 | | 1,607 | |
| Lodi CA Public Financing Authority Electric Revenue | | 5.000% | | 9/1/29 | (4) | | 650 | | 780 | |
| Lodi CA Unified School District GO | | 4.000% | | 8/1/36 | | | 4,120 | | 4,303 | |
| Lodi CA Unified School District GO | | 4.000% | | 8/1/37 | | | 2,700 | | 2,811 | |
| Long Beach CA Community College District GO | | 0.000% | | 6/1/29 | (ETM) | | 960 | | 706 | |
| Long Beach CA Community College District GO | | 0.000% | | 6/1/29 | (4) | | 5,420 | | 3,865 | |
| Long Beach CA Community College District GO | | 4.000% | | 8/1/31 | | | 1,230 | | 1,322 | |
| Long Beach CA Community College District GO | | 4.000% | | 8/1/33 | | | 760 | | 805 | |
| Long Beach CA Community College District GO | | 4.000% | | 8/1/34 | | | 600 | | 631 | |
| Long Beach CA Finance Authority Natural Gas Purchase Revenue | | 5.250% | | 11/15/19 | | | 525 | | 539 | |
| Long Beach CA Finance Authority Natural Gas Purchase Revenue | | 5.250% | | 11/15/20 | | | 3,330 | | 3,507 | |
| Long Beach CA Finance Authority Natural Gas Purchase Revenue | | 5.250% | | 11/15/21 | | | 500 | | 537 | |
| Long Beach CA Finance Authority Natural Gas Purchase Revenue | | 5.250% | | 11/15/22 | | | 260 | | 285 | |
| Long Beach CA Finance Authority Natural Gas Purchase Revenue | | 5.000% | | 11/15/24 | | | 7,960 | | 8,874 | |
| Long Beach CA Finance Authority Natural Gas Purchase Revenue | | 3.163% | | 11/15/25 | | | 16,845 | | 17,010 | |
| Long Beach CA Finance Authority Natural Gas Purchase Revenue | | 3.183% | | 11/15/26 | | | 10,025 | | 10,076 | |
| Long Beach CA Finance Authority Natural Gas Purchase Revenue | | 5.500% | | 11/15/32 | | | 2,670 | | 3,304 | |
| Long Beach CA Harbor Revenue | | 5.000% | | 12/15/20 | | | 14,000 | | 14,921 | |
99
California Intermediate-Term Tax-Exempt Fund
| | | | | | | | Face | | Market | |
| | | | | Maturity | | | Amount | | Value· | |
| | | Coupon | | Date | | | ($000 | ) | ($000 | ) |
| Long Beach CA Harbor Revenue | | 5.000% | | 5/15/33 | | | 1,000 | | 1,134 | |
| Long Beach CA Harbor Revenue | | 5.000% | | 5/15/34 | | | 2,000 | | 2,261 | |
| Long Beach CA Harbor Revenue | | 5.000% | | 5/15/35 | | | 2,825 | | 3,186 | |
| Long Beach CA Unified School District GO | | 0.000% | | 8/1/26 | (12) | | 1,450 | | 1,167 | |
| Long Beach CA Unified School District GO | | 0.000% | | 8/1/27 | | | 2,500 | | 1,917 | |
| Long Beach CA Unified School District GO | | 5.000% | | 8/1/30 | | | 5,000 | | 5,501 | |
| Los Angeles CA Community College District GO | | 5.000% | | 8/1/19 | (Prere.) | | 6,960 | | 7,116 | |
| Los Angeles CA Community College District GO | | 5.500% | | 8/1/19 | (Prere.) | | 5,000 | | 5,128 | |
| Los Angeles CA Community College District GO | | 4.000% | | 8/1/20 | | | 1,000 | | 1,037 | |
| Los Angeles CA Community College District GO | | 4.000% | | 8/1/21 | | | 555 | | 588 | |
| Los Angeles CA Community College District GO | | 5.000% | | 8/1/22 | | | 3,030 | | 3,376 | |
| Los Angeles CA Community College District GO | | 5.000% | | 8/1/24 | | | 4,895 | | 5,697 | |
| Los Angeles CA Community College District GO | | 5.000% | | 8/1/25 | | | 10,940 | | 12,977 | |
| Los Angeles CA Community College District GO | | 5.000% | | 8/1/28 | | | 25,145 | | 28,743 | |
| Los Angeles CA Community College District GO | | 4.000% | | 8/1/29 | | | 5,000 | | 5,491 | |
| Los Angeles CA Community College District GO | | 5.000% | | 8/1/29 | | | 1,500 | | 1,707 | |
| Los Angeles CA Community College District GO | | 4.000% | | 8/1/30 | | | 1,000 | | 1,053 | |
| Los Angeles CA Community College District GO | | 4.000% | | 8/1/30 | | | 9,045 | | 9,839 | |
| Los Angeles CA Community College District GO | | 4.000% | | 8/1/30 | | | 4,045 | | 4,319 | |
| Los Angeles CA Community College District GO | | 5.000% | | 8/1/30 | | | 7,125 | | 8,072 | |
| Los Angeles CA Community College District GO | | 4.000% | | 8/1/31 | | | 8,540 | | 9,199 | |
| Los Angeles CA Community College District GO | | 4.000% | | 8/1/31 | | | 6,145 | | 6,442 | |
| Los Angeles CA Community College District GO | | 4.000% | | 8/1/31 | | | 4,320 | | 4,582 | |
| Los Angeles CA Community College District GO | | 5.000% | | 8/1/31 | | | 17,830 | | 20,129 | |
| Los Angeles CA Community College District GO | | 4.000% | | 8/1/32 | | | 14,500 | | 15,275 | |
| Los Angeles CA Community College District GO | | 4.000% | | 8/1/32 | | | 2,850 | | 3,051 | |
| Los Angeles CA Community College District GO | | 4.000% | | 8/1/32 | | | 5,205 | | 5,483 | |
| Los Angeles CA Community College District GO | | 4.000% | | 8/1/33 | | | 19,215 | | 20,112 | |
| Los Angeles CA Community College District GO | | 4.000% | | 8/1/33 | | | 1,925 | | 2,044 | |
| Los Angeles CA Community College District GO | | 4.000% | | 8/1/34 | | | 3,500 | | 3,689 | |
| Los Angeles CA Community College District GO | | 4.000% | | 8/1/35 | | | 4,000 | | 4,189 | |
| Los Angeles CA Community College District GO | | 4.000% | | 8/1/36 | | | 4,700 | | 4,891 | |
| Los Angeles CA Community College District GO | | 5.000% | | 8/1/36 | | | 8,725 | | 9,967 | |
| Los Angeles CA Community College District GO | | 4.000% | | 8/1/37 | | | 6,500 | | 6,736 | |
| Los Angeles CA Community College District GO | | 4.000% | | 8/1/37 | | | 10,000 | | 10,270 | |
| Los Angeles CA Community College District GO | | 4.000% | | 8/1/37 | | | 1,000 | | 1,038 | |
| Los Angeles CA Community Facilities District No.4 Special Tax Revenue (Playa Vista - Phase 1) | | 5.000% | | 9/1/23 | | | 870 | | 978 | |
| Los Angeles CA Community Facilities District No.4 Special Tax Revenue (Playa Vista - Phase 1) | | 5.000% | | 9/1/24 | | | 1,000 | | 1,143 | |
| Los Angeles CA Community Facilities District No.4 Special Tax Revenue (Playa Vista - Phase 1) | | 5.000% | | 9/1/25 | | | 1,500 | | 1,710 | |
| Los Angeles CA Community Facilities District No.4 Special Tax Revenue (Playa Vista - Phase 1) | | 5.000% | | 9/1/26 | | | 1,200 | | 1,360 | |
| Los Angeles CA Community Facilities District No.4 Special Tax Revenue (Playa Vista - Phase 1) | | 5.000% | | 9/1/27 | | | 2,000 | | 2,255 | |
| Los Angeles CA Department of Airports International Airport Revenue | | 4.500% | | 5/15/19 | | | 1,305 | | 1,322 | |
100
California Intermediate-Term Tax-Exempt Fund
| | | | | | | | Face | | Market | |
| | | | | Maturity | | | Amount | | Value· | |
| | | Coupon | | Date | | | ($000 | ) | ($000 | ) |
| Los Angeles CA Department of Airports International Airport Revenue | | 5.000% | | 5/15/22 | | | 1,035 | | 1,145 | |
| Los Angeles CA Department of Airports International Airport Revenue | | 5.000% | | 5/15/23 | | | 950 | | 1,074 | |
| Los Angeles CA Department of Airports International Airport Revenue | | 5.000% | | 5/15/23 | | | 1,420 | | 1,570 | |
| Los Angeles CA Department of Airports International Airport Revenue | | 5.000% | | 5/15/24 | | | 1,700 | | 1,876 | |
| Los Angeles CA Department of Airports International Airport Revenue | | 5.000% | | 5/15/25 | | | 1,330 | | 1,560 | |
| Los Angeles CA Department of Airports International Airport Revenue | | 5.000% | | 5/15/25 | | | 1,500 | | 1,653 | |
| Los Angeles CA Department of Airports International Airport Revenue | | 5.000% | | 5/15/26 | | | 1,535 | | 1,772 | |
| Los Angeles CA Department of Airports International Airport Revenue | | 5.000% | | 5/15/26 | | | 5,500 | | 5,752 | |
| Los Angeles CA Department of Airports International Airport Revenue | | 5.000% | | 5/15/27 | | | 2,020 | | 2,322 | |
| Los Angeles CA Department of Airports International Airport Revenue | | 5.000% | | 5/15/28 | | | 2,000 | | 2,289 | |
| Los Angeles CA Department of Airports International Airport Revenue | | 5.250% | | 5/15/28 | | | 10,000 | | 10,500 | |
| Los Angeles CA Department of Airports International Airport Revenue | | 5.000% | | 5/15/29 | | | 4,385 | | 4,579 | |
| Los Angeles CA Department of Airports International Airport Revenue | | 5.000% | | 5/15/29 | | | 1,115 | | 1,240 | |
| Los Angeles CA Department of Airports International Airport Revenue | | 5.250% | | 5/15/29 | | | 10,000 | | 10,496 | |
| Los Angeles CA Department of Airports International Airport Revenue | | 5.000% | | 5/15/30 | | | 550 | | 641 | |
| Los Angeles CA Department of Airports International Airport Revenue | | 5.000% | | 5/15/30 | | | 1,835 | | 1,915 | |
| Los Angeles CA Department of Airports International Airport Revenue | | 5.000% | | 5/15/30 | | | 1,200 | | 1,332 | |
| Los Angeles CA Department of Airports International Airport Revenue | | 5.000% | | 5/15/31 | | | 1,190 | | 1,318 | |
| Los Angeles CA Department of Airports International Airport Revenue | | 5.000% | | 5/15/32 | | | 1,700 | | 1,879 | |
| Los Angeles CA Department of Airports nternational Airport Revenue | | 5.000% | | 5/15/33 | | | 1,800 | | 2,069 | |
| Los Angeles CA Department of Airports International Airport Revenue | | 5.000% | | 5/15/33 | | | 1,510 | | 1,667 | |
| Los Angeles CA Department of Airports International Airport Revenue | | 5.000% | | 5/15/34 | | | 1,945 | | 2,226 | |
| Los Angeles CA Department of Airports International Airport Revenue | | 5.000% | | 5/15/34 | | | 4,135 | | 4,556 | |
| Los Angeles CA Department of Airports International Airport Revenue | | 5.000% | | 5/15/34 | | | 4,750 | | 5,334 | |
| Los Angeles CA Department of Airports International Airport Revenue | | 5.000% | | 5/15/35 | | | 1,850 | | 2,112 | |
| Los Angeles CA Department of Airports International Airport Revenue | | 5.000% | | 5/15/35 | | | 2,000 | | 2,240 | |
| Los Angeles CA Department of Airports International Airport Revenue | | 5.000% | | 5/15/36 | | | 2,245 | | 2,552 | |
101
California Intermediate-Term Tax-Exempt Fund
| | | | | | | | Face | | Market | |
| | | | | Maturity | | | Amount | | Value· | |
| | | Coupon | | Date | | | ($000 | ) | ($000 | ) |
| Los Angeles CA Department of Airports International Airport Revenue | | 5.000% | | 5/15/37 | | | 2,500 | | 2,832 | |
| Los Angeles CA Department of Water & Power Revenue | | 5.000% | | 7/1/21 | (Prere.) | | 140 | | 151 | |
| Los Angeles CA Department of Water & Power Revenue | | 4.000% | | 7/1/22 | | | 1,000 | | 1,078 | |
| Los Angeles CA Department of Water & Power Revenue | | 5.000% | | 7/1/22 | | | 1,000 | | 1,112 | |
| Los Angeles CA Department of Water & Power Revenue | | 5.000% | | 7/1/22 | | | 2,575 | | 2,864 | |
| Los Angeles CA Department of Water & Power Revenue | | 5.000% | | 7/1/22 | | | 9,985 | | 10,810 | |
| Los Angeles CA Department of Water & Power Revenue | | 5.000% | | 7/1/23 | | | 1,335 | | 1,338 | |
| Los Angeles CA Department of Water & Power Revenue | | 5.000% | | 7/1/23 | | | 5,605 | | 6,219 | |
| Los Angeles CA Department of Water & Power Revenue | | 5.000% | | 7/1/24 | | | 2,770 | | 2,777 | |
| Los Angeles CA Department of Water & Power Revenue | | 5.000% | | 7/1/24 | | | 3,025 | | 3,513 | |
| Los Angeles CA Department of Water & Power Revenue | | 5.000% | | 7/1/24 | | | 995 | | 1,156 | |
| Los Angeles CA Department of Water & Power Revenue | | 5.000% | | 7/1/25 | | | 10,100 | | 11,295 | |
| Los Angeles CA Department of Water & Power Revenue | | 5.000% | | 7/1/25 | | | 1,395 | | 1,652 | |
| Los Angeles CA Department of Water & Power Revenue | | 5.000% | | 7/1/25 | | | 520 | | 616 | |
| Los Angeles CA Department of Water & Power Revenue | | 5.000% | | 7/1/26 | | | 2,350 | | 2,356 | |
| Los Angeles CA Department of Water & Power Revenue | | 5.000% | | 7/1/26 | | | 1,500 | | 1,652 | |
| Los Angeles CA Department of Water & Power Revenue | | 5.000% | | 7/1/26 | | | 1,755 | | 2,088 | |
| Los Angeles CA Department of Water & Power Revenue | | 5.000% | | 7/1/26 | | | 4,800 | | 5,348 | |
| Los Angeles CA Department of Water & Power Revenue | | 5.000% | | 7/1/26 | | | 6,060 | | 7,208 | |
| Los Angeles CA Department of Water & Power Revenue | | 5.000% | | 7/1/26 | | | 750 | | 892 | |
| Los Angeles CA Department of Water & Power Revenue | | 5.000% | | 7/1/27 | | | 1,655 | | 1,659 | |
| Los Angeles CA Department of Water & Power Revenue | | 5.000% | | 7/1/28 | | | 8,030 | | 9,271 | |
| Los Angeles CA Department of Water & Power Revenue | | 5.000% | | 7/1/28 | | | 2,000 | | 2,005 | |
| Los Angeles CA Department of Water & Power Revenue | | 5.000% | | 7/1/29 | | | 1,670 | | 1,674 | |
| Los Angeles CA Department of Water & Power Revenue | | 5.000% | | 7/1/29 | | | 1,500 | | 1,692 | |
| Los Angeles CA Department of Water & Power Revenue | | 5.000% | | 7/1/29 | | | 2,010 | | 2,420 | |
| Los Angeles CA Department of Water & Power Revenue | | 5.000% | | 7/1/30 | | | 2,065 | | 2,346 | |
102
California Intermediate-Term Tax-Exempt Fund
| | | | | | | | Face | | Market | |
| | | | | Maturity | | | Amount | | Value· | |
| | | Coupon | | Date | | | ($000 | ) | ($000 | ) |
| Los Angeles CA Department of Water & Power Revenue | | 5.000% | | 7/1/30 | | | 10,000 | | 11,246 | |
| Los Angeles CA Department of Water & Power Revenue | | 5.000% | | 7/1/30 | | | 930 | | 1,076 | |
| Los Angeles CA Department of Water & Power Revenue | | 5.000% | | 7/1/31 | | | 15,035 | | 16,753 | |
| Los Angeles CA Department of Water & Power Revenue | | 5.000% | | 7/1/31 | | | 2,500 | | 2,831 | |
| Los Angeles CA Department of Water & Power Revenue | | 5.000% | | 7/1/31 | | | 4,690 | | 5,312 | |
| Los Angeles CA Department of Water & Power Revenue | | 5.000% | | 7/1/31 | | | 7,000 | | 7,851 | |
| Los Angeles CA Department of Water & Power Revenue | | 5.000% | | 7/1/31 | | | 10,010 | | 11,680 | |
| Los Angeles CA Department of Water & Power Revenue | | 5.000% | | 7/1/31 | | | 2,515 | | 2,969 | |
| Los Angeles CA Department of Water & Power Revenue | | 5.000% | | 7/1/32 | | | 14,250 | | 15,859 | |
| Los Angeles CA Department of Water & Power Revenue | | 5.000% | | 7/1/32 | | | 6,730 | | 7,528 | |
| Los Angeles CA Department of Water & Power Revenue | | 5.000% | | 7/1/32 | | | 3,300 | | 3,727 | |
| Los Angeles CA Department of Water & Power Revenue | | 5.000% | | 7/1/32 | | | 6,080 | | 6,866 | |
| Los Angeles CA Department of Water & Power Revenue | | 5.000% | | 7/1/32 | | | 7,500 | | 8,482 | |
| Los Angeles CA Department of Water & Power Revenue | | 5.000% | | 7/1/32 | | | 2,060 | | 2,423 | |
| Los Angeles CA Department of Water & Power Revenue | | 5.000% | | 7/1/32 | | | 7,000 | | 7,790 | |
| Los Angeles CA Department of Water & Power Revenue | | 5.000% | | 7/1/33 | | | 5,525 | | 6,304 | |
| Los Angeles CA Department of Water & Power Revenue | | 5.000% | | 7/1/33 | | | 1,000 | | 1,170 | |
| Los Angeles CA Department of Water & Power Revenue | | 5.000% | | 7/1/33 | | | 5,000 | | 5,553 | |
| Los Angeles CA Department of Water & Power Revenue | | 5.000% | | 7/1/33 | | | 1,530 | | 1,746 | |
| Los Angeles CA Department of Water & Power Revenue | | 5.000% | | 7/1/34 | | | 12,005 | | 13,470 | |
| Los Angeles CA Department of Water & Power Revenue | | 5.000% | | 7/1/34 | | | 2,000 | | 2,244 | |
| Los Angeles CA Department of Water & Power Revenue | | 5.000% | | 7/1/34 | | | 5,305 | | 5,952 | |
| Los Angeles CA Department of Water & Power Revenue | | 5.000% | | 7/1/34 | | | 4,500 | | 5,115 | |
| Los Angeles CA Department of Water & Power Revenue | | 5.000% | | 7/1/34 | | | 7,500 | | 8,432 | |
| Los Angeles CA Department of Water & Power Revenue | | 5.000% | | 7/1/34 | | | 1,500 | | 1,746 | |
| Los Angeles CA Department of Water & Power Revenue | | 5.000% | | 7/1/35 | | | 2,250 | | 2,550 | |
| Los Angeles CA Department of Water & Power Revenue | | 5.000% | | 7/1/35 | | | 2,000 | | 2,315 | |
103
California Intermediate-Term Tax-Exempt Fund
| | | | | | | | Face | | Market | |
| | | | | Maturity | | | Amount | | Value· | |
| | | Coupon | | Date | | | ($000 | ) | ($000 | ) |
| Los Angeles CA Department of Water & Power Revenue | | 5.000% | | 7/1/35 | | | 1,500 | | 1,700 | |
| Los Angeles CA Department of Water & Power Revenue | | 5.000% | | 7/1/36 | | | 4,000 | | 4,564 | |
| Los Angeles CA Department of Water & Power Revenue | | 5.000% | | 7/1/36 | | | 20,345 | | 23,455 | |
| Los Angeles CA Department of Water & Power Revenue | | 5.000% | | 7/1/36 | | | 1,545 | | 1,744 | |
| Los Angeles CA Department of Water & Power Revenue | | 5.000% | | 7/1/36 | | | 1,050 | | 1,185 | |
| Los Angeles CA Department of Water & Power Revenue | | 5.000% | | 7/1/37 | | | 5,000 | | 5,695 | |
| Los Angeles CA Department of Water & Power Revenue | | 5.000% | | 7/1/37 | | | 25,260 | | 29,061 | |
| Los Angeles CA Department of Water & Power Revenue | | 5.000% | | 7/1/38 | | | 5,000 | | 5,741 | |
| Los Angeles CA Department of Water & Power Revenue VRDO | | 1.450% | | 12/3/18 | | | 57 | | 57 | |
| Los Angeles CA Department of Water & Power System Revenue | | 5.000% | | 7/1/35 | | | 38,460 | | 43,127 | |
| Los Angeles CA GO | | 5.000% | | 9/1/21 | (Prere.) | | 5,850 | | 6,352 | |
| Los Angeles CA GO | | 5.000% | | 9/1/21 | (Prere.) | | 5,850 | | 6,352 | |
| Los Angeles CA GO | | 5.000% | | 9/1/22 | | | 10,010 | | 10,840 | |
| Los Angeles CA Harbor Department Revenue | | 5.000% | | 8/1/20 | | | 500 | | 527 | |
| Los Angeles CA Harbor Department Revenue | | 5.000% | | 8/1/21 | | | 750 | | 812 | |
| Los Angeles CA Harbor Department Revenue | | 5.000% | | 8/1/25 | | | 3,795 | | 4,091 | |
| Los Angeles CA Harbor Department Revenue | | 5.000% | | 8/1/30 | | | 4,010 | | 4,665 | |
| Los Angeles CA Harbor Department Revenue | | 5.000% | | 8/1/31 | | | 2,435 | | 2,823 | |
| Los Angeles CA Harbor Department Revenue | | 5.000% | | 8/1/32 | | | 4,300 | | 4,972 | |
| Los Angeles CA Harbor Department Revenue | | 5.000% | | 8/1/33 | | | 3,515 | | 4,049 | |
| Los Angeles CA Harbor Department Revenue | | 5.000% | | 8/1/33 | | | 2,560 | | 2,892 | |
| Los Angeles CA Harbor Department Revenue | | 4.000% | | 8/1/34 | | | 3,000 | | 3,142 | |
| Los Angeles CA Harbor Department Revenue | | 4.000% | | 8/1/35 | | | 2,660 | | 2,771 | |
| Los Angeles CA Harbor Department Revenue | | 5.000% | | 8/1/35 | | | 1,925 | | 2,163 | |
| Los Angeles CA Harbor Department Revenue | | 4.000% | | 8/1/36 | | | 2,500 | | 2,591 | |
| Los Angeles CA Harbor Department Revenue | | 5.000% | | 8/1/36 | | | 1,985 | | 2,230 | |
| Los Angeles CA Municipal Improvement Corp. Lease Revenue | | 5.000% | | 11/1/24 | | | 6,275 | | 7,285 | |
| Los Angeles CA Municipal Improvement Corp. Lease Revenue | | 5.000% | | 11/1/25 | | | 5,000 | | 5,901 | |
| Los Angeles CA Municipal Improvement Corp. Lease Revenue | | 5.000% | | 11/1/25 | | | 8,140 | | 9,607 | |
| Los Angeles CA Municipal Improvement Corp. Lease Revenue | | 5.000% | | 11/1/26 | | | 3,015 | | 3,606 | |
| Los Angeles CA Municipal Improvement Corp. Lease Revenue | | 5.000% | | 11/1/27 | | | 4,115 | | 4,890 | |
| Los Angeles CA Municipal Improvement Corp. Lease Revenue | | 5.000% | | 11/1/29 | | | 9,805 | | 11,460 | |
| Los Angeles CA Municipal Improvement Corp. Lease Revenue | | 4.000% | | 11/1/33 | | | 10,400 | | 10,941 | |
| Los Angeles CA Municipal Improvement Corp. Lease Revenue | | 4.000% | | 11/1/34 | | | 5,880 | | 6,144 | |
| Los Angeles CA Municipal Improvement Corp. Lease Revenue | | 4.000% | | 11/1/35 | | | 20,805 | | 21,667 | |
104
California Intermediate-Term Tax-Exempt Fund
| | | | | | | | Face | | Market | |
| | | | | Maturity | | | Amount | | Value· | |
| | | Coupon | | Date | | | ($000 | ) | ($000 | ) |
| Los Angeles CA Municipal Improvement Corp. Lease Revenue | | 4.000% | | 11/1/36 | | | 4,825 | | 4,996 | |
| Los Angeles CA Unified School District GO | | 5.000% | | 7/1/20 | | | 29,000 | | 30,467 | |
| Los Angeles CA Unified School District GO | | 5.000% | | 7/1/20 | | | 15,010 | | 15,769 | |
| Los Angeles CA Unified School District GO | | 4.000% | | 7/1/21 | | | 1,000 | | 1,056 | |
| Los Angeles CA Unified School District GO | | 5.000% | | 7/1/21 | | | 9,945 | | 10,130 | |
| Los Angeles CA Unified School District GO | | 5.000% | | 7/1/21 | | | 10,000 | | 10,805 | |
| Los Angeles CA Unified School District GO | | 5.000% | | 7/1/21 | | | 2,940 | | 3,177 | |
| Los Angeles CA Unified School District GO | | 3.000% | | 7/1/22 | | | 1,595 | | 1,653 | |
| Los Angeles CA Unified School District GO | | 4.000% | | 7/1/22 | | | 18,320 | | 19,624 | |
| Los Angeles CA Unified School District GO | | 4.000% | | 7/1/22 | | | 1,100 | | 1,179 | |
| Los Angeles CA Unified School District GO | | 5.000% | | 7/1/22 | | | 13,000 | | 14,372 | |
| Los Angeles CA Unified School District GO | | 3.000% | | 7/1/23 | | | 1,550 | | 1,616 | |
| Los Angeles CA Unified School District GO | | 4.000% | | 7/1/23 | | | 425 | | 462 | |
| Los Angeles CA Unified School District GO | | 5.000% | | 7/1/23 | | | 3,690 | | 4,170 | |
| Los Angeles CA Unified School District GO | | 5.000% | | 7/1/23 | | | 5,185 | | 5,859 | |
| Los Angeles CA Unified School District GO | | 5.000% | | 7/1/23 | | | 6,860 | | 7,752 | |
| Los Angeles CA Unified School District GO | | 5.000% | | 7/1/23 | | | 7,250 | | 8,193 | |
| Los Angeles CA Unified School District GO | | 4.000% | | 7/1/24 | | | 9,000 | | 9,894 | |
| Los Angeles CA Unified School District GO | | 5.000% | | 7/1/24 | | | 11,000 | | 12,675 | |
| Los Angeles CA Unified School District GO | | 5.000% | | 7/1/24 | | | 4,010 | | 4,318 | |
| Los Angeles CA Unified School District GO | | 5.000% | | 7/1/24 | | | 13,105 | | 15,101 | |
| Los Angeles CA Unified School District GO | | 5.000% | | 7/1/24 | | | 3,430 | | 3,693 | |
| Los Angeles CA Unified School District GO | | 5.000% | | 7/1/24 | | | 11,865 | | 13,672 | |
| Los Angeles CA Unified School District GO | | 5.000% | | 7/1/24 | | | 4,000 | | 4,609 | |
| Los Angeles CA Unified School District GO | | 5.000% | | 7/1/24 | | | 2,810 | | 3,238 | |
| Los Angeles CA Unified School District GO | | 5.000% | | 7/1/25 | | | 6,010 | | 6,464 | |
| Los Angeles CA Unified School District GO | | 5.000% | | 7/1/25 | | | 1,510 | | 1,735 | |
| Los Angeles CA Unified School District GO | | 5.000% | | 7/1/25 | | | 17,005 | | 19,923 | |
| Los Angeles CA Unified School District GO | | 5.250% | | 7/1/25 | | | 1,600 | | 1,631 | |
| Los Angeles CA Unified School District GO | | 5.000% | | 7/1/26 | | | 5,710 | | 5,811 | |
| Los Angeles CA Unified School District GO | | 5.000% | | 7/1/26 | | | 2,500 | | 2,685 | |
| Los Angeles CA Unified School District GO | | 5.000% | | 7/1/26 | | | 9,325 | | 11,078 | |
| Los Angeles CA Unified School District GO | | 5.000% | | 7/1/27 | | | 8,375 | | 9,216 | |
| Los Angeles CA Unified School District GO | | 5.000% | | 7/1/27 | | | 1,595 | | 1,623 | |
| Los Angeles CA Unified School District GO | | 5.000% | | 1/1/28 | | | 8,395 | | 9,229 | |
| Los Angeles CA Unified School District GO | | 5.000% | | 7/1/28 | | | 34,670 | | 39,402 | |
| Los Angeles CA Unified School District GO | | 5.000% | | 7/1/28 | | | 2,600 | | 2,792 | |
| Los Angeles CA Unified School District GO | | 5.250% | | 7/1/28 | | | 5,025 | | 5,281 | |
| Los Angeles CA Unified School District GO | | 5.000% | | 7/1/29 | | | 2,500 | | 2,684 | |
| Los Angeles CA Unified School District GO | | 5.000% | | 7/1/29 | | | 34,760 | | 39,407 | |
| Los Angeles CA Unified School District GO | | 5.000% | | 7/1/30 | | | 1,985 | | 2,282 | |
| Los Angeles CA Unified School District GO | | 5.000% | | 7/1/30 | | | 3,015 | | 3,236 | |
| Los Angeles CA Unified School District GO | | 5.000% | | 7/1/30 | | | 6,675 | | 7,560 | |
| Los Angeles CA Unified School District GO | | 5.000% | | 7/1/31 | | | 3,000 | | 3,218 | |
| Los Angeles CA Unified School District GO | | 5.000% | | 7/1/31 | | | 15,775 | | 18,695 | |
| Los Angeles CA Unified School District GO | | 5.000% | | 7/1/32 | | | 3,000 | | 3,539 | |
| Los Angeles CA Unified School District GO | | 4.000% | | 7/1/33 | | | 2,130 | | 2,224 | |
| Los Angeles CA Unified School District GO | | 5.000% | | 7/1/33 | | | 5,080 | | 5,961 | |
| Los Angeles CA Unified School District GO | | 5.000% | | 1/1/34 | | | 1,385 | | 1,408 | |
| Los Angeles CA Unified School District GO | | 5.000% | | 1/1/34 | | | 1,580 | | 1,607 | |
| Los Angeles CA Unified School District GO | | 5.000% | | 7/1/34 | | | 10,000 | | 11,680 | |
| Los Angeles CA Unified School District GO | | 5.000% | | 7/1/35 | | | 10,000 | | 11,638 | |
| Los Angeles CA Unified School District GO | | 5.000% | | 7/1/36 | | | 5,600 | | 6,485 | |
105
California Intermediate-Term Tax-Exempt Fund
| | | | | | | | Face | | Market | |
| | | | | Maturity | | | Amount | | Value· | |
| | | Coupon | | Date | | | ($000 | ) | ($000 | ) |
| Los Angeles CA Unified School District GO | | 5.000% | | 7/1/37 | | | 5,870 | | 6,783 | |
| Los Angeles CA Unified School District GO | | 5.000% | | 7/1/38 | | | 5,120 | | 5,896 | |
| Los Angeles CA Wastewater System Revenue | | 5.000% | | 6/1/20 | | | 1,825 | | 1,916 | |
| Los Angeles CA Wastewater System Revenue | | 5.000% | | 6/1/21 | | | 2,010 | | 2,172 | |
| Los Angeles CA Wastewater System Revenue | | 5.000% | | 6/1/22 | | | 2,750 | | 3,049 | |
| Los Angeles CA Wastewater System Revenue | | 5.000% | | 6/1/23 | | | 1,250 | | 1,420 | |
| Los Angeles CA Wastewater System Revenue | | 5.000% | | 6/1/26 | | | 13,090 | | 14,392 | |
| Los Angeles CA Wastewater System Revenue | | 5.000% | | 6/1/29 | | | 10,000 | | 10,966 | |
| Los Angeles CA Wastewater System Revenue | | 5.000% | | 6/1/31 | | | 5,420 | | 6,060 | |
| Los Angeles CA Wastewater System Revenue | | 5.000% | | 6/1/32 | | | 10,880 | | 12,145 | |
| Los Angeles CA Wastewater System Revenue | | 5.000% | | 6/1/33 | | | 1,525 | | 1,733 | |
| Los Angeles CA Wastewater System Revenue | | 5.000% | | 6/1/33 | | | 16,925 | | 18,793 | |
| Los Angeles CA Wastewater System Revenue | | 5.000% | | 6/1/34 | | | 5,000 | | 5,536 | |
| Los Angeles CA Wastewater System Revenue | | 5.000% | | 6/1/34 | | | 2,355 | | 2,737 | |
| Los Angeles CA Wastewater System Revenue | | 5.000% | | 6/1/35 | | | 4,500 | | 4,968 | |
| Los Angeles CA Wastewater System Revenue | | 5.000% | | 6/1/35 | | | 2,840 | | 3,289 | |
| Los Angeles CA Wastewater System Revenue | | 5.000% | | 6/1/35 | | | 2,985 | | 3,457 | |
| Los Angeles CA Wastewater System Revenue | | 5.000% | | 6/1/36 | | | 3,000 | | 3,460 | |
| Los Angeles CA Wastewater System Revenue | | 5.000% | | 6/1/36 | | | 6,250 | | 7,209 | |
| Los Angeles CA Wastewater System Revenue | | 5.000% | | 6/1/37 | | | 7,000 | | 8,052 | |
| Los Angeles CA Wastewater System Revenue | | 5.000% | | 6/1/37 | | | 3,655 | | 4,204 | |
| Los Angeles County CA Facilities Inc. Lease Revenue | | 5.000% | | 12/1/36 | | | 1,440 | | 1,658 | |
| Los Angeles County CA Facilities Inc. Lease Revenue | | 5.000% | | 12/1/37 | | | 1,335 | | 1,531 | |
| Los Angeles County CA Metropolitan Transportation Authority Revenue (Union Station Gateway Project) | | 5.000% | | 7/1/25 | | | 1,045 | | 1,236 | |
| Los Angeles County CA Metropolitan Transportation Authority Revenue (Union Station Gateway Project) | | 5.000% | | 7/1/26 | | | 2,000 | | 2,354 | |
| Los Angeles County CA Metropolitan Transportation Authority Sales Tax Revenue | | 5.000% | | 6/1/19 | | | 1,600 | | 1,627 | |
| Los Angeles County CA Metropolitan Transportation Authority Sales Tax Revenue | | 5.000% | | 7/1/20 | | | 4,000 | | 4,079 | |
| Los Angeles County CA Metropolitan Transportation Authority Sales Tax Revenue | | 5.000% | | 7/1/21 | | | 3,045 | | 3,299 | |
| Los Angeles County CA Metropolitan Transportation Authority Sales Tax Revenue | | 5.000% | | 7/1/21 | (Prere.) | | 10,015 | | 10,828 | |
| Los Angeles County CA Metropolitan Transportation Authority Sales Tax Revenue | | 5.000% | | 7/1/22 | | | 5,095 | | 5,659 | |
| Los Angeles County CA Metropolitan Transportation Authority Sales Tax Revenue | | 5.000% | | 7/1/24 | | | 1,255 | | 1,388 | |
| Los Angeles County CA Metropolitan Transportation Authority Sales Tax Revenue | | 5.000% | | 7/1/24 | | | 4,000 | | 4,643 | |
| Los Angeles County CA Metropolitan Transportation Authority Sales Tax Revenue | | 5.000% | | 7/1/25 | | | 6,065 | | 7,179 | |
| Los Angeles County CA Metropolitan Transportation Authority Sales Tax Revenue | | 5.000% | | 7/1/30 | | | 7,320 | | 8,697 | |
| Los Angeles County CA Metropolitan Transportation Authority Sales Tax Revenue | | 5.000% | | 7/1/33 | | | 5,000 | | 5,850 | |
| Los Angeles County CA Metropolitan Transportation Authority Sales Tax Revenue | | 5.000% | | 7/1/33 | | | 8,585 | | 9,586 | |
106
California Intermediate-Term Tax-Exempt Fund
| | | | | | | | Face | | Market | |
| | | | | Maturity | | | Amount | | Value· | |
| | | Coupon | | Date | | | ($000 | ) | ($000 | ) |
| Los Angeles County CA Metropolitan Transportation Authority Sales Tax Revenue | | 4.000% | | 6/1/34 | | | 6,500 | | 6,876 | |
| Los Angeles County CA Metropolitan Transportation Authority Sales Tax Revenue | | 5.000% | | 7/1/34 | | | 5,000 | | 5,820 | |
| Los Angeles County CA Metropolitan Transportation Authority Sales Tax Revenue | | 5.000% | | 7/1/34 | | | 8,985 | | 10,016 | |
| Los Angeles County CA Metropolitan Transportation Authority Sales Tax Revenue | | 5.000% | | 6/1/35 | | | 10,055 | | 11,543 | |
| Los Angeles County CA Metropolitan Transportation Authority Sales Tax Revenue | | 5.000% | | 7/1/35 | | | 5,000 | | 5,800 | |
| Los Angeles County CA Metropolitan Transportation Authority Sales Tax Revenue | | 5.000% | | 7/1/35 | | | 24,690 | | 28,680 | |
| Los Angeles County CA Metropolitan Transportation Authority Sales Tax Revenue | | 5.000% | | 6/1/36 | | | 10,000 | | 11,445 | |
| Los Angeles County CA Metropolitan Transportation Authority Sales Tax Revenue | | 5.000% | | 7/1/36 | | | 5,000 | | 5,768 | |
| Los Angeles County CA Metropolitan Transportation Authority Sales Tax Revenue | | 5.000% | | 7/1/36 | | | 21,095 | | 24,388 | |
| Los Angeles County CA Metropolitan Transportation Authority Sales Tax Revenue | | 5.000% | | 7/1/37 | | | 21,735 | | 25,060 | |
| Los Angeles County CA Public Works Financing Authority Lease Revenue | | 5.000% | | 12/1/21 | | | 2,440 | | 2,667 | |
| Los Angeles County CA Public Works Financing Authority Lease Revenue | | 5.000% | | 8/1/22 | | | 1,155 | | 1,283 | |
| Los Angeles County CA Public Works Financing Authority Lease Revenue | | 5.000% | | 12/1/22 | | | 1,275 | | 1,428 | |
| Los Angeles County CA Public Works Financing Authority Lease Revenue | | 5.000% | | 8/1/23 | | | 1,500 | | 1,665 | |
| Los Angeles County CA Public Works Financing Authority Lease Revenue | | 5.000% | | 8/1/24 | | | 1,515 | | 1,679 | |
| Los Angeles County CA Public Works Financing Authority Lease Revenue | | 5.000% | | 12/1/24 | | | 1,325 | | 1,549 | |
| Los Angeles County CA Public Works Financing Authority Lease Revenue | | 5.000% | | 8/1/25 | | | 1,325 | | 1,464 | |
| Los Angeles County CA Public Works Financing Authority Lease Revenue | | 5.000% | | 12/1/25 | | | 970 | | 1,151 | |
| Los Angeles County CA Public Works Financing Authority Lease Revenue | | 5.000% | | 8/1/30 | | | 2,500 | | 2,738 | |
| Los Angeles County CA Public Works Financing Authority Lease Revenue | | 5.000% | | 8/1/31 | | | 3,000 | | 3,283 | |
| Los Angeles County CA Public Works Financing Authority Lease Revenue | | 5.000% | | 12/1/33 | | | 6,190 | | 7,028 | |
1 | Los Angeles County CA Public Works Financing Authority Lease Revenue TOB VRDO | | 1.720% | | 12/7/18 | | | 2,750 | | 2,750 | |
| Los Angeles County CA Redevelopment Authority Tax Allocation Revenue (Hollywood/North Hollywood Redevelopment Project) | | 5.000% | | 7/1/21 | | | 1,670 | | 1,802 | |
| Los Angeles County CA Redevelopment Authority Tax Allocation Revenue (Hollywood/North Hollywood Redevelopment Project) | | 5.000% | | 7/1/22 | | | 4,555 | | 5,037 | |
107
California Intermediate-Term Tax-Exempt Fund
| | | | | | | | Face | | Market | |
| | | | | Maturity | | | Amount | | Value· | |
| | | Coupon | | Date | | | ($000 | ) | ($000 | ) |
| Los Angeles County CA Redevelopment Authority Tax Allocation Revenue (Hollywood/North Hollywood Redevelopment Project) | | 5.000% | | 7/1/23 | | | 2,105 | | 2,381 | |
| Los Angeles County CA Redevelopment Authority Tax Allocation Revenue (Hollywood/North Hollywood Redevelopment Project) | | 5.000% | | 7/1/24 | | | 2,215 | | 2,496 | |
| Los Angeles County CA Sanitation Districts Financing Authority Revenue | | 5.000% | | 10/1/19 | | | 730 | | 750 | |
| Los Angeles County CA Sanitation Districts Financing Authority Revenue | | 5.000% | | 10/1/20 | | | 1,000 | | 1,058 | |
| Los Angeles County CA Sanitation Districts Financing Authority Revenue | | 5.000% | | 10/1/29 | | | 1,370 | | 1,590 | |
| Los Angeles County CA Sanitation Districts Financing Authority Revenue | | 5.000% | | 10/1/30 | | | 3,060 | | 3,527 | |
| Los Angeles County CA Sanitation Districts Financing Authority Revenue | | 5.000% | | 10/1/31 | | | 4,300 | | 4,939 | |
| Los Angeles County CA Sanitation Districts Financing Authority Revenue | | 5.000% | | 10/1/32 | | | 6,000 | | 6,875 | |
| Los Angeles County CA Sanitation Districts Financing Authority Revenue | | 5.000% | | 10/1/33 | | | 8,350 | | 9,539 | |
| Los Angeles County CA Sanitation Districts Financing Authority Revenue | | 5.000% | | 10/1/34 | | | 7,100 | | 8,088 | |
| Los Angeles County CA Sanitation Districts Financing Authority Revenue | | 5.000% | | 10/1/35 | | | 3,790 | | 4,307 | |
| Los Angeles County CA Unified School District GO | | 5.000% | | 7/1/21 | | | 12,500 | | 13,506 | |
| Los Angeles County CA Unified School District GO | | 5.000% | | 7/1/30 | | | 1,000 | | 1,165 | |
| Los Rios CA Community College District GO | | 5.000% | | 8/1/24 | | | 500 | | 581 | |
| Los Rios CA Community College District GO | | 5.000% | | 8/1/25 | | | 500 | | 592 | |
| Los Rios CA Community College District GO | | 5.000% | | 8/1/26 | | | 1,410 | | 1,695 | |
| Los Rios CA Community College District GO | | 5.000% | | 8/1/27 | | | 1,100 | | 1,337 | |
| Los Rios CA Community College District GO | | 5.000% | | 8/1/28 | | | 1,285 | | 1,545 | |
| Los Rios CA Community College District GO | | 5.000% | | 8/1/29 | | | 1,120 | | 1,333 | |
| Los Rios CA Community College District GO | | 5.000% | | 8/1/30 | | | 1,115 | | 1,311 | |
| Los Rios CA Community College District GO | | 4.000% | | 8/1/31 | | | 3,060 | | 3,289 | |
| Los Rios CA Community College District GO | | 4.000% | | 8/1/32 | | | 3,125 | | 3,338 | |
| Los Rios CA Community College District GO | | 4.000% | | 8/1/33 | | | 3,050 | | 3,232 | |
| Los Rios CA Community College District GO | | 4.000% | | 8/1/35 | | | 3,750 | | 3,927 | |
| M-S-R California Energy Authority Revenue | | 7.000% | | 11/1/34 | | | 12,745 | | 17,751 | |
| M-S-R California Energy Authority Revenue | | 7.000% | | 11/1/34 | | | 8,600 | | 11,978 | |
| M-S-R California Energy Authority Revenue | | 7.000% | | 11/1/34 | | | 8,765 | | 12,208 | |
| M-S-R California Public Power Agency Revenue (San Juan Project) | | 5.000% | | 7/1/21 | | | 5,000 | | 5,393 | |
| M-S-R California Public Power Agency Revenue (San Juan Project) | | 5.000% | | 7/1/22 | | | 5,000 | | 5,530 | |
| Manhattan Beach CA Unified School District GO | | 0.000% | | 9/1/26 | (3) | | 2,160 | | 1,738 | |
| Manteca CA Unified School District GO | | 5.000% | | 8/1/20 | | | 1,000 | | 1,054 | |
| Manteca CA Unified School District GO | | 5.000% | | 8/1/21 | | | 1,000 | | 1,082 | |
| Manteca CA Unified School District GO | | 5.000% | | 8/1/22 | | | 1,000 | | 1,109 | |
| Manteca CA Unified School District GO | | 5.000% | | 8/1/23 | | | 1,130 | | 1,281 | |
| Marin CA Community College District GO | | 5.000% | | 8/1/23 | | | 550 | | 627 | |
108
California Intermediate-Term Tax-Exempt Fund
| | | | | | | | Face | | Market | |
| | | | | Maturity | | | Amount | | Value· | |
| | | Coupon | | Date | | | ($000 | ) | ($000 | ) |
| Marin CA Community College District GO | | 5.000% | | 8/1/24 | | | 445 | | 517 | |
| Marin CA Community College District GO | | 5.000% | | 8/1/25 | | | 605 | | 717 | |
| Marin CA Community College District GO | | 4.000% | | 8/1/28 | | | 600 | | 673 | |
| Marin CA Community College District GO | | 4.000% | | 8/1/29 | | | 450 | | 498 | |
| Marin CA Community College District GO | | 4.000% | | 8/1/30 | | | 800 | | 875 | |
| Marin CA Community College District GO | | 4.000% | | 8/1/31 | | | 7,660 | | 8,294 | |
| Marin CA Community College District GO | | 4.000% | | 8/1/32 | | | 1,000 | | 1,078 | |
| Marin CA Community College District GO | | 4.000% | | 8/1/32 | | | 2,945 | | 3,164 | |
| Marin CA Community College District GO | | 4.000% | | 8/1/33 | | | 1,900 | | 2,025 | |
| Marin CA Community College District GO | | 4.000% | | 8/1/34 | | | 1,000 | | 1,057 | |
| Marin CA Community College District GO | | 4.000% | | 8/1/34 | | | 3,000 | | 3,176 | |
| Marin CA Community College District GO | | 4.000% | | 8/1/36 | | | 665 | | 694 | |
| Marin CA Healthcare District GO | | 5.000% | | 8/1/28 | | | 435 | | 505 | |
| Marin CA Healthcare District GO | | 5.000% | | 8/1/30 | | | 500 | | 578 | |
| Marin CA Healthcare District GO | | 5.000% | | 8/1/31 | | | 1,000 | | 1,152 | |
| Marin CA Healthcare District GO | | 5.000% | | 8/1/32 | | | 1,850 | | 2,128 | |
| Marin CA Healthcare District GO | | 5.000% | | 8/1/33 | | | 1,350 | | 1,549 | |
| Marin CA Healthcare District GO | | 5.000% | | 8/1/34 | | | 1,250 | | 1,429 | |
| Marin CA Healthcare District GO | | 4.000% | | 8/1/35 | | | 1,750 | | 1,819 | |
| Marina Coast Water District California Enterprise Revenue | | 4.000% | | 6/1/22 | | | 1,090 | | 1,166 | |
| Marysville CA Revenue (Fremont-Rideout Health Group) | | 5.250% | | 1/1/21 | (Prere.) | | 1,780 | | 1,907 | |
| Marysville CA Revenue (Fremont-Rideout Health Group) | | 5.250% | | 1/1/21 | (Prere.) | | 2,730 | | 2,925 | |
| Marysville CA Revenue (Fremont-Rideout Health Group) | | 5.250% | | 1/1/21 | (Prere.) | | 1,500 | | 1,607 | |
| Menlo Park CA Community Development Agency Successor Agency Tax Allocation Revenue | | 5.000% | | 10/1/19 | | | 445 | | 457 | |
| Menlo Park CA Community Development Agency Successor Agency Tax Allocation Revenue | | 5.000% | | 10/1/20 | | | 400 | | 423 | |
| Menlo Park CA Community Development Agency Successor Agency Tax Allocation Revenue | | 5.000% | | 10/1/21 | (4) | | 615 | | 667 | |
| Menlo Park CA Community Development Agency Successor Agency Tax Allocation Revenue | | 5.000% | | 10/1/22 | (4) | | 520 | | 577 | |
| Menlo Park CA Community Development Agency Successor Agency Tax Allocation Revenue | | 5.000% | | 10/1/26 | (4) | | 1,000 | | 1,167 | |
| Menlo Park CA Community Development Agency Successor Agency Tax Allocation Revenue | | 5.000% | | 10/1/27 | (4) | | 1,250 | | 1,453 | |
| Menlo Park CA Community Development Agency Successor Agency Tax Allocation Revenue | | 5.000% | | 10/1/29 | (4) | | 400 | | 460 | |
| Metropolitan Water District of Southern California Revenue | | 5.000% | | 7/1/21 | | | 2,700 | | 2,929 | |
| Metropolitan Water District of Southern California Revenue | | 5.000% | | 7/1/23 | | | 1,055 | | 1,203 | |
| Metropolitan Water District of Southern California Revenue | | 5.000% | | 7/1/24 | | | 3,550 | | 4,131 | |
109
California Intermediate-Term Tax-Exempt Fund
| | | | | | | | Face | | Market | |
| | | | | Maturity | | | Amount | | Value· | |
| | | Coupon | | Date | | | ($000 | ) | ($000 | ) |
| Metropolitan Water District of Southern California Revenue | | 5.000% | | 7/1/25 | | | 3,490 | | 4,140 | |
| Metropolitan Water District of Southern California Revenue | | 5.000% | | 7/1/26 | | | 3,325 | | 3,916 | |
| Metropolitan Water District of Southern California Revenue | | 5.000% | | 7/1/30 | | | 2,150 | | 2,368 | |
| Metropolitan Water District of Southern California Revenue | | 5.000% | | 10/1/30 | | | 3,585 | | 3,922 | |
| Metropolitan Water District of Southern California Revenue | | 5.000% | | 1/1/31 | | | 1,150 | | 1,153 | |
| Metropolitan Water District of Southern California Revenue | | 5.000% | | 7/1/31 | | | 2,250 | | 2,474 | |
| Metropolitan Water District of Southern California Revenue | | 5.000% | | 7/1/31 | | | 2,930 | | 2,983 | |
| Metropolitan Water District of Southern California Revenue | | 5.000% | | 10/1/31 | | | 11,065 | | 12,089 | |
| Metropolitan Water District of Southern California Revenue | | 5.000% | | 7/1/35 | | | 2,605 | | 2,651 | |
| Modesto CA Community Facilities District No. 2004-1 Special Tax Revenue (Village One No. 2) | | 5.000% | | 9/1/29 | | | 1,570 | | 1,732 | |
| Modesto CA Community Facilities District No. 2004-1 Special Tax Revenue (Village One No. 2) | | 5.000% | | 9/1/30 | | | 1,700 | | 1,864 | |
| Modesto CA Irrigation District Electric Revenue | | 5.000% | | 7/1/21 | | | 1,000 | | 1,080 | |
| Modesto CA Irrigation District Electric Revenue | | 5.000% | | 7/1/22 | | | 1,025 | | 1,135 | |
| Modesto CA Irrigation District Financing Authority Electric Revenue | | 5.000% | | 10/1/31 | | | 1,475 | | 1,663 | |
| Modesto CA Irrigation District Financing Authority Electric Revenue | | 5.000% | | 10/1/31 | | | 1,840 | | 2,074 | |
| Moreno Valley CA Community Redevelopment Agency Successor Agency Tax Allocation Revenue | | 5.000% | | 8/1/29 | | | 1,200 | | 1,411 | |
| Moreno Valley CA Community Redevelopment Agency Successor Agency Tax Allocation Revenue | | 5.000% | | 8/1/32 | | | 1,010 | | 1,168 | |
| Moreno Valley CA Unified School District Financing Authority Special Tax Revenue | | 4.000% | | 9/1/21 | | | 615 | | 640 | |
| Moreno Valley CA Unified School District Financing Authority Special Tax Revenue | | 4.000% | | 9/1/22 | | | 685 | | 719 | |
| Moreno Valley CA Unified School District Financing Authority Special Tax Revenue | | 4.000% | | 9/1/23 | | | 735 | | 776 | |
| Moreno Valley CA Unified School District Financing Authority Special Tax Revenue | | 4.000% | | 9/1/24 | | | 780 | | 824 | |
| Moreno Valley CA Unified School District Financing Authority Special Tax Revenue | | 5.000% | | 9/1/25 | | | 845 | | 939 | |
| Moreno Valley CA Unified School District Financing Authority Special Tax Revenue | | 5.000% | | 9/1/26 | | | 930 | | 1,039 | |
| Moreno Valley CA Unified School District Financing Authority Special Tax Revenue | | 5.000% | | 9/1/27 | | | 1,010 | | 1,133 | |
| Moreno Valley CA Unified School District Financing Authority Special Tax Revenue | | 5.000% | | 9/1/29 | | | 1,185 | | 1,317 | |
| Moreno Valley CA Unified School District Financing Authority Special Tax Revenue | | 5.000% | | 9/1/31 | | | 1,390 | | 1,535 | |
110
California Intermediate-Term Tax-Exempt Fund
| | | | | | | | Face | | Market | |
| | | | | Maturity | | | Amount | | Value· | |
| | | Coupon | | Date | | | ($000 | ) | ($000 | ) |
| Moreno Valley CA Unified School District Financing Authority Special Tax Revenue | | 5.000% | | 9/1/35 | | | 920 | | 1,002 | |
| Morgan Hill CA Redevelopment Agency Successor Agency Tax Allocation Revenue | | 5.000% | | 3/1/23 | | | 1,330 | | 1,494 | |
| Morgan Hill CA Redevelopment Agency Successor Agency Tax Allocation Revenue | | 5.000% | | 9/1/23 | | | 2,550 | | 2,893 | |
| Morgan Hill CA Redevelopment Agency Successor Agency Tax Allocation Revenue | | 5.000% | | 9/1/28 | | | 5,075 | | 5,674 | |
| Morgan Hill CA Redevelopment Agency Successor Agency Tax Allocation Revenue | | 5.000% | | 9/1/29 | | | 5,430 | | 6,061 | |
| Morgan Hill CA Redevelopment Agency Successor Agency Tax Allocation Revenue | | 5.000% | | 9/1/31 | | | 2,990 | | 3,326 | |
| Morgan Hill CA Redevelopment Agency Successor Agency Tax Allocation Revenue | | 5.000% | | 9/1/32 | | | 4,315 | | 4,792 | |
| Morgan Hill CA Redevelopment Agency Successor Agency Tax Allocation Revenue | | 5.000% | | 9/1/33 | | | 2,000 | | 2,215 | |
| Morgan Hill CA Unified School District GO | | 4.000% | | 8/1/32 | | | 400 | | 429 | |
| Morgan Hill CA Unified School District GO | | 4.000% | | 8/1/33 | | | 200 | | 213 | |
| Morgan Hill CA Unified School District GO | | 4.000% | | 8/1/34 | | | 250 | | 265 | |
| Morgan Hill CA Unified School District GO | | 4.000% | | 8/1/36 | | | 1,240 | | 1,293 | |
| Morgan Hill CA Unified School District GO | | 4.000% | | 8/1/37 | | | 745 | | 773 | |
| Mount Diablo CA Unified School District GO | | 5.000% | | 8/1/19 | | | 650 | | 664 | |
| Mount Diablo CA Unified School District GO | | 5.000% | | 8/1/20 | | | 700 | | 738 | |
| Mount Diablo CA Unified School District GO | | 5.000% | | 8/1/21 | | | 775 | | 838 | |
| Mount San Antonio CA Community College District GO | | 0.000% | | 8/1/25 | | | 2,000 | | 1,694 | |
12 | Mount San Antonio CA Community College District GO | | 0.000% | | 8/1/28 | | | 3,000 | | 2,911 | |
| Mount San Jacinto CA Community College District GO | | 4.000% | | 8/1/37 | | | 3,290 | | 3,416 | |
| Mount San Jacinto CA Community College District GO | | 4.000% | | 8/1/38 | | | 1,400 | | 1,441 | |
| Mountain View CA Los Altos Union High School District GO | | 0.000% | | 8/1/26 | | | 3,500 | | 2,835 | |
5 | Mountain View CA Shoreline Regional Park Community Tax Allocation Revenue | | 5.000% | | 8/1/32 | (4) | | 500 | | 584 | |
5 | Mountain View CA Shoreline Regional Park Community Tax Allocation Revenue | | 5.000% | | 8/1/34 | (4) | | 350 | | 403 | |
5 | Mountain View CA Shoreline Regional Park Community Tax Allocation Revenue | | 5.000% | | 8/1/35 | (4) | | 450 | | 516 | |
5 | Mountain View CA Shoreline Regional Park Community Tax Allocation Revenue | | 5.000% | | 8/1/37 | (4) | | 1,220 | | 1,389 | |
| Mountain View-Whisman CA School District COP | | 4.000% | | 6/1/19 | | | 400 | | 405 | |
| Mountain View-Whisman CA School District COP | | 4.000% | | 6/1/20 | | | 500 | | 518 | |
| Mountain View-Whisman CA School District COP | | 5.000% | | 6/1/21 | | | 285 | | 307 | |
| Mountain View-Whisman CA School District COP | | 5.000% | | 6/1/22 | | | 400 | | 443 | |
| Mountain View-Whisman CA School District GO | | 5.000% | | 9/1/24 | | | 400 | | 465 | |
| Mountain View-Whisman CA School District GO | | 5.000% | | 9/1/25 | | | 630 | | 746 | |
111
California Intermediate-Term Tax-Exempt Fund
| | | | | | | | Face | | Market | |
| | | | | Maturity | | | Amount | | Value· | |
| | | Coupon | | Date | | | ($000 | ) | ($000 | ) |
| Mountain View-Whisman CA School District GO | | 5.000% | | 9/1/26 | | | 1,110 | | 1,333 | |
| Murrieta Valley CA Unified School District GO | | 5.000% | | 9/1/19 | (4) | | 575 | | 589 | |
| Murrieta Valley CA Unified School District GO | | 5.000% | | 9/1/20 | (4) | | 775 | | 817 | |
| Murrieta Valley CA Unified School District GO | | 4.000% | | 9/1/21 | (4) | | 250 | | 264 | |
| Murrieta Valley CA Unified School District GO | | 5.000% | | 9/1/21 | (4) | | 1,605 | | 1,735 | |
| Murrieta Valley CA Unified School District GO | | 4.000% | | 9/1/22 | (4) | | 320 | | 343 | |
| Murrieta Valley CA Unified School District GO | | 4.000% | | 9/1/23 | (4) | | 850 | | 922 | |
| Murrieta Valley CA Unified School District GO | | 5.000% | | 9/1/23 | (4) | | 1,460 | | 1,649 | |
| Murrieta Valley CA Unified School District GO | | 4.000% | | 9/1/24 | (4) | | 350 | | 384 | |
| Murrieta Valley CA Unified School District GO | | 5.000% | | 9/1/25 | (4) | | 700 | | 808 | |
| Murrieta Valley CA Unified School District GO | | 5.000% | | 9/1/25 | (4) | | 1,400 | | 1,616 | |
| Murrieta Valley CA Unified School District GO | | 5.000% | | 9/1/26 | (4) | | 520 | | 595 | |
| Murrieta Valley CA Unified School District GO | | 5.000% | | 9/1/26 | (4) | | 1,625 | | 1,860 | |
| Murrieta Valley CA Unified School District GO | | 5.000% | | 9/1/27 | (4) | | 465 | | 529 | |
| Murrieta Valley CA Unified School District GO | | 5.000% | | 9/1/28 | (4) | | 300 | | 340 | |
13 | Napa Valley CA Community College District GO | | 0.000% | | 8/1/30 | | | 8,130 | | 7,997 | |
13 | Napa Valley CA Community College District GO | | 0.000% | | 8/1/31 | | | 4,650 | | 4,546 | |
| Napa Valley CA Unified School District GO | | 5.000% | | 8/1/31 | | | 205 | | 237 | |
| Newark CA Unified School District GO | | 0.000% | | 8/1/26 | (4) | | 3,300 | | 2,641 | |
| Newport Beach CA Revenue (Hoag Memorial Hospital Presbyterian) | | 5.875% | | 12/1/21 | (Prere.) | | 5,150 | | 5,752 | |
| Newport Mesa CA Unified School District GO | | 0.000% | | 8/1/29 | | | 4,625 | | 3,350 | |
| Newport Mesa CA Unified School District GO | | 0.000% | | 8/1/30 | | | 3,000 | | 2,077 | |
| Newport Mesa CA Unified School District GO | | 0.000% | | 8/1/31 | | | 1,500 | | 995 | |
| Newport Mesa CA Unified School District GO | | 0.000% | | 8/1/32 | | | 14,000 | | 8,881 | |
| Norco CA Special Tax Revenue (Norco Ridge Ranch) | | 4.000% | | 9/1/20 | | | 845 | | 873 | |
| Norco CA Special Tax Revenue (Norco Ridge Ranch) | | 4.000% | | 9/1/21 | | | 1,055 | | 1,106 | |
| Norco CA Special Tax Revenue (Norco Ridge Ranch) | | 5.000% | | 9/1/22 | | | 970 | | 1,063 | |
| Norco CA Special Tax Revenue (Norco Ridge Ranch) | | 5.000% | | 9/1/23 | | | 1,270 | | 1,413 | |
| Norco CA Special Tax Revenue (Norco Ridge Ranch) | | 5.000% | | 9/1/24 | | | 1,380 | | 1,554 | |
| Norco CA Special Tax Revenue (Norco Ridge Ranch) | | 5.000% | | 9/1/25 | | | 500 | | 568 | |
| Norco CA Special Tax Revenue (Norco Ridge Ranch) | | 5.000% | | 9/1/26 | | | 1,620 | | 1,859 | |
| Norco CA Special Tax Revenue (Norco Ridge Ranch) | | 5.000% | | 9/1/27 | | | 1,755 | | 2,029 | |
| Norco CA Special Tax Revenue (Norco Ridge Ranch) | | 5.000% | | 9/1/28 | (15) | | 750 | | 873 | |
| Northern California Power Agency Capital Facilities Revenue | | 5.000% | | 8/1/20 | | | 1,000 | | 1,035 | |
| Northern California Power Agency Revenue (Hydroelectric Project) | | 5.000% | | 7/1/20 | | | 3,500 | | 3,565 | |
| Northern California Power Agency Revenue (Hydroelectric Project) | | 5.000% | | 7/1/21 | | | 2,500 | | 2,546 | |
| Northern California Power Agency Revenue (Hydroelectric Project) | | 5.000% | | 7/1/22 | | | 3,395 | | 3,456 | |
| Northern California Power Agency Revenue (Hydroelectric Project) | | 5.000% | | 7/1/28 | | | 5,000 | | 5,488 | |
112
California Intermediate-Term Tax-Exempt Fund
| | | | | | | | Face | | Market | |
| | | | | Maturity | | | Amount | | Value· | |
| | | Coupon | | Date | | | ($000 | ) | ($000 | ) |
| Northern California Power Agency Revenue (Hydroelectric Project) | | 5.000% | | 7/1/29 | | | 3,000 | | 3,291 | |
| Northern California Power Agency Revenue (Hydroelectric Project) | | 5.000% | | 7/1/30 | | | 1,605 | | 1,758 | |
| Northern California Power Agency Revenue (Hydroelectric Project) | | 5.000% | | 7/1/31 | | | 1,600 | | 1,750 | |
| Northern California Transmission Agency Revenue | | 5.000% | | 5/1/20 | | | 250 | | 262 | |
| Northern California Transmission Agency Revenue | | 5.000% | | 5/1/21 | | | 245 | | 263 | |
| Northern California Transmission Agency Revenue | | 5.000% | | 5/1/22 | | | 200 | | 220 | |
| Northern California Transmission Agency Revenue | | 5.000% | | 5/1/23 | | | 385 | | 434 | |
| Northern California Transmission Agency Revenue | | 5.000% | | 5/1/24 | | | 695 | | 798 | |
| Northern California Transmission Agency Revenue | | 5.000% | | 5/1/25 | | | 2,030 | | 2,373 | |
| Northern California Transmission Agency Revenue | | 5.000% | | 5/1/27 | | | 1,250 | | 1,474 | |
| Northern California Transmission Agency Revenue | | 5.000% | | 5/1/28 | | | 1,065 | | 1,246 | |
| Northern California Transmission Agency Revenue | | 5.000% | | 5/1/29 | | | 1,600 | | 1,865 | |
| Northern California Transmission Agency Revenue | | 5.000% | | 5/1/31 | | | 1,250 | | 1,437 | |
| Northern California Transmission Agency Revenue | | 5.000% | | 5/1/32 | | | 2,500 | | 2,864 | |
| Northern California Transmission Agency Revenue | | 5.000% | | 5/1/33 | | | 4,255 | | 4,859 | |
| Northern California Transmission Agency Revenue | | 5.000% | | 5/1/34 | | | 3,100 | | 3,526 | |
| Northern California Transmission Agency Revenue | | 5.000% | | 5/1/36 | | | 5,000 | | 5,645 | |
| Northern California Transmission Agency Revenue | | 5.000% | | 5/1/37 | | | 3,500 | | 3,944 | |
| Northstar Community Services District California Community Facilities District No. 1 Special Tax Revenue | | 5.000% | | 9/1/19 | | | 2,085 | | 2,107 | |
| Northstar Community Services District California Community Facilities District No. 1 Special Tax Revenue | | 5.000% | | 9/1/20 | | | 2,340 | | 2,397 | |
| Northstar Community Services District California Community Facilities District No. 1 Special Tax Revenue | | 5.000% | | 9/1/21 | | | 1,220 | | 1,264 | |
| Northstar Community Services District California Community Facilities District No. 1 Special Tax Revenue | | 5.000% | | 9/1/22 | | | 1,360 | | 1,422 | |
| Northstar Community Services District California Community Facilities District No. 1 Special Tax Revenue | | 5.000% | | 9/1/23 | | | 1,500 | | 1,579 | |
| Northstar Community Services District California Community Facilities District No. 1 Special Tax Revenue | | 5.000% | | 9/1/24 | | | 1,660 | | 1,750 | |
113
California Intermediate-Term Tax-Exempt Fund
| | | | | | | | Face | | Market | |
| | | | | Maturity | | | Amount | | Value· | |
| | | Coupon | | Date | | | ($000 | ) | ($000 | ) |
| Oakdale CA Irrigation District Water Revenue | | 5.000% | | 8/1/26 | | | 240 | | 270 | |
| Oakdale CA Irrigation District Water Revenue | | 5.000% | | 8/1/27 | | | 350 | | 393 | |
| Oakdale CA Irrigation District Water Revenue | | 5.000% | | 8/1/29 | | | 455 | | 511 | |
| Oakdale CA Irrigation District Water Revenue | | 5.000% | | 8/1/30 | | | 415 | | 465 | |
| Oakdale CA Irrigation District Water Revenue | | 5.000% | | 8/1/33 | | | 350 | | 389 | |
| Oakdale CA Irrigation District Water Revenue | | 5.000% | | 8/1/34 | | | 400 | | 442 | |
| Oakdale CA Irrigation District Water Revenue | | 5.000% | | 8/1/35 | | | 300 | | 332 | |
| Oakland CA GO | | 5.000% | | 1/15/23 | | | 5,650 | | 6,336 | |
| Oakland CA GO | | 5.000% | | 1/15/31 | | | 3,000 | | 3,178 | |
| Oakland CA Redevelopment Agency Tax Allocation Revenue (Central District Project) | | 5.000% | | 9/1/21 | | | 3,000 | | 3,228 | |
| Oakland CA Unified School District GO | | 5.000% | | 8/1/19 | | | 6,565 | | 6,707 | |
| Oakland CA Unified School District GO | | 5.000% | | 8/1/20 | | | 2,525 | | 2,658 | |
| Oakland CA Unified School District GO | | 5.000% | | 8/1/20 | | | 5,030 | | 5,295 | |
| Oakland CA Unified School District GO | | 5.000% | | 8/1/21 | | | 1,600 | | 1,723 | |
| Oakland CA Unified School District GO | | 5.000% | | 8/1/21 | (4) | | 3,000 | | 3,230 | |
| Oakland CA Unified School District GO | | 6.250% | | 8/1/21 | (Prere.) | | 2,000 | | 2,232 | |
| Oakland CA Unified School District GO | | 5.000% | | 8/1/22 | | | 1,300 | | 1,433 | |
| Oakland CA Unified School District GO | | 5.000% | | 8/1/22 | (4) | | 2,325 | | 2,563 | |
| Oakland CA Unified School District GO | | 5.500% | | 8/1/23 | | | 1,000 | | 1,131 | |
| Oakland CA Unified School District GO | | 5.000% | | 8/1/24 | | | 1,275 | | 1,458 | |
| Oakland CA Unified School District GO | | 5.000% | | 8/1/25 | (4) | | 2,175 | | 2,528 | |
| Oakland CA Unified School District GO | | 5.000% | | 8/1/26 | (4) | | 1,320 | | 1,529 | |
| Oakland CA Unified School District GO | | 5.000% | | 8/1/26 | | | 1,035 | | 1,199 | |
| Oakland CA Unified School District GO | | 5.000% | | 8/1/27 | | | 1,295 | | 1,496 | |
| Oakland CA Unified School District GO | | 5.000% | | 8/1/27 | (4) | | 1,160 | | 1,340 | |
| Oakland CA Unified School District GO | | 5.000% | | 8/1/28 | | | 1,000 | | 1,151 | |
| Oakland CA Unified School District GO | | 5.000% | | 8/1/28 | (4) | | 1,230 | | 1,416 | |
| Oakland CA Unified School District GO | | 5.000% | | 8/1/29 | | | 1,000 | | 1,148 | |
| Oakland CA Unified School District GO | | 5.000% | | 8/1/31 | | | 480 | | 551 | |
| Oakland CA Unified School District GO | | 5.000% | | 8/1/31 | | | 2,350 | | 2,685 | |
| Oakland CA Unified School District GO | | 5.000% | | 8/1/32 | | | 1,515 | | 1,729 | |
| Oakland CA Unified School District GO | | 5.000% | | 8/1/33 | | | 1,200 | | 1,365 | |
| Oakland CA Unified School District GO | | 5.000% | | 8/1/33 | | | 1,245 | | 1,417 | |
| Oakland CA Unified School District GO | | 5.000% | | 8/1/34 | | | 2,500 | | 2,838 | |
| Oceanside CA Unified School District GO | | 4.000% | | 8/1/33 | (15) | | 3,500 | | 3,663 | |
| Ohlone CA Community College District GO | | 5.000% | | 8/1/21 | (Prere.) | | 1,770 | | 1,918 | |
| Ohlone CA Community College District GO | | 5.000% | | 8/1/22 | | | 760 | | 845 | |
| Ohlone CA Community College District GO | | 4.000% | | 8/1/34 | | | 3,900 | | 4,109 | |
| Ohlone CA Community College District GO | | 4.000% | | 8/1/35 | | | 4,290 | | 4,496 | |
| Ontario CA Public Financing Authority Water Revenue | | 5.250% | | 7/1/27 | | | 1,285 | | 1,454 | |
| Ontario CA Public Financing Authority Water Revenue | | 5.250% | | 7/1/28 | | | 1,765 | | 1,991 | |
| Ontario CA Public Financing Authority Water Revenue | | 5.250% | | 7/1/29 | | | 2,280 | | 2,564 | |
| Ontario CA Public Financing Authority Water Revenue | | 5.250% | | 7/1/30 | | | 1,400 | | 1,570 | |
| Ontario CA Public Financing Authority Water Revenue | | 5.250% | | 7/1/31 | | | 2,525 | | 2,825 | |
| Ontario CA Public Financing Authority Water Revenue | | 5.250% | | 7/1/32 | | | 2,660 | | 2,972 | |
| Ontario CA Public Financing Authority Water Revenue | | 5.250% | | 7/1/33 | | | 2,205 | | 2,462 | |
114
California Intermediate-Term Tax-Exempt Fund
| | | | | | | | Face | | Market | |
| | | | | Maturity | | | Amount | | Value· | |
| | | Coupon | | Date | | | ($000 | ) | ($000 | ) |
| Orange County CA Development Agency Tax Allocation Revenue (Santa Ana Heights Project) | | 5.000% | | 9/1/21 | | | 1,200 | | 1,294 | |
| Orange County CA Development Agency Tax Allocation Revenue (Santa Ana Heights Project) | | 5.000% | | 3/1/22 | | | 1,230 | | 1,342 | |
| Orange County CA Development Agency Tax Allocation Revenue (Santa Ana Heights Project) | | 5.000% | | 9/1/22 | | | 1,260 | | 1,389 | |
| Orange County CA Development Agency Tax Allocation Revenue (Santa Ana Heights Project) | | 5.000% | | 3/1/23 | | | 1,290 | | 1,437 | |
| Orange County CA Development Agency Tax Allocation Revenue (Santa Ana Heights Project) | | 5.000% | | 9/1/23 | | | 1,320 | | 1,483 | |
| Orange County CA Sanitation District Wastewater Revenue | | 5.000% | | 2/1/30 | | | 9,925 | | 11,311 | |
| Orange County CA Transportation Authority Toll Road Revenue | | 5.000% | | 8/15/22 | | | 1,050 | | 1,166 | |
| Orange County CA Transportation Authority Toll Road Revenue | | 5.000% | | 8/15/27 | | | 2,525 | | 2,835 | |
| Orange County CA Transportation Authority Toll Road Revenue | | 5.000% | | 8/15/28 | | | 2,545 | | 2,848 | |
| Orange County CA Water District COP | | 5.000% | | 8/15/19 | (Prere.) | | 6,925 | | 7,089 | |
| Orange County CA Water District Revenue | | 5.000% | | 8/15/33 | | | 8,000 | | 8,941 | |
| Oxnard CA Union High School District GO | | 4.000% | | 8/1/23 | | | 210 | | 229 | |
| Oxnard CA Union High School District GO | | 4.000% | | 8/1/24 | | | 200 | | 221 | |
| Oxnard CA Union High School District GO | | 4.000% | | 8/1/25 | | | 300 | | 335 | |
| Oxnard CA Union High School District GO | | 5.000% | | 8/1/26 | | | 850 | | 1,021 | |
| Oxnard CA Union High School District GO | | 5.000% | | 8/1/27 | | | 750 | | 909 | |
| Oxnard CA Union High School District GO | | 5.000% | | 8/1/28 | | | 500 | | 600 | |
| Oxnard CA Union High School District GO | | 5.000% | | 8/1/29 | | | 850 | | 1,009 | |
| Oxnard CA Union High School District GO | | 4.000% | | 8/1/30 | | | 2,000 | | 2,142 | |
| Oxnard CA Union High School District GO | | 4.000% | | 8/1/31 | | | 750 | | 799 | |
| Oxnard CA Union High School District GO | | 4.000% | | 8/1/32 | | | 1,000 | | 1,060 | |
| Pajaro Valley CA Unified School District GO | | 4.000% | | 8/1/33 | | | 225 | | 239 | |
| Pajaro Valley CA Unified School District GO | | 4.000% | | 8/1/34 | | | 250 | | 263 | |
| Pajaro Valley CA Unified School District GO | | 4.000% | | 8/1/35 | | | 300 | | 314 | |
| Pajaro Valley CA Unified School District GO | | 4.000% | | 8/1/36 | | | 250 | | 259 | |
| Pajaro Valley CA Unified School District GO | | 5.000% | | 8/1/38 | | | 1,155 | | 1,319 | |
| Palm Desert CA Redevelopment Agency Tax Allocation Revenue | | 5.000% | | 10/1/21 | (15) | | 440 | | 477 | |
| Palm Desert CA Redevelopment Agency Tax Allocation Revenue | | 5.000% | | 10/1/24 | (15) | | 1,050 | | 1,216 | |
| Palm Desert CA Redevelopment Agency Tax Allocation Revenue | | 5.000% | | 10/1/25 | (15) | | 1,000 | | 1,179 | |
| Palm Desert CA Redevelopment Agency Tax Allocation Revenue | | 5.000% | | 10/1/26 | (15) | | 1,100 | | 1,314 | |
| Palm Springs CA Unified School District GO | | 5.000% | | 8/1/22 | | | 1,565 | | 1,731 | |
| Palm Springs CA Unified School District GO | | 5.000% | | 8/1/25 | | | 4,775 | | 5,602 | |
| Palm Springs CA Unified School District GO | | 5.000% | | 8/1/26 | | | 5,800 | | 6,894 | |
| Palm Springs CA Unified School District GO | | 5.000% | | 8/1/28 | | | 1,000 | | 1,071 | |
| Palm Springs CA Unified School District GO | | 5.000% | | 8/1/29 | | | 1,500 | | 1,604 | |
| Palm Springs CA Unified School District GO | | 5.000% | | 8/1/30 | | | 1,500 | | 1,602 | |
115
California Intermediate-Term Tax-Exempt Fund
| | | | | | | | Face | | Market | |
| | | | | Maturity | | | Amount | | Value· | |
| | | Coupon | | Date | | | ($000 | ) | ($000 | ) |
| Palm Springs CA Unified School District GO | | 5.000% | | 8/1/31 | | | 1,500 | | 1,600 | |
| Palmdale CA Community Redevelopment Agency Tax Allocation Revenue | | 5.000% | | 9/1/20 | | | 450 | | 474 | |
| Palmdale CA Community Redevelopment Agency Tax Allocation Revenue | | 5.000% | | 9/1/21 | | | 350 | | 377 | |
| Palmdale CA Community Redevelopment Agency Tax Allocation Revenue | | 5.000% | | 9/1/22 | | | 615 | | 679 | |
| Palmdale CA Community Redevelopment Agency Tax Allocation Revenue | | 5.000% | | 9/1/23 | | | 400 | | 450 | |
| Palmdale CA Community Redevelopment Agency Tax Allocation Revenue | | 5.000% | | 9/1/24 | | | 725 | | 829 | |
| Palmdale CA Community Redevelopment Agency Tax Allocation Revenue | | 5.000% | | 9/1/25 | | | 740 | | 858 | |
| Palmdale CA Community Redevelopment Agency Tax Allocation Revenue | | 5.000% | | 9/1/25 | | | 550 | | 638 | |
| Palmdale CA Community Redevelopment Agency Tax Allocation Revenue | | 5.000% | | 9/1/26 | | | 630 | | 741 | |
| Palmdale CA Community Redevelopment Agency Tax Allocation Revenue | | 5.000% | | 9/1/26 | | | 650 | | 764 | |
| Palmdale CA Community Redevelopment Agency Tax Allocation Revenue | | 5.000% | | 9/1/27 | | | 430 | | 503 | |
| Palmdale CA Community Redevelopment Agency Tax Allocation Revenue | | 5.000% | | 9/1/28 | | | 1,355 | | 1,577 | |
| Palmdale CA Community Redevelopment Agency Tax Allocation Revenue | | 5.000% | | 9/1/29 | | | 1,275 | | 1,478 | |
| Palmdale CA Community Redevelopment Agency Tax Allocation Revenue | | 5.000% | | 9/1/31 | | | 415 | | 478 | |
| Palmdale CA Community Redevelopment Agency Tax Allocation Revenue | | 5.000% | | 9/1/32 | | | 1,435 | | 1,647 | |
| Palmdale CA Community Redevelopment Agency Tax Allocation Revenue | | 5.000% | | 9/1/33 | | | 750 | | 857 | |
| Palmdale CA Community Redevelopment Agency Tax Allocation Revenue | | 5.000% | | 9/1/34 | (14) | | 2,000 | | 2,277 | |
| Palmdale CA Community Redevelopment Agency Tax Allocation Revenue | | 5.000% | | 9/1/34 | | | 500 | | 569 | |
| Palo Alto CA Improvement Revenue (University Avenue Area Parking) | | 4.000% | | 9/2/19 | | | 1,000 | | 1,016 | |
| Palo Alto CA Improvement Revenue (University Avenue Area Parking) | | 4.000% | | 9/2/20 | | | 250 | | 258 | |
| Palo Alto CA Improvement Revenue (University Avenue Area Parking) | | 4.000% | | 9/2/21 | | | 400 | | 421 | |
| Palo Alto CA Improvement Revenue (University Avenue Area Parking) | | 5.000% | | 9/2/27 | | | 1,000 | | 1,083 | |
| Palo Alto CA Unified School District GO | | 0.000% | | 8/1/24 | | | 15,890 | | 13,915 | |
| Palomar CA Community College District GO | | 5.000% | | 8/1/29 | | | 490 | | 585 | |
| Palomar CA Community College District GO | | 5.000% | | 8/1/30 | | | 520 | | 616 | |
| Palomar CA Community College District GO | | 5.000% | | 8/1/31 | | | 400 | | 471 | |
| Palomar CA Community College District GO | | 5.000% | | 8/1/32 | | | 300 | | 352 | |
| Palomar CA Community College District GO | | 4.000% | | 8/1/33 | | | 2,140 | | 2,245 | |
| Palomar CA Community College District GO | | 5.000% | | 8/1/33 | | | 2,780 | | 3,244 | |
| Palomar CA Community College District GO | | 4.000% | | 8/1/34 | | | 2,390 | | 2,494 | |
| Palomar CA Community College District GO | | 5.000% | | 8/1/35 | | | 2,485 | | 2,871 | |
| Palomar Pomerado Health California COP | | 6.625% | | 11/1/19 | (Prere.) | | 5,000 | | 5,218 | |
| Palomar Pomerado Health California COP | | 5.000% | | 11/1/21 | | | 560 | | 595 | |
116
California Intermediate-Term Tax-Exempt Fund
| | | | | | | | Face | | Market | |
| | | | | Maturity | | | Amount | | Value· | |
| | | Coupon | | Date | | | ($000 | ) | ($000 | ) |
| Palomar Pomerado Health California COP | | 5.000% | | 11/1/23 | | | 600 | | 657 | |
| Palomar Pomerado Health California COP | | 5.000% | | 11/1/24 | | | 665 | | 737 | |
| Palomar Pomerado Health California COP | | 5.000% | | 11/1/26 | | | 445 | | 500 | |
| Palomar Pomerado Health California COP | | 5.000% | | 11/1/27 | | | 750 | | 846 | |
| Palomar Pomerado Health California COP | | 5.000% | | 11/1/32 | | | 4,550 | | 4,945 | |
| Palomar Pomerado Health California GO | | 0.000% | | 8/1/21 | (14) | | 1,400 | | 1,310 | |
| Palomar Pomerado Health California GO | | 0.000% | | 8/1/22 | (14) | | 7,190 | | 6,530 | |
| Palomar Pomerado Health California GO | | 0.000% | | 8/1/24 | (12) | | 5,130 | | 4,371 | |
| Palomar Pomerado Health California GO | | 0.000% | | 8/1/26 | (12) | | 660 | | 521 | |
| Palomar Pomerado Health California GO | | 0.000% | | 8/1/27 | (12) | | 3,095 | | 2,341 | |
| Palomar Pomerado Health California GO | | 0.000% | | 8/1/27 | (14) | | 16,165 | | 12,104 | |
| Palomar Pomerado Health California GO | | 5.000% | | 8/1/28 | | | 1,640 | | 1,872 | |
| Palomar Pomerado Health California GO | | 5.000% | | 8/1/28 | | | 7,460 | | 8,515 | |
| Palomar Pomerado Health California GO | | 0.000% | | 8/1/29 | (12) | | 4,295 | | 2,967 | |
| Palomar Pomerado Health California GO | | 5.000% | | 8/1/29 | | | 795 | | 903 | |
| Palomar Pomerado Health California GO | | 5.000% | | 8/1/29 | | | 4,025 | | 4,572 | |
| Palomar Pomerado Health California GO | | 5.000% | | 8/1/30 | | | 1,130 | | 1,277 | |
| Palomar Pomerado Health California GO | | 5.000% | | 8/1/31 | | | 775 | | 873 | |
| Palomar Pomerado Health California GO | | 4.000% | | 8/1/32 | | | 4,000 | | 4,170 | |
| Palomar Pomerado Health California GO | | 5.000% | | 8/1/33 | | | 1,235 | | 1,380 | |
14 | Palomar Pomerado Health California GO | | 0.000% | | 8/1/38 | (12) | | 3,000 | | 3,719 | |
| Palomar Pomerado Health California Revenue | | 4.000% | | 11/1/19 | | | 1,250 | | 1,265 | |
| Palomar Pomerado Health California Revenue | | 5.000% | | 11/1/20 | | | 1,125 | | 1,173 | |
| Palomar Pomerado Health California Revenue | | 5.000% | | 11/1/21 | | | 1,375 | | 1,460 | |
| Palomar Pomerado Health California Revenue | | 5.000% | | 11/1/23 | | | 2,410 | | 2,638 | |
| Palomar Pomerado Health California Revenue | | 5.000% | | 11/1/24 | | | 2,390 | | 2,650 | |
| Palomar Pomerado Health California Revenue | | 5.000% | | 11/1/25 | | | 2,250 | | 2,519 | |
| Palomar Pomerado Health California Revenue | | 5.000% | | 11/1/26 | | | 1,875 | | 2,108 | |
| Palomar Pomerado Health California Revenue | | 5.000% | | 11/1/28 | | | 345 | | 381 | |
| Paramount CA Redevelopment Agency Successor Agency Tax Allocation Revenue (Redevelopment Project Area No. 1) | | 5.000% | | 8/1/19 | | | 1,415 | | 1,445 | |
| Paramount CA Redevelopment Agency Successor Agency Tax Allocation Revenue (Redevelopment Project Area No. 1) | | 5.000% | | 8/1/20 | (4) | | 1,505 | | 1,585 | |
| Paramount CA Redevelopment Agency Successor Agency Tax Allocation Revenue (Redevelopment Project Area No. 1) | | 5.000% | | 8/1/21 | (4) | | 1,455 | | 1,565 | |
| Paramount CA Redevelopment Agency Successor Agency Tax Allocation Revenue (Redevelopment Project Area No. 1) | | 5.000% | | 8/1/22 | (4) | | 2,965 | | 3,263 | |
| Paramount CA Redevelopment Agency Successor Agency Tax Allocation Revenue (Redevelopment Project Area No. 1) | | 5.000% | | 8/1/23 | (4) | | 2,485 | | 2,790 | |
| Paramount CA Redevelopment Agency Successor Agency Tax Allocation Revenue (Redevelopment Project Area No. 1) | | 0.000% | | 8/1/26 | (14) | | 6,050 | | 4,520 | |
| Pasadena CA Unified School District GO | | 5.000% | | 8/1/23 | | | 905 | | 1,026 | |
| Pasadena CA Unified School District GO | | 5.000% | | 8/1/24 | | | 1,085 | | 1,255 | |
| Pasadena CA Unified School District GO | | 5.000% | | 8/1/25 | | | 750 | | 883 | |
| Pasadena CA Unified School District GO | | 5.000% | | 8/1/25 | | | 1,000 | | 1,178 | |
| Pasadena CA Unified School District GO | | 5.000% | | 8/1/26 | | | 510 | | 610 | |
| Pasadena CA Unified School District GO | | 5.000% | | 8/1/26 | | | 1,015 | | 1,214 | |
| Pasadena CA Unified School District GO | | 5.000% | | 5/1/30 | | | 3,695 | | 4,028 | |
117
California Intermediate-Term Tax-Exempt Fund
| | | | | | | | Face | | Market | |
| | | | | Maturity | | | Amount | | Value· | |
| | | Coupon | | Date | | | ($000 | ) | ($000 | ) |
| Pasadena CA Unified School District GO | | 5.000% | | 5/1/31 | | | 1,500 | | 1,634 | |
| Pasadena CA Unified School District GO | | 5.000% | | 5/1/32 | | | 2,000 | | 2,177 | |
| Peralta CA Community College District Revenue | | 5.000% | | 8/1/23 | | | 1,000 | | 1,131 | |
| Peralta CA Community College District Revenue | | 5.000% | | 8/1/25 | | | 250 | | 294 | |
| Peralta CA Community College District Revenue | | 4.000% | | 8/1/26 | | | 1,500 | | 1,660 | |
| Peralta CA Community College District Revenue | | 5.000% | | 8/1/27 | | | 890 | | 1,033 | |
| Peralta CA Community College District Revenue | | 5.000% | | 8/1/28 | | | 2,455 | | 2,834 | |
| Peralta CA Community College District Revenue | | 5.000% | | 8/1/29 | | | 2,985 | | 3,430 | |
| Peralta CA Community College District Revenue | | 5.000% | | 8/1/30 | | | 2,260 | | 2,587 | |
| Peralta CA Community College District Revenue | | 5.000% | | 8/1/31 | | | 1,550 | | 1,768 | |
| Peralta CA Community College District Revenue | | 5.000% | | 8/1/32 | | | 2,340 | | 2,660 | |
| Peralta CA Community College District Revenue | | 5.000% | | 8/1/34 | | | 3,000 | | 3,375 | |
| Pittsburg CA Redevelopment Agency Tax Allocation Revenue (Los Medanos Community Development Project) | | 5.000% | | 8/1/19 | | | 3,755 | | 3,832 | |
| Pittsburg CA Redevelopment Agency Tax Allocation Revenue (Los Medanos Community Development Project) | | 5.000% | | 9/1/19 | (4) | | 6,300 | | 6,444 | |
| Pittsburg CA Redevelopment Agency Tax Allocation Revenue (Los Medanos Community Development Project) | | 0.000% | | 8/1/20 | (2) | | 2,460 | | 2,375 | |
| Pittsburg CA Redevelopment Agency Tax Allocation Revenue (Los Medanos Community Development Project) | | 5.000% | | 9/1/20 | (4) | | 11,880 | | 12,510 | |
| Pittsburg CA Redevelopment Agency Tax Allocation Revenue (Los Medanos Community Development Project) | | 5.000% | | 9/1/21 | (4) | | 2,000 | | 2,153 | |
| Pittsburg CA Redevelopment Agency Tax Allocation Revenue (Los Medanos Community Development Project) | | 0.000% | | 8/1/25 | (2) | | 2,965 | | 2,446 | |
| Pittsburg CA Redevelopment Agency Tax Allocation Revenue (Los Medanos Community Development Project) | | 5.000% | | 8/1/25 | (4) | | 855 | | 978 | |
| Pittsburg CA Redevelopment Agency Tax Allocation Revenue (Los Medanos Community Development Project) | | 5.000% | | 8/1/26 | (4) | | 900 | | 1,024 | |
| Pittsburg CA Redevelopment Agency Tax Allocation Revenue (Los Medanos Community Development Project) | | 5.000% | | 8/1/27 | (4) | | 1,220 | | 1,381 | |
| Pittsburg CA Redevelopment Agency Tax Allocation Revenue (Los Medanos Community Development Project) | | 5.000% | | 8/1/28 | (4) | | 1,285 | | 1,443 | |
| Pittsburg CA Redevelopment Agency Tax Allocation Revenue (Los Medanos Community Development Project) | | 0.000% | | 8/1/29 | (2) | | 355 | | 246 | |
| Pittsburg CA Redevelopment Agency Tax Allocation Revenue (Los Medanos Community Development Project) | | 5.000% | | 8/1/29 | (4) | | 1,350 | | 1,509 | |
| Pittsburg CA Water Revenue | | 4.000% | | 8/1/19 | | | 500 | | 508 | |
| Pittsburg CA Water Revenue | | 4.000% | | 8/1/20 | | | 680 | | 706 | |
| Pittsburg CA Water Revenue | | 4.000% | | 8/1/21 | | | 500 | | 528 | |
| Pittsburg CA Water Revenue | | 5.000% | | 8/1/22 | | | 250 | | 277 | |
| Placentia-Yorba Linda CA Unified School District GO | | 5.000% | | 8/1/19 | | | 350 | | 358 | |
118
California Intermediate-Term Tax-Exempt Fund
| | | | | | | | Face | | Market | |
| | | | | Maturity | | | Amount | | Value· | |
| | | Coupon | | Date | | | ($000 | ) | ($000 | ) |
| Placentia-Yorba Linda CA Unified School District GO | | 5.000% | | 8/1/20 | | | 500 | | 527 | |
| Placentia-Yorba Linda CA Unified School District GO | | 5.000% | | 10/1/20 | (4) | | 325 | | 343 | |
| Placentia-Yorba Linda CA Unified School District GO | | 5.000% | | 8/1/21 | | | 775 | | 837 | |
| Placentia-Yorba Linda CA Unified School District GO | | 5.000% | | 10/1/21 | (4) | | 300 | | 324 | |
| Placentia-Yorba Linda CA Unified School District GO | | 5.000% | | 8/1/22 | | | 1,325 | | 1,467 | |
| Placentia-Yorba Linda CA Unified School District GO | | 5.000% | | 10/1/22 | (4) | | 375 | | 414 | |
| Placentia-Yorba Linda CA Unified School District GO | | 5.000% | | 8/1/23 | | | 2,540 | | 2,874 | |
| Placentia-Yorba Linda CA Unified School District GO | | 5.000% | | 10/1/23 | (4) | | 500 | | 563 | |
| Placentia-Yorba Linda CA Unified School District GO | | 5.000% | | 8/1/24 | | | 1,065 | | 1,228 | |
| Placentia-Yorba Linda CA Unified School District GO | | 5.000% | | 8/1/25 | | | 1,785 | | 2,095 | |
| Pleasanton CA Unified School District GO | | 4.000% | | 8/1/34 | | | 1,050 | | 1,106 | |
| Pleasanton CA Unified School District GO | | 4.000% | | 8/1/35 | | | 1,000 | | 1,046 | |
| Pleasanton CA Unified School District GO | | 4.000% | | 8/1/36 | | | 800 | | 833 | |
| Pomona CA Single Family Mortgage Revenue | | 7.600% | | 5/1/23 | (ETM) | | 5,085 | | 5,728 | |
| Pomona CA Unified School District GO | | 5.000% | | 8/1/22 | (15) | | 440 | | 488 | |
| Pomona CA Unified School District GO | | 5.000% | | 8/1/26 | (15) | | 450 | | 515 | |
| Port of Oakland CA Revenue | | 5.000% | | 11/1/26 | | | 2,330 | | 2,768 | |
| Port of Oakland CA Revenue | | 5.000% | | 11/1/27 | | | 1,250 | | 1,497 | |
| Port of Oakland CA Revenue | | 5.000% | | 11/1/28 | | | 1,515 | | 1,798 | |
| Port of Oakland CA Revenue | | 5.000% | | 11/1/29 | | | 950 | | 1,117 | |
| Poway CA Redevelopment Agency Successor Agency Tax Allocation Revenue | | 5.000% | | 6/15/22 | | | 2,225 | | 2,459 | |
| Poway CA Redevelopment Agency Successor Agency Tax Allocation Revenue | | 5.000% | | 12/15/22 | | | 3,535 | | 3,951 | |
| Poway CA Redevelopment Agency Successor Agency Tax Allocation Revenue | | 5.000% | | 6/15/23 | | | 3,325 | | 3,759 | |
| Poway CA Redevelopment Agency Successor Agency Tax Allocation Revenue | | 5.000% | | 12/15/26 | | | 1,370 | | 1,611 | |
| Poway CA Unified School District GO | | 0.000% | | 8/1/19 | | | 5,425 | | 5,358 | |
| Poway CA Unified School District GO | | 5.000% | | 9/1/19 | | | 980 | | 1,002 | |
| Poway CA Unified School District GO | | 0.000% | | 8/1/20 | | | 3,280 | | 3,171 | |
| Poway CA Unified School District GO | | 5.000% | | 9/1/20 | | | 610 | | 641 | |
| Poway CA Unified School District GO | | 5.000% | | 9/1/21 | | | 320 | | 345 | |
| Poway CA Unified School District GO | | 5.000% | | 9/1/22 | | | 455 | | 502 | |
| Poway CA Unified School District GO | | 5.000% | | 9/1/23 | | | 1,565 | | 1,719 | |
| Poway CA Unified School District GO | | 5.000% | | 8/1/26 | | | 5,125 | | 5,507 | |
| Poway CA Unified School District GO | | 5.000% | | 9/1/26 | | | 990 | | 1,071 | |
| Poway CA Unified School District GO | | 5.000% | | 8/1/27 | | | 1,625 | | 1,849 | |
| Poway CA Unified School District GO | | 0.000% | | 8/1/28 | | | 9,070 | | 6,797 | |
| Poway CA Unified School District GO | | 5.000% | | 9/1/29 | | | 1,190 | | 1,274 | |
| Poway CA Unified School District GO | | 5.000% | | 9/1/30 | | | 2,525 | | 2,696 | |
| Poway CA Unified School District GO | | 0.000% | | 8/1/31 | | | 1,345 | | 876 | |
| Poway CA Unified School District Public Financing Authority Special Tax Revenue | | 4.000% | | 9/1/20 | | | 1,165 | | 1,206 | |
119
California Intermediate-Term Tax-Exempt Fund
| | | | | | | | Face | | Market | |
| | | | | Maturity | | | Amount | | Value· | |
| | | Coupon | | Date | | | ($000 | ) | ($000 | ) |
| Poway CA Unified School District Public Financing Authority Special Tax Revenue | | 4.000% | | 9/1/21 | | | 1,000 | | 1,050 | |
| Poway CA Unified School District Public Financing Authority Special Tax Revenue | | 4.000% | | 9/1/22 | | | 860 | | 915 | |
| Poway CA Unified School District Public Financing Authority Special Tax Revenue | | 5.000% | | 9/1/22 | (15) | | 715 | | 786 | |
| Poway CA Unified School District Public Financing Authority Special Tax Revenue | | 4.000% | | 9/15/22 | | | 435 | | 464 | |
| Poway CA Unified School District Public Financing Authority Special Tax Revenue | | 5.000% | | 9/1/23 | (15) | | 1,180 | | 1,322 | |
| Poway CA Unified School District Public Financing Authority Special Tax Revenue | | 5.000% | | 9/1/23 | | | 1,005 | | 1,126 | |
| Poway CA Unified School District Public Financing Authority Special Tax Revenue | | 5.000% | | 9/1/24 | (15) | | 1,000 | | 1,139 | |
| Poway CA Unified School District Public Financing Authority Special Tax Revenue | | 5.000% | | 9/1/24 | | | 1,530 | | 1,742 | |
| Poway CA Unified School District Public Financing Authority Special Tax Revenue | | 5.000% | | 9/1/25 | (15) | | 775 | | 896 | |
| Poway CA Unified School District Public Financing Authority Special Tax Revenue | | 5.000% | | 9/1/25 | | | 1,645 | | 1,899 | |
| Poway CA Unified School District Public Financing Authority Special Tax Revenue | | 5.000% | | 9/1/26 | (15) | | 1,000 | | 1,147 | |
| Poway CA Unified School District Public Financing Authority Special Tax Revenue | | 5.000% | | 9/1/26 | | | 2,520 | | 2,937 | |
| Poway CA Unified School District Public Financing Authority Special Tax Revenue | | 5.000% | | 9/15/26 | | | 915 | | 998 | |
| Poway CA Unified School District Public Financing Authority Special Tax Revenue | | 5.000% | | 9/15/27 | | | 990 | | 1,076 | |
| Poway CA Unified School District Public Financing Authority Special Tax Revenue | | 5.000% | | 9/15/29 | | | 1,005 | | 1,081 | |
| Poway CA Unified School District Public Financing Authority Special Tax Revenue | | 5.000% | | 9/15/30 | | | 1,000 | | 1,101 | |
| Poway CA Unified School District Public Financing Authority Special Tax Revenue | | 5.000% | | 9/15/30 | | | 1,235 | | 1,324 | |
| Poway CA Unified School District Public Financing Authority Special Tax Revenue | | 5.000% | | 9/15/31 | | | 1,290 | | 1,379 | |
| Poway CA Unified School District Public Financing Authority Special Tax Revenue | | 5.000% | | 9/15/32 | | | 980 | | 1,077 | |
| Poway CA Unified School District Public Financing Authority Special Tax Revenue | | 5.000% | | 9/15/32 | | | 1,405 | | 1,498 | |
| Poway CA Unified School District Public Financing Authority Special Tax Revenue | | 5.000% | | 9/15/33 | | | 1,500 | | 1,597 | |
| Poway CA Unified School District Public Financing Authority Special Tax Revenue | | 5.000% | | 9/15/34 | | | 1,590 | | 1,690 | |
| Poway CA Unified School District Public Financing Authority Special Tax Revenue | | 5.000% | | 9/15/35 | | | 1,690 | | 1,792 | |
| Rancho Cucamonga CA Redevelopment Agency Successor Agency Tax Allocation Revenue (Rancho Redevelopment Project) | | 5.000% | | 9/1/27 | (4) | | 1,700 | | 1,943 | |
| Rancho Cucamonga CA Redevelopment Agency Successor Agency Tax Allocation Revenue (Rancho Redevelopment Project) | | 5.000% | | 9/1/28 | (4) | | 2,800 | | 3,187 | |
120
California Intermediate-Term Tax-Exempt Fund
| | | | | | | | Face | | Market | |
| | | | | Maturity | | | Amount | | Value· | |
| | | Coupon | | Date | | | ($000 | ) | ($000 | ) |
| Rancho Cucamonga CA Redevelopment Agency Successor Agency Tax Allocation Revenue (Rancho Redevelopment Project) | | 5.000% | | 9/1/30 | (4) | | 1,500 | | 1,695 | |
| Rancho Cucamonga CA Redevelopment Agency Successor Agency Tax Allocation Revenue (Rancho Redevelopment Project) | | 5.000% | | 9/1/31 | (4) | | 1,400 | | 1,578 | |
| Rancho Cucamonga CA Redevelopment Agency Successor Agency Tax Allocation Revenue (Rancho Redevelopment Project) | | 5.000% | | 9/1/32 | (4) | | 1,710 | | 1,924 | |
| Rancho Santiago CA Community College District GO | | 5.125% | | 9/1/29 | (4) | | 5,095 | | 6,357 | |
| Rancho Santiago CA Community College District GO | | 0.000% | | 9/1/30 | (4) | | 1,000 | | 680 | |
| Redding CA Electric System Revenue | | 4.000% | | 6/1/19 | | | 1,400 | | 1,416 | |
| Redding CA Electric System Revenue | | 5.000% | | 6/1/20 | | | 1,120 | | 1,174 | |
| Redding CA Electric System Revenue | | 5.000% | | 6/1/22 | | | 395 | | 437 | |
| Redding CA Electric System Revenue | | 5.000% | | 6/1/22 | | | 1,100 | | 1,216 | |
| Redding CA Electric System Revenue | | 5.000% | | 6/1/23 | | | 500 | | 565 | |
| Redding CA Electric System Revenue | | 5.000% | | 6/1/23 | | | 800 | | 905 | |
| Redding CA Electric System Revenue | | 5.000% | | 6/1/24 | | | 1,000 | | 1,153 | |
| Redding CA Electric System Revenue | | 5.000% | | 6/1/24 | | | 750 | | 865 | |
| Redding CA Electric System Revenue | | 5.000% | | 6/1/25 | | | 830 | | 975 | |
| Redding CA Electric System Revenue | | 5.000% | | 6/1/25 | | | 730 | | 857 | |
| Redding CA Electric System Revenue | | 5.000% | | 6/1/26 | | | 1,000 | | 1,190 | |
| Redding CA Electric System Revenue | | 5.000% | | 6/1/27 | | | 1,350 | | 1,626 | |
| Redding CA Electric System Revenue | | 5.000% | | 6/1/28 | | | 1,275 | | 1,525 | |
| Redding CA Electric System Revenue | | 5.000% | | 6/1/29 | | | 1,495 | | 1,777 | |
| Redding CA Electric System Revenue | | 5.000% | | 6/1/30 | | | 800 | | 953 | |
| Redding CA Joint Powers Financing Authority Electric System Revenue | | 4.000% | | 6/1/23 | | | 325 | | 352 | |
| Redding CA Joint Powers Financing Authority Electric System Revenue | | 5.000% | | 6/1/24 | | | 300 | | 344 | |
| Redding CA Joint Powers Financing Authority Electric System Revenue | | 5.000% | | 6/1/25 | | | 375 | | 439 | |
| Redding CA Joint Powers Financing Authority Electric System Revenue | | 5.000% | | 6/1/26 | | | 675 | | 788 | |
| Redding CA Joint Powers Financing Authority Electric System Revenue | | 5.000% | | 6/1/27 | | | 1,000 | | 1,159 | |
| Redding CA Joint Powers Financing Authority Electric System Revenue | | 5.000% | | 6/1/28 | | | 1,000 | | 1,152 | |
| Redding CA Joint Powers Financing Authority Electric System Revenue | | 5.000% | | 6/1/30 | | | 775 | | 884 | |
| Redding CA Joint Powers Financing Authority Electric System Revenue | | 5.000% | | 6/1/32 | | | 475 | | 538 | |
| Redwood City CA Redevelopment Agency Redevelopment Project Area No. 2 Tax Allocation Revenue | | 0.000% | | 7/15/25 | (2) | | 3,350 | | 2,767 | |
| Rialto CA Redevelopment Agency Successor Agency Tax Allocation Revenue | | 5.000% | | 9/1/28 | | | 1,000 | | 1,200 | |
| Rialto CA Redevelopment Agency Successor Agency Tax Allocation Revenue | | 5.000% | | 9/1/30 | | | 1,285 | | 1,505 | |
| Rialto CA Redevelopment Agency Successor Agency Tax Allocation Revenue | | 5.000% | | 9/1/32 | | | 470 | | 545 | |
121
California Intermediate-Term Tax-Exempt Fund
| | | | | | | | Face | | Market | |
| | | | | Maturity | | | Amount | | Value· | |
| | | Coupon | | Date | | | ($000 | ) | ($000 | ) |
| Rialto CA Redevelopment Agency Successor Agency Tax Allocation Revenue | | 5.000% | | 9/1/33 | | | 515 | | 595 | |
| Rialto CA Redevelopment Agency Successor Agency Tax Allocation Revenue | | 5.000% | | 9/1/37 | | | 3,250 | | 3,689 | |
| Rio CA Elementary School District Community Facilities District Special Tax Revenue | | 5.000% | | 9/1/27 | | | 1,000 | | 1,096 | |
| Rio CA Elementary School District Community Facilities District Special Tax Revenue | | 5.000% | | 9/1/28 | | | 1,000 | | 1,087 | |
| Rio CA Elementary School District Community Facilities District Special Tax Revenue | | 5.000% | | 9/1/30 | | | 1,000 | | 1,079 | |
| Rio CA Elementary School District Community Facilities District Special Tax Revenue | | 5.000% | | 9/1/35 | | | 2,300 | | 2,478 | |
| Rio Hondo CA Community College District GO | | 0.000% | | 8/1/31 | | | 2,010 | | 1,296 | |
| Riverside CA Community College District GO | | 0.000% | | 8/1/27 | | | 2,755 | | 2,081 | |
| Riverside CA Community College District GO | | 0.000% | | 8/1/28 | | | 1,650 | | 1,186 | |
| Riverside CA Community College District GO | | 5.000% | | 8/1/28 | | | 3,080 | | 3,568 | |
| Riverside CA Electric Revenue | | 5.000% | | 10/1/24 | (4) | | 1,000 | | 1,010 | |
| Riverside CA Electric Revenue | | 5.000% | | 10/1/25 | (4) | | 2,000 | | 2,020 | |
| Riverside CA Electric Revenue | | 5.000% | | 10/1/26 | (4) | | 2,500 | | 2,525 | |
| Riverside CA Electric Revenue | | 5.000% | | 10/1/27 | (4) | | 3,570 | | 3,606 | |
1 | Riverside CA Electric Revenue TOB VRDO | | 1.720% | | 12/7/18 | | | 2,210 | | 2,210 | |
| Riverside CA Redevelopment Successor Agency Tax Allocation Revenue | | 5.000% | | 9/1/29 | | | 1,265 | | 1,426 | |
| Riverside CA Redevelopment Successor Agency Tax Allocation Revenue | | 5.000% | | 9/1/31 | | | 1,045 | | 1,176 | |
| Riverside CA Redevelopment Successor Agency Tax Allocation Revenue | | 5.000% | | 10/1/31 | (4) | | 2,930 | | 3,259 | |
| Riverside CA Redevelopment Successor Agency Tax Allocation Revenue | | 5.000% | | 10/1/32 | (4) | | 3,075 | | 3,413 | |
| Riverside CA Redevelopment Successor Agency Tax Allocation Revenue | | 5.000% | | 9/1/33 | | | 1,055 | | 1,185 | |
| Riverside CA Redevelopment Successor Agency Tax Allocation Revenue | | 5.000% | | 10/1/33 | (4) | | 1,230 | | 1,362 | |
1 | Riverside CA Redevelopment Successor Agency Tax Allocation Revenue TOB VRDO | | 1.790% | | 12/7/18 | (15) | | 5,000 | | 5,000 | |
| Riverside CA Sewer Revenue | | 5.000% | | 8/1/20 | | | 1,685 | | 1,775 | |
| Riverside CA Sewer Revenue | | 5.000% | | 8/1/21 | | | 2,000 | | 2,165 | |
| Riverside CA Sewer Revenue | | 5.000% | | 8/1/22 | | | 2,160 | | 2,399 | |
| Riverside CA Sewer Revenue | | 5.000% | | 8/1/23 | | | 3,760 | | 4,276 | |
| Riverside CA Sewer Revenue | | 5.000% | | 8/1/24 | | | 2,020 | | 2,345 | |
| Riverside CA Sewer Revenue | | 5.000% | | 8/1/26 | | | 600 | | 719 | |
| Riverside CA Sewer Revenue | | 5.000% | | 8/1/27 | | | 1,055 | | 1,276 | |
| Riverside CA Sewer Revenue | | 5.000% | | 8/1/28 | | | 1,000 | | 1,221 | |
| Riverside CA Sewer Revenue | | 5.000% | | 8/1/29 | | | 1,000 | | 1,207 | |
| Riverside CA Sewer Revenue | | 5.000% | | 8/1/30 | | | 2,680 | | 3,204 | |
| Riverside CA Unified School District Financing Authority Revenue | | 5.000% | | 9/1/19 | | | 1,220 | | 1,248 | |
| Riverside CA Unified School District Financing Authority Revenue | | 5.000% | | 9/1/20 | | | 1,280 | | 1,347 | |
| Riverside CA Unified School District Financing Authority Revenue | | 5.000% | | 9/1/23 | | | 1,410 | | 1,543 | |
| Riverside CA Unified School District Financing Authority Revenue | | 5.000% | | 9/1/25 | | | 1,555 | | 1,685 | |
122
California Intermediate-Term Tax-Exempt Fund
| | | | | | | | Face | | Market | |
| | | | | Maturity | | | Amount | | Value· | |
| | | Coupon | | Date | | | ($000 | ) | ($000 | ) |
| Riverside CA Unified School District Financing Authority Revenue | | 5.000% | | 9/1/26 | | | 1,615 | | 1,747 | |
| Riverside CA Unified School District Financing Authority Revenue | | 5.000% | | 9/1/27 | | | 1,710 | | 1,850 | |
| Riverside County CA Asset Leasing Corp. Leasehold Revenue (Riverside County Hospital Project) | | 5.000% | | 6/1/19 | | | 3,660 | | 3,721 | |
| Riverside County CA Asset Leasing Corp. Leasehold Revenue (Riverside County Hospital Project) | | 0.000% | | 6/1/25 | (14) | | 6,835 | | 5,637 | |
| Riverside County CA Infrastructure Financing Authority (Indio Law Building) | | 4.000% | | 11/1/28 | | | 500 | | 541 | |
| Riverside County CA Infrastructure Financing Authority (Indio Law Building) | | 4.000% | | 11/1/30 | | | 1,070 | | 1,146 | |
| Riverside County CA Infrastructure Financing Authority (Indio Law Building) | | 4.000% | | 11/1/32 | | | 1,150 | | 1,214 | |
| Riverside County CA Infrastructure Financing Authority (Indio Law Building) | | 4.000% | | 11/1/35 | | | 1,930 | | 2,013 | |
| Riverside County CA Infrastructure Financing Authority (Indio Law Building) | | 4.000% | | 11/1/36 | | | 2,010 | | 2,086 | |
| Riverside County CA Infrastructure Financing Authority (Indio Law Building) | | 4.000% | | 11/1/37 | | | 1,000 | | 1,036 | |
| Riverside County CA Public Financing Authority Lease Revenue | | 5.000% | | 11/1/22 | | | 1,800 | | 1,993 | |
| Riverside County CA Public Financing Authority Lease Revenue | | 5.000% | | 11/1/23 | | | 2,030 | | 2,292 | |
| Riverside County CA Public Financing Authority Lease Revenue | | 5.000% | | 11/1/24 | | | 1,735 | | 1,992 | |
| Riverside County CA Public Financing Authority Lease Revenue | | 5.000% | | 11/1/30 | | | 9,885 | | 11,272 | |
| Riverside County CA Public Financing Authority Lease Revenue | | 5.000% | | 11/1/32 | | | 10,620 | | 12,081 | |
| Riverside County CA Public Financing Authority Tax Allocation Revenue | | 4.000% | | 9/1/19 | | | 2,560 | | 2,602 | |
| Riverside County CA Public Financing Authority Tax Allocation Revenue | | 5.000% | | 10/1/19 | | | 225 | | 231 | |
| Riverside County CA Public Financing Authority Tax Allocation Revenue | | 5.000% | | 9/1/20 | | | 2,665 | | 2,807 | |
| Riverside County CA Public Financing Authority Tax Allocation Revenue | | 5.000% | | 10/1/20 | | | 375 | | 395 | |
| Riverside County CA Public Financing Authority Tax Allocation Revenue | | 5.000% | | 9/1/21 | (4) | | 2,550 | | 2,749 | |
| Riverside County CA Public Financing Authority Tax Allocation Revenue | | 5.000% | | 10/1/21 | | | 250 | | 270 | |
| Riverside County CA Public Financing Authority Tax Allocation Revenue | | 5.000% | | 9/1/22 | (4) | | 1,830 | | 2,019 | |
| Riverside County CA Public Financing Authority Tax Allocation Revenue | | 5.000% | | 10/1/22 | | | 350 | | 386 | |
| Riverside County CA Public Financing Authority Tax Allocation Revenue | | 5.000% | | 9/1/23 | (4) | | 2,445 | | 2,751 | |
| Riverside County CA Public Financing Authority Tax Allocation Revenue | | 5.000% | | 10/1/33 | (15) | | 3,535 | | 4,020 | |
| Riverside County CA Public Financing Authority Tax Allocation Revenue | | 5.000% | | 10/1/35 | (15) | | 1,195 | | 1,343 | |
123
California Intermediate-Term Tax-Exempt Fund
| | | | | | | | Face | | Market | |
| | | | | Maturity | | | Amount | | Value· | |
| | | Coupon | | Date | | | ($000 | ) | ($000 | ) |
| Riverside County CA Redevelopment Successor Agency Tax Allocation Revenue | | 5.000% | | 10/1/19 | (4) | | 1,000 | | 1,026 | |
| Riverside County CA Redevelopment Successor Agency Tax Allocation Revenue | | 5.000% | | 10/1/21 | (4) | | 1,150 | | 1,242 | |
15 | Riverside County CA Redevelopment Successor Agency Tax Allocation Revenue | | 0.000% | | 10/1/22 | (15) | | 375 | | 356 | |
| Riverside County CA Redevelopment Successor Agency Tax Allocation Revenue | | 5.000% | | 10/1/22 | (4) | | 1,320 | | 1,458 | |
| Riverside County CA Redevelopment Successor Agency Tax Allocation Revenue | | 5.000% | | 10/1/23 | (4) | | 1,905 | | 2,144 | |
| Riverside County CA Redevelopment Successor Agency Tax Allocation Revenue | | 5.000% | | 10/1/24 | (4) | | 2,005 | | 2,296 | |
| Riverside County CA Redevelopment Successor Agency Tax Allocation Revenue | | 5.000% | | 10/1/25 | (4) | | 1,440 | | 1,673 | |
15 | Riverside County CA Redevelopment Successor Agency Tax Allocation Revenue | | 0.000% | | 10/1/27 | (15) | | 520 | | 522 | |
| Riverside County CA Redevelopment Successor Agency Tax Allocation Revenue | | 5.000% | | 10/1/27 | (4) | | 1,160 | | 1,335 | |
15 | Riverside County CA Redevelopment Successor Agency Tax Allocation Revenue | | 0.000% | | 10/1/30 | (15) | | 750 | | 741 | |
15 | Riverside County CA Redevelopment Successor Agency Tax Allocation Revenue | | 0.000% | | 10/1/32 | (15) | | 590 | | 579 | |
15 | Riverside County CA Redevelopment Successor Agency Tax Allocation Revenue | | 0.000% | | 10/1/37 | (15) | | 1,015 | | 977 | |
| Riverside County CA Transportation Commission Sales Tax Revenue | | 5.250% | | 6/1/23 | (Prere.) | | 3,000 | | 3,435 | |
| Riverside County CA Transportation Commission Sales Tax Revenue | | 5.250% | | 6/1/23 | (Prere.) | | 4,075 | | 4,666 | |
| Riverside County CA Transportation Commission Sales Tax Revenue | | 5.250% | | 6/1/23 | (Prere.) | | 3,000 | | 3,435 | |
| Riverside County CA Transportation Commission Sales Tax Revenue | | 5.250% | | 6/1/23 | (Prere.) | | 2,000 | | 2,290 | |
| Riverside County CA Transportation Commission Sales Tax Revenue | | 5.000% | | 6/1/37 | | | 4,900 | | 5,641 | |
| Riverside County CA Transportation Commission Toll Revenue | | 0.000% | | 6/1/22 | | | 2,500 | | 2,243 | |
| Riverside County CA Transportation Commission Toll Revenue | | 0.000% | | 6/1/23 | | | 3,630 | | 3,134 | |
| Riverside County CA Transportation Commission Toll Revenue | | 0.000% | | 6/1/24 | | | 6,985 | | 5,776 | |
| Riverside County CA Transportation Commission Toll Revenue | | 0.000% | | 6/1/31 | | | 5,000 | | 2,950 | |
| Riverside County CA Transportation Commission Toll Revenue | | 0.000% | | 6/1/32 | | | 4,000 | | 2,241 | |
| Riverside County CA Transportation Commission Toll Revenue | | 0.000% | | 6/1/33 | | | 5,500 | | 2,923 | |
| Riverside County CA Transportation Commission Toll Revenue | | 0.000% | | 6/1/34 | | | 3,500 | | 1,765 | |
| Rocklin CA Unified School District GO | | 0.000% | | 8/1/23 | (14) | | 7,030 | | 6,265 | |
| Rocklin CA Unified School District GO | | 0.000% | | 8/1/24 | (14) | | 2,965 | | 2,576 | |
| Roseville CA Financing Authority Electric System Revenue | | 5.000% | | 2/1/29 | | | 330 | | 392 | |
| Roseville CA Financing Authority Electric System Revenue | | 5.000% | | 2/1/30 | | | 200 | | 236 | |
124
California Intermediate-Term Tax-Exempt Fund
| | | | | | | | Face | | Market | |
| | | | | Maturity | | | Amount | | Value· | |
| | | Coupon | | Date | | | ($000 | ) | ($000 | ) |
| Roseville CA Financing Authority Electric System Revenue | | 5.000% | | 2/1/30 | | | 770 | | 873 | |
| Roseville CA Financing Authority Electric System Revenue | | 5.000% | | 2/1/31 | | | 530 | | 599 | |
| Roseville CA Financing Authority Electric System Revenue | | 5.000% | | 2/1/32 | | | 250 | | 292 | |
| Roseville CA Financing Authority Electric System Revenue | | 5.000% | | 2/1/32 | | | 1,310 | | 1,476 | |
| Roseville CA Financing Authority Electric System Revenue | | 5.000% | | 2/1/33 | | | 350 | | 407 | |
| Roseville CA Financing Authority Electric System Revenue | | 5.000% | | 2/1/33 | | | 1,000 | | 1,123 | |
| Roseville CA Financing Authority Electric System Revenue | | 5.000% | | 2/1/34 | | | 250 | | 286 | |
| Roseville CA Financing Authority Electric System Revenue | | 5.000% | | 2/1/34 | | | 3,425 | | 3,832 | |
| Roseville CA Financing Authority Electric System Revenue | | 4.000% | | 2/1/36 | | | 4,530 | | 4,683 | |
| Roseville CA Financing Authority Special Tax Revenue | | 4.000% | | 9/1/19 | | | 850 | | 865 | |
| Roseville CA Financing Authority Special Tax Revenue | | 4.000% | | 9/1/20 | | | 550 | | 571 | |
| Roseville CA Financing Authority Special Tax Revenue | | 4.000% | | 9/1/21 | | | 700 | | 742 | |
| Roseville CA Financing Authority Special Tax Revenue | | 4.000% | | 9/1/22 | | | 1,000 | | 1,078 | |
| Roseville CA Financing Authority Special Tax Revenue | | 5.000% | | 9/1/23 | | | 550 | | 626 | |
| Roseville CA Financing Authority Special Tax Revenue | | 5.000% | | 9/1/24 | | | 1,100 | | 1,278 | |
| Roseville CA Financing Authority Special Tax Revenue | | 5.000% | | 9/1/27 | | | 1,100 | | 1,335 | |
| Roseville CA Financing Authority Special Tax Revenue | | 5.000% | | 9/1/29 | | | 750 | | 897 | |
| Roseville CA Financing Authority Special Tax Revenue | | 5.000% | | 9/1/30 | (4) | | 2,000 | | 2,381 | |
| Roseville CA Financing Authority Special Tax Revenue | | 5.000% | | 9/1/31 | (4) | | 2,665 | | 3,154 | |
5 | Roseville CA Joint Union High School District GO | | 0.000% | | 8/1/23 | | | 275 | | 245 | |
5 | Roseville CA Joint Union High School District GO | | 0.000% | | 8/1/24 | | | 580 | | 497 | |
5 | Roseville CA Joint Union High School District GO | | 0.000% | | 8/1/25 | | | 555 | | 459 | |
5 | Roseville CA Joint Union High School District GO | | 0.000% | | 8/1/26 | | | 500 | | 397 | |
5 | Roseville CA Joint Union High School District GO | | 5.000% | | 8/1/27 | | | 185 | | 221 | |
5 | Roseville CA Joint Union High School District GO | | 0.000% | | 8/1/28 | | | 500 | | 361 | |
5 | Roseville CA Joint Union High School District GO | | 5.000% | | 8/1/28 | | | 175 | | 208 | |
5 | Roseville CA Joint Union High School District GO | | 0.000% | | 8/1/29 | | | 1,085 | | 745 | |
125
California Intermediate-Term Tax-Exempt Fund
| | | | | | | | Face | | Market | |
| | | | | Maturity | | | Amount | | Value· | |
| | | Coupon | | Date | | | ($000 | ) | ($000 | ) |
| Roseville CA Joint Union High School District GO | | 0.000% | | 8/1/29 | (4) | | 3,215 | | 2,290 | |
5 | Roseville CA Joint Union High School District GO | | 5.000% | | 8/1/29 | | | 200 | | 236 | |
5 | Roseville CA Joint Union High School District GO | | 0.000% | | 8/1/30 | | | 1,000 | | 649 | |
5 | Roseville CA Joint Union High School District GO | | 5.000% | | 8/1/30 | | | 300 | | 350 | |
5 | Roseville CA Joint Union High School District GO | | 0.000% | | 8/1/31 | | | 1,585 | | 973 | |
| Roseville CA Natural Gas Financing Authority Gas Revenue | | 5.000% | | 2/15/19 | | | 10,000 | | 10,053 | |
| Roseville CA Natural Gas Financing Authority Gas Revenue | | 5.000% | | 2/15/20 | | | 2,170 | | 2,237 | |
| Roseville CA Natural Gas Financing Authority Gas Revenue | | 5.000% | | 2/15/24 | | | 865 | | 956 | |
| Roseville CA Natural Gas Financing Authority Gas Revenue | | 5.000% | | 2/15/27 | | | 210 | | 238 | |
| Roseville CA Special Tax Revenue | | 5.000% | | 9/1/20 | | | 1,055 | | 1,103 | |
| Roseville CA Special Tax Revenue | | 5.000% | | 9/1/21 | | | 500 | | 533 | |
| Sacramento CA Area Flood Control Agency Special Assessment Revenue (Natomas Basin Local Assessment) | | 5.000% | | 10/1/22 | (15) | | 445 | | 492 | |
| Sacramento CA Area Flood Control Agency Special Assessment Revenue (Natomas Basin Local Assessment) | | 5.000% | | 10/1/24 | (15) | | 300 | | 344 | |
| Sacramento CA Area Flood Control Agency Special Assessment Revenue (Natomas Basin Local Assessment) | | 5.000% | | 10/1/26 | (15) | | 280 | | 320 | |
| Sacramento CA Area Flood Control Agency Special Assessment Revenue (Natomas Basin Local Assessment) | | 5.000% | | 10/1/27 | (15) | | 650 | | 740 | |
| Sacramento CA Area Flood Control Agency Special Assessment Revenue (Natomas Basin Local Assessment) | | 5.000% | | 10/1/28 | (15) | | 250 | | 283 | |
| Sacramento CA Area Flood Control Agency Special Assessment Revenue (Natomas Basin Local Assessment) | | 5.000% | | 10/1/29 | (15) | | 500 | | 565 | |
| Sacramento CA Area Flood Control Agency Special Assessment Revenue (Natomas Basin Local Assessment) | | 5.000% | | 10/1/31 | (15) | | 1,160 | | 1,297 | |
| Sacramento CA Area Flood Control Agency Special Assessment Revenue (Natomas Basin Local Assessment) | | 5.000% | | 10/1/33 | (15) | | 1,280 | | 1,422 | |
| Sacramento CA Area Flood Control Agency Special Assessment Revenue (Natomas Basin Local Assessment) | | 5.000% | | 10/1/34 | (15) | | 1,340 | | 1,483 | |
| Sacramento CA City Financing Authority Revenue | | 5.000% | | 12/1/19 | | | 3,990 | | 4,122 | |
| Sacramento CA City Financing Authority Revenue | | 4.000% | | 12/1/20 | | | 3,700 | | 3,862 | |
| Sacramento CA City Financing Authority Revenue | | 5.000% | | 12/1/20 | | | 2,000 | | 2,126 | |
126
California Intermediate-Term Tax-Exempt Fund
| | | | | | | | Face | | Market | |
| | | | | Maturity | | | Amount | | Value· | |
| | | Coupon | | Date | | | ($000 | ) | ($000 | ) |
| Sacramento CA City Financing Authority Revenue | | 5.000% | | 12/1/32 | (15) | | 1,300 | | 1,480 | |
| Sacramento CA City Financing Authority Revenue | | 5.000% | | 12/1/33 | (15) | | 1,725 | | 1,955 | |
| Sacramento CA City Financing Authority Tax Allocation Revenue | | 0.000% | | 12/1/25 | (14) | | 5,000 | | 4,063 | |
| Sacramento CA City Financing Authority Tax Allocation Revenue | | 0.000% | | 12/1/27 | (14) | | 15,815 | | 11,856 | |
| Sacramento CA City Financing Authority Tax Allocation Revenue | | 0.000% | | 12/1/31 | (14) | | 5,000 | | 3,078 | |
| Sacramento CA City Financing Authority Tax Allocation Revenue | | 0.000% | | 12/1/34 | (14) | | 3,990 | | 2,076 | |
| Sacramento CA City Unified School District GO | | 5.000% | | 7/1/20 | (4) | | 500 | | 525 | |
| Sacramento CA City Unified School District GO | | 5.000% | | 7/1/21 | (4) | | 460 | | 496 | |
| Sacramento CA City Unified School District GO | | 5.000% | | 7/1/22 | (4) | | 770 | | 852 | |
| Sacramento CA Cogeneration Authority Revenue | | 5.000% | | 7/1/19 | | | 1,155 | | 1,177 | |
| Sacramento CA Cogeneration Authority Revenue | | 5.250% | | 7/1/20 | | | 1,250 | | 1,319 | |
| Sacramento CA Cogeneration Authority Revenue | | 5.250% | | 7/1/21 | | | 1,000 | | 1,086 | |
| Sacramento CA Financing Authority Lease Revenue | | 5.000% | | 12/1/18 | | | 50 | | 50 | |
| Sacramento CA Municipal Utility District Financing Authority Revenue | | 5.000% | | 7/1/20 | | | 1,405 | | 1,477 | |
| Sacramento CA Municipal Utility District Revenue | | 5.000% | | 8/15/19 | | | 780 | | 798 | |
| Sacramento CA Municipal Utility District Revenue | | 5.000% | | 8/15/21 | | | 2,590 | | 2,814 | |
| Sacramento CA Municipal Utility District Revenue | | 5.000% | | 8/15/22 | | | 4,000 | | 4,461 | |
| Sacramento CA Municipal Utility District Revenue | | 5.000% | | 8/15/23 | | | 4,000 | | 4,566 | |
| Sacramento CA Municipal Utility District Revenue | | 5.250% | | 7/1/24 | (2) | | 10,085 | | 11,351 | |
| Sacramento CA Municipal Utility District Revenue | | 5.000% | | 8/15/24 | | | 3,480 | | 4,057 | |
| Sacramento CA Municipal Utility District Revenue | | 5.000% | | 8/15/25 | | | 5,455 | | 6,042 | |
| Sacramento CA Municipal Utility District Revenue | | 5.000% | | 8/15/25 | | | 2,505 | | 2,972 | |
| Sacramento CA Municipal Utility District Revenue | | 5.000% | | 8/15/25 | | | 1,500 | | 1,779 | |
| Sacramento CA Municipal Utility District Revenue | | 5.000% | | 8/15/26 | | | 2,515 | | 3,026 | |
| Sacramento CA Municipal Utility District Revenue | | 5.000% | | 8/15/26 | | | 2,000 | | 2,407 | |
| Sacramento CA Municipal Utility District Revenue | | 5.000% | | 8/15/27 | | | 4,905 | | 5,536 | |
| Sacramento CA Municipal Utility District Revenue | | 5.000% | | 8/15/28 | | | 2,000 | | 2,253 | |
| Sacramento CA Municipal Utility District Revenue | | 5.000% | | 8/15/28 | | | 1,540 | | 1,897 | |
127
California Intermediate-Term Tax-Exempt Fund
| | | | | | | | Face | | Market | |
| | | | | Maturity | | | Amount | | Value· | |
| | | Coupon | | Date | | | ($000 | ) | ($000 | ) |
| Sacramento CA Municipal Utility District Revenue | | 5.000% | | 8/15/30 | | | 6,435 | | 7,069 | |
| Sacramento CA Regional Transportation District Farebox Revenue | | 5.000% | | 9/1/20 | (Prere.) | | 405 | | 428 | |
| Sacramento CA Regional Transportation District Farebox Revenue | | 5.000% | | 9/1/20 | (Prere.) | | 925 | | 976 | |
| Sacramento CA Regional Transportation District Farebox Revenue | | 5.000% | | 9/1/20 | (Prere.) | | 975 | | 1,029 | |
| Sacramento CA Regional Transportation District Farebox Revenue | | 5.000% | | 9/1/20 | (Prere.) | | 1,100 | | 1,161 | |
| Sacramento CA Regional Transportation District Farebox Revenue | | 5.000% | | 9/1/20 | (Prere.) | | 1,155 | | 1,219 | |
| Sacramento CA Regional Transportation District Farebox Revenue | | 5.000% | | 3/1/22 | | | 680 | | 714 | |
| Sacramento CA Regional Transportation District Farebox Revenue | | 5.000% | | 3/1/28 | | | 1,575 | | 1,648 | |
| Sacramento CA Regional Transportation District Farebox Revenue | | 5.000% | | 3/1/29 | | | 1,660 | | 1,735 | |
| Sacramento CA Regional Transportation District Farebox Revenue | | 5.000% | | 3/1/30 | | | 1,875 | | 1,958 | |
| Sacramento CA Regional Transportation District Farebox Revenue | | 5.000% | | 3/1/31 | | | 1,970 | | 2,057 | |
| Sacramento CA Transient Occupancy Tax Revenue (Convention Center Complex) | | 5.000% | | 6/1/26 | | | 905 | | 1,075 | |
| Sacramento CA Transient Occupancy Tax Revenue (Convention Center Complex) | | 5.000% | | 6/1/27 | | | 1,025 | | 1,229 | |
| Sacramento CA Transient Occupancy Tax Revenue (Convention Center Complex) | | 5.000% | | 6/1/28 | | | 2,000 | | 2,422 | |
| Sacramento CA Transient Occupancy Tax Revenue (Convention Center Complex) | | 5.000% | | 6/1/29 | | | 1,300 | | 1,559 | |
| Sacramento CA Transient Occupancy Tax Revenue (Convention Center Complex) | | 5.000% | | 6/1/30 | | | 1,165 | | 1,384 | |
| Sacramento CA Transient Occupancy Tax Revenue (Convention Center Complex) | | 5.000% | | 6/1/31 | | | 2,000 | | 2,357 | |
| Sacramento CA Transient Occupancy Tax Revenue (Convention Center Complex) | | 5.000% | | 6/1/32 | | | 1,370 | | 1,604 | |
| Sacramento CA Transient Occupancy Tax Revenue (Convention Center Complex) | | 5.000% | | 6/1/33 | | | 1,220 | | 1,415 | |
| Sacramento CA Transient Occupancy Tax Revenue (Convention Center Complex) | | 5.000% | | 6/1/34 | | | 1,485 | | 1,709 | |
| Sacramento CA Transient Occupancy Tax Revenue (Convention Center Complex) | | 5.000% | | 6/1/35 | | | 2,000 | | 2,290 | |
| Sacramento CA Transient Occupancy Tax Revenue (Convention Center Complex) | | 5.000% | | 6/1/37 | | | 2,405 | | 2,733 | |
| Sacramento CA Transient Occupancy Tax Revenue (Convention Center Complex) | | 5.000% | | 6/1/38 | | | 1,290 | | 1,462 | |
| Sacramento CA Transient Occupancy Tax Revenue (Sub-Convention Center Complex) | | 5.000% | | 6/1/23 | | | 525 | | 591 | |
| Sacramento CA Transient Occupancy Tax Revenue (Sub-Convention Center Complex) | | 5.000% | | 6/1/24 | | | 425 | | 488 | |
| Sacramento CA Transient Occupancy Tax Revenue (Sub-Convention Center Complex) | | 5.000% | | 6/1/25 | | | 450 | | 526 | |
| Sacramento CA Transient Occupancy Tax Revenue (Sub-Convention Center Complex) | | 5.000% | | 6/1/26 | | | 500 | | 590 | |
128
California Intermediate-Term Tax-Exempt Fund
| | | | | | | | Face | | Market | |
| | | | | Maturity | | | Amount | | Value· | |
| | | Coupon | | Date | | | ($000 | ) | ($000 | ) |
| Sacramento CA Transient Occupancy Tax Revenue (Sub-Convention Center Complex) | | 5.000% | | 6/1/27 | | | 1,535 | | 1,826 | |
| Sacramento CA Transient Occupancy Tax Revenue (Sub-Convention Center Complex) | | 5.000% | | 6/1/28 | | | 1,605 | | 1,924 | |
| Sacramento CA Transient Occupancy Tax Revenue (Sub-Convention Center Complex) | | 5.000% | | 6/1/29 | | | 1,695 | | 2,015 | |
| Sacramento CA Transient Occupancy Tax Revenue (Sub-Convention Center Complex) | | 5.000% | | 6/1/30 | | | 1,775 | | 2,094 | |
| Sacramento CA Transient Occupancy Tax Revenue (Sub-Convention Center Complex) | | 5.000% | | 6/1/31 | | | 1,865 | | 2,184 | |
| Sacramento CA Transient Occupancy Tax Revenue (Sub-Convention Center Complex) | | 5.000% | | 6/1/32 | | | 500 | | 582 | |
| Sacramento CA Transient Occupancy Tax Revenue (Sub-Convention Center Complex) | | 5.000% | | 6/1/34 | | | 2,145 | | 2,455 | |
| Sacramento CA Transient Occupancy Tax Revenue (Sub-Convention Center Complex) | | 5.000% | | 6/1/35 | | | 650 | | 740 | |
| Sacramento CA Transient Occupancy Tax Revenue (Sub-Convention Center Complex) | | 5.000% | | 6/1/36 | | | 1,200 | | 1,359 | |
| Sacramento CA Transient Occupancy Tax Revenue (Sub-Convention Center Complex) | | 5.000% | | 6/1/37 | | | 1,040 | | 1,176 | |
| Sacramento CA Transient Occupancy Tax Revenue (Sub-Convention Center Complex) | | 5.000% | | 6/1/38 | | | 1,375 | | 1,551 | |
| Sacramento CA Transportation Authority Sales Tax Revenue | | 5.000% | | 10/1/21 | | | 2,300 | | 2,498 | |
| Sacramento CA Unified School District GO | | 3.000% | | 8/1/19 | (4) | | 1,215 | | 1,226 | |
| Sacramento CA Unified School District GO | | 3.000% | | 8/1/20 | (4) | | 1,000 | | 1,020 | |
| Sacramento CA Unified School District GO | | 4.000% | | 8/1/21 | (4) | | 1,000 | | 1,055 | |
| Sacramento CA Unified School District GO | | 4.000% | | 8/1/22 | (4) | | 750 | | 804 | |
| Sacramento CA Unified School District GO | | 5.000% | | 8/1/23 | (4) | | 1,175 | | 1,331 | |
| Sacramento CA Water Revenue | | 5.000% | | 9/1/27 | | | 3,210 | | 3,625 | |
| Sacramento County CA Airport Revenue | | 5.000% | | 7/1/22 | | | 370 | | 408 | |
| Sacramento County CA Airport Revenue | | 5.000% | | 7/1/22 | | | 380 | | 419 | |
| Sacramento County CA Airport Revenue | | 5.000% | | 7/1/22 | | | 345 | | 381 | |
| Sacramento County CA Airport Revenue | | 5.000% | | 7/1/22 | | | 1,000 | | 1,104 | |
| Sacramento County CA Airport Revenue | | 5.000% | | 7/1/23 | | | 500 | | 563 | |
| Sacramento County CA Airport Revenue | | 5.000% | | 7/1/23 | | | 345 | | 388 | |
| Sacramento County CA Airport Revenue | | 5.000% | | 7/1/23 | | | 425 | | 479 | |
| Sacramento County CA Airport Revenue | | 5.000% | | 7/1/23 | | | 1,000 | | 1,127 | |
| Sacramento County CA Airport Revenue | | 5.000% | | 7/1/24 | | | 1,000 | | 1,147 | |
| Sacramento County CA Airport Revenue | | 5.000% | | 7/1/24 | | | 745 | | 852 | |
| Sacramento County CA Airport Revenue | | 5.000% | | 7/1/24 | | | 245 | | 280 | |
| Sacramento County CA Airport Revenue | | 5.000% | | 7/1/24 | | | 500 | | 573 | |
| Sacramento County CA Airport Revenue | | 5.000% | | 7/1/25 | | | 750 | | 874 | |
| Sacramento County CA Airport Revenue | | 5.000% | | 7/1/25 | | | 775 | | 899 | |
| Sacramento County CA Airport Revenue | | 5.000% | | 7/1/25 | | | 1,000 | | 1,160 | |
| Sacramento County CA Airport Revenue | | 5.000% | | 7/1/25 | | | 1,150 | | 1,340 | |
| Sacramento County CA Airport Revenue | | 5.000% | | 7/1/26 | | | 1,180 | | 1,392 | |
| Sacramento County CA Airport Revenue | | 5.000% | | 7/1/26 | | | 750 | | 878 | |
| Sacramento County CA Airport Revenue | | 5.000% | | 7/1/26 | | | 1,080 | | 1,265 | |
| Sacramento County CA Airport Revenue | | 5.000% | | 7/1/26 | | | 1,265 | | 1,492 | |
| Sacramento County CA Airport Revenue | | 5.000% | | 7/1/27 | | | 1,000 | | 1,193 | |
| Sacramento County CA Airport Revenue | | 5.000% | | 7/1/27 | | | 1,795 | | 2,134 | |
| Sacramento County CA Airport Revenue | | 5.000% | | 7/1/28 | | | 1,250 | | 1,308 | |
| Sacramento County CA Airport Revenue | | 5.000% | | 7/1/28 | | | 790 | | 948 | |
129
California Intermediate-Term Tax-Exempt Fund
| | | | | | | | Face | | Market | |
| | | | | Maturity | | | Amount | | Value· | |
| | | Coupon | | Date | | | ($000 | ) | ($000 | ) |
| Sacramento County CA Airport Revenue | | 5.000% | | 7/1/28 | | | 1,410 | | 1,685 | |
| Sacramento County CA Airport Revenue | | 5.000% | | 7/1/28 | | | 385 | | 462 | |
| Sacramento County CA Airport Revenue | | 5.000% | | 7/1/29 | | | 500 | | 596 | |
| Sacramento County CA Airport Revenue | | 5.000% | | 7/1/29 | | | 2,265 | | 2,688 | |
| Sacramento County CA Airport Revenue | | 5.000% | | 7/1/29 | | | 500 | | 596 | |
| Sacramento County CA Airport Revenue | | 5.000% | | 7/1/30 | | | 5,240 | | 5,477 | |
| Sacramento County CA Airport Revenue | | 5.000% | | 7/1/30 | | | 1,120 | | 1,323 | |
| Sacramento County CA Airport Revenue | | 5.000% | | 7/1/30 | | | 3,360 | | 3,954 | |
| Sacramento County CA Airport Revenue | | 5.000% | | 7/1/30 | | | 1,250 | | 1,477 | |
| Sacramento County CA Airport Revenue | | 5.000% | | 7/1/31 | | | 500 | | 587 | |
| Sacramento County CA Airport Revenue | | 5.000% | | 7/1/31 | | | 1,750 | | 2,046 | |
| Sacramento County CA Airport Revenue | | 5.000% | | 7/1/32 | | | 665 | | 778 | |
| Sacramento County CA Airport Revenue | | 5.000% | | 7/1/32 | | | 1,175 | | 1,375 | |
| Sacramento County CA Airport Revenue | | 5.000% | | 7/1/32 | | | 1,500 | | 1,745 | |
| Sacramento County CA Airport Revenue | | 5.000% | | 7/1/33 | | | 750 | | 873 | |
| Sacramento County CA Airport Revenue | | 5.000% | | 7/1/35 | | | 1,000 | | 1,119 | |
| Sacramento County CA Airport Revenue | | 5.000% | | 7/1/36 | | | 2,000 | | 2,231 | |
| Sacramento County CA Airport Revenue | | 5.000% | | 7/1/36 | | | 1,250 | | 1,435 | |
| Sacramento County CA Airport Revenue | | 5.000% | | 7/1/37 | | | 2,530 | | 2,895 | |
| Sacramento County CA Sanitation Districts Financing Authority Revenue | | 5.000% | | 12/1/30 | | | 2,000 | | 2,269 | |
| Saddleback Valley CA Unified School District GO | | 4.000% | | 8/1/20 | | | 2,100 | | 2,180 | |
| San Bernardino CA City Unified School District GO | | 5.000% | | 8/1/20 | (4) | | 765 | | 804 | |
| San Bernardino CA City Unified School District GO | | 5.000% | | 8/1/21 | (4) | | 1,230 | | 1,326 | |
| San Bernardino CA City Unified School District GO | | 5.000% | | 8/1/22 | (4) | | 1,525 | | 1,683 | |
| San Bernardino CA City Unified School District GO | | 5.000% | | 8/1/23 | (4) | | 1,100 | | 1,240 | |
| San Bernardino CA City Unified School District GO | | 5.000% | | 8/1/24 | (4) | | 1,400 | | 1,578 | |
| San Bernardino CA City Unified School District GO | | 5.000% | | 8/1/26 | (4) | | 1,310 | | 1,471 | |
| San Bernardino CA City Unified School District GO | | 5.000% | | 8/1/28 | (4) | | 470 | | 552 | |
| San Bernardino CA City Unified School District GO | | 5.000% | | 8/1/29 | (4) | | 550 | | 641 | |
| San Bernardino CA City Unified School District GO | | 5.000% | | 8/1/30 | (4) | | 630 | | 730 | |
| San Bernardino CA City Unified School District GO | | 5.000% | | 8/1/31 | (4) | | 230 | | 265 | |
| San Bernardino CA Community College District GO | | 0.000% | | 8/1/23 | (4) | | 2,655 | | 2,371 | |
| San Bernardino CA Community College District GO | | 5.000% | | 8/1/24 | | | 4,375 | | 4,940 | |
| San Bernardino CA Community College District GO | | 5.000% | | 8/1/25 | | | 4,550 | | 5,127 | |
| San Bernardino CA Community College District GO | | 5.000% | | 8/1/26 | | | 4,150 | | 4,672 | |
| San Bernardino CA Community College District GO | | 4.000% | | 8/1/27 | | | 10,000 | | 10,713 | |
130
California Intermediate-Term Tax-Exempt Fund
| | | | | | | | Face | | Market | |
| | | | | Maturity | | | Amount | | Value· | |
| | | Coupon | | Date | | | ($000 | ) | ($000 | ) |
| San Bernardino CA Community College District GO | | 0.000% | | 8/1/29 | | | 1,000 | | 692 | |
| San Bernardino CA Community College District GO | | 5.000% | | 8/1/29 | | | 5,000 | | 5,766 | |
| San Bernardino CA Community College District GO | | 0.000% | | 8/1/30 | | | 1,100 | | 721 | |
| San Bernardino CA Community College District GO | | 0.000% | | 8/1/31 | | | 1,000 | | 619 | |
| San Bernardino CA Community College District GO | | 4.000% | | 8/1/31 | | | 10,660 | | 11,271 | |
| San Bernardino CA Community College District GO | | 5.000% | | 8/1/31 | | | 8,370 | | 9,569 | |
| San Bernardino CA Community College District GO | | 0.000% | | 8/1/32 | | | 1,100 | | 644 | |
| San Bernardino CA Community College District GO | | 4.000% | | 8/1/32 | | | 12,010 | | 12,659 | |
| San Bernardino CA Community College District GO | | 0.000% | | 8/1/33 | | | 1,165 | | 646 | |
| San Bernardino CA Community College District GO | | 4.000% | | 8/1/33 | | | 5,000 | | 5,253 | |
| San Bernardino County CA Medical Center COP | | 5.500% | | 8/1/22 | (14) | | 8,940 | | 9,861 | |
| San Bernardino County CA Transportation Authority Revenue | | 5.000% | | 3/1/31 | | | 3,355 | | 3,655 | |
| San Diego CA Association of Governments South Bay Expressway Toll Revenue | | 5.000% | | 7/1/29 | | | 860 | | 1,011 | |
| San Diego CA Association of Governments South Bay Expressway Toll Revenue | | 5.000% | | 7/1/31 | | | 2,000 | | 2,312 | |
| San Diego CA Association of Governments South Bay Expressway Toll Revenue | | 5.000% | | 7/1/32 | | | 1,750 | | 2,011 | |
| San Diego CA Association of Governments South Bay Expressway Toll Revenue | | 5.000% | | 7/1/34 | | | 1,500 | | 1,704 | |
| San Diego CA Association of Governments South Bay Expressway Toll Revenue | | 5.000% | | 7/1/35 | | | 1,500 | | 1,696 | |
| San Diego CA Association of Governments South Bay Expressway Toll Revenue | | 5.000% | | 7/1/36 | | | 1,500 | | 1,689 | |
| San Diego CA Association of Governments South Bay Expressway Toll Revenue | | 5.000% | | 7/1/37 | | | 1,000 | | 1,124 | |
| San Diego CA Association of Governments South Bay Expressway Toll Revenue | | 5.000% | | 7/1/38 | | | 1,150 | | 1,288 | |
| San Diego CA Community College District GO | | 5.000% | | 8/1/21 | (Prere.) | | 3,380 | | 3,662 | |
| San Diego CA Community College District GO | | 5.000% | | 8/1/21 | (Prere.) | | 9,830 | | 10,651 | |
| San Diego CA Community College District GO | | 5.000% | | 8/1/21 | (Prere.) | | 5,000 | | 5,417 | |
| San Diego CA Community College District GO | | 5.000% | | 8/1/21 | (Prere.) | | 2,000 | | 2,167 | |
| San Diego CA Community College District GO | | 5.000% | | 8/1/21 | (Prere.) | | 8,670 | | 9,394 | |
| San Diego CA Community College District GO | | 5.000% | | 8/1/28 | | | 4,100 | | 4,536 | |
| San Diego CA Community College District GO | | 5.000% | | 8/1/31 | | | 1,000 | | 1,121 | |
| San Diego CA Community College District GO | | 4.000% | | 8/1/32 | | | 23,125 | | 24,703 | |
| San Diego CA Community College District GO | | 5.000% | | 8/1/32 | | | 2,150 | | 2,408 | |
| San Diego CA Community Facilities District No. 1 (Miramar Ranch North) Special Tax Revenue | | 5.000% | | 9/1/20 | | | 3,465 | | 3,650 | |
| San Diego CA Public Facilities Financing Authority Sewer Revenue | | 5.000% | | 5/15/19 | (Prere.) | | 1,825 | | 1,853 | |
131
California Intermediate-Term Tax-Exempt Fund
| | | | | | | | Face | | Market | |
| | | | | Maturity | | | Amount | | Value· | |
| | | Coupon | | Date | | | ($000 | ) | ($000 | ) |
| San Diego CA Public Facilities Financing Authority Sewer Revenue | | 5.000% | | 5/15/19 | (Prere.) | | 6,000 | | 6,091 | |
| San Diego CA Public Facilities Financing Authority Sewer Revenue | | 5.250% | | 5/15/19 | (Prere.) | | 2,000 | | 2,033 | |
| San Diego CA Public Facilities Financing Authority Sewer Revenue | | 5.250% | | 5/15/20 | (Prere.) | | 5,000 | | 5,254 | |
| San Diego CA Public Facilities Financing Authority Sewer Revenue | | 5.000% | | 5/15/21 | | | 5,765 | | 6,220 | |
| San Diego CA Public Facilities Financing Authority Sewer Revenue | | 5.000% | | 5/15/23 | | | 10,080 | | 11,461 | |
| San Diego CA Public Facilities Financing Authority Sewer Revenue | | 5.000% | | 5/15/34 | | | 5,000 | | 5,743 | |
| San Diego CA Public Facilities Financing Authority Sewer Revenue | | 5.000% | | 5/15/35 | | | 5,150 | | 5,890 | |
| San Diego CA Public Facilities Financing Authority Sewer Revenue | | 5.000% | | 5/15/36 | | | 5,000 | | 5,705 | |
| San Diego CA Public Facilities Financing Authority Water Revenue | | 5.000% | | 8/1/19 | (Prere.) | | 4,215 | | 4,308 | |
| San Diego CA Public Facilities Financing Authority Water Revenue | | 5.125% | | 8/1/19 | (Prere.) | | 5,000 | | 5,115 | |
| San Diego CA Public Facilities Financing Authority Water Revenue | | 5.250% | | 8/1/20 | (Prere.) | | 5,355 | | 5,661 | |
| San Diego CA Public Facilities Financing Authority Water Revenue | | 5.000% | | 8/1/22 | | | 3,220 | | 3,585 | |
| San Diego CA Public Facilities Financing Authority Water Revenue | | 5.000% | | 8/1/25 | | | 4,270 | | 5,068 | |
| San Diego CA Public Facilities Financing Authority Water Revenue | | 5.000% | | 8/1/26 | | | 10,710 | | 12,913 | |
| San Diego CA Public Facilities Financing Authority Water Revenue | | 5.000% | | 8/1/30 | | | 2,000 | | 2,195 | |
| San Diego CA Public Facilities Financing Authority Water Revenue | | 5.000% | | 8/1/32 | | | 4,190 | | 4,592 | |
| San Diego CA Redevelopment Agency Tax Allocation | | 5.000% | | 9/1/19 | | | 1,000 | | 1,025 | |
| San Diego CA Redevelopment Agency Tax Allocation | | 5.000% | | 9/1/20 | | | 1,000 | | 1,056 | |
| San Diego CA Redevelopment Agency Tax Allocation | | 5.000% | | 9/1/21 | | | 2,135 | | 2,318 | |
| San Diego CA Redevelopment Agency Tax Allocation | | 5.000% | | 9/1/22 | | | 1,040 | | 1,158 | |
| San Diego CA Redevelopment Agency Tax Allocation | | 5.000% | | 9/1/23 | | | 1,055 | | 1,203 | |
| San Diego CA Unified School District GO | | 5.500% | | 7/1/20 | (4) | | 9,490 | | 10,059 | |
| San Diego CA Unified School District GO | | 5.000% | | 7/1/21 | | | 15,000 | | 16,239 | |
| San Diego CA Unified School District GO | | 5.000% | | 7/1/22 | | | 1,580 | | 1,756 | |
| San Diego CA Unified School District GO | | 5.500% | | 7/1/22 | (4) | | 12,790 | | 14,436 | |
| San Diego CA Unified School District GO | | 5.000% | | 7/1/24 | | | 1,735 | | 2,016 | |
| San Diego CA Unified School District GO | | 4.000% | | 7/1/25 | | | 2,500 | | 2,808 | |
| San Diego CA Unified School District GO | | 5.000% | | 7/1/25 | | | 1,695 | | 2,007 | |
| San Diego CA Unified School District GO | | 5.500% | | 7/1/25 | (14) | | 1,130 | | 1,373 | |
| San Diego CA Unified School District GO | | 0.000% | | 7/1/26 | | | 8,425 | | 6,850 | |
| San Diego CA Unified School District GO | | 5.000% | | 7/1/26 | | | 20,040 | | 23,572 | |
| San Diego CA Unified School District GO | | 5.500% | | 7/1/26 | (4) | | 7,565 | | 9,343 | |
| San Diego CA Unified School District GO | | 0.000% | | 7/1/27 | | | 8,500 | | 6,646 | |
132
California Intermediate-Term Tax-Exempt Fund
| | | | | | | | Face | | Market | |
| | | | | Maturity | | | Amount | | Value· | |
| | | Coupon | | Date | | | ($000 | ) | ($000 | ) |
| San Diego CA Unified School District GO | | 0.000% | | 7/1/28 | | | 8,000 | | 5,987 | |
| San Diego CA Unified School District GO | | 5.000% | | 7/1/28 | | | 6,535 | | 7,634 | |
| San Diego CA Unified School District GO | | 5.000% | | 7/1/28 | | | 725 | | 847 | |
| San Diego CA Unified School District GO | | 0.000% | | 7/1/29 | | | 1,250 | | 887 | |
| San Diego CA Unified School District GO | | 0.000% | | 7/1/29 | | | 3,250 | | 2,323 | |
| San Diego CA Unified School District GO | | 5.000% | | 7/1/29 | | | 750 | | 874 | |
| San Diego CA Unified School District GO | | 5.000% | | 7/1/29 | | | 3,315 | | 3,905 | |
| San Diego CA Unified School District GO | | 0.000% | | 7/1/30 | | | 2,000 | | 1,356 | |
| San Diego CA Unified School District GO | | 0.000% | | 7/1/30 | | | 2,170 | | 1,477 | |
| San Diego CA Unified School District GO | | 0.000% | | 7/1/30 | | | 2,500 | | 1,702 | |
| San Diego CA Unified School District GO | | 0.000% | | 7/1/30 | | | 10,255 | | 6,981 | |
| San Diego CA Unified School District GO | | 5.000% | | 7/1/30 | | | 7,610 | | 8,497 | |
| San Diego CA Unified School District GO | | 0.000% | | 7/1/31 | | | 2,300 | | 1,489 | |
| San Diego CA Unified School District GO | | 5.000% | | 7/1/31 | | | 8,985 | | 10,012 | |
| San Diego CA Unified School District GO | | 5.000% | | 7/1/31 | | | 1,200 | | 1,390 | |
| San Diego CA Unified School District GO | | 5.000% | | 7/1/31 | | | 3,000 | | 3,538 | |
| San Diego CA Unified School District GO | | 0.000% | | 7/1/32 | | | 2,000 | | 1,233 | |
| San Diego CA Unified School District GO | | 4.000% | | 7/1/32 | | | 1,000 | | 1,061 | |
| San Diego CA Unified School District GO | | 4.000% | | 8/1/32 | | | 1,065 | | 1,131 | |
| San Diego CA Unified School District GO | | 4.000% | | 7/1/33 | | | 2,000 | | 2,109 | |
| San Diego CA Unified School District GO | | 5.000% | | 7/1/33 | | | 4,330 | | 5,063 | |
| San Diego CA Unified School District GO | | 4.000% | | 7/1/34 | | | 3,000 | | 3,139 | |
| San Diego CA Unified School District GO | | 4.000% | | 7/1/34 | | | 2,000 | | 2,102 | |
| San Diego CA Unified School District GO | | 4.000% | | 7/1/35 | | | 3,600 | | 3,739 | |
| San Diego CA Unified School District GO | | 4.000% | | 7/1/35 | | | 3,390 | | 3,542 | |
| San Diego CA Unified School District GO | | 4.000% | | 8/1/35 | | | 1,855 | | 1,929 | |
| San Diego CA Unified School District GO | | 4.000% | | 7/1/37 | | | 5,155 | | 5,342 | |
| San Diego County CA COP | | 5.000% | | 10/15/24 | | | 2,125 | | 2,470 | |
| San Diego County CA COP | | 5.000% | | 10/15/25 | | | 5,305 | | 6,141 | |
| San Diego County CA COP | | 5.000% | | 10/15/26 | | | 2,590 | | 2,978 | |
| San Diego County CA COP | | 5.000% | | 10/15/27 | | | 2,000 | | 2,294 | |
| San Diego County CA COP | | 5.000% | | 10/15/28 | | | 1,400 | | 1,602 | |
| San Diego County CA COP | | 5.000% | | 10/15/29 | | | 2,010 | | 2,293 | |
| San Diego County CA Limited Obligation Revenue (Sanford Burnham Prebys Medical Discovery Institute) | | 5.000% | | 11/1/19 | | | 480 | | 493 | |
| San Diego County CA Limited Obligation Revenue (Sanford Burnham Prebys Medical Discovery Institute) | | 5.000% | | 11/1/22 | | | 425 | | 468 | |
| San Diego County CA Limited Obligation Revenue (Sanford Burnham Prebys Medical Discovery Institute) | | 4.000% | | 11/1/23 | | | 1,665 | | 1,789 | |
| San Diego County CA Limited Obligation Revenue (Sanford Burnham Prebys Medical Discovery Institute) | | 5.000% | | 11/1/24 | | | 790 | | 899 | |
| San Diego County CA Limited Obligation Revenue (Sanford Burnham Prebys Medical Discovery Institute) | | 5.000% | | 11/1/26 | | | 1,145 | | 1,312 | |
| San Diego County CA Limited Obligation Revenue (Sanford Burnham Prebys Medical Discovery Institute) | | 5.000% | | 11/1/28 | | | 1,950 | | 2,221 | |
| San Diego County CA Limited Obligation Revenue (Sanford Burnham Prebys Medical Discovery Institute) | | 5.000% | | 11/1/30 | | | 1,705 | | 1,927 | |
133
California Intermediate-Term Tax-Exempt Fund
| | | | | | | | Face | | Market | |
| | | | | Maturity | | | Amount | | Value· | |
| | | Coupon | | Date | | | ($000 | ) | ($000 | ) |
| San Diego County CA Regional Airport Authority Revenue | | 5.000% | | 7/1/23 | | | 3,915 | | 4,108 | |
| San Diego County CA Regional Airport Authority Revenue | | 5.000% | | 7/1/25 | | | 9,000 | | 9,436 | |
| San Diego County CA Regional Airport Authority Revenue | | 5.000% | | 7/1/26 | | | 200 | | 239 | |
| San Diego County CA Regional Airport Authority Revenue | | 5.000% | | 7/1/26 | | | 6,000 | | 6,288 | |
| San Diego County CA Regional Airport Authority Revenue | | 5.000% | | 7/1/27 | | | 300 | | 361 | |
| San Diego County CA Regional Airport Authority Revenue | | 5.000% | | 7/1/28 | | | 350 | | 417 | |
| San Diego County CA Regional Airport Authority Revenue | | 5.000% | | 7/1/28 | | | 3,000 | | 3,141 | |
| San Diego County CA Regional Airport Authority Revenue | | 5.000% | | 7/1/29 | | | 310 | | 367 | |
| San Diego County CA Regional Airport Authority Revenue | | 5.000% | | 7/1/30 | | | 530 | | 621 | |
| San Diego County CA Regional Airport Authority Revenue | | 5.000% | | 7/1/32 | | | 1,000 | | 1,157 | |
| San Diego County CA Regional Airport Authority Revenue | | 5.000% | | 7/1/33 | | | 1,305 | | 1,503 | |
| San Diego County CA Regional Airport Authority Revenue | | 5.000% | | 7/1/34 | | | 1,000 | | 1,144 | |
| San Diego County CA Regional Airport Authority Revenue | | 5.000% | | 7/1/35 | | | 1,000 | | 1,139 | |
| San Diego County CA Regional Airport Authority Revenue | | 5.000% | | 7/1/36 | | | 2,750 | | 3,119 | |
| San Diego County CA Regional Airport Authority Revenue | | 5.000% | | 7/1/37 | | | 1,690 | | 1,910 | |
| San Diego County CA Regional Building Authority Lease Revenue (County Operations Center & Annex Redevelopment Project) | | 5.000% | | 2/1/19 | (Prere.) | | 4,820 | | 4,847 | |
| San Diego County CA Regional Building Authority Lease Revenue (County Operations Center & Annex Redevelopment Project) | | 5.000% | | 2/1/19 | (Prere.) | | 2,420 | | 2,433 | |
| San Diego County CA Regional Transportation Commission Revenue | | 4.000% | | 4/1/21 | | | 30,010 | | 31,586 | |
| San Diego County CA Water Authority Financing Agency Water Revenue | | 5.000% | | 11/1/19 | (Prere.) | | 2,000 | | 2,061 | |
| San Diego County CA Water Authority Revenue | | 3.000% | | 5/1/21 | | | 5,000 | | 5,139 | |
| San Diego County CA Water Authority Revenue | | 5.000% | | 5/1/26 | | | 2,090 | | 2,504 | |
| San Diego County CA Water Authority Revenue | | 5.000% | | 5/1/30 | | | 5,000 | | 5,358 | |
| San Diego County CA Water Authority Revenue | | 5.000% | | 5/1/35 | | | 13,795 | | 15,750 | |
| San Diego County CA Water Authority Revenue COP | | 5.250% | | 5/1/21 | (14) | | 6,725 | | 7,285 | |
| San Diego County CA Water Authority Revenue COP | | 5.250% | | 5/1/22 | (14) | | 7,075 | | 7,884 | |
| San Dieguito CA Union High School District GO | | 4.000% | | 8/1/31 | | | 1,750 | | 1,840 | |
134
California Intermediate-Term Tax-Exempt Fund
| | | | | | | | Face | | Market | |
| | | | | Maturity | | | Amount | | Value· | |
| | | Coupon | | Date | | | ($000 | ) | ($000 | ) |
| San Francisco CA Bay Area Rapid Transit District GO | | 5.000% | | 8/1/28 | | | 1,685 | | 1,968 | |
| San Francisco CA Bay Area Rapid Transit District GO | | 4.000% | | 8/1/34 | | | 6,595 | | 6,955 | |
| San Francisco CA Bay Area Rapid Transit District GO | | 5.000% | | 8/1/36 | | | 1,825 | | 2,112 | |
| San Francisco CA Bay Area Rapid Transit District Sales Tax Revenue | | 5.000% | | 7/1/20 | | | 1,040 | | 1,093 | |
| San Francisco CA Bay Area Rapid Transit District Sales Tax Revenue | | 5.000% | | 7/1/22 | (Prere.) | | 290 | | 321 | |
| San Francisco CA Bay Area Rapid Transit District Sales Tax Revenue | | 5.000% | | 7/1/22 | (Prere.) | | 690 | | 764 | |
| San Francisco CA Bay Area Rapid Transit District Sales Tax Revenue | | 5.000% | | 7/1/22 | (Prere.) | | 755 | | 836 | |
| San Francisco CA Bay Area Rapid Transit District Sales Tax Revenue | | 5.000% | | 7/1/23 | | | 780 | | 866 | |
| San Francisco CA Bay Area Rapid Transit District Sales Tax Revenue | | 5.000% | | 7/1/27 | | | 5,435 | | 6,389 | |
| San Francisco CA Bay Area Rapid Transit District Sales Tax Revenue | | 5.000% | | 7/1/28 | | | 2,510 | | 2,936 | |
| San Francisco CA Bay Area Rapid Transit District Sales Tax Revenue | | 5.000% | | 7/1/29 | | | 1,885 | | 2,078 | |
| San Francisco CA Bay Area Rapid Transit District Sales Tax Revenue | | 5.000% | | 7/1/30 | | | 2,045 | | 2,253 | |
| San Francisco CA Bay Area Rapid Transit District Sales Tax Revenue | | 5.000% | | 7/1/31 | | | 2,215 | | 2,554 | |
| San Francisco CA Bay Area Rapid Transit District Sales Tax Revenue | | 5.000% | | 7/1/32 | | | 1,625 | | 1,867 | |
| San Francisco CA Bay Area Rapid Transit District Sales Tax Revenue | | 5.000% | | 7/1/33 | | | 1,500 | | 1,719 | |
| San Francisco CA City & County (Earthquake Safety & Emergency Response) GO | | 5.000% | | 6/15/23 | | | 2,220 | | 2,458 | |
| San Francisco CA City & County (Earthquake Safety & Emergency Response) GO | | 5.000% | | 6/15/23 | | | 4,070 | | 4,507 | |
| San Francisco CA City & County (Earthquake Safety & Emergency Response) GO | | 5.000% | | 6/15/24 | | | 2,335 | | 2,582 | |
| San Francisco CA City & County (Earthquake Safety & Emergency Response) GO | | 5.000% | | 6/15/24 | | | 4,270 | | 4,722 | |
| San Francisco CA City & County (Earthquake Safety & Emergency Response) GO | | 5.000% | | 6/15/25 | | | 2,450 | | 2,704 | |
| San Francisco CA City & County (Earthquake Safety & Emergency Response) GO | | 5.000% | | 6/15/25 | | | 4,485 | | 4,950 | |
| San Francisco CA City & County COP | | 5.000% | | 4/1/27 | | | 13,095 | | 15,316 | |
| San Francisco CA City & County COP | | 4.000% | | 9/1/30 | | | 5,215 | | 5,492 | |
| San Francisco CA City & County COP | | 4.000% | | 9/1/31 | | | 5,100 | | 5,348 | |
| San Francisco CA City & County COP | | 4.000% | | 9/1/32 | | | 5,680 | | 5,931 | |
| San Francisco CA City & County COP | | 4.000% | | 4/1/35 | | | 9,870 | | 10,314 | |
| San Francisco CA City & County COP | | 4.000% | | 9/1/35 | | | 5,170 | | 5,328 | |
| San Francisco CA City & County COP | | 4.000% | | 4/1/36 | | | 10,665 | | 11,087 | |
| San Francisco CA City & County GO | | 5.000% | | 6/15/20 | | | 500 | | 525 | |
| San Francisco CA City & County GO | | 5.000% | | 6/15/22 | | | 2,640 | | 2,888 | |
| San Francisco CA City & County GO | | 5.000% | | 6/15/23 | | | 4,000 | | 4,369 | |
| San Francisco CA City & County GO | | 5.000% | | 6/15/26 | | | 2,920 | | 3,298 | |
| San Francisco CA City & County GO | | 5.000% | | 6/15/27 | | | 5,815 | | 6,552 | |
135
California Intermediate-Term Tax-Exempt Fund
| | | | | | | | Face | | Market | |
| | | | | Maturity | | | Amount | | Value· | |
| | | Coupon | | Date | | | ($000 | ) | ($000 | ) |
| San Francisco CA City & County GO | | 4.000% | | 6/15/28 | | | 4,190 | | 4,487 | |
| San Francisco CA City & County GO | | 4.000% | | 6/15/29 | | | 4,545 | | 4,835 | |
| San Francisco CA City & County GO | | 4.000% | | 6/15/29 | | | 7,130 | | 7,621 | |
| San Francisco CA City & County GO | | 4.000% | | 6/15/33 | | | 8,160 | | 8,583 | |
| San Francisco CA City & County International Airport Revenue | | 5.000% | | 5/1/20 | (Prere.) | | 2,135 | | 2,230 | |
| San Francisco CA City & County International Airport Revenue | | 5.250% | | 5/1/20 | (14) | | 5,000 | | 5,249 | |
| San Francisco CA City & County International Airport Revenue | | 5.000% | | 5/1/21 | | | 2,865 | | 2,998 | |
| San Francisco CA City & County International Airport Revenue | | 5.000% | | 5/1/21 | | | 5,100 | | 5,487 | |
| San Francisco CA City & County International Airport Revenue | | 5.000% | | 5/3/21 | (Prere.) | | 550 | | 591 | |
| San Francisco CA City & County International Airport Revenue | | 5.000% | | 5/3/21 | (Prere.) | | 1,150 | | 1,237 | |
| San Francisco CA City & County International Airport Revenue | | 5.000% | | 5/3/21 | (Prere.) | | 1,200 | | 1,290 | |
| San Francisco CA City & County International Airport Revenue | | 5.000% | | 5/1/22 | | | 2,865 | | 2,997 | |
| San Francisco CA City & County International Airport Revenue | | 5.000% | | 5/1/22 | | | 1,650 | | 1,822 | |
| San Francisco CA City & County International Airport Revenue | | 5.000% | | 5/1/22 | | | 6,150 | | 6,792 | |
| San Francisco CA City & County International Airport Revenue | | 5.000% | | 5/1/23 | | | 3,070 | | 3,470 | |
| San Francisco CA City & County International Airport Revenue | | 4.000% | | 5/1/24 | | | 5,775 | | 6,371 | |
| San Francisco CA City & County International Airport Revenue | | 5.000% | | 5/1/24 | | | 3,245 | | 3,746 | |
| San Francisco CA City & County International Airport Revenue | | 5.000% | | 5/1/24 | | | 1,700 | | 1,962 | |
| San Francisco CA City & County International Airport Revenue | | 4.000% | | 5/1/25 | | | 3,625 | | 4,044 | |
| San Francisco CA City & County International Airport Revenue | | 5.000% | | 5/1/25 | | | 6,180 | | 7,276 | |
| San Francisco CA City & County International Airport Revenue | | 5.000% | | 5/1/25 | | | 2,090 | | 2,461 | |
| San Francisco CA City & County International Airport Revenue | | 5.000% | | 5/1/27 | | | 1,970 | | 2,331 | |
| San Francisco CA City & County International Airport Revenue | | 5.000% | | 5/1/28 | | | 2,305 | | 2,467 | |
| San Francisco CA City & County International Airport Revenue | | 5.000% | | 5/1/28 | | | 2,175 | | 2,551 | |
| San Francisco CA City & County International Airport Revenue | | 5.000% | | 5/1/28 | | | 7,625 | | 8,323 | |
| San Francisco CA City & County International Airport Revenue | | 4.900% | | 5/1/29 | | | 8,325 | | 8,554 | |
| San Francisco CA City & County International Airport Revenue | | 5.000% | | 5/1/29 | | | 1,755 | | 2,047 | |
| San Francisco CA City & County International Airport Revenue | | 5.000% | | 5/1/30 | | | 1,000 | | 1,156 | |
| San Francisco CA City & County International Airport Revenue | | 5.000% | | 5/1/30 | | | 4,790 | | 5,118 | |
136
California Intermediate-Term Tax-Exempt Fund
| | | | | | | | Face | | Market | |
| | | | | Maturity | | | Amount | | Value· | |
| | | Coupon | | Date | | | ($000 | ) | ($000 | ) |
| San Francisco CA City & County International Airport Revenue | | 5.000% | | 5/1/31 | | | 635 | | 729 | |
| San Francisco CA City & County Public Utilities Commission Wastewater Revenue | | 5.000% | | 10/1/26 | | | 5,865 | | 6,937 | |
| San Francisco CA City & County Public Utilities Commission Wastewater Revenue | | 5.000% | | 10/1/26 | | | 1,795 | | 2,123 | |
| San Francisco CA City & County Public Utilities Commission Wastewater Revenue | | 5.000% | | 10/1/27 | | | 1,885 | | 2,218 | |
| San Francisco CA City & County Public Utilities Commission Wastewater Revenue | | 5.000% | | 10/1/30 | | | 13,170 | | 14,558 | |
| San Francisco CA City & County Public Utilities Commission Wastewater Revenue | | 5.000% | | 10/1/34 | | | 3,550 | | 4,151 | |
| San Francisco CA City & County Public Utilities Commission Wastewater Revenue | | 5.000% | | 10/1/34 | | | 9,495 | | 10,809 | |
| San Francisco CA City & County Public Utilities Commission Wastewater Revenue | | 5.000% | | 10/1/35 | | | 125 | | 145 | |
| San Francisco CA City & County Public Utilities Commission Wastewater Revenue | | 5.000% | | 10/1/35 | | | 9,980 | | 11,322 | |
| San Francisco CA City & County Public Utilities Commission Wastewater Revenue | | 5.000% | | 10/1/36 | | | 10,495 | | 11,857 | |
| San Francisco CA City & County Public Utilities Commission Wastewater Revenue | | 5.000% | | 10/1/37 | | | 2,840 | | 3,275 | |
| San Francisco CA City & County Public Utilities Commission Wastewater Revenue | | 5.000% | | 10/1/38 | | | 3,970 | | 4,565 | |
| San Francisco CA City & County Public Utilities Commission Water Revenue | | 5.000% | | 11/1/19 | | | 1,020 | | 1,052 | |
| San Francisco CA City & County Public Utilities Commission Water Revenue | | 5.000% | | 11/1/19 | (Prere.) | | 2,705 | | 2,788 | |
| San Francisco CA City & County Public Utilities Commission Water Revenue | | 5.000% | | 11/1/19 | (Prere.) | | 2,960 | | 3,050 | |
| San Francisco CA City & County Public Utilities Commission Water Revenue | | 5.000% | | 11/1/19 | (Prere.) | | 10,000 | | 10,305 | |
| San Francisco CA City & County Public Utilities Commission Water Revenue | | 5.000% | | 11/1/19 | (Prere.) | | 440 | | 453 | |
| San Francisco CA City & County Public Utilities Commission Water Revenue | | 5.000% | | 11/1/19 | (Prere.) | | 2,555 | | 2,633 | |
| San Francisco CA City & County Public Utilities Commission Water Revenue | | 5.000% | | 11/1/19 | (Prere.) | | 1,000 | | 1,031 | |
| San Francisco CA City & County Public Utilities Commission Water Revenue | | 5.000% | | 11/1/20 | | | 2,010 | | 2,133 | |
| San Francisco CA City & County Public Utilities Commission Water Revenue | | 5.000% | | 11/1/21 | | | 1,165 | | 1,270 | |
| San Francisco CA City & County Public Utilities Commission Water Revenue | | 5.000% | | 11/1/21 | (Prere.) | | 10,335 | | 11,271 | |
| San Francisco CA City & County Public Utilities Commission Water Revenue | | 5.000% | | 11/1/21 | (Prere.) | | 11,000 | | 11,996 | |
| San Francisco CA City & County Public Utilities Commission Water Revenue | | 5.000% | | 5/1/22 | (Prere.) | | 3,020 | | 3,338 | |
| San Francisco CA City & County Public Utilities Commission Water Revenue | | 5.000% | | 5/1/22 | (Prere.) | | 9,000 | | 9,948 | |
| San Francisco CA City & County Public Utilities Commission Water Revenue | | 5.000% | | 5/1/22 | (Prere.) | | 5,730 | | 6,333 | |
| San Francisco CA City & County Public Utilities Commission Water Revenue | | 5.000% | | 5/1/22 | (Prere.) | | 5,000 | | 5,527 | |
137
California Intermediate-Term Tax-Exempt Fund
| | | | | | | | Face | | Market | |
| | | | | Maturity | | | Amount | | Value· | |
| | | Coupon | | Date | | | ($000 | ) | ($000 | ) |
| San Francisco CA City & County Public Utilities Commission Water Revenue | | 5.000% | | 11/1/22 | | | 925 | | 1,035 | |
| San Francisco CA City & County Public Utilities Commission Water Revenue | | 5.000% | | 11/1/23 | | | 1,425 | | 1,631 | |
| San Francisco CA City & County Public Utilities Commission Water Revenue | | 5.000% | | 11/1/23 | | | 4,245 | | 4,860 | |
| San Francisco CA City & County Public Utilities Commission Water Revenue | | 5.000% | | 11/1/24 | | | 1,000 | | 1,168 | |
| San Francisco CA City & County Public Utilities Commission Water Revenue | | 5.000% | | 11/1/24 | | | 4,560 | | 5,327 | |
| San Francisco CA City & County Public Utilities Commission Water Revenue | | 5.000% | | 11/1/25 | | | 6,035 | | 7,101 | |
| San Francisco CA City & County Public Utilities Commission Water Revenue | | 5.000% | | 11/1/27 | | | 7,755 | | 9,039 | |
| San Francisco CA City & County Public Utilities Commission Water Revenue | | 5.000% | | 11/1/27 | | | 1,000 | | 1,166 | |
| San Francisco CA City & County Public Utilities Commission Water Revenue | | 5.000% | | 10/1/28 | | | 10,235 | | 11,338 | |
| San Francisco CA City & County Public Utilities Commission Water Revenue | | 5.000% | | 11/1/28 | | | 5,355 | | 6,204 | |
| San Francisco CA City & County Public Utilities Commission Water Revenue | | 5.000% | | 11/1/28 | | | 2,640 | | 3,032 | |
| San Francisco CA City & County Public Utilities Commission Water Revenue | | 5.000% | | 11/1/28 | | | 3,830 | | 4,398 | |
| San Francisco CA City & County Public Utilities Commission Water Revenue | | 5.000% | | 11/1/28 | | | 1,830 | | 2,101 | |
| San Francisco CA City & County Public Utilities Commission Water Revenue | | 5.000% | | 11/1/29 | | | 12,685 | | 14,597 | |
| San Francisco CA City & County Public Utilities Commission Water Revenue | | 5.000% | | 11/1/29 | | | 3,510 | | 3,843 | |
| San Francisco CA City & County Public Utilities Commission Water Revenue | | 5.000% | | 11/1/29 | | | 3,300 | | 3,774 | |
| San Francisco CA City & County Public Utilities Commission Water Revenue | | 5.000% | | 11/1/29 | | | 4,025 | | 4,603 | |
| San Francisco CA City & County Public Utilities Commission Water Revenue | | 5.000% | | 11/1/29 | | | 1,925 | | 2,201 | |
| San Francisco CA City & County Public Utilities Commission Water Revenue | | 4.000% | | 11/1/30 | | | 1,750 | | 1,887 | |
| San Francisco CA City & County Public Utilities Commission Water Revenue | | 4.000% | | 11/1/30 | | | 3,660 | | 3,947 | |
| San Francisco CA City & County Public Utilities Commission Water Revenue | | 5.000% | | 11/1/30 | | | 3,470 | | 3,950 | |
| San Francisco CA City & County Public Uilities Commission Water Revenue | | 5.000% | | 11/1/30 | | | 4,230 | | 4,815 | |
| San Francisco CA City & County Public Utilities Commission Water Revenue | | 5.000% | | 11/1/30 | | | 2,025 | | 2,305 | |
| San Francisco CA City & County Public Utilities Commission Water Revenue | | 5.000% | | 10/1/31 | | | 2,000 | | 2,296 | |
| San Francisco CA City & County Public Utilities Commission Water Revenue | | 5.000% | | 10/1/31 | | | 14,015 | | 15,465 | |
| San Francisco CA City & County Public Utilities Commission Water Revenue | | 5.000% | | 11/1/31 | | | 3,650 | | 4,144 | |
| San Francisco CA City & County Public Utilities Commission Water Revenue | | 5.000% | | 11/1/31 | | | 4,450 | | 5,052 | |
138
California Intermediate-Term Tax-Exempt Fund
| | | | | | | | Face | | Market | |
| | | | | Maturity | | | Amount | | Value· | |
| | | Coupon | | Date | | | ($000 | ) | ($000 | ) |
| San Francisco CA City & County Public Utilities Commission Water Revenue | | 5.000% | | 11/1/31 | | | 2,130 | | 2,418 | |
| San Francisco CA City & County Public Utilities Commission Water Revenue | | 5.000% | | 11/1/31 | | | 1,000 | | 1,139 | |
| San Francisco CA City & County Public Utilities Commission Water Revenue | | 5.000% | | 10/1/32 | | | 3,000 | | 3,435 | |
| San Francisco CA City & County Public Utilities Commission Water Revenue | | 5.000% | | 11/1/32 | | | 2,675 | | 3,041 | |
| San Francisco CA City & County Public Utilities Commission Water Revenue | | 5.000% | | 11/1/32 | | | 3,835 | | 4,345 | |
| San Francisco CA City & County Public Utilities Commission Water Revenue | | 5.000% | | 11/1/32 | | | 4,680 | | 5,302 | |
| San Francisco CA City & County Public Utilities Commission Water Revenue | | 5.000% | | 11/1/32 | | | 2,240 | | 2,538 | |
| San Francisco CA City & County Public Utilities Commission Water Revenue | | 5.000% | | 11/1/33 | | | 6,000 | | 6,931 | |
| San Francisco CA City & County Public Utilities Commission Water Revenue | | 5.000% | | 11/1/35 | | | 7,000 | | 8,017 | |
| San Francisco CA City & County Public Utilities Commission Water Revenue | | 4.000% | | 11/1/36 | | | 8,600 | | 8,875 | |
| San Francisco CA City & County Public Utilities Commission Water Revenue | | 5.000% | | 11/1/38 | | | 1,520 | | 1,696 | |
| San Francisco CA City & County Redevelopment Agency Community Facilities District No. 7 Special Tax Revenue (Hunters Point Shipyard Improvements) | | 5.000% | | 8/1/30 | | | 525 | | 571 | |
| San Francisco CA City & County Redevelopment Agency Community Facilities District No. 7 Special Tax Revenue (Hunters Point Shipyard Improvements) | | 5.000% | | 8/1/33 | | | 680 | | 729 | |
| San Francisco CA City & County Redevelopment Financing Authority Tax Allocation Revenue (Mission Bays Redevelopment Project) | | 5.000% | | 8/1/19 | | | 220 | | 225 | |
| San Francisco CA City & County Redevelopment Financing Authority Tax Allocation Revenue (Mission Bays Redevelopment Project) | | 5.000% | | 8/1/20 | | | 130 | | 137 | |
| San Francisco CA City & County Redevelopment Financing Authority Tax Allocation Revenue (Mission Bays Redevelopment Project) | | 5.000% | | 8/1/21 | | | 160 | | 172 | |
| San Francisco CA City & County Redevelopment Financing Authority Tax Allocation Revenue (Mission Bays Redevelopment Project) | | 5.000% | | 8/1/22 | | | 125 | | 137 | |
| San Francisco CA City & County Redevelopment Financing Authority Tax Allocation Revenue (Mission Bays Redevelopment Project) | | 5.000% | | 8/1/23 | | | 120 | | 135 | |
139
California Intermediate-Term Tax-Exempt Fund
| | | | | | | | Face | | Market | |
| | | | | Maturity | | | Amount | | Value· | |
| | | Coupon | | Date | | | ($000 | ) | ($000 | ) |
| San Francisco CA City & County Redevelopment Financing Authority Tax Allocation Revenue (Mission Bays Redevelopment Project) | | 5.000% | | 8/1/24 | | | 860 | | 982 | |
| San Francisco CA City & County Redevelopment Financing Authority Tax Allocation Revenue (Mission Bays Redevelopment Project) | | 5.000% | | 8/1/24 | | | 135 | | 154 | |
| San Francisco CA City & County Redevelopment Financing Authority Tax Allocation Revenue (Mission Bays Redevelopment Project) | | 5.000% | | 8/1/24 | | | 305 | | 349 | |
| San Francisco CA City & County Redevelopment Financing Authority Tax Allocation Revenue (Mission Bays Redevelopment Project) | | 5.000% | | 8/1/24 | | | 440 | | 502 | |
| San Francisco CA City & County Redevelopment Financing Authority Tax Allocation Revenue (Mission Bays Redevelopment Project) | | 5.000% | | 8/1/25 | | | 400 | | 464 | |
| San Francisco CA City & County Redevelopment Financing Authority Tax Allocation Revenue (Mission Bays Redevelopment Project) | | 5.000% | | 8/1/25 | | | 240 | | 273 | |
| San Francisco CA City & County Redevelopment Financing Authority Tax Allocation Revenue (Mission Bays Redevelopment Project) | | 5.000% | | 8/1/25 | | | 400 | | 466 | |
| San Francisco CA City & County Redevelopment Financing Authority Tax Allocation Revenue (Mission Bays Redevelopment Project) | | 5.000% | | 8/1/26 | | | 1,405 | | 1,646 | |
| San Francisco CA City & County Redevelopment Financing Authority Tax Allocation Revenue (Mission Bays Redevelopment Project) | | 5.000% | | 8/1/26 | | | 500 | | 590 | |
| San Francisco CA City & County Redevelopment Financing Authority Tax Allocation Revenue (Mission Bays Redevelopment Project) | | 5.000% | | 8/1/27 | | | 140 | | 157 | |
| San Francisco CA City & County Redevelopment Financing Authority Tax Allocation Revenue (Mission Bays Redevelopment Project) | | 5.000% | | 8/1/27 | | | 500 | | 585 | |
| San Francisco CA City & County Redevelopment Financing Authority Tax Allocation Revenue (Mission Bays Redevelopment Project) | | 5.000% | | 8/1/27 | | | 500 | | 582 | |
| San Francisco CA City & County Redevelopment Financing Authority Tax Allocation Revenue (Mission Bays Redevelopment Project) | | 5.000% | | 8/1/28 | | | 835 | | 972 | |
140
California Intermediate-Term Tax-Exempt Fund
| | | | | | | | Face | | Market | |
| | | | | Maturity | | | Amount | | Value· | |
| | | Coupon | | Date | | | ($000 | ) | ($000 | ) |
| San Francisco CA City & County Redevelopment Financing Authority Tax Allocation Revenue (Mission Bays Redevelopment Project) | | 5.000% | | 8/1/29 | | | 460 | | 514 | |
| San Francisco CA City & County Redevelopment Financing Authority Tax Allocation Revenue (Mission Bays Redevelopment Project) | | 5.000% | | 8/1/29 | | | 745 | | 863 | |
| San Francisco CA City & County Redevelopment Financing Authority Tax Allocation Revenue (Mission Bays Redevelopment Project) | | 5.000% | | 8/1/30 | | | 550 | | 634 | |
| San Francisco CA City & County Redevelopment Financing Authority Tax Allocation Revenue (Mission Bays Redevelopment Project) | | 5.000% | | 8/1/31 | | | 710 | | 814 | |
| San Francisco CA City & County Redevelopment Financing Authority Tax Allocation Revenue (Mission Bays Redevelopment Project) | | 5.000% | | 8/1/31 | | | 400 | | 444 | |
| San Francisco CA City & County Redevelopment Financing Authority Tax Allocation Revenue (Mission Bays Redevelopment Project) | | 5.000% | | 8/1/32 | | | 450 | | 513 | |
| San Francisco CA City & County Redevelopment Financing Authority Tax Allocation Revenue (Mission Bays Redevelopment Project) | | 5.000% | | 8/1/32 | | | 1,000 | | 1,140 | |
| San Francisco CA City & County Redevelopment Financing Authority Tax Allocation Revenue (Mission Bays Redevelopment Project) | | 5.000% | | 8/1/32 | | | 860 | | 982 | |
| San Francisco CA City & County Redevelopment Financing Authority Tax Allocation Revenue (Mission Bays Redevelopment Project) | | 5.000% | | 8/1/32 | | | 525 | | 582 | |
| San Francisco CA City & County Redevelopment Financing Authority Tax Allocation Revenue (Mission Bays Redevelopment Project) | | 5.000% | | 8/1/33 | | | 670 | | 759 | |
| San Francisco CA City & County Redevelopment Financing Authority Tax Allocation Revenue (Mission Bays Redevelopment Project) | | 5.000% | | 8/1/33 | | | 660 | | 748 | |
| San Francisco CA City & County Redevelopment Financing Authority Tax Allocation Revenue (Mission Bays Redevelopment Project) | | 5.000% | | 8/1/33 | | | 750 | | 851 | |
| San Francisco CA City & County Redevelopment Financing Authority Tax Allocation Revenue (Mission Bays Redevelopment Project) | | 5.000% | | 8/1/34 | | | 700 | | 788 | |
141
California Intermediate-Term Tax-Exempt Fund
| | | | | | | | Face | | Market | |
| | | | | Maturity | | | Amount | | Value· | |
| | | Coupon | | Date | | | ($000 | ) | ($000 | ) |
| San Francisco CA City & County Redevelopment Financing Authority Tax Allocation Revenue (Mission Bays Redevelopment Project) | | 5.000% | | 8/1/34 | | | 660 | | 743 | |
| San Francisco CA City & County Redevelopment Financing Authority Tax Allocation Revenue (Mission Bays Redevelopment Project) | | 5.000% | | 8/1/34 | | | 555 | | 625 | |
| San Francisco CA City & County Redevelopment Financing Authority Tax Allocation Revenue (Mission Bays Redevelopment Project) | | 5.000% | | 8/1/34 | | | 225 | | 248 | |
| San Francisco CA City & County Redevelopment Financing Authority Tax Allocation Revenue (Mission Bays Redevelopment Project) | | 5.000% | | 8/1/35 | | | 400 | | 448 | |
| San Francisco CA City & County Redevelopment Financing Authority Tax Allocation Revenue (Mission Bays Redevelopment Project) | | 5.000% | | 8/1/35 | | | 595 | | 666 | |
| San Francisco CA City & County Redevelopment Financing Authority Tax Allocation Revenue (Mission Bays Redevelopment Project) | | 5.000% | | 8/1/35 | | | 900 | | 1,007 | |
| San Francisco CA City & County Redevelopment Financing Authority Tax Allocation Revenue (Mission Bays Redevelopment Project) | | 5.000% | | 8/1/36 | | | 350 | | 390 | |
| San Francisco CA City & County Redevelopment Financing Authority Tax Allocation Revenue (Mission Bays Redevelopment Project) | | 5.000% | | 8/1/36 | | | 780 | | 869 | |
| San Francisco CA City & County Redevelopment Financing Authority Tax Allocation Revenue (Mission Bays Redevelopment Project) | | 5.000% | | 8/1/36 | | | 625 | | 696 | |
| San Francisco CA City & County Redevelopment Financing Authority Tax Allocation Revenue (Redevelopment Projects) | | 5.000% | | 8/1/21 | | | 2,030 | | 2,196 | |
| San Francisco CA City & County Unified School District GO | | 5.000% | | 6/15/24 | | | 1,080 | | 1,250 | |
| San Francisco CA City & County Unified School District GO | | 5.000% | | 6/15/27 | | | 6,475 | | 7,444 | |
| San Francisco CA City & County Unified School District GO | | 5.000% | | 6/15/28 | | | 10,170 | | 11,686 | |
| San Francisco CA City & County Unified School District GO | | 4.000% | | 6/15/30 | | | 1,270 | | 1,303 | |
| San Francisco CA City & County Unified School District GO | | 5.000% | | 6/15/31 | | | 7,965 | | 8,288 | |
| San Francisco CA City & County Unified School District GO | | 4.000% | | 6/15/32 | | | 5,300 | | 5,477 | |
| San Francisco CA City & County Unified School District GO | | 4.250% | | 6/15/33 | | | 4,000 | | 4,156 | |
142
California Intermediate-Term Tax-Exempt Fund
| | | | | | | | Face | | Market | |
| | | | | Maturity | | | Amount | | Value· | |
| | | Coupon | | Date | | | ($000 | ) | ($000 | ) |
| San Francisco CA Municipal Transportation Agency Revenue | | 5.000% | | 3/1/29 | | | 1,585 | | 1,762 | |
| San Francisco CA Municipal Transportation Agency Revenue | | 5.000% | | 3/1/32 | | | 2,170 | | 2,401 | |
| San Francisco CA Municipal Transportation Agency Revenue | | 5.000% | | 3/1/33 | | | 3,025 | | 3,342 | |
| San Francisco CA Municipal Transportation Agency Revenue | | 5.000% | | 3/1/34 | | | 1,640 | | 1,833 | |
| San Joaquin County CA Transportation Authority Revenue | | 4.000% | | 3/1/20 | | | 1,020 | | 1,049 | |
| San Joaquin County CA Transportation Authority Revenue | | 4.000% | | 3/1/21 | | | 710 | | 745 | |
| San Joaquin County CA Transportation Authority Revenue | | 5.000% | | 3/1/22 | | | 300 | | 330 | |
| San Joaquin County CA Transportation Authority Revenue | | 5.000% | | 3/1/33 | | | 7,085 | | 8,236 | |
| San Joaquin County CA Transportation Authority Revenue | | 5.000% | | 3/1/34 | | | 1,345 | | 1,554 | |
| San Joaquin County CA Transportation Authority Revenue | | 5.000% | | 3/1/35 | | | 5,750 | | 6,622 | |
| San Joaquin Hills CA Transportation Corridor Agency Toll Road Revenue | | 0.000% | | 1/15/22 | (14) | | 570 | | 522 | |
| San Joaquin Hills CA Transportation Corridor Agency Toll Road Revenue | | 0.000% | | 1/1/23 | (ETM) | | 16,000 | | 14,682 | |
| San Joaquin Hills CA Transportation Corridor Agency Toll Road Revenue | | 0.000% | | 1/15/24 | (14) | | 7,140 | | 6,073 | |
| San Joaquin Hills CA Transportation Corridor Agency Toll Road Revenue | | 0.000% | | 1/1/25 | (ETM) | | 14,750 | | 12,868 | |
| San Joaquin Hills CA Transportation Corridor Agency Toll Road Revenue | | 5.000% | | 1/15/29 | | | 12,210 | | 13,379 | |
| San Joaquin Hills CA Transportation Corridor Agency Toll Road Revenue | | 5.000% | | 1/15/34 | | | 2,435 | | 2,630 | |
| San Jose CA Airport Revenue | | 5.000% | | 3/1/26 | | | 4,610 | | 4,905 | |
| San Jose CA Airport Revenue | | 5.000% | | 3/1/29 | | | 200 | | 232 | |
| San Jose CA Airport Revenue | | 5.000% | | 3/1/30 | | | 250 | | 288 | |
| San Jose CA Airport Revenue | | 5.000% | | 3/1/33 | | | 500 | | 569 | |
| San Jose CA Airport Revenue | | 5.000% | | 3/1/34 | | | 500 | | 566 | |
| San Jose CA Airport Revenue | | 5.000% | | 3/1/36 | | | 3,000 | | 3,376 | |
| San Jose CA Redevelopment Agency Tax Allocation Revenue | | 5.000% | | 8/1/19 | | | 2,350 | | 2,401 | |
| San Jose CA Redevelopment Agency Tax Allocation Revenue | | 5.000% | | 8/1/20 | (Prere.) | | 1,140 | | 1,200 | |
| San Jose CA Redevelopment Agency Tax Allocation Revenue | | 5.000% | | 8/1/20 | (Prere.) | | 1,270 | | 1,337 | |
| San Jose CA Redevelopment Agency Tax Allocation Revenue | | 5.000% | | 8/1/20 | | | 3,255 | | 3,429 | |
| San Jose CA Redevelopment Agency Tax Allocation Revenue | | 5.125% | | 8/1/20 | (Prere.) | | 570 | | 601 | |
| San Jose CA Redevelopment Agency Tax Allocation Revenue | | 5.250% | | 8/1/20 | (Prere.) | | 800 | | 846 | |
| San Jose CA Redevelopment Agency Tax Allocation Revenue | | 5.375% | | 8/1/20 | (Prere.) | | 1,355 | | 1,435 | |
| San Jose CA Redevelopment Agency Tax Allocation Revenue | | 5.000% | | 8/1/21 | | | 7,545 | | 8,176 | |
143
California Intermediate-Term Tax-Exempt Fund
| | | | | | | | Face | | Market | |
| | | | | Maturity | | | Amount | | Value· | |
| | | Coupon | | Date | | | ($000 | ) | ($000 | ) |
| San Jose CA Redevelopment Agency Tax Allocation Revenue | | 5.000% | | 8/1/22 | | | 3,500 | | 3,890 | |
| San Jose CA Redevelopment Agency Tax Allocation Revenue | | 5.000% | | 8/1/23 | | | 5,000 | | 5,684 | |
| San Jose CA Redevelopment Agency Tax Allocation Revenue | | 5.000% | | 8/1/24 | | | 5,000 | | 5,796 | |
| San Jose CA Redevelopment Agency Tax Allocation Revenue | | 5.000% | | 8/1/26 | | | 3,650 | | 4,361 | |
| San Jose CA Redevelopment Agency Tax Allocation Revenue | | 5.000% | | 8/1/27 | | | 2,335 | | 2,814 | |
| San Jose CA Redevelopment Agency Tax Allocation Revenue | | 5.000% | | 8/1/28 | | | 1,000 | | 1,197 | |
| San Jose CA Redevelopment Agency Tax Allocation Revenue | | 5.000% | | 8/1/29 | | | 1,000 | | 1,189 | |
| San Jose CA Special Hotel Tax Revenue (Convention Center Expansion & Renovation Project) | | 6.125% | | 5/1/31 | | | 5,000 | | 5,454 | |
| San Jose CA Unified School District Santa Clara County GO | | 5.000% | | 8/1/19 | | | 1,000 | | 1,022 | |
| San Jose CA Unified School District Santa Clara County GO | | 5.000% | | 8/1/20 | | | 1,000 | | 1,054 | |
| San Jose CA Unified School District Santa Clara County GO | | 5.000% | | 8/1/22 | | | 500 | | 555 | |
| San Jose CA Unified School District Santa Clara County GO | | 5.000% | | 8/1/23 | | | 400 | | 454 | |
| San Jose CA Unified School District Santa Clara County GO | | 5.000% | | 8/1/24 | | | 525 | | 608 | |
| San Jose CA Unified School District Santa Clara County GO | | 5.000% | | 8/1/25 | | | 440 | | 519 | |
| San Jose CA Unified School District Santa Clara County GO | | 5.000% | | 8/1/26 | | | 775 | | 928 | |
| San Jose CA Unified School District Santa Clara County GO | | 5.000% | | 8/1/27 | | | 750 | | 908 | |
| San Juan CA Unified School District GO | | 0.000% | | 8/1/25 | (4) | | 10,000 | | 8,459 | |
| San Juan CA Unified School District GO | | 0.000% | | 8/1/26 | (4) | | 12,215 | | 9,970 | |
| San Luis & Delta Mendota CA Water Authority Revenue | | 5.000% | | 3/1/24 | (15) | | 855 | | 956 | |
| San Luis & Delta Mendota CA Water Authority Revenue | | 5.000% | | 3/1/25 | (15) | | 970 | | 1,081 | |
| San Luis & Delta Mendota CA Water Authority Revenue | | 5.000% | | 3/1/26 | (15) | | 500 | | 555 | |
| San Luis & Delta Mendota CA Water Authority Revenue | | 5.000% | | 3/1/27 | (15) | | 1,070 | | 1,183 | |
| San Luis & Delta Mendota CA Water Authority Revenue | | 5.000% | | 3/1/28 | (15) | | 600 | | 662 | |
| San Luis & Delta Mendota CA Water Authority Revenue | | 5.000% | | 3/1/33 | (15) | | 2,790 | | 3,055 | |
| San Marcos CA Schools Financing Authority Lease Revenue | | 5.000% | | 8/15/25 | (4) | | 800 | | 938 | |
| San Marcos CA Schools Financing Authority Lease Revenue | | 5.000% | | 8/15/26 | (4) | | 635 | | 756 | |
| San Marcos CA Schools Financing Authority Lease Revenue | | 5.000% | | 8/15/27 | (4) | | 600 | | 725 | |
144
California Intermediate-Term Tax-Exempt Fund
| | | | | | | | Face | | Market | |
| | | | | Maturity | | | Amount | | Value· | |
| | | Coupon | | Date | | | ($000 | ) | ($000 | ) |
| San Marcos CA Schools Financing Authority Lease Revenue | | 5.000% | | 8/15/28 | (4) | | 890 | | 1,069 | |
| San Marcos CA Schools Financing Authority Lease Revenue | | 5.000% | | 8/15/30 | (4) | | 750 | | 890 | |
| San Marcos CA Schools Financing Authority Lease Revenue | | 5.000% | | 8/15/31 | (4) | | 1,060 | | 1,252 | |
| San Marcos CA Schools Financing Authority Lease Revenue | | 5.000% | | 8/15/32 | (4) | | 850 | | 1,000 | |
| San Marcos CA Schools Financing Authority Lease Revenue | | 5.000% | | 8/15/33 | (4) | | 635 | | 744 | |
| San Marcos CA Schools Financing Authority Lease Revenue | | 5.000% | | 8/15/35 | (4) | | 1,000 | | 1,159 | |
| San Marcos CA Schools Financing Authority Lease Revenue | | 5.000% | | 8/15/36 | (4) | | 1,325 | | 1,526 | |
| San Marcos CA Schools Financing Authority Lease Revenue | | 5.000% | | 8/15/37 | (4) | | 1,750 | | 2,009 | |
| San Marcos CA Unified School District GO | | 0.000% | | 8/1/25 | | | 2,300 | | 1,924 | |
| San Marcos CA Unified School District GO | | 0.000% | | 8/1/30 | | | 2,000 | | 1,344 | |
| San Marcos CA Unified School District GO | | 5.000% | | 8/1/30 | | | 4,030 | | 4,745 | |
| San Marcos CA Unified School District GO | | 0.000% | | 8/1/31 | | | 2,000 | | 1,284 | |
| San Marcos CA Unified School District GO | | 5.000% | | 8/1/31 | | | 3,015 | | 3,526 | |
| San Marcos CA Unified School District GO | | 0.000% | | 8/1/32 | | | 2,500 | | 1,538 | |
| San Marcos CA Unified School District GO | | 4.000% | | 8/1/32 | | | 300 | | 318 | |
| San Marcos CA Unified School District GO | | 5.000% | | 8/1/34 | | | 3,535 | | 4,080 | |
| San Marcos CA Unified School District GO | | 5.000% | | 8/1/35 | | | 4,000 | | 4,591 | |
| San Marcos CA Unified School District GO | | 5.000% | | 8/1/36 | | | 3,375 | | 3,844 | |
| San Marcos CA Unified School District GO | | 4.000% | | 8/1/37 | | | 4,000 | | 4,124 | |
| San Marcos CA Unified School District GO | | 4.000% | | 8/1/38 | | | 9,140 | | 9,364 | |
| San Mateo CA Union High School District GO | | 0.000% | | 9/1/23 | (Prere.) | | 2,725 | | 2,366 | |
| San Mateo CA Union High School District GO | | 5.000% | | 9/1/23 | (Prere.) | | 1,315 | | 1,495 | |
| San Mateo CA Union High School District GO | | 5.000% | | 9/1/23 | (Prere.) | | 725 | | 824 | |
| San Mateo CA Union High School District GO | | 0.000% | | 9/1/24 | | | 2,665 | | 2,268 | |
| San Mateo CA Union High School District GO | | 5.000% | | 9/1/30 | | | 1,285 | | 1,447 | |
| San Mateo CA Union High School District GO | | 5.000% | | 9/1/31 | | | 715 | | 804 | |
| San Mateo CA Union High School District GO | | 4.000% | | 9/1/32 | | | 3,155 | | 3,376 | |
| San Mateo CA Union High School District GO | | 4.000% | | 9/1/33 | | | 3,540 | | 3,753 | |
| San Mateo CA Union High School District GO | | 4.000% | | 9/1/33 | | | 1,950 | | 2,067 | |
| San Mateo CA Union High School District GO | | 4.000% | | 9/1/35 | | | 1,585 | | 1,659 | |
| San Mateo County CA Community College District GO | | 0.000% | | 9/1/21 | (14) | | 4,645 | | 4,400 | |
| San Mateo County CA Community College District GO | | 0.000% | | 9/1/22 | (14) | | 5,675 | | 5,246 | |
| San Mateo County CA Community College District GO | | 0.000% | | 9/1/24 | (14) | | 2,825 | | 2,469 | |
| San Mateo County CA Community College District GO | | 0.000% | | 9/1/25 | (14) | | 4,000 | | 3,383 | |
| San Mateo County CA Community College District GO | | 0.000% | | 9/1/30 | (14) | | 5,640 | | 3,912 | |
| San Mateo County CA Community College District GO | | 5.000% | | 9/1/32 | | | 2,000 | | 2,392 | |
| San Mateo County CA Community College District GO | | 4.000% | | 9/1/34 | | | 2,670 | | 2,836 | |
5 | San Mateo County CA Community College District GO | | 5.000% | | 9/1/36 | | | 1,000 | | 1,148 | |
145
California Intermediate-Term Tax-Exempt Fund
| | | | | | | | Face | | Market | |
| | | | | Maturity | | | Amount | | Value· | |
| | | Coupon | | Date | | | ($000 | ) | ($000 | ) |
5 | San Mateo County CA Community College District GO | | 5.000% | | 9/1/37 | | | 1,000 | | 1,145 | |
5 | San Mateo County CA Community College District GO | | 5.000% | | 9/1/38 | | | 750 | | 856 | |
| San Mateo County CA Joint Powers Financing Authority Lease Revenue (Capital Project Program) | | 5.000% | | 7/15/35 | (4) | | 4,875 | | 5,652 | |
| San Mateo County CA Joint Powers Financing Authority Lease Revenue (Capital Project Program) | | 5.000% | | 7/15/36 | | | 6,075 | | 7,017 | |
| San Mateo County CA Joint Powers Financing Authority Lease Revenue (Capital Project Program) | | 5.000% | | 7/15/37 | | | 6,435 | | 7,411 | |
| San Mateo County CA Joint Powers Financing Authority Lease Revenue (Maple Street Correctional Center) | | 5.000% | | 6/15/23 | | | 1,000 | | 1,137 | |
| San Mateo County CA Joint Powers Financing Authority Lease Revenue (Maple Street Correctional Center) | | 5.000% | | 6/15/27 | | | 2,000 | | 2,281 | |
| San Mateo County CA Joint Powers Financing Authority Lease Revenue (Youth Services Campus) | | 4.000% | | 7/15/21 | | | 1,000 | | 1,056 | |
| San Mateo County CA Joint Powers Financing Authority Lease Revenue (Youth Services Campus) | | 5.000% | | 7/15/22 | | | 1,335 | | 1,484 | |
| San Mateo County CA Joint Powers Financing Authority Lease Revenue (Youth Services Campus) | | 5.000% | | 7/15/23 | | | 1,505 | | 1,714 | |
| San Mateo County CA Joint Powers Financing Authority Lease Revenue (Youth Services Campus) | | 4.000% | | 7/15/33 | | | 5,000 | | 5,289 | |
| San Mateo County CA Transportation Authority Revenue | | 4.000% | | 6/1/20 | | | 770 | | 797 | |
| San Mateo County CA Transportation Authority Revenue | | 5.000% | | 6/1/20 | | | 750 | | 787 | |
| San Mateo County CA Transportation Authority Revenue | | 5.000% | | 6/1/21 | | | 1,385 | | 1,497 | |
| San Mateo County CA Transportation Authority Revenue | | 4.000% | | 6/1/22 | | | 600 | | 646 | |
| San Mateo County CA Transportation Authority Revenue | | 5.000% | | 6/1/22 | | | 785 | | 871 | |
| San Mateo County CA Transportation Authority Revenue | | 4.000% | | 6/1/23 | | | 1,520 | | 1,663 | |
| San Mateo County CA Transportation Authority Revenue | | 5.000% | | 6/1/23 | | | 855 | | 972 | |
| San Mateo County CA Transportation Authority Revenue | | 4.000% | | 6/1/24 | | | 750 | | 831 | |
| San Mateo County CA Transportation Authority Revenue | | 5.000% | | 6/1/24 | | | 1,250 | | 1,449 | |
| San Mateo County CA Transportation Authority Revenue | | 5.000% | | 6/1/25 | | | 1,245 | | 1,474 | |
| San Mateo County CA Transportation Authority Revenue | | 5.000% | | 6/1/31 | | | 1,365 | | 1,559 | |
| San Mateo-Foster City CA School District GO | | 4.000% | | 8/1/19 | | | 1,000 | | 1,016 | |
146
California Intermediate-Term Tax-Exempt Fund
| | | | | | | | Face | | Market | |
| | | | | Maturity | | | Amount | | Value· | |
| | | Coupon | | Date | | | ($000 | ) | ($000 | ) |
| San Mateo-Foster City CA School District GO | | 4.000% | | 8/1/34 | | | 1,580 | | 1,653 | |
| San Pablo CA Redevelopment Agency Successor Agency Tax Allocation Revenue | | 5.000% | | 6/15/22 | (4) | | 1,000 | | 1,097 | |
| San Pablo CA Redevelopment Agency Successor Agency Tax Allocation Revenue | | 5.000% | | 6/15/23 | (4) | | 1,250 | | 1,399 | |
| San Pablo CA Redevelopment Agency Successor Agency Tax Allocation Revenue | | 5.000% | | 6/15/27 | (4) | | 1,770 | | 1,984 | |
| San Pablo CA Redevelopment Agency Successor Agency Tax Allocation Revenue | | 5.000% | | 6/15/28 | (4) | | 1,860 | | 2,074 | |
| San Pablo CA Redevelopment Agency Successor Agency Tax Allocation Revenue | | 5.000% | | 6/15/30 | (4) | | 2,275 | | 2,518 | |
| San Rafael CA Elementary School District Capital Appreciation GO | | 0.000% | | 8/1/29 | (14) | | 2,000 | | 1,424 | |
| San Rafael CA High School District GO | | 0.000% | | 8/1/26 | (14) | | 3,280 | | 2,659 | |
| San Rafael CA High School District GO | | 0.000% | | 8/1/29 | (14) | | 6,505 | | 4,633 | |
| San Ramon CA Public Financing Authority Tax Allocation Revenue | | 0.000% | | 2/1/25 | (2) | | 1,020 | | 843 | |
| San Ramon CA Public Financing Authority Tax Allocation Revenue | | 0.000% | | 2/1/27 | (2) | | 1,700 | | 1,290 | |
| San Ramon CA Public Financing Authority Tax Allocation Revenue | | 0.000% | | 2/1/28 | (2) | | 1,800 | | 1,305 | |
| San Ramon CA Redevelopment Agency Successor Agency Tax Allocation Revenue | | 5.000% | | 2/1/25 | (15) | | 1,520 | | 1,748 | |
| San Ramon CA Redevelopment Agency Successor Agency Tax Allocation Revenue | | 5.000% | | 2/1/26 | (15) | | 1,595 | | 1,816 | |
| San Ramon CA Redevelopment Agency Successor Agency Tax Allocation Revenue | | 5.000% | | 2/1/27 | (15) | | 1,670 | | 1,894 | |
| San Ramon Valley CA Unified School District GO | | 4.000% | | 8/1/28 | | | 1,225 | | 1,311 | |
| San Ramon Valley CA Unified School District GO | | 4.000% | | 8/1/28 | | | 1,225 | | 1,311 | |
| San Ramon Valley CA Unified School District GO | | 4.000% | | 8/1/32 | | | 2,000 | | 2,117 | |
| San Ysidro CA School District COP | | 5.000% | | 9/1/27 | (15) | | 100 | | 110 | |
| San Ysidro CA School District COP | | 5.000% | | 9/1/31 | (15) | | 200 | | 219 | |
| San Ysidro CA School District COP | | 5.000% | | 9/1/34 | (15) | | 200 | | 218 | |
| San Ysidro CA School District COP | | 5.000% | | 9/1/37 | (15) | | 320 | | 348 | |
| San Ysidro CA School District GO | | 0.000% | | 8/1/26 | (14) | | 4,770 | | 3,696 | |
| Santa Ana CA College Improvement District No. 1 Rancho Santiago Community College GO | | 4.000% | | 8/1/20 | | | 700 | | 727 | |
| Santa Ana CA College Improvement District No. 1 Rancho Santiago Community College GO | | 5.000% | | 8/1/21 | | | 125 | | 135 | |
| Santa Ana CA College Improvement District No. 1 Rancho Santiago Community College GO | | 5.000% | | 8/1/22 | | | 100 | | 111 | |
| Santa Ana CA College Improvement District No. 1 Rancho Santiago Community College GO | | 5.000% | | 8/1/23 | | | 100 | | 114 | |
| Santa Ana CA College Improvement District No. 1 Rancho Santiago Community College GO | | 5.000% | | 8/1/24 | | | 130 | | 151 | |
| Santa Ana CA College Improvement District No. 1 Rancho Santiago Community College GO | | 5.000% | | 8/1/25 | | | 150 | | 177 | |
| Santa Ana CA College Improvement District No. 1 Rancho Santiago Community College GO | | 5.000% | | 8/1/26 | | | 200 | | 240 | |
| Santa Ana CA College Improvement District No. 1 Rancho Santiago Community College GO | | 5.000% | | 8/1/27 | | | 250 | | 303 | |
147
California Intermediate-Term Tax-Exempt Fund
| | | | | | | | Face | | Market | |
| | | | | Maturity | | | Amount | | Value· | |
| | | Coupon | | Date | | | ($000 | ) | ($000 | ) |
| Santa Ana CA College Improvement District No. 1 Rancho Santiago Community College GO | | 4.000% | | 8/1/28 | | | 275 | | 306 | |
| Santa Ana CA College Improvement District No. 1 Rancho Santiago Community College GO | | 4.000% | | 8/1/29 | | | 350 | | 385 | |
| Santa Ana CA College Improvement District No. 1 Rancho Santiago Community College GO | | 4.000% | | 8/1/30 | | | 500 | | 544 | |
| Santa Ana CA College Improvement District No. 1 Rancho Santiago Community College GO | | 4.000% | | 8/1/31 | | | 500 | | 538 | |
| Santa Ana CA College Improvement District No. 1 Rancho Santiago Community College GO | | 4.000% | | 8/1/32 | | | 500 | | 534 | |
| Santa Ana CA College Improvement District No. 1 Rancho Santiago Community College GO | | 4.000% | | 8/1/33 | | | 750 | | 794 | |
| Santa Ana CA Unified School District COP | | 0.000% | | 4/1/32 | (4) | | 1,750 | | 1,058 | |
| Santa Ana CA Unified School District GO | | 0.000% | | 8/1/31 | (14) | | 3,775 | | 2,403 | |
| Santa Barbara CA Unified School District GO | | 4.000% | | 8/1/30 | | | 840 | | 916 | |
| Santa Barbara CA Unified School District GO | | 4.000% | | 8/1/30 | | | 300 | | 327 | |
| Santa Clara CA Electric Revenue | | 4.000% | | 7/1/24 | | | 4,720 | | 5,064 | |
| Santa Clara CA Electric Revenue | | 4.000% | | 7/1/25 | | | 5,200 | | 5,571 | |
| Santa Clara CA Electric Revenue | | 4.000% | | 7/1/26 | | | 5,230 | | 5,594 | |
| Santa Clara CA Electric Revenue | | 5.000% | | 7/1/30 | | | 1,000 | | 1,076 | |
| Santa Clara CA Electric Revenue | | 5.250% | | 7/1/32 | | | 2,525 | | 2,731 | |
| Santa Clara CA Financing Authority Revenue | | 4.000% | | 4/1/34 | | | 6,970 | | 7,313 | |
| Santa Clara CA Financing Authority Revenue | | 4.000% | | 4/1/35 | | | 7,250 | | 7,578 | |
| Santa Clara CA Unified School District GO | | 5.000% | | 7/1/20 | (Prere.) | | 4,715 | | 4,957 | |
| Santa Clara CA Unified School District GO | | 5.000% | | 7/1/20 | (Prere.) | | 4,405 | | 4,631 | |
| Santa Clara CA Unified School District GO | | 5.000% | | 7/1/20 | (Prere.) | | 4,115 | | 4,326 | |
| Santa Clara CA Unified School District GO | | 5.000% | | 7/1/20 | (Prere.) | | 3,775 | | 3,968 | |
| Santa Clara CA Unified School District GO | | 5.000% | | 7/1/21 | | | 2,290 | | 2,480 | |
| Santa Clara CA Unified School District GO | | 5.000% | | 7/1/22 | | | 2,060 | | 2,290 | |
| Santa Clara CA Unified School District GO | | 5.000% | | 7/1/23 | | | 2,185 | | 2,487 | |
| Santa Clara CA Unified School District GO | | 5.000% | | 7/1/25 | | | 3,120 | | 3,606 | |
| Santa Clara CA Unified School District GO | | 5.000% | | 7/1/25 | | | 3,595 | | 4,155 | |
| Santa Clara CA Unified School District GO | | 4.000% | | 7/1/29 | | | 6,650 | | 7,180 | |
| Santa Clara CA Unified School District GO | | 4.000% | | 7/1/29 | | | 8,235 | | 8,891 | |
| Santa Clara CA Unified School District GO | | 4.000% | | 7/1/30 | | | 8,800 | | 9,421 | |
| Santa Clara CA Unified School District GO | | 4.000% | | 7/1/33 | | | 8,750 | | 9,218 | |
| Santa Clara County CA Financing Authority Lease Revenue (Multiple Facilities Projects) | | 5.000% | | 5/15/20 | | | 4,215 | | 4,416 | |
| Santa Clara County CA Financing Authority Lease Revenue (Multiple Facilities Projects) | | 5.000% | | 5/15/21 | | | 5,770 | | 6,223 | |
| Santa Clara County CA Financing Authority Lease Revenue (Multiple Facilities Projects) | | 5.000% | | 5/15/22 | | | 6,060 | | 6,714 | |
| Santa Clara County CA Financing Authority Revenue | | 5.000% | | 5/15/22 | | | 4,090 | | 4,531 | |
| Santa Clara County CA Financing Authority Revenue | | 5.000% | | 5/15/25 | | | 6,510 | | 7,674 | |
| Santa Clara County CA Financing Authority Revenue | | 5.000% | | 5/15/26 | | | 6,800 | | 7,980 | |
| Santa Clara County CA GO | | 5.000% | | 8/1/28 | | | 8,830 | | 9,758 | |
| Santa Clara Valley CA Joint Powers Authority Revenue | | 5.000% | | 8/1/22 | | | 710 | | 790 | |
| Santa Clara Valley CA Joint Powers Authority Revenue | | 5.000% | | 8/1/23 | | | 375 | | 427 | |
148
California Intermediate-Term Tax-Exempt Fund
| | | | | | | | Face | | Market | |
| | | | | Maturity | | | Amount | | Value· | |
| | | Coupon | | Date | | | ($000 | ) | ($000 | ) |
| Santa Clara Valley CA Joint Powers Authority Revenue | | 5.000% | | 8/1/24 | | | 275 | | 319 | |
| Santa Clara Valley CA Joint Powers Authority Revenue | | 4.000% | | 8/1/25 | | | 615 | | 682 | |
| Santa Clara Valley CA Joint Powers Authority Revenue | | 4.000% | | 8/1/26 | | | 660 | | 737 | |
| Santa Clara Valley CA Joint Powers Authority Revenue | | 5.000% | | 8/1/29 | | | 545 | | 643 | |
| Santa Clara Valley CA Joint Powers Authority Revenue | | 5.000% | | 8/1/30 | | | 1,200 | | 1,401 | |
| Santa Clara Valley CA Water District COP | | 5.000% | | 6/1/20 | | | 575 | | 603 | |
| Santa Clara Valley CA Water District COP | | 5.000% | | 6/1/21 | | | 525 | | 566 | |
| Santa Clara Valley CA Water District COP | | 5.000% | | 6/1/22 | | | 550 | | 608 | |
| Santa Clara Valley CA Water District COP | | 5.000% | | 6/1/23 | | | 820 | | 927 | |
| Santa Clarita CA Community College District GO | | 0.000% | | 8/1/29 | (4) | | 2,480 | | 1,772 | |
| Santa Clarita CA Community College District GO | | 5.000% | | 8/1/32 | | | 5,450 | | 5,936 | |
| Santa Monica CA Community College District GO | | 0.000% | | 8/1/24 | | | 4,500 | | 3,930 | |
| Santa Monica CA Community College District GO | | 0.000% | | 8/1/26 | | | 11,025 | | 9,005 | |
| Santa Monica CA Community College District GO | | 4.000% | | 8/1/30 | | | 2,000 | | 2,126 | |
| Santa Monica CA Community College District GO | | 5.000% | | 8/1/30 | | | 500 | | 601 | |
| Santa Monica CA Community College District GO | | 5.000% | | 8/1/31 | | | 600 | | 716 | |
| Santa Monica CA Community College District GO | | 4.000% | | 8/1/32 | | | 2,565 | | 2,702 | |
| Santa Monica CA Community College District GO | | 5.000% | | 8/1/32 | | | 500 | | 593 | |
| Santa Monica CA Community College District GO | | 4.000% | | 8/1/33 | | | 3,510 | | 3,672 | |
| Santa Monica CA Community College District GO | | 4.000% | | 8/1/33 | | | 500 | | 536 | |
| Santa Monica CA Community College District GO | | 4.000% | | 8/1/34 | | | 635 | | 677 | |
| Santa Monica-Malibu CA Unified School District GO | | 5.000% | | 7/1/29 | | | 200 | | 237 | |
| Santa Monica-Malibu CA Unified School District GO | | 5.000% | | 7/1/30 | | | 250 | | 295 | |
| Santa Monica-Malibu CA Unified School District GO | | 5.000% | | 7/1/31 | | | 350 | | 411 | |
| Santa Monica-Malibu CA Unified School District GO | | 4.000% | | 8/1/31 | | | 1,600 | | 1,708 | |
| Santa Monica-Malibu CA Unified School District GO | | 5.000% | | 7/1/32 | | | 250 | | 293 | |
| Santa Monica-Malibu CA Unified School District GO | | 5.000% | | 7/1/33 | | | 250 | | 291 | |
| Santa Monica-Malibu CA Unified School District GO | | 4.000% | | 8/1/33 | | | 1,150 | | 1,212 | |
| Santa Monica-Malibu CA Unified School District GO | | 5.000% | | 7/1/34 | | | 315 | | 365 | |
149
California Intermediate-Term Tax-Exempt Fund
| | | | | | | | Face | | Market | |
| | | | | Maturity | | | Amount | | Value· | |
| | | Coupon | | Date | | | ($000 | ) | ($000 | ) |
| Santa Monica-Malibu CA Unified School District GO | | 5.000% | | 7/1/35 | | | 350 | | 405 | |
| Santa Monica-Malibu CA Unified School District GO | | 4.000% | | 7/1/36 | | | 430 | | 449 | |
| Santa Monica-Malibu CA Unified School District GO | | 4.000% | | 7/1/37 | | | 465 | | 483 | |
| Santa Rosa CA High School District GO | | 5.000% | | 5/1/20 | | | 1,150 | | 1,204 | |
| Santa Rosa CA High School District GO | | 5.000% | | 8/1/28 | (4) | | 500 | | 590 | |
| Santa Rosa CA High School District GO | | 5.000% | | 8/1/30 | (4) | | 800 | | 934 | |
| Santa Rosa CA High School District GO | | 5.000% | | 8/1/32 | (4) | | 800 | | 928 | |
| Santa Rosa CA High School District GO | | 5.000% | | 8/1/34 | (4) | | 965 | | 1,109 | |
| Santa Rosa CA High School District GO | | 5.000% | | 8/1/35 | (4) | | 750 | | 859 | |
| Santa Rosa CA Wastewater Revenue | | 5.000% | | 9/1/21 | | | 1,300 | | 1,409 | |
| Santa Rosa CA Wastewater Revenue | | 5.000% | | 9/1/22 | | | 1,140 | | 1,266 | |
| Santa Rosa CA Wastewater Revenue | | 5.000% | | 9/1/23 | | | 945 | | 1,073 | |
| Santa Rosa CA Wastewater Revenue | | 5.000% | | 9/1/24 | | | 865 | | 1,002 | |
| Santa Rosa CA Wastewater Revenue | | 5.000% | | 9/1/25 | | | 815 | | 960 | |
| Santa Rosa CA Wastewater Revenue | | 5.000% | | 9/1/26 | | | 855 | | 1,027 | |
| Santa Rosa CA Wastewater Revenue | | 0.000% | | 9/1/28 | (4) | | 11,095 | | 8,206 | |
| Santa Rosa CA Wastewater Revenue | | 5.000% | | 9/1/29 | | | 2,870 | | 3,156 | |
| Santa Rosa CA Wastewater Revenue | | 5.000% | | 9/1/30 | | | 3,055 | | 3,356 | |
| Santa Rosa CA Wastewater Revenue | | 5.000% | | 9/1/33 | | | 1,425 | | 1,560 | |
| Santee CA CDC Successor Agency Tax Allocation Revenue | | 4.000% | | 8/1/20 | | | 590 | | 612 | |
| Santee CA CDC Successor Agency Tax Allocation Revenue | | 4.000% | | 8/1/21 | | | 600 | | 630 | |
| Santee CA CDC Successor Agency Tax Allocation Revenue | | 5.000% | | 8/1/22 | | | 570 | | 627 | |
| Shasta-Tehama-Trinity CA Joint Community College District GO | | 5.000% | | 8/1/31 | | | 300 | | 352 | |
| Shasta-Tehama-Trinity CA Joint Community College District GO | | 5.000% | | 8/1/32 | | | 275 | | 321 | |
| Shasta-Tehama-Trinity CA Joint Community College District GO | | 4.000% | | 8/1/36 | | | 700 | | 734 | |
| Shasta-Tehama-Trinity CA Joint Community College District GO | | 4.000% | | 8/1/37 | | | 1,000 | | 1,044 | |
| Signal Hill CA Redevelopment Agency Successor Agency Tax Allocation Revenue | | 5.000% | | 10/1/19 | | | 2,040 | | 2,093 | |
| Signal Hill CA Redevelopment Agency Successor Agency Tax Allocation Revenue | | 5.000% | | 10/1/20 | (15) | | 2,120 | | 2,243 | |
| Silicon Valley CA Clean Water Wastewater Revenue | | 5.000% | | 8/1/20 | | | 100 | | 105 | |
| Silicon Valley CA Clean Water Wastewater Revenue | | 5.000% | | 8/1/21 | | | 725 | | 785 | |
| Silicon Valley CA Clean Water Wastewater Revenue | | 5.000% | | 8/1/24 | | | 1,000 | | 1,161 | |
| Silicon Valley CA Clean Water Wastewater Revenue | | 5.000% | | 8/1/28 | | | 1,000 | | 1,163 | |
| Silicon Valley CA Clean Water Wastewater Revenue | | 5.000% | | 8/1/35 | | | 1,000 | | 1,133 | |
| Simi Valley CA Unified School District GO | | 5.000% | | 8/1/20 | | | 1,500 | | 1,581 | |
| Simi Valley CA Unified School District GO | | 5.000% | | 8/1/21 | | | 1,220 | | 1,323 | |
| Simi Valley CA Unified School District GO | | 5.000% | | 8/1/22 | | | 1,500 | | 1,669 | |
| Simi Valley CA Unified School District GO | | 5.000% | | 8/1/23 | | | 2,500 | | 2,847 | |
150
California Intermediate-Term Tax-Exempt Fund
| | | | | | | | Face | | Market | |
| | | | | Maturity | | | Amount | | Value· | |
| | | Coupon | | Date | | | ($000 | ) | ($000 | ) |
| Simi Valley CA Unified School District GO | | 5.000% | | 8/1/24 | | | 3,455 | | 4,015 | |
| Simi Valley CA Unified School District GO | | 5.000% | | 8/1/25 | | | 2,785 | | 3,300 | |
| Simi Valley CA Unified School District GO | | 0.000% | | 8/1/26 | (4) | | 3,030 | | 2,401 | |
| Simi Valley CA Unified School District GO | | 5.000% | | 8/1/26 | | | 2,025 | | 2,434 | |
| Simi Valley CA Unified School District GO | | 0.000% | | 8/1/27 | (4) | | 2,900 | | 2,201 | |
| Simi Valley CA Unified School District GO | | 0.000% | | 8/1/28 | (4) | | 4,785 | | 3,475 | |
| Simi Valley CA Unified School District GO | | 4.000% | | 8/1/36 | | | 1,240 | | 1,292 | |
| Simi Valley CA Unified School District GO | | 4.000% | | 8/1/37 | | | 1,320 | | 1,371 | |
| Solana Beach CA School District Special Tax Revenue | | 5.000% | | 9/1/29 | | | 2,120 | | 2,268 | |
| Solana Beach CA School District Special Tax Revenue | | 5.000% | | 9/1/32 | | | 2,655 | | 2,831 | |
| Solano County CA Community College District GO | | 0.000% | | 8/1/21 | (14) | | 985 | | 931 | |
5 | Soledad CA Unified School District Revenue BAN | | 0.000% | | 8/1/21 | | | 2,120 | | 1,981 | |
| Sonoma County CA Transportation Authority Sales Tax Revenue | | 5.000% | | 12/1/20 | | | 1,405 | | 1,496 | |
| Sonoma County CA Transportation Authority Sales Tax Revenue | | 5.000% | | 12/1/22 | | | 2,445 | | 2,739 | |
| South Orange County CA Public Financing Authority Special Tax Revenue | | 5.000% | | 8/15/23 | | | 1,000 | | 1,095 | |
| South Orange County CA Public Financing Authority Special Tax Revenue | | 5.000% | | 8/15/25 | | | 1,250 | | 1,372 | |
| South San Francisco CA Unified School District GO | | 4.000% | | 9/1/33 | | | 2,010 | | 2,116 | |
| Southern California Public Power Authority Revenue | | 5.000% | | 7/1/23 | | | 500 | | 501 | |
| Southern California Public Power Authority Revenue | | 5.000% | | 7/1/25 | | | 6,760 | | 7,909 | |
| Southern California Public Power Authority Revenue | | 5.000% | | 7/1/28 | | | 10,000 | | 10,465 | |
| Southern California Public Power Authority Revenue | | 5.000% | | 7/1/29 | | | 5,000 | | 5,231 | |
| Southern California Public Power Authority Revenue | | 5.000% | | 7/1/30 | | | 10,750 | | 11,243 | |
| Southern California Public Power Authority Revenue (Canyon Power Project) | | 5.000% | | 7/1/20 | | | 1,250 | | 1,314 | |
| Southern California Public Power Authority Revenue (Canyon Power Project) | | 5.000% | | 7/1/21 | | | 1,000 | | 1,080 | |
| Southern California Public Power Authority Revenue (Canyon Power Project) | | 5.000% | | 7/1/23 | | | 4,000 | | 4,308 | |
| Southern California Public Power Authority Revenue (Canyon Power Project) | | 5.000% | | 7/1/24 | | | 2,375 | | 2,557 | |
| Southern California Public Power Authority Revenue (Canyon Power Project) | | 5.000% | | 7/1/25 | | | 1,675 | | 1,803 | |
| Southern California Public Power Authority Revenue (Canyon Power Project) | | 5.000% | | 7/1/26 | | | 1,250 | | 1,345 | |
| Southern California Public Power Authority Revenue (Canyon Power Project) | | 5.000% | | 7/1/27 | | | 1,000 | | 1,075 | |
| Southern California Public Power Authority Revenue (Canyon Power Project) PUT | | 2.250% | | 5/1/21 | | | 38,000 | | 38,049 | |
| Southern California Public Power Authority Revenue (Linden Wind Energy Project) | | 5.000% | | 7/1/28 | | | 3,500 | | 3,663 | |
151
California Intermediate-Term Tax-Exempt Fund
| | | | | | | | Face | | Market | |
| | | | | Maturity | | | Amount | | Value· | |
| | | Coupon | | Date | | | ($000 | ) | ($000 | ) |
| Southern California Public Power Authority Revenue (Linden Wind Energy Project) | | 5.000% | | 7/1/29 | | | 2,500 | | 2,615 | |
| Southern California Public Power Authority Revenue (Linden Wind Energy Project) | | 5.000% | | 7/1/30 | | | 2,500 | | 2,615 | |
| Southern California Public Power Authority Revenue (Milford Wind Corridor Phase I Project) | | 5.000% | | 7/1/28 | | | 5,000 | | 5,159 | |
| Southern California Public Power Authority Revenue (Milford Wind Corridor Phase I Project) | | 5.000% | | 7/1/29 | | | 5,000 | | 5,158 | |
| Southern California Public Power Authority Revenue (Natural Gas Project) | | 5.250% | | 11/1/23 | | | 5,540 | | 6,171 | |
| Southern California Public Power Authority Revenue (Natural Gas Project) | | 5.250% | | 11/1/24 | | | 5,000 | | 5,636 | |
| Southern California Public Power Authority Revenue (Natural Gas Project) | | 5.250% | | 11/1/25 | | | 7,025 | | 8,002 | |
| Southern California Public Power Authority Revenue (Natural Gas Project) | | 5.250% | | 11/1/26 | | | 3,525 | | 4,061 | |
| Southern California Public Power Authority Revenue (Natural Gas Project) | | 5.000% | | 11/1/28 | | | 2,265 | | 2,595 | |
| Southern California Public Power Authority Revenue (Natural Gas Project) | | 5.000% | | 11/1/33 | | | 4,830 | | 5,642 | |
| Southern California Water Replenishment District Financing Authority Revenue | | 5.000% | | 8/1/20 | | | 1,000 | | 1,055 | |
| Southern California Water Replenishment District Financing Authority Revenue | | 5.000% | | 8/1/22 | | | 900 | | 1,003 | |
| Southern California Water Replenishment District Financing Authority Revenue | | 5.000% | | 8/1/23 | | | 1,350 | | 1,539 | |
| Southern California Water Replenishment District Financing Authority Revenue | | 5.000% | | 8/1/24 | | | 700 | | 813 | |
| Southern California Water Replenishment District Financing Authority Revenue | | 5.000% | | 8/1/25 | | | 805 | | 952 | |
| Southern California Water Replenishment District Financing Authority Revenue | | 5.000% | | 8/1/26 | | | 750 | | 881 | |
| Southern California Water Replenishment District Financing Authority Revenue | | 5.000% | | 8/1/27 | | | 1,340 | | 1,567 | |
| Southern California Water Replenishment District Financing Authority Revenue | | 5.000% | | 8/1/29 | | | 1,500 | | 1,736 | |
| Southern California Water Replenishment District Financing Authority Revenue | | 5.000% | | 8/1/30 | | | 1,120 | | 1,287 | |
| Southern California Water Replenishment District Financing Authority Revenue | | 5.000% | | 8/1/31 | | | 1,470 | | 1,683 | |
| Southern California Water Replenishment District Financing Authority Revenue | | 5.000% | | 8/1/32 | | | 2,410 | | 2,754 | |
| Southern California Water Replenishment District Financing Authority Revenue | | 5.000% | | 8/1/33 | | | 2,325 | | 2,649 | |
| Southern California Water Replenishment District Financing Authority Revenue | | 5.000% | | 8/1/34 | | | 3,400 | | 3,863 | |
| Southern California Water Replenishment District Financing Authority Revenue | | 5.000% | | 8/1/35 | | | 2,840 | | 3,219 | |
| Southern California Water Replenishment District Financing Authority Revenue | | 5.000% | | 8/1/36 | | | 3,000 | | 3,398 | |
| Southwestern California Community College District GO | | 0.000% | | 8/1/24 | | | 750 | | 648 | |
152
California Intermediate-Term Tax-Exempt Fund
| | | | | | | | Face | | Market | |
| | | | | Maturity | | | Amount | | Value· | |
| | | Coupon | | Date | | | ($000 | ) | ($000 | ) |
| Southwestern California Community College District GO | | 0.000% | | 8/1/25 | | | 1,090 | | 898 | |
| Southwestern California Community College District GO | | 0.000% | | 8/1/26 | | | 2,000 | | 1,577 | |
| Southwestern California Community College District GO | | 0.000% | | 8/1/27 | | | 2,000 | | 1,506 | |
| Southwestern California Community College District GO | | 0.000% | | 8/1/28 | | | 2,535 | | 1,817 | |
| Southwestern California Community College District GO | | 5.000% | | 8/1/28 | | | 175 | | 208 | |
| Southwestern California Community College District GO | | 5.000% | | 8/1/29 | | | 1,000 | | 1,167 | |
| Southwestern California Community College District GO | | 5.000% | | 8/1/29 | | | 300 | | 354 | |
| Southwestern California Community College District GO | | 5.000% | | 8/1/30 | | | 300 | | 351 | |
| Southwestern California Community College District GO | | 4.000% | | 8/1/31 | | | 275 | | 293 | |
| Southwestern California Community College District GO | | 4.000% | | 8/1/32 | | | 1,000 | | 1,061 | |
| Southwestern California Community College District GO | | 4.000% | | 8/1/32 | | | 250 | | 265 | |
| Southwestern California Community College District GO | | 4.000% | | 8/1/33 | | | 300 | | 317 | |
| Southwestern California Community College District GO | | 4.000% | | 8/1/34 | | | 1,750 | | 1,836 | |
| Southwestern California Community College District GO | | 4.000% | | 8/1/35 | | | 1,500 | | 1,566 | |
| Southwestern California Community College District GO | | 4.000% | | 8/1/36 | | | 1,200 | | 1,244 | |
| Southwestern California Community College District GO | | 4.000% | | 8/1/37 | | | 2,385 | | 2,463 | |
| Southwestern California Community College District GO | | 4.000% | | 8/1/38 | | | 1,750 | | 1,799 | |
16 | St. Helena CA Unified School District GO | | 0.000% | | 8/1/27 | | | 4,550 | | 4,139 | |
5 | State Center California Community College District GO | | 5.000% | | 8/1/27 | | | 635 | | 768 | |
5 | State Center California Community College District GO | | 5.000% | | 8/1/28 | | | 655 | | 801 | |
5 | State Center California Community College District GO | | 5.000% | | 8/1/29 | | | 710 | | 863 | |
| State Center California Community College District GO | | 4.000% | | 8/1/34 | | | 1,000 | | 1,056 | |
| State Center California Community College District GO | | 4.000% | | 8/1/36 | | | 1,045 | | 1,091 | |
| State Center California Community College District GO | | 4.000% | | 8/1/37 | | | 1,000 | | 1,040 | |
| Stockton CA Public Financing Authority Revenue | | 4.000% | | 9/2/20 | (15) | | 580 | | 601 | |
| Stockton CA Public Financing Authority Revenue | | 4.000% | | 9/2/21 | (15) | | 450 | | 472 | |
| Stockton CA Public Financing Authority Revenue | | 4.000% | | 9/2/22 | (15) | | 950 | | 1,009 | |
153
California Intermediate-Term Tax-Exempt Fund
| | | | | | | | Face | | Market | |
| | | | | Maturity | | | Amount | | Value· | |
| | | Coupon | | Date | | | ($000 | ) | ($000 | ) |
| Stockton CA Public Financing Authority Revenue | | 4.000% | | 9/2/23 | (15) | | 660 | | 708 | |
| Stockton CA Public Financing Authority Revenue | | 4.000% | | 9/2/24 | (15) | | 1,050 | | 1,134 | |
| Stockton CA Public Financing Authority Revenue | | 4.000% | | 9/2/25 | (15) | | 1,100 | | 1,196 | |
| Stockton CA Public Financing Authority Revenue | | 4.000% | | 9/2/26 | (15) | | 1,145 | | 1,247 | |
| Stockton CA Public Financing Authority Wastewater Revenue | | 5.000% | | 9/1/22 | (15) | | 1,000 | | 1,101 | |
| Stockton CA Public Financing Authority Wastewater Revenue | | 5.000% | | 9/1/23 | (15) | | 1,015 | | 1,139 | |
| Stockton CA Public Financing Authority Wastewater Revenue | | 5.000% | | 9/1/24 | (15) | | 1,000 | | 1,141 | |
| Stockton CA Public Financing Authority Wastewater Revenue | | 5.000% | | 9/1/25 | (15) | | 1,250 | | 1,428 | |
| Stockton CA Public Financing Authority Wastewater Revenue | | 5.000% | | 9/1/26 | (15) | | 1,375 | | 1,566 | |
| Stockton CA Public Financing Authority Wastewater Revenue | | 5.000% | | 9/1/27 | (15) | | 1,250 | | 1,419 | |
| Stockton CA Public Financing Authority Water Revenue | | 5.000% | | 10/1/20 | (15) | | 500 | | 528 | |
| Stockton CA Public Financing Authority Water Revenue | | 5.000% | | 10/1/23 | (15) | | 725 | | 811 | |
| Stockton CA Public Financing Authority Water Revenue | | 5.000% | | 10/1/24 | (15) | | 900 | | 1,021 | |
| Stockton CA Public Financing Authority Water Revenue | | 5.000% | | 10/1/25 | (15) | | 1,000 | | 1,150 | |
| Stockton CA Public Financing Authority Water Revenue | | 5.000% | | 10/1/26 | (15) | | 1,000 | | 1,160 | |
| Stockton CA Public Financing Authority Water Revenue | | 5.000% | | 10/1/27 | (15) | | 1,000 | | 1,167 | |
| Stockton CA Public Financing Authority Water Revenue | | 5.000% | | 10/1/28 | (15) | | 1,250 | | 1,465 | |
| Stockton CA Public Financing Authority Water Revenue | | 5.000% | | 10/1/29 | (15) | | 1,520 | | 1,768 | |
| Stockton CA Public Financing Authority Water Revenue | | 5.000% | | 10/1/30 | (15) | | 1,750 | | 2,017 | |
| Stockton CA Public Financing Authority Water Revenue | | 5.000% | | 10/1/32 | (15) | | 1,635 | | 1,876 | |
| Stockton CA Public Financing Authority Water Revenue | | 5.000% | | 10/1/33 | (15) | | 1,290 | | 1,475 | |
| Stockton CA Public Financing Authority Water Revenue | | 5.000% | | 10/1/34 | (15) | | 1,540 | | 1,752 | |
| Stockton CA Public Financing Authority Water Revenue | | 5.000% | | 10/1/35 | (15) | | 1,550 | | 1,755 | |
| Stockton CA Public Financing Authority Water Revenue | | 4.000% | | 10/1/37 | (15) | | 1,730 | | 1,749 | |
| Stockton CA Public Financing Authority Water Revenue (Delta Water Supply Project) | | 6.125% | | 10/1/35 | | | 1,000 | | 1,162 | |
| Stockton CA Redevelopment Agency Successor Agency Tax Allocation Revenue | | 5.000% | | 9/1/28 | (4) | | 1,600 | | 1,844 | |
| Stockton CA Redevelopment Agency Successor Agency Tax Allocation Revenue | | 5.000% | | 9/1/29 | (4) | | 1,500 | | 1,720 | |
154
California Intermediate-Term Tax-Exempt Fund
| | | | | | | | Face | | Market | |
| | | | | Maturity | | | Amount | | Value· | |
| | | Coupon | | Date | | | ($000 | ) | ($000 | ) |
| Stockton CA Redevelopment Agency Successor Agency Tax Allocation Revenue | | 5.000% | | 9/1/33 | (4) | | 2,890 | | 3,261 | |
| Stockton CA Redevelopment Agency Successor Agency Tax Allocation Revenue | | 5.000% | | 9/1/34 | (4) | | 2,000 | | 2,248 | |
| Stockton CA Unified School District GO | | 4.000% | | 8/1/19 | | | 3,470 | | 3,522 | |
| Stockton CA Unified School District GO | | 5.000% | | 8/1/20 | | | 930 | | 979 | |
| Stockton CA Unified School District GO | | 5.000% | | 8/1/21 | | | 2,185 | | 2,359 | |
| Stockton CA Unified School District GO | | 5.000% | | 8/1/22 | | | 2,650 | | 2,932 | |
| Stockton CA Unified School District GO | | 5.000% | | 7/1/23 | (4) | | 1,110 | | 1,224 | |
| Stockton CA Unified School District GO | | 5.000% | | 8/1/23 | | | 2,055 | | 2,323 | |
| Stockton CA Unified School District GO | | 5.000% | | 7/1/24 | (4) | | 1,570 | | 1,727 | |
| Stockton CA Unified School District GO | | 5.000% | | 8/1/28 | (15) | | 1,000 | | 1,127 | |
| Stockton CA Unified School District GO | | 5.000% | | 8/1/29 | (15) | | 600 | | 673 | |
| Stockton CA Unified School District GO | | 4.000% | | 8/1/30 | (4) | | 1,960 | | 2,051 | |
| Stockton CA Unified School District GO | | 5.000% | | 8/1/30 | (15) | | 1,555 | | 1,737 | |
| Stockton CA Unified School District GO | | 5.000% | | 8/1/31 | (15) | | 1,875 | | 2,087 | |
| Stockton CA Unified School District GO | | 5.000% | | 8/1/32 | (15) | | 2,060 | | 2,288 | |
| Stockton CA Unified School District GO | | 5.000% | | 8/1/33 | (15) | | 2,250 | | 2,493 | |
| Stockton CA Unified School District GO | | 5.000% | | 8/1/34 | (15) | | 2,105 | | 2,326 | |
| Suisun City CA Redevelopment Agency Successor Agency Tax Allocation Revenue | | 5.000% | | 10/1/23 | (15) | | 1,060 | | 1,195 | |
| Suisun City CA Redevelopment Agency Successor Agency Tax Allocation Revenue | | 5.000% | | 10/1/25 | (15) | | 1,000 | | 1,140 | |
| Suisun City CA Redevelopment Agency Successor Agency Tax Allocation Revenue | | 5.000% | | 10/1/26 | (15) | | 1,200 | | 1,364 | |
| Suisun City CA Redevelopment Agency Successor Agency Tax Allocation Revenue | | 5.000% | | 10/1/27 | (15) | | 1,360 | | 1,540 | |
| Suisun City CA Redevelopment Agency Successor Agency Tax Allocation Revenue | | 5.000% | | 10/1/28 | (15) | | 1,280 | | 1,444 | |
| Suisun City CA Redevelopment Agency Successor Agency Tax Allocation Revenue | | 5.000% | | 10/1/29 | (15) | | 2,255 | | 2,532 | |
| Suisun City CA Redevelopment Agency Successor Agency Tax Allocation Revenue | | 5.000% | | 10/1/30 | (15) | | 1,000 | | 1,119 | |
| Sweetwater CA Unified School District GO | | 5.000% | | 8/1/23 | (15) | | 1,090 | | 1,230 | |
| Sweetwater CA Unified School District GO | | 5.000% | | 8/1/24 | (15) | | 1,000 | | 1,149 | |
| Sweetwater CA Unified School District GO | | 5.000% | | 8/1/27 | (15) | | 7,000 | | 7,942 | |
| Sweetwater CA Unified School District GO | | 5.000% | | 8/1/28 | (15) | | 8,000 | | 9,050 | |
| Sweetwater CA Unified School District GO | | 5.000% | | 8/1/35 | | | 5,000 | | 5,580 | |
| Tahoe-Truckee CA Unified School District GO | | 5.000% | | 8/1/24 | | | 100 | | 116 | |
| Tahoe-Truckee CA Unified School District GO | | 5.000% | | 8/1/25 | | | 200 | | 237 | |
| Tahoe-Truckee CA Unified School District GO | | 5.000% | | 8/1/26 | | | 330 | | 396 | |
| Temecula CA Development Agency Successor Agency Tax Allocation Revenue | | 2.000% | | 12/15/18 | | | 500 | | 500 | |
| Temecula CA Development Agency Successor Agency Tax Allocation Revenue | | 4.000% | | 12/15/19 | | | 500 | | 510 | |
| Temecula CA Development Agency Successor Agency Tax Allocation Revenue | | 4.000% | | 12/15/20 | | | 750 | | 777 | |
| Temecula CA Development Agency Successor Agency Tax Allocation Revenue | | 4.000% | | 12/15/21 | | | 1,495 | | 1,567 | |
| Temecula CA Development Agency Successor Agency Tax Allocation Revenue | | 5.000% | | 12/15/22 | | | 800 | | 878 | |
| Temecula CA Development Agency Successor Agency Tax Allocation Revenue | | 5.000% | | 12/15/23 | | | 1,395 | | 1,552 | |
155
California Intermediate-Term Tax-Exempt Fund
| | | | | | | | Face | | Market | |
| | | | | Maturity | | | Amount | | Value· | |
| | | Coupon | | Date | | | ($000 | ) | ($000 | ) |
| Temecula CA Development Agency Successor Agency Tax Allocation Revenue | | 5.000% | | 12/15/24 | | | 1,720 | | 1,938 | |
| Temecula CA Development Agency Successor Agency Tax Allocation Revenue | | 5.000% | | 12/15/25 | | | 1,795 | | 2,040 | |
| Temecula CA Development Agency Successor Agency Tax Allocation Revenue | | 5.000% | | 12/15/26 | | | 1,000 | | 1,145 | |
| Temecula CA Development Agency Successor Agency Tax Allocation Revenue | | 5.000% | | 12/15/27 | | | 1,000 | | 1,150 | |
| Temecula CA Development Agency Successor Agency Tax Allocation Revenue | | 5.000% | | 12/15/28 | (4) | | 530 | | 618 | |
| Temecula CA Development Agency Successor Agency Tax Allocation Revenue | | 5.000% | | 12/15/29 | (4) | | 500 | | 580 | |
| Temecula CA Development Agency Successor Agency Tax Allocation Revenue | | 5.000% | | 12/15/30 | (4) | | 520 | | 599 | |
| Temecula CA Development Agency Successor Agency Tax Allocation Revenue | | 5.000% | | 12/15/31 | (4) | | 1,000 | | 1,146 | |
| Temecula CA Development Agency Successor Agency Tax Allocation Revenue | | 5.000% | | 12/15/32 | (4) | | 785 | | 897 | |
| Temecula CA Development Agency Successor Agency Tax Allocation Revenue | | 5.000% | | 12/15/33 | (4) | | 1,650 | | 1,875 | |
| Temecula CA Development Agency Successor Agency Tax Allocation Revenue | | 5.000% | | 12/15/34 | (4) | | 1,705 | | 1,929 | |
| Temecula CA Development Agency Successor Agency Tax Allocation Revenue | | 5.000% | | 12/15/35 | (4) | | 2,620 | | 2,939 | |
| Temecula CA Development Agency Successor Agency Tax Allocation Revenue | | 5.000% | | 12/15/36 | (4) | | 2,765 | | 3,089 | |
| Temecula CA Development Agency Successor Agency Tax Allocation Revenue | | 5.000% | | 12/15/37 | (4) | | 2,350 | | 2,619 | |
17 | Temecula Valley CA Unified School District GO | | 0.000% | | 8/1/32 | (15) | | 2,000 | | 2,035 | |
| Tracy CA Community Development Agency Successor Agency Tax Allocation Revenue | | 5.000% | | 8/1/19 | | | 250 | | 255 | |
| Tracy CA Community Development Agency Successor Agency Tax Allocation Revenue | | 5.000% | | 8/1/20 | | | 250 | | 263 | |
| Tracy CA Community Development Agency Successor Agency Tax Allocation Revenue | | 5.000% | | 8/1/21 | | | 900 | | 968 | |
| Tracy CA Community Development Agency Successor Agency Tax Allocation Revenue | | 5.000% | | 8/1/23 | (4) | | 400 | | 450 | |
| Tracy CA Community Development Agency Successor Agency Tax Allocation Revenue | | 5.000% | | 8/1/24 | (4) | | 400 | | 458 | |
| Tracy CA Community Development Agency Successor Agency Tax Allocation Revenue | | 5.000% | | 8/1/25 | (4) | | 960 | | 1,117 | |
| Turlock CA Irrigation District Revenue | | 5.000% | | 1/1/21 | | | 2,185 | | 2,259 | |
| Turlock CA Irrigation District Revenue | | 5.000% | | 1/1/22 | | | 3,310 | | 3,422 | |
| Turlock CA Irrigation District Revenue | | 5.000% | | 1/1/28 | | | 7,020 | | 7,433 | |
| Turlock CA Irrigation District Revenue | | 5.000% | | 1/1/29 | | | 6,400 | | 6,774 | |
| Turlock CA Irrigation District Revenue | | 5.000% | | 1/1/30 | | | 7,770 | | 8,216 | |
| Turlock CA Irrigation District Revenue | | 5.000% | | 1/1/37 | | | 5,615 | | 6,321 | |
| Tustin CA Unified School District Special Tax Revenue | | 5.000% | | 9/1/22 | | | 1,390 | | 1,526 | |
| Tustin CA Unified School District Special Tax Revenue | | 5.000% | | 9/1/23 | | | 750 | | 839 | |
| Tustin CA Unified School District Special Tax Revenue | | 5.000% | | 9/1/24 | | | 760 | | 860 | |
156
California Intermediate-Term Tax-Exempt Fund
| | | | | | | | Face | | Market | |
| | | | | Maturity | | | Amount | | Value· | |
| | | Coupon | | Date | | | ($000 | ) | ($000 | ) |
| Tustin CA Unified School District Special Tax Revenue | | 5.000% | | 9/1/25 | | | 2,820 | | 3,217 | |
| Tustin CA Unified School District Special Tax Revenue | | 5.000% | | 9/1/26 | | | 2,300 | | 2,595 | |
| Tustin CA Unified School District Special Tax Revenue | | 5.000% | | 9/1/27 | | | 3,915 | | 4,372 | |
| Tustin CA Unified School District Special Tax Revenue | | 5.000% | | 9/1/29 | | | 3,640 | | 4,020 | |
| Tustin CA Unified School District Special Tax Revenue | | 5.000% | | 9/1/30 | | | 3,500 | | 3,852 | |
| Twin Rivers CA Unified School District GO | | 5.000% | | 8/1/19 | | | 1,645 | | 1,681 | |
| Twin Rivers CA Unified School District GO | | 5.000% | | 8/1/19 | | | 600 | | 613 | |
| Twin Rivers CA Unified School District GO | | 5.000% | | 8/1/20 | (4) | | 475 | | 500 | |
| Twin Rivers CA Unified School District GO | | 5.000% | | 8/1/20 | (4) | | 750 | | 789 | |
| Twin Rivers CA Unified School District GO | | 5.000% | | 8/1/21 | (4) | | 550 | | 593 | |
| Twin Rivers CA Unified School District GO | | 5.000% | | 8/1/21 | (4) | | 850 | | 917 | |
| Twin Rivers CA Unified School District GO | | 5.000% | | 8/1/22 | (4) | | 515 | | 569 | |
| Twin Rivers CA Unified School District GO | | 5.000% | | 8/1/22 | (4) | | 625 | | 690 | |
| Ukiah CA Unified School District GO | | 0.000% | | 8/1/25 | (14) | | 3,175 | | 2,651 | |
| Union CA Elementary School District GO | | 0.000% | | 9/1/29 | (14) | | 1,335 | | 960 | |
| Union City CA Community Redevelopment Agency Successor Agency Tax Allocation Revenue | | 5.000% | | 10/1/31 | | | 1,820 | | 2,077 | |
| Union City CA Community Redevelopment Agency Successor Agency Tax Allocation Revenue | | 5.000% | | 10/1/32 | | | 1,360 | | 1,546 | |
| Union City CA Community Redevelopment Agency Successor Agency Tax Allocation Revenue | | 5.000% | | 10/1/33 | | | 3,000 | | 3,395 | |
| Union City CA Community Redevelopment Agency Successor Agency Tax Allocation Revenue | | 5.000% | | 10/1/35 | | | 1,250 | | 1,403 | |
| Union City CA Community Redevelopment Agency Successor Agency Tax Allocation Revenue | | 5.000% | | 10/1/36 | | | 1,000 | | 1,118 | |
| University of California Regents Medical Center Pooled Revenue | | 5.000% | | 5/15/23 | (Prere.) | | 14,940 | | 16,899 | |
| University of California Regents Medical Center Pooled Revenue | | 5.000% | | 5/15/23 | (Prere.) | | 5,000 | | 5,656 | |
| University of California Regents Medical Center Pooled Revenue | | 5.000% | | 5/15/24 | | | 6,010 | | 6,949 | |
| University of California Regents Medical Center Pooled Revenue | | 4.000% | | 5/15/25 | | | 10,000 | | 11,194 | |
| University of California Regents Medical Center Pooled Revenue | | 4.000% | | 5/15/26 | | | 10,015 | | 11,303 | |
| University of California Regents Medical Center Pooled Revenue | | 5.000% | | 5/15/29 | | | 5,015 | | 5,822 | |
| University of California Regents Medical Center Pooled Revenue | | 5.000% | | 5/15/30 | | | 3,000 | | 3,457 | |
| University of California Regents Medical Center Pooled Revenue | | 5.000% | | 5/15/32 | | | 8,440 | | 9,629 | |
| University of California Regents Medical Center Pooled Revenue | | 5.000% | | 5/15/33 | | | 12,105 | | 13,725 | |
157
California Intermediate-Term Tax-Exempt Fund
| | | | | | | | Face | | Market | |
| | | | | Maturity | | | Amount | | Value· | |
| | | Coupon | | Date | | | ($000 | ) | ($000 | ) |
| University of California Regents Medical Center Pooled Revenue | | 5.000% | | 5/15/34 | | | 14,000 | | 15,770 | |
| University of California Regents Medical Center Pooled Revenue | | 5.000% | | 5/15/35 | | | 5,000 | | 5,597 | |
| University of California Regents Medical Center Pooled Revenue | | 4.500% | | 5/15/36 | | | 10,000 | | 10,656 | |
| University of California Revenue | | 5.750% | | 5/15/19 | (Prere.) | | 3,000 | | 3,056 | |
| University of California Revenue | | 5.000% | | 5/15/20 | | | 4,470 | | 4,686 | |
| University of California Revenue | | 5.000% | | 5/15/20 | | | 8,275 | | 8,671 | |
| University of California Revenue | | 5.000% | | 5/15/21 | (Prere.) | | 4,675 | | 5,026 | |
| University of California Revenue | | 5.000% | | 5/15/21 | (Prere.) | | 5,005 | | 5,380 | |
| University of California Revenue | | 5.000% | | 5/15/21 | | | 3,270 | | 3,528 | |
| University of California Revenue | | 5.000% | | 5/15/22 | | | 3,850 | | 4,143 | |
| University of California Revenue | | 5.000% | | 5/15/22 | (Prere.) | | 6,540 | | 7,225 | |
| University of California Revenue | | 5.000% | | 5/15/23 | | | 2,010 | | 2,278 | |
| University of California Revenue | | 5.000% | | 5/15/23 | (Prere.) | | 650 | | 737 | |
| University of California Revenue | | 5.000% | | 5/15/23 | (Prere.) | | 4,695 | | 5,321 | |
| University of California Revenue | | 5.000% | | 5/15/25 | | | 2,670 | | 3,155 | |
| University of California Revenue | | 5.000% | | 5/15/25 | | | 9,190 | | 10,822 | |
| University of California Revenue | | 4.000% | | 5/15/27 | | | 9,060 | | 10,142 | |
| University of California Revenue | | 4.000% | | 5/15/27 | | | 3,820 | | 4,270 | |
| University of California Revenue | | 5.000% | | 5/15/27 | | | 7,075 | | 8,271 | |
| University of California Revenue | | 5.000% | | 5/15/27 | | | 6,225 | | 6,674 | |
| University of California Revenue | | 4.000% | | 5/15/28 | | | 9,020 | | 10,050 | |
| University of California Revenue | | 4.000% | | 5/15/28 | | | 7,110 | | 7,890 | |
| University of California Revenue | | 5.000% | | 5/15/28 | | | 9,265 | | 10,764 | |
| University of California Revenue | | 5.000% | | 5/15/28 | | | 6,675 | | 7,146 | |
| University of California Revenue | | 5.000% | | 5/15/28 | | | 7,080 | | 8,216 | |
| University of California Revenue | | 4.000% | | 5/15/29 | | | 13,390 | | 14,719 | |
| University of California Revenue | | 4.000% | | 5/15/29 | | | 5,485 | | 6,005 | |
| University of California Revenue | | 5.000% | | 5/15/29 | | | 2,060 | | 2,484 | |
| University of California Revenue | | 4.000% | | 5/15/30 | | | 7,500 | | 8,116 | |
| University of California Revenue | | 4.000% | | 5/15/30 | | | 7,705 | | 8,324 | |
| University of California Revenue | | 5.000% | | 5/15/30 | | | 1,095 | | 1,275 | |
| University of California Revenue | | 5.000% | | 5/15/30 | | | 5,215 | | 6,221 | |
| University of California Revenue | | 5.000% | | 5/15/30 | | | 750 | | 836 | |
| University of California Revenue | | 4.000% | | 5/15/31 | | | 5,270 | | 5,619 | |
| University of California Revenue | | 5.000% | | 5/15/31 | | | 15,015 | | 17,568 | |
| University of California Revenue | | 5.000% | | 5/15/31 | | | 2,315 | | 2,646 | |
| University of California Revenue | | 5.000% | | 5/15/32 | | | 3,250 | | 3,839 | |
| University of California Revenue | | 5.000% | | 5/15/32 | | | 8,460 | | 9,719 | |
| University of California Revenue | | 5.000% | | 5/15/32 | | | 7,490 | | 8,135 | |
| University of California Revenue | | 5.250% | | 5/15/32 | | | 5,000 | | 5,718 | |
| University of California Revenue | | 4.000% | | 5/15/33 | | | 12,715 | | 13,393 | |
| University of California Revenue | | 5.000% | | 5/15/33 | | | 6,995 | | 7,978 | |
| University of California Revenue | | 5.000% | | 5/15/33 | | | 5,910 | | 6,944 | |
| University of California Revenue | | 5.000% | | 5/15/33 | | | 15,470 | | 17,108 | |
| University of California Revenue | | 5.000% | | 5/15/33 | | | 5,000 | | 5,720 | |
| University of California Revenue | | 5.000% | | 5/15/33 | | | 12,000 | | 13,855 | |
| University of California Revenue | | 5.000% | | 5/15/33 | | | 5,415 | | 5,988 | |
| University of California Revenue | | 4.000% | | 5/15/34 | | | 10,610 | | 11,093 | |
| University of California Revenue | | 4.000% | | 5/15/34 | | | 10,000 | | 10,424 | |
| University of California Revenue | | 5.000% | | 5/15/34 | | | 1,500 | | 1,751 | |
| University of California Revenue | | 5.000% | | 5/15/34 | | | 15,900 | | 17,534 | |
158
California Intermediate-Term Tax-Exempt Fund
| | | | | | | | Face | | Market | |
| | | | | Maturity | | | Amount | | Value· | |
| | | Coupon | | Date | | | ($000 | ) | ($000 | ) |
| University of California Revenue | | 5.000% | | 5/15/34 | | | 3,915 | | 4,458 | |
| University of California Revenue | | 5.000% | | 5/15/34 | | | 6,395 | | 7,381 | |
| University of California Revenue | | 5.000% | | 5/15/34 | | | 12,800 | | 14,712 | |
| University of California Revenue | | 4.000% | | 5/15/35 | | | 5,790 | | 6,028 | |
| University of California Revenue | | 5.000% | | 5/15/35 | | | 4,000 | | 4,645 | |
| University of California Revenue | | 5.000% | | 5/15/35 | | | 1,910 | | 2,168 | |
| University of California Revenue | | 5.000% | | 5/15/35 | | | 11,290 | | 12,932 | |
| University of California Revenue | | 5.000% | | 5/15/35 | | | 5,100 | | 5,862 | |
| University of California Revenue | | 5.000% | | 5/15/36 | | | 20,280 | | 23,201 | |
| University of California Revenue | | 5.000% | | 5/15/36 | | | 5,425 | | 6,124 | |
| University of California Revenue | | 5.000% | | 5/15/36 | | | 15,750 | | 17,931 | |
| University of California Revenue | | 5.000% | | 5/15/36 | | | 1,775 | | 2,047 | |
| University of California Revenue | | 5.000% | | 5/15/37 | | | 9,500 | | 10,838 | |
| University of California Revenue | | 5.000% | | 5/15/37 | | | 14,585 | | 16,785 | |
| University of California Revenue | | 5.000% | | 5/15/37 | | | 11,710 | | 13,360 | |
| University of California Revenue | | 5.000% | | 5/15/37 | | | 4,905 | | 5,628 | |
| University of California Revenue | | 5.000% | | 5/15/38 | | | 22,075 | | 25,334 | |
| University of California Revenue | | 5.000% | | 5/15/38 | | | 5,000 | | 5,721 | |
| University of California Revenue PUT | | 1.400% | | 5/15/21 | | | 4,800 | | 4,717 | |
| University of California Revenue PUT | | 5.000% | | 5/15/23 | | | 52,095 | | 58,569 | |
| University of California Revenue VRDO | | 1.470% | | 12/3/18 | | | 1,300 | | 1,300 | |
| Upland CA Community Facilities District No. 2003-2 Improvement Area No. 1 Special Tax Revenue | | 5.000% | | 9/1/31 | | | 1,110 | | 1,186 | |
| Upland CA COP (San Antonio Regional Hospital) | | 5.000% | | 1/1/22 | | | 500 | | 534 | |
| Upland CA COP (San Antonio Regional Hospital) | | 5.000% | | 1/1/23 | | | 900 | | 974 | |
| Upland CA COP (San Antonio Regional Hospital) | | 5.000% | | 1/1/25 | | | 1,030 | | 1,145 | |
| Upland CA COP (San Antonio Regional Hospital) | | 5.000% | | 1/1/27 | | | 1,485 | | 1,677 | |
| Upland CA COP (San Antonio Regional Hospital) | | 5.000% | | 1/1/28 | | | 1,530 | | 1,738 | |
| Upland CA COP (San Antonio Regional Hospital) | | 5.000% | | 1/1/30 | | | 1,450 | | 1,632 | |
| Upland CA COP (San Antonio Regional Hospital) | | 5.000% | | 1/1/31 | | | 1,390 | | 1,552 | |
| Upland CA COP (San Antonio Regional Hospital) | | 5.000% | | 1/1/33 | | | 1,710 | | 1,892 | |
| Upland CA COP (San Antonio Regional Hospital) | | 5.000% | | 1/1/34 | | | 1,500 | | 1,646 | |
| Upland CA COP (San Antonio Regional Hospital) | | 4.000% | | 1/1/35 | | | 2,025 | | 2,041 | |
| Upland CA COP (San Antonio Regional Hospital) | | 4.000% | | 1/1/36 | | | 1,000 | | 1,003 | |
| Vacaville CA Redevelopment Agency Tax Allocation Revenue | | 5.000% | | 9/1/22 | | | 600 | | 662 | |
| Vacaville CA Redevelopment Agency Tax Allocation Revenue | | 5.000% | | 9/1/23 | | | 865 | | 974 | |
| Vacaville CA Redevelopment Agency Tax Allocation Revenue | | 5.000% | | 9/1/24 | | | 1,325 | | 1,519 | |
| Vacaville CA Redevelopment Agency Tax Allocation Revenue | | 5.000% | | 9/1/25 | | | 1,390 | | 1,568 | |
159
California Intermediate-Term Tax-Exempt Fund
| | | | | | | | Face | | Market | |
| | | | | Maturity | | | Amount | | Value· | |
| | | Coupon | | Date | | | ($000 | ) | ($000 | ) |
| Vacaville CA Redevelopment Agency Tax Allocation Revenue | | 5.000% | | 9/1/26 | | | 1,460 | | 1,643 | |
| Vacaville CA Redevelopment Agency Tax Allocation Revenue | | 5.000% | | 9/1/27 | | | 1,200 | | 1,349 | |
| Vacaville CA Redevelopment Agency Tax Allocation Revenue | | 5.000% | | 9/1/28 | | | 1,200 | | 1,346 | |
5 | Val Verde CA Unified School District CP | | 5.000% | | 3/1/25 | (4) | | 250 | | 290 | |
5 | Val Verde CA Unified School District CP | | 5.000% | | 3/1/26 | (4) | | 260 | | 305 | |
5 | Val Verde CA Unified School District CP | | 5.000% | | 3/1/27 | (4) | | 275 | | 326 | |
5 | Val Verde CA Unified School District CP | | 5.000% | | 3/1/28 | (4) | | 280 | | 335 | |
5 | Val Verde CA Unified School District CP | | 5.000% | | 3/1/29 | (4) | | 450 | | 533 | |
5 | Val Verde CA Unified School District CP | | 5.000% | | 3/1/30 | (4) | | 850 | | 996 | |
5 | Val Verde CA Unified School District CP | | 5.000% | | 3/1/31 | (4) | | 1,015 | | 1,179 | |
| Ventura County CA Community College District GO | | 5.000% | | 8/1/25 | | | 1,915 | | 2,063 | |
| Ventura County CA Community College District GO | | 5.000% | | 8/1/27 | | | 2,205 | | 2,368 | |
| Ventura County CA Community College District GO | | 0.000% | | 8/1/28 | | | 15,000 | | 11,166 | |
| Ventura County CA Public Financing Authority Lease Revenue | | 5.000% | | 11/1/24 | | | 1,200 | | 1,332 | |
| Ventura County CA Public Financing Authority Lease Revenue | | 5.000% | | 11/1/29 | | | 1,000 | | 1,103 | |
| Ventura County CA Public Financing Authority Lease Revenue | | 5.000% | | 11/1/32 | | | 2,000 | | 2,201 | |
| Ventura County CA Public Financing Authority Lease Revenue | | 5.000% | | 11/1/33 | | | 1,250 | | 1,375 | |
| Vista CA Joint Powers Financing Authority Revenue | | 5.000% | | 5/1/20 | | | 500 | | 523 | |
| Vista CA Joint Powers Financing Authority Revenue | | 5.000% | | 5/1/21 | | | 325 | | 349 | |
| Vista CA Joint Powers Financing Authority Revenue | | 5.000% | | 5/1/22 | | | 400 | | 441 | |
| Vista CA Joint Powers Financing Authority Revenue | | 5.250% | | 5/1/35 | | | 5,990 | | 6,848 | |
| Vista CA Redevelopment Agency Successor Agency Tax Allocation Revenue | | 5.000% | | 9/1/19 | (4) | | 300 | | 307 | |
| Vista CA Redevelopment Agency Successor Agency Tax Allocation Revenue | | 5.000% | | 9/1/20 | (4) | | 275 | | 290 | |
| Vista CA Redevelopment Agency Successor Agency Tax Allocation Revenue | | 5.000% | | 9/1/21 | (4) | | 265 | | 286 | |
| Vista CA Redevelopment Agency Successor Agency Tax Allocation Revenue | | 5.000% | | 9/1/22 | (4) | | 335 | | 369 | |
| Vista CA Redevelopment Agency Successor Agency Tax Allocation Revenue | | 5.000% | | 9/1/23 | (4) | | 400 | | 450 | |
| Vista CA Redevelopment Agency Successor Agency Tax Allocation Revenue | | 5.000% | | 9/1/24 | (4) | | 585 | | 669 | |
| Vista CA Unified School District GO | | 5.000% | | 8/1/24 | | | 5,000 | | 5,524 | |
| Walnut CA Energy Center Authority Revenue | | 5.000% | | 1/1/30 | | | 2,000 | | 2,065 | |
| Walnut Valley CA Unified School District GO | | 5.000% | | 8/1/23 | | | 250 | | 284 | |
| Walnut Valley CA Unified School District GO | | 5.000% | | 8/1/24 | | | 350 | | 406 | |
| Washington Township CA Health Care District GO | | 5.000% | | 8/1/23 | | | 170 | | 192 | |
160
California Intermediate-Term Tax-Exempt Fund
| | | | | | | | Face | | Market | |
| | | | | Maturity | | | Amount | | Value· | |
| | | Coupon | | Date | | | ($000 | ) | ($000 | ) |
| Washington Township CA Health Care District GO | | 4.000% | | 8/1/24 | | | 625 | | 687 | |
| Washington Township CA Health Care District GO | | 5.000% | | 8/1/25 | | | 1,425 | | 1,672 | |
| Washington Township CA Health Care District GO | | 5.000% | | 8/1/26 | | | 1,395 | | 1,659 | |
| Washington Township CA Health Care District Revenue | | 4.000% | | 7/1/19 | | | 445 | | 449 | |
| Washington Township CA Health Care District Revenue | | 5.000% | | 7/1/19 | | | 500 | | 507 | |
| Washington Township CA Health Care District Revenue | | 4.000% | | 7/1/20 | | | 375 | | 384 | |
| Washington Township CA Health Care District Revenue | | 5.000% | | 7/1/20 | | | 465 | | 483 | |
| Washington Township CA Health Care District Revenue | | 5.000% | | 7/1/21 | | | 350 | | 372 | |
| Washington Township CA Health Care District Revenue | | 4.000% | | 7/1/22 | | | 540 | | 565 | |
| Washington Township CA Health Care District Revenue | | 5.000% | | 7/1/22 | | | 725 | | 784 | |
| Washington Township CA Health Care District Revenue | | 5.000% | | 7/1/23 | | | 570 | | 624 | |
| Washington Township CA Health Care District Revenue | | 5.000% | | 7/1/23 | | | 400 | | 438 | |
| Washington Township CA Health Care District Revenue | | 5.000% | | 7/1/24 | | | 610 | | 676 | |
| Washington Township CA Health Care District Revenue | | 5.000% | | 7/1/24 | | | 750 | | 831 | |
| Washington Township CA Health Care District Revenue | | 4.000% | | 7/1/25 | | | 650 | | 689 | |
| Washington Township CA Health Care District Revenue | | 5.000% | | 7/1/25 | | | 775 | | 868 | |
| Washington Township CA Health Care District Revenue | | 5.000% | | 7/1/26 | | | 785 | | 883 | |
| Washington Township CA Health Care District Revenue | | 5.000% | | 7/1/26 | | | 1,270 | | 1,428 | |
| Washington Township CA Health Care District Revenue | | 5.000% | | 7/1/26 | | | 900 | | 1,003 | |
| Washington Township CA Health Care District Revenue | | 5.000% | | 7/1/27 | | | 930 | | 1,045 | |
| Washington Township CA Health Care District Revenue | | 5.000% | | 7/1/27 | | | 430 | | 483 | |
| Washington Township CA Health Care District Revenue | | 5.000% | | 7/1/29 | | | 665 | | 743 | |
| Washington Township CA Health Care District Revenue | | 5.000% | | 7/1/29 | | | 1,005 | | 1,123 | |
| Washington Township CA Health Care District Revenue | | 6.000% | | 7/1/29 | | | 1,000 | | 1,018 | |
| Washington Township CA Health Care District Revenue | | 5.000% | | 7/1/30 | | | 1,540 | | 1,713 | |
| Washington Township CA Health Care District Revenue | | 4.000% | | 7/1/32 | | | 1,000 | | 1,007 | |
| Washington Township CA Health Care District Revenue | | 5.000% | | 7/1/32 | | | 2,340 | | 2,585 | |
161
California Intermediate-Term Tax-Exempt Fund
| | | | | | | | Face | | Market | |
| | | | | Maturity | | | Amount | | Value· | |
| | | Coupon | | Date | | | ($000 | ) | ($000 | ) |
| Washington Township CA Health Care District Revenue | | 5.000% | | 7/1/33 | | | 2,975 | | 3,273 | |
| Washington Township CA Health Care District Revenue | | 4.000% | | 7/1/34 | | | 2,970 | | 2,962 | |
| Washington Township CA Health Care District Revenue | | 4.000% | | 7/1/36 | | | 1,935 | | 1,937 | |
| West Basin CA Municipal Water District Revenue | | 5.000% | | 8/1/22 | | | 2,010 | | 2,235 | |
| West Contra Costa CA Unified School District GO | | 5.000% | | 8/1/20 | | | 250 | | 264 | |
| West Contra Costa CA Unified School District GO | | 6.000% | | 8/1/26 | | | 5,000 | | 6,320 | |
| West Contra Costa CA Unified School District GO | | 0.000% | | 8/1/28 | (14) | | 6,400 | | 4,737 | |
| West Contra Costa CA Unified School District GO | | 0.000% | | 8/1/30 | (14) | | 6,235 | | 4,194 | |
| West Contra Costa CA Unified School District GO | | 5.000% | | 8/1/30 | | | 3,425 | | 3,884 | |
| West Contra Costa CA Unified School District GO | | 5.000% | | 8/1/31 | | | 5,690 | | 6,446 | |
| West Contra Costa CA Unified School District GO | | 5.000% | | 8/1/32 | | | 1,825 | | 2,098 | |
| West Contra Costa CA Unified School District GO | | 5.000% | | 8/1/32 | | | 5,560 | | 6,289 | |
| West Contra Costa CA Unified School District GO | | 0.000% | | 8/1/33 | (12) | | 2,650 | | 1,526 | |
| West Contra Costa CA Unified School District GO | | 5.000% | | 8/1/33 | | | 915 | | 1,049 | |
| West Contra Costa CA Unified School District GO | | 5.000% | | 8/1/33 | | | 1,020 | | 1,169 | |
| West Contra Costa CA Unified School District GO | | 5.000% | | 8/1/33 | | | 3,265 | | 3,686 | |
| West Contra Costa CA Unified School District GO | | 5.000% | | 8/1/34 | | | 2,010 | | 2,299 | |
| West Contra Costa CA Unified School District GO | | 5.000% | | 8/1/34 | | | 1,070 | | 1,224 | |
| West Contra Costa CA Unified School District GO | | 5.000% | | 8/1/35 | | | 1,400 | | 1,597 | |
| West Contra Costa CA Unified School District GO | | 5.000% | | 8/1/35 | | | 1,000 | | 1,141 | |
| Western CA Municipal Water District Revenue PUT | | 1.500% | | 10/1/20 | | | 2,350 | | 2,330 | |
| Western Placer CA Unified School District COP | | 3.000% | | 8/1/21 | (4) | | 500 | | 512 | |
| Western Placer CA Unified School District COP | | 3.000% | | 8/1/23 | (4) | | 600 | | 621 | |
| Western Placer CA Unified School District GO | | 5.000% | | 8/1/28 | | | 200 | | 235 | |
| Western Placer CA Unified School District GO | | 5.000% | | 8/1/29 | | | 200 | | 233 | |
| Western Placer CA Unified School District GO | | 5.000% | | 8/1/30 | | | 380 | | 439 | |
| Western Placer CA Unified School District GO | | 4.000% | | 8/1/31 | (15) | | 755 | | 807 | |
| Western Placer CA Unified School District GO | | 4.000% | | 8/1/31 | (15) | | 885 | | 946 | |
| Western Placer CA Unified School District GO | | 5.000% | | 8/1/31 | | | 565 | | 649 | |
| Western Placer CA Unified School District GO | | 4.000% | | 8/1/32 | (15) | | 920 | | 976 | |
| Western Placer CA Unified School District GO | | 4.000% | | 8/1/34 | (15) | | 545 | | 569 | |
162
California Intermediate-Term Tax-Exempt Fund
| | | | | | | | Face | | Market | |
| | | | | Maturity | | | Amount | | Value· | |
| | | Coupon | | Date | | | ($000 | ) | ($000 | ) |
| Western Placer CA Unified School District GO | | 4.000% | | 8/1/34 | (15) | | 990 | | 1,034 | |
| Western Placer CA Unified School District GO | | 4.000% | | 8/1/35 | (15) | | 630 | | 652 | |
| Western Placer CA Unified School District GO | | 4.000% | | 8/1/35 | (15) | | 1,025 | | 1,060 | |
| Western Placer CA Unified School District GO | | 4.000% | | 8/1/36 | (15) | | 1,070 | | 1,098 | |
| Westlands CA Water District Revenue | | 5.000% | | 9/1/21 | (4) | | 750 | | 809 | |
| Westlands CA Water District Revenue | | 5.000% | | 9/1/22 | (4) | | 765 | | 844 | |
| Westlands CA Water District Revenue | | 5.000% | | 9/1/24 | (4) | | 1,000 | | 1,100 | |
| Westlands CA Water District Revenue | | 5.000% | | 9/1/25 | (4) | | 1,250 | | 1,368 | |
| William S. Hart Union High School District California GO | | 5.000% | | 9/1/25 | | | 1,835 | | 2,025 | |
| William S. Hart Union High School District California GO | | 5.000% | | 9/1/26 | | | 1,085 | | 1,195 | |
| William S. Hart Union High School District California GO | | 5.000% | | 9/1/27 | | | 1,585 | | 1,742 | |
| William S. Hart Union High School District California GO | | 0.000% | | 8/1/34 | (4) | | 3,880 | | 2,149 | |
| Yucaipa Valley CA Water District Water System Revenue | | 5.000% | | 9/1/19 | | | 1,020 | | 1,045 | |
| | | | | | | | | | 13,275,786 | |
Guam (0.2%) | | | | | | | | | | |
| Guam Government Business Privilege Tax Revenue | | 5.000% | | 11/15/20 | | | 750 | | 786 | |
| Guam Government Business Privilege Tax Revenue | | 5.000% | | 11/15/21 | | | 1,125 | | 1,200 | |
| Guam Government Business Privilege Tax Revenue | | 5.000% | | 11/15/22 | | | 1,500 | | 1,627 | |
| Guam Government Waterworks Authority Water & Waste Water System Revenue | | 5.000% | | 7/1/20 | | | 540 | | 558 | |
| Guam Government Waterworks Authority Water & Waste Water System Revenue | | 5.000% | | 7/1/21 | | | 400 | | 421 | |
| Guam Government Waterworks Authority Water & Waste Water System Revenue | | 5.000% | | 7/1/22 | | | 500 | | 535 | |
| Guam Government Waterworks Authority Water & Waste Water System Revenue | | 5.000% | | 7/1/28 | | | 2,115 | | 2,233 | |
| Guam Government Waterworks Authority Water & Waste Water System Revenue | | 5.000% | | 7/1/29 | | | 5,035 | | 5,350 | |
| Guam Government Waterworks Authority Water & Waste Water System Revenue | | 5.250% | | 7/1/33 | | | 4,000 | | 4,216 | |
| Guam Government Waterworks Authority Water & Waste Water System Revenue | | 5.000% | | 7/1/35 | | | 4,450 | | 4,643 | |
| Guam Government Waterworks Authority Water & Waste Water System Revenue | | 5.000% | | 7/1/36 | | | 1,450 | | 1,528 | |
| Guam Power Authority Revenue | | 5.000% | | 10/1/22 | | | 1,605 | | 1,714 | |
| Guam Power Authority Revenue | | 5.000% | | 10/1/26 | | | 1,810 | | 1,961 | |
| Guam Power Authority Revenue | | 5.000% | | 10/1/30 | | | 1,470 | | 1,565 | |
| | | | | | | | | | 28,337 | |
Total Tax-Exempt Municipal Bonds (Cost $13,159,899) | | | | | | | 13,304,123 | |
163
California Intermediate-Term Tax-Exempt Fund
| | Amount | |
| | ($000 | ) |
Other Assets and Liabilities (0.8%) | | | |
Other Assets | | | |
Investment in Vanguard | | 732 | |
Receivables for Investment Securities Sold | | 6,946 | |
Receivables for Accrued Income | | 141,239 | |
Receivables for Capital Shares Issued | | 26,226 | |
Variation Margin Receivable—Futures Contracts | | 79 | |
Other Assets | | 330 | |
Total Other Assets | | 175,552 | |
Liabilities | | | |
Payables for Investment Securities Purchased | | (36,716 | ) |
Payables for Capital Shares Redeemed | | (22,632 | ) |
Payables for Distributions | | (7,016 | ) |
Payables to Vanguard | | (5,310 | ) |
Variation Margin Payable—Futures Contracts | | (440 | ) |
Total Liabilities | | (72,114 | ) |
Net Assets (100%) | | 13,407,561 | |
164
California Intermediate-Term Tax-Exempt Fund
At November 30, 2018, net assets consisted of:
| | Amount | |
| | ($000 | ) |
Paid-in Capital | | 13,296,398 | |
Total Distributable Earnings (Loss) | | 111,163 | |
Net Assets | | 13,407,561 | |
| | | |
Investor Shares—Net Assets | | | |
Applicable to 131,468,135 outstanding $.001 par value shares of beneficial interest (unlimited authorization) | | 1,513,668 | |
Net Asset Value Per Share—Investor Shares | | $11.51 | |
| | | |
Admiral Shares—Net Assets | | | |
Applicable to 1,033,031,770 outstanding $.001 par value shares of beneficial interest (unlimited authorization) | | 11,893,893 | |
Net Asset Value Per Share—Admiral Shares | | $11.51 | |
· See Note A in Notes to Financial Statements.
1 Security exempt from registration under Rule 144A of the Securities Act of 1933. Such securities may be sold in transactions exempt from registration, normally to qualified institutional buyers. At November 30, 2018, the aggregate value of these securities was $89,900,000, representing 0.7% of net assets.
2 Adjustable-rate security based upon SIFMA Municipal Swap Index Yield plus spread.
3 4.500% coupon rate will be effective August 2023.
4 Securities with a value of $2,075,000 have been segregated as initial margin for open futures contracts.
5 Security purchased on a when-issued or delayed-delivery basis for which the fund has not taken delivery as of November 30, 2018.
6 5.000% coupon rate will be effective February 2023.
7 5.700% coupon rate will be effective January 2024.
8 5.800% coupon rate will be effective January 2024.
9 5.900% coupon rate will be effective January 2024.
10 5.300% coupon rate will be effective January 2024.
11 5.500% coupon rate will be effective January 2024.
12 5.875% coupon rate will be effective August 2023.
13 4.000% coupon rate will be effective February 2021.
14 7.000% coupon rate will be effective August 2019.
15 5.000% coupon rate will be effective October 2021.
16 4.000% coupon rate will be effective August 2023.
17 4.300% coupon rate will be effective August 2019.
A key to abbreviations and other references follows the Statement of Net Assets.
See accompanying Notes, which are an integral part of the Financial Statements.
165
California Intermediate-Term Tax-Exempt Fund
Key to Abbreviations
ARS—Auction Rate Security.
BAN—Bond Anticipation Note.
COP—Certificate of Participation.
CP—Commercial Paper.
FR—Floating Rate.
GAN—Grant Anticipation Note.
GO—General Obligation Bond.
PILOT—Payments in Lieu of Taxes.
PUT—Put Option Obligation.
RAN—Revenue Anticipation Note.
TAN—Tax Anticipation Note.
TOB—Tender Option Bond.
TRAN—Tax Revenue Anticipation Note.
VRDO—Variable Rate Demand Obligation.
VRDP—Variable Rate Demand Preferred.
(ETM)—Escrowed to Maturity.
(Prere.)—Prerefunded.
Scheduled principal and interest payments are guaranteed by:
(1) MBIA (Municipal Bond Investors Assurance).
(2) AMBAC (Ambac Assurance Corporation).
(3) FGIC (Financial Guaranty Insurance Company).
(4) AGM (Assured Guaranty Municipal Corporation).
(5) BIGI (Bond Investors Guaranty Insurance).
(6) Connie Lee Inc.
(7) FHA (Federal Housing Authority).
(8) CapMAC (Capital Markets Assurance Corporation).
(9) American Capital Access Financial Guaranty Corporation.
(10) XL Capital Assurance Inc.
(11) CIFG (CDC IXIS Financial Guaranty).
(12) AGC (Assured Guaranty Corporation).
(13) BHAC (Berkshire Hathaway Assurance Corporation).
(14) NPFG (National Public Finance Guarantee Corporation).
(15) BAM (Build America Mutual Assurance Company).
(16) MAC (Municipal Assurance Corporation).
(17) RAA (Radian Asset Assurance Inc.).
(18) SBLF (Michigan School Bond Loan Fund).
(19) TPSF (Texas Permanent School Fund).
The insurance does not guarantee the market value of the municipal bonds.
LOC — Scheduled principal and interest payments are guaranteed by bank letter of credit.
166
California Intermediate-Term Tax-Exempt Fund
Derivative Financial Instruments Outstanding as of Period End
Futures Contracts
| | | | | | | | ($000 | ) |
| | | | | | | | Value and | |
| | | | Number of | | | | Unrealized | |
| | | | Long (Short | ) | Notional | | Appreciation | |
| | Expiration | | Contracts | | Amount | | (Depreciation | ) |
Long Futures Contracts | | | | | | | | | |
2-Year U.S. Treasury Note | | March 2019 | | 1,867 | | 393,908 | | 241 | |
5-Year U.S. Treasury Note | | March 2019 | | 1,540 | | 173,960 | | 246 | |
| | | | | | | | 487 | |
| | | | | | | | | |
Short Futures Contracts | | | | | | | | | |
30-Year U.S. Treasury Bond | | March 2019 | | (682 | ) | (95,416 | ) | (241 | ) |
Ultra 10-Year U.S. Treasury Note | | March 2019 | | (491 | ) | (62,112 | ) | (107 | ) |
10-Year U.S. Treasury Note | | March 2019 | | (384 | ) | (45,870 | ) | (56 | ) |
| | | | | | | | (404 | ) |
| | | | | | | | 83 | |
See accompanying Notes, which are an integral part of the Financial Statements.
167
California Intermediate-Term Tax-Exempt Fund
Statement of Operations
| | Year Ended | |
| | November 30, 2018 | |
| | ($000 | ) |
Investment Income | | | |
Income | | | |
Interest | | 378,023 | |
Total Income | | 378,023 | |
Expenses | | | |
The Vanguard Group—Note B | | | |
Investment Advisory Services | | 1,718 | |
Management and Administrative—Investor Shares | | 2,122 | |
Management and Administrative—Admiral Shares | | 8,164 | |
Marketing and Distribution—Investor Shares | | 336 | |
Marketing and Distribution—Admiral Shares | | 867 | |
Custodian Fees | | 79 | |
Auditing Fees | | 35 | |
Shareholders’ Reports and Proxy—Investor Shares | | 30 | |
Shareholders’ Reports and Proxy—Admiral Shares | | 62 | |
Trustees’ Fees and Expenses | | 8 | |
Total Expenses | | 13,421 | |
Net Investment Income | | 364,602 | |
Realized Net Gain (Loss) | | | |
Investment Securities Sold | | (13,297 | ) |
Futures Contracts | | (3,186 | ) |
Realized Net Gain (Loss) | | (16,483 | ) |
Change in Unrealized Appreciation (Depreciation) | | | |
Investment Securities | | (211,703 | ) |
Futures Contracts | | 1,641 | |
Change in Unrealized Appreciation (Depreciation) | | (210,062 | ) |
Net Increase (Decrease) in Net Assets Resulting from Operations | | 138,057 | |
See accompanying Notes, which are an integral part of the Financial Statements.
168
California Intermediate-Term Tax-Exempt Fund
Statement of Changes in Net Assets
| | Year Ended November 30, | |
| | 2018 | | 2017 | |
| | ($000 | ) | ($000 | ) |
Increase (Decrease) in Net Assets | | | | | |
Operations | | | | | |
Net Investment Income | | 364,602 | | 320,289 | |
Realized Net Gain (Loss) | | (16,483 | ) | (10,634 | ) |
Change in Unrealized Appreciation (Depreciation) | | (210,062 | ) | 275,391 | |
Net Increase (Decrease) in Net Assets Resulting from Operations | | 138,057 | | 585,046 | |
Distributions | | | | | |
Net Investment Income | | | | | |
Investor Shares | | (41,945 | ) | (41,380 | ) |
Admiral Shares | | (323,188 | ) | (277,425 | ) |
Realized Capital Gain | | | | | |
Investor Shares | | — | | — | |
Admiral Shares | | — | | — | |
Total Distributions | | (365,133 | ) | (318,805 | ) |
Capital Share Transactions | | | | | |
Investor Shares | | (131,910 | ) | 4,005 | |
Admiral Shares | | 853,053 | | 1,199,133 | |
Net Increase (Decrease) from Capital Share Transactions | | 721,143 | | 1,203,138 | |
Total Increase (Decrease) | | 494,067 | | 1,469,379 | |
Net Assets | | | | | |
Beginning of Period | | 12,913,494 | | 11,444,115 | |
End of Period | | 13,407,561 | | 12,913,494 | |
See accompanying Notes, which are an integral part of the Financial Statements.
169
California Intermediate-Term Tax-Exempt Fund
Financial Highlights
Investor Shares
For a Share Outstanding | | | | | | Year Ended November 30, | |
Throughout Each Period | | 2018 | | 2017 | | 2016 | | 2015 | | 2014 | |
Net Asset Value, Beginning of Period | | $11.70 | | $11.42 | | $11.79 | | $11.78 | | $11.32 | |
Investment Operations | | | | | | | | | | | |
Net Investment Income | | .305 | 1 | .303 | 1 | .307 | | .331 | | .355 | |
Net Realized and Unrealized Gain (Loss) on Investments | | (.189 | ) | .278 | | (.370 | ) | .010 | | .460 | |
Total from Investment Operations | | .116 | | .581 | | (.063 | ) | .341 | | .815 | |
Distributions | | | | | | | | | | | |
Dividends from Net Investment Income | | (.306 | ) | (.301 | ) | (.307 | ) | (.331 | ) | (.355 | ) |
Distributions from Realized Capital Gains | | — | | — | | — | | — | | — | |
Total Distributions | | (.306 | ) | (.301 | ) | (.307 | ) | (.331 | ) | (.355 | ) |
Net Asset Value, End of Period | | $11.51 | | $11.70 | | $11.42 | | $11.79 | | $11.78 | |
| | | | | | | | | | | |
Total Return2 | | 1.00% | | 5.12% | | -0.62% | | 2.93% | | 7.29% | |
| | | | | | | | | | | |
Ratios/Supplemental Data | | | | | | | | | | | |
Net Assets, End of Period (Millions) | | $1,514 | | $1,673 | | $1,631 | | $1,509 | | $1,444 | |
Ratio of Total Expenses to Average Net Assets | | 0.17% | | 0.19% | | 0.19% | | 0.20% | | 0.20% | |
Ratio of Net Investment Income to Average Net Assets | | 2.63% | | 2.58% | | 2.56% | | 2.81% | | 3.06% | |
Portfolio Turnover Rate | | 16% | | 11% | | 16% | | 17% | | 11% | |
1 Calculated based on average shares outstanding.
2 Total returns do not include account service fees that may have applied in the periods shown. Fund prospectuses provide information about any applicable account service fees.
See accompanying Notes, which are an integral part of the Financial Statements.
170
California Intermediate-Term Tax-Exempt Fund
Financial Highlights
Admiral Shares
For a Share Outstanding | | | | | | Year Ended November 30, | |
Throughout Each Period | | 2018 | | 2017 | | 2016 | | 2015 | | 2014 | |
Net Asset Value, Beginning of Period | | $11.70 | | $11.42 | | $11.79 | | $11.78 | | $11.32 | |
Investment Operations | | | | | | | | | | | |
Net Investment Income | | .314 | 1 | .314 | 1 | .319 | | .340 | | .364 | |
Net Realized and Unrealized Gain (Loss) on Investments | | (.189 | ) | .279 | | (.370 | ) | .010 | | .460 | |
Total from Investment Operations | | .125 | | .593 | | (.051 | ) | .350 | | .824 | |
Distributions | | | | | | | | | | | |
Dividends from Net Investment Income | | (.315 | ) | (.313 | ) | (.319 | ) | (.340 | ) | (.364 | ) |
Distributions from Realized Capital Gains | | — | | — | | — | | — | | — | |
Total Distributions | | (.315 | ) | (.313 | ) | (.319 | ) | (.340 | ) | (.364 | ) |
Net Asset Value, End of Period | | $11.51 | | $11.70 | | $11.42 | | $11.79 | | $11.78 | |
| | | | | | | | | | | |
Total Return2 | | 1.08% | | 5.22% | | -0.52% | | 3.01% | | 7.37% | |
| | | | | | | | | | | |
Ratios/Supplemental Data | | | | | | | | | | | |
Net Assets, End of Period (Millions) | | $11,894 | | $11,240 | | $9,813 | | $8,746 | | $7,240 | |
Ratio of Total Expenses to Average Net Assets | | 0.09% | | 0.09% | | 0.09% | | 0.12% | | 0.12% | |
Ratio of Net Investment Income to Average Net Assets | | 2.71% | | 2.68% | | 2.66% | | 2.89% | | 3.14% | |
Portfolio Turnover Rate | | 16% | | 11% | | 16% | | 17% | | 11% | |
1 Calculated based on average shares outstanding.
2 Total returns do not include account service fees that may have applied in the periods shown. Fund prospectuses provide information about any applicable account service fees.
See accompanying Notes, which are an integral part of the Financial Statements.
171
California Intermediate-Term Tax-Exempt Fund
Notes to Financial Statements
Vanguard California Intermediate-Term Tax-Exempt Fund is registered under the Investment Company Act of 1940 as an open-end investment company, or mutual fund. The fund invests in debt instruments of municipal issuers whose ability to meet their obligations may be affected by economic and political developments in the state. The fund offers two classes of shares: Investor Shares and Admiral Shares. Investor Shares are available to any investor who meets the fund’s minimum purchase requirements. Admiral Shares are designed for investors who meet certain administrative, service, and account-size criteria.
A. The following significant accounting policies conform to generally accepted accounting principles for U.S. investment companies. The fund consistently follows such policies in preparing its financial statements.
1. Security Valuation: Securities are valued as of the close of trading on the New York Stock Exchange (generally 4 p.m., Eastern time) on the valuation date. Bonds and temporary cash investments are valued using the latest bid prices or using valuations based on a matrix system (which considers such factors as security prices, yields, maturities, and ratings), both as furnished by independent pricing services. Securities for which market quotations are not readily available, or whose values have been affected by events occurring before the fund’s pricing time but after the close of the securities’ primary markets, are valued by methods deemed by the board of trustees to represent fair value.
2. Futures Contracts: The fund uses futures contracts to invest in fixed income asset classes with greater efficiency and lower cost than is possible through direct investment, to add value when these instruments are attractively priced, or to adjust sensitivity to changes in interest rates. The primary risks associated with the use of futures contracts are imperfect correlation between changes in market values of bonds held by the fund and the prices of futures contracts, and the possibility of an illiquid market. Counterparty risk involving futures is mitigated because a regulated clearinghouse is the counterparty instead of the clearing broker. To further mitigate counterparty risk, the fund trades futures contracts on an exchange, monitors the financial strength of its clearing brokers and clearinghouse, and has entered into clearing agreements with its clearing brokers. The clearinghouse imposes initial margin requirements to secure the fund’s performance and requires daily settlement of variation margin representing changes in the market value of each contract. Any assets pledged as initial margin for open contracts are noted in the Statement of Net Assets.
Futures contracts are valued at their quoted daily settlement prices. The notional amounts of the contracts are not recorded in the Statement of Net Assets. Fluctuations in the value of the contracts are recorded in the Statement of Net Assets as an asset (liability) and in the Statement of Operations as unrealized appreciation (depreciation) until the contracts are closed, when they are recorded as realized futures gains (losses).
During the year ended November 30, 2018, the fund’s average investments in long and short futures contracts represented 4% and 2% of net assets, respectively, based on the average of the notional amounts at each quarter-end during the period.
3. Federal Income Taxes: The fund intends to continue to qualify as a regulated investment company and distribute all of its income. Management has analyzed the fund’s tax positions taken for all open federal income tax years (November 30, 2015–2018), and has concluded that no provision for federal income tax is required in the fund’s financial statements.
172
California Intermediate-Term Tax-Exempt Fund
4. Distributions: Distributions from net investment income are declared daily and paid on the first business day of the following month. Annual distributions from realized capital gains, if any, are recorded on the ex-dividend date. Distributions are determined on a tax basis and may differ from net investment income and realized capital gains for financial reporting purposes.
5. Credit Facility: The fund and certain other funds managed by The Vanguard Group (“Vanguard”) participate in a $3.1 billion committed credit facility provided by a syndicate of lenders pursuant to a credit agreement that may be renewed annually; each fund is individually liable for its borrowings, if any, under the credit facility. Borrowings may be utilized for temporary and emergency purposes, and are subject to the fund’s regulatory and contractual borrowing restrictions. The participating funds are charged administrative fees and an annual commitment fee of 0.10% of the undrawn amount of the facility; these fees are allocated to the funds based on a method approved by the fund’s board of trustees and included in Management and Administrative expenses on the fund’s Statement of Operations. Any borrowings under this facility bear interest at a rate based upon the higher of the one-month London Interbank Offered Rate, federal funds effective rate, or overnight bank funding rate plus an agreed-upon spread.
The fund had no borrowings outstanding at November 30, 2018, or at any time during the period then ended.
6. Other: Interest income is accrued daily. Premiums and discounts on debt securities purchased are amortized and accreted, respectively, to interest income over the lives of the respective securities. Security transactions are accounted for on the date securities are bought or sold. Costs used to determine realized gains (losses) on the sale of investment securities are those of the specific securities sold.
Each class of shares has equal rights as to assets and earnings, except that each class separately bears certain class-specific expenses related to maintenance of shareholder accounts (included in Management and Administrative expenses), shareholder reporting, and the proxy. Marketing and distribution expenses are allocated to each class of shares based on a method approved by the board of trustees. Income, other non-class-specific expenses, and gains and losses on investments are allocated to each class of shares based on its relative net assets.
B. In accordance with the terms of a Funds’ Service Agreement (the “FSA”) between Vanguard and the fund, Vanguard furnishes to the fund investment advisory, corporate management, administrative, marketing, and distribution services at Vanguard’s cost of operations (as defined by the FSA). These costs of operations are allocated to the fund based on methods and guidelines approved by the board of trustees. Vanguard does not require reimbursement in the current period for certain costs of operations (such as deferred compensation/benefits and risk/insurance costs); the fund’s liability for these costs of operations is included in Payables to Vanguard on the Statement of Net Assets. All other costs of operations payable to Vanguard are generally settled twice a month.
Upon the request of Vanguard, the fund may invest up to 0.40% of its net assets as capital in Vanguard. At November 30, 2018, the fund had contributed to Vanguard capital in the amount of $732,000, representing 0.01% of the fund’s net assets and 0.29% of Vanguard’s capitalization. The fund’s trustees and officers are also directors and employees, respectively, of Vanguard.
173
California Intermediate-Term Tax-Exempt Fund
C. Various inputs may be used to determine the value of the fund’s investments. These inputs are summarized in three broad levels for financial statement purposes. The inputs or methodologies used to value securities are not necessarily an indication of the risk associated with investing in those securities.
Level 1—Quoted prices in active markets for identical securities.
Level 2—Other significant observable inputs (including quoted prices for similar securities, interest rates, prepayment speeds, credit risk, etc.).
Level 3—Significant unobservable inputs (including the fund’s own assumptions used to determine the fair value of investments). Any investments valued with significant unobservable inputs are noted on the Statement of Net Assets.
The following table summarizes the market value of the fund’s investments as of November 30, 2018, based on the inputs used to value them:
| | Level 1 | | Level 2 | | Level 3 | |
Investments | | ($000 | ) | ($000 | ) | ($000 | ) |
Tax-Exempt Municipal Bonds | | — | | 13,304,123 | | — | |
Futures Contracts—Assets1 | | 79 | | — | | — | |
Futures Contracts—Liabilities1 | | (440 | ) | — | | — | |
Total | | (361 | ) | 13,304,123 | | — | |
1 Represents variation margin on the last day of the reporting period.
D. Permanent differences between book-basis and tax-basis components of net assets are reclassified among capital accounts in the financial statements to reflect their tax character. These reclassifications have no effect on net assets or net asset value per share. As of period end, permanent differences primarily attributable to the accounting for the expiration of capital loss carryforwards were reclassified between the following accounts:
| | Amount | |
| | ($000 | ) |
Paid-in Capital | | (987 | ) |
Total Distributable Earnings (Loss) | | 987 | |
174
California Intermediate-Term Tax-Exempt Fund
Temporary differences between book-basis and tax-basis components of total distributable earnings (loss) arise when certain items of income, gain, or loss are recognized in different periods for financial statement and tax purposes; these differences will reverse at some time in the future. The differences are primarily related to the tax deferral of losses on wash sales and straddles, the realization of unrealized gains or losses on certain futures contracts, and payables for distributions. As of period end, the tax-basis components of total distributable earnings (loss) are detailed in the table as follows:
| | Amount | |
| | ($000 | ) |
Undistributed Ordinary Income | | — | |
Undistributed Tax-Exempt Income | | 11,720 | |
Undistributed Long-Term Gains | | — | |
Capital Loss Carryforwards* | | (31,371 | ) |
Net Unrealized Gains (Losses) | | 142,534 | |
* Includes $6,085,000, which may be used to offset future net capital gains through November 30, 2019, as well as capital losses of $25,286,000, which may be carried forward indefinitely but must be used before any expiring loss carryforwards.
As of November 30, 2018, gross unrealized appreciation and depreciation for investments and derivatives based on cost for U.S. federal income tax purposes were as follows:
| | Amount | |
| | ($000 | ) |
Tax Cost | | 13,161,589 | |
Gross Unrealized Appreciation | | 247,628 | |
Gross Unrealized Depreciation | | (105,094 | ) |
Net Unrealized Appreciation (Depreciation) | | 142,534 | |
E. During the year ended November 30, 2018, the fund purchased $2,928,051,000 of investment securities and sold $2,035,825,000 of investment securities, other than temporary cash investments.
The fund purchased securities from and sold securities to other Vanguard funds or accounts managed by Vanguard or its affiliates, in accordance with procedures adopted by the board of trustees in compliance with Rule 17a-7 of the Investment Company Act of 1940. For the year ended November 30, 2018, such purchases and sales were $658,088,000 and $756,128,000, respectively; these amounts are included in the purchases and sales of investment securities noted above.
175
California Intermediate-Term Tax-Exempt Fund
F. Capital share transactions for each class of shares were:
| | | | | | Year Ended November 30, | |
| | | | 2018 | | | | 2017 | |
| | Amount | | Shares | | Amount | | Shares | |
| | ($000 | ) | (000 | ) | ($000 | ) | (000 | ) |
Investor Shares | | | | | | | | | |
Issued | | 457,126 | | 39,360 | | 489,631 | | 41,769 | |
Issued in Lieu of Cash Distributions | | 36,503 | | 3,150 | | 36,165 | | 3,085 | |
Redeemed | | (625,539 | ) | (53,990 | ) | (521,791 | ) | (44,773 | ) |
Net Increase (Decrease)—Investor Shares | | (131,910 | ) | (11,480 | ) | 4,005 | | 81 | |
Admiral Shares | | | | | | | | | |
Issued | | 3,591,582 | | 309,848 | | 3,125,968 | | 267,074 | |
Issued in Lieu of Cash Distributions | | 242,580 | | 20,941 | | 209,413 | | 17,858 | |
Redeemed | | (2,981,109 | ) | (258,169 | ) | (2,136,248 | ) | (183,801 | ) |
Net Increase (Decrease)—Admiral Shares | | 853,053 | | 72,620 | | 1,199,133 | | 101,131 | |
At November 30, 2018, one shareholder was the record or beneficial owner of 26% of the fund’s net assets. If the shareholder were to redeem its investment in the fund, the redemption might result in an increase in the fund’s expense ratio, cause the fund to incur higher transaction costs, or lead to the realization of taxable capital gains.
G. Management has determined that no events or transactions occurred subsequent to November 30, 2018, that would require recognition or disclosure in these financial statements.
176
California Long-Term Tax-Exempt Fund
Performance Summary
All of the returns in this report represent past performance, which is not a guarantee of future results that may be achieved by the fund. (Current performance may be lower or higher than the performance data cited. For performance data current to the most recent month-end, visit our website at vanguard.com/performance.) Note, too, that both investment returns and principal value can fluctuate widely, so an investor’s shares, when sold, could be worth more or less than their original cost. The returns shown do not reflect taxes that a shareholder would pay on fund distributions or on the sale of fund shares.
Cumulative Performance: November 30, 2008, Through November 30, 2018
Initial Investment of $10,000
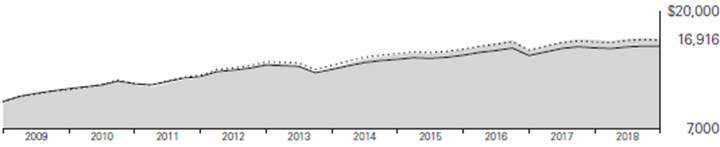
| Average Annual Total Returns | |
| Periods Ended November 30, 2018 | |
| | |
| | | | Final Value |
| One | Five | Ten | of a $10,000 |
| Year | Years | Years | Investment |
| | | | |

| California Long-Term Tax-Exempt Fund Investor Shares | 0.71% | 4.36% | 5.40% | $16,916 |

| Bloomberg Barclays CA Municipal Bond Index | 1.10 | 3.72 | 5.31 | 16,773 |

| Bloomberg Barclays Municipal Bond Index | 1.13 | 3.52 | 4.88 | 16,101 |
| | | | |
| | | | Final Value |
| One | Five | Ten | of a $50,000 |
| Year | Years | Years | Investment |
| | | | |
California Long-Term Tax-Exempt Fund Admiral Shares | 0.80% | 4.45% | 5.49% | $85,289 |
Bloomberg Barclays CA Municipal Bond Index | 1.10 | 3.72 | 5.31 | 83,866 |
Bloomberg Barclays Municipal Bond Index | 1.13 | 3.52 | 4.88 | 80,506 |
See Financial Highlights for dividend and capital gains information.
177
California Long-Term Tax-Exempt Fund
Average Annual Total Returns: Periods Ended September 30, 2018
This table presents returns through the latest calendar quarter—rather than through the end of the fiscal period. Securities and Exchange Commission rules require that we provide this information.
| | | | | | | | | | | | Ten Years |
| | Inception Date | | One Year | | Five Years | | Income | | Capital | | Total |
Investor Shares | | 4/7/1986 | | 0.45% | | 4.45% | | 3.94% | | 1.11% | | 5.05% |
Admiral Shares | | 11/12/2001 | | 0.54 | | 4.54 | | 4.03 | | 1.11 | | 5.14 |
178
California Long-Term Tax-Exempt Fund
Distribution by Stated Maturity
As of November 30, 2018
Under 1 Year | | 3.9 | % |
1 - 3 Years | | 3.0 | |
3 - 5 Years | | 2.0 | |
5 - 10 Years | | 8.5 | |
10 - 20 Years | | 42.5 | |
20 - 30 Years | | 35.7 | |
Over 30 Years | | 4.4 | |
179
California Long-Term Tax-Exempt Fund
Financial Statements
Statement of Net Assets
As of November 30, 2018
The fund reports a complete list of its holdings in regulatory filings four times in each fiscal year, at the quarter-ends. For the second and fourth fiscal quarters, the lists appear in the fund’s semiannual and annual reports to shareholders. For the first and third fiscal quarters, the fund files the lists with the Securities and Exchange Commission on Form N-Q. Shareholders can look up the fund’s Forms N-Q on the SEC’s website at sec.gov.
| | | | | | | | Face | | Market | |
| | | | | Maturity | | | Amount | | Value· | |
| | | Coupon | | Date | | | ($000 | ) | ($000 | ) |
Tax-Exempt Municipal Bonds (99.9%) | | | | | | | | | | |
California (99.9%) | | | | | | | | | | |
| ABAG Finance Authority for Nonprofit Corps. California Revenue (Episcopal Senior Communities) | | 5.000% | | 7/1/42 | | | 1,000 | | 1,042 | |
| ABAG Finance Authority for Nonprofit Corps. California Revenue (Eskaton Properties Inc. Obligated Group) | | 5.000% | | 11/15/35 | | | 3,250 | | 3,448 | |
| ABAG Finance Authority for Nonprofit Corps. California Revenue (Jackson Laboratory) | | 5.000% | | 7/1/37 | | | 7,565 | | 8,127 | |
| ABAG Finance Authority for Nonprofit Corps. California Revenue (Sharp Healthcare) | | 5.000% | | 8/1/43 | | | 15,830 | | 17,138 | |
| ABAG Finance Authority for Nonprofit Corps. California Revenue (Windemere Ranch Infrastructure Financing Program) | | 5.000% | | 9/2/32 | (4) | | 1,000 | | 1,149 | |
| Alameda CA Community Improvement Commission Successor Agency Tax Allocation Revenue | | 5.000% | | 9/1/29 | (15) | | 1,500 | | 1,687 | |
| Alameda CA Corridor Transportation Authority Revenue | | 0.000% | | 10/1/30 | (2) | | 30,375 | | 19,060 | |
| Alameda CA Corridor Transportation Authority Revenue | | 5.000% | | 10/1/35 | | | 1,050 | | 1,151 | |
| Alameda CA Corridor Transportation Authority Revenue | | 5.000% | | 10/1/36 | | | 1,000 | | 1,092 | |
| Alameda CA Corridor Transportation Authority Revenue | | 4.000% | | 10/1/37 | (4) | | 1,870 | | 1,917 | |
| Alameda CA Corridor Transportation Authority Revenue | | 5.000% | | 10/1/37 | | | 6,745 | | 7,350 | |
| Alameda County CA Unified School District GO | | 0.000% | | 8/1/24 | (4) | | 3,510 | | 3,053 | |
| Alameda County CA Unified School District GO | | 0.000% | | 8/1/29 | (4) | | 5,000 | | 3,595 | |
| Anaheim CA Housing & Public Improvements Authority Revenue (Electric Utility Distribution System) | | 5.000% | | 10/1/21 | (Prere.) | | 950 | | 1,032 | |
| Anaheim CA Housing & Public Improvements Authority Revenue (Electric Utility Distribution System) | | 5.000% | | 10/1/36 | | | 3,795 | | 4,154 | |
| Anaheim CA Housing & Public Improvements Authority Revenue (Electric Utility Distribution System) | | 5.000% | | 10/1/41 | | | 1,275 | | 1,363 | |
180
California Long-Term Tax-Exempt Fund
| | | | | | | | Face | | Market | |
| | | | | Maturity | | | Amount | | Value· | |
| | | Coupon | | Date | | | ($000 | ) | ($000 | ) |
| Anaheim CA Housing & Public Improvements Authority Revenue (Water System Project) | | 5.000% | | 10/1/41 | | | 2,250 | | 2,408 | |
| Anaheim CA Public Financing Authority Revenue (Electric System) | | 4.000% | | 10/1/31 | | | 5,080 | | 5,338 | |
| Bay Area Toll Authority California Toll Bridge Revenue (San Francisco Bay Area) | | 5.625% | | 4/1/19 | (Prere.) | | 10,000 | | 10,133 | |
| Bay Area Toll Authority California Toll Bridge Revenue (San Francisco Bay Area) | | 5.000% | | 4/1/23 | (Prere.) | | 4,025 | | 4,548 | |
| Bay Area Toll Authority California Toll Bridge Revenue (San Francisco Bay Area) | | 5.000% | | 4/1/23 | (Prere.) | | 4,000 | | 4,520 | |
| Bay Area Toll Authority California Toll Bridge Revenue (San Francisco Bay Area) | | 5.000% | | 4/1/23 | (Prere.) | | 125 | | 141 | |
| Bay Area Toll Authority California Toll Bridge Revenue (San Francisco Bay Area) | | 5.250% | | 4/1/23 | (Prere.) | | 2,350 | | 2,680 | |
| Bay Area Toll Authority California Toll Bridge Revenue (San Francisco Bay Area) | | 4.000% | | 4/1/30 | | | 5,060 | | 5,458 | |
| Bay Area Toll Authority California Toll Bridge Revenue (San Francisco Bay Area) | | 4.000% | | 4/1/ 31 | | | 8,060 | | 8,640 | |
| Bay Area Toll Authority California Toll Bridge Revenue (San Francisco Bay Area) | | 4.000% | | 4/1/33 | | | 5,485 | | 5,805 | |
| Bay Area Toll Authority California Toll Bridge Revenue (San Francisco Bay Area) | | 4.000% | | 4/1/47 | | | 5,010 | | 5,071 | |
| Bay Area Toll Authority California Toll Bridge Revenue (San Francisco Bay Area) | | 4.000% | | 4/1/49 | | | 1,000 | | 1,009 | |
| Bay Area Toll Authority California Toll Bridge Revenue (San Francisco Bay Area) | | 5.000% | | 10/1/54 | | | 25,260 | | 27,277 | |
1 | Bay Area Toll Authority California Toll Bridge Revenue (San Francisco Bay Area) | | 5.000% | | 4/1/56 | | | 20,000 | | 22,047 | |
| Bay Area Toll Authority California Toll Bridge Revenue (San Francisco Bay Area) PUT | | 2.125% | | 4/1/25 | | | 1,500 | | 1,446 | |
| Beaumont CA Public Improvement Wastewater Revenue | | 5.000% | | 9/1/49 | (4) | | 4,000 | | 4,495 | |
| Brentwood CA Infrastructure Financing Authority Revenue | | 5.000% | | 9/2/28 | (4) | | 2,130 | | 2,417 | |
| Cabrillo CA Community College District Revenue | | 0.000% | | 5/1/26 | (2) | | 8,020 | | 5,906 | |
| California Community College Financing Authority Revenue (NCCD-Orange Coast Properties LLC) | | 5.250% | | 5/1/43 | | | 2,225 | | 2,407 | |
| California Community College Financing Authority Revenue (NCCD-Orange Coast Properties LLC) | | 5.250% | | 5/1/48 | | | 2,000 | | 2,154 | |
| California Community College Financing Authority Revenue (NCCD-Orange Coast Properties LLC) | | 5.250% | | 5/1/53 | | | 3,750 | | 4,008 | |
| California County CA Tobacco Securitization Agency Revenue | | 5.450% | | 6/1/28 | | | 7,500 | | 7,509 | |
| California Department of Water Resources Water System Revenue (Central Valley Project) | | 5.000% | | 12/1/24 | (Prere.) | | 25 | | 29 | |
| California Department of Water Resources Water System Revenue (Central Valley Project) | | 5.000% | | 12/1/28 | | | 2,565 | | 3,071 | |
| California Department of Water Resources Water System Revenue (Central Valley Project) | | 5.000% | | 12/1/29 | | | 3,975 | | 4,604 | |
181
California Long-Term Tax-Exempt Fund
| | | | | | | | Face | | Market | |
| | | | | Maturity | | | Amount | | Value· | |
| | | Coupon | | Date | | | ($000 | ) | ($000 | ) |
| California Department of Water Resources Water System Revenue (Central Valley Project) | | 5.000% | | 12/1/31 | | | 3,515 | | 4,179 | |
| California Department of Water Resources Water System Revenue (Central Valley Project) | | 5.000% | | 12/1/33 | | | 2,210 | | 2,571 | |
| California Educational Facilities Authority Revenue (Art Center College of Design) | | 5.000% | | 12/1/38 | | | 2,250 | | 2,528 | |
| California Educational Facilities Authority Revenue (Claremont McKenna College) | | 5.000% | | 1/1/29 | | | 1,140 | | 1,330 | |
| California Educational Facilities Authority Revenue (Claremont McKenna College) | | 4.000% | | 1/1/39 | | | 10,000 | | 10,246 | |
| California Educational Facilities Authority Revenue (College of Arts) | | 6.875% | | 6/1/19 | | | 740 | | 758 | |
| California Educational Facilities Authority Revenue (College of Arts) | | 5.250% | | 6/1/30 | | | 1,125 | | 1,212 | |
| California Educational Facilities Authority Revenue (Mount St. Mary’s University) | | 5.000% | | 10/1/35 | | | 800 | | 915 | |
| California Educational Facilities Authority Revenue (Occidental College) | | 5.000% | | 10/1/37 | | | 1,130 | | 1,277 | |
| California Educational Facilities Authority Revenue (Occidental College) | | 5.000% | | 10/1/45 | | | 1,425 | | 1,597 | |
| California Educational Facilities Authority Revenue (Pepperdine College) | | 5.000% | | 9/1/22 | (Prere.) | | 1,775 | | 1,973 | |
| California Educational Facilities Authority Revenue (Pepperdine College) | | 5.000% | | 9/1/33 | | | 1,225 | | 1,336 | |
| California Educational Facilities Authority Revenue (Pepperdine College) | | 5.000% | | 12/1/39 | | | 2,000 | | 2,248 | |
| California Educational Facilities Authority Revenue (Pepperdine College) | | 5.000% | | 9/1/45 | | | 5,000 | | 5,601 | |
| California Educational Facilities Authority Revenue (Santa Clara University) | | 5.000% | | 4/1/39 | | | 5,890 | | 6,579 | |
| California Educational Facilities Authority Revenue (Santa Clara University) | | 5.000% | | 4/1/45 | | | 6,500 | | 7,232 | |
| California Educational Facilities Authority Revenue (Stanford University) | | 5.000% | | 3/15/26 | | | 40 | | 48 | |
| California Educational Facilities Authority Revenue (Stanford University) | | 5.000% | | 3/15/39 | | | 3,700 | | 4,557 | |
| California Educational Facilities Authority Revenue (Stanford University) | | 5.250% | | 4/1/40 | | | 6,425 | | 8,207 | |
| California Educational Facilities Authority Revenue (Stanford University) | | 5.000% | | 6/1/43 | | | 3,790 | | 4,743 | |
| California Educational Facilities Authority Revenue (Stanford University) | | 5.000% | | 5/1/45 | | | 4,000 | | 5,030 | |
| California Educational Facilities Authority Revenue (Stanford University) | | 5.000% | | 6/1/46 | | | 9,000 | | 11,269 | |
| California Educational Facilities Authority Revenue (University of San Francisco) | | 6.125% | | 10/1/21 | (Prere.) | | 610 | | 681 | |
| California Educational Facilities Authority Revenue (University of San Francisco) | | 6.125% | | 10/1/21 | (Prere.) | | 640 | | 715 | |
| California Educational Facilities Authority Revenue (University of San Francisco) | | 5.000% | | 10/1/53 | | | 4,000 | | 4,402 | |
| California Educational Facilities Authority Revenue (University of the Pacific) | | 5.000% | | 11/1/30 | | | 3,225 | | 3,669 | |
| California GO | | 6.000% | | 4/1/19 | (Prere.) | | 7,495 | | 7,603 | |
| California GO | | 6.500% | | 4/1/19 | (Prere.) | | 17,870 | | 18,157 | |
182
California Long-Term Tax-Exempt Fund
| | | | | | | | Face | | Market | |
| | | | | Maturity | | | Amount | | Value· | |
| | | Coupon | | Date | | | ($000 | ) | ($000 | ) |
| California GO | | 6.000% | | 8/1/19 | (14) | | 70 | | 70 | |
| California GO | | 5.000% | | 4/1/20 | | | 1,460 | | 1,476 | |
| California GO | | 5.000% | | 9/1/20 | | | 5,000 | | 5,277 | |
| California GO | | 5.000% | | 9/1/21 | | | 11,000 | | 11,915 | |
| California GO | | 5.000% | | 11/1/ 23 | | | 7,000 | | 7,940 | |
| California GO | | 5.000% | | 5/1/24 | | | 3,000 | | 3,431 | |
| California GO | | 5.000% | | 11/1/24 | | | 6,695 | | 7,724 | |
| California GO | | 5.000% | | 3/1/25 | | | 7,000 | | 7,266 | |
| California GO | | 5.000% | | 3/1/26 | | | 1,600 | | 1,844 | |
| California GO | | 5.000% | | 3/1/27 | | | 9,000 | | 10,319 | |
| California GO | | 3.500% | | 8/1/27 | | | 9,000 | | 9,694 | |
| California GO | | 5.250% | | 10/1/27 | | | 5,000 | | 5,437 | |
| California GO | | 5.000% | | 3/1/28 | | | 10,000 | | 11,409 | |
| California GO | | 5.000% | | 8/1/28 | | | 2,875 | | 3,302 | |
| California GO | | 5.000% | | 8/1/28 | | | 6,460 | | 7,542 | |
| California GO | | 4.000% | | 9/1/28 | | | 6,000 | | 6,493 | |
| California GO | | 5.000% | | 9/1/28 | | | 5,930 | | 6,930 | |
| California GO | | 5.000% | | 10/1/29 | | | 10,000 | | 11,044 | |
| California GO | | 5.000% | | 10/1/29 | | | 4,000 | | 4,623 | |
| California GO | | 5.250% | | 10/1/29 | | | 4,700 | | 4,829 | |
| California GO | | 5.250% | | 3/1/30 | | | 10,000 | | 10,399 | |
| California GO | | 5.000% | | 8/1/ 30 | | | 3,225 | | 3,735 | |
| California GO | | 5.000% | | 8/1/30 | | | 21,110 | | 24,819 | |
| California GO | | 5.250% | | 9/1/ 30 | | | 6,000 | | 6,479 | |
| California GO | | 5.750% | | 4/1/31 | | | 15,875 | | 16,068 | |
| California GO | | 5.000% | | 8/1/31 | | | 9,460 | | 10,741 | |
| California GO | | 5.000% | | 8/1/31 | | | 14,040 | | 16,433 | |
| California GO | | 5.000% | | 9/1/31 | | | 1,800 | | 1,931 | |
| California GO | | 5.000% | | 9/1/31 | | | 8,390 | | 9,694 | |
| California GO | | 5.000% | | 10/1/31 | | | 4,500 | | 5,064 | |
| California GO | | 5.000% | | 11/1/31 | | | 5,000 | | 5,869 | |
| California GO | | 4.000% | | 8/1/32 | | | 10,000 | | 10,591 | |
| California GO | | 4.000% | | 9/1/32 | | | 7,500 | | 7,945 | |
| California GO | | 5.000% | | 9/1/32 | | | 1,045 | | 1,120 | |
| California GO | | 5.000% | | 9/1/32 | | | 2,775 | | 3,193 | |
| California GO | | 5.000% | | 10/1/32 | | | 8,790 | | 9,871 | |
| California GO | | 5.000% | | 2/1/33 | | | 2,615 | | 2,855 | |
| California GO | | 6.000% | | 3/1/33 | | | 7,000 | | 7,356 | |
| California GO | | 6.500% | | 4/1/33 | | | 15,130 | | 15,353 | |
| California GO | | 5.000% | | 8/1/33 | | | 2,635 | | 2,944 | |
| California GO | | 5.000% | | 8/1/33 | | | 5,000 | | 5,726 | |
| California GO | | 5.000% | | 10/1/33 | | | 4,000 | | 4,480 | |
| California GO | | 5.250% | | 4/1/35 | | | 5,000 | | 5,452 | |
| California GO | | 4.000% | | 8/1/35 | | | 10,000 | | 10,446 | |
| California GO | | 4.000% | | 9/1/35 | | | 9,575 | | 10,003 | |
| California GO | | 5.000% | | 10/1/35 | | | 7,500 | | 8,483 | |
| California GO | | 5.000% | | 11/1/35 | | | 3,750 | | 4,330 | |
| California GO | | 6.000% | | 11/1/35 | | | 5,000 | | 5,183 | |
| California GO | | 4.000% | | 8/1/36 | | | 10,000 | | 10,386 | |
| California GO | | 5.000% | | 9/1/36 | | | 8,500 | | 9,251 | |
| California GO | | 5.000% | | 4/1/37 | | | 5,000 | | 5,442 | |
| California GO | | 6.000% | | 4/1/38 | | | 13,695 | | 13,875 | |
| California GO | | 5.000% | | 10/1/39 | | | 7,615 | | 8,422 | |
| California GO | | 5.500% | | 11/1/39 | | | 3,690 | | 3,804 | |
183
California Long-Term Tax-Exempt Fund
| | | | | | | | Face | | Market | |
| | | | | Maturity | | | Amount | | Value· | |
| | | Coupon | | Date | | | ($000 | ) | ($000 | ) |
| California GO | | 6.000% | | 11/1/ 39 | | | 2,700 | | 2,796 | |
| California GO | | 3.800% | | 12/1/39 | | | 3,670 | | 3,698 | |
| California GO | | 5.500% | | 3/1/40 | | | 11,500 | | 11,970 | |
| California GO | | 3.850% | | 12/1/40 | | | 3,830 | | 3,859 | |
| California GO | | 5.000% | | 10/1/41 | | | 5,000 | | 5,343 | |
| California GO | | 5.000% | | 4/1/42 | | | 2,000 | | 2,146 | |
| California GO | | 5.000% | | 9/1/42 | | | 8,515 | | 9,242 | |
| California GO | | 3.900% | | 12/1/42 | | | 6,710 | | 6,760 | |
| California GO | | 5.000% | | 2/1/43 | | | 6,265 | | 6,762 | |
| California GO | | 5.000% | | 4/1/43 | | | 6,500 | | 7,034 | |
| California GO | | 5.000% | | 11/1/43 | | | 12,425 | | 13,578 | |
| California GO | | 5.000% | | 12/1/43 | | | 5,335 | | 5,842 | |
| California GO | | 5.000% | | 5/1/44 | | | 5,000 | | 5,468 | |
| California GO | | 5.000% | | 8/1/45 | | | 11,735 | | 12,956 | |
| California GO | | 5.000% | | 8/1/46 | | | 10,000 | | 11,150 | |
| California GO VRDO | | 1.320% | | 12/3/18 | LOC | | 7,800 | | 7,800 | |
| California GO VRDO | | 1.440% | | 12/3/18 | LOC | | 100 | | 100 | |
| California Health Facilities Financing Authority Revenue (Adventist Health System/West) | | 5.000% | | 3/1/25 | | | 3,000 | | 3,319 | |
| California Health Facilities Financing Authority Revenue (Adventist Health System/West) | | 4.000% | | 3/1/33 | | | 1,300 | | 1,317 | |
| California Health Facilities Financing Authority Revenue (Adventist Health System/West) | | 4.000% | | 3/1/34 | | | 2,700 | | 2,743 | |
| California Health Facilities Financing Authority Revenue (Adventist Health System/West) | | 4.000% | | 3/1/39 | | | 5,000 | | 4,967 | |
| California Health Facilities Financing Authority Revenue (Catholic Healthcare West) | | 6.000% | | 7/1/19 | (Prere.) | | 5,000 | | 5,126 | |
| California Health Facilities Financing Authority Revenue (Catholic Healthcare West) | | 5.625% | | 7/1/25 | | | 5,000 | | 5,099 | |
| California Health Facilities Financing Authority Revenue (Catholic Healthcare West) | | 5.250% | | 3/1/27 | | | 2,500 | | 2,665 | |
| California Health Facilities Financing Authority Revenue (Catholic Healthcare West) | | 5.250% | | 3/1/41 | | | 9,000 | | 9,478 | |
| California Health Facilities Financing Authority Revenue (Cedars-Sinai Medical Center) | | 5.000% | | 11/15/27 | | | 5,055 | | 5,897 | |
| California Health Facilities Financing Authority Revenue (Cedars-Sinai Medical Center) | | 5.000% | | 8/15/32 | | | 5,000 | | 5,739 | |
| California Health Facilities Financing Authority Revenue (Cedars-Sinai Medical Center) | | 5.000% | | 8/15/35 | | | 5,000 | | 5,691 | |
| California Health Facilities Financing Authority Revenue (Cedars-Sinai Medical Center) | | 4.000% | | 8/15/39 | | | 5,000 | | 5,056 | |
| California Health Facilities Financing Authority Revenue (Children’s Hospital of Los Angeles) | | 5.000% | | 11/15/29 | | | 3,500 | | 3,783 | |
| California Health Facilities Financing Authority Revenue (Children’s Hospital of Los Angeles) | | 5.000% | | 8/15/42 | | | 7,500 | | 8,163 | |
| California Health Facilities Financing Authority Revenue (Children’s Hospital of Orange County) | | 6.500% | | 11/1/38 | | | 3,000 | | 3,136 | |
| California Health Facilities Financing Authority Revenue (Children’s Hospital of Orange County) | | 5.250% | | 11/1/41 | | | 4,025 | | 4,367 | |
| California Health Facilities Financing Authority Revenue (Chinese Hospital Association) | | 5.000% | | 6/1/37 | | | 2,000 | | 2,154 | |
184
California Long-Term Tax-Exempt Fund
| | | | | | | | Face | | Market | |
| | | | | Maturity | | | Amount | | Value· | |
| | | Coupon | | Date | | | ($000 | ) | ($000 | ) |
| California Health Facilities Financing Authority Revenue (Chinese Hospital Association) | | 5.000% | | 6/1/42 | | | 5,000 | | 5,377 | |
| California Health Facilities Financing Authority Revenue (City of Hope Medical Center) | | 5.000% | | 11/15/32 | | | 4,275 | | 4,657 | |
| California Health Facilities Financing Authority Revenue (City of Hope Medical Center) | | 5.000% | | 11/15/35 | | | 7,815 | | 8,485 | |
| California Health Facilities Financing Authority Revenue (City of Hope Medical Center) | | 5.000% | | 11/15/39 | | | 4,505 | | 4,870 | |
| California Health Facilities Financing Authority Revenue (El Camino Hospital) | | 5.000% | | 2/1/26 | | | 2,740 | | 3,142 | |
| California Health Facilities Financing Authority Revenue (El Camino Hospital) | | 5.000% | | 2/1/27 | | | 1,840 | | 2,096 | |
| California Health Facilities Financing Authority Revenue (El Camino Hospital) | | 5.000% | | 2/1/40 | | | 6,000 | | 6,507 | |
| California Health Facilities Financing Authority Revenue (El Camino Hospital) | | 5.000% | | 2/1/47 | | | 7,000 | | 7,674 | |
| California Health Facilities Financing Authority Revenue (Kaiser Permanente) | | 5.000% | | 11/1/27 | | | 7,080 | | 8,541 | |
| California Health Facilities Financing Authority Revenue (Kaiser Permanente) | | 4.000% | | 11/1/44 | | | 14,000 | | 14,283 | |
| California Health Facilities Financing Authority Revenue (Kaiser Permanente) | | 5.000% | | 11/1/47 | | | 11,800 | | 14,556 | |
| California Health Facilities Financing Authority Revenue (Kaiser Permanente) | | 4.000% | | 11/1/51 | | | 4,000 | | 4,025 | |
2 | California Health Facilities Financing Authority Revenue (Kaiser Permanente) TOB VRDO | | 1.660% | | 12/7/18 | | | 21,700 | | 21,700 | |
2 | California Health Facilities Financing Authority Revenue (Kaiser Permanente) TOB VRDO | | 1.690% | | 12/ 7/18 | | | 10,025 | | 10,025 | |
| California Health Facilities Financing Authority Revenue (Lucile Salter Packard Children’s Hospital at Stanford) | | 5.000% | | 8/15/43 | | | 5,300 | | 5,718 | |
| California Health Facilities Financing Authority Revenue (Lucile Salter Packard Children’s Hospital at Stanford) | | 5.000% | | 8/15/55 | | | 7,000 | | 7,679 | |
| California Health Facilities Financing Authority Revenue (Lucile Salter Packard Children’s Hospital at Stanford) | | 5.000% | | 11/15/56 | | | 12,000 | | 13,278 | |
| California Health Facilities Financing Authority Revenue (Marshall Medical Center) | | 5.000% | | 11/1/29 | | | 1,000 | | 1,138 | |
| California Health Facilities Financing Authority Revenue (Marshall Medical Center) | | 5.000% | | 11/1/33 | | | 1,100 | | 1,237 | |
| California Health Facilities Financing Authority Revenue (Memorial Health Services) | | 5.000% | | 10/1/25 | | | 2,750 | | 3,045 | |
| California Health Facilities Financing Authority Revenue (Memorial Health Services) | | 5.000% | | 10/1/26 | | | 5,000 | | 5,533 | |
| California Health Facilities Financing Authority Revenue (Memorial Health Services) | | 5.000% | | 10/1/33 | | | 2,510 | | 2,755 | |
| California Health Facilities Financing Authority Revenue (Northern California Presbyterian Homes & Services) | | 5.000% | | 7/1/34 | | | 645 | | 729 | |
| California Health Facilities Financing Authority Revenue (Northern California Presbyterian Homes & Services) | | 5.000% | | 7/1/39 | | | 1,600 | | 1,786 | |
185
California Long-Term Tax-Exempt Fund
| | | | | | | | Face | | Market | |
| | | | | Maturity | | | Amount | | Value· | |
| | | Coupon | | Date | | | ($000 | ) | ($000 | ) |
| California Health Facilities Financing Authority Revenue (Northern California Presbyterian Homes & Services) | | 5.000% | | 7/1/44 | | | 1,500 | | 1,664 | |
| California Health Facilities Financing Authority Revenue (Providence Health & Services) | | 5.000% | | 10/1/29 | | | 2,390 | | 2,716 | |
| California Health Facilities Financing Authority Revenue (Providence Health & Services) | | 5.000% | | 10/1/38 | | | 6,025 | | 6,697 | |
| California Health Facilities Financing Authority Revenue (Providence Health & Services) | | 5.500% | | 10/1/39 | | | 6,500 | | 6,686 | |
| California Health Facilities Financing Authority Revenue (Providence St. Joseph Health Obligated Group) | | 4.000% | | 10/1/36 | | | 1,000 | | 1,027 | |
| California Health Facilities Financing Authority Revenue (Providence St. Joseph Health Obligated Group) | | 4.000% | | 10/1/47 | | | 2,515 | | 2,515 | |
| California Health Facilities Financing Authority Revenue (Rady Children’s Hospital) | | 5.500% | | 8/15/33 | | | 3,920 | | 4,262 | |
| California Health Facilities Financing Authority Revenue (Scripps Health) | | 5.000% | | 11/15/40 | | | 8,000 | | 8,639 | |
| California Health Facilities Financing Authority Revenue (St. Joseph Health System) | | 5.750% | | 7/1/39 | | | 7,000 | | 7,157 | |
| California Health Facilities Financing Authority Revenue (Stanford Health Care Obligated Group) | | 5.000% | | 11/15/29 | | | 5,080 | | 6,059 | |
| California Health Facilities Financing Authority Revenue (Stanford Health Care Obligated Group) | | 4.000% | | 11/15/40 | | | 10,000 | | 10,100 | |
| California Health Facilities Financing Authority Revenue (Stanford Hospital) | | 5.000% | | 8/15/42 | | | 5,000 | | 5,389 | |
| California Health Facilities Financing Authority Revenue (Stanford Hospital) | | 5.000% | | 8/15/51 | | | 5,000 | | 5,362 | |
| California Health Facilities Financing Authority Revenue (Stanford Hospital) | | 5.000% | | 8/15/54 | | | 2,000 | | 2,179 | |
| California Health Facilities Financing Authority Revenue (Sutter Health) | | 5.875% | | 8/15/20 | | | 4,000 | | 4,279 | |
| California Health Facilities Financing Authority Revenue (Sutter Health) | | 5.000% | | 11/15/29 | | | 1,500 | | 1,760 | |
| California Health Facilities Financing Authority Revenue (Sutter Health) | | 5.000% | | 11/15/30 | | | 1,000 | | 1,165 | |
| California Health Facilities Financing Authority Revenue (Sutter Health) | | 4.000% | | 8/15/40 | | | 6,500 | | 6,569 | |
| California Health Facilities Financing Authority Revenue (Sutter Health) | | 4.000% | | 11/15/42 | | | 7,400 | | 7,472 | |
| California Health Facilities Financing Authority Revenue (Sutter Health) | | 5.000% | | 8/15/43 | | | 9,000 | | 9,782 | |
| California Health Facilities Financing Authority Revenue (Sutter Health) | | 5.000% | | 11/15/46 | | | 22,000 | | 23,859 | |
| California Health Facilities Financing Authority Revenue (Sutter Health) | | 5.000% | | 11/15/48 | | | 26,000 | | 28,471 | |
| California Health Facilities Financing Authority Revenue (Sutter Health) | | 5.000% | | 11/15/48 | | | 4,700 | | 5,147 | |
| California Infrastructure & Economic Development Bank Revenue | | 5.000% | | 10/1/28 | | | 3,420 | | 4,034 | |
186
California Long-Term Tax-Exempt Fund
��
| | | | | | | | Face | | Market | |
| | | | | Maturity | | | Amount | | Value· | |
| | | Coupon | | Date | | | ($000 | ) | ($000 | ) |
| California Infrastructure & Economic Development Bank Revenue | | 5.000% | | 10/1/28 | | | 5,040 | | 6,143 | |
| California Infrastructure & Economic Development Bank Revenue | | 5.000% | | 10/1/29 | | | 3,445 | | 4,078 | |
| California Infrastructure & Economic Development Bank Revenue | | 5.000% | | 10/1/33 | | | 3,025 | | 3,512 | |
| California Infrastructure & Economic Development Bank Revenue | | 5.000% | | 10/1/34 | | | 5,000 | | 5,729 | |
| California Infrastructure & Economic Development Bank Revenue (Academy of Motion Picture Arts & Sciences Obligated Group) | | 5.000% | | 11/1/30 | | | 2,000 | | 2,236 | |
| California Infrastructure & Economic Development Bank Revenue (Academy of Motion Picture Arts & Sciences Obligated Group) | | 5.000% | | 11/1/41 | | | 6,100 | | 6,704 | |
| California Infrastructure & Economic Development Bank Revenue (Pacific Gas & Electric Co.) VRDO | | 2.060% | | 12/3/18 | LOC | | 6,520 | | 6,520 | |
| California Infrastructure & Economic Development Bank Revenue (Sanford Consortium for Regenerative Medicine) | | 4.000% | | 5/15/40 | | | 5,415 | | 5,523 | |
| California Infrastructure & Economic Development Bank Revenue (Science Center Phase II Project) | | 5.000% | | 5/1/28 | | | 1,220 | | 1,418 | |
| California Infrastructure & Economic Development Bank Revenue (Science Center Phase II Project) | | 5.000% | | 5/1/29 | | | 1,290 | | 1,491 | |
| California Infrastructure & Economic Development Bank Revenue (University of California) | | 5.000% | | 5/15/47 | | | 5,000 | | 5,630 | |
| California Infrastructure & Economic Development Bank Revenue (University of California) | | 5.000% | | 5/15/52 | | | 5,000 | | 5,589 | |
| California Municipal Finance Authority (Community Hospitals of Central California Obligated Group) COP | | 5.500% | | 2/1/19 | (Prere.) | | 11,000 | | 11,069 | |
| California Municipal Finance Authority Mobile Home Park Revenue (Caritas Affordable Housing Inc. Projects) | | 4.000% | | 8/15/42 | | | 1,000 | | 975 | |
| California Municipal Finance Authority Revenue (Anaheim Electric Utility Distribution System) | | 5.000% | | 10/1/33 | | | 2,120 | | 2,418 | |
| California Municipal Finance Authority Revenue (Anaheim Electric Utility Distribution System) | | 5.000% | | 10/1/34 | | | 1,340 | | 1,524 | |
| California Municipal Finance Authority Revenue (Anaheim Water System Project Revenue) | | 4.000% | | 10/1/34 | | | 4,560 | | 4,745 | |
| California Municipal Finance Authority Revenue (Azusa Pacific University) | | 5.000% | | 4/1/35 | | | 2,000 | | 2,083 | |
| California Municipal Finance Authority Revenue (Azusa Pacific University) | | 5.000% | | 4/1/41 | | | 4,000 | | 4,120 | |
| California Municipal Finance Authority Revenue (Biola University) | | 5.000% | | 10/1/33 | | | 625 | | 704 | |
| California Municipal Finance Authority Revenue (Biola University) | | 5.000% | | 10/1/38 | | | 1,255 | | 1,340 | |
187
California Long-Term Tax-Exempt Fund
| | | | | | | | Face | | Market | |
| | | | | Maturity | | | Amount | | Value· | |
| | | Coupon | | Date | | | ($000 | ) | ($000 | ) |
| California Municipal Finance Authority Revenue (Biola University) | | 5.000% | | 10/1/42 | | | 2,500 | | 2,656 | |
| California Municipal Finance Authority Revenue (California Lutheran University) | | 5.000% | | 10/1/32 | | | 225 | | 256 | |
| California Municipal Finance Authority Revenue (California Lutheran University) | | 5.000% | | 10/1/34 | | | 250 | | 282 | |
| California Municipal Finance Authority Revenue (California Lutheran University) | | 5.000% | | 10/1/36 | | | 250 | | 280 | |
| California Municipal Finance Authority Revenue (California Lutheran University) | | 5.000% | | 10/1/38 | | | 300 | | 334 | |
| California Municipal Finance Authority Revenue (Channing House Project) | | 4.000% | | 5/15/40 | | | 6,500 | | 6,555 | |
| California Municipal Finance Authority Revenue (Channing House Project) | | 5.000% | | 5/15/47 | | | 3,000 | | 3,392 | |
| California Municipal Finance Authority Revenue (Community Hospitals of Central California Obligated Group) | | 5.000% | | 2/1/28 | | | 1,800 | | 2,068 | |
| California Municipal Finance Authority Revenue (Community Hospitals of Central California Obligated Group) | | 5.000% | | 2/1/31 | | | 2,370 | | 2,674 | |
| California Municipal Finance Authority Revenue (Community Hospitals of Central California Obligated Group) | | 5.000% | | 2/1/40 | | | 5,000 | | 5,385 | |
| California Municipal Finance Authority Revenue (Community Hospitals of Central California Obligated Group) | | 5.000% | | 2/1/47 | | | 9,200 | | 9,971 | |
| California Municipal Finance Authority Revenue (Eisenhower Medical Center) | | 5.000% | | 7/1/32 | | | 750 | | 834 | |
| California Municipal Finance Authority Revenue (Eisenhower Medical Center) | | 5.000% | | 7/1/34 | | | 1,750 | | 1,929 | |
| California Municipal Finance Authority Revenue (Eisenhower Medical Center) | | 5.000% | | 7/1/37 | | | 1,800 | | 1,966 | |
| California Municipal Finance Authority Revenue (Eisenhower Medical Center) | | 5.000% | | 7/1/42 | | | 5,250 | | 5,674 | |
| California Municipal Finance Authority Revenue (Eisenhower Medical Center) | | 5.000% | | 7/1/42 | | | 2,500 | | 2,702 | |
| California Municipal Finance Authority Revenue (Eisenhower Medical Center) | | 4.000% | | 7/1/47 | | | 5,000 | | 4,836 | |
| California Municipal Finance Authority Revenue (Institute on Aging Project) | | 5.000% | | 8/15/37 | | | 930 | | 1,063 | |
| California Municipal Finance Authority Revenue (NorthBay Healthcare Group) | | 5.000% | | 11/1/35 | | | 690 | | 735 | |
| California Municipal Finance Authority Revenue (NorthBay Healthcare Group) | | 5.250% | | 11/1/41 | | | 5,000 | | 5,298 | |
| California Municipal Finance Authority Revenue (NorthBay Healthcare Group) | | 5.000% | | 11/1/44 | | | 1,800 | | 1,893 | |
| California Municipal Finance Authority Revenue (Retirement Housing Foundation Obligated Group) | | 5.000% | | 11/15/29 | | | 390 | | 451 | |
| California Municipal Finance Authority Revenue (Retirement Housing Foundation Obligated Group) | | 5.000% | | 11/15/30 | | | 275 | | 318 | |
188
California Long-Term Tax-Exempt Fund
| | | | | | | | Face | | Market | |
| | | | | Maturity | | | Amount | | Value· | |
| | | Coupon | | Date | | | ($000 | ) | ($000 | ) |
| California Municipal Finance Authority Revenue (Retirement Housing Foundation Obligated Group) | | 5.000% | | 11/15/31 | | | 2,910 | | 3,368 | |
| California Municipal Finance Authority Revenue (University of La Verne) | | 5.250% | | 6/1/20 | (ETM) | | 2,420 | | 2,543 | |
| California Municipal Finance Authority Student Housing Revenue (Bowles Hall Foundation) | | 5.000% | | 6/1/50 | | | 2,580 | | 2,711 | |
| California Municipal Finance Authority Water Revenue (San Bernardino Municipal Water Department) | | 5.000% | | 8/1/46 | (15) | | 7,500 | | 8,214 | |
| California Pollution Control Financing Authority Revenue (Pacific Gas & Electric Co.) VRDO | | 2.050% | | 12/3/18 | LOC | | 3,355 | | 3,355 | |
| California Pollution Control Financing Authority Water Furnishing Revenue (San Diego County Water Authority Desalination Project Pipeline) | | 5.000% | | 11/21/45 | | | 1,480 | | 1,496 | |
| California Public Finance Authority Revenue (Sharp Healthcare Obligated Group) | | 4.000% | | 8/1/47 | | | 5,000 | | 5,058 | |
| California Public Finance Authority Revenue (Sharp Healthcare Obligated Group) | | 5.000% | | 8/1/47 | | | 5,250 | | 5,850 | |
| California Public Works Board Lease Revenue (Department of Corrections) | | 5.000% | | 5/1/29 | | | 7,095 | | 8,407 | |
| California Public Works Board Lease Revenue (Department of Corrections) | | 4.500% | | 9/1/35 | | | 4,000 | | 4,271 | |
| California Public Works Board Lease Revenue (Department of General Services) | | 6.000% | | 4/1/19 | (Prere.) | | 6,000 | | 6,087 | |
| California Public Works Board Lease Revenue (Department of General Services) | | 6.250% | | 4/1/19 | (Prere.) | | 8,250 | | 8,376 | |
| California Public Works Board Lease Revenue (Judicial Council Projects) | | 5.000% | | 3/1/29 | | | 2,500 | | 2,747 | |
| California Public Works Board Lease Revenue (Judicial Council Projects) | | 5.000% | | 3/1/34 | | | 1,300 | | 1,418 | |
| California Public Works Board Lease Revenue (Judicial Council Projects) | | 5.000% | | 3/1/38 | | | 3,470 | | 3,761 | |
| California Public Works Board Lease Revenue (Office of Emergency Services) | | 5.000% | | 4/1/31 | | | 1,000 | | 1,158 | |
| California Public Works Board Lease Revenue (Riverside Campus) | | 5.000% | | 4/1/31 | | | 2,500 | | 2,895 | |
| California Public Works Board Lease Revenue (Various Capital Projects) | | 6.250% | | 11/1/19 | (Prere.) | | 5,000 | | 5,209 | |
| California Public Works Board Lease Revenue (Various Capital Projects) | | 5.000% | | 4/1/23 | | | 4,180 | | 4,568 | |
| California Public Works Board Lease Revenue (Various Capital Projects) | | 5.000% | | 11/1/26 | | | 5,000 | | 5,509 | |
| California Public Works Board Lease Revenue (Various Capital Projects) | | 4.000% | | 11/1/30 | | | 6,000 | | 6,387 | |
| California Public Works Board Lease Revenue (Various Capital Projects) | | 4.000% | | 4/1/33 | | | 2,220 | | 2,329 | |
| California Public Works Board Lease Revenue (Various Capital Projects) | | 5.500% | | 11/1/33 | | | 2,330 | | 2,632 | |
| California Public Works Board Lease Revenue (Various Capital Projects) | | 5.000% | | 11/1/37 | | | 5,000 | | 5,433 | |
| California Public Works Board Lease Revenue (Various Capital Projects) | | 5.000% | | 9/1/39 | | | 3,000 | | 3,307 | |
189
California Long-Term Tax-Exempt Fund
| | | | | | | | Face | | Market | |
| | | | | Maturity | | | Amount | | Value· | |
| | | Coupon | | Date | | | ($000 | ) | ($000 | ) |
| California School Finance Authority Revenue (Green Dot Public Schools Obligated Group) | | 5.000% | | 8/1/48 | | | 2,775 | | 2,925 | |
| California State University Systemwide Revenue | | 5.250% | | 5/1/19 | (Prere.) | | 3,280 | | 3,330 | |
| California State University Systemwide Revenue | | 5.000% | | 11/1/30 | | | 10,675 | | 12,387 | |
| California State University Systemwide Revenue | | 5.000% | | 11/1/30 | | | 2,500 | | 2,895 | |
| California State University Systemwide Revenue | | 5.000% | | 11/1/31 | | | 5,150 | | 5,939 | |
| California State University Systemwide Revenue | | 5.000% | | 11/1/31 | | | 7,000 | | 7,939 | |
| California State University Systemwide Revenue | | 5.000% | | 11/1/32 | | | 6,610 | | 7,600 | |
| California State University Systemwide Revenue | | 5.000% | | 11/1/32 | | | 7,000 | | 7,923 | |
| California State University Systemwide Revenue | | 4.000% | | 11/1/37 | | | 1,875 | | 1,926 | |
| California State University Systemwide Revenue | | 5.000% | | 11/1/37 | | | 10,000 | | 10,742 | |
| California State University Systemwide Revenue | | 5.000% | | 11/1/37 | | | 3,750 | | 4,114 | |
| California State University Systemwide Revenue | | 4.000% | | 11/1/38 | | | 1,385 | | 1,415 | |
| California State University Systemwide Revenue | | 5.000% | | 11/1/38 | | | 4,040 | | 4,572 | |
| California State University Systemwide Revenue | | 5.000% | | 11/1/42 | | | 1,355 | | 1,452 | |
| California State University Systemwide Revenue | | 5.000% | | 11/1/43 | | | 1,810 | | 2,031 | |
| California State University Systemwide Revenue | | 5.000% | | 11/1/47 | | | 8,620 | | 9,640 | |
| California State University Systemwide Revenue | | 5.000% | | 11/1/47 | | | 6,105 | | 6,828 | |
| California State University Systemwide Revenue | | 5.000% | | 11/1/48 | | | 4,900 | | 5,546 | |
| California State University Systemwide Revenue | | 5.000% | | 11/1/50 | | | 6,000 | | 6,766 | |
| California State University Systemwide Revenue PUT | | 3.000% | | 11/1/19 | | | 7,000 | | 7,027 | |
3 | California Statewide Communities Development Authority Hospital Revenue (Methodist Hospital of Southern California) | | 5.000% | | 1/1/48 | | | 5,000 | | 5,344 | |
| California Statewide Communities Development Authority Revenue (899 Charleston Project) | | 5.250% | | 11/1/44 | | | 1,000 | | 1,036 | |
| California Statewide Communities Development Authority Revenue (899 Charleston Project) | | 5.375% | | 11/1/49 | | | 2,300 | | 2,397 | |
| California Statewide Communities Development Authority Revenue (Adventist Health System/West) | | 5.000% | | 3/1/27 | | | 2,035 | | 2,370 | |
| California Statewide Communities Development Authority Revenue (Adventist Health System/West) | | 5.000% | | 3/1/31 | | | 4,745 | | 5,407 | |
| California Statewide Communities Development Authority Revenue (Adventist Health System/West) | | 5.000% | | 3/1/33 | | | 1,350 | | 1,559 | |
| California Statewide Communities Development Authority Revenue (Adventist Health System/West) | | 3.500% | | 3/1/38 | | | 625 | | 582 | |
| California Statewide Communities Development Authority Revenue (Adventist Health System/West) | | 5.000% | | 3/1/45 | | | 4,315 | | 4,739 | |
| California Statewide Communities Development Authority Revenue (Adventist Health System/West) | | 5.000% | | 3/1/48 | | | 3,000 | | 3,356 | |
| California Statewide Communities Development Authority Revenue (Buck Institute for Age Research) | | 5.000% | | 11/15/29 | (4) | | 940 | | 1,055 | |
| California Statewide Communities Development Authority Revenue (Buck Institute for Age Research) | | 5.000% | | 11/15/44 | (4) | | 5,500 | | 6,025 | |
190
California Long-Term Tax-Exempt Fund
| | | | | | | | Face | | Market | |
| | | | | Maturity | | | Amount | | Value· | |
| | | Coupon | | Date | | | ($000 | ) | ($000 | ) |
| California Statewide Communities Development Authority Revenue (Buck Institute for Age Research) | | 5.000% | | 11/15/49 | (4) | | 1,000 | | 1,092 | |
| California Statewide Communities Development Authority Revenue (Cottage Health System Obligated Group) | | 5.000% | | 11/1/39 | | | 310 | | 340 | |
| California Statewide Communities Development Authority Revenue (Cottage Health System Obligated Group) | | 5.000% | | 11/1/40 | | | 7,200 | | 7,484 | |
| California Statewide Communities Development Authority Revenue (Cottage Health System Obligated Group) | | 5.000% | | 11/1/43 | | | 13,705 | | 14,996 | |
| California Statewide Communities Development Authority Revenue (Covenant Retirement Communities Inc.) | | 5.625% | | 12/1/36 | | | 4,000 | | 4,450 | |
| California Statewide Communities Development Authority Revenue (Daughters of Charity Health System) | | 5.750% | | 7/1/30 | | | 5,000 | | 4,210 | |
| California Statewide Communities Development Authority Revenue (Daughters of Charity Health System) | | 5.750% | | 7/1/35 | | | 1,515 | | 1,273 | |
| California Statewide Communities Development Authority Revenue (Episcopal Communities & Services) | | 5.000% | | 5/15/42 | | | 2,500 | | 2,626 | |
| California Statewide Communities Development Authority Revenue (Episcopal Communities & Services) | | 5.000% | | 5/15/47 | | | 2,000 | | 2,093 | |
| California Statewide Communities Development Authority Revenue (Huntington Memorial Hospital) | | 5.000% | | 7/1/43 | | | 1,500 | | 1,657 | |
| California Statewide Communities Development Authority Revenue (Huntington Memorial Hospital) | | 5.000% | | 7/1/44 | | | 5,800 | | 6,248 | |
| California Statewide Communities Development Authority Revenue (Huntington Memorial Hospital) | | 5.000% | | 7/1/48 | | | 7,000 | | 7,697 | |
| California Statewide Communities Development Authority Revenue (John Muir Health) | | 5.000% | | 8/15/46 | | | 1,525 | | 1,675 | |
| California Statewide Communities Development Authority Revenue (John Muir Health) | | 5.000% | | 8/15/51 | | | 3,000 | | 3,284 | |
| California Statewide Communities Development Authority Revenue (John Muir Health) | | 5.000% | | 12/1/53 | | | 2,500 | | 2,729 | |
| California Statewide Communities Development Authority Revenue (John Muir Health) | | 5.000% | | 12/1/57 | | | 3,775 | | 4,104 | |
| California Statewide Communities Development Authority Revenue (Kaiser Permanente) | | 5.000% | | 4/1/42 | | | 15,465 | | 16,424 | |
| California Statewide Communities Development Authority Revenue (Loma Linda University Medical Center) | | 5.500% | | 12/1/58 | | | 2,500 | | 2,657 | |
| California Statewide Communities Development Authority Revenue (Marin General Hospital) | | 5.000% | | 8/1/34 | | | 680 | | 780 | |
| California Statewide Communities Development Authority Revenue (Marin General Hospital) | | 5.000% | | 8/1/35 | | | 800 | | 914 | |
191
California Long-Term Tax-Exempt Fund
| | | | | | | | Face | | Market | |
| | | | | Maturity | | | Amount | | Value· | |
| | | Coupon | | Date | | | ($000 | ) | ($000 | ) |
| California Statewide Communities Development Authority Revenue (Marin General Hospital) | | 5.000% | | 8/1/36 | | | 780 | | 887 | |
| California Statewide Communities Development Authority Revenue (Marin General Hospital) | | 5.000% | | 8/1/37 | | | 520 | | 590 | |
| California Statewide Communities Development Authority Revenue (Marin General Hospital) | | 5.000% | | 8/1/38 | | | 500 | | 564 | |
| California Statewide Communities Development Authority Revenue (Redlands Community Hospital) | | 5.000% | | 10/1/46 | | | 1,600 | | 1,724 | |
| California Statewide Communities Development Authority Revenue (Sutter Health) | | 5.250% | | 8/15/31 | | | 2,500 | | 2,701 | |
| California Statewide Communities Development Authority Revenue (Sutter Health) | | 5.000% | | 8/15/32 | | | 11,000 | | 11,938 | |
| California Statewide Communities Development Authority Revenue (The Culinary Institute of America Project) | | 5.000% | | 7/1/41 | | | 800 | | 862 | |
| California Statewide Communities Development Authority Revenue (Trinity Health) | | 5.000% | | 12/1/41 | | | 11,025 | | 11,930 | |
| California Statewide Communities Development Authority Senior Living Revenue (Southern California Presbyterian Homes) | | 7.250% | | 11/15/41 | | | 3,000 | | 3,126 | |
| California Statewide Communities Development Authority Student Housing Revenue (CHF-Irvine LLC - UCI East Campus Apartments Phase II) | | 5.000% | | 5/15/29 | | | 2,000 | | 2,235 | |
| California Statewide Communities Development Authority Student Housing Revenue (CHF-Irvine LLC - UCI East Campus Apartments Phase II) | | 5.000% | | 5/15/30 | | | 3,500 | | 3,892 | |
| California Statewide Communities Development Authority Student Housing Revenue (CHF-Irvine LLC - UCI East Campus Apartments Phase II) | | 5.000% | | 5/15/32 | | | 2,500 | | 2,761 | |
| California Statewide Communities Development Authority Student Housing Revenue (CHF-Irvine LLC - UCI East Campus Apartments Phase II) | | 5.000% | | 5/15/40 | | | 4,445 | | 4,797 | |
| Campbell CA Union High School District GO | | 5.000% | | 8/1/35 | | | 1,000 | | 1,144 | |
| Carlsbad CA Unified School District GO | | 4.000% | | 5/1/32 | | | 575 | | 611 | |
| Carlsbad CA Unified School District GO | | 4.000% | | 5/1/33 | | | 685 | | 723 | |
| Carlsbad CA Unified School District GO | | 4.000% | | 5/1/34 | | | 690 | | 722 | |
| Centinela Valley CA Union High School District GO | | 6.000% | | 8/1/23 | (Prere.) | | 3,000 | | 3,546 | |
| Centinela Valley CA Union High School District GO | | 4.000% | | 8/1/50 | (4) | | 3,000 | | 3,029 | |
3 | Central CA Unified School District GO | | 4.000% | | 8/1/48 | | | 8,500 | | 8,493 | |
| Central School District San Bernardino California GO | | 5.000% | | 8/1/47 | | | 3,000 | | 3,347 | |
| Ceres CA Unified School District GO | | 5.000% | | 8/1/51 | (15) | | 5,000 | | 5,527 | |
| Cerritos CA Community College District GO | | 4.000% | | 8/1/33 | | | 2,135 | | 2,204 | |
| Cerritos CA Community College District GO | | 0.000% | | 8/1/34 | | | 4,000 | | 2,253 | |
| Cerritos CA Community College District GO | | 0.000% | | 8/1/35 | | | 1,730 | | 927 | |
| Cerritos CA Community College District GO | | 5.000% | | 8/1/38 | | | 7,000 | | 7,594 | |
192
California Long-Term Tax-Exempt Fund
| | | | | | | | Face | | Market | |
| | | | | Maturity | | | Amount | | Value· | |
| | | Coupon | | Date | | | ($000 | ) | ($000 | ) |
| Chabot-Las Positas CA Community College District GO | | 5.000% | | 8/1/30 | | | 3,500 | | 3,901 | |
| Chabot-Las Positas CA Community College District GO | | 4.000% | | 8/1/47 | | | 1,100 | | 1,122 | |
| Charter Oak CA Unified School District GO | | 5.000% | | 8/1/31 | (4) | | 1,380 | | 1,565 | |
| Charter Oak CA Unified School District GO | | 5.000% | | 8/1/33 | (4) | | 1,755 | | 1,978 | |
| Chico CA Unified School District GO | | 4.000% | | 8/1/35 | | | 1,880 | | 1,957 | |
| Chula Vista CA Redevelopment Agency Successor Agency Tax Allocation Revenue | | 4.000% | | 10/1/25 | | | 2,130 | | 2,324 | |
| Chula Vista CA Redevelopment Agency Successor Agency Tax Allocation Revenue | | 4.000% | | 10/1/26 | | | 1,175 | | 1,287 | |
4 | Citrus CA Community College District GO | | 0.000% | | 8/1/36 | | | 1,810 | | 1,612 | |
4 | Citrus CA Community College District GO | | 0.000% | | 8/1/37 | | | 2,475 | | 2,200 | |
4 | Citrus CA Community College District GO | | 0.000% | | 8/1/38 | | | 2,150 | | 1,907 | |
| Clovis CA Wastewater System Revenue | | 5.000% | | 8/1/37 | (15) | | 1,000 | | 1,144 | |
| Clovis CA Wastewater System Revenue | | 5.000% | | 8/1/38 | (15) | | 2,220 | | 2,533 | |
| Colton CA Joint Unified School District GO | | 5.000% | | 8/1/27 | (4) | | 2,535 | | 2,836 | |
| Conejo Valley CA Unified School District GO | | 0.000% | | 8/1/29 | (4) | | 2,000 | | 1,340 | |
| Conejo Valley CA Unified School District GO | | 0.000% | | 8/1/30 | (4) | | 1,865 | | 1,179 | |
| Contra Costa CA Community College District GO | | 5.000% | | 8/1/38 | | | 3,600 | | 3,982 | |
| Contra Costa CA Transportation Authority Sales Tax Revenue | | 5.000% | | 3/1/29 | | | 1,400 | | 1,665 | |
| Contra Costa CA Transportation Authority Sales Tax Revenue | | 5.000% | | 3/1/34 | | | 1,970 | | 2,182 | |
| Cotati-Rohnert Park CA Unified School District GO | | 5.000% | | 8/1/44 | (4) | | 3,000 | | 3,325 | |
2 | Cotati-Rohnert Park CA Unified School District GO TOB VRDO | | 1.740% | | 12/7/18 | (15) | | 3,505 | | 3,505 | |
| Del Mar CA Race Track Authority Revenue | | 5.000% | | 10/1/38 | | | 1,500 | | 1,501 | |
| Dublin CA Community Facilities District Improvement Area No. 1 Special Tax Revenue (Dublin Crossing) | | 5.000% | | 9/1/37 | | | 1,150 | | 1,238 | |
| East Bay CA Municipal Utility District Water System Revenue | | 5.000% | | 6/1/30 | | | 3,325 | | 3,761 | |
| East Bay CA Municipal Utility District Water System Revenue | | 5.000% | | 6/1/30 | | | 1,500 | | 1,697 | |
| East Bay CA Municipal Utility District Water System Revenue | | 5.000% | | 6/1/45 | | | 2,315 | | 2,619 | |
| East Bay CA Regional Park District GO | | 5.000% | | 9/1/19 | (Prere.) | | 1,825 | | 1,869 | |
| East Bay CA Regional Park District GO | | 5.000% | | 9/1/25 | | | 175 | | 179 | |
| Eastern California Municipal Water District Water & Sewer Revenue | | 4.000% | | 7/1/34 | | | 5,300 | | 5,513 | |
| Eastern California Municipal Water District Water & Wastewater Revenue | | 4.000% | | 7/1/35 | | | 3,780 | | 3,920 | |
| Eastern California Municipal Water District Water & Wastewater Revenue | | 5.000% | | 7/1/39 | | | 2,030 | | 2,301 | |
| El Camino CA Community College District GO | | 5.000% | | 8/1/32 | | | 1,000 | | 1,156 | |
| El Camino CA Community College District GO | | 5.000% | | 8/1/33 | | | 1,115 | | 1,283 | |
| El Camino CA Community College District GO | | 5.000% | | 8/1/37 | | | 1,550 | | 1,753 | |
| El Camino CA Community College District GO | | 5.000% | | 8/1/48 | | | 6,550 | | 7,444 | |
| El Camino CA Healthcare District GO | | 4.000% | | 8/1/34 | | | 5,000 | | 5,250 | |
| El Dorado CA Irrigation District Revenue | | 5.250% | | 3/1/39 | (4) | | 7,500 | | 8,412 | |
| Encinitas CA Community Facilities District No. 1 Special Tax Revenue | | 5.000% | | 9/1/27 | | | 1,000 | | 1,076 | |
193
California Long-Term Tax-Exempt Fund
| | | | | | | | Face | | Market | |
| | | | | Maturity | | | Amount | | Value· | |
| | | Coupon | | Date | | | ($000 | ) | ($000 | ) |
| Escondido CA GO | | 5.000% | | 9/1/30 | | | 2,030 | | 2,349 | |
| Evergreen CA School District Election GO | | 4.000% | | 8/1/39 | | | 330 | | 341 | |
| Folsom Ranch CA Financing Authority Special Tax Revenue | | 5.000% | | 9/1/33 | | | 530 | | 581 | |
| Folsom Ranch CA Financing Authority Special Tax Revenue | | 5.000% | | 9/1/37 | | | 2,000 | | 2,148 | |
| Folsom Ranch CA Financing Authority Special Tax Revenue | | 5.000% | | 9/1/38 | | | 845 | | 910 | |
| Folsom Ranch CA Financing Authority Special Tax Revenue | | 5.000% | | 9/1/48 | | | 1,675 | | 1,794 | |
| Foothill-De Anza CA Community College District GO | | 0.000% | | 8/1/22 | (14) | | 3,850 | | 3,564 | |
| Foothill-De Anza CA Community College District GO | | 0.000% | | 8/1/23 | (14) | | 3,590 | | 3,236 | |
| Foothill-De Anza CA Community College District GO | | 0.000% | | 8/1/25 | (14) | | 2,390 | | 2,024 | |
5 | Foothill/Eastern Transportation Corridor Agency California Toll Road Revenue | | 0.000% | | 1/15/42 | | | 9,000 | | 8,032 | |
| Foothill/Eastern Transportation Corridor Agency California Toll Road Revenue | | 6.500% | | 1/15/43 | | | 2,200 | | 2,518 | |
| Foothill/Eastern Transportation Corridor Agency California Toll Road Revenue | | 5.750% | | 1/15/46 | | | 13,500 | | 15,044 | |
| Foothill/Eastern Transportation Corridor Agency California Toll Road Revenue | | 6.000% | | 1/15/53 | | | 6,675 | | 7,577 | |
| Fresno CA Joint Powers Financing Authority Lease Revenue | | 5.000% | | 4/1/35 | (4) | | 1,000 | | 1,118 | |
| Gilroy CA School Facilities Finance Authority Revenue | | 5.000% | | 8/1/46 | | | 5,000 | | 5,432 | |
| Gilroy CA Unified School District GO | | 4.000% | | 8/1/33 | | | 1,155 | | 1,219 | |
| Gilroy CA Unified School District GO | | 4.000% | | 8/1/36 | | | 1,000 | | 1,040 | |
| Gilroy CA Unified School District GO | | 4.000% | | 8/1/37 | | | 1,000 | | 1,036 | |
| Gilroy CA Unified School District GO | | 4.000% | | 8/1/41 | | | 3,115 | | 3,186 | |
| Gilroy CA Unified School District GO | | 4.000% | | 8/1/46 | | | 8,000 | | 8,133 | |
| Golden State Tobacco Securitization Corp. California Revenue | | 5.000% | | 6/1/25 | | | 4,120 | | 4,524 | |
| Golden State Tobacco Securitization Corp. California Revenue | | 0.000% | | 6/1/28 | (2) | | 10,035 | | 7,480 | |
| Golden State Tobacco Securitization Corp. California Revenue | | 5.000% | | 6/1/30 | | | 5,250 | | 5,783 | |
| Golden State Tobacco Securitization Corp. California Revenue | | 5.000% | | 6/1/31 | | | 6,500 | | 7,138 | |
| Golden State Tobacco Securitization Corp. California Revenue | | 5.000% | | 6/1/32 | | | 2,260 | | 2,463 | |
| Golden State Tobacco Securitization Corp. California Revenue | | 5.000% | | 6/1/33 | | | 1,365 | | 1,481 | |
| Golden State Tobacco Securitization Corp. California Revenue | | 5.000% | | 6/1/35 | | | 5,000 | | 5,521 | |
| Golden State Tobacco Securitization Corp. California Revenue | | 3.500% | | 6/1/36 | | | 7,500 | | 7,340 | |
| Golden State Tobacco Securitization Corp. California Revenue | | 5.000% | | 6/1/40 | | | 14,000 | | 15,278 | |
| Grossmont CA Healthcare District GO | | 6.125% | | 7/15/21 | (Prere.) | | 2,500 | | 2,774 | |
| Grossmont CA Union High School District GO | | 0.000% | | 8/1/30 | | | 6,500 | | 4,398 | |
194
California Long-Term Tax-Exempt Fund
| | | | | | | | Face | | Market | |
| | | | | Maturity | | | Amount | | Value· | |
| | | Coupon | | Date | | | ($000 | ) | ($000 | ) |
| Grossmont-Cuyamaca CA Community College District GO | | 4.000% | | 8/1/47 | | | 10,335 | | 10,468 | |
| Hartnell CA Community College District GO | | 4.000% | | 8/1/47 | | | 4,165 | | 4,220 | |
| Hayward CA Unified School District GO | | 5.000% | | 8/1/31 | (4) | | 3,780 | | 4,236 | |
| Hayward CA Unified School District GO | | 5.000% | | 8/1/31 | (4) | | 3,500 | | 3,922 | |
| Hemet CA Unified School District Financing Authority Special Tax Revenue | | 5.000% | | 9/1/39 | | | 1,100 | | 1,160 | |
| Imperial CA Community College District GO | | 0.000% | | 8/1/30 | (15) | | 2,125 | | 1,408 | |
| Imperial CA Irrigation District Electric Revenue | | 5.000% | | 11/1/32 | | | 2,765 | | 3,147 | |
| Imperial CA Irrigation District Electric Revenue | | 5.000% | | 11/1/45 | | | 4,010 | | 4,484 | |
| Imperial CA Unified School District GO | | 5.250% | | 8/1/43 | (15) | | 5,000 | | 5,716 | |
| Inglewood CA Redevelopment Agency Successor Agency Tax Allocation Revenue | | 5.000% | | 5/1/32 | (15) | | 1,000 | | 1,137 | |
| Inglewood CA Redevelopment Agency Successor Agency Tax Allocation Revenue | | 5.000% | | 5/1/34 | (15) | | 960 | | 1,082 | |
| Inglewood CA Redevelopment Agency Successor Agency Tax Allocation Revenue | | 5.000% | | 5/1/38 | (15) | | 500 | | 555 | |
| Irvine CA Facilities District No. 2013-3 Special Tax Revenue | | 5.000% | | 9/1/51 | (4) | | 1,250 | | 1,382 | |
| Irvine CA Unified School District Community Facilities District No. 09-1 Special Tax Revenue | | 5.000% | | 9/1/37 | | | 265 | | 287 | |
| Irvine CA Unified School District Community Facilities District No. 09-1 Special Tax Revenue | | 5.000% | | 9/1/42 | | | 400 | | 429 | |
| Irvine CA Unified School District Community Facilities District No. 09-1 Special Tax Revenue | | 5.000% | | 9/1/47 | | | 1,000 | | 1,067 | |
| Irvine CA Unified School District Community Facilities District No. 09-1 Special Tax Revenue | | 5.000% | | 9/1/51 | | | 1,000 | | 1,064 | |
| Jefferson CA Union High School District GO | | 5.000% | | 8/1/26 | (15) | | 1,000 | | 1,160 | |
| Kern County CA GO | | 5.750% | | 2/1/19 | (Prere.) | | 2,000 | | 2,013 | |
| La Quinta CA Redevelopment Agency Tax Allocation Revenue | | 5.000% | | 9/1/34 | | | 1,050 | | 1,182 | |
| La Verne CA (Brethren Hillcrest Homes) COP | | 5.000% | | 5/15/36 | | | 2,450 | | 2,530 | |
| Lancaster CA Redevelopment Agency Successor Agency Tax Allocation Revenue | | 5.000% | | 8/1/29 | | | 1,000 | | 1,146 | |
| Lancaster CA Redevelopment Agency Successor Agency Tax Allocation Revenue | | 5.000% | | 8/1/30 | | | 1,255 | | 1,429 | |
| Las Virgenes CA Unified School District GO | | 0.000% | | 9/1/26 | (14) | | 6,140 | | 4,977 | |
| Lincoln CA Special Tax Revenue (Lincoln Crossing Project) | | 5.000% | | 9/1/32 | (4) | | 3,220 | | 3,763 | |
| Lincoln CA Special Tax Revenue (Lincoln Crossing Project) | | 5.000% | | 9/1/34 | (4) | | 2,000 | | 2,312 | |
| Livermore Valley CA Water Financing Authority Revenue | | 5.000% | | 7/1/30 | | | 625 | | 733 | |
| Livermore Valley CA Water Financing Authority Revenue | | 4.000% | | 7/1/43 | | | 3,000 | | 3,077 | |
| Livermore Valley CA Water Financing Authority Revenue | | 5.000% | | 7/1/47 | | | 4,000 | | 4,476 | |
| Lodi CA Public Financing Authority Electric Revenue | | 5.000% | | 9/1/32 | (4) | | 1,640 | | 1,933 | |
| Long Beach CA Airport Revenue | | 5.000% | | 6/1/40 | | | 4,440 | | 4,626 | |
| Long Beach CA Community College District GO | | 0.000% | | 8/1/34 | | | 2,520 | | 1,411 | |
| Long Beach CA Finance Authority Natural Gas Purchase Revenue | | 3.183% | | 11/15/26 | | | 1,800 | | 1,809 | |
195
California Long-Term Tax-Exempt Fund
| | | | | | | | Face | | Market | |
| | | | | Maturity | | | Amount | | Value· | |
| | | Coupon | | Date | | | ($000 | ) | ($000 | ) |
| Long Beach CA Finance Authority Natural Gas Purchase Revenue | | 5.000% | | 11/15/29 | | | 1,235 | | 1,438 | |
| Long Beach CA Finance Authority Natural Gas Purchase Revenue | | 5.000% | | 11/15/35 | | | 1,340 | | 1,586 | |
| Long Beach CA Finance Authority Natural Gas Purchase Revenue | | 5.500% | | 11/15/37 | | | 3,090 | | 3,868 | |
| Long Beach CA Finance Authority Tax Revenue | | 5.500% | | 8/1/26 | (2) | | 7,570 | | 8,519 | |
| Long Beach CA Finance Authority Tax Revenue | | 5.500% | | 8/1/31 | (2) | | 4,215 | | 4,948 | |
| Long Beach CA Harbor Revenue | | 5.000% | | 5/15/39 | | | 1,510 | | 1,695 | |
| Long Beach CA Harbor Revenue | | 5.000% | | 5/15/42 | | | 2,000 | | 2,240 | |
| Long Beach CA Harbor Revenue | | 5.000% | | 5/15/47 | | | 4,955 | | 5,545 | |
| Long Beach CA Unified School District GO | | 0.000% | | 8/1/26 | | | 1,870 | | 1,499 | |
| Los Angeles CA Community College District GO | | 5.250% | | 8/1/20 | (Prere.) | | 5,000 | | 5,290 | |
| Los Angeles CA Community College District GO | | 5.000% | | 8/1/28 | | | 3,510 | | 4,012 | |
| Los Angeles CA Community College District GO | | 4.000% | | 8/1/29 | | | 1,250 | | 1,372 | |
| Los Angeles CA Community College District GO | | 5.000% | | 8/1/30 | | | 5,500 | | 6,231 | |
| Los Angeles CA Community College District GO | | 4.000% | | 8/1/31 | | | 1,790 | | 1,924 | |
| Los Angeles CA Community College District GO | | 4.000% | | 8/1/32 | | | 1,700 | | 1,820 | |
| Los Angeles CA Community College District GO | | 4.000% | | 8/1/33 | | | 3,500 | | 3,663 | |
| Los Angeles CA Community College District GO | | 4.000% | | 8/1/33 | | | 1,075 | | 1,142 | |
| Los Angeles CA Community College District GO | | 4.000% | | 8/1/36 | | | 2,300 | | 2,394 | |
| Los Angeles CA Community College District GO | | 4.000% | | 8/1/37 | | | 5,000 | | 5,135 | |
| Los Angeles CA Community College District GO | | 4.000% | | 8/1/41 | | | 5,000 | | 5,108 | |
| Los Angeles CA Department of Airports International Airport Revenue | | 5.000% | | 5/15/30 | | | 14,590 | | 15,234 | |
| Los Angeles CA Department of Airports International Airport Revenue | | 5.000% | | 5/15/30 | | | 3,195 | | 3,335 | |
| Los Angeles CA Department of Airports International Airport Revenue | | 5.000% | | 5/15/35 | | | 16,000 | | 17,379 | |
| Los Angeles CA Department of Airports International Airport Revenue | | 5.000% | | 5/15/35 | | | 4,000 | | 4,168 | |
| Los Angeles CA Department of Airports International Airport Revenue | | 5.000% | | 5/15/35 | | | 1,000 | | 1,141 | |
| Los Angeles CA Department of Airports International Airport Revenue | | 5.000% | | 5/15/38 | | | 4,625 | | 5,156 | |
| Los Angeles CA Department of Water & Power Revenue | | 5.000% | | 7/1/25 | | | 4,070 | | 4,081 | |
| Los Angeles CA Department of Water & Power Revenue | | 5.000% | | 7/1/29 | | | 5,000 | | 5,742 | |
| Los Angeles CA Department of Water & Power Revenue | | 5.000% | | 7/1/30 | | | 5,000 | | 6,005 | |
| Los Angeles CA Department of Water & Power Revenue | | 5.000% | | 7/1/30 | | | 2,000 | | 2,380 | |
| Los Angeles CA Department of Water & Power Revenue | | 5.000% | | 7/1/31 | | | 1,355 | | 1,557 | |
| Los Angeles CA Department of Water & Power Revenue | | 5.000% | | 7/1/33 | | | 5,000 | | 5,900 | |
| Los Angeles CA Department of Water & Power Revenue | | 5.000% | | 7/1/33 | | | 2,500 | | 2,813 | |
| Los Angeles CA Department of Water & Power Revenue | | 5.000% | | 7/1/34 | | | 9,000 | | 10,560 | |
| Los Angeles CA Department of Water & Power Revenue | | 5.000% | | 7/1/35 | | | 3,500 | | 3,918 | |
196
California Long-Term Tax-Exempt Fund
| | | | | | | | Face | | Market | |
| | | | | Maturity | | | Amount | | Value· | |
| | | Coupon | | Date | | | ($000 | ) | ($000 | ) |
| Los Angeles CA Department of Water & Power Revenue | | 5.000% | | 7/1/36 | | | 10,000 | | 10,857 | |
| Los Angeles CA Department of Water & Power Revenue | | 5.000% | | 7/1/36 | | | 4,765 | | 5,437 | |
| Los Angeles CA Department of Water & Power Revenue | | 5.000% | | 7/1/36 | | | 3,760 | | 4,244 | |
| Los Angeles CA Department of Water & Power Revenue | | 5.000% | | 7/1/36 | | | 5,000 | | 5,275 | |
| Los Angeles CA Department of Water & Power Revenue | | 5.000% | | 7/1/37 | | | 1,700 | | 1,956 | |
| Los Angeles CA Department of Water & Power Revenue | | 5.000% | | 7/1/37 | | | 4,675 | | 5,324 | |
| Los Angeles CA Department of Water & Power Revenue | | 5.000% | | 7/1/37 | | | 1,640 | | 1,890 | |
| Los Angeles CA Department of Water & Power Revenue | | 5.000% | | 7/1/37 | | | 1,545 | | 1,676 | |
| Los Angeles CA Department of Water & Power Revenue | | 5.000% | | 7/1/38 | | | 4,345 | | 4,989 | |
| Los Angeles CA Department of Water & Power Revenue | | 5.000% | | 7/1/38 | | | 1,000 | | 1,148 | |
| Los Angeles CA Department of Water & Power Revenue | | 5.000% | | 7/1/38 | | | 5,000 | | 5,421 | |
| Los Angeles CA Department of Water & Power Revenue | | 5.000% | | 7/1/38 | | | 1,750 | | 1,964 | |
| Los Angeles CA Department of Water & Power Revenue | | 5.000% | | 7/1/38 | | | 2,500 | | 2,840 | |
| Los Angeles CA Department of Water & Power Revenue | | 5.000% | | 7/1/39 | | | 4,000 | | 4,440 | |
| Los Angeles CA Department of Water & Power Revenue | | 5.250% | | 7/1/39 | | | 2,000 | | 2,123 | |
| Los Angeles CA Department of Water & Power Revenue | | 5.000% | | 7/1/40 | | | 2,020 | | 2,256 | |
| Los Angeles CA Department of Water & Power Revenue | | 5.000% | | 7/1/41 | | | 5,000 | | 5,639 | |
| Los Angeles CA Department of Water & Power Revenue | | 5.000% | | 7/1/42 | | | 4,500 | | 5,011 | |
| Los Angeles CA Department of Water & Power Revenue | | 5.000% | | 7/1/43 | | | 5,000 | | 5,478 | |
| Los Angeles CA Department of Water & Power Revenue | | 5.000% | | 7/1/43 | | | 5,000 | | 5,411 | |
| Los Angeles CA Department of Water & Power Revenue | | 5.000% | | 7/1/43 | | | 10,150 | | 10,984 | |
| Los Angeles CA Department of Water & Power Revenue | | 5.000% | | 7/1/44 | | | 13,950 | | 15,379 | |
| Los Angeles CA Department of Water & Power Revenue | | 5.000% | | 7/1/46 | | | 2,500 | | 2,775 | |
| Los Angeles CA Harbor Department Revenue | | 4.000% | | 8/1/39 | | | 3,000 | | 3,084 | |
| Los Angeles CA Municipal Improvement Corp. Lease Revenue | | 5.000% | | 11/1/29 | | | 3,000 | | 3,507 | |
| Los Angeles CA Municipal Improvement Corp. Lease Revenue | | 5.000% | | 11/1/30 | | | 2,420 | | 2,807 | |
| Los Angeles CA Municipal Improvement Corp. Lease Revenue | | 4.000% | | 11/1/33 | | | 5,200 | | 5,470 | |
197
California Long-Term Tax-Exempt Fund
| | | | | | | | Face | | Market | |
| | | | | Maturity | | | Amount | | Value· | |
| | | Coupon | | Date | | | ($000 | ) | ($000 | ) |
| Los Angeles CA Municipal Improvement Corp. Lease Revenue | | 4.000% | | 11/1/34 | | | 2,500 | | 2,612 | |
| Los Angeles CA Unified School District GO | | 5.000% | | 7/1/28 | | | 8,000 | | 9,092 | |
| Los Angeles CA Unified School District GO | | 5.000% | | 7/1/28 | | | 2,040 | | 2,460 | |
| Los Angeles CA Unified School District GO | | 5.250% | | 7/1/28 | | | 5,500 | | 5,780 | |
| Los Angeles CA Unified School District GO | | 5.000% | | 7/1/30 | | | 2,860 | | 3,239 | |
| Los Angeles CA Unified School District GO | | 5.000% | | 7/1/30 | | | 2,820 | | 3,358 | |
| Los Angeles CA Unified School District GO | | 5.000% | | 1/1/34 | | | 5,000 | | 5,084 | |
| Los Angeles CA Unified School District GO | | 5.250% | | 7/1/34 | | | 10,000 | | 10,483 | |
| Los Angeles CA Unified School District GO | | 4.000% | | 7/1/35 | | | 5,000 | | 5,160 | |
| Los Angeles CA Wastewater System Revenue | | 5.000% | | 6/1/33 | | | 1,000 | | 1,167 | |
| Los Angeles CA Wastewater System Revenue | | 5.000% | | 6/1/34 | | | 3,250 | | 3,777 | |
| Los Angeles CA Wastewater System Revenue | | 5.000% | | 6/1/35 | | | 2,500 | | 2,895 | |
| Los Angeles CA Wastewater System Revenue | | 5.000% | | 6/1/36 | | | 1,660 | | 1,915 | |
| Los Angeles CA Wastewater System Revenue | | 5.000% | | 6/1/37 | | | 2,100 | | 2,416 | |
| Los Angeles CA Wastewater System Revenue | | 5.000% | | 6/1/43 | | | 2,840 | | 3,113 | |
| Los Angeles CA Wastewater System Revenue | | 5.000% | | 6/1/48 | | | 10,000 | | 11,357 | |
| Los Angeles County CA Facilities Inc. Lease Revenue | | 4.000% | | 12/1/48 | | | 7,500 | | 7,536 | |
| Los Angeles County CA Metropolitan Transportation Authority Sales Tax Revenue | | 5.000% | | 6/1/31 | | | 2,010 | | 2,342 | |
| Los Angeles County CA Metropolitan Transportation Authority Sales Tax Revenue | | 5.000% | | 6/1/32 | | | 2,340 | | 2,717 | |
| Los Angeles County CA Metropolitan Transportation Authority Sales Tax Revenue | | 5.000% | | 6/1/34 | | | 5,000 | | 5,758 | |
| Los Angeles County CA Metropolitan Transportation Authority Sales Tax Revenue | | 5.000% | | 7/1/34 | | | 3,305 | | 3,847 | |
| Los Angeles County CA Metropolitan Transportation Authority Sales Tax Revenue | | 5.000% | | 7/1/37 | | | 3,580 | | 4,119 | |
| Los Angeles County CA Public Works Financing Authority Lease Revenue | | 5.000% | | 8/1/37 | | | 2,750 | | 2,989 | |
| Los Angeles County CA Public Works Financing Authority Lease Revenue | | 5.000% | | 8/1/42 | | | 5,940 | | 6,442 | |
| Los Angeles County CA Sanitation Districts Financing Authority Revenue | | 5.000% | | 10/1/35 | | | 4,000 | | 4,546 | |
| Los Angeles County CA Schools Regionalized Business Services Corp. COP | | 0.000% | | 8/1/20 | (2) | | 2,095 | | 2,017 | |
| Los Rios CA Community College District GO | | 4.000% | | 8/1/34 | | | 4,500 | | 4,740 | |
| M-S-R California Energy Authority Revenue | | 7.000% | | 11/1/34 | | | 7,000 | | 9,750 | |
| M-S-R California Energy Authority Revenue | | 7.000% | | 11/1/34 | | | 3,200 | | 4,457 | |
| M-S-R California Energy Authority Revenue | | 6.500% | | 11/1/39 | | | 3,500 | | 4,788 | |
| M-S-R California Energy Authority Revenue | | 6.500% | | 11/1/39 | | | 4,195 | | 5,739 | |
| M-S-R California Public Power Agency Revenue (San Juan Project) | | 6.750% | | 7/1/20 | (ETM) | | 3,375 | | 3,561 | |
| Manhattan Beach CA Unified School District GO | | 5.000% | | 9/1/41 | | | 1,735 | | 2,011 | |
| Manhattan Beach CA Unified School District GO | | 5.000% | | 9/1/42 | | | 1,645 | | 1,901 | |
| Manhattan Beach CA Unified School District GO | | 5.000% | | 9/1/43 | | | 2,910 | | 3,353 | |
| Marin CA Community College District GO | | 4.000% | | 8/1/35 | | | 700 | | 736 | |
| Marin CA Community College District GO | | 4.000% | | 8/1/38 | | | 1,500 | | 1,553 | |
| Marin CA Healthcare District GO | | 5.000% | | 8/1/29 | | | 1,055 | | 1,221 | |
| Marina Coast Water District California Enterprise Revenue | | 5.000% | | 6/1/37 | | | 4,085 | | 4,605 | |
| Metropolitan Water District of Southern California Revenue | | 5.000% | | 10/1/33 | | | 6,000 | | 6,539 | |
198
California Long-Term Tax-Exempt Fund
| | | | | | | | Face | | Market | |
| | | | | Maturity | | | Amount | | Value· | |
| | | Coupon | | Date | | | ($000 | ) | ($000 | ) |
| Metropolitan Water District of Southern California Revenue | | 5.000% | | 7/1/34 | | | 5,480 | | 6,274 | |
| Metropolitan Water District of Southern California Revenue | | 5.000% | | 7/1/40 | | | 4,500 | | 5,061 | |
| Milpitas CA Redevelopment Agency Successor Agency Tax Allocation Revenue | | 5.000% | | 9/1/26 | | | 2,085 | | 2,430 | |
| Milpitas CA Redevelopment Agency Successor Agency Tax Allocation Revenue | | 5.000% | | 9/1/30 | | | 4,000 | | 4,578 | |
| Modesto CA Irrigation District Financing Authority Electric Revenue | | 5.000% | | 10/1/40 | | | 6,000 | | 6,622 | |
| Modesto CA Irrigation District Financing Authority Revenue (Woodland Project) | | 6.500% | | 10/1/22 | (ETM) | | 4,345 | | 4,757 | |
| Moreno Valley CA Community Redevelopment Agency Successor Agency Tax Allocation Revenue | | 5.000% | | 8/1/31 | | | 1,660 | | 1,926 | |
| Moreno Valley CA Unified School District Financing Authority Special Tax Revenue | | 5.000% | | 9/1/33 | | | 1,605 | | 1,758 | |
| Morgan Hill CA Unified School District GO | | 4.000% | | 8/1/47 | | | 8,000 | | 8,165 | |
| Mountain View-Whisman CA School District COP | | 4.000% | | 6/1/30 | | | 675 | | 712 | |
| Mountain View-Whisman CA School District COP | | 4.000% | | 6/1/32 | | | 1,500 | | 1,573 | |
6 | Napa Valley CA Community College District GO | | 0.000% | | 8/1/33 | | | 2,500 | | 2,416 | |
6 | Napa Valley CA Community College District GO | | 0.000% | | 8/1/34 | | | 2,000 | | 1,920 | |
| New Haven CA Unified School District GO | | 5.000% | | 8/1/27 | (15) | | 3,000 | | 3,419 | |
| New Haven CA Unified School District GO | | 5.000% | | 8/1/28 | (15) | | 2,000 | | 2,270 | |
| Newark CA Unified School District GO | | 5.000% | | 8/1/44 | | | 6,000 | | 6,647 | |
| Newport Beach CA Revenue (Hoag Memorial Hospital Presbyterian) | | 6.000% | | 12/1/21 | (Prere.) | | 3,525 | | 3,950 | |
| Newport Mesa CA Unified School District GO | | 0.000% | | 8/1/35 | | | 4,000 | | 2,193 | |
| Newport Mesa CA Unified School District GO | | 0.000% | | 8/1/36 | | | 1,000 | | 521 | |
| Newport Mesa CA Unified School District GO | | 0.000% | | 8/1/37 | | | 2,000 | | 998 | |
| Newport Mesa CA Unified School District GO | | 0.000% | | 8/1/38 | | | 1,000 | | 477 | |
| Northern California Power Agency Revenue (Hydroelectric Project) | | 7.500% | | 7/1/21 | (Prere.) | | 1,365 | | 1,502 | |
| Northern California Transmission Agency Revenue | | 5.000% | | 5/1/37 | | | 3,610 | | 4,068 | |
| Northern California Transmission Agency Revenue | | 5.000% | | 5/1/38 | | | 1,850 | | 2,080 | |
| Northstar Community Services District California Community Facilities District No. 1 Special Tax Revenue | | 5.000% | | 9/1/25 | | | 1,825 | | 1,911 | |
| Northstar Community Services District California Community Facilities District No. 1 Special Tax Revenue | | 5.000% | | 9/1/26 | | | 1,995 | | 2,077 | |
| Norwalk-La Mirada CA Unified School District GO | | 5.000% | | 8/1/44 | | | 4,320 | | 4,853 | |
| Norwalk-La Mirada CA Unified School District GO | | 4.000% | | 8/1/47 | | | 5,055 | | 5,107 | |
| Oakland CA GO | | 5.000% | | 1/15/29 | | | 1,640 | | 1,892 | |
| Oakland CA Unified School District GO | | 6.625% | | 8/1/21 | (Prere.) | | 1,000 | | 1,125 | |
| Oakland CA Unified School District GO | | 5.000% | | 8/1/35 | | | 2,850 | | 3,227 | |
199
California Long-Term Tax-Exempt Fund
| | | | | | | | Face | | Market | |
| | | | | Maturity | | | Amount | | Value· | |
| | | Coupon | | Date | | | ($000 | ) | ($000 | ) |
| Oakland CA Unified School District GO | | 5.000% | | 8/1/40 | | | 500 | | 560 | |
| Oceanside CA Unified School District GO | | 0.000% | | 8/1/25 | (ETM) | | 755 | | 640 | |
| Oceanside CA Unified School District GO | | 0.000% | | 8/1/25 | (12) | | 6,110 | | 5,138 | |
| Pajaro Valley CA Unified School District GO | | 5.000% | | 8/1/43 | | | 5,000 | | 5,651 | |
| Palm Desert CA Redevelopment Agency Tax Allocation Revenue | | 5.000% | | 10/1/28 | (15) | | 1,100 | | 1,300 | |
| Palo Alto CA Improvement Revenue (University Avenue Area Parking) | | 4.250% | | 9/2/22 | | | 200 | | 215 | |
| Palo Alto CA Improvement Revenue (University Avenue Area Parking) | | 5.000% | | 9/2/26 | | | 1,000 | | 1,087 | |
| Palomar CA Community College District GO | | 0.000% | | 8/1/24 | | | 5,125 | | 4,475 | |
| Palomar CA Community College District GO | | 4.000% | | 8/1/45 | | | 3,000 | | 3,063 | |
| Palomar Pomerado Health California COP | | 6.000% | | 11/1/20 | (Prere.) | | 3,800 | | 4,102 | |
| Palomar Pomerado Health California GO | | 0.000% | | 8/1/33 | (12) | | 4,000 | | 2,274 | |
| Palomar Pomerado Health California GO | | 5.000% | | 8/1/34 | | | 600 | | 667 | |
| Palomar Pomerado Health California GO | | 4.000% | | 8/1/35 | | | 4,100 | | 4,202 | |
| Palomar Pomerado Health California GO | | 0.000% | | 8/1/36 | | | 5,000 | | 2,339 | |
| Palomar Pomerado Health California Revenue | | 5.000% | | 11/1/39 | | | 5,000 | | 5,278 | |
| Palomar Pomerado Health California Revenue | | 5.000% | | 11/1/42 | | | 3,000 | | 3,163 | |
| Palomar Pomerado Health California Revenue | | 5.000% | | 11/1/47 | (4) | | 4,000 | | 4,443 | |
| Paramount CA Redevelopment Agency Successor Agency Tax Allocation Revenue (Redevelopment Project Area No. 1) | | 0.000% | | 8/1/26 | (14) | | 3,000 | | 2,241 | |
| Pasadena CA Unified School District GO | | 5.000% | | 5/1/34 | | | 4,000 | | 4,348 | |
| Pittsburg CA Redevelopment Agency Tax Allocation Revenue (Los Medanos Community Development Project) | | 0.000% | | 8/1/19 | (2) | | 1,800 | | 1,776 | |
| Pittsburg CA Redevelopment Agency Tax Allocation Revenue (Los Medanos Community Development Project) | | 0.000% | | 8/1/21 | (2) | | 2,920 | | 2,741 | |
| Pittsburg CA Redevelopment Agency Tax Allocation Revenue (Los Medanos Community Development Project) | | 0.000% | | 8/1/22 | (2) | | 4,125 | | 3,765 | |
| Pittsburg CA Redevelopment Agency Tax Allocation Revenue (Los Medanos Community Development Project) | | 0.000% | | 8/1/24 | (2) | | 1,000 | | 855 | |
| Pittsburg CA Water Revenue | | 5.000% | | 8/1/28 | | | 585 | | 700 | |
| Pleasanton CA Unified School District GO | | 4.000% | | 8/1/42 | | | 7,300 | | 7,507 | |
| Poway CA Unified School District GO | | 5.000% | | 9/1/25 | | | 1,825 | | 1,981 | |
| Poway CA Unified School District GO | | 5.000% | | 9/1/27 | | | 2,040 | | 2,198 | |
| Poway CA Unified School District GO | | 5.000% | | 9/1/31 | | | 1,355 | | 1,444 | |
| Poway CA Unified School District GO | | 0.000% | | 8/1/33 | | | 5,010 | | 2,936 | |
| Poway CA Unified School District GO | | 0.000% | | 8/1/33 | | | 990 | | 580 | |
| Poway CA Unified School District GO | | 5.000% | | 9/1/33 | | | 985 | | 1,046 | |
| Poway CA Unified School District GO | | 0.000% | | 8/1/34 | | | 8,130 | | 4,530 | |
| Poway CA Unified School District GO | | 5.000% | | 9/1/36 | | | 600 | | 634 | |
| Poway CA Unified School District GO | | 0.000% | | 8/1/46 | | | 10,000 | | 3,065 | |
1 | Poway CA Unified School District GO | | 0.000% | | 8/1/51 | | | 10,000 | | 2,435 | |
| Poway CA Unified School District Public Financing Authority Community Facilities District No. 11 Zones 2 & 3 Special Tax Revenue | | 5.000% | | 9/15/38 | | | 1,200 | | 1,228 | |
200
California Long-Term Tax-Exempt Fund
| | | | | | | | Face | | Market | |
| | | | | Maturity | | | Amount | | Value· | |
| | | Coupon | | Date | | | ($000 | ) | ($000 | ) |
| Poway CA Unified School District Public Financing Authority Community Facilities District No. 11 Zones 2 & 3 Special Tax Revenue | | 5.000% | | 9/15/43 | | | 2,325 | | 2,375 | |
| Poway CA Unified School District Public Financing Authority Special Tax Revenue | | 5.000% | | 9/15/24 | | | 785 | | 879 | |
| Poway CA Unified School District Public Financing Authority Special Tax Revenue | | 5.000% | | 9/1/27 | | | 1,385 | | 1,602 | |
| Poway CA Unified School District Public Financing Authority Special Tax Revenue | | 5.000% | | 9/15/27 | | | 1,030 | | 1,143 | |
| Poway CA Unified School District Public Financing Authority Special Tax Revenue | | 5.000% | | 9/1/28 | | | 2,340 | | 2,683 | |
| Poway CA Unified School District Public Financing Authority Special Tax Revenue | | 5.000% | | 9/1/29 | | | 3,465 | | 3,947 | |
| Poway CA Unified School District Public Financing Authority Special Tax Revenue | | 5.000% | | 9/1/30 | | | 1,775 | | 2,010 | |
| Poway CA Unified School District Public Financing Authority Special Tax Revenue | | 5.000% | | 9/1/33 | (15) | | 1,750 | | 1,964 | |
| Rancho Cucamonga CA Redevelopment Agency Successor Agency Tax Allocation Revenue (Rancho Redevelopment Project) | | 5.000% | | 9/1/29 | (4) | | 1,800 | | 2,042 | |
| Redding CA Electric System Revenue | | 5.000% | | 6/1/30 | | | 1,665 | | 1,955 | |
| Redding CA Joint Powers Financing Authority Electric System Revenue | | 5.000% | | 6/1/29 | | | 1,000 | | 1,146 | |
| Redding CA Joint Powers Financing Authority Electric System Revenue | | 5.000% | | 6/1/31 | | | 600 | | 681 | |
| Redwood City CA Redevelopment Agency Redevelopment Project Area No. 2 Tax Allocation Revenue | | 0.000% | | 7/15/26 | (2) | | 3,445 | | 2,732 | |
| Rio Hondo CA Community College District GO | | 0.000% | | 8/1/36 | | | 16,650 | | 8,403 | |
2 | Riverside CA Electric Revenue TOB VRDO | | 1.720% | | 12/7/18 | | | 2,475 | | 2,475 | |
| Riverside CA Sewer Revenue | | 5.000% | | 8/1/32 | | | 3,000 | | 3,539 | |
| Riverside CA Sewer Revenue | | 5.000% | | 8/1/33 | | | 3,660 | | 4,298 | |
| Riverside CA Unified School District Financing Authority Revenue | | 5.000% | | 9/1/24 | | | 1,440 | | 1,564 | |
| Riverside CA Unified School District Financing Authority Revenue | | 5.000% | | 9/1/28 | | | 1,795 | | 1,942 | |
| Riverside CA Unified School District Financing Authority Revenue | | 5.000% | | 9/1/29 | | | 1,880 | | 2,033 | |
| Riverside CA Unified School District Financing Authority Revenue | | 5.000% | | 9/1/32 | | | 1,375 | | 1,484 | |
| Riverside County CA Infrastructure Financing Authority (Indio Law Building) | | 4.000% | | 11/1/44 | | | 10,090 | | 10,317 | |
| Riverside County CA Public Financing Authority Lease Revenue | | 5.000% | | 11/1/33 | | | 5,000 | | 5,681 | |
| Riverside County CA Public Financing Authority Lease Revenue | | 5.250% | | 11/1/40 | | | 5,000 | | 5,732 | |
| Riverside County CA Public Financing Authority Lease Revenue | | 5.250% | | 11/1/45 | | | 8,000 | | 9,145 | |
| Riverside County CA Public Financing Authority Tax Allocation Revenue | | 5.000% | | 10/1/32 | (15) | | 820 | | 938 | |
2 | Riverside County CA Public Financing Authority Tax Allocation Revenue TOB VRDO | | 1.790% | | 12/7/18 | (15) | | 2,420 | | 2,420 | |
201
California Long-Term Tax-Exempt Fund
| | | | | | | | Face | | Market | |
| | | | | Maturity | | | Amount | | Value· | |
| | | Coupon | | Date | | | ($000 | ) | ($000 | ) |
| Riverside County CA Redevelopment Successor Agency Tax Allocation Revenue | | 4.000% | | 10/1/37 | (4) | | 1,500 | | 1,533 | |
7 | Riverside County CA Redevelopment Successor Agency Tax Allocation Revenue | | 0.000% | | 10/1/41 | (15) | | 2,000 | | 1,907 | |
| Riverside County CA Transportation Commission Sales Tax Revenue | | 5.000% | | 6/1/38 | | | 3,500 | | 3,993 | |
| Riverside County CA Transportation Commission Toll Revenue | | 0.000% | | 6/1/41 | | | 6,710 | | 2,299 | |
| Riverside County CA Transportation Commission Toll Revenue | | 0.000% | | 6/1/42 | | | 2,975 | | 967 | |
| Riverside County CA Transportation Commission Toll Revenue | | 0.000% | | 6/1/43 | | | 7,500 | | 2,319 | |
| Riverside County CA Transportation Commission Toll Revenue | | 5.750% | | 6/1/48 | | | 2,000 | | 2,170 | |
| Roseville CA Financing Authority Electric System Revenue | | 5.000% | | 2/1/20 | (Prere.) | | 4,500 | | 4,672 | |
| Roseville CA Financing Authority Electric System Revenue | | 4.000% | | 2/1/37 | | | 7,480 | | 7,715 | |
| Roseville CA Natural Gas Financing Authority Gas Revenue | | 5.000% | | 2/15/22 | | | 1,635 | | 1,752 | |
| Roseville CA Natural Gas Financing Authority Gas Revenue | | 5.000% | | 2/15/28 | | | 2,460 | | 2,796 | |
| Roseville CA Special Tax Revenue | | 5.000% | | 9/1/37 | | | 1,250 | | 1,332 | |
| Ross Valley CA Public Financing Authority Revenue | | 5.000% | | 1/1/39 | | | 500 | | 558 | |
| Ross Valley CA Public Financing Authority Revenue | | 5.000% | | 1/1/43 | | | 1,190 | | 1,325 | |
| Sacramento CA Area Flood Control Agency Special Assessment Revenue (Natomas Basin Local Assessment) | | 5.000% | | 10/1/39 | (15) | | 1,900 | | 2,087 | |
| Sacramento CA Area Flood Control Agency Special Assessment Revenue (Natomas Basin Local Assessment) | | 5.000% | | 10/1/44 | (15) | | 2,000 | | 2,184 | |
| Sacramento CA City Financing Authority Tax Allocation Revenue | | 0.000% | | 12/1/30 | (14) | | 3,000 | | 1,947 | |
| Sacramento CA Financing Authority Lease Revenue | | 5.400% | | 11/1/20 | (2) | | 2,500 | | 2,612 | |
| Sacramento CA Municipal Utility District Revenue | | 5.000% | | 8/15/28 | | | 2,000 | | 2,253 | |
| Sacramento CA Municipal Utility District Revenue | | 5.000% | | 8/15/31 | | | 1,175 | | 1,289 | |
| Sacramento CA Municipal Utility District Revenue | | 5.000% | | 8/15/32 | | | 1,195 | | 1,309 | |
| Sacramento CA Municipal Utility District Revenue | | 5.000% | | 8/15/33 | | | 1,450 | | 1,586 | |
| Sacramento CA Regional Transportation District Farebox Revenue | | 5.000% | | 3/1/36 | | | 1,370 | | 1,429 | |
| Sacramento CA Regional Transportation District Farebox Revenue | | 5.000% | | 3/1/42 | | | 3,125 | | 3,258 | |
| Sacramento CA Transient Occupancy Tax Revenue (Convention Center Complex) | | 5.000% | | 6/1/36 | | | 2,245 | | 2,559 | |
| Sacramento CA Transient Occupancy Tax Revenue (Convention Center Complex) | | 5.000% | | 6/1/48 | | | 10,000 | | 11,133 | |
202
California Long-Term Tax-Exempt Fund
| | | | | | | | Face | | Market | |
| | | | | Maturity | | | Amount | | Value· | |
| | | Coupon | | Date | | | ($000 | ) | ($000 | ) |
| Sacramento CA Transient Occupancy Tax Revenue (Sub-Convention Center Complex) | | 5.000% | | 6/1/48 | | | 5,000 | | 5,554 | |
| Sacramento County CA Airport Revenue | | 5.000% | | 7/1/31 | | | 500 | | 587 | |
| Sacramento County CA Airport Revenue | | 5.000% | | 7/1/33 | | | 1,500 | | 1,736 | |
| Sacramento County CA Airport Revenue | | 5.000% | | 7/1/34 | | | 1,225 | | 1,420 | |
| Sacramento County CA Airport Revenue | | 5.000% | | 7/1/34 | | | 2,000 | | 2,302 | |
| Sacramento County CA Airport Revenue | | 5.000% | | 7/1/35 | | | 2,515 | | 2,899 | |
| Sacramento County CA Airport Revenue | | 5.000% | | 7/1/35 | | | 2,000 | | 2,289 | |
| Sacramento County CA Airport Revenue | | 5.000% | | 7/1/38 | | | 1,330 | | 1,516 | |
| Sacramento County CA Airport Revenue | | 5.000% | | 7/1/41 | | | 7,500 | | 8,315 | |
| Sacramento County CA Airport Revenue | | 5.000% | | 7/1/41 | | | 5,770 | | 6,368 | |
| Sacramento County CA Sanitation Districts Financing Authority Revenue | | 5.000% | | 8/1/32 | | | 1,000 | | 1,143 | |
| Sacramento County CA Sanitation Districts Financing Authority Revenue | | 5.000% | | 12/1/35 | | | 4,920 | | 5,525 | |
| San Bernardino CA City Unified School District GO | | 5.000% | | 8/1/27 | (4) | | 1,060 | | 1,189 | |
| San Bernardino CA City Unified School District GO | | 0.000% | | 8/1/35 | (4) | | 5,900 | | 3,090 | |
| San Bernardino CA City Unified School District GO | | 0.000% | | 8/1/36 | (4) | | 5,000 | | 2,480 | |
| San Bernardino CA City Unified School District GO | | 4.000% | | 8/1/42 | (4) | | 4,500 | | 4,531 | |
| San Bernardino CA Community College District GO | | 0.000% | | 8/1/44 | | | 15,000 | | 4,976 | |
| San Bernardino CA Community College District GO | | 5.000% | | 8/1/45 | | | 3,500 | | 3,904 | |
| San Bernardino CA Community College District GO | | 0.000% | | 8/1/48 | | | 17,770 | | 4,953 | |
| San Bernardino County CA Transportation Authority Revenue | | 5.000% | | 3/1/32 | | | 4,035 | | 4,391 | |
| San Diego CA Association of Governments South Bay Expressway Toll Revenue | | 5.000% | | 7/1/42 | | | 3,080 | | 3,421 | |
| San Diego CA Community College District GO | | 5.000% | | 8/1/21 | (Prere.) | | 3,000 | | 3,250 | |
| San Diego CA Community College District GO | | 5.000% | | 8/1/21 | (Prere.) | | 2,500 | | 2,709 | |
| San Diego CA Community College District GO | | 4.000% | | 8/1/32 | | | 3,200 | | 3,418 | |
| San Diego CA Community College District GO | | 4.000% | | 8/1/32 | | | 3,935 | | 4,203 | |
| San Diego CA Community College District GO | | 0.000% | | 8/1/36 | | | 8,000 | | 4,137 | |
| San Diego CA Community College District GO | | 0.000% | | 8/1/38 | | | 3,510 | | 1,636 | |
| San Diego CA Public Facilities Financing Authority Sewer Revenue | | 5.250% | | 5/15/19 | (Prere.) | | 7,000 | | 7,116 | |
| San Diego CA Public Facilities Financing Authority Sewer Revenue | | 5.250% | | 5/15/19 | (Prere.) | | 6,000 | | 6,099 | |
| San Diego CA Public Facilities Financing Authority Water Revenue | | 5.500% | | 8/1/19 | (Prere.) | | 5,000 | | 5,127 | |
| San Diego CA Public Facilities Financing Authority Water Revenue | | 5.750% | | 8/1/19 | (Prere.) | | 2,500 | | 2,567 | |
| San Diego CA Public Facilities Financing Authority Water Revenue | | 5.000% | | 8/1/28 | | | 5,000 | | 5,899 | |
| San Diego CA Public Facilities Financing Authority Water Revenue | | 5.000% | | 8/1/36 | | | 5,000 | | 5,712 | |
| San Diego CA Unified School District GO | | 5.000% | | 7/1/28 | | | 7,000 | | 8,178 | |
| San Diego CA Unified School District GO | | 0.000% | | 7/1/29 | | | 8,150 | | 5,826 | |
| San Diego CA Unified School District GO | | 0.000% | | 7/1/30 | | | 1,500 | | 1,021 | |
203
California Long-Term Tax-Exempt Fund
| | | | | | | | Face | | Market | |
| | | | | Maturity | | | Amount | | Value· | |
| | | Coupon | | Date | | | ($000 | ) | ($000 | ) |
| San Diego CA Unified School District GO | | 0.000% | | 7/1/31 | | | 1,500 | | 971 | |
| San Diego CA Unified School District GO | | 0.000% | | 7/1/32 | | | 1,085 | | 672 | |
| San Diego CA Unified School District GO | | 4.000% | | 7/1/32 | | | 5,550 | | 5,865 | |
| San Diego CA Unified School District GO | | 0.000% | | 7/1/34 | | | 3,500 | | 1,961 | |
| San Diego CA Unified School District GO | | 4.000% | | 7/1/34 | | | 1,210 | | 1,266 | |
| San Diego CA Unified School District GO | | 5.000% | | 7/1/35 | | | 5,000 | | 5,549 | |
| San Diego CA Unified School District GO | | 0.000% | | 7/1/38 | | | 4,890 | | 2,278 | |
| San Diego CA Unified School District GO | | 4.000% | | 7/1/45 | | | 8,050 | | 8,189 | |
| San Diego CA Unified School District GO | | 0.000% | | 7/1/46 | | | 10,000 | | 3,248 | |
| San Diego CA Unified School District GO | | 4.000% | | 7/1/47 | | | 12,525 | | 12,745 | |
| San Diego CA Unified School District GO | | 0.000% | | 7/1/49 | | | 1,000 | | 281 | |
| San Diego County CA COP | | 5.000% | | 10/15/28 | | | 1,445 | | 1,653 | |
| San Diego County CA Regional Airport Authority Revenue | | 5.000% | | 7/1/26 | | | 4,000 | | 4,192 | |
| San Diego County CA Regional Airport Authority Revenue | | 5.000% | | 7/1/28 | | | 3,200 | | 3,350 | |
| San Diego County CA Regional Airport Authority Revenue | | 5.000% | | 7/1/34 | | | 2,715 | | 2,835 | |
| San Diego County CA Regional Airport Authority Revenue | | 5.000% | | 7/1/40 | | | 3,000 | | 3,129 | |
| San Diego County CA Regional Airport Authority Revenue | | 5.000% | | 7/1/42 | | | 4,000 | | 4,474 | |
| San Diego County CA Regional Airport Authority Revenue | | 5.000% | | 7/1/43 | | | 3,540 | | 3,858 | |
| San Diego County CA Regional Airport Authority Revenue | | 5.000% | | 7/1/47 | | | 5,355 | | 5,967 | |
| San Diego County CA Regional Transportation Commission Sales Tax Revenue | | 5.000% | | 4/1/35 | | | 1,540 | | 1,761 | |
| San Diego County CA Regional Transportation Commission Sales Tax Revenue | | 5.000% | | 4/1/37 | | | 1,500 | | 1,618 | |
| San Diego County CA Water Authority Revenue | | 5.000% | | 5/1/30 | | | 5,030 | | 5,860 | |
| San Diego County CA Water Authority Revenue | | 5.000% | | 5/1/36 | | | 8,350 | | 9,493 | |
| San Francisco CA Bay Area Rapid Transit District GO | | 5.000% | | 8/1/31 | | | 7,000 | | 8,109 | |
| San Francisco CA Bay Area Rapid Transit District Sales Tax Revenue | | 5.000% | | 7/1/30 | | | 1,550 | | 1,793 | |
| San Francisco CA City & County COP | | 4.000% | | 4/1/33 | | | 5,040 | | 5,312 | |
| San Francisco CA City & County COP | | 4.000% | | 9/1/33 | | | 5,855 | | 6,086 | |
| San Francisco CA City & County GO | | 4.000% | | 6/15/34 | | | 8,485 | | 8,875 | |
| San Francisco CA City & County GO | | 4.000% | | 6/15/35 | | | 8,825 | | 9,171 | |
| San Francisco CA City & County International Airport Revenue | | 5.000% | | 5/3/21 | (Prere.) | | 1,485 | | 1,597 | |
| San Francisco CA City & County International Airport Revenue | | 5.000% | | 5/1/30 | | | 980 | | 1,133 | |
| San Francisco CA City & County International Airport Revenue | | 5.000% | | 5/1/32 | | | 1,000 | | 1,143 | |
| San Francisco CA City & County International Airport Revenue | | 5.000% | | 5/1/43 | | | 8,000 | | 8,736 | |
| San Francisco CA City & County International Airport Revenue | | 5.000% | | 5/1/44 | | | 6,000 | | 6,590 | |
| San Francisco CA City & County International Airport Revenue | | 5.000% | | 5/1/46 | | | 15,930 | | 17,582 | |
| San Francisco CA City & County International Airport Revenue | | 5.000% | | 5/1/48 | | | 4,090 | | 4,596 | |
204
California Long-Term Tax-Exempt Fund
| | | | | | | | Face | | Market | |
| | | | | Maturity | | | Amount | | Value· | |
| | | Coupon | | Date | | | ($000 | ) | ($000 | ) |
| San Francisco CA City & County Public Utilities Commission Wastewater Revenue | | 5.000% | | 10/1/34 | | | 3,000 | | 3,507 | |
| San Francisco CA City & County Public Utilities Commission Wastewater Revenue | | 5.000% | | 10/1/34 | | | 2,675 | | 3,045 | |
| San Francisco CA City & County Public Utilities Commission Wastewater Revenue | | 5.000% | | 10/1/35 | | | 2,815 | | 3,193 | |
| San Francisco CA City & County Public Utilities Commission Wastewater Revenue | | 5.000% | | 10/1/36 | | | 7,000 | | 8,101 | |
| San Francisco CA City & County Public Utilities Commission Wastewater Revenue | | 5.000% | | 10/1/36 | | | 2,960 | | 3,344 | |
| San Francisco CA City & County Public Utilities Commission Wastewater Revenue | | 5.000% | | 10/1/37 | | | 2,080 | | 2,399 | |
| San Francisco CA City & County Public Utilities Commission Water Revenue | | 5.000% | | 11/1/21 | (Prere.) | | 5,000 | | 5,453 | |
| San Francisco CA City & County Public Utilities Commission Water Revenue | | 5.000% | | 11/1/21 | (Prere.) | | 1,205 | | 1,314 | |
| San Francisco CA City & County Public Utilities Commission Water Revenue | | 5.000% | | 11/1/21 | (Prere.) | | 1,100 | | 1,200 | |
| San Francisco CA City & County Public Utilities Commission Water Revenue | | 5.000% | | 5/1/22 | (Prere.) | | 5,000 | | 5,527 | |
| San Francisco CA City & County Public Utilities Commission Water Revenue | | 5.000% | | 5/1/22 | (Prere.) | | 950 | | 1,050 | |
| San Francisco CA City & County Public Utilities Commission Water Revenue | | 5.000% | | 5/1/22 | (Prere.) | | 4,000 | | 4,421 | |
| San Francisco CA City & County Public Utilities Commission Water Revenue | | 5.000% | | 10/1/29 | | | 12,680 | | 14,031 | |
| San Francisco CA City & County Public Utilities Commission Water Revenue | | 5.000% | | 11/1/29 | | | 5,035 | | 5,944 | |
| San Francisco CA City & County Public Utilities Commission Water Revenue | | 4.000% | | 11/1/30 | | | 2,040 | | 2,216 | |
| San Francisco CA City & County Public Utilities Commission Water Revenue | | 4.000% | | 11/1/31 | | | 2,430 | | 2,618 | |
| San Francisco CA City & County Public Utilities Commission Water Revenue | | 4.000% | | 11/1/31 | | | 1,015 | | 1,094 | |
| San Francisco CA City & County Public Utilities Commission Water Revenue | | 5.000% | | 11/1/32 | | | 4,000 | | 4,547 | |
| San Francisco CA City & County Public Utilities Commission Water Revenue | | 5.000% | | 11/1/32 | | | 1,305 | | 1,483 | |
| San Francisco CA City & County Public Utilities Commission Water Revenue | | 5.000% | | 11/1/33 | | | 1,370 | | 1,553 | |
| San Francisco CA City & County Public Utilities Commission Water Revenue | | 5.000% | | 11/1/35 | | | 11,000 | | 12,599 | |
| San Francisco CA City & County Public Utilities Commission Water Revenue | | 5.000% | | 11/1/35 | | | 1,860 | | 2,024 | |
| San Francisco CA City & County Public Utilities Commission Water Revenue | | 5.000% | | 11/1/36 | | | 4,010 | | 4,501 | |
| San Francisco CA City & County Public Utilities Commission Water Revenue | | 4.000% | | 11/1/39 | | | 8,000 | | 8,187 | |
| San Francisco CA City & County Public Utilities Commission Water Revenue | | 5.000% | | 11/1/43 | | | 10,000 | | 10,809 | |
| San Francisco CA City & County Redevelopment Financing Authority Tax Allocation Revenue (Mission Bay North) | | 6.500% | | 8/1/19 | (Prere.) | | 2,000 | | 2,064 | |
205
California Long-Term Tax-Exempt Fund
| | | | | | | | Face | | Market | |
| | | | | Maturity | | | Amount | | Value· | |
| | | Coupon | | Date | | | ($000 | ) | ($000 | ) |
| San Francisco CA City & County Redevelopment Financing Authority Tax Allocation Revenue (Mission Bay North) | | 6.750% | | 2/1/21 | (Prere.) | | 1,000 | | 1,105 | |
| San Francisco CA City & County Redevelopment Financing Authority Tax Allocation Revenue (Mission Bays Redevelopment Project) | | 5.000% | | 8/1/28 | | | 975 | | 1,131 | |
| San Francisco CA City & County Redevelopment Financing Authority Tax Allocation Revenue (Mission Bays Redevelopment Project) | | 5.000% | | 8/1/30 | | | 1,200 | | 1,380 | |
| San Francisco CA City & County Redevelopment Financing Authority Tax Allocation Revenue (Mission Bays Redevelopment Project) | | 5.000% | | 8/1/37 | | | 850 | | 945 | |
| San Francisco CA City & County Redevelopment Financing Authority Tax Allocation Revenue (Mission Bays Redevelopment Project) | | 5.000% | | 8/1/43 | | | 3,500 | | 3,818 | |
| San Francisco CA City & County Unified School District GO | | 5.250% | | 6/15/19 | (Prere.) | | 4,000 | | 4,077 | |
| San Francisco CA City & County Unified School District GO | | 5.000% | | 6/15/32 | | | 8,365 | | 8,701 | |
| San Joaquin County CA Transportation Authority Revenue | | 5.000% | | 3/1/37 | | | 7,000 | | 8,001 | |
| San Joaquin Hills CA Transportation Corridor Agency Toll Road Revenue | | 0.000% | | 1/15/24 | (14) | | 6,000 | | 5,103 | |
| San Joaquin Hills CA Transportation Corridor Agency Toll Road Revenue | | 0.000% | | 1/15/25 | (14) | | 6,045 | | 4,922 | |
| San Joaquin Hills CA Transportation Corridor Agency Toll Road Revenue | | 5.000% | | 1/15/34 | | | 5,000 | | 5,401 | |
| San Joaquin Hills CA Transportation Corridor Agency Toll Road Revenue | | 5.000% | | 1/15/44 | | | 10,010 | | 10,631 | |
| San Jose CA Airport Revenue | | 5.000% | | 3/1/42 | | | 2,570 | | 2,856 | |
| San Jose CA Redevelopment Agency Tax Allocation Revenue | | 5.500% | | 8/1/20 | (Prere.) | | 850 | | 902 | |
| San Jose CA Redevelopment Agency Tax Allocation Revenue | | 5.500% | | 8/1/20 | (Prere.) | | 2,750 | | 2,918 | |
| San Jose CA Redevelopment Agency Tax Allocation Revenue | | 5.000% | | 8/1/35 | | | 4,030 | | 4,632 | |
| San Jose CA Special Hotel Tax Revenue (Convention Center Expansion & Renovation Project) | | 6.500% | | 5/1/42 | | | 5,000 | | 5,497 | |
| San Jose CA Unified School District Santa Clara County GO | | 5.000% | | 8/1/32 | | | 10,000 | | 11,551 | |
| San Juan CA Unified School District GO | | 0.000% | | 8/1/20 | (4) | | 4,930 | | 4,775 | |
| San Juan CA Unified School District GO | | 0.000% | | 8/1/23 | (4) | | 4,540 | | 4,077 | |
| San Luis Obispo County CA Community College District GO | | 5.000% | | 8/1/28 | | | 890 | | 1,033 | |
| San Luis Obispo County CA Community College District GO | | 5.000% | | 8/1/32 | | | 1,395 | | 1,598 | |
| San Marcos CA Schools Financing Authority Lease Revenue | | 5.000% | | 8/15/29 | (4) | | 760 | | 909 | |
206
California Long-Term Tax-Exempt Fund
| | | | | | | | Face | | Market | |
| | | | | Maturity | | | Amount | | Value· | |
| | | Coupon | | Date | | | ($000 | ) | ($000 | ) |
| San Marcos CA Schools Financing Authority Lease Revenue | | 5.000% | | 8/15/34 | (4) | | 1,155 | | 1,345 | |
| San Marcos CA Unified School District GO | | 5.000% | | 8/1/21 | (Prere.) | | 5,620 | | 6,089 | |
| San Marcos CA Unified School District GO | | 5.000% | | 8/1/21 | (Prere.) | | 2,835 | | 3,072 | |
| San Marcos CA Unified School District GO | | 0.000% | | 8/1/32 | | | 2,600 | | 1,599 | |
| San Marcos CA Unified School District GO | | 4.000% | | 8/1/33 | | | 3,500 | | 3,679 | |
| San Marcos CA Unified School District GO | | 5.000% | | 8/1/35 | | | 5,000 | | 5,739 | |
| San Marcos CA Unified School District GO | | 5.000% | | 8/1/36 | | | 2,000 | | 2,278 | |
8 | San Mateo CA Union High School District GO | | 0.000% | | 9/1/41 | | | 5,000 | | 4,316 | |
3 | San Mateo County CA Community College District GO | | 5.000% | | 9/1/39 | | | 1,000 | | 1,139 | |
3 | San Mateo County CA Community College District GO | | 5.000% | | 9/1/40 | | | 1,100 | | 1,249 | |
| San Mateo County CA Joint Powers Financing Authority Lease Revenue (Capital Project Program) | | 5.000% | | 7/1/21 | (14) | | 3,500 | | 3,709 | |
| San Mateo County CA Joint Powers Financing Authority Lease Revenue (Capital Project Program) | | 4.000% | | 7/15/52 | | | 8,955 | | 8,971 | |
| San Mateo County CA Joint Powers Financing Authority Lease Revenue (Youth Services Campus) | | 5.000% | | 7/15/31 | | | 2,290 | | 2,642 | |
| San Mateo County CA Joint Powers Financing Authority Lease Revenue (Youth Services Campus) | | 4.000% | | 7/15/35 | | | 2,110 | | 2,208 | |
| San Mateo County CA Mid-Peninsula Water District COP | | 4.000% | | 12/1/46 | | | 2,000 | | 2,031 | |
| San Mateo-Foster City CA School District GO | | 4.000% | | 8/1/45 | | | 5,000 | | 5,075 | |
| San Pablo CA Redevelopment Agency Successor Agency Tax Allocation Revenue | | 5.000% | | 6/15/29 | (4) | | 1,780 | | 1,975 | |
| San Rafael CA Elementary School District GO | | 4.500% | | 8/1/42 | | | 2,645 | | 2,830 | |
| San Ramon CA Public Financing Authority Tax Allocation Revenue | | 0.000% | | 2/1/33 | (2) | | 2,000 | | 1,134 | |
| San Ramon Valley CA Unified School District GO | | 4.000% | | 8/1/34 | | | 3,445 | | 3,585 | |
| San Ysidro CA School District COP | | 5.000% | | 9/1/47 | (15) | | 2,045 | | 2,195 | |
| Santa Ana CA College Improvement District No. 1 Rancho Santiago Community College GO | | 4.000% | | 8/1/41 | | | 2,000 | | 2,058 | |
| Santa Ana CA Unified School District GO | | 0.000% | | 8/1/32 | (14) | | 3,680 | | 2,227 | |
| Santa Barbara CA Secondary/High School District GO | | 0.000% | | 8/1/40 | | | 2,050 | | 824 | |
| Santa Barbara CA Unified School District GO | | 4.000% | | 8/1/31 | | | 985 | | 1,065 | |
| Santa Barbara CA Unified School District GO | | 4.000% | | 8/1/31 | | | 500 | | 541 | |
| Santa Clara CA Electric Revenue | | 6.000% | | 7/1/31 | | | 3,000 | | 3,307 | |
| Santa Clara CA Unified School District GO | | 5.000% | | 7/1/20 | (Prere.) | | 4,000 | | 4,205 | |
| Santa Clara CA Unified School District GO | | 4.000% | | 7/1/41 | | | 5,000 | | 5,127 | |
| Santa Clara Valley CA Joint Powers Authority Revenue | | 5.000% | | 8/1/28 | | | 625 | | 742 | |
| Santa Clara Valley CA Joint Powers Authority Revenue | | 5.000% | | 8/1/29 | | | 525 | | 620 | |
| Santa Clarita CA Community College District GO | | 4.000% | | 8/1/41 | | | 6,850 | | 7,029 | |
| Santa Monica CA Community College District GO | | 4.000% | | 8/1/31 | | | 3,000 | | 3,174 | |
| Santa Monica CA Community College District GO | | 4.000% | | 8/1/35 | | | 1,000 | | 1,060 | |
207
California Long-Term Tax-Exempt Fund
| | | | | | | | Face | | Market | |
| | | | | Maturity | | | Amount | | Value· | |
| | | Coupon | | Date | | | ($000 | ) | ($000 | ) |
| Santa Monica CA Community College District GO | | 4.000% | | 8/1/36 | | | 1,250 | | 1,316 | |
| Santa Monica-Malibu CA Unified School District GO | | 4.000% | | 7/1/38 | | | 400 | | 413 | |
| Santa Rosa CA High School District GO | | 5.000% | | 8/1/36 | (4) | | 550 | | 626 | |
| Santa Rosa CA High School District GO | | 5.000% | | 8/1/37 | (4) | | 470 | | 534 | |
| Santa Rosa CA High School District GO | | 5.000% | | 8/1/39 | (4) | | 1,125 | | 1,268 | |
| Santa Rosa CA Wastewater Revenue | | 5.000% | | 9/1/28 | | | 4,845 | | 5,333 | |
| Santa Rosa CA Wastewater Revenue | | 5.000% | | 9/1/33 | | | 1,000 | | 1,095 | |
| Silicon Valley CA Clean Water Wastewater Revenue | | 5.000% | | 2/1/39 | | | 3,090 | | 3,418 | |
| Silicon Valley CA Clean Water Wastewater Revenue | | 5.000% | | 8/1/45 | | | 1,500 | | 1,685 | |
| Simi Valley CA Unified School District GO | | 0.000% | | 8/1/32 | (4) | | 1,720 | | 1,035 | |
| Simi Valley CA Unified School District GO | | 4.000% | | 8/1/35 | | | 1,230 | | 1,291 | |
| Solana Beach CA School District Special Tax Revenue | | 5.000% | | 9/1/32 | | | 995 | | 1,061 | |
| Solana Beach CA School District Special Tax Revenue | | 5.000% | | 9/1/35 | | | 2,495 | | 2,654 | |
| Solano County CA Community College District GO | | 5.000% | | 8/1/36 | | | 1,750 | | 2,008 | |
| Solano County CA Community College District GO | | 5.000% | | 8/1/37 | | | 1,050 | | 1,200 | |
| Southern California Public Power Authority Revenue (Natural Gas Project) | | 5.000% | | 11/1/28 | | | 3,600 | | 4,125 | |
| Southern California Public Power Authority Revenue (Natural Gas Project) | | 5.000% | | 11/1/33 | | | 3,530 | | 4,123 | |
| Southern California Public Power Authority Revenue (Transmission Project) | | 5.750% | | 7/1/21 | (14) | | 220 | | 221 | |
| Southern California Water Replenishment District Financing Authority Revenue | | 5.000% | | 8/1/41 | | | 8,000 | | 9,005 | |
| Southwestern California Community College District GO | | 4.000% | | 8/1/34 | | | 375 | | 393 | |
| Southwestern California Community College District GO | | 5.000% | | 8/1/44 | | | 7,045 | | 7,903 | |
| Southwestern California Community College District GO | | 4.000% | | 8/1/47 | | | 7,940 | | 8,039 | |
| State Center California Community College District GO | | 4.000% | | 8/1/42 | | | 2,315 | | 2,381 | |
| Stockton CA Public Financing Authority Wastewater Revenue | | 5.000% | | 9/1/29 | (15) | | 1,000 | | 1,126 | |
| Stockton CA Public Financing Authority Water Revenue | | 5.000% | | 10/1/31 | (15) | | 1,525 | | 1,751 | |
| Stockton CA Public Financing Authority Water Revenue | | 5.000% | | 10/1/36 | (15) | | 2,000 | | 2,255 | |
| Stockton CA Public Financing Authority Water Revenue | | 4.000% | | 10/1/37 | (15) | | 1,000 | | 1,011 | |
| Stockton CA Public Financing Authority Water Revenue (Delta Water Supply Project) | | 6.250% | | 10/1/38 | | | 2,160 | | 2,515 | |
| Stockton CA Redevelopment Agency Successor Agency Tax Allocation Revenue | | 5.000% | | 9/1/37 | (4) | | 4,220 | | 4,682 | |
| Stockton CA Unified School District GO | | 5.000% | | 8/1/38 | (4) | | 2,500 | | 2,741 | |
| Suisun City CA Redevelopment Agency Successor Agency Tax Allocation Revenue | | 5.000% | | 10/1/31 | (15) | | 1,225 | | 1,368 | |
208
California Long-Term Tax-Exempt Fund
| | | | | | | | Face | | Market | |
| | | | | Maturity | | | Amount | | Value· | |
| | | Coupon | | Date | | | ($000 | ) | ($000 | ) |
| Suisun City CA Redevelopment Agency Successor Agency Tax Allocation Revenue | | 5.000% | | 10/1/32 | (15) | | 1,250 | | 1,392 | |
| Suisun City CA Redevelopment Agency Successor Agency Tax Allocation Revenue | | 5.000% | | 10/1/33 | (15) | | 1,280 | | 1,423 | |
| Sweetwater CA Unified School District GO | | 5.000% | | 8/1/29 | (15) | | 4,200 | | 4,734 | |
| Tahoe-Truckee CA Unified School District GO | | 5.000% | | 8/1/39 | | | 2,500 | | 2,823 | |
| Temecula CA Development Agency Successor Agency Tax Allocation Revenue | | 5.000% | | 12/15/38 | (4) | | 3,115 | | 3,466 | |
9 | Temecula Valley CA Unified School District GO | | 0.000% | | 8/1/35 | (15) | | 3,000 | | 3,052 | |
10 | Temecula Valley CA Unified School District GO | | 0.000% | | 8/1/37 | (15) | | 3,785 | | 3,854 | |
| Torrance CA Hospital Revenue (Torrance Memorial Medical Center) | | 5.000% | | 9/1/40 | | | 3,000 | | 3,138 | |
| Tulare County CA Transportation Authority Sales Tax Revenue | | 4.000% | | 2/1/34 | | | 1,540 | | 1,565 | |
| Turlock CA Irrigation District Revenue | | 5.000% | | 1/1/31 | | | 2,000 | | 2,113 | |
| Tustin CA Community Facilities District Special Tax Revenue | | 5.000% | | 9/1/37 | | | 1,000 | | 1,103 | |
| Tustin CA Unified School District Special Tax Revenue | | 5.000% | | 9/1/31 | | | 3,000 | | 3,289 | |
| Ukiah CA Unified School District GO | | 0.000% | | 8/1/32 | (10) | | 6,425 | | 3,915 | |
| Union CA Elementary School District GO | | 0.000% | | 9/1/20 | (14) | | 2,300 | | 2,224 | |
| Union CA Elementary School District GO | | 0.000% | | 9/1/21 | (14) | | 2,000 | | 1,889 | |
| University of California Regents Medical Center Pooled Revenue | | 5.000% | | 5/15/35 | | | 1,760 | | 1,970 | |
| University of California Regents Medical Center Pooled Revenue | | 5.000% | | 5/15/41 | | | 10,000 | | 11,052 | |
| University of California Regents Medical Center Pooled Revenue | | 4.000% | | 5/15/44 | | | 7,515 | | 7,581 | |
| University of California Revenue | | 5.000% | | 5/15/21 | (Prere.) | | 2,230 | | 2,397 | |
| University of California Revenue | | 5.000% | | 5/15/21 | (Prere.) | | 1,560 | | 1,677 | |
| University of California Revenue | | 5.000% | | 5/15/23 | (Prere.) | | 1,550 | | 1,757 | |
| University of California Revenue | | 5.000% | | 5/15/23 | (Prere.) | | 2,325 | | 2,635 | |
| University of California Revenue | | 5.000% | | 5/15/29 | | | 2,060 | | 2,421 | |
| University of California Revenue | | 5.000% | | 5/15/31 | | | 2,020 | | 2,331 | |
| University of California Revenue | | 5.000% | | 5/15/32 | | | 7,925 | | 9,064 | |
| University of California Revenue | | 5.000% | | 5/15/32 | | | 1,000 | | 1,149 | |
| University of California Revenue | | 5.000% | | 5/15/33 | | | 2,675 | | 2,958 | |
| University of California Revenue | | 4.000% | | 5/15/34 | | | 5,000 | | 5,229 | |
| University of California Revenue | | 4.000% | | 5/15/34 | | | 7,000 | | 7,319 | |
| University of California Revenue | | 4.000% | | 5/15/34 | | | 7,000 | | 7,297 | |
| University of California Revenue | | 5.000% | | 5/15/34 | | | 4,820 | | 5,627 | |
| University of California Revenue | | 5.000% | | 5/15/34 | | | 2,975 | | 3,169 | |
| University of California Revenue | | 4.000% | | 5/15/35 | | | 5,000 | | 5,206 | |
| University of California Revenue | | 5.000% | | 5/15/35 | | | 7,475 | | 8,680 | |
| University of California Revenue | | 5.000% | | 5/15/35 | | | 2,080 | | 2,214 | |
| University of California Revenue | | 5.000% | | 5/15/36 | | | 5,250 | | 6,006 | |
| University of California Revenue | | 5.000% | | 5/15/37 | | | 3,535 | | 4,033 | |
| University of California Revenue | | 5.250% | | 5/15/37 | | | 3,500 | | 3,951 | |
| University of California Revenue | | 5.000% | | 5/15/38 | | | 10,000 | | 10,940 | |
| University of California Revenue | | 5.000% | | 5/15/40 | | | 50 | | 50 | |
| University of California Revenue | | 5.000% | | 5/15/40 | | | 5,000 | | 5,586 | |
| University of California Revenue | | 5.000% | | 5/15/41 | | | 10,250 | | 11,421 | |
| University of California Revenue | | 5.000% | | 5/15/42 | | | 5,025 | | 5,650 | |
| University of California Revenue | | 4.000% | | 5/15/46 | | | 13,280 | | 13,361 | |
209
California Long-Term Tax-Exempt Fund
| | | | | | | | Face | | Market | |
| | | | | Maturity | | | Amount | | Value· | |
| | | Coupon | | Date | | | ($000 | ) | ($000 | ) |
| University of California Revenue | | 5.000% | | 5/15/47 | | | 15,000 | | 16,717 | |
| University of California Revenue | | 5.000% | | 5/15/47 | | | 1,000 | | 1,117 | |
| University of California Revenue | | 5.000% | | 5/15/48 | | | 11,500 | | 12,966 | |
| University of California Revenue | | 5.000% | | 5/15/52 | | | 8,000 | | 8,862 | |
| University of California Revenue PUT | | 5.000% | | 5/15/23 | | | 6,500 | | 7,308 | |
| Upland CA COP (San Antonio Regional Hospital) | | 4.000% | | 1/1/42 | | | 5,000 | | 4,878 | |
| Upland CA COP (San Antonio Regional Hospital) | | 5.000% | | 1/1/47 | | | 4,000 | | 4,329 | |
3 | Val Verde CA Unified School District CP | | 5.000% | | 3/1/32 | (4) | | 750 | | 866 | |
3 | Val Verde CA Unified School District CP | | 5.000% | | 3/1/33 | (4) | | 1,000 | | 1,150 | |
3 | Val Verde CA Unified School District CP | | 5.000% | | 3/1/35 | (4) | | 2,445 | | 2,785 | |
| Vallecitos CA Water District Water & Wastewater Enterprise Revenue | | 5.000% | | 7/1/33 | | | 1,110 | | 1,258 | |
| Vallecitos CA Water District Water & Wastewater Enterprise Revenue | | 5.000% | | 7/1/35 | | | 750 | | 848 | |
| Vallejo CA Sanitation & Flood Control COP | | 5.000% | | 7/1/19 | (14) | | 574 | | 582 | |
| Vista CA Redevelopment Agency Successor Agency Tax Allocation Revenue | | 5.000% | | 9/1/28 | (4) | | 1,970 | | 2,236 | |
| Vista CA Unified School District GO | | 0.000% | | 8/1/28 | (14) | | 7,425 | | 5,522 | |
| Walnut CA Energy Center Authority Revenue | | 5.000% | | 1/1/34 | | | 3,100 | | 3,473 | |
| Walnut Valley CA Unified School District GO | | 0.000% | | 8/1/36 | | | 1,000 | | 493 | |
| Washington Township CA Health Care District GO | | 5.500% | | 8/1/40 | | | 5,000 | | 5,730 | |
| Washington Township CA Health Care District Revenue | | 5.000% | | 7/1/33 | | | 1,080 | | 1,188 | |
| Washington Township CA Health Care District Revenue | | 4.000% | | 7/1/35 | | | 2,170 | | 2,151 | |
| West Contra Costa CA Unified School District GO | | 5.250% | | 8/1/21 | (Prere.) | | 7,000 | | 7,630 | |
| West Contra Costa CA Unified School District GO | | 0.000% | | 8/1/32 | (14) | | 7,650 | | 4,661 | |
| West Contra Costa CA Unified School District GO | | 5.000% | | 8/1/40 | | | 3,000 | | 3,391 | |
| West Sacramento CA Area Flood Control Agency Special Assessment Revenue | | 5.000% | | 9/1/40 | (4) | | 2,050 | | 2,269 | |
| West Sacramento CA Area Flood Control Agency Special Assessment Revenue | | 5.000% | | 9/1/45 | (4) | | 2,715 | | 2,991 | |
| Western Placer CA Unified School District COP | | 4.000% | | 8/1/41 | (4) | | 2,075 | | 2,108 | |
| Western Placer CA Unified School District GO | | 5.000% | | 8/1/42 | (15) | | 6,350 | | 7,104 | |
| Westminster CA Redevelopment Agency (Westminster Redevelopment Project No. 1) | | 5.000% | | 11/1/28 | (15) | | 690 | | 797 | |
| Westminster CA Redevelopment Agency (Westminster Redevelopment Project No. 1) | | 5.000% | | 11/1/29 | (15) | | 1,000 | | 1,148 | |
| Whittier CA Health Facilities Revenue (Presbyterian Intercommunity Hospital Obligated Group) | | 5.000% | | 6/1/44 | | | 4,500 | | 4,797 | |
| Yuba City CA Unified School District GO | | 0.000% | | 9/1/19 | (14) | | 2,270 | | 2,237 | |
| Yucaipa Valley CA Water District Water System Revenue | | 5.000% | | 9/1/27 | | | 1,000 | | 1,144 | |
| | | | | | | | | | 3,972,780 | |
Guam (0.0%) | | | | | | | | | | |
| Guam Power Authority Revenue | | 5.000% | | 10/1/24 | | | 1,000 | | 1,092 | |
Total Tax-Exempt Municipal Bonds (Cost $3,891,141) | | | | | | | 3,973,872 | |
210
California Long-Term Tax-Exempt Fund
| | | | | | | | | Amount | |
| | | | | | | | | ($000 | ) |
Other Assets and Liabilities (0.1%) | | | | | | | | | | |
Other Assets | | | | | | | | | | |
Investment in Vanguard | | | | | | | | | 212 | |
Receivables for Accrued Income | | | | | | | | | 39,041 | |
Receivables for Capital Shares Issued | | | | | | | | | 5,011 | |
Variation Margin Receivable—Futures Contracts | | | | | | | | | 29 | |
Other Assets | | | | | | | | | 402 | |
Total Other Assets | | | | | | | | | 44,695 | |
Liabilities | | | | | | | | | | |
Payables for Investment Securities Purchased | | | | | | | | | (23,723 | ) |
Payables for Capital Shares Redeemed | | | | | | | | | (3,328 | ) |
Payables for Distributions | | | | | | | | | (3,553 | ) |
Payables to Vanguard | | | | | | | | | (2,205 | ) |
Variation Margin Payable—Futures Contracts | | | | | | | | | (157 | ) |
Total Liabilities | | | | | | | | | (32,966 | ) |
Net Assets (100%) | | | | | | | | | 3,985,601 | |
At November 30, 2018, net assets consisted of: | | | | | | | | | | |
| | | | | | | | | | |
| | | | | | | | | Amount
($000 | ) |
Paid-in Capital | | | | | | | | | 3,923,703 | |
Total Distributable Earnings (Loss) | | | | | | | | | 61,898 | |
Net Assets | | | | | | | | | 3,985,601 | |
Investor Shares—Net Assets | | | | | | |
Applicable to 40,665,058 outstanding $.001 par value shares of beneficial interest (unlimited authorization) | | | | | 479,367 | |
Net Asset Value Per Share—Investor Shares | | | | | $11.79 | |
| | | | | | |
Admiral Shares—Net Assets | | | | | | |
Applicable to 297,436,320 outstanding $.001 par value shares of beneficial interest (unlimited authorization) | | | | | 3,506,234 | |
Net Asset Value Per Share—Admiral Shares | | | | | $11.79 | |
· See Note A in Notes to Financial Statements.
1 Securities with a value of $1,004,000 have been segregated as initial margin for open futures contracts
2 Security exempt from registration under Rule 144A of the Securities Act of 1933. Such securities may be sold in transactions exempt from registration, normally to qualified institutional buyers. At November 30, 2018, the aggregate value of these securities was $40,125,000, representing 1.0% of net assets.
3 Security purchased on a when-issued or delayed-delivery basis for which the fund has not taken delivery as of November 30, 2018
4 5.000% coupon rate will be effective February 2023.
5 6.850% coupon rate will be effective January 2024.
6 4.000% coupon rate will be effective February 2021.
7 5.000% coupon rate will be effective October 2021.
8 6.700% coupon rate will be effective September 2028.
9 4.500% coupon rate will be effective August 2019.
10 4.625% coupon rate will be effective August 2019.
A key to abbreviations and other references follows the Statement of Net Assets.
See accompanying Notes, which are an integral part of the Financial Statements.
211
California Long-Term Tax-Exempt Fund
Key to Abbreviations
ARS — Auction Rate Security.
BAN — Bond Anticipation Note.
COP — Certificate of Participation.
CP — Commercial Paper.
FR — Floating Rate.
GAN — Grant Anticipation Note.
GO — General Obligation Bond.
PILOT — Payments in Lieu of Taxes.
PUT — Put Option Obligation.
RAN — Revenue Anticipation Note.
TAN — Tax Anticipation Note.
TOB — Tender Option Bond.
TRAN — Tax Revenue Anticipation Note.
VRDO — Variable Rate Demand Obligation.
VRDP — Variable Rate Demand Preferred.
(ETM) — Escrowed to Maturity.
(Prere.) — Prerefunded.
Scheduled principal and interest payments are guaranteed by:
(1) MBIA (Municipal Bond Investors Assurance).
(2) AMBAC (Ambac Assurance Corporation).
(3) FGIC (Financial Guaranty Insurance Company).
(4) AGM (Assured Guaranty Municipal Corporation).
(5) BIGI (Bond Investors Guaranty Insurance).
(6) Connie Lee Inc.
(7) FHA (Federal Housing Authority).
(8) CapMAC (Capital Markets Assurance Corporation).
(9) American Capital Access Financial Guaranty Corporation.
(10) XL Capital Assurance Inc.
(11) CIFG (CDC IXIS Financial Guaranty).
(12) AGC (Assured Guaranty Corporation).
(13) BHAC (Berkshire Hathaway Assurance Corporation).
(14) NPFG (National Public Finance Guarantee Corporation).
(15) BAM (Build America Mutual Assurance Company).
(16) MAC (Municipal Assurance Corporation).
(17) RAA (Radian Asset Assurance Inc.).
(18) SBLF (Michigan School Bond Loan Fund).
(19) TPSF (Texas Permanent School Fund).
The insurance does not guarantee the market value of the municipal bonds.
LOC — Scheduled principal and interest payments are guaranteed by bank letter of credit.
212
California Long-Term Tax-Exempt Fund
Derivative Financial Instruments Outstanding as of Period End |
Futures Contracts |
| | | | | | | | ($000 | ) |
| | | | | | | | Value and | |
| | | | Number of | | | | Unrealized | |
| | | | Long (Short | ) | Notional | | Appreciation | |
| | Expiration | | Contracts | | Amount | | (Depreciation | ) |
Long Futures Contracts | | | | | | | | | |
5-Year U.S. Treasury Note | | March 2019 | | 742 | | 83,817 | | 123 | |
2-Year U.S. Treasury Note | | March 2019 | | 383 | | 80,807 | | 50 | |
| | | | | | | | 173 | |
| | | | | | | | | |
Short Futures Contracts | | | | | | | | | |
Ultra Long U.S. Treasury Bond | | March 2019 | | (178 | ) | (27,128 | ) | (59 | ) |
Ultra 10-Year U.S. Treasury Note | | March 2019 | | (133 | ) | (16,825 | ) | (37 | ) |
10-Year U.S. Treasury Note | | March 2019 | | (134 | ) | (16,007 | ) | (23 | ) |
30-Year U.S. Treasury Bond | | March 2019 | | (102 | ) | (14,270 | ) | (35 | ) |
| | | | | | | | (154 | ) |
| | | | | | | | 19 | |
See accompanying Notes, which are an integral part of the Financial Statements.
213
California Long-Term Tax-Exempt Fund
Statement of Operations
| | Year Ended | |
| | November 30, 2018 | |
| | ($000 | ) |
Investment Income | | | |
Income | | | |
Interest | | 138,491 | |
Total Income | | 138,491 | |
Expenses | | | |
The Vanguard Group—Note B | | | |
Investment Advisory Services | | 507 | |
Management and Administrative—Investor Shares | | 656 | |
Management and Administrative—Admiral Shares | | 2,417 | |
Marketing and Distribution—Investor Shares | | 96 | |
Marketing and Distribution—Admiral Shares | | 211 | |
Custodian Fees | | 25 | |
Auditing Fees | | 35 | |
Shareholders’ Reports and Proxy—Investor Shares | | 13 | |
Shareholders’ Reports and Proxy—Admiral Shares | | 18 | |
Trustees’ Fees and Expenses | | 2 | |
Total Expenses | | 3,980 | |
Net Investment Income | | 134,511 | |
Realized Net Gain (Loss) | | | |
Investment Securities Sold | | (2,080 | ) |
Futures Contracts | | (350 | ) |
Realized Net Gain (Loss) | | (2,430 | ) |
Change in Unrealized Appreciation (Depreciation) | | | |
Investment Securities | | (103,492 | ) |
Futures Contracts | | 372 | |
Change in Unrealized Appreciation (Depreciation) | | (103,120 | ) |
Net Increase (Decrease) in Net Assets Resulting from Operations | | 28,961 | |
See accompanying Notes, which are an integral part of the Financial Statements.
214
California Long-Term Tax-Exempt Fund
Statement of Changes in Net Assets
| | Year Ended November 30, | |
| | 2018 | | 2017 | |
| | ($000 | ) | ($000 | ) |
Increase (Decrease) in Net Assets | | | | | |
Operations | | | | | |
Net Investment Income | | 134,511 | | 126,202 | |
Realized Net Gain (Loss) | | (2,430 | ) | 10,183 | |
Change in Unrealized Appreciation (Depreciation) | | (103,120 | ) | 121,883 | |
Net Increase (Decrease) in Net Assets Resulting from Operations | | 28,961 | | 258,268 | |
Distributions | | | | | |
Net Investment Income | | | | | |
Investor Shares | | (16,260 | ) | (15,357 | ) |
Admiral Shares | | (118,407 | ) | (110,135 | ) |
Realized Capital Gain | | | | | |
Investor Shares | | — | | — | |
Admiral Shares | | — | | — | |
Total Distributions | | (134,667 | ) | (125,492 | ) |
Capital Share Transactions | | | | | |
Investor Shares | | 6,720 | | 13,831 | |
Admiral Shares | | 179,406 | | 241,094 | |
Net Increase (Decrease) from Capital Share Transactions | | 186,126 | | 254,925 | |
Total Increase (Decrease) | | 80,420 | | 387,701 | |
Net Assets | | | | | |
Beginning of Period | | 3,905,181 | | 3,517,480 | |
End of Period | | 3,985,601 | | 3,905,181 | |
See accompanying Notes, which are an integral part of the Financial Statements.
215
California Long-Term Tax-Exempt Fund
Financial Highlights
Investor Shares
For a Share Outstanding | | Year Ended November 30, | |
Throughout Each Period | | 2018 | | 2017 | | 2016 | | 2015 | | 2014 | |
Net Asset Value, Beginning of Period | | $12.10 | | $11.66 | | $12.12 | | $12.07 | | $11.31 | |
Investment Operations | | | | | | | | | | | |
Net Investment Income | | .394 | 1 | .396 | 1 | .410 | | .428 | | .442 | |
Net Realized and Unrealized Gain (Loss) on Investments | | (.309 | ) | .438 | | (.460 | ) | .050 | | .760 | |
Total from Investment Operations | | .085 | | .834 | | (.050 | ) | .478 | | 1.202 | |
Distributions | | | | | | | | | | | |
Dividends from Net Investment Income | | (.395 | ) | (.394 | ) | (.410 | ) | (.428 | ) | (.442 | ) |
Distributions from Realized Capital Gains | | — | | — | | — | | — | | — | |
Total Distributions | | (.395 | ) | (.394 | ) | (.410 | ) | (.428 | ) | (.442 | ) |
Net Asset Value, End of Period | | $11.79 | | $12.10 | | $11.66 | | $12.12 | | $12.07 | |
| | | | | | | | | | | |
Total Return2 | | 0.71% | | 7.22% | | -0.55% | | 4.03% | | 10.79% | |
| | | | | | | | | | | |
Ratios/Supplemental Data | | | | | | | | | | | |
Net Assets, End of Period (Millions) | | $479 | | $486 | | $455 | | $425 | | $397 | |
Ratio of Total Expenses to Average Net Assets | | 0.17% | | 0.19% | | 0.19% | | 0.20% | | 0.20% | |
Ratio of Net Investment Income to Average Net Assets | | 3.31% | | 3.29% | | 3.31% | | 3.55% | | 3.75% | |
Portfolio Turnover Rate | | 15% | | 16% | | 18% | | 17% | | 14% | |
1 Calculated based on average shares outstanding.
2 Total returns do not include account service fees that may have applied in the periods shown. Fund prospectuses provide information about any applicable account service fees.
See accompanying Notes, which are an integral part of the Financial Statements.
216
California Long-Term Tax-Exempt Fund
Financial Highlights
Admiral Shares
For a Share Outstanding | | Year Ended November 30, | |
Throughout Each Period | | 2018 | | 2017 | | 2016 | | 2015 | | 2014 | |
Net Asset Value, Beginning of Period | | $12.10 | | $11.66 | | $12.12 | | $12.07 | | $11.31 | |
Investment Operations | | | | | | | | | | | |
Net Investment Income | | .404 | 1 | .408 | 1 | .423 | | .438 | | .451 | |
Net Realized and Unrealized Gain (Loss) on Investments | | (.310 | ) | .438 | | (.460 | ) | .050 | | .760 | |
Total from Investment Operations | | .094 | | .846 | | (.037 | ) | .488 | | 1.211 | |
Distributions | | | | | | | | | | | |
Dividends from Net Investment Income | | (.404 | ) | (.406 | ) | (.423 | ) | (.438 | ) | (.451 | ) |
Distributions from Realized Capital Gains | | — | | — | | — | | — | | — | |
Total Distributions | | (.404 | ) | (.406 | ) | (.423 | ) | (.438 | ) | (.451 | ) |
Net Asset Value, End of Period | | $11.79 | | $12.10 | | $11.66 | | $12.12 | | $12.07 | |
| | | | | | | | | | | |
Total Return2 | | 0.80% | | 7.33% | | -0.45% | | 4.12% | | 10.87% | |
| | | | | | | | | | | |
Ratios/Supplemental Data | | | | | | | | | | | |
Net Assets, End of Period (Millions) | | $3,506 | | $3,419 | | $3,062 | | $2,909 | | $2,674 | |
Ratio of Total Expenses to Average Net Assets | | 0.09% | | 0.09% | | 0.09% | | 0.12% | | 0.12% | |
Ratio of Net Investment Income to Average Net Assets | | 3.39% | | 3.39% | | 3.41% | | 3.63% | | 3.83% | |
Portfolio Turnover Rate | | 15% | | 16% | | 18% | | 17% | | 14% | |
1 Calculated based on average shares outstanding.
2 Total returns do not include account service fees that may have applied in the periods shown. Fund prospectuses provide information about any applicable account service fees.
See accompanying Notes, which are an integral part of the Financial Statements.
217
California Long-Term Tax-Exempt Fund
Notes to Financial Statements
Vanguard California Long-Term Tax-Exempt Fund is registered under the Investment Company Act of 1940 as an open-end investment company, or mutual fund. The fund invests in debt instruments of municipal issuers whose ability to meet their obligations may be affected by economic and political developments in the state. The fund offers two classes of shares: Investor Shares and Admiral Shares. Investor Shares are available to any investor who meets the fund’s minimum purchase requirements. Admiral Shares are designed for investors who meet certain administrative, service, and account-size criteria.
A. The following significant accounting policies conform to generally accepted accounting principles for U.S. investment companies. The fund consistently follows such policies in preparing its financial statements.
1. Security Valuation: Securities are valued as of the close of trading on the New York Stock Exchange (generally 4 p.m., Eastern time) on the valuation date. Bonds and temporary cash investments are valued using the latest bid prices or using valuations based on a matrix system (which considers such factors as security prices, yields, maturities, and ratings), both as furnished by independent pricing services. Securities for which market quotations are not readily available, or whose values have been affected by events occurring before the fund’s pricing time but after the close of the securities’ primary markets, are valued by methods deemed by the board of trustees to represent fair value.
2. Futures Contracts: The fund uses futures contracts to invest in fixed income asset classes with greater efficiency and lower cost than is possible through direct investment, to add value when these instruments are attractively priced, or to adjust sensitivity to changes in interest rates. The primary risks associated with the use of futures contracts are imperfect correlation between changes in market values of bonds held by the fund and the prices of futures contracts, and the possibility of an illiquid market. Counterparty risk involving futures is mitigated because a regulated clearinghouse is the counterparty instead of the clearing broker. To further mitigate counterparty risk, the fund trades futures contracts on an exchange, monitors the financial strength of its clearing brokers and clearinghouse, and has entered into clearing agreements with its clearing brokers. The clearinghouse imposes initial margin requirements to secure the fund’s performance and requires daily settlement of variation margin representing changes in the market value of each contract. Any assets pledged as initial margin for open contracts are noted in the Statement of Net Assets.
Futures contracts are valued at their quoted daily settlement prices. The notional amounts of the contracts are not recorded in the Statement of Net Assets. Fluctuations in the value of the contracts are recorded in the Statement of Net Assets as an asset (liability) and in the Statement of Operations as unrealized appreciation (depreciation) until the contracts are closed, when they are recorded as realized futures gains (losses).
During the year ended November 30, 2018, the fund’s average investments in long and short futures contracts represented 4% and 1% of net assets, respectively, based on the average of the notional amounts at each quarter-end during the period.
3. Federal Income Taxes: The fund intends to continue to qualify as a regulated investment company and distribute all of its taxable income. Management has analyzed the fund’s tax positions taken for all open federal income tax years (November 30, 2015–2018), and has concluded that no provision for federal income tax is required in the fund’s financial statements.
218
California Long-Term Tax-Exempt Fund
4. Distributions: Distributions from net investment income are declared daily and paid on the first business day of the following month. Annual distributions from realized capital gains, if any, are recorded on the ex-dividend date. Distributions are determined on a tax basis and may differ from net investment income and realized capital gains for financial reporting purposes.
5. Credit Facility: The fund and certain other funds managed by The Vanguard Group (“Vanguard”) participate in a $3.1 billion committed credit facility provided by a syndicate of lenders pursuant to a credit agreement that may be renewed annually; each fund is individually liable for its borrowings, if any, under the credit facility. Borrowings may be utilized for temporary and emergency purposes, and are subject to the fund’s regulatory and contractual borrowing restrictions. The participating funds are charged administrative fees and an annual commitment fee of 0.10% of the undrawn amount of the facility; these fees are allocated to the funds based on a method approved by the fund’s board of trustees and included in Management and Administrative expenses on the fund’s Statement of Operations. Any borrowings under this facility bear interest at a rate based upon the higher of the one-month London Interbank Offered Rate, federal funds effective rate, or overnight bank funding rate plus an agreed-upon spread.
The fund had no borrowings outstanding at November 30, 2018, or at any time during the period then ended.
6. Other: Interest income is accrued daily. Premiums and discounts on debt securities purchased are amortized and accreted, respectively, to interest income over the lives of the respective securities. Security transactions are accounted for on the date securities are bought or sold. Costs used to determine realized gains (losses) on the sale of investment securities are those of the specific securities sold.
Each class of shares has equal rights as to assets and earnings, except that each class separately bears certain class-specific expenses related to maintenance of shareholder accounts (included in Management and Administrative expenses), shareholder reporting, and the proxy. Marketing and distribution expenses are allocated to each class of shares based on a method approved by the board of trustees. Income, other non-class-specific expenses, and gains and losses on investments are allocated to each class of shares based on its relative net assets.
B. In accordance with the terms of a Funds’ Service Agreement (the “FSA”) between Vanguard and the fund, Vanguard furnishes to the fund investment advisory, corporate management, administrative, marketing, and distribution services at Vanguard’s cost of operations (as defined by the FSA). These costs of operations are allocated to the fund based on methods and guidelines approved by the board of trustees. Vanguard does not require reimbursement in the current period for certain costs of operations (such as deferred compensation/benefits and risk/insurance costs); the fund’s liability for these costs of operations is included in Payables to Vanguard on the Statement of Net Assets. All other costs of operations payable to Vanguard are generally settled twice a month.
Upon the request of Vanguard, the fund may invest up to 0.40% of its net assets as capital in Vanguard. At November 30, 2018, the fund had contributed to Vanguard capital in the amount of $212,000, representing 0.01% of the fund’s net assets and 0.08% of Vanguard’s capitalization. The fund’s trustees and officers are also directors and employees, respectively, of Vanguard.
219
California Long-Term Tax-Exempt Fund
C. Various inputs may be used to determine the value of the fund’s investments. These inputs are summarized in three broad levels for financial statement purposes. The inputs or methodologies used to value securities are not necessarily an indication of the risk associated with investing in those securities.
Level 1—Quoted prices in active markets for identical securities.
Level 2—Other significant observable inputs (including quoted prices for similar securities, interest rates, prepayment speeds, credit risk, etc.).
Level 3—Significant unobservable inputs (including the fund’s own assumptions used to determine the fair value of investments). Any investments valued with significant unobservable inputs are noted on the Statement of Net Assets.
The following table summarizes the market value of the fund’s investments as of November 30, 2018, based on the inputs used to value them:
| | Level 1 | | Level 2 | | Level 3 | |
Investments | | ($000 | ) | ($000 | ) | ($000 | ) |
Tax-Exempt Municipal Bonds | | — | | 3,973,872 | | — | |
Futures Contracts—Assets1 | | 29 | | — | | — | |
Futures Contracts—Liabilities1 | | (157 | ) | — | | — | |
Total | | (128 | ) | 3,973,872 | | — | |
1 Represents variation margin on the last day of the reporting period.
D. Permanent differences between book-basis and tax-basis components of net assets are reclassified among capital accounts in the financial statements to reflect their tax character. These reclassifications have no effect on net assets or net asset value per share. As of period end, permanent differences primarily attributable to the accounting for the expiration of capital loss carryforwards were reclassified between the following accounts:
| Amount
($000 | ) |
Paid-in Capital | (12,487 | ) |
Total Distributable Earnings (Loss) | 12,487 | |
220
California Long-Term Tax-Exempt Fund
Temporary differences between book-basis and tax-basis components of total distributable earnings (loss) arise when certain items of income, gain, or loss are recognized in different periods for financial statement and tax purposes; these differences will reverse at some time in the future. The differences are primarily related to the tax deferral of losses on wash sales and straddles, the realization of unrealized gains or losses on certain futures contracts, and payables for distributions. As of period end, the tax-basis components of total distributable earnings (loss) are detailed in the table as follows:
| | Amount
($000 | ) |
Undistributed Ordinary Income | | — | |
Undistributed Tax-Exempt Income | | 5,580 | |
Undistributed Long-Term Gains | | — | |
Capital Loss Carryforwards* | | (19,571 | ) |
Net Unrealized Gains (Losses) | | 81,444 | |
* Includes $16,937,000, which may be used to offset future net capital gains through November 30, 2019, as well as capital losses of $2,634,000, which may be carried forward indefinitely but must be used before any expiring loss carryforwards.
As of November 30, 2018, gross unrealized appreciation and depreciation for investments and derivatives based on cost for U.S. federal income tax purposes were as follows:
| | Amount
($000 | ) |
Tax Cost | | 3,892,428 | |
Gross Unrealized Appreciation | | 113,340 | |
Gross Unrealized Depreciation | | (31,896 | ) |
Net Unrealized Appreciation (Depreciation) | | 81,444 | |
E. During the year ended November 30, 2018, the fund purchased $857,485,000 of investment securities and sold $566,557,000 of investment securities, other than temporary cash investments.
The fund purchased securities from and sold securities to other Vanguard funds or accounts managed by Vanguard or its affiliates, in accordance with procedures adopted by the board of trustees in compliance with Rule 17a-7 of the Investment Company Act of 1940. For the year ended November 30, 2018, such purchases and sales were $310,128,000 and $285,558,000, respectively; these amounts are included in the purchases and sales of investment securities noted above.
221
California Long-Term Tax-Exempt Fund
F. Capital share transactions for each class of shares were:
| | Year Ended November 30, | |
| | 2018 | | 2017 | |
| | Amount | | Shares | | Amount | | Shares | |
| | ($000 | ) | (000 | ) | ($000 | ) | (000 | ) |
Investor Shares | | | | | | | | | |
Issued | | 133,804 | | 11,189 | | 121,897 | | 10,151 | |
Issued in Lieu of Cash Distributions | | 14,104 | | 1,183 | | 13,372 | | 1,110 | |
Redeemed | | (141,188 | ) | (11,850 | ) | (121,438 | ) | (10,145 | ) |
Net Increase (Decrease)—Investor Shares | | 6,720 | | 522 | | 13,831 | | 1,116 | |
Admiral Shares | | | | | | | | | |
Issued | | 688,286 | | 57,626 | | 654,121 | | 54,583 | |
Issued in Lieu of Cash Distributions | | 76,586 | | 6,424 | | 72,146 | | 5,991 | |
Redeemed | | (585,466 | ) | (49,191 | ) | (485,173 | ) | (40,663 | ) |
Net Increase (Decrease)—Admiral Shares | | 179,406 | | 14,859 | | 241,094 | | 19,911 | |
G. Management has determined that no events or transactions occurred subsequent to November 30, 2018, that would require recognition or disclosure in these financial statements.
222
Report of Independent Registered Public Accounting Firm
To the Board of Trustees of Vanguard California Tax-Free Funds and Shareholders of Vanguard California Municipal Money Market Fund, Vanguard California Intermediate-Term Tax-Exempt Fund and Vanguard California Long-Term Tax-Exempt Fund
Opinions on the Financial Statements
We have audited the accompanying statements of net assets of Vanguard California Municipal Money Market Fund, Vanguard California Intermediate-Term Tax-Exempt Fund and Vanguard California Long-Term Tax-Exempt Fund (constituting Vanguard California Tax-Free Funds, hereafter collectively referred to as the “Funds”) as of November 30, 2018, the related statements of operations for the year ended November 30, 2018, the statements of changes in net assets for each of the two years in the period ended November 30, 2018, including the related notes, and the financial highlights for each of the five years in the period ended November 30, 2018 (collectively referred to as the “financial statements”). In our opinion, the financial statements present fairly, in all material respects, the financial position of each of the Funds as of November 30, 2018, the results of each of their operations for the year then ended, the changes in each of their net assets for each of the two years in the period ended November 30, 2018 and each of the financial highlights for each of the five years in the period ended November 30, 2018 in conformity with accounting principles generally accepted in the United States of America.
Basis for Opinions
These financial statements are the responsibility of the Funds’ management. Our responsibility is to express an opinion on the Funds’ financial statements based on our audits. We are a public accounting firm registered with the Public Company Accounting Oversight Board (United States) (“PCAOB”) and are required to be independent with respect to the Funds in accordance with the U.S. federal securities laws and the applicable rules and regulations of the Securities and Exchange Commission and the PCAOB.
We conducted our audits of these financial statements in accordance with the standards of the PCAOB. Those standards require that we plan and perform the audit to obtain reasonable assurance about whether the financial statements are free of material misstatement, whether due to error or fraud.
Our audits included performing procedures to assess the risks of material misstatement of the financial statements, whether due to error or fraud, and performing procedures that respond to those risks. Such procedures included examining, on a test basis, evidence regarding the amounts and disclosures in the financial statements. Our audits also included evaluating the accounting principles used and significant estimates made by management, as well as evaluating the overall presentation of the financial statements. Our procedures included confirmation of securities owned as of November 30, 2018 by correspondence with the custodian and brokers; when replies were not received from brokers, we performed other auditing procedures. We believe that our audits provide a reasonable basis for our opinions.
/s/PricewaterhouseCoopers LLP
Philadelphia, Pennsylvania
January 17, 2019
We have served as the auditor of one or more investment companies in The Vanguard Group of Funds since 1975.
223
|
Special 2018 tax information (unaudited) for Vanguard California Tax-Exempt Funds |
This information for the fiscal year ended November 30, 2018, is included pursuant to provisions of the Internal Revenue Code.
Each fund designates 100% of its income dividends as exempt-interest dividends.
224
BLOOMBERG is a trademark and service mark of Bloomberg Finance L.P. BARCLAYS is a trademark and service mark of Barclays Bank Plc, used under license. Bloomberg Finance L.P. and its affiliates, including Bloomberg Index Services Limited (BISL) (collectively, Bloomberg), or Bloomberg’s licensors, own all proprietary rights in the Bloomberg Barclays Municipal California Intermediate Bond Index and the Bloomberg Barclays CA Municipal Bond Index (Indices or Bloomberg Barclays Indices).
Neither Barclays Bank Plc, Barclays Capital Inc., or any affiliate (collectively Barclays) or Bloomberg is the issuer or producer of the California Tax-Exempt Funds and neither Bloomberg nor Barclays has any responsibilities, obligations or duties to investors in the California Tax-Exempt Funds. The Indices are licensed for use by The Vanguard Group, Inc. (Vanguard) as the sponsor of the California Tax-Exempt Funds. Bloomberg and Barclays’ only relationship with Vanguard in respect of the Indices is the licensing of the Indices, which are determined, composed and calculated by BISL, or any successor thereto, without regard to the Issuer or the California Tax-Exempt Funds or the owners of the California Tax-Exempt Funds.
Additionally, Vanguard may for itself execute transaction(s) with Barclays in or relating to the Indices in connection with the California Tax-Exempt Funds. Investors acquire the California Tax-Exempt Funds from Vanguard and investors neither acquire any interest in the Indices nor enter into any relationship of any kind whatsoever with Bloomberg or Barclays upon making an investment in the California Tax-Exempt Funds. The California Tax-Exempt Funds are not sponsored, endorsed, sold or promoted by Bloomberg or Barclays. Neither Bloomberg nor Barclays makes any representation or warranty, express or implied regarding the advisability of investing in the California Tax-Exempt Funds or the advisability of investing in securities generally or the ability of the Indices to track corresponding or relative market performance. Neither Bloomberg nor Barclays has passed on the legality or suitability of the California Tax-Exempt Funds with respect to any person or entity. Neither Bloomberg nor Barclays is responsible for and has not participated in the determination of the timing of, prices at, or quantities of the California Tax-Exempt Funds to be issued. Neither Bloomberg nor Barclays has any obligation to take the needs of the Issuer or the owners of the California Tax-Exempt Funds or any other third party into consideration in determining, composing or calculating the Indices. Neither Bloomberg nor Barclays has any obligation or liability in connection with administration, marketing or trading of the California Tax-Exempt Funds.
The licensing agreement between Bloomberg and Barclays is solely for the benefit of Bloomberg and Barclays and not for the benefit of the owners of the California Tax-Exempt Funds, investors or other third parties. In addition, the licensing agreement between Vanguard and Bloomberg is solely for the benefit of Vanguard and Bloomberg and not for the benefit of the owners of the California Tax-Exempt Funds, investors or other third parties.
NEITHER BLOOMBERG NOR BARCLAYS SHALL HAVE ANY LIABILITY TO THE ISSUER, INVESTORS OR TO OTHER THIRD PARTIES FOR THE QUALITY, ACCURACY AND/OR COMPLETENESS OF THE BLOOMBERG BARCLAYS INDICES OR ANY DATA INCLUDED THEREIN OR FOR INTERRUPTIONS IN THE DELIVERY OF THE BLOOMBERG BARCLAYS INDICES. NEITHER BLOOMBERG NOR BARCLAYS MAKES ANY WARRANTY, EXPRESS OR IMPLIED, AS TO RESULTS TO BE OBTAINED BY THE ISSUER, THE INVESTORS OR ANY OTHER PERSON OR ENTITY FROM THE USE OF THE BLOOMBERG BARCLAYS INDICES OR ANY DATA INCLUDED THEREIN. NEITHER BLOOMBERG NOR BARCLAYS MAKES ANY EXPRESS OR IMPLIED WARRANTIES, AND EACH HEREBY EXPRESSLY DISCLAIMS ALL WARRANTIES OF MERCHANTABILITY OR FITNESS FOR A PARTICULAR PURPOSE OR USE WITH RESPECT TO THE BLOOMBERG BARCLAYS INDICES OR ANY DATA INCLUDED THEREIN. BLOOMBERG RESERVES THE RIGHT TO CHANGE THE METHODS OF CALCULATION OR PUBLICATION, OR TO CEASE THE CALCULATION OR PUBLICATION OF THE BLOOMBERG BARCLAYS INDICES, AND NEITHER BLOOMBERG NOR BARCLAYS SHALL BE LIABLE FOR ANY MISCALCULATION OF OR ANY INCORRECT, DELAYED OR INTERRUPTED PUBLICATION WITH RESPECT TO ANY OF THE BLOOMBERG BARCLAYS INDICES. NEITHER BLOOMBERG NOR BARCLAYS SHALL BE LIABLE FOR ANY DAMAGES, INCLUDING, WITHOUT LIMITATION, ANY SPECIAL, INDIRECT OR CONSEQUENTIAL DAMAGES, OR ANY LOST PROFITS AND EVEN IF ADVISED OF THE POSSIBILITY OF SUCH, RESULTING FROM THE USE OF THE BLOOMBERG BARCLAYS INDICES OR ANY DATA INCLUDED THEREIN OR WITH RESPECT TO THE CALIFORNIA TAX-EXEMPT FUNDS.
None of the information supplied by Bloomberg or Barclays and used in this publication may be reproduced in any manner without the prior written permission of both Bloomberg and Barclays Capital, the investment banking division of Barclays Bank Plc. Barclays Bank Plc is registered in England No. 1026167. Registered office 1 Churchill Place London E14 5HP.
© 2019 Bloomberg. Used with Permission.
Source: Bloomberg Index Services Limited. Copyright 2019, Bloomberg. All rights reserved.
225
This page intentionally left blank.
The People Who Govern Your Fund
The trustees of your mutual fund are there to see that the fund is operated and managed in your best interests since, as a shareholder, you are a part owner of the fund. Your fund’s trustees also serve on the board of directors of The Vanguard Group, Inc., which is owned by the Vanguard funds and provides services to them.
A majority of Vanguard’s board members are independent, meaning that they have no affiliation with Vanguard or the funds they oversee, apart from the sizable personal investments they have made as private individuals. The independent board members have distinguished backgrounds in business, academia, and public service. Each of the trustees and executive officers oversees 212 Vanguard funds.
Information for each trustee and executive officer of the fund appears below. The mailing address of the trustees and officers is P.O. Box 876, Valley Forge, PA 19482. More information about the trustees is in the Statement of Additional Information, which can be obtained, without charge, by contacting Vanguard at 800-662-7447, or online at vanguard.com.
Interested Trustees1
F. William McNabb III
Born in 1957. Trustee since July 2009. Principal occupation(s) during the past five years and other experience: chairman of the board (January 2010–present) of Vanguard and of each of the investment companies served by Vanguard, trustee (2009–present) of each of the investment companies served by Vanguard, and director (2008–present) of Vanguard. Chief executive officer and president (2008–2017) of Vanguard and each of the investment companies served by Vanguard, managing director (1995–2008) of Vanguard, and director (1997–2018) of Vanguard Marketing Corporation. Director (2018–present) of UnitedHealth Group.
Mortimer J. Buckley
Born in 1969. Trustee since January 2018. Principal occupation(s) during the past five years and other experience: chief executive officer (January 2018–present) of Vanguard; chief executive officer, president, and trustee (January 2018–present) of each of the investment companies served by Vanguard; president and director (2017–present) of Vanguard; and president (February 2018–present) of Vanguard Marketing Corporation. Chief investment officer (2013–2017), managing director (2002–2017), head of the Retail Investor Group (2006–2012), and chief information officer (2001–2006) of Vanguard. Chairman of the board (2011–2017) of the Children’s Hospital of Philadelphia.
Independent Trustees
Emerson U. Fullwood
Born in 1948. Trustee since January 2008. Principal occupation(s) during the past five years and other experience: executive chief staff and marketing officer for North America and corporate vice president (retired 2008) of Xerox Corporation (document management products and services). Former president of the Worldwide Channels Group, Latin America, and Worldwide Customer Service and executive chief staff officer of Developing Markets of Xerox. Executive in residence and 2009–2010 Distinguished Minett Professor at the Rochester Institute of Technology. Lead director of SPX FLOW, Inc. (multi-industry manufacturing). Director of the University of Rochester Medical Center, the Monroe Community College Foundation, the United Way of Rochester, North Carolina A&T University, and Roberts Wesleyan College. Trustee of the University of Rochester.
Amy Gutmann
Born in 1949. Trustee since June 2006. Principal occupation(s) during the past five years and other experience: president (2004–present) of the University of Pennsylvania. Christopher H. Browne Distinguished Professor of Political Science, School of Arts and Sciences, and professor of communication, Annenberg School for Communication, with secondary faculty appointments in the Department of Philosophy, School of Arts and Sciences, and at the Graduate School of Education, University of Pennsylvania. Trustee of the National Constitution Center.
1 Mr. McNabb and Mr. Buckley are considered “interested persons,” as defined in the Investment Company Act of 1940, because they are officers of the Vanguard funds.
JoAnn Heffernan Heisen
Born in 1950. Trustee since July 1998. Principal occupation(s) during the past five years and other experience: corporate vice president of Johnson & Johnson (pharmaceuticals/medical devices/consumer products) and member of its executive committee (1997–2008). Chief global diversity officer (retired 2008), vice president and chief information officer (1997–2006), controller (1995–1997), treasurer (1991–1995), and assistant treasurer (1989–1991) of Johnson & Johnson. Director of Skytop Lodge Corporation (hotels) and the Robert Wood Johnson Foundation. Member of the advisory board of the Institute for Women’s Leadership at Rutgers University.
F. Joseph Loughrey
Born in 1949. Trustee since October 2009. Principal occupation(s) during the past five years and other experience: president and chief operating officer (retired 2009) and vice chairman of the board (2008–2009) of Cummins Inc. (industrial machinery). Chairman of the board of Hillenbrand, Inc. (specialized consumer services), Oxfam America, and the Lumina Foundation for Education. Director of the V Foundation for Cancer Research. Member of the advisory council for the College of Arts and Letters and chair of the advisory board to the Kellogg Institute for International Studies, both at the University of Notre Dame.
Mark Loughridge
Born in 1953. Trustee since March 2012. Principal occupation(s) during the past five years and other experience: senior vice president and chief financial officer (retired 2013) of IBM (information technology services). Fiduciary member of IBM’s Retirement Plan Committee (2004–2013), senior vice president and general manager (2002–2004) of IBM Global Financing, vice president and controller (1998–2002) of IBM, and a variety of other prior management roles at IBM. Member of the Council on Chicago Booth.
Scott C. Malpass
Born in 1962. Trustee since March 2012. Principal occupation(s) during the past five years and other experience: chief investment officer (1989–present) and vice president (1996–present) of the University of Notre Dame. Assistant professor of finance at the Mendoza College of Business, University of Notre Dame, and member of the Notre Dame 403(b) Investment Committee. Chairman of the board of TIFF Advisory Services, Inc. Member of the board of Catholic Investment Services, Inc. (investment advisors), the board of advisors for Spruceview Capital Partners, and the board of superintendence of the Institute for the Works of Religion.
Deanna Mulligan
Born in 1963. Trustee since January 2018. Principal occupation(s) during the past five years and other experience: president (2010–present) and chief executive officer (2011–present) of The Guardian Life Insurance Company of America. Chief operating officer (2010–2011) and executive vice president (2008–2010) of Individual Life and Disability of The Guardian Life Insurance Company of America. Member of the board of The Guardian Life Insurance Company of America, the American Council of Life Insurers, the Partnership for New York City (business leadership), and the Committee Encouraging Corporate Philanthropy. Trustee of the Economic Club of New York and the Bruce Museum (arts and science). Member of the Advisory Council for the Stanford Graduate School of Business.
André F. Perold
Born in 1952. Trustee since December 2004. Principal occupation(s) during the past five years and other experience: George Gund Professor of Finance and Banking, Emeritus at the Harvard Business School (retired 2011). Chief investment officer and co-managing partner of HighVista Strategies LLC (private investment firm). Overseer of the Museum of Fine Arts Boston.
Sarah Bloom Raskin
Born in 1961. Trustee since January 2018. Principal occupation(s) during the past five years and other experience: deputy secretary (2014–2017) of the United States Department of the Treasury. Governor (2010–2014) of the Federal Reserve Board. Commissioner (2007–2010) of financial regulation for the State of Maryland. Member of the board of directors (2012–2014) of Neighborhood Reinvestment Corporation. Director of i(x) Investments, LLC.
Peter F. Volanakis
Born in 1955. Trustee since July 2009. Principal occupation(s) during the past five years and other experience: president and chief operating officer (retired 2010) of Corning Incorporated (communications equipment) and director of Corning Incorporated (2000–2010) and Dow Corning (2001–2010). Director (2012) of SPX Corporation (multi-industry manufacturing). Overseer of the Amos Tuck School of Business Administration, Dartmouth College (2001–2013). Chairman of the board of trustees of Colby-Sawyer College. Member of the Board of Hypertherm Inc. (industrial cutting systems, software, and consumables).
Executive Officers
Glenn Booraem
Born in 1967. Principal occupation(s) during the past five years and other experience: principal of Vanguard. Investment stewardship officer (2017–present), treasurer (2015–2017), controller (2010–2015), and assistant controller (2001–2010) of each of the investment companies served by Vanguard.
Christine M. Buchanan
Born in 1970. Principal occupation(s) during the past five years and other experience: principal of Vanguard and global head of Fund Administration at Vanguard. Treasurer (2017–present) of each of the investment companies served by Vanguard. Partner (2005–2017) at KPMG LLP (audit, tax, and advisory services).
Brian Dvorak
Born in 1973. Principal occupation(s) during the past five years and other experience: principal of Vanguard. Chief compliance officer (2017–present) of Vanguard and each of the investment companies served by Vanguard. Assistant vice president (2017–present) of Vanguard Marketing Corporation. Vice president and director of Enterprise Risk Management (2011–2013) at Oppenheimer Funds, Inc.
Thomas J. Higgins
Born in 1957. Principal occupation(s) during the past five years and other experience: principal of Vanguard. Chief financial officer (2008–present) and treasurer (1998–2008) of each of the investment companies served by Vanguard.
Peter Mahoney
Born in 1974. Principal occupation(s) during the past five years and other experience: principal of Vanguard. Controller (2015–present) of each of the investment companies served by Vanguard. Head of International Fund Services (2008–2014) at Vanguard.
Anne E. Robinson
Born in 1970. Principal occupation(s) during the past five years and other experience: general counsel (2016–present) of Vanguard. Secretary (2016–present) of Vanguard and of each of the investment companies served by Vanguard. Managing director (2016–present) of Vanguard. Director and senior vice president (2016–2018) of Vanguard Marketing Corporation. Managing director and general counsel of Global Cards and Consumer Services (2014–2016) at Citigroup. Counsel (2003–2014) at American Express.
Michael Rollings
Born in 1963. Principal occupation(s) during the past five years and other experience: finance director (2017–present) and treasurer (2017) of each of the investment companies served by Vanguard. Managing director (2016–present) of Vanguard. Chief financial officer (2016–present) of Vanguard. Director (2016–present) of Vanguard Marketing Corporation. Executive vice president and chief financial officer (2006–2016) of MassMutual Financial Group.
Vanguard Senior Management Team
Joseph Brennan | | Chris D. McIsaac |
Mortimer J. Buckley | | James M. Norris |
Gregory Davis | | Thomas M. Rampulla |
John James | | Karin A. Risi |
Martha G. King | | Anne E. Robinson |
John T. Marcante | | Michael Rollings |
Chairman Emeritus and Senior Advisor
John J. Brennan
Chairman, 1996–2009
Chief Executive Officer and President, 1996–2008
Founder
John C. Bogle
Chairman and Chief Executive Officer, 1974–1996
| 
P.O. Box 2600 Valley Forge, PA 19482-2600 |
Connect with Vanguard® > vanguard.com
Fund Information > 800-662-7447
Direct Investor Account Services > 800-662-2739
Institutional Investor Services > 800-523-1036
Text Telephone for People
Who Are Deaf or Hard of Hearing > 800-749-7273
This material may be used in conjunction with the offering of shares of any Vanguard fund only if preceded or accompanied by the fund’s current prospectus.
All comparative mutual fund data are from Lipper, a Thomson Reuters Company, or Morningstar, Inc., unless otherwise noted.
You can obtain a free copy of Vanguard’s proxy voting guidelines by visiting vanguard.com/proxyreporting or by calling Vanguard at 800-662-2739. The guidelines are also available from the SEC’s website, sec.gov. In addition, you may obtain a free report on how your fund voted the proxies for securities it owned during the 12 months ended June 30. To get the report, visit either vanguard.com/proxyreporting or sec.gov.
You can review information about your fund on the SEC’s website, and you can receive copies of this information, for a fee, by sending a request via email addressed to publicinfo@sec.gov.
CFA® is a registered trademark owned by CFA Institute.
| © 2019 The Vanguard Group, Inc. All rights reserved. Vanguard Marketing Corporation, Distributor. Q750 012019 |
Item 2: Code of Ethics. The Registrant has adopted a code of ethics that applies to the Registrant’s principal executive officer, principal financial officer, principal accounting officer or controller or persons performing similar functions. The Code of Ethics was amended during the reporting period covered by this report to make certain technical, non-material changes.
Item 3: Audit Committee Financial Expert. All members of the Audit Committee have been determined by the Registrant’s Board of Trustees to be Audit Committee Financial Experts and to be independent: JoAnn Heffernan Heisen, F. Joseph Loughrey, Mark Loughridge, Sarah Bloom Raskin, and Peter F. Volanakis.
Item 4: Principal Accountant Fees and Services.
(a) Audit Fees.
Audit Fees of the Registrant.
Fiscal Year Ended November 30, 2018: $99,000
Fiscal Year Ended November 30, 2017: $102,000
Aggregate Audit Fees of Registered Investment Companies in the Vanguard Group.
Fiscal Year Ended November 30, 2018: $9,734,277
Fiscal Year Ended November 30, 2017: $8,424,459
Includes fees billed in connection with audits of the Registrant, other registered investment companies in the Vanguard complex, The Vanguard Group, Inc. and Vanguard Marketing Corporation.
(b) Audit-Related Fees.
Fiscal Year Ended November 30, 2018: $5,581,336
Fiscal Year Ended November 30, 2017: $3,194,093
Includes fees billed in connection with assurance and related services provided to the Registrant, other registered investment companies in the Vanguard complex, The Vanguard Group, Inc., and Vanguard Marketing Corporation.
(c) Tax Fees.
Fiscal Year Ended November 30, 2018: $347,985
Fiscal Year Ended November 30, 2017: $274,313
Includes fees billed in connection with tax compliance, planning, and advice services provided to the Registrant, other registered investment companies in the Vanguard complex, The Vanguard Group, Inc., and Vanguard Marketing Corporation.
(d) All Other Fees.
Fiscal Year Ended November 30, 2018: $0
Fiscal Year Ended November 30, 2017: $0
Includes fees billed for services related to tax reported information provided to the Registrant, other registered investment companies in the Vanguard complex, The Vanguard Group, Inc., and Vanguard Marketing Corporation.
(e) (1) Pre-Approval Policies. The policy of the Registrant’s Audit Committee is to consider and, if appropriate, approve before the principal accountant is engaged for such services, all specific audit and non-audit services provided to: the Registrant, other registered investment companies in the Vanguard complex, The Vanguard Group, Inc., and entities controlled by The Vanguard Group, Inc. that provide ongoing services to the Registrant. In making a determination, the Audit Committee considers whether the services are consistent with maintaining the principal accountant’s independence.
In the event of a contingency situation in which the principal accountant is needed to provide services in between scheduled Audit Committee meetings, the Chairman of the Audit Committee would be called on to consider and, if appropriate, pre-approve audit or permitted non-audit services in an amount sufficient to complete services through the next Audit Committee meeting, and to determine if such services would be consistent with maintaining the accountant’s independence. At the next scheduled Audit Committee meeting, services and fees would be presented to the Audit Committee for formal consideration, and, if appropriate, approval by the entire Audit Committee. The Audit Committee would again consider whether such services and fees are consistent with maintaining the principal accountant’s independence.
The Registrant’s Audit Committee is informed at least annually of all audit and non-audit services provided by the principal accountant to the Vanguard complex, whether such services are provided to: the Registrant, other registered investment companies in the Vanguard complex, The Vanguard Group, Inc., or other entities controlled by The Vanguard Group, Inc. that provide ongoing services to the Registrant.
(2) No percentage of the principal accountant’s fees or services were approved pursuant to the waiver provision of paragraph (c)(7)(i)(C) of Rule 2-01 of Regulation S-X.
(f) For the most recent fiscal year, over 50% of the hours worked under the principal accountant’s engagement were not performed by persons other than full-time, permanent employees of the principal accountant.
(g) Aggregate Non-Audit Fees.
Fiscal Year Ended November 30, 2018: $347,985
Fiscal Year Ended November 30, 2017: $274,313
Includes fees billed for non-audit services provided to the Registrant, other registered investment companies in the Vanguard complex, The Vanguard Group, Inc., and Vanguard Marketing Corporation.
(h) For the most recent fiscal year, the Audit Committee has determined that the provision of all non-audit services was consistent with maintaining the principal accountant’s independence.
Item 5: Audit Committee of Listed Registrants.
The Registrant is a listed issuer as defined in rule 10A-3 under the Securities Exchange Act of 1934 (“Exchange Act”). The Registrant has a separately-designated standing audit committee established in accordance with Section 3(a)(58)(A) of the Exchange Act. The Registrant’s audit committee members are: JoAnn Heffernan Heisen, F. Joseph Loughrey, Mark Loughridge, Sarah Bloom Raskin, and Peter F. Volanakis.
Item 6: Investments.
Not Applicable.
Item 7: Disclosure of Proxy Voting Policies and Procedures for Closed-End Management Investment Companies.
Not Applicable.
Item 8: Portfolio Managers of Closed-End Management Investment Companies.
Not Applicable.
Item 9: Purchase of Equity Securities by Closed-End Management Investment Company and Affiliated Purchasers.
Not Applicable.
Item 10: Submission of Matters to a Vote of Security Holders.
Not Applicable.
Item 11: Controls and Procedures.
(a) Disclosure Controls and Procedures. The Principal Executive and Financial Officers concluded that the Registrant’s Disclosure Controls and Procedures are effective based on their evaluation of the Disclosure Controls and Procedures as of a date within 90 days of the filing date of this report.
(b) Internal Control Over Financial Reporting. There were no significant changes in Registrant’s Internal Control Over Financial Reporting or in other factors that could significantly affect this control subsequent to the date of the evaluation, including any corrective actions with regard to significant deficiencies and material weaknesses.
Item 12: Disclosure of Securities Lending Activities for Closed-End Management Investment Companies.
Not Applicable.
Item 13: Exhibits.
(a) Code of Ethics.
(b) Certifications.
Pursuant to the requirements of the Securities Exchange Act of 1934 and the Investment Company Act of 1940, the registrant has duly caused this report to be signed on its behalf by the undersigned, thereunto duly authorized.
| VANGUARD CALIFORNIA TAX-FREE FUNDS |
| |
BY: | /s/ MORTIMER J. BUCKLEY* | |
| | |
| MORTIMER J. BUCKLEY | |
| CHIEF EXECUTIVE OFFICER | |
Date: January 22, 2019
Pursuant to the requirements of the Securities Exchange Act of 1934 and the Investment Company Act of 1940, this report has been signed below by the following persons on behalf of the registrant and in the capacities and on the dates indicated.
| VANGUARD CALIFORNIA TAX-FREE FUNDS |
| |
BY: | /s/ MORTIMER J. BUCKLEY * | |
| | |
| MORTIMER J. BUCKLEY | |
| CHIEF EXECUTIVE OFFICER | |
Date: January 22, 2019
| VANGUARD CALIFORNIA TAX-FREE FUNDS |
| |
BY: | /s/ THOMAS J. HIGGINS* | |
| | |
| THOMAS J. HIGGINS | |
| CHIEF FINANCIAL OFFICER | |
| |
Date: January 22, 2019 | |
* By: /s/ Anne E. Robinson
Anne E. Robinson, pursuant to a Power of Attorney filed on January 18, 2018 see file Number 33-32216, Incorporated by Reference.