

| (based on a hypothetical $10,000 investment) | ||
| Class Name | Costs of a $10,000 investment ~ | Costs paid as a percentage of a $10,000 investment (annualized) ~ |
| A | $19 | 0.37% |
| Net Assets ($): | 2,940,855,570 | Portfolio Turnover Rate (%): | 3 | |
| Total Number of Holdings: | 16 |

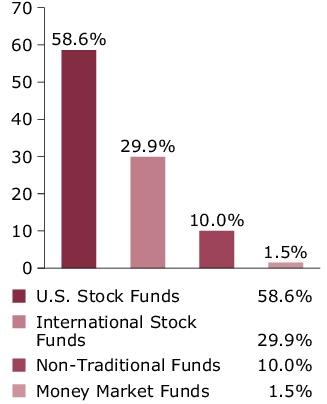
| MFS Value Fund | 12.0% |
| MFS Growth Fund | 11.2% |
| MFS Research Fund | 10.2% |
| MFS Mid Cap Growth Fund | 10.1% |
| MFS Mid Cap Value Fund | 10.1% |
| MFS Research International Fund | 8.0% |
| MFS Global Real Estate Fund | 5.0% |
| MFS Commodity Strategy Fund | 5.0% |
| MFS International Intrinsic Value Fund | 5.0% |
| MFS International Large Cap Value Fund | 5.0% |
| MFS International Growth Fund | 5.0% |
| MFS International New Discovery Fund | 4.0% |
| MFS Emerging Markets Equity Fund | 2.9% |
| MFS New Discovery Value Fund | 2.5% |
| MFS New Discovery Fund | 2.5% |
| MFS Institutional Money Market Portfolio | 1.5% |
| (based on a hypothetical $10,000 investment) | ||
| Class Name | Costs of a $10,000 investment ~ | Costs paid as a percentage of a $10,000 investment (annualized) ~ |
| B | $58 | 1.12% |
| Net Assets ($): | 2,940,855,570 | Portfolio Turnover Rate (%): | 3 | |
| Total Number of Holdings: | 16 |

| MFS Value Fund | 12.0% |
| MFS Growth Fund | 11.2% |
| MFS Research Fund | 10.2% |
| MFS Mid Cap Growth Fund | 10.1% |
| MFS Mid Cap Value Fund | 10.1% |
| MFS Research International Fund | 8.0% |
| MFS Global Real Estate Fund | 5.0% |
| MFS Commodity Strategy Fund | 5.0% |
| MFS International Intrinsic Value Fund | 5.0% |
| MFS International Large Cap Value Fund | 5.0% |
| MFS International Growth Fund | 5.0% |
| MFS International New Discovery Fund | 4.0% |
| MFS Emerging Markets Equity Fund | 2.9% |
| MFS New Discovery Value Fund | 2.5% |
| MFS New Discovery Fund | 2.5% |
| MFS Institutional Money Market Portfolio | 1.5% |
| (based on a hypothetical $10,000 investment) | ||
| Class Name | Costs of a $10,000 investment ~ | Costs paid as a percentage of a $10,000 investment (annualized) ~ |
| C | $58 | 1.12% |
| Net Assets ($): | 2,940,855,570 | Portfolio Turnover Rate (%): | 3 | |
| Total Number of Holdings: | 16 |

| MFS Value Fund | 12.0% |
| MFS Growth Fund | 11.2% |
| MFS Research Fund | 10.2% |
| MFS Mid Cap Growth Fund | 10.1% |
| MFS Mid Cap Value Fund | 10.1% |
| MFS Research International Fund | 8.0% |
| MFS Global Real Estate Fund | 5.0% |
| MFS Commodity Strategy Fund | 5.0% |
| MFS International Intrinsic Value Fund | 5.0% |
| MFS International Large Cap Value Fund | 5.0% |
| MFS International Growth Fund | 5.0% |
| MFS International New Discovery Fund | 4.0% |
| MFS Emerging Markets Equity Fund | 2.9% |
| MFS New Discovery Value Fund | 2.5% |
| MFS New Discovery Fund | 2.5% |
| MFS Institutional Money Market Portfolio | 1.5% |
| (based on a hypothetical $10,000 investment) | ||
| Class Name | Costs of a $10,000 investment ~ | Costs paid as a percentage of a $10,000 investment (annualized) ~ |
| I | $6 | 0.12% |
| Net Assets ($): | 2,940,855,570 | Portfolio Turnover Rate (%): | 3 | |
| Total Number of Holdings: | 16 |

| MFS Value Fund | 12.0% |
| MFS Growth Fund | 11.2% |
| MFS Research Fund | 10.2% |
| MFS Mid Cap Growth Fund | 10.1% |
| MFS Mid Cap Value Fund | 10.1% |
| MFS Research International Fund | 8.0% |
| MFS Global Real Estate Fund | 5.0% |
| MFS Commodity Strategy Fund | 5.0% |
| MFS International Intrinsic Value Fund | 5.0% |
| MFS International Large Cap Value Fund | 5.0% |
| MFS International Growth Fund | 5.0% |
| MFS International New Discovery Fund | 4.0% |
| MFS Emerging Markets Equity Fund | 2.9% |
| MFS New Discovery Value Fund | 2.5% |
| MFS New Discovery Fund | 2.5% |
| MFS Institutional Money Market Portfolio | 1.5% |
| (based on a hypothetical $10,000 investment) | ||
| Class Name | Costs of a $10,000 investment ~ | Costs paid as a percentage of a $10,000 investment (annualized) ~ |
| R1 | $58 | 1.12% |
| Net Assets ($): | 2,940,855,570 | Portfolio Turnover Rate (%): | 3 | |
| Total Number of Holdings: | 16 |

| MFS Value Fund | 12.0% |
| MFS Growth Fund | 11.2% |
| MFS Research Fund | 10.2% |
| MFS Mid Cap Growth Fund | 10.1% |
| MFS Mid Cap Value Fund | 10.1% |
| MFS Research International Fund | 8.0% |
| MFS Global Real Estate Fund | 5.0% |
| MFS Commodity Strategy Fund | 5.0% |
| MFS International Intrinsic Value Fund | 5.0% |
| MFS International Large Cap Value Fund | 5.0% |
| MFS International Growth Fund | 5.0% |
| MFS International New Discovery Fund | 4.0% |
| MFS Emerging Markets Equity Fund | 2.9% |
| MFS New Discovery Value Fund | 2.5% |
| MFS New Discovery Fund | 2.5% |
| MFS Institutional Money Market Portfolio | 1.5% |
| (based on a hypothetical $10,000 investment) | ||
| Class Name | Costs of a $10,000 investment ~ | Costs paid as a percentage of a $10,000 investment (annualized) ~ |
| R2 | $32 | 0.62% |
| Net Assets ($): | 2,940,855,570 | Portfolio Turnover Rate (%): | 3 | |
| Total Number of Holdings: | 16 |

| MFS Value Fund | 12.0% |
| MFS Growth Fund | 11.2% |
| MFS Research Fund | 10.2% |
| MFS Mid Cap Growth Fund | 10.1% |
| MFS Mid Cap Value Fund | 10.1% |
| MFS Research International Fund | 8.0% |
| MFS Global Real Estate Fund | 5.0% |
| MFS Commodity Strategy Fund | 5.0% |
| MFS International Intrinsic Value Fund | 5.0% |
| MFS International Large Cap Value Fund | 5.0% |
| MFS International Growth Fund | 5.0% |
| MFS International New Discovery Fund | 4.0% |
| MFS Emerging Markets Equity Fund | 2.9% |
| MFS New Discovery Value Fund | 2.5% |
| MFS New Discovery Fund | 2.5% |
| MFS Institutional Money Market Portfolio | 1.5% |
| (based on a hypothetical $10,000 investment) | ||
| Class Name | Costs of a $10,000 investment ~ | Costs paid as a percentage of a $10,000 investment (annualized) ~ |
| R3 | $19 | 0.37% |
| Net Assets ($): | 2,940,855,570 | Portfolio Turnover Rate (%): | 3 | |
| Total Number of Holdings: | 16 |

| MFS Value Fund | 12.0% |
| MFS Growth Fund | 11.2% |
| MFS Research Fund | 10.2% |
| MFS Mid Cap Growth Fund | 10.1% |
| MFS Mid Cap Value Fund | 10.1% |
| MFS Research International Fund | 8.0% |
| MFS Global Real Estate Fund | 5.0% |
| MFS Commodity Strategy Fund | 5.0% |
| MFS International Intrinsic Value Fund | 5.0% |
| MFS International Large Cap Value Fund | 5.0% |
| MFS International Growth Fund | 5.0% |
| MFS International New Discovery Fund | 4.0% |
| MFS Emerging Markets Equity Fund | 2.9% |
| MFS New Discovery Value Fund | 2.5% |
| MFS New Discovery Fund | 2.5% |
| MFS Institutional Money Market Portfolio | 1.5% |
| (based on a hypothetical $10,000 investment) | ||
| Class Name | Costs of a $10,000 investment ~ | Costs paid as a percentage of a $10,000 investment (annualized) ~ |
| R4 | $6 | 0.12% |
| Net Assets ($): | 2,940,855,570 | Portfolio Turnover Rate (%): | 3 | |
| Total Number of Holdings: | 16 |
| MFS Value Fund | 12.0% |
| MFS Growth Fund | 11.2% |
| MFS Research Fund | 10.2% |
| MFS Mid Cap Growth Fund | 10.1% |
| MFS Mid Cap Value Fund | 10.1% |
| MFS Research International Fund | 8.0% |
| MFS Global Real Estate Fund | 5.0% |
| MFS Commodity Strategy Fund | 5.0% |
| MFS International Intrinsic Value Fund | 5.0% |
| MFS International Large Cap Value Fund | 5.0% |
| MFS International Growth Fund | 5.0% |
| MFS International New Discovery Fund | 4.0% |
| MFS Emerging Markets Equity Fund | 2.9% |
| MFS New Discovery Value Fund | 2.5% |
| MFS New Discovery Fund | 2.5% |
| MFS Institutional Money Market Portfolio | 1.5% |
| (based on a hypothetical $10,000 investment) | ||
| Class Name | Costs of a $10,000 investment ~ | Costs paid as a percentage of a $10,000 investment (annualized) ~ |
| R6 | $2 | 0.04% |
| Net Assets ($): | 2,940,855,570 | Portfolio Turnover Rate (%): | 3 | |
| Total Number of Holdings: | 16 |

| MFS Value Fund | 12.0% |
| MFS Growth Fund | 11.2% |
| MFS Research Fund | 10.2% |
| MFS Mid Cap Growth Fund | 10.1% |
| MFS Mid Cap Value Fund | 10.1% |
| MFS Research International Fund | 8.0% |
| MFS Global Real Estate Fund | 5.0% |
| MFS Commodity Strategy Fund | 5.0% |
| MFS International Intrinsic Value Fund | 5.0% |
| MFS International Large Cap Value Fund | 5.0% |
| MFS International Growth Fund | 5.0% |
| MFS International New Discovery Fund | 4.0% |
| MFS Emerging Markets Equity Fund | 2.9% |
| MFS New Discovery Value Fund | 2.5% |
| MFS New Discovery Fund | 2.5% |
| MFS Institutional Money Market Portfolio | 1.5% |
Allocation Fund
| (based on a hypothetical $10,000 investment) | ||
| Class Name | Costs of a $10,000 investment ~ | Costs paid as a percentage of a $10,000 investment (annualized) ~ |
| A | $18 | 0.34% |
| Net Assets ($): | 3,813,437,829 | Portfolio Turnover Rate (%): | 2 | |
| Total Number of Holdings: | 22 |

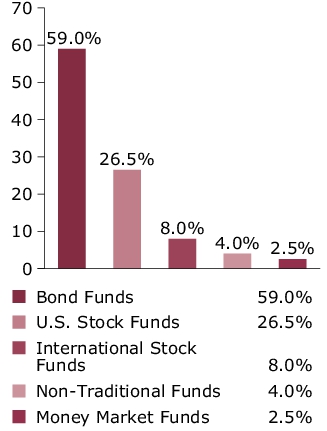
| MFS Total Return Bond Fund | 14.5% |
| MFS Inflation-Adjusted Bond Fund | 10.0% |
| MFS Limited Maturity Fund | 10.0% |
| MFS Government Securities Fund | 9.5% |
| MFS Global Opportunistic Bond Fund | 7.0% |
| MFS Value Fund | 6.0% |
| MFS Research Fund | 5.3% |
| MFS Growth Fund | 5.2% |
| MFS Mid Cap Growth Fund | 4.0% |
| MFS Mid Cap Value Fund | 4.0% |
| MFS High Income Fund | 4.0% |
| MFS Research International Fund | 3.5% |
| MFS Institutional Money Market Portfolio | 2.5% |
| MFS Global Real Estate Fund | 2.0% |
| MFS Emerging Markets Debt Fund | 2.0% |
| MFS Emerging Markets Debt Local Currency Fund | 2.0% |
| MFS Commodity Strategy Fund | 2.0% |
| MFS International Intrinsic Value Fund | 1.5% |
| MFS International Large Cap Value Fund | 1.5% |
| MFS International Growth Fund | 1.5% |
| MFS New Discovery Value Fund | 1.0% |
| MFS New Discovery Fund | 1.0% |
Allocation Fund
| (based on a hypothetical $10,000 investment) | ||
| Class Name | Costs of a $10,000 investment ~ | Costs paid as a percentage of a $10,000 investment (annualized) ~ |
| B | $56 | 1.09% |
| Net Assets ($): | 3,813,437,829 | Portfolio Turnover Rate (%): | 2 | |
| Total Number of Holdings: | 22 |

| MFS Total Return Bond Fund | 14.5% |
| MFS Inflation-Adjusted Bond Fund | 10.0% |
| MFS Limited Maturity Fund | 10.0% |
| MFS Government Securities Fund | 9.5% |
| MFS Global Opportunistic Bond Fund | 7.0% |
| MFS Value Fund | 6.0% |
| MFS Research Fund | 5.3% |
| MFS Growth Fund | 5.2% |
| MFS Mid Cap Growth Fund | 4.0% |
| MFS Mid Cap Value Fund | 4.0% |
| MFS High Income Fund | 4.0% |
| MFS Research International Fund | 3.5% |
| MFS Institutional Money Market Portfolio | 2.5% |
| MFS Global Real Estate Fund | 2.0% |
| MFS Emerging Markets Debt Fund | 2.0% |
| MFS Emerging Markets Debt Local Currency Fund | 2.0% |
| MFS Commodity Strategy Fund | 2.0% |
| MFS International Intrinsic Value Fund | 1.5% |
| MFS International Large Cap Value Fund | 1.5% |
| MFS International Growth Fund | 1.5% |
| MFS New Discovery Value Fund | 1.0% |
| MFS New Discovery Fund | 1.0% |
Allocation Fund
| (based on a hypothetical $10,000 investment) | ||
| Class Name | Costs of a $10,000 investment ~ | Costs paid as a percentage of a $10,000 investment (annualized) ~ |
| C | $56 | 1.09% |
| Net Assets ($): | 3,813,437,829 | Portfolio Turnover Rate (%): | 2 | |
| Total Number of Holdings: | 22 |

| MFS Total Return Bond Fund | 14.5% |
| MFS Inflation-Adjusted Bond Fund | 10.0% |
| MFS Limited Maturity Fund | 10.0% |
| MFS Government Securities Fund | 9.5% |
| MFS Global Opportunistic Bond Fund | 7.0% |
| MFS Value Fund | 6.0% |
| MFS Research Fund | 5.3% |
| MFS Growth Fund | 5.2% |
| MFS Mid Cap Growth Fund | 4.0% |
| MFS Mid Cap Value Fund | 4.0% |
| MFS High Income Fund | 4.0% |
| MFS Research International Fund | 3.5% |
| MFS Institutional Money Market Portfolio | 2.5% |
| MFS Global Real Estate Fund | 2.0% |
| MFS Emerging Markets Debt Fund | 2.0% |
| MFS Emerging Markets Debt Local Currency Fund | 2.0% |
| MFS Commodity Strategy Fund | 2.0% |
| MFS International Intrinsic Value Fund | 1.5% |
| MFS International Large Cap Value Fund | 1.5% |
| MFS International Growth Fund | 1.5% |
| MFS New Discovery Value Fund | 1.0% |
| MFS New Discovery Fund | 1.0% |
Allocation Fund
| (based on a hypothetical $10,000 investment) | ||
| Class Name | Costs of a $10,000 investment ~ | Costs paid as a percentage of a $10,000 investment (annualized) ~ |
| I | $5 | 0.09% |
| Net Assets ($): | 3,813,437,829 | Portfolio Turnover Rate (%): | 2 | |
| Total Number of Holdings: | 22 |

| MFS Total Return Bond Fund | 14.5% |
| MFS Inflation-Adjusted Bond Fund | 10.0% |
| MFS Limited Maturity Fund | 10.0% |
| MFS Government Securities Fund | 9.5% |
| MFS Global Opportunistic Bond Fund | 7.0% |
| MFS Value Fund | 6.0% |
| MFS Research Fund | 5.3% |
| MFS Growth Fund | 5.2% |
| MFS Mid Cap Growth Fund | 4.0% |
| MFS Mid Cap Value Fund | 4.0% |
| MFS High Income Fund | 4.0% |
| MFS Research International Fund | 3.5% |
| MFS Institutional Money Market Portfolio | 2.5% |
| MFS Global Real Estate Fund | 2.0% |
| MFS Emerging Markets Debt Fund | 2.0% |
| MFS Emerging Markets Debt Local Currency Fund | 2.0% |
| MFS Commodity Strategy Fund | 2.0% |
| MFS International Intrinsic Value Fund | 1.5% |
| MFS International Large Cap Value Fund | 1.5% |
| MFS International Growth Fund | 1.5% |
| MFS New Discovery Value Fund | 1.0% |
| MFS New Discovery Fund | 1.0% |
Allocation Fund
| (based on a hypothetical $10,000 investment) | ||
| Class Name | Costs of a $10,000 investment ~ | Costs paid as a percentage of a $10,000 investment (annualized) ~ |
| R1 | $56 | 1.09% |
| Net Assets ($): | 3,813,437,829 | Portfolio Turnover Rate (%): | 2 | |
| Total Number of Holdings: | 22 |

| MFS Total Return Bond Fund | 14.5% |
| MFS Inflation-Adjusted Bond Fund | 10.0% |
| MFS Limited Maturity Fund | 10.0% |
| MFS Government Securities Fund | 9.5% |
| MFS Global Opportunistic Bond Fund | 7.0% |
| MFS Value Fund | 6.0% |
| MFS Research Fund | 5.3% |
| MFS Growth Fund | 5.2% |
| MFS Mid Cap Growth Fund | 4.0% |
| MFS Mid Cap Value Fund | 4.0% |
| MFS High Income Fund | 4.0% |
| MFS Research International Fund | 3.5% |
| MFS Institutional Money Market Portfolio | 2.5% |
| MFS Global Real Estate Fund | 2.0% |
| MFS Emerging Markets Debt Fund | 2.0% |
| MFS Emerging Markets Debt Local Currency Fund | 2.0% |
| MFS Commodity Strategy Fund | 2.0% |
| MFS International Intrinsic Value Fund | 1.5% |
| MFS International Large Cap Value Fund | 1.5% |
| MFS International Growth Fund | 1.5% |
| MFS New Discovery Value Fund | 1.0% |
| MFS New Discovery Fund | 1.0% |
Allocation Fund
| (based on a hypothetical $10,000 investment) | ||
| Class Name | Costs of a $10,000 investment ~ | Costs paid as a percentage of a $10,000 investment (annualized) ~ |
| R2 | $30 | 0.59% |
| Net Assets ($): | 3,813,437,829 | Portfolio Turnover Rate (%): | 2 | |
| Total Number of Holdings: | 22 |

| MFS Total Return Bond Fund | 14.5% |
| MFS Inflation-Adjusted Bond Fund | 10.0% |
| MFS Limited Maturity Fund | 10.0% |
| MFS Government Securities Fund | 9.5% |
| MFS Global Opportunistic Bond Fund | 7.0% |
| MFS Value Fund | 6.0% |
| MFS Research Fund | 5.3% |
| MFS Growth Fund | 5.2% |
| MFS Mid Cap Growth Fund | 4.0% |
| MFS Mid Cap Value Fund | 4.0% |
| MFS High Income Fund | 4.0% |
| MFS Research International Fund | 3.5% |
| MFS Institutional Money Market Portfolio | 2.5% |
| MFS Global Real Estate Fund | 2.0% |
| MFS Emerging Markets Debt Fund | 2.0% |
| MFS Emerging Markets Debt Local Currency Fund | 2.0% |
| MFS Commodity Strategy Fund | 2.0% |
| MFS International Intrinsic Value Fund | 1.5% |
| MFS International Large Cap Value Fund | 1.5% |
| MFS International Growth Fund | 1.5% |
| MFS New Discovery Value Fund | 1.0% |
| MFS New Discovery Fund | 1.0% |
Allocation Fund
| (based on a hypothetical $10,000 investment) | ||
| Class Name | Costs of a $10,000 investment ~ | Costs paid as a percentage of a $10,000 investment (annualized) ~ |
| R3 | $18 | 0.34% |
| Net Assets ($): | 3,813,437,829 | Portfolio Turnover Rate (%): | 2 | |
| Total Number of Holdings: | 22 |

| MFS Total Return Bond Fund | 14.5% |
| MFS Inflation-Adjusted Bond Fund | 10.0% |
| MFS Limited Maturity Fund | 10.0% |
| MFS Government Securities Fund | 9.5% |
| MFS Global Opportunistic Bond Fund | 7.0% |
| MFS Value Fund | 6.0% |
| MFS Research Fund | 5.3% |
| MFS Growth Fund | 5.2% |
| MFS Mid Cap Growth Fund | 4.0% |
| MFS Mid Cap Value Fund | 4.0% |
| MFS High Income Fund | 4.0% |
| MFS Research International Fund | 3.5% |
| MFS Institutional Money Market Portfolio | 2.5% |
| MFS Global Real Estate Fund | 2.0% |
| MFS Emerging Markets Debt Fund | 2.0% |
| MFS Emerging Markets Debt Local Currency Fund | 2.0% |
| MFS Commodity Strategy Fund | 2.0% |
| MFS International Intrinsic Value Fund | 1.5% |
| MFS International Large Cap Value Fund | 1.5% |
| MFS International Growth Fund | 1.5% |
| MFS New Discovery Value Fund | 1.0% |
| MFS New Discovery Fund | 1.0% |
Allocation Fund
| (based on a hypothetical $10,000 investment) | ||
| Class Name | Costs of a $10,000 investment ~ | Costs paid as a percentage of a $10,000 investment (annualized) ~ |
| R4 | $5 | 0.09% |
| Net Assets ($): | 3,813,437,829 | Portfolio Turnover Rate (%): | 2 | |
| Total Number of Holdings: | 22 |

| MFS Total Return Bond Fund | 14.5% |
| MFS Inflation-Adjusted Bond Fund | 10.0% |
| MFS Limited Maturity Fund | 10.0% |
| MFS Government Securities Fund | 9.5% |
| MFS Global Opportunistic Bond Fund | 7.0% |
| MFS Value Fund | 6.0% |
| MFS Research Fund | 5.3% |
| MFS Growth Fund | 5.2% |
| MFS Mid Cap Growth Fund | 4.0% |
| MFS Mid Cap Value Fund | 4.0% |
| MFS High Income Fund | 4.0% |
| MFS Research International Fund | 3.5% |
| MFS Institutional Money Market Portfolio | 2.5% |
| MFS Global Real Estate Fund | 2.0% |
| MFS Emerging Markets Debt Fund | 2.0% |
| MFS Emerging Markets Debt Local Currency Fund | 2.0% |
| MFS Commodity Strategy Fund | 2.0% |
| MFS International Intrinsic Value Fund | 1.5% |
| MFS International Large Cap Value Fund | 1.5% |
| MFS International Growth Fund | 1.5% |
| MFS New Discovery Value Fund | 1.0% |
| MFS New Discovery Fund | 1.0% |
Allocation Fund
| (based on a hypothetical $10,000 investment) | ||
| Class Name | Costs of a $10,000 investment ~ | Costs paid as a percentage of a $10,000 investment (annualized) ~ |
| R6 | $2 | 0.03% |
| Net Assets ($): | 3,813,437,829 | Portfolio Turnover Rate (%): | 2 | |
| Total Number of Holdings: | 22 |
| MFS Total Return Bond Fund | 14.5% |
| MFS Inflation-Adjusted Bond Fund | 10.0% |
| MFS Limited Maturity Fund | 10.0% |
| MFS Government Securities Fund | 9.5% |
| MFS Global Opportunistic Bond Fund | 7.0% |
| MFS Value Fund | 6.0% |
| MFS Research Fund | 5.3% |
| MFS Growth Fund | 5.2% |
| MFS Mid Cap Growth Fund | 4.0% |
| MFS Mid Cap Value Fund | 4.0% |
| MFS High Income Fund | 4.0% |
| MFS Research International Fund | 3.5% |
| MFS Institutional Money Market Portfolio | 2.5% |
| MFS Global Real Estate Fund | 2.0% |
| MFS Emerging Markets Debt Fund | 2.0% |
| MFS Emerging Markets Debt Local Currency Fund | 2.0% |
| MFS Commodity Strategy Fund | 2.0% |
| MFS International Intrinsic Value Fund | 1.5% |
| MFS International Large Cap Value Fund | 1.5% |
| MFS International Growth Fund | 1.5% |
| MFS New Discovery Value Fund | 1.0% |
| MFS New Discovery Fund | 1.0% |
| (based on a hypothetical $10,000 investment) | ||
| Class Name | Costs of a $10,000 investment ~ | Costs paid as a percentage of a $10,000 investment (annualized) ~ |
| A | $18 | 0.34% |
| Net Assets ($): | 6,793,417,247 | Portfolio Turnover Rate (%): | 2 | |
| Total Number of Holdings: | 22 |

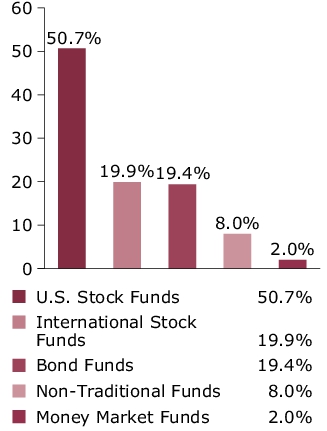
| MFS Value Fund | 10.0% |
| MFS Research Fund | 9.2% |
| MFS Growth Fund | 9.2% |
| MFS Mid Cap Growth Fund | 9.2% |
| MFS Mid Cap Value Fund | 9.1% |
| MFS Research International Fund | 7.0% |
| MFS Inflation-Adjusted Bond Fund | 5.0% |
| MFS Global Real Estate Fund | 4.0% |
| MFS Commodity Strategy Fund | 4.0% |
| MFS High Income Fund | 3.9% |
| MFS Global Opportunistic Bond Fund | 3.0% |
| MFS International Intrinsic Value Fund | 3.0% |
| MFS International Large Cap Value Fund | 3.0% |
| MFS Emerging Markets Debt Fund | 3.0% |
| MFS International Growth Fund | 3.0% |
| MFS Total Return Bond Fund | 2.5% |
| MFS New Discovery Value Fund | 2.0% |
| MFS New Discovery Fund | 2.0% |
| MFS International New Discovery Fund | 2.0% |
| MFS Institutional Money Market Portfolio | 2.0% |
| MFS Emerging Markets Debt Local Currency Fund | 2.0% |
| MFS Emerging Markets Equity Fund | 1.9% |
| (based on a hypothetical $10,000 investment) | ||
| Class Name | Costs of a $10,000 investment ~ | Costs paid as a percentage of a $10,000 investment (annualized) ~ |
| B | $57 | 1.09% |
| Net Assets ($): | 6,793,417,247 | Portfolio Turnover Rate (%): | 2 | |
| Total Number of Holdings: | 22 |

| MFS Value Fund | 10.0% |
| MFS Research Fund | 9.2% |
| MFS Growth Fund | 9.2% |
| MFS Mid Cap Growth Fund | 9.2% |
| MFS Mid Cap Value Fund | 9.1% |
| MFS Research International Fund | 7.0% |
| MFS Inflation-Adjusted Bond Fund | 5.0% |
| MFS Global Real Estate Fund | 4.0% |
| MFS Commodity Strategy Fund | 4.0% |
| MFS High Income Fund | 3.9% |
| MFS Global Opportunistic Bond Fund | 3.0% |
| MFS International Intrinsic Value Fund | 3.0% |
| MFS International Large Cap Value Fund | 3.0% |
| MFS Emerging Markets Debt Fund | 3.0% |
| MFS International Growth Fund | 3.0% |
| MFS Total Return Bond Fund | 2.5% |
| MFS New Discovery Value Fund | 2.0% |
| MFS New Discovery Fund | 2.0% |
| MFS International New Discovery Fund | 2.0% |
| MFS Institutional Money Market Portfolio | 2.0% |
| MFS Emerging Markets Debt Local Currency Fund | 2.0% |
| MFS Emerging Markets Equity Fund | 1.9% |
| (based on a hypothetical $10,000 investment) | ||
| Class Name | Costs of a $10,000 investment ~ | Costs paid as a percentage of a $10,000 investment (annualized) ~ |
| C | $57 | 1.09% |
| Net Assets ($): | 6,793,417,247 | Portfolio Turnover Rate (%): | 2 | |
| Total Number of Holdings: | 22 |

| MFS Value Fund | 10.0% |
| MFS Research Fund | 9.2% |
| MFS Growth Fund | 9.2% |
| MFS Mid Cap Growth Fund | 9.2% |
| MFS Mid Cap Value Fund | 9.1% |
| MFS Research International Fund | 7.0% |
| MFS Inflation-Adjusted Bond Fund | 5.0% |
| MFS Global Real Estate Fund | 4.0% |
| MFS Commodity Strategy Fund | 4.0% |
| MFS High Income Fund | 3.9% |
| MFS Global Opportunistic Bond Fund | 3.0% |
| MFS International Intrinsic Value Fund | 3.0% |
| MFS International Large Cap Value Fund | 3.0% |
| MFS Emerging Markets Debt Fund | 3.0% |
| MFS International Growth Fund | 3.0% |
| MFS Total Return Bond Fund | 2.5% |
| MFS New Discovery Value Fund | 2.0% |
| MFS New Discovery Fund | 2.0% |
| MFS International New Discovery Fund | 2.0% |
| MFS Institutional Money Market Portfolio | 2.0% |
| MFS Emerging Markets Debt Local Currency Fund | 2.0% |
| MFS Emerging Markets Equity Fund | 1.9% |
| (based on a hypothetical $10,000 investment) | ||
| Class Name | Costs of a $10,000 investment ~ | Costs paid as a percentage of a $10,000 investment (annualized) ~ |
| I | $5 | 0.09% |
| Net Assets ($): | 6,793,417,247 | Portfolio Turnover Rate (%): | 2 | |
| Total Number of Holdings: | 22 |

| MFS Value Fund | 10.0% |
| MFS Research Fund | 9.2% |
| MFS Growth Fund | 9.2% |
| MFS Mid Cap Growth Fund | 9.2% |
| MFS Mid Cap Value Fund | 9.1% |
| MFS Research International Fund | 7.0% |
| MFS Inflation-Adjusted Bond Fund | 5.0% |
| MFS Global Real Estate Fund | 4.0% |
| MFS Commodity Strategy Fund | 4.0% |
| MFS High Income Fund | 3.9% |
| MFS Global Opportunistic Bond Fund | 3.0% |
| MFS International Intrinsic Value Fund | 3.0% |
| MFS International Large Cap Value Fund | 3.0% |
| MFS Emerging Markets Debt Fund | 3.0% |
| MFS International Growth Fund | 3.0% |
| MFS Total Return Bond Fund | 2.5% |
| MFS New Discovery Value Fund | 2.0% |
| MFS New Discovery Fund | 2.0% |
| MFS International New Discovery Fund | 2.0% |
| MFS Institutional Money Market Portfolio | 2.0% |
| MFS Emerging Markets Debt Local Currency Fund | 2.0% |
| MFS Emerging Markets Equity Fund | 1.9% |
| (based on a hypothetical $10,000 investment) | ||
| Class Name | Costs of a $10,000 investment ~ | Costs paid as a percentage of a $10,000 investment (annualized) ~ |
| R1 | $57 | 1.09% |
| Net Assets ($): | 6,793,417,247 | Portfolio Turnover Rate (%): | 2 | |
| Total Number of Holdings: | 22 |

| MFS Value Fund | 10.0% |
| MFS Research Fund | 9.2% |
| MFS Growth Fund | 9.2% |
| MFS Mid Cap Growth Fund | 9.2% |
| MFS Mid Cap Value Fund | 9.1% |
| MFS Research International Fund | 7.0% |
| MFS Inflation-Adjusted Bond Fund | 5.0% |
| MFS Global Real Estate Fund | 4.0% |
| MFS Commodity Strategy Fund | 4.0% |
| MFS High Income Fund | 3.9% |
| MFS Global Opportunistic Bond Fund | 3.0% |
| MFS International Intrinsic Value Fund | 3.0% |
| MFS International Large Cap Value Fund | 3.0% |
| MFS Emerging Markets Debt Fund | 3.0% |
| MFS International Growth Fund | 3.0% |
| MFS Total Return Bond Fund | 2.5% |
| MFS New Discovery Value Fund | 2.0% |
| MFS New Discovery Fund | 2.0% |
| MFS International New Discovery Fund | 2.0% |
| MFS Institutional Money Market Portfolio | 2.0% |
| MFS Emerging Markets Debt Local Currency Fund | 2.0% |
| MFS Emerging Markets Equity Fund | 1.9% |
| (based on a hypothetical $10,000 investment) | ||
| Class Name | Costs of a $10,000 investment ~ | Costs paid as a percentage of a $10,000 investment (annualized) ~ |
| R2 | $31 | 0.59% |
| Net Assets ($): | 6,793,417,247 | Portfolio Turnover Rate (%): | 2 | |
| Total Number of Holdings: | 22 |

| MFS Value Fund | 10.0% |
| MFS Research Fund | 9.2% |
| MFS Growth Fund | 9.2% |
| MFS Mid Cap Growth Fund | 9.2% |
| MFS Mid Cap Value Fund | 9.1% |
| MFS Research International Fund | 7.0% |
| MFS Inflation-Adjusted Bond Fund | 5.0% |
| MFS Global Real Estate Fund | 4.0% |
| MFS Commodity Strategy Fund | 4.0% |
| MFS High Income Fund | 3.9% |
| MFS Global Opportunistic Bond Fund | 3.0% |
| MFS International Intrinsic Value Fund | 3.0% |
| MFS International Large Cap Value Fund | 3.0% |
| MFS Emerging Markets Debt Fund | 3.0% |
| MFS International Growth Fund | 3.0% |
| MFS Total Return Bond Fund | 2.5% |
| MFS New Discovery Value Fund | 2.0% |
| MFS New Discovery Fund | 2.0% |
| MFS International New Discovery Fund | 2.0% |
| MFS Institutional Money Market Portfolio | 2.0% |
| MFS Emerging Markets Debt Local Currency Fund | 2.0% |
| MFS Emerging Markets Equity Fund | 1.9% |
| (based on a hypothetical $10,000 investment) | ||
| Class Name | Costs of a $10,000 investment ~ | Costs paid as a percentage of a $10,000 investment (annualized) ~ |
| R3 | $18 | 0.34% |
| Net Assets ($): | 6,793,417,247 | Portfolio Turnover Rate (%): | 2 | |
| Total Number of Holdings: | 22 |
| MFS Value Fund | 10.0% |
| MFS Research Fund | 9.2% |
| MFS Growth Fund | 9.2% |
| MFS Mid Cap Growth Fund | 9.2% |
| MFS Mid Cap Value Fund | 9.1% |
| MFS Research International Fund | 7.0% |
| MFS Inflation-Adjusted Bond Fund | 5.0% |
| MFS Global Real Estate Fund | 4.0% |
| MFS Commodity Strategy Fund | 4.0% |
| MFS High Income Fund | 3.9% |
| MFS Global Opportunistic Bond Fund | 3.0% |
| MFS International Intrinsic Value Fund | 3.0% |
| MFS International Large Cap Value Fund | 3.0% |
| MFS Emerging Markets Debt Fund | 3.0% |
| MFS International Growth Fund | 3.0% |
| MFS Total Return Bond Fund | 2.5% |
| MFS New Discovery Value Fund | 2.0% |
| MFS New Discovery Fund | 2.0% |
| MFS International New Discovery Fund | 2.0% |
| MFS Institutional Money Market Portfolio | 2.0% |
| MFS Emerging Markets Debt Local Currency Fund | 2.0% |
| MFS Emerging Markets Equity Fund | 1.9% |
| (based on a hypothetical $10,000 investment) | ||
| Class Name | Costs of a $10,000 investment ~ | Costs paid as a percentage of a $10,000 investment (annualized) ~ |
| R4 | $5 | 0.09% |
| Net Assets ($): | 6,793,417,247 | Portfolio Turnover Rate (%): | 2 | |
| Total Number of Holdings: | 22 |

| MFS Value Fund | 10.0% |
| MFS Research Fund | 9.2% |
| MFS Growth Fund | 9.2% |
| MFS Mid Cap Growth Fund | 9.2% |
| MFS Mid Cap Value Fund | 9.1% |
| MFS Research International Fund | 7.0% |
| MFS Inflation-Adjusted Bond Fund | 5.0% |
| MFS Global Real Estate Fund | 4.0% |
| MFS Commodity Strategy Fund | 4.0% |
| MFS High Income Fund | 3.9% |
| MFS Global Opportunistic Bond Fund | 3.0% |
| MFS International Intrinsic Value Fund | 3.0% |
| MFS International Large Cap Value Fund | 3.0% |
| MFS Emerging Markets Debt Fund | 3.0% |
| MFS International Growth Fund | 3.0% |
| MFS Total Return Bond Fund | 2.5% |
| MFS New Discovery Value Fund | 2.0% |
| MFS New Discovery Fund | 2.0% |
| MFS International New Discovery Fund | 2.0% |
| MFS Institutional Money Market Portfolio | 2.0% |
| MFS Emerging Markets Debt Local Currency Fund | 2.0% |
| MFS Emerging Markets Equity Fund | 1.9% |
| (based on a hypothetical $10,000 investment) | ||
| Class Name | Costs of a $10,000 investment ~ | Costs paid as a percentage of a $10,000 investment (annualized) ~ |
| R6 | $1 | 0.02% |
| Net Assets ($): | 6,793,417,247 | Portfolio Turnover Rate (%): | 2 | |
| Total Number of Holdings: | 22 |

| MFS Value Fund | 10.0% |
| MFS Research Fund | 9.2% |
| MFS Growth Fund | 9.2% |
| MFS Mid Cap Growth Fund | 9.2% |
| MFS Mid Cap Value Fund | 9.1% |
| MFS Research International Fund | 7.0% |
| MFS Inflation-Adjusted Bond Fund | 5.0% |
| MFS Global Real Estate Fund | 4.0% |
| MFS Commodity Strategy Fund | 4.0% |
| MFS High Income Fund | 3.9% |
| MFS Global Opportunistic Bond Fund | 3.0% |
| MFS International Intrinsic Value Fund | 3.0% |
| MFS International Large Cap Value Fund | 3.0% |
| MFS Emerging Markets Debt Fund | 3.0% |
| MFS International Growth Fund | 3.0% |
| MFS Total Return Bond Fund | 2.5% |
| MFS New Discovery Value Fund | 2.0% |
| MFS New Discovery Fund | 2.0% |
| MFS International New Discovery Fund | 2.0% |
| MFS Institutional Money Market Portfolio | 2.0% |
| MFS Emerging Markets Debt Local Currency Fund | 2.0% |
| MFS Emerging Markets Equity Fund | 1.9% |
| (based on a hypothetical $10,000 investment) | ||
| Class Name | Costs of a $10,000 investment ~ | Costs paid as a percentage of a $10,000 investment (annualized) ~ |
| A | $18 | 0.34% |
| Net Assets ($): | 6,807,643,144 | Portfolio Turnover Rate (%): | 2 | |
| Total Number of Holdings: | 23 |

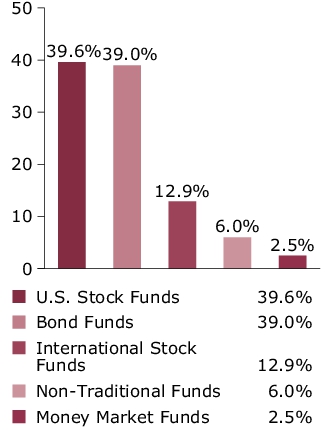
| MFS Government Securities Fund | 9.5% |
| MFS Total Return Bond Fund | 8.5% |
| MFS Value Fund | 8.0% |
| MFS Research Fund | 7.2% |
| MFS Growth Fund | 7.2% |
| MFS Mid Cap Growth Fund | 7.1% |
| MFS Mid Cap Value Fund | 7.1% |
| MFS Inflation-Adjusted Bond Fund | 7.0% |
| MFS Global Opportunistic Bond Fund | 5.0% |
| MFS Research International Fund | 5.0% |
| MFS High Income Fund | 4.0% |
| MFS Global Real Estate Fund | 3.0% |
| MFS Commodity Strategy Fund | 3.0% |
| MFS Emerging Markets Debt Fund | 3.0% |
| MFS Institutional Money Market Portfolio | 2.5% |
| MFS International Intrinsic Value Fund | 2.0% |
| MFS International Large Cap Value Fund | 2.0% |
| MFS Emerging Markets Debt Local Currency Fund | 2.0% |
| MFS International Growth Fund | 2.0% |
| MFS New Discovery Value Fund | 1.5% |
| MFS New Discovery Fund | 1.5% |
| MFS International New Discovery Fund | 1.0% |
| MFS Emerging Markets Equity Fund | 0.9% |
| (based on a hypothetical $10,000 investment) | ||
| Class Name | Costs of a $10,000 investment ~ | Costs paid as a percentage of a $10,000 investment (annualized) ~ |
| B | $57 | 1.09% |
| Net Assets ($): | 6,807,643,144 | Portfolio Turnover Rate (%): | 2 | |
| Total Number of Holdings: | 23 |

| MFS Government Securities Fund | 9.5% |
| MFS Total Return Bond Fund | 8.5% |
| MFS Value Fund | 8.0% |
| MFS Research Fund | 7.2% |
| MFS Growth Fund | 7.2% |
| MFS Mid Cap Growth Fund | 7.1% |
| MFS Mid Cap Value Fund | 7.1% |
| MFS Inflation-Adjusted Bond Fund | 7.0% |
| MFS Global Opportunistic Bond Fund | 5.0% |
| MFS Research International Fund | 5.0% |
| MFS High Income Fund | 4.0% |
| MFS Global Real Estate Fund | 3.0% |
| MFS Commodity Strategy Fund | 3.0% |
| MFS Emerging Markets Debt Fund | 3.0% |
| MFS Institutional Money Market Portfolio | 2.5% |
| MFS International Intrinsic Value Fund | 2.0% |
| MFS International Large Cap Value Fund | 2.0% |
| MFS Emerging Markets Debt Local Currency Fund | 2.0% |
| MFS International Growth Fund | 2.0% |
| MFS New Discovery Value Fund | 1.5% |
| MFS New Discovery Fund | 1.5% |
| MFS International New Discovery Fund | 1.0% |
| MFS Emerging Markets Equity Fund | 0.9% |
| (based on a hypothetical $10,000 investment) | ||
| Class Name | Costs of a $10,000 investment ~ | Costs paid as a percentage of a $10,000 investment (annualized) ~ |
| C | $57 | 1.09% |
| Net Assets ($): | 6,807,643,144 | Portfolio Turnover Rate (%): | 2 | |
| Total Number of Holdings: | 23 |

| MFS Government Securities Fund | 9.5% |
| MFS Total Return Bond Fund | 8.5% |
| MFS Value Fund | 8.0% |
| MFS Research Fund | 7.2% |
| MFS Growth Fund | 7.2% |
| MFS Mid Cap Growth Fund | 7.1% |
| MFS Mid Cap Value Fund | 7.1% |
| MFS Inflation-Adjusted Bond Fund | 7.0% |
| MFS Global Opportunistic Bond Fund | 5.0% |
| MFS Research International Fund | 5.0% |
| MFS High Income Fund | 4.0% |
| MFS Global Real Estate Fund | 3.0% |
| MFS Commodity Strategy Fund | 3.0% |
| MFS Emerging Markets Debt Fund | 3.0% |
| MFS Institutional Money Market Portfolio | 2.5% |
| MFS International Intrinsic Value Fund | 2.0% |
| MFS International Large Cap Value Fund | 2.0% |
| MFS Emerging Markets Debt Local Currency Fund | 2.0% |
| MFS International Growth Fund | 2.0% |
| MFS New Discovery Value Fund | 1.5% |
| MFS New Discovery Fund | 1.5% |
| MFS International New Discovery Fund | 1.0% |
| MFS Emerging Markets Equity Fund | 0.9% |
| (based on a hypothetical $10,000 investment) | ||
| Class Name | Costs of a $10,000 investment ~ | Costs paid as a percentage of a $10,000 investment (annualized) ~ |
| I | $5 | 0.09% |
| Net Assets ($): | 6,807,643,144 | Portfolio Turnover Rate (%): | 2 | |
| Total Number of Holdings: | 23 |

| MFS Government Securities Fund | 9.5% |
| MFS Total Return Bond Fund | 8.5% |
| MFS Value Fund | 8.0% |
| MFS Research Fund | 7.2% |
| MFS Growth Fund | 7.2% |
| MFS Mid Cap Growth Fund | 7.1% |
| MFS Mid Cap Value Fund | 7.1% |
| MFS Inflation-Adjusted Bond Fund | 7.0% |
| MFS Global Opportunistic Bond Fund | 5.0% |
| MFS Research International Fund | 5.0% |
| MFS High Income Fund | 4.0% |
| MFS Global Real Estate Fund | 3.0% |
| MFS Commodity Strategy Fund | 3.0% |
| MFS Emerging Markets Debt Fund | 3.0% |
| MFS Institutional Money Market Portfolio | 2.5% |
| MFS International Intrinsic Value Fund | 2.0% |
| MFS International Large Cap Value Fund | 2.0% |
| MFS Emerging Markets Debt Local Currency Fund | 2.0% |
| MFS International Growth Fund | 2.0% |
| MFS New Discovery Value Fund | 1.5% |
| MFS New Discovery Fund | 1.5% |
| MFS International New Discovery Fund | 1.0% |
| MFS Emerging Markets Equity Fund | 0.9% |
| (based on a hypothetical $10,000 investment) | ||
| Class Name | Costs of a $10,000 investment ~ | Costs paid as a percentage of a $10,000 investment (annualized) ~ |
| R1 | $57 | 1.09% |
| Net Assets ($): | 6,807,643,144 | Portfolio Turnover Rate (%): | 2 | |
| Total Number of Holdings: | 23 |

| MFS Government Securities Fund | 9.5% |
| MFS Total Return Bond Fund | 8.5% |
| MFS Value Fund | 8.0% |
| MFS Research Fund | 7.2% |
| MFS Growth Fund | 7.2% |
| MFS Mid Cap Growth Fund | 7.1% |
| MFS Mid Cap Value Fund | 7.1% |
| MFS Inflation-Adjusted Bond Fund | 7.0% |
| MFS Global Opportunistic Bond Fund | 5.0% |
| MFS Research International Fund | 5.0% |
| MFS High Income Fund | 4.0% |
| MFS Global Real Estate Fund | 3.0% |
| MFS Commodity Strategy Fund | 3.0% |
| MFS Emerging Markets Debt Fund | 3.0% |
| MFS Institutional Money Market Portfolio | 2.5% |
| MFS International Intrinsic Value Fund | 2.0% |
| MFS International Large Cap Value Fund | 2.0% |
| MFS Emerging Markets Debt Local Currency Fund | 2.0% |
| MFS International Growth Fund | 2.0% |
| MFS New Discovery Value Fund | 1.5% |
| MFS New Discovery Fund | 1.5% |
| MFS International New Discovery Fund | 1.0% |
| MFS Emerging Markets Equity Fund | 0.9% |
| (based on a hypothetical $10,000 investment) | ||
| Class Name | Costs of a $10,000 investment ~ | Costs paid as a percentage of a $10,000 investment (annualized) ~ |
| R2 | $31 | 0.59% |
| Net Assets ($): | 6,807,643,144 | Portfolio Turnover Rate (%): | 2 | |
| Total Number of Holdings: | 23 |

| MFS Government Securities Fund | 9.5% |
| MFS Total Return Bond Fund | 8.5% |
| MFS Value Fund | 8.0% |
| MFS Research Fund | 7.2% |
| MFS Growth Fund | 7.2% |
| MFS Mid Cap Growth Fund | 7.1% |
| MFS Mid Cap Value Fund | 7.1% |
| MFS Inflation-Adjusted Bond Fund | 7.0% |
| MFS Global Opportunistic Bond Fund | 5.0% |
| MFS Research International Fund | 5.0% |
| MFS High Income Fund | 4.0% |
| MFS Global Real Estate Fund | 3.0% |
| MFS Commodity Strategy Fund | 3.0% |
| MFS Emerging Markets Debt Fund | 3.0% |
| MFS Institutional Money Market Portfolio | 2.5% |
| MFS International Intrinsic Value Fund | 2.0% |
| MFS International Large Cap Value Fund | 2.0% |
| MFS Emerging Markets Debt Local Currency Fund | 2.0% |
| MFS International Growth Fund | 2.0% |
| MFS New Discovery Value Fund | 1.5% |
| MFS New Discovery Fund | 1.5% |
| MFS International New Discovery Fund | 1.0% |
| MFS Emerging Markets Equity Fund | 0.9% |
| (based on a hypothetical $10,000 investment) | ||
| Class Name | Costs of a $10,000 investment ~ | Costs paid as a percentage of a $10,000 investment (annualized) ~ |
| R3 | $18 | 0.34% |
| Net Assets ($): | 6,807,643,144 | Portfolio Turnover Rate (%): | 2 | |
| Total Number of Holdings: | 23 |

| MFS Government Securities Fund | 9.5% |
| MFS Total Return Bond Fund | 8.5% |
| MFS Value Fund | 8.0% |
| MFS Research Fund | 7.2% |
| MFS Growth Fund | 7.2% |
| MFS Mid Cap Growth Fund | 7.1% |
| MFS Mid Cap Value Fund | 7.1% |
| MFS Inflation-Adjusted Bond Fund | 7.0% |
| MFS Global Opportunistic Bond Fund | 5.0% |
| MFS Research International Fund | 5.0% |
| MFS High Income Fund | 4.0% |
| MFS Global Real Estate Fund | 3.0% |
| MFS Commodity Strategy Fund | 3.0% |
| MFS Emerging Markets Debt Fund | 3.0% |
| MFS Institutional Money Market Portfolio | 2.5% |
| MFS International Intrinsic Value Fund | 2.0% |
| MFS International Large Cap Value Fund | 2.0% |
| MFS Emerging Markets Debt Local Currency Fund | 2.0% |
| MFS International Growth Fund | 2.0% |
| MFS New Discovery Value Fund | 1.5% |
| MFS New Discovery Fund | 1.5% |
| MFS International New Discovery Fund | 1.0% |
| MFS Emerging Markets Equity Fund | 0.9% |
| (based on a hypothetical $10,000 investment) | ||
| Class Name | Costs of a $10,000 investment ~ | Costs paid as a percentage of a $10,000 investment (annualized) ~ |
| R4 | $5 | 0.09% |
| Net Assets ($): | 6,807,643,144 | Portfolio Turnover Rate (%): | 2 | |
| Total Number of Holdings: | 23 |

| MFS Government Securities Fund | 9.5% |
| MFS Total Return Bond Fund | 8.5% |
| MFS Value Fund | 8.0% |
| MFS Research Fund | 7.2% |
| MFS Growth Fund | 7.2% |
| MFS Mid Cap Growth Fund | 7.1% |
| MFS Mid Cap Value Fund | 7.1% |
| MFS Inflation-Adjusted Bond Fund | 7.0% |
| MFS Global Opportunistic Bond Fund | 5.0% |
| MFS Research International Fund | 5.0% |
| MFS High Income Fund | 4.0% |
| MFS Global Real Estate Fund | 3.0% |
| MFS Commodity Strategy Fund | 3.0% |
| MFS Emerging Markets Debt Fund | 3.0% |
| MFS Institutional Money Market Portfolio | 2.5% |
| MFS International Intrinsic Value Fund | 2.0% |
| MFS International Large Cap Value Fund | 2.0% |
| MFS Emerging Markets Debt Local Currency Fund | 2.0% |
| MFS International Growth Fund | 2.0% |
| MFS New Discovery Value Fund | 1.5% |
| MFS New Discovery Fund | 1.5% |
| MFS International New Discovery Fund | 1.0% |
| MFS Emerging Markets Equity Fund | 0.9% |
| (based on a hypothetical $10,000 investment) | ||
| Class Name | Costs of a $10,000 investment ~ | Costs paid as a percentage of a $10,000 investment (annualized) ~ |
| R6 | $1 | 0.02% |
| Net Assets ($): | 6,807,643,144 | Portfolio Turnover Rate (%): | 2 | |
| Total Number of Holdings: | 23 |
| MFS Government Securities Fund | 9.5% |
| MFS Total Return Bond Fund | 8.5% |
| MFS Value Fund | 8.0% |
| MFS Research Fund | 7.2% |
| MFS Growth Fund | 7.2% |
| MFS Mid Cap Growth Fund | 7.1% |
| MFS Mid Cap Value Fund | 7.1% |
| MFS Inflation-Adjusted Bond Fund | 7.0% |
| MFS Global Opportunistic Bond Fund | 5.0% |
| MFS Research International Fund | 5.0% |
| MFS High Income Fund | 4.0% |
| MFS Global Real Estate Fund | 3.0% |
| MFS Commodity Strategy Fund | 3.0% |
| MFS Emerging Markets Debt Fund | 3.0% |
| MFS Institutional Money Market Portfolio | 2.5% |
| MFS International Intrinsic Value Fund | 2.0% |
| MFS International Large Cap Value Fund | 2.0% |
| MFS Emerging Markets Debt Local Currency Fund | 2.0% |
| MFS International Growth Fund | 2.0% |
| MFS New Discovery Value Fund | 1.5% |
| MFS New Discovery Fund | 1.5% |
| MFS International New Discovery Fund | 1.0% |
| MFS Emerging Markets Equity Fund | 0.9% |
Mid Cap Equity Fund
| (based on a hypothetical $10,000 investment) | ||
| Class Name | Costs of a $10,000 investment | Costs paid as a percentage of a $10,000 investment (annualized) |
| A | $46 | 0.84% |
| Net Assets ($): | 956,869,646 | Portfolio Turnover Rate (%): | 30 | |
| Total Number of Holdings: | 147 |
| Equities | 99.1% |
| Money Market Funds | 0.9% |
| Financials | 17.4% |
| Industrials | 16.7% |
| Information Technology | 12.7% |
| Consumer Discretionary | 10.5% |
| Health Care | 10.4% |
| Real Estate | 7.8% |
| Utilities | 7.3% |
| Energy | 4.5% |
| Materials | 4.4% |
| Communication Services | 3.9% |
| Consumer Staples | 3.5% |
| Ameriprise Financial, Inc. | 2.0% |
| M&T Bank Corp. | 1.8% |
| Spotify Technology S.A. | 1.7% |
| Vistra Corp. | 1.6% |
| Wabtec Corp. | 1.6% |
| AppLovin Corp. | 1.6% |
| Hartford Financial Services Group, Inc. | 1.6% |
| Veeva Systems, Inc. | 1.6% |
| Datadog, Inc., "A" | 1.5% |
| Verisk Analytics, Inc., "A" | 1.5% |
Mid Cap Equity Fund
| (based on a hypothetical $10,000 investment) | ||
| Class Name | Costs of a $10,000 investment | Costs paid as a percentage of a $10,000 investment (annualized) |
| B | $86 | 1.59% |
| Net Assets ($): | 956,869,646 | Portfolio Turnover Rate (%): | 30 | |
| Total Number of Holdings: | 147 |
| Equities | 99.1% |
| Money Market Funds | 0.9% |
| Financials | 17.4% |
| Industrials | 16.7% |
| Information Technology | 12.7% |
| Consumer Discretionary | 10.5% |
| Health Care | 10.4% |
| Real Estate | 7.8% |
| Utilities | 7.3% |
| Energy | 4.5% |
| Materials | 4.4% |
| Communication Services | 3.9% |
| Consumer Staples | 3.5% |
| Ameriprise Financial, Inc. | 2.0% |
| M&T Bank Corp. | 1.8% |
| Spotify Technology S.A. | 1.7% |
| Vistra Corp. | 1.6% |
| Wabtec Corp. | 1.6% |
| AppLovin Corp. | 1.6% |
| Hartford Financial Services Group, Inc. | 1.6% |
| Veeva Systems, Inc. | 1.6% |
| Datadog, Inc., "A" | 1.5% |
| Verisk Analytics, Inc., "A" | 1.5% |
Mid Cap Equity Fund
| (based on a hypothetical $10,000 investment) | ||
| Class Name | Costs of a $10,000 investment | Costs paid as a percentage of a $10,000 investment (annualized) |
| C | $86 | 1.59% |
| Net Assets ($): | 956,869,646 | Portfolio Turnover Rate (%): | 30 | |
| Total Number of Holdings: | 147 |
| Equities | 99.1% |
| Money Market Funds | 0.9% |
| Financials | 17.4% |
| Industrials | 16.7% |
| Information Technology | 12.7% |
| Consumer Discretionary | 10.5% |
| Health Care | 10.4% |
| Real Estate | 7.8% |
| Utilities | 7.3% |
| Energy | 4.5% |
| Materials | 4.4% |
| Communication Services | 3.9% |
| Consumer Staples | 3.5% |
| Ameriprise Financial, Inc. | 2.0% |
| M&T Bank Corp. | 1.8% |
| Spotify Technology S.A. | 1.7% |
| Vistra Corp. | 1.6% |
| Wabtec Corp. | 1.6% |
| AppLovin Corp. | 1.6% |
| Hartford Financial Services Group, Inc. | 1.6% |
| Veeva Systems, Inc. | 1.6% |
| Datadog, Inc., "A" | 1.5% |
| Verisk Analytics, Inc., "A" | 1.5% |
Mid Cap Equity Fund
| (based on a hypothetical $10,000 investment) | ||
| Class Name | Costs of a $10,000 investment | Costs paid as a percentage of a $10,000 investment (annualized) |
| I | $32 | 0.59% |
| Net Assets ($): | 956,869,646 | Portfolio Turnover Rate (%): | 30 | |
| Total Number of Holdings: | 147 |
| Equities | 99.1% |
| Money Market Funds | 0.9% |
| Financials | 17.4% |
| Industrials | 16.7% |
| Information Technology | 12.7% |
| Consumer Discretionary | 10.5% |
| Health Care | 10.4% |
| Real Estate | 7.8% |
| Utilities | 7.3% |
| Energy | 4.5% |
| Materials | 4.4% |
| Communication Services | 3.9% |
| Consumer Staples | 3.5% |
| Ameriprise Financial, Inc. | 2.0% |
| M&T Bank Corp. | 1.8% |
| Spotify Technology S.A. | 1.7% |
| Vistra Corp. | 1.6% |
| Wabtec Corp. | 1.6% |
| AppLovin Corp. | 1.6% |
| Hartford Financial Services Group, Inc. | 1.6% |
| Veeva Systems, Inc. | 1.6% |
| Datadog, Inc., "A" | 1.5% |
| Verisk Analytics, Inc., "A" | 1.5% |
Mid Cap Equity Fund
| (based on a hypothetical $10,000 investment) | ||
| Class Name | Costs of a $10,000 investment | Costs paid as a percentage of a $10,000 investment (annualized) |
| R1 | $72 | 1.32% |
| Net Assets ($): | 956,869,646 | Portfolio Turnover Rate (%): | 30 | |
| Total Number of Holdings: | 147 |
| Equities | 99.1% |
| Money Market Funds | 0.9% |
| Financials | 17.4% |
| Industrials | 16.7% |
| Information Technology | 12.7% |
| Consumer Discretionary | 10.5% |
| Health Care | 10.4% |
| Real Estate | 7.8% |
| Utilities | 7.3% |
| Energy | 4.5% |
| Materials | 4.4% |
| Communication Services | 3.9% |
| Consumer Staples | 3.5% |
| Ameriprise Financial, Inc. | 2.0% |
| M&T Bank Corp. | 1.8% |
| Spotify Technology S.A. | 1.7% |
| Vistra Corp. | 1.6% |
| Wabtec Corp. | 1.6% |
| AppLovin Corp. | 1.6% |
| Hartford Financial Services Group, Inc. | 1.6% |
| Veeva Systems, Inc. | 1.6% |
| Datadog, Inc., "A" | 1.5% |
| Verisk Analytics, Inc., "A" | 1.5% |
Mid Cap Equity Fund
| (based on a hypothetical $10,000 investment) | ||
| Class Name | Costs of a $10,000 investment | Costs paid as a percentage of a $10,000 investment (annualized) |
| R2 | $59 | 1.09% |
| Net Assets ($): | 956,869,646 | Portfolio Turnover Rate (%): | 30 | |
| Total Number of Holdings: | 147 |
| Equities | 99.1% |
| Money Market Funds | 0.9% |
| Financials | 17.4% |
| Industrials | 16.7% |
| Information Technology | 12.7% |
| Consumer Discretionary | 10.5% |
| Health Care | 10.4% |
| Real Estate | 7.8% |
| Utilities | 7.3% |
| Energy | 4.5% |
| Materials | 4.4% |
| Communication Services | 3.9% |
| Consumer Staples | 3.5% |
| Ameriprise Financial, Inc. | 2.0% |
| M&T Bank Corp. | 1.8% |
| Spotify Technology S.A. | 1.7% |
| Vistra Corp. | 1.6% |
| Wabtec Corp. | 1.6% |
| AppLovin Corp. | 1.6% |
| Hartford Financial Services Group, Inc. | 1.6% |
| Veeva Systems, Inc. | 1.6% |
| Datadog, Inc., "A" | 1.5% |
| Verisk Analytics, Inc., "A" | 1.5% |
Mid Cap Equity Fund
| (based on a hypothetical $10,000 investment) | ||
| Class Name | Costs of a $10,000 investment | Costs paid as a percentage of a $10,000 investment (annualized) |
| R3 | $46 | 0.84% |
| Net Assets ($): | 956,869,646 | Portfolio Turnover Rate (%): | 30 | |
| Total Number of Holdings: | 147 |
| Equities | 99.1% |
| Money Market Funds | 0.9% |
| Financials | 17.4% |
| Industrials | 16.7% |
| Information Technology | 12.7% |
| Consumer Discretionary | 10.5% |
| Health Care | 10.4% |
| Real Estate | 7.8% |
| Utilities | 7.3% |
| Energy | 4.5% |
| Materials | 4.4% |
| Communication Services | 3.9% |
| Consumer Staples | 3.5% |
| Ameriprise Financial, Inc. | 2.0% |
| M&T Bank Corp. | 1.8% |
| Spotify Technology S.A. | 1.7% |
| Vistra Corp. | 1.6% |
| Wabtec Corp. | 1.6% |
| AppLovin Corp. | 1.6% |
| Hartford Financial Services Group, Inc. | 1.6% |
| Veeva Systems, Inc. | 1.6% |
| Datadog, Inc., "A" | 1.5% |
| Verisk Analytics, Inc., "A" | 1.5% |
Mid Cap Equity Fund
| (based on a hypothetical $10,000 investment) | ||
| Class Name | Costs of a $10,000 investment | Costs paid as a percentage of a $10,000 investment (annualized) |
| R4 | $32 | 0.59% |
| Net Assets ($): | 956,869,646 | Portfolio Turnover Rate (%): | 30 | |
| Total Number of Holdings: | 147 |
| Equities | 99.1% |
| Money Market Funds | 0.9% |
| Financials | 17.4% |
| Industrials | 16.7% |
| Information Technology | 12.7% |
| Consumer Discretionary | 10.5% |
| Health Care | 10.4% |
| Real Estate | 7.8% |
| Utilities | 7.3% |
| Energy | 4.5% |
| Materials | 4.4% |
| Communication Services | 3.9% |
| Consumer Staples | 3.5% |
| Ameriprise Financial, Inc. | 2.0% |
| M&T Bank Corp. | 1.8% |
| Spotify Technology S.A. | 1.7% |
| Vistra Corp. | 1.6% |
| Wabtec Corp. | 1.6% |
| AppLovin Corp. | 1.6% |
| Hartford Financial Services Group, Inc. | 1.6% |
| Veeva Systems, Inc. | 1.6% |
| Datadog, Inc., "A" | 1.5% |
| Verisk Analytics, Inc., "A" | 1.5% |
Mid Cap Equity Fund
| (based on a hypothetical $10,000 investment) | ||
| Class Name | Costs of a $10,000 investment | Costs paid as a percentage of a $10,000 investment (annualized) |
| R6 | $26 | 0.48% |
| Net Assets ($): | 956,869,646 | Portfolio Turnover Rate (%): | 30 | |
| Total Number of Holdings: | 147 |
| Equities | 99.1% |
| Money Market Funds | 0.9% |
| Financials | 17.4% |
| Industrials | 16.7% |
| Information Technology | 12.7% |
| Consumer Discretionary | 10.5% |
| Health Care | 10.4% |
| Real Estate | 7.8% |
| Utilities | 7.3% |
| Energy | 4.5% |
| Materials | 4.4% |
| Communication Services | 3.9% |
| Consumer Staples | 3.5% |
| Ameriprise Financial, Inc. | 2.0% |
| M&T Bank Corp. | 1.8% |
| Spotify Technology S.A. | 1.7% |
| Vistra Corp. | 1.6% |
| Wabtec Corp. | 1.6% |
| AppLovin Corp. | 1.6% |
| Hartford Financial Services Group, Inc. | 1.6% |
| Veeva Systems, Inc. | 1.6% |
| Datadog, Inc., "A" | 1.5% |
| Verisk Analytics, Inc., "A" | 1.5% |
Small Cap Equity Fund
| (based on a hypothetical $10,000 investment) | ||
| Class Name | Costs of a $10,000 investment | Costs paid as a percentage of a $10,000 investment (annualized) |
| A | $53 | 0.99% |
| Net Assets ($): | 364,265,504 | Portfolio Turnover Rate (%): | 32 | |
| Total Number of Holdings: | 183 |
| Equities | 99.3% |
| Money Market Funds | 0.7% |
| Financials | 20.4% |
| Health Care | 17.6% |
| Industrials | 15.9% |
| Information Technology | 12.8% |
| Consumer Discretionary | 11.1% |
| Energy | 5.4% |
| Real Estate | 5.2% |
| Materials | 5.0% |
| Communication Services | 2.9% |
| Utilities | 1.6% |
| Consumer Staples | 1.4% |
| Prestige Consumer Healthcare, Inc. | 1.7% |
| Newell Brands, Inc. | 1.7% |
| Encompass Health Corp. | 1.6% |
| SLM Corp. | 1.5% |
| Columbia Banking System, Inc. | 1.5% |
| Armstrong World Industries, Inc. | 1.5% |
| Piedmont Office Realty Trust, Inc., REIT | 1.5% |
| Element Solutions, Inc. | 1.4% |
| Grand Canyon Education, Inc. | 1.4% |
| Cathay General Bancorp, Inc. | 1.4% |
Small Cap Equity Fund
| (based on a hypothetical $10,000 investment) | ||
| Class Name | Costs of a $10,000 investment | Costs paid as a percentage of a $10,000 investment (annualized) |
| B | $92 | 1.74% |
| Net Assets ($): | 364,265,504 | Portfolio Turnover Rate (%): | 32 | |
| Total Number of Holdings: | 183 |
| Equities | 99.3% |
| Money Market Funds | 0.7% |
| Financials | 20.4% |
| Health Care | 17.6% |
| Industrials | 15.9% |
| Information Technology | 12.8% |
| Consumer Discretionary | 11.1% |
| Energy | 5.4% |
| Real Estate | 5.2% |
| Materials | 5.0% |
| Communication Services | 2.9% |
| Utilities | 1.6% |
| Consumer Staples | 1.4% |
| Prestige Consumer Healthcare, Inc. | 1.7% |
| Newell Brands, Inc. | 1.7% |
| Encompass Health Corp. | 1.6% |
| SLM Corp. | 1.5% |
| Columbia Banking System, Inc. | 1.5% |
| Armstrong World Industries, Inc. | 1.5% |
| Piedmont Office Realty Trust, Inc., REIT | 1.5% |
| Element Solutions, Inc. | 1.4% |
| Grand Canyon Education, Inc. | 1.4% |
| Cathay General Bancorp, Inc. | 1.4% |
Small Cap Equity Fund
| (based on a hypothetical $10,000 investment) | ||
| Class Name | Costs of a $10,000 investment | Costs paid as a percentage of a $10,000 investment (annualized) |
| C | $92 | 1.74% |
| Net Assets ($): | 364,265,504 | Portfolio Turnover Rate (%): | 32 | |
| Total Number of Holdings: | 183 |
| Equities | 99.3% |
| Money Market Funds | 0.7% |
| Financials | 20.4% |
| Health Care | 17.6% |
| Industrials | 15.9% |
| Information Technology | 12.8% |
| Consumer Discretionary | 11.1% |
| Energy | 5.4% |
| Real Estate | 5.2% |
| Materials | 5.0% |
| Communication Services | 2.9% |
| Utilities | 1.6% |
| Consumer Staples | 1.4% |
| Prestige Consumer Healthcare, Inc. | 1.7% |
| Newell Brands, Inc. | 1.7% |
| Encompass Health Corp. | 1.6% |
| SLM Corp. | 1.5% |
| Columbia Banking System, Inc. | 1.5% |
| Armstrong World Industries, Inc. | 1.5% |
| Piedmont Office Realty Trust, Inc., REIT | 1.5% |
| Element Solutions, Inc. | 1.4% |
| Grand Canyon Education, Inc. | 1.4% |
| Cathay General Bancorp, Inc. | 1.4% |
Small Cap Equity Fund
| (based on a hypothetical $10,000 investment) | ||
| Class Name | Costs of a $10,000 investment | Costs paid as a percentage of a $10,000 investment (annualized) |
| I | $39 | 0.74% |
| Net Assets ($): | 364,265,504 | Portfolio Turnover Rate (%): | 32 | |
| Total Number of Holdings: | 183 |
| Equities | 99.3% |
| Money Market Funds | 0.7% |
| Financials | 20.4% |
| Health Care | 17.6% |
| Industrials | 15.9% |
| Information Technology | 12.8% |
| Consumer Discretionary | 11.1% |
| Energy | 5.4% |
| Real Estate | 5.2% |
| Materials | 5.0% |
| Communication Services | 2.9% |
| Utilities | 1.6% |
| Consumer Staples | 1.4% |
| Prestige Consumer Healthcare, Inc. | 1.7% |
| Newell Brands, Inc. | 1.7% |
| Encompass Health Corp. | 1.6% |
| SLM Corp. | 1.5% |
| Columbia Banking System, Inc. | 1.5% |
| Armstrong World Industries, Inc. | 1.5% |
| Piedmont Office Realty Trust, Inc., REIT | 1.5% |
| Element Solutions, Inc. | 1.4% |
| Grand Canyon Education, Inc. | 1.4% |
| Cathay General Bancorp, Inc. | 1.4% |
Small Cap Equity Fund
| (based on a hypothetical $10,000 investment) | ||
| Class Name | Costs of a $10,000 investment | Costs paid as a percentage of a $10,000 investment (annualized) |
| R1 | $92 | 1.74% |
| Net Assets ($): | 364,265,504 | Portfolio Turnover Rate (%): | 32 | |
| Total Number of Holdings: | 183 |
| Equities | 99.3% |
| Money Market Funds | 0.7% |
| Financials | 20.4% |
| Health Care | 17.6% |
| Industrials | 15.9% |
| Information Technology | 12.8% |
| Consumer Discretionary | 11.1% |
| Energy | 5.4% |
| Real Estate | 5.2% |
| Materials | 5.0% |
| Communication Services | 2.9% |
| Utilities | 1.6% |
| Consumer Staples | 1.4% |
| Prestige Consumer Healthcare, Inc. | 1.7% |
| Newell Brands, Inc. | 1.7% |
| Encompass Health Corp. | 1.6% |
| SLM Corp. | 1.5% |
| Columbia Banking System, Inc. | 1.5% |
| Armstrong World Industries, Inc. | 1.5% |
| Piedmont Office Realty Trust, Inc., REIT | 1.5% |
| Element Solutions, Inc. | 1.4% |
| Grand Canyon Education, Inc. | 1.4% |
| Cathay General Bancorp, Inc. | 1.4% |
Small Cap Equity Fund
| (based on a hypothetical $10,000 investment) | ||
| Class Name | Costs of a $10,000 investment | Costs paid as a percentage of a $10,000 investment (annualized) |
| R2 | $66 | 1.24% |
| Net Assets ($): | 364,265,504 | Portfolio Turnover Rate (%): | 32 | |
| Total Number of Holdings: | 183 |
| Equities | 99.3% |
| Money Market Funds | 0.7% |
| Financials | 20.4% |
| Health Care | 17.6% |
| Industrials | 15.9% |
| Information Technology | 12.8% |
| Consumer Discretionary | 11.1% |
| Energy | 5.4% |
| Real Estate | 5.2% |
| Materials | 5.0% |
| Communication Services | 2.9% |
| Utilities | 1.6% |
| Consumer Staples | 1.4% |
| Prestige Consumer Healthcare, Inc. | 1.7% |
| Newell Brands, Inc. | 1.7% |
| Encompass Health Corp. | 1.6% |
| SLM Corp. | 1.5% |
| Columbia Banking System, Inc. | 1.5% |
| Armstrong World Industries, Inc. | 1.5% |
| Piedmont Office Realty Trust, Inc., REIT | 1.5% |
| Element Solutions, Inc. | 1.4% |
| Grand Canyon Education, Inc. | 1.4% |
| Cathay General Bancorp, Inc. | 1.4% |
Small Cap Equity Fund
| (based on a hypothetical $10,000 investment) | ||
| Class Name | Costs of a $10,000 investment | Costs paid as a percentage of a $10,000 investment (annualized) |
| R3 | $53 | 0.99% |
| Net Assets ($): | 364,265,504 | Portfolio Turnover Rate (%): | 32 | |
| Total Number of Holdings: | 183 |
| Equities | 99.3% |
| Money Market Funds | 0.7% |
| Financials | 20.4% |
| Health Care | 17.6% |
| Industrials | 15.9% |
| Information Technology | 12.8% |
| Consumer Discretionary | 11.1% |
| Energy | 5.4% |
| Real Estate | 5.2% |
| Materials | 5.0% |
| Communication Services | 2.9% |
| Utilities | 1.6% |
| Consumer Staples | 1.4% |
| Prestige Consumer Healthcare, Inc. | 1.7% |
| Newell Brands, Inc. | 1.7% |
| Encompass Health Corp. | 1.6% |
| SLM Corp. | 1.5% |
| Columbia Banking System, Inc. | 1.5% |
| Armstrong World Industries, Inc. | 1.5% |
| Piedmont Office Realty Trust, Inc., REIT | 1.5% |
| Element Solutions, Inc. | 1.4% |
| Grand Canyon Education, Inc. | 1.4% |
| Cathay General Bancorp, Inc. | 1.4% |
Small Cap Equity Fund
| (based on a hypothetical $10,000 investment) | ||
| Class Name | Costs of a $10,000 investment | Costs paid as a percentage of a $10,000 investment (annualized) |
| R4 | $39 | 0.74% |
| Net Assets ($): | 364,265,504 | Portfolio Turnover Rate (%): | 32 | |
| Total Number of Holdings: | 183 |
| Equities | 99.3% |
| Money Market Funds | 0.7% |
| Financials | 20.4% |
| Health Care | 17.6% |
| Industrials | 15.9% |
| Information Technology | 12.8% |
| Consumer Discretionary | 11.1% |
| Energy | 5.4% |
| Real Estate | 5.2% |
| Materials | 5.0% |
| Communication Services | 2.9% |
| Utilities | 1.6% |
| Consumer Staples | 1.4% |
| Prestige Consumer Healthcare, Inc. | 1.7% |
| Newell Brands, Inc. | 1.7% |
| Encompass Health Corp. | 1.6% |
| SLM Corp. | 1.5% |
| Columbia Banking System, Inc. | 1.5% |
| Armstrong World Industries, Inc. | 1.5% |
| Piedmont Office Realty Trust, Inc., REIT | 1.5% |
| Element Solutions, Inc. | 1.4% |
| Grand Canyon Education, Inc. | 1.4% |
| Cathay General Bancorp, Inc. | 1.4% |
Small Cap Equity Fund
| (based on a hypothetical $10,000 investment) | ||
| Class Name | Costs of a $10,000 investment | Costs paid as a percentage of a $10,000 investment (annualized) |
| R6 | $34 | 0.63% |
| Net Assets ($): | 364,265,504 | Portfolio Turnover Rate (%): | 32 | |
| Total Number of Holdings: | 183 |
| Equities | 99.3% |
| Money Market Funds | 0.7% |
| Financials | 20.4% |
| Health Care | 17.6% |
| Industrials | 15.9% |
| Information Technology | 12.8% |
| Consumer Discretionary | 11.1% |
| Energy | 5.4% |
| Real Estate | 5.2% |
| Materials | 5.0% |
| Communication Services | 2.9% |
| Utilities | 1.6% |
| Consumer Staples | 1.4% |
| Prestige Consumer Healthcare, Inc. | 1.7% |
| Newell Brands, Inc. | 1.7% |
| Encompass Health Corp. | 1.6% |
| SLM Corp. | 1.5% |
| Columbia Banking System, Inc. | 1.5% |
| Armstrong World Industries, Inc. | 1.5% |
| Piedmont Office Realty Trust, Inc., REIT | 1.5% |
| Element Solutions, Inc. | 1.4% |
| Grand Canyon Education, Inc. | 1.4% |
| Cathay General Bancorp, Inc. | 1.4% |
Value Equity Fund
| (based on a hypothetical $10,000 investment) | ||
| Class Name | Costs of a $10,000 investment | Costs paid as a percentage of a $10,000 investment (annualized) |
| A | $39 | 0.74% |
| Net Assets ($): | 303,323,916 | Portfolio Turnover Rate (%): | 25 | |
| Total Number of Holdings: | 108 |
| Equities | 99.5% |
| Money Market Funds | 0.5% |
| Financials | 22.4% |
| Health Care | 15.2% |
| Industrials | 14.0% |
| Information Technology | 8.3% |
| Consumer Staples | 8.1% |
| Energy | 7.2% |
| Consumer Discretionary | 6.2% |
| Utilities | 5.2% |
| Real Estate | 4.9% |
| Materials | 4.1% |
| Communication Services | 3.9% |
| JPMorgan Chase & Co. | 3.2% |
| Johnson & Johnson | 2.6% |
| Wells Fargo & Co. | 2.4% |
| NextEra Energy, Inc. | 1.9% |
| Berkshire Hathaway, Inc., "B" | 1.9% |
| Eaton Corp. PLC | 1.8% |
| American Express Co. | 1.8% |
| T-Mobile USA, Inc. | 1.8% |
| Fiserv, Inc. | 1.7% |
| Pfizer, Inc. | 1.7% |
Value Equity Fund
| (based on a hypothetical $10,000 investment) | ||
| Class Name | Costs of a $10,000 investment | Costs paid as a percentage of a $10,000 investment (annualized) |
| B | $78 | 1.49% |
| Net Assets ($): | 303,323,916 | Portfolio Turnover Rate (%): | 25 | |
| Total Number of Holdings: | 108 |
| Equities | 99.5% |
| Money Market Funds | 0.5% |
| Financials | 22.4% |
| Health Care | 15.2% |
| Industrials | 14.0% |
| Information Technology | 8.3% |
| Consumer Staples | 8.1% |
| Energy | 7.2% |
| Consumer Discretionary | 6.2% |
| Utilities | 5.2% |
| Real Estate | 4.9% |
| Materials | 4.1% |
| Communication Services | 3.9% |
| JPMorgan Chase & Co. | 3.2% |
| Johnson & Johnson | 2.6% |
| Wells Fargo & Co. | 2.4% |
| NextEra Energy, Inc. | 1.9% |
| Berkshire Hathaway, Inc., "B" | 1.9% |
| Eaton Corp. PLC | 1.8% |
| American Express Co. | 1.8% |
| T-Mobile USA, Inc. | 1.8% |
| Fiserv, Inc. | 1.7% |
| Pfizer, Inc. | 1.7% |
Value Equity Fund
| (based on a hypothetical $10,000 investment) | ||
| Class Name | Costs of a $10,000 investment | Costs paid as a percentage of a $10,000 investment (annualized) |
| C | $78 | 1.49% |
| Net Assets ($): | 303,323,916 | Portfolio Turnover Rate (%): | 25 | |
| Total Number of Holdings: | 108 |
| Equities | 99.5% |
| Money Market Funds | 0.5% |
| Financials | 22.4% |
| Health Care | 15.2% |
| Industrials | 14.0% |
| Information Technology | 8.3% |
| Consumer Staples | 8.1% |
| Energy | 7.2% |
| Consumer Discretionary | 6.2% |
| Utilities | 5.2% |
| Real Estate | 4.9% |
| Materials | 4.1% |
| Communication Services | 3.9% |
| JPMorgan Chase & Co. | 3.2% |
| Johnson & Johnson | 2.6% |
| Wells Fargo & Co. | 2.4% |
| NextEra Energy, Inc. | 1.9% |
| Berkshire Hathaway, Inc., "B" | 1.9% |
| Eaton Corp. PLC | 1.8% |
| American Express Co. | 1.8% |
| T-Mobile USA, Inc. | 1.8% |
| Fiserv, Inc. | 1.7% |
| Pfizer, Inc. | 1.7% |
Value Equity Fund
| (based on a hypothetical $10,000 investment) | ||
| Class Name | Costs of a $10,000 investment | Costs paid as a percentage of a $10,000 investment (annualized) |
| I | $26 | 0.49% |
| Net Assets ($): | 303,323,916 | Portfolio Turnover Rate (%): | 25 | |
| Total Number of Holdings: | 108 |
| Equities | 99.5% |
| Money Market Funds | 0.5% |
| Financials | 22.4% |
| Health Care | 15.2% |
| Industrials | 14.0% |
| Information Technology | 8.3% |
| Consumer Staples | 8.1% |
| Energy | 7.2% |
| Consumer Discretionary | 6.2% |
| Utilities | 5.2% |
| Real Estate | 4.9% |
| Materials | 4.1% |
| Communication Services | 3.9% |
| JPMorgan Chase & Co. | 3.2% |
| Johnson & Johnson | 2.6% |
| Wells Fargo & Co. | 2.4% |
| NextEra Energy, Inc. | 1.9% |
| Berkshire Hathaway, Inc., "B" | 1.9% |
| Eaton Corp. PLC | 1.8% |
| American Express Co. | 1.8% |
| T-Mobile USA, Inc. | 1.8% |
| Fiserv, Inc. | 1.7% |
| Pfizer, Inc. | 1.7% |
Value Equity Fund
| (based on a hypothetical $10,000 investment) | ||
| Class Name | Costs of a $10,000 investment | Costs paid as a percentage of a $10,000 investment (annualized) |
| R1 | $39 | 0.74% |
| Net Assets ($): | 303,323,916 | Portfolio Turnover Rate (%): | 25 | |
| Total Number of Holdings: | 108 |
| Equities | 99.5% |
| Money Market Funds | 0.5% |
| Financials | 22.4% |
| Health Care | 15.2% |
| Industrials | 14.0% |
| Information Technology | 8.3% |
| Consumer Staples | 8.1% |
| Energy | 7.2% |
| Consumer Discretionary | 6.2% |
| Utilities | 5.2% |
| Real Estate | 4.9% |
| Materials | 4.1% |
| Communication Services | 3.9% |
| JPMorgan Chase & Co. | 3.2% |
| Johnson & Johnson | 2.6% |
| Wells Fargo & Co. | 2.4% |
| NextEra Energy, Inc. | 1.9% |
| Berkshire Hathaway, Inc., "B" | 1.9% |
| Eaton Corp. PLC | 1.8% |
| American Express Co. | 1.8% |
| T-Mobile USA, Inc. | 1.8% |
| Fiserv, Inc. | 1.7% |
| Pfizer, Inc. | 1.7% |
Value Equity Fund
| (based on a hypothetical $10,000 investment) | ||
| Class Name | Costs of a $10,000 investment | Costs paid as a percentage of a $10,000 investment (annualized) |
| R2 | $52 | 0.99% |
| Net Assets ($): | 303,323,916 | Portfolio Turnover Rate (%): | 25 | |
| Total Number of Holdings: | 108 |
| Equities | 99.5% |
| Money Market Funds | 0.5% |
| Financials | 22.4% |
| Health Care | 15.2% |
| Industrials | 14.0% |
| Information Technology | 8.3% |
| Consumer Staples | 8.1% |
| Energy | 7.2% |
| Consumer Discretionary | 6.2% |
| Utilities | 5.2% |
| Real Estate | 4.9% |
| Materials | 4.1% |
| Communication Services | 3.9% |
| JPMorgan Chase & Co. | 3.2% |
| Johnson & Johnson | 2.6% |
| Wells Fargo & Co. | 2.4% |
| NextEra Energy, Inc. | 1.9% |
| Berkshire Hathaway, Inc., "B" | 1.9% |
| Eaton Corp. PLC | 1.8% |
| American Express Co. | 1.8% |
| T-Mobile USA, Inc. | 1.8% |
| Fiserv, Inc. | 1.7% |
| Pfizer, Inc. | 1.7% |
Value Equity Fund
| (based on a hypothetical $10,000 investment) | ||
| Class Name | Costs of a $10,000 investment | Costs paid as a percentage of a $10,000 investment (annualized) |
| R3 | $39 | 0.74% |
| Net Assets ($): | 303,323,916 | Portfolio Turnover Rate (%): | 25 | |
| Total Number of Holdings: | 108 |
| Equities | 99.5% |
| Money Market Funds | 0.5% |
| Financials | 22.4% |
| Health Care | 15.2% |
| Industrials | 14.0% |
| Information Technology | 8.3% |
| Consumer Staples | 8.1% |
| Energy | 7.2% |
| Consumer Discretionary | 6.2% |
| Utilities | 5.2% |
| Real Estate | 4.9% |
| Materials | 4.1% |
| Communication Services | 3.9% |
| JPMorgan Chase & Co. | 3.2% |
| Johnson & Johnson | 2.6% |
| Wells Fargo & Co. | 2.4% |
| NextEra Energy, Inc. | 1.9% |
| Berkshire Hathaway, Inc., "B" | 1.9% |
| Eaton Corp. PLC | 1.8% |
| American Express Co. | 1.8% |
| T-Mobile USA, Inc. | 1.8% |
| Fiserv, Inc. | 1.7% |
| Pfizer, Inc. | 1.7% |
Value Equity Fund
| (based on a hypothetical $10,000 investment) | ||
| Class Name | Costs of a $10,000 investment | Costs paid as a percentage of a $10,000 investment (annualized) |
| R4 | $26 | 0.49% |
| Net Assets ($): | 303,323,916 | Portfolio Turnover Rate (%): | 25 | |
| Total Number of Holdings: | 108 |
| Equities | 99.5% |
| Money Market Funds | 0.5% |
| Financials | 22.4% |
| Health Care | 15.2% |
| Industrials | 14.0% |
| Information Technology | 8.3% |
| Consumer Staples | 8.1% |
| Energy | 7.2% |
| Consumer Discretionary | 6.2% |
| Utilities | 5.2% |
| Real Estate | 4.9% |
| Materials | 4.1% |
| Communication Services | 3.9% |
| JPMorgan Chase & Co. | 3.2% |
| Johnson & Johnson | 2.6% |
| Wells Fargo & Co. | 2.4% |
| NextEra Energy, Inc. | 1.9% |
| Berkshire Hathaway, Inc., "B" | 1.9% |
| Eaton Corp. PLC | 1.8% |
| American Express Co. | 1.8% |
| T-Mobile USA, Inc. | 1.8% |
| Fiserv, Inc. | 1.7% |
| Pfizer, Inc. | 1.7% |
Value Equity Fund
| (based on a hypothetical $10,000 investment) | ||
| Class Name | Costs of a $10,000 investment | Costs paid as a percentage of a $10,000 investment (annualized) |
| R6 | $22 | 0.42% |
| Net Assets ($): | 303,323,916 | Portfolio Turnover Rate (%): | 25 | |
| Total Number of Holdings: | 108 |
| Equities | 99.5% |
| Money Market Funds | 0.5% |
| Financials | 22.4% |
| Health Care | 15.2% |
| Industrials | 14.0% |
| Information Technology | 8.3% |
| Consumer Staples | 8.1% |
| Energy | 7.2% |
| Consumer Discretionary | 6.2% |
| Utilities | 5.2% |
| Real Estate | 4.9% |
| Materials | 4.1% |
| Communication Services | 3.9% |
| JPMorgan Chase & Co. | 3.2% |
| Johnson & Johnson | 2.6% |
| Wells Fargo & Co. | 2.4% |
| NextEra Energy, Inc. | 1.9% |
| Berkshire Hathaway, Inc., "B" | 1.9% |
| Eaton Corp. PLC | 1.8% |
| American Express Co. | 1.8% |
| T-Mobile USA, Inc. | 1.8% |
| Fiserv, Inc. | 1.7% |
| Pfizer, Inc. | 1.7% |
Growth Equity Fund
| (based on a hypothetical $10,000 investment) | ||
| Class Name | Costs of a $10,000 investment | Costs paid as a percentage of a $10,000 investment (annualized) |
| A | $40 | 0.74% |
| Net Assets ($): | 390,772,112 | Portfolio Turnover Rate (%): | 24 | |
| Total Number of Holdings: | 73 |
| Equities | 99.2% |
| Money Market Funds | 0.8% |
| Information Technology | 48.8% |
| Consumer Discretionary | 13.9% |
| Communication Services | 13.3% |
| Health Care | 7.8% |
| Financials | 6.5% |
| Industrials | 3.5% |
| Consumer Staples | 2.4% |
| Real Estate | 1.4% |
| Utilities | 1.2% |
| Materials | 0.4% |
| NVIDIA Corp. | 12.0% |
| Apple, Inc. | 10.9% |
| Microsoft Corp. | 9.7% |
| Amazon.com, Inc. | 6.9% |
| Meta Platforms, Inc., "A" | 4.5% |
| Alphabet, Inc., "A" | 4.3% |
| Alphabet, Inc., "C" | 2.8% |
| ServiceNow, Inc. | 2.0% |
| AppLovin Corp. | 2.0% |
| Booking Holdings, Inc. | 1.7% |
Growth Equity Fund
| (based on a hypothetical $10,000 investment) | ||
| Class Name | Costs of a $10,000 investment | Costs paid as a percentage of a $10,000 investment (annualized) |
| B | $81 | 1.49% |
| Net Assets ($): | 390,772,112 | Portfolio Turnover Rate (%): | 24 | |
| Total Number of Holdings: | 73 |
| Equities | 99.2% |
| Money Market Funds | 0.8% |
| Information Technology | 48.8% |
| Consumer Discretionary | 13.9% |
| Communication Services | 13.3% |
| Health Care | 7.8% |
| Financials | 6.5% |
| Industrials | 3.5% |
| Consumer Staples | 2.4% |
| Real Estate | 1.4% |
| Utilities | 1.2% |
| Materials | 0.4% |
| NVIDIA Corp. | 12.0% |
| Apple, Inc. | 10.9% |
| Microsoft Corp. | 9.7% |
| Amazon.com, Inc. | 6.9% |
| Meta Platforms, Inc., "A" | 4.5% |
| Alphabet, Inc., "A" | 4.3% |
| Alphabet, Inc., "C" | 2.8% |
| ServiceNow, Inc. | 2.0% |
| AppLovin Corp. | 2.0% |
| Booking Holdings, Inc. | 1.7% |
Growth Equity Fund
| (based on a hypothetical $10,000 investment) | ||
| Class Name | Costs of a $10,000 investment | Costs paid as a percentage of a $10,000 investment (annualized) |
| C | $81 | 1.49% |
| Net Assets ($): | 390,772,112 | Portfolio Turnover Rate (%): | 24 | |
| Total Number of Holdings: | 73 |
| Equities | 99.2% |
| Money Market Funds | 0.8% |
| Information Technology | 48.8% |
| Consumer Discretionary | 13.9% |
| Communication Services | 13.3% |
| Health Care | 7.8% |
| Financials | 6.5% |
| Industrials | 3.5% |
| Consumer Staples | 2.4% |
| Real Estate | 1.4% |
| Utilities | 1.2% |
| Materials | 0.4% |
| NVIDIA Corp. | 12.0% |
| Apple, Inc. | 10.9% |
| Microsoft Corp. | 9.7% |
| Amazon.com, Inc. | 6.9% |
| Meta Platforms, Inc., "A" | 4.5% |
| Alphabet, Inc., "A" | 4.3% |
| Alphabet, Inc., "C" | 2.8% |
| ServiceNow, Inc. | 2.0% |
| AppLovin Corp. | 2.0% |
| Booking Holdings, Inc. | 1.7% |
Growth Equity Fund
| (based on a hypothetical $10,000 investment) | ||
| Class Name | Costs of a $10,000 investment | Costs paid as a percentage of a $10,000 investment (annualized) |
| I | $27 | 0.49% |
| Net Assets ($): | 390,772,112 | Portfolio Turnover Rate (%): | 24 | |
| Total Number of Holdings: | 73 |
| Equities | 99.2% |
| Money Market Funds | 0.8% |
| Information Technology | 48.8% |
| Consumer Discretionary | 13.9% |
| Communication Services | 13.3% |
| Health Care | 7.8% |
| Financials | 6.5% |
| Industrials | 3.5% |
| Consumer Staples | 2.4% |
| Real Estate | 1.4% |
| Utilities | 1.2% |
| Materials | 0.4% |
| NVIDIA Corp. | 12.0% |
| Apple, Inc. | 10.9% |
| Microsoft Corp. | 9.7% |
| Amazon.com, Inc. | 6.9% |
| Meta Platforms, Inc., "A" | 4.5% |
| Alphabet, Inc., "A" | 4.3% |
| Alphabet, Inc., "C" | 2.8% |
| ServiceNow, Inc. | 2.0% |
| AppLovin Corp. | 2.0% |
| Booking Holdings, Inc. | 1.7% |
Growth Equity Fund
| (based on a hypothetical $10,000 investment) | ||
| Class Name | Costs of a $10,000 investment | Costs paid as a percentage of a $10,000 investment (annualized) |
| R1 | $81 | 1.49% |
| Net Assets ($): | 390,772,112 | Portfolio Turnover Rate (%): | 24 | |
| Total Number of Holdings: | 73 |
| Equities | 99.2% |
| Money Market Funds | 0.8% |
| Information Technology | 48.8% |
| Consumer Discretionary | 13.9% |
| Communication Services | 13.3% |
| Health Care | 7.8% |
| Financials | 6.5% |
| Industrials | 3.5% |
| Consumer Staples | 2.4% |
| Real Estate | 1.4% |
| Utilities | 1.2% |
| Materials | 0.4% |
| NVIDIA Corp. | 12.0% |
| Apple, Inc. | 10.9% |
| Microsoft Corp. | 9.7% |
| Amazon.com, Inc. | 6.9% |
| Meta Platforms, Inc., "A" | 4.5% |
| Alphabet, Inc., "A" | 4.3% |
| Alphabet, Inc., "C" | 2.8% |
| ServiceNow, Inc. | 2.0% |
| AppLovin Corp. | 2.0% |
| Booking Holdings, Inc. | 1.7% |
Growth Equity Fund
| (based on a hypothetical $10,000 investment) | ||
| Class Name | Costs of a $10,000 investment | Costs paid as a percentage of a $10,000 investment (annualized) |
| R2 | $54 | 0.99% |
| Net Assets ($): | 390,772,112 | Portfolio Turnover Rate (%): | 24 | |
| Total Number of Holdings: | 73 |
| Equities | 99.2% |
| Money Market Funds | 0.8% |
| Information Technology | 48.8% |
| Consumer Discretionary | 13.9% |
| Communication Services | 13.3% |
| Health Care | 7.8% |
| Financials | 6.5% |
| Industrials | 3.5% |
| Consumer Staples | 2.4% |
| Real Estate | 1.4% |
| Utilities | 1.2% |
| Materials | 0.4% |
| NVIDIA Corp. | 12.0% |
| Apple, Inc. | 10.9% |
| Microsoft Corp. | 9.7% |
| Amazon.com, Inc. | 6.9% |
| Meta Platforms, Inc., "A" | 4.5% |
| Alphabet, Inc., "A" | 4.3% |
| Alphabet, Inc., "C" | 2.8% |
| ServiceNow, Inc. | 2.0% |
| AppLovin Corp. | 2.0% |
| Booking Holdings, Inc. | 1.7% |
Growth Equity Fund
| (based on a hypothetical $10,000 investment) | ||
| Class Name | Costs of a $10,000 investment | Costs paid as a percentage of a $10,000 investment (annualized) |
| R3 | $40 | 0.74% |
| Net Assets ($): | 390,772,112 | Portfolio Turnover Rate (%): | 24 | |
| Total Number of Holdings: | 73 |
| Equities | 99.2% |
| Money Market Funds | 0.8% |
| Information Technology | 48.8% |
| Consumer Discretionary | 13.9% |
| Communication Services | 13.3% |
| Health Care | 7.8% |
| Financials | 6.5% |
| Industrials | 3.5% |
| Consumer Staples | 2.4% |
| Real Estate | 1.4% |
| Utilities | 1.2% |
| Materials | 0.4% |
| NVIDIA Corp. | 12.0% |
| Apple, Inc. | 10.9% |
| Microsoft Corp. | 9.7% |
| Amazon.com, Inc. | 6.9% |
| Meta Platforms, Inc., "A" | 4.5% |
| Alphabet, Inc., "A" | 4.3% |
| Alphabet, Inc., "C" | 2.8% |
| ServiceNow, Inc. | 2.0% |
| AppLovin Corp. | 2.0% |
| Booking Holdings, Inc. | 1.7% |
Growth Equity Fund
| (based on a hypothetical $10,000 investment) | ||
| Class Name | Costs of a $10,000 investment | Costs paid as a percentage of a $10,000 investment (annualized) |
| R4 | $27 | 0.49% |
| Net Assets ($): | 390,772,112 | Portfolio Turnover Rate (%): | 24 | |
| Total Number of Holdings: | 73 |
| Equities | 99.2% |
| Money Market Funds | 0.8% |
| Information Technology | 48.8% |
| Consumer Discretionary | 13.9% |
| Communication Services | 13.3% |
| Health Care | 7.8% |
| Financials | 6.5% |
| Industrials | 3.5% |
| Consumer Staples | 2.4% |
| Real Estate | 1.4% |
| Utilities | 1.2% |
| Materials | 0.4% |
| NVIDIA Corp. | 12.0% |
| Apple, Inc. | 10.9% |
| Microsoft Corp. | 9.7% |
| Amazon.com, Inc. | 6.9% |
| Meta Platforms, Inc., "A" | 4.5% |
| Alphabet, Inc., "A" | 4.3% |
| Alphabet, Inc., "C" | 2.8% |
| ServiceNow, Inc. | 2.0% |
| AppLovin Corp. | 2.0% |
| Booking Holdings, Inc. | 1.7% |
Growth Equity Fund
| (based on a hypothetical $10,000 investment) | ||
| Class Name | Costs of a $10,000 investment | Costs paid as a percentage of a $10,000 investment (annualized) |
| R6 | $23 | 0.42% |
| Net Assets ($): | 390,772,112 | Portfolio Turnover Rate (%): | 24 | |
| Total Number of Holdings: | 73 |
| Equities | 99.2% |
| Money Market Funds | 0.8% |
| Information Technology | 48.8% |
| Consumer Discretionary | 13.9% |
| Communication Services | 13.3% |
| Health Care | 7.8% |
| Financials | 6.5% |
| Industrials | 3.5% |
| Consumer Staples | 2.4% |
| Real Estate | 1.4% |
| Utilities | 1.2% |
| Materials | 0.4% |
| NVIDIA Corp. | 12.0% |
| Apple, Inc. | 10.9% |
| Microsoft Corp. | 9.7% |
| Amazon.com, Inc. | 6.9% |
| Meta Platforms, Inc., "A" | 4.5% |
| Alphabet, Inc., "A" | 4.3% |
| Alphabet, Inc., "C" | 2.8% |
| ServiceNow, Inc. | 2.0% |
| AppLovin Corp. | 2.0% |
| Booking Holdings, Inc. | 1.7% |
Equity Fund
| (based on a hypothetical $10,000 investment) | ||
| Class Name | Costs of a $10,000 investment | Costs paid as a percentage of a $10,000 investment (annualized) |
| A | $68 | 1.31% |
| Net Assets ($): | 7,674,867,411 | Portfolio Turnover Rate (%): | 17 | |
| Total Number of Holdings: | 101 |
| Equities | 98.7% |
| Money Market Funds | 1.3% |
| Taiwan Semiconductor Manufacturing Co. Ltd. | 9.5% |
| Tencent Holdings Ltd. | 5.9% |
| Samsung Electronics Co. Ltd. | 3.9% |
| Alibaba Group Holding Ltd. | 3.2% |
| Infosys Ltd. | 2.6% |
| Tata Consultancy Services Ltd. | 2.1% |
| China Construction Bank Corp. | 2.0% |
| HDFC Bank Ltd. | 1.8% |
| Kweichow Moutai Co. Ltd., "A" | 1.7% |
| Kotak Mahindra Bank Ltd. | 1.7% |
| China | 26.1% |
| India | 16.0% |
| Taiwan | 14.5% |
| South Korea | 12.7% |
| Brazil | 5.7% |
| Indonesia | 3.7% |
| Mexico | 2.9% |
| Thailand | 2.2% |
| Hong Kong | 2.0% |
| Other Countries | 14.2% |
Equity Fund
| (based on a hypothetical $10,000 investment) | ||
| Class Name | Costs of a $10,000 investment | Costs paid as a percentage of a $10,000 investment (annualized) |
| B | $106 | 2.06% |
| Net Assets ($): | 7,674,867,411 | Portfolio Turnover Rate (%): | 17 | |
| Total Number of Holdings: | 101 |
| Equities | 98.7% |
| Money Market Funds | 1.3% |
| Taiwan Semiconductor Manufacturing Co. Ltd. | 9.5% |
| Tencent Holdings Ltd. | 5.9% |
| Samsung Electronics Co. Ltd. | 3.9% |
| Alibaba Group Holding Ltd. | 3.2% |
| Infosys Ltd. | 2.6% |
| Tata Consultancy Services Ltd. | 2.1% |
| China Construction Bank Corp. | 2.0% |
| HDFC Bank Ltd. | 1.8% |
| Kweichow Moutai Co. Ltd., "A" | 1.7% |
| Kotak Mahindra Bank Ltd. | 1.7% |
| China | 26.1% |
| India | 16.0% |
| Taiwan | 14.5% |
| South Korea | 12.7% |
| Brazil | 5.7% |
| Indonesia | 3.7% |
| Mexico | 2.9% |
| Thailand | 2.2% |
| Hong Kong | 2.0% |
| Other Countries | 14.2% |
Equity Fund
| (based on a hypothetical $10,000 investment) | ||
| Class Name | Costs of a $10,000 investment | Costs paid as a percentage of a $10,000 investment (annualized) |
| C | $106 | 2.06% |
| Net Assets ($): | 7,674,867,411 | Portfolio Turnover Rate (%): | 17 | |
| Total Number of Holdings: | 101 |
| Equities | 98.7% |
| Money Market Funds | 1.3% |
| Taiwan Semiconductor Manufacturing Co. Ltd. | 9.5% |
| Tencent Holdings Ltd. | 5.9% |
| Samsung Electronics Co. Ltd. | 3.9% |
| Alibaba Group Holding Ltd. | 3.2% |
| Infosys Ltd. | 2.6% |
| Tata Consultancy Services Ltd. | 2.1% |
| China Construction Bank Corp. | 2.0% |
| HDFC Bank Ltd. | 1.8% |
| Kweichow Moutai Co. Ltd., "A" | 1.7% |
| Kotak Mahindra Bank Ltd. | 1.7% |
| China | 26.1% |
| India | 16.0% |
| Taiwan | 14.5% |
| South Korea | 12.7% |
| Brazil | 5.7% |
| Indonesia | 3.7% |
| Mexico | 2.9% |
| Thailand | 2.2% |
| Hong Kong | 2.0% |
| Other Countries | 14.2% |
Equity Fund
| (based on a hypothetical $10,000 investment) | ||
| Class Name | Costs of a $10,000 investment | Costs paid as a percentage of a $10,000 investment (annualized) |
| I | $55 | 1.06% |
| Net Assets ($): | 7,674,867,411 | Portfolio Turnover Rate (%): | 17 | |
| Total Number of Holdings: | 101 |
| Equities | 98.7% |
| Money Market Funds | 1.3% |
| Taiwan Semiconductor Manufacturing Co. Ltd. | 9.5% |
| Tencent Holdings Ltd. | 5.9% |
| Samsung Electronics Co. Ltd. | 3.9% |
| Alibaba Group Holding Ltd. | 3.2% |
| Infosys Ltd. | 2.6% |
| Tata Consultancy Services Ltd. | 2.1% |
| China Construction Bank Corp. | 2.0% |
| HDFC Bank Ltd. | 1.8% |
| Kweichow Moutai Co. Ltd., "A" | 1.7% |
| Kotak Mahindra Bank Ltd. | 1.7% |
| China | 26.1% |
| India | 16.0% |
| Taiwan | 14.5% |
| South Korea | 12.7% |
| Brazil | 5.7% |
| Indonesia | 3.7% |
| Mexico | 2.9% |
| Thailand | 2.2% |
| Hong Kong | 2.0% |
| Other Countries | 14.2% |
Equity Fund
| (based on a hypothetical $10,000 investment) | ||
| Class Name | Costs of a $10,000 investment | Costs paid as a percentage of a $10,000 investment (annualized) |
| R1 | $106 | 2.06% |
| Net Assets ($): | 7,674,867,411 | Portfolio Turnover Rate (%): | 17 | |
| Total Number of Holdings: | 101 |
| Equities | 98.7% |
| Money Market Funds | 1.3% |
| Taiwan Semiconductor Manufacturing Co. Ltd. | 9.5% |
| Tencent Holdings Ltd. | 5.9% |
| Samsung Electronics Co. Ltd. | 3.9% |
| Alibaba Group Holding Ltd. | 3.2% |
| Infosys Ltd. | 2.6% |
| Tata Consultancy Services Ltd. | 2.1% |
| China Construction Bank Corp. | 2.0% |
| HDFC Bank Ltd. | 1.8% |
| Kweichow Moutai Co. Ltd., "A" | 1.7% |
| Kotak Mahindra Bank Ltd. | 1.7% |
| China | 26.1% |
| India | 16.0% |
| Taiwan | 14.5% |
| South Korea | 12.7% |
| Brazil | 5.7% |
| Indonesia | 3.7% |
| Mexico | 2.9% |
| Thailand | 2.2% |
| Hong Kong | 2.0% |
| Other Countries | 14.2% |
Equity Fund
| (based on a hypothetical $10,000 investment) | ||
| Class Name | Costs of a $10,000 investment | Costs paid as a percentage of a $10,000 investment (annualized) |
| R2 | $81 | 1.56% |
| Net Assets ($): | 7,674,867,411 | Portfolio Turnover Rate (%): | 17 | |
| Total Number of Holdings: | 101 |
| Equities | 98.7% |
| Money Market Funds | 1.3% |
| Taiwan Semiconductor Manufacturing Co. Ltd. | 9.5% |
| Tencent Holdings Ltd. | 5.9% |
| Samsung Electronics Co. Ltd. | 3.9% |
| Alibaba Group Holding Ltd. | 3.2% |
| Infosys Ltd. | 2.6% |
| Tata Consultancy Services Ltd. | 2.1% |
| China Construction Bank Corp. | 2.0% |
| HDFC Bank Ltd. | 1.8% |
| Kweichow Moutai Co. Ltd., "A" | 1.7% |
| Kotak Mahindra Bank Ltd. | 1.7% |
| China | 26.1% |
| India | 16.0% |
| Taiwan | 14.5% |
| South Korea | 12.7% |
| Brazil | 5.7% |
| Indonesia | 3.7% |
| Mexico | 2.9% |
| Thailand | 2.2% |
| Hong Kong | 2.0% |
| Other Countries | 14.2% |
Equity Fund
| (based on a hypothetical $10,000 investment) | ||
| Class Name | Costs of a $10,000 investment | Costs paid as a percentage of a $10,000 investment (annualized) |
| R3 | $68 | 1.31% |
| Net Assets ($): | 7,674,867,411 | Portfolio Turnover Rate (%): | 17 | |
| Total Number of Holdings: | 101 |
| Equities | 98.7% |
| Money Market Funds | 1.3% |
| Taiwan Semiconductor Manufacturing Co. Ltd. | 9.5% |
| Tencent Holdings Ltd. | 5.9% |
| Samsung Electronics Co. Ltd. | 3.9% |
| Alibaba Group Holding Ltd. | 3.2% |
| Infosys Ltd. | 2.6% |
| Tata Consultancy Services Ltd. | 2.1% |
| China Construction Bank Corp. | 2.0% |
| HDFC Bank Ltd. | 1.8% |
| Kweichow Moutai Co. Ltd., "A" | 1.7% |
| Kotak Mahindra Bank Ltd. | 1.7% |
| China | 26.1% |
| India | 16.0% |
| Taiwan | 14.5% |
| South Korea | 12.7% |
| Brazil | 5.7% |
| Indonesia | 3.7% |
| Mexico | 2.9% |
| Thailand | 2.2% |
| Hong Kong | 2.0% |
| Other Countries | 14.2% |
Equity Fund
| (based on a hypothetical $10,000 investment) | ||
| Class Name | Costs of a $10,000 investment | Costs paid as a percentage of a $10,000 investment (annualized) |
| R4 | $55 | 1.06% |
| Net Assets ($): | 7,674,867,411 | Portfolio Turnover Rate (%): | 17 | |
| Total Number of Holdings: | 101 |
| Equities | 98.7% |
| Money Market Funds | 1.3% |
| Taiwan Semiconductor Manufacturing Co. Ltd. | 9.5% |
| Tencent Holdings Ltd. | 5.9% |
| Samsung Electronics Co. Ltd. | 3.9% |
| Alibaba Group Holding Ltd. | 3.2% |
| Infosys Ltd. | 2.6% |
| Tata Consultancy Services Ltd. | 2.1% |
| China Construction Bank Corp. | 2.0% |
| HDFC Bank Ltd. | 1.8% |
| Kweichow Moutai Co. Ltd., "A" | 1.7% |
| Kotak Mahindra Bank Ltd. | 1.7% |
| China | 26.1% |
| India | 16.0% |
| Taiwan | 14.5% |
| South Korea | 12.7% |
| Brazil | 5.7% |
| Indonesia | 3.7% |
| Mexico | 2.9% |
| Thailand | 2.2% |
| Hong Kong | 2.0% |
| Other Countries | 14.2% |
Equity Fund
| (based on a hypothetical $10,000 investment) | ||
| Class Name | Costs of a $10,000 investment | Costs paid as a percentage of a $10,000 investment (annualized) |
| R6 | $47 | 0.91% |
| Net Assets ($): | 7,674,867,411 | Portfolio Turnover Rate (%): | 17 | |
| Total Number of Holdings: | 101 |
| Equities | 98.7% |
| Money Market Funds | 1.3% |
| Taiwan Semiconductor Manufacturing Co. Ltd. | 9.5% |
| Tencent Holdings Ltd. | 5.9% |
| Samsung Electronics Co. Ltd. | 3.9% |
| Alibaba Group Holding Ltd. | 3.2% |
| Infosys Ltd. | 2.6% |
| Tata Consultancy Services Ltd. | 2.1% |
| China Construction Bank Corp. | 2.0% |
| HDFC Bank Ltd. | 1.8% |
| Kweichow Moutai Co. Ltd., "A" | 1.7% |
| Kotak Mahindra Bank Ltd. | 1.7% |
| China | 26.1% |
| India | 16.0% |
| Taiwan | 14.5% |
| South Korea | 12.7% |
| Brazil | 5.7% |
| Indonesia | 3.7% |
| Mexico | 2.9% |
| Thailand | 2.2% |
| Hong Kong | 2.0% |
| Other Countries | 14.2% |
| (based on a hypothetical $10,000 investment) | ||
| Class Name | Costs of a $10,000 investment | Costs paid as a percentage of a $10,000 investment (annualized) |
| A | $54 | 1.05% |
| Net Assets ($): | 17,084,862,478 | Portfolio Turnover Rate (%): | 8 | |
| Total Number of Holdings: | 88 |
| Equities | 98.5% |
| Money Market Funds | 1.5% |
| SAP SE | 4.9% |
| Schneider Electric SE | 4.0% |
| Taiwan Semiconductor Manufacturing Co. Ltd. | 3.8% |
| Hitachi Ltd. | 3.7% |
| Roche Holding AG | 3.2% |
| Nestle S.A. | 3.1% |
| Linde PLC | 2.6% |
| LVMH Moet Hennessy Louis Vuitton SE | 2.3% |
| EssilorLuxottica | 2.3% |
| Heineken N.V. | 2.2% |
| France | 14.9% |
| Germany | 11.4% |
| Japan | 10.4% |
| Switzerland | 9.5% |
| United Kingdom | 8.3% |
| Canada | 7.3% |
| Taiwan | 6.4% |
| Netherlands | 4.2% |
| United States | 4.1% |
| Other Countries | 23.5% |
| (based on a hypothetical $10,000 investment) | ||
| Class Name | Costs of a $10,000 investment | Costs paid as a percentage of a $10,000 investment (annualized) |
| B | $92 | 1.80% |
| Net Assets ($): | 17,084,862,478 | Portfolio Turnover Rate (%): | 8 | |
| Total Number of Holdings: | 88 |
| Equities | 98.5% |
| Money Market Funds | 1.5% |
| SAP SE | 4.9% |
| Schneider Electric SE | 4.0% |
| Taiwan Semiconductor Manufacturing Co. Ltd. | 3.8% |
| Hitachi Ltd. | 3.7% |
| Roche Holding AG | 3.2% |
| Nestle S.A. | 3.1% |
| Linde PLC | 2.6% |
| LVMH Moet Hennessy Louis Vuitton SE | 2.3% |
| EssilorLuxottica | 2.3% |
| Heineken N.V. | 2.2% |
| France | 14.9% |
| Germany | 11.4% |
| Japan | 10.4% |
| Switzerland | 9.5% |
| United Kingdom | 8.3% |
| Canada | 7.3% |
| Taiwan | 6.4% |
| Netherlands | 4.2% |
| United States | 4.1% |
| Other Countries | 23.5% |
| (based on a hypothetical $10,000 investment) | ||
| Class Name | Costs of a $10,000 investment | Costs paid as a percentage of a $10,000 investment (annualized) |
| C | $92 | 1.80% |
| Net Assets ($): | 17,084,862,478 | Portfolio Turnover Rate (%): | 8 | |
| Total Number of Holdings: | 88 |
| Equities | 98.5% |
| Money Market Funds | 1.5% |
| SAP SE | 4.9% |
| Schneider Electric SE | 4.0% |
| Taiwan Semiconductor Manufacturing Co. Ltd. | 3.8% |
| Hitachi Ltd. | 3.7% |
| Roche Holding AG | 3.2% |
| Nestle S.A. | 3.1% |
| Linde PLC | 2.6% |
| LVMH Moet Hennessy Louis Vuitton SE | 2.3% |
| EssilorLuxottica | 2.3% |
| Heineken N.V. | 2.2% |
| France | 14.9% |
| Germany | 11.4% |
| Japan | 10.4% |
| Switzerland | 9.5% |
| United Kingdom | 8.3% |
| Canada | 7.3% |
| Taiwan | 6.4% |
| Netherlands | 4.2% |
| United States | 4.1% |
| Other Countries | 23.5% |
| (based on a hypothetical $10,000 investment) | ||
| Class Name | Costs of a $10,000 investment | Costs paid as a percentage of a $10,000 investment (annualized) |
| I | $41 | 0.80% |
| Net Assets ($): | 17,084,862,478 | Portfolio Turnover Rate (%): | 8 | |
| Total Number of Holdings: | 88 |
| Equities | 98.5% |
| Money Market Funds | 1.5% |
| SAP SE | 4.9% |
| Schneider Electric SE | 4.0% |
| Taiwan Semiconductor Manufacturing Co. Ltd. | 3.8% |
| Hitachi Ltd. | 3.7% |
| Roche Holding AG | 3.2% |
| Nestle S.A. | 3.1% |
| Linde PLC | 2.6% |
| LVMH Moet Hennessy Louis Vuitton SE | 2.3% |
| EssilorLuxottica | 2.3% |
| Heineken N.V. | 2.2% |
| France | 14.9% |
| Germany | 11.4% |
| Japan | 10.4% |
| Switzerland | 9.5% |
| United Kingdom | 8.3% |
| Canada | 7.3% |
| Taiwan | 6.4% |
| Netherlands | 4.2% |
| United States | 4.1% |
| Other Countries | 23.5% |
| (based on a hypothetical $10,000 investment) | ||
| Class Name | Costs of a $10,000 investment | Costs paid as a percentage of a $10,000 investment (annualized) |
| R1 | $92 | 1.80% |
| Net Assets ($): | 17,084,862,478 | Portfolio Turnover Rate (%): | 8 | |
| Total Number of Holdings: | 88 |
| Equities | 98.5% |
| Money Market Funds | 1.5% |
| SAP SE | 4.9% |
| Schneider Electric SE | 4.0% |
| Taiwan Semiconductor Manufacturing Co. Ltd. | 3.8% |
| Hitachi Ltd. | 3.7% |
| Roche Holding AG | 3.2% |
| Nestle S.A. | 3.1% |
| Linde PLC | 2.6% |
| LVMH Moet Hennessy Louis Vuitton SE | 2.3% |
| EssilorLuxottica | 2.3% |
| Heineken N.V. | 2.2% |
| France | 14.9% |
| Germany | 11.4% |
| Japan | 10.4% |
| Switzerland | 9.5% |
| United Kingdom | 8.3% |
| Canada | 7.3% |
| Taiwan | 6.4% |
| Netherlands | 4.2% |
| United States | 4.1% |
| Other Countries | 23.5% |
| (based on a hypothetical $10,000 investment) | ||
| Class Name | Costs of a $10,000 investment | Costs paid as a percentage of a $10,000 investment (annualized) |
| R2 | $67 | 1.30% |
| Net Assets ($): | 17,084,862,478 | Portfolio Turnover Rate (%): | 8 | |
| Total Number of Holdings: | 88 |
| Equities | 98.5% |
| Money Market Funds | 1.5% |
| SAP SE | 4.9% |
| Schneider Electric SE | 4.0% |
| Taiwan Semiconductor Manufacturing Co. Ltd. | 3.8% |
| Hitachi Ltd. | 3.7% |
| Roche Holding AG | 3.2% |
| Nestle S.A. | 3.1% |
| Linde PLC | 2.6% |
| LVMH Moet Hennessy Louis Vuitton SE | 2.3% |
| EssilorLuxottica | 2.3% |
| Heineken N.V. | 2.2% |
| France | 14.9% |
| Germany | 11.4% |
| Japan | 10.4% |
| Switzerland | 9.5% |
| United Kingdom | 8.3% |
| Canada | 7.3% |
| Taiwan | 6.4% |
| Netherlands | 4.2% |
| United States | 4.1% |
| Other Countries | 23.5% |
| (based on a hypothetical $10,000 investment) | ||
| Class Name | Costs of a $10,000 investment | Costs paid as a percentage of a $10,000 investment (annualized) |
| R3 | $54 | 1.05% |
| Net Assets ($): | 17,084,862,478 | Portfolio Turnover Rate (%): | 8 | |
| Total Number of Holdings: | 88 |
| Equities | 98.5% |
| Money Market Funds | 1.5% |
| SAP SE | 4.9% |
| Schneider Electric SE | 4.0% |
| Taiwan Semiconductor Manufacturing Co. Ltd. | 3.8% |
| Hitachi Ltd. | 3.7% |
| Roche Holding AG | 3.2% |
| Nestle S.A. | 3.1% |
| Linde PLC | 2.6% |
| LVMH Moet Hennessy Louis Vuitton SE | 2.3% |
| EssilorLuxottica | 2.3% |
| Heineken N.V. | 2.2% |
| France | 14.9% |
| Germany | 11.4% |
| Japan | 10.4% |
| Switzerland | 9.5% |
| United Kingdom | 8.3% |
| Canada | 7.3% |
| Taiwan | 6.4% |
| Netherlands | 4.2% |
| United States | 4.1% |
| Other Countries | 23.5% |
| (based on a hypothetical $10,000 investment) | ||
| Class Name | Costs of a $10,000 investment | Costs paid as a percentage of a $10,000 investment (annualized) |
| R4 | $41 | 0.80% |
| Net Assets ($): | 17,084,862,478 | Portfolio Turnover Rate (%): | 8 | |
| Total Number of Holdings: | 88 |
| Equities | 98.5% |
| Money Market Funds | 1.5% |
| SAP SE | 4.9% |
| Schneider Electric SE | 4.0% |
| Taiwan Semiconductor Manufacturing Co. Ltd. | 3.8% |
| Hitachi Ltd. | 3.7% |
| Roche Holding AG | 3.2% |
| Nestle S.A. | 3.1% |
| Linde PLC | 2.6% |
| LVMH Moet Hennessy Louis Vuitton SE | 2.3% |
| EssilorLuxottica | 2.3% |
| Heineken N.V. | 2.2% |
| France | 14.9% |
| Germany | 11.4% |
| Japan | 10.4% |
| Switzerland | 9.5% |
| United Kingdom | 8.3% |
| Canada | 7.3% |
| Taiwan | 6.4% |
| Netherlands | 4.2% |
| United States | 4.1% |
| Other Countries | 23.5% |
| (based on a hypothetical $10,000 investment) | ||
| Class Name | Costs of a $10,000 investment | Costs paid as a percentage of a $10,000 investment (annualized) |
| R6 | $35 | 0.68% |
| Net Assets ($): | 17,084,862,478 | Portfolio Turnover Rate (%): | 8 | |
| Total Number of Holdings: | 88 |
| Equities | 98.5% |
| Money Market Funds | 1.5% |
| SAP SE | 4.9% |
| Schneider Electric SE | 4.0% |
| Taiwan Semiconductor Manufacturing Co. Ltd. | 3.8% |
| Hitachi Ltd. | 3.7% |
| Roche Holding AG | 3.2% |
| Nestle S.A. | 3.1% |
| Linde PLC | 2.6% |
| LVMH Moet Hennessy Louis Vuitton SE | 2.3% |
| EssilorLuxottica | 2.3% |
| Heineken N.V. | 2.2% |
| France | 14.9% |
| Germany | 11.4% |
| Japan | 10.4% |
| Switzerland | 9.5% |
| United Kingdom | 8.3% |
| Canada | 7.3% |
| Taiwan | 6.4% |
| Netherlands | 4.2% |
| United States | 4.1% |
| Other Countries | 23.5% |
| (based on a hypothetical $10,000 investment) | ||
| Class Name | Costs of a $10,000 investment | Costs paid as a percentage of a $10,000 investment (annualized) |
| A | $51 | 1.01% |
| Net Assets ($): | 21,681,708,653 | Portfolio Turnover Rate (%): | 7 | |
| Total Number of Holdings: | 91 |
| Equities | 96.4% |
| Money Market Funds | 3.6% |
| Taiwan Semiconductor Manufacturing Co. Ltd., ADR | 3.3% |
| Schneider Electric SE | 3.1% |
| NatWest Group PLC | 3.0% |
| Franco-Nevada Corp. | 2.8% |
| TotalEnergies SE | 2.7% |
| Resona Holdings, Inc. | 2.4% |
| Legrand S.A. | 2.4% |
| Deutsche Boerse AG | 2.3% |
| SAP SE | 2.2% |
| AIB Group PLC | 2.1% |
| United Kingdom | 18.0% |
| France | 15.8% |
| Japan | 13.6% |
| United States | 10.9% |
| Germany | 7.8% |
| Switzerland | 7.1% |
| Canada | 5.1% |
| Ireland | 4.2% |
| Spain | 4.0% |
| Other Countries | 13.5% |
| (based on a hypothetical $10,000 investment) | ||
| Class Name | Costs of a $10,000 investment | Costs paid as a percentage of a $10,000 investment (annualized) |
| B | $88 | 1.76% |
| Net Assets ($): | 21,681,708,653 | Portfolio Turnover Rate (%): | 7 | |
| Total Number of Holdings: | 91 |
| Equities | 96.4% |
| Money Market Funds | 3.6% |
| Taiwan Semiconductor Manufacturing Co. Ltd., ADR | 3.3% |
| Schneider Electric SE | 3.1% |
| NatWest Group PLC | 3.0% |
| Franco-Nevada Corp. | 2.8% |
| TotalEnergies SE | 2.7% |
| Resona Holdings, Inc. | 2.4% |
| Legrand S.A. | 2.4% |
| Deutsche Boerse AG | 2.3% |
| SAP SE | 2.2% |
| AIB Group PLC | 2.1% |
| United Kingdom | 18.0% |
| France | 15.8% |
| Japan | 13.6% |
| United States | 10.9% |
| Germany | 7.8% |
| Switzerland | 7.1% |
| Canada | 5.1% |
| Ireland | 4.2% |
| Spain | 4.0% |
| Other Countries | 13.5% |
| (based on a hypothetical $10,000 investment) | ||
| Class Name | Costs of a $10,000 investment | Costs paid as a percentage of a $10,000 investment (annualized) |
| C | $88 | 1.76% |
| Net Assets ($): | 21,681,708,653 | Portfolio Turnover Rate (%): | 7 | |
| Total Number of Holdings: | 91 |
| Equities | 96.4% |
| Money Market Funds | 3.6% |
| Taiwan Semiconductor Manufacturing Co. Ltd., ADR | 3.3% |
| Schneider Electric SE | 3.1% |
| NatWest Group PLC | 3.0% |
| Franco-Nevada Corp. | 2.8% |
| TotalEnergies SE | 2.7% |
| Resona Holdings, Inc. | 2.4% |
| Legrand S.A. | 2.4% |
| Deutsche Boerse AG | 2.3% |
| SAP SE | 2.2% |
| AIB Group PLC | 2.1% |
| United Kingdom | 18.0% |
| France | 15.8% |
| Japan | 13.6% |
| United States | 10.9% |
| Germany | 7.8% |
| Switzerland | 7.1% |
| Canada | 5.1% |
| Ireland | 4.2% |
| Spain | 4.0% |
| Other Countries | 13.5% |
| (based on a hypothetical $10,000 investment) | ||
| Class Name | Costs of a $10,000 investment | Costs paid as a percentage of a $10,000 investment (annualized) |
| I | $38 | 0.76% |
| Net Assets ($): | 21,681,708,653 | Portfolio Turnover Rate (%): | 7 | |
| Total Number of Holdings: | 91 |
| Equities | 96.4% |
| Money Market Funds | 3.6% |
| Taiwan Semiconductor Manufacturing Co. Ltd., ADR | 3.3% |
| Schneider Electric SE | 3.1% |
| NatWest Group PLC | 3.0% |
| Franco-Nevada Corp. | 2.8% |
| TotalEnergies SE | 2.7% |
| Resona Holdings, Inc. | 2.4% |
| Legrand S.A. | 2.4% |
| Deutsche Boerse AG | 2.3% |
| SAP SE | 2.2% |
| AIB Group PLC | 2.1% |
| United Kingdom | 18.0% |
| France | 15.8% |
| Japan | 13.6% |
| United States | 10.9% |
| Germany | 7.8% |
| Switzerland | 7.1% |
| Canada | 5.1% |
| Ireland | 4.2% |
| Spain | 4.0% |
| Other Countries | 13.5% |
| (based on a hypothetical $10,000 investment) | ||
| Class Name | Costs of a $10,000 investment | Costs paid as a percentage of a $10,000 investment (annualized) |
| R1 | $88 | 1.76% |
| Net Assets ($): | 21,681,708,653 | Portfolio Turnover Rate (%): | 7 | |
| Total Number of Holdings: | 91 |
| Equities | 96.4% |
| Money Market Funds | 3.6% |
| Taiwan Semiconductor Manufacturing Co. Ltd., ADR | 3.3% |
| Schneider Electric SE | 3.1% |
| NatWest Group PLC | 3.0% |
| Franco-Nevada Corp. | 2.8% |
| TotalEnergies SE | 2.7% |
| Resona Holdings, Inc. | 2.4% |
| Legrand S.A. | 2.4% |
| Deutsche Boerse AG | 2.3% |
| SAP SE | 2.2% |
| AIB Group PLC | 2.1% |
| United Kingdom | 18.0% |
| France | 15.8% |
| Japan | 13.6% |
| United States | 10.9% |
| Germany | 7.8% |
| Switzerland | 7.1% |
| Canada | 5.1% |
| Ireland | 4.2% |
| Spain | 4.0% |
| Other Countries | 13.5% |
| (based on a hypothetical $10,000 investment) | ||
| Class Name | Costs of a $10,000 investment | Costs paid as a percentage of a $10,000 investment (annualized) |
| R2 | $63 | 1.26% |
| Net Assets ($): | 21,681,708,653 | Portfolio Turnover Rate (%): | 7 | |
| Total Number of Holdings: | 91 |
| Equities | 96.4% |
| Money Market Funds | 3.6% |
| Taiwan Semiconductor Manufacturing Co. Ltd., ADR | 3.3% |
| Schneider Electric SE | 3.1% |
| NatWest Group PLC | 3.0% |
| Franco-Nevada Corp. | 2.8% |
| TotalEnergies SE | 2.7% |
| Resona Holdings, Inc. | 2.4% |
| Legrand S.A. | 2.4% |
| Deutsche Boerse AG | 2.3% |
| SAP SE | 2.2% |
| AIB Group PLC | 2.1% |
| United Kingdom | 18.0% |
| France | 15.8% |
| Japan | 13.6% |
| United States | 10.9% |
| Germany | 7.8% |
| Switzerland | 7.1% |
| Canada | 5.1% |
| Ireland | 4.2% |
| Spain | 4.0% |
| Other Countries | 13.5% |
| (based on a hypothetical $10,000 investment) | ||
| Class Name | Costs of a $10,000 investment | Costs paid as a percentage of a $10,000 investment (annualized) |
| R3 | $51 | 1.01% |
| Net Assets ($): | 21,681,708,653 | Portfolio Turnover Rate (%): | 7 | |
| Total Number of Holdings: | 91 |
| Equities | 96.4% |
| Money Market Funds | 3.6% |
| Taiwan Semiconductor Manufacturing Co. Ltd., ADR | 3.3% |
| Schneider Electric SE | 3.1% |
| NatWest Group PLC | 3.0% |
| Franco-Nevada Corp. | 2.8% |
| TotalEnergies SE | 2.7% |
| Resona Holdings, Inc. | 2.4% |
| Legrand S.A. | 2.4% |
| Deutsche Boerse AG | 2.3% |
| SAP SE | 2.2% |
| AIB Group PLC | 2.1% |
| United Kingdom | 18.0% |
| France | 15.8% |
| Japan | 13.6% |
| United States | 10.9% |
| Germany | 7.8% |
| Switzerland | 7.1% |
| Canada | 5.1% |
| Ireland | 4.2% |
| Spain | 4.0% |
| Other Countries | 13.5% |
| (based on a hypothetical $10,000 investment) | ||
| Class Name | Costs of a $10,000 investment | Costs paid as a percentage of a $10,000 investment (annualized) |
| R4 | $38 | 0.76% |
| Net Assets ($): | 21,681,708,653 | Portfolio Turnover Rate (%): | 7 | |
| Total Number of Holdings: | 91 |
| Equities | 96.4% |
| Money Market Funds | 3.6% |
| Taiwan Semiconductor Manufacturing Co. Ltd., ADR | 3.3% |
| Schneider Electric SE | 3.1% |
| NatWest Group PLC | 3.0% |
| Franco-Nevada Corp. | 2.8% |
| TotalEnergies SE | 2.7% |
| Resona Holdings, Inc. | 2.4% |
| Legrand S.A. | 2.4% |
| Deutsche Boerse AG | 2.3% |
| SAP SE | 2.2% |
| AIB Group PLC | 2.1% |
| United Kingdom | 18.0% |
| France | 15.8% |
| Japan | 13.6% |
| United States | 10.9% |
| Germany | 7.8% |
| Switzerland | 7.1% |
| Canada | 5.1% |
| Ireland | 4.2% |
| Spain | 4.0% |
| Other Countries | 13.5% |
| (based on a hypothetical $10,000 investment) | ||
| Class Name | Costs of a $10,000 investment | Costs paid as a percentage of a $10,000 investment (annualized) |
| R6 | $33 | 0.66% |
| Net Assets ($): | 21,681,708,653 | Portfolio Turnover Rate (%): | 7 | |
| Total Number of Holdings: | 91 |
| Equities | 96.4% |
| Money Market Funds | 3.6% |
| Taiwan Semiconductor Manufacturing Co. Ltd., ADR | 3.3% |
| Schneider Electric SE | 3.1% |
| NatWest Group PLC | 3.0% |
| Franco-Nevada Corp. | 2.8% |
| TotalEnergies SE | 2.7% |
| Resona Holdings, Inc. | 2.4% |
| Legrand S.A. | 2.4% |
| Deutsche Boerse AG | 2.3% |
| SAP SE | 2.2% |
| AIB Group PLC | 2.1% |
| United Kingdom | 18.0% |
| France | 15.8% |
| Japan | 13.6% |
| United States | 10.9% |
| Germany | 7.8% |
| Switzerland | 7.1% |
| Canada | 5.1% |
| Ireland | 4.2% |
| Spain | 4.0% |
| Other Countries | 13.5% |
DiversificationSM Fund
| (based on a hypothetical $10,000 investment) | ||
| Class Name | Costs of a $10,000 investment ~ | Costs paid as a percentage of a $10,000 investment (annualized) ~ |
| A | $18 | 0.35% |
| Net Assets ($): | 38,105,233,626 | Portfolio Turnover Rate (%): | 1 | |
| Total Number of Holdings: | 7 |


| MFS Research International Fund | 27.6% |
| MFS Emerging Markets Equity Fund | 17.2% |
| MFS International Large Cap Value Fund | 15.0% |
| MFS International Intrinsic Value Fund | 15.0% |
| MFS International Growth Fund | 15.0% |
| MFS International New Discovery Fund | 10.0% |
| MFS Institutional Money Market Portfolio | 0.2% |
DiversificationSM Fund
| (based on a hypothetical $10,000 investment) | ||
| Class Name | Costs of a $10,000 investment ~ | Costs paid as a percentage of a $10,000 investment (annualized) ~ |
| B | $56 | 1.10% |
| Net Assets ($): | 38,105,233,626 | Portfolio Turnover Rate (%): | 1 | |
| Total Number of Holdings: | 7 |


| MFS Research International Fund | 27.6% |
| MFS Emerging Markets Equity Fund | 17.2% |
| MFS International Large Cap Value Fund | 15.0% |
| MFS International Intrinsic Value Fund | 15.0% |
| MFS International Growth Fund | 15.0% |
| MFS International New Discovery Fund | 10.0% |
| MFS Institutional Money Market Portfolio | 0.2% |
DiversificationSM Fund
| (based on a hypothetical $10,000 investment) | ||
| Class Name | Costs of a $10,000 investment ~ | Costs paid as a percentage of a $10,000 investment (annualized) ~ |
| C | $56 | 1.10% |
| Net Assets ($): | 38,105,233,626 | Portfolio Turnover Rate (%): | 1 | |
| Total Number of Holdings: | 7 |


| MFS Research International Fund | 27.6% |
| MFS Emerging Markets Equity Fund | 17.2% |
| MFS International Large Cap Value Fund | 15.0% |
| MFS International Intrinsic Value Fund | 15.0% |
| MFS International Growth Fund | 15.0% |
| MFS International New Discovery Fund | 10.0% |
| MFS Institutional Money Market Portfolio | 0.2% |
DiversificationSM Fund
| (based on a hypothetical $10,000 investment) | ||
| Class Name | Costs of a $10,000 investment ~ | Costs paid as a percentage of a $10,000 investment (annualized) ~ |
| I | $5 | 0.10% |
| Net Assets ($): | 38,105,233,626 | Portfolio Turnover Rate (%): | 1 | |
| Total Number of Holdings: | 7 |


| MFS Research International Fund | 27.6% |
| MFS Emerging Markets Equity Fund | 17.2% |
| MFS International Large Cap Value Fund | 15.0% |
| MFS International Intrinsic Value Fund | 15.0% |
| MFS International Growth Fund | 15.0% |
| MFS International New Discovery Fund | 10.0% |
| MFS Institutional Money Market Portfolio | 0.2% |
DiversificationSM Fund
| (based on a hypothetical $10,000 investment) | ||
| Class Name | Costs of a $10,000 investment ~ | Costs paid as a percentage of a $10,000 investment (annualized) ~ |
| R1 | $56 | 1.10% |
| Net Assets ($): | 38,105,233,626 | Portfolio Turnover Rate (%): | 1 | |
| Total Number of Holdings: | 7 |


| MFS Research International Fund | 27.6% |
| MFS Emerging Markets Equity Fund | 17.2% |
| MFS International Large Cap Value Fund | 15.0% |
| MFS International Intrinsic Value Fund | 15.0% |
| MFS International Growth Fund | 15.0% |
| MFS International New Discovery Fund | 10.0% |
| MFS Institutional Money Market Portfolio | 0.2% |
DiversificationSM Fund
| (based on a hypothetical $10,000 investment) | ||
| Class Name | Costs of a $10,000 investment ~ | Costs paid as a percentage of a $10,000 investment (annualized) ~ |
| R2 | $30 | 0.60% |
| Net Assets ($): | 38,105,233,626 | Portfolio Turnover Rate (%): | 1 | |
| Total Number of Holdings: | 7 |


| MFS Research International Fund | 27.6% |
| MFS Emerging Markets Equity Fund | 17.2% |
| MFS International Large Cap Value Fund | 15.0% |
| MFS International Intrinsic Value Fund | 15.0% |
| MFS International Growth Fund | 15.0% |
| MFS International New Discovery Fund | 10.0% |
| MFS Institutional Money Market Portfolio | 0.2% |
DiversificationSM Fund
| (based on a hypothetical $10,000 investment) | ||
| Class Name | Costs of a $10,000 investment ~ | Costs paid as a percentage of a $10,000 investment (annualized) ~ |
| R3 | $18 | 0.35% |
| Net Assets ($): | 38,105,233,626 | Portfolio Turnover Rate (%): | 1 | |
| Total Number of Holdings: | 7 |
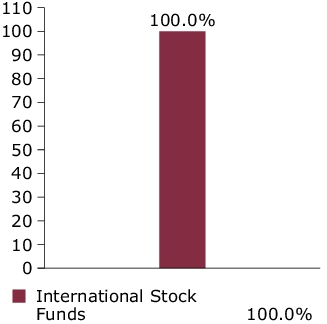

| MFS Research International Fund | 27.6% |
| MFS Emerging Markets Equity Fund | 17.2% |
| MFS International Large Cap Value Fund | 15.0% |
| MFS International Intrinsic Value Fund | 15.0% |
| MFS International Growth Fund | 15.0% |
| MFS International New Discovery Fund | 10.0% |
| MFS Institutional Money Market Portfolio | 0.2% |
DiversificationSM Fund
| (based on a hypothetical $10,000 investment) | ||
| Class Name | Costs of a $10,000 investment ~ | Costs paid as a percentage of a $10,000 investment (annualized) ~ |
| R4 | $5 | 0.10% |
| Net Assets ($): | 38,105,233,626 | Portfolio Turnover Rate (%): | 1 | |
| Total Number of Holdings: | 7 |


| MFS Research International Fund | 27.6% |
| MFS Emerging Markets Equity Fund | 17.2% |
| MFS International Large Cap Value Fund | 15.0% |
| MFS International Intrinsic Value Fund | 15.0% |
| MFS International Growth Fund | 15.0% |
| MFS International New Discovery Fund | 10.0% |
| MFS Institutional Money Market Portfolio | 0.2% |
DiversificationSM Fund
| (based on a hypothetical $10,000 investment) | ||
| Class Name | Costs of a $10,000 investment ~ | Costs paid as a percentage of a $10,000 investment (annualized) ~ |
| R6 | $0 | 0.00% |
| Net Assets ($): | 38,105,233,626 | Portfolio Turnover Rate (%): | 1 | |
| Total Number of Holdings: | 7 |

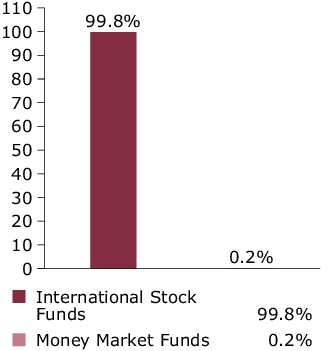
| MFS Research International Fund | 27.6% |
| MFS Emerging Markets Equity Fund | 17.2% |
| MFS International Large Cap Value Fund | 15.0% |
| MFS International Intrinsic Value Fund | 15.0% |
| MFS International Growth Fund | 15.0% |
| MFS International New Discovery Fund | 10.0% |
| MFS Institutional Money Market Portfolio | 0.2% |
| (based on a hypothetical $10,000 investment) | ||
| Class Name | Costs of a $10,000 investment ~ | Costs paid as a percentage of a $10,000 investment (annualized) ~ |
| A | $47 | 0.92% |
| Net Assets ($): | 33,122,985 | Portfolio Turnover Rate (%): | 1 | |
| Total Number of Holdings: | 15 |
| Active Security Selection (a) | Derivative Overlay Positions (b) | Net Market Exposure (c) | ||
| Strategic Allocation | MFS Growth Fund | 30.3% | ||
| MFS International Equity Fund | 30.3% | |||
| MFS Value Fund | 30.3% | |||
| Market Exposure Overlay | Mini Russell 1000 Value Index Future DEC 20 24 | (14.0)% | ||
| Mini MSCI EAFE Index Future MAR 21 25 | (14.1)% | |||
| Mini Russell 1000 Growth Future DEC 20 24 | (23.1)% | |||
| Net Equity Exposure | 39.7% | |||
| Standard & Poor's 500 Index Option 4200.00 PUT DEC 20 24 | (0.0)% | |||
| Standard & Poor's 500 Index Option 4400.00 PUT DEC 20 24 | (0.0)% | |||
| Standard & Poor's 500 Index Option 4900.00 PUT JUN 20 25 | (0.4)% | |||
| Standard & Poor's 500 Index Option 4600.00 PUT SEP 19 25 | (0.4)% | |||
| Standard & Poor's 500 Index Option 5450.00 PUT MAR 21 25 | (0.5)% | |||
| Standard & Poors Index Option PUT(s) | (1.3)% | |||
| Downside Hedge(s) | (1.3)% | |||
| Net Equivalent Equity Exposure | 90.9% | (52.5)% | 38.4% | |
| Limited Maturity U.S. Treasury Notes | 3.5% | |||
| Cash | Cash & Cash Equivalents (d) | 5.5% | ||
| Other (e) | 52.6% | |||
| Total Net Exposure Summary | 100.0% | |||
| (based on a hypothetical $10,000 investment) | ||
| Class Name | Costs of a $10,000 investment ~ | Costs paid as a percentage of a $10,000 investment (annualized) ~ |
| B | $85 | 1.67% |
| Net Assets ($): | 33,122,985 | Portfolio Turnover Rate (%): | 1 | |
| Total Number of Holdings: | 15 |
| Active Security Selection (a) | Derivative Overlay Positions (b) | Net Market Exposure (c) | ||
| Strategic Allocation | MFS Growth Fund | 30.3% | ||
| MFS International Equity Fund | 30.3% | |||
| MFS Value Fund | 30.3% | |||
| Market Exposure Overlay | Mini Russell 1000 Value Index Future DEC 20 24 | (14.0)% | ||
| Mini MSCI EAFE Index Future MAR 21 25 | (14.1)% | |||
| Mini Russell 1000 Growth Future DEC 20 24 | (23.1)% | |||
| Net Equity Exposure | 39.7% | |||
| Standard & Poor's 500 Index Option 4200.00 PUT DEC 20 24 | (0.0)% | |||
| Standard & Poor's 500 Index Option 4400.00 PUT DEC 20 24 | (0.0)% | |||
| Standard & Poor's 500 Index Option 4900.00 PUT JUN 20 25 | (0.4)% | |||
| Standard & Poor's 500 Index Option 4600.00 PUT SEP 19 25 | (0.4)% | |||
| Standard & Poor's 500 Index Option 5450.00 PUT MAR 21 25 | (0.5)% | |||
| Standard & Poors Index Option PUT(s) | (1.3)% | |||
| Downside Hedge(s) | (1.3)% | |||
| Net Equivalent Equity Exposure | 90.9% | (52.5)% | 38.4% | |
| Limited Maturity U.S. Treasury Notes | 3.5% | |||
| Cash | Cash & Cash Equivalents (d) | 5.5% | ||
| Other (e) | 52.6% | |||
| Total Net Exposure Summary | 100.0% | |||
| (based on a hypothetical $10,000 investment) | ||
| Class Name | Costs of a $10,000 investment ~ | Costs paid as a percentage of a $10,000 investment (annualized) ~ |
| C | $85 | 1.67% |
| Net Assets ($): | 33,122,985 | Portfolio Turnover Rate (%): | 1 | |
| Total Number of Holdings: | 15 |
| Active Security Selection (a) | Derivative Overlay Positions (b) | Net Market Exposure (c) | ||
| Strategic Allocation | MFS Growth Fund | 30.3% | ||
| MFS International Equity Fund | 30.3% | |||
| MFS Value Fund | 30.3% | |||
| Market Exposure Overlay | Mini Russell 1000 Value Index Future DEC 20 24 | (14.0)% | ||
| Mini MSCI EAFE Index Future MAR 21 25 | (14.1)% | |||
| Mini Russell 1000 Growth Future DEC 20 24 | (23.1)% | |||
| Net Equity Exposure | 39.7% | |||
| Standard & Poor's 500 Index Option 4200.00 PUT DEC 20 24 | (0.0)% | |||
| Standard & Poor's 500 Index Option 4400.00 PUT DEC 20 24 | (0.0)% | |||
| Standard & Poor's 500 Index Option 4900.00 PUT JUN 20 25 | (0.4)% | |||
| Standard & Poor's 500 Index Option 4600.00 PUT SEP 19 25 | (0.4)% | |||
| Standard & Poor's 500 Index Option 5450.00 PUT MAR 21 25 | (0.5)% | |||
| Standard & Poors Index Option PUT(s) | (1.3)% | |||
| Downside Hedge(s) | (1.3)% | |||
| Net Equivalent Equity Exposure | 90.9% | (52.5)% | 38.4% | |
| Limited Maturity U.S. Treasury Notes | 3.5% | |||
| Cash | Cash & Cash Equivalents (d) | 5.5% | ||
| Other (e) | 52.6% | |||
| Total Net Exposure Summary | 100.0% | |||
| (based on a hypothetical $10,000 investment) | ||
| Class Name | Costs of a $10,000 investment ~ | Costs paid as a percentage of a $10,000 investment (annualized) ~ |
| I | $34 | 0.67% |
| Net Assets ($): | 33,122,985 | Portfolio Turnover Rate (%): | 1 | |
| Total Number of Holdings: | 15 |
| Active Security Selection (a) | Derivative Overlay Positions (b) | Net Market Exposure (c) | ||
| Strategic Allocation | MFS Growth Fund | 30.3% | ||
| MFS International Equity Fund | 30.3% | |||
| MFS Value Fund | 30.3% | |||
| Market Exposure Overlay | Mini Russell 1000 Value Index Future DEC 20 24 | (14.0)% | ||
| Mini MSCI EAFE Index Future MAR 21 25 | (14.1)% | |||
| Mini Russell 1000 Growth Future DEC 20 24 | (23.1)% | |||
| Net Equity Exposure | 39.7% | |||
| Standard & Poor's 500 Index Option 4200.00 PUT DEC 20 24 | (0.0)% | |||
| Standard & Poor's 500 Index Option 4400.00 PUT DEC 20 24 | (0.0)% | |||
| Standard & Poor's 500 Index Option 4900.00 PUT JUN 20 25 | (0.4)% | |||
| Standard & Poor's 500 Index Option 4600.00 PUT SEP 19 25 | (0.4)% | |||
| Standard & Poor's 500 Index Option 5450.00 PUT MAR 21 25 | (0.5)% | |||
| Standard & Poors Index Option PUT(s) | (1.3)% | |||
| Downside Hedge(s) | (1.3)% | |||
| Net Equivalent Equity Exposure | 90.9% | (52.5)% | 38.4% | |
| Limited Maturity U.S. Treasury Notes | 3.5% | |||
| Cash | Cash & Cash Equivalents (d) | 5.5% | ||
| Other (e) | 52.6% | |||
| Total Net Exposure Summary | 100.0% | |||
| (based on a hypothetical $10,000 investment) | ||
| Class Name | Costs of a $10,000 investment ~ | Costs paid as a percentage of a $10,000 investment (annualized) ~ |
| R1 | $85 | 1.67% |
| Net Assets ($): | 33,122,985 | Portfolio Turnover Rate (%): | 1 | |
| Total Number of Holdings: | 15 |
| Active Security Selection (a) | Derivative Overlay Positions (b) | Net Market Exposure (c) | ||
| Strategic Allocation | MFS Growth Fund | 30.3% | ||
| MFS International Equity Fund | 30.3% | |||
| MFS Value Fund | 30.3% | |||
| Market Exposure Overlay | Mini Russell 1000 Value Index Future DEC 20 24 | (14.0)% | ||
| Mini MSCI EAFE Index Future MAR 21 25 | (14.1)% | |||
| Mini Russell 1000 Growth Future DEC 20 24 | (23.1)% | |||
| Net Equity Exposure | 39.7% | |||
| Standard & Poor's 500 Index Option 4200.00 PUT DEC 20 24 | (0.0)% | |||
| Standard & Poor's 500 Index Option 4400.00 PUT DEC 20 24 | (0.0)% | |||
| Standard & Poor's 500 Index Option 4900.00 PUT JUN 20 25 | (0.4)% | |||
| Standard & Poor's 500 Index Option 4600.00 PUT SEP 19 25 | (0.4)% | |||
| Standard & Poor's 500 Index Option 5450.00 PUT MAR 21 25 | (0.5)% | |||
| Standard & Poors Index Option PUT(s) | (1.3)% | |||
| Downside Hedge(s) | (1.3)% | |||
| Net Equivalent Equity Exposure | 90.9% | (52.5)% | 38.4% | |
| Limited Maturity U.S. Treasury Notes | 3.5% | |||
| Cash | Cash & Cash Equivalents (d) | 5.5% | ||
| Other (e) | 52.6% | |||
| Total Net Exposure Summary | 100.0% | |||
| (based on a hypothetical $10,000 investment) | ||
| Class Name | Costs of a $10,000 investment ~ | Costs paid as a percentage of a $10,000 investment (annualized) ~ |
| R2 | $59 | 1.17% |
| Net Assets ($): | 33,122,985 | Portfolio Turnover Rate (%): | 1 | |
| Total Number of Holdings: | 15 |
| Active Security Selection (a) | Derivative Overlay Positions (b) | Net Market Exposure (c) | ||
| Strategic Allocation | MFS Growth Fund | 30.3% | ||
| MFS International Equity Fund | 30.3% | |||
| MFS Value Fund | 30.3% | |||
| Market Exposure Overlay | Mini Russell 1000 Value Index Future DEC 20 24 | (14.0)% | ||
| Mini MSCI EAFE Index Future MAR 21 25 | (14.1)% | |||
| Mini Russell 1000 Growth Future DEC 20 24 | (23.1)% | |||
| Net Equity Exposure | 39.7% | |||
| Standard & Poor's 500 Index Option 4200.00 PUT DEC 20 24 | (0.0)% | |||
| Standard & Poor's 500 Index Option 4400.00 PUT DEC 20 24 | (0.0)% | |||
| Standard & Poor's 500 Index Option 4900.00 PUT JUN 20 25 | (0.4)% | |||
| Standard & Poor's 500 Index Option 4600.00 PUT SEP 19 25 | (0.4)% | |||
| Standard & Poor's 500 Index Option 5450.00 PUT MAR 21 25 | (0.5)% | |||
| Standard & Poors Index Option PUT(s) | (1.3)% | |||
| Downside Hedge(s) | (1.3)% | |||
| Net Equivalent Equity Exposure | 90.9% | (52.5)% | 38.4% | |
| Limited Maturity U.S. Treasury Notes | 3.5% | |||
| Cash | Cash & Cash Equivalents (d) | 5.5% | ||
| Other (e) | 52.6% | |||
| Total Net Exposure Summary | 100.0% | |||
| (based on a hypothetical $10,000 investment) | ||
| Class Name | Costs of a $10,000 investment ~ | Costs paid as a percentage of a $10,000 investment (annualized) ~ |
| R3 | $47 | 0.92% |
| Net Assets ($): | 33,122,985 | Portfolio Turnover Rate (%): | 1 | |
| Total Number of Holdings: | 15 |
| Active Security Selection (a) | Derivative Overlay Positions (b) | Net Market Exposure (c) | ||
| Strategic Allocation | MFS Growth Fund | 30.3% | ||
| MFS International Equity Fund | 30.3% | |||
| MFS Value Fund | 30.3% | |||
| Market Exposure Overlay | Mini Russell 1000 Value Index Future DEC 20 24 | (14.0)% | ||
| Mini MSCI EAFE Index Future MAR 21 25 | (14.1)% | |||
| Mini Russell 1000 Growth Future DEC 20 24 | (23.1)% | |||
| Net Equity Exposure | 39.7% | |||
| Standard & Poor's 500 Index Option 4200.00 PUT DEC 20 24 | (0.0)% | |||
| Standard & Poor's 500 Index Option 4400.00 PUT DEC 20 24 | (0.0)% | |||
| Standard & Poor's 500 Index Option 4900.00 PUT JUN 20 25 | (0.4)% | |||
| Standard & Poor's 500 Index Option 4600.00 PUT SEP 19 25 | (0.4)% | |||
| Standard & Poor's 500 Index Option 5450.00 PUT MAR 21 25 | (0.5)% | |||
| Standard & Poors Index Option PUT(s) | (1.3)% | |||
| Downside Hedge(s) | (1.3)% | |||
| Net Equivalent Equity Exposure | 90.9% | (52.5)% | 38.4% | |
| Limited Maturity U.S. Treasury Notes | 3.5% | |||
| Cash | Cash & Cash Equivalents (d) | 5.5% | ||
| Other (e) | 52.6% | |||
| Total Net Exposure Summary | 100.0% | |||
| (based on a hypothetical $10,000 investment) | ||
| Class Name | Costs of a $10,000 investment ~ | Costs paid as a percentage of a $10,000 investment (annualized) ~ |
| R4 | $34 | 0.67% |
| Net Assets ($): | 33,122,985 | Portfolio Turnover Rate (%): | 1 | |
| Total Number of Holdings: | 15 |
| Active Security Selection (a) | Derivative Overlay Positions (b) | Net Market Exposure (c) | ||
| Strategic Allocation | MFS Growth Fund | 30.3% | ||
| MFS International Equity Fund | 30.3% | |||
| MFS Value Fund | 30.3% | |||
| Market Exposure Overlay | Mini Russell 1000 Value Index Future DEC 20 24 | (14.0)% | ||
| Mini MSCI EAFE Index Future MAR 21 25 | (14.1)% | |||
| Mini Russell 1000 Growth Future DEC 20 24 | (23.1)% | |||
| Net Equity Exposure | 39.7% | |||
| Standard & Poor's 500 Index Option 4200.00 PUT DEC 20 24 | (0.0)% | |||
| Standard & Poor's 500 Index Option 4400.00 PUT DEC 20 24 | (0.0)% | |||
| Standard & Poor's 500 Index Option 4900.00 PUT JUN 20 25 | (0.4)% | |||
| Standard & Poor's 500 Index Option 4600.00 PUT SEP 19 25 | (0.4)% | |||
| Standard & Poor's 500 Index Option 5450.00 PUT MAR 21 25 | (0.5)% | |||
| Standard & Poors Index Option PUT(s) | (1.3)% | |||
| Downside Hedge(s) | (1.3)% | |||
| Net Equivalent Equity Exposure | 90.9% | (52.5)% | 38.4% | |
| Limited Maturity U.S. Treasury Notes | 3.5% | |||
| Cash | Cash & Cash Equivalents (d) | 5.5% | ||
| Other (e) | 52.6% | |||
| Total Net Exposure Summary | 100.0% | |||
| (based on a hypothetical $10,000 investment) | ||
| Class Name | Costs of a $10,000 investment ~ | Costs paid as a percentage of a $10,000 investment (annualized) ~ |
| R6 | $30 | 0.60% |
| Net Assets ($): | 33,122,985 | Portfolio Turnover Rate (%): | 1 | |
| Total Number of Holdings: | 15 |
| Active Security Selection (a) | Derivative Overlay Positions (b) | Net Market Exposure (c) | ||
| Strategic Allocation | MFS Growth Fund | 30.3% | ||
| MFS International Equity Fund | 30.3% | |||
| MFS Value Fund | 30.3% | |||
| Market Exposure Overlay | Mini Russell 1000 Value Index Future DEC 20 24 | (14.0)% | ||
| Mini MSCI EAFE Index Future MAR 21 25 | (14.1)% | |||
| Mini Russell 1000 Growth Future DEC 20 24 | (23.1)% | |||
| Net Equity Exposure | 39.7% | |||
| Standard & Poor's 500 Index Option 4200.00 PUT DEC 20 24 | (0.0)% | |||
| Standard & Poor's 500 Index Option 4400.00 PUT DEC 20 24 | (0.0)% | |||
| Standard & Poor's 500 Index Option 4900.00 PUT JUN 20 25 | (0.4)% | |||
| Standard & Poor's 500 Index Option 4600.00 PUT SEP 19 25 | (0.4)% | |||
| Standard & Poor's 500 Index Option 5450.00 PUT MAR 21 25 | (0.5)% | |||
| Standard & Poors Index Option PUT(s) | (1.3)% | |||
| Downside Hedge(s) | (1.3)% | |||
| Net Equivalent Equity Exposure | 90.9% | (52.5)% | 38.4% | |
| Limited Maturity U.S. Treasury Notes | 3.5% | |||
| Cash | Cash & Cash Equivalents (d) | 5.5% | ||
| Other (e) | 52.6% | |||
| Total Net Exposure Summary | 100.0% | |||
| (based on a hypothetical $10,000 investment) | ||
| Class Name | Costs of a $10,000 investment | Costs paid as a percentage of a $10,000 investment (annualized) |
| A | $48 | 0.95% |
| Net Assets ($): | 6,341,261,579 | Portfolio Turnover Rate (%): | 12 | |
| Total Number of Holdings: | 91 |
| Equities | 97.6% |
| Money Market Funds | 2.4% |
| NatWest Group PLC | 4.1% |
| Mitsubishi UFJ Financial Group, Inc. | 3.7% |
| UBS Group AG | 3.0% |
| Roche Holding AG | 2.7% |
| Willis Towers Watson PLC | 2.6% |
| BNP Paribas S.A. | 2.2% |
| Schneider Electric SE | 2.1% |
| Sanofi | 2.1% |
| National Grid PLC | 2.1% |
| TotalEnergies SE | 2.0% |
| United Kingdom | 27.2% |
| Japan | 16.7% |
| France | 14.7% |
| Switzerland | 8.7% |
| Germany | 6.3% |
| United States | 5.7% |
| Canada | 5.5% |
| Ireland | 3.5% |
| Spain | 2.9% |
| Other Countries | 8.8% |
| (based on a hypothetical $10,000 investment) | ||
| Class Name | Costs of a $10,000 investment | Costs paid as a percentage of a $10,000 investment (annualized) |
| C | $86 | 1.70% |
| Net Assets ($): | 6,341,261,579 | Portfolio Turnover Rate (%): | 12 | |
| Total Number of Holdings: | 91 |
| Equities | 97.6% |
| Money Market Funds | 2.4% |
| NatWest Group PLC | 4.1% |
| Mitsubishi UFJ Financial Group, Inc. | 3.7% |
| UBS Group AG | 3.0% |
| Roche Holding AG | 2.7% |
| Willis Towers Watson PLC | 2.6% |
| BNP Paribas S.A. | 2.2% |
| Schneider Electric SE | 2.1% |
| Sanofi | 2.1% |
| National Grid PLC | 2.1% |
| TotalEnergies SE | 2.0% |
| United Kingdom | 27.2% |
| Japan | 16.7% |
| France | 14.7% |
| Switzerland | 8.7% |
| Germany | 6.3% |
| United States | 5.7% |
| Canada | 5.5% |
| Ireland | 3.5% |
| Spain | 2.9% |
| Other Countries | 8.8% |
| (based on a hypothetical $10,000 investment) | ||
| Class Name | Costs of a $10,000 investment | Costs paid as a percentage of a $10,000 investment (annualized) |
| I | $35 | 0.70% |
| Net Assets ($): | 6,341,261,579 | Portfolio Turnover Rate (%): | 12 | |
| Total Number of Holdings: | 91 |
| Equities | 97.6% |
| Money Market Funds | 2.4% |
| NatWest Group PLC | 4.1% |
| Mitsubishi UFJ Financial Group, Inc. | 3.7% |
| UBS Group AG | 3.0% |
| Roche Holding AG | 2.7% |
| Willis Towers Watson PLC | 2.6% |
| BNP Paribas S.A. | 2.2% |
| Schneider Electric SE | 2.1% |
| Sanofi | 2.1% |
| National Grid PLC | 2.1% |
| TotalEnergies SE | 2.0% |
| United Kingdom | 27.2% |
| Japan | 16.7% |
| France | 14.7% |
| Switzerland | 8.7% |
| Germany | 6.3% |
| United States | 5.7% |
| Canada | 5.5% |
| Ireland | 3.5% |
| Spain | 2.9% |
| Other Countries | 8.8% |
| (based on a hypothetical $10,000 investment) | ||
| Class Name | Costs of a $10,000 investment | Costs paid as a percentage of a $10,000 investment (annualized) |
| R1 | $86 | 1.70% |
| Net Assets ($): | 6,341,261,579 | Portfolio Turnover Rate (%): | 12 | |
| Total Number of Holdings: | 91 |
| Equities | 97.6% |
| Money Market Funds | 2.4% |
| NatWest Group PLC | 4.1% |
| Mitsubishi UFJ Financial Group, Inc. | 3.7% |
| UBS Group AG | 3.0% |
| Roche Holding AG | 2.7% |
| Willis Towers Watson PLC | 2.6% |
| BNP Paribas S.A. | 2.2% |
| Schneider Electric SE | 2.1% |
| Sanofi | 2.1% |
| National Grid PLC | 2.1% |
| TotalEnergies SE | 2.0% |
| United Kingdom | 27.2% |
| Japan | 16.7% |
| France | 14.7% |
| Switzerland | 8.7% |
| Germany | 6.3% |
| United States | 5.7% |
| Canada | 5.5% |
| Ireland | 3.5% |
| Spain | 2.9% |
| Other Countries | 8.8% |
| (based on a hypothetical $10,000 investment) | ||
| Class Name | Costs of a $10,000 investment | Costs paid as a percentage of a $10,000 investment (annualized) |
| R2 | $61 | 1.20% |
| Net Assets ($): | 6,341,261,579 | Portfolio Turnover Rate (%): | 12 | |
| Total Number of Holdings: | 91 |
| Equities | 97.6% |
| Money Market Funds | 2.4% |
| NatWest Group PLC | 4.1% |
| Mitsubishi UFJ Financial Group, Inc. | 3.7% |
| UBS Group AG | 3.0% |
| Roche Holding AG | 2.7% |
| Willis Towers Watson PLC | 2.6% |
| BNP Paribas S.A. | 2.2% |
| Schneider Electric SE | 2.1% |
| Sanofi | 2.1% |
| National Grid PLC | 2.1% |
| TotalEnergies SE | 2.0% |
| United Kingdom | 27.2% |
| Japan | 16.7% |
| France | 14.7% |
| Switzerland | 8.7% |
| Germany | 6.3% |
| United States | 5.7% |
| Canada | 5.5% |
| Ireland | 3.5% |
| Spain | 2.9% |
| Other Countries | 8.8% |
| (based on a hypothetical $10,000 investment) | ||
| Class Name | Costs of a $10,000 investment | Costs paid as a percentage of a $10,000 investment (annualized) |
| R3 | $48 | 0.95% |
| Net Assets ($): | 6,341,261,579 | Portfolio Turnover Rate (%): | 12 | |
| Total Number of Holdings: | 91 |
| Equities | 97.6% |
| Money Market Funds | 2.4% |
| NatWest Group PLC | 4.1% |
| Mitsubishi UFJ Financial Group, Inc. | 3.7% |
| UBS Group AG | 3.0% |
| Roche Holding AG | 2.7% |
| Willis Towers Watson PLC | 2.6% |
| BNP Paribas S.A. | 2.2% |
| Schneider Electric SE | 2.1% |
| Sanofi | 2.1% |
| National Grid PLC | 2.1% |
| TotalEnergies SE | 2.0% |
| United Kingdom | 27.2% |
| Japan | 16.7% |
| France | 14.7% |
| Switzerland | 8.7% |
| Germany | 6.3% |
| United States | 5.7% |
| Canada | 5.5% |
| Ireland | 3.5% |
| Spain | 2.9% |
| Other Countries | 8.8% |
| (based on a hypothetical $10,000 investment) | ||
| Class Name | Costs of a $10,000 investment | Costs paid as a percentage of a $10,000 investment (annualized) |
| R4 | $35 | 0.70% |
| Net Assets ($): | 6,341,261,579 | Portfolio Turnover Rate (%): | 12 | |
| Total Number of Holdings: | 91 |
| Equities | 97.6% |
| Money Market Funds | 2.4% |
| NatWest Group PLC | 4.1% |
| Mitsubishi UFJ Financial Group, Inc. | 3.7% |
| UBS Group AG | 3.0% |
| Roche Holding AG | 2.7% |
| Willis Towers Watson PLC | 2.6% |
| BNP Paribas S.A. | 2.2% |
| Schneider Electric SE | 2.1% |
| Sanofi | 2.1% |
| National Grid PLC | 2.1% |
| TotalEnergies SE | 2.0% |
| United Kingdom | 27.2% |
| Japan | 16.7% |
| France | 14.7% |
| Switzerland | 8.7% |
| Germany | 6.3% |
| United States | 5.7% |
| Canada | 5.5% |
| Ireland | 3.5% |
| Spain | 2.9% |
| Other Countries | 8.8% |
| (based on a hypothetical $10,000 investment) | ||
| Class Name | Costs of a $10,000 investment | Costs paid as a percentage of a $10,000 investment (annualized) |
| R6 | $34 | 0.67% |
| Net Assets ($): | 6,341,261,579 | Portfolio Turnover Rate (%): | 12 | |
| Total Number of Holdings: | 91 |
| Equities | 97.6% |
| Money Market Funds | 2.4% |
| NatWest Group PLC | 4.1% |
| Mitsubishi UFJ Financial Group, Inc. | 3.7% |
| UBS Group AG | 3.0% |
| Roche Holding AG | 2.7% |
| Willis Towers Watson PLC | 2.6% |
| BNP Paribas S.A. | 2.2% |
| Schneider Electric SE | 2.1% |
| Sanofi | 2.1% |
| National Grid PLC | 2.1% |
| TotalEnergies SE | 2.0% |
| United Kingdom | 27.2% |
| Japan | 16.7% |
| France | 14.7% |
| Switzerland | 8.7% |
| Germany | 6.3% |
| United States | 5.7% |
| Canada | 5.5% |
| Ireland | 3.5% |
| Spain | 2.9% |
| Other Countries | 8.8% |
Item 1(b):
Not applicable.
ITEM 2. CODE OF ETHICS.
During the period covered by this report, the Registrant has not amended any provision in its Code of Ethics (the “Code”) that relates to an element of the Code’s definition enumerated in paragraph (b) of Item 2 of this Form N-CSR. During the period covered by this report, the Registrant did not grant a waiver, including an implicit waiver, from any provision of the Code.
ITEM 3. AUDIT COMMITTEE FINANCIAL EXPERT.
Not applicable for semi-annual reports.
ITEM 4. PRINCIPAL ACCOUNTANT FEES AND SERVICES.
Not applicable for semi-annual reports.
ITEM 5. AUDIT COMMITTEE OF LISTED REGISTRANTS.
Not applicable to the Registrant.
ITEM 6. INVESTMENTS
A schedule of investments for each series covered by this Form N-CSR is included in the financial statements of such series under Item 7 of this Form N-CSR.
| Issuer | Shares/Par | Value ($) | ||
| Investment Companies (h) – 99.9% | ||||
| Bond Funds – 59.0% | ||||
| MFS Emerging Markets Debt Fund - Class R6 | 6,280,665 | $76,310,080 | ||
| MFS Emerging Markets Debt Local Currency Fund - Class R6 | 14,126,745 | 76,001,889 | ||
| MFS Global Opportunistic Bond Fund - Class R6 | 32,626,731 | 267,539,193 | ||
| MFS Government Securities Fund - Class R6 | 42,139,920 | 363,246,109 | ||
| MFS High Income Fund - Class R6 | 48,849,906 | 151,923,206 | ||
| MFS Inflation-Adjusted Bond Fund - Class R6 | 41,528,389 | 380,815,331 | ||
| MFS Limited Maturity Fund - Class R6 | 64,983,063 | 379,501,090 | ||
| MFS Total Return Bond Fund - Class R6 | 57,857,277 | 554,272,715 | ||
| $2,249,609,613 | ||||
| International Stock Funds – 8.0% | ||||
| MFS International Growth Fund - Class R6 | 1,268,220 | $56,917,716 | ||
| MFS International Intrinsic Value Fund - Class R6 | 1,381,252 | 57,280,534 | ||
| MFS International Large Cap Value Fund - Class R6 | 3,987,755 | 57,264,164 | ||
| MFS Research International Fund - Class R6 | 5,680,907 | 133,501,307 | ||
| $304,963,721 | ||||
| Non-Traditional Funds – 4.0% | ||||
| MFS Commodity Strategy Fund - Class R6 | 20,929,187 | $75,972,948 | ||
| MFS Global Real Estate Fund - Class R6 | 4,287,888 | 76,495,931 | ||
| $152,468,879 | ||||
| U.S. Stock Funds – 26.5% | ||||
| MFS Growth Fund - Class R6 | 865,560 | $198,637,245 | ||
| MFS Mid Cap Growth Fund - Class R6 (a) | 4,291,934 | 153,050,370 | ||
| MFS Mid Cap Value Fund - Class R6 | 4,036,607 | 152,866,310 | ||
| MFS New Discovery Fund - Class R6 (a) | 1,132,551 | 38,155,656 | ||
| MFS New Discovery Value Fund - Class R6 | 1,823,439 | 38,201,039 | ||
| MFS Research Fund - Class R6 | 3,056,374 | 199,672,879 | ||
| MFS Value Fund - Class R6 | 4,109,994 | 228,967,790 | ||
| $1,009,551,289 | ||||
| Money Market Funds – 2.4% | ||||
| MFS Institutional Money Market Portfolio, 4.66% (v) | 93,592,011 | $93,601,370 | ||
| Total Investment Companies (Identified Cost, $3,032,882,120) | $3,810,194,872 | |||
| Other Assets, Less Liabilities – 0.1% | 3,242,957 | |||
| Net Assets – 100.0% | $3,813,437,829 | |||
| Issuer | Shares/Par | Value ($) | ||
| Investment Companies (h) – 100.0% | ||||
| Bond Funds – 39.0% | ||||
| MFS Emerging Markets Debt Fund - Class R6 | 16,769,293 | $203,746,909 | ||
| MFS Emerging Markets Debt Local Currency Fund - Class R6 | 25,151,932 | 135,317,396 | ||
| MFS Global Opportunistic Bond Fund - Class R6 | 41,537,148 | 340,604,617 | ||
| MFS Government Securities Fund - Class R6 | 75,148,879 | 647,783,336 | ||
| MFS High Income Fund - Class R6 | 86,921,980 | 270,327,358 | ||
| MFS Inflation-Adjusted Bond Fund - Class R6 | 51,759,794 | 474,637,313 | ||
| MFS Total Return Bond Fund - Class R6 | 60,470,449 | 579,306,897 | ||
| $2,651,723,826 | ||||
| International Stock Funds – 12.9% | ||||
| MFS Emerging Markets Equity Fund - Class R6 | 1,873,731 | $66,611,152 | ||
| MFS International Growth Fund - Class R6 | 3,010,143 | 135,095,234 | ||
| MFS International Intrinsic Value Fund - Class R6 | 3,281,077 | 136,066,250 | ||
| MFS International Large Cap Value Fund - Class R6 | 9,467,169 | 135,948,538 | ||
| MFS International New Discovery Fund - Class R6 | 2,039,111 | 67,841,227 | ||
| MFS Research International Fund - Class R6 | 14,452,657 | 339,637,427 | ||
| $881,199,828 | ||||
| Non-Traditional Funds – 6.0% | ||||
| MFS Commodity Strategy Fund - Class R6 | 56,169,280 | $203,894,487 | ||
| MFS Global Real Estate Fund - Class R6 | 11,536,971 | 205,819,565 | ||
| $409,714,052 | ||||
| U.S. Stock Funds – 39.6% | ||||
| MFS Growth Fund - Class R6 | 2,131,024 | $489,048,706 | ||
| MFS Mid Cap Growth Fund - Class R6 (a) | 13,509,746 | 481,757,550 | ||
| MFS Mid Cap Value Fund - Class R6 | 12,661,761 | 479,500,901 | ||
| MFS New Discovery Fund - Class R6 (a) | 3,040,292 | 102,427,428 | ||
| MFS New Discovery Value Fund - Class R6 | 4,907,511 | 102,812,347 | ||
| MFS Research Fund - Class R6 | 7,533,061 | 492,134,881 | ||
| MFS Value Fund - Class R6 | 9,794,694 | 545,662,392 | ||
| $2,693,344,205 | ||||
| Money Market Funds – 2.5% | ||||
| MFS Institutional Money Market Portfolio, 4.66% (v) | 171,041,316 | $171,058,420 | ||
| Total Investment Companies (Identified Cost, $4,664,402,727) | $6,807,040,331 | |||
| Other Assets, Less Liabilities – 0.0% | 602,813 | |||
| Net Assets – 100.0% | $6,807,643,144 | |||
| Issuer | Shares/Par | Value ($) | ||
| Investment Companies (h) – 100.0% | ||||
| Bond Funds – 19.4% | ||||
| MFS Emerging Markets Debt Fund - Class R6 | 16,697,434 | $202,873,819 | ||
| MFS Emerging Markets Debt Local Currency Fund - Class R6 | 25,050,320 | 134,770,722 | ||
| MFS Global Opportunistic Bond Fund - Class R6 | 24,813,811 | 203,473,251 | ||
| MFS High Income Fund - Class R6 | 86,539,604 | 269,138,168 | ||
| MFS Inflation-Adjusted Bond Fund - Class R6 | 36,818,074 | 337,621,735 | ||
| MFS Total Return Bond Fund - Class R6 | 17,713,692 | 169,697,175 | ||
| $1,317,574,870 | ||||
| International Stock Funds – 19.9% | ||||
| MFS Emerging Markets Equity Fund - Class R6 | 3,742,684 | $133,052,426 | ||
| MFS International Growth Fund - Class R6 | 4,508,152 | 202,325,847 | ||
| MFS International Intrinsic Value Fund - Class R6 | 4,906,240 | 203,461,797 | ||
| MFS International Large Cap Value Fund - Class R6 | 14,140,789 | 203,061,730 | ||
| MFS International New Discovery Fund - Class R6 | 4,072,733 | 135,499,815 | ||
| MFS Research International Fund - Class R6 | 20,173,293 | 474,072,385 | ||
| $1,351,474,000 | ||||
| Non-Traditional Funds – 8.0% | ||||
| MFS Commodity Strategy Fund - Class R6 | 74,766,232 | $271,401,420 | ||
| MFS Global Real Estate Fund - Class R6 | 15,373,161 | 274,257,196 | ||
| $545,658,616 | ||||
| U.S. Stock Funds – 50.7% | ||||
| MFS Growth Fund - Class R6 | 2,714,285 | $622,901,343 | ||
| MFS Mid Cap Growth Fund - Class R6 (a) | 17,421,244 | 621,241,563 | ||
| MFS Mid Cap Value Fund - Class R6 | 16,288,771 | 616,855,753 | ||
| MFS New Discovery Fund - Class R6 (a) | 4,054,285 | 136,588,855 | ||
| MFS New Discovery Value Fund - Class R6 | 6,549,638 | 137,214,922 | ||
| MFS Research Fund - Class R6 | 9,596,264 | 626,923,914 | ||
| MFS Value Fund - Class R6 | 12,222,577 | 680,919,763 | ||
| $3,442,646,113 | ||||
| Money Market Funds – 2.0% | ||||
| MFS Institutional Money Market Portfolio, 4.66% (v) | 135,015,883 | $135,029,384 | ||
| Total Investment Companies (Identified Cost, $3,882,695,748) | $6,792,382,983 | |||
| Other Assets, Less Liabilities – 0.0% | 1,034,264 | |||
| Net Assets – 100.0% | $6,793,417,247 | |||
| Issuer | Shares/Par | Value ($) | ||
| Investment Companies (h) – 100.0% | ||||
| International Stock Funds – 29.9% | ||||
| MFS Emerging Markets Equity Fund - Class R6 | 2,429,809 | $86,379,731 | ||
| MFS International Growth Fund - Class R6 | 3,252,197 | 145,958,607 | ||
| MFS International Intrinsic Value Fund - Class R6 | 3,540,087 | 146,807,408 | ||
| MFS International Large Cap Value Fund - Class R6 | 10,215,719 | 146,697,723 | ||
| MFS International New Discovery Fund - Class R6 | 3,525,131 | 117,281,102 | ||
| MFS Research International Fund - Class R6 | 9,981,384 | 234,562,520 | ||
| $877,687,091 | ||||
| Non-Traditional Funds – 10.0% | ||||
| MFS Commodity Strategy Fund - Class R6 | 40,468,204 | $146,899,580 | ||
| MFS Global Real Estate Fund - Class R6 | 8,311,042 | 148,268,985 | ||
| $295,168,565 | ||||
| U.S. Stock Funds – 58.6% | ||||
| MFS Growth Fund - Class R6 | 1,428,501 | $327,826,773 | ||
| MFS Mid Cap Growth Fund - Class R6 (a) | 8,351,016 | 297,797,247 | ||
| MFS Mid Cap Value Fund - Class R6 | 7,820,698 | 296,169,814 | ||
| MFS New Discovery Fund - Class R6 (a) | 2,191,128 | 73,819,099 | ||
| MFS New Discovery Value Fund - Class R6 | 3,537,508 | 74,110,784 | ||
| MFS Research Fund - Class R6 | 4,598,434 | 300,415,687 | ||
| MFS Value Fund - Class R6 | 6,344,827 | 353,470,311 | ||
| $1,723,609,715 | ||||
| Money Market Funds – 1.5% | ||||
| MFS Institutional Money Market Portfolio, 4.66% (v) | 44,416,998 | $44,421,440 | ||
| Total Investment Companies (Identified Cost, $1,485,838,758) | $2,940,886,811 | |||
| Other Assets, Less Liabilities – (0.0)% | (31,241) | |||
| Net Assets – 100.0% | $2,940,855,570 | |||
| (a) | Non-income producing security. |
| (h) | An affiliated issuer, which may be considered one in which the fund owns 5% or more of the outstanding voting securities, or a company which is under common control. At period end, the aggregate values of each fund’s investments in affiliated issuers were as follows: |
| Affiliated Issuers | |
| MFS Conservative Allocation Fund | $3,810,194,872 |
| MFS Moderate Allocation Fund | 6,807,040,331 |
| MFS Growth Allocation Fund | 6,792,382,983 |
| MFS Aggressive Growth Allocation Fund | 2,940,886,811 |
| (v) | Affiliated issuer that is available only to investment companies managed by MFS. The rate quoted for the MFS Institutional Money Market Portfolio is the annualized seven-day yield of the fund at period end. |
| MFS Conservative Allocation Fund | MFS Moderate Allocation Fund | MFS Growth Allocation Fund | MFS Aggressive Growth Allocation Fund | |
| Assets | ||||
| Investments in affiliated issuers, at value (identified cost, $3,032,882,120, $4,664,402,727, $3,882,695,748, and $1,485,838,758, respectively) | $3,810,194,872 | $6,807,040,331 | $6,792,382,983 | $2,940,886,811 |
| Receivables for | ||||
| Investments sold | 3,795,561 | 4,371,447 | 2,016,290 | 522,431 |
| Fund shares sold | 2,424,151 | 3,411,499 | 3,416,169 | 2,181,861 |
| Receivable from investment adviser | — | 53,619 | 90,230 | — |
| Total assets | $3,816,414,584 | $6,814,876,896 | $6,797,905,672 | $2,943,591,103 |
| Liabilities | ||||
| Payables for | ||||
| Investments purchased | $4,701 | $— | $231,048 | $835,834 |
| Fund shares reacquired | 2,158,585 | 5,762,817 | 2,743,125 | 1,170,201 |
| Payable to affiliates | ||||
| Administrative services fee | 192 | 192 | 192 | 192 |
| Shareholder servicing costs | 589,598 | 1,098,042 | 1,154,767 | 546,426 |
| Distribution and service fees | 102,616 | 192,058 | 191,369 | 82,378 |
| Payable for independent Trustees' compensation | 1,924 | 2,284 | 1,690 | 348 |
| Accrued expenses and other liabilities | 119,139 | 178,359 | 166,234 | 100,154 |
| Total liabilities | $2,976,755 | $7,233,752 | $4,488,425 | $2,735,533 |
| Net assets | $3,813,437,829 | $6,807,643,144 | $6,793,417,247 | $2,940,855,570 |
| Net assets consist of | ||||
| Paid-in capital | $2,977,615,118 | $4,436,978,479 | $3,652,867,053 | $1,411,884,062 |
| Total distributable earnings (loss) | 835,822,711 | 2,370,664,665 | 3,140,550,194 | 1,528,971,508 |
| Net assets | $3,813,437,829 | $6,807,643,144 | $6,793,417,247 | $2,940,855,570 |
| MFS Conservative Allocation Fund | MFS Moderate Allocation Fund | MFS Growth Allocation Fund | MFS Aggressive Growth Allocation Fund | |
| Net assets | ||||
| Class A | $2,713,607,306 | $5,235,008,887 | $5,032,048,037 | $1,773,459,777 |
| Class B | 8,066,501 | 21,829,036 | 26,833,821 | 13,134,239 |
| Class C | 213,572,270 | 336,224,443 | 377,934,006 | 245,169,441 |
| Class I | 379,477,588 | 410,640,619 | 394,195,534 | 269,505,056 |
| Class R1 | 8,763,688 | 16,105,021 | 15,513,262 | 11,448,475 |
| Class R2 | 34,785,977 | 84,474,926 | 100,250,930 | 50,996,342 |
| Class R3 | 64,821,242 | 144,921,765 | 113,173,585 | 82,190,271 |
| Class R4 | 269,540,788 | 219,808,548 | 258,332,469 | 154,433,234 |
| Class R6 | 120,802,469 | 338,629,899 | 475,135,603 | 340,518,735 |
| Total net assets | $3,813,437,829 | $6,807,643,144 | $6,793,417,247 | $2,940,855,570 |
| Shares of beneficial interest outstanding | ||||
| Class A | 154,865,056 | 249,899,468 | 190,386,311 | 54,645,624 |
| Class B | 461,731 | 1,056,567 | 1,020,234 | 412,501 |
| Class C | 12,407,706 | 16,460,260 | 14,672,477 | 7,849,908 |
| Class I | 21,402,015 | 19,243,725 | 14,702,388 | 8,109,904 |
| Class R1 | 522,781 | 812,331 | 620,474 | 373,663 |
| Class R2 | 2,057,419 | 4,149,740 | 3,908,569 | 1,615,241 |
| Class R3 | 3,737,033 | 6,988,081 | 4,326,494 | 2,555,471 |
| Class R4 | 15,365,293 | 10,503,548 | 9,763,497 | 4,727,937 |
| Class R6 | 6,812,644 | 15,869,033 | 17,705,863 | 10,241,567 |
| Total shares of beneficial interest outstanding | 217,631,678 | 324,982,753 | 257,106,307 | 90,531,816 |
| Class A shares | ||||
| Net asset value per share (net assets / shares of beneficial interest outstanding) | $17.52 | $20.95 | $26.43 | $32.45 |
| Offering price per share (100 / 94.25 x net asset value per share) | $18.59 | $22.23 | $28.04 | $34.43 |
| Class B shares | ||||
| Net asset value and offering price per share (net assets / shares of beneficial interest outstanding) | $17.47 | $20.66 | $26.30 | $31.84 |
| Class C shares | ||||
| Net asset value and offering price per share (net assets / shares of beneficial interest outstanding) | $17.21 | $20.43 | $25.76 | $31.23 |
| Class I shares | ||||
| Net asset value, offering price, and redemption price per share (net assets / shares of beneficial interest outstanding) | $17.73 | $21.34 | $26.81 | $33.23 |
| Class R1 shares | ||||
| Net asset value, offering price, and redemption price per share (net assets / shares of beneficial interest outstanding) | $16.76 | $19.83 | $25.00 | $30.64 |
| Class R2 shares | ||||
| Net asset value, offering price, and redemption price per share (net assets / shares of beneficial interest outstanding) | $16.91 | $20.36 | $25.65 | $31.57 |
| Class R3 shares | ||||
| Net asset value, offering price, and redemption price per share (net assets / shares of beneficial interest outstanding) | $17.35 | $20.74 | $26.16 | $32.16 |
| Class R4 shares | ||||
| Net asset value, offering price, and redemption price per share (net assets / shares of beneficial interest outstanding) | $17.54 | $20.93 | $26.46 | $32.66 |
| MFS Conservative Allocation Fund | MFS Moderate Allocation Fund | MFS Growth Allocation Fund | MFS Aggressive Growth Allocation Fund | |
| Class R6 shares | ||||
| Net asset value, offering price, and redemption price per share (net assets / shares of beneficial interest outstanding) | $17.73 | $21.34 | $26.83 | $33.25 |
| On sales of $50,000 or more, the maximum offering price of Class A shares is reduced. A contingent deferred sales charge may be imposed on redemptions of Class A, Class B, and Class C shares. | ||||
| MFS Conservative Allocation Fund | MFS Moderate Allocation Fund | MFS Growth Allocation Fund | MFS Aggressive Growth Allocation Fund | |
| Net investment income (loss) | ||||
| Dividends from affiliated issuers | $56,275,123 | $72,699,191 | $45,328,433 | $5,091,750 |
| Other | 487 | 783 | 750 | 328 |
| Total investment income | $56,275,610 | $72,699,974 | $45,329,183 | $5,092,078 |
| Expenses | ||||
| Distribution and service fees | $4,740,458 | $8,780,736 | $8,646,403 | $3,717,272 |
| Shareholder servicing costs | 1,363,334 | 2,679,744 | 2,929,007 | 1,364,747 |
| Administrative services fee | 8,775 | 8,775 | 8,775 | 8,775 |
| Independent Trustees' compensation | 33,410 | 57,378 | 56,221 | 24,357 |
| Custodian fee | 36,770 | 55,460 | 50,309 | 22,914 |
| Shareholder communications | 76,526 | 142,825 | 180,750 | 87,936 |
| Audit and tax fees | 23,407 | 23,963 | 23,202 | 23,127 |
| Legal fees | 9,807 | 16,980 | 16,496 | 7,239 |
| Miscellaneous | 137,571 | 176,233 | 170,682 | 120,630 |
| Total expenses | $6,430,058 | $11,942,094 | $12,081,845 | $5,376,997 |
| Reduction of expenses by investment adviser and distributor | (280) | (286,318) | (485,987) | (583) |
| Net expenses | $6,429,778 | $11,655,776 | $11,595,858 | $5,376,414 |
| Net investment income (loss) | $49,845,832 | $61,044,198 | $33,733,325 | $(284,336) |
| Realized and unrealized gain (loss) | ||||
| Realized gain (loss) (identified cost basis) | ||||
| Investments in affiliated issuers | $54,145,233 | $149,951,714 | $122,735,667 | $37,021,692 |
| Capital gain distributions from affiliated issuers | 241,383 | 613,073 | 796,887 | 416,127 |
| Net realized gain (loss) | $54,386,616 | $150,564,787 | $123,532,554 | $37,437,819 |
| Change in unrealized appreciation or depreciation | ||||
| Affiliated issuers | $123,448,889 | $261,295,139 | $361,375,896 | $198,327,919 |
| Net realized and unrealized gain (loss) | $177,835,505 | $411,859,926 | $484,908,450 | $235,765,738 |
| Change in net assets from operations | $227,681,337 | $472,904,124 | $518,641,775 | $235,481,402 |
| Six months ended 11/30/24 (unaudited) | MFS Conservative Allocation Fund | MFS Moderate Allocation Fund | MFS Growth Allocation Fund | MFS Aggressive Growth Allocation Fund |
| Change in net assets | ||||
| From operations | ||||
| Net investment income (loss) | $49,845,832 | $61,044,198 | $33,733,325 | $(284,336) |
| Net realized gain (loss) | 54,386,616 | 150,564,787 | 123,532,554 | 37,437,819 |
| Net unrealized gain (loss) | 123,448,889 | 261,295,139 | 361,375,896 | 198,327,919 |
| Change in net assets from operations | $227,681,337 | $472,904,124 | $518,641,775 | $235,481,402 |
| Total distributions to shareholders | $(47,808,088) | $(58,300,998) | $— | $— |
| Change in net assets from fund share transactions | $(126,221,218) | $(237,726,447) | $(267,648,426) | $(87,306,707) |
| Total change in net assets | $53,652,031 | $176,876,679 | $250,993,349 | $148,174,695 |
| Net assets | ||||
| At beginning of period | 3,759,785,798 | 6,630,766,465 | 6,542,423,898 | 2,792,680,875 |
| At end of period | $3,813,437,829 | $6,807,643,144 | $6,793,417,247 | $2,940,855,570 |
| Year ended 5/31/24 | MFS Conservative Allocation Fund | MFS Moderate Allocation Fund | MFS Growth Allocation Fund | MFS Aggressive Growth Allocation Fund |
| Change in net assets | ||||
| From operations | ||||
| Net investment income (loss) | $106,143,998 | $146,245,547 | $110,108,706 | $28,142,191 |
| Net realized gain (loss) | 101,888,874 | 223,756,418 | 188,487,204 | 83,264,396 |
| Net unrealized gain (loss) | 150,916,467 | 445,189,662 | 697,896,876 | 363,533,640 |
| Change in net assets from operations | $358,949,339 | $815,191,627 | $996,492,786 | $474,940,227 |
| Total distributions to shareholders | $(128,744,928) | $(261,699,848) | $(223,743,119) | $(83,271,543) |
| Change in net assets from fund share transactions | $(270,743,007) | $(222,811,782) | $(164,837,632) | $(18,861,300) |
| Total change in net assets | $(40,538,596) | $330,679,997 | $607,912,035 | $372,807,384 |
| Net assets | ||||
| At beginning of period | 3,800,324,394 | 6,300,086,468 | 5,934,511,863 | 2,419,873,491 |
| At end of period | $3,759,785,798 | $6,630,766,465 | $6,542,423,898 | $2,792,680,875 |
| Six months ended | Year ended | |||||
| Class A | 11/30/24 (unaudited) | 5/31/24 | 5/31/23 | 5/31/22 | 5/31/21 | 5/31/20 |
| Net asset value, beginning of period | $16.71 | $15.71 | $16.53 | $18.19 | $15.98 | $15.45 |
| Income (loss) from investment operations | ||||||
| Net investment income (loss) (d)(l) | $0.22 | $0.46 | $0.42 | $0.51 | $0.26 | $0.33 |
| Net realized and unrealized gain (loss) | 0.81 | 1.10 | (0.70) | (1.50) | 2.43 | 0.75 |
| Total from investment operations | $1.03 | $1.56 | $(0.28) | $(0.99) | $2.69 | $1.08 |
| Less distributions declared to shareholders | ||||||
| From net investment income | $(0.22) | $(0.44) | $(0.42) | $(0.47) | $(0.27) | $(0.34) |
| From net realized gain | — | (0.12) | (0.12) | (0.20) | (0.21) | (0.21) |
| Total distributions declared to shareholders | $(0.22) | $(0.56) | $(0.54) | $(0.67) | $(0.48) | $(0.55) |
| Net asset value, end of period (x) | $17.52 | $16.71 | $15.71 | $16.53 | $18.19 | $15.98 |
| Total return (%) (r)(s)(t)(x) | 6.17(n) | 10.05 | (1.61) | (5.80) | 17.04 | 7.07 |
| Ratios (%) (to average net assets) and Supplemental data: | ||||||
| Expenses before expense reductions (h) | 0.34(a) | 0.34 | 0.34 | 0.34 | 0.32 | 0.33 |
| Expenses after expense reductions (h) | 0.34(a) | 0.34 | 0.34 | 0.34 | 0.32 | 0.33 |
| Net investment income (loss) (l) | 2.62(a) | 2.82 | 2.67 | 2.83 | 1.51 | 2.05 |
| Portfolio turnover rate | 2(n) | 3 | 4 | 9 | 6 | 12 |
| Net assets at end of period (000 omitted) | $2,713,607 | $2,634,559 | $2,605,100 | $2,760,128 | $2,471,451 | $1,417,121 |
| Six months ended | Year ended | |||||
| Class B | 11/30/24 (unaudited) | 5/31/24 | 5/31/23 | 5/31/22 | 5/31/21 | 5/31/20 |
| Net asset value, beginning of period | $16.65 | $15.65 | $16.44 | $18.09 | $15.89 | $15.35 |
| Income (loss) from investment operations | ||||||
| Net investment income (loss) (d)(l) | $0.16 | $0.34 | $0.30 | $0.36 | $0.13 | $0.21 |
| Net realized and unrealized gain (loss) | 0.80 | 1.09 | (0.69) | (1.49) | 2.42 | 0.76 |
| Total from investment operations | $0.96 | $1.43 | $(0.39) | $(1.13) | $2.55 | $0.97 |
| Less distributions declared to shareholders | ||||||
| From net investment income | $(0.14) | $(0.31) | $(0.28) | $(0.32) | $(0.14) | $(0.22) |
| From net realized gain | — | (0.12) | (0.12) | (0.20) | (0.21) | (0.21) |
| Total distributions declared to shareholders | $(0.14) | $(0.43) | $(0.40) | $(0.52) | $(0.35) | $(0.43) |
| Net asset value, end of period (x) | $17.47 | $16.65 | $15.65 | $16.44 | $18.09 | $15.89 |
| Total return (%) (r)(s)(t)(x) | 5.80(n) | 9.18 | (2.27) | (6.53) | 16.12 | 6.31 |
| Ratios (%) (to average net assets) and Supplemental data: | ||||||
| Expenses before expense reductions (h) | 1.09(a) | 1.09 | 1.09 | 1.09 | 1.07 | 1.08 |
| Expenses after expense reductions (h) | N/A | N/A | 1.09 | 1.09 | 1.07 | 1.08 |
| Net investment income (loss) (l) | 1.89(a) | 2.09 | 1.93 | 2.02 | 0.79 | 1.32 |
| Portfolio turnover rate | 2(n) | 3 | 4 | 9 | 6 | 12 |
| Net assets at end of period (000 omitted) | $8,067 | $10,641 | $17,274 | $28,023 | $45,913 | $63,965 |
| Six months ended | Year ended | |||||
| Class C | 11/30/24 (unaudited) | 5/31/24 | 5/31/23 | 5/31/22 | 5/31/21 | 5/31/20 |
| Net asset value, beginning of period | $16.42 | $15.44 | $16.24 | $17.88 | $15.71 | $15.20 |
| Income (loss) from investment operations | ||||||
| Net investment income (loss) (d)(l) | $0.16 | $0.33 | $0.30 | $0.37 | $0.14 | $0.20 |
| Net realized and unrealized gain (loss) | 0.78 | 1.09 | (0.69) | (1.48) | 2.38 | 0.75 |
| Total from investment operations | $0.94 | $1.42 | $(0.39) | $(1.11) | $2.52 | $0.95 |
| Less distributions declared to shareholders | ||||||
| From net investment income | $(0.15) | $(0.32) | $(0.29) | $(0.33) | $(0.14) | $(0.23) |
| From net realized gain | — | (0.12) | (0.12) | (0.20) | (0.21) | (0.21) |
| Total distributions declared to shareholders | $(0.15) | $(0.44) | $(0.41) | $(0.53) | $(0.35) | $(0.44) |
| Net asset value, end of period (x) | $17.21 | $16.42 | $15.44 | $16.24 | $17.88 | $15.71 |
| Total return (%) (r)(s)(t)(x) | 5.75(n) | 9.24 | (2.31) | (6.50) | 16.15 | 6.24 |
| Ratios (%) (to average net assets) and Supplemental data: | ||||||
| Expenses before expense reductions (h) | 1.09(a) | 1.09 | 1.09 | 1.09 | 1.07 | 1.08 |
| Expenses after expense reductions (h) | 1.09(a) | N/A | 1.09 | 1.09 | 1.07 | 1.08 |
| Net investment income (loss) (l) | 1.88(a) | 2.08 | 1.92 | 2.07 | 0.80 | 1.30 |
| Portfolio turnover rate | 2(n) | 3 | 4 | 9 | 6 | 12 |
| Net assets at end of period (000 omitted) | $213,572 | $230,461 | $282,608 | $392,290 | $484,043 | $542,274 |
| Six months ended | Year ended | |||||
| Class I | 11/30/24 (unaudited) | 5/31/24 | 5/31/23 | 5/31/22 | 5/31/21 | 5/31/20 |
| Net asset value, beginning of period | $16.91 | $15.89 | $16.71 | $18.38 | $16.14 | $15.60 |
| Income (loss) from investment operations | ||||||
| Net investment income (loss) (d)(l) | $0.25 | $0.50 | $0.46 | $0.55 | $0.31 | $0.37 |
| Net realized and unrealized gain (loss) | 0.81 | 1.12 | (0.71) | (1.51) | 2.45 | 0.76 |
| Total from investment operations | $1.06 | $1.62 | $(0.25) | $(0.96) | $2.76 | $1.13 |
| Less distributions declared to shareholders | ||||||
| From net investment income | $(0.24) | $(0.48) | $(0.45) | $(0.51) | $(0.31) | $(0.38) |
| From net realized gain | — | (0.12) | (0.12) | (0.20) | (0.21) | (0.21) |
| Total distributions declared to shareholders | $(0.24) | $(0.60) | $(0.57) | $(0.71) | $(0.52) | $(0.59) |
| Net asset value, end of period (x) | $17.73 | $16.91 | $15.89 | $16.71 | $18.38 | $16.14 |
| Total return (%) (r)(s)(t)(x) | 6.29(n) | 10.34 | (1.34) | (5.57) | 17.32 | 7.34 |
| Ratios (%) (to average net assets) and Supplemental data: | ||||||
| Expenses before expense reductions (h) | 0.09(a) | 0.09 | 0.09 | 0.09 | 0.07 | 0.08 |
| Expenses after expense reductions (h) | N/A | N/A | N/A | 0.09 | N/A | N/A |
| Net investment income (loss) (l) | 2.87(a) | 3.07 | 2.91 | 3.06 | 1.79 | 2.30 |
| Portfolio turnover rate | 2(n) | 3 | 4 | 9 | 6 | 12 |
| Net assets at end of period (000 omitted) | $379,478 | $389,407 | $400,796 | $508,191 | $519,688 | $400,869 |
| Six months ended | Year ended | |||||
| Class R1 | 11/30/24 (unaudited) | 5/31/24 | 5/31/23 | 5/31/22 | 5/31/21 | 5/31/20 |
| Net asset value, beginning of period | $16.00 | $15.06 | $15.87 | $17.49 | $15.38 | $14.89 |
| Income (loss) from investment operations | ||||||
| Net investment income (loss) (d)(l) | $0.15 | $0.32 | $0.29 | $0.35 | $0.13 | $0.20 |
| Net realized and unrealized gain (loss) | 0.77 | 1.07 | (0.68) | (1.44) | 2.34 | 0.73 |
| Total from investment operations | $0.92 | $1.39 | $(0.39) | $(1.09) | $2.47 | $0.93 |
| Less distributions declared to shareholders | ||||||
| From net investment income | $(0.16) | $(0.33) | $(0.30) | $(0.33) | $(0.15) | $(0.23) |
| From net realized gain | — | (0.12) | (0.12) | (0.20) | (0.21) | (0.21) |
| Total distributions declared to shareholders | $(0.16) | $(0.45) | $(0.42) | $(0.53) | $(0.36) | $(0.44) |
| Net asset value, end of period (x) | $16.76 | $16.00 | $15.06 | $15.87 | $17.49 | $15.38 |
| Total return (%) (r)(s)(t)(x) | 5.74(n) | 9.28 | (2.38) | (6.51) | 16.18 | 6.27 |
| Ratios (%) (to average net assets) and Supplemental data: | ||||||
| Expenses before expense reductions (h) | 1.09(a) | 1.09 | 1.09 | 1.09 | 1.07 | 1.08 |
| Expenses after expense reductions (h) | N/A | N/A | N/A | 1.09 | N/A | N/A |
| Net investment income (loss) (l) | 1.87(a) | 2.10 | 1.94 | 2.03 | 0.78 | 1.31 |
| Portfolio turnover rate | 2(n) | 3 | 4 | 9 | 6 | 12 |
| Net assets at end of period (000 omitted) | $8,764 | $8,754 | $9,884 | $11,188 | $13,269 | $11,468 |
| Six months ended | Year ended | |||||
| Class R2 | 11/30/24 (unaudited) | 5/31/24 | 5/31/23 | 5/31/22 | 5/31/21 | 5/31/20 |
| Net asset value, beginning of period | $16.13 | $15.19 | $15.99 | $17.62 | $15.49 | $14.99 |
| Income (loss) from investment operations | ||||||
| Net investment income (loss) (d)(l) | $0.20 | $0.40 | $0.37 | $0.44 | $0.21 | $0.28 |
| Net realized and unrealized gain (loss) | 0.78 | 1.06 | (0.67) | (1.45) | 2.36 | 0.74 |
| Total from investment operations | $0.98 | $1.46 | $(0.30) | $(1.01) | $2.57 | $1.02 |
| Less distributions declared to shareholders | ||||||
| From net investment income | $(0.20) | $(0.40) | $(0.38) | $(0.42) | $(0.23) | $(0.31) |
| From net realized gain | — | (0.12) | (0.12) | (0.20) | (0.21) | (0.21) |
| Total distributions declared to shareholders | $(0.20) | $(0.52) | $(0.50) | $(0.62) | $(0.44) | $(0.52) |
| Net asset value, end of period (x) | $16.91 | $16.13 | $15.19 | $15.99 | $17.62 | $15.49 |
| Total return (%) (r)(s)(t)(x) | 6.08(n) | 9.73 | (1.79) | (6.06) | 16.75 | 6.81 |
| Ratios (%) (to average net assets) and Supplemental data: | ||||||
| Expenses before expense reductions (h) | 0.59(a) | 0.59 | 0.59 | 0.59 | 0.57 | 0.58 |
| Expenses after expense reductions (h) | N/A | N/A | N/A | 0.59 | N/A | 0.58 |
| Net investment income (loss) (l) | 2.39(a) | 2.58 | 2.42 | 2.55 | 1.28 | 1.81 |
| Portfolio turnover rate | 2(n) | 3 | 4 | 9 | 6 | 12 |
| Net assets at end of period (000 omitted) | $34,786 | $39,250 | $42,000 | $48,041 | $54,728 | $56,260 |
| Six months ended | Year ended | |||||
| Class R3 | 11/30/24 (unaudited) | 5/31/24 | 5/31/23 | 5/31/22 | 5/31/21 | 5/31/20 |
| Net asset value, beginning of period | $16.54 | $15.56 | $16.37 | $18.02 | $15.84 | $15.31 |
| Income (loss) from investment operations | ||||||
| Net investment income (loss) (d)(l) | $0.22 | $0.45 | $0.42 | $0.51 | $0.26 | $0.32 |
| Net realized and unrealized gain (loss) | 0.81 | 1.09 | (0.70) | (1.50) | 2.40 | 0.76 |
| Total from investment operations | $1.03 | $1.54 | $(0.28) | $(0.99) | $2.66 | $1.08 |
| Less distributions declared to shareholders | ||||||
| From net investment income | $(0.22) | $(0.44) | $(0.41) | $(0.46) | $(0.27) | $(0.34) |
| From net realized gain | — | (0.12) | (0.12) | (0.20) | (0.21) | (0.21) |
| Total distributions declared to shareholders | $(0.22) | $(0.56) | $(0.53) | $(0.66) | $(0.48) | $(0.55) |
| Net asset value, end of period (x) | $17.35 | $16.54 | $15.56 | $16.37 | $18.02 | $15.84 |
| Total return (%) (r)(s)(t)(x) | 6.24(n) | 10.01 | (1.57) | (5.81) | 16.98 | 7.14 |
| Ratios (%) (to average net assets) and Supplemental data: | ||||||
| Expenses before expense reductions (h) | 0.34(a) | 0.34 | 0.34 | 0.34 | 0.32 | 0.33 |
| Expenses after expense reductions (h) | 0.34(a) | 0.34 | N/A | 0.34 | N/A | N/A |
| Net investment income (loss) (l) | 2.63(a) | 2.81 | 2.67 | 2.84 | 1.53 | 2.06 |
| Portfolio turnover rate | 2(n) | 3 | 4 | 9 | 6 | 12 |
| Net assets at end of period (000 omitted) | $64,821 | $67,619 | $77,250 | $91,528 | $109,177 | $95,119 |
| Six months ended | Year ended | |||||
| Class R4 | 11/30/24 (unaudited) | 5/31/24 | 5/31/23 | 5/31/22 | 5/31/21 | 5/31/20 |
| Net asset value, beginning of period | $16.73 | $15.73 | $16.55 | $18.21 | $15.99 | $15.46 |
| Income (loss) from investment operations | ||||||
| Net investment income (loss) (d)(l) | $0.25 | $0.50 | $0.45 | $0.54 | $0.31 | $0.36 |
| Net realized and unrealized gain (loss) | 0.80 | 1.10 | (0.69) | (1.49) | 2.43 | 0.76 |
| Total from investment operations | $1.05 | $1.60 | $(0.24) | $(0.95) | $2.74 | $1.12 |
| Less distributions declared to shareholders | ||||||
| From net investment income | $(0.24) | $(0.48) | $(0.46) | $(0.51) | $(0.31) | $(0.38) |
| From net realized gain | — | (0.12) | (0.12) | (0.20) | (0.21) | (0.21) |
| Total distributions declared to shareholders | $(0.24) | $(0.60) | $(0.58) | $(0.71) | $(0.52) | $(0.59) |
| Net asset value, end of period (x) | $17.54 | $16.73 | $15.73 | $16.55 | $18.21 | $15.99 |
| Total return (%) (r)(s)(t)(x) | 6.30(n) | 10.32 | (1.35) | (5.57) | 17.36 | 7.34 |
| Ratios (%) (to average net assets) and Supplemental data: | ||||||
| Expenses before expense reductions (h) | 0.09(a) | 0.09 | 0.09 | 0.09 | 0.07 | 0.08 |
| Expenses after expense reductions (h) | N/A | N/A | N/A | 0.09 | N/A | N/A |
| Net investment income (loss) (l) | 2.88(a) | 3.07 | 2.89 | 3.00 | 1.77 | 2.29 |
| Portfolio turnover rate | 2(n) | 3 | 4 | 9 | 6 | 12 |
| Net assets at end of period (000 omitted) | $269,541 | $275,572 | $279,463 | $267,840 | $269,196 | $234,301 |
| Six months ended | Year ended | |||
| Class R6 | 11/30/24 (unaudited) | 5/31/24 | 5/31/23 | 5/31/22(i) |
| Net asset value, beginning of period | $16.91 | $15.89 | $16.71 | $18.54 |
| Income (loss) from investment operations | ||||
| Net investment income (loss) (d)(l) | $0.25 | $0.51 | $0.47 | $0.16 |
| Net realized and unrealized gain (loss) | 0.81 | 1.12 | (0.70) | (1.39) |
| Total from investment operations | $1.06 | $1.63 | $(0.23) | $(1.23) |
| Less distributions declared to shareholders | ||||
| From net investment income | $(0.24) | $(0.49) | $(0.47) | $(0.40) |
| From net realized gain | — | (0.12) | (0.12) | (0.20) |
| Total distributions declared to shareholders | $(0.24) | $(0.61) | $(0.59) | $(0.60) |
| Net asset value, end of period (x) | $17.73 | $16.91 | $15.89 | $16.71 |
| Total return (%) (r)(s)(t)(x) | 6.32(n) | 10.41 | (1.27) | (6.95)(n) |
| Ratios (%) (to average net assets) and Supplemental data: | ||||
| Expenses before expense reductions (h) | 0.03(a) | 0.03 | 0.03 | 0.04(a) |
| Expenses after expense reductions (h) | N/A | N/A | N/A | 0.03(a) |
| Net investment income (loss) (l) | 2.91(a) | 3.14 | 2.95 | 1.44(a) |
| Portfolio turnover rate | 2(n) | 3 | 4 | 9 |
| Net assets at end of period (000 omitted) | $120,802 | $103,522 | $85,950 | $66,370 |
| (a) | Annualized. |
| (d) | Per share data is based on average shares outstanding. |
| (h) | In addition to the fees and expenses which the fund bears directly, the fund indirectly bears a pro rata share of the fees and expenses of the underlying affiliated funds in which the fund invests. Accordingly, the expense ratio for the fund reflects only those fees and expenses borne directly by the fund. Because the underlying affiliated funds have varied expense and fee levels and the fund may own different proportions of the underlying affiliated funds at different times, the amount of fees and expenses incurred indirectly by the fund will vary. |
| (i) | For Class R6, the period is from the class inception, September 30, 2021, through the stated period end. |
| (l) | Recognition of net investment income by the fund may be affected by the timing of the declaration of dividends by the underlying affiliated funds in which the fund invests and for interim net investment income ratios, the actual annual net investment income ratio may differ. The ratios and per share amounts do not include net investment income of the underlying affiliated funds in which the fund invests. |
| (n) | Not annualized. |
| (r) | Certain expenses have been reduced without which performance would have been lower. |
| (s) | From time to time the fund may receive proceeds from litigation settlements, without which performance would be lower. |
| (t) | Total returns do not include any applicable sales charges. |
| (x) | The net asset values and total returns have been calculated on net assets which include adjustments made in accordance with U.S. generally accepted accounting principles required at period end for financial reporting purposes. |
| Six months ended | Year ended | |||||
| Class A | 11/30/24 (unaudited) | 5/31/24 | 5/31/23 | 5/31/22 | 5/31/21 | 5/31/20 |
| Net asset value, beginning of period | $19.69 | $18.07 | $19.22 | $21.57 | $18.02 | $17.56 |
| Income (loss) from investment operations | ||||||
| Net investment income (loss) (d)(l) | $0.18 | $0.43 | $0.44 | $0.63 | $0.25 | $0.33 |
| Net realized and unrealized gain (loss) | 1.26 | 1.97 | (0.85) | (1.79) | 4.04 | 0.97 |
| Total from investment operations | $1.44 | $2.40 | $(0.41) | $(1.16) | $4.29 | $1.30 |
| Less distributions declared to shareholders | ||||||
| From net investment income | $(0.18) | $(0.42) | $(0.45) | $(0.61) | $(0.24) | $(0.34) |
| From net realized gain | — | (0.36) | (0.29) | (0.58) | (0.50) | (0.50) |
| Total distributions declared to shareholders | $(0.18) | $(0.78) | $(0.74) | $(1.19) | $(0.74) | $(0.84) |
| Net asset value, end of period (x) | $20.95 | $19.69 | $18.07 | $19.22 | $21.57 | $18.02 |
| Total return (%) (r)(s)(t)(x) | 7.33(n) | 13.48 | (1.99) | (5.96) | 24.18 | 7.35 |
| Ratios (%) (to average net assets) and Supplemental data: | ||||||
| Expenses before expense reductions (h) | 0.35(a) | 0.35 | 0.34 | 0.36 | 0.33 | 0.34 |
| Expenses after expense reductions (h) | 0.34(a) | 0.34 | 0.33 | 0.35 | 0.33 | 0.34 |
| Net investment income (loss) (l) | 1.82(a) | 2.28 | 2.44 | 2.99 | 1.23 | 1.79 |
| Portfolio turnover rate | 2(n) | 4 | 2 | 11 | 7 | 8 |
| Net assets at end of period (000 omitted) | $5,235,009 | $5,030,342 | $4,676,731 | $4,812,425 | $4,687,031 | $3,173,202 |
| Six months ended | Year ended | |||||
| Class B | 11/30/24 (unaudited) | 5/31/24 | 5/31/23 | 5/31/22 | 5/31/21 | 5/31/20 |
| Net asset value, beginning of period | $19.42 | $17.81 | $18.93 | $21.28 | $17.79 | $17.33 |
| Income (loss) from investment operations | ||||||
| Net investment income (loss) (d)(l) | $0.11 | $0.28 | $0.31 | $0.46 | $0.10 | $0.19 |
| Net realized and unrealized gain (loss) | 1.22 | 1.95 | (0.84) | (1.76) | 3.99 | 0.97 |
| Total from investment operations | $1.33 | $2.23 | $(0.53) | $(1.30) | $4.09 | $1.16 |
| Less distributions declared to shareholders | ||||||
| From net investment income | $(0.09) | $(0.26) | $(0.30) | $(0.47) | $(0.10) | $(0.20) |
| From net realized gain | — | (0.36) | (0.29) | (0.58) | (0.50) | (0.50) |
| Total distributions declared to shareholders | $(0.09) | $(0.62) | $(0.59) | $(1.05) | $(0.60) | $(0.70) |
| Net asset value, end of period (x) | $20.66 | $19.42 | $17.81 | $18.93 | $21.28 | $17.79 |
| Total return (%) (r)(s)(t)(x) | 6.87(n) | 12.67 | (2.69) | (6.67) | 23.24 | 6.57 |
| Ratios (%) (to average net assets) and Supplemental data: | ||||||
| Expenses before expense reductions (h) | 1.10(a) | 1.10 | 1.09 | 1.11 | 1.08 | 1.09 |
| Expenses after expense reductions (h) | 1.09(a) | 1.09 | 1.08 | 1.10 | 1.08 | 1.09 |
| Net investment income (loss) (l) | 1.09(a) | 1.53 | 1.71 | 2.20 | 0.50 | 1.05 |
| Portfolio turnover rate | 2(n) | 4 | 2 | 11 | 7 | 8 |
| Net assets at end of period (000 omitted) | $21,829 | $26,965 | $43,399 | $69,914 | $116,059 | $149,969 |
| Six months ended | Year ended | |||||
| Class C | 11/30/24 (unaudited) | 5/31/24 | 5/31/23 | 5/31/22 | 5/31/21 | 5/31/20 |
| Net asset value, beginning of period | $19.21 | $17.64 | $18.76 | $21.10 | $17.65 | $17.21 |
| Income (loss) from investment operations | ||||||
| Net investment income (loss) (d)(l) | $0.11 | $0.28 | $0.30 | $0.46 | $0.10 | $0.18 |
| Net realized and unrealized gain (loss) | 1.21 | 1.92 | (0.83) | (1.75) | 3.95 | 0.97 |
| Total from investment operations | $1.32 | $2.20 | $(0.53) | $(1.29) | $4.05 | $1.15 |
| Less distributions declared to shareholders | ||||||
| From net investment income | $(0.10) | $(0.27) | $(0.30) | $(0.47) | $(0.10) | $(0.21) |
| From net realized gain | — | (0.36) | (0.29) | (0.58) | (0.50) | (0.50) |
| Total distributions declared to shareholders | $(0.10) | $(0.63) | $(0.59) | $(1.05) | $(0.60) | $(0.71) |
| Net asset value, end of period (x) | $20.43 | $19.21 | $17.64 | $18.76 | $21.10 | $17.65 |
| Total return (%) (r)(s)(t)(x) | 6.89(n) | 12.64 | (2.67) | (6.66) | 23.19 | 6.55 |
| Ratios (%) (to average net assets) and Supplemental data: | ||||||
| Expenses before expense reductions (h) | 1.10(a) | 1.10 | 1.09 | 1.11 | 1.08 | 1.09 |
| Expenses after expense reductions (h) | 1.09(a) | 1.09 | 1.08 | 1.10 | 1.08 | 1.09 |
| Net investment income (loss) (l) | 1.07(a) | 1.53 | 1.70 | 2.22 | 0.53 | 1.04 |
| Portfolio turnover rate | 2(n) | 4 | 2 | 11 | 7 | 8 |
| Net assets at end of period (000 omitted) | $336,224 | $357,049 | $403,805 | $537,508 | $721,781 | $874,127 |
| Six months ended | Year ended | |||||
| Class I | 11/30/24 (unaudited) | 5/31/24 | 5/31/23 | 5/31/22 | 5/31/21 | 5/31/20 |
| Net asset value, beginning of period | $20.06 | $18.39 | $19.55 | $21.91 | $18.29 | $17.81 |
| Income (loss) from investment operations | ||||||
| Net investment income (loss) (d)(l) | $0.21 | $0.49 | $0.50 | $0.70 | $0.30 | $0.37 |
| Net realized and unrealized gain (loss) | 1.27 | 2.00 | (0.88) | (1.82) | 4.11 | 1.00 |
| Total from investment operations | $1.48 | $2.49 | $(0.38) | $(1.12) | $4.41 | $1.37 |
| Less distributions declared to shareholders | ||||||
| From net investment income | $(0.20) | $(0.46) | $(0.49) | $(0.66) | $(0.29) | $(0.39) |
| From net realized gain | — | (0.36) | (0.29) | (0.58) | (0.50) | (0.50) |
| Total distributions declared to shareholders | $(0.20) | $(0.82) | $(0.78) | $(1.24) | $(0.79) | $(0.89) |
| Net asset value, end of period (x) | $21.34 | $20.06 | $18.39 | $19.55 | $21.91 | $18.29 |
| Total return (%) (r)(s)(t)(x) | 7.42(n) | 13.79 | (1.76) | (5.69) | 24.49 | 7.62 |
| Ratios (%) (to average net assets) and Supplemental data: | ||||||
| Expenses before expense reductions (h) | 0.10(a) | 0.10 | 0.09 | 0.11 | 0.08 | 0.09 |
| Expenses after expense reductions (h) | 0.09(a) | 0.09 | 0.08 | 0.10 | N/A | N/A |
| Net investment income (loss) (l) | 2.07(a) | 2.53 | 2.69 | 3.26 | 1.50 | 2.04 |
| Portfolio turnover rate | 2(n) | 4 | 2 | 11 | 7 | 8 |
| Net assets at end of period (000 omitted) | $410,641 | $422,766 | $416,670 | $448,966 | $476,798 | $310,815 |
| Six months ended | Year ended | |||||
| Class R1 | 11/30/24 (unaudited) | 5/31/24 | 5/31/23 | 5/31/22 | 5/31/21 | 5/31/20 |
| Net asset value, beginning of period | $18.65 | $17.15 | $18.27 | $20.58 | $17.23 | $16.83 |
| Income (loss) from investment operations | ||||||
| Net investment income (loss) (d)(l) | $0.10 | $0.28 | $0.29 | $0.45 | $0.09 | $0.18 |
| Net realized and unrealized gain (loss) | 1.19 | 1.86 | (0.81) | (1.70) | 3.87 | 0.93 |
| Total from investment operations | $1.29 | $2.14 | $(0.52) | $(1.25) | $3.96 | $1.11 |
| Less distributions declared to shareholders | ||||||
| From net investment income | $(0.11) | $(0.28) | $(0.31) | $(0.48) | $(0.11) | $(0.21) |
| From net realized gain | — | (0.36) | (0.29) | (0.58) | (0.50) | (0.50) |
| Total distributions declared to shareholders | $(0.11) | $(0.64) | $(0.60) | $(1.06) | $(0.61) | $(0.71) |
| Net asset value, end of period (x) | $19.83 | $18.65 | $17.15 | $18.27 | $20.58 | $17.23 |
| Total return (%) (r)(s)(t)(x) | 6.91(n) | 12.65 | (2.70) | (6.65) | 23.25 | 6.49 |
| Ratios (%) (to average net assets) and Supplemental data: | ||||||
| Expenses before expense reductions (h) | 1.10(a) | 1.10 | 1.09 | 1.11 | 1.08 | 1.09 |
| Expenses after expense reductions (h) | 1.09(a) | 1.09 | 1.08 | 1.10 | N/A | 1.09 |
| Net investment income (loss) (l) | 1.08(a) | 1.56 | 1.69 | 2.21 | 0.49 | 1.03 |
| Portfolio turnover rate | 2(n) | 4 | 2 | 11 | 7 | 8 |
| Net assets at end of period (000 omitted) | $16,105 | $18,754 | $21,036 | $25,035 | $26,919 | $24,120 |
| Six months ended | Year ended | |||||
| Class R2 | 11/30/24 (unaudited) | 5/31/24 | 5/31/23 | 5/31/22 | 5/31/21 | 5/31/20 |
| Net asset value, beginning of period | $19.14 | $17.58 | $18.72 | $21.04 | $17.59 | $17.16 |
| Income (loss) from investment operations | ||||||
| Net investment income (loss) (d)(l) | $0.16 | $0.37 | $0.39 | $0.56 | $0.20 | $0.27 |
| Net realized and unrealized gain (loss) | 1.21 | 1.92 | (0.84) | (1.74) | 3.95 | 0.96 |
| Total from investment operations | $1.37 | $2.29 | $(0.45) | $(1.18) | $4.15 | $1.23 |
| Less distributions declared to shareholders | ||||||
| From net investment income | $(0.15) | $(0.37) | $(0.40) | $(0.56) | $(0.20) | $(0.30) |
| From net realized gain | — | (0.36) | (0.29) | (0.58) | (0.50) | (0.50) |
| Total distributions declared to shareholders | $(0.15) | $(0.73) | $(0.69) | $(1.14) | $(0.70) | $(0.80) |
| Net asset value, end of period (x) | $20.36 | $19.14 | $17.58 | $18.72 | $21.04 | $17.59 |
| Total return (%) (r)(s)(t)(x) | 7.19(n) | 13.22 | (2.24) | (6.20) | 23.88 | 7.06 |
| Ratios (%) (to average net assets) and Supplemental data: | ||||||
| Expenses before expense reductions (h) | 0.60(a) | 0.60 | 0.59 | 0.61 | 0.58 | 0.59 |
| Expenses after expense reductions (h) | 0.59(a) | 0.59 | 0.58 | 0.60 | 0.58 | 0.59 |
| Net investment income (loss) (l) | 1.57(a) | 2.02 | 2.18 | 2.70 | 1.01 | 1.53 |
| Portfolio turnover rate | 2(n) | 4 | 2 | 11 | 7 | 8 |
| Net assets at end of period (000 omitted) | $84,475 | $86,169 | $94,299 | $107,117 | $128,654 | $124,725 |
| Six months ended | Year ended | |||||
| Class R3 | 11/30/24 (unaudited) | 5/31/24 | 5/31/23 | 5/31/22 | 5/31/21 | 5/31/20 |
| Net asset value, beginning of period | $19.50 | $17.90 | $19.04 | $21.38 | $17.86 | $17.41 |
| Income (loss) from investment operations | ||||||
| Net investment income (loss) (d)(l) | $0.18 | $0.42 | $0.44 | $0.63 | $0.25 | $0.33 |
| Net realized and unrealized gain (loss) | 1.24 | 1.96 | (0.85) | (1.78) | 4.01 | 0.96 |
| Total from investment operations | $1.42 | $2.38 | $(0.41) | $(1.15) | $4.26 | $1.29 |
| Less distributions declared to shareholders | ||||||
| From net investment income | $(0.18) | $(0.42) | $(0.44) | $(0.61) | $(0.24) | $(0.34) |
| From net realized gain | — | (0.36) | (0.29) | (0.58) | (0.50) | (0.50) |
| Total distributions declared to shareholders | $(0.18) | $(0.78) | $(0.73) | $(1.19) | $(0.74) | $(0.84) |
| Net asset value, end of period (x) | $20.74 | $19.50 | $17.90 | $19.04 | $21.38 | $17.86 |
| Total return (%) (r)(s)(t)(x) | 7.29(n) | 13.49 | (1.96) | (5.97) | 24.21 | 7.35 |
| Ratios (%) (to average net assets) and Supplemental data: | ||||||
| Expenses before expense reductions (h) | 0.35(a) | 0.35 | 0.34 | 0.36 | 0.33 | 0.34 |
| Expenses after expense reductions (h) | 0.34(a) | 0.34 | 0.33 | 0.35 | N/A | N/A |
| Net investment income (loss) (l) | 1.83(a) | 2.27 | 2.44 | 2.97 | 1.24 | 1.83 |
| Portfolio turnover rate | 2(n) | 4 | 2 | 11 | 7 | 8 |
| Net assets at end of period (000 omitted) | $144,922 | $157,588 | $163,134 | $196,975 | $250,644 | $219,996 |
| Six months ended | Year ended | |||||
| Class R4 | 11/30/24 (unaudited) | 5/31/24 | 5/31/23 | 5/31/22 | 5/31/21 | 5/31/20 |
| Net asset value, beginning of period | $19.67 | $18.05 | $19.20 | $21.55 | $18.00 | $17.54 |
| Income (loss) from investment operations | ||||||
| Net investment income (loss) (d)(l) | $0.21 | $0.48 | $0.49 | $0.69 | $0.30 | $0.37 |
| Net realized and unrealized gain (loss) | 1.25 | 1.96 | (0.86) | (1.80) | 4.04 | 0.98 |
| Total from investment operations | $1.46 | $2.44 | $(0.37) | $(1.11) | $4.34 | $1.35 |
| Less distributions declared to shareholders | ||||||
| From net investment income | $(0.20) | $(0.46) | $(0.49) | $(0.66) | $(0.29) | $(0.39) |
| From net realized gain | — | (0.36) | (0.29) | (0.58) | (0.50) | (0.50) |
| Total distributions declared to shareholders | $(0.20) | $(0.82) | $(0.78) | $(1.24) | $(0.79) | $(0.89) |
| Net asset value, end of period (x) | $20.93 | $19.67 | $18.05 | $19.20 | $21.55 | $18.00 |
| Total return (%) (r)(s)(t)(x) | 7.47(n) | 13.77 | (1.74) | (5.74) | 24.50 | 7.62 |
| Ratios (%) (to average net assets) and Supplemental data: | ||||||
| Expenses before expense reductions (h) | 0.10(a) | 0.10 | 0.09 | 0.11 | 0.08 | 0.09 |
| Expenses after expense reductions (h) | 0.09(a) | 0.09 | 0.08 | 0.10 | N/A | N/A |
| Net investment income (loss) (l) | 2.07(a) | 2.54 | 2.72 | 3.24 | 1.49 | 2.04 |
| Portfolio turnover rate | 2(n) | 4 | 2 | 11 | 7 | 8 |
| Net assets at end of period (000 omitted) | $219,809 | $226,037 | $247,048 | $296,478 | $334,080 | $252,825 |
| Six months ended | Year ended | |||
| Class R6 | 11/30/24 (unaudited) | 5/31/24 | 5/31/23 | 5/31/22(i) |
| Net asset value, beginning of period | $20.06 | $18.39 | $19.55 | $22.22 |
| Income (loss) from investment operations | ||||
| Net investment income (loss) (d)(l) | $0.22 | $0.50 | $0.51 | $0.15 |
| Net realized and unrealized gain (loss) | 1.27 | 2.01 | (0.88) | (1.67) |
| Total from investment operations | $1.49 | $2.51 | $(0.37) | $(1.52) |
| Less distributions declared to shareholders | ||||
| From net investment income | $(0.21) | $(0.48) | $(0.50) | $(0.57) |
| From net realized gain | — | (0.36) | (0.29) | (0.58) |
| Total distributions declared to shareholders | $(0.21) | $(0.84) | $(0.79) | $(1.15) |
| Net asset value, end of period (x) | $21.34 | $20.06 | $18.39 | $19.55 |
| Total return (%) (r)(s)(t)(x) | 7.46(n) | 13.87 | (1.69) | (7.39)(n) |
| Ratios (%) (to average net assets) and Supplemental data: | ||||
| Expenses before expense reductions (h) | 0.03(a) | 0.03 | 0.03 | 0.03(a) |
| Expenses after expense reductions (h) | 0.02(a) | 0.02 | 0.02 | 0.02(a) |
| Net investment income (loss) (l) | 2.13(a) | 2.60 | 2.74 | 1.12(a) |
| Portfolio turnover rate | 2(n) | 4 | 2 | 11 |
| Net assets at end of period (000 omitted) | $338,630 | $305,097 | $233,967 | $207,850 |
| (a) | Annualized. |
| (d) | Per share data is based on average shares outstanding. |
| (h) | In addition to the fees and expenses which the fund bears directly, the fund indirectly bears a pro rata share of the fees and expenses of the underlying affiliated funds in which the fund invests. Accordingly, the expense ratio for the fund reflects only those fees and expenses borne directly by the fund. Because the underlying affiliated funds have varied expense and fee levels and the fund may own different proportions of the underlying affiliated funds at different times, the amount of fees and expenses incurred indirectly by the fund will vary. |
| (i) | For Class R6, the period is from the class inception, September 30, 2021, through the stated period end. |
| (l) | Recognition of net investment income by the fund may be affected by the timing of the declaration of dividends by the underlying affiliated funds in which the fund invests and for interim net investment income ratios, the actual annual net investment income ratio may differ. The ratios and per share amounts do not include net investment income of the underlying affiliated funds in which the fund invests. |
| (n) | Not annualized. |
| (r) | Certain expenses have been reduced without which performance would have been lower. |
| (s) | From time to time the fund may receive proceeds from litigation settlements, without which performance would be lower. |
| (t) | Total returns do not include any applicable sales charges. |
| (x) | The net asset values and total returns have been calculated on net assets which include adjustments made in accordance with U.S. generally accepted accounting principles required at period end for financial reporting purposes. |
| Six months ended | Year ended | |||||
| Class A | 11/30/24 (unaudited) | 5/31/24 | 5/31/23 | 5/31/22 | 5/31/21 | 5/31/20 |
| Net asset value, beginning of period | $24.45 | $21.60 | $23.06 | $26.18 | $20.57 | $20.26 |
| Income (loss) from investment operations | ||||||
| Net investment income (loss) (d)(l) | $0.13 | $0.41 | $0.49 | $0.83 | $0.23 | $0.33 |
| Net realized and unrealized gain (loss) | 1.85 | 3.28 | (0.99) | (2.10) | 6.25 | 1.03 |
| Total from investment operations | $1.98 | $3.69 | $(0.50) | $(1.27) | $6.48 | $1.36 |
| Less distributions declared to shareholders | ||||||
| From net investment income | $— | $(0.39) | $(0.48) | $(0.83) | $(0.23) | $(0.34) |
| From net realized gain | — | (0.45) | (0.48) | (1.02) | (0.64) | (0.71) |
| Total distributions declared to shareholders | $— | $(0.84) | $(0.96) | $(1.85) | $(0.87) | $(1.05) |
| Net asset value, end of period (x) | $26.43 | $24.45 | $21.60 | $23.06 | $26.18 | $20.57 |
| Total return (%) (r)(s)(t)(x) | 8.10(n) | 17.32 | (1.97) | (5.64) | 31.90 | 6.41 |
| Ratios (%) (to average net assets) and Supplemental data: | ||||||
| Expenses before expense reductions (h) | 0.36(a) | 0.36 | 0.36 | 0.37 | 0.35 | 0.36 |
| Expenses after expense reductions (h) | 0.34(a) | 0.35 | 0.34 | 0.35 | 0.35 | 0.35 |
| Net investment income (loss) (l) | 1.01(a) | 1.77 | 2.25 | 3.24 | 0.96 | 1.57 |
| Portfolio turnover rate | 2(n) | 4 | 2 | 11 | 7 | 4 |
| Net assets at end of period (000 omitted) | $5,032,048 | $4,774,614 | $4,249,189 | $4,361,480 | $4,279,764 | $2,944,439 |
| Six months ended | Year ended | |||||
| Class B | 11/30/24 (unaudited) | 5/31/24 | 5/31/23 | 5/31/22 | 5/31/21 | 5/31/20 |
| Net asset value, beginning of period | $24.42 | $21.53 | $22.92 | $25.99 | $20.39 | $20.08 |
| Income (loss) from investment operations | ||||||
| Net investment income (loss) (d)(l) | $0.03 | $0.23 | $0.33 | $0.63 | $0.05 | $0.17 |
| Net realized and unrealized gain (loss) | 1.85 | 3.27 | (0.98) | (2.10) | 6.21 | 1.00 |
| Total from investment operations | $1.88 | $3.50 | $(0.65) | $(1.47) | $6.26 | $1.17 |
| Less distributions declared to shareholders | ||||||
| From net investment income | $— | $(0.16) | $(0.26) | $(0.58) | $(0.02) | $(0.15) |
| From net realized gain | — | (0.45) | (0.48) | (1.02) | (0.64) | (0.71) |
| Total distributions declared to shareholders | $— | $(0.61) | $(0.74) | $(1.60) | $(0.66) | $(0.86) |
| Net asset value, end of period (x) | $26.30 | $24.42 | $21.53 | $22.92 | $25.99 | $20.39 |
| Total return (%) (r)(s)(t)(x) | 7.70(n) | 16.42 | (2.69) | (6.36) | 30.98 | 5.56 |
| Ratios (%) (to average net assets) and Supplemental data: | ||||||
| Expenses before expense reductions (h) | 1.11(a) | 1.11 | 1.11 | 1.12 | 1.10 | 1.11 |
| Expenses after expense reductions (h) | 1.09(a) | 1.10 | 1.09 | 1.10 | 1.10 | 1.10 |
| Net investment income (loss) (l) | 0.28(a) | 1.02 | 1.52 | 2.46 | 0.23 | 0.83 |
| Portfolio turnover rate | 2(n) | 4 | 2 | 11 | 7 | 4 |
| Net assets at end of period (000 omitted) | $26,834 | $31,854 | $46,181 | $69,836 | $109,514 | $126,962 |
| Six months ended | Year ended | |||||
| Class C | 11/30/24 (unaudited) | 5/31/24 | 5/31/23 | 5/31/22 | 5/31/21 | 5/31/20 |
| Net asset value, beginning of period | $23.92 | $21.14 | $22.55 | $25.63 | $20.12 | $19.85 |
| Income (loss) from investment operations | ||||||
| Net investment income (loss) (d)(l) | $0.03 | $0.23 | $0.32 | $0.62 | $0.06 | $0.17 |
| Net realized and unrealized gain (loss) | 1.81 | 3.21 | (0.95) | (2.07) | 6.12 | 0.99 |
| Total from investment operations | $1.84 | $3.44 | $(0.63) | $(1.45) | $6.18 | $1.16 |
| Less distributions declared to shareholders | ||||||
| From net investment income | $— | $(0.21) | $(0.30) | $(0.61) | $(0.03) | $(0.18) |
| From net realized gain | — | (0.45) | (0.48) | (1.02) | (0.64) | (0.71) |
| Total distributions declared to shareholders | $— | $(0.66) | $(0.78) | $(1.63) | $(0.67) | $(0.89) |
| Net asset value, end of period (x) | $25.76 | $23.92 | $21.14 | $22.55 | $25.63 | $20.12 |
| Total return (%) (r)(s)(t)(x) | 7.69(n) | 16.45 | (2.67) | (6.39) | 30.98 | 5.56 |
| Ratios (%) (to average net assets) and Supplemental data: | ||||||
| Expenses before expense reductions (h) | 1.11(a) | 1.11 | 1.11 | 1.12 | 1.10 | 1.11 |
| Expenses after expense reductions (h) | 1.09(a) | 1.10 | 1.09 | 1.10 | 1.10 | 1.10 |
| Net investment income (loss) (l) | 0.27(a) | 1.03 | 1.51 | 2.46 | 0.26 | 0.82 |
| Portfolio turnover rate | 2(n) | 4 | 2 | 11 | 7 | 4 |
| Net assets at end of period (000 omitted) | $377,934 | $383,396 | $396,612 | $490,305 | $638,016 | $694,541 |
| Six months ended | Year ended | |||||
| Class I | 11/30/24 (unaudited) | 5/31/24 | 5/31/23 | 5/31/22 | 5/31/21 | 5/31/20 |
| Net asset value, beginning of period | $24.77 | $21.87 | $23.33 | $26.47 | $20.78 | $20.45 |
| Income (loss) from investment operations | ||||||
| Net investment income (loss) (d)(l) | $0.16 | $0.48 | $0.54 | $0.91 | $0.29 | $0.38 |
| Net realized and unrealized gain (loss) | 1.88 | 3.31 | (0.98) | (2.13) | 6.33 | 1.05 |
| Total from investment operations | $2.04 | $3.79 | $(0.44) | $(1.22) | $6.62 | $1.43 |
| Less distributions declared to shareholders | ||||||
| From net investment income | $— | $(0.44) | $(0.54) | $(0.90) | $(0.29) | $(0.39) |
| From net realized gain | — | (0.45) | (0.48) | (1.02) | (0.64) | (0.71) |
| Total distributions declared to shareholders | $— | $(0.89) | $(1.02) | $(1.92) | $(0.93) | $(1.10) |
| Net asset value, end of period (x) | $26.81 | $24.77 | $21.87 | $23.33 | $26.47 | $20.78 |
| Total return (%) (r)(s)(t)(x) | 8.24(n) | 17.60 | (1.69) | (5.44) | 32.24 | 6.69 |
| Ratios (%) (to average net assets) and Supplemental data: | ||||||
| Expenses before expense reductions (h) | 0.11(a) | 0.11 | 0.11 | 0.12 | 0.10 | 0.11 |
| Expenses after expense reductions (h) | 0.09(a) | 0.10 | 0.09 | 0.10 | 0.10 | 0.10 |
| Net investment income (loss) (l) | 1.27(a) | 2.04 | 2.47 | 3.50 | 1.23 | 1.80 |
| Portfolio turnover rate | 2(n) | 4 | 2 | 11 | 7 | 4 |
| Net assets at end of period (000 omitted) | $394,196 | $396,160 | $421,284 | $421,692 | $434,119 | $294,213 |
| Six months ended | Year ended | |||||
| Class R1 | 11/30/24 (unaudited) | 5/31/24 | 5/31/23 | 5/31/22 | 5/31/21 | 5/31/20 |
| Net asset value, beginning of period | $23.22 | $20.55 | $21.97 | $25.02 | $19.69 | $19.42 |
| Income (loss) from investment operations | ||||||
| Net investment income (loss) (d)(l) | $0.03 | $0.23 | $0.32 | $0.62 | $0.05 | $0.16 |
| Net realized and unrealized gain (loss) | 1.75 | 3.11 | (0.94) | (2.02) | 5.98 | 0.98 |
| Total from investment operations | $1.78 | $3.34 | $(0.62) | $(1.40) | $6.03 | $1.14 |
| Less distributions declared to shareholders | ||||||
| From net investment income | $— | $(0.22) | $(0.32) | $(0.63) | $(0.06) | $(0.16) |
| From net realized gain | — | (0.45) | (0.48) | (1.02) | (0.64) | (0.71) |
| Total distributions declared to shareholders | $— | $(0.67) | $(0.80) | $(1.65) | $(0.70) | $(0.87) |
| Net asset value, end of period (x) | $25.00 | $23.22 | $20.55 | $21.97 | $25.02 | $19.69 |
| Total return (%) (r)(s)(t)(x) | 7.67(n) | 16.46 | (2.67) | (6.38) | 30.91 | 5.59 |
| Ratios (%) (to average net assets) and Supplemental data: | ||||||
| Expenses before expense reductions (h) | 1.11(a) | 1.11 | 1.11 | 1.12 | 1.10 | 1.11 |
| Expenses after expense reductions (h) | 1.09(a) | 1.10 | 1.09 | 1.10 | 1.10 | 1.10 |
| Net investment income (loss) (l) | 0.27(a) | 1.05 | 1.53 | 2.53 | 0.21 | 0.82 |
| Portfolio turnover rate | 2(n) | 4 | 2 | 11 | 7 | 4 |
| Net assets at end of period (000 omitted) | $15,513 | $16,321 | $16,463 | $18,598 | $21,519 | $19,543 |
| Six months ended | Year ended | |||||
| Class R2 | 11/30/24 (unaudited) | 5/31/24 | 5/31/23 | 5/31/22 | 5/31/21 | 5/31/20 |
| Net asset value, beginning of period | $23.76 | $21.01 | $22.44 | $25.52 | $20.06 | $19.78 |
| Income (loss) from investment operations | ||||||
| Net investment income (loss) (d)(l) | $0.09 | $0.34 | $0.42 | $0.75 | $0.17 | $0.27 |
| Net realized and unrealized gain (loss) | 1.80 | 3.18 | (0.95) | (2.05) | 6.10 | 1.00 |
| Total from investment operations | $1.89 | $3.52 | $(0.53) | $(1.30) | $6.27 | $1.27 |
| Less distributions declared to shareholders | ||||||
| From net investment income | $— | $(0.32) | $(0.42) | $(0.76) | $(0.17) | $(0.28) |
| From net realized gain | — | (0.45) | (0.48) | (1.02) | (0.64) | (0.71) |
| Total distributions declared to shareholders | $— | $(0.77) | $(0.90) | $(1.78) | $(0.81) | $(0.99) |
| Net asset value, end of period (x) | $25.65 | $23.76 | $21.01 | $22.44 | $25.52 | $20.06 |
| Total return (%) (r)(s)(t)(x) | 7.95(n) | 17.00 | (2.18) | (5.89) | 31.62 | 6.12 |
| Ratios (%) (to average net assets) and Supplemental data: | ||||||
| Expenses before expense reductions (h) | 0.61(a) | 0.61 | 0.61 | 0.62 | 0.60 | 0.61 |
| Expenses after expense reductions (h) | 0.59(a) | 0.60 | 0.59 | 0.60 | 0.60 | 0.60 |
| Net investment income (loss) (l) | 0.77(a) | 1.52 | 1.98 | 2.97 | 0.72 | 1.30 |
| Portfolio turnover rate | 2(n) | 4 | 2 | 11 | 7 | 4 |
| Net assets at end of period (000 omitted) | $100,251 | $101,107 | $107,528 | $122,694 | $142,619 | $123,459 |
| Six months ended | Year ended | |||||
| Class R3 | 11/30/24 (unaudited) | 5/31/24 | 5/31/23 | 5/31/22 | 5/31/21 | 5/31/20 |
| Net asset value, beginning of period | $24.20 | $21.38 | $22.83 | $25.93 | $20.37 | $20.08 |
| Income (loss) from investment operations | ||||||
| Net investment income (loss) (d)(l) | $0.13 | $0.40 | $0.49 | $0.82 | $0.23 | $0.33 |
| Net realized and unrealized gain (loss) | 1.83 | 3.25 | (0.98) | (2.07) | 6.20 | 1.01 |
| Total from investment operations | $1.96 | $3.65 | $(0.49) | $(1.25) | $6.43 | $1.34 |
| Less distributions declared to shareholders | ||||||
| From net investment income | $— | $(0.38) | $(0.48) | $(0.83) | $(0.23) | $(0.34) |
| From net realized gain | — | (0.45) | (0.48) | (1.02) | (0.64) | (0.71) |
| Total distributions declared to shareholders | $— | $(0.83) | $(0.96) | $(1.85) | $(0.87) | $(1.05) |
| Net asset value, end of period (x) | $26.16 | $24.20 | $21.38 | $22.83 | $25.93 | $20.37 |
| Total return (%) (r)(s)(t)(x) | 8.10(n) | 17.33 | (1.97) | (5.64) | 31.94 | 6.35 |
| Ratios (%) (to average net assets) and Supplemental data: | ||||||
| Expenses before expense reductions (h) | 0.36(a) | 0.36 | 0.36 | 0.37 | 0.35 | 0.36 |
| Expenses after expense reductions (h) | 0.34(a) | 0.35 | 0.34 | 0.35 | 0.35 | 0.35 |
| Net investment income (loss) (l) | 1.02(a) | 1.76 | 2.26 | 3.22 | 0.98 | 1.59 |
| Portfolio turnover rate | 2(n) | 4 | 2 | 11 | 7 | 4 |
| Net assets at end of period (000 omitted) | $113,174 | $114,964 | $115,250 | $140,484 | $170,541 | $147,888 |
| Six months ended | Year ended | |||||
| Class R4 | 11/30/24 (unaudited) | 5/31/24 | 5/31/23 | 5/31/22 | 5/31/21 | 5/31/20 |
| Net asset value, beginning of period | $24.45 | $21.60 | $23.05 | $26.17 | $20.55 | $20.24 |
| Income (loss) from investment operations | ||||||
| Net investment income (loss) (d)(l) | $0.16 | $0.47 | $0.54 | $0.91 | $0.29 | $0.38 |
| Net realized and unrealized gain (loss) | 1.85 | 3.27 | (0.97) | (2.11) | 6.26 | 1.03 |
| Total from investment operations | $2.01 | $3.74 | $(0.43) | $(1.20) | $6.55 | $1.41 |
| Less distributions declared to shareholders | ||||||
| From net investment income | $— | $(0.44) | $(0.54) | $(0.90) | $(0.29) | $(0.39) |
| From net realized gain | — | (0.45) | (0.48) | (1.02) | (0.64) | (0.71) |
| Total distributions declared to shareholders | $— | $(0.89) | $(1.02) | $(1.92) | $(0.93) | $(1.10) |
| Net asset value, end of period (x) | $26.46 | $24.45 | $21.60 | $23.05 | $26.17 | $20.55 |
| Total return (%) (r)(s)(t)(x) | 8.22(n) | 17.59 | (1.67) | (5.43) | 32.26 | 6.66 |
| Ratios (%) (to average net assets) and Supplemental data: | ||||||
| Expenses before expense reductions (h) | 0.11(a) | 0.11 | 0.11 | 0.12 | 0.11 | 0.11 |
| Expenses after expense reductions (h) | 0.09(a) | 0.10 | 0.09 | 0.10 | 0.10 | 0.10 |
| Net investment income (loss) (l) | 1.27(a) | 2.03 | 2.51 | 3.52 | 1.23 | 1.81 |
| Portfolio turnover rate | 2(n) | 4 | 2 | 11 | 7 | 4 |
| Net assets at end of period (000 omitted) | $258,332 | $277,386 | $307,903 | $328,631 | $360,879 | $264,076 |
| Six months ended | Year ended | |||
| Class R6 | 11/30/24 (unaudited) | 5/31/24 | 5/31/23 | 5/31/22(i) |
| Net asset value, beginning of period | $24.79 | $21.88 | $23.35 | $27.02 |
| Income (loss) from investment operations | ||||
| Net investment income (loss) (d)(l) | $0.17 | $0.49 | $0.56 | $0.12 |
| Net realized and unrealized gain (loss) | 1.87 | 3.33 | (0.99) | (1.87) |
| Total from investment operations | $2.04 | $3.82 | $(0.43) | $(1.75) |
| Less distributions declared to shareholders | ||||
| From net investment income | $— | $(0.46) | $(0.56) | $(0.90) |
| From net realized gain | — | (0.45) | (0.48) | (1.02) |
| Total distributions declared to shareholders | $— | $(0.91) | $(1.04) | $(1.92) |
| Net asset value, end of period (x) | $26.83 | $24.79 | $21.88 | $23.35 |
| Total return (%) (r)(s)(t)(x) | 8.23(n) | 17.73 | (1.65) | (7.27)(n) |
| Ratios (%) (to average net assets) and Supplemental data: | ||||
| Expenses before expense reductions (h) | 0.04(a) | 0.04 | 0.04 | 0.04(a) |
| Expenses after expense reductions (h) | 0.02(a) | 0.02 | 0.02 | 0.02(a) |
| Net investment income (loss) (l) | 1.33(a) | 2.08 | 2.55 | 0.75(a) |
| Portfolio turnover rate | 2(n) | 4 | 2 | 11 |
| Net assets at end of period (000 omitted) | $475,136 | $446,621 | $274,102 | $228,326 |
| (a) | Annualized. |
| (d) | Per share data is based on average shares outstanding. |
| (h) | In addition to the fees and expenses which the fund bears directly, the fund indirectly bears a pro rata share of the fees and expenses of the underlying affiliated funds in which the fund invests. Accordingly, the expense ratio for the fund reflects only those fees and expenses borne directly by the fund. Because the underlying affiliated funds have varied expense and fee levels and the fund may own different proportions of the underlying affiliated funds at different times, the amount of fees and expenses incurred indirectly by the fund will vary. |
| (i) | For Class R6, the period is from the class inception, September 30, 2021, through the stated period end. |
| (l) | Recognition of net investment income by the fund may be affected by the timing of the declaration of dividends by the underlying affiliated funds in which the fund invests and for interim net investment income ratios, the actual annual net investment income ratio may differ. The ratios and per share amounts do not include net investment income of the underlying affiliated funds in which the fund invests. |
| (n) | Not annualized. |
| (r) | Certain expenses have been reduced without which performance would have been lower. |
| (s) | From time to time the fund may receive proceeds from litigation settlements, without which performance would be lower. |
| (t) | Total returns do not include any applicable sales charges. |
| (x) | The net asset values and total returns have been calculated on net assets which include adjustments made in accordance with U.S. generally accepted accounting principles required at period end for financial reporting purposes. |
| Six months ended | Year ended | |||||
| Class A | 11/30/24 (unaudited) | 5/31/24 | 5/31/23 | 5/31/22 | 5/31/21 | 5/31/20 |
| Net asset value, beginning of period | $29.90 | $25.73 | $27.39 | $31.03 | $23.23 | $22.94 |
| Income (loss) from investment operations | ||||||
| Net investment income (loss) (d)(l) | $(0.00)(w) | $0.30 | $0.44 | $0.92 | $0.14 | $0.28 |
| Net realized and unrealized gain (loss) | 2.55 | 4.77 | (1.02) | (2.46) | 8.66 | 1.18 |
| Total from investment operations | $2.55 | $5.07 | $(0.58) | $(1.54) | $8.80 | $1.46 |
| Less distributions declared to shareholders | ||||||
| From net investment income | $— | $(0.27) | $(0.45) | $(0.94) | $(0.15) | $(0.29) |
| From net realized gain | — | (0.63) | (0.63) | (1.16) | (0.85) | (0.88) |
| Total distributions declared to shareholders | $— | $(0.90) | $(1.08) | $(2.10) | $(1.00) | $(1.17) |
| Net asset value, end of period (x) | $32.45 | $29.90 | $25.73 | $27.39 | $31.03 | $23.23 |
| Total return (%) (r)(s)(t)(x) | 8.53(n) | 19.97 | (1.95) | (5.78) | 38.35 | 5.97 |
| Ratios (%) (to average net assets) and Supplemental data: | ||||||
| Expenses before expense reductions (h) | 0.37(a) | 0.38 | 0.39 | 0.39 | 0.40 | 0.41 |
| Expenses after expense reductions (h) | 0.37(a) | 0.38 | 0.38 | 0.38 | 0.38 | 0.38 |
| Net investment income (loss) (l) | (0.02)(a) | 1.08 | 1.71 | 3.02 | 0.50 | 1.18 |
| Portfolio turnover rate | 3(n) | 4 | 4 | 13 | 7 | 6 |
| Net assets at end of period (000 omitted) | $1,773,460 | $1,662,799 | $1,422,920 | $1,424,073 | $1,386,555 | $928,555 |
| Six months ended | Year ended | |||||
| Class B | 11/30/24 (unaudited) | 5/31/24 | 5/31/23 | 5/31/22 | 5/31/21 | 5/31/20 |
| Net asset value, beginning of period | $29.44 | $25.31 | $26.90 | $30.47 | $22.88 | $22.60 |
| Income (loss) from investment operations | ||||||
| Net investment income (loss) (d)(l) | $(0.12) | $0.09 | $0.25 | $0.69 | $(0.06) | $0.10 |
| Net realized and unrealized gain (loss) | 2.52 | 4.69 | (1.01) | (2.44) | 8.50 | 1.15 |
| Total from investment operations | $2.40 | $4.78 | $(0.76) | $(1.75) | $8.44 | $1.25 |
| Less distributions declared to shareholders | ||||||
| From net investment income | $— | $(0.02) | $(0.20) | $(0.66) | $— | $(0.09) |
| From net realized gain | — | (0.63) | (0.63) | (1.16) | (0.85) | (0.88) |
| Total distributions declared to shareholders | $— | $(0.65) | $(0.83) | $(1.82) | $(0.85) | $(0.97) |
| Net asset value, end of period (x) | $31.84 | $29.44 | $25.31 | $26.90 | $30.47 | $22.88 |
| Total return (%) (r)(s)(t)(x) | 8.15(n) | 19.06 | (2.68) | (6.48) | 37.30 | 5.18 |
| Ratios (%) (to average net assets) and Supplemental data: | ||||||
| Expenses before expense reductions (h) | 1.12(a) | 1.13 | 1.14 | 1.14 | 1.15 | 1.16 |
| Expenses after expense reductions (h) | 1.12(a) | N/A | 1.13 | 1.13 | 1.13 | 1.13 |
| Net investment income (loss) (l) | (0.76)(a) | 0.33 | 0.98 | 2.27 | (0.22) | 0.44 |
| Portfolio turnover rate | 3(n) | 4 | 4 | 13 | 7 | 6 |
| Net assets at end of period (000 omitted) | $13,134 | $15,383 | $19,808 | $27,855 | $40,147 | $41,016 |
| Six months ended | Year ended | |||||
| Class C | 11/30/24 (unaudited) | 5/31/24 | 5/31/23 | 5/31/22 | 5/31/21 | 5/31/20 |
| Net asset value, beginning of period | $28.88 | $24.88 | $26.51 | $30.09 | $22.61 | $22.36 |
| Income (loss) from investment operations | ||||||
| Net investment income (loss) (d)(l) | $(0.12) | $0.09 | $0.24 | $0.67 | $(0.05) | $0.09 |
| Net realized and unrealized gain (loss) | 2.47 | 4.62 | (0.99) | (2.39) | 8.38 | 1.15 |
| Total from investment operations | $2.35 | $4.71 | $(0.75) | $(1.72) | $8.33 | $1.24 |
| Less distributions declared to shareholders | ||||||
| From net investment income | $— | $(0.08) | $(0.25) | $(0.70) | $— | $(0.11) |
| From net realized gain | — | (0.63) | (0.63) | (1.16) | (0.85) | (0.88) |
| Total distributions declared to shareholders | $— | $(0.71) | $(0.88) | $(1.86) | $(0.85) | $(0.99) |
| Net asset value, end of period (x) | $31.23 | $28.88 | $24.88 | $26.51 | $30.09 | $22.61 |
| Total return (%) (r)(s)(t)(x) | 8.14(n) | 19.11 | (2.70) | (6.47) | 37.26 | 5.20 |
| Ratios (%) (to average net assets) and Supplemental data: | ||||||
| Expenses before expense reductions (h) | 1.12(a) | 1.13 | 1.14 | 1.14 | 1.14 | 1.16 |
| Expenses after expense reductions (h) | 1.12(a) | 1.13 | 1.13 | 1.13 | 1.13 | 1.13 |
| Net investment income (loss) (l) | (0.77)(a) | 0.34 | 0.96 | 2.27 | (0.20) | 0.41 |
| Portfolio turnover rate | 3(n) | 4 | 4 | 13 | 7 | 6 |
| Net assets at end of period (000 omitted) | $245,169 | $237,741 | $217,393 | $232,876 | $264,940 | $234,144 |
| Six months ended | Year ended | |||||
| Class I | 11/30/24 (unaudited) | 5/31/24 | 5/31/23 | 5/31/22 | 5/31/21 | 5/31/20 |
| Net asset value, beginning of period | $30.58 | $26.28 | $27.96 | $31.62 | $23.65 | $23.33 |
| Income (loss) from investment operations | ||||||
| Net investment income (loss) (d)(l) | $0.04 | $0.38 | $0.51 | $1.00 | $0.22 | $0.35 |
| Net realized and unrealized gain (loss) | 2.61 | 4.89 | (1.05) | (2.48) | 8.80 | 1.20 |
| Total from investment operations | $2.65 | $5.27 | $(0.54) | $(1.48) | $9.02 | $1.55 |
| Less distributions declared to shareholders | ||||||
| From net investment income | $— | $(0.34) | $(0.51) | $(1.02) | $(0.20) | $(0.35) |
| From net realized gain | — | (0.63) | (0.63) | (1.16) | (0.85) | (0.88) |
| Total distributions declared to shareholders | $— | $(0.97) | $(1.14) | $(2.18) | $(1.05) | $(1.23) |
| Net asset value, end of period (x) | $33.23 | $30.58 | $26.28 | $27.96 | $31.62 | $23.65 |
| Total return (%) (r)(s)(t)(x) | 8.67(n) | 20.32 | (1.74) | (5.52) | 38.67 | 6.24 |
| Ratios (%) (to average net assets) and Supplemental data: | ||||||
| Expenses before expense reductions (h) | 0.12(a) | 0.13 | 0.14 | 0.14 | 0.15 | 0.16 |
| Expenses after expense reductions (h) | N/A | N/A | 0.13 | 0.13 | 0.13 | 0.13 |
| Net investment income (loss) (l) | 0.23(a) | 1.34 | 1.95 | 3.22 | 0.78 | 1.46 |
| Portfolio turnover rate | 3(n) | 4 | 4 | 13 | 7 | 6 |
| Net assets at end of period (000 omitted) | $269,505 | $266,362 | $238,896 | $240,621 | $241,144 | $178,491 |
| Six months ended | Year ended | |||||
| Class R1 | 11/30/24 (unaudited) | 5/31/24 | 5/31/23 | 5/31/22 | 5/31/21 | 5/31/20 |
| Net asset value, beginning of period | $28.33 | $24.44 | $26.07 | $29.60 | $22.25 | $22.00 |
| Income (loss) from investment operations | ||||||
| Net investment income (loss) (d)(l) | $(0.11) | $0.10 | $0.27 | $0.69 | $(0.06) | $0.09 |
| Net realized and unrealized gain (loss) | 2.42 | 4.51 | (1.01) | (2.37) | 8.26 | 1.13 |
| Total from investment operations | $2.31 | $4.61 | $(0.74) | $(1.68) | $8.20 | $1.22 |
| Less distributions declared to shareholders | ||||||
| From net investment income | $— | $(0.09) | $(0.26) | $(0.69) | $— | $(0.09) |
| From net realized gain | — | (0.63) | (0.63) | (1.16) | (0.85) | (0.88) |
| Total distributions declared to shareholders | $— | $(0.72) | $(0.89) | $(1.85) | $(0.85) | $(0.97) |
| Net asset value, end of period (x) | $30.64 | $28.33 | $24.44 | $26.07 | $29.60 | $22.25 |
| Total return (%) (r)(s)(t)(x) | 8.15(n) | 19.08 | (2.70) | (6.46) | 37.28 | 5.21 |
| Ratios (%) (to average net assets) and Supplemental data: | ||||||
| Expenses before expense reductions (h) | 1.12(a) | 1.13 | 1.14 | 1.14 | 1.14 | 1.16 |
| Expenses after expense reductions (h) | N/A | N/A | 1.13 | 1.13 | 1.13 | 1.13 |
| Net investment income (loss) (l) | (0.76)(a) | 0.37 | 1.12 | 2.34 | (0.24) | 0.40 |
| Portfolio turnover rate | 3(n) | 4 | 4 | 13 | 7 | 6 |
| Net assets at end of period (000 omitted) | $11,448 | $14,166 | $12,269 | $15,536 | $18,496 | $14,484 |
| Six months ended | Year ended | |||||
| Class R2 | 11/30/24 (unaudited) | 5/31/24 | 5/31/23 | 5/31/22 | 5/31/21 | 5/31/20 |
| Net asset value, beginning of period | $29.12 | $25.08 | $26.71 | $30.30 | $22.71 | $22.44 |
| Income (loss) from investment operations | ||||||
| Net investment income (loss) (d)(l) | $(0.04) | $0.23 | $0.36 | $0.83 | $0.07 | $0.21 |
| Net realized and unrealized gain (loss) | 2.49 | 4.64 | (0.99) | (2.40) | 8.44 | 1.16 |
| Total from investment operations | $2.45 | $4.87 | $(0.63) | $(1.57) | $8.51 | $1.37 |
| Less distributions declared to shareholders | ||||||
| From net investment income | $— | $(0.20) | $(0.37) | $(0.86) | $(0.07) | $(0.22) |
| From net realized gain | — | (0.63) | (0.63) | (1.16) | (0.85) | (0.88) |
| Total distributions declared to shareholders | $— | $(0.83) | $(1.00) | $(2.02) | $(0.92) | $(1.10) |
| Net asset value, end of period (x) | $31.57 | $29.12 | $25.08 | $26.71 | $30.30 | $22.71 |
| Total return (%) (r)(s)(t)(x) | 8.41(n) | 19.66 | (2.19) | (6.01) | 37.93 | 5.73 |
| Ratios (%) (to average net assets) and Supplemental data: | ||||||
| Expenses before expense reductions (h) | 0.62(a) | 0.63 | 0.64 | 0.64 | 0.65 | 0.66 |
| Expenses after expense reductions (h) | N/A | N/A | 0.63 | 0.63 | 0.63 | 0.63 |
| Net investment income (loss) (l) | (0.27)(a) | 0.84 | 1.45 | 2.76 | 0.27 | 0.91 |
| Portfolio turnover rate | 3(n) | 4 | 4 | 13 | 7 | 6 |
| Net assets at end of period (000 omitted) | $50,996 | $50,476 | $49,019 | $55,975 | $65,485 | $55,453 |
| Six months ended | Year ended | |||||
| Class R3 | 11/30/24 (unaudited) | 5/31/24 | 5/31/23 | 5/31/22 | 5/31/21 | 5/31/20 |
| Net asset value, beginning of period | $29.63 | $25.50 | $27.15 | $30.76 | $23.04 | $22.75 |
| Income (loss) from investment operations | ||||||
| Net investment income (loss) (d)(l) | $(0.00)(w) | $0.30 | $0.44 | $0.91 | $0.15 | $0.29 |
| Net realized and unrealized gain (loss) | 2.53 | 4.73 | (1.02) | (2.43) | 8.56 | 1.17 |
| Total from investment operations | $2.53 | $5.03 | $(0.58) | $(1.52) | $8.71 | $1.46 |
| Less distributions declared to shareholders | ||||||
| From net investment income | $— | $(0.27) | $(0.44) | $(0.93) | $(0.14) | $(0.29) |
| From net realized gain | — | (0.63) | (0.63) | (1.16) | (0.85) | (0.88) |
| Total distributions declared to shareholders | $— | $(0.90) | $(1.07) | $(2.09) | $(0.99) | $(1.17) |
| Net asset value, end of period (x) | $32.16 | $29.63 | $25.50 | $27.15 | $30.76 | $23.04 |
| Total return (%) (r)(s)(t)(x) | 8.54(n) | 19.98 | (1.98) | (5.75) | 38.28 | 6.00 |
| Ratios (%) (to average net assets) and Supplemental data: | ||||||
| Expenses before expense reductions (h) | 0.37(a) | 0.38 | 0.39 | 0.39 | 0.40 | 0.41 |
| Expenses after expense reductions (h) | N/A | N/A | 0.38 | 0.38 | 0.38 | 0.38 |
| Net investment income (loss) (l) | (0.01)(a) | 1.08 | 1.71 | 3.00 | 0.54 | 1.20 |
| Portfolio turnover rate | 3(n) | 4 | 4 | 13 | 7 | 6 |
| Net assets at end of period (000 omitted) | $82,190 | $83,257 | $77,815 | $91,223 | $105,120 | $87,315 |
| Six months ended | Year ended | |||||
| Class R4 | 11/30/24 (unaudited) | 5/31/24 | 5/31/23 | 5/31/22 | 5/31/21 | 5/31/20 |
| Net asset value, beginning of period | $30.05 | $25.85 | $27.52 | $31.15 | $23.32 | $23.01 |
| Income (loss) from investment operations | ||||||
| Net investment income (loss) (d)(l) | $0.04 | $0.37 | $0.52 | $1.02 | $0.21 | $0.34 |
| Net realized and unrealized gain (loss) | 2.57 | 4.80 | (1.05) | (2.47) | 8.67 | 1.20 |
| Total from investment operations | $2.61 | $5.17 | $(0.53) | $(1.45) | $8.88 | $1.54 |
| Less distributions declared to shareholders | ||||||
| From net investment income | $— | $(0.34) | $(0.51) | $(1.02) | $(0.20) | $(0.35) |
| From net realized gain | — | (0.63) | (0.63) | (1.16) | (0.85) | (0.88) |
| Total distributions declared to shareholders | $— | $(0.97) | $(1.14) | $(2.18) | $(1.05) | $(1.23) |
| Net asset value, end of period (x) | $32.66 | $30.05 | $25.85 | $27.52 | $31.15 | $23.32 |
| Total return (%) (r)(s)(t)(x) | 8.69(n) | 20.26 | (1.73) | (5.51) | 38.61 | 6.29 |
| Ratios (%) (to average net assets) and Supplemental data: | ||||||
| Expenses before expense reductions (h) | 0.12(a) | 0.13 | 0.14 | 0.14 | 0.15 | 0.16 |
| Expenses after expense reductions (h) | N/A | N/A | 0.13 | 0.13 | 0.13 | 0.13 |
| Net investment income (loss) (l) | 0.23(a) | 1.34 | 2.00 | 3.31 | 0.77 | 1.44 |
| Portfolio turnover rate | 3(n) | 4 | 4 | 13 | 7 | 6 |
| Net assets at end of period (000 omitted) | $154,433 | $151,061 | $167,605 | $183,201 | $200,635 | $137,680 |
| Six months ended | Year ended | |||
| Class R6 | 11/30/24 (unaudited) | 5/31/24 | 5/31/23 | 5/31/22(i) |
| Net asset value, beginning of period | $30.58 | $26.29 | $27.97 | $32.28 |
| Income (loss) from investment operations | ||||
| Net investment income (loss) (d)(l) | $0.05 | $0.40 | $0.53 | $0.01 |
| Net realized and unrealized gain (loss) | 2.62 | 4.88 | (1.04) | (2.12) |
| Total from investment operations | $2.67 | $5.28 | $(0.51) | $(2.11) |
| Less distributions declared to shareholders | ||||
| From net investment income | $— | $(0.36) | $(0.54) | $(1.04) |
| From net realized gain | — | (0.63) | (0.63) | (1.16) |
| Total distributions declared to shareholders | $— | $(0.99) | $(1.17) | $(2.20) |
| Net asset value, end of period (x) | $33.25 | $30.58 | $26.29 | $27.97 |
| Total return (%) (r)(s)(t)(x) | 8.73(n) | 20.37 | (1.64) | (7.35)(n) |
| Ratios (%) (to average net assets) and Supplemental data: | ||||
| Expenses before expense reductions (h) | 0.04(a) | 0.05 | 0.05 | 0.08(a) |
| Expenses after expense reductions (h) | N/A | N/A | 0.04 | 0.05(a) |
| Net investment income (loss) (l) | 0.31(a) | 1.42 | 2.03 | 0.05(a) |
| Portfolio turnover rate | 3(n) | 4 | 4 | 13 |
| Net assets at end of period (000 omitted) | $340,519 | $311,437 | $214,147 | $186,590 |
| (a) | Annualized. |
| (d) | Per share data is based on average shares outstanding. |
| (h) | In addition to the fees and expenses which the fund bears directly, the fund indirectly bears a pro rata share of the fees and expenses of the underlying affiliated funds in which the fund invests. Accordingly, the expense ratio for the fund reflects only those fees and expenses borne directly by the fund. Because the underlying affiliated funds have varied expense and fee levels and the fund may own different proportions of the underlying affiliated funds at different times, the amount of fees and expenses incurred indirectly by the fund will vary. |
| (i) | For Class R6, the period is from the class inception, September 30, 2021, through the stated period end. |
| (l) | Recognition of net investment income by the fund may be affected by the timing of the declaration of dividends by the underlying affiliated funds in which the fund invests and for interim net investment income ratios, the actual annual net investment income ratio may differ. The ratios and per share amounts do not include net investment income of the underlying affiliated funds in which the fund invests. |
| (n) | Not annualized. |
| (r) | Certain expenses have been reduced without which performance would have been lower. |
| (s) | From time to time the fund may receive proceeds from litigation settlements, without which performance would be lower. |
| (t) | Total returns do not include any applicable sales charges. |
| (w) | Per share amount was less than $0.01. |
| (x) | The net asset values and total returns have been calculated on net assets which include adjustments made in accordance with U.S. generally accepted accounting principles required at period end for financial reporting purposes. |
| Level 1 | Level 2 | Level 3 | Total | |
| MFS Conservative Allocation Fund | ||||
| Financial Instruments | ||||
| Mutual Funds | $3,352,180,781 | $458,014,091 | $— | $3,810,194,872 |
| MFS Moderate Allocation Fund | ||||
| Financial Instruments | ||||
| Mutual Funds | $5,444,082,953 | $1,362,957,378 | $— | $6,807,040,331 |
| MFS Growth Allocation Fund | ||||
| Financial Instruments | ||||
| Mutual Funds | $4,819,667,420 | $1,972,715,563 | $— | $6,792,382,983 |
| MFS Aggressive Growth Allocation Fund | ||||
| Financial Instruments | ||||
| Mutual Funds | $1,765,402,473 | $1,175,484,338 | $— | $2,940,886,811 |
| Year ended 5/31/24 | MFS Conservative Allocation Fund | MFS Moderate Allocation Fund | MFS Growth Allocation Fund | MFS Aggressive Growth Allocation Fund |
| Ordinary income (including any short-term capital gains) | $102,180,742 | $148,678,366 | $102,505,563 | $25,002,015 |
| Long-term capital gains | 26,564,186 | 113,021,482 | 121,237,556 | 58,269,528 |
| Total distributions | $128,744,928 | $261,699,848 | $223,743,119 | $83,271,543 |
| As of 11/30/24 | MFS Conservative Allocation Fund | MFS Moderate Allocation Fund | MFS Growth Allocation Fund | MFS Aggressive Growth Allocation Fund |
| Cost of investments | $3,156,915,430 | $4,809,918,281 | $4,012,231,735 | $1,529,724,362 |
| Gross appreciation | 806,031,979 | 2,269,734,385 | 2,906,359,265 | 1,426,380,962 |
| Gross depreciation | (152,752,537) | (272,612,335) | (126,208,017) | (15,218,513) |
| Net unrealized appreciation (depreciation) | $653,279,442 | $1,997,122,050 | $2,780,151,248 | $1,411,162,449 |
| As of 5/31/24 | ||||
| Undistributed ordinary income | 22,623,806 | 29,241,390 | 33,460,548 | 5,398,790 |
| Undistributed long-term capital gain | 98,187,535 | 190,993,238 | 169,672,519 | 75,256,786 |
| Net unrealized appreciation (depreciation) | 535,138,121 | 1,735,826,911 | 2,418,775,352 | 1,212,834,530 |
| MFS Conservative Allocation Fund | MFS Moderate Allocation Fund | MFS Growth Allocation Fund | MFS Aggressive Growth Allocation Fund | ||||||||||||
| Six Months Ended 11/30/24 | Year Ended 5/31/24 | Six Months Ended 11/30/24 | Year Ended 5/31/24 | Six Months Ended 11/30/24 | Year Ended 5/31/24 | Six Months Ended 11/30/24 | Year Ended 5/31/24 | ||||||||
| Class A | $33,761,906 | $89,871,853 | $44,690,256 | $197,640,422 | $— | $162,775,358 | $— | $49,468,948 | |||||||
| Class B | 78,178 | 369,042 | 112,808 | 1,122,384 | — | 1,001,438 | — | 413,740 | |||||||
| Class C | 1,988,511 | 6,885,359 | 1,762,327 | 12,688,690 | — | 11,280,328 | — | 5,924,888 | |||||||
| Class I | 5,265,004 | 14,162,367 | 4,114,105 | 17,769,328 | — | 16,117,657 | — | 8,677,074 | |||||||
| Class R1 | 84,500 | 279,109 | 103,280 | 710,602 | — | 504,043 | — | 368,981 | |||||||
| Class R2 | 437,986 | 1,308,350 | 643,938 | 3,492,144 | — | 3,529,778 | — | 1,508,730 | |||||||
| Class R3 | 846,514 | 2,421,813 | 1,317,585 | 6,389,272 | — | 3,992,894 | — | 2,573,233 | |||||||
| Class R4 | 3,785,835 | 9,900,754 | 2,292,446 | 10,245,145 | — | 11,096,068 | — | 5,353,798 | |||||||
| Class R6 | 1,559,654 | 3,546,281 | 3,264,253 | 11,641,861 | — | 13,445,555 | — | 8,982,151 | |||||||
| Total | $47,808,088 | $128,744,928 | $58,300,998 | $261,699,848 | $— | $223,743,119 | $— | $83,271,543 | |||||||
| MFS Conservative Allocation Fund | MFS Moderate Allocation Fund | MFS Growth Allocation Fund | MFS Aggressive Growth Allocation Fund | |
| Class A | 0.10% | 0.10% | 0.10% | 0.13% |
| Class B | 0.10% | 0.10% | 0.10% | 0.13% |
| Class C | 0.10% | 0.10% | 0.10% | 0.13% |
| Class I | 0.10% | 0.10% | 0.10% | 0.13% |
| Class R1 | 0.10% | 0.10% | 0.10% | 0.13% |
| Class R2 | 0.10% | 0.10% | 0.10% | 0.13% |
| Class R3 | 0.10% | 0.10% | 0.10% | 0.13% |
| Class R4 | 0.10% | 0.10% | 0.10% | 0.13% |
| Class R6 | 0.03% | 0.02% | 0.02% | 0.05% |
| MFS Conservative Allocation Fund | MFS Moderate Allocation Fund | MFS Growth Allocation Fund | MFS Aggressive Growth Allocation Fund |
| $80,890 | $194,535 | $338,587 | $183,226 |
| Class A | |||||
| Distribution Fee Rate (d) | Service Fee Rate (d) | Total Distribution Plan (d) | Annual Effective Rate (e) | Distribution and Service Fee | |
| MFS Conservative Allocation Fund | — | 0.25% | 0.25% | 0.25% | $3,358,876 |
| MFS Moderate Allocation Fund | — | 0.25% | 0.25% | 0.25% | 6,425,794 |
| MFS Growth Allocation Fund | — | 0.25% | 0.25% | 0.25% | 6,123,976 |
| MFS Aggressive Growth Allocation Fund | — | 0.25% | 0.25% | 0.25% | 2,142,647 |
| Class B | |||||
| Distribution Fee Rate (d) | Service Fee Rate (d) | Total Distribution Plan (d) | Annual Effective Rate (e) | Distribution and Service Fee | |
| MFS Conservative Allocation Fund | 0.75% | 0.25% | 1.00% | 1.00% | $47,157 |
| MFS Moderate Allocation Fund | 0.75% | 0.25% | 1.00% | 1.00% | 122,395 |
| MFS Growth Allocation Fund | 0.75% | 0.25% | 1.00% | 1.00% | 147,926 |
| MFS Aggressive Growth Allocation Fund | 0.75% | 0.25% | 1.00% | 1.00% | 72,005 |
| Class C | |||||
| Distribution Fee Rate (d) | Service Fee Rate (d) | Total Distribution Plan (d) | Annual Effective Rate (e) | Distribution and Service Fee | |
| MFS Conservative Allocation Fund | 0.75% | 0.25% | 1.00% | 1.00% | $1,115,868 |
| MFS Moderate Allocation Fund | 0.75% | 0.25% | 1.00% | 1.00% | 1,741,536 |
| MFS Growth Allocation Fund | 0.75% | 0.25% | 1.00% | 1.00% | 1,901,252 |
| MFS Aggressive Growth Allocation Fund | 0.75% | 0.25% | 1.00% | 1.00% | 1,204,016 |
| Class R1 | |||||
| Distribution Fee Rate (d) | Service Fee Rate (d) | Total Distribution Plan (d) | Annual Effective Rate (e) | Distribution and Service Fee | |
| MFS Conservative Allocation Fund | 0.75% | 0.25% | 1.00% | 1.00% | $44,704 |
| MFS Moderate Allocation Fund | 0.75% | 0.25% | 1.00% | 1.00% | 92,943 |
| MFS Growth Allocation Fund | 0.75% | 0.25% | 1.00% | 1.00% | 83,577 |
| MFS Aggressive Growth Allocation Fund | 0.75% | 0.25% | 1.00% | 1.00% | 70,784 |
| Class R2 | |||||
| Distribution Fee Rate (d) | Service Fee Rate (d) | Total Distribution Plan (d) | Annual Effective Rate (e) | Distribution and Service Fee | |
| MFS Conservative Allocation Fund | 0.25% | 0.25% | 0.50% | 0.50% | $91,212 |
| MFS Moderate Allocation Fund | 0.25% | 0.25% | 0.50% | 0.50% | 210,146 |
| MFS Growth Allocation Fund | 0.25% | 0.25% | 0.50% | 0.50% | 248,860 |
| MFS Aggressive Growth Allocation Fund | 0.25% | 0.25% | 0.50% | 0.50% | 124,810 |
| Class R3 | |||||
| Distribution Fee Rate (d) | Service Fee Rate (d) | Total Distribution Plan (d) | Annual Effective Rate (e) | Distribution and Service Fee | |
| MFS Conservative Allocation Fund | — | 0.25% | 0.25% | 0.25% | $82,641 |
| MFS Moderate Allocation Fund | — | 0.25% | 0.25% | 0.25% | 187,922 |
| MFS Growth Allocation Fund | — | 0.25% | 0.25% | 0.25% | 140,812 |
| MFS Aggressive Growth Allocation Fund | — | 0.25% | 0.25% | 0.25% | 103,010 |
| MFS Conservative Allocation Fund | MFS Moderate Allocation Fund | MFS Growth Allocation Fund | MFS Aggressive Growth Allocation Fund | |
| Total Distribution and Service Fees | $4,740,458 | $8,780,736 | $8,646,403 | $3,717,272 |
| (d) | In accordance with the distribution plan for certain classes, each fund pays distribution and/or service fees equal to these annual percentage rates of each class’s average daily net assets. The distribution and service fee rates disclosed by class represent the current rates in effect at the end of the reporting period. Any rate changes, if applicable, are detailed below. |
| (e) | The annual effective rates represent actual fees incurred under the distribution plan for the six months ended November 30, 2024 based on each class's average daily net assets. MFD has voluntarily agreed to rebate a portion of each class’s 0.25% service fee attributable to accounts for which there is no financial intermediary specified on the account except for accounts attributable to MFS or its affiliates’ seed money. For the six months ended November 30, 2024, these rebates amounted to the following and are included in the reduction of total expenses in the Statements of Operations: |
| MFS Conservative Allocation Fund | MFS Moderate Allocation Fund | MFS Growth Allocation Fund | MFS Aggressive Growth Allocation Fund | |
| Class A | $274 | $170 | $539 | $544 |
| Class B | — | 2 | 3 | 1 |
| Class C | 5 | 14 | 97 | 38 |
| Class R2 | — | — | 2 | — |
| Class R3 | 1 | — | — | — |
| CDSC Imposed | MFS Conservative Allocation Fund | MFS Moderate Allocation Fund | MFS Growth Allocation Fund | MFS Aggressive Growth Allocation Fund |
| Class A | $47,022 | $86,088 | $37,067 | $23,994 |
| Class B | 3,638 | 3,037 | 2,135 | 1,310 |
| Class C | 6,226 | 17,936 | 27,264 | 20,478 |
| MFS Conservative Allocation Fund | MFS Moderate Allocation Fund | MFS Growth Allocation Fund | MFS Aggressive Growth Allocation Fund | |
| Expenses paid | $141,404 | $358,338 | $482,740 | $254,592 |
| Annual percentage of average daily net assets | 0.0074% | 0.0106% | 0.0145% | 0.0178% |
| MFS Conservative Allocation Fund | MFS Moderate Allocation Fund | MFS Growth Allocation Fund | MFS Aggressive Growth Allocation Fund |
| $1,221,930 | $2,321,406 | $2,446,267 | $1,110,155 |
| MFS Conservative Allocation Fund | MFS Moderate Allocation Fund | MFS Growth Allocation Fund | MFS Aggressive Growth Allocation Fund | |
| Percentage of average daily net assets | 0.0005% | 0.0003% | 0.0003% | 0.0006% |
| Fund | Date | Transaction | Class | Shares | Amount |
| MFS Conservative Allocation Fund | 8/19/2024 | Redemption | Class A | 3 | $51 |
| MFS Conservative Allocation Fund | 8/19/2024 | Redemption | Class B | 5 | 90 |
| MFS Conservative Allocation Fund | 8/19/2024 | Redemption | Class I | 4 | 67 |
| MFS Conservative Allocation Fund | 8/19/2024 | Redemption | Class R1 | 3 | 54 |
| MFS Conservative Allocation Fund | 8/19/2024 | Redemption | Class R2 | 4 | 59 |
| MFS Conservative Allocation Fund | 8/19/2024 | Redemption | Class R3 | 4 | 63 |
| MFS Conservative Allocation Fund | 8/19/2024 | Redemption | Class R4 | 2 | 29 |
| MFS Moderate Allocation Fund | 8/19/2024 | Redemption | Class A | 4 | 74 |
| MFS Moderate Allocation Fund | 8/19/2024 | Redemption | Class B | 5 | 110 |
| MFS Moderate Allocation Fund | 8/19/2024 | Redemption | Class I | 4 | 85 |
| Fund | Date | Transaction | Class | Shares | Amount |
| MFS Moderate Allocation Fund | 8/19/2024 | Redemption | Class R1 | 4 | 69 |
| MFS Moderate Allocation Fund | 8/19/2024 | Redemption | Class R2 | 4 | 74 |
| MFS Moderate Allocation Fund | 8/19/2024 | Redemption | Class R3 | 4 | 80 |
| MFS Moderate Allocation Fund | 8/19/2024 | Redemption | Class R4 | 2 | 36 |
| MFS Growth Allocation Fund | 8/19/2024 | Redemption | Class B | 5 | 132 |
| MFS Growth Allocation Fund | 8/19/2024 | Redemption | Class I | 4 | 106 |
| MFS Growth Allocation Fund | 8/19/2024 | Redemption | Class R1 | 4 | 85 |
| MFS Growth Allocation Fund | 8/19/2024 | Redemption | Class R2 | 4 | 89 |
| MFS Growth Allocation Fund | 8/19/2024 | Redemption | Class R3 | 4 | 100 |
| MFS Growth Allocation Fund | 8/19/2024 | Redemption | Class R4 | 2 | 45 |
| MFS Aggressive Growth Allocation Fund | 7/10/2024 | Redemption | Class B | 5 | 150 |
| MFS Aggressive Growth Allocation Fund | 7/10/2024 | Redemption | Class R4 | 2 | 51 |
| MFS Aggressive Growth Allocation Fund | 7/10/2024 | Redemption | Class R6 | 2 | 74 |
| MFS Aggressive Growth Allocation Fund | 8/19/2024 | Redemption | Class C | 4 | 120 |
| MFS Aggressive Growth Allocation Fund | 8/19/2024 | Redemption | Class I | 4 | 120 |
| MFS Aggressive Growth Allocation Fund | 8/19/2024 | Redemption | Class R1 | 3 | 97 |
| MFS Aggressive Growth Allocation Fund | 8/19/2024 | Redemption | Class R2 | 3 | 100 |
| MFS Aggressive Growth Allocation Fund | 8/19/2024 | Redemption | Class R3 | 4 | 113 |
| MFS Conservative Allocation Fund | MFS Moderate Allocation Fund | MFS Growth Allocation Fund | MFS Aggressive Growth Allocation Fund | |
| Purchases | $67,969,471 | $125,509,472 | $131,900,539 | $71,978,081 |
| Sales | $227,727,261 | $403,511,072 | $399,472,824 | $165,391,070 |
| MFS Conservative Allocation Fund | MFS Moderate Allocation Fund | ||||||||||
| Six Months Ended 11/30/24 | Year ended 5/31/24 | Six Months Ended 11/30/24 | Year ended 5/31/24 | ||||||||
| Shares | Amount | Shares | Amount | Shares | Amount | Shares | Amount | ||||
| Shares sold | |||||||||||
| Class A | 12,606,701 | $ 216,612,008 | 28,653,866 | $ 461,680,881 | 15,145,394 | $ 307,918,357 | 38,488,685 | $ 724,945,243 | |||
| Class B | 1,134 | 19,434 | 2,036 | 32,968 | 9,113 | 185,856 | 14,892 | 275,072 | |||
| Class C | 488,434 | 8,214,012 | 1,128,987 | 17,891,623 | 797,176 | 15,801,812 | 2,174,910 | 40,030,031 | |||
| Class I | 1,668,087 | 28,849,244 | 4,434,001 | 72,449,069 | 2,176,455 | 45,187,436 | 4,201,975 | 80,574,077 | |||
| Class R1 | 38,875 | 639,860 | 102,856 | 1,591,718 | 38,230 | 735,895 | 101,321 | 1,806,636 | |||
| Class R2 | 139,832 | 2,321,580 | 421,430 | 6,609,935 | 179,443 | 3,538,936 | 711,023 | 13,035,650 | |||
| Class R3 | 186,700 | 3,161,320 | 658,105 | 10,520,309 | 360,765 | 7,251,896 | 1,437,785 | 26,924,426 | |||
| Class R4 | 618,258 | 10,597,971 | 5,211,089 | 84,854,054 | 873,543 | 17,670,421 | 2,469,665 | 46,364,103 | |||
| Class R6 | 1,581,430 | 27,247,451 | 2,388,355 | 38,891,841 | 1,941,709 | 39,887,893 | 4,260,214 | 81,413,430 | |||
| 17,329,451 | $297,662,880 | 43,000,725 | $694,522,398 | 21,521,828 | $438,178,502 | 53,860,470 | $1,015,368,668 | ||||
| MFS Conservative Allocation Fund − continued | MFS Moderate Allocation Fund − continued | ||||||||||
| Six Months Ended 11/30/24 | Year ended 5/31/24 | Six Months Ended 11/30/24 | Year ended 5/31/24 | ||||||||
| Shares | Amount | Shares | Amount | Shares | Amount | Shares | Amount | ||||
| Shares issued to shareholders in reinvestment of distributions | |||||||||||
| Class A | 1,901,327 | $ 32,642,791 | 5,374,506 | $ 87,057,068 | 2,142,803 | $ 43,599,484 | 10,184,600 | $ 192,561,050 | |||
| Class B | 4,564 | 78,178 | 22,710 | 367,106 | 5,603 | 112,808 | 59,873 | 1,119,215 | |||
| Class C | 113,749 | 1,921,250 | 415,839 | 6,634,590 | 86,239 | 1,716,286 | 665,898 | 12,317,379 | |||
| Class I | 260,073 | 4,514,202 | 745,225 | 12,198,560 | 160,420 | 3,324,125 | 718,212 | 13,813,624 | |||
| Class R1 | 5,132 | 84,500 | 17,940 | 279,109 | 5,348 | 103,280 | 39,539 | 710,602 | |||
| Class R2 | 26,439 | 437,964 | 83,535 | 1,307,566 | 32,465 | 642,407 | 189,172 | 3,479,935 | |||
| Class R3 | 49,429 | 839,833 | 151,137 | 2,421,813 | 65,474 | 1,317,585 | 341,416 | 6,389,272 | |||
| Class R4 | 199,760 | 3,429,534 | 541,186 | 8,766,990 | 86,794 | 1,762,256 | 420,047 | 7,922,869 | |||
| Class R6 | 87,998 | 1,528,442 | 214,240 | 3,508,220 | 157,261 | 3,257,989 | 604,281 | 11,627,315 | |||
| 2,648,471 | $45,476,694 | 7,566,318 | $122,541,022 | 2,742,407 | $55,836,220 | 13,223,038 | $249,941,261 | ||||
| Shares reacquired | |||||||||||
| Class A | (17,314,231) | $(297,091,911) | (42,165,659) | $ (679,410,705) | (22,814,627) | $(463,231,579) | (52,035,061) | $ (979,416,954) | |||
| Class B | (183,047) | (3,134,367) | (489,767) | (7,889,942) | (346,926) | (6,960,515) | (1,122,715) | (20,845,372) | |||
| Class C | (2,233,896) | (37,666,192) | (5,810,667) | (91,987,897) | (3,014,309) | (59,805,610) | (7,146,592) | (131,304,365) | |||
| Class I | (3,560,933) | (61,628,232) | (7,368,608) | (120,195,504) | (4,171,456) | (86,174,304) | (6,498,734) | (124,568,446) | |||
| Class R1 | (68,512) | (1,125,513) | (229,590) | (3,555,455) | (236,889) | (4,608,220) | (361,813) | (6,435,169) | |||
| Class R2 | (542,204) | (8,934,971) | (837,330) | (13,024,028) | (563,714) | (11,055,963) | (1,761,251) | (32,303,718) | |||
| Class R3 | (586,599) | (9,918,547) | (1,686,619) | (26,858,947) | (1,520,633) | (30,461,026) | (2,811,459) | (52,336,764) | |||
| Class R4 | (1,926,793) | (32,917,931) | (7,045,576) | (114,018,186) | (1,946,089) | (39,635,454) | (5,084,608) | (95,256,133) | |||
| Class R6 | (980,110) | (16,943,128) | (1,888,179) | (30,865,763) | (1,441,435) | (29,808,498) | (2,375,075) | (45,654,790) | |||
| (27,396,325) | $(469,360,792) | (67,521,995) | $(1,087,806,427) | (36,056,078) | $(731,741,169) | (79,197,308) | $(1,488,121,711) | ||||
| Net change | |||||||||||
| Class A | (2,806,203) | $ (47,837,112) | (8,137,287) | $ (130,672,756) | (5,526,430) | $(111,713,738) | (3,361,776) | $ (61,910,661) | |||
| Class B | (177,349) | (3,036,755) | (465,021) | (7,489,868) | (332,210) | (6,661,851) | (1,047,950) | (19,451,085) | |||
| Class C | (1,631,713) | (27,530,930) | (4,265,841) | (67,461,684) | (2,130,894) | (42,287,512) | (4,305,784) | (78,956,955) | |||
| Class I | (1,632,773) | (28,264,786) | (2,189,382) | (35,547,875) | (1,834,581) | (37,662,743) | (1,578,547) | (30,180,745) | |||
| Class R1 | (24,505) | (401,153) | (108,794) | (1,684,628) | (193,311) | (3,769,045) | (220,953) | (3,917,931) | |||
| Class R2 | (375,933) | (6,175,427) | (332,365) | (5,106,527) | (351,806) | (6,874,620) | (861,056) | (15,788,133) | |||
| Class R3 | (350,470) | (5,917,394) | (877,377) | (13,916,825) | (1,094,394) | (21,891,545) | (1,032,258) | (19,023,066) | |||
| Class R4 | (1,108,775) | (18,890,426) | (1,293,301) | (20,397,142) | (985,752) | (20,202,777) | (2,194,896) | (40,969,161) | |||
| Class R6 | 689,318 | 11,832,765 | 714,416 | 11,534,298 | 657,535 | 13,337,384 | 2,489,420 | 47,385,955 | |||
| (7,418,403) | $(126,221,218) | (16,954,952) | $(270,743,007) | (11,791,843) | $(237,726,447) | (12,113,800) | $(222,811,782) | ||||
| MFS Growth Allocation Fund | MFS Aggressive Growth Allocation Fund | ||||||||||
| Six Months Ended 11/30/24 | Year ended 5/31/24 | Six Months Ended 11/30/24 | Year ended 5/31/24 | ||||||||
| Shares | Amount | Shares | Amount | Shares | Amount | Shares | Amount | ||||
| Shares sold | |||||||||||
| Class A | 10,753,979 | $ 272,323,229 | 26,373,321 | $ 607,598,304 | 3,477,124 | $ 107,842,407 | 8,337,637 | $ 231,956,156 | |||
| Class B | 1,208 | 31,032 | 13,033 | 298,444 | 1,000 | 30,691 | 5,592 | 155,166 | |||
| Class C | 772,028 | 19,114,052 | 2,228,222 | 50,213,389 | 592,026 | 17,689,066 | 1,501,745 | 40,371,819 | |||
| Class I | 1,415,557 | 36,397,293 | 3,323,201 | 77,611,965 | 756,728 | 23,916,170 | 2,347,008 | 65,619,427 | |||
| Class R1 | 31,739 | 760,843 | 78,399 | 1,712,219 | 21,516 | 628,407 | 55,524 | 1,449,531 | |||
| Class R2 | 147,658 | 3,624,495 | 472,409 | 10,538,293 | 93,059 | 2,820,590 | 267,583 | 7,235,169 | |||
| Class R3 | 179,779 | 4,511,880 | 758,566 | 17,401,361 | 148,429 | 4,561,060 | 499,068 | 13,772,733 | |||
| Class R4 | 646,022 | 16,231,561 | 1,693,765 | 38,911,275 | 349,633 | 10,908,647 | 1,202,455 | 33,650,536 | |||
| Class R6 | 2,238,185 | 57,443,854 | 6,378,653 | 148,826,066 | 1,072,515 | 33,824,145 | 2,764,571 | 78,389,580 | |||
| 16,186,155 | $410,438,239 | 41,319,569 | $953,111,316 | 6,512,030 | $202,221,183 | 16,981,183 | $472,600,117 | ||||
| MFS Growth Allocation Fund − continued | MFS Aggressive Growth Allocation Fund − continued | ||||||||||
| Six Months Ended 11/30/24 | Year ended 5/31/24 | Six Months Ended 11/30/24 | Year ended 5/31/24 | ||||||||
| Shares | Amount | Shares | Amount | Shares | Amount | Shares | Amount | ||||
| Shares issued to shareholders in reinvestment of distributions | |||||||||||
| Class A | — | $ — | 6,895,731 | $ 159,566,952 | — | $ — | 1,731,313 | $ 48,338,271 | |||
| Class B | — | — | 42,943 | 995,840 | — | — | 14,971 | 413,044 | |||
| Class C | — | — | 489,783 | 11,122,968 | — | — | 215,414 | 5,829,111 | |||
| Class I | — | — | 625,767 | 14,655,458 | — | — | 262,919 | 7,501,074 | |||
| Class R1 | — | — | 22,859 | 504,043 | — | — | 13,903 | 368,981 | |||
| Class R2 | — | — | 156,620 | 3,525,506 | — | — | 55,407 | 1,508,730 | |||
| Class R3 | — | — | 174,362 | 3,992,894 | — | — | 92,997 | 2,573,233 | |||
| Class R4 | — | — | 396,749 | 9,168,874 | — | — | 164,820 | 4,621,554 | |||
| Class R6 | — | — | 572,494 | 13,413,543 | — | — | 314,237 | 8,962,035 | |||
| — | $— | 9,377,308 | $216,946,078 | — | $— | 2,865,981 | $80,116,033 | ||||
| Shares reacquired | |||||||||||
| Class A | (15,627,545) | $(395,897,567) | (34,701,688) | $ (800,188,597) | (4,448,368) | $(137,976,765) | (9,763,709) | $ (271,168,271) | |||
| Class B | (285,156) | (7,237,144) | (896,653) | (20,633,952) | (110,961) | (3,403,011) | (280,825) | (7,686,617) | |||
| Class C | (2,127,840) | (52,699,662) | (5,449,297) | (122,951,706) | (974,036) | (29,128,947) | (2,221,331) | (59,884,198) | |||
| Class I | (2,704,163) | (69,445,109) | (7,218,417) | (169,596,270) | (1,358,413) | (43,281,240) | (2,987,100) | (85,039,076) | |||
| Class R1 | (114,189) | (2,804,949) | (199,314) | (4,359,554) | (147,874) | (4,411,938) | (71,429) | (1,896,741) | |||
| Class R2 | (494,588) | (12,067,199) | (1,492,343) | (33,162,251) | (211,095) | (6,347,442) | (544,505) | (14,786,730) | |||
| Class R3 | (603,770) | (15,072,522) | (1,572,046) | (35,662,874) | (402,939) | (12,422,094) | (833,881) | (22,948,365) | |||
| Class R4 | (2,228,489) | (56,827,707) | (5,002,019) | (114,090,971) | (648,130) | (20,372,402) | (2,824,746) | (78,452,912) | |||
| Class R6 | (2,551,129) | (66,034,806) | (1,457,895) | (34,248,851) | (1,015,594) | (32,184,051) | (1,040,500) | (29,714,540) | |||
| (26,736,869) | $(678,086,665) | (57,989,672) | $(1,334,895,026) | (9,317,410) | $(289,527,890) | (20,568,026) | $(571,577,450) | ||||
| Net change | |||||||||||
| Class A | (4,873,566) | $(123,574,338) | (1,432,636) | $ (33,023,341) | (971,244) | $ (30,134,358) | 305,241 | $ 9,126,156 | |||
| Class B | (283,948) | (7,206,112) | (840,677) | (19,339,668) | (109,961) | (3,372,320) | (260,262) | (7,118,407) | |||
| Class C | (1,355,812) | (33,585,610) | (2,731,292) | (61,615,349) | (382,010) | (11,439,881) | (504,172) | (13,683,268) | |||
| Class I | (1,288,606) | (33,047,816) | (3,269,449) | (77,328,847) | (601,685) | (19,365,070) | (377,173) | (11,918,575) | |||
| Class R1 | (82,450) | (2,044,106) | (98,056) | (2,143,292) | (126,358) | (3,783,531) | (2,002) | (78,229) | |||
| Class R2 | (346,930) | (8,442,704) | (863,314) | (19,098,452) | (118,036) | (3,526,852) | (221,515) | (6,042,831) | |||
| Class R3 | (423,991) | (10,560,642) | (639,118) | (14,268,619) | (254,510) | (7,861,034) | (241,816) | (6,602,399) | |||
| Class R4 | (1,582,467) | (40,596,146) | (2,911,505) | (66,010,822) | (298,497) | (9,463,755) | (1,457,471) | (40,180,822) | |||
| Class R6 | (312,944) | (8,590,952) | 5,493,252 | 127,990,758 | 56,921 | 1,640,094 | 2,038,308 | 57,637,075 | |||
| (10,550,714) | $(267,648,426) | (7,292,795) | $(164,837,632) | (2,805,380) | $(87,306,707) | (720,862) | $(18,861,300) | ||||
| MFS Conservative Allocation Fund | MFS Moderate Allocation Fund | MFS Growth Allocation Fund | MFS Aggressive Growth Allocation Fund | |
| Commitment Fee | $9,587 | $16,635 | $16,262 | $6,843 |
| Interest Expense | — | — | — | — |
| MFS Conservative Allocation Fund | ||||||
| Affiliated Issuers | Beginning Value | Purchases | Sales Proceeds | Realized Gain (Loss) | Change in Unrealized Appreciation or Depreciation | Ending Value |
| MFS Commodity Strategy Fund | $73,990,862 | $4,156,073 | $1,881,952 | $(550,817) | $258,782 | $75,972,948 |
| MFS Emerging Markets Debt Fund | 75,371,286 | 2,752,682 | 3,656,194 | (730,862) | 2,573,168 | 76,310,080 |
| MFS Emerging Markets Debt Local Currency Fund | 74,861,597 | 5,323,187 | 3,606,617 | (780,847) | 204,569 | 76,001,889 |
| MFS Global Opportunistic Bond Fund | 262,991,582 | 5,631,105 | 9,649,793 | (1,602,006) | 10,168,305 | 267,539,193 |
| MFS Global Real Estate Fund | 75,124,162 | 2,673,771 | 8,655,160 | 759,158 | 6,594,000 | 76,495,931 |
| MFS Government Securities Fund | 350,196,697 | 21,452,625 | 16,053,698 | (2,845,223) | 10,495,708 | 363,246,109 |
| MFS Growth Fund | 197,357,367 | 4,764,813 | 26,831,714 | 18,678,541 | 4,668,238 | 198,637,245 |
| MFS High Income Fund | 150,885,326 | 4,943,605 | 7,350,882 | (721,912) | 4,167,069 | 151,923,206 |
| MFS Inflation-Adjusted Bond Fund | 372,796,911 | 16,507,289 | 12,293,450 | (2,776,654) | 6,581,235 | 380,815,331 |
| MFS Institutional Money Market Portfolio | 112,019,102 | 61,658,030 | 80,076,110 | 1,877 | (1,529) | 93,601,370 |
| MFS International Growth Fund | 56,131,684 | 2,010,745 | 4,207,096 | 2,102,691 | 879,692 | 56,917,716 |
| MFS International Intrinsic Value Fund | 56,419,287 | 2,390,042 | 1,926,509 | 250,857 | 146,857 | 57,280,534 |
| MFS International Large Cap Value Fund | 56,626,723 | 1,984,221 | 2,540,891 | 156,143 | 1,037,968 | 57,264,164 |
| MFS Limited Maturity Fund | 376,334,575 | 8,853,316 | 11,527,725 | (532,779) | 6,373,703 | 379,501,090 |
| MFS Mid Cap Growth Fund | 147,334,621 | 1,312,945 | 16,334,576 | 12,042,083 | 8,695,297 | 153,050,370 |
| MFS Mid Cap Value Fund | 150,631,023 | 820,487 | 18,075,199 | 11,149,413 | 8,340,586 | 152,866,310 |
| MFS New Discovery Fund | 37,302,373 | 437,100 | 4,094,917 | 228,224 | 4,282,876 | 38,155,656 |
| MFS New Discovery Value Fund | 37,404,049 | 593,864 | 5,440,614 | 1,933,148 | 3,710,592 | 38,201,039 |
| MFS Research Fund | 196,638,720 | 1,403,770 | 22,189,994 | 12,882,046 | 10,938,337 | 199,672,879 |
| MFS Research International Fund | 132,087,128 | 5,773,378 | 4,704,355 | 1,650,076 | (1,304,920) | 133,501,307 |
| MFS Total Return Bond Fund | 538,861,608 | 25,135,706 | 25,426,608 | (4,699,902) | 20,401,911 | 554,272,715 |
| MFS Value Fund | 225,762,101 | 2,696,583 | 21,279,317 | 7,551,978 | 14,236,445 | 228,967,790 |
| $3,757,128,784 | $183,275,337 | $307,803,371 | $54,145,233 | $123,448,889 | $3,810,194,872 | |
| MFS Conservative Allocation Fund - continued | ||
| Affiliated Issuers | Dividend Income | Capital Gain Distributions |
| MFS Commodity Strategy Fund | $— | $— |
| MFS Emerging Markets Debt Fund | 2,718,457 | — |
| MFS Emerging Markets Debt Local Currency Fund | 2,186,052 | — |
| MFS Global Opportunistic Bond Fund | 4,315,139 | — |
| MFS Global Real Estate Fund | — | — |
| MFS Government Securities Fund | 7,351,559 | — |
| MFS Growth Fund | 293,998 | 171,408 |
| MFS High Income Fund | 4,913,919 | — |
| MFS Inflation-Adjusted Bond Fund | 9,094,261 | — |
| MFS Institutional Money Market Portfolio | 2,868,671 | — |
| MFS International Growth Fund | — | — |
| MFS International Intrinsic Value Fund | — | — |
| MFS International Large Cap Value Fund | — | — |
| MFS Limited Maturity Fund | 8,510,354 | — |
| MFS Mid Cap Growth Fund | — | — |
| MFS Mid Cap Value Fund | — | — |
| MFS New Discovery Fund | — | — |
| MFS New Discovery Value Fund | 170,299 | 69,975 |
| MFS Research Fund | — | — |
| MFS Research International Fund | — | — |
| MFS Total Return Bond Fund | 11,730,450 | — |
| MFS Value Fund | 2,121,964 | — |
| $56,275,123 | $241,383 | |
| MFS Moderate Allocation Fund | ||||||
| Affiliated Issuers | Beginning Value | Purchases | Sales Proceeds | Realized Gain (Loss) | Change in Unrealized Appreciation or Depreciation | Ending Value |
| MFS Commodity Strategy Fund | $197,572,781 | $9,828,900 | $2,609,061 | $(1,101,826) | $203,693 | $203,894,487 |
| MFS Emerging Markets Debt Fund | 199,368,840 | 7,254,957 | 7,741,750 | (1,726,748) | 6,591,610 | 203,746,909 |
| MFS Emerging Markets Debt Local Currency Fund | 130,041,251 | 9,623,810 | 3,204,756 | (1,473,429) | 330,520 | 135,317,396 |
| MFS Emerging Markets Equity Fund | 65,807,407 | 1,730,730 | 5,360,309 | (1,085,097) | 5,518,421 | 66,611,152 |
| MFS Global Opportunistic Bond Fund | 327,673,852 | 9,269,881 | 7,130,912 | (1,483,033) | 12,274,829 | 340,604,617 |
| MFS Global Real Estate Fund | 196,953,022 | 6,249,067 | 16,818,182 | 1,372,559 | 18,063,099 | 205,819,565 |
| MFS Government Securities Fund | 608,321,325 | 42,105,607 | 16,105,182 | (2,961,289) | 16,422,875 | 647,783,336 |
| MFS Growth Fund | 487,286,045 | 3,678,635 | 59,162,173 | 45,968,103 | 11,278,096 | 489,048,706 |
| MFS High Income Fund | 265,322,603 | 8,750,292 | 9,830,946 | (1,171,522) | 7,256,931 | 270,327,358 |
| MFS Inflation-Adjusted Bond Fund | 454,038,276 | 24,990,217 | 9,087,705 | (2,068,110) | 6,764,635 | 474,637,313 |
| MFS Institutional Money Market Portfolio | 193,157,749 | 84,756,371 | 106,854,686 | (2,149) | 1,135 | 171,058,420 |
| MFS International Growth Fund | 133,968,013 | 3,442,640 | 9,299,636 | 4,969,043 | 2,015,174 | 135,095,234 |
| MFS International Intrinsic Value Fund | 134,711,990 | 4,689,914 | 4,219,643 | 484,000 | 399,989 | 136,066,250 |
| MFS International Large Cap Value Fund | 135,227,456 | 3,926,378 | 5,988,204 | 280,583 | 2,502,325 | 135,948,538 |
| MFS International New Discovery Fund | 66,473,913 | 2,367,397 | 3,363,969 | 306,519 | 2,057,367 | 67,841,227 |
| MFS Mid Cap Growth Fund | 458,490,265 | 971,579 | 42,122,527 | 31,171,494 | 33,246,739 | 481,757,550 |
| MFS Mid Cap Value Fund | 470,472,589 | 758,226 | 52,427,772 | 33,096,141 | 27,601,717 | 479,500,901 |
| MFS New Discovery Fund | 98,597,220 | 626,333 | 8,776,468 | (908,914) | 12,889,257 | 102,427,428 |
| MFS New Discovery Value Fund | 99,674,785 | 1,125,277 | 13,040,749 | 4,214,498 | 10,838,536 | 102,812,347 |
| MFS Research Fund | 483,162,574 | 433,739 | 49,969,941 | 29,567,851 | 28,940,658 | 492,134,881 |
| MFS Research International Fund | 337,102,824 | 12,654,449 | 10,904,652 | 4,106,261 | (3,321,455) | 339,637,427 |
| MFS Total Return Bond Fund | 549,143,576 | 34,015,984 | 20,034,042 | (3,767,075) | 19,948,454 | 579,306,897 |
| MFS Value Fund | 535,003,267 | 5,337,230 | 46,312,493 | 12,163,854 | 39,470,534 | 545,662,392 |
| $6,627,571,623 | $278,587,613 | $510,365,758 | $149,951,714 | $261,295,139 | $6,807,040,331 | |
| MFS Moderate Allocation Fund - continued | ||
| Affiliated Issuers | Dividend Income | Capital Gain Distributions |
| MFS Commodity Strategy Fund | $— | $— |
| MFS Emerging Markets Debt Fund | 7,237,166 | — |
| MFS Emerging Markets Debt Local Currency Fund | 3,850,098 | — |
| MFS Emerging Markets Equity Fund | 5,444,534 | — |
| MFS Global Opportunistic Bond Fund | — | — |
| MFS Global Real Estate Fund | — | — |
| MFS Government Securities Fund | 12,986,070 | — |
| MFS Growth Fund | 728,161 | 424,537 |
| MFS High Income Fund | 8,713,666 | — |
| MFS Inflation-Adjusted Bond Fund | 11,191,012 | — |
| MFS Institutional Money Market Portfolio | 4,990,494 | — |
| MFS International Growth Fund | — | — |
| MFS International Intrinsic Value Fund | — | — |
| MFS International Large Cap Value Fund | — | — |
| MFS International New Discovery Fund | — | — |
| MFS Mid Cap Growth Fund | — | — |
| MFS Mid Cap Value Fund | — | — |
| MFS New Discovery Fund | — | — |
| MFS New Discovery Value Fund | 458,846 | 188,536 |
| MFS Research Fund | — | — |
| MFS Research International Fund | — | — |
| MFS Total Return Bond Fund | 12,074,010 | — |
| MFS Value Fund | 5,025,134 | — |
| $72,699,191 | $613,073 | |
| MFS Growth Allocation Fund | ||||||
| Affiliated Issuers | Beginning Value | Purchases | Sales Proceeds | Realized Gain (Loss) | Change in Unrealized Appreciation or Depreciation | Ending Value |
| MFS Commodity Strategy Fund | $260,264,533 | $15,492,200 | $3,204,852 | $(1,444,568) | $294,107 | $271,401,420 |
| MFS Emerging Markets Debt Fund | 196,491,441 | 8,242,750 | 6,669,604 | (1,539,550) | 6,348,782 | 202,873,819 |
| MFS Emerging Markets Debt Local Currency Fund | 126,637,435 | 11,032,357 | 1,711,122 | (839,367) | (348,581) | 134,770,722 |
| MFS Emerging Markets Equity Fund | 129,885,501 | 4,674,829 | 10,331,158 | (1,424,242) | 10,247,496 | 133,052,426 |
| MFS Global Opportunistic Bond Fund | 192,174,290 | 8,513,881 | 3,579,271 | (854,354) | 7,218,705 | 203,473,251 |
| MFS Global Real Estate Fund | 255,483,882 | 10,413,631 | 17,068,928 | 1,337,809 | 24,090,802 | 274,257,196 |
| MFS Growth Fund | 613,829,066 | 2,103,372 | 65,649,886 | 52,597,879 | 20,020,912 | 622,901,343 |
| MFS High Income Fund | 260,316,834 | 8,720,452 | 5,892,771 | (726,307) | 6,719,960 | 269,138,168 |
| MFS Inflation-Adjusted Bond Fund | 314,835,948 | 24,551,275 | 5,080,220 | (1,199,042) | 4,513,774 | 337,621,735 |
| MFS Institutional Money Market Portfolio | 141,147,812 | 72,604,348 | 78,723,144 | (1,399) | 1,767 | 135,029,384 |
| MFS International Growth Fund | 197,928,651 | 7,142,630 | 13,179,286 | 4,681,655 | 5,752,197 | 202,325,847 |
| MFS International Intrinsic Value Fund | 199,701,572 | 8,523,084 | 6,100,389 | 692,963 | 644,567 | 203,461,797 |
| MFS International Large Cap Value Fund | 200,352,106 | 7,315,627 | 8,765,456 | 418,133 | 3,741,320 | 203,061,730 |
| MFS International New Discovery Fund | 131,105,243 | 5,980,403 | 6,282,945 | (512,401) | 5,209,515 | 135,499,815 |
| MFS Mid Cap Growth Fund | 578,329,871 | 1,143,429 | 40,144,980 | 17,022,518 | 64,890,725 | 621,241,563 |
| MFS Mid Cap Value Fund | 597,229,966 | 669,771 | 58,343,563 | 34,453,514 | 42,846,065 | 616,855,753 |
| MFS New Discovery Fund | 128,876,894 | 528,117 | 8,560,597 | (1,101,170) | 16,845,611 | 136,588,855 |
| MFS New Discovery Value Fund | 130,884,164 | 1,296,790 | 14,811,143 | 2,545,165 | 17,299,946 | 137,214,922 |
| MFS Research Fund | 607,809,024 | 122,965 | 55,083,558 | 11,575,835 | 62,499,648 | 626,923,914 |
| MFS Research International Fund | 465,645,197 | 20,861,471 | 13,531,500 | 2,257,993 | (1,160,776) | 474,072,385 |
| MFS Total Return Bond Fund | 150,456,270 | 20,334,067 | 5,656,013 | (933,039) | 5,495,890 | 169,697,175 |
| MFS Value Fund | 660,138,515 | 6,675,724 | 49,825,582 | 5,727,642 | 58,203,464 | 680,919,763 |
| $6,539,524,215 | $246,943,173 | $478,195,968 | $122,735,667 | $361,375,896 | $6,792,382,983 | |
| Affiliated Issuers | Dividend Income | Capital Gain Distributions |
| MFS Commodity Strategy Fund | $— | $— |
| MFS Emerging Markets Debt Fund | 7,164,982 | — |
| MFS Emerging Markets Debt Local Currency Fund | 3,773,758 | — |
| MFS Emerging Markets Equity Fund | — | — |
| MFS Global Opportunistic Bond Fund | 3,209,643 | — |
| MFS Global Real Estate Fund | — | — |
| MFS Growth Fund | 939,204 | 547,580 |
| MFS High Income Fund | 8,605,792 | — |
| MFS Inflation-Adjusted Bond Fund | 7,784,014 | — |
| MFS Institutional Money Market Portfolio | 3,687,035 | — |
| MFS International Growth Fund | — | — |
| MFS International Intrinsic Value Fund | — | — |
| MFS International Large Cap Value Fund | — | — |
| MFS International New Discovery Fund | — | — |
| MFS Mid Cap Growth Fund | — | — |
| MFS Mid Cap Value Fund | — | — |
| MFS New Discovery Fund | — | — |
| MFS New Discovery Value Fund | 606,744 | 249,307 |
| MFS Research Fund | — | — |
| MFS Research International Fund | — | — |
| MFS Total Return Bond Fund | 3,337,090 | — |
| MFS Value Fund | 6,220,171 | — |
| $45,328,433 | $796,887 | |
| MFS Aggressive Growth Allocation Fund | ||||||
| Affiliated Issuers | Beginning Value | Purchases | Sales Proceeds | Realized Gain (Loss) | Change in Unrealized Appreciation or Depreciation | Ending Value |
| MFS Commodity Strategy Fund | $138,085,071 | $10,954,509 | $1,587,406 | $(742,825) | $190,231 | $146,899,580 |
| MFS Emerging Markets Equity Fund | 82,659,664 | 3,147,492 | 4,989,822 | (688,124) | 6,250,521 | 86,379,731 |
| MFS Global Real Estate Fund | 137,259,260 | 7,217,496 | 9,911,337 | 364,103 | 13,339,463 | 148,268,985 |
| MFS Growth Fund | 315,995,797 | 4,155,582 | 30,036,917 | 21,666,653 | 16,045,658 | 327,826,773 |
| MFS Institutional Money Market Portfolio | 40,659,061 | 36,694,280 | 32,932,009 | (921) | 1,029 | 44,421,440 |
| MFS International Growth Fund | 140,236,074 | 5,233,071 | 6,822,480 | 994,848 | 6,317,094 | 145,958,607 |
| MFS International Intrinsic Value Fund | 140,927,041 | 7,650,496 | 2,683,104 | 61,190 | 851,785 | 146,807,408 |
| MFS International Large Cap Value Fund | 141,398,691 | 6,496,968 | 4,122,381 | 174,756 | 2,749,689 | 146,697,723 |
| MFS International New Discovery Fund | 111,416,603 | 6,027,047 | 4,106,366 | (475,397) | 4,419,215 | 117,281,102 |
| MFS Mid Cap Growth Fund | 273,856,861 | 3,155,965 | 18,443,548 | 2,946,113 | 36,281,856 | 297,797,247 |
| MFS Mid Cap Value Fund | 281,504,724 | 1,994,822 | 24,227,083 | 6,449,046 | 30,448,305 | 296,169,814 |
| MFS New Discovery Fund | 68,626,102 | 1,658,286 | 4,978,660 | (651,021) | 9,164,392 | 73,819,099 |
| MFS New Discovery Value Fund | 69,617,915 | 1,534,801 | 7,739,697 | 953,812 | 9,743,953 | 74,110,784 |
| MFS Research Fund | 286,479,893 | 385,114 | 21,610,037 | 3,681,863 | 31,478,854 | 300,415,687 |
| MFS Research International Fund | 225,772,320 | 12,117,356 | 3,757,750 | 270,239 | 160,355 | 234,562,520 |
| MFS Value Fund | 336,281,302 | 4,660,615 | 20,374,482 | 2,017,357 | 30,885,519 | 353,470,311 |
| $2,790,776,379 | $113,083,900 | $198,323,079 | $37,021,692 | $198,327,919 | $2,940,886,811 | |
| Affiliated Issuers | Dividend Income | Capital Gain Distributions |
| MFS Commodity Strategy Fund | $3,186,046 | $— |
| MFS Emerging Markets Equity Fund | — | — |
| MFS Global Real Estate Fund | — | — |
| MFS Growth Fund | 485,463 | 283,037 |
| MFS Institutional Money Market Portfolio | 1,096,339 | — |
| MFS International Growth Fund | — | — |
| MFS International Intrinsic Value Fund | — | — |
| MFS International Large Cap Value Fund | — | — |
| MFS International New Discovery Fund | — | — |
| MFS Mid Cap Growth Fund | — | — |
| MFS Mid Cap Value Fund | — | — |
| MFS New Discovery Fund | — | — |
| MFS New Discovery Value Fund | 323,902 | 133,090 |
| MFS Research Fund | — | — |
| MFS Research International Fund | — | — |
| MFS Value Fund | — | — |
| $5,091,750 | $416,127 | |
| Number of Dollars | |||
| Nominee | For | Against/Withheld | Abstain |
| Steven E. Buller | 93,694,553,358.767 | 2,599,093,584.595 | 0.000 |
| John A. Caroselli | 94,028,434,411.278 | 2,265,212,532.084 | 0.000 |
| Maureen R. Goldfarb | 94,361,674,360.213 | 1,931,972,583.149 | 0.000 |
| Peter D. Jones | 94,066,354,687.369 | 2,227,292,255.993 | 0.000 |
| John P. Kavanaugh | 94,185,926,082.433 | 2,107,559,444.381 | 161,416.548 |
| James W. Kilman, Jr. | 94,450,795,713.326 | 1,842,851,230.036 | 0.000 |
| Clarence Otis, Jr. | 93,984,248,122.457 | 2,309,398,820.905 | 0.000 |
| Michael W. Roberge | 94,352,210,986.123 | 1,941,435,957.239 | 0.000 |
| Maryanne L. Roepke | 94,413,451,878.996 | 1,880,195,064.366 | 0.000 |
| Paula E. Smith | 94,545,454,781.292 | 1,748,192,162.070 | 0.000 |
| Laurie J. Thomsen | 94,416,793,826.848 | 1,876,853,116.514 | 0.000 |
| Darrell A. Williams | 94,451,319,166.310 | 1,842,327,777.051 | 0.000 |
| Issuer | Shares/Par | Value ($) | ||
| Investment Companies (h) – 100.0% | ||||
| International Stock Funds – 99.8% | ||||
| MFS Emerging Markets Equity Fund - Class R6 | 184,252,932 | $ 6,550,191,733 | ||
| MFS International Growth Fund - Class R6 | 127,169,329 | 5,707,359,490 | ||
| MFS International Intrinsic Value Fund - Class R6 | 137,914,855 | 5,719,329,025 | ||
| MFS International Large Cap Value Fund - Class R6 | 399,147,939 | 5,731,764,403 | ||
| MFS International New Discovery Fund - Class R6 | 114,769,323 | 3,818,375,377 | ||
| MFS Research International Fund - Class R6 | 446,688,441 | 10,497,178,377 | ||
| $38,024,198,405 | ||||
| Money Market Funds – 0.2% | ||||
| MFS Institutional Money Market Portfolio, 4.66% (v) | 65,206,822 | $ 65,213,343 | ||
| Total Investment Companies (Identified Cost, $30,804,953,315) | $38,089,411,748 | |||
| Other Assets, Less Liabilities – 0.0% | 15,821,878 | |||
| Net Assets – 100.0% | $38,105,233,626 | |||
| (h) | An affiliated issuer, which may be considered one in which the fund owns 5% or more of the outstanding voting securities, or a company which is under common control. At period end, the aggregate value of the fund’s investments in affiliated issuers was $38,089,411,748. | |||
| (v) | Affiliated issuer that is available only to investment companies managed by MFS. The rate quoted for the MFS Institutional Money Market Portfolio is the annualized seven-day yield of the fund at period end. |
| Financial Statements | Statement of Assets and Liabilities |
| At 11/30/24 (unaudited)Assets | |
| Investments in affiliated issuers, at value (identified cost, $30,804,953,315) | $38,089,411,748 |
| Receivables for | |
| Fund shares sold | 47,321,156 |
| Receivable from investment adviser | 543,641 |
| Other assets | 46,615 |
| Total assets | $38,137,323,160 |
| Liabilities | |
| Payables for | |
| Investments purchased | $11,089,875 |
| Fund shares reacquired | 15,056,842 |
| Payable to affiliates | |
| Administrative services fee | 192 |
| Shareholder servicing costs | 5,457,423 |
| Distribution and service fees | 163,312 |
| Payable for independent Trustees' compensation | 12,477 |
| Accrued expenses and other liabilities | 309,413 |
| Total liabilities | $32,089,534 |
| Net assets | $38,105,233,626 |
| Net assets consist of | |
| Paid-in capital | $31,115,635,602 |
| Total distributable earnings (loss) | 6,989,598,024 |
| Net assets | $38,105,233,626 |
| Shares of beneficial interest outstanding | 1,577,229,671 |
| Net assets | Shares outstanding | Net asset value per share (a) | |
| Class A | $3,592,437,780 | 150,501,423 | $23.87 |
| Class B | 5,196,038 | 221,546 | 23.45 |
| Class C | 232,851,110 | 10,109,453 | 23.03 |
| Class I | 14,435,030,871 | 596,328,185 | 24.21 |
| Class R1 | 7,323,080 | 324,123 | 22.59 |
| Class R2 | 52,718,066 | 2,253,842 | 23.39 |
| Class R3 | 1,335,341,234 | 56,480,324 | 23.64 |
| Class R4 | 821,486,965 | 34,062,866 | 24.12 |
| Class R6 | 17,622,848,482 | 726,947,909 | 24.24 |
| (a) | Maximum offering price per share was equal to the net asset value per share for all share classes, except for Class A, for which the maximum offering price per share was $25.33 [100 / 94.25 x $23.87]. On sales of $50,000 or more, the maximum offering price of Class A shares is reduced. A contingent deferred sales charge may be imposed on redemptions of Class A, Class B, and Class C shares. Redemption price per share was equal to the net asset value per share for Classes I, R1, R2, R3, R4, and R6. |
| Financial Statements | Statement of Operations |
| Six months ended 11/30/24 (unaudited)Net investment income (loss) | |
| Income | |
| Dividends from affiliated issuers | $1,530,444 |
| Payments from investment adviser for other expenses agreement (See Note 3) | 200,133 |
| Other | 4,143 |
| Total investment income | $1,734,720 |
| Expenses | |
| Distribution and service fees | $7,820,610 |
| Shareholder servicing costs | 11,285,904 |
| Administrative services fee | 8,775 |
| Independent Trustees' compensation | 78,300 |
| Custodian fee | 50,497 |
| Shareholder communications | 1,687,744 |
| Audit and tax fees | 24,140 |
| Legal fees | 95,362 |
| Miscellaneous | 460,297 |
| Total expenses | $21,511,629 |
| Reduction of expenses by investment adviser and distributor | (3,062,491) |
| Net expenses | $18,449,138 |
| Net investment income (loss) | $(16,714,418) |
| Realized and unrealized gain (loss) | |
| Realized gain (loss) (identified cost basis) | |
| Investments in affiliated issuers | $(1,571,095) |
| Change in unrealized appreciation or depreciation | |
| Affiliated issuers | $1,038,780,155 |
| Net realized and unrealized gain (loss) | $1,037,209,060 |
| Change in net assets from operations | $1,020,494,642 |
| Financial Statements | Statements of Changes in Net Assets |
| Six months ended | Year ended | |
| 11/30/24 (unaudited) | 5/31/24 | |
| Change in net assets | ||
| From operations | ||
| Net investment income (loss) | $(16,714,418) | $814,624,416 |
| Net realized gain (loss) | (1,571,095) | 268,540,764 |
| Net unrealized gain (loss) | 1,038,780,155 | 3,937,595,301 |
| Change in net assets from operations | $1,020,494,642 | $5,020,760,481 |
| Total distributions to shareholders | $— | $(1,522,468,104) |
| Change in net assets from fund share transactions | $(1,540,718,267) | $(237,226,239) |
| Total change in net assets | $(520,223,625) | $3,261,066,138 |
| Net assets | ||
| At beginning of period | 38,625,457,251 | 35,364,391,113 |
| At end of period | $38,105,233,626 | $38,625,457,251 |
| Financial Statements | Financial Highlights |
| Class A | Six months ended | Year ended | ||||
| 11/30/24 (unaudited) | 5/31/24 | 5/31/23 | 5/31/22 | 5/31/21 | 5/31/20 | |
| Net asset value, beginning of period | $23.29 | $21.20 | $21.37 | $25.51 | $18.80 | $18.71 |
| Income (loss) from investment operations | ||||||
| Net investment income (loss) (d)(l) | $(0.04) | $0.42 | $0.22 | $0.40 | $0.10 | $0.25 |
| Net realized and unrealized gain (loss) | 0.62 | 2.54 | 0.09 | (3.92) | 6.96 | 0.32 |
| Total from investment operations | $0.58 | $2.96 | $0.31 | $(3.52) | $7.06 | $0.57 |
| Less distributions declared to shareholders | ||||||
| From net investment income | $— | $(0.52) | $(0.08) | $(0.41) | $(0.12) | $(0.26) |
| From net realized gain | — | (0.35) | (0.40) | (0.21) | (0.23) | (0.22) |
| Total distributions declared to shareholders | $— | $(0.87) | $(0.48) | $(0.62) | $(0.35) | $(0.48) |
| Net asset value, end of period (x) | $23.87 | $23.29 | $21.20 | $21.37 | $25.51 | $18.80 |
| Total return (%) (r)(s)(t)(x) | 2.49(n) | 14.19 | 1.61 | (14.16) | 37.66 | 2.80 |
| Ratios (%) (to average net assets) and Supplemental data: | ||||||
| Expenses before expense reductions (h) | 0.37(a) | 0.36 | 0.37 | 0.37 | 0.36 | 0.37 |
| Expenses after expense reductions (h) | 0.35(a) | 0.35 | 0.35 | 0.35 | 0.34 | 0.35 |
| Net investment income (loss) (l) | (0.34)(a) | 1.93 | 1.07 | 1.64 | 0.46 | 1.31 |
| Portfolio turnover rate | 1(n) | 3 | 7 | 4 | 9 | 6 |
| Net assets at end of period (000 omitted) | $3,592,438 | $3,689,945 | $3,498,538 | $3,644,253 | $4,381,231 | $2,778,815 |
| Class B | Six months ended | Year ended | ||||
| 11/30/24 (unaudited) | 5/31/24 | 5/31/23 | 5/31/22 | 5/31/21 | 5/31/20 | |
| Net asset value, beginning of period | $22.97 | $20.87 | $21.12 | $25.16 | $18.61 | $18.50 |
| Income (loss) from investment operations | ||||||
| Net investment income (loss) (d)(l) | $(0.13) | $0.23 | $0.06 | $0.21 | $(0.06) | $0.10 |
| Net realized and unrealized gain (loss) | 0.61 | 2.52 | 0.09 | (3.86) | 6.84 | 0.31 |
| Total from investment operations | $0.48 | $2.75 | $0.15 | $(3.65) | $6.78 | $0.41 |
| Less distributions declared to shareholders | ||||||
| From net investment income | $— | $(0.30) | $— | $(0.18) | $— | $(0.08) |
| From net realized gain | — | (0.35) | (0.40) | (0.21) | (0.23) | (0.22) |
| Total distributions declared to shareholders | $— | $(0.65) | $(0.40) | $(0.39) | $(0.23) | $(0.30) |
| Net asset value, end of period (x) | $23.45 | $22.97 | $20.87 | $21.12 | $25.16 | $18.61 |
| Total return (%) (r)(s)(t)(x) | 2.09(n) | 13.32 | 0.83 | (14.73) | 36.51 | 2.08 |
| Ratios (%) (to average net assets) and Supplemental data: | ||||||
| Expenses before expense reductions (h) | 1.12(a) | 1.11 | 1.12 | 1.12 | 1.11 | 1.12 |
| Expenses after expense reductions (h) | 1.10(a) | 1.10 | 1.10 | 1.10 | 1.09 | 1.10 |
| Net investment income (loss) (l) | (1.09)(a) | 1.06 | 0.30 | 0.89 | (0.28) | 0.53 |
| Portfolio turnover rate | 1(n) | 3 | 7 | 4 | 9 | 6 |
| Net assets at end of period (000 omitted) | $5,196 | $6,527 | $9,428 | $13,672 | $21,542 | $20,424 |
| Class C | Six months ended | Year ended | ||||
| 11/30/24 (unaudited) | 5/31/24 | 5/31/23 | 5/31/22 | 5/31/21 | 5/31/20 | |
| Net asset value, beginning of period | $22.56 | $20.55 | $20.80 | $24.83 | $18.36 | $18.28 |
| Income (loss) from investment operations | ||||||
| Net investment income (loss) (d)(l) | $(0.13) | $0.25 | $0.06 | $0.22 | $(0.06) | $0.10 |
| Net realized and unrealized gain (loss) | 0.60 | 2.45 | 0.09 | (3.82) | 6.76 | 0.30 |
| Total from investment operations | $0.47 | $2.70 | $0.15 | $(3.60) | $6.70 | $0.40 |
| Less distributions declared to shareholders | ||||||
| From net investment income | $— | $(0.34) | $— | $(0.22) | $— | $(0.10) |
| From net realized gain | — | (0.35) | (0.40) | (0.21) | (0.23) | (0.22) |
| Total distributions declared to shareholders | $— | $(0.69) | $(0.40) | $(0.43) | $(0.23) | $(0.32) |
| Net asset value, end of period (x) | $23.03 | $22.56 | $20.55 | $20.80 | $24.83 | $18.36 |
| Total return (%) (r)(s)(t)(x) | 2.08(n) | 13.30 | 0.84 | (14.75) | 36.57 | 2.04 |
| Ratios (%) (to average net assets) and Supplemental data: | ||||||
| Expenses before expense reductions (h) | 1.12(a) | 1.11 | 1.12 | 1.12 | 1.11 | 1.12 |
| Expenses after expense reductions (h) | 1.10(a) | 1.10 | 1.10 | 1.10 | 1.09 | 1.10 |
| Net investment income (loss) (l) | (1.09)(a) | 1.16 | 0.29 | 0.92 | (0.28) | 0.53 |
| Portfolio turnover rate | 1(n) | 3 | 7 | 4 | 9 | 6 |
| Net assets at end of period (000 omitted) | $232,851 | $263,351 | $304,133 | $379,572 | $489,683 | $419,045 |
| Class I | Six months ended | Year ended | ||||
| 11/30/24 (unaudited) | 5/31/24 | 5/31/23 | 5/31/22 | 5/31/21 | 5/31/20 | |
| Net asset value, beginning of period | $23.59 | $21.46 | $21.63 | $25.81 | $19.01 | $18.91 |
| Income (loss) from investment operations | ||||||
| Net investment income (loss) (d)(l) | $(0.01) | $0.49 | $0.26 | $0.47 | $0.16 | $0.30 |
| Net realized and unrealized gain (loss) | 0.63 | 2.56 | 0.10 | (3.97) | 7.03 | 0.32 |
| Total from investment operations | $0.62 | $3.05 | $0.36 | $(3.50) | $7.19 | $0.62 |
| Less distributions declared to shareholders | ||||||
| From net investment income | $— | $(0.57) | $(0.13) | $(0.47) | $(0.16) | $(0.30) |
| From net realized gain | — | (0.35) | (0.40) | (0.21) | (0.23) | (0.22) |
| Total distributions declared to shareholders | $— | $(0.92) | $(0.53) | $(0.68) | $(0.39) | $(0.52) |
| Net asset value, end of period (x) | $24.21 | $23.59 | $21.46 | $21.63 | $25.81 | $19.01 |
| Total return (%) (r)(s)(t)(x) | 2.63(n) | 14.48 | 1.85 | (13.93) | 38.00 | 3.04 |
| Ratios (%) (to average net assets) and Supplemental data: | ||||||
| Expenses before expense reductions (h) | 0.12(a) | 0.11 | 0.12 | 0.12 | 0.11 | 0.12 |
| Expenses after expense reductions (h) | 0.10(a) | 0.10 | 0.10 | 0.10 | 0.09 | 0.10 |
| Net investment income (loss) (l) | (0.09)(a) | 2.20 | 1.28 | 1.94 | 0.71 | 1.56 |
| Portfolio turnover rate | 1(n) | 3 | 7 | 4 | 9 | 6 |
| Net assets at end of period (000 omitted) | $14,435,031 | $14,892,220 | $14,757,462 | $15,504,823 | $17,850,569 | $9,936,595 |
| Class R1 | Six months ended | Year ended | ||||
| 11/30/24 (unaudited) | 5/31/24 | 5/31/23 | 5/31/22 | 5/31/21 | 5/31/20 | |
| Net asset value, beginning of period | $22.12 | $20.20 | $20.45 | $24.40 | $18.04 | $17.99 |
| Income (loss) from investment operations | ||||||
| Net investment income (loss) (d)(l) | $(0.12) | $0.25 | $0.06 | $0.20 | $(0.07) | $0.12 |
| Net realized and unrealized gain (loss) | 0.59 | 2.39 | 0.09 | (3.75) | 6.66 | 0.28 |
| Total from investment operations | $0.47 | $2.64 | $0.15 | $(3.55) | $6.59 | $0.40 |
| Less distributions declared to shareholders | ||||||
| From net investment income | $— | $(0.37) | $— | $(0.19) | $— | $(0.13) |
| From net realized gain | — | (0.35) | (0.40) | (0.21) | (0.23) | (0.22) |
| Total distributions declared to shareholders | $— | $(0.72) | $(0.40) | $(0.40) | $(0.23) | $(0.35) |
| Net asset value, end of period (x) | $22.59 | $22.12 | $20.20 | $20.45 | $24.40 | $18.04 |
| Total return (%) (r)(s)(t)(x) | 2.12(n) | 13.25 | 0.86 | (14.78) | 36.61 | 2.04 |
| Ratios (%) (to average net assets) and Supplemental data: | ||||||
| Expenses before expense reductions (h) | 1.12(a) | 1.11 | 1.12 | 1.12 | 1.11 | 1.12 |
| Expenses after expense reductions (h) | 1.10(a) | 1.10 | 1.10 | 1.10 | 1.09 | 1.10 |
| Net investment income (loss) (l) | (1.09)(a) | 1.20 | 0.32 | 0.86 | (0.31) | 0.67 |
| Portfolio turnover rate | 1(n) | 3 | 7 | 4 | 9 | 6 |
| Net assets at end of period (000 omitted) | $7,323 | $7,571 | $7,177 | $7,056 | $10,359 | $7,756 |
| Class R2 | Six months ended | Year ended | ||||
| 11/30/24 (unaudited) | 5/31/24 | 5/31/23 | 5/31/22 | 5/31/21 | 5/31/20 | |
| Net asset value, beginning of period | $22.85 | $20.81 | $20.98 | $25.05 | $18.49 | $18.39 |
| Income (loss) from investment operations | ||||||
| Net investment income (loss) (d)(l) | $(0.07) | $0.35 | $0.16 | $0.34 | $0.06 | $0.19 |
| Net realized and unrealized gain (loss) | 0.61 | 2.49 | 0.10 | (3.85) | 6.80 | 0.33 |
| Total from investment operations | $0.54 | $2.84 | $0.26 | $(3.51) | $6.86 | $0.52 |
| Less distributions declared to shareholders | ||||||
| From net investment income | $— | $(0.45) | $(0.03) | $(0.35) | $(0.07) | $(0.20) |
| From net realized gain | — | (0.35) | (0.40) | (0.21) | (0.23) | (0.22) |
| Total distributions declared to shareholders | $— | $(0.80) | $(0.43) | $(0.56) | $(0.30) | $(0.42) |
| Net asset value, end of period (x) | $23.39 | $22.85 | $20.81 | $20.98 | $25.05 | $18.49 |
| Total return (%) (r)(s)(t)(x) | 2.36(n) | 13.88 | 1.36 | (14.34) | 37.21 | 2.60 |
| Ratios (%) (to average net assets) and Supplemental data: | ||||||
| Expenses before expense reductions (h) | 0.62(a) | 0.61 | 0.62 | 0.62 | 0.61 | 0.62 |
| Expenses after expense reductions (h) | 0.60(a) | 0.60 | 0.60 | 0.60 | 0.59 | 0.60 |
| Net investment income (loss) (l) | (0.59)(a) | 1.61 | 0.80 | 1.43 | 0.26 | 1.02 |
| Portfolio turnover rate | 1(n) | 3 | 7 | 4 | 9 | 6 |
| Net assets at end of period (000 omitted) | $52,718 | $54,122 | $61,253 | $65,430 | $74,611 | $53,110 |
| Class R3 | Six months ended | Year ended | ||||
| 11/30/24 (unaudited) | 5/31/24 | 5/31/23 | 5/31/22 | 5/31/21 | 5/31/20 | |
| Net asset value, beginning of period | $23.07 | $21.01 | $21.19 | $25.30 | $18.66 | $18.57 |
| Income (loss) from investment operations | ||||||
| Net investment income (loss) (d)(l) | $(0.04) | $0.42 | $0.22 | $0.40 | $0.11 | $0.24 |
| Net realized and unrealized gain (loss) | 0.61 | 2.51 | 0.09 | (3.89) | 6.88 | 0.33 |
| Total from investment operations | $0.57 | $2.93 | $0.31 | $(3.49) | $6.99 | $0.57 |
| Less distributions declared to shareholders | ||||||
| From net investment income | $— | $(0.52) | $(0.09) | $(0.41) | $(0.12) | $(0.26) |
| From net realized gain | — | (0.35) | (0.40) | (0.21) | (0.23) | (0.22) |
| Total distributions declared to shareholders | $— | $(0.87) | $(0.49) | $(0.62) | $(0.35) | $(0.48) |
| Net asset value, end of period (x) | $23.64 | $23.07 | $21.01 | $21.19 | $25.30 | $18.66 |
| Total return (%) (r)(s)(t)(x) | 2.47(n) | 14.19 | 1.59 | (14.14) | 37.61 | 2.83 |
| Ratios (%) (to average net assets) and Supplemental data: | ||||||
| Expenses before expense reductions (h) | 0.37(a) | 0.36 | 0.37 | 0.37 | 0.36 | 0.38 |
| Expenses after expense reductions (h) | 0.35(a) | 0.35 | 0.35 | 0.35 | 0.34 | 0.35 |
| Net investment income (loss) (l) | (0.34)(a) | 1.93 | 1.08 | 1.66 | 0.49 | 1.25 |
| Portfolio turnover rate | 1(n) | 3 | 7 | 4 | 9 | 6 |
| Net assets at end of period (000 omitted) | $1,335,341 | $1,353,877 | $1,216,239 | $1,178,451 | $1,318,182 | $724,023 |
| Class R4 | Six months ended | Year ended | ||||
| 11/30/24 (unaudited) | 5/31/24 | 5/31/23 | 5/31/22 | 5/31/21 | 5/31/20 | |
| Net asset value, beginning of period | $23.50 | $21.39 | $21.56 | $25.72 | $18.95 | $18.85 |
| Income (loss) from investment operations | ||||||
| Net investment income (loss) (d)(l) | $(0.01) | $0.48 | $0.28 | $0.47 | $0.18 | $0.32 |
| Net realized and unrealized gain (loss) | 0.63 | 2.55 | 0.09 | (3.95) | 6.99 | 0.30 |
| Total from investment operations | $0.62 | $3.03 | $0.37 | $(3.48) | $7.17 | $0.62 |
| Less distributions declared to shareholders | ||||||
| From net investment income | $— | $(0.57) | $(0.14) | $(0.47) | $(0.17) | $(0.30) |
| From net realized gain | — | (0.35) | (0.40) | (0.21) | (0.23) | (0.22) |
| Total distributions declared to shareholders | $— | $(0.92) | $(0.54) | $(0.68) | $(0.40) | $(0.52) |
| Net asset value, end of period (x) | $24.12 | $23.50 | $21.39 | $21.56 | $25.72 | $18.95 |
| Total return (%) (r)(s)(t)(x) | 2.64(n) | 14.43 | 1.86 | (13.91) | 37.96 | 3.04 |
| Ratios (%) (to average net assets) and Supplemental data: | ||||||
| Expenses before expense reductions (h) | 0.12(a) | 0.11 | 0.12 | 0.12 | 0.11 | 0.12 |
| Expenses after expense reductions (h) | 0.10(a) | 0.10 | 0.10 | 0.10 | 0.09 | 0.10 |
| Net investment income (loss) (l) | (0.09)(a) | 2.15 | 1.33 | 1.91 | 0.77 | 1.62 |
| Portfolio turnover rate | 1(n) | 3 | 7 | 4 | 9 | 6 |
| Net assets at end of period (000 omitted) | $821,487 | $1,055,356 | $987,868 | $1,017,358 | $1,277,938 | $721,937 |
| Class R6 | Six months ended | Year ended | ||||
| 11/30/24 (unaudited) | 5/31/24 | 5/31/23 | 5/31/22 | 5/31/21 | 5/31/20 | |
| Net asset value, beginning of period | $23.61 | $21.48 | $21.66 | $25.84 | $19.03 | $18.92 |
| Income (loss) from investment operations | ||||||
| Net investment income (loss) (d)(l) | $0.00(w) | $0.51 | $0.29 | $0.49 | $0.19 | $0.32 |
| Net realized and unrealized gain (loss) | 0.63 | 2.57 | 0.09 | (3.97) | 7.03 | 0.33 |
| Total from investment operations | $0.63 | $3.08 | $0.38 | $(3.48) | $7.22 | $0.65 |
| Less distributions declared to shareholders | ||||||
| From net investment income | $— | $(0.60) | $(0.16) | $(0.49) | $(0.18) | $(0.32) |
| From net realized gain | — | (0.35) | (0.40) | (0.21) | (0.23) | (0.22) |
| Total distributions declared to shareholders | $— | $(0.95) | $(0.56) | $(0.70) | $(0.41) | $(0.54) |
| Net asset value, end of period (x) | $24.24 | $23.61 | $21.48 | $21.66 | $25.84 | $19.03 |
| Total return (%) (r)(s)(t)(x) | 2.67(n) | 14.58 | 1.92 | (13.84) | 38.12 | 3.17 |
| Ratios (%) (to average net assets) and Supplemental data: | ||||||
| Expenses before expense reductions (h) | 0.01(a) | 0.01 | 0.01 | 0.01 | 0.02 | 0.02 |
| Expenses after expense reductions (h) | 0.00(a) | 0.00 | 0.00 | 0.00 | 0.00 | 0.00 |
| Net investment income (loss) (l) | 0.01(a) | 2.29 | 1.42 | 2.03 | 0.81 | 1.65 |
| Portfolio turnover rate | 1(n) | 3 | 7 | 4 | 9 | 6 |
| Net assets at end of period (000 omitted) | $17,622,848 | $17,302,488 | $14,522,293 | $12,792,920 | $13,046,306 | $6,984,049 |
| (a) | Annualized. |
| (d) | Per share data is based on average shares outstanding. |
| (h) | In addition to the fees and expenses which the fund bears directly, the fund indirectly bears a pro rata share of the fees and expenses of the underlying affiliated funds in which the fund invests. Accordingly, the expense ratio for the fund reflects only those fees and expenses borne directly by the fund. Because the underlying affiliated funds have varied expense and fee levels and the fund may own different proportions of the underlying affiliated funds at different times, the amount of fees and expenses incurred indirectly by the fund will vary. |
| (l) | Recognition of net investment income by the fund may be affected by the timing of the declaration of dividends by the underlying affiliated funds in which the fund invests and for interim net investment income ratios, the actual annual net investment income ratio may differ. The ratios and per share amounts do not include net investment income of the underlying affiliated funds in which the fund invests. |
| (n) | Not annualized. |
| (r) | Certain expenses have been reduced without which performance would have been lower. |
| (s) | From time to time the fund may receive proceeds from litigation settlements, without which performance would be lower. |
| (t) | Total returns do not include any applicable sales charges. |
| (w) | Per share amount was less than $0.01. |
| (x) | The net asset values and total returns have been calculated on net assets which include adjustments made in accordance with U.S. generally accepted accounting principles required at period end for financial reporting purposes. |
| Financial Instruments | Level 1 | Level 2 | Level 3 | Total |
| Mutual Funds | $65,213,343 | $38,024,198,405 | $— | $38,089,411,748 |
| Year ended 5/31/24 | |
| Ordinary income (including any short-term capital gains) | $950,009,360 |
| Long-term capital gains | 572,458,744 |
| Total distributions | $1,522,468,104 |
| As of 11/30/24 | |
| Cost of investments | $31,498,998,451 |
| Gross appreciation | 6,590,413,297 |
| Gross depreciation | — |
| Net unrealized appreciation (depreciation) | $6,590,413,297 |
| As of 5/31/24 | |
| Undistributed ordinary income | 77,382,103 |
| Undistributed long-term capital gain | 340,088,137 |
| Net unrealized appreciation (depreciation) | 5,551,633,142 |
| Six months ended 11/30/24 | Year ended 5/31/24 | ||
| Class A | $— | $139,039,397 | |
| Class B | — | 214,369 | |
| Class C | — | 8,844,889 | |
| Class I | — | 617,110,382 | |
| Class R1 | — | 254,762 | |
| Class R2 | — | 1,994,308 | |
| Class R3 | — | 50,654,134 | |
| Class R4 | — | 41,989,134 | |
| Class R6 | — | 662,366,729 | |
| Total | $— | $1,522,468,104 |
| Distribution Fee Rate (d) | Service Fee Rate (d) | Total Distribution Plan (d) | Annual Effective Rate (e) | Distribution and Service Fee | |
| Class A | — | 0.25% | 0.25% | 0.25% | $ 4,635,117 |
| Class B | 0.75% | 0.25% | 1.00% | 1.00% | 30,493 |
| Class C | 0.75% | 0.25% | 1.00% | 1.00% | 1,273,275 |
| Class R1 | 0.75% | 0.25% | 1.00% | 1.00% | 38,104 |
| Class R2 | 0.25% | 0.25% | 0.50% | 0.50% | 135,944 |
| Class R3 | — | 0.25% | 0.25% | 0.25% | 1,707,677 |
| Total Distribution and Service Fees | $7,820,610 |
| (d) | In accordance with the distribution plan for certain classes, the fund pays distribution and/or service fees equal to these annual percentage rates of each class’s average daily net assets. The distribution and service fee rates disclosed by class represent the current rates in effect at the end of the reporting period. Any rate changes, if applicable, are detailed below. |
| (e) | The annual effective rates represent actual fees incurred under the distribution plan for the six months ended November 30, 2024 based on each class's average daily net assets. MFD has voluntarily agreed to rebate a portion of each class's 0.25% service fee attributable to accounts for which there is no financial intermediary specified on the account except for accounts attributable to MFS or its affiliates' seed money. For the six months ended November 30, 2024, this rebate amounted to $88, $27, $503, and $5 for Class A, Class C, Class R2, and Class R3 shares, respectively, and is included in the reduction of total expenses in the Statement of Operations. |
| Amount | |
| Class A | $22,789 |
| Class B | 217 |
| Class C | 4,357 |
| Date | Transaction | Class | Shares | Amount |
| 8/19/2024 | Redemption | Class A | 3 | $67 |
| 8/19/2024 | Redemption | Class C | 3 | 61 |
| 8/19/2024 | Redemption | Class I | 3 | 74 |
| 8/19/2024 | Redemption | Class R1 | 3 | 67 |
| 8/19/2024 | Redemption | Class R2 | 3 | 73 |
| 8/19/2024 | Redemption | Class R3 | 3 | 77 |
| 8/19/2024 | Redemption | Class R4 | 3 | 76 |
| Six months ended 11/30/24 | Year ended 5/31/24 | ||||
| Shares | Amount | Shares | Amount | ||
| Shares sold | |||||
| Class A | 6,487,712 | $155,465,618 | 21,116,213 | $463,709,792 | |
| Class B | 213 | 5,003 | 2,200 | 47,755 | |
| Class C | 218,192 | 5,072,659 | 837,851 | 17,816,891 | |
| Class I | 43,951,113 | 1,064,932,831 | 144,061,202 | 3,197,643,029 | |
| Class R1 | 23,874 | 541,376 | 55,709 | 1,159,250 | |
| Class R2 | 134,845 | 3,156,631 | 488,795 | 10,506,205 | |
| Class R3 | 5,608,636 | 132,094,594 | 12,134,732 | 263,997,990 | |
| Class R4 | 2,073,327 | 50,077,671 | 9,495,308 | 211,083,571 | |
| Class R6 | 72,811,569 | 1,767,842,019 | 173,779,325 | 3,863,744,543 | |
| 131,309,481 | $3,179,188,402 | 361,971,335 | $8,029,709,026 | ||
| Shares issued to shareholders in reinvestment of distributions | |||||
| Class A | — | $— | 5,687,347 | $124,780,390 | |
| Class B | — | — | 9,753 | 211,739 | |
| Class C | — | — | 380,983 | 8,122,547 | |
| Class I | — | — | 24,344,641 | 540,451,039 | |
| Class R1 | — | — | 12,184 | 254,762 | |
| Class R2 | — | — | 91,440 | 1,970,533 | |
| Class R3 | — | — | 2,331,069 | 50,654,134 | |
| Class R4 | — | — | 1,864,107 | 41,215,405 | |
| Class R6 | — | — | 28,878,878 | 641,399,886 | |
| — | $— | 63,600,402 | $1,409,060,435 | ||
| Six months ended 11/30/24 | Year ended 5/31/24 | ||||
| Shares | Amount | Shares | Amount | ||
| Shares reacquired | |||||
| Class A | (14,443,300) | $(344,958,690) | (33,337,903) | $(734,161,095) | |
| Class B | (62,839) | (1,489,121) | (179,488) | (3,857,676) | |
| Class C | (1,784,659) | (41,351,395) | (4,345,156) | (92,443,777) | |
| Class I | (79,031,621) | (1,916,756,175) | (224,528,943) | (4,998,067,706) | |
| Class R1 | (41,951) | (954,058) | (81,063) | (1,681,120) | |
| Class R2 | (249,847) | (5,862,952) | (1,154,869) | (24,891,948) | |
| Class R3 | (7,826,560) | (185,131,493) | (13,648,248) | (296,884,886) | |
| Class R4 | (12,923,350) | (306,504,493) | (12,634,468) | (279,378,396) | |
| Class R6 | (78,758,510) | (1,916,898,292) | (145,710,852) | (3,244,629,096) | |
| (195,122,637) | $(4,719,906,669) | (435,620,990) | $(9,675,995,700) | ||
| Net change | |||||
| Class A | (7,955,588) | $(189,493,072) | (6,534,343) | $(145,670,913) | |
| Class B | (62,626) | (1,484,118) | (167,535) | (3,598,182) | |
| Class C | (1,566,467) | (36,278,736) | (3,126,322) | (66,504,339) | |
| Class I | (35,080,508) | (851,823,344) | (56,123,100) | (1,259,973,638) | |
| Class R1 | (18,077) | (412,682) | (13,170) | (267,108) | |
| Class R2 | (115,002) | (2,706,321) | (574,634) | (12,415,210) | |
| Class R3 | (2,217,924) | (53,036,899) | 817,553 | 17,767,238 | |
| Class R4 | (10,850,023) | (256,426,822) | (1,275,053) | (27,079,420) | |
| Class R6 | (5,946,941) | (149,056,273) | 56,947,351 | 1,260,515,333 | |
| (63,813,156) | $(1,540,718,267) | (10,049,253) | $(237,226,239) | ||
| Affiliated Issuers | Beginning Value | Purchases | Sales Proceeds | Realized Gain (Loss) | Change in Unrealized Appreciation or Depreciation | Ending Value |
| MFS Emerging Markets Equity Fund | $6,580,456,450 | $54,771,667 | $527,648,248 | $(23,404,432) | $466,016,296 | $6,550,191,733 |
| MFS Institutional Money Market Portfolio | 45,245,200 | 416,306,644 | 396,334,637 | (1,264) | (2,600) | 65,213,343 |
| MFS International Growth Fund | 5,786,166,571 | 19,423,249 | 394,411,486 | 26,465,843 | 269,715,313 | 5,707,359,490 |
| MFS International Intrinsic Value Fund | 5,805,800,237 | 48,741,078 | 170,003,782 | (33,180,405) | 67,971,897 | 5,719,329,025 |
| MFS International Large Cap Value Fund | 5,838,361,894 | 38,315,406 | 261,467,846 | 38,770,280 | 77,784,669 | 5,731,764,403 |
| MFS International New Discovery Fund | 3,845,730,677 | 37,716,288 | 196,920,518 | (26,885,084) | 158,734,014 | 3,818,375,377 |
| MFS Research International Fund | 10,690,284,936 | 69,289,675 | 277,620,767 | 16,663,967 | (1,439,434) | 10,497,178,377 |
| $38,592,045,965 | $684,564,007 | $2,224,407,284 | $(1,571,095) | $1,038,780,155 | $38,089,411,748 |
| Affiliated Issuers | Dividend Income | Capital Gain Distributions |
| MFS Emerging Markets Equity Fund | $— | $— |
| MFS Institutional Money Market Portfolio | 1,530,444 | — |
| MFS International Growth Fund | — | — |
| MFS International Intrinsic Value Fund | — | — |
| MFS International Large Cap Value Fund | — | — |
| MFS International New Discovery Fund | — | — |
| MFS Research International Fund | — | — |
| $1,530,444 | $— |
| Number of Dollars | ||||||
| Nominee | For | Against/Withheld | Abstain | |||
| Steven E. Buller | 93,694,553,358.767 | 2,599,093,584.595 | 0.000 | |||
| John A. Caroselli | 94,028,434,411.278 | 2,265,212,532.084 | 0.000 | |||
| Maureen R. Goldfarb | 94,361,674,360.213 | 1,931,972,583.149 | 0.000 | |||
| Peter D. Jones | 94,066,354,687.369 | 2,227,292,255.993 | 0.000 | |||
| John P. Kavanaugh | 94,185,926,082.433 | 2,107,559,444.381 | 161,416.548 | |||
| James W. Kilman, Jr. | 94,450,795,713.326 | 1,842,851,230.036 | 0.000 | |||
| Clarence Otis, Jr. | 93,984,248,122.457 | 2,309,398,820.905 | 0.000 | |||
| Michael W. Roberge | 94,352,210,986.123 | 1,941,435,957.239 | 0.000 | |||
| Maryanne L. Roepke | 94,413,451,878.996 | 1,880,195,064.366 | 0.000 | |||
| Paula E. Smith | 94,545,454,781.292 | 1,748,192,162.070 | 0.000 | |||
| Laurie J. Thomsen | 94,416,793,826.848 | 1,876,853,116.514 | 0.000 | |||
| Darrell A. Williams | 94,451,319,166.310 | 1,842,327,777.051 | 0.000 | |||
| Issuer | Shares/Par | Value ($) | ||
| Common Stocks – 99.2% | ||||
| Aerospace & Defense – 1.0% | ||||
| CACI International, Inc., “A” (a) | 6,367 | $ 2,928,056 | ||
| Standard Aero, Inc. (a) | 29,883 | 856,447 | ||
| $3,784,503 | ||||
| Apparel Manufacturers – 2.3% | ||||
| PVH Corp. | 40,205 | $ 4,357,016 | ||
| Skechers USA, Inc., “A” (a) | 61,868 | 3,948,416 | ||
| $8,305,432 | ||||
| Automotive – 2.0% | ||||
| Blue Bird Corp. (a) | 28,038 | $ 1,139,745 | ||
| Methode Electronics, Inc. | 118,708 | 1,296,291 | ||
| REV Group, Inc. | 95,101 | 2,950,033 | ||
| Visteon Corp. (a) | 20,110 | 1,877,671 | ||
| $7,263,740 | ||||
| Biotechnology – 2.8% | ||||
| Adaptive Biotechnologies Corp. (a) | 50,110 | $ 297,653 | ||
| Alector, Inc. (a) | 136,598 | 353,789 | ||
| Arcus Biosciences, Inc. (a) | 63,240 | 976,426 | ||
| Beam Therapeutics, Inc. (a) | 45,109 | 1,234,633 | ||
| Entrada Therapeutics, Inc. (a) | 54,254 | 1,079,112 | ||
| Exelixis, Inc. (a) | 34,348 | 1,252,328 | ||
| Fate Therapeutics, Inc. (a) | 127,523 | 404,248 | ||
| Novavax, Inc. (a) | 73,066 | 637,135 | ||
| Protagonist Therapeutics, Inc. (a) | 26,126 | 1,144,319 | ||
| Prothena Corp. PLC (a) | 36,081 | 584,873 | ||
| Sana Biotechnology, Inc. (a) | 44,884 | 124,778 | ||
| Sangamo Therapeutics, Inc. (a) | 74,633 | 168,671 | ||
| Twist Bioscience Corp. (a) | 22,919 | 1,127,156 | ||
| Voyager Therapeutics, Inc. (a) | 134,360 | 921,710 | ||
| $10,306,831 | ||||
| Brokerage & Asset Managers – 0.3% | ||||
| A-Mark Precious Metals, Inc. | 20,519 | $ 621,726 | ||
| Hamilton Lane, Inc., “A” | 3,226 | 620,682 | ||
| $1,242,408 | ||||
| Business Services – 4.0% | ||||
| Andersons, Inc. | 3,009 | $ 143,650 | ||
| BlueLinx Holdings, Inc. (a) | 21,751 | 2,734,101 | ||
| TaskUs, Inc., “A” (a) | 234,924 | 3,443,986 | ||
| TriNet Group, Inc. | 39,685 | 3,707,769 | ||
| UL Solutions, Inc. | 4,007 | 215,296 | ||
| WNS (Holdings) Ltd. (a) | 11,415 | 619,035 | ||
| World Fuel Services Corp. | 65,164 | 1,886,498 | ||
| Yext, Inc. (a) | 228,377 | 1,886,394 | ||
| $14,636,729 | ||||
| Issuer | Shares/Par | Value ($) | ||
| Common Stocks – continued | ||||
| Chemicals – 3.1% | ||||
| Avient Corp. | 78,601 | $ 4,028,301 | ||
| Element Solutions, Inc. | 180,633 | 5,180,555 | ||
| Rayonier Advanced Materials, Inc. (a) | 235,115 | 2,071,363 | ||
| $11,280,219 | ||||
| Computer Software – 6.1% | ||||
| ACI Worldwide, Inc. (a) | 22,950 | $ 1,304,019 | ||
| Clear Secure, Inc., “A” | 99,096 | 2,564,604 | ||
| Consensus Cloud Solutions, Inc. (a) | 17,560 | 438,122 | ||
| Dun & Bradstreet Holdings, Inc. | 131,463 | 1,669,580 | ||
| Elastic N.V. (a) | 33,270 | 3,641,734 | ||
| Five9, Inc. (a) | 33,288 | 1,374,129 | ||
| Nutanix, Inc. (a) | 27,691 | 1,807,668 | ||
| OneStream, Inc. (a) | 46,077 | 1,377,242 | ||
| PagerDuty, Inc. (a) | 196,271 | 4,168,796 | ||
| Sabre Corp. (a) | 816,555 | 3,192,730 | ||
| SentinelOne, Inc., “A” (a) | 25,310 | 707,415 | ||
| $22,246,039 | ||||
| Computer Software - Systems – 1.8% | ||||
| Adtran Holdings, Inc. (a) | 54,505 | $ 463,292 | ||
| Pitney Bowes, Inc. | 63,961 | 515,526 | ||
| Rimini Street, Inc. (a) | 229,924 | 496,636 | ||
| ScanSource, Inc. (a) | 5,297 | 267,022 | ||
| Verint Systems, Inc. (a) | 190,303 | 4,795,635 | ||
| $6,538,111 | ||||
| Construction – 2.8% | ||||
| AZEK Co., Inc. (a) | 88,609 | $ 4,706,910 | ||
| Builders FirstSource, Inc. (a) | 14,127 | 2,634,262 | ||
| GMS, Inc. (a) | 27,993 | 2,809,098 | ||
| SiteOne Landscape Supply, Inc. (a) | 1,033 | 158,307 | ||
| $10,308,577 | ||||
| Consumer Products – 4.1% | ||||
| e.l.f. Beauty, Inc. (a) | 18,335 | $ 2,374,749 | ||
| Herbalife Ltd. (a) | 31,811 | 247,171 | ||
| Newell Brands, Inc. | 633,772 | 6,077,874 | ||
| Prestige Consumer Healthcare, Inc. (a) | 72,215 | 6,121,666 | ||
| $14,821,460 | ||||
| Consumer Services – 2.1% | ||||
| Grand Canyon Education, Inc. (a) | 30,960 | $ 5,095,706 | ||
| Lyft, Inc. (a) | 150,343 | 2,609,955 | ||
| $7,705,661 | ||||
| Electrical Equipment – 1.5% | ||||
| Armstrong World Industries, Inc. | 33,879 | $ 5,414,881 | ||
| Electronics – 4.6% | ||||
| Advanced Energy Industries, Inc. | 37,493 | $ 4,313,195 | ||
| Alpha and Omega Semiconductor Ltd. (a) | 7,677 | 318,365 | ||
| Axcelis Technologies, Inc. (a) | 37,349 | 2,772,790 | ||
| Issuer | Shares/Par | Value ($) | ||
| Common Stocks – continued | ||||
| Electronics – continued | ||||
| Cirrus Logic, Inc. (a) | 13,939 | $ 1,455,928 | ||
| Formfactor, Inc. (a) | 41,077 | 1,645,545 | ||
| Photronics, Inc. (a) | 73,369 | 1,827,622 | ||
| Plexus Corp. (a) | 11,716 | 1,926,110 | ||
| Sanmina Corp. (a) | 33,521 | 2,661,903 | ||
| $16,921,458 | ||||
| Energy - Independent – 1.4% | ||||
| Berry Corp. | 318,343 | $ 1,298,839 | ||
| Permian Resources Corp. | 181,468 | 2,841,789 | ||
| SM Energy Co. | 18,529 | 837,326 | ||
| $4,977,954 | ||||
| Energy - Integrated – 0.1% | ||||
| National Gas Fuel Co. | 5,154 | $ 329,701 | ||
| Engineering - Construction – 1.5% | ||||
| APi Group, Inc. (a) | 132,175 | $ 4,993,571 | ||
| Tutor Perini Corp. (a) | 10,349 | 281,286 | ||
| $5,274,857 | ||||
| Food & Beverages – 0.4% | ||||
| Dole PLC | 11,829 | $ 178,263 | ||
| Simply Good Foods Co. (a) | 17,962 | 714,708 | ||
| WK Kellogg Co. | 21,923 | 455,998 | ||
| $1,348,969 | ||||
| Forest & Paper Products – 0.2% | ||||
| JELD-WEN Holding, Inc. (a) | 70,132 | $ 763,737 | ||
| Gaming & Lodging – 1.5% | ||||
| International Game Technology PLC | 133,555 | $ 2,568,263 | ||
| Rush Street Interactive, Inc. (a) | 189,541 | 2,733,181 | ||
| $5,301,444 | ||||
| Insurance – 5.5% | ||||
| Hanover Insurance Group, Inc. | 24,730 | $ 4,080,697 | ||
| Jackson Financial, Inc. | 35,509 | 3,557,647 | ||
| Kemper Corp. | 68,059 | 4,865,538 | ||
| Lincoln National Corp. | 75,415 | 2,680,249 | ||
| Voya Financial, Inc. | 60,451 | 5,017,433 | ||
| $20,201,564 | ||||
| Internet – 2.4% | ||||
| CarGurus, Inc. (a) | 90,257 | $ 3,413,520 | ||
| EverQuote, Inc., “A” (a) | 99,725 | 1,913,723 | ||
| Vimeo, Inc. (a) | 58,720 | 383,441 | ||
| Yelp, Inc. (a) | 55,691 | 2,128,510 | ||
| ZipRecruiter, Inc., “A” (a) | 117,074 | 1,037,276 | ||
| $8,876,470 | ||||
| Issuer | Shares/Par | Value ($) | ||
| Common Stocks – continued | ||||
| Leisure & Toys – 2.5% | ||||
| Corsair Gaming, Inc. (a) | 419,741 | $ 3,085,096 | ||
| Fox Factory Holding Corp. (a) | 12,471 | 405,058 | ||
| Funko, Inc., “A” (a) | 327,266 | 3,845,376 | ||
| Patrick Industries, Inc. | 4,716 | 633,783 | ||
| Playtika Holdings Corp. | 124,003 | 1,044,105 | ||
| $9,013,418 | ||||
| Machinery & Tools – 2.6% | ||||
| Flowserve Corp. | 71,037 | $ 4,334,678 | ||
| Hyster-Yale, Inc. | 2,829 | 159,103 | ||
| Olympic Steel, Inc. | 30,764 | 1,300,702 | ||
| Timken Co. | 47,608 | 3,687,239 | ||
| $9,481,722 | ||||
| Major Banks – 0.4% | ||||
| Metro Bank Holdings PLC (a) | 20,533 | $ 1,333,413 | ||
| Medical & Health Technology & Services – 3.3% | ||||
| Encompass Health Corp. | 57,481 | $ 5,917,094 | ||
| Health Catalyst, Inc. (a) | 253,309 | 2,236,718 | ||
| Owens & Minor, Inc. (a) | 78,827 | 1,061,800 | ||
| Teladoc Health, Inc. (a) | 226,890 | 2,718,142 | ||
| $11,933,754 | ||||
| Medical Equipment – 3.8% | ||||
| Anika Therapeutics, Inc. (a) | 36,404 | $ 645,079 | ||
| Concentra Group Holdings, Inc. | 59,613 | 1,300,756 | ||
| Maravai Lifesciences Holdings, Inc., “A” (a) | 188,221 | 1,067,213 | ||
| MiMedx Group, Inc. (a) | 139,736 | 1,292,558 | ||
| Natera, Inc. (a) | 12,820 | 2,150,940 | ||
| OraSure Technologies, Inc. (a) | 287,063 | 1,090,839 | ||
| Organogenesis Holdings, Inc. (a) | 205,931 | 796,953 | ||
| QuidelOrtho Corp. (a) | 43,691 | 1,791,331 | ||
| UFP Technologies, Inc. (a) | 3,982 | 1,285,867 | ||
| Veracyte, Inc. (a) | 7,448 | 319,892 | ||
| ZimVie, Inc. (a) | 130,154 | 1,921,073 | ||
| $13,662,501 | ||||
| Metals & Mining – 0.9% | ||||
| Radius Recycling, Inc. | 93,890 | $ 1,860,900 | ||
| Ryerson Holding Corp. | 57,509 | 1,477,981 | ||
| $3,338,881 | ||||
| Natural Gas - Distribution – 1.0% | ||||
| Southwest Gas Holdings, Inc. | 4,216 | $ 329,522 | ||
| UGI Corp. | 112,113 | 3,404,872 | ||
| $3,734,394 | ||||
| Oil Services – 2.7% | ||||
| Expro Group Holdings N.V. (a) | 85,033 | $ 1,181,108 | ||
| NOV, Inc. | 171,986 | 2,755,216 | ||
| Oil States International, Inc. (a) | 180,983 | 995,407 | ||
| Select Water Solutions, Inc. | 102,737 | 1,517,425 | ||
| Issuer | Shares/Par | Value ($) | ||
| Common Stocks – continued | ||||
| Oil Services – continued | ||||
| Weatherford International PLC | 40,667 | $ 3,346,894 | ||
| $9,796,050 | ||||
| Other Banks & Diversified Financials – 14.3% | ||||
| Amalgamated Financial Corp. | 69,317 | $ 2,469,765 | ||
| Bank of N.T. Butterfield & Son Ltd. | 55,068 | 2,088,729 | ||
| Bank OZK | 39,039 | 1,950,779 | ||
| Bread Financial Holdings, Inc. | 21,015 | 1,236,312 | ||
| Cathay General Bancorp, Inc. | 97,612 | 5,076,800 | ||
| Columbia Banking System, Inc. | 176,823 | 5,483,281 | ||
| East West Bancorp, Inc. | 40,400 | 4,431,072 | ||
| Equity Bancshares, Inc., “A” | 31,742 | 1,523,299 | ||
| Kearny Financial Corp. of Maryland | 57,145 | 452,588 | ||
| Navient Corp. | 93,153 | 1,451,324 | ||
| Orrstown Financial Services, Inc. | 12,504 | 493,908 | ||
| Popular, Inc. | 46,581 | 4,628,288 | ||
| PROG Holdings, Inc. | 52,442 | 2,551,828 | ||
| SLM Corp. | 204,617 | 5,602,413 | ||
| Texas Capital Bancshares, Inc. (a) | 49,557 | 4,383,317 | ||
| United Community Bank, Inc. | 100,708 | 3,404,938 | ||
| Wintrust Financial Corp. | 34,589 | 4,773,628 | ||
| $52,002,269 | ||||
| Pharmaceuticals – 6.1% | ||||
| ACADIA Pharmaceuticals, Inc. (a) | 47,732 | $ 778,986 | ||
| Alkermes PLC (a) | 41,846 | 1,214,371 | ||
| Amicus Therapeutics, Inc. (a) | 98,531 | 983,339 | ||
| Amneal Pharmaceuticals, Inc. (a) | 149,062 | 1,232,743 | ||
| Arcturus Therapeutics Holdings, Inc. (a) | 48,162 | 883,291 | ||
| Catalyst Pharmaceuticals, Inc. (a) | 60,791 | 1,341,657 | ||
| Collegium Pharmaceutical, Inc. (a) | 5,487 | 167,354 | ||
| Cytokinetics, Inc. (a) | 28,812 | 1,494,190 | ||
| Ironwood Pharmaceuticals, Inc. (a) | 77,768 | 273,743 | ||
| Kiniksa Pharmaceuticals International PLC (a) | 52,239 | 1,153,437 | ||
| Kymera Therapeutics, Inc. (a) | 30,030 | 1,406,906 | ||
| Macrogenics, Inc. (a) | 31,863 | 114,388 | ||
| Neurocrine Biosciences, Inc. (a) | 6,777 | 858,985 | ||
| Nurix Therapeutics, Inc. (a) | 54,270 | 1,199,910 | ||
| Organon & Co. | 225,655 | 3,581,145 | ||
| Pacira BioSciences, Inc. (a) | 11,274 | 190,643 | ||
| Phibro Animal Health Corp., “A” | 77,602 | 1,813,559 | ||
| PTC Therapeutics, Inc. (a) | 35,001 | 1,535,844 | ||
| Ultragenyx Pharmaceutical, Inc. (a) | 17,158 | 817,236 | ||
| USANA Health Sciences, Inc. (a) | 4,620 | 178,009 | ||
| Vanda Pharmaceuticals, Inc. (a) | 144,100 | 742,115 | ||
| Zymeworks, Inc. (a) | 22,049 | 310,670 | ||
| $22,272,521 | ||||
| Printing & Publishing – 0.1% | ||||
| Cimpress PLC (a) | 6,491 | $ 521,227 | ||
| Issuer | Shares/Par | Value ($) | ||
| Common Stocks – continued | ||||
| Railroad & Shipping – 0.8% | ||||
| Scorpio Tankers, Inc. | 28,096 | $ 1,423,343 | ||
| Teekay Tankers Ltd. | 35,692 | 1,436,603 | ||
| $2,859,946 | ||||
| Real Estate – 2.4% | ||||
| Broadstone Net Lease, Inc., REIT | 205,774 | $ 3,603,103 | ||
| Cushman & Wakefield PLC (a) | 262,074 | 4,009,732 | ||
| Essential Properties Realty Trust, REIT | 35,492 | 1,210,277 | ||
| $8,823,112 | ||||
| Real Estate - Office – 2.6% | ||||
| Highwoods Properties, Inc., REIT | 123,703 | $ 4,015,399 | ||
| Piedmont Office Realty Trust, Inc., REIT | 553,284 | 5,267,264 | ||
| $9,282,663 | ||||
| Real Estate - Storage – 0.2% | ||||
| Innovative Industrial Properties, Inc., REIT | 7,115 | $ 775,677 | ||
| Specialty Chemicals – 0.6% | ||||
| Tronox Holdings PLC | 186,235 | $ 2,253,444 | ||
| Specialty Stores – 1.4% | ||||
| Bath & Body Works, Inc. | 39,107 | $ 1,417,238 | ||
| Carvana Co. (a) | 14,558 | 3,791,194 | ||
| $5,208,432 | ||||
| Telephone Services – 0.1% | ||||
| Lumen Technologies, Inc. (a) | 68,649 | $ 503,884 | ||
| Tobacco – 0.3% | ||||
| Mativ Holdings, Inc. | 14,257 | $ 187,480 | ||
| Turning Point Brands, Inc. | 12,146 | 751,837 | ||
| $939,317 | ||||
| Trucking – 1.1% | ||||
| Saia, Inc. (a) | 7,078 | $ 4,027,948 | ||
| Utilities - Electric Power – 0.5% | ||||
| Portland General Electric Co. | 35,238 | $ 1,688,605 | ||
| Total Common Stocks (Identified Cost, $290,034,271) | $361,303,923 | |||
| Investment Companies (h) – 0.7% | ||||
| Money Market Funds – 0.7% | ||||
| MFS Institutional Money Market Portfolio, 4.66% (v) (Identified Cost, $2,665,801) | 2,665,637 | $ 2,665,904 | ||
| Other Assets, Less Liabilities – 0.1% | 295,677 | |||
| Net Assets – 100.0% | $364,265,504 | |||
| (a) | Non-income producing security. | |||
| (h) | An affiliated issuer, which may be considered one in which the fund owns 5% or more of the outstanding voting securities, or a company which is under common control. At period end, the aggregate values of the fund's investments in affiliated issuers and in unaffiliated issuers were $2,665,904 and $361,303,923, respectively. | |||
| (v) | Affiliated issuer that is available only to investment companies managed by MFS. The rate quoted for the MFS Institutional Money Market Portfolio is the annualized seven-day yield of the fund at period end. |
| The following abbreviations are used in this report and are defined: | |
| REIT | Real Estate Investment Trust |
| Financial Statements | Statement of Assets and Liabilities |
| At 11/30/24 (unaudited)Assets | |
| Investments in unaffiliated issuers, at value (identified cost, $290,034,271) | $361,303,923 |
| Investments in affiliated issuers, at value (identified cost, $2,665,801) | 2,665,904 |
| Receivables for | |
| Fund shares sold | 192,940 |
| Interest and dividends | 505,415 |
| Receivable from investment adviser | 10,656 |
| Other assets | 30,488 |
| Total assets | $364,709,326 |
| Liabilities | |
| Payables for | |
| Fund shares reacquired | $326,496 |
| Payable to affiliates | |
| Administrative services fee | 682 |
| Shareholder servicing costs | 60,909 |
| Distribution and service fees | 3,026 |
| Accrued expenses and other liabilities | 52,709 |
| Total liabilities | $443,822 |
| Net assets | $364,265,504 |
| Net assets consist of | |
| Paid-in capital | $267,291,266 |
| Total distributable earnings (loss) | 96,974,238 |
| Net assets | $364,265,504 |
| Shares of beneficial interest outstanding | 21,200,577 |
| Net assets | Shares outstanding | Net asset value per share (a) | |
| Class A | $44,811,998 | 2,631,321 | $17.03 |
| Class B | 247,498 | 15,286 | 16.19 |
| Class C | 4,949,854 | 306,009 | 16.18 |
| Class I | 127,445,054 | 7,400,752 | 17.22 |
| Class R1 | 3,817,894 | 235,830 | 16.19 |
| Class R2 | 15,181,065 | 899,518 | 16.88 |
| Class R3 | 1,339,464 | 78,559 | 17.05 |
| Class R4 | 22,981,085 | 1,332,876 | 17.24 |
| Class R6 | 143,491,592 | 8,300,426 | 17.29 |
| (a) | Maximum offering price per share was equal to the net asset value per share for all share classes, except for Class A, for which the maximum offering price per share was $18.07 [100 / 94.25 x $17.03]. On sales of $50,000 or more, the maximum offering price of Class A shares is reduced. A contingent deferred sales charge may be imposed on redemptions of Class A, Class B, and Class C shares. Redemption price per share was equal to the net asset value per share for Classes I, R1, R2, R3, R4, and R6. |
| Financial Statements | Statement of Operations |
| Six months ended 11/30/24 (unaudited)Net investment income (loss) | |
| Income | |
| Dividends from unaffiliated issuers | $2,469,240 |
| Income on securities loaned | 87,329 |
| Dividends from affiliated issuers | 63,247 |
| Other | 28,132 |
| Foreign taxes withheld | (4,342) |
| Total investment income | $2,643,606 |
| Expenses | |
| Management fee | $1,116,241 |
| Distribution and service fees | 133,208 |
| Shareholder servicing costs | 128,390 |
| Administrative services fee | 29,674 |
| Independent Trustees' compensation | 3,841 |
| Custodian fee | 9,725 |
| Shareholder communications | 15,638 |
| Audit and tax fees | 33,998 |
| Legal fees | 819 |
| Miscellaneous | 84,409 |
| Total expenses | $1,555,943 |
| Reduction of expenses by investment adviser and distributor | (223,539) |
| Net expenses | $1,332,404 |
| Net investment income (loss) | $1,311,202 |
| Realized and unrealized gain (loss) | |
| Realized gain (loss) (identified cost basis) | |
| Unaffiliated issuers | $12,840,423 |
| Affiliated issuers | (347) |
| Net realized gain (loss) | $12,840,076 |
| Change in unrealized appreciation or depreciation | |
| Unaffiliated issuers | $27,418,543 |
| Affiliated issuers | (119) |
| Net unrealized gain (loss) | $27,418,424 |
| Net realized and unrealized gain (loss) | $40,258,500 |
| Change in net assets from operations | $41,569,702 |
| Financial Statements | Statements of Changes in Net Assets |
| Six months ended | Year ended | |
| 11/30/24 (unaudited) | 5/31/24 | |
| Change in net assets | ||
| From operations | ||
| Net investment income (loss) | $1,311,202 | $2,650,178 |
| Net realized gain (loss) | 12,840,076 | 20,992,559 |
| Net unrealized gain (loss) | 27,418,424 | 37,585,722 |
| Change in net assets from operations | $41,569,702 | $61,228,459 |
| Total distributions to shareholders | $— | $(2,451,014) |
| Change in net assets from fund share transactions | $(17,015,021) | $(10,857,124) |
| Total change in net assets | $24,554,681 | $47,920,321 |
| Net assets | ||
| At beginning of period | 339,710,823 | 291,790,502 |
| At end of period | $364,265,504 | $339,710,823 |
| Financial Statements | Financial Highlights |
| Class A | Six months ended | Year ended | ||||
| 11/30/24 (unaudited) | 5/31/24 | 5/31/23 | 5/31/22 | 5/31/21 | 5/31/20 | |
| Net asset value, beginning of period | $15.16 | $12.56 | $14.31 | $17.57 | $11.33 | $12.77 |
| Income (loss) from investment operations | ||||||
| Net investment income (loss) (d) | $0.04 | $0.09 | $0.08 | $0.03 | $0.04 | $0.06 |
| Net realized and unrealized gain (loss) | 1.83 | 2.60 | (1.29) | (1.18) | 6.26 | (1.28) |
| Total from investment operations | $1.87 | $2.69 | $(1.21) | $(1.15) | $6.30 | $(1.22) |
| Less distributions declared to shareholders | ||||||
| From net investment income | $— | $(0.09) | $— | $— | $(0.06) | $(0.05) |
| From net realized gain | — | — | (0.54) | (2.11) | — | (0.17) |
| Total distributions declared to shareholders | $— | $(0.09) | $(0.54) | $(2.11) | $(0.06) | $(0.22) |
| Net asset value, end of period (x) | $17.03 | $15.16 | $12.56 | $14.31 | $17.57 | $11.33 |
| Total return (%) (r)(s)(t)(x) | 12.34(n) | 21.38 | (8.65) | (7.52) | 55.75 | (9.87) |
| Ratios (%) (to average net assets) and Supplemental data: | ||||||
| Expenses before expense reductions | 1.12(a) | 1.13 | 1.13 | 1.13 | 1.12 | 1.16 |
| Expenses after expense reductions | 0.99(a) | 0.99 | 0.99 | 0.99 | 0.99 | 0.99 |
| Net investment income (loss) | 0.55(a) | 0.64 | 0.57 | 0.16 | 0.26 | 0.48 |
| Portfolio turnover rate | 32(n) | 61 | 56 | 72 | 80 | 75 |
| Net assets at end of period (000 omitted) | $44,812 | $40,727 | $33,667 | $40,921 | $73,141 | $57,133 |
| Class B | Six months ended | Year ended | ||||
| 11/30/24 (unaudited) | 5/31/24 | 5/31/23 | 5/31/22 | 5/31/21 | 5/31/20 | |
| Net asset value, beginning of period | $14.47 | $12.01 | $13.81 | $17.15 | $11.10 | $12.56 |
| Income (loss) from investment operations | ||||||
| Net investment income (loss) (d) | $(0.02) | $(0.02) | $(0.02) | $(0.08) | $(0.07) | $(0.03) |
| Net realized and unrealized gain (loss) | 1.74 | 2.48 | (1.24) | (1.15) | 6.12 | (1.26) |
| Total from investment operations | $1.72 | $2.46 | $(1.26) | $(1.23) | $6.05 | $(1.29) |
| Less distributions declared to shareholders | ||||||
| From net investment income | $— | $— | $— | $— | $— | $— |
| From net realized gain | — | — | (0.54) | (2.11) | — | (0.17) |
| Total distributions declared to shareholders | $— | $— | $(0.54) | $(2.11) | $— | $(0.17) |
| Net asset value, end of period (x) | $16.19 | $14.47 | $12.01 | $13.81 | $17.15 | $11.10 |
| Total return (%) (r)(s)(t)(x) | 11.89(n) | 20.48 | (9.34) | (8.21) | 54.50 | (10.53) |
| Ratios (%) (to average net assets) and Supplemental data: | ||||||
| Expenses before expense reductions | 1.87(a) | 1.88 | 1.89 | 1.88 | 1.86 | 1.91 |
| Expenses after expense reductions | 1.74(a) | 1.74 | 1.74 | 1.74 | 1.74 | 1.74 |
| Net investment income (loss) | (0.22)(a) | (0.15) | (0.19) | (0.50) | (0.52) | (0.27) |
| Portfolio turnover rate | 32(n) | 61 | 56 | 72 | 80 | 75 |
| Net assets at end of period (000 omitted) | $247 | $355 | $451 | $664 | $615 | $387 |
| Class C | Six months ended | Year ended | ||||
| 11/30/24 (unaudited) | 5/31/24 | 5/31/23 | 5/31/22 | 5/31/21 | 5/31/20 | |
| Net asset value, beginning of period | $14.46 | $11.99 | $13.79 | $17.14 | $11.09 | $12.55 |
| Income (loss) from investment operations | ||||||
| Net investment income (loss) (d) | $(0.01) | $(0.02) | $(0.02) | $(0.09) | $(0.07) | $(0.03) |
| Net realized and unrealized gain (loss) | 1.73 | 2.49 | (1.24) | (1.15) | 6.12 | (1.26) |
| Total from investment operations | $1.72 | $2.47 | $(1.26) | $(1.24) | $6.05 | $(1.29) |
| Less distributions declared to shareholders | ||||||
| From net investment income | $— | $— | $— | $— | $— | $(0.00)(w) |
| From net realized gain | — | — | (0.54) | (2.11) | — | (0.17) |
| Total distributions declared to shareholders | $— | $— | $(0.54) | $(2.11) | $— | $(0.17) |
| Net asset value, end of period (x) | $16.18 | $14.46 | $11.99 | $13.79 | $17.14 | $11.09 |
| Total return (%) (r)(s)(t)(x) | 11.89(n) | 20.60 | (9.35) | (8.27) | 54.55 | (10.53) |
| Ratios (%) (to average net assets) and Supplemental data: | ||||||
| Expenses before expense reductions | 1.87(a) | 1.88 | 1.89 | 1.88 | 1.87 | 1.91 |
| Expenses after expense reductions | 1.74(a) | 1.74 | 1.74 | 1.74 | 1.74 | 1.74 |
| Net investment income (loss) | (0.20)(a) | (0.13) | (0.18) | (0.53) | (0.50) | (0.26) |
| Portfolio turnover rate | 32(n) | 61 | 56 | 72 | 80 | 75 |
| Net assets at end of period (000 omitted) | $4,950 | $4,989 | $5,319 | $6,593 | $7,503 | $5,133 |
| Class I | Six months ended | Year ended | ||||
| 11/30/24 (unaudited) | 5/31/24 | 5/31/23 | 5/31/22 | 5/31/21 | 5/31/20 | |
| Net asset value, beginning of period | $15.31 | $12.68 | $14.40 | $17.67 | $11.39 | $12.83 |
| Income (loss) from investment operations | ||||||
| Net investment income (loss) (d) | $0.06 | $0.13 | $0.11 | $0.09 | $0.07 | $0.09 |
| Net realized and unrealized gain (loss) | 1.85 | 2.62 | (1.29) | (1.22) | 6.31 | (1.27) |
| Total from investment operations | $1.91 | $2.75 | $(1.18) | $(1.13) | $6.38 | $(1.18) |
| Less distributions declared to shareholders | ||||||
| From net investment income | $— | $(0.12) | $— | $(0.03) | $(0.10) | $(0.09) |
| From net realized gain | — | — | (0.54) | (2.11) | — | (0.17) |
| Total distributions declared to shareholders | $— | $(0.12) | $(0.54) | $(2.14) | $(0.10) | $(0.26) |
| Net asset value, end of period (x) | $17.22 | $15.31 | $12.68 | $14.40 | $17.67 | $11.39 |
| Total return (%) (r)(s)(t)(x) | 12.48(n) | 21.68 | (8.38) | (7.39) | 56.17 | (9.58) |
| Ratios (%) (to average net assets) and Supplemental data: | ||||||
| Expenses before expense reductions | 0.87(a) | 0.88 | 0.88 | 0.88 | 0.87 | 0.91 |
| Expenses after expense reductions | 0.74(a) | 0.74 | 0.74 | 0.74 | 0.74 | 0.74 |
| Net investment income (loss) | 0.80(a) | 0.88 | 0.82 | 0.52 | 0.46 | 0.74 |
| Portfolio turnover rate | 32(n) | 61 | 56 | 72 | 80 | 75 |
| Net assets at end of period (000 omitted) | $127,445 | $115,902 | $102,893 | $115,533 | $80,950 | $53,562 |
| Class R1 | Six months ended | Year ended | ||||
| 11/30/24 (unaudited) | 5/31/24 | 5/31/23 | 5/31/22 | 5/31/21 | 5/31/20 | |
| Net asset value, beginning of period | $14.47 | $12.00 | $13.80 | $17.15 | $11.09 | $12.56 |
| Income (loss) from investment operations | ||||||
| Net investment income (loss) (d) | $(0.01) | $(0.02) | $(0.02) | $(0.08) | $(0.07) | $(0.03) |
| Net realized and unrealized gain (loss) | 1.73 | 2.49 | (1.24) | (1.16) | 6.13 | (1.27) |
| Total from investment operations | $1.72 | $2.47 | $(1.26) | $(1.24) | $6.06 | $(1.30) |
| Less distributions declared to shareholders | ||||||
| From net investment income | $— | $— | $— | $— | $— | $(0.00)(w) |
| From net realized gain | — | — | (0.54) | (2.11) | — | (0.17) |
| Total distributions declared to shareholders | $— | $— | $(0.54) | $(2.11) | $— | $(0.17) |
| Net asset value, end of period (x) | $16.19 | $14.47 | $12.00 | $13.80 | $17.15 | $11.09 |
| Total return (%) (r)(s)(t)(x) | 11.89(n) | 20.58 | (9.35) | (8.26) | 54.64 | (10.59) |
| Ratios (%) (to average net assets) and Supplemental data: | ||||||
| Expenses before expense reductions | 1.87(a) | 1.88 | 1.88 | 1.88 | 1.86 | 1.91 |
| Expenses after expense reductions | 1.74(a) | 1.74 | 1.74 | 1.74 | 1.74 | 1.74 |
| Net investment income (loss) | (0.20)(a) | (0.12) | (0.17) | (0.50) | (0.52) | (0.27) |
| Portfolio turnover rate | 32(n) | 61 | 56 | 72 | 80 | 75 |
| Net assets at end of period (000 omitted) | $3,818 | $3,647 | $3,410 | $3,853 | $4,996 | $2,897 |
| Class R2 | Six months ended | Year ended | ||||
| 11/30/24 (unaudited) | 5/31/24 | 5/31/23 | 5/31/22 | 5/31/21 | 5/31/20 | |
| Net asset value, beginning of period | $15.04 | $12.46 | $14.24 | $17.54 | $11.32 | $12.78 |
| Income (loss) from investment operations | ||||||
| Net investment income (loss) (d) | $0.02 | $0.05 | $0.04 | $(0.00)(w) | $(0.00)(w) | $0.03 |
| Net realized and unrealized gain (loss) | 1.82 | 2.58 | (1.28) | (1.19) | 6.26 | (1.27) |
| Total from investment operations | $1.84 | $2.63 | $(1.24) | $(1.19) | $6.26 | $(1.24) |
| Less distributions declared to shareholders | ||||||
| From net investment income | $— | $(0.05) | $— | $— | $(0.04) | $(0.05) |
| From net realized gain | — | — | (0.54) | (2.11) | — | (0.17) |
| Total distributions declared to shareholders | $— | $(0.05) | $(0.54) | $(2.11) | $(0.04) | $(0.22) |
| Net asset value, end of period (x) | $16.88 | $15.04 | $12.46 | $14.24 | $17.54 | $11.32 |
| Total return (%) (r)(s)(t)(x) | 12.23(n) | 21.11 | (8.91) | (7.77) | 55.37 | (10.07) |
| Ratios (%) (to average net assets) and Supplemental data: | ||||||
| Expenses before expense reductions | 1.37(a) | 1.38 | 1.38 | 1.38 | 1.36 | 1.41 |
| Expenses after expense reductions | 1.24(a) | 1.24 | 1.24 | 1.24 | 1.24 | 1.24 |
| Net investment income (loss) | 0.31(a) | 0.38 | 0.33 | (0.01) | (0.03) | 0.23 |
| Portfolio turnover rate | 32(n) | 61 | 56 | 72 | 80 | 75 |
| Net assets at end of period (000 omitted) | $15,181 | $14,234 | $13,529 | $14,633 | $16,870 | $9,315 |
| Class R3 | Six months ended | Year ended | ||||
| 11/30/24 (unaudited) | 5/31/24 | 5/31/23 | 5/31/22 | 5/31/21 | 5/31/20 | |
| Net asset value, beginning of period | $15.18 | $12.58 | $14.34 | $17.61 | $11.35 | $12.83 |
| Income (loss) from investment operations | ||||||
| Net investment income (loss) (d) | $0.04 | $0.09 | $0.08 | $0.04 | $0.03 | $0.06 |
| Net realized and unrealized gain (loss) | 1.83 | 2.61 | (1.30) | (1.20) | 6.29 | (1.28) |
| Total from investment operations | $1.87 | $2.70 | $(1.22) | $(1.16) | $6.32 | $(1.22) |
| Less distributions declared to shareholders | ||||||
| From net investment income | $— | $(0.10) | $— | $— | $(0.06) | $(0.09) |
| From net realized gain | — | — | (0.54) | (2.11) | — | (0.17) |
| Total distributions declared to shareholders | $— | $(0.10) | $(0.54) | $(2.11) | $(0.06) | $(0.26) |
| Net asset value, end of period (x) | $17.05 | $15.18 | $12.58 | $14.34 | $17.61 | $11.35 |
| Total return (%) (r)(s)(t)(x) | 12.32(n) | 21.45 | (8.70) | (7.55) | 55.83 | (9.92) |
| Ratios (%) (to average net assets) and Supplemental data: | ||||||
| Expenses before expense reductions | 1.12(a) | 1.13 | 1.13 | 1.13 | 1.12 | 1.16 |
| Expenses after expense reductions | 0.99(a) | 0.99 | 0.99 | 0.99 | 0.99 | 0.99 |
| Net investment income (loss) | 0.57(a) | 0.65 | 0.60 | 0.21 | 0.23 | 0.52 |
| Portfolio turnover rate | 32(n) | 61 | 56 | 72 | 80 | 75 |
| Net assets at end of period (000 omitted) | $1,339 | $1,012 | $661 | $450 | $667 | $537 |
| Class R4 | Six months ended | Year ended | ||||
| 11/30/24 (unaudited) | 5/31/24 | 5/31/23 | 5/31/22 | 5/31/21 | 5/31/20 | |
| Net asset value, beginning of period | $15.33 | $12.69 | $14.42 | $17.68 | $11.40 | $12.84 |
| Income (loss) from investment operations | ||||||
| Net investment income (loss) (d) | $0.06 | $0.13 | $0.11 | $0.08 | $0.07 | $0.10 |
| Net realized and unrealized gain (loss) | 1.85 | 2.63 | (1.30) | (1.21) | 6.30 | (1.28) |
| Total from investment operations | $1.91 | $2.76 | $(1.19) | $(1.13) | $6.37 | $(1.18) |
| Less distributions declared to shareholders | ||||||
| From net investment income | $— | $(0.12) | $— | $(0.02) | $(0.09) | $(0.09) |
| From net realized gain | — | — | (0.54) | (2.11) | — | (0.17) |
| Total distributions declared to shareholders | $— | $(0.12) | $(0.54) | $(2.13) | $(0.09) | $(0.26) |
| Net asset value, end of period (x) | $17.24 | $15.33 | $12.69 | $14.42 | $17.68 | $11.40 |
| Total return (%) (r)(s)(t)(x) | 12.46(n) | 21.76 | (8.44) | (7.34) | 56.09 | (9.60) |
| Ratios (%) (to average net assets) and Supplemental data: | ||||||
| Expenses before expense reductions | 0.87(a) | 0.88 | 0.88 | 0.88 | 0.87 | 0.95 |
| Expenses after expense reductions | 0.74(a) | 0.74 | 0.74 | 0.74 | 0.74 | 0.74 |
| Net investment income (loss) | 0.80(a) | 0.89 | 0.83 | 0.48 | 0.53 | 0.96 |
| Portfolio turnover rate | 32(n) | 61 | 56 | 72 | 80 | 75 |
| Net assets at end of period (000 omitted) | $22,981 | $21,298 | $18,322 | $20,000 | $23,281 | $19,044 |
| Class R6 | Six months ended | Year ended | ||||
| 11/30/24 (unaudited) | 5/31/24 | 5/31/23 | 5/31/22 | 5/31/21 | 5/31/20 | |
| Net asset value, beginning of period | $15.36 | $12.72 | $14.44 | $17.70 | $11.40 | $12.85 |
| Income (loss) from investment operations | ||||||
| Net investment income (loss) (d) | $0.07 | $0.14 | $0.13 | $0.10 | $0.09 | $0.10 |
| Net realized and unrealized gain (loss) | 1.86 | 2.64 | (1.31) | (1.21) | 6.32 | (1.28) |
| Total from investment operations | $1.93 | $2.78 | $(1.18) | $(1.11) | $6.41 | $(1.18) |
| Less distributions declared to shareholders | ||||||
| From net investment income | $— | $(0.14) | $— | $(0.04) | $(0.11) | $(0.10) |
| From net realized gain | — | — | (0.54) | (2.11) | — | (0.17) |
| Total distributions declared to shareholders | $— | $(0.14) | $(0.54) | $(2.15) | $(0.11) | $(0.27) |
| Net asset value, end of period (x) | $17.29 | $15.36 | $12.72 | $14.44 | $17.70 | $11.40 |
| Total return (%) (r)(s)(t)(x) | 12.57(n) | 21.83 | (8.36) | (7.23) | 56.40 | (9.59) |
| Ratios (%) (to average net assets) and Supplemental data: | ||||||
| Expenses before expense reductions | 0.76(a) | 0.78 | 0.77 | 0.77 | 0.77 | 0.82 |
| Expenses after expense reductions | 0.63(a) | 0.64 | 0.63 | 0.63 | 0.65 | 0.65 |
| Net investment income (loss) | 0.90(a) | 1.00 | 0.94 | 0.60 | 0.60 | 0.83 |
| Portfolio turnover rate | 32(n) | 61 | 56 | 72 | 80 | 75 |
| Net assets at end of period (000 omitted) | $143,492 | $137,545 | $113,539 | $135,216 | $136,883 | $102,332 |
| (a) | Annualized. |
| (d) | Per share data is based on average shares outstanding. |
| (n) | Not annualized. |
| (r) | Certain expenses have been reduced without which performance would have been lower. |
| (s) | From time to time the fund may receive proceeds from litigation settlements, without which performance would be lower. |
| (t) | Total returns do not include any applicable sales charges. |
| (w) | Per share amount was less than $0.01. |
| (x) | The net asset values and total returns have been calculated on net assets which include adjustments made in accordance with U.S. generally accepted accounting principles required at period end for financial reporting purposes. |
| Financial Instruments | Level 1 | Level 2 | Level 3 | Total |
| Equity Securities | $361,303,923 | $— | $— | $361,303,923 |
| Mutual Funds | 2,665,904 | — | — | 2,665,904 |
| Total | $363,969,827 | $— | $— | $363,969,827 |
| Year ended 5/31/24 | |
| Ordinary income (including any short-term capital gains) | $2,451,014 |
| As of 11/30/24 | |
| Cost of investments | $297,458,862 |
| Gross appreciation | 88,779,524 |
| Gross depreciation | (22,268,559) |
| Net unrealized appreciation (depreciation) | $66,510,965 |
| As of 5/31/24 | |
| Undistributed ordinary income | 2,644,095 |
| Undistributed long-term capital gain | 13,667,900 |
| Net unrealized appreciation (depreciation) | 39,092,541 |
| Six months ended 11/30/24 | Year ended 5/31/24 | ||
| Class A | $— | $224,299 | |
| Class I | — | 819,300 | |
| Class R2 | — | 49,235 | |
| Class R3 | — | 5,746 | |
| Class R4 | — | 170,011 | |
| Class R6 | — | 1,182,423 | |
| Total | $— | $2,451,014 |
| Up to $1 billion | 0.65% |
| In excess of $1 billion and up to $2.5 billion | 0.60% |
| In excess of $2.5 billion | 0.575% |
| Classes | ||||||||
| A | B | C | I | R1 | R2 | R3 | R4 | R6 |
| 0.99% | 1.74% | 1.74% | 0.74% | 1.74% | 1.24% | 0.99% | 0.74% | 0.67% |
| Classes | ||||||||
| A | B | C | I | R1 | R2 | R3 | R4 | R6 |
| 0.99% | 1.74% | 1.74% | 0.74% | 1.74% | 1.24% | 0.99% | 0.74% | 0.66% |
| Distribution Fee Rate (d) | Service Fee Rate (d) | Total Distribution Plan (d) | Annual Effective Rate (e) | Distribution and Service Fee | |
| Class A | — | 0.25% | 0.25% | 0.25% | $ 51,659 |
| Class B | 0.75% | 0.25% | 1.00% | 1.00% | 1,370 |
| Class C | 0.75% | 0.25% | 1.00% | 1.00% | 24,503 |
| Class R1 | 0.75% | 0.25% | 1.00% | 1.00% | 18,083 |
| Class R2 | 0.25% | 0.25% | 0.50% | 0.50% | 36,026 |
| Class R3 | — | 0.25% | 0.25% | 0.25% | 1,567 |
| Total Distribution and Service Fees | $133,208 |
| (d) | In accordance with the distribution plan for certain classes, the fund pays distribution and/or service fees equal to these annual percentage rates of each class’s average daily net assets. The distribution and service fee rates disclosed by class represent the current rates in effect at the end of the reporting period. Any rate changes, if applicable, are detailed below. |
| (e) | The annual effective rates represent actual fees incurred under the distribution plan for the six months ended November 30, 2024 based on each class's average daily net assets. MFD has voluntarily agreed to rebate a portion of each class's 0.25% service fee attributable to accounts for which there is no financial intermediary specified on the account except for accounts attributable to MFS or its affiliates' seed money. For the six months ended November 30, 2024, this rebate amounted to $16 and $33 for Class A and Class C shares, respectively, and is included in the reduction of total expenses in the Statement of Operations. |
| Amount | |
| Class A | $538 |
| Class B | 47 |
| Class C | 430 |
| Date | Transaction | Class | Shares | Amount |
| 08/19/2024 | Redemption | Class A | 3 | $41 |
| 08/19/2024 | Redemption | Class C | 3 | 38 |
| 08/19/2024 | Redemption | Class I | 3 | 41 |
| 08/19/2024 | Redemption | Class R1 | 2 | 35 |
| 08/19/2024 | Redemption | Class R2 | 2 | 37 |
| Six months ended 11/30/24 | Year ended 5/31/24 | ||||
| Shares | Amount | Shares | Amount | ||
| Shares sold | |||||
| Class A | 222,196 | $3,486,841 | 611,486 | $8,803,439 | |
| Class B | 78 | 1,240 | 178 | 2,400 | |
| Class C | 17,361 | 258,820 | 71,842 | 939,356 | |
| Class I | 675,682 | 10,548,537 | 2,385,448 | 35,073,132 | |
| Class R1 | 9,314 | 136,380 | 26,923 | 363,683 | |
| Class R2 | 90,028 | 1,379,591 | 193,064 | 2,700,196 | |
| Class R3 | 24,804 | 371,920 | 15,784 | 226,977 | |
| Class R4 | 82,830 | 1,297,744 | 127,665 | 1,834,434 | |
| Class R6 | 634,889 | 9,895,092 | 1,681,809 | 24,029,689 | |
| 1,757,182 | $27,376,165 | 5,114,199 | $73,973,306 | ||
| Shares issued to shareholders in reinvestment of distributions | |||||
| Class A | — | $— | 14,858 | $224,051 | |
| Class I | — | — | 53,857 | 819,169 | |
| Class R2 | — | — | 3,287 | 49,235 | |
| Class R3 | — | — | 381 | 5,746 | |
| Class R4 | — | — | 11,163 | 170,011 | |
| Class R6 | — | — | 77,484 | 1,181,626 | |
| — | $— | 161,030 | $2,449,838 | ||
| Six months ended 11/30/24 | Year ended 5/31/24 | ||||
| Shares | Amount | Shares | Amount | ||
| Shares reacquired | |||||
| Class A | (277,104) | $(4,282,765) | (621,437) | $(8,824,190) | |
| Class B | (9,355) | (135,522) | (13,197) | (178,166) | |
| Class C | (56,482) | (847,941) | (170,178) | (2,268,888) | |
| Class I | (844,421) | (13,386,647) | (2,987,297) | (42,673,683) | |
| Class R1 | (25,595) | (376,809) | (58,903) | (780,703) | |
| Class R2 | (136,688) | (2,097,219) | (335,910) | (4,693,139) | |
| Class R3 | (12,939) | (194,977) | (2,019) | (29,183) | |
| Class R4 | (139,212) | (2,212,094) | (192,969) | (2,787,483) | |
| Class R6 | (1,287,593) | (20,857,212) | (1,732,499) | (25,044,833) | |
| (2,789,389) | $(44,391,186) | (6,114,409) | $(87,280,268) | ||
| Net change | |||||
| Class A | (54,908) | $(795,924) | 4,907 | $203,300 | |
| Class B | (9,277) | (134,282) | (13,019) | (175,766) | |
| Class C | (39,121) | (589,121) | (98,336) | (1,329,532) | |
| Class I | (168,739) | (2,838,110) | (547,992) | (6,781,382) | |
| Class R1 | (16,281) | (240,429) | (31,980) | (417,020) | |
| Class R2 | (46,660) | (717,628) | (139,559) | (1,943,708) | |
| Class R3 | 11,865 | 176,943 | 14,146 | 203,540 | |
| Class R4 | (56,382) | (914,350) | (54,141) | (783,038) | |
| Class R6 | (652,704) | (10,962,120) | 26,794 | 166,482 | |
| (1,032,207) | $(17,015,021) | (839,180) | $(10,857,124) | ||
| Affiliated Issuers | Beginning Value | Purchases | Sales Proceeds | Realized Gain (Loss) | Change in Unrealized Appreciation or Depreciation | Ending Value |
| MFS Institutional Money Market Portfolio | $2,394,092 | $24,785,800 | $24,513,522 | $(347) | $(119) | $2,665,904 |
| Affiliated Issuers | Dividend Income | Capital Gain Distributions |
| MFS Institutional Money Market Portfolio | $63,247 | $— |
| Number of Dollars | ||||||
| Nominee | For | Against/Withheld | Abstain | |||
| Steven E. Buller | 93,694,553,358.767 | 2,599,093,584.595 | 0.000 | |||
| John A. Caroselli | 94,028,434,411.278 | 2,265,212,532.084 | 0.000 | |||
| Maureen R. Goldfarb | 94,361,674,360.213 | 1,931,972,583.149 | 0.000 | |||
| Peter D. Jones | 94,066,354,687.369 | 2,227,292,255.993 | 0.000 | |||
| John P. Kavanaugh | 94,185,926,082.433 | 2,107,559,444.381 | 161,416.548 | |||
| James W. Kilman, Jr. | 94,450,795,713.326 | 1,842,851,230.036 | 0.000 | |||
| Clarence Otis, Jr. | 93,984,248,122.457 | 2,309,398,820.905 | 0.000 | |||
| Michael W. Roberge | 94,352,210,986.123 | 1,941,435,957.239 | 0.000 | |||
| Maryanne L. Roepke | 94,413,451,878.996 | 1,880,195,064.366 | 0.000 | |||
| Paula E. Smith | 94,545,454,781.292 | 1,748,192,162.070 | 0.000 | |||
| Laurie J. Thomsen | 94,416,793,826.848 | 1,876,853,116.514 | 0.000 | |||
| Darrell A. Williams | 94,451,319,166.310 | 1,842,327,777.051 | 0.000 | |||
| Issuer | Shares/Par | Value ($) | ||
| Common Stocks – 99.0% | ||||
| Aerospace & Defense – 0.3% | ||||
| Leidos Holdings, Inc. | 8,255 | $ 1,365,377 | ||
| Apparel Manufacturers – 0.8% | ||||
| PVH Corp. | 30,053 | $ 3,256,844 | ||
| Automotive – 1.7% | ||||
| Tesla, Inc. (a) | 18,937 | $ 6,536,295 | ||
| Biotechnology – 0.2% | ||||
| Exelixis, Inc. (a) | 8,284 | $ 302,035 | ||
| Illumina, Inc. (a) | 4,049 | 583,663 | ||
| $885,698 | ||||
| Business Services – 2.2% | ||||
| Dropbox, Inc. (a) | 114,823 | $ 3,176,004 | ||
| TriNet Group, Inc. | 10,052 | 939,159 | ||
| Verisk Analytics, Inc., “A” | 15,511 | 4,563,491 | ||
| $8,678,654 | ||||
| Computer Software – 18.7% | ||||
| AppLovin Corp. (a) | 22,638 | $ 7,623,347 | ||
| Atlassian Corp. (a) | 1,944 | 512,400 | ||
| Autodesk, Inc. (a) | 14,762 | 4,309,028 | ||
| Datadog, Inc., “A” (a) | 31,985 | 4,885,709 | ||
| Guidewire Software, Inc. (a) | 20,033 | 4,064,495 | ||
| Microsoft Corp. | 89,218 | 37,780,254 | ||
| Nutanix, Inc. (a) | 15,368 | 1,003,223 | ||
| Salesforce, Inc. | 9,700 | 3,200,903 | ||
| ServiceNow, Inc. (a) | 7,453 | 7,821,476 | ||
| Tyler Technologies, Inc. (a) | 2,865 | 1,802,572 | ||
| $73,003,407 | ||||
| Computer Software - Systems – 10.9% | ||||
| Apple, Inc. | 178,857 | $ 42,448,132 | ||
| Construction – 1.5% | ||||
| Builders FirstSource, Inc. (a) | 14,379 | $ 2,681,252 | ||
| Masco Corp. | 39,193 | 3,157,388 | ||
| $5,838,640 | ||||
| Consumer Products – 1.3% | ||||
| Colgate-Palmolive Co. | 12,324 | $ 1,190,868 | ||
| Kimberly-Clark Corp. | 28,850 | 4,020,248 | ||
| $5,211,116 | ||||
| Issuer | Shares/Par | Value ($) | ||
| Common Stocks – continued | ||||
| Consumer Services – 1.8% | ||||
| Booking Holdings, Inc. | 1,295 | $ 6,736,564 | ||
| Grand Canyon Education, Inc. (a) | 1,786 | 293,958 | ||
| $7,030,522 | ||||
| Electrical Equipment – 0.5% | ||||
| Amphenol Corp., “A” | 28,460 | $ 2,067,619 | ||
| Electronics – 16.6% | ||||
| Applied Materials, Inc. | 27,898 | $ 4,874,060 | ||
| Broadcom, Inc. | 38,280 | 6,204,422 | ||
| Lam Research Corp. | 56,985 | 4,210,052 | ||
| NVIDIA Corp. | 338,859 | 46,847,257 | ||
| NXP Semiconductors N.V. | 12,117 | 2,779,276 | ||
| $64,915,067 | ||||
| Entertainment – 1.7% | ||||
| Spotify Technology S.A. (a) | 13,703 | $ 6,535,783 | ||
| Food & Beverages – 0.1% | ||||
| PepsiCo, Inc. | 1,861 | $ 304,180 | ||
| Health Maintenance Organizations – 1.0% | ||||
| Cigna Group | 11,604 | $ 3,919,831 | ||
| Insurance – 2.9% | ||||
| Ameriprise Financial, Inc. | 9,316 | $ 5,347,104 | ||
| Corebridge Financial, Inc. | 38,273 | 1,238,897 | ||
| Equitable Holdings, Inc. | 96,535 | 4,655,883 | ||
| $11,241,884 | ||||
| Internet – 12.2% | ||||
| Alphabet, Inc., “A” | 99,176 | $ 16,755,785 | ||
| Alphabet, Inc., “C” | 63,568 | 10,837,708 | ||
| Gartner, Inc. (a) | 4,520 | 2,341,044 | ||
| Meta Platforms, Inc., “A” | 30,545 | 17,542,604 | ||
| $47,477,141 | ||||
| Leisure & Toys – 0.6% | ||||
| Hasbro, Inc. | 37,087 | $ 2,416,218 | ||
| Machinery & Tools – 0.2% | ||||
| Flowserve Corp. | 15,681 | $ 956,855 | ||
| Medical & Health Technology & Services – 3.0% | ||||
| IQVIA Holdings, Inc. (a) | 15,030 | $ 3,018,625 | ||
| McKesson Corp. | 6,454 | 4,056,339 | ||
| Veeva Systems, Inc. (a) | 20,032 | 4,564,291 | ||
| $11,639,255 | ||||
| Network & Telecom – 0.6% | ||||
| Qualcomm, Inc. | 15,349 | $ 2,433,277 | ||
| Issuer | Shares/Par | Value ($) | ||
| Common Stocks – continued | ||||
| Other Banks & Diversified Financials – 3.6% | ||||
| American Express Co. | 16,802 | $ 5,119,233 | ||
| Mastercard, Inc., “A” | 3,396 | 1,809,864 | ||
| Northern Trust Corp. | 30,253 | 3,362,924 | ||
| Popular, Inc. | 11,016 | 1,094,550 | ||
| Visa, Inc., “A” | 8,686 | 2,736,785 | ||
| $14,123,356 | ||||
| Pharmaceuticals – 3.6% | ||||
| AbbVie, Inc. | 17,438 | $ 3,189,933 | ||
| Eli Lilly & Co. | 6,226 | 4,951,849 | ||
| Incyte Corp. (a) | 12,398 | 924,767 | ||
| Merck & Co., Inc. | 6,885 | 699,791 | ||
| Pfizer, Inc. | 125,284 | 3,283,694 | ||
| Vertex Pharmaceuticals, Inc. (a) | 2,273 | 1,064,060 | ||
| $14,114,094 | ||||
| Printing & Publishing – 0.9% | ||||
| Lamar Advertising Co., REIT | 26,875 | $ 3,601,787 | ||
| Real Estate – 0.5% | ||||
| Jones Lang LaSalle, Inc. (a) | 7,001 | $ 1,964,480 | ||
| Restaurants – 1.0% | ||||
| Texas Roadhouse, Inc. | 3,198 | $ 656,454 | ||
| Wingstop, Inc. | 9,420 | 3,097,013 | ||
| $3,753,467 | ||||
| Specialty Chemicals – 0.4% | ||||
| RPM International, Inc. | 10,350 | $ 1,436,373 | ||
| Specialty Stores – 9.0% | ||||
| Amazon.com, Inc. (a) | 129,821 | $ 26,988,488 | ||
| Burlington Stores, Inc. (a) | 2,254 | 635,358 | ||
| Costco Wholesale Corp. | 360 | 349,877 | ||
| Home Depot, Inc. | 1,249 | 535,983 | ||
| Ross Stores, Inc. | 14,071 | 2,179,176 | ||
| Target Corp. | 26,792 | 3,544,849 | ||
| TJX Cos., Inc. | 6,429 | 808,061 | ||
| $35,041,792 | ||||
| Utilities - Electric Power – 1.2% | ||||
| NRG Energy, Inc. | 41,378 | $ 4,204,419 | ||
| Vistra Corp. | 2,584 | 413,026 | ||
| $4,617,445 | ||||
| Total Common Stocks (Identified Cost, $185,606,958) | $386,814,589 | |||
| Issuer | Shares/Par | Value ($) | ||
| Investment Companies (h) – 0.8% | ||||
| Money Market Funds – 0.8% | ||||
| MFS Institutional Money Market Portfolio, 4.66% (v) (Identified Cost, $3,066,749) | 3,066,653 | $ 3,066,960 | ||
| Other Assets, Less Liabilities – 0.2% | 890,563 | |||
| Net Assets – 100.0% | $390,772,112 | |||
| (a) | Non-income producing security. | |||
| (h) | An affiliated issuer, which may be considered one in which the fund owns 5% or more of the outstanding voting securities, or a company which is under common control. At period end, the aggregate values of the fund's investments in affiliated issuers and in unaffiliated issuers were $3,066,960 and $386,814,589, respectively. | |||
| (v) | Affiliated issuer that is available only to investment companies managed by MFS. The rate quoted for the MFS Institutional Money Market Portfolio is the annualized seven-day yield of the fund at period end. |
| The following abbreviations are used in this report and are defined: | |
| REIT | Real Estate Investment Trust |
| Financial Statements | Statement of Assets and Liabilities |
| At 11/30/24 (unaudited)Assets | |
| Investments in unaffiliated issuers, at value (identified cost, $185,606,958) | $386,814,589 |
| Investments in affiliated issuers, at value (identified cost, $3,066,749) | 3,066,960 |
| Receivables for | |
| Fund shares sold | 805,681 |
| Dividends | 236,985 |
| Receivable from investment adviser | 3,498 |
| Other assets | 25,868 |
| Total assets | $390,953,581 |
| Liabilities | |
| Payables for | |
| Fund shares reacquired | $93,198 |
| Payable to affiliates | |
| Administrative services fee | 721 |
| Shareholder servicing costs | 34,788 |
| Distribution and service fees | 3,424 |
| Payable for audit and tax fees | 34,119 |
| Accrued expenses and other liabilities | 15,219 |
| Total liabilities | $181,469 |
| Net assets | $390,772,112 |
| Net assets consist of | |
| Paid-in capital | $167,822,270 |
| Total distributable earnings (loss) | 222,949,842 |
| Net assets | $390,772,112 |
| Shares of beneficial interest outstanding | 14,860,016 |
| Net assets | Shares outstanding | Net asset value per share (a) | |
| Class A | $104,612,330 | 4,014,361 | $26.06 |
| Class B | 760,183 | 30,595 | 24.85 |
| Class C | 2,950,975 | 118,966 | 24.81 |
| Class I | 84,967,632 | 3,222,613 | 26.37 |
| Class R1 | 1,269,984 | 51,117 | 24.84 |
| Class R2 | 466,692 | 17,954 | 25.99 |
| Class R3 | 238,210 | 9,086 | 26.22 |
| Class R4 | 196,821 | 7,453 | 26.41 |
| Class R6 | 195,309,285 | 7,387,871 | 26.44 |
| (a) | Maximum offering price per share was equal to the net asset value per share for all share classes, except for Class A, for which the maximum offering price per share was $27.65 [100 / 94.25 x $26.06]. On sales of $50,000 or more, the maximum offering price of Class A shares is reduced. A contingent deferred sales charge may be imposed on redemptions of Class A, Class B, and Class C shares. Redemption price per share was equal to the net asset value per share for Classes I, R1, R2, R3, R4, and R6. |
| Financial Statements | Statement of Operations |
| Six months ended 11/30/24 (unaudited)Net investment income (loss) | |
| Income | |
| Dividends from unaffiliated issuers | $1,288,522 |
| Dividends from affiliated issuers | 87,580 |
| Other | 4,735 |
| Foreign taxes withheld | (3,702) |
| Total investment income | $1,377,135 |
| Expenses | |
| Management fee | $720,061 |
| Distribution and service fees | 134,728 |
| Shareholder servicing costs | 73,495 |
| Administrative services fee | 30,867 |
| Independent Trustees' compensation | 3,908 |
| Custodian fee | 8,789 |
| Shareholder communications | 6,210 |
| Audit and tax fees | 34,697 |
| Legal fees | 762 |
| Registration fees | 72,383 |
| Miscellaneous | 17,440 |
| Total expenses | $1,103,340 |
| Reduction of expenses by investment adviser and distributor | (149,534) |
| Net expenses | $953,806 |
| Net investment income (loss) | $423,329 |
| Realized and unrealized gain (loss) | |
| Realized gain (loss) (identified cost basis) | |
| Unaffiliated issuers | $17,912,415 |
| Affiliated issuers | 876 |
| Net realized gain (loss) | $17,913,291 |
| Change in unrealized appreciation or depreciation | |
| Unaffiliated issuers | $38,636,975 |
| Affiliated issuers | 15 |
| Net unrealized gain (loss) | $38,636,990 |
| Net realized and unrealized gain (loss) | $56,550,281 |
| Change in net assets from operations | $56,973,610 |
| Financial Statements | Statements of Changes in Net Assets |
| Six months ended | Year ended | |
| 11/30/24 (unaudited) | 5/31/24 | |
| Change in net assets | ||
| From operations | ||
| Net investment income (loss) | $423,329 | $738,515 |
| Net realized gain (loss) | 17,913,291 | 15,260,913 |
| Net unrealized gain (loss) | 38,636,990 | 75,679,924 |
| Change in net assets from operations | $56,973,610 | $91,679,352 |
| Total distributions to shareholders | $— | $(1,770,465) |
| Change in net assets from fund share transactions | $(5,007,251) | $3,268,090 |
| Total change in net assets | $51,966,359 | $93,176,977 |
| Net assets | ||
| At beginning of period | 338,805,753 | 245,628,776 |
| At end of period | $390,772,112 | $338,805,753 |
| Financial Statements | Financial Highlights |
| Class A | Six months ended | Year ended | ||||
| 11/30/24 (unaudited) | 5/31/24 | 5/31/23 | 5/31/22 | 5/31/21 | 5/31/20 | |
| Net asset value, beginning of period | $22.33 | $16.25 | $15.89 | $20.10 | $15.79 | $13.25 |
| Income (loss) from investment operations | ||||||
| Net investment income (loss) (d) | $0.00(w) | $0.00(w) | $0.07 | $0.01 | $0.02 | $0.06 |
| Net realized and unrealized gain (loss) | 3.73 | 6.19 | 0.62 | (0.76) | 5.50 | 3.12 |
| Total from investment operations | $3.73 | $6.19 | $0.69 | $(0.75) | $5.52 | $3.18 |
| Less distributions declared to shareholders | ||||||
| From net investment income | $— | $(0.11) | $(0.00)(w) | $— | $(0.04) | $(0.08) |
| From net realized gain | — | — | (0.33) | (3.46) | (1.17) | (0.56) |
| Total distributions declared to shareholders | $— | $(0.11) | $(0.33) | $(3.46) | $(1.21) | $(0.64) |
| Net asset value, end of period (x) | $26.06 | $22.33 | $16.25 | $15.89 | $20.10 | $15.79 |
| Total return (%) (r)(s)(t)(x) | 16.70(n) | 38.18 | 4.54 | (6.92) | 35.89 | 24.34 |
| Ratios (%) (to average net assets) and Supplemental data: | ||||||
| Expenses before expense reductions | 0.82(a) | 0.85 | 0.87 | 0.86 | 0.86 | 0.90 |
| Expenses after expense reductions | 0.74(a) | 0.74 | 0.74 | 0.74 | 0.74 | 0.74 |
| Net investment income (loss) | 0.02(a) | 0.01 | 0.50 | 0.03 | 0.08 | 0.42 |
| Portfolio turnover rate | 24(n) | 48 | 64 | 55 | 71 | 61 |
| Net assets at end of period (000 omitted) | $104,612 | $72,063 | $19,925 | $15,472 | $71,049 | $57,531 |
| Class B | Six months ended | Year ended | ||||
| 11/30/24 (unaudited) | 5/31/24 | 5/31/23 | 5/31/22 | 5/31/21 | 5/31/20 | |
| Net asset value, beginning of period | $21.37 | $15.59 | $15.37 | $19.67 | $15.55 | $13.08 |
| Income (loss) from investment operations | ||||||
| Net investment income (loss) (d) | $(0.08) | $(0.13) | $(0.04) | $(0.14) | $(0.12) | $(0.05) |
| Net realized and unrealized gain (loss) | 3.56 | 5.92 | 0.59 | (0.70) | 5.41 | 3.08 |
| Total from investment operations | $3.48 | $5.79 | $0.55 | $(0.84) | $5.29 | $3.03 |
| Less distributions declared to shareholders | ||||||
| From net investment income | $— | $(0.01) | $— | $— | $— | $— |
| From net realized gain | — | — | (0.33) | (3.46) | (1.17) | (0.56) |
| Total distributions declared to shareholders | $— | $(0.01) | $(0.33) | $(3.46) | $(1.17) | $(0.56) |
| Net asset value, end of period (x) | $24.85 | $21.37 | $15.59 | $15.37 | $19.67 | $15.55 |
| Total return (%) (r)(s)(t)(x) | 16.28(n) | 37.14 | 3.77 | (7.58) | 34.89 | 23.42 |
| Ratios (%) (to average net assets) and Supplemental data: | ||||||
| Expenses before expense reductions | 1.57(a) | 1.60 | 1.62 | 1.63 | 1.61 | 1.65 |
| Expenses after expense reductions | 1.49(a) | 1.49 | 1.49 | 1.49 | 1.49 | 1.49 |
| Net investment income (loss) | (0.72)(a) | (0.73) | (0.24) | (0.73) | (0.67) | (0.33) |
| Portfolio turnover rate | 24(n) | 48 | 64 | 55 | 71 | 61 |
| Net assets at end of period (000 omitted) | $760 | $854 | $478 | $467 | $550 | $408 |
| Class C | Six months ended | Year ended | ||||
| 11/30/24 (unaudited) | 5/31/24 | 5/31/23 | 5/31/22 | 5/31/21 | 5/31/20 | |
| Net asset value, beginning of period | $21.34 | $15.58 | $15.36 | $19.66 | $15.54 | $13.07 |
| Income (loss) from investment operations | ||||||
| Net investment income (loss) (d) | $(0.08) | $(0.14) | $(0.04) | $(0.14) | $(0.12) | $(0.05) |
| Net realized and unrealized gain (loss) | 3.55 | 5.93 | 0.59 | (0.70) | 5.41 | 3.08 |
| Total from investment operations | $3.47 | $5.79 | $0.55 | $(0.84) | $5.29 | $3.03 |
| Less distributions declared to shareholders | ||||||
| From net investment income | $— | $(0.03) | $— | $— | $— | $— |
| From net realized gain | — | — | (0.33) | (3.46) | (1.17) | (0.56) |
| Total distributions declared to shareholders | $— | $(0.03) | $(0.33) | $(3.46) | $(1.17) | $(0.56) |
| Net asset value, end of period (x) | $24.81 | $21.34 | $15.58 | $15.36 | $19.66 | $15.54 |
| Total return (%) (r)(s)(t)(x) | 16.26(n) | 37.16 | 3.77 | (7.58) | 34.91 | 23.44 |
| Ratios (%) (to average net assets) and Supplemental data: | ||||||
| Expenses before expense reductions | 1.57(a) | 1.60 | 1.62 | 1.63 | 1.60 | 1.65 |
| Expenses after expense reductions | 1.49(a) | 1.49 | 1.49 | 1.49 | 1.49 | 1.49 |
| Net investment income (loss) | (0.73)(a) | (0.73) | (0.26) | (0.74) | (0.67) | (0.33) |
| Portfolio turnover rate | 24(n) | 48 | 64 | 55 | 71 | 61 |
| Net assets at end of period (000 omitted) | $2,951 | $2,067 | $1,056 | $874 | $859 | $613 |
| Class I | Six months ended | Year ended | ||||
| 11/30/24 (unaudited) | 5/31/24 | 5/31/23 | 5/31/22 | 5/31/21 | 5/31/20 | |
| Net asset value, beginning of period | $22.57 | $16.39 | $16.00 | $20.21 | $15.87 | $13.31 |
| Income (loss) from investment operations | ||||||
| Net investment income (loss) (d) | $0.03 | $0.05 | $0.11 | $0.05 | $0.06 | $0.10 |
| Net realized and unrealized gain (loss) | 3.77 | 6.25 | 0.63 | (0.75) | 5.54 | 3.14 |
| Total from investment operations | $3.80 | $6.30 | $0.74 | $(0.70) | $5.60 | $3.24 |
| Less distributions declared to shareholders | ||||||
| From net investment income | $— | $(0.12) | $(0.02) | $(0.05) | $(0.09) | $(0.12) |
| From net realized gain | — | — | (0.33) | (3.46) | (1.17) | (0.56) |
| Total distributions declared to shareholders | $— | $(0.12) | $(0.35) | $(3.51) | $(1.26) | $(0.68) |
| Net asset value, end of period (x) | $26.37 | $22.57 | $16.39 | $16.00 | $20.21 | $15.87 |
| Total return (%) (r)(s)(t)(x) | 16.84(n) | 38.56 | 4.81 | (6.66) | 36.23 | 24.71 |
| Ratios (%) (to average net assets) and Supplemental data: | ||||||
| Expenses before expense reductions | 0.57(a) | 0.60 | 0.62 | 0.64 | 0.60 | 0.65 |
| Expenses after expense reductions | 0.49(a) | 0.49 | 0.49 | 0.49 | 0.49 | 0.49 |
| Net investment income (loss) | 0.28(a) | 0.27 | 0.76 | 0.27 | 0.33 | 0.68 |
| Portfolio turnover rate | 24(n) | 48 | 64 | 55 | 71 | 61 |
| Net assets at end of period (000 omitted) | $84,968 | $67,182 | $54,445 | $53,045 | $4,866 | $2,366 |
| Class R1 | Six months ended | Year ended | ||||
| 11/30/24 (unaudited) | 5/31/24 | 5/31/23 | 5/31/22 | 5/31/21 | 5/31/20 | |
| Net asset value, beginning of period | $21.37 | $15.58 | $15.36 | $19.66 | $15.54 | $13.08 |
| Income (loss) from investment operations | ||||||
| Net investment income (loss) (d) | $(0.08) | $(0.13) | $(0.03) | $(0.13) | $(0.12) | $(0.05) |
| Net realized and unrealized gain (loss) | 3.55 | 5.92 | 0.58 | (0.71) | 5.41 | 3.07 |
| Total from investment operations | $3.47 | $5.79 | $0.55 | $(0.84) | $5.29 | $3.02 |
| Less distributions declared to shareholders | ||||||
| From net investment income | $— | $— | $— | $— | $— | $— |
| From net realized gain | — | — | (0.33) | (3.46) | (1.17) | (0.56) |
| Total distributions declared to shareholders | $— | $— | $(0.33) | $(3.46) | $(1.17) | $(0.56) |
| Net asset value, end of period (x) | $24.84 | $21.37 | $15.58 | $15.36 | $19.66 | $15.54 |
| Total return (%) (r)(s)(t)(x) | 16.24(n) | 37.16 | 3.77 | (7.58) | 34.91 | 23.34 |
| Ratios (%) (to average net assets) and Supplemental data: | ||||||
| Expenses before expense reductions | 1.57(a) | 1.60 | 1.62 | 1.63 | 1.60 | 1.64 |
| Expenses after expense reductions | 1.49(a) | 1.49 | 1.49 | 1.49 | 1.49 | 1.49 |
| Net investment income (loss) | (0.73)(a) | (0.73) | (0.23) | (0.70) | (0.67) | (0.33) |
| Portfolio turnover rate | 24(n) | 48 | 64 | 55 | 71 | 61 |
| Net assets at end of period (000 omitted) | $1,270 | $1,144 | $918 | $495 | $320 | $87 |
| Class R2 | Six months ended | Year ended | ||||
| 11/30/24 (unaudited) | 5/31/24 | 5/31/23 | 5/31/22 | 5/31/21 | 5/31/20 | |
| Net asset value, beginning of period | $22.30 | $16.23 | $15.91 | $20.15 | $15.84 | $13.29 |
| Income (loss) from investment operations | ||||||
| Net investment income (loss) (d) | $(0.03) | $(0.04) | $0.04 | $(0.04) | $(0.03) | $0.03 |
| Net realized and unrealized gain (loss) | 3.72 | 6.17 | 0.61 | (0.74) | 5.52 | 3.13 |
| Total from investment operations | $3.69 | $6.13 | $0.65 | $(0.78) | $5.49 | $3.16 |
| Less distributions declared to shareholders | ||||||
| From net investment income | $— | $(0.06) | $— | $— | $(0.01) | $(0.05) |
| From net realized gain | — | — | (0.33) | (3.46) | (1.17) | (0.56) |
| Total distributions declared to shareholders | $— | $(0.06) | $(0.33) | $(3.46) | $(1.18) | $(0.61) |
| Net asset value, end of period (x) | $25.99 | $22.30 | $16.23 | $15.91 | $20.15 | $15.84 |
| Total return (%) (r)(s)(t)(x) | 16.55(n) | 37.82 | 4.28 | (7.07) | 35.52 | 24.10 |
| Ratios (%) (to average net assets) and Supplemental data: | ||||||
| Expenses before expense reductions | 1.07(a) | 1.10 | 1.12 | 1.13 | 1.11 | 1.16 |
| Expenses after expense reductions | 0.99(a) | 0.99 | 0.99 | 0.99 | 0.99 | 0.99 |
| Net investment income (loss) | (0.23)(a) | (0.23) | 0.25 | (0.23) | (0.17) | 0.17 |
| Portfolio turnover rate | 24(n) | 48 | 64 | 55 | 71 | 61 |
| Net assets at end of period (000 omitted) | $467 | $383 | $253 | $200 | $182 | $266 |
| Class R3 | Six months ended | Year ended | ||||
| 11/30/24 (unaudited) | 5/31/24 | 5/31/23 | 5/31/22 | 5/31/21 | 5/31/20 | |
| Net asset value, beginning of period | $22.47 | $16.33 | $15.97 | $20.17 | $15.85 | $13.30 |
| Income (loss) from investment operations | ||||||
| Net investment income (loss) (d) | $0.00(w) | $0.00(w) | $0.08 | $0.00 | $0.02 | $0.06 |
| Net realized and unrealized gain (loss) | 3.75 | 6.23 | 0.61 | (0.74) | 5.52 | 3.14 |
| Total from investment operations | $3.75 | $6.23 | $0.69 | $(0.74) | $5.54 | $3.20 |
| Less distributions declared to shareholders | ||||||
| From net investment income | $— | $(0.09) | $(0.00)(w) | $— | $(0.05) | $(0.09) |
| From net realized gain | — | — | (0.33) | (3.46) | (1.17) | (0.56) |
| Total distributions declared to shareholders | $— | $(0.09) | $(0.33) | $(3.46) | $(1.22) | $(0.65) |
| Net asset value, end of period (x) | $26.22 | $22.47 | $16.33 | $15.97 | $20.17 | $15.85 |
| Total return (%) (r)(s)(t)(x) | 16.69(n) | 38.22 | 4.52 | (6.85) | 35.85 | 24.35 |
| Ratios (%) (to average net assets) and Supplemental data: | ||||||
| Expenses before expense reductions | 0.82(a) | 0.85 | 0.87 | 0.88 | 0.85 | 0.90 |
| Expenses after expense reductions | 0.74(a) | 0.74 | 0.74 | 0.74 | 0.74 | 0.74 |
| Net investment income (loss) | 0.02(a) | 0.02 | 0.51 | 0.02 | 0.08 | 0.42 |
| Portfolio turnover rate | 24(n) | 48 | 64 | 55 | 71 | 61 |
| Net assets at end of period (000 omitted) | $238 | $203 | $147 | $122 | $130 | $90 |
| Class R4 | Six months ended | Year ended | ||||
| 11/30/24 (unaudited) | 5/31/24 | 5/31/23 | 5/31/22 | 5/31/21 | 5/31/20 | |
| Net asset value, beginning of period | $22.60 | $16.42 | $16.03 | $20.23 | $15.87 | $13.32 |
| Income (loss) from investment operations | ||||||
| Net investment income (loss) (d) | $0.03 | $0.05 | $0.11 | $0.05 | $0.06 | $0.10 |
| Net realized and unrealized gain (loss) | 3.78 | 6.25 | 0.63 | (0.75) | 5.56 | 3.13 |
| Total from investment operations | $3.81 | $6.30 | $0.74 | $(0.70) | $5.62 | $3.23 |
| Less distributions declared to shareholders | ||||||
| From net investment income | $— | $(0.12) | $(0.02) | $(0.04) | $(0.09) | $(0.12) |
| From net realized gain | — | — | (0.33) | (3.46) | (1.17) | (0.56) |
| Total distributions declared to shareholders | $— | $(0.12) | $(0.35) | $(3.50) | $(1.26) | $(0.68) |
| Net asset value, end of period (x) | $26.41 | $22.60 | $16.42 | $16.03 | $20.23 | $15.87 |
| Total return (%) (r)(s)(t)(x) | 16.86(n) | 38.51 | 4.80 | (6.64) | 36.34 | 24.60 |
| Ratios (%) (to average net assets) and Supplemental data: | ||||||
| Expenses before expense reductions | 0.57(a) | 0.60 | 0.62 | 0.63 | 0.60 | 0.65 |
| Expenses after expense reductions | 0.49(a) | 0.49 | 0.49 | 0.49 | 0.49 | 0.49 |
| Net investment income (loss) | 0.27(a) | 0.27 | 0.76 | 0.27 | 0.33 | 0.67 |
| Portfolio turnover rate | 24(n) | 48 | 64 | 55 | 71 | 61 |
| Net assets at end of period (000 omitted) | $197 | $168 | $122 | $116 | $124 | $91 |
| Class R6 | Six months ended | Year ended | ||||
| 11/30/24 (unaudited) | 5/31/24 | 5/31/23 | 5/31/22 | 5/31/21 | 5/31/20 | |
| Net asset value, beginning of period | $22.62 | $16.43 | $16.03 | $20.23 | $15.89 | $13.32 |
| Income (loss) from investment operations | ||||||
| Net investment income (loss) (d) | $0.04 | $0.06 | $0.13 | $0.07 | $0.08 | $0.11 |
| Net realized and unrealized gain (loss) | 3.78 | 6.26 | 0.62 | (0.75) | 5.53 | 3.16 |
| Total from investment operations | $3.82 | $6.32 | $0.75 | $(0.68) | $5.61 | $3.27 |
| Less distributions declared to shareholders | ||||||
| From net investment income | $— | $(0.13) | $(0.02) | $(0.06) | $(0.10) | $(0.14) |
| From net realized gain | — | — | (0.33) | (3.46) | (1.17) | (0.56) |
| Total distributions declared to shareholders | $— | $(0.13) | $(0.35) | $(3.52) | $(1.27) | $(0.70) |
| Net asset value, end of period (x) | $26.44 | $22.62 | $16.43 | $16.03 | $20.23 | $15.89 |
| Total return (%) (r)(s)(t)(x) | 16.89(n) | 38.63 | 4.91 | (6.57) | 36.29 | 24.86 |
| Ratios (%) (to average net assets) and Supplemental data: | ||||||
| Expenses before expense reductions | 0.51(a) | 0.53 | 0.54 | 0.54 | 0.52 | 0.55 |
| Expenses after expense reductions | 0.42(a) | 0.42 | 0.42 | 0.40 | 0.40 | 0.39 |
| Net investment income (loss) | 0.34(a) | 0.34 | 0.82 | 0.36 | 0.42 | 0.77 |
| Portfolio turnover rate | 24(n) | 48 | 64 | 55 | 71 | 61 |
| Net assets at end of period (000 omitted) | $195,309 | $194,742 | $168,286 | $158,585 | $185,568 | $145,833 |
| (a) | Annualized. |
| (d) | Per share data is based on average shares outstanding. |
| (n) | Not annualized. |
| (r) | Certain expenses have been reduced without which performance would have been lower. |
| (s) | From time to time the fund may receive proceeds from litigation settlements, without which performance would be lower. |
| (t) | Total returns do not include any applicable sales charges. |
| (w) | Per share amount was less than $0.01. |
| (x) | The net asset values and total returns have been calculated on net assets which include adjustments made in accordance with U.S. generally accepted accounting principles required at period end for financial reporting purposes. |
| Financial Instruments | Level 1 | Level 2 | Level 3 | Total |
| Equity Securities | $386,814,589 | $— | $— | $386,814,589 |
| Mutual Funds | 3,066,960 | — | — | 3,066,960 |
| Total | $389,881,549 | $— | $— | $389,881,549 |
| Year ended 5/31/24 | |
| Ordinary income (including any short-term capital gains) | $1,770,465 |
| As of 11/30/24 | |
| Cost of investments | $191,330,958 |
| Gross appreciation | 200,127,077 |
| Gross depreciation | (1,576,486) |
| Net unrealized appreciation (depreciation) | $198,550,591 |
| As of 5/31/24 | |
| Undistributed ordinary income | 735,614 |
| Undistributed long-term capital gain | 5,314,501 |
| Net unrealized appreciation (depreciation) | 159,926,117 |
| Six months ended 11/30/24 | Year ended 5/31/24 | ||
| Class A | $— | $197,828 | |
| Class B | — | 327 | |
| Class C | — | 2,119 | |
| Class I | — | 354,433 | |
| Class R2 | — | 960 | |
| Class R3 | — | 785 | |
| Class R4 | — | 900 | |
| Class R6 | — | 1,213,113 | |
| Total | $— | $1,770,465 |
| Up to $1 billion | 0.40% |
| In excess of $1 billion and up to $2.5 billion | 0.375% |
| In excess of $2.5 billion | 0.35% |
| Classes | ||||||||
| A | B | C | I | R1 | R2 | R3 | R4 | R6 |
| 0.74% | 1.49% | 1.49% | 0.49% | 1.49% | 0.99% | 0.74% | 0.49% | 0.43% |
| Distribution Fee Rate (d) | Service Fee Rate (d) | Total Distribution Plan (d) | Annual Effective Rate (e) | Distribution and Service Fee | |
| Class A | — | 0.25% | 0.25% | 0.25% | $ 110,349 |
| Class B | 0.75% | 0.25% | 1.00% | 1.00% | 3,939 |
| Class C | 0.75% | 0.25% | 1.00% | 1.00% | 12,967 |
| Class R1 | 0.75% | 0.25% | 1.00% | 1.00% | 6,145 |
| Class R2 | 0.25% | 0.25% | 0.50% | 0.50% | 1,054 |
| Class R3 | — | 0.25% | 0.25% | 0.25% | 274 |
| Total Distribution and Service Fees | $134,728 |
| (d) | In accordance with the distribution plan for certain classes, the fund pays distribution and/or service fees equal to these annual percentage rates of each class’s average daily net assets. The distribution and service fee rates disclosed by class represent the current rates in effect at the end of the reporting period. Any rate changes, if applicable, are detailed below. |
| (e) | The annual effective rates represent actual fees incurred under the distribution plan for the six months ended November 30, 2024 based on each class's average daily net assets. MFD has voluntarily agreed to rebate a portion of each class's 0.25% service fee attributable to accounts for which there is no financial intermediary specified on the account except for accounts attributable to MFS or its affiliates' seed money. For the six months ended November 30, 2024, this rebate amounted to $20 and $3 for Class A and Class C shares, respectively, and is included in the reduction of total expenses in the Statement of Operations. |
| Amount | |
| Class A | $897 |
| Class B | 3 |
| Class C | 100 |
| Date | Transaction | Class | Shares | Amount |
| 8/19/2024 | Redemption | Class A | 3 | $36 |
| 8/19/2024 | Redemption | Class C | 5,968 | 72,131 |
| 8/19/2024 | Redemption | Class I | 2 | 30 |
| Six months ended 11/30/24 | Year ended 5/31/24 | ||||
| Shares | Amount | Shares | Amount | ||
| Shares sold | |||||
| Class A | 1,313,187 | $31,613,878 | 2,472,567 | $48,709,454 | |
| Class B | 2,866 | 63,221 | 27,001 | 476,842 | |
| Class C | 36,152 | 826,966 | 44,993 | 841,502 | |
| Class I | 674,030 | 16,838,018 | 878,377 | 16,863,761 | |
| Class R1 | 1,665 | 37,897 | 2,314 | 40,516 | |
| Class R2 | 817 | 19,740 | 1,602 | 30,587 | |
| Class R3 | 61 | 1,459 | 102 | 1,883 | |
| Class R6 | 476,069 | 11,336,178 | 1,184,199 | 22,708,762 | |
| 2,504,847 | $60,737,357 | 4,611,155 | $89,673,307 | ||
| Shares issued to shareholders in reinvestment of distributions | |||||
| Class A | — | $— | 10,404 | $197,566 | |
| Class B | — | — | 18 | 327 | |
| Class C | — | — | 116 | 2,110 | |
| Class I | — | — | 18,488 | 354,414 | |
| Class R2 | — | — | 51 | 960 | |
| Class R3 | — | — | 41 | 785 | |
| Class R4 | — | — | 47 | 900 | |
| Class R6 | — | — | 63,150 | 1,213,113 | |
| — | $— | 92,315 | $1,770,175 | ||
| Shares reacquired | |||||
| Class A | (525,726) | $(12,470,889) | (482,376) | $(9,674,938) | |
| Class B | (12,232) | (280,851) | (17,707) | (307,388) | |
| Class C | (14,050) | (325,708) | (16,013) | (294,397) | |
| Class I | (428,487) | (10,452,915) | (1,241,959) | (23,036,762) | |
| Class R1 | (4,081) | (95,192) | (7,701) | (143,522) | |
| Class R2 | (14) | (348) | (90) | (1,782) | |
| Class R3 | (2) | (50) | (92) | (1,763) | |
| Class R6 | (1,697,726) | (42,118,655) | (2,882,734) | (54,714,840) | |
| (2,682,318) | $(65,744,608) | (4,648,672) | $(88,175,392) | ||
| Net change | |||||
| Class A | 787,461 | $19,142,989 | 2,000,595 | $39,232,082 | |
| Class B | (9,366) | (217,630) | 9,312 | 169,781 | |
| Class C | 22,102 | 501,258 | 29,096 | 549,215 | |
| Class I | 245,543 | 6,385,103 | (345,094) | (5,818,587) | |
| Class R1 | (2,416) | (57,295) | (5,387) | (103,006) | |
| Class R2 | 803 | 19,392 | 1,563 | 29,765 | |
| Class R3 | 59 | 1,409 | 51 | 905 | |
| Class R4 | — | — | 47 | 900 | |
| Class R6 | (1,221,657) | (30,782,477) | (1,635,385) | (30,792,965) | |
| (177,471) | $(5,007,251) | 54,798 | $3,268,090 | ||
| Affiliated Issuers | Beginning Value | Purchases | Sales Proceeds | Realized Gain (Loss) | Change in Unrealized Appreciation or Depreciation | Ending Value |
| MFS Institutional Money Market Portfolio | $1,969,671 | $32,980,547 | $31,884,149 | $876 | $15 | $3,066,960 |
| Affiliated Issuers | Dividend Income | Capital Gain Distributions |
| MFS Institutional Money Market Portfolio | $87,580 | $— |
| Number of Dollars | ||||||
| Nominee | For | Against/Withheld | Abstain | |||
| Steven E. Buller | 93,694,553,358.767 | 2,599,093,584.595 | 0.000 | |||
| John A. Caroselli | 94,028,434,411.278 | 2,265,212,532.084 | 0.000 | |||
| Maureen R. Goldfarb | 94,361,674,360.213 | 1,931,972,583.149 | 0.000 | |||
| Peter D. Jones | 94,066,354,687.369 | 2,227,292,255.993 | 0.000 | |||
| John P. Kavanaugh | 94,185,926,082.433 | 2,107,559,444.381 | 161,416.548 | |||
| James W. Kilman, Jr. | 94,450,795,713.326 | 1,842,851,230.036 | 0.000 | |||
| Clarence Otis, Jr. | 93,984,248,122.457 | 2,309,398,820.905 | 0.000 | |||
| Michael W. Roberge | 94,352,210,986.123 | 1,941,435,957.239 | 0.000 | |||
| Maryanne L. Roepke | 94,413,451,878.996 | 1,880,195,064.366 | 0.000 | |||
| Paula E. Smith | 94,545,454,781.292 | 1,748,192,162.070 | 0.000 | |||
| Laurie J. Thomsen | 94,416,793,826.848 | 1,876,853,116.514 | 0.000 | |||
| Darrell A. Williams | 94,451,319,166.310 | 1,842,327,777.051 | 0.000 | |||
| Issuer | Shares/Par | Value ($) | ||
| Common Stocks – 99.3% | ||||
| Aerospace & Defense – 3.8% | ||||
| CACI International, Inc., “A” (a) | 1,299 | $ 597,384 | ||
| General Dynamics Corp. | 14,093 | 4,002,553 | ||
| General Electric Co. | 8,070 | 1,470,031 | ||
| Leidos Holdings, Inc. | 18,037 | 2,983,320 | ||
| RTX Corp. | 20,556 | 2,504,338 | ||
| $11,557,626 | ||||
| Apparel Manufacturers – 1.3% | ||||
| PVH Corp. | 35,368 | $ 3,832,830 | ||
| Biotechnology – 1.2% | ||||
| Biogen, Inc. (a) | 9,003 | $ 1,446,152 | ||
| Gilead Sciences, Inc. | 15,094 | 1,397,402 | ||
| Illumina, Inc. (a) | 6,158 | 887,676 | ||
| $3,731,230 | ||||
| Brokerage & Asset Managers – 2.5% | ||||
| Cboe Global Markets, Inc. | 2,881 | $ 621,864 | ||
| Charles Schwab Corp. | 8,090 | 669,528 | ||
| Citigroup, Inc. | 69,112 | 4,897,967 | ||
| Interactive Brokers Group, Inc. | 6,840 | 1,307,056 | ||
| $7,496,415 | ||||
| Business Services – 2.3% | ||||
| Accenture PLC, “A” | 4,977 | $ 1,803,516 | ||
| Fiserv, Inc. (a) | 23,890 | 5,278,734 | ||
| $7,082,250 | ||||
| Chemicals – 0.9% | ||||
| Eastman Chemical Co. | 27,314 | $ 2,860,322 | ||
| Computer Software – 1.8% | ||||
| Guidewire Software, Inc. (a) | 3,250 | $ 659,393 | ||
| Salesforce, Inc. | 14,369 | 4,741,626 | ||
| $5,401,019 | ||||
| Construction – 3.7% | ||||
| Builders FirstSource, Inc. (a) | 15,879 | $ 2,960,957 | ||
| CRH PLC | 6,190 | 633,051 | ||
| Essex Property Trust, Inc., REIT | 2,521 | 782,670 | ||
| Masco Corp. | 28,766 | 2,317,389 | ||
| Mohawk Industries, Inc. (a) | 8,277 | 1,149,096 | ||
| Stanley Black & Decker, Inc. | 37,220 | 3,329,329 | ||
| $11,172,492 | ||||
| Issuer | Shares/Par | Value ($) | ||
| Common Stocks – continued | ||||
| Consumer Products – 3.5% | ||||
| Colgate-Palmolive Co. | 40,791 | $ 3,941,634 | ||
| International Flavors & Fragrances, Inc. | 10,160 | 928,218 | ||
| Kimberly-Clark Corp. | 24,918 | 3,472,323 | ||
| Newell Brands, Inc. | 226,878 | 2,175,760 | ||
| $10,517,935 | ||||
| Consumer Services – 1.1% | ||||
| Booking Holdings, Inc. | 626 | $ 3,256,439 | ||
| Electrical Equipment – 1.5% | ||||
| Amphenol Corp., “A” | 63,922 | $ 4,643,933 | ||
| Electronics – 2.8% | ||||
| Applied Materials, Inc. | 17,267 | $ 3,016,718 | ||
| Lam Research Corp. | 36,869 | 2,723,882 | ||
| NXP Semiconductors N.V. | 11,588 | 2,657,939 | ||
| $8,398,539 | ||||
| Energy - Independent – 5.1% | ||||
| ConocoPhillips | 37,253 | $ 4,035,990 | ||
| EOG Resources, Inc. | 33,936 | 4,522,311 | ||
| Phillips 66 | 29,994 | 4,018,596 | ||
| Valero Energy Corp. | 19,986 | 2,779,653 | ||
| $15,356,550 | ||||
| Energy - Integrated – 1.7% | ||||
| Exxon Mobil Corp. | 30,125 | $ 3,553,545 | ||
| National Gas Fuel Co. | 24,201 | 1,548,138 | ||
| $5,101,683 | ||||
| Food & Beverages – 2.6% | ||||
| General Mills, Inc. | 37,199 | $ 2,464,806 | ||
| Mondelez International, Inc. | 58,280 | 3,785,286 | ||
| PepsiCo, Inc. | 9,906 | 1,619,135 | ||
| $7,869,227 | ||||
| Health Maintenance Organizations – 2.2% | ||||
| Cigna Group | 14,672 | $ 4,956,201 | ||
| UnitedHealth Group, Inc. | 2,938 | 1,792,768 | ||
| $6,748,969 | ||||
| Insurance – 6.9% | ||||
| American International Group, Inc. | 5,653 | $ 434,603 | ||
| Ameriprise Financial, Inc. | 6,622 | 3,800,829 | ||
| Berkshire Hathaway, Inc., “B” (a) | 11,677 | 5,640,225 | ||
| Chubb Ltd. | 17,004 | 4,909,565 | ||
| Corebridge Financial, Inc. | 76,672 | 2,481,873 | ||
| Everest Group Ltd. | 2,115 | 819,689 | ||
| Hartford Financial Services Group, Inc. | 14,561 | 1,795,517 | ||
| MetLife, Inc. | 14,015 | 1,236,543 | ||
| $21,118,844 | ||||
| Issuer | Shares/Par | Value ($) | ||
| Common Stocks – continued | ||||
| Internet – 2.1% | ||||
| Alphabet, Inc., “A” | 20,192 | $ 3,411,439 | ||
| Meta Platforms, Inc., “A” | 5,338 | 3,065,720 | ||
| $6,477,159 | ||||
| Leisure & Toys – 0.2% | ||||
| Hasbro, Inc. | 8,939 | $ 582,376 | ||
| Machinery & Tools – 4.8% | ||||
| CNH Industrial N.V. | 151,363 | $ 1,901,119 | ||
| Eaton Corp. PLC | 14,563 | 5,467,242 | ||
| Trane Technologies PLC | 7,894 | 3,285,641 | ||
| Wabtec Corp. | 20,270 | 4,066,567 | ||
| $14,720,569 | ||||
| Major Banks – 7.6% | ||||
| Bank of America Corp. | 34,392 | $ 1,633,964 | ||
| Goldman Sachs Group, Inc. | 6,332 | 3,853,465 | ||
| JPMorgan Chase & Co. | 38,647 | 9,650,929 | ||
| Morgan Stanley | 4,706 | 619,357 | ||
| Wells Fargo & Co. | 96,464 | 7,347,663 | ||
| $23,105,378 | ||||
| Medical & Health Technology & Services – 2.0% | ||||
| McKesson Corp. | 7,285 | $ 4,578,623 | ||
| Veeva Systems, Inc. (a) | 6,111 | 1,392,391 | ||
| $5,971,014 | ||||
| Medical Equipment – 3.1% | ||||
| Abbott Laboratories | 9,627 | $ 1,143,399 | ||
| Becton, Dickinson and Co. | 12,153 | 2,696,751 | ||
| Boston Scientific Corp. (a) | 14,719 | 1,334,424 | ||
| Medtronic PLC | 49,166 | 4,254,826 | ||
| $9,429,400 | ||||
| Metals & Mining – 0.4% | ||||
| United States Steel Corp. | 28,497 | $ 1,161,823 | ||
| Network & Telecom – 1.6% | ||||
| Motorola Solutions, Inc. | 2,693 | $ 1,345,692 | ||
| Qualcomm, Inc. | 21,787 | 3,453,893 | ||
| $4,799,585 | ||||
| Oil Services – 1.0% | ||||
| TechnipFMC PLC (a) | 94,572 | $ 2,966,724 | ||
| Other Banks & Diversified Financials – 3.6% | ||||
| American Express Co. | 17,843 | $ 5,436,405 | ||
| Northern Trust Corp. | 10,343 | 1,149,728 | ||
| Popular, Inc. | 38,007 | 3,776,375 | ||
| Synchrony Financial | 8,880 | 599,578 | ||
| $10,962,086 | ||||
| Issuer | Shares/Par | Value ($) | ||
| Common Stocks – continued | ||||
| Pharmaceuticals – 6.6% | ||||
| AbbVie, Inc. | 7,405 | $ 1,354,597 | ||
| Johnson & Johnson | 50,740 | 7,865,207 | ||
| Organon & Co. | 85,423 | 1,355,663 | ||
| Pfizer, Inc. | 196,842 | 5,159,229 | ||
| Vertex Pharmaceuticals, Inc. (a) | 9,193 | 4,303,519 | ||
| $20,038,215 | ||||
| Railroad & Shipping – 2.5% | ||||
| CSX Corp. | 112,388 | $ 4,107,781 | ||
| Union Pacific Corp. | 14,174 | 3,467,811 | ||
| $7,575,592 | ||||
| Real Estate – 2.4% | ||||
| Essential Properties Realty Trust, REIT | 65,517 | $ 2,234,130 | ||
| Jones Lang LaSalle, Inc. (a) | 7,434 | 2,085,980 | ||
| W.P. Carey, Inc., REIT | 52,122 | 2,974,081 | ||
| $7,294,191 | ||||
| Real Estate - Office – 1.9% | ||||
| Cousins Properties, Inc., REIT | 56,723 | $ 1,800,388 | ||
| Highwoods Properties, Inc., REIT | 121,176 | 3,933,373 | ||
| $5,733,761 | ||||
| Restaurants – 0.3% | ||||
| Aramark | 21,944 | $ 892,901 | ||
| Specialty Chemicals – 2.2% | ||||
| Linde PLC | 5,635 | $ 2,597,679 | ||
| RPM International, Inc. | 30,072 | 4,173,392 | ||
| $6,771,071 | ||||
| Specialty Stores – 3.4% | ||||
| Home Depot, Inc. | 3,290 | $ 1,411,838 | ||
| O'Reilly Automotive, Inc. (a) | 3,139 | 3,902,468 | ||
| Target Corp. | 25,361 | 3,355,514 | ||
| TJX Cos., Inc. | 13,186 | 1,657,348 | ||
| $10,327,168 | ||||
| Telecommunications - Wireless – 2.1% | ||||
| SBA Communications Corp., REIT | 4,221 | $ 955,001 | ||
| T-Mobile USA, Inc. | 21,686 | 5,355,141 | ||
| $6,310,142 | ||||
| Tobacco – 1.9% | ||||
| Altria Group, Inc. | 51,229 | $ 2,957,962 | ||
| Philip Morris International, Inc. | 21,130 | 2,811,558 | ||
| $5,769,520 | ||||
| Utilities - Electric Power – 4.7% | ||||
| Dominion Energy, Inc. | 17,589 | $ 1,033,354 | ||
| Duke Energy Corp. | 30,021 | 3,513,958 | ||
| Edison International | 17,767 | 1,559,054 | ||
| Issuer | Shares/Par | Value ($) | ||
| Common Stocks – continued | ||||
| Utilities - Electric Power – continued | ||||
| NextEra Energy, Inc. | 72,549 | $ 5,707,430 | ||
| NRG Energy, Inc. | 11,996 | 1,218,913 | ||
| PG&E Corp. | 57,339 | 1,240,243 | ||
| $14,272,952 | ||||
| Total Common Stocks (Identified Cost, $213,860,967) | $301,307,930 | |||
| Investment Companies (h) – 0.5% | ||||
| Money Market Funds – 0.5% | ||||
| MFS Institutional Money Market Portfolio, 4.66% (v) (Identified Cost, $1,550,194) | 1,550,039 | $ 1,550,194 | ||
| Other Assets, Less Liabilities – 0.2% | 465,792 | |||
| Net Assets – 100.0% | $303,323,916 | |||
| (a) | Non-income producing security. | |||
| (h) | An affiliated issuer, which may be considered one in which the fund owns 5% or more of the outstanding voting securities, or a company which is under common control. At period end, the aggregate values of the fund's investments in affiliated issuers and in unaffiliated issuers were $1,550,194 and $301,307,930, respectively. | |||
| (v) | Affiliated issuer that is available only to investment companies managed by MFS. The rate quoted for the MFS Institutional Money Market Portfolio is the annualized seven-day yield of the fund at period end. |
| The following abbreviations are used in this report and are defined: | |
| REIT | Real Estate Investment Trust |
| Financial Statements | Statement of Assets and Liabilities |
| At 11/30/24 (unaudited)Assets | |
| Investments in unaffiliated issuers, at value (identified cost, $213,860,967) | $301,307,930 |
| Investments in affiliated issuers, at value (identified cost, $1,550,194) | 1,550,194 |
| Receivables for | |
| Fund shares sold | 63,964 |
| Dividends | 661,543 |
| Receivable from investment adviser | 7,917 |
| Other assets | 30,425 |
| Total assets | $303,621,973 |
| Liabilities | |
| Payables for | |
| Fund shares reacquired | $220,867 |
| Payable to affiliates | |
| Administrative services fee | 587 |
| Shareholder servicing costs | 24,320 |
| Distribution and service fees | 1,004 |
| Payable for independent Trustees' compensation | 52 |
| Payable for audit and tax fees | 34,132 |
| Accrued expenses and other liabilities | 17,095 |
| Total liabilities | $298,057 |
| Net assets | $303,323,916 |
| Net assets consist of | |
| Paid-in capital | $182,856,027 |
| Total distributable earnings (loss) | 120,467,889 |
| Net assets | $303,323,916 |
| Shares of beneficial interest outstanding | 16,720,876 |
| Net assets | Shares outstanding | Net asset value per share (a) | |
| Class A | $28,975,448 | 1,590,729 | $18.22 |
| Class B | 288,842 | 16,136 | 17.90 |
| Class C | 1,460,459 | 82,303 | 17.74 |
| Class I | 63,074,781 | 3,486,491 | 18.09 |
| Class R1 | 123,714 | 6,897 | 17.94 |
| Class R2 | 150,602 | 8,379 | 17.97 |
| Class R3 | 383,237 | 21,261 | 18.03 |
| Class R4 | 132,128 | 7,293 | 18.12 |
| Class R6 | 208,734,705 | 11,501,387 | 18.15 |
| (a) | Maximum offering price per share was equal to the net asset value per share for all share classes, except for Class A, for which the maximum offering price per share was $19.33 [100 / 94.25 x $18.22]. On sales of $50,000 or more, the maximum offering price of Class A shares is reduced. A contingent deferred sales charge may be imposed on redemptions of Class A, Class B, and Class C shares. Redemption price per share was equal to the net asset value per share for Classes I, R1, R2, R3, R4, and R6. |
| Financial Statements | Statement of Operations |
| Six months ended 11/30/24 (unaudited)Net investment income (loss) | |
| Income | |
| Dividends from unaffiliated issuers | $3,107,660 |
| Dividends from affiliated issuers | 64,260 |
| Other | 3,501 |
| Foreign taxes withheld | (4,880) |
| Total investment income | $3,170,541 |
| Expenses | |
| Management fee | $593,092 |
| Distribution and service fees | 43,512 |
| Shareholder servicing costs | 39,270 |
| Administrative services fee | 26,341 |
| Independent Trustees' compensation | 3,525 |
| Custodian fee | 8,340 |
| Shareholder communications | 4,764 |
| Audit and tax fees | 35,198 |
| Legal fees | 700 |
| Registration fees | 64,874 |
| Miscellaneous | 17,305 |
| Total expenses | $836,921 |
| Reduction of expenses by investment adviser and distributor | (139,365) |
| Net expenses | $697,556 |
| Net investment income (loss) | $2,472,985 |
| Realized and unrealized gain (loss) | |
| Realized gain (loss) (identified cost basis) | |
| Unaffiliated issuers | $17,403,229 |
| Affiliated issuers | 41 |
| Net realized gain (loss) | $17,403,270 |
| Change in unrealized appreciation or depreciation | |
| Unaffiliated issuers | $9,447,614 |
| Affiliated issuers | (412) |
| Net unrealized gain (loss) | $9,447,202 |
| Net realized and unrealized gain (loss) | $26,850,472 |
| Change in net assets from operations | $29,323,457 |
| Financial Statements | Statements of Changes in Net Assets |
| Six months ended | Year ended | |
| 11/30/24 (unaudited) | 5/31/24 | |
| Change in net assets | ||
| From operations | ||
| Net investment income (loss) | $2,472,985 | $4,712,528 |
| Net realized gain (loss) | 17,403,270 | 16,512,216 |
| Net unrealized gain (loss) | 9,447,202 | 43,733,159 |
| Change in net assets from operations | $29,323,457 | $64,957,903 |
| Total distributions to shareholders | $— | $(9,661,076) |
| Change in net assets from fund share transactions | $(23,553,582) | $3,544,009 |
| Total change in net assets | $5,769,875 | $58,840,836 |
| Net assets | ||
| At beginning of period | 297,554,041 | 238,713,205 |
| At end of period | $303,323,916 | $297,554,041 |
| Financial Statements | Financial Highlights |
| Class A | Six months ended | Year ended | ||||
| 11/30/24 (unaudited) | 5/31/24 | 5/31/23 | 5/31/22 | 5/31/21 | 5/31/20 | |
| Net asset value, beginning of period | $16.53 | $13.45 | $15.05 | $16.28 | $11.48 | $12.07 |
| Income (loss) from investment operations | ||||||
| Net investment income (loss) (d) | $0.12 | $0.22 | $0.20 | $0.19 | $0.20 | $0.24 |
| Net realized and unrealized gain (loss) | 1.57 | 3.36 | (0.68) | 0.29 | 4.82 | (0.57) |
| Total from investment operations | $1.69 | $3.58 | $(0.48) | $0.48 | $5.02 | $(0.33) |
| Less distributions declared to shareholders | ||||||
| From net investment income | $— | $(0.18) | $(0.15) | $(0.01) | $(0.22) | $(0.26) |
| From net realized gain | — | (0.32) | (0.97) | (1.70) | — | — |
| Total distributions declared to shareholders | $— | $(0.50) | $(1.12) | $(1.71) | $(0.22) | $(0.26) |
| Net asset value, end of period (x) | $18.22 | $16.53 | $13.45 | $15.05 | $16.28 | $11.48 |
| Total return (%) (r)(s)(t)(x) | 10.22(n) | 27.03 | (3.51) | 3.02 | 44.17 | (3.04) |
| Ratios (%) (to average net assets) and Supplemental data: | ||||||
| Expenses before expense reductions | 0.83(a) | 0.85 | 0.86 | 0.86 | 0.86 | 0.91 |
| Expenses after expense reductions | 0.74(a) | 0.74 | 0.74 | 0.74 | 0.74 | 0.74 |
| Net investment income (loss) | 1.40(a) | 1.49 | 1.41 | 1.17 | 1.48 | 1.96 |
| Portfolio turnover rate | 25(n) | 55 | 51 | 49 | 57 | 45 |
| Net assets at end of period (000 omitted) | $28,975 | $26,761 | $22,380 | $17,572 | $68,612 | $52,735 |
| Class B | Six months ended | Year ended | ||||
| 11/30/24 (unaudited) | 5/31/24 | 5/31/23 | 5/31/22 | 5/31/21 | 5/31/20 | |
| Net asset value, beginning of period | $16.30 | $13.21 | $14.85 | $16.28 | $11.46 | $12.07 |
| Income (loss) from investment operations | ||||||
| Net investment income (loss) (d) | $0.05 | $0.10 | $0.09 | $0.09 | $0.10 | $0.15 |
| Net realized and unrealized gain (loss) | 1.55 | 3.31 | (0.68) | 0.28 | 4.82 | (0.59) |
| Total from investment operations | $1.60 | $3.41 | $(0.59) | $0.37 | $4.92 | $(0.44) |
| Less distributions declared to shareholders | ||||||
| From net investment income | $— | $— | $(0.08) | $(0.10) | $(0.10) | $(0.17) |
| From net realized gain | — | (0.32) | (0.97) | (1.70) | — | — |
| Total distributions declared to shareholders | $— | $(0.32) | $(1.05) | $(1.80) | $(0.10) | $(0.17) |
| Net asset value, end of period (x) | $17.90 | $16.30 | $13.21 | $14.85 | $16.28 | $11.46 |
| Total return (%) (r)(s)(t)(x) | 9.82(n) | 26.05 | (4.29) | 2.32 | 43.10 | (3.87) |
| Ratios (%) (to average net assets) and Supplemental data: | ||||||
| Expenses before expense reductions | 1.58(a) | 1.60 | 1.61 | 1.60 | 1.61 | 1.65 |
| Expenses after expense reductions | 1.49(a) | 1.49 | 1.49 | 1.49 | 1.49 | 1.49 |
| Net investment income (loss) | 0.65(a) | 0.71 | 0.67 | 0.56 | 0.73 | 1.20 |
| Portfolio turnover rate | 25(n) | 55 | 51 | 49 | 57 | 45 |
| Net assets at end of period (000 omitted) | $289 | $329 | $560 | $439 | $140 | $132 |
| Class C | Six months ended | Year ended | ||||
| 11/30/24 (unaudited) | 5/31/24 | 5/31/23 | 5/31/22 | 5/31/21 | 5/31/20 | |
| Net asset value, beginning of period | $16.16 | $13.19 | $14.78 | $16.22 | $11.45 | $12.05 |
| Income (loss) from investment operations | ||||||
| Net investment income (loss) (d) | $0.05 | $0.11 | $0.09 | $0.08 | $0.10 | $0.15 |
| Net realized and unrealized gain (loss) | 1.53 | 3.27 | (0.67) | 0.28 | 4.81 | (0.58) |
| Total from investment operations | $1.58 | $3.38 | $(0.58) | $0.36 | $4.91 | $(0.43) |
| Less distributions declared to shareholders | ||||||
| From net investment income | $— | $(0.09) | $(0.04) | $(0.10) | $(0.14) | $(0.17) |
| From net realized gain | — | (0.32) | (0.97) | (1.70) | — | — |
| Total distributions declared to shareholders | $— | $(0.41) | $(1.01) | $(1.80) | $(0.14) | $(0.17) |
| Net asset value, end of period (x) | $17.74 | $16.16 | $13.19 | $14.78 | $16.22 | $11.45 |
| Total return (%) (r)(s)(t)(x) | 9.78(n) | 25.97 | (4.20) | 2.29 | 43.08 | (3.76) |
| Ratios (%) (to average net assets) and Supplemental data: | ||||||
| Expenses before expense reductions | 1.58(a) | 1.60 | 1.61 | 1.61 | 1.61 | 1.66 |
| Expenses after expense reductions | 1.49(a) | 1.49 | 1.49 | 1.49 | 1.49 | 1.49 |
| Net investment income (loss) | 0.65(a) | 0.75 | 0.67 | 0.53 | 0.72 | 1.20 |
| Portfolio turnover rate | 25(n) | 55 | 51 | 49 | 57 | 45 |
| Net assets at end of period (000 omitted) | $1,460 | $1,389 | $966 | $974 | $873 | $456 |
| Class I | Six months ended | Year ended | ||||
| 11/30/24 (unaudited) | 5/31/24 | 5/31/23 | 5/31/22 | 5/31/21 | 5/31/20 | |
| Net asset value, beginning of period | $16.40 | $13.35 | $14.93 | $16.37 | $11.54 | $12.13 |
| Income (loss) from investment operations | ||||||
| Net investment income (loss) (d) | $0.14 | $0.26 | $0.23 | $0.25 | $0.24 | $0.28 |
| Net realized and unrealized gain (loss) | 1.55 | 3.33 | (0.67) | 0.27 | 4.84 | (0.58) |
| Total from investment operations | $1.69 | $3.59 | $(0.44) | $0.52 | $5.08 | $(0.30) |
| Less distributions declared to shareholders | ||||||
| From net investment income | $— | $(0.22) | $(0.17) | $(0.26) | $(0.25) | $(0.29) |
| From net realized gain | — | (0.32) | (0.97) | (1.70) | — | — |
| Total distributions declared to shareholders | $— | $(0.54) | $(1.14) | $(1.96) | $(0.25) | $(0.29) |
| Net asset value, end of period (x) | $18.09 | $16.40 | $13.35 | $14.93 | $16.37 | $11.54 |
| Total return (%) (r)(s)(t)(x) | 10.30(n) | 27.34 | (3.24) | 3.25 | 44.51 | (2.84) |
| Ratios (%) (to average net assets) and Supplemental data: | ||||||
| Expenses before expense reductions | 0.58(a) | 0.60 | 0.61 | 0.61 | 0.61 | 0.65 |
| Expenses after expense reductions | 0.49(a) | 0.49 | 0.49 | 0.49 | 0.49 | 0.49 |
| Net investment income (loss) | 1.65(a) | 1.74 | 1.67 | 1.61 | 1.70 | 2.18 |
| Portfolio turnover rate | 25(n) | 55 | 51 | 49 | 57 | 45 |
| Net assets at end of period (000 omitted) | $63,075 | $59,883 | $52,655 | $56,857 | $1,517 | $488 |
| Class R1 | Six months ended | Year ended | ||||
| 11/30/24 (unaudited) | 5/31/24 | 5/31/23 | 5/31/22 | 5/31/21 | 5/31/20 | |
| Net asset value, beginning of period | $16.28 | $13.26 | $14.84 | $16.22 | $11.45 | $12.05 |
| Income (loss) from investment operations | ||||||
| Net investment income (loss) (d) | $0.12 | $0.22 | $0.20 | $0.20 | $0.10 | $0.15 |
| Net realized and unrealized gain (loss) | 1.54 | 3.31 | (0.67) | 0.28 | 4.80 | (0.58) |
| Total from investment operations | $1.66 | $3.53 | $(0.47) | $0.48 | $4.90 | $(0.43) |
| Less distributions declared to shareholders | ||||||
| From net investment income | $— | $(0.19) | $(0.14) | $(0.16) | $(0.13) | $(0.17) |
| From net realized gain | — | (0.32) | (0.97) | (1.70) | — | — |
| Total distributions declared to shareholders | $— | $(0.51) | $(1.11) | $(1.86) | $(0.13) | $(0.17) |
| Net asset value, end of period (x) | $17.94 | $16.28 | $13.26 | $14.84 | $16.22 | $11.45 |
| Total return (%) (r)(s)(t)(x) | 10.20(n) | 27.00 | (3.49) | 3.04 | 43.07 | (3.79) |
| Ratios (%) (to average net assets) and Supplemental data: | ||||||
| Expenses before expense reductions | 0.83(a) | 0.85 | 0.86 | 0.86 | 1.61 | 1.65 |
| Expenses after expense reductions | 0.74(a) | 0.74 | 0.74 | 0.74 | 1.49 | 1.49 |
| Net investment income (loss) | 1.40(a) | 1.49 | 1.42 | 1.27 | 0.72 | 1.21 |
| Portfolio turnover rate | 25(n) | 55 | 51 | 49 | 57 | 45 |
| Net assets at end of period (000 omitted) | $124 | $112 | $88 | $92 | $89 | $62 |
| Class R2 | Six months ended | Year ended | ||||
| 11/30/24 (unaudited) | 5/31/24 | 5/31/23 | 5/31/22 | 5/31/21 | 5/31/20 | |
| Net asset value, beginning of period | $16.33 | $13.30 | $14.89 | $16.31 | $11.50 | $12.10 |
| Income (loss) from investment operations | ||||||
| Net investment income (loss) (d) | $0.10 | $0.18 | $0.16 | $0.16 | $0.17 | $0.21 |
| Net realized and unrealized gain (loss) | 1.54 | 3.32 | (0.68) | 0.29 | 4.83 | (0.57) |
| Total from investment operations | $1.64 | $3.50 | $(0.52) | $0.45 | $5.00 | $(0.36) |
| Less distributions declared to shareholders | ||||||
| From net investment income | $— | $(0.15) | $(0.10) | $(0.17) | $(0.19) | $(0.24) |
| From net realized gain | — | (0.32) | (0.97) | (1.70) | — | — |
| Total distributions declared to shareholders | $— | $(0.47) | $(1.07) | $(1.87) | $(0.19) | $(0.24) |
| Net asset value, end of period (x) | $17.97 | $16.33 | $13.30 | $14.89 | $16.31 | $11.50 |
| Total return (%) (r)(s)(t)(x) | 10.04(n) | 26.70 | (3.79) | 2.81 | 43.83 | (3.31) |
| Ratios (%) (to average net assets) and Supplemental data: | ||||||
| Expenses before expense reductions | 1.08(a) | 1.10 | 1.11 | 1.11 | 1.11 | 1.16 |
| Expenses after expense reductions | 0.99(a) | 0.99 | 0.99 | 0.99 | 0.99 | 0.99 |
| Net investment income (loss) | 1.15(a) | 1.24 | 1.17 | 1.03 | 1.23 | 1.71 |
| Portfolio turnover rate | 25(n) | 55 | 51 | 49 | 57 | 45 |
| Net assets at end of period (000 omitted) | $151 | $136 | $105 | $111 | $104 | $77 |
| Class R3 | Six months ended | Year ended | ||||
| 11/30/24 (unaudited) | 5/31/24 | 5/31/23 | 5/31/22 | 5/31/21 | 5/31/20 | |
| Net asset value, beginning of period | $16.36 | $13.32 | $14.90 | $16.36 | $11.53 | $12.13 |
| Income (loss) from investment operations | ||||||
| Net investment income (loss) (d) | $0.12 | $0.22 | $0.20 | $0.21 | $0.20 | $0.25 |
| Net realized and unrealized gain (loss) | 1.55 | 3.33 | (0.67) | 0.27 | 4.85 | (0.58) |
| Total from investment operations | $1.67 | $3.55 | $(0.47) | $0.48 | $5.05 | $(0.33) |
| Less distributions declared to shareholders | ||||||
| From net investment income | $— | $(0.19) | $(0.14) | $(0.24) | $(0.22) | $(0.27) |
| From net realized gain | — | (0.32) | (0.97) | (1.70) | — | — |
| Total distributions declared to shareholders | $— | $(0.51) | $(1.11) | $(1.94) | $(0.22) | $(0.27) |
| Net asset value, end of period (x) | $18.03 | $16.36 | $13.32 | $14.90 | $16.36 | $11.53 |
| Total return (%) (r)(s)(t)(x) | 10.21(n) | 27.01 | (3.48) | 3.02 | 44.17 | (3.09) |
| Ratios (%) (to average net assets) and Supplemental data: | ||||||
| Expenses before expense reductions | 0.83(a) | 0.85 | 0.86 | 0.86 | 0.86 | 0.90 |
| Expenses after expense reductions | 0.74(a) | 0.74 | 0.74 | 0.74 | 0.74 | 0.74 |
| Net investment income (loss) | 1.40(a) | 1.49 | 1.43 | 1.33 | 1.48 | 1.93 |
| Portfolio turnover rate | 25(n) | 55 | 51 | 49 | 57 | 45 |
| Net assets at end of period (000 omitted) | $383 | $336 | $292 | $312 | $103 | $71 |
| Class R4 | Six months ended | Year ended | ||||
| 11/30/24 (unaudited) | 5/31/24 | 5/31/23 | 5/31/22 | 5/31/21 | 5/31/20 | |
| Net asset value, beginning of period | $16.42 | $13.37 | $14.96 | $16.37 | $11.54 | $12.14 |
| Income (loss) from investment operations | ||||||
| Net investment income (loss) (d) | $0.14 | $0.26 | $0.23 | $0.24 | $0.23 | $0.28 |
| Net realized and unrealized gain (loss) | 1.56 | 3.33 | (0.68) | 0.30 | 4.85 | (0.58) |
| Total from investment operations | $1.70 | $3.59 | $(0.45) | $0.54 | $5.08 | $(0.30) |
| Less distributions declared to shareholders | ||||||
| From net investment income | $— | $(0.22) | $(0.17) | $(0.25) | $(0.25) | $(0.30) |
| From net realized gain | — | (0.32) | (0.97) | (1.70) | — | — |
| Total distributions declared to shareholders | $— | $(0.54) | $(1.14) | $(1.95) | $(0.25) | $(0.30) |
| Net asset value, end of period (x) | $18.12 | $16.42 | $13.37 | $14.96 | $16.37 | $11.54 |
| Total return (%) (r)(s)(t)(x) | 10.35(n) | 27.30 | (3.29) | 3.38 | 44.52 | (2.86) |
| Ratios (%) (to average net assets) and Supplemental data: | ||||||
| Expenses before expense reductions | 0.58(a) | 0.60 | 0.61 | 0.61 | 0.61 | 0.66 |
| Expenses after expense reductions | 0.49(a) | 0.49 | 0.49 | 0.49 | 0.49 | 0.49 |
| Net investment income (loss) | 1.65(a) | 1.74 | 1.67 | 1.53 | 1.73 | 2.21 |
| Portfolio turnover rate | 25(n) | 55 | 51 | 49 | 57 | 45 |
| Net assets at end of period (000 omitted) | $132 | $120 | $94 | $97 | $94 | $65 |
| Class R6 | Six months ended | Year ended | ||||
| 11/30/24 (unaudited) | 5/31/24 | 5/31/23 | 5/31/22 | 5/31/21 | 5/31/20 | |
| Net asset value, beginning of period | $16.44 | $13.39 | $14.97 | $16.39 | $11.56 | $12.15 |
| Income (loss) from investment operations | ||||||
| Net investment income (loss) (d) | $0.15 | $0.27 | $0.25 | $0.25 | $0.25 | $0.29 |
| Net realized and unrealized gain (loss) | 1.56 | 3.33 | (0.68) | 0.29 | 4.85 | (0.57) |
| Total from investment operations | $1.71 | $3.60 | $(0.43) | $0.54 | $5.10 | $(0.28) |
| Less distributions declared to shareholders | ||||||
| From net investment income | $— | $(0.23) | $(0.18) | $(0.26) | $(0.27) | $(0.31) |
| From net realized gain | — | (0.32) | (0.97) | (1.70) | — | — |
| Total distributions declared to shareholders | $— | $(0.55) | $(1.15) | $(1.96) | $(0.27) | $(0.31) |
| Net asset value, end of period (x) | $18.15 | $16.44 | $13.39 | $14.97 | $16.39 | $11.56 |
| Total return (%) (r)(s)(t)(x) | 10.40(n) | 27.34 | (3.15) | 3.41 | 44.57 | (2.69) |
| Ratios (%) (to average net assets) and Supplemental data: | ||||||
| Expenses before expense reductions | 0.51(a) | 0.53 | 0.53 | 0.52 | 0.52 | 0.56 |
| Expenses after expense reductions | 0.42(a) | 0.42 | 0.42 | 0.40 | 0.40 | 0.39 |
| Net investment income (loss) | 1.72(a) | 1.81 | 1.75 | 1.61 | 1.83 | 2.32 |
| Portfolio turnover rate | 25(n) | 55 | 51 | 49 | 57 | 45 |
| Net assets at end of period (000 omitted) | $208,735 | $208,489 | $161,572 | $162,638 | $190,875 | $140,463 |
| (a) | Annualized. |
| (d) | Per share data is based on average shares outstanding. |
| (n) | Not annualized. |
| (r) | Certain expenses have been reduced without which performance would have been lower. |
| (s) | From time to time the fund may receive proceeds from litigation settlements, without which performance would be lower. |
| (t) | Total returns do not include any applicable sales charges. |
| (x) | The net asset values and total returns have been calculated on net assets which include adjustments made in accordance with U.S. generally accepted accounting principles required at period end for financial reporting purposes. |
| Financial Instruments | Level 1 | Level 2 | Level 3 | Total |
| Equity Securities | $301,307,930 | $— | $— | $301,307,930 |
| Mutual Funds | 1,550,194 | — | — | 1,550,194 |
| Total | $302,858,124 | $— | $— | $302,858,124 |
| Year ended 5/31/24 | |
| Ordinary income (including any short-term capital gains) | $4,001,019 |
| Long-term capital gains | 5,660,057 |
| Total distributions | $9,661,076 |
| As of 11/30/24 | |
| Cost of investments | $216,870,285 |
| Gross appreciation | 90,674,475 |
| Gross depreciation | (4,686,636) |
| Net unrealized appreciation (depreciation) | $85,987,839 |
| As of 5/31/24 | |
| Undistributed ordinary income | 5,667,358 |
| Undistributed long-term capital gain | 8,885,641 |
| Net unrealized appreciation (depreciation) | 76,591,433 |
| Six months ended 11/30/24 | Year ended 5/31/24 | ||
| Class A | $— | $755,611 | |
| Class B | — | 7,465 | |
| Class C | — | 33,472 | |
| Class I | — | 2,015,558 | |
| Class R1 | — | 3,373 | |
| Class R2 | — | 3,764 | |
| Class R3 | — | 10,245 | |
| Class R4 | — | 3,803 | |
| Class R6 | — | 6,827,785 | |
| Total | $— | $9,661,076 |
| Up to $1 billion | 0.40% |
| In excess of $1 billion and up to $2.5 billion | 0.375% |
| In excess of $2.5 billion | 0.35% |
| Classes | ||||||||
| A | B | C | I | R1 | R2 | R3 | R4 | R6 |
| 0.74% | 1.49% | 1.49% | 0.49% | 1.49% | 0.99% | 0.74% | 0.49% | 0.44% |
| Distribution Fee Rate (d) | Service Fee Rate (d) | Total Distribution Plan (d) | Annual Effective Rate (e) | Distribution and Service Fee | |
| Class A | — | 0.25% | 0.25% | 0.25% | $ 34,144 |
| Class B | 0.75% | 0.25% | 1.00% | 1.00% | 1,551 |
| Class C | 0.75% | 0.25% | 1.00% | 1.00% | 6,881 |
| Class R1 | 0.75% | 0.25% | 1.00% | 0.25% | 145 |
| Class R2 | 0.25% | 0.25% | 0.50% | 0.50% | 352 |
| Class R3 | — | 0.25% | 0.25% | 0.25% | 439 |
| Total Distribution and Service Fees | $43,512 |
| (d) | In accordance with the distribution plan for certain classes, the fund pays distribution and/or service fees equal to these annual percentage rates of each class’s average daily net assets. The distribution and service fee rates disclosed by class represent the current rates in effect at the end of the reporting period. Any rate changes, if applicable, are detailed below. |
| (e) | The annual effective rates represent actual fees incurred under the distribution plan for the six months ended November 30, 2024 based on each class's average daily net assets. MFD has voluntarily agreed to rebate a portion of each class's 0.25% service fee attributable to accounts for which there is no financial intermediary specified on the account except for accounts attributable to MFS or its affiliates' seed money. For the six months ended |
| Amount | |
| Class A | $3 |
| Class B | 2 |
| Class C | __ |
| Date | Transaction | Class | Shares | Amount |
| 8/19/2024 | Redemption | Class A | 3 | $46 |
| 8/19/2024 | Redemption | Class C | 5,586 | 92,285 |
| 8/19/2024 | Redemption | Class I | 3 | 47 |
| Six months ended 11/30/24 | Year ended 5/31/24 | ||||
| Shares | Amount | Shares | Amount | ||
| Shares sold | |||||
| Class A | 122,861 | $2,085,445 | 415,753 | $6,372,300 | |
| Class B | — | — | 2,517 | 39,020 | |
| Class C | 6,769 | 115,210 | 34,440 | 498,408 | |
| Class I | 121,727 | 2,011,534 | 375,968 | 5,545,503 | |
| Class R2 | 62 | 1,023 | 153 | 2,268 | |
| Class R3 | 928 | 15,647 | 493 | 7,620 | |
| Class R6 | 316,226 | 5,290,144 | 1,363,703 | 20,073,416 | |
| 568,573 | $9,519,003 | 2,193,027 | $32,538,535 | ||
| Shares issued to shareholders in reinvestment of distributions | |||||
| Class A | — | $— | 50,632 | $755,430 | |
| Class B | — | — | 505 | 7,465 | |
| Class C | — | — | 2,286 | 33,472 | |
| Class I | — | — | 136,371 | 2,015,558 | |
| Class R1 | — | — | 229 | 3,373 | |
| Class R2 | — | — | 255 | 3,764 | |
| Class R3 | — | — | 694 | 10,245 | |
| Class R4 | — | — | 257 | 3,803 | |
| Class R6 | — | — | 460,714 | 6,827,785 | |
| — | $— | 651,943 | $9,660,895 | ||
| Shares reacquired | |||||
| Class A | (151,199) | $(2,540,484) | (510,872) | $(7,578,399) | |
| Class B | (4,044) | (68,356) | (25,210) | (356,139) | |
| Class C | (10,412) | (172,633) | (24,057) | (353,613) | |
| Class I | (287,631) | (4,864,715) | (804,331) | (12,009,873) | |
| Class R2 | (1) | (4) | (9) | (144) | |
| Class R3 | (180) | (3,056) | (2,576) | (37,300) | |
| Class R6 | (1,495,363) | (25,423,337) | (1,214,949) | (18,319,953) | |
| (1,948,830) | $(33,072,585) | (2,582,004) | $(38,655,421) | ||
| Net change | |||||
| Class A | (28,338) | $(455,039) | (44,487) | $(450,669) | |
| Class B | (4,044) | (68,356) | (22,188) | (309,654) | |
| Class C | (3,643) | (57,423) | 12,669 | 178,267 | |
| Class I | (165,904) | (2,853,181) | (291,992) | (4,448,812) | |
| Class R1 | — | — | 229 | 3,373 | |
| Class R2 | 61 | 1,019 | 399 | 5,888 | |
| Class R3 | 748 | 12,591 | (1,389) | (19,435) | |
| Class R4 | — | — | 257 | 3,803 | |
| Class R6 | (1,179,137) | (20,133,193) | 609,468 | 8,581,248 | |
| (1,380,257) | $(23,553,582) | 262,966 | $3,544,009 | ||
| Affiliated Issuers | Beginning Value | Purchases | Sales Proceeds | Realized Gain (Loss) | Change in Unrealized Appreciation or Depreciation | Ending Value |
| MFS Institutional Money Market Portfolio | $4,496,352 | $18,535,026 | $21,480,813 | $41 | $(412) | $1,550,194 |
| Affiliated Issuers | Dividend Income | Capital Gain Distributions |
| MFS Institutional Money Market Portfolio | $64,260 | $— |
| Number of Dollars | ||||||
| Nominee | For | Against/Withheld | Abstain | |||
| Steven E. Buller | 93,694,553,358.767 | 2,599,093,584.595 | 0.000 | |||
| John A. Caroselli | 94,028,434,411.278 | 2,265,212,532.084 | 0.000 | |||
| Maureen R. Goldfarb | 94,361,674,360.213 | 1,931,972,583.149 | 0.000 | |||
| Peter D. Jones | 94,066,354,687.369 | 2,227,292,255.993 | 0.000 | |||
| John P. Kavanaugh | 94,185,926,082.433 | 2,107,559,444.381 | 161,416.548 | |||
| James W. Kilman, Jr. | 94,450,795,713.326 | 1,842,851,230.036 | 0.000 | |||
| Clarence Otis, Jr. | 93,984,248,122.457 | 2,309,398,820.905 | 0.000 | |||
| Michael W. Roberge | 94,352,210,986.123 | 1,941,435,957.239 | 0.000 | |||
| Maryanne L. Roepke | 94,413,451,878.996 | 1,880,195,064.366 | 0.000 | |||
| Paula E. Smith | 94,545,454,781.292 | 1,748,192,162.070 | 0.000 | |||
| Laurie J. Thomsen | 94,416,793,826.848 | 1,876,853,116.514 | 0.000 | |||
| Darrell A. Williams | 94,451,319,166.310 | 1,842,327,777.051 | 0.000 | |||
| Issuer | Shares/Par | Value ($) | ||
| Common Stocks – 96.5% | ||||
| Aerospace & Defense – 1.4% | ||||
| BAE Systems PLC | 2,681,953 | $ 41,943,980 | ||
| Dassault Aviation S.A. | 223,471 | 44,556,479 | ||
| $86,500,459 | ||||
| Airlines – 1.1% | ||||
| Ryanair Holdings PLC, ADR | 1,593,417 | $ 70,174,085 | ||
| Alcoholic Beverages – 3.1% | ||||
| China Resources Beer Holdings Co. Ltd. | 7,270,000 | $ 24,478,115 | ||
| Diageo PLC | 2,866,552 | 85,953,461 | ||
| Heineken N.V. | 566,506 | 42,003,303 | ||
| Kirin Holdings Co. Ltd. | 1,676,300 | 23,407,036 | ||
| Pernod Ricard S.A. | 156,651 | 17,556,499 | ||
| $193,398,414 | ||||
| Apparel Manufacturers – 1.7% | ||||
| Burberry Group PLC | 1,628,163 | $ 18,639,954 | ||
| Compagnie Financiere Richemont S.A. | 485,574 | 67,658,335 | ||
| Gildan Activewear, Inc. | 433,763 | 21,561,908 | ||
| $107,860,197 | ||||
| Automotive – 2.4% | ||||
| Aptiv PLC (a) | 702,061 | $ 38,985,447 | ||
| Compagnie Generale des Etablissements Michelin | 1,425,108 | 46,376,898 | ||
| DENSO Corp. | 3,339,400 | 47,511,244 | ||
| USS Co. Ltd. | 2,108,700 | 19,552,401 | ||
| $152,425,990 | ||||
| Broadcasting – 0.7% | ||||
| WPP Group PLC | 3,882,893 | $ 42,522,972 | ||
| Brokerage & Asset Managers – 3.9% | ||||
| Barclays PLC | 31,009,437 | $ 104,265,970 | ||
| Deutsche Boerse AG | 373,604 | 87,577,802 | ||
| IG Group Holdings PLC | 4,523,615 | 55,207,532 | ||
| $247,051,304 | ||||
| Business Services – 2.5% | ||||
| RS Group PLC | 3,925,854 | $ 35,752,819 | ||
| Secom Co. Ltd. | 1,786,400 | 62,352,093 | ||
| Sodexo | 755,281 | 62,826,071 | ||
| $160,930,983 | ||||
| Chemicals – 0.4% | ||||
| Nutrien Ltd. | 567,349 | $ 26,500,464 | ||
| Issuer | Shares/Par | Value ($) | ||
| Common Stocks – continued | ||||
| Computer Software - Systems – 8.2% | ||||
| Amadeus IT Group S.A. | 1,050,649 | $ 73,852,520 | ||
| Capgemini | 695,806 | 111,854,829 | ||
| Fujitsu Ltd. | 4,504,500 | 86,273,035 | ||
| Hitachi Ltd. | 3,569,200 | 89,468,519 | ||
| NEC Corp. | 958,600 | 81,644,995 | ||
| Samsung Electronics Co. Ltd. | 1,904,043 | 73,975,220 | ||
| $517,069,118 | ||||
| Construction – 1.9% | ||||
| CRH PLC | 429,452 | $ 43,920,056 | ||
| Techtronic Industries Co. Ltd. | 5,294,000 | 74,565,297 | ||
| $118,485,353 | ||||
| Consumer Products – 1.7% | ||||
| Haleon PLC | 8,754,257 | $ 41,765,053 | ||
| Reckitt Benckiser Group PLC | 1,034,232 | 64,066,080 | ||
| $105,831,133 | ||||
| Electrical Equipment – 4.5% | ||||
| Legrand S.A. | 455,761 | $ 45,763,647 | ||
| Mitsubishi Electric Corp. | 6,053,200 | 103,030,610 | ||
| Schneider Electric SE | 517,601 | 133,383,733 | ||
| $282,177,990 | ||||
| Electronics – 1.6% | ||||
| Kyocera Corp. | 4,495,900 | $ 44,270,975 | ||
| NXP Semiconductors N.V. | 256,857 | 58,915,290 | ||
| $103,186,265 | ||||
| Energy - Independent – 0.8% | ||||
| Woodside Energy Group Ltd. | 3,295,544 | $ 52,696,816 | ||
| Energy - Integrated – 6.0% | ||||
| Aker BP ASA | 1,455,296 | $ 29,863,725 | ||
| Eni S.p.A. (l) | 8,911,867 | 126,437,735 | ||
| Suncor Energy, Inc. (l) | 2,443,742 | 97,233,059 | ||
| TotalEnergies SE | 2,174,831 | 126,520,252 | ||
| $380,054,771 | ||||
| Food & Beverages – 1.0% | ||||
| Danone S.A. | 932,580 | $ 63,816,149 | ||
| Food & Drug Stores – 1.5% | ||||
| Tesco PLC | 20,993,932 | $ 98,044,484 | ||
| General Merchandise – 0.6% | ||||
| B&M European Value Retail S.A. | 7,955,347 | $ 35,175,262 | ||
| Issuer | Shares/Par | Value ($) | ||
| Common Stocks – continued | ||||
| Insurance – 4.5% | ||||
| Manulife Financial Corp. | 2,573,419 | $ 82,836,835 | ||
| St. James's Place PLC | 3,317,034 | 38,135,582 | ||
| Willis Towers Watson PLC | 510,051 | 164,236,422 | ||
| $285,208,839 | ||||
| Internet – 0.9% | ||||
| Informa PLC | 5,395,355 | $ 58,907,692 | ||
| Machinery & Tools – 3.3% | ||||
| Aalberts Industries N.V. | 680,415 | $ 26,196,627 | ||
| Daikin Industries Ltd. | 351,100 | 42,456,258 | ||
| Kubota Corp. | 1,828,200 | 22,883,043 | ||
| Toyota Industries Corp. | 1,165,700 | 86,858,828 | ||
| Weir Group PLC | 1,174,278 | 33,287,381 | ||
| $211,682,137 | ||||
| Major Banks – 18.0% | ||||
| ABN AMRO Group N.V., GDR | 2,265,969 | $ 35,287,673 | ||
| Bank of Ireland Group PLC | 9,349,356 | 82,004,982 | ||
| BNP Paribas S.A. | 2,359,529 | 141,435,152 | ||
| DBS Group Holdings Ltd. | 1,211,030 | 38,387,810 | ||
| Lloyds Banking Group PLC | 46,968,240 | 31,764,750 | ||
| Mitsubishi UFJ Financial Group, Inc. | 19,584,000 | 234,526,383 | ||
| NatWest Group PLC | 49,796,291 | 255,595,110 | ||
| Resona Holdings, Inc. | 7,255,100 | 60,604,618 | ||
| Toronto-Dominion Bank | 1,356,955 | 76,785,733 | ||
| UBS Group AG | 5,761,094 | 186,322,913 | ||
| $1,142,715,124 | ||||
| Medical & Health Technology & Services – 0.3% | ||||
| ICON PLC (a) | 94,090 | $ 19,782,422 | ||
| Medical Equipment – 1.6% | ||||
| ConvaTec Group PLC | 7,256,102 | $ 21,789,767 | ||
| Smith & Nephew PLC | 6,359,058 | 80,809,395 | ||
| $102,599,162 | ||||
| Metals & Mining – 3.0% | ||||
| Glencore PLC | 21,901,667 | $ 106,066,328 | ||
| Rio Tinto PLC | 1,372,303 | 86,346,168 | ||
| $192,412,496 | ||||
| Other Banks & Diversified Financials – 2.5% | ||||
| AIB Group PLC | 12,617,055 | $ 68,766,041 | ||
| Julius Baer Group Ltd. | 1,349,610 | 89,350,741 | ||
| $158,116,782 | ||||
| Pharmaceuticals – 5.6% | ||||
| Bayer AG | 903,221 | $ 18,532,578 | ||
| Novartis AG | 305,825 | 32,391,890 | ||
| Roche Holding AG | 594,330 | 172,440,739 | ||
| Issuer | Shares/Par | Value ($) | ||
| Common Stocks – continued | ||||
| Pharmaceuticals – continued | ||||
| Sanofi | 1,358,070 | $ 132,355,936 | ||
| $355,721,143 | ||||
| Printing & Publishing – 0.3% | ||||
| Springer Nature AG & Co. KGaA (a) | 728,317 | $ 19,993,978 | ||
| Specialty Chemicals – 0.7% | ||||
| Linde PLC | 33,626 | $ 15,501,250 | ||
| Nitto Denko Corp. | 1,929,900 | 30,797,923 | ||
| $46,299,173 | ||||
| Specialty Stores – 0.4% | ||||
| Alibaba Group Holding Ltd., ADR | 268,155 | $ 23,428,702 | ||
| Telecommunications - Wireless – 0.2% | ||||
| KDDI Corp. | 389,700 | $ 12,891,038 | ||
| Telephone Services – 1.8% | ||||
| Deutsche Telekom AG | 2,254,846 | $ 72,257,271 | ||
| Quebecor, Inc., “B” (l) | 1,715,948 | 40,516,545 | ||
| $112,773,816 | ||||
| Tobacco – 3.1% | ||||
| British American Tobacco PLC | 3,062,472 | $ 116,634,393 | ||
| Imperial Brands PLC | 2,508,608 | 82,143,050 | ||
| $198,777,443 | ||||
| Utilities - Electric Power – 5.3% | ||||
| E.ON SE | 7,165,523 | $ 92,402,181 | ||
| Iberdrola S.A. | 7,795,381 | 111,290,500 | ||
| National Grid PLC | 10,255,803 | 129,753,134 | ||
| $333,445,815 | ||||
| Total Common Stocks (Identified Cost, $4,955,070,093) | $6,118,657,971 | |||
| Preferred Stocks – 1.7% | ||||
| Consumer Products – 1.7% | ||||
| Henkel AG & Co. KGaA (Identified Cost, $111,967,764) | 1,237,345 | $ 105,753,784 | ||
| Investment Companies (h) – 1.0% | ||||
| Money Market Funds – 1.0% | ||||
| MFS Institutional Money Market Portfolio, 4.66% (v) (Identified Cost, $61,205,216) | 61,201,740 | $ 61,207,860 | ||
| Collateral for Securities Loaned – 1.4% | ||||
| JPMorgan U.S. Government Money Market Fund - Class IM Shares, 4.59% (j) (Identified Cost, $92,393,543) | 92,393,543 | $ 92,393,543 | ||
| Other Assets, Less Liabilities – (0.6)% | (36,751,579) | |||
| Net Assets – 100.0% | $6,341,261,579 | |||
| (a) | Non-income producing security. | |||
| (h) | An affiliated issuer, which may be considered one in which the fund owns 5% or more of the outstanding voting securities, or a company which is under common control. At period end, the aggregate values of the fund's investments in affiliated issuers and in unaffiliated issuers were $61,207,860 and $6,316,805,298, respectively. | |||
| (j) | The rate quoted is the annualized seven-day yield of the fund at period end. | |||
| (l) | A portion of this security is on loan. See Note 2 for additional information. | |||
| (v) | Affiliated issuer that is available only to investment companies managed by MFS. The rate quoted for the MFS Institutional Money Market Portfolio is the annualized seven-day yield of the fund at period end. |
| The following abbreviations are used in this report and are defined: | |
| ADR | American Depositary Receipt |
| GDR | Global Depositary Receipt |
| Financial Statements | Statement of Assets and Liabilities |
| At 11/30/24 (unaudited)Assets | |
| Investments in unaffiliated issuers, at value, including $201,519,605 of securities on loan (identified cost, $5,159,431,400) | $6,316,805,298 |
| Investments in affiliated issuers, at value (identified cost, $61,205,216) | 61,207,860 |
| Cash | 448,976 |
| Foreign currency, at value (identified cost, $337) | 337 |
| Receivables for | |
| Investments sold | 25,121,631 |
| Fund shares sold | 332,141 |
| Interest and dividends | 31,093,847 |
| Total assets | $6,435,010,090 |
| Liabilities | |
| Payables for | |
| Investments purchased | $110,890 |
| Fund shares reacquired | 7,020 |
| Collateral for securities loaned, at value (c) | 92,393,543 |
| Payable to affiliates | |
| Investment adviser | 192,147 |
| Administrative services fee | 6,737 |
| Shareholder servicing costs | 4,462 |
| Distribution and service fees | 341 |
| Payable for independent Trustees' compensation | 1,176 |
| Accrued expenses and other liabilities | 1,032,195 |
| Total liabilities | $93,748,511 |
| Net assets | $6,341,261,579 |
| Net assets consist of | |
| Paid-in capital | $4,783,649,967 |
| Total distributable earnings (loss) | 1,557,611,612 |
| Net assets | $6,341,261,579 |
| Shares of beneficial interest outstanding | 441,489,414 |
| (c) | Non-cash collateral is not included. |
| Net assets | Shares outstanding | Net asset value per share (a) | |
| Class A | $8,511,977 | 595,803 | $14.29 |
| Class C | 839,806 | 59,369 | 14.15 |
| Class I | 17,590,807 | 1,222,537 | 14.39 |
| Class R1 | 102,655 | 7,231 | 14.20 |
| Class R2 | 107,431 | 7,515 | 14.30 |
| Class R3 | 133,743 | 9,329 | 14.34 |
| Class R4 | 107,870 | 7,501 | 14.38 |
| Class R6 | 6,313,867,290 | 439,580,129 | 14.36 |
| (a) | Maximum offering price per share was equal to the net asset value per share for all share classes, except for Class A, for which the maximum offering price per share was $15.16 [100 / 94.25 x $14.29]. On sales of $50,000 or more, the maximum offering price of Class A shares is reduced. A contingent deferred sales charge may be imposed on redemptions of Class A and Class C shares. Redemption price per share was equal to the net asset value per share for Classes I, R1, R2, R3, R4, and R6. |
| Financial Statements | Statement of Operations |
| Six months ended 11/30/24 (unaudited)Net investment income (loss) | |
| Income | |
| Dividends from unaffiliated issuers | $88,953,123 |
| Dividends from affiliated issuers | 1,923,776 |
| Income on securities loaned | 184,398 |
| Other | 2,057 |
| Foreign taxes withheld | (4,183,845) |
| Total investment income | $86,879,509 |
| Expenses | |
| Management fee | $22,785,778 |
| Distribution and service fees | 15,630 |
| Shareholder servicing costs | 8,659 |
| Administrative services fee | 308,221 |
| Independent Trustees' compensation | 54,342 |
| Custodian fee | 336,944 |
| Shareholder communications | 4,663 |
| Audit and tax fees | 36,557 |
| Legal fees | 15,816 |
| Miscellaneous | 116,347 |
| Total expenses | $23,682,957 |
| Fees paid indirectly | (8,385) |
| Reduction of expenses by investment adviser | (2,083,470) |
| Net expenses | $21,591,102 |
| Net investment income (loss) | $65,288,407 |
| Realized and unrealized gain (loss) | |
| Realized gain (loss) (identified cost basis) | |
| Unaffiliated issuers | $223,571,427 |
| Affiliated issuers | 304 |
| Foreign currency | (987,093) |
| Net realized gain (loss) | $222,584,638 |
| Change in unrealized appreciation or depreciation | |
| Unaffiliated issuers | $(158,764,836) |
| Affiliated issuers | (5,322) |
| Translation of assets and liabilities in foreign currencies | (357,338) |
| Net unrealized gain (loss) | $(159,127,496) |
| Net realized and unrealized gain (loss) | $63,457,142 |
| Change in net assets from operations | $128,745,549 |
| Financial Statements | Statements of Changes in Net Assets |
| Six months ended | Year ended | |
| 11/30/24 (unaudited) | 5/31/24 | |
| Change in net assets | ||
| From operations | ||
| Net investment income (loss) | $65,288,407 | $197,080,581 |
| Net realized gain (loss) | 222,584,638 | 68,016,443 |
| Net unrealized gain (loss) | (159,127,496) | 765,924,258 |
| Change in net assets from operations | $128,745,549 | $1,031,021,282 |
| Total distributions to shareholders | $— | $(256,123,721) |
| Change in net assets from fund share transactions | $(223,786,604) | $(147,868,331) |
| Total change in net assets | $(95,041,055) | $627,029,230 |
| Net assets | ||
| At beginning of period | 6,436,302,634 | 5,809,273,404 |
| At end of period | $6,341,261,579 | $6,436,302,634 |
| Financial Statements | Financial Highlights |
| Class A | Six months ended | Year ended | |||
| 11/30/24 (unaudited) | 5/31/24 | 5/31/23 | 5/31/22 | 5/31/21(c) | |
| Net asset value, beginning of period | $14.03 | $12.38 | $12.41 | $13.66 | $10.00 |
| Income (loss) from investment operations | |||||
| Net investment income (loss) (d) | $0.13 | $0.39 | $0.38 | $0.35 | $0.29 |
| Net realized and unrealized gain (loss) | 0.13 | 1.78 | (0.09) | (1.11) | 3.42 |
| Total from investment operations | $0.26 | $2.17 | $0.29 | $(0.76) | $3.71 |
| Less distributions declared to shareholders | |||||
| From net investment income | $— | $(0.44) | $(0.20) | $(0.27) | $(0.05) |
| From net realized gain | — | (0.08) | (0.12) | (0.22) | (0.00)(w) |
| Total distributions declared to shareholders | $— | $(0.52) | $(0.32) | $(0.49) | $(0.05) |
| Net asset value, end of period (x) | $14.29 | $14.03 | $12.38 | $12.41 | $13.66 |
| Total return (%) (r)(s)(t)(x) | 1.85(n) | 17.92 | 2.45 | (5.74) | 37.16(n) |
| Ratios (%) (to average net assets) and Supplemental data: | |||||
| Expenses before expense reductions (f) | 1.02(a) | 1.06 | 1.07 | 1.04 | 1.04(a) |
| Expenses after expense reductions (f) | 0.95(a) | 0.98 | 0.96 | 0.96 | 0.93(a) |
| Net investment income (loss) | 1.75(a) | 3.01 | 3.13 | 2.72 | 2.61(a) |
| Portfolio turnover rate | 12(n) | 17 | 26 | 24 | 18(n) |
| Net assets at end of period (000 omitted) | $8,512 | $7,962 | $5,864 | $2,956 | $1,187 |
| Class C | Six months ended | Year ended | |||
| 11/30/24 (unaudited) | 5/31/24 | 5/31/23 | 5/31/22 | 5/31/21(c) | |
| Net asset value, beginning of period | $13.94 | $12.29 | $12.33 | $13.61 | $10.00 |
| Income (loss) from investment operations | |||||
| Net investment income (loss) (d) | $0.07 | $0.28 | $0.22 | $0.22 | $0.16 |
| Net realized and unrealized gain (loss) | 0.14 | 1.77 | (0.02) | (1.08) | 3.45 |
| Total from investment operations | $0.21 | $2.05 | $0.20 | $(0.86) | $3.61 |
| Less distributions declared to shareholders | |||||
| From net investment income | $— | $(0.32) | $(0.12) | $(0.20) | $— |
| From net realized gain | — | (0.08) | (0.12) | (0.22) | (0.00)(w) |
| Total distributions declared to shareholders | $— | $(0.40) | $(0.24) | $(0.42) | $(0.00)(w) |
| Net asset value, end of period (x) | $14.15 | $13.94 | $12.29 | $12.33 | $13.61 |
| Total return (%) (r)(s)(t)(x) | 1.51(n) | 17.02 | 1.70 | (6.46) | 36.11(n) |
| Ratios (%) (to average net assets) and Supplemental data: | |||||
| Expenses before expense reductions (f) | 1.77(a) | 1.81 | 1.83 | 1.78 | 1.81(a) |
| Expenses after expense reductions (f) | 1.70(a) | 1.72 | 1.71 | 1.71 | 1.68(a) |
| Net investment income (loss) | 1.00(a) | 2.15 | 1.89 | 1.69 | 1.49(a) |
| Portfolio turnover rate | 12(n) | 17 | 26 | 24 | 18(n) |
| Net assets at end of period (000 omitted) | $840 | $893 | $905 | $1,111 | $636 |
| Class I | Six months ended | Year ended | |||
| 11/30/24 (unaudited) | 5/31/24 | 5/31/23 | 5/31/22 | 5/31/21(c) | |
| Net asset value, beginning of period | $14.11 | $12.45 | $12.43 | $13.69 | $10.00 |
| Income (loss) from investment operations | |||||
| Net investment income (loss) (d) | $0.14 | $0.40 | $0.39 | $0.41 | $0.31 |
| Net realized and unrealized gain (loss) | 0.14 | 1.81 | (0.05) | (1.16) | 3.44 |
| Total from investment operations | $0.28 | $2.21 | $0.34 | $(0.75) | $3.75 |
| Less distributions declared to shareholders | |||||
| From net investment income | $— | $(0.47) | $(0.20) | $(0.29) | $(0.06) |
| From net realized gain | — | (0.08) | (0.12) | (0.22) | (0.00)(w) |
| Total distributions declared to shareholders | $— | $(0.55) | $(0.32) | $(0.51) | $(0.06) |
| Net asset value, end of period (x) | $14.39 | $14.11 | $12.45 | $12.43 | $13.69 |
| Total return (%) (r)(s)(t)(x) | 1.98(n) | 18.16 | 2.88 | (5.60) | 37.58(n) |
| Ratios (%) (to average net assets) and Supplemental data: | |||||
| Expenses before expense reductions (f) | 0.77(a) | 0.81 | 0.82 | 0.79 | 0.79(a) |
| Expenses after expense reductions (f) | 0.70(a) | 0.72 | 0.71 | 0.71 | 0.68(a) |
| Net investment income (loss) | 1.98(a) | 3.04 | 3.28 | 3.15 | 2.82(a) |
| Portfolio turnover rate | 12(n) | 17 | 26 | 24 | 18(n) |
| Net assets at end of period (000 omitted) | $17,591 | $15,423 | $11,178 | $18,972 | $2,775 |
| Class R1 | Six months ended | Year ended | |||
| 11/30/24 (unaudited) | 5/31/24 | 5/31/23 | 5/31/22 | 5/31/21(c) | |
| Net asset value, beginning of period | $13.99 | $12.35 | $12.36 | $13.61 | $10.00 |
| Income (loss) from investment operations | |||||
| Net investment income (loss) (d) | $0.07 | $0.28 | $0.24 | $0.19 | $0.09 |
| Net realized and unrealized gain (loss) | 0.14 | 1.78 | (0.04) | (1.06) | 3.52 |
| Total from investment operations | $0.21 | $2.06 | $0.20 | $(0.87) | $3.61 |
| Less distributions declared to shareholders | |||||
| From net investment income | $— | $(0.34) | $(0.09) | $(0.16) | $— |
| From net realized gain | — | (0.08) | (0.12) | (0.22) | (0.00)(w) |
| Total distributions declared to shareholders | $— | $(0.42) | $(0.21) | $(0.38) | $(0.00)(w) |
| Net asset value, end of period (x) | $14.20 | $13.99 | $12.35 | $12.36 | $13.61 |
| Total return (%) (r)(s)(t)(x) | 1.50(n) | 16.98 | 1.76 | (6.49) | 36.11(n) |
| Ratios (%) (to average net assets) and Supplemental data: | |||||
| Expenses before expense reductions (f) | 1.77(a) | 1.81 | 1.83 | 1.78 | 1.83(a) |
| Expenses after expense reductions (f) | 1.70(a) | 1.73 | 1.71 | 1.71 | 1.68(a) |
| Net investment income (loss) | 1.00(a) | 2.19 | 2.04 | 1.43 | 0.85(a) |
| Portfolio turnover rate | 12(n) | 17 | 26 | 24 | 18(n) |
| Net assets at end of period (000 omitted) | $103 | $101 | $86 | $85 | $91 |
| Class R2 | Six months ended | Year ended | |||
| 11/30/24 (unaudited) | 5/31/24 | 5/31/23 | 5/31/22 | 5/31/21(c) | |
| Net asset value, beginning of period | $14.05 | $12.40 | $12.41 | $13.66 | $10.00 |
| Income (loss) from investment operations | |||||
| Net investment income (loss) (d) | $0.11 | $0.35 | $0.30 | $0.25 | $0.14 |
| Net realized and unrealized gain (loss) | 0.14 | 1.78 | (0.04) | (1.05) | 3.52 |
| Total from investment operations | $0.25 | $2.13 | $0.26 | $(0.80) | $3.66 |
| Less distributions declared to shareholders | |||||
| From net investment income | $— | $(0.40) | $(0.15) | $(0.23) | $(0.00)(w) |
| From net realized gain | — | (0.08) | (0.12) | (0.22) | (0.00)(w) |
| Total distributions declared to shareholders | $— | $(0.48) | $(0.27) | $(0.45) | $(0.00)(w) |
| Net asset value, end of period (x) | $14.30 | $14.05 | $12.40 | $12.41 | $13.66 |
| Total return (%) (r)(s)(t)(x) | 1.78(n) | 17.56 | 2.26 | (6.01) | 36.63(n) |
| Ratios (%) (to average net assets) and Supplemental data: | |||||
| Expenses before expense reductions (f) | 1.27(a) | 1.31 | 1.33 | 1.28 | 1.33(a) |
| Expenses after expense reductions (f) | 1.20(a) | 1.23 | 1.21 | 1.21 | 1.18(a) |
| Net investment income (loss) | 1.50(a) | 2.70 | 2.55 | 1.94 | 1.36(a) |
| Portfolio turnover rate | 12(n) | 17 | 26 | 24 | 18(n) |
| Net assets at end of period (000 omitted) | $107 | $105 | $88 | $86 | $92 |
| Class R3 | Six months ended | Year ended | |||
| 11/30/24 (unaudited) | 5/31/24 | 5/31/23 | 5/31/22 | 5/31/21(c) | |
| Net asset value, beginning of period | $14.08 | $12.42 | $12.43 | $13.68 | $10.00 |
| Income (loss) from investment operations | |||||
| Net investment income (loss) (d) | $0.13 | $0.38 | $0.33 | $0.29 | $0.17 |
| Net realized and unrealized gain (loss) | 0.13 | 1.79 | (0.04) | (1.06) | 3.54 |
| Total from investment operations | $0.26 | $2.17 | $0.29 | $(0.77) | $3.71 |
| Less distributions declared to shareholders | |||||
| From net investment income | $— | $(0.43) | $(0.18) | $(0.26) | $(0.03) |
| From net realized gain | — | (0.08) | (0.12) | (0.22) | (0.00)(w) |
| Total distributions declared to shareholders | $— | $(0.51) | $(0.30) | $(0.48) | $(0.03) |
| Net asset value, end of period (x) | $14.34 | $14.08 | $12.42 | $12.43 | $13.68 |
| Total return (%) (r)(s)(t)(x) | 1.85(n) | 17.89 | 2.51 | (5.77) | 37.15(n) |
| Ratios (%) (to average net assets) and Supplemental data: | |||||
| Expenses before expense reductions (f) | 1.02(a) | 1.06 | 1.08 | 1.03 | 1.08(a) |
| Expenses after expense reductions (f) | 0.95(a) | 0.98 | 0.96 | 0.96 | 0.93(a) |
| Net investment income (loss) | 1.78(a) | 2.94 | 2.80 | 2.19 | 1.61(a) |
| Portfolio turnover rate | 12(n) | 17 | 26 | 24 | 18(n) |
| Net assets at end of period (000 omitted) | $134 | $105 | $89 | $87 | $92 |
| Class R4 | Six months ended | Year ended | |||
| 11/30/24 (unaudited) | 5/31/24 | 5/31/23 | 5/31/22 | 5/31/21(c) | |
| Net asset value, beginning of period | $14.10 | $12.44 | $12.45 | $13.70 | $10.00 |
| Income (loss) from investment operations | |||||
| Net investment income (loss) (d) | $0.14 | $0.42 | $0.36 | $0.32 | $0.19 |
| Net realized and unrealized gain (loss) | 0.14 | 1.79 | (0.04) | (1.06) | 3.57 |
| Total from investment operations | $0.28 | $2.21 | $0.32 | $(0.74) | $3.76 |
| Less distributions declared to shareholders | |||||
| From net investment income | $— | $(0.47) | $(0.21) | $(0.29) | $(0.06) |
| From net realized gain | — | (0.08) | (0.12) | (0.22) | (0.00)(w) |
| Total distributions declared to shareholders | $— | $(0.55) | $(0.33) | $(0.51) | $(0.06) |
| Net asset value, end of period (x) | $14.38 | $14.10 | $12.44 | $12.45 | $13.70 |
| Total return (%) (r)(s)(t)(x) | 1.99(n) | 18.15 | 2.76 | (5.53) | 37.67(n) |
| Ratios (%) (to average net assets) and Supplemental data: | |||||
| Expenses before expense reductions (f) | 0.77(a) | 0.81 | 0.83 | 0.78 | 0.83(a) |
| Expenses after expense reductions (f) | 0.70(a) | 0.73 | 0.71 | 0.71 | 0.68(a) |
| Net investment income (loss) | 2.00(a) | 3.19 | 3.05 | 2.44 | 1.86(a) |
| Portfolio turnover rate | 12(n) | 17 | 26 | 24 | 18(n) |
| Net assets at end of period (000 omitted) | $108 | $106 | $90 | $87 | $92 |
| Class R6 | Six months ended | Year ended | |||
| 11/30/24 (unaudited) | 5/31/24 | 5/31/23 | 5/31/22 | 5/31/21(c) | |
| Net asset value, beginning of period | $14.08 | $12.42 | $12.44 | $13.68 | $10.00 |
| Income (loss) from investment operations | |||||
| Net investment income (loss) (d) | $0.15 | $0.42 | $0.37 | $0.32 | $0.30 |
| Net realized and unrealized gain (loss) | 0.13 | 1.79 | (0.05) | (1.04) | 3.44 |
| Total from investment operations | $0.28 | $2.21 | $0.32 | $(0.72) | $3.74 |
| Less distributions declared to shareholders | |||||
| From net investment income | $— | $(0.47) | $(0.22) | $(0.30) | $(0.06) |
| From net realized gain | — | (0.08) | (0.12) | (0.22) | (0.00)(w) |
| Total distributions declared to shareholders | $— | $(0.55) | $(0.34) | $(0.52) | $(0.06) |
| Net asset value, end of period (x) | $14.36 | $14.08 | $12.42 | $12.44 | $13.68 |
| Total return (%) (r)(s)(t)(x) | 1.99(n) | 18.24 | 2.76 | (5.45) | 37.49(n) |
| Ratios (%) (to average net assets) and Supplemental data: | |||||
| Expenses before expense reductions (f) | 0.74(a) | 0.75 | 0.75 | 0.74 | 0.78(a) |
| Expenses after expense reductions (f) | 0.67(a) | 0.67 | 0.64 | 0.66 | 0.67(a) |
| Net investment income (loss) | 2.03(a) | 3.21 | 3.12 | 2.45 | 2.74(a) |
| Portfolio turnover rate | 12(n) | 17 | 26 | 24 | 18(n) |
| Net assets at end of period (000 omitted) | $6,313,867 | $6,411,609 | $5,790,974 | $5,727,457 | $5,800,471 |
| (a) | Annualized. |
| (c) | For the period from the commencement of the fund’s investment operations, June 30, 2020, through the stated period end. |
| (d) | Per share data is based on average shares outstanding. |
| (f) | Ratios do not reflect reductions from fees paid indirectly, if applicable. See Note 2 in the Notes to Financial Statements for additional information. |
| (n) | Not annualized. |
| (r) | Certain expenses have been reduced without which performance would have been lower. |
| (s) | From time to time the fund may receive proceeds from litigation settlements, without which performance would be lower. |
| (t) | Total returns do not include any applicable sales charges. |
| (w) | Per share amount was less than $0.01. |
| (x) | The net asset values and total returns have been calculated on net assets which include adjustments made in accordance with U.S. generally accepted accounting principles required at period end for financial reporting purposes. |
| Financial Instruments | Level 1 | Level 2 | Level 3 | Total |
| Equity Securities | $6,224,411,755 | $— | $— | $6,224,411,755 |
| Mutual Funds | 153,601,403 | — | — | 153,601,403 |
| Total | $6,378,013,158 | $— | $— | $6,378,013,158 |
| Year ended 5/31/24 | |
| Ordinary income (including any short-term capital gains) | $218,004,366 |
| Long-term capital gains | 38,119,355 |
| Total distributions | $256,123,721 |
| As of 11/30/24 | |
| Cost of investments | $5,271,092,702 |
| Gross appreciation | 1,420,647,761 |
| Gross depreciation | (313,727,305) |
| Net unrealized appreciation (depreciation) | $1,106,920,456 |
| As of 5/31/24 | |
| Undistributed ordinary income | 126,562,549 |
| Undistributed long-term capital gain | 32,373,926 |
| Other temporary differences | 4,238,974 |
| Net unrealized appreciation (depreciation) | 1,265,690,614 |
| Six months ended 11/30/24 | Year ended 5/31/24 | ||
| Class A | $— | $282,431 | |
| Class C | — | 26,015 | |
| Class I | — | 674,611 | |
| Class R1 | — | 2,952 | |
| Class R2 | — | 3,468 | |
| Class R3 | — | 3,690 | |
| Class R4 | — | 3,946 | |
| Class R6 | — | 255,126,608 | |
| Total | $— | $256,123,721 |
| Up to $2.5 billion | 0.75% |
| In excess of $2.5 billion and up to $5 billion | 0.70% |
| In excess of $5 billion and up to $10 billion | 0.65% |
| In excess of $10 billion and up to $20 billion | 0.62% |
| In excess of $20 billion | 0.60% |
| Classes | |||||||
| A | C | I | R1 | R2 | R3 | R4 | R6 |
| 0.96% | 1.71% | 0.71% | 1.71% | 1.21% | 0.96% | 0.71% | 0.67% |
| Distribution Fee Rate (d) | Service Fee Rate (d) | Total Distribution Plan (d) | Annual Effective Rate (e) | Distribution and Service Fee | |
| Class A | — | 0.25% | 0.25% | 0.25% | $ 10,248 |
| Class C | 0.75% | 0.25% | 1.00% | 1.00% | 4,448 |
| Class R1 | 0.75% | 0.25% | 1.00% | 1.00% | 514 |
| Class R2 | 0.25% | 0.25% | 0.50% | 0.50% | 267 |
| Class R3 | — | 0.25% | 0.25% | 0.25% | 153 |
| Total Distribution and Service Fees | $15,630 |
| (d) | In accordance with the distribution plan for certain classes, the fund pays distribution and/or service fees equal to these annual percentage rates of each class’s average daily net assets. The distribution and service fee rates disclosed by class represent the current rates in effect at the end of the reporting period. Any rate changes, if applicable, are detailed below. |
| (e) | The annual effective rates represent actual fees incurred under the distribution plan for the six months ended November 30, 2024 based on each class's average daily net assets. MFD has voluntarily agreed to rebate a portion of each class's 0.25% service fee attributable to accounts for which there is no financial intermediary specified on the account except for accounts attributable to MFS or its affiliates' seed money. There were no service fee rebates for the six months ended November 30, 2024. |
| Amount | |
| Class A | $— |
| Class C | 6 |
| Date | Transaction | Class | Shares | Amount |
| 8/19/2024 | Redemption | Class A | 3 | $44 |
| 8/19/2024 | Redemption | Class I | 236,731 | 3,442,068 |
| 8/22/2024 | Redemption | Class I | 2 | 32 |
| 8/22/2024 | Purchase | Class I | 236,731 | 3,442,068 |
| Six months ended 11/30/24 | Year ended 5/31/24 | ||||
| Shares | Amount | Shares | Amount | ||
| Shares sold | |||||
| Class A | 59,659 | $851,309 | 224,395 | $2,920,032 | |
| Class C | 1,006 | 14,075 | 5,111 | 64,714 | |
| Class I | 394,627 | 5,732,539 | 658,289 | 8,664,867 | |
| Class R2 | 49 | 703 | 78 | 1,006 | |
| Class R3 | 1,898 | 27,244 | — | — | |
| Class R6 | 4,332,489 | 61,614,733 | 7,943,145 | 103,056,521 | |
| 4,789,728 | $68,240,603 | 8,831,018 | $114,707,140 | ||
| Shares issued to shareholders in reinvestment of distributions | |||||
| Class A | — | $— | 21,911 | $282,431 | |
| Class C | — | — | 2,024 | 26,015 | |
| Class I | — | — | 52,094 | 674,611 | |
| Class R1 | — | — | 228 | 2,952 | |
| Class R2 | — | — | 268 | 3,468 | |
| Class R3 | — | — | 285 | 3,690 | |
| Class R4 | — | — | 305 | 3,946 | |
| Class R6 | — | — | 19,731,350 | 254,929,038 | |
| — | $— | 19,808,465 | $255,926,151 | ||
| Six months ended 11/30/24 | Year ended 5/31/24 | ||||
| Shares | Amount | Shares | Amount | ||
| Shares reacquired | |||||
| Class A | (31,431) | $(446,032) | (152,319) | $(1,980,272) | |
| Class C | (5,662) | (80,623) | (16,696) | (216,142) | |
| Class I | (265,000) | (3,841,549) | (515,110) | (6,732,479) | |
| Class R2 | — | — | (1) | (7) | |
| Class R3 | (1) | (13) | — | — | |
| Class R6 | (20,010,467) | (287,658,990) | (38,541,896) | (509,572,722) | |
| (20,312,561) | $(292,027,207) | (39,226,022) | $(518,501,622) | ||
| Net change | |||||
| Class A | 28,228 | $405,277 | 93,987 | $1,222,191 | |
| Class C | (4,656) | (66,548) | (9,561) | (125,413) | |
| Class I | 129,627 | 1,890,990 | 195,273 | 2,606,999 | |
| Class R1 | — | — | 228 | 2,952 | |
| Class R2 | 49 | 703 | 345 | 4,467 | |
| Class R3 | 1,897 | 27,231 | 285 | 3,690 | |
| Class R4 | — | — | 305 | 3,946 | |
| Class R6 | (15,677,978) | (226,044,257) | (10,867,401) | (151,587,163) | |
| (15,522,833) | $(223,786,604) | (10,586,539) | $(147,868,331) | ||
| Affiliated Issuers | Beginning Value | Purchases | Sales Proceeds | Realized Gain (Loss) | Change in Unrealized Appreciation or Depreciation | Ending Value |
| MFS Institutional Money Market Portfolio | $91,173,194 | $419,511,000 | $449,471,316 | $304 | $(5,322) | $61,207,860 |
| Affiliated Issuers | Dividend Income | Capital Gain Distributions |
| MFS Institutional Money Market Portfolio | $1,923,776 | $— |
| Number of Dollars | ||||||
| Nominee | For | Against/Withheld | Abstain | |||
| Steven E. Buller | 93,694,553,358.767 | 2,599,093,584.595 | 0.000 | |||
| John A. Caroselli | 94,028,434,411.278 | 2,265,212,532.084 | 0.000 | |||
| Maureen R. Goldfarb | 94,361,674,360.213 | 1,931,972,583.149 | 0.000 | |||
| Peter D. Jones | 94,066,354,687.369 | 2,227,292,255.993 | 0.000 | |||
| John P. Kavanaugh | 94,185,926,082.433 | 2,107,559,444.381 | 161,416.548 | |||
| James W. Kilman, Jr. | 94,450,795,713.326 | 1,842,851,230.036 | 0.000 | |||
| Clarence Otis, Jr. | 93,984,248,122.457 | 2,309,398,820.905 | 0.000 | |||
| Michael W. Roberge | 94,352,210,986.123 | 1,941,435,957.239 | 0.000 | |||
| Maryanne L. Roepke | 94,413,451,878.996 | 1,880,195,064.366 | 0.000 | |||
| Paula E. Smith | 94,545,454,781.292 | 1,748,192,162.070 | 0.000 | |||
| Laurie J. Thomsen | 94,416,793,826.848 | 1,876,853,116.514 | 0.000 | |||
| Darrell A. Williams | 94,451,319,166.310 | 1,842,327,777.051 | 0.000 | |||
| Issuer | Shares/Par | Value ($) | ||
| Common Stocks – 96.0% | ||||
| Airlines – 0.8% | ||||
| Ryanair Holdings PLC, ADR | 4,167,935 | $ 183,555,857 | ||
| Alcoholic Beverages – 2.6% | ||||
| Diageo PLC | 10,456,980 | $ 313,552,124 | ||
| Pernod Ricard S.A. | 2,230,419 | 249,971,820 | ||
| $563,523,944 | ||||
| Apparel Manufacturers – 0.8% | ||||
| Compagnie Financiere Richemont S.A. | 643,133 | $ 89,612,105 | ||
| LVMH Moet Hennessy Louis Vuitton SE | 119,153 | 74,713,997 | ||
| $164,326,102 | ||||
| Automotive – 0.7% | ||||
| Knorr-Bremse AG | 1,944,192 | $ 148,451,340 | ||
| Brokerage & Asset Managers – 5.1% | ||||
| Deutsche Boerse AG | 2,085,768 | $ 488,931,892 | ||
| Euronext N.V. | 2,403,295 | 268,838,031 | ||
| London Stock Exchange Group PLC | 2,451,761 | 352,189,080 | ||
| $1,109,959,003 | ||||
| Business Services – 3.8% | ||||
| Experian PLC | 6,850,735 | $ 327,535,268 | ||
| Intertek Group PLC | 2,822,063 | 169,634,561 | ||
| Nomura Research Institute Ltd. | 5,025,254 | 153,840,474 | ||
| SGS S.A. | 1,700,348 | 168,914,880 | ||
| $819,925,183 | ||||
| Computer Software – 4.6% | ||||
| Cadence Design Systems, Inc. (a) | 976,919 | $ 299,728,519 | ||
| Dassault Systemes SE | 2,840,942 | 98,164,439 | ||
| NICE Systems Ltd., ADR (a) | 717,914 | 130,976,230 | ||
| SAP SE | 1,951,733 | 464,535,059 | ||
| $993,404,247 | ||||
| Computer Software - Systems – 4.0% | ||||
| Amadeus IT Group S.A. | 3,990,335 | $ 280,489,666 | ||
| Cap Gemini S.A. | 1,525,816 | 245,283,635 | ||
| Samsung Electronics Co. Ltd. | 8,720,105 | 338,790,503 | ||
| $864,563,804 | ||||
| Construction – 3.6% | ||||
| Compagnie de Saint-Gobain S.A. | 3,968,640 | $ 362,628,877 | ||
| CRH PLC | 4,081,524 | 417,417,460 | ||
| $780,046,337 | ||||
| Issuer | Shares/Par | Value ($) | ||
| Common Stocks – continued | ||||
| Consumer Products – 5.8% | ||||
| Beiersdorf AG | 1,204,192 | $ 156,304,660 | ||
| Haleon PLC | 82,055,291 | 391,471,594 | ||
| Kenvue, Inc. | 9,478,907 | 228,252,081 | ||
| KOSE Corp. | 470,700 | 21,106,636 | ||
| Lion Corp. | 3,806,600 | 45,445,676 | ||
| Reckitt Benckiser Group PLC | 1,762,307 | 109,167,075 | ||
| ROHTO Pharmaceutical Co. Ltd. | 10,614,000 | 210,485,465 | ||
| Svenska Cellulosa Aktiebolaget | 7,751,914 | 100,857,233 | ||
| $1,263,090,420 | ||||
| Electrical Equipment – 7.4% | ||||
| Legrand S.A. | 5,205,049 | $ 522,646,605 | ||
| Mitsubishi Electric Corp. | 22,099,500 | 376,152,276 | ||
| Schneider Electric SE | 2,607,376 | 671,910,248 | ||
| Yokogawa Electric Corp. | 1,129,600 | 25,160,096 | ||
| $1,595,869,225 | ||||
| Electronics – 5.6% | ||||
| Analog Devices, Inc. | 1,020,645 | $ 222,551,643 | ||
| ASML Holding N.V. | 198,948 | 138,623,875 | ||
| Hirose Electric Co. Ltd. | 1,264,400 | 152,008,527 | ||
| Taiwan Semiconductor Manufacturing Co. Ltd., ADR | 3,858,273 | 712,468,692 | ||
| $1,225,652,737 | ||||
| Energy - Independent – 1.3% | ||||
| Woodside Energy Group Ltd. | 17,071,816 | $ 272,983,862 | ||
| Energy - Integrated – 4.4% | ||||
| Aker BP ASA | 8,021,656 | $ 164,610,176 | ||
| Galp Energia SGPS S.A., “B” | 6,386,451 | 104,997,625 | ||
| Petroleo Brasileiro S.A., ADR | 8,124,447 | 105,942,789 | ||
| TotalEnergies SE | 9,963,050 | 579,597,739 | ||
| $955,148,329 | ||||
| Engineering - Construction – 0.6% | ||||
| Taisei Corp. | 3,193,900 | $ 138,970,081 | ||
| Food & Beverages – 2.5% | ||||
| Chocoladefabriken Lindt & Sprungli AG | 5,604 | $ 64,783,920 | ||
| Ezaki Glico Co. Ltd. | 2,956,600 | 86,678,724 | ||
| Novozymes A/S | 1,081,307 | 63,472,722 | ||
| Toyo Suisan Kaisha Ltd. | 4,639,600 | 325,708,353 | ||
| $540,643,719 | ||||
| Food & Drug Stores – 0.1% | ||||
| Ocado Group PLC (a) | 7,328,905 | $ 29,481,524 | ||
| Insurance – 2.4% | ||||
| Hiscox Ltd. | 7,739,693 | $ 103,582,615 | ||
| Samsung Fire & Marine Insurance Co. Ltd. | 465,421 | 130,947,093 | ||
| Willis Towers Watson PLC | 860,388 | 277,044,936 | ||
| $511,574,644 | ||||
| Issuer | Shares/Par | Value ($) | ||
| Common Stocks – continued | ||||
| Internet – 0.5% | ||||
| M3, Inc. | 11,955,400 | $ 115,846,899 | ||
| Machinery & Tools – 4.0% | ||||
| Epiroc AB | 7,700,449 | $ 140,524,303 | ||
| GEA Group AG | 3,423,404 | 171,439,750 | ||
| IMI PLC (h) | 13,489,485 | 312,925,241 | ||
| Schindler Holding AG | 498,294 | 143,954,115 | ||
| Spirax Group PLC | 1,048,087 | 95,783,418 | ||
| $864,626,827 | ||||
| Major Banks – 10.4% | ||||
| Banco de Sabadell S.A. | 82,859,739 | $ 156,571,262 | ||
| Bank of Ireland Group PLC | 30,977,256 | 271,707,310 | ||
| Lloyds TSB Group PLC | 196,718,386 | 133,041,164 | ||
| National Bank of Greece S.A | 12,947,097 | 91,336,917 | ||
| NatWest Group PLC | 124,670,178 | 639,908,747 | ||
| Resona Holdings, Inc. | 63,296,100 | 528,736,467 | ||
| UBS Group AG | 13,257,711 | 428,775,391 | ||
| $2,250,077,258 | ||||
| Medical Equipment – 6.8% | ||||
| Agilent Technologies, Inc. | 2,282,026 | $ 314,851,127 | ||
| Bruker BioSciences Corp. | 2,205,632 | 127,816,374 | ||
| EssilorLuxottica | 1,399,748 | 340,414,864 | ||
| Olympus Corp. | 7,777,300 | 122,657,231 | ||
| Shimadzu Corp. | 9,972,300 | 280,762,496 | ||
| Smith & Nephew PLC | 13,706,963 | 174,184,793 | ||
| Waters Corp. (a) | 284,930 | 109,618,270 | ||
| $1,470,305,155 | ||||
| Metals & Mining – 1.2% | ||||
| Glencore PLC | 52,392,764 | $ 253,729,870 | ||
| Oil Services – 0.4% | ||||
| Tenaris S.A. | 5,038,230 | $ 96,828,336 | ||
| Other Banks & Diversified Financials – 5.9% | ||||
| AIB Group PLC | 84,564,254 | $ 460,895,732 | ||
| CaixaBank S.A. | 79,116,449 | 430,868,955 | ||
| Chiba Bank Ltd. | 20,914,300 | 174,775,008 | ||
| Julius Baer Group Ltd. | 2,203,109 | 145,856,524 | ||
| Mebuki Financial Group, Inc. | 17,028,270 | 75,616,716 | ||
| North Pacific Bank Ltd. | 141,600 | 412,574 | ||
| $1,288,425,509 | ||||
| Pharmaceuticals – 1.7% | ||||
| Roche Holding AG | 1,238,244 | $ 359,267,933 | ||
| Issuer | Shares/Par | Value ($) | ||
| Common Stocks – continued | ||||
| Precious Metals & Minerals – 5.0% | ||||
| Agnico Eagle Mines Ltd. | 2,648,846 | $ 223,349,469 | ||
| Franco-Nevada Corp. | 5,000,031 | 612,223,915 | ||
| Wheaton Precious Metals Corp. | 4,142,097 | 257,729,165 | ||
| $1,093,302,549 | ||||
| Printing & Publishing – 1.5% | ||||
| Wolters Kluwer N.V. | 1,950,519 | $ 326,045,681 | ||
| Specialty Chemicals – 2.1% | ||||
| Croda International PLC | 1,361,804 | $ 59,883,550 | ||
| Nitto Denko Corp. | 6,180,000 | 98,622,293 | ||
| Sika AG | 529,036 | 137,035,103 | ||
| Symrise AG | 1,483,563 | 164,070,658 | ||
| $459,611,604 | ||||
| Specialty Stores – 0.4% | ||||
| Zalando SE (a) | 2,771,662 | $ 86,296,180 | ||
| Total Common Stocks (Identified Cost, $15,315,766,478) | $20,825,534,159 | |||
| Investment Companies (h) – 3.6% | ||||
| Money Market Funds – 3.6% | ||||
| MFS Institutional Money Market Portfolio, 4.66% (v) (Identified Cost, $769,913,956) | 769,920,177 | $ 769,997,169 | ||
| Other Assets, Less Liabilities – 0.4% | 86,177,325 | |||
| Net Assets – 100.0% | $21,681,708,653 | |||
| (a) | Non-income producing security. | |||
| (h) | An affiliated issuer, which may be considered one in which the fund owns 5% or more of the outstanding voting securities, or a company which is under common control. At period end, the aggregate values of the fund's investments in affiliated issuers and in unaffiliated issuers were $1,082,922,410 and $20,512,608,918, respectively. | |||
| (v) | Affiliated issuer that is available only to investment companies managed by MFS. The rate quoted for the MFS Institutional Money Market Portfolio is the annualized seven-day yield of the fund at period end. |
| The following abbreviations are used in this report and are defined: | |
| ADR | American Depositary Receipt |
| Financial Statements | Statement of Assets and Liabilities |
| At 11/30/24 (unaudited)Assets | |
| Investments in unaffiliated issuers, at value (identified cost, $15,138,586,925) | $20,512,608,918 |
| Investments in affiliated issuers, at value (identified cost, $947,093,509) | 1,082,922,410 |
| Cash | 1,728,003 |
| Foreign currency, at value (identified cost, $1,937,636) | 1,961,721 |
| Receivables for | |
| Investments sold | 19,590,370 |
| Fund shares sold | 8,806,336 |
| Interest and dividends | 91,142,397 |
| Other assets | 19,999 |
| Total assets | $21,718,780,154 |
| Liabilities | |
| Payables for | |
| Investments purchased | $20,187,958 |
| Fund shares reacquired | 5,683,258 |
| Payable to affiliates | |
| Investment adviser | 1,503,075 |
| Administrative services fee | 6,755 |
| Shareholder servicing costs | 2,671,506 |
| Distribution and service fees | 80,364 |
| Payable for independent Trustees' compensation | 7,617 |
| Payable for IRS compliance fees for tax reclaims | 4,647,955 |
| Accrued expenses and other liabilities | 2,283,013 |
| Total liabilities | $37,071,501 |
| Net assets | $21,681,708,653 |
| Net assets consist of | |
| Paid-in capital | $13,771,339,707 |
| Total distributable earnings (loss) | 7,910,368,946 |
| Net assets | $21,681,708,653 |
| Shares of beneficial interest outstanding | 513,722,918 |
| Net assets | Shares outstanding | Net asset value per share (a) | |
| Class A | $1,747,236,418 | 42,514,584 | $41.10 |
| Class B | 803,624 | 21,132 | 38.03 |
| Class C | 15,518,433 | 442,958 | 35.03 |
| Class I | 6,504,581,405 | 146,417,382 | 44.42 |
| Class R1 | 8,190,886 | 231,843 | 35.33 |
| Class R2 | 110,306,591 | 2,996,599 | 36.81 |
| Class R3 | 905,153,076 | 22,275,224 | 40.63 |
| Class R4 | 489,037,105 | 11,826,178 | 41.35 |
| Class R6 | 11,900,881,115 | 286,997,018 | 41.47 |
| (a) | Maximum offering price per share was equal to the net asset value per share for all share classes, except for Class A, for which the maximum offering price per share was $43.61 [100 / 94.25 x $41.10]. On sales of $50,000 or more, the maximum offering price of Class A shares is reduced. A contingent deferred sales charge may be imposed on redemptions of Class A, Class B, and Class C shares. Redemption price per share was equal to the net asset value per share for Classes I, R1, R2, R3, R4, and R6. |
| Financial Statements | Statement of Operations |
| Six months ended 11/30/24 (unaudited)Net investment income (loss) | |
| Income | |
| Dividends from unaffiliated issuers | $199,931,909 |
| Dividends from affiliated issuers | 18,367,456 |
| Income on securities loaned | 259,000 |
| Interest | 8,786 |
| Other | 3,216 |
| Foreign taxes withheld | (13,284,464) |
| Total investment income | $205,285,903 |
| Expenses | |
| Management fee | $71,645,518 |
| Distribution and service fees | 3,867,024 |
| Shareholder servicing costs | 5,398,474 |
| Administrative services fee | 309,005 |
| Independent Trustees' compensation | 70,876 |
| Custodian fee | 810,468 |
| Shareholder communications | 482,914 |
| Audit and tax fees | 42,180 |
| Legal fees | 54,597 |
| Miscellaneous | 294,484 |
| Total expenses | $82,975,540 |
| Reduction of expenses by investment adviser and distributor | (1,467,496) |
| Net expenses | $81,508,044 |
| Net investment income (loss) | $123,777,859 |
| Realized and unrealized gain (loss) | |
| Realized gain (loss) (identified cost basis) | |
| Unaffiliated issuers | $734,672,259 |
| Affiliated issuers | 10,958,791 |
| Foreign currency | (652,351) |
| Net realized gain (loss) | $744,978,699 |
| Change in unrealized appreciation or depreciation | |
| Unaffiliated issuers | $(730,005,375) |
| Affiliated issuers | (19,038,757) |
| Translation of assets and liabilities in foreign currencies | (582,959) |
| Net unrealized gain (loss) | $(749,627,091) |
| Net realized and unrealized gain (loss) | $(4,648,392) |
| Change in net assets from operations | $119,129,467 |
| Financial Statements | Statements of Changes in Net Assets |
| Six months ended | Year ended | |
| 11/30/24 (unaudited) | 5/31/24 | |
| Change in net assets | ||
| From operations | ||
| Net investment income (loss) | $123,777,859 | $430,048,270 |
| Net realized gain (loss) | 744,978,699 | 1,792,653,006 |
| Net unrealized gain (loss) | (749,627,091) | 1,556,135,802 |
| Change in net assets from operations | $119,129,467 | $3,778,837,078 |
| Total distributions to shareholders | $— | $(2,275,439,510) |
| Change in net assets from fund share transactions | $(520,775,750) | $(593,154,719) |
| Total change in net assets | $(401,646,283) | $910,242,849 |
| Net assets | ||
| At beginning of period | 22,083,354,936 | 21,173,112,087 |
| At end of period | $21,681,708,653 | $22,083,354,936 |
| Financial Statements | Financial Highlights |
| Class A | Six months ended | Year ended | ||||
| 11/30/24 (unaudited) | 5/31/24 | 5/31/23 | 5/31/22 | 5/31/21 | 5/31/20 | |
| Net asset value, beginning of period | $40.94 | $38.48 | $42.44 | $53.83 | $44.47 | $42.09 |
| Income (loss) from investment operations | ||||||
| Net investment income (loss) (d) | $0.18 | $0.67 | $0.39 | $0.20 | $0.32 | $0.21 |
| Net realized and unrealized gain (loss) | (0.02) | 6.20 | 0.83 | (7.57) | 11.78 | 3.93 |
| Total from investment operations | $0.16 | $6.87 | $1.22 | $(7.37) | $12.10 | $4.14 |
| Less distributions declared to shareholders | ||||||
| From net investment income | $— | $(0.68) | $(0.30) | $(0.39) | $(0.21) | $(0.37) |
| From net realized gain | — | (3.73) | (4.88) | (3.63) | (2.53) | (1.39) |
| Total distributions declared to shareholders | $— | $(4.41) | $(5.18) | $(4.02) | $(2.74) | $(1.76) |
| Net asset value, end of period (x) | $41.10 | $40.94 | $38.48 | $42.44 | $53.83 | $44.47 |
| Total return (%) (r)(s)(t)(x) | 0.39(n) | 19.09 | 3.67 | (15.10) | 27.66 | 9.84 |
| Ratios (%) (to average net assets) and Supplemental data: | ||||||
| Expenses before expense reductions | 1.02(a) | 1.07 | 1.04 | 0.98 | 0.97 | 0.99 |
| Expenses after expense reductions | 1.01(a) | 1.05 | 1.03 | 0.96 | 0.96 | 0.98 |
| Net investment income (loss) | 0.85(a)(l) | 1.72 | 1.00 | 0.40 | 0.63 | 0.48 |
| Portfolio turnover rate | 7(n) | 12 | 19 | 10 | 7 | 7 |
| Net assets at end of period (000 omitted) | $1,747,236 | $1,841,902 | $1,899,509 | $2,345,833 | $3,046,287 | $2,651,120 |
| Class B | Six months ended | Year ended | ||||
| 11/30/24 (unaudited) | 5/31/24 | 5/31/23 | 5/31/22 | 5/31/21 | 5/31/20 | |
| Net asset value, beginning of period | $38.02 | $35.69 | $39.72 | $50.76 | $42.18 | $39.99 |
| Income (loss) from investment operations | ||||||
| Net investment income (loss) (d) | $0.02 | $0.28 | $(0.04) | $(0.25) | $(0.08) | $(0.12) |
| Net realized and unrealized gain (loss) | (0.01) | 5.81 | 0.89 | (7.01) | 11.19 | 3.72 |
| Total from investment operations | $0.01 | $6.09 | $0.85 | $(7.26) | $11.11 | $3.60 |
| Less distributions declared to shareholders | ||||||
| From net investment income | $— | $(0.03) | $— | $(0.15) | $— | $(0.02) |
| From net realized gain | — | (3.73) | (4.88) | (3.63) | (2.53) | (1.39) |
| Total distributions declared to shareholders | $— | $(3.76) | $(4.88) | $(3.78) | $(2.53) | $(1.41) |
| Net asset value, end of period (x) | $38.03 | $38.02 | $35.69 | $39.72 | $50.76 | $42.18 |
| Total return (%) (r)(s)(t)(x) | 0.03(n) | 18.16 | 2.91 | (15.74) | 26.75 | 8.99 |
| Ratios (%) (to average net assets) and Supplemental data: | ||||||
| Expenses before expense reductions | 1.77(a) | 1.82 | 1.79 | 1.72 | 1.72 | 1.74 |
| Expenses after expense reductions | 1.76(a) | 1.81 | 1.78 | 1.71 | 1.71 | 1.73 |
| Net investment income (loss) | 0.10(a)(l) | 0.79 | (0.10) | (0.52) | (0.16) | (0.29) |
| Portfolio turnover rate | 7(n) | 12 | 19 | 10 | 7 | 7 |
| Net assets at end of period (000 omitted) | $804 | $1,188 | $2,313 | $8,336 | $19,911 | $25,231 |
| Class C | Six months ended | Year ended | ||||
| 11/30/24 (unaudited) | 5/31/24 | 5/31/23 | 5/31/22 | 5/31/21 | 5/31/20 | |
| Net asset value, beginning of period | $35.03 | $33.31 | $37.41 | $48.04 | $40.04 | $38.05 |
| Income (loss) from investment operations | ||||||
| Net investment income (loss) (d) | $0.02 | $0.28 | $(0.04) | $(0.23) | $(0.09) | $(0.11) |
| Net realized and unrealized gain (loss) | (0.02) | 5.37 | 0.82 | (6.60) | 10.62 | 3.54 |
| Total from investment operations | $0.00 | $5.65 | $0.78 | $(6.83) | $10.53 | $3.43 |
| Less distributions declared to shareholders | ||||||
| From net investment income | $— | $(0.20) | $— | $(0.17) | $— | $(0.05) |
| From net realized gain | — | (3.73) | (4.88) | (3.63) | (2.53) | (1.39) |
| Total distributions declared to shareholders | $— | $(3.93) | $(4.88) | $(3.80) | $(2.53) | $(1.44) |
| Net asset value, end of period (x) | $35.03 | $35.03 | $33.31 | $37.41 | $48.04 | $40.04 |
| Total return (%) (r)(s)(t)(x) | 0.00(n) | 18.19 | 2.90 | (15.73) | 26.73 | 9.00 |
| Ratios (%) (to average net assets) and Supplemental data: | ||||||
| Expenses before expense reductions | 1.77(a) | 1.82 | 1.79 | 1.73 | 1.72 | 1.74 |
| Expenses after expense reductions | 1.76(a) | 1.81 | 1.78 | 1.71 | 1.71 | 1.73 |
| Net investment income (loss) | 0.10(a)(l) | 0.83 | (0.10) | (0.50) | (0.19) | (0.27) |
| Portfolio turnover rate | 7(n) | 12 | 19 | 10 | 7 | 7 |
| Net assets at end of period (000 omitted) | $15,518 | $20,444 | $33,852 | $117,583 | $264,432 | $395,411 |
| Class I | Six months ended | Year ended | ||||
| 11/30/24 (unaudited) | 5/31/24 | 5/31/23 | 5/31/22 | 5/31/21 | 5/31/20 | |
| Net asset value, beginning of period | $44.20 | $41.22 | $45.09 | $56.87 | $46.83 | $44.24 |
| Income (loss) from investment operations | ||||||
| Net investment income (loss) (d) | $0.25 | $0.83 | $0.51 | $0.34 | $0.47 | $0.34 |
| Net realized and unrealized gain (loss) | (0.03) | 6.67 | 0.91 | (8.04) | 12.44 | 4.13 |
| Total from investment operations | $0.22 | $7.50 | $1.42 | $(7.70) | $12.91 | $4.47 |
| Less distributions declared to shareholders | ||||||
| From net investment income | $— | $(0.79) | $(0.41) | $(0.45) | $(0.34) | $(0.49) |
| From net realized gain | — | (3.73) | (4.88) | (3.63) | (2.53) | (1.39) |
| Total distributions declared to shareholders | $— | $(4.52) | $(5.29) | $(4.08) | $(2.87) | $(1.88) |
| Net asset value, end of period (x) | $44.42 | $44.20 | $41.22 | $45.09 | $56.87 | $46.83 |
| Total return (%) (r)(s)(t)(x) | 0.50(n) | 19.38 | 3.93 | (14.89) | 28.01 | 10.10 |
| Ratios (%) (to average net assets) and Supplemental data: | ||||||
| Expenses before expense reductions | 0.77(a) | 0.81 | 0.79 | 0.73 | 0.72 | 0.74 |
| Expenses after expense reductions | 0.76(a) | 0.80 | 0.78 | 0.71 | 0.71 | 0.73 |
| Net investment income (loss) | 1.10(a)(l) | 1.99 | 1.23 | 0.63 | 0.89 | 0.74 |
| Portfolio turnover rate | 7(n) | 12 | 19 | 10 | 7 | 7 |
| Net assets at end of period (000 omitted) | $6,504,581 | $6,723,488 | $6,689,895 | $8,888,439 | $12,285,870 | $10,468,862 |
| Class R1 | Six months ended | Year ended | ||||
| 11/30/24 (unaudited) | 5/31/24 | 5/31/23 | 5/31/22 | 5/31/21 | 5/31/20 | |
| Net asset value, beginning of period | $35.33 | $33.77 | $37.88 | $48.67 | $40.54 | $38.51 |
| Income (loss) from investment operations | ||||||
| Net investment income (loss) (d) | $0.02 | $0.34 | $0.11 | $(0.17) | $(0.06) | $(0.10) |
| Net realized and unrealized gain (loss) | (0.02) | 5.38 | 0.68 | (6.74) | 10.72 | 3.58 |
| Total from investment operations | $0.00 | $5.72 | $0.79 | $(6.91) | $10.66 | $3.48 |
| Less distributions declared to shareholders | ||||||
| From net investment income | $— | $(0.43) | $(0.02) | $(0.25) | $— | $(0.06) |
| From net realized gain | — | (3.73) | (4.88) | (3.63) | (2.53) | (1.39) |
| Total distributions declared to shareholders | $— | $(4.16) | $(4.90) | $(3.88) | $(2.53) | $(1.45) |
| Net asset value, end of period (x) | $35.33 | $35.33 | $33.77 | $37.88 | $48.67 | $40.54 |
| Total return (%) (r)(s)(t)(x) | 0.00(n) | 18.22 | 2.89 | (15.73) | 26.72 | 9.01 |
| Ratios (%) (to average net assets) and Supplemental data: | ||||||
| Expenses before expense reductions | 1.77(a) | 1.82 | 1.79 | 1.73 | 1.72 | 1.74 |
| Expenses after expense reductions | 1.76(a) | 1.80 | 1.78 | 1.71 | 1.71 | 1.73 |
| Net investment income (loss) | 0.10(a)(l) | 1.00 | 0.32 | (0.37) | (0.12) | (0.25) |
| Portfolio turnover rate | 7(n) | 12 | 19 | 10 | 7 | 7 |
| Net assets at end of period (000 omitted) | $8,191 | $8,242 | $8,149 | $8,909 | $11,648 | $9,836 |
| Class R2 | Six months ended | Year ended | ||||
| 11/30/24 (unaudited) | 5/31/24 | 5/31/23 | 5/31/22 | 5/31/21 | 5/31/20 | |
| Net asset value, beginning of period | $36.71 | $34.94 | $39.03 | $49.87 | $41.36 | $39.25 |
| Income (loss) from investment operations | ||||||
| Net investment income (loss) (d) | $0.11 | $0.52 | $0.28 | $0.06 | $0.18 | $0.09 |
| Net realized and unrealized gain (loss) | (0.01) | 5.57 | 0.72 | (6.94) | 10.95 | 3.67 |
| Total from investment operations | $0.10 | $6.09 | $1.00 | $(6.88) | $11.13 | $3.76 |
| Less distributions declared to shareholders | ||||||
| From net investment income | $— | $(0.59) | $(0.21) | $(0.33) | $(0.09) | $(0.26) |
| From net realized gain | — | (3.73) | (4.88) | (3.63) | (2.53) | (1.39) |
| Total distributions declared to shareholders | $— | $(4.32) | $(5.09) | $(3.96) | $(2.62) | $(1.65) |
| Net asset value, end of period (x) | $36.81 | $36.71 | $34.94 | $39.03 | $49.87 | $41.36 |
| Total return (%) (r)(s)(t)(x) | 0.27(n) | 18.75 | 3.42 | (15.30) | 27.36 | 9.56 |
| Ratios (%) (to average net assets) and Supplemental data: | ||||||
| Expenses before expense reductions | 1.27(a) | 1.31 | 1.29 | 1.23 | 1.22 | 1.24 |
| Expenses after expense reductions | 1.26(a) | 1.30 | 1.28 | 1.21 | 1.21 | 1.23 |
| Net investment income (loss) | 0.60(a)(l) | 1.48 | 0.79 | 0.12 | 0.38 | 0.23 |
| Portfolio turnover rate | 7(n) | 12 | 19 | 10 | 7 | 7 |
| Net assets at end of period (000 omitted) | $110,307 | $125,614 | $132,772 | $153,967 | $224,998 | $219,474 |
| Class R3 | Six months ended | Year ended | ||||
| 11/30/24 (unaudited) | 5/31/24 | 5/31/23 | 5/31/22 | 5/31/21 | 5/31/20 | |
| Net asset value, beginning of period | $40.48 | $38.07 | $42.06 | $53.38 | $44.11 | $41.78 |
| Income (loss) from investment operations | ||||||
| Net investment income (loss) (d) | $0.18 | $0.66 | $0.41 | $0.20 | $0.31 | $0.21 |
| Net realized and unrealized gain (loss) | (0.03) | 6.13 | 0.79 | (7.49) | 11.70 | 3.89 |
| Total from investment operations | $0.15 | $6.79 | $1.20 | $(7.29) | $12.01 | $4.10 |
| Less distributions declared to shareholders | ||||||
| From net investment income | $— | $(0.65) | $(0.31) | $(0.40) | $(0.21) | $(0.38) |
| From net realized gain | — | (3.73) | (4.88) | (3.63) | (2.53) | (1.39) |
| Total distributions declared to shareholders | $— | $(4.38) | $(5.19) | $(4.03) | $(2.74) | $(1.77) |
| Net asset value, end of period (x) | $40.63 | $40.48 | $38.07 | $42.06 | $53.38 | $44.11 |
| Total return (%) (r)(s)(t)(x) | 0.37(n) | 19.09 | 3.66 | (15.09) | 27.68 | 9.81 |
| Ratios (%) (to average net assets) and Supplemental data: | ||||||
| Expenses before expense reductions | 1.02(a) | 1.07 | 1.04 | 0.98 | 0.97 | 0.99 |
| Expenses after expense reductions | 1.01(a) | 1.06 | 1.03 | 0.96 | 0.96 | 0.98 |
| Net investment income (loss) | 0.86(a)(l) | 1.71 | 1.07 | 0.39 | 0.62 | 0.49 |
| Portfolio turnover rate | 7(n) | 12 | 19 | 10 | 7 | 7 |
| Net assets at end of period (000 omitted) | $905,153 | $902,678 | $977,368 | $1,034,115 | $1,383,344 | $1,320,257 |
| Class R4 | Six months ended | Year ended | ||||
| 11/30/24 (unaudited) | 5/31/24 | 5/31/23 | 5/31/22 | 5/31/21 | 5/31/20 | |
| Net asset value, beginning of period | $41.14 | $38.66 | $42.63 | $53.98 | $44.58 | $42.20 |
| Income (loss) from investment operations | ||||||
| Net investment income (loss) (d) | $0.23 | $0.77 | $0.48 | $0.32 | $0.45 | $0.33 |
| Net realized and unrealized gain (loss) | (0.02) | 6.23 | 0.84 | (7.59) | 11.82 | 3.93 |
| Total from investment operations | $0.21 | $7.00 | $1.32 | $(7.27) | $12.27 | $4.26 |
| Less distributions declared to shareholders | ||||||
| From net investment income | $— | $(0.79) | $(0.41) | $(0.45) | $(0.34) | $(0.49) |
| From net realized gain | — | (3.73) | (4.88) | (3.63) | (2.53) | (1.39) |
| Total distributions declared to shareholders | $— | $(4.52) | $(5.29) | $(4.08) | $(2.87) | $(1.88) |
| Net asset value, end of period (x) | $41.35 | $41.14 | $38.66 | $42.63 | $53.98 | $44.58 |
| Total return (%) (r)(s)(t)(x) | 0.51(n) | 19.38 | 3.94 | (14.89) | 27.99 | 10.09 |
| Ratios (%) (to average net assets) and Supplemental data: | ||||||
| Expenses before expense reductions | 0.77(a) | 0.82 | 0.79 | 0.73 | 0.72 | 0.74 |
| Expenses after expense reductions | 0.76(a) | 0.80 | 0.78 | 0.71 | 0.71 | 0.73 |
| Net investment income (loss) | 1.10(a)(l) | 1.96 | 1.22 | 0.61 | 0.88 | 0.75 |
| Portfolio turnover rate | 7(n) | 12 | 19 | 10 | 7 | 7 |
| Net assets at end of period (000 omitted) | $489,037 | $557,082 | $622,734 | $781,557 | $1,183,942 | $1,019,909 |
| Class R6 | Six months ended | Year ended | ||||
| 11/30/24 (unaudited) | 5/31/24 | 5/31/23 | 5/31/22 | 5/31/21 | 5/31/20 | |
| Net asset value, beginning of period | $41.23 | $38.75 | $42.72 | $54.06 | $44.63 | $42.24 |
| Income (loss) from investment operations | ||||||
| Net investment income (loss) (d) | $0.25 | $0.83 | $0.57 | $0.40 | $0.51 | $0.37 |
| Net realized and unrealized gain (loss) | (0.01) | 6.22 | 0.80 | (7.63) | 11.84 | 3.94 |
| Total from investment operations | $0.24 | $7.05 | $1.37 | $(7.23) | $12.35 | $4.31 |
| Less distributions declared to shareholders | ||||||
| From net investment income | $— | $(0.84) | $(0.46) | $(0.48) | $(0.39) | $(0.53) |
| From net realized gain | — | (3.73) | (4.88) | (3.63) | (2.53) | (1.39) |
| Total distributions declared to shareholders | $— | $(4.57) | $(5.34) | $(4.11) | $(2.92) | $(1.92) |
| Net asset value, end of period (x) | $41.47 | $41.23 | $38.75 | $42.72 | $54.06 | $44.63 |
| Total return (%) (r)(s)(t)(x) | 0.58(n) | 19.48 | 4.07 | (14.81) | 28.15 | 10.21 |
| Ratios (%) (to average net assets) and Supplemental data: | ||||||
| Expenses before expense reductions | 0.67(a) | 0.71 | 0.68 | 0.62 | 0.62 | 0.63 |
| Expenses after expense reductions | 0.66(a) | 0.69 | 0.67 | 0.60 | 0.61 | 0.62 |
| Net investment income (loss) | 1.21(a)(l) | 2.12 | 1.45 | 0.78 | 1.01 | 0.85 |
| Portfolio turnover rate | 7(n) | 12 | 19 | 10 | 7 | 7 |
| Net assets at end of period (000 omitted) | $11,900,881 | $11,902,716 | $10,806,520 | $11,183,181 | $13,585,886 | $11,561,818 |
| (a) | Annualized. |
| (d) | Per share data is based on average shares outstanding. |
| (l) | Recognition of net investment income by the fund may be affected by the timing of the declaration of dividends by companies in which the fund invests and the actual annual net investment income ratio may differ. |
| (n) | Not annualized. |
| (r) | Certain expenses have been reduced without which performance would have been lower. |
| (s) | From time to time the fund may receive proceeds from litigation settlements, without which performance would be lower. |
| (t) | Total returns do not include any applicable sales charges. |
| (x) | The net asset values and total returns have been calculated on net assets which include adjustments made in accordance with U.S. generally accepted accounting principles required at period end for financial reporting purposes. |
| Financial Instruments | Level 1 | Level 2 | Level 3 | Total |
| Equity Securities | $20,825,534,159 | $— | $— | $20,825,534,159 |
| Mutual Funds | 769,997,169 | — | — | 769,997,169 |
| Total | $21,595,531,328 | $— | $— | $21,595,531,328 |
| Year ended 5/31/24 | |
| Ordinary income (including any short-term capital gains) | $401,184,634 |
| Long-term capital gains | 1,874,254,876 |
| Total distributions | $2,275,439,510 |
| As of 11/30/24 | |
| Cost of investments | $16,111,023,245 |
| Gross appreciation | 6,518,298,769 |
| Gross depreciation | (1,033,790,686) |
| Net unrealized appreciation (depreciation) | $5,484,508,083 |
| As of 5/31/24 | |
| Undistributed ordinary income | 327,801,751 |
| Undistributed long-term capital gain | 1,227,063,365 |
| Other temporary differences | 2,822,150 |
| Net unrealized appreciation (depreciation) | 6,233,552,213 |
| Six months ended 11/30/24 | Year ended 5/31/24 | ||
| Class A | $— | $194,579,439 | |
| Class B | — | 149,837 | |
| Class C | — | 2,809,790 | |
| Class I | — | 670,949,652 | |
| Class R1 | — | 915,815 | |
| Class R2 | — | 14,232,852 | |
| Class R3 | — | 83,620,241 | |
| Class R4 | — | 66,883,726 | |
| Class R6 | — | 1,241,298,158 | |
| Total | $— | $2,275,439,510 |
| Up to $1 billion | 0.90% |
| In excess of $1 billion and up to $2 billion | 0.80% |
| In excess of $2 billion and up to $10 billion | 0.70% |
| In excess of $10 billion and up to $15 billion | 0.65% |
| In excess of $15 billion and up to $20 billion | 0.55% |
| In excess of $20 billion and up to $25 billion | 0.50% |
| In excess of $25 billion and up to $30 billion | 0.45% |
| In excess of $30 billion and up to $35 billion | 0.43% |
| In excess of $35 billion | 0.41% |
| Distribution Fee Rate (d) | Service Fee Rate (d) | Total Distribution Plan (d) | Annual Effective Rate (e) | Distribution and Service Fee | |
| Class A | — | 0.25% | 0.25% | 0.25% | $ 2,280,949 |
| Class B | 0.75% | 0.25% | 1.00% | 1.00% | 5,211 |
| Class C | 0.75% | 0.25% | 1.00% | 1.00% | 90,285 |
| Class R1 | 0.75% | 0.25% | 1.00% | 1.00% | 41,434 |
| Class R2 | 0.25% | 0.25% | 0.50% | 0.50% | 297,896 |
| Class R3 | — | 0.25% | 0.25% | 0.25% | 1,151,249 |
| Total Distribution and Service Fees | $3,867,024 |
| (d) | In accordance with the distribution plan for certain classes, the fund pays distribution and/or service fees equal to these annual percentage rates of each class’s average daily net assets. The distribution and service fee rates disclosed by class represent the current rates in effect at the end of the reporting period. Any rate changes, if applicable, are detailed below. |
| (e) | The annual effective rates represent actual fees incurred under the distribution plan for the six months ended November 30, 2024 based on each class's average daily net assets. MFD has voluntarily agreed to rebate a portion of each class's 0.25% service fee attributable to accounts for which there is no financial intermediary specified on the account except for accounts attributable to MFS or its affiliates' seed money. For the six months ended November 30, 2024, this rebate amounted to $84 and $260 for Class A and Class R3 shares, respectively, and is included in the reduction of total expenses in the Statement of Operations. |
| Amount | |
| Class A | $1,623 |
| Class B | 25 |
| Class C | 103 |
| Date | Transaction | Class | Shares | Amount |
| 8/19/2024 | Redemption | Class I | 3 | $144 |
| 8/19/2024 | Redemption | Class R1 | 5 | 189 |
| 8/19/2024 | Redemption | Class R2 | 5 | 194 |
| 8/19/2024 | Redemption | Class R3 | 4 | 186 |
| 8/19/2024 | Redemption | Class R4 | 5 | 191 |
| Six months ended 11/30/24 | Year ended 5/31/24 | ||||
| Shares | Amount | Shares | Amount | ||
| Shares sold | |||||
| Class A | 2,096,521 | $86,081,280 | 6,156,370 | $237,226,544 | |
| Class B | — | — | 1,036 | 35,849 | |
| Class C | 4,404 | 156,784 | 18,947 | 631,703 | |
| Class I | 6,458,923 | 287,031,120 | 16,519,782 | 687,209,969 | |
| Class R1 | 10,885 | 385,280 | 26,362 | 889,180 | |
| Class R2 | 182,293 | 6,741,905 | 404,140 | 14,245,013 | |
| Class R3 | 2,247,117 | 91,518,542 | 4,992,430 | 195,595,262 | |
| Class R4 | 849,375 | 35,137,778 | 2,403,877 | 93,929,826 | |
| Class R6 | 14,865,739 | 621,360,709 | 22,613,585 | 884,669,944 | |
| 26,715,257 | $1,128,413,398 | 53,136,529 | $2,114,433,290 | ||
| Shares issued to shareholders in reinvestment of distributions | |||||
| Class A | — | $— | 4,425,137 | $163,508,817 | |
| Class B | — | — | 4,281 | 147,387 | |
| Class C | — | — | 85,811 | 2,721,915 | |
| Class I | — | — | 15,127,236 | 602,669,078 | |
| Class R1 | — | — | 28,628 | 915,815 | |
| Class R2 | — | — | 427,844 | 14,191,597 | |
| Class R3 | — | — | 2,289,084 | 83,620,241 | |
| Class R4 | — | — | 1,588,648 | 58,922,953 | |
| Class R6 | — | — | 32,114,333 | 1,193,047,471 | |
| — | $— | 56,091,002 | $2,119,745,274 | ||
| Six months ended 11/30/24 | Year ended 5/31/24 | ||||
| Shares | Amount | Shares | Amount | ||
| Shares reacquired | |||||
| Class A | (4,572,980) | $(188,618,440) | (14,948,857) | $(577,739,346) | |
| Class B | (10,107) | (389,729) | (38,879) | (1,415,052) | |
| Class C | (145,085) | (5,138,361) | (537,375) | (17,996,022) | |
| Class I | (12,160,994) | (542,253,618) | (41,825,004) | (1,749,061,014) | |
| Class R1 | (12,365) | (438,210) | (62,933) | (2,109,279) | |
| Class R2 | (607,025) | (22,464,691) | (1,211,113) | (42,827,348) | |
| Class R3 | (2,271,917) | (92,989,855) | (10,653,036) | (406,323,224) | |
| Class R4 | (2,564,107) | (106,948,497) | (6,559,062) | (260,552,802) | |
| Class R6 | (16,527,451) | (689,947,747) | (44,973,291) | (1,769,309,196) | |
| (38,872,031) | $(1,649,189,148) | (120,809,550) | $(4,827,333,283) | ||
| Net change | |||||
| Class A | (2,476,459) | $(102,537,160) | (4,367,350) | $(177,003,985) | |
| Class B | (10,107) | (389,729) | (33,562) | (1,231,816) | |
| Class C | (140,681) | (4,981,577) | (432,617) | (14,642,404) | |
| Class I | (5,702,071) | (255,222,498) | (10,177,986) | (459,181,967) | |
| Class R1 | (1,480) | (52,930) | (7,943) | (304,284) | |
| Class R2 | (424,732) | (15,722,786) | (379,129) | (14,390,738) | |
| Class R3 | (24,800) | (1,471,313) | (3,371,522) | (127,107,721) | |
| Class R4 | (1,714,732) | (71,810,719) | (2,566,537) | (107,700,023) | |
| Class R6 | (1,661,712) | (68,587,038) | 9,754,627 | 308,408,219 | |
| (12,156,774) | $(520,775,750) | (11,582,019) | $(593,154,719) | ||
| Affiliated Issuers | Beginning Value | Purchases | Sales Proceeds | Realized Gain (Loss) | Change in Unrealized Appreciation or Depreciation | Ending Value |
| IMI PLC | $353,648,089 | $— | $32,656,638 | $10,954,504 | $(19,020,714) | $312,925,241 |
| MFS Institutional Money Market Portfolio | 626,197,991 | 1,343,336,128 | 1,199,523,194 | 4,287 | (18,043) | 769,997,169 |
| $979,846,080 | $1,343,336,128 | $1,232,179,832 | $10,958,791 | $(19,038,757) | $1,082,922,410 |
| Affiliated Issuers | Dividend Income | Capital Gain Distributions |
| IMI PLC | $1,441,587 | $— |
| MFS Institutional Money Market Portfolio | 16,925,869 | — |
| $18,367,456 | $— |
| Number of Dollars | ||||||
| Nominee | For | Against/Withheld | Abstain | |||
| Steven E. Buller | 93,694,553,358.767 | 2,599,093,584.595 | 0.000 | |||
| John A. Caroselli | 94,028,434,411.278 | 2,265,212,532.084 | 0.000 | |||
| Maureen R. Goldfarb | 94,361,674,360.213 | 1,931,972,583.149 | 0.000 | |||
| Peter D. Jones | 94,066,354,687.369 | 2,227,292,255.993 | 0.000 | |||
| John P. Kavanaugh | 94,185,926,082.433 | 2,107,559,444.381 | 161,416.548 | |||
| James W. Kilman, Jr. | 94,450,795,713.326 | 1,842,851,230.036 | 0.000 | |||
| Clarence Otis, Jr. | 93,984,248,122.457 | 2,309,398,820.905 | 0.000 | |||
| Michael W. Roberge | 94,352,210,986.123 | 1,941,435,957.239 | 0.000 | |||
| Maryanne L. Roepke | 94,413,451,878.996 | 1,880,195,064.366 | 0.000 | |||
| Paula E. Smith | 94,545,454,781.292 | 1,748,192,162.070 | 0.000 | |||
| Laurie J. Thomsen | 94,416,793,826.848 | 1,876,853,116.514 | 0.000 | |||
| Darrell A. Williams | 94,451,319,166.310 | 1,842,327,777.051 | 0.000 | |||
| Issuer | Shares/Par | Value ($) | ||
| Common Stocks – 98.3% | ||||
| Aerospace & Defense – 1.5% | ||||
| Rolls-Royce Holdings PLC (a) | 27,564,375 | $ 196,255,989 | ||
| Singapore Technologies Engineering Ltd. | 19,153,400 | 64,390,796 | ||
| $260,646,785 | ||||
| Alcoholic Beverages – 4.5% | ||||
| Diageo PLC | 7,983,844 | $ 239,395,241 | ||
| Heineken N.V. | 5,096,271 | 377,860,315 | ||
| Pernod Ricard S.A. | 1,393,471 | 156,171,769 | ||
| $773,427,325 | ||||
| Apparel Manufacturers – 2.9% | ||||
| Burberry Group PLC | 3,764,255 | $ 43,094,905 | ||
| Kering S.A. | 275,199 | 64,291,891 | ||
| LVMH Moet Hennessy Louis Vuitton SE | 632,001 | 396,291,498 | ||
| $503,678,294 | ||||
| Brokerage & Asset Managers – 2.4% | ||||
| Deutsche Boerse AG | 1,160,448 | $ 272,024,519 | ||
| London Stock Exchange Group PLC | 975,763 | 140,165,813 | ||
| $412,190,332 | ||||
| Business Services – 3.9% | ||||
| Compass Group PLC | 5,350,325 | $ 183,513,365 | ||
| Experian PLC | 5,066,465 | 242,228,895 | ||
| Nomura Research Institute Ltd. | 5,711,600 | 174,851,909 | ||
| Sodexo | 879,291 | 73,141,491 | ||
| $673,735,660 | ||||
| Chemicals – 0.5% | ||||
| UPL Ltd. | 12,533,799 | $ 80,842,883 | ||
| Computer Software – 8.7% | ||||
| Dassault Systemes SE | 4,798,718 | $ 165,812,417 | ||
| Kingsoft Corp. | 12,930,000 | 52,175,958 | ||
| OBIC Co. Ltd. | 5,228,800 | 171,393,103 | ||
| Oracle Corp. Japan | 1,225,900 | 125,506,469 | ||
| SAP SE | 3,543,677 | 843,436,169 | ||
| Totvs S.A. | 10,419,000 | 47,903,047 | ||
| Wisetech Global Ltd. | 1,026,275 | 85,768,304 | ||
| $1,491,995,467 | ||||
| Computer Software - Systems – 7.5% | ||||
| Amadeus IT Group S.A. | 5,273,131 | $ 370,660,296 | ||
| Cap Gemini S.A. | 1,843,411 | 296,338,845 | ||
| Hitachi Ltd. | 24,843,400 | 622,745,211 | ||
| $1,289,744,352 | ||||
| Issuer | Shares/Par | Value ($) | ||
| Common Stocks – continued | ||||
| Construction – 0.3% | ||||
| Kingspan Group PLC | 730,379 | $ 55,034,738 | ||
| Consumer Products – 2.8% | ||||
| AmorePacific Corp. | 1,060,248 | $ 79,192,747 | ||
| Haleon PLC | 24,483,641 | 116,807,214 | ||
| KOSE Corp. | 302,600 | 13,568,872 | ||
| Reckitt Benckiser Group PLC | 4,231,268 | 262,108,220 | ||
| $471,677,053 | ||||
| Electrical Equipment – 4.0% | ||||
| Schneider Electric SE | 2,626,969 | $ 676,959,285 | ||
| Electronics – 6.7% | ||||
| ASML Holding N.V. | 229,082 | $ 159,620,778 | ||
| SK Hynix, Inc. | 621,826 | 71,273,415 | ||
| Taiwan Semiconductor Manufacturing Co. Ltd. | 20,892,000 | 640,594,526 | ||
| Taiwan Semiconductor Manufacturing Co. Ltd., ADR | 1,502,148 | 277,386,650 | ||
| $1,148,875,369 | ||||
| Energy - Independent – 0.8% | ||||
| Reliance Industries Ltd. | 8,989,120 | $ 137,470,490 | ||
| Entertainment – 0.2% | ||||
| Lottery Corp. Ltd. | 9,387,571 | $ 31,724,657 | ||
| Food & Beverages – 3.1% | ||||
| Nestle S.A. | 6,034,831 | $ 524,124,319 | ||
| Food & Drug Stores – 0.4% | ||||
| Sugi Holdings Co. Ltd. | 3,938,600 | $ 66,525,070 | ||
| Gaming & Lodging – 3.1% | ||||
| Aristocrat Leisure Ltd. | 3,684,851 | $ 162,870,778 | ||
| Flutter Entertainment PLC (a) | 976,593 | 269,852,178 | ||
| Sands China Ltd. (a) | 37,099,200 | 94,590,707 | ||
| $527,313,663 | ||||
| Insurance – 2.5% | ||||
| AIA Group Ltd. | 46,700,000 | $ 348,986,686 | ||
| Ping An Insurance Co. of China Ltd., “H” | 14,522,000 | 83,607,783 | ||
| $432,594,469 | ||||
| Internet – 1.2% | ||||
| LY Corp. | 29,936,600 | $ 82,403,673 | ||
| NAVER Corp. | 832,206 | 123,185,935 | ||
| $205,589,608 | ||||
| Leisure & Toys – 1.7% | ||||
| Prosus N.V. | 2,191,889 | $ 89,423,482 | ||
| Tencent Holdings Ltd. | 3,792,500 | 193,977,305 | ||
| $283,400,787 | ||||
| Issuer | Shares/Par | Value ($) | ||
| Common Stocks – continued | ||||
| Machinery & Tools – 6.2% | ||||
| Assa Abloy AB | 10,526,522 | $ 323,689,271 | ||
| Delta Electronics, Inc. | 15,114,000 | 177,275,313 | ||
| GEA Group AG | 4,001,898 | 200,410,000 | ||
| RB Global, Inc. | 3,608,468 | 356,529,988 | ||
| $1,057,904,572 | ||||
| Major Banks – 1.6% | ||||
| DBS Group Holdings Ltd. | 8,415,740 | $ 266,766,164 | ||
| Medical Equipment – 5.2% | ||||
| EssilorLuxottica | 1,622,284 | $ 394,535,008 | ||
| QIAGEN N.V. | 4,155,546 | 182,003,479 | ||
| Sonova Holding AG | 430,780 | 147,148,108 | ||
| Terumo Corp. | 7,970,900 | 162,518,149 | ||
| $886,204,744 | ||||
| Natural Gas - Distribution – 0.4% | ||||
| China Resources Gas Group Ltd. | 19,379,400 | $ 69,235,269 | ||
| Oil Services – 0.5% | ||||
| Tenaris S.A. | 4,480,268 | $ 86,105,020 | ||
| Other Banks & Diversified Financials – 4.7% | ||||
| Credicorp Ltd. | 923,887 | $ 171,353,322 | ||
| Element Fleet Management Corp. | 8,612,330 | 182,684,856 | ||
| Grupo Financiero Banorte S.A. de C.V. | 16,793,074 | 111,601,969 | ||
| HDFC Bank Ltd. | 9,808,964 | 208,499,073 | ||
| Kasikornbank Co. Ltd. | 13,963,500 | 61,069,320 | ||
| Kotak Mahindra Bank Ltd. | 3,369,019 | 70,383,725 | ||
| $805,592,265 | ||||
| Pharmaceuticals – 6.4% | ||||
| Chugai Pharmaceutical Co. Ltd. | 858,100 | $ 37,835,764 | ||
| Daiichi Sankyo Co. Ltd. | 3,047,700 | 96,722,316 | ||
| Merck KGaA | 849,718 | 127,334,682 | ||
| Novartis AG | 2,572,907 | 272,513,100 | ||
| Roche Holding AG | 1,909,982 | 554,168,068 | ||
| $1,088,573,930 | ||||
| Precious Metals & Minerals – 3.3% | ||||
| Agnico Eagle Mines Ltd. | 3,732,347 | $ 314,709,772 | ||
| Franco-Nevada Corp. | 1,978,345 | 242,236,522 | ||
| $556,946,294 | ||||
| Railroad & Shipping – 0.9% | ||||
| Canadian Pacific Kansas City Ltd. | 1,911,083 | $ 146,195,836 | ||
| Restaurants – 0.6% | ||||
| Yum China Holdings, Inc. | 1,547,295 | $ 72,026,582 | ||
| Yum China Holdings, Inc. | 660,400 | 30,128,512 | ||
| $102,155,094 | ||||
| Issuer | Shares/Par | Value ($) | ||
| Common Stocks – continued | ||||
| Specialty Chemicals – 7.5% | ||||
| Air Liquide S.A. | 1,895,595 | $ 315,520,579 | ||
| Akzo Nobel N.V. | 1,488,838 | 87,132,708 | ||
| Linde PLC | 957,468 | 441,383,173 | ||
| Resonac Holdings Corp. | 4,415,400 | 120,210,770 | ||
| Sika AG | 474,667 | 122,952,013 | ||
| Symrise AG | 1,709,094 | 189,012,652 | ||
| $1,276,211,895 | ||||
| Specialty Stores – 1.8% | ||||
| Alibaba Group Holding Ltd. | 8,644,700 | $ 92,930,470 | ||
| Zalando SE (a) | 3,923,471 | 122,157,954 | ||
| ZOZO, Inc. | 2,981,700 | 93,910,399 | ||
| $308,998,823 | ||||
| Telecommunications - Wireless – 0.2% | ||||
| Advanced Info Service Public Co. Ltd. | 4,218,700 | $ 35,055,893 | ||
| Tobacco – 0.3% | ||||
| ITC Ltd. | 10,307,958 | $ 58,160,202 | ||
| Total Common Stocks (Identified Cost, $12,395,471,793) | $16,791,656,607 | |||
| Strike Price | First Exercise | |||
| Rights – 0.0% | ||||
| Chemicals – 0.0% | ||||
| UPL Ltd. (8 shares for 1 right, Expiration 12/31/2024) (a) (Identified Cost, $0) | INR 360 | 12/17/24 | 1,566,724 | $ 3,430,258 |
| Investment Companies (h) – 1.5% | ||||
| Money Market Funds – 1.5% | ||||
| MFS Institutional Money Market Portfolio, 4.66% (v) (Identified Cost, $254,248,168) | 254,235,521 | $ 254,260,945 | ||
| Other Assets, Less Liabilities – 0.2% | 35,514,668 | |||
| Net Assets – 100.0% | $17,084,862,478 | |||
| (a) | Non-income producing security. | |||
| (h) | An affiliated issuer, which may be considered one in which the fund owns 5% or more of the outstanding voting securities, or a company which is under common control. At period end, the aggregate values of the fund's investments in affiliated issuers and in unaffiliated issuers were $254,260,945 and $16,795,086,865, respectively. | |||
| (v) | Affiliated issuer that is available only to investment companies managed by MFS. The rate quoted for the MFS Institutional Money Market Portfolio is the annualized seven-day yield of the fund at period end. |
| The following abbreviations are used in this report and are defined: | |
| ADR | American Depositary Receipt |
| Abbreviations indicate amounts shown in currencies other than the U.S. dollar. All amounts are stated in U.S. dollars unless otherwise indicated. A list of abbreviations is shown below: | |
| INR | Indian Rupee |
| Financial Statements | Statement of Assets and Liabilities |
| At 11/30/24 (unaudited)Assets | |
| Investments in unaffiliated issuers, at value (identified cost, $12,395,471,793) | $16,795,086,865 |
| Investments in affiliated issuers, at value (identified cost, $254,248,168) | 254,260,945 |
| Foreign currency, at value (identified cost, $992,036) | 1,004,360 |
| Receivables for | |
| Investments sold | 6,051,518 |
| Fund shares sold | 20,649,374 |
| Interest and dividends | 47,682,745 |
| Other assets | 47,510 |
| Total assets | $17,124,783,317 |
| Liabilities | |
| Payables for | |
| Investments purchased | $6,134,528 |
| Fund shares reacquired | 2,935,527 |
| Payable to affiliates | |
| Investment adviser | 1,215,516 |
| Administrative services fee | 6,754 |
| Shareholder servicing costs | 1,648,391 |
| Distribution and service fees | 31,382 |
| Payable for independent Trustees' compensation | 5,662 |
| Deferred foreign capital gains tax expense payable | 26,251,911 |
| Accrued expenses and other liabilities | 1,691,168 |
| Total liabilities | $39,920,839 |
| Net assets | $17,084,862,478 |
| Net assets consist of | |
| Paid-in capital | $11,692,698,359 |
| Total distributable earnings (loss) | 5,392,164,119 |
| Net assets | $17,084,862,478 |
| Shares of beneficial interest outstanding | 369,695,669 |
| Net assets | Shares outstanding | Net asset value per share (a) | |
| Class A | $665,668,173 | 14,951,820 | $44.52 |
| Class B | 617,573 | 15,037 | 41.07 |
| Class C | 24,149,894 | 611,450 | 39.50 |
| Class I | 4,369,170,679 | 85,962,704 | 50.83 |
| Class R1 | 8,403,513 | 219,375 | 38.31 |
| Class R2 | 20,617,666 | 516,805 | 39.89 |
| Class R3 | 319,870,891 | 7,259,682 | 44.06 |
| Class R4 | 117,051,850 | 2,609,485 | 44.86 |
| Class R6 | 11,559,312,239 | 257,549,311 | 44.88 |
| (a) | Maximum offering price per share was equal to the net asset value per share for all share classes, except for Class A, for which the maximum offering price per share was $47.24 [100 / 94.25 x $44.52]. On sales of $50,000 or more, the maximum offering price of Class A shares is reduced. A contingent deferred sales charge may be imposed on redemptions of Class A, Class B, and Class C shares. Redemption price per share was equal to the net asset value per share for Classes I, R1, R2, R3, R4, and R6. |
| Financial Statements | Statement of Operations |
| Six months ended 11/30/24 (unaudited)Net investment income (loss) | |
| Income | |
| Dividends from unaffiliated issuers | $113,330,882 |
| Dividends from affiliated issuers | 6,499,583 |
| Income on securities loaned | 46,972 |
| Interest | 3,078 |
| Other | 2,053 |
| Foreign taxes withheld | (9,122,712) |
| Total investment income | $110,759,856 |
| Expenses | |
| Management fee | $57,383,231 |
| Distribution and service fees | 1,457,052 |
| Shareholder servicing costs | 3,661,667 |
| Administrative services fee | 309,005 |
| Independent Trustees' compensation | 68,153 |
| Custodian fee | 857,110 |
| Shareholder communications | 362,977 |
| Audit and tax fees | 56,951 |
| Legal fees | 39,859 |
| Miscellaneous | 258,076 |
| Total expenses | $64,454,081 |
| Reduction of expenses by investment adviser and distributor | (1,141,094) |
| Net expenses | $63,312,987 |
| Net investment income (loss) | $47,446,869 |
| Realized and unrealized gain (loss) | |
| Realized gain (loss) (identified cost basis) | |
| Unaffiliated issuers (includes $580,810 foreign capital gains tax) | $863,150,330 |
| Affiliated issuers | 56,333 |
| Foreign currency | (1,242,415) |
| Net realized gain (loss) | $861,964,248 |
| Change in unrealized appreciation or depreciation | |
| Unaffiliated issuers (includes $17,528,621 increase in deferred foreign capital gains tax) | $(58,336,626) |
| Affiliated issuers | (16,747) |
| Translation of assets and liabilities in foreign currencies | (37,915) |
| Net unrealized gain (loss) | $(58,391,288) |
| Net realized and unrealized gain (loss) | $803,572,960 |
| Change in net assets from operations | $851,019,829 |
| Financial Statements | Statements of Changes in Net Assets |
| Six months ended | Year ended | |
| 11/30/24 (unaudited) | 5/31/24 | |
| Change in net assets | ||
| From operations | ||
| Net investment income (loss) | $47,446,869 | $215,027,937 |
| Net realized gain (loss) | 861,964,248 | 200,125,390 |
| Net unrealized gain (loss) | (58,391,288) | 1,442,939,822 |
| Change in net assets from operations | $851,019,829 | $1,858,093,149 |
| Total distributions to shareholders | $— | $(430,495,414) |
| Change in net assets from fund share transactions | $(353,013,218) | $577,818,110 |
| Total change in net assets | $498,006,611 | $2,005,415,845 |
| Net assets | ||
| At beginning of period | 16,586,855,867 | 14,581,440,022 |
| At end of period | $17,084,862,478 | $16,586,855,867 |
| Financial Statements | Financial Highlights |
| Class A | Six months ended | Year ended | ||||
| 11/30/24 (unaudited) | 5/31/24 | 5/31/23 | 5/31/22 | 5/31/21 | 5/31/20 | |
| Net asset value, beginning of period | $42.42 | $38.82 | $37.54 | $45.69 | $33.66 | $32.76 |
| Income (loss) from investment operations | ||||||
| Net investment income (loss) (d) | $0.05 | $0.41 | $0.35 | $0.21 | $0.22 | $0.23 |
| Net realized and unrealized gain (loss) | 2.05 | 4.22 | 1.90 | (5.48) | 12.05 | 1.20 |
| Total from investment operations | $2.10 | $4.63 | $2.25 | $(5.27) | $12.27 | $1.43 |
| Less distributions declared to shareholders | ||||||
| From net investment income | $— | $(0.48) | $(0.31) | $(0.32) | $(0.24) | $(0.35) |
| From net realized gain | — | (0.55) | (0.66) | (2.56) | — | (0.18) |
| Total distributions declared to shareholders | $— | $(1.03) | $(0.97) | $(2.88) | $(0.24) | $(0.53) |
| Net asset value, end of period (x) | $44.52 | $42.42 | $38.82 | $37.54 | $45.69 | $33.66 |
| Total return (%) (r)(s)(t)(x) | 4.95(n) | 12.11 | 6.12 | (12.34) | 36.52 | 4.24 |
| Ratios (%) (to average net assets) and Supplemental data: | ||||||
| Expenses before expense reductions | 1.07(a) | 1.11 | 1.09 | 1.08 | 1.08 | 1.08 |
| Expenses after expense reductions | 1.05(a) | 1.09 | 1.08 | 1.06 | 1.06 | 1.07 |
| Net investment income (loss) | 0.24(a)(l) | 1.03 | 0.94 | 0.49 | 0.53 | 0.66 |
| Portfolio turnover rate | 8(n) | 13 | 17 | 12 | 23 | 17 |
| Net assets at end of period (000 omitted) | $665,668 | $638,324 | $626,068 | $534,840 | $650,731 | $546,391 |
| Class B | Six months ended | Year ended | ||||
| 11/30/24 (unaudited) | 5/31/24 | 5/31/23 | 5/31/22 | 5/31/21 | 5/31/20 | |
| Net asset value, beginning of period | $39.27 | $35.93 | $34.77 | $42.52 | $31.38 | $30.67 |
| Income (loss) from investment operations | ||||||
| Net investment income (loss) (d) | $(0.10) | $0.07 | $0.00(w) | $(0.13) | $(0.09) | $(0.06) |
| Net realized and unrealized gain (loss) | 1.90 | 3.93 | 1.82 | (5.06) | 11.23 | 1.15 |
| Total from investment operations | $1.80 | $4.00 | $1.82 | $(5.19) | $11.14 | $1.09 |
| Less distributions declared to shareholders | ||||||
| From net investment income | $— | $(0.11) | $— | $— | $— | $(0.20) |
| From net realized gain | — | (0.55) | (0.66) | (2.56) | — | (0.18) |
| Total distributions declared to shareholders | $— | $(0.66) | $(0.66) | $(2.56) | $— | $(0.38) |
| Net asset value, end of period (x) | $41.07 | $39.27 | $35.93 | $34.77 | $42.52 | $31.38 |
| Total return (%) (r)(s)(t)(x) | 4.58(n) | 11.25 | 5.32 | (12.99) | 35.50 | 3.44 |
| Ratios (%) (to average net assets) and Supplemental data: | ||||||
| Expenses before expense reductions | 1.82(a) | 1.86 | 1.84 | 1.83 | 1.82 | 1.83 |
| Expenses after expense reductions | 1.80(a) | 1.85 | 1.83 | 1.81 | 1.81 | 1.82 |
| Net investment income (loss) | (0.48)(a)(l) | 0.19 | 0.00(w) | (0.33) | (0.24) | (0.18) |
| Portfolio turnover rate | 8(n) | 13 | 17 | 12 | 23 | 17 |
| Net assets at end of period (000 omitted) | $618 | $786 | $1,138 | $1,559 | $2,439 | $2,922 |
| Class C | Six months ended | Year ended | ||||
| 11/30/24 (unaudited) | 5/31/24 | 5/31/23 | 5/31/22 | 5/31/21 | 5/31/20 | |
| Net asset value, beginning of period | $37.77 | $34.67 | $33.61 | $41.19 | $30.40 | $29.76 |
| Income (loss) from investment operations | ||||||
| Net investment income (loss) (d) | $(0.10) | $0.10 | $0.03 | $(0.11) | $(0.08) | $(0.04) |
| Net realized and unrealized gain (loss) | 1.83 | 3.75 | 1.73 | (4.91) | 10.87 | 1.10 |
| Total from investment operations | $1.73 | $3.85 | $1.76 | $(5.02) | $10.79 | $1.06 |
| Less distributions declared to shareholders | ||||||
| From net investment income | $— | $(0.20) | $(0.04) | $(0.00)(w) | $— | $(0.24) |
| From net realized gain | — | (0.55) | (0.66) | (2.56) | — | (0.18) |
| Total distributions declared to shareholders | $— | $(0.75) | $(0.70) | $(2.56) | $— | $(0.42) |
| Net asset value, end of period (x) | $39.50 | $37.77 | $34.67 | $33.61 | $41.19 | $30.40 |
| Total return (%) (r)(s)(t)(x) | 4.58(n) | 11.24 | 5.33 | (12.99) | 35.49 | 3.46 |
| Ratios (%) (to average net assets) and Supplemental data: | ||||||
| Expenses before expense reductions | 1.81(a) | 1.86 | 1.84 | 1.83 | 1.82 | 1.83 |
| Expenses after expense reductions | 1.80(a) | 1.85 | 1.83 | 1.81 | 1.81 | 1.82 |
| Net investment income (loss) | (0.50)(a)(l) | 0.28 | 0.09 | (0.29) | (0.21) | (0.14) |
| Portfolio turnover rate | 8(n) | 13 | 17 | 12 | 23 | 17 |
| Net assets at end of period (000 omitted) | $24,150 | $25,405 | $27,498 | $30,292 | $41,907 | $39,530 |
| Class I | Six months ended | Year ended | ||||
| 11/30/24 (unaudited) | 5/31/24 | 5/31/23 | 5/31/22 | 5/31/21 | 5/31/20 | |
| Net asset value, beginning of period | $48.36 | $44.10 | $42.50 | $51.32 | $37.75 | $36.61 |
| Income (loss) from investment operations | ||||||
| Net investment income (loss) (d) | $0.12 | $0.60 | $0.48 | $0.37 | $0.39 | $0.34 |
| Net realized and unrealized gain (loss) | 2.35 | 4.77 | 2.18 | (6.20) | 13.49 | 1.35 |
| Total from investment operations | $2.47 | $5.37 | $2.66 | $(5.83) | $13.88 | $1.69 |
| Less distributions declared to shareholders | ||||||
| From net investment income | $— | $(0.56) | $(0.40) | $(0.43) | $(0.31) | $(0.37) |
| From net realized gain | — | (0.55) | (0.66) | (2.56) | — | (0.18) |
| Total distributions declared to shareholders | $— | $(1.11) | $(1.06) | $(2.99) | $(0.31) | $(0.55) |
| Net asset value, end of period (x) | $50.83 | $48.36 | $44.10 | $42.50 | $51.32 | $37.75 |
| Total return (%) (r)(s)(t)(x) | 5.11(n) | 12.36 | 6.37 | (12.10) | 36.85 | 4.51 |
| Ratios (%) (to average net assets) and Supplemental data: | ||||||
| Expenses before expense reductions | 0.82(a) | 0.86 | 0.84 | 0.83 | 0.83 | 0.83 |
| Expenses after expense reductions | 0.80(a) | 0.84 | 0.83 | 0.81 | 0.82 | 0.82 |
| Net investment income (loss) | 0.49(a)(l) | 1.33 | 1.14 | 0.77 | 0.84 | 0.89 |
| Portfolio turnover rate | 8(n) | 13 | 17 | 12 | 23 | 17 |
| Net assets at end of period (000 omitted) | $4,369,171 | $4,102,118 | $3,576,683 | $3,251,727 | $3,722,298 | $2,457,330 |
| Class R1 | Six months ended | Year ended | ||||
| 11/30/24 (unaudited) | 5/31/24 | 5/31/23 | 5/31/22 | 5/31/21 | 5/31/20 | |
| Net asset value, beginning of period | $36.63 | $33.69 | $32.73 | $40.23 | $29.72 | $29.12 |
| Income (loss) from investment operations | ||||||
| Net investment income (loss) (d) | $(0.10) | $0.11 | $0.04 | $(0.08) | $(0.06) | $(0.03) |
| Net realized and unrealized gain (loss) | 1.78 | 3.63 | 1.66 | (4.81) | 10.62 | 1.07 |
| Total from investment operations | $1.68 | $3.74 | $1.70 | $(4.89) | $10.56 | $1.04 |
| Less distributions declared to shareholders | ||||||
| From net investment income | $— | $(0.25) | $(0.08) | $(0.05) | $(0.05) | $(0.26) |
| From net realized gain | — | (0.55) | (0.66) | (2.56) | — | (0.18) |
| Total distributions declared to shareholders | $— | $(0.80) | $(0.74) | $(2.61) | $(0.05) | $(0.44) |
| Net asset value, end of period (x) | $38.31 | $36.63 | $33.69 | $32.73 | $40.23 | $29.72 |
| Total return (%) (r)(s)(t)(x) | 4.59(n) | 11.25 | 5.30 | (12.99) | 35.53 | 3.45 |
| Ratios (%) (to average net assets) and Supplemental data: | ||||||
| Expenses before expense reductions | 1.81(a) | 1.86 | 1.84 | 1.83 | 1.83 | 1.83 |
| Expenses after expense reductions | 1.80(a) | 1.84 | 1.83 | 1.81 | 1.81 | 1.82 |
| Net investment income (loss) | (0.50)(a)(l) | 0.32 | 0.13 | (0.21) | (0.17) | (0.11) |
| Portfolio turnover rate | 8(n) | 13 | 17 | 12 | 23 | 17 |
| Net assets at end of period (000 omitted) | $8,404 | $8,136 | $7,182 | $6,895 | $7,424 | $4,890 |
| Class R2 | Six months ended | Year ended | ||||
| 11/30/24 (unaudited) | 5/31/24 | 5/31/23 | 5/31/22 | 5/31/21 | 5/31/20 | |
| Net asset value, beginning of period | $38.05 | $34.89 | $33.87 | $41.51 | $30.63 | $29.92 |
| Income (loss) from investment operations | ||||||
| Net investment income (loss) (d) | $0.00(w) | $0.22 | $0.21 | $0.10 | $0.10 | $0.15 |
| Net realized and unrealized gain (loss) | 1.84 | 3.83 | 1.73 | (4.96) | 10.97 | 1.07 |
| Total from investment operations | $1.84 | $4.05 | $1.94 | $(4.86) | $11.07 | $1.22 |
| Less distributions declared to shareholders | ||||||
| From net investment income | $— | $(0.34) | $(0.26) | $(0.22) | $(0.19) | $(0.33) |
| From net realized gain | — | (0.55) | (0.66) | (2.56) | — | (0.18) |
| Total distributions declared to shareholders | $— | $(0.89) | $(0.92) | $(2.78) | $(0.19) | $(0.51) |
| Net asset value, end of period (x) | $39.89 | $38.05 | $34.89 | $33.87 | $41.51 | $30.63 |
| Total return (%) (r)(s)(t)(x) | 4.84(n) | 11.78 | 5.85 | (12.55) | 36.20 | 3.95 |
| Ratios (%) (to average net assets) and Supplemental data: | ||||||
| Expenses before expense reductions | 1.32(a) | 1.37 | 1.34 | 1.33 | 1.33 | 1.33 |
| Expenses after expense reductions | 1.30(a) | 1.35 | 1.33 | 1.31 | 1.31 | 1.32 |
| Net investment income (loss) | 0.01(a)(l) | 0.63 | 0.62 | 0.26 | 0.28 | 0.48 |
| Portfolio turnover rate | 8(n) | 13 | 17 | 12 | 23 | 17 |
| Net assets at end of period (000 omitted) | $20,618 | $22,937 | $37,317 | $34,618 | $40,886 | $34,149 |
| Class R3 | Six months ended | Year ended | ||||
| 11/30/24 (unaudited) | 5/31/24 | 5/31/23 | 5/31/22 | 5/31/21 | 5/31/20 | |
| Net asset value, beginning of period | $41.98 | $38.45 | $37.20 | $45.30 | $33.38 | $32.51 |
| Income (loss) from investment operations | ||||||
| Net investment income (loss) (d) | $0.05 | $0.43 | $0.38 | $0.21 | $0.23 | $0.23 |
| Net realized and unrealized gain (loss) | 2.03 | 4.15 | 1.85 | (5.43) | 11.94 | 1.18 |
| Total from investment operations | $2.08 | $4.58 | $2.23 | $(5.22) | $12.17 | $1.41 |
| Less distributions declared to shareholders | ||||||
| From net investment income | $— | $(0.50) | $(0.32) | $(0.32) | $(0.25) | $(0.36) |
| From net realized gain | — | (0.55) | (0.66) | (2.56) | — | (0.18) |
| Total distributions declared to shareholders | $— | $(1.05) | $(0.98) | $(2.88) | $(0.25) | $(0.54) |
| Net asset value, end of period (x) | $44.06 | $41.98 | $38.45 | $37.20 | $45.30 | $33.38 |
| Total return (%) (r)(s)(t)(x) | 4.95(n) | 12.09 | 6.11 | (12.33) | 36.55 | 4.22 |
| Ratios (%) (to average net assets) and Supplemental data: | ||||||
| Expenses before expense reductions | 1.07(a) | 1.11 | 1.09 | 1.08 | 1.08 | 1.08 |
| Expenses after expense reductions | 1.05(a) | 1.09 | 1.08 | 1.06 | 1.06 | 1.07 |
| Net investment income (loss) | 0.24(a)(l) | 1.08 | 1.03 | 0.49 | 0.58 | 0.69 |
| Portfolio turnover rate | 8(n) | 13 | 17 | 12 | 23 | 17 |
| Net assets at end of period (000 omitted) | $319,871 | $316,301 | $269,664 | $149,194 | $182,926 | $124,732 |
| Class R4 | Six months ended | Year ended | ||||
| 11/30/24 (unaudited) | 5/31/24 | 5/31/23 | 5/31/22 | 5/31/21 | 5/31/20 | |
| Net asset value, beginning of period | $42.68 | $39.03 | $37.74 | $45.91 | $33.79 | $32.83 |
| Income (loss) from investment operations | ||||||
| Net investment income (loss) (d) | $0.12 | $0.50 | $0.41 | $0.33 | $0.31 | $0.31 |
| Net realized and unrealized gain (loss) | 2.06 | 4.25 | 1.94 | (5.51) | 12.12 | 1.20 |
| Total from investment operations | $2.18 | $4.75 | $2.35 | $(5.18) | $12.43 | $1.51 |
| Less distributions declared to shareholders | ||||||
| From net investment income | $— | $(0.55) | $(0.40) | $(0.43) | $(0.31) | $(0.37) |
| From net realized gain | — | (0.55) | (0.66) | (2.56) | — | (0.18) |
| Total distributions declared to shareholders | $— | $(1.10) | $(1.06) | $(2.99) | $(0.31) | $(0.55) |
| Net asset value, end of period (x) | $44.86 | $42.68 | $39.03 | $37.74 | $45.91 | $33.79 |
| Total return (%) (r)(s)(t)(x) | 5.11(n) | 12.37 | 6.38 | (12.11) | 36.87 | 4.48 |
| Ratios (%) (to average net assets) and Supplemental data: | ||||||
| Expenses before expense reductions | 0.82(a) | 0.86 | 0.84 | 0.83 | 0.83 | 0.83 |
| Expenses after expense reductions | 0.80(a) | 0.85 | 0.83 | 0.81 | 0.81 | 0.82 |
| Net investment income (loss) | 0.52(a)(l) | 1.24 | 1.12 | 0.76 | 0.77 | 0.91 |
| Portfolio turnover rate | 8(n) | 13 | 17 | 12 | 23 | 17 |
| Net assets at end of period (000 omitted) | $117,052 | $133,781 | $237,042 | $224,116 | $273,949 | $262,925 |
| Class R6 | Six months ended | Year ended | ||||
| 11/30/24 (unaudited) | 5/31/24 | 5/31/23 | 5/31/22 | 5/31/21 | 5/31/20 | |
| Net asset value, beginning of period | $42.68 | $39.05 | $37.75 | $45.93 | $33.80 | $32.81 |
| Income (loss) from investment operations | ||||||
| Net investment income (loss) (d) | $0.14 | $0.58 | $0.48 | $0.38 | $0.39 | $0.34 |
| Net realized and unrealized gain (loss) | 2.06 | 4.22 | 1.93 | (5.51) | 12.08 | 1.21 |
| Total from investment operations | $2.20 | $4.80 | $2.41 | $(5.13) | $12.47 | $1.55 |
| Less distributions declared to shareholders | ||||||
| From net investment income | $— | $(0.62) | $(0.45) | $(0.49) | $(0.34) | $(0.38) |
| From net realized gain | — | (0.55) | (0.66) | (2.56) | — | (0.18) |
| Total distributions declared to shareholders | $— | $(1.17) | $(1.11) | $(3.05) | $(0.34) | $(0.56) |
| Net asset value, end of period (x) | $44.88 | $42.68 | $39.05 | $37.75 | $45.93 | $33.80 |
| Total return (%) (r)(s)(t)(x) | 5.15(n) | 12.50 | 6.53 | (12.01) | 37.00 | 4.60 |
| Ratios (%) (to average net assets) and Supplemental data: | ||||||
| Expenses before expense reductions | 0.70(a) | 0.73 | 0.72 | 0.71 | 0.72 | 0.74 |
| Expenses after expense reductions | 0.68(a) | 0.72 | 0.70 | 0.69 | 0.71 | 0.73 |
| Net investment income (loss) | 0.61(a)(l) | 1.45 | 1.30 | 0.89 | 0.96 | 1.00 |
| Portfolio turnover rate | 8(n) | 13 | 17 | 12 | 23 | 17 |
| Net assets at end of period (000 omitted) | $11,559,312 | $11,339,067 | $9,798,848 | $8,329,602 | $9,597,724 | $7,506,854 |
| (a) | Annualized. |
| (d) | Per share data is based on average shares outstanding. |
| (l) | Recognition of net investment income by the fund may be affected by the timing of the declaration of dividends by companies in which the fund invests and the actual annual net investment income ratio may differ. |
| (n) | Not annualized. |
| (r) | Certain expenses have been reduced without which performance would have been lower. |
| (s) | From time to time the fund may receive proceeds from litigation settlements, without which performance would be lower. |
| (t) | Total returns do not include any applicable sales charges. |
| (w) | Per share amount was less than $0.01 and total return or ratio was less than 0.01%, as applicable. |
| (x) | The net asset values and total returns have been calculated on net assets which include adjustments made in accordance with U.S. generally accepted accounting principles required at period end for financial reporting purposes. |
| Financial Instruments | Level 1 | Level 2 | Level 3 | Total |
| Equity Securities: | ||||
| France | $2,539,062,783 | $— | $— | $2,539,062,783 |
| Germany | 1,936,379,455 | — | — | 1,936,379,455 |
| Japan | 1,768,191,705 | — | — | 1,768,191,705 |
| Switzerland | 1,620,905,608 | — | — | 1,620,905,608 |
| United Kingdom | 1,423,569,642 | — | — | 1,423,569,642 |
| Canada | 1,242,356,974 | — | — | 1,242,356,974 |
| Taiwan | 1,095,256,489 | — | — | 1,095,256,489 |
| Netherlands | 714,037,283 | — | — | 714,037,283 |
| China | 594,081,879 | — | — | 594,081,879 |
| Other Countries | 3,857,814,789 | 3,430,258 | — | 3,861,245,047 |
| Mutual Funds | 254,260,945 | — | — | 254,260,945 |
| Total | $17,045,917,552 | $3,430,258 | $— | $17,049,347,810 |
| Year ended 5/31/24 | |
| Ordinary income (including any short-term capital gains) | $255,093,827 |
| Long-term capital gains | 175,401,587 |
| Total distributions | $430,495,414 |
| As of 11/30/24 | |
| Cost of investments | $12,650,711,998 |
| Gross appreciation | 5,221,910,381 |
| Gross depreciation | (823,274,569) |
| Net unrealized appreciation (depreciation) | $4,398,635,812 |
| As of 5/31/24 | |
| Undistributed ordinary income | 175,269,002 |
| Undistributed long-term capital gain | 88,819,041 |
| Other temporary differences | (6,385,181) |
| Net unrealized appreciation (depreciation) | 4,283,441,428 |
| Six months ended 11/30/24 | Year ended 5/31/24 | ||
| Class A | $— | $17,238,013 | |
| Class B | — | 16,379 | |
| Class C | — | 542,806 | |
| Class I | — | 92,086,533 | |
| Class R1 | — | 176,572 | |
| Class R2 | — | 730,415 | |
| Class R3 | — | 7,763,605 | |
| Class R4 | — | 3,862,652 | |
| Class R6 | — | 308,078,439 | |
| Total | $— | $430,495,414 |
| Up to $1 billion | 0.90% |
| In excess of $1 billion and up to $2 billion | 0.80% |
| In excess of $2 billion and up to $5 billion | 0.70% |
| In excess of $5 billion and up to $10 billion | 0.65% |
| In excess of $10 billion and up to $20 billion | 0.62% |
| In excess of $20 billion | 0.60% |
| Distribution Fee Rate (d) | Service Fee Rate (d) | Total Distribution Plan (d) | Annual Effective Rate (e) | Distribution and Service Fee | |
| Class A | — | 0.25% | 0.25% | 0.25% | $ 826,691 |
| Class B | 0.75% | 0.25% | 1.00% | 1.00% | 3,540 |
| Class C | 0.75% | 0.25% | 1.00% | 1.00% | 126,539 |
| Class R1 | 0.75% | 0.25% | 1.00% | 1.00% | 41,742 |
| Class R2 | 0.25% | 0.25% | 0.50% | 0.50% | 54,444 |
| Class R3 | — | 0.25% | 0.25% | 0.25% | 404,096 |
| Total Distribution and Service Fees | $1,457,052 |
| (d) | In accordance with the distribution plan for certain classes, the fund pays distribution and/or service fees equal to these annual percentage rates of each class’s average daily net assets. The distribution and service fee rates disclosed by class represent the current rates in effect at the end of the reporting period. Any rate changes, if applicable, are detailed below. |
| (e) | The annual effective rates represent actual fees incurred under the distribution plan for the six months ended November 30, 2024 based on each class's average daily net assets. MFD has voluntarily agreed to rebate a portion of each class's 0.25% service fee attributable to accounts for which there is no financial intermediary specified on the account except for accounts attributable to MFS or its affiliates' seed money. For the six months ended November 30, 2024, this rebate amounted to $82 for Class A shares and is included in the reduction of total expenses in the Statement of Operations. |
| Amount | |
| Class A | $3,347 |
| Class B | 33 |
| Class C | 606 |
| Date | Transaction | Class | Shares | Amount | |||
| 8/19/2024 | Redemption | Class I | 2 | $116 | |||
| 8/19/2024 | Redemption | Class R1 | 3 | 125 | |||
| 8/19/2024 | Redemption | Class R2 | 4 | 152 | |||
| 8/19/2024 | Redemption | Class R3 | 3 | 145 | |||
| 8/19/2024 | Redemption | Class R4 | 4 | 175 |
| Six months ended 11/30/24 | Year ended 5/31/24 | ||||
| Shares | Amount | Shares | Amount | ||
| Shares sold | |||||
| Class A | 1,499,185 | $66,635,300 | 3,783,914 | $149,197,654 | |
| Class B | — | — | 1,368 | 48,815 | |
| Class C | 39,493 | 1,553,305 | 86,553 | 3,090,081 | |
| Class I | 8,753,365 | 442,643,680 | 22,519,808 | 1,020,562,269 | |
| Class R1 | 18,589 | 712,888 | 34,114 | 1,178,419 | |
| Class R2 | 38,512 | 1,525,509 | 273,823 | 9,659,654 | |
| Class R3 | 827,295 | 36,918,815 | 2,220,925 | 86,631,310 | |
| Class R4 | 315,724 | 14,029,511 | 1,066,201 | 42,679,510 | |
| Class R6 | 15,055,836 | 671,578,466 | 46,225,792 | 1,847,250,958 | |
| 26,547,999 | $1,235,597,474 | 76,212,498 | $3,160,298,670 | ||
| Shares issued to shareholders in reinvestment of distributions | |||||
| Class A | — | $— | 311,289 | $12,317,712 | |
| Class B | — | — | 446 | 16,379 | |
| Class C | — | — | 13,938 | 492,710 | |
| Class I | — | — | 1,887,658 | 85,057,876 | |
| Class R1 | — | — | 5,149 | 176,572 | |
| Class R2 | — | — | 20,361 | 723,635 | |
| Class R3 | — | — | 198,253 | 7,763,605 | |
| Class R4 | — | — | 85,724 | 3,409,254 | |
| Class R6 | — | — | 7,221,019 | 287,035,502 | |
| — | $— | 9,743,837 | $396,993,245 | ||
| Six months ended 11/30/24 | Year ended 5/31/24 | ||||
| Shares | Amount | Shares | Amount | ||
| Shares reacquired | |||||
| Class A | (1,596,761) | $(70,614,482) | (5,172,234) | $(206,819,730) | |
| Class B | (4,985) | (204,538) | (13,468) | (493,997) | |
| Class C | (100,672) | (3,984,764) | (221,028) | (7,898,886) | |
| Class I | (7,612,077) | (385,990,944) | (20,687,421) | (937,414,437) | |
| Class R1 | (21,303) | (812,590) | (30,324) | (1,043,626) | |
| Class R2 | (124,450) | (4,935,652) | (761,019) | (26,935,706) | |
| Class R3 | (1,102,620) | (48,576,802) | (1,898,058) | (75,244,584) | |
| Class R4 | (840,645) | (36,969,541) | (4,090,187) | (165,819,559) | |
| Class R6 | (23,180,524) | (1,036,521,379) | (38,710,372) | (1,557,803,280) | |
| (34,584,037) | $(1,588,610,692) | (71,584,111) | $(2,979,473,805) | ||
| Net change | |||||
| Class A | (97,576) | $(3,979,182) | (1,077,031) | $(45,304,364) | |
| Class B | (4,985) | (204,538) | (11,654) | (428,803) | |
| Class C | (61,179) | (2,431,459) | (120,537) | (4,316,095) | |
| Class I | 1,141,288 | 56,652,736 | 3,720,045 | 168,205,708 | |
| Class R1 | (2,714) | (99,702) | 8,939 | 311,365 | |
| Class R2 | (85,938) | (3,410,143) | (466,835) | (16,552,417) | |
| Class R3 | (275,325) | (11,657,987) | 521,120 | 19,150,331 | |
| Class R4 | (524,921) | (22,940,030) | (2,938,262) | (119,730,795) | |
| Class R6 | (8,124,688) | (364,942,913) | 14,736,439 | 576,483,180 | |
| (8,036,038) | $(353,013,218) | 14,372,224 | $577,818,110 | ||
| Affiliated Issuers | Beginning Value | Purchases | Sales Proceeds | Realized Gain (Loss) | Change in Unrealized Appreciation or Depreciation | Ending Value |
| MFS Institutional Money Market Portfolio | $232,641,263 | $1,126,386,973 | $1,104,806,877 | $56,333 | $(16,747) | $254,260,945 |
| Affiliated Issuers | Dividend Income | Capital Gain Distributions |
| MFS Institutional Money Market Portfolio | $6,499,583 | $— |
| Number of Dollars | ||||||
| Nominee | For | Against/Withheld | Abstain | |||
| Steven E. Buller | 93,694,553,358.767 | 2,599,093,584.595 | 0.000 | |||
| John A. Caroselli | 94,028,434,411.278 | 2,265,212,532.084 | 0.000 | |||
| Maureen R. Goldfarb | 94,361,674,360.213 | 1,931,972,583.149 | 0.000 | |||
| Peter D. Jones | 94,066,354,687.369 | 2,227,292,255.993 | 0.000 | |||
| John P. Kavanaugh | 94,185,926,082.433 | 2,107,559,444.381 | 161,416.548 | |||
| James W. Kilman, Jr. | 94,450,795,713.326 | 1,842,851,230.036 | 0.000 | |||
| Clarence Otis, Jr. | 93,984,248,122.457 | 2,309,398,820.905 | 0.000 | |||
| Michael W. Roberge | 94,352,210,986.123 | 1,941,435,957.239 | 0.000 | |||
| Maryanne L. Roepke | 94,413,451,878.996 | 1,880,195,064.366 | 0.000 | |||
| Paula E. Smith | 94,545,454,781.292 | 1,748,192,162.070 | 0.000 | |||
| Laurie J. Thomsen | 94,416,793,826.848 | 1,876,853,116.514 | 0.000 | |||
| Darrell A. Williams | 94,451,319,166.310 | 1,842,327,777.051 | 0.000 | |||
| Issuer | Shares/Par | Value ($) | ||
| Common Stocks – 98.8% | ||||
| Airlines – 0.8% | ||||
| Grupo Aeroportuario del Centro Norte S.A.B. de C.V. | 3,130,640 | $ 24,330,547 | ||
| Grupo Aeroportuario del Sureste, “B” | 1,538,528 | 39,218,921 | ||
| $63,549,468 | ||||
| Alcoholic Beverages – 4.1% | ||||
| Ambev S.A., ADR | 35,756,467 | $ 75,803,710 | ||
| China Resources Beer Holdings Co. Ltd. | 13,252,000 | 44,619,529 | ||
| Kweichow Moutai Co. Ltd., “A” | 623,513 | 131,523,870 | ||
| Wuliangye Yibin Co. Ltd., “A” | 3,033,218 | 61,548,780 | ||
| $313,495,889 | ||||
| Automotive – 4.5% | ||||
| BYD Co. Ltd. | 2,027,500 | $ 66,077,313 | ||
| Hero MotoCorp Ltd. | 588,816 | 33,182,125 | ||
| Mahindra & Mahindra Ltd. | 2,971,215 | 104,299,549 | ||
| Maruti Suzuki India Ltd. | 441,810 | 57,904,254 | ||
| PT Astra International Tbk | 248,404,800 | 79,953,580 | ||
| $341,416,821 | ||||
| Biotechnology – 0.5% | ||||
| Hugel, Inc. (a) | 190,323 | $ 35,471,116 | ||
| Brokerage & Asset Managers – 0.4% | ||||
| B3 S.A. - Brasil Bolsa Balcao | 20,451,300 | $ 31,707,973 | ||
| Business Services – 5.0% | ||||
| Infosys Ltd. | 8,956,792 | $ 196,936,266 | ||
| Tata Consultancy Services Ltd. | 3,211,201 | 162,309,662 | ||
| Tech Mahindra Ltd. | 1,142,124 | 23,144,920 | ||
| $382,390,848 | ||||
| Chemicals – 1.1% | ||||
| UPL Ltd. | 12,488,073 | $ 80,547,951 | ||
| Computer Software – 1.2% | ||||
| Kingsoft Corp. | 22,587,400 | $ 91,146,112 | ||
| Computer Software - Systems – 5.6% | ||||
| EPAM Systems, Inc. (a) | 144,779 | $ 35,314,494 | ||
| Hon Hai Precision Industry Co. Ltd. | 15,823,000 | 95,231,244 | ||
| Samsung Electronics Co. Ltd. | 7,696,233 | 299,011,382 | ||
| $429,557,120 | ||||
| Conglomerates – 0.7% | ||||
| LG Corp. | 934,933 | $ 50,196,396 | ||
| Issuer | Shares/Par | Value ($) | ||
| Common Stocks – continued | ||||
| Construction – 3.2% | ||||
| Anhui Conch Cement Co. Ltd. | 16,250,000 | $ 42,392,757 | ||
| Beijing New Building Materials PLC, “A” | 11,705,894 | 46,156,476 | ||
| Gree Electric Appliances, Inc., “A” | 9,726,839 | 56,588,214 | ||
| Midea Group Co. Ltd., “A” | 3,598,408 | 34,889,342 | ||
| Techtronic Industries Co. Ltd. | 3,902,500 | 54,966,201 | ||
| Zhejiang Supor Co. Ltd., “A” | 1,433,052 | 10,358,004 | ||
| $245,350,994 | ||||
| Consumer Services – 0.4% | ||||
| MakeMyTrip Ltd. (a) | 269,891 | $ 30,967,293 | ||
| Electronics – 12.0% | ||||
| ASE Technology Holding Co. Ltd | 22,754,000 | $ 106,124,157 | ||
| SK Hynix, Inc. | 521,235 | 59,743,720 | ||
| SK Square Co. Ltd. (a) | 571,254 | 30,097,250 | ||
| Taiwan Semiconductor Manufacturing Co. Ltd. | 23,740,695 | 727,941,761 | ||
| $923,906,888 | ||||
| Energy - Independent – 2.1% | ||||
| Bharat Petroleum Corp. Ltd. | 15,176,294 | $ 52,463,813 | ||
| PT United Tractors Tbk | 31,343,100 | 52,963,806 | ||
| Reliance Industries Ltd. | 3,740,478 | 57,203,079 | ||
| $162,630,698 | ||||
| Energy - Integrated – 4.1% | ||||
| Galp Energia SGPS S.A., “B” | 4,299,349 | $ 70,684,240 | ||
| Petroleo Brasileiro S.A., ADR | 6,675,037 | 95,319,528 | ||
| Petroleo Brasileiro S.A., ADR | 3,680,671 | 47,995,950 | ||
| Petronet LNG Ltd. | 14,620,673 | 57,637,424 | ||
| Saudi Arabian Oil Co. | 6,068,883 | 44,342,633 | ||
| $315,979,775 | ||||
| Engineering - Construction – 0.8% | ||||
| Doosan Bobcat, Inc. | 2,159,861 | $ 60,071,400 | ||
| Food & Beverages – 3.0% | ||||
| Gruma S.A.B. de C.V. | 2,495,669 | $ 42,276,916 | ||
| Inner Mongolia Yili Industrial Group Co. Ltd., “A” | 30,258,727 | 119,561,515 | ||
| Orion Corp. | 977,254 | 71,872,880 | ||
| $233,711,311 | ||||
| Food & Drug Stores – 0.5% | ||||
| BIM Birlesik Magazalar A.S. | 2,761,840 | $ 37,694,655 | ||
| Insurance – 5.2% | ||||
| AIA Group Ltd. | 8,400,800 | $ 62,778,744 | ||
| DB Insurance Co. Ltd. | 871,179 | 68,193,073 | ||
| Hyundai Marine & Fire Insurance Co. Ltd. | 2,979,320 | 56,807,937 | ||
| Ping An Insurance Co. of China Ltd., “H” | 22,551,500 | 129,836,174 | ||
| Samsung Fire & Marine Insurance Co. Ltd. | 292,110 | 82,185,710 | ||
| $399,801,638 | ||||
| Issuer | Shares/Par | Value ($) | ||
| Common Stocks – continued | ||||
| Internet – 0.2% | ||||
| Baidu, Inc., ADR (a) | 177,892 | $ 15,129,715 | ||
| Leisure & Toys – 7.5% | ||||
| NetEase, Inc., ADR | 1,389,508 | $ 121,554,160 | ||
| Tencent Holdings Ltd. | 8,889,800 | 454,692,009 | ||
| $576,246,169 | ||||
| Machinery & Tools – 1.6% | ||||
| Delta Electronics, Inc. | 10,622,000 | $ 124,587,692 | ||
| Major Banks – 4.0% | ||||
| Banco Bradesco S.A., ADR | 26,555,662 | $ 56,563,560 | ||
| Bandhan Bank Ltd. | 16,668,827 | 33,354,915 | ||
| Erste Group Bank AG | 754,327 | 41,431,976 | ||
| National Bank of Greece S.A | 4,924,293 | 34,739,042 | ||
| Nedbank Group Ltd. | 4,355,516 | 69,741,387 | ||
| OTP Bank PLC | 1,344,692 | 72,950,572 | ||
| $308,781,452 | ||||
| Medical & Health Technology & Services – 0.0% | ||||
| Burning Rock Biotech Ltd., ADR (a)(l) | 318,839 | $ 1,995,932 | ||
| Metals & Mining – 2.1% | ||||
| Industries Qatar Q.P.S.C. | 15,005,749 | $ 53,494,815 | ||
| Vale S.A., ADR | 10,678,418 | 105,289,202 | ||
| $158,784,017 | ||||
| Natural Gas - Distribution – 0.4% | ||||
| China Resources Gas Group Ltd. | 8,096,300 | $ 28,925,019 | ||
| Network & Telecom – 1.2% | ||||
| Accton Technology Corp. | 3,003,000 | $ 60,738,571 | ||
| GDS Holdings Ltd., “A” (a) | 4,639,700 | 11,376,548 | ||
| GDS Holdings Ltd., ADR (a) | 1,069,488 | 21,058,219 | ||
| $93,173,338 | ||||
| Oil Services – 0.6% | ||||
| Samsung E&A Co. Ltd. (a) | 3,655,788 | $ 47,038,740 | ||
| Other Banks & Diversified Financials – 13.5% | ||||
| Bangkok Bank Public Co. Ltd. | 12,928,200 | $ 56,164,496 | ||
| Bank Negara Indonesia PT | 269,601,100 | 84,734,205 | ||
| China Construction Bank Corp. | 202,568,490 | 152,289,519 | ||
| China Merchants Bank Co. Ltd. | 8,914,500 | 40,382,981 | ||
| Credicorp Ltd. | 581,158 | 107,787,374 | ||
| Emirates NBD Bank PJSC | 9,152,309 | 49,836,963 | ||
| Grupo Financiero Banorte S.A. de C.V. | 7,968,218 | 52,954,499 | ||
| HDFC Bank Ltd. | 6,461,212 | 137,339,347 | ||
| Kasikornbank Co. Ltd. | 18,573,100 | 81,229,390 | ||
| KB Financial Group, Inc. | 1,723,029 | 118,816,809 | ||
| Kotak Mahindra Bank Ltd. | 6,267,001 | 130,926,799 | ||
| Saudi Awwal Bank | 2,768,208 | 22,878,665 | ||
| Issuer | Shares/Par | Value ($) | ||
| Common Stocks – continued | ||||
| Other Banks & Diversified Financials – continued | ||||
| Sberbank of Russia PJSC (a)(u) | 50,760,059 | $ 0 | ||
| $1,035,341,047 | ||||
| Pharmaceuticals – 0.1% | ||||
| Hypera S.A. | 2,519,545 | $ 8,234,524 | ||
| Precious Metals & Minerals – 0.8% | ||||
| Gold Fields Ltd., ADR | 4,134,047 | $ 59,902,341 | ||
| Real Estate – 2.0% | ||||
| Emaar Properties PJSC | 36,382,829 | $ 94,599,912 | ||
| Hang Lung Properties Ltd. | 40,093,000 | 32,511,737 | ||
| SM Investments Corp. | 1,559,830 | 23,277,074 | ||
| $150,388,723 | ||||
| Specialty Stores – 5.3% | ||||
| Alibaba Group Holding Ltd. | 23,035,248 | $ 247,628,768 | ||
| Multiplan Empreendimentos Imobiliarios S.A. | 4,490,256 | 17,885,543 | ||
| PDD Holdings, Inc., ADR (a) | 234,386 | 22,632,312 | ||
| Vipshop Holdings Ltd., ADR | 4,039,785 | 55,789,431 | ||
| Walmart de Mexico S.A.B. de C.V. | 24,512,799 | 64,882,749 | ||
| $408,818,803 | ||||
| Telecommunications - Wireless – 2.1% | ||||
| Advanced Info Service Public Co. Ltd. | 3,833,000 | $ 31,850,864 | ||
| Etihad Etisalat Co. | 4,457,246 | 65,490,159 | ||
| PT Telekom Indonesia | 368,350,100 | 62,999,607 | ||
| $160,340,630 | ||||
| Telephone Services – 0.5% | ||||
| Hellenic Telecommunications Organization S.A. | 2,566,317 | $ 40,576,028 | ||
| Tobacco – 1.7% | ||||
| British American Tobacco PLC | 1,686,156 | $ 64,217,321 | ||
| ITC Ltd. | 11,992,523 | 67,664,959 | ||
| $131,882,280 | ||||
| Total Common Stocks (Identified Cost, $6,575,427,141) | $7,579,740,796 | |||
| Strike Price | First Exercise | |||
| Rights – 0.0% | ||||
| Chemicals – 0.0% | ||||
| UPL Ltd. (8 shares for 1 right, Expiration 12/31/2024) (a) (Identified Cost, $0) | INR 360 | 12/17/24 | 1,561,009 | $ 3,417,745 |
| Issuer | Shares/Par | Value ($) | ||
| Investment Companies (h) – 1.3% | ||||
| Money Market Funds – 1.3% | ||||
| MFS Institutional Money Market Portfolio, 4.66% (v) (Identified Cost, $100,190,277) | 100,186,880 | $ 100,196,899 | ||
| Collateral for Securities Loaned – 0.0% | ||||
| JPMorgan U.S. Government Money Market Fund - Class IM Shares, 4.59% (j) (Identified Cost, $185,900) | 185,900 | $ 185,900 | ||
| Other Assets, Less Liabilities – (0.1)% | (8,673,929) | |||
| Net Assets – 100.0% | $7,674,867,411 | |||
| (a) | Non-income producing security. | |||
| (h) | An affiliated issuer, which may be considered one in which the fund owns 5% or more of the outstanding voting securities, or a company which is under common control. At period end, the aggregate values of the fund's investments in affiliated issuers and in unaffiliated issuers were $100,196,899 and $7,583,344,441, respectively. | |||
| (j) | The rate quoted is the annualized seven-day yield of the fund at period end. | |||
| (l) | A portion of this security is on loan. See Note 2 for additional information. | |||
| (u) | The security was valued using significant unobservable inputs and is considered level 3 under the fair value hierarchy. For further information about the fund’s level 3 holdings, please see Note 2 in the Notes to Financial Statements. | |||
| (v) | Affiliated issuer that is available only to investment companies managed by MFS. The rate quoted for the MFS Institutional Money Market Portfolio is the annualized seven-day yield of the fund at period end. |
| The following abbreviations are used in this report and are defined: | |
| ADR | American Depositary Receipt |
| Abbreviations indicate amounts shown in currencies other than the U.S. dollar. All amounts are stated in U.S. dollars unless otherwise indicated. A list of abbreviations is shown below: | |
| INR | Indian Rupee |
| Financial Statements | Statement of Assets and Liabilities |
| At 11/30/24 (unaudited)Assets | |
| Investments in unaffiliated issuers, at value, including $208,208 of securities on loan (identified cost, $6,575,613,041) | $7,583,344,441 |
| Investments in affiliated issuers, at value (identified cost, $100,190,277) | 100,196,899 |
| Cash | 1,979,788 |
| Receivables for | |
| Fund shares sold | 13,551,527 |
| Interest and dividends | 7,294,747 |
| Other assets | 8,002 |
| Total assets | $7,706,375,404 |
| Liabilities | |
| Payables for | |
| Fund shares reacquired | $203,333 |
| Collateral for securities loaned, at value | 185,900 |
| Payable to affiliates | |
| Investment adviser | 643,185 |
| Administrative services fee | 6,754 |
| Shareholder servicing costs | 103,825 |
| Distribution and service fees | 5,163 |
| Payable for independent Trustees' compensation | 3,286 |
| Deferred foreign capital gains tax expense payable | 28,322,675 |
| Accrued expenses and other liabilities | 2,033,872 |
| Total liabilities | $31,507,993 |
| Net assets | $7,674,867,411 |
| Net assets consist of | |
| Paid-in capital | $7,530,382,048 |
| Total distributable earnings (loss) | 144,485,363 |
| Net assets | $7,674,867,411 |
| Shares of beneficial interest outstanding | 216,224,832 |
| Net assets | Shares outstanding | Net asset value per share (a) | |
| Class A | $165,894,320 | 4,951,958 | $33.50 |
| Class B | 339,366 | 11,081 | 30.63 |
| Class C | 2,718,326 | 91,279 | 29.78 |
| Class I | 100,347,219 | 2,826,252 | 35.51 |
| Class R1 | 776,893 | 26,453 | 29.37 |
| Class R2 | 2,099,576 | 69,284 | 30.30 |
| Class R3 | 1,793,222 | 53,582 | 33.47 |
| Class R4 | 5,866,406 | 175,646 | 33.40 |
| Class R6 | 7,395,032,083 | 208,019,297 | 35.55 |
| (a) | Maximum offering price per share was equal to the net asset value per share for all share classes, except for Class A, for which the maximum offering price per share was $35.54 [100 / 94.25 x $33.50]. On sales of $50,000 or more, the maximum offering price of Class A shares is reduced. A contingent deferred sales charge may be imposed on redemptions of Class A, Class B, and Class C shares. Redemption price per share was equal to the net asset value per share for Classes I, R1, R2, R3, R4, and R6. |
| Financial Statements | Statement of Operations |
| Six months ended 11/30/24 (unaudited)Net investment income (loss) | |
| Income | |
| Dividends from unaffiliated issuers | $126,259,805 |
| Dividends from affiliated issuers | 3,298,518 |
| Other | 964,302 |
| Income on securities loaned | 79,679 |
| Interest | 285 |
| Foreign taxes withheld | (14,919,402) |
| Total investment income | $115,683,187 |
| Expenses | |
| Management fee | $35,045,218 |
| Distribution and service fees | 241,243 |
| Shareholder servicing costs | 275,943 |
| Administrative services fee | 309,005 |
| Independent Trustees' compensation | 64,387 |
| Custodian fee | 1,559,318 |
| Shareholder communications | 114,895 |
| Audit and tax fees | 66,419 |
| Legal fees | 18,728 |
| Miscellaneous | 191,081 |
| Total expenses | $37,886,237 |
| Reduction of expenses by investment adviser and distributor | (1,378,285) |
| Net expenses | $36,507,952 |
| Net investment income (loss) | $79,175,235 |
| Realized and unrealized gain (loss) | |
| Realized gain (loss) (identified cost basis) | |
| Unaffiliated issuers (includes $3,962,630 foreign capital gains tax) | $31,810,128 |
| Affiliated issuers | 11,761 |
| Foreign currency | (2,084,373) |
| Net realized gain (loss) | $29,737,516 |
| Change in unrealized appreciation or depreciation | |
| Unaffiliated issuers (includes $22,374,169 increase in deferred foreign capital gains tax) | $398,460,604 |
| Affiliated issuers | (4,761) |
| Translation of assets and liabilities in foreign currencies | (43,911) |
| Net unrealized gain (loss) | $398,411,932 |
| Net realized and unrealized gain (loss) | $428,149,448 |
| Change in net assets from operations | $507,324,683 |
| Financial Statements | Statements of Changes in Net Assets |
| Six months ended | Year ended | |
| 11/30/24 (unaudited) | 5/31/24 | |
| Change in net assets | ||
| From operations | ||
| Net investment income (loss) | $79,175,235 | $182,227,475 |
| Net realized gain (loss) | 29,737,516 | (233,675,613) |
| Net unrealized gain (loss) | 398,411,932 | 846,907,442 |
| Change in net assets from operations | $507,324,683 | $795,459,304 |
| Total distributions to shareholders | $— | $(195,005,589) |
| Change in net assets from fund share transactions | $(381,092,316) | $43,328,238 |
| Total change in net assets | $126,232,367 | $643,781,953 |
| Net assets | ||
| At beginning of period | 7,548,635,044 | 6,904,853,091 |
| At end of period | $7,674,867,411 | $7,548,635,044 |
| Financial Statements | Financial Highlights |
| Class A | Six months ended | Year ended | ||||
| 11/30/24 (unaudited) | 5/31/24 | 5/31/23 | 5/31/22 | 5/31/21 | 5/31/20 | |
| Net asset value, beginning of period | $31.50 | $29.10 | $30.53 | $41.38 | $28.13 | $31.63 |
| Income (loss) from investment operations | ||||||
| Net investment income (loss) (d) | $0.27 | $0.64 | $0.62 | $0.49 | $0.33 | $0.58 |
| Net realized and unrealized gain (loss) | 1.73 | 2.51 | (1.77) | (10.64) | 13.12 | (3.50) |
| Total from investment operations | $2.00 | $3.15 | $(1.15) | $(10.15) | $13.45 | $(2.92) |
| Less distributions declared to shareholders | ||||||
| From net investment income | $— | $(0.75) | $(0.28) | $(0.70) | $(0.20) | $(0.58) |
| Net asset value, end of period (x) | $33.50 | $31.50 | $29.10 | $30.53 | $41.38 | $28.13 |
| Total return (%) (r)(s)(t)(x) | 6.35(n) | 10.99 | (3.75) | (24.78) | 47.89 | (9.55) |
| Ratios (%) (to average net assets) and Supplemental data: | ||||||
| Expenses before expense reductions | 1.35(a) | 1.36 | 1.38 | 1.35 | 1.34 | 1.39 |
| Expenses after expense reductions | 1.31(a) | 1.31 | 1.31 | 1.31 | 1.31 | 1.30 |
| Net investment income (loss) | 1.62(a) | 2.11 | 2.18 | 1.38 | 0.89 | 1.82 |
| Portfolio turnover rate | 17(n) | 34 | 36 | 38 | 37 | 32 |
| Net assets at end of period (000 omitted) | $165,894 | $164,392 | $157,909 | $168,750 | $204,557 | $118,726 |
| Class B | Six months ended | Year ended | ||||
| 11/30/24 (unaudited) | 5/31/24 | 5/31/23 | 5/31/22 | 5/31/21 | 5/31/20 | |
| Net asset value, beginning of period | $28.90 | $26.70 | $27.95 | $37.84 | $25.78 | $29.01 |
| Income (loss) from investment operations | ||||||
| Net investment income (loss) (d) | $0.14 | $0.37 | $0.36 | $0.20 | $0.05 | $0.35 |
| Net realized and unrealized gain (loss) | 1.59 | 2.31 | (1.61) | (9.73) | 12.01 | (3.26) |
| Total from investment operations | $1.73 | $2.68 | $(1.25) | $(9.53) | $12.06 | $(2.91) |
| Less distributions declared to shareholders | ||||||
| From net investment income | $— | $(0.48) | $— | $(0.36) | $— | $(0.32) |
| Net asset value, end of period (x) | $30.63 | $28.90 | $26.70 | $27.95 | $37.84 | $25.78 |
| Total return (%) (r)(s)(t)(x) | 5.99(n) | 10.14 | (4.47) | (25.33) | 46.78 | (10.24) |
| Ratios (%) (to average net assets) and Supplemental data: | ||||||
| Expenses before expense reductions | 2.10(a) | 2.11 | 2.13 | 2.09 | 2.09 | 2.13 |
| Expenses after expense reductions | 2.06(a) | 2.06 | 2.06 | 2.06 | 2.06 | 2.06 |
| Net investment income (loss) | 0.93(a) | 1.34 | 1.40 | 0.59 | 0.16 | 1.19 |
| Portfolio turnover rate | 17(n) | 34 | 36 | 38 | 37 | 32 |
| Net assets at end of period (000 omitted) | $339 | $421 | $673 | $1,166 | $2,396 | $2,393 |
| Class C | Six months ended | Year ended | ||||
| 11/30/24 (unaudited) | 5/31/24 | 5/31/23 | 5/31/22 | 5/31/21 | 5/31/20 | |
| Net asset value, beginning of period | $28.10 | $26.00 | $27.23 | $36.91 | $25.15 | $28.33 |
| Income (loss) from investment operations | ||||||
| Net investment income (loss) (d) | $0.14 | $0.37 | $0.35 | $0.20 | $0.06 | $0.33 |
| Net realized and unrealized gain (loss) | 1.54 | 2.23 | (1.56) | (9.49) | 11.70 | (3.17) |
| Total from investment operations | $1.68 | $2.60 | $(1.21) | $(9.29) | $11.76 | $(2.84) |
| Less distributions declared to shareholders | ||||||
| From net investment income | $— | $(0.50) | $(0.02) | $(0.39) | $— | $(0.34) |
| Net asset value, end of period (x) | $29.78 | $28.10 | $26.00 | $27.23 | $36.91 | $25.15 |
| Total return (%) (r)(s)(t)(x) | 5.98(n) | 10.11 | (4.45) | (25.33) | 46.76 | (10.23) |
| Ratios (%) (to average net assets) and Supplemental data: | ||||||
| Expenses before expense reductions | 2.10(a) | 2.11 | 2.13 | 2.09 | 2.09 | 2.13 |
| Expenses after expense reductions | 2.06(a) | 2.06 | 2.06 | 2.06 | 2.06 | 2.06 |
| Net investment income (loss) | 0.92(a) | 1.37 | 1.39 | 0.62 | 0.18 | 1.16 |
| Portfolio turnover rate | 17(n) | 34 | 36 | 38 | 37 | 32 |
| Net assets at end of period (000 omitted) | $2,718 | $2,887 | $3,702 | $5,427 | $10,467 | $10,082 |
| Class I | Six months ended | Year ended | ||||
| 11/30/24 (unaudited) | 5/31/24 | 5/31/23 | 5/31/22 | 5/31/21 | 5/31/20 | |
| Net asset value, beginning of period | $33.34 | $30.75 | $32.24 | $43.63 | $29.64 | $33.29 |
| Income (loss) from investment operations | ||||||
| Net investment income (loss) (d) | $0.33 | $0.75 | $0.74 | $0.60 | $0.43 | $0.66 |
| Net realized and unrealized gain (loss) | 1.84 | 2.66 | (1.88) | (11.21) | 13.84 | (3.65) |
| Total from investment operations | $2.17 | $3.41 | $(1.14) | $(10.61) | $14.27 | $(2.99) |
| Less distributions declared to shareholders | ||||||
| From net investment income | $— | $(0.82) | $(0.35) | $(0.78) | $(0.28) | $(0.66) |
| Net asset value, end of period (x) | $35.51 | $33.34 | $30.75 | $32.24 | $43.63 | $29.64 |
| Total return (%) (r)(s)(t)(x) | 6.51(n) | 11.27 | (3.51) | (24.59) | 48.24 | (9.32) |
| Ratios (%) (to average net assets) and Supplemental data: | ||||||
| Expenses before expense reductions | 1.10(a) | 1.11 | 1.13 | 1.09 | 1.09 | 1.15 |
| Expenses after expense reductions | 1.06(a) | 1.06 | 1.06 | 1.06 | 1.06 | 1.06 |
| Net investment income (loss) | 1.87(a) | 2.35 | 2.44 | 1.59 | 1.11 | 1.98 |
| Portfolio turnover rate | 17(n) | 34 | 36 | 38 | 37 | 32 |
| Net assets at end of period (000 omitted) | $100,347 | $100,206 | $95,629 | $93,329 | $168,061 | $94,350 |
| Class R1 | Six months ended | Year ended | ||||
| 11/30/24 (unaudited) | 5/31/24 | 5/31/23 | 5/31/22 | 5/31/21 | 5/31/20 | |
| Net asset value, beginning of period | $27.72 | $25.42 | $26.70 | $36.41 | $24.80 | $27.97 |
| Income (loss) from investment operations | ||||||
| Net investment income (loss) (d) | $0.10 | $0.52 | $0.35 | $0.16 | $0.05 | $0.30 |
| Net realized and unrealized gain (loss) | 1.55 | 2.05 | (1.54) | (9.30) | 11.56 | (3.09) |
| Total from investment operations | $1.65 | $2.57 | $(1.19) | $(9.14) | $11.61 | $(2.79) |
| Less distributions declared to shareholders | ||||||
| From net investment income | $— | $(0.27) | $(0.09) | $(0.57) | $— | $(0.38) |
| Net asset value, end of period (x) | $29.37 | $27.72 | $25.42 | $26.70 | $36.41 | $24.80 |
| Total return (%) (r)(s)(t)(x) | 5.95(n) | 10.17 | (4.47) | (25.33) | 46.81 | (10.22) |
| Ratios (%) (to average net assets) and Supplemental data: | ||||||
| Expenses before expense reductions | 2.10(a) | 2.11 | 2.13 | 2.10 | 2.09 | 2.14 |
| Expenses after expense reductions | 2.06(a) | 2.06 | 2.06 | 2.06 | 2.06 | 2.06 |
| Net investment income (loss) | 0.70(a) | 1.94 | 1.42 | 0.53 | 0.16 | 1.08 |
| Portfolio turnover rate | 17(n) | 34 | 36 | 38 | 37 | 32 |
| Net assets at end of period (000 omitted) | $777 | $519 | $1,296 | $1,414 | $725 | $1,742 |
| Class R2 | Six months ended | Year ended | ||||
| 11/30/24 (unaudited) | 5/31/24 | 5/31/23 | 5/31/22 | 5/31/21 | 5/31/20 | |
| Net asset value, beginning of period | $28.53 | $26.44 | $27.77 | $37.68 | $25.64 | $28.87 |
| Income (loss) from investment operations | ||||||
| Net investment income (loss) (d) | $0.22 | $0.50 | $0.50 | $0.36 | $0.22 | $0.49 |
| Net realized and unrealized gain (loss) | 1.55 | 2.29 | (1.61) | (9.68) | 11.94 | (3.22) |
| Total from investment operations | $1.77 | $2.79 | $(1.11) | $(9.32) | $12.16 | $(2.73) |
| Less distributions declared to shareholders | ||||||
| From net investment income | $— | $(0.70) | $(0.22) | $(0.59) | $(0.12) | $(0.50) |
| Net asset value, end of period (x) | $30.30 | $28.53 | $26.44 | $27.77 | $37.68 | $25.64 |
| Total return (%) (r)(s)(t)(x) | 6.20(n) | 10.71 | (3.99) | (24.96) | 47.47 | (9.76) |
| Ratios (%) (to average net assets) and Supplemental data: | ||||||
| Expenses before expense reductions | 1.60(a) | 1.61 | 1.63 | 1.59 | 1.59 | 1.63 |
| Expenses after expense reductions | 1.56(a) | 1.56 | 1.56 | 1.56 | 1.56 | 1.56 |
| Net investment income (loss) | 1.41(a) | 1.83 | 1.92 | 1.11 | 0.67 | 1.68 |
| Portfolio turnover rate | 17(n) | 34 | 36 | 38 | 37 | 32 |
| Net assets at end of period (000 omitted) | $2,100 | $2,250 | $2,028 | $2,427 | $4,227 | $3,431 |
| Class R3 | Six months ended | Year ended | ||||
| 11/30/24 (unaudited) | 5/31/24 | 5/31/23 | 5/31/22 | 5/31/21 | 5/31/20 | |
| Net asset value, beginning of period | $31.47 | $29.08 | $30.51 | $41.17 | $27.95 | $31.47 |
| Income (loss) from investment operations | ||||||
| Net investment income (loss) (d) | $0.27 | $0.64 | $0.63 | $0.56 | $0.41 | $0.51 |
| Net realized and unrealized gain (loss) | 1.73 | 2.51 | (1.78) | (10.69) | 12.96 | (3.41) |
| Total from investment operations | $2.00 | $3.15 | $(1.15) | $(10.13) | $13.37 | $(2.90) |
| Less distributions declared to shareholders | ||||||
| From net investment income | $— | $(0.76) | $(0.28) | $(0.53) | $(0.15) | $(0.62) |
| Net asset value, end of period (x) | $33.47 | $31.47 | $29.08 | $30.51 | $41.17 | $27.95 |
| Total return (%) (r)(s)(t)(x) | 6.36(n) | 11.01 | (3.75) | (24.78) | 47.89 | (9.55) |
| Ratios (%) (to average net assets) and Supplemental data: | ||||||
| Expenses before expense reductions | 1.35(a) | 1.36 | 1.38 | 1.34 | 1.34 | 1.39 |
| Expenses after expense reductions | 1.31(a) | 1.31 | 1.31 | 1.31 | 1.31 | 1.31 |
| Net investment income (loss) | 1.58(a) | 2.11 | 2.20 | 1.52 | 1.13 | 1.64 |
| Portfolio turnover rate | 17(n) | 34 | 36 | 38 | 37 | 32 |
| Net assets at end of period (000 omitted) | $1,793 | $1,661 | $1,286 | $1,406 | $5,103 | $6,246 |
| Class R4 | Six months ended | Year ended | ||||
| 11/30/24 (unaudited) | 5/31/24 | 5/31/23 | 5/31/22 | 5/31/21 | 5/31/20 | |
| Net asset value, beginning of period | $31.36 | $28.98 | $30.43 | $41.24 | $28.03 | $31.47 |
| Income (loss) from investment operations | ||||||
| Net investment income (loss) (d) | $0.31 | $0.73 | $0.70 | $0.60 | $0.43 | $0.81 |
| Net realized and unrealized gain (loss) | 1.73 | 2.48 | (1.78) | (10.62) | 13.06 | (3.63) |
| Total from investment operations | $2.04 | $3.21 | $(1.08) | $(10.02) | $13.49 | $(2.82) |
| Less distributions declared to shareholders | ||||||
| From net investment income | $— | $(0.83) | $(0.37) | $(0.79) | $(0.28) | $(0.62) |
| Net asset value, end of period (x) | $33.40 | $31.36 | $28.98 | $30.43 | $41.24 | $28.03 |
| Total return (%) (r)(s)(t)(x) | 6.51(n) | 11.27 | (3.53) | (24.57) | 48.20 | (9.31) |
| Ratios (%) (to average net assets) and Supplemental data: | ||||||
| Expenses before expense reductions | 1.10(a) | 1.11 | 1.13 | 1.10 | 1.09 | 1.13 |
| Expenses after expense reductions | 1.06(a) | 1.06 | 1.06 | 1.06 | 1.06 | 1.06 |
| Net investment income (loss) | 1.86(a) | 2.41 | 2.46 | 1.70 | 1.20 | 2.54 |
| Portfolio turnover rate | 17(n) | 34 | 36 | 38 | 37 | 32 |
| Net assets at end of period (000 omitted) | $5,866 | $5,670 | $4,138 | $3,264 | $3,037 | $2,673 |
| Class R6 | Six months ended | Year ended | ||||
| 11/30/24 (unaudited) | 5/31/24 | 5/31/23 | 5/31/22 | 5/31/21 | 5/31/20 | |
| Net asset value, beginning of period | $33.36 | $30.77 | $32.26 | $43.67 | $29.66 | $33.30 |
| Income (loss) from investment operations | ||||||
| Net investment income (loss) (d) | $0.36 | $0.81 | $0.79 | $0.66 | $0.47 | $0.70 |
| Net realized and unrealized gain (loss) | 1.83 | 2.66 | (1.88) | (11.24) | 13.86 | (3.64) |
| Total from investment operations | $2.19 | $3.47 | $(1.09) | $(10.58) | $14.33 | $(2.94) |
| Less distributions declared to shareholders | ||||||
| From net investment income | $— | $(0.88) | $(0.40) | $(0.83) | $(0.32) | $(0.70) |
| Net asset value, end of period (x) | $35.55 | $33.36 | $30.77 | $32.26 | $43.67 | $29.66 |
| Total return (%) (r)(s)(t)(x) | 6.56(n) | 11.45 | (3.34) | (24.49) | 48.43 | (9.21) |
| Ratios (%) (to average net assets) and Supplemental data: | ||||||
| Expenses before expense reductions | 0.95(a) | 0.95 | 0.97 | 0.95 | 0.98 | 1.03 |
| Expenses after expense reductions | 0.91(a) | 0.90 | 0.90 | 0.92 | 0.95 | 0.95 |
| Net investment income (loss) | 2.02(a) | 2.52 | 2.62 | 1.76 | 1.20 | 2.10 |
| Portfolio turnover rate | 17(n) | 34 | 36 | 38 | 37 | 32 |
| Net assets at end of period (000 omitted) | $7,395,032 | $7,270,629 | $6,638,192 | $6,524,541 | $7,034,144 | $3,336,889 |
| (a) | Annualized. |
| (d) | Per share data is based on average shares outstanding. |
| (n) | Not annualized. |
| (r) | Certain expenses have been reduced without which performance would have been lower. |
| (s) | From time to time the fund may receive proceeds from litigation settlements, without which performance would be lower. |
| (t) | Total returns do not include any applicable sales charges. |
| (x) | The net asset values and total returns have been calculated on net assets which include adjustments made in accordance with U.S. generally accepted accounting principles required at period end for financial reporting purposes. |
| Financial Instruments | Level 1 | Level 2 | Level 3 | Total |
| Equity Securities: | ||||
| China | $2,008,152,699 | $— | $— | $2,008,152,699 |
| India | 1,225,882,356 | 3,417,745 | — | 1,229,300,101 |
| Taiwan | 1,114,623,425 | — | — | 1,114,623,425 |
| South Korea | 979,506,413 | — | — | 979,506,413 |
| Brazil | 438,799,990 | — | — | 438,799,990 |
| Indonesia | 280,651,198 | — | — | 280,651,198 |
| Mexico | 223,663,632 | — | — | 223,663,632 |
| Thailand | 169,244,750 | — | — | 169,244,750 |
| Hong Kong | 150,256,682 | — | — | 150,256,682 |
| Other Countries | 988,959,651 | — | 0 | 988,959,651 |
| Mutual Funds | 100,382,799 | — | — | 100,382,799 |
| Total | $7,680,123,595 | $3,417,745 | $0 | $7,683,541,340 |
| Equity Securities | |
| Balance as of 5/31/24 | $0 |
| Realized gain (loss) | (133,173,627) |
| Change in unrealized appreciation or depreciation | 190,969,984 |
| Sales | (57,796,357) |
| Balance as of 11/30/24 | $0 |
| Year ended 5/31/24 | |
| Ordinary income (including any short-term capital gains) | $195,005,589 |
| As of 11/30/24 | |
| Cost of investments | $6,867,771,132 |
| Gross appreciation | 1,652,035,607 |
| Gross depreciation | (836,265,399) |
| Net unrealized appreciation (depreciation) | $815,770,208 |
| As of 5/31/24 | |
| Undistributed ordinary income | 89,827,132 |
| Capital loss carryforwards | (839,805,585) |
| Other temporary differences | (7,801,063) |
| Net unrealized appreciation (depreciation) | 394,940,196 |
| Short-Term | $(87,512,882) |
| Long-Term | (752,292,703) |
| Total | $(839,805,585) |
| Six months ended 11/30/24 | Year ended 5/31/24 | ||
| Class A | $— | $3,951,591 | |
| Class B | — | 9,297 | |
| Class C | — | 57,336 | |
| Class I | — | 2,449,314 | |
| Class R1 | — | 4,843 | |
| Class R2 | — | 55,841 | |
| Class R3 | — | 37,325 | |
| Class R4 | — | 127,002 | |
| Class R6 | — | 188,313,040 | |
| Total | $— | $195,005,589 |
| Up to $500 million | 1.05% |
| In excess of $500 million and up to $1 billion | 0.95% |
| In excess of $1 billion and up to $4 billion | 0.90% |
| In excess of $4 billion and up to $10 billion | 0.85% |
| In excess of $10 billion | 0.80% |
| Classes | ||||||||
| A | B | C | I | R1 | R2 | R3 | R4 | R6 |
| 1.31% | 2.06% | 2.06% | 1.06% | 2.06% | 1.56% | 1.31% | 1.06% | 0.95% |
| Distribution Fee Rate (d) | Service Fee Rate (d) | Total Distribution Plan (d) | Annual Effective Rate (e) | Distribution and Service Fee | |
| Class A | — | 0.25% | 0.25% | 0.25% | $ 213,800 |
| Class B | 0.75% | 0.25% | 1.00% | 1.00% | 2,016 |
| Class C | 0.75% | 0.25% | 1.00% | 1.00% | 14,482 |
| Class R1 | 0.75% | 0.25% | 1.00% | 1.00% | 3,123 |
| Class R2 | 0.25% | 0.25% | 0.50% | 0.50% | 5,612 |
| Class R3 | — | 0.25% | 0.25% | 0.25% | 2,210 |
| Total Distribution and Service Fees | $241,243 |
| (d) | In accordance with the distribution plan for certain classes, the fund pays distribution and/or service fees equal to these annual percentage rates of each class’s average daily net assets. The distribution and service fee rates disclosed by class represent the current rates in effect at the end of the reporting period. Any rate changes, if applicable, are detailed below. |
| (e) | The annual effective rates represent actual fees incurred under the distribution plan for the six months ended November 30, 2024 based on each class's average daily net assets. MFD has voluntarily agreed to rebate a portion of each class's 0.25% service fee attributable to accounts for which there is no financial intermediary specified on the account except for accounts attributable to MFS or its affiliates' seed money. For the six months ended November 30, 2024, this rebate amounted to $83 for Class A shares and is included in the reduction of total expenses in the Statement of Operations. |
| Amount | |
| Class A | $1,682 |
| Class B | 40 |
| Class C | 146 |
| Date | Transaction | Class | Shares | Amount |
| 8/19/2024 | Redemption | Class I | 3 | $90 |
| 8/19/2024 | Redemption | Class R2 | 2 | 74 |
| 8/19/2024 | Redemption | Class R3 | 2 | 82 |
| 8/19/2024 | Redemption | Class R4 | 3 | 114 |
| Six months ended 11/30/24 | Year ended 5/31/24 | ||||
| Shares | Amount | Shares | Amount | ||
| Shares sold | |||||
| Class A | 308,864 | $10,385,730 | 739,470 | $22,319,529 | |
| Class C | 10,822 | 323,505 | 15,074 | 409,668 | |
| Class I | 236,355 | 8,402,110 | 1,050,979 | 33,135,098 | |
| Class R1 | 8,258 | 248,602 | 3,181 | 84,455 | |
| Class R2 | 4,252 | 130,509 | 26,465 | 733,505 | |
| Class R3 | 4,868 | 164,091 | 11,491 | 346,695 | |
| Class R4 | 9,385 | 317,410 | 56,262 | 1,685,364 | |
| Class R6 | 6,569,444 | 233,468,545 | 17,962,781 | 573,976,606 | |
| 7,152,248 | $253,440,502 | 19,865,703 | $632,690,920 | ||
| Shares issued to shareholders in reinvestment of distributions | |||||
| Class A | — | $— | 131,462 | $3,895,108 | |
| Class B | — | — | 341 | 9,297 | |
| Class C | — | — | 1,993 | 52,870 | |
| Class I | — | — | 73,657 | 2,307,660 | |
| Class R1 | — | — | 185 | 4,843 | |
| Class R2 | — | — | 2,054 | 55,202 | |
| Class R3 | — | — | 1,261 | 37,325 | |
| Class R4 | — | — | 4,310 | 127,002 | |
| Class R6 | — | — | 6,011,617 | 188,283,848 | |
| — | $— | 6,226,880 | $194,773,155 | ||
| Six months ended 11/30/24 | Year ended 5/31/24 | ||||
| Shares | Amount | Shares | Amount | ||
| Shares reacquired | |||||
| Class A | (576,217) | $(19,385,430) | (1,078,187) | $(32,596,738) | |
| Class B | (3,480) | (106,431) | (10,996) | (304,838) | |
| Class C | (22,270) | (666,063) | (56,767) | (1,532,744) | |
| Class I | (415,705) | (14,937,152) | (1,228,601) | (39,545,287) | |
| Class R1 | (535) | (15,914) | (35,609) | (962,943) | |
| Class R2 | (13,829) | (418,918) | (26,376) | (726,693) | |
| Class R3 | (4,064) | (134,317) | (4,195) | (127,802) | |
| Class R4 | (14,539) | (487,386) | (22,535) | (680,007) | |
| Class R6 | (16,517,413) | (598,381,207) | (21,737,746) | (707,658,785) | |
| (17,568,052) | $(634,532,818) | (24,201,012) | $(784,135,837) | ||
| Net change | |||||
| Class A | (267,353) | $(8,999,700) | (207,255) | $(6,382,101) | |
| Class B | (3,480) | (106,431) | (10,655) | (295,541) | |
| Class C | (11,448) | (342,558) | (39,700) | (1,070,206) | |
| Class I | (179,350) | (6,535,042) | (103,965) | (4,102,529) | |
| Class R1 | 7,723 | 232,688 | (32,243) | (873,645) | |
| Class R2 | (9,577) | (288,409) | 2,143 | 62,014 | |
| Class R3 | 804 | 29,774 | 8,557 | 256,218 | |
| Class R4 | (5,154) | (169,976) | 38,037 | 1,132,359 | |
| Class R6 | (9,947,969) | (364,912,662) | 2,236,652 | 54,601,669 | |
| (10,415,804) | $(381,092,316) | 1,891,571 | $43,328,238 | ||
| Affiliated Issuers | Beginning Value | Purchases | Sales Proceeds | Realized Gain (Loss) | Change in Unrealized Appreciation or Depreciation | Ending Value |
| MFS Institutional Money Market Portfolio | $155,743,854 | $832,342,244 | $887,896,199 | $11,761 | $(4,761) | $100,196,899 |
| Affiliated Issuers | Dividend Income | Capital Gain Distributions |
| MFS Institutional Money Market Portfolio | $3,298,518 | $— |
| Number of Dollars | ||||||
| Nominee | For | Against/Withheld | Abstain | |||
| Steven E. Buller | 93,694,553,358.767 | 2,599,093,584.595 | 0.000 | |||
| John A. Caroselli | 94,028,434,411.278 | 2,265,212,532.084 | 0.000 | |||
| Maureen R. Goldfarb | 94,361,674,360.213 | 1,931,972,583.149 | 0.000 | |||
| Peter D. Jones | 94,066,354,687.369 | 2,227,292,255.993 | 0.000 | |||
| John P. Kavanaugh | 94,185,926,082.433 | 2,107,559,444.381 | 161,416.548 | |||
| James W. Kilman, Jr. | 94,450,795,713.326 | 1,842,851,230.036 | 0.000 | |||
| Clarence Otis, Jr. | 93,984,248,122.457 | 2,309,398,820.905 | 0.000 | |||
| Michael W. Roberge | 94,352,210,986.123 | 1,941,435,957.239 | 0.000 | |||
| Maryanne L. Roepke | 94,413,451,878.996 | 1,880,195,064.366 | 0.000 | |||
| Paula E. Smith | 94,545,454,781.292 | 1,748,192,162.070 | 0.000 | |||
| Laurie J. Thomsen | 94,416,793,826.848 | 1,876,853,116.514 | 0.000 | |||
| Darrell A. Williams | 94,451,319,166.310 | 1,842,327,777.051 | 0.000 | |||
| Issuer | Shares/Par | Value ($) | ||
| Common Stocks – 98.8% | ||||
| Aerospace & Defense – 1.8% | ||||
| CACI International, Inc., “A” (a) | 4,101 | $ 1,885,968 | ||
| Leidos Holdings, Inc. | 39,410 | 6,518,414 | ||
| Standard Aero, Inc. (a) | 67,162 | 1,924,863 | ||
| Textron, Inc. | 83,525 | 7,152,246 | ||
| $17,481,491 | ||||
| Airlines – 1.8% | ||||
| SkyWest, Inc. (a) | 56,101 | $ 6,437,029 | ||
| United Airlines Holdings, Inc. (a) | 106,602 | 10,322,271 | ||
| $16,759,300 | ||||
| Alcoholic Beverages – 0.1% | ||||
| Molson Coors Beverage Co. | 15,190 | $ 942,691 | ||
| Apparel Manufacturers – 1.8% | ||||
| PVH Corp. | 117,494 | $ 12,732,825 | ||
| Skechers USA, Inc., “A” (a) | 74,067 | 4,726,956 | ||
| $17,459,781 | ||||
| Automotive – 0.4% | ||||
| Aptiv PLC (a) | 22,643 | $ 1,257,366 | ||
| Visteon Corp. (a) | 23,814 | 2,223,513 | ||
| $3,480,879 | ||||
| Biotechnology – 2.2% | ||||
| Biogen, Inc. (a) | 33,106 | $ 5,317,817 | ||
| Exelixis, Inc. (a) | 208,587 | 7,605,082 | ||
| Illumina, Inc. (a) | 54,690 | 7,883,563 | ||
| $20,806,462 | ||||
| Broadcasting – 1.3% | ||||
| Omnicom Group, Inc. | 122,348 | $ 12,824,517 | ||
| Brokerage & Asset Managers – 0.8% | ||||
| Cboe Global Markets, Inc. | 6,680 | $ 1,441,878 | ||
| Raymond James Financial, Inc. | 35,962 | 6,087,647 | ||
| $7,529,525 | ||||
| Business Services – 5.1% | ||||
| Boise Cascade Corp. | 2,904 | $ 428,630 | ||
| Constellium SE (a) | 117,914 | 1,445,626 | ||
| Dropbox, Inc. (a) | 207,849 | 5,749,103 | ||
| GoDaddy, Inc. (a) | 42,786 | 8,453,230 | ||
| Insperity, Inc. | 71,335 | 5,624,765 | ||
| TriNet Group, Inc. | 97,823 | 9,139,603 | ||
| UL Solutions, Inc. | 59,477 | 3,195,699 | ||
| Verisk Analytics, Inc., “A” | 48,589 | 14,295,370 | ||
| Issuer | Shares/Par | Value ($) | ||
| Common Stocks – continued | ||||
| Business Services – continued | ||||
| WNS (Holdings) Ltd. (a) | 11,121 | $ 603,092 | ||
| $48,935,118 | ||||
| Chemicals – 2.3% | ||||
| Avient Corp. | 215,417 | $ 11,040,121 | ||
| Eastman Chemical Co. | 106,459 | 11,148,387 | ||
| $22,188,508 | ||||
| Computer Software – 6.3% | ||||
| ACI Worldwide, Inc. (a) | 52,397 | $ 2,977,198 | ||
| AppLovin Corp. (a) | 45,394 | 15,286,429 | ||
| Clear Secure, Inc., “A” | 23,764 | 615,012 | ||
| Datadog, Inc., “A” (a) | 95,744 | 14,624,896 | ||
| Guidewire Software, Inc. (a) | 64,637 | 13,114,201 | ||
| Nutanix, Inc. (a) | 84,204 | 5,496,837 | ||
| Okta, Inc. (a) | 26,063 | 2,021,446 | ||
| Tyler Technologies, Inc. (a) | 6,881 | 4,329,319 | ||
| Zoom Communications, Inc. (a) | 26,975 | 2,230,563 | ||
| $60,695,901 | ||||
| Computer Software - Systems – 1.4% | ||||
| Box, Inc., “A” (a) | 95,961 | $ 3,367,272 | ||
| Dell Technologies, Inc. | 23,055 | 2,941,587 | ||
| Zebra Technologies Corp., “A” (a) | 17,051 | 6,939,757 | ||
| $13,248,616 | ||||
| Construction – 5.2% | ||||
| AZEK Co., Inc. (a) | 73,291 | $ 3,893,218 | ||
| Builders FirstSource, Inc. (a) | 71,774 | 13,383,698 | ||
| Essex Property Trust, Inc., REIT | 19,779 | 6,140,588 | ||
| GMS, Inc. (a) | 49,160 | 4,933,206 | ||
| Masco Corp. | 131,443 | 10,589,048 | ||
| Mohawk Industries, Inc. (a) | 74,609 | 10,357,968 | ||
| $49,297,726 | ||||
| Consumer Products – 1.1% | ||||
| Newell Brands, Inc. | 1,014,242 | $ 9,726,581 | ||
| Reynolds Consumer Products, Inc. | 14,606 | 404,440 | ||
| $10,131,021 | ||||
| Consumer Services – 0.1% | ||||
| Grand Canyon Education, Inc. (a) | 3,436 | $ 565,531 | ||
| Electrical Equipment – 1.0% | ||||
| AMETEK, Inc. | 27,562 | $ 5,357,502 | ||
| Amphenol Corp., “A” | 63,079 | 4,582,689 | ||
| $9,940,191 | ||||
| Electronics – 1.6% | ||||
| Advanced Energy Industries, Inc. | 3,751 | $ 431,515 | ||
| Amkor Technology, Inc. | 173,136 | 4,577,716 | ||
| Cirrus Logic, Inc. (a) | 29,077 | 3,037,092 | ||
| Corning, Inc. | 51,426 | 2,502,903 | ||
| Issuer | Shares/Par | Value ($) | ||
| Common Stocks – continued | ||||
| Electronics – continued | ||||
| Formfactor, Inc. (a) | 8,947 | $ 358,417 | ||
| Monolithic Power Systems, Inc. | 6,859 | 3,893,443 | ||
| $14,801,086 | ||||
| Energy - Independent – 2.7% | ||||
| Antero Resources Corp. (a) | 117,581 | $ 3,843,723 | ||
| Phillips 66 | 84,104 | 11,268,254 | ||
| Valero Energy Corp. | 75,852 | 10,549,496 | ||
| $25,661,473 | ||||
| Energy - Integrated – 0.5% | ||||
| National Gas Fuel Co. | 80,538 | $ 5,152,016 | ||
| Entertainment – 1.7% | ||||
| Spotify Technology S.A. (a) | 34,355 | $ 16,385,961 | ||
| Food & Beverages – 2.7% | ||||
| Coca-Cola Consolidated, Inc. | 4,154 | $ 5,418,021 | ||
| General Mills, Inc. | 143,718 | 9,522,755 | ||
| Ingredion, Inc. | 54,566 | 8,039,754 | ||
| Primo Brands Corp. | 98,441 | 2,807,537 | ||
| $25,788,067 | ||||
| Forest & Paper Products – 0.5% | ||||
| Sylvamo Corp. | 38,162 | $ 3,521,971 | ||
| UFP Industries, Inc. | 10,496 | 1,426,406 | ||
| $4,948,377 | ||||
| Gaming & Lodging – 0.7% | ||||
| Carnival Corp. (a) | 69,043 | $ 1,755,764 | ||
| International Game Technology PLC | 275,175 | 5,291,615 | ||
| $7,047,379 | ||||
| Insurance – 9.2% | ||||
| Ameriprise Financial, Inc. | 33,518 | $ 19,238,326 | ||
| Assurant, Inc. | 3,185 | 723,313 | ||
| Brighthouse Financial, Inc. (a) | 45,480 | 2,377,240 | ||
| Corebridge Financial, Inc. | 425,513 | 13,773,856 | ||
| Equitable Holdings, Inc. | 167,636 | 8,085,084 | ||
| Everest Group Ltd. | 31,168 | 12,079,470 | ||
| Hartford Financial Services Group, Inc. | 123,286 | 15,202,397 | ||
| Jackson Financial, Inc. | 74,020 | 7,416,064 | ||
| Lincoln National Corp. | 32,218 | 1,145,028 | ||
| Old Republic International Corp. | 30,644 | 1,194,197 | ||
| Reinsurance Group of America, Inc. | 18,025 | 4,116,910 | ||
| Voya Financial, Inc. | 35,772 | 2,969,076 | ||
| $88,320,961 | ||||
| Internet – 0.8% | ||||
| Gartner, Inc. (a) | 14,934 | $ 7,734,767 | ||
| Issuer | Shares/Par | Value ($) | ||
| Common Stocks – continued | ||||
| Leisure & Toys – 1.0% | ||||
| Electronic Arts, Inc. | 43,257 | $ 7,079,873 | ||
| Hasbro, Inc. | 43,761 | 2,851,029 | ||
| $9,930,902 | ||||
| Machinery & Tools – 5.4% | ||||
| AGCO Corp. | 62,427 | $ 6,318,237 | ||
| Albany International Corp. | 9,982 | 827,508 | ||
| CNH Industrial N.V. | 1,094,894 | 13,751,869 | ||
| Flowserve Corp. | 97,065 | 5,922,906 | ||
| Mueller Industries, Inc. | 60,308 | 4,871,077 | ||
| Timken Co. | 61,216 | 4,741,179 | ||
| Wabtec Corp. | 76,239 | 15,295,068 | ||
| $51,727,844 | ||||
| Medical & Health Technology & Services – 6.8% | ||||
| ICON PLC (a) | 21,780 | $ 4,579,245 | ||
| IDEXX Laboratories, Inc. (a) | 18,931 | 7,984,149 | ||
| IQVIA Holdings, Inc. (a) | 50,845 | 10,211,710 | ||
| McKesson Corp. | 22,663 | 14,243,696 | ||
| Tenet Healthcare Corp. (a) | 5,134 | 732,519 | ||
| Universal Health Services, Inc. | 58,336 | 11,958,880 | ||
| Veeva Systems, Inc. (a) | 65,771 | 14,985,922 | ||
| $64,696,121 | ||||
| Medical Equipment – 0.1% | ||||
| STERIS PLC | 4,391 | $ 961,892 | ||
| Natural Gas - Distribution – 1.2% | ||||
| UGI Corp. | 367,375 | $ 11,157,179 | ||
| Natural Gas - Pipeline – 0.2% | ||||
| Cheniere Energy, Inc. | 2,310 | $ 517,463 | ||
| Targa Resources Corp. | 8,199 | 1,675,056 | ||
| $2,192,519 | ||||
| Network & Telecom – 0.6% | ||||
| InterDigital, Inc. | 15,301 | $ 2,998,384 | ||
| Motorola Solutions, Inc. | 6,380 | 3,188,086 | ||
| $6,186,470 | ||||
| Oil Services – 1.6% | ||||
| NOV, Inc. | 89,346 | $ 1,431,323 | ||
| TechnipFMC PLC (a) | 445,599 | 13,978,441 | ||
| $15,409,764 | ||||
| Other Banks & Diversified Financials – 7.3% | ||||
| M&T Bank Corp. | 78,569 | $ 17,284,394 | ||
| Northern Trust Corp. | 55,296 | 6,146,703 | ||
| Popular, Inc. | 129,137 | 12,831,052 | ||
| SLM Corp. | 457,220 | 12,518,684 | ||
| Synchrony Financial | 205,076 | 13,846,732 | ||
| Issuer | Shares/Par | Value ($) | ||
| Common Stocks – continued | ||||
| Other Banks & Diversified Financials – continued | ||||
| Texas Capital Bancshares, Inc. (a) | 80,430 | $ 7,114,034 | ||
| $69,741,599 | ||||
| Pharmaceuticals – 1.4% | ||||
| Incyte Corp. (a) | 72,272 | $ 5,390,769 | ||
| Organon & Co. | 491,259 | 7,796,280 | ||
| $13,187,049 | ||||
| Printing & Publishing – 0.8% | ||||
| Lamar Advertising Co., REIT | 57,869 | $ 7,755,603 | ||
| Real Estate – 4.4% | ||||
| Broadstone Net Lease, Inc., REIT | 124,527 | $ 2,180,468 | ||
| CareTrust REIT, Inc. | 141,656 | 4,219,932 | ||
| CBRE Group, Inc., “A” (a) | 10,138 | 1,419,219 | ||
| Essential Properties Realty Trust, REIT | 210,288 | 7,170,821 | ||
| Jones Lang LaSalle, Inc. (a) | 43,931 | 12,327,038 | ||
| NNN REIT, Inc. | 132,171 | 5,812,880 | ||
| Tanger, Inc., REIT | 204,709 | 7,568,092 | ||
| W.P. Carey, Inc., REIT | 25,978 | 1,482,305 | ||
| $42,180,755 | ||||
| Real Estate - Office – 1.6% | ||||
| Cousins Properties, Inc., REIT | 127,356 | $ 4,042,279 | ||
| Highwoods Properties, Inc., REIT | 335,821 | 10,900,750 | ||
| $14,943,029 | ||||
| Real Estate - Storage – 0.4% | ||||
| Innovative Industrial Properties, Inc., REIT | 32,765 | $ 3,572,040 | ||
| Restaurants – 3.4% | ||||
| Aramark | 306,789 | $ 12,483,244 | ||
| Performance Food Group Co. (a) | 61,632 | 5,438,408 | ||
| Texas Roadhouse, Inc. | 18,225 | 3,741,046 | ||
| Wingstop, Inc. | 32,578 | 10,710,669 | ||
| $32,373,367 | ||||
| Specialty Chemicals – 1.6% | ||||
| Ashland, Inc. | 13,548 | $ 1,057,557 | ||
| RPM International, Inc. | 97,797 | 13,572,268 | ||
| Seaboard Corp. | 184 | 480,972 | ||
| Tronox Holdings PLC | 31,408 | 380,037 | ||
| $15,490,834 | ||||
| Specialty Stores – 2.2% | ||||
| Abercrombie & Fitch Co., “A” (a) | 20,183 | $ 3,021,193 | ||
| Bath & Body Works, Inc. | 30,963 | 1,122,099 | ||
| Gap, Inc. | 164,098 | 3,979,376 | ||
| O'Reilly Automotive, Inc. (a) | 9,798 | 12,181,070 | ||
| Ross Stores, Inc. | 6,392 | 989,929 | ||
| $21,293,667 | ||||
| Issuer | Shares/Par | Value ($) | ||
| Common Stocks – continued | ||||
| Telephone Services – 0.1% | ||||
| Altice USA, Inc., “A” (a) | 360,775 | $ 869,468 | ||
| Utilities - Electric Power – 5.6% | ||||
| DTE Energy Co. | 25,268 | $ 3,178,209 | ||
| Edison International | 113,323 | 9,944,093 | ||
| NRG Energy, Inc. | 114,531 | 11,637,495 | ||
| PPL Corp. | 384,081 | 13,415,949 | ||
| Vistra Corp. | 96,957 | 15,497,607 | ||
| $53,673,353 | ||||
| Total Common Stocks (Identified Cost, $731,120,513) | $945,470,800 | |||
| Investment Companies (h) – 0.9% | ||||
| Money Market Funds – 0.9% | ||||
| MFS Institutional Money Market Portfolio, 4.66% (v) (Identified Cost, $8,352,576) | 8,352,158 | $ 8,352,994 | ||
| Other Assets, Less Liabilities – 0.3% | 3,045,852 | |||
| Net Assets – 100.0% | $956,869,646 | |||
| (a) | Non-income producing security. | |||
| (h) | An affiliated issuer, which may be considered one in which the fund owns 5% or more of the outstanding voting securities, or a company which is under common control. At period end, the aggregate values of the fund's investments in affiliated issuers and in unaffiliated issuers were $8,352,994 and $945,470,800, respectively. | |||
| (v) | Affiliated issuer that is available only to investment companies managed by MFS. The rate quoted for the MFS Institutional Money Market Portfolio is the annualized seven-day yield of the fund at period end. |
| The following abbreviations are used in this report and are defined: | |
| REIT | Real Estate Investment Trust |
| Financial Statements | Statement of Assets and Liabilities |
| At 11/30/24 (unaudited)Assets | |
| Investments in unaffiliated issuers, at value (identified cost, $731,120,513) | $945,470,800 |
| Investments in affiliated issuers, at value (identified cost, $8,352,576) | 8,352,994 |
| Cash | 180,106 |
| Receivables for | |
| Fund shares sold | 3,235,539 |
| Interest and dividends | 857,368 |
| Receivable from investment adviser | 7,751 |
| Other assets | 60,926 |
| Total assets | $958,165,484 |
| Liabilities | |
| Payables for | |
| Investments purchased | $180,107 |
| Fund shares reacquired | 947,248 |
| Payable to affiliates | |
| Administrative services fee | 1,601 |
| Shareholder servicing costs | 112,811 |
| Distribution and service fees | 2,402 |
| Accrued expenses and other liabilities | 51,669 |
| Total liabilities | $1,295,838 |
| Net assets | $956,869,646 |
| Net assets consist of | |
| Paid-in capital | $658,877,945 |
| Total distributable earnings (loss) | 297,991,701 |
| Net assets | $956,869,646 |
| Shares of beneficial interest outstanding | 56,530,013 |
| Net assets | Shares outstanding | Net asset value per share (a) | |
| Class A | $59,929,564 | 3,533,445 | $16.96 |
| Class B | 187,614 | 11,293 | 16.61 |
| Class C | 4,936,568 | 298,060 | 16.56 |
| Class I | 338,010,024 | 20,008,994 | 16.89 |
| Class R1 | 195,723 | 11,773 | 16.63 |
| Class R2 | 659,085 | 39,324 | 16.76 |
| Class R3 | 6,555,521 | 389,211 | 16.84 |
| Class R4 | 1,385,131 | 81,831 | 16.93 |
| Class R6 | 545,010,416 | 32,156,082 | 16.95 |
| (a) | Maximum offering price per share was equal to the net asset value per share for all share classes, except for Class A, for which the maximum offering price per share was $17.99 [100 / 94.25 x $16.96]. On sales of $50,000 or more, the maximum offering price of Class A shares is reduced. A contingent deferred sales charge may be imposed on redemptions of Class A, Class B, and Class C shares. Redemption price per share was equal to the net asset value per share for Classes I, R1, R2, R3, R4, and R6. |
| Financial Statements | Statement of Operations |
| Six months ended 11/30/24 (unaudited)Net investment income (loss) | |
| Income | |
| Dividends from unaffiliated issuers | $6,056,290 |
| Dividends from affiliated issuers | 210,990 |
| Income on securities loaned | 111,328 |
| Other | 27,154 |
| Foreign taxes withheld | (46,908) |
| Total investment income | $6,358,854 |
| Expenses | |
| Management fee | $1,976,110 |
| Distribution and service fees | 91,468 |
| Shareholder servicing costs | 183,699 |
| Administrative services fee | 61,366 |
| Independent Trustees' compensation | 6,935 |
| Custodian fee | 23,032 |
| Shareholder communications | 11,083 |
| Audit and tax fees | 34,653 |
| Legal fees | 1,540 |
| Miscellaneous | 107,829 |
| Total expenses | $2,497,715 |
| Fees paid indirectly | (30) |
| Reduction of expenses by investment adviser | (331,309) |
| Net expenses | $2,166,376 |
| Net investment income (loss) | $4,192,478 |
| Realized and unrealized gain (loss) | |
| Realized gain (loss) (identified cost basis) | |
| Unaffiliated issuers | $34,521,605 |
| Affiliated issuers | 519 |
| Net realized gain (loss) | $34,522,124 |
| Change in unrealized appreciation or depreciation | |
| Unaffiliated issuers | $91,058,302 |
| Affiliated issuers | (319) |
| Net unrealized gain (loss) | $91,057,983 |
| Net realized and unrealized gain (loss) | $125,580,107 |
| Change in net assets from operations | $129,772,585 |
| Financial Statements | Statements of Changes in Net Assets |
| Six months ended | Year ended | |
| 11/30/24 (unaudited) | 5/31/24 | |
| Change in net assets | ||
| From operations | ||
| Net investment income (loss) | $4,192,478 | $6,774,870 |
| Net realized gain (loss) | 34,522,124 | 58,146,347 |
| Net unrealized gain (loss) | 91,057,983 | 93,951,176 |
| Change in net assets from operations | $129,772,585 | $158,872,393 |
| Total distributions to shareholders | $— | $(13,586,306) |
| Change in net assets from fund share transactions | $127,763,280 | $69,104,258 |
| Total change in net assets | $257,535,865 | $214,390,345 |
| Net assets | ||
| At beginning of period | 699,333,781 | 484,943,436 |
| At end of period | $956,869,646 | $699,333,781 |
| Financial Statements | Financial Highlights |
| Class A | Six months ended | Year ended | ||||
| 11/30/24 (unaudited) | 5/31/24 | 5/31/23 | 5/31/22 | 5/31/21 | 5/31/20 | |
| Net asset value, beginning of period | $14.57 | $11.31 | $12.38 | $15.36 | $10.70 | $11.14 |
| Income (loss) from investment operations | ||||||
| Net investment income (loss) (d) | $0.06 | $0.11 | $0.11 | $0.07 | $0.08 | $0.10 |
| Net realized and unrealized gain (loss) | 2.33 | 3.42 | (0.62) | (0.05)(g) | 4.68 | 0.02 |
| Total from investment operations | $2.39 | $3.53 | $(0.51) | $0.02 | $4.76 | $0.12 |
| Less distributions declared to shareholders | ||||||
| From net investment income | $— | $(0.11) | $(0.11) | $— | $(0.10) | $(0.10) |
| From net realized gain | — | (0.16) | (0.45) | (3.00) | (0.00)(w) | (0.46) |
| Total distributions declared to shareholders | $— | $(0.27) | $(0.56) | $(3.00) | $(0.10) | $(0.56) |
| Net asset value, end of period (x) | $16.96 | $14.57 | $11.31 | $12.38 | $15.36 | $10.70 |
| Total return (%) (r)(s)(t)(x) | 16.40(n) | 31.49 | (4.30) | (1.00) | 44.61 | 0.51 |
| Ratios (%) (to average net assets) and Supplemental data: | ||||||
| Expenses before expense reductions (f) | 0.92(a) | 0.93 | 0.94 | 0.94 | 0.92 | 0.96 |
| Expenses after expense reductions (f) | 0.84(a) | 0.84 | 0.84 | 0.84 | 0.84 | 0.84 |
| Net investment income (loss) | 0.77(a) | 0.88 | 0.96 | 0.45 | 0.58 | 0.89 |
| Portfolio turnover rate | 30(n) | 75 | 67 | 89 | 103 | 81 |
| Net assets at end of period (000 omitted) | $59,930 | $42,546 | $32,605 | $19,061 | $133,584 | $74,843 |
| Class B | Six months ended | Year ended | ||||
| 11/30/24 (unaudited) | 5/31/24 | 5/31/23 | 5/31/22 | 5/31/21 | 5/31/20 | |
| Net asset value, beginning of period | $14.33 | $11.12 | $12.17 | $15.26 | $10.64 | $11.08 |
| Income (loss) from investment operations | ||||||
| Net investment income (loss) (d) | $0.00(w) | $0.02 | $0.02 | $(0.01) | $(0.02) | $0.02 |
| Net realized and unrealized gain (loss) | 2.28 | 3.36 | (0.61) | (0.08) | 4.65 | 0.01 |
| Total from investment operations | $2.28 | $3.38 | $(0.59) | $(0.09) | $4.63 | $0.03 |
| Less distributions declared to shareholders | ||||||
| From net investment income | $— | $(0.01) | $(0.01) | $(0.00)(w) | $(0.01) | $(0.01) |
| From net realized gain | — | (0.16) | (0.45) | (3.00) | (0.00)(w) | (0.46) |
| Total distributions declared to shareholders | $— | $(0.17) | $(0.46) | $(3.00) | $(0.01) | $(0.47) |
| Net asset value, end of period (x) | $16.61 | $14.33 | $11.12 | $12.17 | $15.26 | $10.64 |
| Total return (%) (r)(s)(t)(x) | 15.91(n) | 30.58 | (5.01) | (1.78) | 43.56 | (0.23) |
| Ratios (%) (to average net assets) and Supplemental data: | ||||||
| Expenses before expense reductions (f) | 1.67(a) | 1.68 | 1.69 | 1.70 | 1.67 | 1.71 |
| Expenses after expense reductions (f) | 1.59(a) | 1.59 | 1.59 | 1.59 | 1.59 | 1.59 |
| Net investment income (loss) | 0.06(a) | 0.12 | 0.20 | (0.05) | (0.16) | 0.15 |
| Portfolio turnover rate | 30(n) | 75 | 67 | 89 | 103 | 81 |
| Net assets at end of period (000 omitted) | $188 | $219 | $197 | $236 | $126 | $92 |
| Class C | Six months ended | Year ended | ||||
| 11/30/24 (unaudited) | 5/31/24 | 5/31/23 | 5/31/22 | 5/31/21 | 5/31/20 | |
| Net asset value, beginning of period | $14.29 | $11.09 | $12.16 | $15.25 | $10.64 | $11.10 |
| Income (loss) from investment operations | ||||||
| Net investment income (loss) (d) | $0.00(w) | $0.02 | $0.03 | $0.01 | $(0.02) | $0.02 |
| Net realized and unrealized gain (loss) | 2.27 | 3.35 | (0.62) | (0.09) | 4.64 | 0.01 |
| Total from investment operations | $2.27 | $3.37 | $(0.59) | $(0.08) | $4.62 | $0.03 |
| Less distributions declared to shareholders | ||||||
| From net investment income | $— | $(0.01) | $(0.03) | $(0.01) | $(0.01) | $(0.03) |
| From net realized gain | — | (0.16) | (0.45) | (3.00) | (0.00)(w) | (0.46) |
| Total distributions declared to shareholders | $— | $(0.17) | $(0.48) | $(3.01) | $(0.01) | $(0.49) |
| Net asset value, end of period (x) | $16.56 | $14.29 | $11.09 | $12.16 | $15.25 | $10.64 |
| Total return (%) (r)(s)(t)(x) | 15.89(n) | 30.59 | (4.98) | (1.74) | 43.49 | (0.28) |
| Ratios (%) (to average net assets) and Supplemental data: | ||||||
| Expenses before expense reductions (f) | 1.67(a) | 1.68 | 1.69 | 1.70 | 1.66 | 1.71 |
| Expenses after expense reductions (f) | 1.59(a) | 1.59 | 1.59 | 1.59 | 1.59 | 1.59 |
| Net investment income (loss) | 0.03(a) | 0.12 | 0.23 | 0.11 | (0.16) | 0.16 |
| Portfolio turnover rate | 30(n) | 75 | 67 | 89 | 103 | 81 |
| Net assets at end of period (000 omitted) | $4,937 | $4,168 | $4,180 | $3,161 | $350 | $138 |
| Class I | Six months ended | Year ended | ||||
| 11/30/24 (unaudited) | 5/31/24 | 5/31/23 | 5/31/22 | 5/31/21 | 5/31/20 | |
| Net asset value, beginning of period | $14.50 | $11.25 | $12.31 | $15.38 | $10.71 | $11.16 |
| Income (loss) from investment operations | ||||||
| Net investment income (loss) (d) | $0.08 | $0.15 | $0.14 | $0.15 | $0.11 | $0.13 |
| Net realized and unrealized gain (loss) | 2.31 | 3.40 | (0.62) | (0.08) | 4.68 | 0.02 |
| Total from investment operations | $2.39 | $3.55 | $(0.48) | $0.07 | $4.79 | $0.15 |
| Less distributions declared to shareholders | ||||||
| From net investment income | $— | $(0.14) | $(0.13) | $(0.14) | $(0.12) | $(0.14) |
| From net realized gain | — | (0.16) | (0.45) | (3.00) | (0.00)(w) | (0.46) |
| Total distributions declared to shareholders | $— | $(0.30) | $(0.58) | $(3.14) | $(0.12) | $(0.60) |
| Net asset value, end of period (x) | $16.89 | $14.50 | $11.25 | $12.31 | $15.38 | $10.71 |
| Total return (%) (r)(s)(t)(x) | 16.48(n) | 31.91 | (4.07) | (0.73) | 44.98 | 0.71 |
| Ratios (%) (to average net assets) and Supplemental data: | ||||||
| Expenses before expense reductions (f) | 0.67(a) | 0.68 | 0.69 | 0.71 | 0.67 | 0.71 |
| Expenses after expense reductions (f) | 0.59(a) | 0.59 | 0.59 | 0.59 | 0.59 | 0.59 |
| Net investment income (loss) | 1.01(a) | 1.14 | 1.22 | 1.07 | 0.84 | 1.18 |
| Portfolio turnover rate | 30(n) | 75 | 67 | 89 | 103 | 81 |
| Net assets at end of period (000 omitted) | $338,010 | $190,406 | $119,155 | $108,560 | $5,410 | $4,368 |
| Class R1 | Six months ended | Year ended | ||||
| 11/30/24 (unaudited) | 5/31/24 | 5/31/23 | 5/31/22 | 5/31/21 | 5/31/20 | |
| Net asset value, beginning of period | $14.32 | $11.13 | $12.18 | $15.26 | $10.65 | $11.09 |
| Income (loss) from investment operations | ||||||
| Net investment income (loss) (d) | $0.02 | $0.02 | $0.02 | $(0.01) | $(0.02) | $0.02 |
| Net realized and unrealized gain (loss) | 2.29 | 3.36 | (0.61) | (0.07) | 4.64 | 0.02 |
| Total from investment operations | $2.31 | $3.38 | $(0.59) | $(0.08) | $4.62 | $0.04 |
| Less distributions declared to shareholders | ||||||
| From net investment income | $— | $(0.03) | $(0.01) | $— | $(0.01) | $(0.02) |
| From net realized gain | — | (0.16) | (0.45) | (3.00) | (0.00)(w) | (0.46) |
| Total distributions declared to shareholders | $— | $(0.19) | $(0.46) | $(3.00) | $(0.01) | $(0.48) |
| Net asset value, end of period (x) | $16.63 | $14.32 | $11.13 | $12.18 | $15.26 | $10.65 |
| Total return (%) (r)(s)(t)(x) | 16.13(n) | 30.52 | (5.00) | (1.72) | 43.45 | (0.16) |
| Ratios (%) (to average net assets) and Supplemental data: | ||||||
| Expenses before expense reductions (f) | 1.40(a) | 1.68 | 1.69 | 1.70 | 1.67 | 1.71 |
| Expenses after expense reductions (f) | 1.32(a) | 1.59 | 1.59 | 1.59 | 1.59 | 1.59 |
| Net investment income (loss) | 0.29(a) | 0.13 | 0.20 | (0.08) | (0.16) | 0.15 |
| Portfolio turnover rate | 30(n) | 75 | 67 | 89 | 103 | 81 |
| Net assets at end of period (000 omitted) | $196 | $167 | $132 | $136 | $142 | $98 |
| Class R2 | Six months ended | Year ended | ||||
| 11/30/24 (unaudited) | 5/31/24 | 5/31/23 | 5/31/22 | 5/31/21 | 5/31/20 | |
| Net asset value, beginning of period | $14.42 | $11.20 | $12.26 | $15.33 | $10.70 | $11.15 |
| Income (loss) from investment operations | ||||||
| Net investment income (loss) (d) | $0.04 | $0.08 | $0.08 | $0.06 | $0.04 | $0.07 |
| Net realized and unrealized gain (loss) | 2.30 | 3.39 | (0.62) | (0.07) | 4.68 | 0.02 |
| Total from investment operations | $2.34 | $3.47 | $(0.54) | $(0.01) | $4.72 | $0.09 |
| Less distributions declared to shareholders | ||||||
| From net investment income | $— | $(0.09) | $(0.07) | $(0.06) | $(0.09) | $(0.08) |
| From net realized gain | — | (0.16) | (0.45) | (3.00) | (0.00)(w) | (0.46) |
| Total distributions declared to shareholders | $— | $(0.25) | $(0.52) | $(3.06) | $(0.09) | $(0.54) |
| Net asset value, end of period (x) | $16.76 | $14.42 | $11.20 | $12.26 | $15.33 | $10.70 |
| Total return (%) (r)(s)(t)(x) | 16.23(n) | 31.24 | (4.52) | (1.27) | 44.24 | 0.21 |
| Ratios (%) (to average net assets) and Supplemental data: | ||||||
| Expenses before expense reductions (f) | 1.17(a) | 1.18 | 1.19 | 1.20 | 1.17 | 1.21 |
| Expenses after expense reductions (f) | 1.09(a) | 1.09 | 1.09 | 1.09 | 1.09 | 1.09 |
| Net investment income (loss) | 0.52(a) | 0.63 | 0.73 | 0.42 | 0.30 | 0.65 |
| Portfolio turnover rate | 30(n) | 75 | 67 | 89 | 103 | 81 |
| Net assets at end of period (000 omitted) | $659 | $549 | $416 | $292 | $253 | $62 |
| Class R3 | Six months ended | Year ended | ||||
| 11/30/24 (unaudited) | 5/31/24 | 5/31/23 | 5/31/22 | 5/31/21 | 5/31/20 | |
| Net asset value, beginning of period | $14.47 | $11.23 | $12.30 | $15.36 | $10.71 | $11.16 |
| Income (loss) from investment operations | ||||||
| Net investment income (loss) (d) | $0.06 | $0.11 | $0.11 | $0.10 | $0.08 | $0.07 |
| Net realized and unrealized gain (loss) | 2.31 | 3.40 | (0.62) | (0.07) | 4.68 | 0.05 |
| Total from investment operations | $2.37 | $3.51 | $(0.51) | $0.03 | $4.76 | $0.12 |
| Less distributions declared to shareholders | ||||||
| From net investment income | $— | $(0.11) | $(0.11) | $(0.09) | $(0.11) | $(0.11) |
| From net realized gain | — | (0.16) | (0.45) | (3.00) | (0.00)(w) | (0.46) |
| Total distributions declared to shareholders | $— | $(0.27) | $(0.56) | $(3.09) | $(0.11) | $(0.57) |
| Net asset value, end of period (x) | $16.84 | $14.47 | $11.23 | $12.30 | $15.36 | $10.71 |
| Total return (%) (r)(s)(t)(x) | 16.38(n) | 31.54 | (4.33) | (0.94) | 44.60 | 0.51 |
| Ratios (%) (to average net assets) and Supplemental data: | ||||||
| Expenses before expense reductions (f) | 0.92(a) | 0.93 | 0.94 | 0.95 | 0.92 | 1.00 |
| Expenses after expense reductions (f) | 0.84(a) | 0.84 | 0.84 | 0.82 | 0.82 | 0.84 |
| Net investment income (loss) | 0.75(a) | 0.88 | 0.92 | 0.74 | 0.62 | 0.72 |
| Portfolio turnover rate | 30(n) | 75 | 67 | 89 | 103 | 81 |
| Net assets at end of period (000 omitted) | $6,556 | $3,632 | $1,051 | $1,947 | $1,422 | $1,015 |
| Class R4 | Six months ended | Year ended | ||||
| 11/30/24 (unaudited) | 5/31/24 | 5/31/23 | 5/31/22 | 5/31/21 | 5/31/20 | |
| Net asset value, beginning of period | $14.53 | $11.27 | $12.33 | $15.39 | $10.72 | $11.17 |
| Income (loss) from investment operations | ||||||
| Net investment income (loss) (d) | $0.08 | $0.15 | $0.14 | $0.13 | $0.11 | $0.13 |
| Net realized and unrealized gain (loss) | 2.32 | 3.41 | (0.62) | (0.06) | 4.69 | 0.02 |
| Total from investment operations | $2.40 | $3.56 | $(0.48) | $0.07 | $4.80 | $0.15 |
| Less distributions declared to shareholders | ||||||
| From net investment income | $— | $(0.14) | $(0.13) | $(0.13) | $(0.13) | $(0.14) |
| From net realized gain | — | (0.16) | (0.45) | (3.00) | (0.00)(w) | (0.46) |
| Total distributions declared to shareholders | $— | $(0.30) | $(0.58) | $(3.13) | $(0.13) | $(0.60) |
| Net asset value, end of period (x) | $16.93 | $14.53 | $11.27 | $12.33 | $15.39 | $10.72 |
| Total return (%) (r)(s)(t)(x) | 16.52(n) | 31.93 | (4.08) | (0.71) | 44.95 | 0.73 |
| Ratios (%) (to average net assets) and Supplemental data: | ||||||
| Expenses before expense reductions (f) | 0.67(a) | 0.68 | 0.69 | 0.70 | 0.67 | 0.71 |
| Expenses after expense reductions (f) | 0.59(a) | 0.59 | 0.59 | 0.59 | 0.59 | 0.59 |
| Net investment income (loss) | 1.03(a) | 1.14 | 1.20 | 0.92 | 0.84 | 1.18 |
| Portfolio turnover rate | 30(n) | 75 | 67 | 89 | 103 | 81 |
| Net assets at end of period (000 omitted) | $1,385 | $1,161 | $854 | $934 | $953 | $685 |
| Class R6 | Six months ended | Year ended | ||||
| 11/30/24 (unaudited) | 5/31/24 | 5/31/23 | 5/31/22 | 5/31/21 | 5/31/20 | |
| Net asset value, beginning of period | $14.54 | $11.28 | $12.34 | $15.40 | $10.73 | $11.17 |
| Income (loss) from investment operations | ||||||
| Net investment income (loss) (d) | $0.09 | $0.16 | $0.15 | $0.15 | $0.12 | $0.14 |
| Net realized and unrealized gain (loss) | 2.32 | 3.41 | (0.62) | (0.07) | 4.69 | 0.02 |
| Total from investment operations | $2.41 | $3.57 | $(0.47) | $0.08 | $4.81 | $0.16 |
| Less distributions declared to shareholders | ||||||
| From net investment income | $— | $(0.15) | $(0.14) | $(0.14) | $(0.14) | $(0.14) |
| From net realized gain | — | (0.16) | (0.45) | (3.00) | (0.00)(w) | (0.46) |
| Total distributions declared to shareholders | $— | $(0.31) | $(0.59) | $(3.14) | $(0.14) | $(0.60) |
| Net asset value, end of period (x) | $16.95 | $14.54 | $11.28 | $12.34 | $15.40 | $10.73 |
| Total return (%) (r)(s)(t)(x) | 16.57(n) | 32.03 | (3.97) | (0.60) | 45.02 | 0.87 |
| Ratios (%) (to average net assets) and Supplemental data: | ||||||
| Expenses before expense reductions (f) | 0.57(a) | 0.58 | 0.59 | 0.59 | 0.58 | 0.61 |
| Expenses after expense reductions (f) | 0.48(a) | 0.49 | 0.49 | 0.48 | 0.51 | 0.49 |
| Net investment income (loss) | 1.13(a) | 1.24 | 1.30 | 1.04 | 0.94 | 1.25 |
| Portfolio turnover rate | 30(n) | 75 | 67 | 89 | 103 | 81 |
| Net assets at end of period (000 omitted) | $545,010 | $456,485 | $326,353 | $325,339 | $308,874 | $233,687 |
| (a) | Annualized. |
| (d) | Per share data is based on average shares outstanding. |
| (f) | Ratios do not reflect reductions from fees paid indirectly, if applicable. See Note 2 in the Notes to Financial Statements for additional information. |
| (g) | The per share amount varies from the net realized and unrealized gain/loss for the period because of the timing of sales of fund shares and the per share amount of realized and unrealized gains and losses at such time. |
| (n) | Not annualized. |
| (r) | Certain expenses have been reduced without which performance would have been lower. |
| (s) | From time to time the fund may receive proceeds from litigation settlements, without which performance would be lower. |
| (t) | Total returns do not include any applicable sales charges. |
| (w) | Per share amount was less than $0.01. |
| (x) | The net asset values and total returns have been calculated on net assets which include adjustments made in accordance with U.S. generally accepted accounting principles required at period end for financial reporting purposes. |
| Financial Instruments | Level 1 | Level 2 | Level 3 | Total |
| Equity Securities | $945,470,800 | $— | $— | $945,470,800 |
| Mutual Funds | 8,352,994 | — | — | 8,352,994 |
| Total | $953,823,794 | $— | $— | $953,823,794 |
| Year ended 5/31/24 | |
| Ordinary income (including any short-term capital gains) | $6,501,103 |
| Long-term capital gains | 7,085,203 |
| Total distributions | $13,586,306 |
| As of 11/30/24 | |
| Cost of investments | $743,215,196 |
| Gross appreciation | 229,539,313 |
| Gross depreciation | (18,930,715) |
| Net unrealized appreciation (depreciation) | $210,608,598 |
| As of 5/31/24 | |
| Undistributed ordinary income | 11,035,490 |
| Undistributed long-term capital gain | 37,633,011 |
| Net unrealized appreciation (depreciation) | 119,550,615 |
| Six months ended 11/30/24 | Year ended 5/31/24 | ||
| Class A | $— | $701,210 | |
| Class B | — | 2,692 | |
| Class C | — | 55,432 | |
| Class I | — | 3,415,290 | |
| Class R1 | — | 2,218 | |
| Class R2 | — | 9,563 | |
| Class R3 | — | 41,666 | |
| Class R4 | — | 23,572 | |
| Class R6 | — | 9,334,663 | |
| Total | $— | $13,586,306 |
| Up to $1 billion | 0.50% |
| In excess of $1 billion and up to $2.5 billion | 0.475% |
| In excess of $2.5 billion | 0.45% |
| Classes | ||||||||
| A | B | C | I | R1 | R2 | R3 | R4 | R6 |
| 0.84% | 1.59% | 1.59% | 0.59% | 1.59% | 1.09% | 0.84% | 0.59% | 0.52% |
| Distribution Fee Rate (d) | Service Fee Rate (d) | Total Distribution Plan (d) | Annual Effective Rate (e) | Distribution and Service Fee | |
| Class A | — | 0.25% | 0.25% | 0.25% | $ 60,244 |
| Class B | 0.75% | 0.25% | 1.00% | 1.00% | 918 |
| Class C | 0.75% | 0.25% | 1.00% | 1.00% | 22,042 |
| Class R1 | 0.75% | 0.25% | 1.00% | 0.73% | 645 |
| Class R2 | 0.25% | 0.25% | 0.50% | 0.50% | 1,454 |
| Class R3 | — | 0.25% | 0.25% | 0.25% | 6,165 |
| Total Distribution and Service Fees | $91,468 |
| (d) | In accordance with the distribution plan for certain classes, the fund pays distribution and/or service fees equal to these annual percentage rates of each class’s average daily net assets. The distribution and service fee rates disclosed by class represent the current rates in effect at the end of the reporting period. Any rate changes, if applicable, are detailed below. |
| (e) | The annual effective rates represent actual fees incurred under the distribution plan for the six months ended November 30, 2024 based on each class's average daily net assets. MFD has voluntarily agreed to rebate a portion of each class's 0.25% service fee attributable to accounts for which there is no financial intermediary specified on the account except for accounts attributable to MFS or its affiliates' seed money. There were no service fee rebates for the year ended November 30, 2024. For the period from October 1, 2024 through November 30, 2024, the 0.75% distribution fee was not imposed for Class R1 shares due to the sales charge limitations contained in Financial Industry Regulatory Authority (“FINRA”) Rule 2341. |
| Amount | |
| Class A | $39 |
| Class B | 21 |
| Class C | 267 |
| Date | Transaction | Class | Shares | Amount |
| 8/19/2024 | Redemption | Class A | 3 | $45 |
| 8/19/2024 | Redemption | Class C | 3 | 38 |
| 8/19/2024 | Redemption | Class I | 3 | 40 |
| 8/19/2024 | Redemption | Class R3 | 2 | 36 |
| Six months ended 11/30/24 | Year ended 5/31/24 | ||||
| Shares | Amount | Shares | Amount | ||
| Shares sold | |||||
| Class A | 971,831 | $14,927,476 | 1,053,413 | $13,910,097 | |
| Class B | 5,678 | 83,965 | — | (1) | |
| Class C | 52,844 | 804,154 | 61,634 | 770,384 | |
| Class I | 8,411,464 | 128,044,103 | 6,233,164 | 81,741,399 | |
| Class R1 | 99 | 1,407 | 145 | 1,903 | |
| Class R2 | 2,412 | 36,047 | 11,437 | 144,326 | |
| Class R3 | 170,067 | 2,520,195 | 213,258 | 2,915,056 | |
| Class R4 | 13,320 | 198,324 | 17,299 | 222,657 | |
| Class R6 | 5,601,318 | 86,209,312 | 6,590,295 | 86,900,001 | |
| 15,229,033 | $232,824,983 | 14,180,645 | $186,605,822 | ||
| Shares issued to shareholders in reinvestment of distributions | |||||
| Class A | — | $— | 53,637 | $700,501 | |
| Class B | — | — | 209 | 2,692 | |
| Class C | — | — | 4,317 | 55,432 | |
| Class I | — | — | 263,322 | 3,415,290 | |
| Class R1 | — | — | 172 | 2,218 | |
| Class R2 | — | — | 740 | 9,563 | |
| Class R3 | — | — | 3,213 | 41,666 | |
| Class R4 | — | — | 1,813 | 23,572 | |
| Class R6 | — | — | 717,903 | 9,332,740 | |
| — | $— | 1,045,326 | $13,583,674 | ||
| Six months ended 11/30/24 | Year ended 5/31/24 | ||||
| Shares | Amount | Shares | Amount | ||
| Shares reacquired | |||||
| Class A | (357,544) | $(5,384,232) | (1,071,588) | $(13,402,085) | |
| Class B | (9,679) | (137,528) | (2,669) | (31,215) | |
| Class C | (46,556) | (707,915) | (151,237) | (1,891,851) | |
| Class I | (1,535,348) | (23,533,586) | (3,955,769) | (51,218,670) | |
| Class R1 | — | — | (513) | (6,997) | |
| Class R2 | (1,185) | (17,862) | (11,191) | (144,957) | |
| Class R3 | (31,796) | (473,487) | (59,090) | (794,145) | |
| Class R4 | (11,386) | (164,878) | (15,023) | (192,384) | |
| Class R6 | (4,844,002) | (74,642,215) | (4,846,024) | (63,402,934) | |
| (6,837,496) | $(105,061,703) | (10,113,104) | $(131,085,238) | ||
| Net change | |||||
| Class A | 614,287 | $9,543,244 | 35,462 | $1,208,513 | |
| Class B | (4,001) | (53,563) | (2,460) | (28,524) | |
| Class C | 6,288 | 96,239 | (85,286) | (1,066,035) | |
| Class I | 6,876,116 | 104,510,517 | 2,540,717 | 33,938,019 | |
| Class R1 | 99 | 1,407 | (196) | (2,876) | |
| Class R2 | 1,227 | 18,185 | 986 | 8,932 | |
| Class R3 | 138,271 | 2,046,708 | 157,381 | 2,162,577 | |
| Class R4 | 1,934 | 33,446 | 4,089 | 53,845 | |
| Class R6 | 757,316 | 11,567,097 | 2,462,174 | 32,829,807 | |
| 8,391,537 | $127,763,280 | 5,112,867 | $69,104,258 | ||
| Affiliated Issuers | Beginning Value | Purchases | Sales Proceeds | Realized Gain (Loss) | Change in Unrealized Appreciation or Depreciation | Ending Value |
| MFS Institutional Money Market Portfolio | $8,781,307 | $99,026,016 | $99,454,529 | $519 | $(319) | $8,352,994 |
| Affiliated Issuers | Dividend Income | Capital Gain Distributions |
| MFS Institutional Money Market Portfolio | $210,990 | $— |
| Number of Dollars | ||||||
| Nominee | For | Against/Withheld | Abstain | |||
| Steven E. Buller | 93,694,553,358.767 | 2,599,093,584.595 | 0.000 | |||
| John A. Caroselli | 94,028,434,411.278 | 2,265,212,532.084 | 0.000 | |||
| Maureen R. Goldfarb | 94,361,674,360.213 | 1,931,972,583.149 | 0.000 | |||
| Peter D. Jones | 94,066,354,687.369 | 2,227,292,255.993 | 0.000 | |||
| John P. Kavanaugh | 94,185,926,082.433 | 2,107,559,444.381 | 161,416.548 | |||
| James W. Kilman, Jr. | 94,450,795,713.326 | 1,842,851,230.036 | 0.000 | |||
| Clarence Otis, Jr. | 93,984,248,122.457 | 2,309,398,820.905 | 0.000 | |||
| Michael W. Roberge | 94,352,210,986.123 | 1,941,435,957.239 | 0.000 | |||
| Maryanne L. Roepke | 94,413,451,878.996 | 1,880,195,064.366 | 0.000 | |||
| Paula E. Smith | 94,545,454,781.292 | 1,748,192,162.070 | 0.000 | |||
| Laurie J. Thomsen | 94,416,793,826.848 | 1,876,853,116.514 | 0.000 | |||
| Darrell A. Williams | 94,451,319,166.310 | 1,842,327,777.051 | 0.000 | |||
| Issuer | Shares/Par | Value ($) | ||
| Bonds – 3.5% | ||||
| U.S. Treasury Obligations – 3.5% | ||||
| U.S. Treasury Notes, 4.25%, 12/31/2024 (f) | $ | 400,000 | $ 399,855 | |
| U.S. Treasury Notes, 3.875%, 3/31/2025 (f) | 400,000 | 399,215 | ||
| U.S. Treasury Notes, 4.625%, 6/30/2025 (f) | 350,000 | 350,390 | ||
| Total Bonds (Identified Cost, $1,149,352) | $1,149,460 | |||
| Investment Companies (h) – 96.8% | ||||
| International Stock Funds – 30.3% | ||||
| MFS International Equity Fund - Class R6 | 286,339 | $10,047,638 | ||
| U.S. Stock Funds – 60.5% | ||||
| MFS Growth Fund - Class R6 | 43,702 | $10,029,171 | ||
| MFS Value Fund - Class R6 | 179,900 | 10,022,230 | ||
| $20,051,401 | ||||
| Money Market Funds – 6.0% | ||||
| MFS Institutional Money Market Portfolio, 4.66% (v) | 1,971,472 | $ 1,971,669 | ||
| Total Investment Companies (Identified Cost, $16,240,191) | $32,070,708 | |||
| Underlying/Expiration Date/Exercise Price | Put/Call | Counterparty | Notional Amount | Par Amount/ Number of Contracts | |
| Purchased Options – 0.1% | |||||
| Market Index Securities – 0.1% | |||||
| S&P 500 Index – December 2024 @ $4,200 | Put | Exchange Traded | $ 2,412,952 | 4 | $ 240 |
| S&P 500 Index – December 2024 @ $4,400 | Put | Exchange Traded | 3,016,190 | 5 | 525 |
| S&P 500 Index – March 2025 @ $5,000 | Put | Exchange Traded | 2,412,952 | 4 | 8,280 |
| S&P 500 Index – June 2025 @ $4,900 | Put | Exchange Traded | 1,809,714 | 3 | 11,820 |
| S&P 500 Index – September 2025 @ $4,600 | Put | Exchange Traded | 2,412,952 | 4 | 17,880 |
| Total Purchased Options (Premiums Paid, $196,380) | $38,745 | ||||
| Other Assets, Less Liabilities – (0.4)% | (135,928) | ||||
| Net Assets – 100.0% | $33,122,985 | ||||
| (f) | All or a portion of the security has been segregated as collateral for open futures contracts. | |||
| (h) | An affiliated issuer, which may be considered one in which the fund owns 5% or more of the outstanding voting securities, or a company which is under common control. At period end, the aggregate values of the fund's investments in affiliated issuers and in unaffiliated issuers were $32,070,708 and $1,188,205, respectively. | |||
| (v) | Affiliated issuer that is available only to investment companies managed by MFS. The rate quoted for the MFS Institutional Money Market Portfolio is the annualized seven-day yield of the fund at period end. |
| Derivative Contracts at 11/30/24 | ||||||
| Futures Contracts | ||||||
| Description | Long/ Short | Currency | Contracts | Notional Amount | Expiration Date | Value/Unrealized Appreciation (Depreciation) |
| Asset Derivatives | ||||||
| Equity Futures | ||||||
| Mini MSCI EAFE Index | Short | USD | 40 | $4,663,400 | December – 2024 | $199,498 |
| Liability Derivatives | ||||||
| Equity Futures | ||||||
| Mini Russell 1000 Growth Index | Short | USD | 38 | $7,644,270 | December – 2024 | $(541,978) |
| Mini Russell 1000 Value Index | Short | USD | 47 | 4,620,805 | December – 2024 | (290,111) |
| $(832,089) | ||||||
| Financial Statements | Statement of Assets and Liabilities |
| At 11/30/24 (unaudited)Assets | |
| Investments in unaffiliated issuers, at value (identified cost, $1,345,732) | $1,188,205 |
| Investments in affiliated issuers, at value (identified cost, $16,240,191) | 32,070,708 |
| Receivables for | |
| Investments sold | 34,585 |
| Fund shares sold | 1,528 |
| Interest | 16,528 |
| Receivable from investment adviser | 14,401 |
| Total assets | $33,325,955 |
| Liabilities | |
| Payables for | |
| Net daily variation margin on open futures contracts | $115,282 |
| Fund shares reacquired | 919 |
| Payable to affiliates | |
| Administrative services fee | 192 |
| Shareholder servicing costs | 8,811 |
| Distribution and service fees | 321 |
| Payable for independent Trustees' compensation | 34 |
| Accrued expenses and other liabilities | 77,411 |
| Total liabilities | $202,970 |
| Net assets | $33,122,985 |
| Net assets consist of | |
| Paid-in capital | $25,872,091 |
| Total distributable earnings (loss) | 7,250,894 |
| Net assets | $33,122,985 |
| Shares of beneficial interest outstanding | 2,605,548 |
| Net assets | Shares outstanding | Net asset value per share (a) | |
| Class A | $3,583,312 | 281,010 | $12.75 |
| Class B | 68,537 | 5,683 | 12.06 |
| Class C | 1,854,460 | 154,576 | 12.00 |
| Class I | 24,809,838 | 1,943,965 | 12.76 |
| Class R1 | 62,570 | 5,187 | 12.06 |
| Class R2 | 65,577 | 5,230 | 12.54 |
| Class R3 | 67,072 | 5,286 | 12.69 |
| Class R4 | 68,610 | 5,382 | 12.75 |
| Class R6 | 2,543,009 | 199,229 | 12.76 |
| (a) | Maximum offering price per share was equal to the net asset value per share for all share classes, except for Class A, for which the maximum offering price per share was $13.53 [100 / 94.25 x $12.75]. On sales of $50,000 or more, the maximum offering price of Class A shares is reduced. A contingent deferred sales charge may be imposed on redemptions of Class A, Class B, and Class C shares. Redemption price per share was equal to the net asset value per share for Classes I, R1, R2, R3, R4, and R6. |
| Financial Statements | Statement of Operations |
| Six months ended 11/30/24 (unaudited)Net investment income (loss) | |
| Income | |
| Dividends from affiliated issuers | $179,230 |
| Interest | 31,677 |
| Other | 17 |
| Total investment income | $210,924 |
| Expenses | |
| Management fee | $67,149 |
| Distribution and service fees | 14,759 |
| Shareholder servicing costs | 15,810 |
| Administrative services fee | 8,775 |
| Independent Trustees' compensation | 1,526 |
| Custodian fee | 4,840 |
| Shareholder communications | 5,463 |
| Audit and tax fees | 28,485 |
| Legal fees | 115 |
| Registration fees | 62,805 |
| Miscellaneous | 24,702 |
| Total expenses | $234,429 |
| Reduction of expenses by investment adviser | (91,421) |
| Net expenses | $143,008 |
| Net investment income (loss) | $67,916 |
| Realized and unrealized gain (loss) | |
| Realized gain (loss) (identified cost basis) | |
| Unaffiliated issuers | $(77,884) |
| Affiliated issuers | 4,199,925 |
| Capital gain distributions from affiliated issuers | 10,596 |
| Futures contracts | (1,168,774) |
| Net realized gain (loss) | $2,963,863 |
| Change in unrealized appreciation or depreciation | |
| Unaffiliated issuers | $(14,535) |
| Affiliated issuers | (1,696,898) |
| Futures contracts | (366,114) |
| Net unrealized gain (loss) | $(2,077,547) |
| Net realized and unrealized gain (loss) | $886,316 |
| Change in net assets from operations | $954,232 |
| Financial Statements | Statements of Changes in Net Assets |
| Six months ended | Year ended | |
| 11/30/24 (unaudited) | 5/31/24 | |
| Change in net assets | ||
| From operations | ||
| Net investment income (loss) | $67,916 | $338,150 |
| Net realized gain (loss) | 2,963,863 | 4,103,229 |
| Net unrealized gain (loss) | (2,077,547) | (478,457) |
| Change in net assets from operations | $954,232 | $3,962,922 |
| Total distributions to shareholders | $— | $(320,494) |
| Change in net assets from fund share transactions | $(7,029,289) | $(23,100,820) |
| Total change in net assets | $(6,075,057) | $(19,458,392) |
| Net assets | ||
| At beginning of period | 39,198,042 | 58,656,434 |
| At end of period | $33,122,985 | $39,198,042 |
| Financial Statements | Financial Highlights |
| Class A | Six months ended | Year ended | ||||
| 11/30/24 (unaudited) | 5/31/24 | 5/31/23 | 5/31/22 | 5/31/21 | 5/31/20 | |
| Net asset value, beginning of period | $12.45 | $11.50 | $11.25 | $11.46 | $11.54 | $10.91 |
| Income (loss) from investment operations | ||||||
| Net investment income (loss) (d)(l) | $0.01 | $0.06 | $0.01 | $0.03 | $(0.01) | $0.09 |
| Net realized and unrealized gain (loss) | 0.29 | 0.95 | 0.24 | (0.24) | (0.05) | 0.60 |
| Total from investment operations | $0.30 | $1.01 | $0.25 | $(0.21) | $(0.06) | $0.69 |
| Less distributions declared to shareholders | ||||||
| From net investment income | $— | $(0.06) | $— | $— | $(0.02) | $(0.06) |
| Net asset value, end of period (x) | $12.75 | $12.45 | $11.50 | $11.25 | $11.46 | $11.54 |
| Total return (%) (r)(s)(t)(x) | 2.41(n) | 8.78 | 2.22 | (1.83) | (0.54) | 6.30 |
| Ratios (%) (to average net assets) and Supplemental data: | ||||||
| Expenses before expense reductions (h) | 1.40(a) | 1.31 | 1.02 | 0.94 | 0.91 | 1.20 |
| Expenses after expense reductions (h) | 0.92(a) | 0.93 | 0.93 | 0.92 | 0.88 | 0.74 |
| Net investment income (loss) (l) | 0.16(a) | 0.54 | 0.11 | 0.29 | (0.07) | 0.77 |
| Portfolio turnover rate | 1(n) | 6 | 19 | 19 | 50 | 28 |
| Net assets at end of period (000 omitted) | $3,583 | $3,476 | $3,646 | $10,280 | $14,339 | $12,826 |
| Class B | Six months ended | Year ended | ||||
| 11/30/24 (unaudited) | 5/31/24 | 5/31/23 | 5/31/22 | 5/31/21 | 5/31/20 | |
| Net asset value, beginning of period | $11.82 | $10.95 | $10.79 | $11.08 | $11.23 | $10.66 |
| Income (loss) from investment operations | ||||||
| Net investment income (loss) (d)(l) | $(0.04) | $(0.02) | $(0.06) | $(0.06) | $(0.09) | $(0.01) |
| Net realized and unrealized gain (loss) | 0.28 | 0.89 | 0.22 | (0.23) | (0.06) | 0.58 |
| Total from investment operations | $0.24 | $0.87 | $0.16 | $(0.29) | $(0.15) | $0.57 |
| Less distributions declared to shareholders | ||||||
| From net investment income | $— | $— | $— | $— | $— | $— |
| Net asset value, end of period (x) | $12.06 | $11.82 | $10.95 | $10.79 | $11.08 | $11.23 |
| Total return (%) (r)(s)(t)(x) | 2.03(n) | 7.95 | 1.48 | (2.62) | (1.34) | 5.35 |
| Ratios (%) (to average net assets) and Supplemental data: | ||||||
| Expenses before expense reductions (h) | 2.15(a) | 2.05 | 1.78 | 1.69 | 1.66 | 1.96 |
| Expenses after expense reductions (h) | 1.67(a) | 1.68 | 1.68 | 1.67 | 1.65 | 1.67 |
| Net investment income (loss) (l) | (0.59)(a) | (0.17) | (0.58) | (0.53) | (0.84) | (0.05) |
| Portfolio turnover rate | 1(n) | 6 | 19 | 19 | 50 | 28 |
| Net assets at end of period (000 omitted) | $69 | $67 | $71 | $80 | $74 | $75 |
| Class C | Six months ended | Year ended | ||||
| 11/30/24 (unaudited) | 5/31/24 | 5/31/23 | 5/31/22 | 5/31/21 | 5/31/20 | |
| Net asset value, beginning of period | $11.76 | $10.89 | $10.74 | $11.02 | $11.18 | $10.62 |
| Income (loss) from investment operations | ||||||
| Net investment income (loss) (d)(l) | $(0.03) | $(0.02) | $(0.06) | $(0.06) | $(0.09) | $(0.02) |
| Net realized and unrealized gain (loss) | 0.27 | 0.89 | 0.21 | (0.22) | (0.06) | 0.58 |
| Total from investment operations | $0.24 | $0.87 | $0.15 | $(0.28) | $(0.15) | $0.56 |
| Less distributions declared to shareholders | ||||||
| From net investment income | $— | $— | $— | $— | $(0.01) | $— |
| Net asset value, end of period (x) | $12.00 | $11.76 | $10.89 | $10.74 | $11.02 | $11.18 |
| Total return (%) (r)(s)(t)(x) | 2.04(n) | 7.99 | 1.40 | (2.54) | (1.35) | 5.27 |
| Ratios (%) (to average net assets) and Supplemental data: | ||||||
| Expenses before expense reductions (h) | 2.15(a) | 2.05 | 1.78 | 1.69 | 1.67 | 1.94 |
| Expenses after expense reductions (h) | 1.67(a) | 1.68 | 1.68 | 1.67 | 1.66 | 1.67 |
| Net investment income (loss) (l) | (0.58)(a) | (0.22) | (0.57) | (0.54) | (0.86) | (0.19) |
| Portfolio turnover rate | 1(n) | 6 | 19 | 19 | 50 | 28 |
| Net assets at end of period (000 omitted) | $1,854 | $1,956 | $2,369 | $3,870 | $6,363 | $2,462 |
| Class I | Six months ended | Year ended | ||||
| 11/30/24 (unaudited) | 5/31/24 | 5/31/23 | 5/31/22 | 5/31/21 | 5/31/20 | |
| Net asset value, beginning of period | $12.44 | $11.50 | $11.30 | $11.50 | $11.57 | $10.94 |
| Income (loss) from investment operations | ||||||
| Net investment income (loss) (d)(l) | $0.03 | $0.09 | $0.05 | $0.06 | $0.02 | $0.08 |
| Net realized and unrealized gain (loss) | 0.29 | 0.94 | 0.23 | (0.24) | (0.06) | 0.61 |
| Total from investment operations | $0.32 | $1.03 | $0.28 | $(0.18) | $(0.04) | $0.69 |
| Less distributions declared to shareholders | ||||||
| From net investment income | $— | $(0.09) | $(0.08) | $(0.02) | $(0.03) | $(0.06) |
| Net asset value, end of period (x) | $12.76 | $12.44 | $11.50 | $11.30 | $11.50 | $11.57 |
| Total return (%) (r)(s)(t)(x) | 2.57(n) | 9.01 | 2.49 | (1.61) | (0.37) | 6.33 |
| Ratios (%) (to average net assets) and Supplemental data: | ||||||
| Expenses before expense reductions (h) | 1.15(a) | 1.04 | 0.78 | 0.69 | 0.66 | 0.94 |
| Expenses after expense reductions (h) | 0.67(a) | 0.69 | 0.68 | 0.67 | 0.65 | 0.67 |
| Net investment income (loss) (l) | 0.43(a) | 0.77 | 0.43 | 0.54 | 0.17 | 0.67 |
| Portfolio turnover rate | 1(n) | 6 | 19 | 19 | 50 | 28 |
| Net assets at end of period (000 omitted) | $24,810 | $30,581 | $46,564 | $82,106 | $105,346 | $78,292 |
| Class R1 | Six months ended | Year ended | ||||
| 11/30/24 (unaudited) | 5/31/24 | 5/31/23 | 5/31/22 | 5/31/21 | 5/31/20 | |
| Net asset value, beginning of period | $11.82 | $10.95 | $10.80 | $11.08 | $11.23 | $10.66 |
| Income (loss) from investment operations | ||||||
| Net investment income (loss) (d)(l) | $(0.03) | $(0.02) | $(0.06) | $(0.06) | $(0.09) | $(0.01) |
| Net realized and unrealized gain (loss) | 0.27 | 0.89 | 0.21 | (0.22) | (0.06) | 0.58 |
| Total from investment operations | $0.24 | $0.87 | $0.15 | $(0.28) | $(0.15) | $0.57 |
| Less distributions declared to shareholders | ||||||
| From net investment income | $— | $— | $— | $— | $— | $— |
| Net asset value, end of period (x) | $12.06 | $11.82 | $10.95 | $10.80 | $11.08 | $11.23 |
| Total return (%) (r)(s)(t)(x) | 2.03(n) | 7.95 | 1.39 | (2.53) | (1.34) | 5.35 |
| Ratios (%) (to average net assets) and Supplemental data: | ||||||
| Expenses before expense reductions (h) | 2.15(a) | 2.06 | 1.78 | 1.68 | 1.66 | 1.96 |
| Expenses after expense reductions (h) | 1.67(a) | 1.68 | 1.68 | 1.67 | 1.65 | 1.67 |
| Net investment income (loss) (l) | (0.58)(a) | (0.19) | (0.60) | (0.51) | (0.83) | (0.10) |
| Portfolio turnover rate | 1(n) | 6 | 19 | 19 | 50 | 28 |
| Net assets at end of period (000 omitted) | $63 | $61 | $57 | $56 | $57 | $58 |
| Class R2 | Six months ended | Year ended | ||||
| 11/30/24 (unaudited) | 5/31/24 | 5/31/23 | 5/31/22 | 5/31/21 | 5/31/20 | |
| Net asset value, beginning of period | $12.26 | $11.34 | $11.15 | $11.39 | $11.48 | $10.86 |
| Income (loss) from investment operations | ||||||
| Net investment income (loss) (d)(l) | $(0.01) | $0.04 | $(0.01) | $(0.00)(w) | $(0.04) | $0.04 |
| Net realized and unrealized gain (loss) | 0.29 | 0.93 | 0.23 | (0.24) | (0.05) | 0.59 |
| Total from investment operations | $0.28 | $0.97 | $0.22 | $(0.24) | $(0.09) | $0.63 |
| Less distributions declared to shareholders | ||||||
| From net investment income | $— | $(0.05) | $(0.03) | $— | $— | $(0.01) |
| Net asset value, end of period (x) | $12.54 | $12.26 | $11.34 | $11.15 | $11.39 | $11.48 |
| Total return (%) (r)(s)(t)(x) | 2.28(n) | 8.53 | 1.94 | (2.11) | (0.78) | 5.79 |
| Ratios (%) (to average net assets) and Supplemental data: | ||||||
| Expenses before expense reductions (h) | 1.65(a) | 1.56 | 1.28 | 1.19 | 1.16 | 1.46 |
| Expenses after expense reductions (h) | 1.17(a) | 1.18 | 1.18 | 1.17 | 1.15 | 1.17 |
| Net investment income (loss) (l) | (0.09)(a) | 0.31 | (0.10) | (0.01) | (0.33) | 0.40 |
| Portfolio turnover rate | 1(n) | 6 | 19 | 19 | 50 | 28 |
| Net assets at end of period (000 omitted) | $66 | $64 | $59 | $58 | $59 | $60 |
| Class R3 | Six months ended | Year ended | ||||
| 11/30/24 (unaudited) | 5/31/24 | 5/31/23 | 5/31/22 | 5/31/21 | 5/31/20 | |
| Net asset value, beginning of period | $12.39 | $11.46 | $11.27 | $11.48 | $11.55 | $10.92 |
| Income (loss) from investment operations | ||||||
| Net investment income (loss) (d)(l) | $0.01 | $0.07 | $0.02 | $0.03 | $(0.01) | $0.07 |
| Net realized and unrealized gain (loss) | 0.29 | 0.93 | 0.22 | (0.24) | (0.06) | 0.59 |
| Total from investment operations | $0.30 | $1.00 | $0.24 | $(0.21) | $(0.07) | $0.66 |
| Less distributions declared to shareholders | ||||||
| From net investment income | $— | $(0.07) | $(0.05) | $— | $— | $(0.03) |
| Net asset value, end of period (x) | $12.69 | $12.39 | $11.46 | $11.27 | $11.48 | $11.55 |
| Total return (%) (r)(s)(t)(x) | 2.42(n) | 8.79 | 2.17 | (1.83) | (0.61) | 6.09 |
| Ratios (%) (to average net assets) and Supplemental data: | ||||||
| Expenses before expense reductions (h) | 1.40(a) | 1.31 | 1.03 | 0.94 | 0.91 | 1.21 |
| Expenses after expense reductions (h) | 0.92(a) | 0.93 | 0.93 | 0.92 | 0.90 | 0.92 |
| Net investment income (loss) (l) | 0.17(a) | 0.56 | 0.15 | 0.24 | (0.09) | 0.65 |
| Portfolio turnover rate | 1(n) | 6 | 19 | 19 | 50 | 28 |
| Net assets at end of period (000 omitted) | $67 | $65 | $60 | $59 | $60 | $60 |
| Class R4 | Six months ended | Year ended | ||||
| 11/30/24 (unaudited) | 5/31/24 | 5/31/23 | 5/31/22 | 5/31/21 | 5/31/20 | |
| Net asset value, beginning of period | $12.43 | $11.50 | $11.30 | $11.50 | $11.57 | $10.93 |
| Income (loss) from investment operations | ||||||
| Net investment income (loss) (d)(l) | $0.03 | $0.10 | $0.05 | $0.06 | $0.02 | $0.10 |
| Net realized and unrealized gain (loss) | 0.29 | 0.93 | 0.23 | (0.24) | (0.07) | 0.60 |
| Total from investment operations | $0.32 | $1.03 | $0.28 | $(0.18) | $(0.05) | $0.70 |
| Less distributions declared to shareholders | ||||||
| From net investment income | $— | $(0.10) | $(0.08) | $(0.02) | $(0.02) | $(0.06) |
| Net asset value, end of period (x) | $12.75 | $12.43 | $11.50 | $11.30 | $11.50 | $11.57 |
| Total return (%) (r)(s)(t)(x) | 2.57(n) | 9.01 | 2.51 | (1.60) | (0.40) | 6.43 |
| Ratios (%) (to average net assets) and Supplemental data: | ||||||
| Expenses before expense reductions (h) | 1.15(a) | 1.06 | 0.78 | 0.69 | 0.66 | 0.96 |
| Expenses after expense reductions (h) | 0.67(a) | 0.68 | 0.68 | 0.67 | 0.65 | 0.67 |
| Net investment income (loss) (l) | 0.41(a) | 0.81 | 0.40 | 0.49 | 0.16 | 0.90 |
| Portfolio turnover rate | 1(n) | 6 | 19 | 19 | 50 | 28 |
| Net assets at end of period (000 omitted) | $69 | $67 | $61 | $60 | $61 | $61 |
| Class R6 | Six months ended | Year ended | ||||
| 11/30/24 (unaudited) | 5/31/24 | 5/31/23 | 5/31/22 | 5/31/21 | 5/31/20 | |
| Net asset value, beginning of period | $12.44 | $11.50 | $11.31 | $11.51 | $11.57 | $10.93 |
| Income (loss) from investment operations | ||||||
| Net investment income (loss) (d)(l) | $0.03 | $0.10 | $0.06 | $0.07 | $0.04 | $0.09 |
| Net realized and unrealized gain (loss) | 0.29 | 0.95 | 0.22 | (0.24) | (0.07) | 0.61 |
| Total from investment operations | $0.32 | $1.05 | $0.28 | $(0.17) | $(0.03) | $0.70 |
| Less distributions declared to shareholders | ||||||
| From net investment income | $— | $(0.11) | $(0.09) | $(0.03) | $(0.03) | $(0.06) |
| Net asset value, end of period (x) | $12.76 | $12.44 | $11.50 | $11.31 | $11.51 | $11.57 |
| Total return (%) (r)(s)(t)(x) | 2.57(n) | 9.18 | 2.50 | (1.53) | (0.27) | 6.44 |
| Ratios (%) (to average net assets) and Supplemental data: | ||||||
| Expenses before expense reductions (h) | 1.08(a) | 0.97 | 0.70 | 0.61 | 0.59 | 0.91 |
| Expenses after expense reductions (h) | 0.60(a) | 0.62 | 0.60 | 0.59 | 0.58 | 0.62 |
| Net investment income (loss) (l) | 0.50(a) | 0.81 | 0.51 | 0.59 | 0.32 | 0.84 |
| Portfolio turnover rate | 1(n) | 6 | 19 | 19 | 50 | 28 |
| Net assets at end of period (000 omitted) | $2,543 | $2,860 | $5,768 | $7,125 | $7,366 | $14,345 |
| (a) | Annualized. |
| (d) | Per share data is based on average shares outstanding. |
| (h) | In addition to the fees and expenses which the fund bears directly, the fund indirectly bears a pro rata share of the fees and expenses of the underlying affiliated funds in which the fund invests. Accordingly, the expense ratio for the fund reflects only those fees and expenses borne directly by the fund. Because the underlying affiliated funds have varied expense and fee levels and the fund may own different proportions of the underlying affiliated funds at different times, the amount of fees and expenses incurred indirectly by the fund will vary. |
| (l) | The ratios and per share amounts do not include net investment income of the underlying affiliated funds in which the fund invests. |
| (n) | Not annualized. |
| (r) | Certain expenses have been reduced without which performance would have been lower. |
| (s) | From time to time the fund may receive proceeds from litigation settlements, without which performance would be lower. |
| (t) | Total returns do not include any applicable sales charges. |
| (w) | Per share amount was less than $0.01. |
| (x) | The net asset values and total returns have been calculated on net assets which include adjustments made in accordance with U.S. generally accepted accounting principles required at period end for financial reporting purposes. |
| Financial Instruments | Level 1 | Level 2 | Level 3 | Total |
| Equity Securities: | ||||
| United States | $20,865 | $17,880 | $— | $38,745 |
| U.S. Treasury Bonds & U.S. Government Agencies & Equivalents | — | 1,149,460 | — | 1,149,460 |
| Mutual Funds | 32,070,708 | — | — | 32,070,708 |
| Total | $32,091,573 | $1,167,340 | $— | $33,258,913 |
| Other Financial Instruments | ||||
| Futures Contracts – Assets | $199,498 | $— | $— | $199,498 |
| Futures Contracts – Liabilities | (832,089) | — | — | (832,089) |
| Fair Value (a) | |||
| Risk | Derivative Contracts | Asset Derivatives | Liability Derivatives |
| Equity | Purchased Option Contracts | $38,745 | $— |
| Equity | Futures Contracts | 199,498 | (832,089) |
| Total | $238,243 | $(832,089) | |
| Risk | Futures Contracts | Unaffiliated Issuers (Purchased Options) |
| Equity | $(1,168,774) | $(77,884) |
| Risk | Futures Contracts | Unaffiliated Issuers (Purchased Options) |
| Equity | $(366,114) | $(15,719) |
| Gross Amounts of: | Derivative Assets | Derivative Liabilities |
| Futures Contracts (a) | $— | $(115,282) |
| Purchased Options (a) | 38,745 | — |
| Total Gross Amount of Derivative Assets and Liabilities Presented in the Statement of Assets & Liabilities | $38,745 | $(115,282) |
| Less: Derivative Assets and Liabilities Not Subject to a Master Netting Agreement or Similar Arrangement | 38,745 | (115,282) |
| Total Gross Amount of Derivative Assets and Liabilities Subject to a Master Netting Agreement or Similar Arrangement | $— | $— |
| Year ended 5/31/24 | |
| Ordinary income (including any short-term capital gains) | $320,494 |
| As of 11/30/24 | |
| Cost of investments | $17,585,923 |
| Gross appreciation | 15,831,576 |
| Gross depreciation | (158,586) |
| Net unrealized appreciation (depreciation) | $15,672,990 |
| As of 5/31/24 | |
| Undistributed ordinary income | 337,214 |
| Capital loss carryforwards | (10,769,875) |
| Net unrealized appreciation (depreciation) | 16,729,323 |
| Short-Term | $(10,769,875) |
| Six months ended 11/30/24 | Year ended 5/31/24 | ||
| Class A | $— | $16,225 | |
| Class I | — | 273,385 | |
| Class R2 | — | 238 | |
| Class R3 | — | 384 | |
| Class R4 | — | 540 | |
| Class R6 | — | 29,722 | |
| Total | $— | $320,494 |
| Classes | ||||||||
| A | B | C | I | R1 | R2 | R3 | R4 | R6 |
| 0.91% | 1.66% | 1.66% | 0.66% | 1.66% | 1.16% | 0.91% | 0.66% | 0.63% |
| Distribution Fee Rate (d) | Service Fee Rate (d) | Total Distribution Plan (d) | Annual Effective Rate (e) | Distribution and Service Fee | |
| Class A | — | 0.25% | 0.25% | 0.25% | $ 4,364 |
| Class B | 0.75% | 0.25% | 1.00% | 1.00% | 341 |
| Class C | 0.75% | 0.25% | 1.00% | 1.00% | 9,495 |
| Class R1 | 0.75% | 0.25% | 1.00% | 1.00% | 312 |
| Class R2 | 0.25% | 0.25% | 0.50% | 0.50% | 164 |
| Class R3 | — | 0.25% | 0.25% | 0.25% | 83 |
| Total Distribution and Service Fees | $14,759 |
| (d) | In accordance with the distribution plan for certain classes, the fund pays distribution and/or service fees equal to these annual percentage rates of each class’s average daily net assets. The distribution and service fee rates disclosed by class represent the current rates in effect at the end of the reporting period. Any rate changes, if applicable, are detailed below. |
| (e) | The annual effective rates represent actual fees incurred under the distribution plan for the six months ended November 30, 2024 based on each class's average daily net assets. MFD has voluntarily agreed to rebate a portion of each class's 0.25% service fee attributable to accounts for which there is no financial intermediary specified on the account except for accounts attributable to MFS or its affiliates' seed money. For the six months ended November 30, 2024, there were no service fee rebates. |
| Amount | |
| Class A | $— |
| Class B | — |
| Class C | 8 |
| Date | Transaction | Class | Shares | Amount |
| 8/19/2024 | Redemption | Class A | 3 | $35 |
| 8/19/2024 | Redemption | Class C | 2 | 24 |
| 8/19/2024 | Redemption | Class I | I | 26 |
| Six months ended 11/30/24 | Year ended 5/31/24 | ||||
| Shares | Amount | Shares | Amount | ||
| Shares sold | |||||
| Class A | 38,115 | $482,975 | 38,153 | $453,764 | |
| Class C | 364 | 4,325 | 1,292 | 14,598 | |
| Class I | 84,551 | 1,065,782 | 597,871 | 7,024,801 | |
| Class R6 | 118 | 1,506 | 3,406 | 40,693 | |
| 123,148 | $1,554,588 | 640,722 | $7,533,856 | ||
| Shares issued to shareholders in reinvestment of distributions | |||||
| Class A | — | $— | 1,369 | $16,225 | |
| Class I | — | — | 22,864 | 270,477 | |
| Class R2 | — | — | 20 | 237 | |
| Class R3 | — | — | 33 | 384 | |
| Class R4 | — | — | 46 | 540 | |
| Class R6 | — | — | 29 | 349 | |
| — | $— | 24,361 | $288,212 | ||
| Six months ended 11/30/24 | Year ended 5/31/24 | ||||
| Shares | Amount | Shares | Amount | ||
| Shares reacquired | |||||
| Class A | (36,329) | $(459,323) | (77,410) | $(917,213) | |
| Class B | — | — | (842) | (9,730) | |
| Class C | (12,157) | (144,945) | (52,520) | (585,089) | |
| Class I | (598,108) | (7,587,948) | (2,212,852) | (26,182,701) | |
| Class R6 | (30,769) | (391,661) | (274,914) | (3,228,155) | |
| (677,363) | $(8,583,877) | (2,618,538) | $(30,922,888) | ||
| Net change | |||||
| Class A | 1,786 | $23,652 | (37,888) | $(447,224) | |
| Class B | — | — | (842) | (9,730) | |
| Class C | (11,793) | (140,620) | (51,228) | (570,491) | |
| Class I | (513,557) | (6,522,166) | (1,592,117) | (18,887,423) | |
| Class R2 | — | — | 20 | 237 | |
| Class R3 | — | — | 33 | 384 | |
| Class R4 | — | — | 46 | 540 | |
| Class R6 | (30,651) | (390,155) | (271,479) | (3,187,113) | |
| (554,215) | $(7,029,289) | (1,953,455) | $(23,100,820) | ||
| Affiliated Issuers | Beginning Value | Purchases | Sales Proceeds | Realized Gain (Loss) | Change in Unrealized Appreciation or Depreciation | Ending Value |
| MFS Growth Fund | $11,905,540 | $179,742 | $3,426,275 | $2,234,480 | $(864,316) | $10,029,171 |
| MFS Institutional Money Market Portfolio | 2,446,440 | 13,337,484 | 13,812,456 | 379 | (178) | 1,971,669 |
| MFS International Equity Fund | 11,924,386 | 209,654 | 2,126,483 | 808,188 | (768,107) | 10,047,638 |
| MFS Value Fund | 11,847,502 | 139,962 | 3,057,815 | 1,156,878 | (64,297) | 10,022,230 |
| $38,123,868 | $13,866,842 | $22,423,029 | $4,199,925 | $(1,696,898) | $32,070,708 |
| Affiliated Issuers | Dividend Income | Capital Gain Distributions |
| MFS Growth Fund | $18,173 | $10,596 |
| MFS Institutional Money Market Portfolio | 51,043 | — |
| MFS International Equity Fund | — | — |
| MFS Value Fund | 110,014 | — |
| $179,230 | $10,596 |
| Number of Dollars | ||||||
| Nominee | For | Against/Withheld | Abstain | |||
| Steven E. Buller | 93,694,553,358.767 | 2,599,093,584.595 | 0.000 | |||
| John A. Caroselli | 94,028,434,411.278 | 2,265,212,532.084 | 0.000 | |||
| Maureen R. Goldfarb | 94,361,674,360.213 | 1,931,972,583.149 | 0.000 | |||
| Peter D. Jones | 94,066,354,687.369 | 2,227,292,255.993 | 0.000 | |||
| John P. Kavanaugh | 94,185,926,082.433 | 2,107,559,444.381 | 161,416.548 | |||
| James W. Kilman, Jr. | 94,450,795,713.326 | 1,842,851,230.036 | 0.000 | |||
| Clarence Otis, Jr. | 93,984,248,122.457 | 2,309,398,820.905 | 0.000 | |||
| Michael W. Roberge | 94,352,210,986.123 | 1,941,435,957.239 | 0.000 | |||
| Maryanne L. Roepke | 94,413,451,878.996 | 1,880,195,064.366 | 0.000 | |||
| Paula E. Smith | 94,545,454,781.292 | 1,748,192,162.070 | 0.000 | |||
| Laurie J. Thomsen | 94,416,793,826.848 | 1,876,853,116.514 | 0.000 | |||
| Darrell A. Williams | 94,451,319,166.310 | 1,842,327,777.051 | 0.000 | |||
ITEM 12. DISCLOSURE OF PROXY VOTING POLICIES AND PROCEDURES FOR CLOSED-END MANAGEMENT INVESTMENT COMPANIES.
Not applicable to the Registrant.
ITEM 13. PORTFOLIO MANAGERS OF CLOSED-END MANAGEMENT INVESTMENT COMPANIES.
Not applicable to the Registrant.
ITEM 14. PURCHASES OF EQUITY SECURITIES BY CLOSED-END MANAGEMENT INVESTMENT COMPANY AND AFFILIATED PURCHASERS.
Not applicable to the Registrant.
ITEM 15. SUBMISSION OF MATTERS TO A VOTE OF SECURITY HOLDERS.
There were no material changes to the procedures by which shareholders may send recommendations to the Board for nominees to the Registrant’s Board since the Registrant last provided disclosure as to such procedures in response to the requirements of Item 407 (c)(2)(iv) of Regulation S-K or this Item.
ITEM 16. CONTROLS AND PROCEDURES.
Based upon their evaluation of the effectiveness of the registrant’s disclosure controls and procedures (as defined in Rule 30a-3(c) under the Investment Company Act of 1940 (the “Act”)) as conducted within 90 days of the filing date of this report on Form N-CSR, the Registrant’s principal financial officer and principal executive officer have concluded that those disclosure controls and procedures provide reasonable assurance that the material information required to be disclosed by the Registrant on this report is recorded, processed, summarized and reported within the time periods specified in the Securities and Exchange Commission’s rules and forms.
There were no changes in the Registrant’s internal controls over financial reporting (as defined in Rule 30a-3(d) under the Act) that occurred during the period covered by the report that have materially affected, or are reasonably likely to materially affect, the Registrant’s internal control over financial reporting.
ITEM 17. DISCLOSURE OF SECURITIES LENDING ACTIVITIES FOR CLOSED-END MANAGEMENT INVESTMENT COMPANIES.
Not applicable to the Registrant.
ITEM 18. RECOVERY OF ERRONEOUSLY AWARDED COMPENSATION.
Not applicable to the Registrant.
ITEM 19. EXHIBITS.
Any code of ethics, or amendment thereto, that is the subject of the disclosure required by Item 2, to the extent that the registrant intends to satisfy the Item 2 requirements through filing of an exhibit: Not applicable.
Any policy required by the listing standards adopted pursuant to Rule 10D-1 under the Exchange Act (17 CFR 240.10D-1) by the registered national securities exchange or registered national securities association upon which the registrant’s securities are listed. Not applicable.
A separate certification for each principal executive officer and principal financial officer of the registrant as required by Rule 30a-2(a) under the Act (17 CFR 270.30a-2): Attached hereto as EX-99.302CERT.
Any written solicitation to purchase securities under Rule 23c-1 under the Act (17 CFR 270.23c-1) sent or given during the period covered by the report by or on behalf of the registrant to 10 or more persons. Not applicable.
Change in the registrant's independent public accountant. Not applicable.
If the report is filed under Section 13(a) or 15(d) of the Exchange Act, provide the certifications required by Rule 30a-2(b) under the Act (17 CFR 270.30a-2(b)), Rule 13a-14(b) or Rule 15d-14(b) under the Exchange Act (17 CFR 240.13a-14(b) or 240.15d-14(b)) and Section 1350 of Chapter 63 of Title 18 of the United States Code (18 U.S.C. 1350) as an exhibit. A certification furnished pursuant to this paragraph will not be deemed “filed” for the purposes of Section 18 of the Exchange Act (15 U.S.C. 78r), or otherwise subject to the liability of that section. Such certification will not be deemed to be incorporated by reference into any filing under the Securities Act of 1933 or the Exchange Act, except to the extent that the registrant specifically incorporates it by reference. Attached hereto as EX-99.906CERT.
Notice
A copy of the Amended and Restated Declaration of Trust, as amended, of the Registrant is on file with the Secretary of State of The Commonwealth of Massachusetts and notice is hereby given that this instrument is executed on behalf of the Registrant by an officer of the Registrant as an officer and not individually and the obligations of or arising out of this instrument are not binding upon any of the Trustees or shareholders individually, but are binding only upon the assets and property of the respective constituent series of the Registrant.
SIGNATURES
Pursuant to the requirements of the Securities Exchange Act of 1934 and the Investment Company Act of 1940, the registrant has duly caused this report to be signed on its behalf by the undersigned, thereunto duly authorized.
(Registrant) MFS SERIES TRUST X
By (Signature and Title)*
/S/ DAVID L. DILORENZO
David L. DiLorenzo, President
Date: January 14, 2025
Pursuant to the requirements of the Securities Exchange Act of 1934 and the Investment Company Act of 1940, this report has been signed below by the following persons on behalf of the registrant and in the capacities and on the dates indicated.
By (Signature and Title)*
/S/ DAVID L. DILORENZO
David L. DiLorenzo, President (Principal Executive Officer)
Date: January 14, 2025
By (Signature and Title)*
/S/ KASEY L. PHILLIPS
Kasey L. Phillips, Treasurer (Principal Financial Officer and Accounting Officer)
Date: January 14, 2025
* Print name and title of each signing officer under his or her signature.