Table of Contents
UNITED STATES
SECURITIES AND EXCHANGE COMMISSION
Washington, D.C. 20549
FORM N-CSR
CERTIFIED SHAREHOLDER REPORT OF
REGISTERED MANAGEMENT INVESTMENT COMPANIES
Investment Company Act file number 811-04492
MFS SERIES TRUST X
(Exact name of registrant as specified in charter)
111 Huntington Avenue, Massachusetts 02199
(Address of principal executive offices) (Zip code)
Christopher R. Bohane
Massachusetts Financial Services Company
111 Huntington Avenue
Boston, Massachusetts 02199
(Name and address of agents for service)
Registrant’s telephone number, including area code: (617) 954-5000
Date of fiscal year end: May 31*
Date of reporting period: May 31, 2021
| * | This Form N-CSR pertains to the following series of the Registrant: MFS Aggressive Growth Allocation Fund, MFS Blended Research Growth Equity Fund, MFS Blended Research Mid Cap Equity Fund, MFS Blended Research Small Cap Equity Fund, MFS Blended Research Value Equity Fund, MFS Conservative Allocation Fund, MFS Emerging Markets Equity Fund, MFS Growth Allocation Fund, MFS International Diversification Fund, MFS International Growth Fund, MFS International Intrinsic Value Fund, MFS International Large Cap Value Fund, MFS Managed Wealth Fund, and MFS Moderate Allocation Fund. Each remaining series of the Registrant has a fiscal year end other than May 31. |
Table of Contents
| ITEM 1. | REPORTS TO STOCKHOLDERS. |
Item 1(a):
Table of Contents

Equity Fund

Table of Contents
Table of Contents
Equity Fund
| 1 | |
| 2 | |
| 4 | |
| 7 | |
| 10 | |
| 12 | |
| 16 | |
| 18 | |
| 19 | |
| 20 | |
| 26 | |
| 37 | |
| 39 | |
| 44 | |
| 45 | |
| 45 | |
| 45 | |
| 45 | |
| 45 | |
| 46 |
| back cover |
Table of Contents
Table of Contents


Table of Contents

| Taiwan Semiconductor Manufacturing Co. Ltd. | 8.1% |
| Samsung Electronics Co. Ltd. | 6.4% |
| Alibaba Group Holding Ltd., ADR | 5.5% |
| Tencent Holdings Ltd. | 3.9% |
| Prosus N.V. | 3.7% |
| Sberbank of Russia | 2.8% |
| Yum China Holdings, Inc. | 2.7% |
| NetEase.com, Inc., ADR | 2.5% |
| AIA Group Ltd. | 2.4% |
| Tata Consultancy Services Ltd. | 2.2% |
| Consumer Discretionary | 20.2% |
| Financials | 19.6% |
| Information Technology | 18.5% |
| Communication Services | 11.2% |
| Consumer Staples | 10.9% |
| Materials | 7.1% |
| Industrials | 4.2% |
| Real Estate | 2.5% |
| Energy | 2.5% |
| Health Care | 1.3% |
| Utilities | 0.4% |
| China | 28.0% |
| South Korea | 13.0% |
| India | 10.4% |
| Taiwan | 9.8% |
| Russia | 7.6% |
| Brazil | 6.1% |
| Hong Kong | 5.7% |
| Netherlands | 3.7% |
| South Africa | 2.9% |
| Other Countries | 12.8% |
| Hong Kong Dollar | 23.6% |
| South Korean Won | 13.0% |
| Taiwan Dollar | 9.8% |
| Indian Rupee | 9.4% |
| Chinese Renminbi | 7.3% |
| Russian Ruble | 7.0% |
| United States Dollar | 6.2% |
| Brazilian Real | 6.1% |
| Euro | 5.7% |
| Other Currencies | 11.9% |
Table of Contents
| (g) | The Global Industry Classification Standard (GICS®) was developed by and/or is the exclusive property of MSCI, Inc. and S&P Global Market Intelligence Inc. (“S&P Global Market Intelligence”). GICS is a service mark of MSCI and S&P Global Market Intelligence and has been licensed for use by MFS. MFS has applied its own internal sector/industry classification methodology for equity securities and non-equity securities that are unclassified by GICS. |
| (x) | Represents the portfolio’s exposure to issuer countries as a percentage of a portfolio’s net assets. For purposes of this presentation, United States (included in Other Countries) includes Cash & Cash Equivalents. |
| (y) | Represents the portfolio’s exposure to a particular currency as a percentage of a portfolio's net assets. For purposes of this presentation, United States Dollar includes Cash & Cash Equivalents. |
Table of Contents
Table of Contents
Table of Contents
| (b) | Security is not a benchmark constituent. |
| (h) | Security was not held in the portfolio at period end. |
Table of Contents
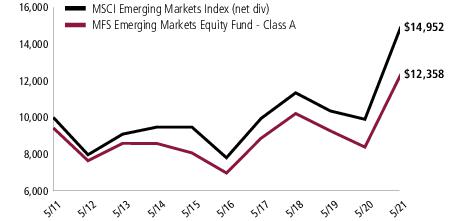
Table of Contents
| Share Class | Class Inception Date | 1-yr | 5-yr | 10-yr | Life (t) |
| A | 10/24/95 | 47.36% | 12.12% | 2.75% | N/A |
| B | 10/24/95 | 46.24% | 11.28% | 1.97% | N/A |
| C | 6/27/96 | 46.24% | 11.28% | 1.97% | N/A |
| I | 1/02/97 | 47.70% | 12.40% | 3.00% | N/A |
| R1 | 10/01/08 | 46.29% | 11.28% | 1.97% | N/A |
| R2 | 10/01/08 | 46.98% | 11.83% | 2.48% | N/A |
| R3 | 10/01/08 | 47.35% | 12.11% | 2.74% | N/A |
| R4 | 10/01/08 | 47.66% | 12.39% | 3.00% | N/A |
| R6 | 6/01/12 | 47.88% | 12.52% | N/A | 5.85% |
| MSCI Emerging Markets Index (net div) (f) | 51.00% | 13.88% | 4.10% | N/A |
| A With Initial Sales Charge (5.75%) | 38.88% | 10.80% | 2.14% | N/A |
| B With CDSC (Declining over six years from 4% to 0%) (v) | 42.24% | 11.01% | 1.97% | N/A |
| C With CDSC (1% for 12 months) (v) | 45.24% | 11.28% | 1.97% | N/A |
| (f) | Source: FactSet Research Systems Inc. |
| (t) | For the period from the class inception date through the stated period end (for those share classes with less than 10 years of performance history). No comparative benchmark performance information is provided for “life” periods. (See Notes to Performance Summary.) |
| (v) | Assuming redemption at the end of the applicable period. |
Table of Contents
| (e) | Morgan Stanley Capital International (“MSCI”) makes no express or implied warranties or representations and shall have no liability whatsoever with respect to any MSCI data contained herein. The MSCI data may not be further redistributed or used as a basis for other indices or any securities or financial products. This report is not approved, reviewed, or produced by MSCI. |
Table of Contents
December 1, 2020 through May 31, 2021
Table of Contents
| Share Class | Annualized Expense Ratio | Beginning Account Value 12/01/20 | Ending Account value 5/31/21 | Expenses Paid During Period (p) 12/01/20–5/31/21 | |
| A | Actual | 1.31% | $1,000.00 | $1,140.65 | $6.99 |
| Hypothetical (h) | 1.31% | $1,000.00 | $1,018.40 | $6.59 | |
| B | Actual | 2.06% | $1,000.00 | $1,136.23 | $10.97 |
| Hypothetical (h) | 2.06% | $1,000.00 | $1,014.66 | $10.35 | |
| C | Actual | 2.06% | $1,000.00 | $1,136.24 | $10.97 |
| Hypothetical (h) | 2.06% | $1,000.00 | $1,014.66 | $10.35 | |
| I | Actual | 1.06% | $1,000.00 | $1,141.85 | $5.66 |
| Hypothetical (h) | 1.06% | $1,000.00 | $1,019.65 | $5.34 | |
| R1 | Actual | 2.06% | $1,000.00 | $1,136.59 | $10.97 |
| Hypothetical (h) | 2.06% | $1,000.00 | $1,014.66 | $10.35 | |
| R2 | Actual | 1.56% | $1,000.00 | $1,139.14 | $8.32 |
| Hypothetical (h) | 1.56% | $1,000.00 | $1,017.15 | $7.85 | |
| R3 | Actual | 1.31% | $1,000.00 | $1,140.52 | $6.99 |
| Hypothetical (h) | 1.31% | $1,000.00 | $1,018.40 | $6.59 | |
| R4 | Actual | 1.06% | $1,000.00 | $1,141.77 | $5.66 |
| Hypothetical (h) | 1.06% | $1,000.00 | $1,019.65 | $5.34 | |
| R6 | Actual | 0.95% | $1,000.00 | $1,142.54 | $5.07 |
| Hypothetical (h) | 0.95% | $1,000.00 | $1,020.19 | $4.78 |
| (h) | 5% class return per year before expenses. |
| (p) | “Expenses Paid During Period” are equal to each class’s annualized expense ratio, as shown above, multiplied by the average account value over the period, multiplied by 182/365 (to reflect the one-half year period). Expenses paid do not include any applicable sales charges (loads). If these transaction costs had been included, your costs would have been higher. |
Table of Contents
| Issuer | Shares/Par | Value ($) | ||
| Common Stocks – 98.4% | ||||
| Airlines – 0.6% | ||||
| Shanghai International Air Co., Ltd. | 6,163,203 | $ 47,954,111 | ||
| Alcoholic Beverages – 4.7% | ||||
| Ambev S.A., ADR | 34,830,145 | $ 120,512,301 | ||
| China Resources Beer Holdings Co. Ltd. | 11,318,000 | 101,565,906 | ||
| Kweichow Moutai Co. Ltd., “A” | 359,632 | 125,407,002 | ||
| $347,485,209 | ||||
| Automotive – 3.7% | ||||
| Hero MotoCorp Ltd. | 1,444,789 | $ 59,832,737 | ||
| Mahindra & Mahindra Ltd. | 10,782,119 | 119,954,739 | ||
| PT United Tractors Tbk | 60,129,100 | 94,951,765 | ||
| $274,739,241 | ||||
| Biotechnology – 0.7% | ||||
| Hugel, Inc. (a) | 282,886 | $ 51,151,431 | ||
| Brokerage & Asset Managers – 2.2% | ||||
| B3 Brasil Bolsa Balcao S.A. | 14,778,100 | $ 49,469,984 | ||
| Moscow Exchange MICEX-RTS PJSC | 48,362,230 | 110,658,876 | ||
| $160,128,860 | ||||
| Business Services – 2.2% | ||||
| Tata Consultancy Services Ltd. | 3,774,245 | $ 164,183,360 | ||
| Chemicals – 1.4% | ||||
| UPL Ltd. | 9,483,059 | $ 106,435,903 | ||
| Computer Software - Systems – 7.6% | ||||
| Hon Hai Precision Industry Co. Ltd. | 21,181,000 | $ 87,087,249 | ||
| Samsung Electronics Co. Ltd. | 6,599,689 | 478,173,767 | ||
| $565,261,016 | ||||
| Construction – 3.2% | ||||
| Gree Electric Appliances, Inc. | 17,929,438 | $ 158,700,022 | ||
| Techtronic Industries Co. Ltd. | 4,391,000 | 81,071,230 | ||
| $239,771,252 | ||||
Table of Contents
| Issuer | Shares/Par | Value ($) | ||
| Common Stocks – continued | ||||
| Consumer Services – 2.9% | ||||
| 51job, Inc., ADR (a) | 1,307,308 | $ 93,707,838 | ||
| MakeMyTrip Ltd. (a) | 2,848,844 | 78,343,210 | ||
| New Oriental Education & Technology Group, Inc. (a) | 4,168,193 | 42,640,614 | ||
| $214,691,662 | ||||
| Electronics – 8.2% | ||||
| Taiwan Semiconductor Manufacturing Co. Ltd. | 28,104,695 | $ 607,806,662 | ||
| Energy - Integrated – 1.2% | ||||
| LUKOIL PJSC, ADR | 1,092,996 | $ 89,035,454 | ||
| Engineering - Construction – 1.2% | ||||
| Doosan Bobcat, Inc. (a) | 1,888,642 | $ 87,203,397 | ||
| Food & Beverages – 4.4% | ||||
| Gruma S.A.B. de C.V. | 5,105,655 | $ 55,617,916 | ||
| Inner Mongolia Yili Industrial Group Co. Ltd., “A” | 18,690,187 | 118,977,089 | ||
| Orion Corp. | 826,047 | 88,846,241 | ||
| Tingyi (Cayman Islands) Holding Corp. | 34,786,000 | 66,063,125 | ||
| $329,504,371 | ||||
| Forest & Paper Products – 0.6% | ||||
| Suzano S.A. (a) | 3,899,100 | $ 45,191,966 | ||
| Gaming & Lodging – 0.7% | ||||
| Kangwon Land, Inc. (a) | 1,956,376 | $ 50,624,013 | ||
| General Merchandise – 2.9% | ||||
| Bim Birlesik Magazalar A.S. | 7,744,204 | $ 58,358,150 | ||
| Lojas Renner S.A. | 11,232,298 | 100,324,741 | ||
| Walmart de Mexico S.A.B. de C.V. | 17,704,527 | 58,114,639 | ||
| $216,797,530 | ||||
| Insurance – 5.4% | ||||
| AIA Group Ltd. | 13,733,200 | $ 175,525,635 | ||
| Ping An Insurance Co. of China Ltd., “H” | 12,163,000 | 132,341,940 | ||
| Samsung Fire & Marine Insurance Co. Ltd. | 488,436 | 92,978,907 | ||
| $400,846,482 | ||||
| Internet – 13.5% | ||||
| Alibaba Group Holding Ltd., ADR (a) | 1,907,993 | $ 408,234,181 | ||
| NAVER Corp. | 377,827 | 123,272,839 | ||
| NetEase.com, Inc., ADR | 1,549,440 | 182,725,459 | ||
| Tencent Holdings Ltd. | 3,673,300 | 292,957,205 | ||
| $ 1,007,189,684 | ||||
Table of Contents
| Issuer | Shares/Par | Value ($) | ||
| Common Stocks – continued | ||||
| Leisure & Toys – 3.7% | ||||
| Prosus N.V. | 2,669,619 | $ 277,192,324 | ||
| Major Banks – 2.9% | ||||
| ABSA Group Ltd. (a) | 10,322,565 | $ 107,504,112 | ||
| China Construction Bank Corp. | 130,572,490 | 107,332,069 | ||
| $214,836,181 | ||||
| Metals & Mining – 2.3% | ||||
| Alrosa PJSC | 38,454,990 | $ 61,426,386 | ||
| Lundin Mining Corp. | 3,900,242 | 41,458,248 | ||
| Vale S.A., ADR | 3,113,335 | 66,998,969 | ||
| $169,883,603 | ||||
| Network & Telecom – 0.6% | ||||
| VTech Holdings Ltd. | 4,209,400 | $ 43,469,121 | ||
| Other Banks & Diversified Financials – 9.2% | ||||
| Banco de Chile | 337,930,841 | $ 34,946,022 | ||
| Credicorp Ltd. (a) | 364,334 | 50,084,995 | ||
| E.Sun Financial Holding Co. Ltd. | 39,349,282 | 36,420,002 | ||
| Grupo Financiero Inbursa S.A. de C.V. (a) | 24,957,942 | 25,341,255 | ||
| HDFC Bank Ltd. (a) | 3,720,838 | 77,665,080 | ||
| Housing Development Finance Corp. Ltd. | 3,815,883 | 134,137,174 | ||
| Komercni Banka A.S. (a) | 1,458,698 | 53,906,864 | ||
| Public Bank Berhad | 20,667,404 | 21,095,835 | ||
| Sberbank of Russia | 50,059,466 | 211,246,291 | ||
| Tisco Financial Group PLC | 12,738,200 | 36,295,816 | ||
| $681,139,334 | ||||
| Pharmaceuticals – 0.6% | ||||
| Genomma Lab Internacional S.A., “B” (a) | 39,514,827 | $ 41,529,837 | ||
| Precious Metals & Minerals – 2.0% | ||||
| Gold Fields Ltd., ADR | 8,741,637 | $ 105,861,224 | ||
| Polymetal International PLC | 1,737,412 | 41,875,431 | ||
| $147,736,655 | ||||
| Real Estate – 2.5% | ||||
| ESR Cayman Ltd. (a) | 18,444,200 | $ 58,340,273 | ||
| Hang Lung Properties Ltd. | 15,390,000 | 38,824,730 | ||
| Multiplan Empreendimentos Imobiliarios S.A. | 13,823,526 | 67,696,944 | ||
| Swire Properties Ltd. | 7,612,400 | 22,411,191 | ||
| $187,273,138 | ||||
Table of Contents
| Issuer | Shares/Par | Value ($) | ||
| Common Stocks – continued | ||||
| Restaurants – 2.7% | ||||
| Yum China Holdings, Inc. | 3,014,019 | $ 203,868,245 | ||
| Specialty Chemicals – 0.8% | ||||
| PTT Global Chemical PLC | 29,398,200 | $ 59,530,532 | ||
| Telecommunications - Wireless – 0.7% | ||||
| Mobile TeleSystems PJSC, ADR | 5,459,675 | $ 49,792,236 | ||
| Telephone Services – 2.5% | ||||
| Hellenic Telecommunications Organization S.A. | 7,925,268 | $ 143,529,804 | ||
| PT Telekom Indonesia | 168,872,300 | 40,680,722 | ||
| $184,210,526 | ||||
| Tobacco – 0.2% | ||||
| PT Hanjaya Mandala Sampoerna Tbk | 173,612,200 | $ 15,440,301 | ||
| Utilities - Electric Power – 0.4% | ||||
| CESC Ltd. | 3,394,333 | $ 32,002,476 | ||
| Total Common Stocks (Identified Cost, $5,581,951,851) | $7,313,906,113 | |||
| Investment Companies (h) – 1.5% | ||||
| Money Market Funds – 1.5% | ||||
| MFS Institutional Money Market Portfolio, 0.03% (v) (Identified Cost, $110,979,546) | 110,979,546 | $ 110,979,547 | ||
| Other Assets, Less Liabilities – 0.1% | 7,831,004 | |||
| Net Assets – 100.0% | $7,432,716,664 | |||
| (a) | Non-income producing security. | |||
| (h) | An affiliated issuer, which may be considered one in which the fund owns 5% or more of the outstanding voting securities, or a company which is under common control. At period end, the aggregate values of the fund's investments in affiliated issuers and in unaffiliated issuers were $110,979,547 and $7,313,906,113, respectively. | |||
| (v) | Affiliated issuer that is available only to investment companies managed by MFS. The rate quoted for the MFS Institutional Money Market Portfolio is the annualized seven-day yield of the fund at period end. |
| The following abbreviations are used in this report and are defined: | |
| ADR | American Depositary Receipt |
Table of Contents
| Assets | |
| Investments in unaffiliated issuers, at value (identified cost, $5,581,951,851) | $7,313,906,113 |
| Investments in affiliated issuers, at value (identified cost, $110,979,546) | 110,979,547 |
| Cash | 1,508,929 |
| Foreign currency, at value (identified cost, $3,025,378) | 3,026,383 |
| Receivables for | |
| Investments sold | 837,735 |
| Fund shares sold | 2,836,359 |
| Dividends | 21,689,322 |
| Other assets | 9,440 |
| Total assets | $7,454,793,828 |
| Liabilities | |
| Payables for | |
| Investments purchased | $1,881,938 |
| Fund shares reacquired | 351,586 |
| Payable to affiliates | |
| Investment adviser | 674,802 |
| Administrative services fee | 7,722 |
| Shareholder servicing costs | 158,686 |
| Distribution and service fees | 9,223 |
| Payable for independent Trustees' compensation | 12 |
| Deferred country tax expense payable | 17,408,963 |
| Accrued expenses and other liabilities | 1,584,232 |
| Total liabilities | $22,077,164 |
| Net assets | $7,432,716,664 |
| Net assets consist of | |
| Paid-in capital | $5,859,092,475 |
| Total distributable earnings (loss) | 1,573,624,189 |
| Net assets | $7,432,716,664 |
| Shares of beneficial interest outstanding | 170,560,909 |
Table of Contents
| Net assets | Shares outstanding | Net asset value per share (a) | |
| Class A | $204,557,325 | 4,943,863 | $41.38 |
| Class B | 2,395,910 | 63,314 | 37.84 |
| Class C | 10,467,409 | 283,576 | 36.91 |
| Class I | 168,060,781 | 3,851,688 | 43.63 |
| Class R1 | 724,579 | 19,902 | 36.41 |
| Class R2 | 4,226,881 | 112,183 | 37.68 |
| Class R3 | 5,103,035 | 123,957 | 41.17 |
| Class R4 | 3,036,968 | 73,634 | 41.24 |
| Class R6 | 7,034,143,776 | 161,088,792 | 43.67 |
| (a) | Maximum offering price per share was equal to the net asset value per share for all share classes, except for Class A, for which the maximum offering price per share was $43.90 [100 / 94.25 x $41.38]. On sales of $50,000 or more, the maximum offering price of Class A shares is reduced. A contingent deferred sales charge may be imposed on redemptions of Class A, Class B, and Class C shares. Redemption price per share was equal to the net asset value per share for Classes I, R1, R2, R3, R4, and R6. |
Table of Contents
| Net investment income (loss) | |
| Income | |
| Dividends | $138,223,864 |
| Other | 1,133,066 |
| Dividends from affiliated issuers | 97,787 |
| Interest | 11,698 |
| Foreign taxes withheld | (18,237,625) |
| Total investment income | $121,228,790 |
| Expenses | |
| Management fee | $50,997,129 |
| Distribution and service fees | 570,108 |
| Shareholder servicing costs | 511,232 |
| Administrative services fee | 551,015 |
| Independent Trustees' compensation | 63,706 |
| Custodian fee | 2,827,638 |
| Shareholder communications | 53,454 |
| Audit and tax fees | 116,028 |
| Legal fees | 36,740 |
| Miscellaneous | 439,010 |
| Total expenses | $56,166,060 |
| Reduction of expenses by investment adviser and distributor | (1,821,331) |
| Net expenses | $54,344,729 |
| Net investment income (loss) | $66,884,061 |
| Realized and unrealized gain (loss) | |
| Realized gain (loss) (identified cost basis) | |
| Unaffiliated issuers (net of $5,793 country tax) | $183,513,617 |
| Affiliated issuers | (5,594) |
| Foreign currency | (2,297,373) |
| Net realized gain (loss) | $181,210,650 |
| Change in unrealized appreciation or depreciation | |
| Unaffiliated issuers (net of $17,408,963 increase in deferred country tax) | $1,745,287,943 |
| Affiliated issuers | (884) |
| Translation of assets and liabilities in foreign currencies | 52,718 |
| Net unrealized gain (loss) | $1,745,339,777 |
| Net realized and unrealized gain (loss) | $1,926,550,427 |
| Change in net assets from operations | $1,993,434,488 |
Table of Contents
| Year ended | ||
| 5/31/21 | 5/31/20 | |
| Change in net assets | ||
| From operations | ||
| Net investment income (loss) | $66,884,061 | $68,641,755 |
| Net realized gain (loss) | 181,210,650 | (284,327,630) |
| Net unrealized gain (loss) | 1,745,339,777 | (169,737,645) |
| Change in net assets from operations | $1,993,434,488 | $(385,423,520) |
| Total distributions to shareholders | $(46,750,489) | $(68,825,844) |
| Change in net assets from fund share transactions | $1,909,499,768 | $1,989,747,868 |
| Total change in net assets | $3,856,183,767 | $1,535,498,504 |
| Net assets | ||
| At beginning of period | 3,576,532,897 | 2,041,034,393 |
| At end of period | $7,432,716,664 | $3,576,532,897 |
Table of Contents
| Class A | Year ended | ||||
| 5/31/21 | 5/31/20 | 5/31/19 | 5/31/18 | 5/31/17 | |
| Net asset value, beginning of period | $28.13 | $31.63 | $34.99 | $30.39 | $24.05 |
| Income (loss) from investment operations | |||||
| Net investment income (loss) (d) | $0.33 | $0.58 | $0.24 | $0.10 | $0.16(c) |
| Net realized and unrealized gain (loss) | 13.12 | (3.50) | (3.46) | 4.53 | 6.32 |
| Total from investment operations | $13.45 | $(2.92) | $(3.22) | $4.63 | $6.48 |
| Less distributions declared to shareholders | |||||
| From net investment income | $(0.20) | $(0.58) | $(0.14) | $(0.03) | $(0.14) |
| Net asset value, end of period (x) | $41.38 | $28.13 | $31.63 | $34.99 | $30.39 |
| Total return (%) (r)(s)(t)(x) | 47.89 | (9.55) | (9.19) | 15.24 | 27.04(c) |
| Ratios (%) (to average net assets) and Supplemental data: | |||||
| Expenses before expense reductions (f) | 1.34 | 1.39 | 1.44 | 1.49 | 1.63(c) |
| Expenses after expense reductions (f) | 1.31 | 1.30 | 1.42 | 1.48 | 1.61(c) |
| Net investment income (loss) | 0.89 | 1.82 | 0.72 | 0.28 | 0.60(c) |
| Portfolio turnover | 37 | 32 | 27 | 24 | 43 |
| Net assets at end of period (000 omitted) | $204,557 | $118,726 | $120,862 | $154,713 | $116,512 |
Table of Contents
| Class B | Year ended | ||||
| 5/31/21 | 5/31/20 | 5/31/19 | 5/31/18 | 5/31/17 | |
| Net asset value, beginning of period | $25.78 | $29.01 | $32.18 | $28.15 | $22.32 |
| Income (loss) from investment operations | |||||
| Net investment income (loss) (d) | $0.05 | $0.35 | $(0.01) | $(0.15) | $(0.05)(c) |
| Net realized and unrealized gain (loss) | 12.01 | (3.26) | (3.16) | 4.18 | 5.88 |
| Total from investment operations | $12.06 | $(2.91) | $(3.17) | $4.03 | $5.83 |
| Less distributions declared to shareholders | |||||
| From net investment income | $— | $(0.32) | $— | $— | $— |
| Net asset value, end of period (x) | $37.84 | $25.78 | $29.01 | $32.18 | $28.15 |
| Total return (%) (r)(s)(t)(x) | 46.78 | (10.24) | (9.85) | 14.32 | 26.12(c) |
| Ratios (%) (to average net assets) and Supplemental data: | |||||
| Expenses before expense reductions (f) | 2.09 | 2.13 | 2.19 | 2.24 | 2.38(c) |
| Expenses after expense reductions (f) | 2.06 | 2.06 | 2.17 | 2.23 | 2.37(c) |
| Net investment income (loss) | 0.16 | 1.19 | (0.04) | (0.48) | (0.20)(c) |
| Portfolio turnover | 37 | 32 | 27 | 24 | 43 |
| Net assets at end of period (000 omitted) | $2,396 | $2,393 | $3,672 | $5,385 | $5,786 |
| Class C | Year ended | ||||
| 5/31/21 | 5/31/20 | 5/31/19 | 5/31/18 | 5/31/17 | |
| Net asset value, beginning of period | $25.15 | $28.33 | $31.42 | $27.49 | $21.80 |
| Income (loss) from investment operations | |||||
| Net investment income (loss) (d) | $0.06 | $0.33 | $(0.01) | $(0.15) | $(0.05)(c) |
| Net realized and unrealized gain (loss) | 11.70 | (3.17) | (3.08) | 4.08 | 5.74 |
| Total from investment operations | $11.76 | $(2.84) | $(3.09) | $3.93 | $5.69 |
| Less distributions declared to shareholders | |||||
| From net investment income | $— | $(0.34) | $— | $— | $— |
| Net asset value, end of period (x) | $36.91 | $25.15 | $28.33 | $31.42 | $27.49 |
| Total return (%) (r)(s)(t)(x) | 46.76 | (10.23) | (9.83) | 14.30 | 26.10(c) |
| Ratios (%) (to average net assets) and Supplemental data: | |||||
| Expenses before expense reductions (f) | 2.09 | 2.13 | 2.19 | 2.24 | 2.38(c) |
| Expenses after expense reductions (f) | 2.06 | 2.06 | 2.17 | 2.23 | 2.37(c) |
| Net investment income (loss) | 0.18 | 1.16 | (0.04) | (0.49) | (0.21)(c) |
| Portfolio turnover | 37 | 32 | 27 | 24 | 43 |
| Net assets at end of period (000 omitted) | $10,467 | $10,082 | $14,116 | $17,790 | $22,567 |
Table of Contents
| Class I | Year ended | ||||
| 5/31/21 | 5/31/20 | 5/31/19 | 5/31/18 | 5/31/17 | |
| Net asset value, beginning of period | $29.64 | $33.29 | $36.85 | $32.00 | $25.31 |
| Income (loss) from investment operations | |||||
| Net investment income (loss) (d) | $0.43 | $0.66 | $0.32 | $0.21 | $0.21(c) |
| Net realized and unrealized gain (loss) | 13.84 | (3.65) | (3.63) | 4.74 | 6.69 |
| Total from investment operations | $14.27 | $(2.99) | $(3.31) | $4.95 | $6.90 |
| Less distributions declared to shareholders | |||||
| From net investment income | $(0.28) | $(0.66) | $(0.25) | $(0.10) | $(0.21) |
| Net asset value, end of period (x) | $43.63 | $29.64 | $33.29 | $36.85 | $32.00 |
| Total return (%) (r)(s)(t)(x) | 48.24 | (9.32) | (8.96) | 15.48 | 27.41(c) |
| Ratios (%) (to average net assets) and Supplemental data: | |||||
| Expenses before expense reductions (f) | 1.09 | 1.15 | 1.20 | 1.24 | 1.38(c) |
| Expenses after expense reductions (f) | 1.06 | 1.06 | 1.17 | 1.23 | 1.36(c) |
| Net investment income (loss) | 1.11 | 1.98 | 0.92 | 0.59 | 0.74(c) |
| Portfolio turnover | 37 | 32 | 27 | 24 | 43 |
| Net assets at end of period (000 omitted) | $168,061 | $94,350 | $69,443 | $62,565 | $33,855 |
| Class R1 | Year ended | ||||
| 5/31/21 | 5/31/20 | 5/31/19 | 5/31/18 | 5/31/17 | |
| Net asset value, beginning of period | $24.80 | $27.97 | $31.17 | $27.26 | $21.62 |
| Income (loss) from investment operations | |||||
| Net investment income (loss) (d) | $0.05 | $0.30 | $(0.05) | $(0.14) | $(0.05)(c) |
| Net realized and unrealized gain (loss) | 11.56 | (3.09) | (3.04) | 4.05 | 5.69 |
| Total from investment operations | $11.61 | $(2.79) | $(3.09) | $3.91 | $5.64 |
| Less distributions declared to shareholders | |||||
| From net investment income | $— | $(0.38) | $(0.11) | $— | $— |
| Net asset value, end of period (x) | $36.41 | $24.80 | $27.97 | $31.17 | $27.26 |
| Total return (%) (r)(s)(t)(x) | 46.81 | (10.22) | (9.89) | 14.34 | 26.09(c) |
| Ratios (%) (to average net assets) and Supplemental data: | |||||
| Expenses before expense reductions (f) | 2.09 | 2.14 | 2.19 | 2.24 | 2.38(c) |
| Expenses after expense reductions (f) | 2.06 | 2.06 | 2.17 | 2.24 | 2.37(c) |
| Net investment income (loss) | 0.16 | 1.08 | (0.18) | (0.45) | (0.23)(c) |
| Portfolio turnover | 37 | 32 | 27 | 24 | 43 |
| Net assets at end of period (000 omitted) | $725 | $1,742 | $1,844 | $637 | $457 |
Table of Contents
| Class R2 | Year ended | ||||
| 5/31/21 | 5/31/20 | 5/31/19 | 5/31/18 | 5/31/17 | |
| Net asset value, beginning of period | $25.64 | $28.87 | $31.96 | $27.81 | $22.05 |
| Income (loss) from investment operations | |||||
| Net investment income (loss) (d) | $0.22 | $0.49 | $0.14 | $0.01 | $0.05(c) |
| Net realized and unrealized gain (loss) | 11.94 | (3.22) | (3.15) | 4.14 | 5.82 |
| Total from investment operations | $12.16 | $(2.73) | $(3.01) | $4.15 | $5.87 |
| Less distributions declared to shareholders | |||||
| From net investment income | $(0.12) | $(0.50) | $(0.08) | $— | $(0.11) |
| Net asset value, end of period (x) | $37.68 | $25.64 | $28.87 | $31.96 | $27.81 |
| Total return (%) (r)(s)(t)(x) | 47.47 | (9.76) | (9.42) | 14.92 | 26.72(c) |
| Ratios (%) (to average net assets) and Supplemental data: | |||||
| Expenses before expense reductions (f) | 1.59 | 1.63 | 1.69 | 1.74 | 1.88(c) |
| Expenses after expense reductions (f) | 1.56 | 1.56 | 1.67 | 1.73 | 1.87(c) |
| Net investment income (loss) | 0.67 | 1.68 | 0.48 | 0.03 | 0.21(c) |
| Portfolio turnover | 37 | 32 | 27 | 24 | 43 |
| Net assets at end of period (000 omitted) | $4,227 | $3,431 | $4,614 | $6,067 | $4,643 |
| Class R3 | Year ended | ||||
| 5/31/21 | 5/31/20 | 5/31/19 | 5/31/18 | 5/31/17 | |
| Net asset value, beginning of period | $27.95 | $31.47 | $34.84 | $30.27 | $23.94 |
| Income (loss) from investment operations | |||||
| Net investment income (loss) (d) | $0.41 | $0.51 | $0.21 | $0.09 | $0.16(c) |
| Net realized and unrealized gain (loss) | 12.96 | (3.41) | (3.42) | 4.51 | 6.29 |
| Total from investment operations | $13.37 | $(2.90) | $(3.21) | $4.60 | $6.45 |
| Less distributions declared to shareholders | |||||
| From net investment income | $(0.15) | $(0.62) | $(0.16) | $(0.03) | $(0.12) |
| Net asset value, end of period (x) | $41.17 | $27.95 | $31.47 | $34.84 | $30.27 |
| Total return (%) (r)(s)(t)(x) | 47.89 | (9.55) | (9.19) | 15.20 | 27.06(c) |
| Ratios (%) (to average net assets) and Supplemental data: | |||||
| Expenses before expense reductions (f) | 1.34 | 1.39 | 1.44 | 1.49 | 1.63(c) |
| Expenses after expense reductions (f) | 1.31 | 1.31 | 1.42 | 1.48 | 1.62(c) |
| Net investment income (loss) | 1.13 | 1.64 | 0.66 | 0.26 | 0.61(c) |
| Portfolio turnover | 37 | 32 | 27 | 24 | 43 |
| Net assets at end of period (000 omitted) | $5,103 | $6,246 | $2,405 | $2,465 | $2,072 |
Table of Contents
| Class R4 | Year ended | ||||
| 5/31/21 | 5/31/20 | 5/31/19 | 5/31/18 | 5/31/17 | |
| Net asset value, beginning of period | $28.03 | $31.47 | $34.85 | $30.26 | $23.96 |
| Income (loss) from investment operations | |||||
| Net investment income (loss) (d) | $0.43 | $0.81 | $0.30 | $0.17 | $0.21(c) |
| Net realized and unrealized gain (loss) | 13.06 | (3.63) | (3.43) | 4.52 | 6.30 |
| Total from investment operations | $13.49 | $(2.82) | $(3.13) | $4.69 | $6.51 |
| Less distributions declared to shareholders | |||||
| From net investment income | $(0.28) | $(0.62) | $(0.25) | $(0.10) | $(0.21) |
| Net asset value, end of period (x) | $41.24 | $28.03 | $31.47 | $34.85 | $30.26 |
| Total return (%) (r)(s)(t)(x) | 48.20 | (9.31) | (8.97) | 15.52 | 27.32(c) |
| Ratios (%) (to average net assets) and Supplemental data: | |||||
| Expenses before expense reductions (f) | 1.09 | 1.13 | 1.19 | 1.24 | 1.38(c) |
| Expenses after expense reductions (f) | 1.06 | 1.06 | 1.17 | 1.23 | 1.37(c) |
| Net investment income (loss) | 1.20 | 2.54 | 0.93 | 0.49 | 0.77(c) |
| Portfolio turnover | 37 | 32 | 27 | 24 | 43 |
| Net assets at end of period (000 omitted) | $3,037 | $2,673 | $6,917 | $7,023 | $4,817 |
| Class R6 | Year ended | ||||
| 5/31/21 | 5/31/20 | 5/31/19 | 5/31/18 | 5/31/17 | |
| Net asset value, beginning of period | $29.66 | $33.30 | $36.86 | $32.00 | $25.32 |
| Income (loss) from investment operations | |||||
| Net investment income (loss) (d) | $0.47 | $0.70 | $0.37 | $0.23 | $0.24(c) |
| Net realized and unrealized gain (loss) | 13.86 | (3.64) | (3.65) | 4.76 | 6.67 |
| Total from investment operations | $14.33 | $(2.94) | $(3.28) | $4.99 | $6.91 |
| Less distributions declared to shareholders | |||||
| From net investment income | $(0.32) | $(0.70) | $(0.28) | $(0.13) | $(0.23) |
| Net asset value, end of period (x) | $43.67 | $29.66 | $33.30 | $36.86 | $32.00 |
| Total return (%) (r)(s)(t)(x) | 48.43 | (9.21) | (8.86) | 15.60 | 27.49(c) |
| Ratios (%) (to average net assets) and Supplemental data: | |||||
| Expenses before expense reductions (f) | 0.98 | 1.03 | 1.06 | 1.14 | 1.28(c) |
| Expenses after expense reductions (f) | 0.95 | 0.95 | 1.04 | 1.13 | 1.26(c) |
| Net investment income (loss) | 1.20 | 2.10 | 1.07 | 0.64 | 0.86(c) |
| Portfolio turnover | 37 | 32 | 27 | 24 | 43 |
| Net assets at end of period (000 omitted) | $7,034,144 | $3,336,889 | $1,817,161 | $1,327,862 | $875,711 |
Table of Contents
| (c) | Amount reflects a one-time reimbursement of expenses by the custodian (or former custodian) without which net investment income and performance would be lower and expenses would be higher. |
| (d) | Per share data is based on average shares outstanding. |
| (f) | Ratios do not reflect reductions from fees paid indirectly, if applicable. |
| (r) | Certain expenses have been reduced without which performance would have been lower. |
| (s) | From time to time the fund may receive proceeds from litigation settlements, without which performance would be lower. |
| (t) | Total returns do not include any applicable sales charges. |
| (x) | The net asset values and total returns have been calculated on net assets which include adjustments made in accordance with U.S. generally accepted accounting principles required at period end for financial reporting purposes. |
Table of Contents
Table of Contents
Table of Contents
| Financial Instruments | Level 1 | Level 2 | Level 3 | Total |
| Equity Securities: | ||||
| China | $2,082,474,806 | $— | $— | $2,082,474,806 |
| South Korea | 972,250,595 | — | — | 972,250,595 |
| India | 772,554,679 | — | — | 772,554,679 |
| Taiwan | 731,313,913 | — | — | 731,313,913 |
| Russia | 180,703,121 | 383,331,553 | — | 564,034,674 |
| Brazil | 450,194,905 | — | — | 450,194,905 |
| Hong Kong | 419,642,180 | — | — | 419,642,180 |
| Netherlands | 277,192,324 | — | — | 277,192,324 |
| South Africa | 213,365,336 | — | — | 213,365,336 |
| Other Countries | 735,056,353 | 95,826,348 | — | 830,882,701 |
| Mutual Funds | 110,979,547 | — | — | 110,979,547 |
| Total | $6,945,727,759 | $479,157,901 | $— | $7,424,885,660 |
Table of Contents
| Year ended 5/31/21 | Year ended 5/31/20 | |
| Ordinary income (including any short-term capital gains) | $46,750,489 | $68,825,844 |
Table of Contents
| As of 5/31/21 | |
| Cost of investments | $5,750,966,315 |
| Gross appreciation | 1,793,240,217 |
| Gross depreciation | (119,320,872) |
| Net unrealized appreciation (depreciation) | $1,673,919,345 |
| Undistributed ordinary income | 33,246,443 |
| Capital loss carryforwards | (130,400,941) |
| Other temporary differences | (3,140,658) |
| Total distributable earnings (loss) | $1,573,624,189 |
| Long-Term | $(130,400,941) |
| Year ended 5/31/21 | Year ended 5/31/20 | |
| Class A | $833,267 | $2,319,285 |
| Class B | — | 35,142 |
| Class C | — | 156,722 |
| Class I | 928,994 | 1,762,494 |
| Class R1 | — | 25,621 |
| Class R2 | 13,944 | 75,352 |
| Class R3 | 17,797 | 128,665 |
| Class R4 | 18,360 | 57,249 |
| Class R6 | 44,938,127 | 64,265,314 |
| Total | $46,750,489 | $68,825,844 |
Table of Contents
| Up to $500 million | 1.05% |
| In excess of $500 million and up to $1 billion | 0.95% |
| In excess of $1 billion and up to $4 billion | 0.90% |
| In excess of $4 billion | 0.85% |
| Up to $500 million | 1.05% |
| In excess of $500 million and up to $1 billion | 0.95% |
| In excess of $1 billion and up to $4 billion | 0.90% |
| In excess of $4 billion and up to $10 billion | 0.85% |
| In excess of $10 billion | 0.80% |
| Classes | ||||||||
| A | B | C | I | R1 | R2 | R3 | R4 | R6 |
| 1.31% | 2.06% | 2.06% | 1.06% | 2.06% | 1.56% | 1.31% | 1.06% | 0.95% |
Table of Contents
| Distribution Fee Rate (d) | Service Fee Rate (d) | Total Distribution Plan (d) | Annual Effective Rate (e) | Distribution and Service Fee | |
| Class A | — | 0.25% | 0.25% | 0.25% | $ 392,061 |
| Class B | 0.75% | 0.25% | 1.00% | 1.00% | 25,398 |
| Class C | 0.75% | 0.25% | 1.00% | 1.00% | 104,186 |
| Class R1 | 0.75% | 0.25% | 1.00% | 1.00% | 16,999 |
| Class R2 | 0.25% | 0.25% | 0.50% | 0.50% | 19,652 |
| Class R3 | — | 0.25% | 0.25% | 0.25% | 11,812 |
| Total Distribution and Service Fees | $570,108 |
| (d) | In accordance with the distribution plan for certain classes, the fund pays distribution and/or service fees equal to these annual percentage rates of each class’s average daily net assets. The distribution and service fee rates disclosed by class represent the current rates in effect at the end of the reporting period. Any rate changes, if applicable, are detailed below. |
| (e) | The annual effective rates represent actual fees incurred under the distribution plan for the year ended May 31, 2021 based on each class's average daily net assets. MFD has voluntarily agreed to rebate a portion of each class's 0.25% service fee attributable to accounts for which there is no financial intermediary specified on the account except for accounts attributable to MFS or its affiliates' seed money. For the year ended May 31, 2021, this rebate amounted to $1,489, $10, and $20 for Class A, Class B, and Class C, respectively, and is included in the reduction of total expenses in the Statement of Operations. |
| Amount | |
| Class A | $1,901 |
| Class B | 3,227 |
| Class C | 444 |
Table of Contents
Table of Contents
| Year ended 5/31/21 | Year ended 5/31/20 | ||||
| Shares | Amount | Shares | Amount | ||
| Shares sold | |||||
| Class A | 1,679,361 | $64,375,766 | 1,190,435 | $37,819,440 | |
| Class B | 2,428 | 85,744 | 935 | 29,943 | |
| Class C | 63,612 | 2,177,128 | 63,962 | 1,887,319 | |
| Class I | 1,741,477 | 70,304,801 | 2,368,864 | 79,671,976 | |
| Class R1 | 6,746 | 212,528 | 6,990 | 196,313 | |
| Class R2 | 26,457 | 894,865 | 48,382 | 1,428,605 | |
| Class R3 | 68,086 | 2,404,763 | 196,269 | 6,193,038 | |
| Class R4 | 18,608 | 706,082 | 32,464 | 982,320 | |
| Class R6 | 49,104,161 | 1,880,456,689 | 61,542,850 | 2,061,826,062 | |
| 52,710,936 | $2,021,618,366 | 65,451,151 | $2,190,035,016 | ||
| Shares issued to shareholders in reinvestment of distributions | |||||
| Class A | 20,821 | $790,353 | 64,558 | $2,205,955 | |
| Class B | — | — | 1,098 | 34,499 | |
| Class C | — | — | 4,234 | 129,803 | |
| Class I | 21,094 | 843,543 | 41,583 | 1,495,334 | |
| Class R1 | — | — | 848 | 25,621 | |
| Class R2 | 399 | 13,823 | 2,324 | 72,434 | |
| Class R3 | 471 | 17,797 | 3,790 | 128,665 | |
| Class R4 | 486 | 18,360 | 1,684 | 57,249 | |
| Class R6 | 1,119,916 | 44,796,623 | 1,778,620 | 63,959,158 | |
| 1,163,187 | $46,480,499 | 1,898,739 | $68,108,718 | ||
| Shares reacquired | |||||
| Class A | (976,624) | $(34,841,665) | (856,185) | $(26,625,828) | |
| Class B | (31,924) | (1,047,364) | (35,822) | (1,026,904) | |
| Class C | (180,884) | (5,803,603) | (165,669) | (4,665,492) | |
| Class I | (1,093,672) | (42,578,167) | (1,313,702) | (40,785,503) | |
| Class R1 | (57,082) | (2,032,902) | (3,539) | (98,749) | |
| Class R2 | (48,506) | (1,570,681) | (76,705) | (2,265,930) | |
| Class R3 | (168,047) | (5,574,762) | (53,024) | (1,668,144) | |
| Class R4 | (40,851) | (1,398,135) | (158,577) | (5,091,946) | |
| Class R6 | (1,632,551) | (63,751,818) | (5,386,290) | (186,167,370) | |
| (4,230,141) | $(158,599,097) | (8,049,513) | $(268,395,866) | ||
Table of Contents
| Year ended 5/31/21 | Year ended 5/31/20 | ||||
| Shares | Amount | Shares | Amount | ||
| Net change | |||||
| Class A | 723,558 | $30,324,454 | 398,808 | $13,399,567 | |
| Class B | (29,496) | (961,620) | (33,789) | (962,462) | |
| Class C | (117,272) | (3,626,475) | (97,473) | (2,648,370) | |
| Class I | 668,899 | 28,570,177 | 1,096,745 | 40,381,807 | |
| Class R1 | (50,336) | (1,820,374) | 4,299 | 123,185 | |
| Class R2 | (21,650) | (661,993) | (25,999) | (764,891) | |
| Class R3 | (99,490) | (3,152,202) | 147,035 | 4,653,559 | |
| Class R4 | (21,757) | (673,693) | (124,429) | (4,052,377) | |
| Class R6 | 48,591,526 | 1,861,501,494 | 57,935,180 | 1,939,617,850 | |
| 49,643,982 | $1,909,499,768 | 59,300,377 | $1,989,747,868 | ||
Table of Contents
| Affiliated Issuers | Beginning Value | Purchases | Sales Proceeds | Realized Gain (Loss) | Change in Unrealized Appreciation or Depreciation | Ending Value |
| MFS Institutional Money Market Portfolio | $72,639,421 | $1,642,102,892 | $1,603,756,288 | $(5,594) | $(884) | $110,979,547 |
| Affiliated Issuers | Dividend Income | Capital Gain Distributions |
| MFS Institutional Money Market Portfolio | $97,787 | $— |
Table of Contents
Table of Contents

July 16, 2021
Table of Contents
| Name, Age | Position(s) Held with Fund | Trustee/Officer Since(h) | Number of MFS Funds overseen by the Trustee | Principal Occupations During the Past Five Years | Other Directorships During the Past Five Years (j) | |||||
| INTERESTED TRUSTEES | ||||||||||
| Robert J. Manning (k) (age 57) | Trustee | February 2004 | 135 | Massachusetts Financial Services Company, Non-Executive Chairman (since January 2021); Director; Chairman of the Board; Executive Chairman (January 2017-2020); Co-Chief Executive Officer (2015-2016) | N/A | |||||
| Michael W. Roberge (k) (age 54) | Trustee | January 2021 | 135 | Massachusetts Financial Services Company, Chairman (since January 2021); Chief Executive Officer (since January 2017); Director; President (until December 2018); Chief Investment Officer (until December 2018); Co-Chief Executive Officer (until December 2016) | N/A | |||||
| INDEPENDENT TRUSTEES | ||||||||||
| John P. Kavanaugh (age 66) | Trustee and Chair of Trustees | January 2009 | 135 | Private investor | N/A | |||||
| Steven E. Buller (age 69) | Trustee | February 2014 | 135 | Private investor | N/A | |||||
| John A. Caroselli (age 67) | Trustee | March 2017 | 135 | Private investor; JC Global Advisors, LLC (management consulting), President (since 2015) | N/A | |||||
| Maureen R. Goldfarb (age 66) | Trustee | January 2009 | 135 | Private investor | N/A | |||||
| Peter D. Jones (age 65) | Trustee | January 2019 | 135 | Private investor | N/A | |||||
Table of Contents
| Name, Age | Position(s) Held with Fund | Trustee/Officer Since(h) | Number of MFS Funds overseen by the Trustee | Principal Occupations During the Past Five Years | Other Directorships During the Past Five Years (j) | |||||
| James W. Kilman, Jr. (age 60) | Trustee | January 2019 | 135 | Burford Capital Limited (finance and investment management), Senior Advisor (since May 3, 2021), Chief Financial Officer (2019 - May 2, 2021); KielStrand Capital LLC (family office), Chief Executive Officer (since 2016); Morgan Stanley & Co. (financial services), Vice Chairman of Investment Banking, Co-Head of Diversified Financials Coverage – Financial Institutions Investment Banking Group (until 2016) | Alpha-En Corporation, Director (2016-2019) | |||||
| Clarence Otis, Jr. (age 65) | Trustee | March 2017 | 135 | Private investor | VF Corporation, Director; Verizon Communications, Inc., Director; The Travelers Companies, Director | |||||
| Maryanne L. Roepke (age 65) | Trustee | May 2014 | 135 | Private investor | N/A | |||||
| Laurie J. Thomsen (age 63) | Trustee | March 2005 | 135 | Private investor | The Travelers Companies, Director; Dycom Industries, Inc., Director |
| Name, Age | Position(s) Held with Fund | Trustee/Officer Since(h) | Number of MFS Funds for which the Person is an Officer | Principal Occupations During the Past Five Years | ||||
| OFFICERS | ||||||||
| Christopher R. Bohane (k) (age 47) | Assistant Secretary and Assistant Clerk | July 2005 | 135 | Massachusetts Financial Services Company, Senior Vice President and Associate General Counsel | ||||
| Kino Clark (k) (age 53) | Assistant Treasurer | January 2012 | 135 | Massachusetts Financial Services Company, Vice President |
Table of Contents
| Name, Age | Position(s) Held with Fund | Trustee/Officer Since(h) | Number of MFS Funds for which the Person is an Officer | Principal Occupations During the Past Five Years | ||||
| John W. Clark, Jr. (k) (age 54) | Assistant Treasurer | April 2017 | 135 | Massachusetts Financial Services Company, Vice President (since March 2017); Deutsche Bank (financial services), Department Head - Treasurer's Office (until February 2017) | ||||
| Thomas H. Connors (k) (age 61) | Assistant Secretary and Assistant Clerk | September 2012 | 135 | Massachusetts Financial Services Company, Vice President and Senior Counsel | ||||
| David L. DiLorenzo (k) (age 52) | President | July 2005 | 135 | Massachusetts Financial Services Company, Senior Vice President | ||||
| Heidi W. Hardin (k) (age 53) | Secretary and Clerk | April 2017 | 135 | Massachusetts Financial Services Company, Executive Vice President and General Counsel (since March 2017); Harris Associates (investment management), General Counsel (until January 2017) | ||||
| Brian E. Langenfeld (k) (age 48) | Assistant Secretary and Assistant Clerk | June 2006 | 135 | Massachusetts Financial Services Company, Vice President and Senior Counsel | ||||
| Amanda S. Mooradian (k) (age 42) | Assistant Secretary and Assistant Clerk | September 2018 | 135 | Massachusetts Financial Services Company, Assistant Vice President and Senior Counsel | ||||
| Susan A. Pereira (k) (age 50) | Assistant Secretary and Assistant Clerk | July 2005 | 135 | Massachusetts Financial Services Company, Vice President and Assistant General Counsel | ||||
| Kasey L. Phillips (k) (age 50) | Assistant Treasurer | September 2012 | 135 | Massachusetts Financial Services Company, Vice President | ||||
| Matthew A. Stowe (k) (age 46) | Assistant Secretary and Assistant Clerk | October 2014 | 135 | Massachusetts Financial Services Company, Vice President and Assistant General Counsel | ||||
| Martin J. Wolin (k) (age 53) | Chief Compliance Officer | July 2015 | 135 | Massachusetts Financial Services Company, Senior Vice President and Chief Compliance Officer |
Table of Contents
| Name, Age | Position(s) Held with Fund | Trustee/Officer Since(h) | Number of MFS Funds for which the Person is an Officer | Principal Occupations During the Past Five Years | ||||
| James O. Yost (k) (age 61) | Treasurer | September 1990 | 135 | Massachusetts Financial Services Company, Senior Vice President |
| (h) | Date first appointed to serve as Trustee/Officer of an MFS Fund. Each Trustee has served continuously since appointment unless indicated otherwise. For the period from December 15, 2004 until February 22, 2005, Mr. Manning served as Advisory Trustee. From January 2012 through December 2016, Messrs. DiLorenzo and Yost served as Treasurer and Deputy Treasurer of the Funds, respectively. |
| (j) | Directorships or trusteeships of companies required to report to the Securities and Exchange Commission (i.e., “public companies”). |
| (k) | “Interested person” of the Trust within the meaning of the Investment Company Act of 1940 (referred to as the 1940 Act), which is the principal federal law governing investment companies like the fund, as a result of a position with MFS. The address of MFS is 111 Huntington Avenue, Boston, Massachusetts 02199-7618. |
Table of Contents
| Investment Adviser | Custodian |
| Massachusetts Financial Services Company 111 Huntington Avenue Boston, MA 02199-7618 | State Street Bank and Trust Company 1 Lincoln Street Boston, MA 02111-2900 |
| Distributor | Independent Registered Public Accounting Firm |
| MFS Fund Distributors, Inc. 111 Huntington Avenue Boston, MA 02199-7618 | Ernst & Young LLP 200 Clarendon Street Boston, MA 02116 |
| Portfolio Manager(s) | |
| Jose Luis Garcia Robert Lau Harry Purcell |
Table of Contents
Table of Contents
Table of Contents
| FACTS | WHAT DOES MFS DO WITH YOUR PERSONAL INFORMATION? |
| Why? | Financial companies choose how they share your personal information. Federal law gives consumers the right to limit some but not all sharing. Federal law also requires us to tell you how we collect, share, and protect your personal information. Please read this notice carefully to understand what we do. |
| What? | The types of personal information we collect and share depend on the product or service you have with us. This information can include: |
| • Social Security number and account balances | |
| • Account transactions and transaction history | |
| • Checking account information and wire transfer instructions | |
| When you are no longer our customer, we continue to share your information as described in this notice. |
| How? | All financial companies need to share customers' personal information to run their everyday business. In the section below, we list the reasons financial companies can share their customers' personal information; the reasons MFS chooses to share; and whether you can limit this sharing. |
| Reasons we can share your personal information | Does MFS share? | Can you limit this sharing? |
| For our everyday business purposes – such as to process your transactions, maintain your account(s), respond to court orders and legal investigations, or report to credit bureaus | Yes | No |
| For our marketing purposes – to offer our products and services to you | No | We don't share |
| For joint marketing with other financial companies | No | We don't share |
| For our affiliates' everyday business purposes – information about your transactions and experiences | No | We don't share |
| For our affiliates' everyday business purposes – information about your creditworthiness | No | We don't share |
| For nonaffiliates to market to you | No | We don't share |
| Questions? | Call 800-225-2606 or go to mfs.com. |

Table of Contents
| Who we are | |
| Who is providing this notice? | MFS Funds, MFS Investment Management, MFS Institutional Advisors, Inc., and MFS Heritage Trust Company. |
| What we do | |
| How does MFS protect my personal information? | To protect your personal information from unauthorized access and use, we use security measures that comply with federal law. These measures include procedural, electronic, and physical safeguards for the protection of the personal information we collect about you. |
| How does MFS collect my personal information? | We collect your personal information, for example, when you |
| • open an account or provide account information | |
| • direct us to buy securities or direct us to sell your securities | |
| • make a wire transfer | |
| We also collect your personal information from others, such as credit bureaus, affiliates, or other companies. | |
| Why can't I limit all sharing? | Federal law gives you the right to limit only |
| • sharing for affiliates' everyday business purposes – information about your creditworthiness | |
| • affiliates from using your information to market to you | |
| • sharing for nonaffiliates to market to you | |
| State laws and individual companies may give you additional rights to limit sharing. | |
| Definitions | |
| Affiliates | Companies related by common ownership or control. They can be financial and nonfinancial companies. |
| • MFS does not share personal information with affiliates, except for everyday business purposes as described on page one of this notice. | |
| Nonaffiliates | Companies not related by common ownership or control. They can be financial and nonfinancial companies. |
| • MFS does not share with nonaffiliates so they can market to you. | |
| Joint marketing | A formal agreement between nonaffiliated financial companies that together market financial products or services to you. |
| • MFS doesn't jointly market. | |
| Other important information |
| If you own an MFS product or receive an MFS service in the name of a third party such as a bank or broker-dealer, their privacy policy may apply to you instead of ours. |
Table of Contents
Table of Contents
Table of Contents
Table of Contents
Table of Contents


Table of Contents
Annual Report
May 31, 2021

MFS® International Diversification SM Fund

MDI-ANN
Table of Contents
MFS® International Diversification SM Fund
| Contact information | back cover |
The report is prepared for the general information of shareholders. It is authorized for distribution to prospective investors only when preceded or accompanied by a current prospectus.
NOT FDIC INSURED • MAY LOSE VALUE • NO BANK GUARANTEE
Table of Contents

Dear Shareholders:
Markets have experienced dramatic swings since the coronavirus pandemic brought the global economy to a standstill for several months early in 2020. While the speedy
development of vaccines brightened the economic and market outlook, uncertainty remains as new variants of the virus appear and questions persist over how fast vaccines can be made widely available in the developing world.
Global central banks have taken aggressive steps to cushion the economic and market fallout related to the virus, and governments are deploying unprecedented levels of fiscal support. Having passed a $1.9 trillion stimulus package in March, the U.S. Congress could approve additional stimulus later this year, some of it focused on infrastructure. Along with extraordinary government expenditures, pent-up consumer demand fueled a surge in economic activity as coronavirus restrictions were eased, pushing up inflation, at least temporarily. Markets reacted by pushing up
yields on global government bonds, though some of the rate rise has since been corrected.
A spirited debate is underway among investors over whether the current price pressures will persist or prove to be temporary, caused by pandemic-induced bottlenecks. The policy measures put in place to counteract the pandemic’s effects have helped build a supportive environment and are encouraging economic recovery; however, if markets disconnect from fundamentals, they can sow the seeds of instability. As such, recent dramatic increases in speculative trading in cryptocurrencies, special purpose acquisition companies (SPACs), and the like bear watching.
In the aftermath of the crisis, we could see societal changes as households, businesses, and governments adjust to a new reality, and any such alterations could affect the investment landscape. For investors, events such as the COVID-19 outbreak demonstrate the importance of having a deep understanding of company fundamentals, and we have built our global research platform to do just that.
At MFS®, we put our clients’ assets to work responsibly by carefully navigating the increasing complexity of global markets and economies. Guided by our long-term philosophy and adhering to our commitment to sustainable investing, we tune out the noise and aim to uncover what we believe are the best, most durable investment opportunities in the market. Our unique global investment platform combines collective expertise, long-term discipline, and thoughtful risk management to create sustainable value for investors.
Respectfully,

Michael W. Roberge
Chief Executive Officer
MFS Investment Management
July 16, 2021
The opinions expressed in this letter are subject to change and may not be relied upon for investment advice. No forecasts can be guaranteed.
1
Table of Contents
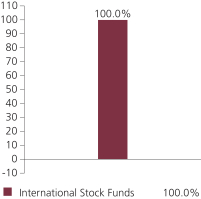
Portfolio target allocation
| Portfolio holdings |
| |||
| MFS Research International Fund | 27.4% | |||
| MFS Emerging Markets Equity Fund | 17.6% | |||
MFS International Growth Fund | 15.0% | |||
MFS International Intrinsic Value Fund | 14.9% | |||
MFS International Large Cap Value Fund | 14.9% | |||
| MFS International New Discovery Fund | 10.0% | |||
| Cash & Cash Equivalents | 0.2% | |||
Portfolio actual allocation
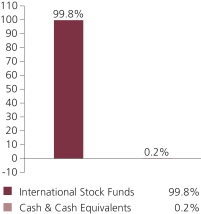
Cash & Cash Equivalents includes any cash, investments in money market funds, short-term securities, and other assets less liabilities. MFS endeavors to fully invest all MFS funds-of-funds in underlying funds on a daily basis. Any divergence from 0.0% in Cash & Cash Equivalents is typically due to the timing of fund subscriptions/redemptions and the settlement of subsequent investment in/divestment from the underlying funds. While the MFS funds-of-funds’ subscriptions/redemptions are processed at the same day NAV of the underlying funds, a positive/negative cash balance will be reflected on the MFS funds-of-funds’ Statements of Assets and Liabilities until the trades with the underlying funds settle, which is typically two business days. Please see the fund’s Statement of Assets and Liabilities for additional information related to the fund’s cash position and other assets and liabilities.
Percentages are based on net assets as of May 31, 2021.
The portfolio is actively managed and current holdings may be different.
2
Table of Contents
Summary of Results
For the twelve months ended May 31, 2021, Class A shares of the MFS International Diversification Fund (fund) provided a total return of 37.98%, at net asset value. This compares with a return of 42.78% for the fund’s benchmark, the MSCI All Country World (ex-US) Index (net div).
Market Environment
The global economy continued to recover from the most unusual recession in memory while financial markets benefited from massive fiscal and monetary intervention aimed at offsetting the economic effects of the pandemic. In developed markets, vaccine distribution broadened after getting off to a slower-than-hoped-for start in some locales, although concerns remained that too few people will be inoculated for herd immunity to be achieved. On balance, emerging markets experienced slower rollouts than developed markets amid ongoing vaccine supply constraints.
Around the world, central banks responded quickly and massively to the crisis with programs to improve liquidity and support markets. These undertakings proved largely successful in helping to restore market function, ease volatility and stimulate a prolonged rebound. In the first half of the period, the US Federal Reserve adopted a new, flexible, average-inflation-targeting framework, which is expected to result in the federal funds rate remaining at low levels longer than under its previous model. Due to relatively manageable external liabilities and balances of payments in many countries and persistently low inflation, even emerging market countries were able to implement countercyclical policies – a departure from the usual market-dictated response to risk-off crises.
Late in the period, markets grappled with the threat of resurgent inflation resulting from pandemic-induced production bottlenecks, monumental levels of economic stimulus and the unleashing of post-lockdown pent-up demand. Meanwhile, raw materials prices rebounded strongly on account of the surprising resilience of the global manufacturing sector during the pandemic. In response to these factors, global government bond yields rose materially in recent months and market leadership shifted from a handful of mega-cap technology companies to a broader array of small-cap and value stocks. At the same time, signs of excess investor enthusiasm were seen in pockets of the market, such as the “meme stocks” popular with users of online message boards and equities issued by special purpose acquisition companies (SPACs).
Factors Affecting Performance
During the reporting period, the fund’s exposure to the MFS International Intrinsic Value Fund, MFS Research International Fund and MFS International New Discovery Fund held back relative performance as all three funds underperformed their respective market segments. The fund’s exposure to the MFS International Growth Fund further weighed on relative results. Conversely, the fund’s exposure to both the MFS Emerging Markets Equity Fund and the MFS International Large Cap Value Fund aided relative returns.
Respectfully,
Portfolio Manager(s)
Camille Humphries Lee
3
Table of Contents
Management Review – continued
The views expressed in this report are those of the portfolio manager(s) only through the end of the period of the report as stated on the cover and do not necessarily reflect the views of MFS or any other person in the MFS organization. These views are subject to change at any time based on market or other conditions, and MFS disclaims any responsibility to update such views. These views may not be relied upon as investment advice or an indication of trading intent on behalf of any MFS portfolio. References to specific securities are not recommendations of such securities, and may not be representative of any MFS portfolio’s current or future investments.
4
Table of Contents
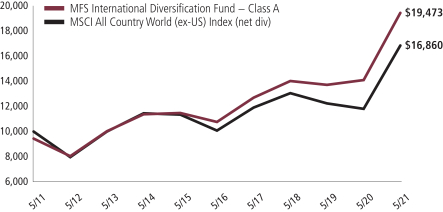
PERFORMANCE SUMMARY THROUGH 5/31/21
The following chart illustrates a representative class of the fund’s historical performance in comparison to its benchmark(s). Performance results include the deduction of the maximum applicable sales charge and reflect the percentage change in net asset value, including reinvestment of dividends and capital gains distributions. The performance of other share classes will be greater than or less than that of the class depicted below. Benchmarks are unmanaged and may not be invested in directly. Benchmark returns do not reflect sales charges, commissions or expenses. (See Notes to Performance Summary.)
Performance data shown represents past performance and is no guarantee of future results. Investment return and principal value fluctuate so your shares, when sold, may be worth more or less than the original cost; current performance may be lower or higher than quoted. The performance shown does not reflect the deduction of taxes, if any, that a shareholder would pay on fund distributions or the redemption of fund shares.
Growth of a Hypothetical $10,000 Investment
5
Table of Contents
Performance Summary – continued
Total Returns through 5/31/21
Average annual without sales charge
| Share Class | Class Inception Date | 1-yr | 5-yr | 10-yr | Life (t) | |||||||||
| A | 9/30/04 | 37.98% | 12.62% | 7.53% | N/A | |||||||||
| B | 9/30/04 | 36.94% | 11.79% | 6.73% | N/A | |||||||||
| C | 9/30/04 | 36.90% | 11.78% | 6.72% | N/A | |||||||||
| I | 9/30/04 | 38.32% | 12.90% | 7.79% | N/A | |||||||||
| R1 | 4/01/05 | 36.94% | 11.79% | 6.72% | N/A | |||||||||
| R2 | 9/30/04 | 37.59% | 12.33% | 7.26% | N/A | |||||||||
| R3 | 4/01/05 | 37.94% | 12.62% | 7.53% | N/A | |||||||||
| R4 | 4/01/05 | 38.28% | 12.89% | 7.80% | N/A | |||||||||
| R6 | 10/02/17 | 38.44% | N/A | N/A | 11.40% | |||||||||
| Comparative benchmark(s) | ||||||||||||||
| MSCI All Country World (ex-US) Index (net div) (f) | 42.78% | 10.88% | 5.36% | N/A | ||||||||||
| Average annual with sales charge | ||||||||||||||
| A With Initial Sales Charge (5.75%) | 30.05% | 11.30% | 6.89% | N/A | ||||||||||
| B With CDSC (Declining over six years from 4% to 0%) (v) | 32.94% | 11.53% | 6.73% | N/A | ||||||||||
| C With CDSC (1% for 12 months) (v) | 35.90% | 11.78% | 6.72% | N/A | ||||||||||
CDSC – Contingent Deferred Sales Charge.
Class I, R1, R2, R3, R4, and R6 shares do not have a sales charge.
| (f) | Source: FactSet Research Systems Inc. |
| (t) | For the period from the class inception date through the stated period end (for those share classes with less than 10 years of performance history). No comparative benchmark performance information is provided for “life” periods. (See Notes to Performance Summary.) |
| (v) | Assuming redemption at the end of the applicable period. |
Benchmark Definition(s)
MSCI All Country World (ex-US) Index (e) (net div) – a market capitalization-weighted index that is designed to measure equity market performance in the developed and emerging markets, excluding the U.S.
It is not possible to invest directly in an index.
| (e) | Morgan Stanley Capital International (“MSCI”) makes no express or implied warranties or representations and shall have no liability whatsoever with respect to any MSCI data contained herein. The MSCI data may not be further redistributed or used as a basis for other indices or any securities or financial products. This report is not approved, reviewed, or produced by MSCI. |
6
Table of Contents
Performance Summary – continued
Notes to Performance Summary
Average annual total return represents the average annual change in value for each share class for the periods presented. Life returns are presented where the share class has less than 10 years of performance history and represent the average annual total return from the class inception date to the stated period end date. As the fund’s share classes may have different inception dates, the life returns may represent different time periods and may not be comparable. As a result, no comparative benchmark performance information is provided for life periods.
Performance results reflect any applicable expense subsidies and waivers in effect during the periods shown. Without such subsidies and waivers the fund’s performance results would be less favorable. Please see the prospectus and financial statements for complete details.
Performance results do not include adjustments made for financial reporting purposes in accordance with U.S. generally accepted accounting principles and may differ from amounts reported in the financial highlights.
From time to time the fund may receive proceeds from litigation settlements, without which performance would be lower.
7
Table of Contents
Fund expenses borne by the shareholders during the period, December 1, 2020 through May 31, 2021
As a shareholder of the fund, you incur two types of costs: (1) transaction costs, including sales charges (loads) on certain purchase or redemption payments, and (2) ongoing costs, including distribution and service (12b-1) fees; and other fund expenses. This example is intended to help you understand your ongoing costs (in dollars) of investing in the fund and to compare these costs with the ongoing costs of investing in other mutual funds.
In addition to the fees and expenses which the fund bears directly, the fund indirectly bears a pro rata share of the fees and expenses of the underlying funds in which the fund invests. Because the underlying funds have varied expenses and fee levels and the fund may own different proportions of the underlying funds at different times, the amount of fees and expenses incurred indirectly by the fund will vary. If these transactional and indirect costs were included, your costs would have been higher.
The example is based on an investment of $1,000 invested at the beginning of the period and held for the entire period December 1, 2020 through May 31, 2021.
Actual Expenses
The first line for each share class in the following table provides information about actual account values and actual expenses. You may use the information in this line, together with the amount you invested, to estimate the expenses that you paid over the period. Simply divide your account value by $1,000 (for example, an $8,600 account value divided by $1,000 = 8.6), then multiply the result by the number in the first line under the heading entitled “Expenses Paid During Period” to estimate the expenses you paid on your account during this period.
Hypothetical Example for Comparison Purposes
The second line for each share class in the following table provides information about hypothetical account values and hypothetical expenses based on the fund’s actual expense ratio and an assumed rate of return of 5% per year before expenses, which is not the fund’s actual return. The hypothetical account values and expenses may not be used to estimate the actual ending account balance or expenses you paid for the period. You may use this information to compare the ongoing costs of investing in the fund and other funds. To do so, compare this 5% hypothetical example with the 5% hypothetical examples that appear in the shareholder reports of the other funds.
Please note that the expenses shown in the table are meant to highlight your ongoing costs only and do not reflect any transactional costs, such as sales charges (loads). Therefore, the second line for each share class in the table is useful in comparing ongoing costs only, and will not help you determine the relative total costs of owning different funds. In addition, if these transactional costs were included, your costs would have been higher.
8
Table of Contents
Expense Table – continued
| Share Class | Annualized Ratio | Beginning Account Value 12/01/20 | Ending Account Value 5/31/21 | Expenses Paid During 12/01/20-5/31/21 | ||||||||||||||
| A | Actual | 0.34% | $1,000.00 | $1,139.25 | $1.81 | |||||||||||||
| Hypothetical (h) | 0.34% | $1,000.00 | $1,023.24 | $1.72 | ||||||||||||||
| B | Actual | 1.09% | $1,000.00 | $1,135.17 | $5.80 | |||||||||||||
| Hypothetical (h) | 1.09% | $1,000.00 | $1,019.50 | $5.49 | ||||||||||||||
| C | Actual | 1.09% | $1,000.00 | $1,134.73 | $5.80 | |||||||||||||
| Hypothetical (h) | 1.09% | $1,000.00 | $1,019.50 | $5.49 | ||||||||||||||
| I | Actual | 0.09% | $1,000.00 | $1,140.73 | $0.48 | |||||||||||||
| Hypothetical (h) | 0.09% | $1,000.00 | $1,024.48 | $0.45 | ||||||||||||||
| R1 | Actual | 1.09% | $1,000.00 | $1,135.31 | $5.80 | |||||||||||||
| Hypothetical (h) | 1.09% | $1,000.00 | $1,019.50 | $5.49 | ||||||||||||||
| R2 | Actual | 0.59% | $1,000.00 | $1,137.77 | $3.14 | |||||||||||||
| Hypothetical (h) | 0.59% | $1,000.00 | $1,021.99 | $2.97 | ||||||||||||||
| R3 | Actual | 0.34% | $1,000.00 | $1,139.39 | $1.81 | |||||||||||||
| Hypothetical (h) | 0.34% | $1,000.00 | $1,023.24 | $1.72 | ||||||||||||||
| R4 | Actual | 0.09% | $1,000.00 | $1,140.34 | $0.48 | |||||||||||||
| Hypothetical (h) | 0.09% | $1,000.00 | $1,024.48 | $0.45 | ||||||||||||||
| R6 | Actual | 0.00% | $1,000.00 | $1,141.45 | $0.00 | |||||||||||||
| Hypothetical (h) | 0.00% | $1,000.00 | $1,024.93 | $0.00 | ||||||||||||||
| (h) | 5% class return per year before expenses. |
| (p) | “Expenses Paid During Period” are equal to each class’s annualized expense ratio, as shown above, multiplied by the average account value over the period, multiplied by 182/365 (to reflect the one-half year period). Expenses paid do not include any applicable sales charges (loads). If these transaction costs had been included, your costs would have been higher. In addition to the fees and expenses which the fund bears directly, the fund indirectly bears a pro rata share of the fees and expenses of the underlying funds in which the fund invests. If these indirect costs were included, your costs would have been higher. |
9
Table of Contents
5/31/21
The Portfolio of Investments is a complete list of all securities owned by your fund. It is categorized by broad-based asset classes.
| Issuer | Shares/Par | Value ($) | ||||||
| Investment Companies (h) - 100.0% | ||||||||
| International Stock Funds - 99.8% | ||||||||
| MFS Emerging Markets Equity Fund - Class R6 | 155,477,668 | $ | 6,789,709,787 | |||||
| MFS International Growth Fund - Class R6 | 125,270,563 | 5,753,676,944 | ||||||
| MFS International Intrinsic Value Fund - Class R6 | 106,311,831 | 5,747,217,582 | ||||||
| MFS International Large Cap Value Fund - Class R6 | 419,796,452 | 5,742,815,460 | ||||||
| MFS International New Discovery Fund - Class R6 | 96,239,689 | 3,835,151,633 | ||||||
| MFS Research International Fund - Class R6 | 438,929,372 | 10,529,915,629 | ||||||
|
| |||||||
| $ | 38,398,487,035 | |||||||
| Money Market Funds - 0.2% | ||||||||
| MFS Institutional Money Market Portfolio, 0.03% (v) | 58,625,841 | $ | 58,625,841 | |||||
| Total Investment Companies (Identified Cost, $28,899,976,466) |
| $ | 38,457,112,876 | |||||
| Other Assets, Less Liabilities - 0.0% | 13,307,416 | |||||||
| Net Assets - 100.0% | $ | 38,470,420,292 | ||||||
| (h) | An affiliated issuer, which may be considered one in which the fund owns 5% or more of the outstanding voting securities, or a company which is under common control. At period end, the aggregate value of the fund’s investments in affiliated issuers was $38,457,112,876. |
| (v) | Affiliated issuer that is available only to investment companies managed by MFS. The rate quoted for the MFS Institutional Money Market Portfolio is the annualized seven-day yield of the fund at period end. |
See Notes to Financial Statements
10
Table of Contents
Financial Statements
STATEMENT OF ASSETS AND LIABILITIES
At 5/31/21
This statement represents your fund’s balance sheet, which details the assets and liabilities comprising the total value of the fund.
| Assets | ||||
Investments in affiliated issuers, at value (identified cost, $28,899,976,466) | $38,457,112,876 | |||
Receivables for | ||||
Fund shares sold | 114,929,540 | |||
Receivable from investment adviser | 980,238 | |||
| Other assets | 44,273 | |||
| Total assets | $38,573,066,927 | |||
| Liabilities | ||||
Payables for | ||||
Investments purchased | $65,269,895 | |||
Fund shares reacquired | 28,443,032 | |||
Payable to affiliates | ||||
Administrative services fee | 238 | |||
Shareholder servicing costs | 6,748,218 | |||
Distribution and service fees | 271,084 | |||
Payable for independent Trustees’ compensation | 1,111 | |||
| Accrued expenses and other liabilities | 1,913,057 | |||
| Total liabilities | $102,646,635 | |||
| Net assets | $38,470,420,292 | |||
| Net assets consist of | ||||
Paid-in capital | $28,722,206,488 | |||
| Total distributable earnings (loss) | 9,748,213,804 | |||
| Net assets | $38,470,420,292 | |||
| Shares of beneficial interest outstanding | 1,493,940,946 | |||
11
Table of Contents
Statement of Assets and Liabilities – continued
| Net assets | Shares outstanding | Net asset value per share (a) | ||||||||||
Class A | $4,381,231,294 | 171,744,375 | $25.51 | |||||||||
Class B | 21,541,970 | 856,125 | 25.16 | |||||||||
Class C | 489,683,141 | 19,723,075 | 24.83 | |||||||||
Class I | 17,850,568,943 | 691,503,771 | 25.81 | |||||||||
Class R1 | 10,358,914 | 424,580 | 24.40 | |||||||||
Class R2 | 74,610,880 | 2,977,924 | 25.05 | |||||||||
Class R3 | 1,318,181,981 | 52,095,361 | 25.30 | |||||||||
Class R4 | 1,277,937,633 | 49,682,253 | 25.72 | |||||||||
Class R6 | 13,046,305,536 | 504,933,482 | 25.84 | |||||||||
| (a) | Maximum offering price per share was equal to the net asset value per share for all share classes, except for Class A, for which the maximum offering price per share was $27.07 [100 / 94.25 x $25.51]. On sales of $50,000 or more, the maximum offering price of Class A shares is reduced. A contingent deferred sales charge may be imposed on redemptions of Class A, Class B, and Class C shares. Redemption price per share was equal to the net asset value per share for Classes I, R1, R2, R3, R4, and R6. |
See Notes to Financial Statements
12
Table of Contents
Financial Statements
Year ended 5/31/21
This statement describes how much your fund earned in investment income and accrued in expenses. It also describes any gains and/or losses generated by fund operations.
| Net investment income (loss) | ||||
Income | ||||
Dividends from affiliated issuers | $242,214,214 | |||
Other | 2,324 | |||
Total investment income | $242,216,538 | |||
Expenses | ||||
Distribution and service fees | $16,682,214 | |||
Shareholder servicing costs | 19,778,404 | |||
Administrative services fee | 17,500 | |||
Independent Trustees’ compensation | 132,177 | |||
Custodian fee | 97,354 | |||
Shareholder communications | 1,534,801 | |||
Audit and tax fees | 45,472 | |||
Legal fees | 201,566 | |||
Miscellaneous | 2,115,136 | |||
Total expenses | $40,604,624 | |||
Reduction of expenses by investment adviser and distributor | (5,091,299 | ) | ||
Net expenses | $35,513,325 | |||
Net investment income (loss) | $206,703,213 | |||
| Realized and unrealized gain (loss) | ||||
Realized gain (loss) (identified cost basis) | ||||
Investments in affiliated issuers | $220,349,436 | |||
Capital gain distributions from affiliated issuers | 321,942,168 | |||
Net realized gain (loss) | $542,291,604 | |||
Change in unrealized appreciation or depreciation | ||||
Affiliated issuers | $8,432,085,145 | |||
Net realized and unrealized gain (loss) | $8,974,376,749 | |||
Change in net assets from operations | $9,181,079,962 | |||
See Notes to Financial Statements
13
Table of Contents
Financial Statements
STATEMENTS OF CHANGES IN NET ASSETS
These statements describe the increases and/or decreases in net assets resulting from operations, any distributions, and any shareholder transactions.
| Year ended | ||||||||
| 5/31/21 | 5/31/20 | |||||||
| Change in net assets | ||||||||
| From operations | ||||||||
Net investment income (loss) | $206,703,213 | $300,953,324 | ||||||
Net realized gain (loss) | 542,291,604 | 96,169,737 | ||||||
Net unrealized gain (loss) | 8,432,085,145 | (71,593,371 | ) | |||||
Change in net assets from operations | $9,181,079,962 | $325,529,690 | ||||||
Total distributions to shareholders | $(510,409,609 | ) | $(530,914,635 | ) | ||||
Change in net assets from fund share transactions | $8,153,994,511 | $5,144,131,183 | ||||||
Total change in net assets | $16,824,664,864 | $4,938,746,238 | ||||||
| Net assets | ||||||||
At beginning of period | 21,645,755,428 | 16,707,009,190 | ||||||
At end of period | $38,470,420,292 | $21,645,755,428 | ||||||
See Notes to Financial Statements
14
Table of Contents
Financial Statements
The financial highlights table is intended to help you understand the fund’s financial performance for the past 5 years (or life of a particular share class, if shorter). Certain information reflects financial results for a single fund share. The total returns in the table represent the rate that an investor would have earned (or lost) on an investment in the fund share class (assuming reinvestment of all distributions) held for the entire period.
| Class A | Year ended | |||||||||||||||||||
| 5/31/21 | 5/31/20 | 5/31/19 | 5/31/18 | 5/31/17 | ||||||||||||||||
Net asset value, beginning of period | $18.80 | $18.71 | $19.68 | $18.07 | $15.59 | |||||||||||||||
| Income (loss) from investment operations |
| |||||||||||||||||||
Net investment income (loss) (d)(l) | $0.10 | $0.25 | $0.37 | $0.21 | $0.24 | (c) | ||||||||||||||
Net realized and unrealized gain (loss) | 6.96 | 0.32 | (0.85 | ) | 1.68 | 2.54 | ||||||||||||||
Total from investment operations | $7.06 | $0.57 | $(0.48 | ) | $1.89 | $2.78 | ||||||||||||||
| Less distributions declared to shareholders |
| |||||||||||||||||||
From net investment income | $(0.12 | ) | $(0.26 | ) | $(0.37 | ) | $(0.28 | ) | $(0.30 | ) | ||||||||||
From net realized gain | (0.23 | ) | (0.22 | ) | (0.12 | ) | — | — | ||||||||||||
Total distributions declared to shareholders | $(0.35 | ) | $(0.48 | ) | $(0.49 | ) | $(0.28 | ) | $(0.30 | ) | ||||||||||
Net asset value, end of period (x) | $25.51 | $18.80 | $18.71 | $19.68 | $18.07 | |||||||||||||||
Total return (%) (r)(s)(t)(x) | 37.66 | 2.80 | (2.15 | ) | 10.46 | 18.18 | (c) | |||||||||||||
| Ratios (%) (to average net assets) and Supplemental data: |
| |||||||||||||||||||
Expenses before expense reductions (f)(h) | 0.36 | 0.37 | 0.36 | 0.38 | 0.37 | (c) | ||||||||||||||
Expenses after expense reductions (f)(h) | 0.34 | 0.35 | 0.34 | 0.35 | 0.35 | (c) | ||||||||||||||
Net investment income (loss) (l) | 0.46 | 1.31 | 1.96 | 1.09 | 1.51 | (c) | ||||||||||||||
Portfolio turnover | 9 | 6 | 1 | 1 | 3 | |||||||||||||||
Net assets at end of period (000 omitted) | $4,381,231 | $2,778,815 | $2,458,587 | $2,263,605 | $1,804,722 | |||||||||||||||
See Notes to Financial Statements
15
Table of Contents
Financial Highlights – continued
| Class B | Year ended | |||||||||||||||||||
| 5/31/21 | 5/31/20 | 5/31/19 | 5/31/18 | 5/31/17 | ||||||||||||||||
Net asset value, beginning of period | $18.61 | $18.50 | $19.43 | $17.84 | $15.38 | |||||||||||||||
| Income (loss) from investment operations |
| |||||||||||||||||||
Net investment income (loss) (d)(l) | $(0.06 | ) | $0.10 | $0.22 | $0.07 | $0.09 | (c) | |||||||||||||
Net realized and unrealized gain (loss) | 6.84 | 0.31 | (0.82 | ) | 1.66 | 2.54 | ||||||||||||||
Total from investment operations | $6.78 | $0.41 | $(0.60 | ) | $1.73 | $2.63 | ||||||||||||||
| Less distributions declared to shareholders |
| |||||||||||||||||||
From net investment income | $— | $(0.08 | ) | $(0.21 | ) | $(0.14 | ) | $(0.17 | ) | |||||||||||
From net realized gain | (0.23 | ) | (0.22 | ) | (0.12 | ) | — | — | ||||||||||||
Total distributions declared to shareholders | $(0.23 | ) | $(0.30 | ) | $(0.33 | ) | $(0.14 | ) | $(0.17 | ) | ||||||||||
Net asset value, end of period (x) | $25.16 | $18.61 | $18.50 | $19.43 | $17.84 | |||||||||||||||
Total return (%) (r)(s)(t)(x) | 36.51 | 2.08 | (2.93 | ) | 9.71 | 17.27 | (c) | |||||||||||||
| Ratios (%) (to average net assets) and Supplemental data: |
| |||||||||||||||||||
Expenses before expense reductions (f)(h) | 1.11 | 1.12 | 1.11 | 1.12 | 1.12 | (c) | ||||||||||||||
Expenses after expense reductions (f)(h) | 1.09 | 1.10 | 1.09 | 1.10 | 1.10 | (c) | ||||||||||||||
Net investment income (loss) (l) | (0.28 | ) | 0.53 | 1.20 | 0.36 | 0.56 | (c) | |||||||||||||
Portfolio turnover | 9 | 6 | 1 | 1 | 3 | |||||||||||||||
Net assets at end of period (000 omitted) | $21,542 | $20,424 | $27,434 | $34,421 | $34,040 | |||||||||||||||
| Class C | Year ended | |||||||||||||||||||
| 5/31/21 | 5/31/20 | 5/31/19 | 5/31/18 | 5/31/17 | ||||||||||||||||
Net asset value, beginning of period | $18.36 | $18.28 | $19.20 | $17.65 | $15.23 | |||||||||||||||
| Income (loss) from investment operations |
| |||||||||||||||||||
Net investment income (loss) (d)(l) | $(0.06 | ) | $0.10 | $0.22 | $0.07 | $0.09 | (c) | |||||||||||||
Net realized and unrealized gain (loss) | 6.76 | 0.30 | (0.81 | ) | 1.64 | 2.51 | ||||||||||||||
Total from investment operations | $6.70 | $0.40 | $(0.59 | ) | $1.71 | $2.60 | ||||||||||||||
| Less distributions declared to shareholders |
| |||||||||||||||||||
From net investment income | $— | $(0.10 | ) | $(0.21 | ) | $(0.16 | ) | $(0.18 | ) | |||||||||||
From net realized gain | (0.23 | ) | (0.22 | ) | (0.12 | ) | — | — | ||||||||||||
Total distributions declared to shareholders | $(0.23 | ) | $(0.32 | ) | $(0.33 | ) | $(0.16 | ) | $(0.18 | ) | ||||||||||
Net asset value, end of period (x) | $24.83 | $18.36 | $18.28 | $19.20 | $17.65 | |||||||||||||||
Total return (%) (r)(s)(t)(x) | 36.57 | 2.04 | (2.87 | ) | 9.67 | 17.28 | (c) | |||||||||||||
| Ratios (%) (to average net assets) and Supplemental data: |
| |||||||||||||||||||
Expenses before expense reductions (f)(h) | 1.11 | 1.12 | 1.11 | 1.12 | 1.12 | (c) | ||||||||||||||
Expenses after expense reductions (f)(h) | 1.09 | 1.10 | 1.09 | 1.10 | 1.10 | (c) | ||||||||||||||
Net investment income (loss) (l) | (0.28 | ) | 0.53 | 1.21 | 0.37 | 0.57 | (c) | |||||||||||||
Portfolio turnover | 9 | 6 | 1 | 1 | 3 | |||||||||||||||
Net assets at end of period (000 omitted) | $489,683 | $419,045 | $472,251 | $517,523 | $470,214 | |||||||||||||||
See Notes to Financial Statements
16
Table of Contents
Financial Highlights – continued
| Class I | Year ended | |||||||||||||||||||
| 5/31/21 | 5/31/20 | 5/31/19 | 5/31/18 | 5/31/17 | ||||||||||||||||
Net asset value, beginning of period | $19.01 | $18.91 | $19.89 | $18.25 | $15.75 | |||||||||||||||
| Income (loss) from investment operations |
| |||||||||||||||||||
Net investment income (loss) (d)(l) | $0.16 | $0.30 | $0.42 | $0.30 | $0.23 | (c) | ||||||||||||||
Net realized and unrealized gain (loss) | 7.03 | 0.32 | (0.86 | ) | 1.66 | 2.61 | ||||||||||||||
Total from investment operations | $7.19 | $0.62 | $(0.44 | ) | $1.96 | $2.84 | ||||||||||||||
| Less distributions declared to shareholders |
| |||||||||||||||||||
From net investment income | $(0.16 | ) | $(0.30 | ) | $(0.42 | ) | $(0.32 | ) | $(0.34 | ) | ||||||||||
From net realized gain | (0.23 | ) | (0.22 | ) | (0.12 | ) | — | — | ||||||||||||
Total distributions declared to shareholders | $(0.39 | ) | $(0.52 | ) | $(0.54 | ) | $(0.32 | ) | $(0.34 | ) | ||||||||||
Net asset value, end of period (x) | $25.81 | $19.01 | $18.91 | $19.89 | $18.25 | |||||||||||||||
Total return (%) (r)(s)(t)(x) | 38.00 | 3.04 | (1.91 | ) | 10.78 | 18.42 | (c) | |||||||||||||
| Ratios (%) (to average net assets) and Supplemental data: |
| |||||||||||||||||||
Expenses before expense reductions (f)(h) | 0.11 | 0.12 | 0.11 | 0.13 | 0.12 | (c) | ||||||||||||||
Expenses after expense reductions (f)(h) | 0.09 | 0.10 | 0.09 | 0.10 | 0.10 | (c) | ||||||||||||||
Net investment income (loss) (l) | 0.71 | 1.56 | 2.21 | 1.56 | 1.39 | (c) | ||||||||||||||
Portfolio turnover | 9 | 6 | 1 | 1 | 3 | |||||||||||||||
Net assets at end of period (000 omitted) | $17,850,569 | $9,936,595 | $7,848,998 | $5,199,628 | $4,166,366 | |||||||||||||||
| Class R1 | Year ended | |||||||||||||||||||
| 5/31/21 | 5/31/20 | 5/31/19 | 5/31/18 | 5/31/17 | ||||||||||||||||
Net asset value, beginning of period | $18.04 | $17.99 | $18.93 | $17.39 | $15.01 | |||||||||||||||
| Income (loss) from investment operations |
| |||||||||||||||||||
Net investment income (loss) (d)(l) | $(0.07 | ) | $0.12 | $0.22 | $0.06 | $0.09 | (c) | |||||||||||||
Net realized and unrealized gain (loss) | 6.66 | 0.28 | (0.81 | ) | 1.63 | 2.47 | ||||||||||||||
Total from investment operations | $6.59 | $0.40 | $(0.59 | ) | $1.69 | $2.56 | ||||||||||||||
| Less distributions declared to shareholders |
| |||||||||||||||||||
From net investment income | $— | $(0.13 | ) | $(0.23 | ) | $(0.15 | ) | $(0.18 | ) | |||||||||||
From net realized gain | (0.23 | ) | (0.22 | ) | (0.12 | ) | — | — | ||||||||||||
Total distributions declared to shareholders | $(0.23 | ) | $(0.35 | ) | $(0.35 | ) | $(0.15 | ) | $(0.18 | ) | ||||||||||
Net asset value, end of period (x) | $24.40 | $18.04 | $17.99 | $18.93 | $17.39 | |||||||||||||||
Total return (%) (r)(s)(t)(x) | 36.61 | 2.04 | (2.91 | ) | 9.70 | 17.29 | (c) | |||||||||||||
| Ratios (%) (to average net assets) and Supplemental data: |
| |||||||||||||||||||
Expenses before expense reductions (f)(h) | 1.11 | 1.12 | 1.11 | 1.12 | 1.12 | (c) | ||||||||||||||
Expenses after expense reductions (f)(h) | 1.09 | 1.10 | 1.09 | 1.10 | 1.10 | (c) | ||||||||||||||
Net investment income (loss) (l) | (0.31 | ) | 0.67 | 1.23 | 0.33 | 0.58 | (c) | |||||||||||||
Portfolio turnover | 9 | 6 | 1 | 1 | 3 | |||||||||||||||
Net assets at end of period (000 omitted) | $10,359 | $7,756 | $8,625 | $8,912 | $8,716 | |||||||||||||||
See Notes to Financial Statements
17
Table of Contents
Financial Highlights – continued
| Class R2 | Year ended | |||||||||||||||||||
| 5/31/21 | 5/31/20 | 5/31/19 | 5/31/18 | 5/31/17 | ||||||||||||||||
Net asset value, beginning of period | $18.49 | $18.39 | $19.34 | $17.76 | $15.34 | |||||||||||||||
| Income (loss) from investment operations |
| |||||||||||||||||||
Net investment income (loss) (d)(l) | $0.06 | $0.19 | $0.33 | $0.16 | $0.17 | (c) | ||||||||||||||
Net realized and unrealized gain (loss) | 6.80 | 0.33 | (0.84 | ) | 1.65 | 2.52 | ||||||||||||||
Total from investment operations | $6.86 | $0.52 | $(0.51 | ) | $1.81 | $2.69 | ||||||||||||||
| Less distributions declared to shareholders |
| |||||||||||||||||||
From net investment income | $(0.07 | ) | $(0.20 | ) | $(0.32 | ) | $(0.23 | ) | $(0.27 | ) | ||||||||||
From net realized gain | (0.23 | ) | (0.22 | ) | (0.12 | ) | — | — | ||||||||||||
Total distributions declared to shareholders | $(0.30 | ) | $(0.42 | ) | $(0.44 | ) | $(0.23 | ) | $(0.27 | ) | ||||||||||
Net asset value, end of period (x) | $25.05 | $18.49 | $18.39 | $19.34 | $17.76 | |||||||||||||||
Total return (%) (r)(s)(t)(x) | 37.21 | 2.60 | (2.41 | ) | 10.20 | 17.82 | (c) | |||||||||||||
| Ratios (%) (to average net assets) and Supplemental data: |
| |||||||||||||||||||
Expenses before expense reductions (f)(h) | 0.61 | 0.62 | 0.61 | 0.62 | 0.62 | (c) | ||||||||||||||
Expenses after expense reductions (f)(h) | 0.59 | 0.60 | 0.59 | 0.60 | 0.60 | (c) | ||||||||||||||
Net investment income (loss) (l) | 0.26 | 1.02 | 1.75 | 0.84 | 1.07 | (c) | ||||||||||||||
Portfolio turnover | 9 | 6 | 1 | 1 | 3 | |||||||||||||||
Net assets at end of period (000 omitted) | $74,611 | $53,110 | $61,929 | $73,998 | $72,991 | |||||||||||||||
| Class R3 | Year ended | |||||||||||||||||||
| 5/31/21 | 5/31/20 | 5/31/19 | 5/31/18 | 5/31/17 | ||||||||||||||||
Net asset value, beginning of period | $18.66 | $18.57 | $19.54 | $17.95 | $15.49 | |||||||||||||||
| Income (loss) from investment operations |
| |||||||||||||||||||
Net investment income (loss) (d)(l) | $0.11 | $0.24 | $0.35 | $0.21 | $0.21 | (c) | ||||||||||||||
Net realized and unrealized gain (loss) | 6.88 | 0.33 | (0.82 | ) | 1.66 | 2.55 | ||||||||||||||
Total from investment operations | $6.99 | $0.57 | $(0.47 | ) | $1.87 | $2.76 | ||||||||||||||
| Less distributions declared to shareholders |
| |||||||||||||||||||
From net investment income | $(0.12 | ) | $(0.26 | ) | $(0.38 | ) | $(0.28 | ) | $(0.30 | ) | ||||||||||
From net realized gain | (0.23 | ) | (0.22 | ) | (0.12 | ) | — | — | ||||||||||||
Total distributions declared to shareholders | $(0.35 | ) | $(0.48 | ) | $(0.50 | ) | $(0.28 | ) | $(0.30 | ) | ||||||||||
Net asset value, end of period (x) | $25.30 | $18.66 | $18.57 | $19.54 | $17.95 | |||||||||||||||
Total return (%) (r)(s)(t)(x) | 37.61 | 2.83 | (2.15 | ) | 10.44 | 18.19 | (c) | |||||||||||||
| Ratios (%) (to average net assets) and Supplemental data: |
| |||||||||||||||||||
Expenses before expense reductions (f)(h) | 0.36 | 0.38 | 0.36 | 0.38 | 0.37 | (c) | ||||||||||||||
Expenses after expense reductions (f)(h) | 0.34 | 0.35 | 0.34 | 0.35 | 0.35 | (c) | ||||||||||||||
Net investment income (loss) (l) | 0.49 | 1.25 | 1.86 | 1.09 | 1.32 | (c) | ||||||||||||||
Portfolio turnover | 9 | 6 | 1 | 1 | 3 | |||||||||||||||
Net assets at end of period (000 omitted) | $1,318,182 | $724,023 | $523,367 | $391,082 | $289,853 | |||||||||||||||
See Notes to Financial Statements
18
Table of Contents
Financial Highlights – continued
| Class R4 | Year ended | |||||||||||||||||||
| 5/31/21 | 5/31/20 | 5/31/19 | 5/31/18 | 5/31/17 | ||||||||||||||||
Net asset value, beginning of period | $18.95 | $18.85 | $19.82 | $18.19 | $15.70 | |||||||||||||||
| Income (loss) from investment operations |
| |||||||||||||||||||
Net investment income (loss) (d)(l) | $0.18 | $0.32 | $0.42 | $0.26 | $0.26 | (c) | ||||||||||||||
Net realized and unrealized gain (loss) | 6.99 | 0.30 | (0.85 | ) | 1.69 | 2.57 | ||||||||||||||
Total from investment operations | $7.17 | $0.62 | $(0.43 | ) | $1.95 | $2.83 | ||||||||||||||
| Less distributions declared to shareholders |
| |||||||||||||||||||
From net investment income | $(0.17 | ) | $(0.30 | ) | $(0.42 | ) | $(0.32 | ) | $(0.34 | ) | ||||||||||
From net realized gain | (0.23 | ) | (0.22 | ) | (0.12 | ) | — | — | ||||||||||||
Total distributions declared to shareholders | $(0.40 | ) | $(0.52 | ) | $(0.54 | ) | $(0.32 | ) | $(0.34 | ) | ||||||||||
Net asset value, end of period (x) | $25.72 | $18.95 | $18.85 | $19.82 | $18.19 | |||||||||||||||
Total return (%) (r)(s)(t)(x) | 37.96 | 3.04 | (1.89 | ) | 10.75 | 18.42 | (c) | |||||||||||||
| Ratios (%) (to average net assets) and Supplemental data: |
| |||||||||||||||||||
Expenses before expense reductions (f)(h) | 0.11 | 0.12 | 0.11 | 0.13 | 0.12 | (c) | ||||||||||||||
Expenses after expense reductions (f)(h) | 0.09 | 0.10 | 0.09 | 0.10 | 0.10 | (c) | ||||||||||||||
Net investment income (loss) (l) | 0.77 | 1.62 | 2.22 | 1.32 | 1.57 | (c) | ||||||||||||||
Portfolio turnover | 9 | 6 | 1 | 1 | 3 | |||||||||||||||
Net assets at end of period (000 omitted) | $1,277,938 | $721,937 | $779,264 | $948,409 | $829,724 | |||||||||||||||
| Class R6 | Year ended | |||||||||||||||||||
| 5/31/21 | 5/31/20 | 5/31/19 | 5/31/18 (i) | |||||||||||||||||
Net asset value, beginning of period | $19.03 | $18.92 | $19.90 | $19.09 | ||||||||||||||||
| Income (loss) from investment operations |
| |||||||||||||||||||
Net investment income (loss) (d)(l) | $0.19 | $0.32 | $0.43 | $0.02 | ||||||||||||||||
Net realized and unrealized gain (loss) | 7.03 | 0.33 | (0.85 | ) | 1.12 | |||||||||||||||
Total from investment operations | $7.22 | $0.65 | $(0.42 | ) | $1.14 | |||||||||||||||
| Less distributions declared to shareholders |
| |||||||||||||||||||
From net investment income | $(0.18 | ) | $(0.32 | ) | $(0.44 | ) | $(0.33 | ) | ||||||||||||
From net realized gain | (0.23 | ) | (0.22 | ) | (0.12 | ) | — | |||||||||||||
Total distributions declared to shareholders | $(0.41 | ) | $(0.54 | ) | $(0.56 | ) | $(0.33 | ) | ||||||||||||
Net asset value, end of period (x) | $25.84 | $19.03 | $18.92 | $19.90 | ||||||||||||||||
Total return (%) (r)(s)(t)(x) | 38.12 | 3.17 | (1.82 | ) | 5.98 | (n) | ||||||||||||||
| Ratios (%) (to average net assets) and Supplemental data: |
| |||||||||||||||||||
Expenses before expense reductions (f)(h) | 0.02 | 0.02 | 0.02 | 0.03 | (a) | |||||||||||||||
Expenses after expense reductions (f)(h) | 0.00 | 0.00 | 0.00 | 0.00 | (a) | |||||||||||||||
Net investment income (loss) (l) | 0.81 | 1.65 | 2.25 | 0.13 | (a) | |||||||||||||||
Portfolio turnover | 9 | 6 | 1 | 1 | (n) | |||||||||||||||
Net assets at end of period (000 omitted) | $13,046,306 | $6,984,049 | $4,526,554 | $2,698,739 | ||||||||||||||||
See Notes to Financial Statements
19
Table of Contents
Financial Highlights – continued
| (a) | Annualized. |
| (c) | Amount reflects a one-time reimbursement of expenses by the custodian (or former custodian) without which net investment income and performance would be lower and expenses would be higher. |
| (d) | Per share data is based on average shares outstanding. |
| (f) | Ratios do not reflect reductions from fees paid indirectly, if applicable. |
| (h) | In addition to the fees and expenses which the fund bears directly, the fund indirectly bears a pro rata share of the fees and expenses of the underlying affiliated funds in which the fund invests. Accordingly, the expense ratio for the fund reflects only those fees and expenses borne directly by the fund. Because the underlying affiliated funds have varied expense and fee levels and the fund may own different proportions of the underlying affiliated funds at different times, the amount of fees and expenses incurred indirectly by the fund will vary. |
| (i) | For Class R6, the period is from the class inception, October 2, 2017, through the stated period end. |
| (l) | The ratios and per share amounts do not include net investment income of the underlying affiliated funds in which the fund invests. |
| (n) | Not annualized. |
| (r) | Certain expenses have been reduced without which performance would have been lower. |
| (s) | From time to time the fund may receive proceeds from litigation settlements, without which performance would be lower. |
| (t) | Total returns do not include any applicable sales charges. |
| (x) | The net asset values and total returns have been calculated on net assets which include adjustments made in accordance with U.S. generally accepted accounting principles required at period end for financial reporting purposes. |
See Notes to Financial Statements
20
Table of Contents
(1) Business and Organization
MFS International Diversification Fund (the fund) is a diversified series of MFS Series Trust X (the trust). The trust is organized as a Massachusetts business trust and is registered under the Investment Company Act of 1940, as amended, as an open-end management investment company.
The fund is an investment company and accordingly follows the investment company accounting and reporting guidance of the Financial Accounting Standards Board (FASB) Accounting Standards Codification Topic 946 Financial Services – Investment Companies.
(2) Significant Accounting Policies
General – The preparation of financial statements in conformity with U.S. generally accepted accounting principles requires management to make estimates and assumptions that affect the reported amounts of assets and liabilities, and disclosure of contingent assets and liabilities at the date of the financial statements and the reported amounts of increases and decreases in net assets from operations during the reporting period. Actual results could differ from those estimates. In the preparation of these financial statements, management has evaluated subsequent events occurring after the date of the fund’s Statement of Assets and Liabilities through the date that the financial statements were issued.
The fund is a “fund of funds”, which invests the majority of its assets in other MFS mutual funds (underlying funds), which may have different fiscal year ends than the fund. The underlying funds, in turn, may engage in a number of investment techniques and practices, which involve certain risks. Certain underlying funds can invest in foreign securities, including securities of emerging market issuers. Investments in foreign securities are vulnerable to the effects of changes in the relative values of the local currency and the U.S. dollar and to the effects of changes in each country’s market, economic, industrial, political, regulatory, geopolitical, environmental, public health, and other conditions. Investments in emerging markets can involve additional and greater risks than the risks associated with investments in developed foreign markets. Emerging markets can have less developed markets, greater custody and operational risk, less developed legal, regulatory, accounting, and auditing systems, and greater political, social, and economic instability than developed markets.
The accounting policies of the underlying funds in which the fund invests are outlined in the underlying funds’ shareholder reports, which are available without charge by calling 1-800-225-2606, at mfs.com and on the Securities and Exchange Commission (SEC) web site at http://www.sec.gov. The underlying funds’ shareholder reports are not covered by this report.
The investment objective of each of the international stock funds held by the fund at May 31, 2021 was to seek capital appreciation.
In March 2020, the FASB issued Accounting Standards Update 2020-04, Reference Rate Reform (Topic 848) – Facilitation of the Effects of Reference Rate Reform on Financial Reporting (“ASU 2020-04”), which provides optional, temporary relief for certain reference rate-related contract modifications due to the planned
21
Table of Contents
Notes to Financial Statements – continued
discontinuation of the London Interbank Offered Rate (LIBOR) and other IBOR-based reference rates as of the end of 2021. In March 2021, the administrator for LIBOR announced the extension of the publication of the more commonly used U.S. dollar LIBOR settings to the end of June 2023. Management is still evaluating the impact of ASU 2020-04 on the fund’s accounting for investments, derivatives, debt and other contracts that will undergo reference rate-related modifications as a result of the reference rate reform.
Investment Valuations – Open-end investment companies (underlying funds) are generally valued at their net asset value per share. The investments of underlying funds managed by the adviser are valued as described below. For purposes of this policy disclosure, “fund” also refers to the underlying funds in which the fund-of-funds invests.
Equity securities, including restricted equity securities and equity securities sold short, are generally valued at the last sale or official closing price on their primary market or exchange as provided by a third-party pricing service. Equity securities, for which there were no sales reported that day, are generally valued at the last quoted daily bid quotation on their primary market or exchange as provided by a third-party pricing service. Equity securities sold short, for which there were no sales reported that day, are generally valued at the last quoted daily ask quotation on their primary market or exchange as provided by a third-party pricing service. Debt instruments and floating rate loans, including restricted debt instruments, are generally valued at an evaluated or composite bid as provided by a third-party pricing service. Debt instruments sold short are generally valued at an evaluated or composite mean as provided by a third-party pricing service. Short-term instruments with a maturity at issuance of 60 days or less may be valued at amortized cost, which approximates market value. Exchange-traded options are generally valued at the last sale or official closing price on their primary exchange as provided by a third-party pricing service. Exchange-traded options for which there were no sales reported that day are generally valued at the last daily bid quotation on their primary exchange as provided by a third-party pricing service. For put options, the position may be valued at the last daily ask quotation if there are no trades reported during the day. Options not traded on an exchange are generally valued at a broker/dealer bid quotation. Foreign currency options are generally valued at valuations provided by a third-party pricing service. Futures contracts are generally valued at last posted settlement price on their primary exchange as provided by a third-party pricing service. Futures contracts for which there were no trades that day for a particular position are generally valued at the closing bid quotation on their primary exchange as provided by a third-party pricing service. Forward foreign currency exchange contracts are generally valued at the mean of bid and asked prices for the time period interpolated from rates provided by a third-party pricing service for proximate time periods. Swap agreements are generally valued using valuations provided by a third-party pricing service, which for cleared swaps includes an evaluation of any trading activity at the clearinghouses. Open-end investment companies are generally valued at net asset value per share. Securities and other assets generally valued on the basis of information from a third-party pricing service may also be valued at a broker/dealer bid quotation. In determining values, third-party pricing services can utilize both transaction data and market information such as yield, quality,
22
Table of Contents
Notes to Financial Statements – continued
coupon rate, maturity, type of issue, trading characteristics, and other market data. The values of foreign securities and other assets and liabilities expressed in foreign currencies are converted to U.S. dollars using the mean of bid and asked prices for rates provided by a third-party pricing service.
The Board of Trustees has delegated primary responsibility for determining or causing to be determined the value of the fund’s investments (including any fair valuation) to the adviser pursuant to valuation policies and procedures approved by the Board. If the adviser determines that reliable market quotations are not readily available, investments are valued at fair value as determined in good faith by the adviser in accordance with such procedures under the oversight of the Board of Trustees. Under the fund’s valuation policies and procedures, market quotations are not considered to be readily available for most types of debt instruments and floating rate loans and many types of derivatives. These investments are generally valued at fair value based on information from third-party pricing services. In addition, investments may be valued at fair value if the adviser determines that an investment’s value has been materially affected by events occurring after the close of the exchange or market on which the investment is principally traded (such as foreign exchange or market) and prior to the determination of the fund’s net asset value, or after the halt of trading of a specific security where trading does not resume prior to the close of the exchange or market on which the security is principally traded. Events that occur after foreign markets close (such as developments in foreign markets and significant movements in the U.S. markets) and prior to the determination of the fund’s net asset value may be deemed to have a material effect on the value of securities traded in foreign markets. Accordingly, the fund’s foreign equity securities may often be valued at fair value. The adviser generally relies on third-party pricing services or other information (such as the correlation with price movements of similar securities in the same or other markets; the type, cost and investment characteristics of the security; the business and financial condition of the issuer; and trading and other market data) to assist in determining whether to fair value and at what value to fair value an investment. The value of an investment for purposes of calculating the fund’s net asset value can differ depending on the source and method used to determine value. When fair valuation is used, the value of an investment used to determine the fund’s net asset value may differ from quoted or published prices for the same investment. There can be no assurance that the fund could obtain the fair value assigned to an investment if it were to sell the investment at the same time at which the fund determines its net asset value per share.
Various inputs are used in determining the value of the fund’s assets or liabilities. These inputs are categorized into three broad levels. In certain cases, the inputs used to measure fair value may fall into different levels of the fair value hierarchy. In such cases, an investment’s level within the fair value hierarchy is based on the lowest level of input that is significant to the fair value measurement. The fund’s assessment of the significance of a particular input to the fair value measurement in its entirety requires judgment, and considers factors specific to the investment. Level 1 includes unadjusted quoted prices in active markets for identical assets or liabilities. Level 2 includes other significant observable market-based inputs (including quoted prices for similar securities, interest rates, prepayment speed, and credit risk). Investments in certain underlying funds may be categorized as level 2 where the net asset value per share of
23
Table of Contents
Notes to Financial Statements – continued
an underlying fund was adjusted to reflect security valuations in foreign markets open on May 31, 2021, which was a U.S. market holiday. Level 3 includes unobservable inputs, which may include the adviser’s own assumptions in determining the fair value of investments. The following is a summary of the levels used as of May 31, 2021 in valuing the fund’s assets or liabilities:
| Financial Instruments | Level 1 | Level 2 | Level 3 | Total | ||||||||||||
| Mutual Funds | $58,625,841 | $38,398,487,035 | $— | $38,457,112,876 | ||||||||||||
For further information regarding security characteristics, see the Portfolio of Investments. Please refer to the underlying funds’ shareholder reports for further information regarding the levels used in valuing the underlying funds’ assets or liabilities.
Derivatives – The fund does not invest in derivatives directly. The fund does invest in underlying funds that may use derivatives primarily to increase or decrease exposure to a particular market or segment of the market, or security, to increase or decrease interest rate or currency exposure, or as alternatives to direct investments. Derivatives are used for hedging or non-hedging purposes. While hedging can reduce or eliminate losses, it can also reduce or eliminate gains. When the underlying funds use derivatives as an investment to increase market exposure, or for hedging purposes, gains and losses from derivative instruments may be substantially greater than the derivative’s original cost.
Indemnifications – Under the fund’s organizational documents, its officers and Trustees may be indemnified against certain liabilities and expenses arising out of the performance of their duties to the fund. Additionally, in the normal course of business, the fund enters into agreements with service providers that may contain indemnification clauses. The fund’s maximum exposure under these agreements is unknown as this would involve future claims that may be made against the fund that have not yet occurred.
Investment Transactions and Income – Investment transactions are recorded on the trade date. Interest income is recorded on the accrual basis. All premium and discount is amortized or accreted for financial statement purposes in accordance with U.S. generally accepted accounting principles. Distributions of income and capital gains from the underlying funds are recorded on the ex-dividend date. Recognition of net investment income by the fund is affected by the timing of the declaration of distributions by the underlying funds in which the fund invests. In determining the net gain or loss on securities sold, the cost of securities is determined on the identified cost basis.
The fund and/or the underlying funds may receive proceeds from litigation settlements. Any proceeds received from litigation involving portfolio holdings are reflected in the Statement of Operations in realized gain/loss if the security has been disposed of by the fund or in unrealized gain/loss if the security is still held by the fund. Any other proceeds from litigation not related to portfolio holdings are reflected as other income in the Statement of Operations.
Tax Matters and Distributions – The fund intends to qualify as a regulated investment company, as defined under Subchapter M of the Internal Revenue Code,
24
Table of Contents
Notes to Financial Statements – continued
and to distribute all of its taxable income, including realized capital gains. As a result, no provision for federal income tax is required. The fund’s federal tax returns, when filed, will remain subject to examination by the Internal Revenue Service for a three year period. Management has analyzed the fund’s tax positions taken on federal and state tax returns for all open tax years and does not believe that there are any uncertain tax positions that require recognition of a tax liability.
Distributions to shareholders are recorded on the ex-dividend date. Income and capital gain distributions are determined in accordance with income tax regulations, which may differ from U.S. generally accepted accounting principles. Certain capital accounts in the financial statements are periodically adjusted for permanent differences in order to reflect their tax character. These adjustments have no impact on net assets or net asset value per share. Temporary differences which arise from recognizing certain items of income, expense, gain or loss in different periods for financial statement and tax purposes will reverse at some time in the future.
Book/tax differences primarily relate to wash sale loss deferrals and treating a portion of the proceeds from redemptions as a distribution for tax purposes.
The tax character of distributions declared to shareholders for the last two fiscal years is as follows:
| Year ended 5/31/21 | Year ended 5/31/20 | |||||||
| Ordinary income (including any short-term capital gains) | $277,409,258 | $300,909,086 | ||||||
| Long-term capital gains | 233,000,351 | 230,005,549 | ||||||
| Total distributions | $510,409,609 | $530,914,635 | ||||||
The federal tax cost and the tax basis components of distributable earnings were as follows:
| As of 5/31/21 | ||||
| Cost of investments | $29,020,311,544 | |||
| Gross appreciation | 9,436,801,332 | |||
| Gross depreciation | — | |||
| Net unrealized appreciation (depreciation) | $9,436,801,332 | |||
| Undistributed long-term capital gain | 322,074,685 | |||
| Late year ordinary loss deferral | (10,662,213 | ) | ||
| Total distributable earnings (loss) | $9,748,213,804 | |||
Multiple Classes of Shares of Beneficial Interest – The fund offers multiple classes of shares, which differ in their respective distribution and service fees. The fund’s income, realized and unrealized gain (loss), and common expenses are allocated to shareholders based on the daily net assets of each class. Dividends are declared separately for each class. Differences in per share dividend rates are generally due to differences in separate class expenses. Class B and Class C shares will convert to
25
Table of Contents
Notes to Financial Statements – continued
Class A shares approximately eight years after purchase. The fund’s distributions declared to shareholders as reported in the Statements of Changes in Net Assets are presented by class as follows:
| Year ended 5/31/21 | Year ended 5/31/20 | |||||||
| Class A | $54,125,738 | $67,819,520 | ||||||
| Class B | 213,326 | 387,736 | ||||||
| Class C | 4,479,788 | 7,858,901 | ||||||
| Class I | 234,694,883 | 253,102,831 | ||||||
| Class R1 | 89,616 | 182,773 | ||||||
| Class R2 | 916,813 | 1,278,642 | ||||||
| Class R3 | 16,313,822 | 15,677,872 | ||||||
| Class R4 | 19,501,248 | 22,450,225 | ||||||
| Class R6 | 180,074,375 | 162,156,135 | ||||||
| Total | $510,409,609 | $530,914,635 | ||||||
(3) Transactions with Affiliates
Investment Adviser – The fund has an investment advisory agreement with MFS to provide overall investment management and related administrative services and facilities to the fund. MFS receives no compensation under this agreement; however MFS receives management fees from the underlying MFS funds.
The investment adviser has agreed in writing to pay a portion of the fund’s operating expenses, excluding distribution and service fees, interest, taxes, extraordinary expenses, brokerage and transaction costs, and investment-related expenses (such as fees and expenses associated with investments in investment companies and other similar investment vehicles), such that fund operating expenses do not exceed 0.10% annually of the class’s average daily net assets for each of Class A, Class B, Class C, Class I, Class R1, Class R2, Class R3, and Class R4 shares and 0.00% annually of the class’s average daily net assets for Class R6 shares. This written agreement will continue until modified by the fund’s Board of Trustees, but such agreement will continue at least until September 30, 2022. For the year ended May 31, 2021, this reduction amounted to $5,088,995, which is included in the reduction of total expenses in the Statement of Operations.
In addition to the fees and expenses which the fund bears directly, the fund indirectly bears a pro rata share of the fees and expenses of the underlying funds in which the fund invests. Accordingly, the expense ratio for the fund reflects only those fees and expenses borne directly by the fund.
Distributor – MFS Fund Distributors, Inc. (MFD), a wholly-owned subsidiary of MFS, as distributor, received $715,211 for the year ended May 31, 2021, as its portion of the initial sales charge on sales of Class A shares of the fund.
The Board of Trustees has adopted a distribution plan for certain share classes pursuant to Rule 12b-1 of the Investment Company Act of 1940.
The fund’s distribution plan provides that the fund will pay MFD for services provided by MFD and financial intermediaries in connection with the distribution and servicing of certain share classes. One component of the plan is a distribution fee paid to MFD and
26
Table of Contents
Notes to Financial Statements – continued
another component of the plan is a service fee paid to MFD. MFD may subsequently pay all, or a portion, of the distribution and/or service fees to financial intermediaries.
Distribution Plan Fee Table:
| Distribution Fee Rate (d) | Service Fee Rate (d) | Total Distribution Plan (d) | Annual Effective Rate (e) | Distribution and Service Fee | ||||||||||||||||
| Class A | — | 0.25% | 0.25% | 0.25% | $8,948,554 | |||||||||||||||
| Class B | 0.75% | 0.25% | 1.00% | 1.00% | 215,998 | |||||||||||||||
| Class C | 0.75% | 0.25% | 1.00% | 1.00% | 4,545,360 | |||||||||||||||
| Class R1 | 0.75% | 0.25% | 1.00% | 1.00% | 88,598 | |||||||||||||||
| Class R2 | 0.25% | 0.25% | 0.50% | 0.50% | 326,018 | |||||||||||||||
| Class R3 | — | 0.25% | 0.25% | 0.25% | 2,557,686 | |||||||||||||||
| Total Distribution and Service Fees |
| $16,682,214 | ||||||||||||||||||
| (d) | In accordance with the distribution plan for certain classes, the fund pays distribution and/or service fees equal to these annual percentage rates of each class’s average daily net assets. The distribution and service fee rates disclosed by class represent the current rates in effect at the end of the reporting period. Any rate changes, if applicable, are detailed below. |
| (e) | The annual effective rates represent actual fees incurred under the distribution plan for the year ended May 31, 2021 based on each class’s average daily net assets. MFD has voluntarily agreed to rebate a portion of each class’s 0.25% service fee attributable to accounts for which there is no financial intermediary specified on the account except for accounts attributable to MFS or its affiliates’ seed money. For the year ended May 31, 2021, this rebate amounted to $2,207, $9, $56, and $32 for Class A, Class B, Class C, and Class R3, respectively, and is included in the reduction of total expenses in the Statement of Operations. |
Certain Class A shares are subject to a contingent deferred sales charge (CDSC) in the event of a shareholder redemption within 18 months of purchase. Class B shares are subject to a CDSC in the event of a shareholder redemption within six years of purchase. Class C shares are subject to a CDSC in the event of a shareholder redemption within 12 months of purchase. All contingent deferred sales charges are paid to MFD and during the year ended May 31, 2021, were as follows:
| Amount | ||||
| Class A | $44,798 | |||
| Class B | 16,612 | |||
| Class C | 33,952 | |||
Shareholder Servicing Agent – MFS Service Center, Inc. (MFSC), a wholly-owned subsidiary of MFS, receives a fee from the fund for its services as shareholder servicing agent calculated as a percentage of the average daily net assets of the fund as determined periodically under the supervision of the fund’s Board of Trustees. For the year ended May 31, 2021, the fee was $778,978, which equated to 0.0026% annually of the fund’s average daily net assets. MFSC also receives reimbursement from the fund for out-of-pocket expenses, sub-accounting and other shareholder servicing costs which may be paid to affiliated and unaffiliated service providers. Class R6 shares do not incur sub-accounting fees. For the year ended May 31, 2021, these out-of-pocket expenses, sub-accounting and other shareholder servicing costs amounted to $18,999,426.
27
Table of Contents
Notes to Financial Statements – continued
Administrator – MFS provides certain financial, legal, shareholder communications, compliance, and other administrative services to the fund. Under an administrative services agreement, the fund reimburses MFS the costs incurred to provide these services. The fund pays an annual fixed amount of $17,500. The administrative services fee incurred for the year ended May 31, 2021 was equivalent to an annual effective rate of 0.0001% of the fund’s average daily net assets.
Trustees’ and Officers’ Compensation – The fund pays compensation to independent Trustees in the form of a retainer, attendance fees, and additional compensation to Board and Committee chairpersons. The fund does not pay compensation directly to Trustees or officers of the fund who are also officers of the investment adviser, all of whom receive remuneration from MFS for their services to the fund. Certain officers and Trustees of the fund are officers or directors of MFS, MFD, and MFSC.
Other – The fund invests in the MFS Institutional Money Market Portfolio which is managed by MFS and seeks current income consistent with preservation of capital and liquidity. This money market fund does not pay a management fee to MFS but does incur investment and operating costs.
(4) Portfolio Securities
For the year ended May 31, 2021, purchases and sales of shares of underlying funds, excluding the MFS Institutional Money Market Portfolio, aggregated $10,356,017,597 and $2,747,612,308, respectively.
(5) Shares of Beneficial Interest
The fund’s Declaration of Trust permits the Trustees to issue an unlimited number of full and fractional shares of beneficial interest. Transactions in fund shares were as follows:
| Year ended 5/31/21 | Year ended 5/31/20 | |||||||||||||||
| Shares | Amount | Shares | Amount | |||||||||||||
| Shares sold | ||||||||||||||||
Class A | 52,005,122 | $1,193,462,989 | 41,250,536 | $798,861,213 | ||||||||||||
Class B | 37,517 | 859,302 | 7,171 | 137,727 | ||||||||||||
Class C | 3,643,882 | 82,120,054 | 4,774,099 | 91,525,185 | ||||||||||||
Class I | 276,871,208 | 6,378,604,517 | 266,430,478 | 5,141,105,282 | ||||||||||||
Class R1 | 100,442 | 2,215,739 | 128,033 | 2,376,947 | ||||||||||||
Class R2 | 1,061,373 | 23,602,037 | 1,180,186 | 22,541,074 | ||||||||||||
Class R3 | 24,193,799 | 543,863,533 | 19,364,507 | 370,821,785 | ||||||||||||
Class R4 | 23,337,909 | 518,487,429 | 11,276,261 | 221,195,859 | ||||||||||||
Class R6 | 202,337,260 | 4,652,214,562 | 175,315,187 | 3,423,958,035 | ||||||||||||
| 583,588,512 | $13,395,430,162 | 519,726,458 | $10,072,523,107 | |||||||||||||
28
Table of Contents
Notes to Financial Statements – continued
| Year ended 5/31/21 | Year ended 5/31/20 | |||||||||||||||
| Shares | Amount | Shares | Amount | |||||||||||||
| Shares issued to shareholders in reinvestment of distributions |
| |||||||||||||||
Class A | 2,113,384 | $49,918,136 | 3,040,475 | $63,363,512 | ||||||||||||
Class B | 8,869 | 207,354 | 18,040 | 373,253 | ||||||||||||
Class C | 174,309 | 4,021,300 | 341,310 | 6,969,545 | ||||||||||||
Class I | 8,406,870 | 200,671,978 | 10,366,283 | 218,210,265 | ||||||||||||
Class R1 | 3,953 | 89,616 | 9,111 | 182,773 | ||||||||||||
Class R2 | 38,089 | 884,798 | 53,169 | 1,090,507 | ||||||||||||
Class R3 | 696,279 | 16,313,813 | 758,076 | 15,677,014 | ||||||||||||
Class R4 | 731,232 | 17,396,006 | 995,391 | 20,883,293 | ||||||||||||
Class R6 | 7,193,661 | 171,856,568 | 7,405,196 | 155,953,430 | ||||||||||||
| 19,366,646 | $461,359,569 | 22,987,051 | $482,703,592 | |||||||||||||
| Shares reacquired |
| |||||||||||||||
Class A | (30,148,837 | ) | $(684,324,402 | ) | (27,918,023 | ) | $(524,778,931 | ) | ||||||||
Class B | (287,822 | ) | (6,438,398 | ) | (410,250 | ) | (7,733,270 | ) | ||||||||
Class C | (6,919,034 | ) | (151,424,967 | ) | (8,128,098 | ) | (150,652,720 | ) | ||||||||
Class I | (116,377,076 | ) | (2,645,247,515 | ) | (169,321,688 | ) | (3,154,741,089 | ) | ||||||||
Class R1 | (109,745 | ) | (2,301,707 | ) | (186,673 | ) | (3,404,779 | ) | ||||||||
Class R2 | (994,555 | ) | (22,025,658 | ) | (1,727,193 | ) | (33,092,520 | ) | ||||||||
Class R3 | (11,600,915 | ) | (261,837,391 | ) | (9,499,079 | ) | (183,036,430 | ) | ||||||||
Class R4 | (12,480,897 | ) | (287,344,149 | ) | (15,526,585 | ) | (308,304,175 | ) | ||||||||
Class R6 | (71,645,033 | ) | (1,641,851,033 | ) | (54,979,151 | ) | (1,045,351,602 | ) | ||||||||
| (250,563,914 | ) | $(5,702,795,220 | ) | (287,696,740 | ) | $(5,411,095,516 | ) | |||||||||
| Net change |
| |||||||||||||||
Class A | 23,969,669 | $559,056,723 | 16,372,988 | $337,445,794 | ||||||||||||
Class B | (241,436 | ) | (5,371,742 | ) | (385,039 | ) | (7,222,290 | ) | ||||||||
Class C | (3,100,843 | ) | (65,283,613 | ) | (3,012,689 | ) | (52,157,990 | ) | ||||||||
Class I | 168,901,002 | 3,934,028,980 | 107,475,073 | 2,204,574,458 | ||||||||||||
Class R1 | (5,350 | ) | 3,648 | (49,529 | ) | (845,059 | ) | |||||||||
Class R2 | 104,907 | 2,461,177 | (493,838 | ) | (9,460,939 | ) | ||||||||||
Class R3 | 13,289,163 | 298,339,955 | 10,623,504 | 203,462,369 | ||||||||||||
Class R4 | 11,588,244 | 248,539,286 | (3,254,933 | ) | (66,225,023 | ) | ||||||||||
Class R6 | 137,885,888 | 3,182,220,097 | 127,741,232 | 2,534,559,863 | ||||||||||||
| 352,391,244 | $8,153,994,511 | 255,016,769 | $5,144,131,183 | |||||||||||||
Effective June 1, 2019, purchases of the fund’s Class B shares are closed to new and existing investors subject to certain exceptions. Please see the fund’s prospectus for details.
(6) Line of Credit
The fund and certain other funds managed by MFS participate in a $1.25 billion unsecured committed line of credit of which $1 billion is reserved for use by the fund and certain other MFS U.S. funds. The line of credit is provided by a syndicate of banks
29
Table of Contents
Notes to Financial Statements – continued
under a credit agreement. Borrowings may be made for temporary financing needs. Interest is charged to each fund, based on its borrowings, generally at a rate equal to the highest of one month LIBOR, the Federal Funds Effective Rate and the Overnight Bank Funding Rate, plus an agreed upon spread. A commitment fee, based on the average daily, unused portion of the committed line of credit, is allocated among the participating funds. In addition, the fund and other funds managed by MFS have established unsecured uncommitted borrowing arrangements with certain banks for temporary financing needs. Interest is charged to each fund, based on its borrowings, at rates equal to customary reference rates plus an agreed upon spread. For the year ended May 31, 2021, the fund’s commitment fee and interest expense were $122,733 and $0, respectively, and are included in “Miscellaneous” expense in the Statement of Operations.
(7) Investments in Affiliated Issuers
An affiliated issuer may be considered one in which the fund owns 5% or more of the outstanding voting securities, or a company which is under common control. For the purposes of this report, the following were affiliated issuers:
| Affiliated Issuers | Beginning Value | Purchases | Sales Proceeds | Realized Gain (Loss) | Change in Appreciation or | Ending Value | ||||||||||||||||||
| MFS Emerging Markets Equity Fund | $3,203,385,279 | $1,825,621,481 | $9,621,659 | $(877,757 | ) | $1,771,202,443 | $6,789,709,787 | |||||||||||||||||
| MFS Institutional Money Market Portfolio | 58,832,709 | 651,360,554 | 651,561,038 | (6,384 | ) | — | 58,625,841 | |||||||||||||||||
| MFS International Growth Fund | 4,837,956,951 | 725,171,051 | 1,324,771,982 | 97,098,057 | 1,418,222,867 | 5,753,676,944 | ||||||||||||||||||
| MFS International Intrinsic Value Fund | 4,870,125,294 | 1,251,117,448 | 1,343,075,721 | 123,835,069 | 845,215,492 | 5,747,217,582 | ||||||||||||||||||
| MFS International Large Cap Value Fund | — | 4,506,453,725 | 45,023,532 | 695,272 | 1,280,689,995 | 5,742,815,460 | ||||||||||||||||||
| MFS International New Discovery Fund | 2,189,290,663 | 1,001,231,102 | 552,806 | (24,174 | ) | 645,206,848 | 3,835,151,633 | |||||||||||||||||
| MFS Research International Fund | 6,472,779,783 | 1,610,525,601 | 24,566,608 | (370,647 | ) | 2,471,547,500 | 10,529,915,629 | |||||||||||||||||
| $21,632,370,679 | $11,571,480,962 | $3,399,173,346 | $220,349,436 | $8,432,085,145 | $38,457,112,876 | |||||||||||||||||||
| Affiliated Issuers | Dividend Income | Capital Gain Distributions | ||||||||||||||||||||||
| MFS Emerging Markets Equity Fund |
| $43,381,170 | $— | |||||||||||||||||||||
| MFS Institutional Money Market Portfolio |
| 53,571 | — | |||||||||||||||||||||
| MFS International Growth Fund |
| 37,611,923 | — | |||||||||||||||||||||
| MFS International Intrinsic Value Fund |
| 34,798,178 | 215,826,954 | |||||||||||||||||||||
| MFS International Large Cap Value Fund |
| 22,816,121 | — | |||||||||||||||||||||
| MFS International New Discovery Fund |
| 14,951,948 | 106,115,214 | |||||||||||||||||||||
| MFS Research International Fund |
| 88,601,303 | — | |||||||||||||||||||||
| $242,214,214 | $321,942,168 | |||||||||||||||||||||||
30
Table of Contents
Notes to Financial Statements – continued
(8) Impacts of COVID-19
The pandemic related to the global spread of novel coronavirus disease (COVID-19), which was first detected in December 2019, has resulted in significant disruptions to global business activity and the global economy, as well as the economies of individual countries, the financial performance of individual companies and sectors, and the securities and commodities markets in general. Multiple surges in cases globally, the availability and widespread adoption of vaccines, and the emergence of variant strains of the virus continue to create uncertainty as to the future and long-term impacts resulting from the pandemic including impacts to the prices and liquidity of the fund’s investments and the fund’s performance.
31
Table of Contents
REPORT OF INDEPENDENT REGISTERED PUBLIC ACCOUNTING FIRM
To the Board of Trustees of MFS Series Trust X and the Shareholders of
MFS International Diversification Fund:
Opinion on the Financial Statements and Financial Highlights
We have audited the accompanying statement of assets and liabilities of MFS International Diversification Fund (the “Fund”), including the portfolio of investments, as of May 31, 2021, the related statement of operations for the year then ended, the statements of changes in net assets for each of the two years in the period then ended, the financial highlights for each of the five years in the period then ended, and the related notes. In our opinion, the financial statements and financial highlights present fairly, in all material respects, the financial position of the Fund as of May 31, 2021, and the results of its operations for the year then ended, the changes in its net assets for each of the two years in the period then ended, and the financial highlights for each of the five years in the period then ended, in conformity with accounting principles generally accepted in the United States of America.
Basis for Opinion
These financial statements and financial highlights are the responsibility of the Fund’s management. Our responsibility is to express an opinion on the Fund’s financial statements and financial highlights based on our audits. We are a public accounting firm registered with the Public Company Accounting Oversight Board (United States) (PCAOB) and are required to be independent with respect to the Fund in accordance with the U.S. federal securities laws and the applicable rules and regulations of the Securities and Exchange Commission and the PCAOB.
We conducted our audits in accordance with the standards of the PCAOB. Those standards require that we plan and perform the audit to obtain reasonable assurance about whether the financial statements and financial highlights are free of material misstatement, whether due to error or fraud. The Fund is not required to have, nor were we engaged to perform, an audit of its internal control over financial reporting. As part of our audits we are required to obtain an understanding of internal control over financial reporting but not for the purpose of expressing an opinion on the effectiveness of the Fund’s internal control over financial reporting. Accordingly, we express no such opinion.
Our audits included performing procedures to assess the risks of material misstatement of the financial statements and financial highlights, whether due to error or fraud, and performing procedures that respond to those risks. Such procedures included examining, on a test basis, evidence regarding the amounts and disclosures in the financial statements and financial highlights. Our audits also included evaluating the accounting principles used and significant estimates made by management, as well as evaluating the overall presentation of the financial statements and financial highlights.
32
Table of Contents
Report of Independent Registered Public Accounting Firm – continued
Our procedures included confirmation of securities owned as of May 31, 2021, by correspondence with the underlying funds’ transfer agent. We believe that our audits provide a reasonable basis for our opinion.
DELOITTE & TOUCHE LLP
Boston, Massachusetts
July 16, 2021
We have served as the auditor of one or more of the MFS investment companies
since 1924.
33
Table of Contents
TRUSTEES AND OFFICERS — IDENTIFICATION AND BACKGROUND
The Trustees and Officers of the Trust, as of July 1, 2021, are listed below, together with their principal occupations during the past five years. (Their titles may have varied during that period.) The address of each Trustee and Officer is 111 Huntington Avenue, Boston, Massachusetts 02199-7618.
Name, Age | Position(s) with Fund | Trustee/Officer Since (h) | Number of | Principal the Past Five Years | Other Directorships | |||||
| INTERESTED TRUSTEES | ||||||||||
| Robert J. Manning (k) (age 57) | Trustee | February 2004 | 135 | Massachusetts Financial Services Company, Non-Executive Chairman (since January 2021); Director; Chairman of the Board; Executive Chairman (January 2017-2020); Co-Chief Executive Officer (2015-2016) | N/A | |||||
Michael W. Roberge (k) (age 54) | Trustee | January 2021 | 135 | Massachusetts Financial Services Company, Chairman (since January 2021); Chief Executive Officer (since January 2017); Director; President (until December 2018); Chief Investment Officer (until December 2018); Co-Chief Executive Officer (until December 2016) | N/A | |||||
| INDEPENDENT TRUSTEES | ||||||||||
John P. Kavanaugh (age 66) | Trustee and Chair of Trustees | January 2009 | 135 | Private investor | N/A | |||||
Steven E. Buller (age 69) | Trustee | February 2014 | 135 | Private investor | N/A | |||||
John A. Caroselli (age 67) | Trustee | March 2017 | 135 | Private investor; JC Global Advisors, LLC (management consulting), President (since 2015) | N/A | |||||
34
Table of Contents
Trustees and Officers – continued
Name, Age | Position(s) with Fund | Trustee/Officer Since (h) | Number of | Principal the Past Five Years | Other Directorships | |||||
Maureen R. Goldfarb (age 66) | Trustee | January 2009 | 135 | Private investor | N/A | |||||
| Peter D. Jones (age 65) | Trustee | January 2019 | 135 | Private investor | N/A | |||||
| James W. Kilman, Jr. (age 60) | Trustee | January 2019 | 135 | Burford Capital Limited (finance and investment management), Senior Advisor (since May 3, 2021), Chief Financial Officer (2019-May 2, 2021); KielStrand Capital LLC (family office), Chief Executive Officer (since 2016); Morgan Stanley & Co. (financial services), Vice Chairman of Investment Banking, Co-Head of Diversified Financials Coverage – Financial Institutions Investment Banking Group (until 2016) | Alpha-En Corporation, Director (2016-2019) | |||||
Clarence Otis, Jr. (age 65) | Trustee | March 2017 | 135 | Private investor | VF Corporation, Director; Verizon Communications, Inc., Director; The Travelers Companies, Director | |||||
Maryanne L. Roepke (age 65) | Trustee | May 2014 | 135 | Private investor | N/A | |||||
| Laurie J. Thomsen (age 63) | Trustee | March 2005 | 135 | Private investor | The Travelers Companies, Director; Dycom Industries, Inc., Director | |||||
35
Table of Contents
Trustees and Officers – continued
Name, Age | Position(s) Held with Fund | Trustee/Officer Since (h) | Number of | Principal the Past Five Years | ||||
| OFFICERS | ||||||||
| Christopher R. Bohane (k) (age 47) | Assistant Secretary and Assistant Clerk | July 2005 | 135 | Massachusetts Financial Services Company, Senior Vice President and Associate General Counsel | ||||
Kino Clark (k) (age 53) | Assistant Treasurer | January 2012 | 135 | Massachusetts Financial Services Company, Vice President | ||||
John W. Clark, Jr. (k) (age 54) | Assistant Treasurer | April 2017 | 135 | Massachusetts Financial Services Company, Vice President (since March 2017); Deutsche Bank (financial services), Department Head – Treasurer’s Office (until February 2017) | ||||
Thomas H. Connors (k) (age 61) | Assistant Secretary and Assistant Clerk | September 2012 | 135 | Massachusetts Financial Services Company, Vice President and Senior Counsel | ||||
| David L. DiLorenzo (k) (age 52) | President | July 2005 | 135 | Massachusetts Financial Services Company, Senior Vice President | ||||
Heidi W. Hardin (k) (age 53) | Secretary and Clerk | April 2017 | 135 | Massachusetts Financial Services Company, Executive Vice President and General Counsel (since March 2017); Harris Associates (investment management), General Counsel (until January 2017) | ||||
Brian E. Langenfeld (k) (age 48) | Assistant Secretary and Assistant Clerk | June 2006 | 135 | Massachusetts Financial Services Company, Vice President and Senior Counsel | ||||
Amanda S. Mooradian (k) (age 42) | Assistant Secretary and Assistant Clerk | September 2018 | 135 | Massachusetts Financial Services Company, Assistant Vice President and Senior Counsel | ||||
| Susan A. Pereira (k) (age 50) | Assistant Secretary and Assistant Clerk | July 2005 | 135 | Massachusetts Financial Services Company, Vice President and Assistant General Counsel | ||||
Kasey L. Phillips (k) (age 50) | Assistant Treasurer | September 2012 | 135 | Massachusetts Financial Services Company, Vice President | ||||
36
Table of Contents
Trustees and Officers – continued
Name, Age | Position(s) Held with Fund | Trustee/Officer Since (h) | Number of | Principal the Past Five Years | ||||
Matthew A. Stowe (k) (age 46) | Assistant Secretary and Assistant Clerk | October 2014 | 135 | Massachusetts Financial Services Company, Vice President and Assistant General Counsel | ||||
Martin J. Wolin (k) (age 53) | Chief Compliance Officer | July 2015 | 135 | Massachusetts Financial Services Company, Senior Vice President and Chief Compliance Officer | ||||
| James O. Yost (k) (age 61) | Treasurer | September 1990 | 135 | Massachusetts Financial Services Company, Senior Vice President | ||||
| (h) | Date first appointed to serve as Trustee/Officer of an MFS Fund. Each Trustee has served continuously since appointment unless indicated otherwise. For the period from December 15, 2004 until February 22, 2005, Mr. Manning served as Advisory Trustee. From January 2012 through December 2016, Messrs. DiLorenzo and Yost served as Treasurer and Deputy Treasurer of the Funds, respectively. |
| (j) | Directorships or trusteeships of companies required to report to the Securities and Exchange Commission (i.e., “public companies”). |
| (k) | “Interested person” of the Trust within the meaning of the Investment Company Act of 1940 (referred to as the 1940 Act), which is the principal federal law governing investment companies like the fund, as a result of a position with MFS. The address of MFS is 111 Huntington Avenue, Boston, Massachusetts 02199-7618. |
Each Trustee (other than Messrs. Jones, Kilman and Roberge) has been elected by shareholders and each Trustee and Officer holds office until his or her successor is chosen and qualified or until his or her earlier death, resignation, retirement or removal. Mr. Roberge became a Trustee of the Funds on January 1, 2021 and Messrs. Jones and Kilman became Trustees of the Funds on January 1, 2019. The Trust does not hold annual meetings for the purpose of electing Trustees, and Trustees are not elected for fixed terms. Under the terms of the Board’s retirement policy, an Independent Trustee shall retire at the end of the calendar year in which he or she reaches the earlier of 75 years of age or 15 years of service on the Board (or, in the case of any Independent Trustee who joined the Board prior to 2015, 20 years of service on the Board).
Messrs. Buller, Kilman and Otis and Ms. Roepke are members of the Trust’s Audit Committee.
Each of the Interested Trustees and certain Officers hold comparable officer positions with certain affiliates of MFS.
37
Table of Contents
Trustees and Officers – continued
The Statement of Additional Information for a Fund includes further information about the Trustees and is available without charge upon request by calling 1-800-225-2606.
| Investment Adviser | Custodian | |
Massachusetts Financial Services Company Boston, MA 02199-7618 | State Street Bank and Trust Company 1 Lincoln Street Boston, MA 02111-2900 | |
| Distributor | Independent Registered Public Accounting Firm | |
MFS Fund Distributors, Inc. Boston, MA 02199-7618 | Deloitte & Touche LLP 200 Berkeley Street Boston, MA 02116 | |
| Portfolio Manager(s) | ||
| Camille Humphries Lee |
38
Table of Contents
STATEMENT REGARDING LIQUIDITY RISK MANAGEMENT PROGRAM
The fund has adopted and implemented a liquidity risk management program (the “Program”) as required by Rule 22e-4 under the Investment Company Act of 1940, as amended. The fund’s Board of Trustees (the “Board”) has designated MFS as the administrator of the Program. The Program is reasonably designed to assess and manage the liquidity risk of the fund. Liquidity risk is the risk that the fund could not meet requests to redeem shares issued by the fund without significant dilution of remaining investors’ interests.
MFS provided a written report to the Board for consideration at its April 2021 meeting that addressed the operation of the Program and provided an assessment of the adequacy and effectiveness of the Program during the period from January 1, 2020 to December 31, 2020 (the “Covered Period”). The report concluded that during the Covered Period the Program had operated effectively and had adequately and effectively been implemented to assess and manage the fund’s liquidity risk. MFS also reported that there were no liquidity events that impacted the fund or its ability to timely meet redemptions without dilution to existing shareholders during the Covered Period.
There can be no assurance that the Program will achieve its objectives in the future. Further information on liquidity risk, and other principal risks to which an investment in the fund may be subject, can be found in the prospectus.
39
Table of Contents
PROXY VOTING POLICIES AND INFORMATION
MFS votes proxies on behalf of the fund pursuant to proxy voting policies and procedures that are available without charge, upon request, by calling 1-800-225-2606, by visiting mfs.com/proxyvoting, or by visiting the SEC Web site at http://www.sec.gov.
Information regarding how the fund voted proxies relating to portfolio securities during the most recent twelve-month period ended June 30 is available by August 31 of each year without charge by visiting mfs.com/proxyvoting, or by visiting the SEC’s Web site at http://www.sec.gov.
QUARTERLY PORTFOLIO DISCLOSURE
The fund files a complete schedule of portfolio holdings with the SEC for the first and third quarters of each fiscal year as an exhibit to its reports on Form N-PORT. The fund’s Form N-PORT reports are available on the SEC’s Web site at http://www.sec.gov. A shareholder can obtain the portfolio holdings report for the first and third quarters of the fund’s fiscal year at mfs.com/openendfunds by choosing the fund’s name and then scrolling to the “Resources” section and clicking on the “Prospectus and Reports” tab.
From time to time, MFS may post important information about the fund or the MFS Funds on the MFS Web site (mfs.com). This information is available at https://www.mfs.com/announcements or at mfs.com/openendfunds by choosing the fund’s name and then scrolling to the “Resources” section and clicking on the “Announcements” tab, if any.
INFORMATION ABOUT FUND CONTRACTS AND LEGAL CLAIMS
The fund has entered into contractual arrangements with an investment adviser, administrator, distributor, shareholder servicing agent, 529 program manager (if applicable), and custodian who each provide services to the fund. Unless expressly stated otherwise, shareholders are not parties to, or intended beneficiaries of these contractual arrangements, and these contractual arrangements are not intended to create any shareholder right to enforce them against the service providers or to seek any remedy under them against the service providers, either directly or on behalf of the fund.
Under the Trust’s By-Laws and Declaration of Trust, any claims asserted against or on behalf of the MFS Funds, including claims against Trustees and Officers, must be brought in state and federal courts located within the Commonwealth of Massachusetts.
FEDERAL TAX INFORMATION (unaudited)
The fund will notify shareholders of amounts for use in preparing 2021 income tax forms in January 2022. The following information is provided pursuant to provisions of the Internal Revenue Code.
The fund designates the maximum amount allowable as qualified dividend income eligible to be taxed at the same rate as long-term capital gain.
The fund designates $292,009,000 as capital gain dividends paid during the fiscal year.
Income derived from foreign sources was $209,758,308. The fund intends to pass through foreign tax credits of $42,617,504 for the fiscal year.
40
Table of Contents
rev. 3/16
| WHAT DOES MFS DO WITH YOUR PERSONAL INFORMATION? |  | ||
| Why? | Financial companies choose how they share your personal information. Federal law gives consumers the right to limit some but not all sharing. Federal law also requires us to tell you how we collect, share, and protect your personal information. Please read this notice carefully to understand what we do. |
| What? | The types of personal information we collect and share depend on the product or service you have with us. This information can include:
• Social Security number and account balances • Account transactions and transaction history • Checking account information and wire transfer instructions
When you are no longer our customer, we continue to share your information as described in this notice. |
| How? | All financial companies need to share customers’ personal information to run their everyday business. In the section below, we list the reasons financial companies can share their customers’ personal information; the reasons MFS chooses to share; and whether you can limit this sharing. |
| Reasons we can share your personal information | Does MFS share? | Can you limit this sharing? | ||
For our everyday business purposes – such as to process your transactions, maintain your account(s), respond to court orders and legal investigations, or report to credit bureaus | Yes | No | ||
For our marketing purposes – to offer our products and services to you | No | We don’t share | ||
For joint marketing with other financial companies | No | We don’t share | ||
For our affiliates’ everyday business purposes – information about your transactions and experiences | No | We don’t share | ||
For our affiliates’ everyday business purposes – information about your creditworthiness | No | We don’t share | ||
| For nonaffiliates to market to you | No | We don’t share |
| Questions? | Call 800-225-2606 or go to mfs.com. | |
41
Table of Contents
| Page 2 |
| Who we are | ||
| Who is providing this notice? | MFS Funds, MFS Investment Management, MFS Institutional Advisors, Inc., and MFS Heritage Trust Company. | |
| What we do | ||
| How does MFS protect my personal information? | To protect your personal information from unauthorized access and use, we use security measures that comply with federal law. These measures include procedural, electronic, and physical safeguards for the protection of the personal information we collect about you. | |
| How does MFS collect my personal information? | We collect your personal information, for example, when you
• open an account or provide account information • direct us to buy securities or direct us to sell your securities • make a wire transfer
We also collect your personal information from others, such as credit bureaus, affiliates, or other companies. | |
| Why can’t I limit all sharing? | Federal law gives you the right to limit only
• sharing for affiliates’ everyday business purposes – information about your creditworthiness • affiliates from using your information to market to you • sharing for nonaffiliates to market to you
State laws and individual companies may give you additional rights to limit sharing. | |
| Definitions | ||
| Affiliates | Companies related by common ownership or control. They can be financial and nonfinancial companies.
• MFS does not share personal information with affiliates, except for everyday business purposes as described on page one of this notice. | |
| Nonaffiliates | Companies not related by common ownership or control. They can be financial and nonfinancial companies.
• MFS does not share with nonaffiliates so they can market to you. | |
| Joint marketing | A formal agreement between nonaffiliated financial companies that together market financial products or services to you.
• MFS doesn’t jointly market. | |
| Other important information | ||
| If you own an MFS product or receive an MFS service in the name of a third party such as a bank or broker-dealer, their privacy policy may apply to you instead of ours. | ||
42
Table of Contents
Save paper with eDelivery.
| MFS® will send you prospectuses, |

reports, and proxies directly via e-mail so you will get information faster with less mailbox clutter.
To sign up:
1. Go to mfs.com.
2. Log in via MFS® Access.
3. Select eDelivery.
If you own your MFS fund shares through a financial institution or a retirement plan, MFS® TALK, MFS® Access, or eDelivery may not be available to you.
WEB SITE
mfs.com
MFS TALK
1-800-637-8255
24 hours a day
ACCOUNT SERVICE AND LITERATURE
Shareholders
1-800-225-2606
Financial advisors
1-800-343-2829
Retirement plan services
1-800-637-1255
MAILING ADDRESS
MFS Service Center, Inc.
P.O. Box 219341
Kansas City, MO 64121-9341
OVERNIGHT MAIL
MFS Service Center, Inc.
Suite 219341
430 W 7th Street
Kansas City, MO 64105-1407
Table of Contents


Table of Contents
Table of Contents
| 1 | |
| 2 | |
| 4 | |
| 7 | |
| 10 | |
| 12 | |
| 17 | |
| 19 | |
| 20 | |
| 21 | |
| 30 | |
| 41 | |
| 43 | |
| 48 | |
| 49 | |
| 49 | |
| 49 | |
| 49 | |
| 49 | |
| 50 |
| back cover |
Table of Contents
Table of Contents


Table of Contents
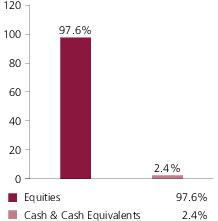
| Taiwan Semiconductor Manufacturing Co. Ltd., ADR | 4.7% |
| Nestle S.A. | 4.4% |
| LVMH Moet Hennessy Louis Vuitton SE | 4.2% |
| Roche Holding AG | 4.0% |
| AIA Group Ltd. | 3.3% |
| SAP AG | 3.2% |
| Hitachi Ltd. | 2.9% |
| Schneider Electric SE | 2.6% |
| Diageo PLC | 2.6% |
| Linde PLC | 2.6% |
| Consumer Staples | 16.6% |
| Industrials | 15.8% |
| Consumer Discretionary | 14.9% |
| Information Technology | 13.3% |
| Health Care | 11.8% |
| Materials | 10.3% |
| Financials | 9.1% |
| Communication Services | 3.6% |
| Energy | 1.6% |
| Utilities | 0.6% |
| France | 17.7% |
| Switzerland | 12.1% |
| United Kingdom | 7.7% |
| Germany | 7.7% |
| Japan | 6.9% |
| Canada | 6.7% |
| China | 6.3% |
| Taiwan | 6.2% |
| United States | 5.7% |
| Other Countries | 23.0% |
| Euro | 32.1% |
| Swiss Franc | 12.1% |
| British Pound Sterling | 8.9% |
| Hong Kong Dollar | 8.6% |
| Japanese Yen | 6.9% |
| United States Dollar | 6.3% |
| Taiwan Dollar | 6.2% |
| Indian Rupee | 5.9% |
| Canadian Dollar | 4.4% |
| Other Currencies | 8.6% |
Table of Contents
| (g) | The Global Industry Classification Standard (GICS®) was developed by and/or is the exclusive property of MSCI, Inc. and S&P Global Market Intelligence Inc. (“S&P Global Market Intelligence”). GICS is a service mark of MSCI and S&P Global Market Intelligence and has been licensed for use by MFS. MFS has applied its own internal sector/industry classification methodology for equity securities and non-equity securities that are unclassified by GICS. |
| (x) | Represents the portfolio’s exposure to issuer countries as a percentage of a portfolio’s net assets. For purposes of this presentation, United States includes Cash & Cash Equivalents. |
| (y) | Represents the portfolio’s exposure to a particular currency as a percentage of a portfolio's net assets. For purposes of this presentation, United States Dollar includes Cash & Cash Equivalents. |
Table of Contents
Table of Contents
Table of Contents
| (b) | Security is not a benchmark constituent. |
Table of Contents
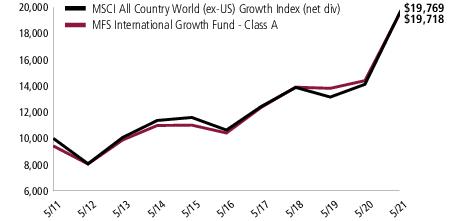
Table of Contents
| Share Class | Class Inception Date | 1-yr | 5-yr | 10-yr |
| A | 10/24/95 | 36.85% | 13.61% | 7.66% |
| B | 10/24/95 | 35.82% | 12.76% | 6.86% |
| C | 7/01/96 | 35.82% | 12.77% | 6.86% |
| I | 1/02/97 | 37.20% | 13.90% | 7.93% |
| R1 | 10/01/08 | 35.83% | 12.76% | 6.85% |
| R2 | 10/01/08 | 36.49% | 13.33% | 7.39% |
| R3 | 10/01/08 | 36.88% | 13.61% | 7.66% |
| R4 | 10/01/08 | 37.20% | 13.89% | 7.93% |
| R6 | 5/01/06 | 37.33% | 14.00% | 8.02% |
| MSCI All Country World (ex-US) Growth Index (net div) (f) | 39.92% | 13.19% | 7.05% |
| A With Initial Sales Charge (5.75%) | 28.98% | 12.28% | 7.03% |
| B With CDSC (Declining over six years from 4% to 0%) (v) | 31.82% | 12.51% | 6.86% |
| C With CDSC (1% for 12 months) (v) | 34.82% | 12.77% | 6.86% |
| (f) | Source: FactSet Research Systems Inc. |
| (v) | Assuming redemption at the end of the applicable period. |
Table of Contents
| (e) | Morgan Stanley Capital International (“MSCI”) makes no express or implied warranties or representations and shall have no liability whatsoever with respect to any MSCI data contained herein. The MSCI data may not be further redistributed or used as a basis for other indices or any securities or financial products. This report is not approved, reviewed, or produced by MSCI. |
Table of Contents
December 1, 2020 through May 31, 2021
Table of Contents
| Share Class | Annualized Expense Ratio | Beginning Account Value 12/01/20 | Ending Account Value 5/31/21 | Expenses Paid During Period (p) 12/01/20-5/31/21 | |
| A | Actual | 1.07% | $1,000.00 | $1,133.71 | $5.69 |
| Hypothetical(h) | 1.07% | $1,000.00 | $1,019.60 | $5.39 | |
| B | Actual | 1.82% | $1,000.00 | $1,129.31 | $9.66 |
| Hypothetical(h) | 1.82% | $1,000.00 | $1,015.86 | $9.15 | |
| C | Actual | 1.82% | $1,000.00 | $1,129.38 | $9.66 |
| Hypothetical(h) | 1.82% | $1,000.00 | $1,015.86 | $9.15 | |
| I | Actual | 0.82% | $1,000.00 | $1,135.32 | $4.37 |
| Hypothetical(h) | 0.82% | $1,000.00 | $1,020.84 | $4.13 | |
| R1 | Actual | 1.82% | $1,000.00 | $1,129.55 | $9.66 |
| Hypothetical(h) | 1.82% | $1,000.00 | $1,015.86 | $9.15 | |
| R2 | Actual | 1.32% | $1,000.00 | $1,132.10 | $7.02 |
| Hypothetical(h) | 1.32% | $1,000.00 | $1,018.35 | $6.64 | |
| R3 | Actual | 1.07% | $1,000.00 | $1,133.73 | $5.69 |
| Hypothetical(h) | 1.07% | $1,000.00 | $1,019.60 | $5.39 | |
| R4 | Actual | 0.82% | $1,000.00 | $1,134.90 | $4.36 |
| Hypothetical(h) | 0.82% | $1,000.00 | $1,020.84 | $4.13 | |
| R6 | Actual | 0.70% | $1,000.00 | $1,135.72 | $3.73 |
| Hypothetical(h) | 0.70% | $1,000.00 | $1,021.44 | $3.53 |
| (h) | 5% class return per year before expenses. |
| (p) | “Expenses Paid During Period” are equal to each class’s annualized expense ratio, as shown above, multiplied by the average account value over the period, multiplied by 182/365 (to reflect the one-half year period). Expenses paid do not include any applicable sales charges (loads). If these transaction costs had been included, your costs would have been higher. |
Table of Contents
| Issuer | Shares/Par | Value ($) | ||
| Common Stocks – 97.6% | ||||
| Aerospace & Defense – 0.9% | ||||
| Rolls-Royce Holdings PLC (a) | 82,224,516 | $ 125,016,945 | ||
| Alcoholic Beverages – 4.5% | ||||
| Diageo PLC | 7,825,670 | $ 378,454,515 | ||
| Pernod Ricard S.A. | 1,235,393 | 272,152,593 | ||
| $650,607,108 | ||||
| Apparel Manufacturers – 6.2% | ||||
| Burberry Group PLC | 3,032,492 | $ 92,024,511 | ||
| Kering S.A. | 204,632 | 187,250,234 | ||
| LVMH Moet Hennessy Louis Vuitton SE | 772,881 | 616,216,469 | ||
| $895,491,214 | ||||
| Automotive – 1.2% | ||||
| Koito Manufacturing Co. Ltd. | 1,533,900 | $ 99,607,535 | ||
| Mahindra & Mahindra Ltd. | 6,549,255 | 72,862,688 | ||
| $172,470,223 | ||||
| Biotechnology – 0.2% | ||||
| Hugel, Inc. (a) | 135,124 | $ 24,433,114 | ||
| Business Services – 3.0% | ||||
| Cap Gemini S.A. | 585,499 | $ 109,293,929 | ||
| Experian PLC | 5,162,563 | 198,250,376 | ||
| Infosys Technologies Ltd., ADR | 6,321,008 | 122,248,295 | ||
| $429,792,600 | ||||
| Chemicals – 0.7% | ||||
| UPL Ltd. | 9,609,308 | $ 107,852,896 | ||
| Computer Software – 4.4% | ||||
| Dassault Systemes S.A. | 335,732 | $ 77,285,994 | ||
| Kingsoft Corp. | 11,434,000 | 77,120,886 | ||
| SAP SE | 3,365,272 | 467,159,978 | ||
| Wisetech Global Ltd. | 793,489 | 17,335,505 | ||
| $638,902,363 | ||||
| Computer Software - Systems – 4.0% | ||||
| Amadeus IT Group S.A. (a) | 1,403,781 | $ 105,983,696 | ||
| Hitachi Ltd. | 8,132,300 | 426,037,746 | ||
| NICE Systems Ltd., ADR (a) | 226,507 | 50,366,096 | ||
| $582,387,538 | ||||
Table of Contents
| Issuer | Shares/Par | Value ($) | ||
| Common Stocks – continued | ||||
| Consumer Products – 5.3% | ||||
| Kao Corp. | 1,652,800 | $ 101,063,987 | ||
| KOSE Corp. | 484,400 | 75,962,627 | ||
| L'Oréal | 632,797 | 284,996,289 | ||
| Reckitt Benckiser Group PLC | 3,352,273 | 303,280,888 | ||
| $765,303,791 | ||||
| Consumer Services – 0.3% | ||||
| 51job, Inc., ADR (a) | 684,749 | $ 49,082,808 | ||
| Electrical Equipment – 3.7% | ||||
| Prysmian S.p.A. | 4,267,115 | $ 147,305,275 | ||
| Schneider Electric SE | 2,431,647 | 384,775,915 | ||
| $532,081,190 | ||||
| Electronics – 6.2% | ||||
| Delta Electronics, Inc. | 19,939,000 | $ 213,799,819 | ||
| Taiwan Semiconductor Manufacturing Co. Ltd., ADR | 5,854,195 | 687,048,325 | ||
| $900,848,144 | ||||
| Energy - Independent – 1.6% | ||||
| Oil Search Ltd. | 27,669,612 | $ 77,945,163 | ||
| Reliance Industries Ltd. | 5,002,878 | 148,820,508 | ||
| $226,765,671 | ||||
| Food & Beverages – 4.9% | ||||
| Danone S.A. | 1,037,082 | $ 73,935,791 | ||
| Nestle S.A. | 5,194,210 | 639,705,231 | ||
| $713,641,022 | ||||
| Food & Drug Stores – 0.5% | ||||
| Sugi Holdings Co. Ltd. | 986,900 | $ 77,697,306 | ||
| Gaming & Lodging – 1.2% | ||||
| Flutter Entertainment PLC (a) | 902,532 | $ 169,382,304 | ||
| General Merchandise – 0.3% | ||||
| Walmart de Mexico S.A.B. de C.V. | 13,528,903 | $ 44,408,264 | ||
| Insurance – 3.3% | ||||
| AIA Group Ltd. | 37,058,600 | $ 473,650,300 | ||
| Internet – 5.7% | ||||
| Alibaba Group Holding Ltd. (a) | 11,379,900 | $ 309,369,886 | ||
| NAVER Corp. | 640,821 | 209,079,351 | ||
| Tencent Holdings Ltd. | 3,342,800 | 266,598,793 | ||
Table of Contents
| Issuer | Shares/Par | Value ($) | ||
| Common Stocks – continued | ||||
| Internet – continued | ||||
| Yahoo Japan Corp. | 9,400,300 | $ 44,181,152 | ||
| $829,229,182 | ||||
| Leisure & Toys – 0.6% | ||||
| Prosus N.V. | 880,304 | $ 91,403,871 | ||
| Machinery & Tools – 4.4% | ||||
| Assa Abloy AB | 5,003,250 | $ 153,845,871 | ||
| GEA Group AG | 3,356,421 | 147,224,769 | ||
| Ingersoll Rand, Inc. (a) | 2,286,773 | 113,515,412 | ||
| Ritchie Bros. Auctioneers, Inc. | 3,847,760 | 227,741,486 | ||
| $642,327,538 | ||||
| Major Banks – 1.3% | ||||
| DBS Group Holdings Ltd. | 8,193,700 | $ 186,223,273 | ||
| Medical & Health Technology & Services – 0.3% | ||||
| Alcon, Inc. | 540,934 | $ 37,649,030 | ||
| Medical Equipment – 4.3% | ||||
| EssilorLuxottica | 1,850,621 | $ 321,078,880 | ||
| QIAGEN N.V. (a) | 3,586,827 | 176,717,994 | ||
| Terumo Corp. | 3,485,400 | 134,239,947 | ||
| $632,036,821 | ||||
| Natural Gas - Distribution – 0.6% | ||||
| China Resources Gas Group Ltd. | 14,272,000 | $ 89,091,394 | ||
| Other Banks & Diversified Financials – 4.5% | ||||
| AEON Financial Service Co. Ltd. | 4,345,500 | $ 50,523,532 | ||
| Credicorp Ltd. (a) | 398,129 | 54,730,794 | ||
| Element Fleet Management Corp. | 9,881,486 | 112,159,369 | ||
| Grupo Financiero Banorte S.A. de C.V. | 17,361,317 | 119,796,921 | ||
| HDFC Bank Ltd. (a) | 15,155,711 | 316,345,272 | ||
| $653,555,888 | ||||
| Pharmaceuticals – 9.2% | ||||
| Bayer AG | 2,558,481 | $ 161,062,267 | ||
| Hypera S.A. | 5,493,474 | 38,162,959 | ||
| Novartis AG | 4,231,182 | 371,502,346 | ||
| Novo Nordisk A.S., “B” | 2,454,720 | 194,265,822 | ||
| Roche Holding AG | 1,658,072 | 576,824,959 | ||
| $1,341,818,353 | ||||
Table of Contents
| Issuer | Shares/Par | Value ($) | ||
| Common Stocks – continued | ||||
| Precious Metals & Minerals – 2.1% | ||||
| Agnico-Eagle Mines Ltd. | 2,639,639 | $ 187,005,411 | ||
| Franco-Nevada Corp. | 787,465 | 116,390,850 | ||
| $303,396,261 | ||||
| Railroad & Shipping – 2.2% | ||||
| Canadian National Railway Co. | 2,912,546 | $ 327,865,303 | ||
| Restaurants – 0.8% | ||||
| Yum China Holdings, Inc. | 1,127,587 | $ 76,269,985 | ||
| Yum China Holdings, Inc. | 581,150 | 38,673,698 | ||
| $114,943,683 | ||||
| Specialty Chemicals – 7.5% | ||||
| Akzo Nobel N.V. | 1,492,589 | $ 192,194,821 | ||
| L'Air Liquide S.A. | 1,410,534 | 239,895,066 | ||
| Linde PLC | 1,242,610 | 374,866,877 | ||
| Sika AG | 415,975 | 133,883,927 | ||
| Symrise AG | 1,108,076 | 147,018,626 | ||
| $1,087,859,317 | ||||
| Specialty Stores – 0.6% | ||||
| Just Eat Takeaway (a)(l) | 711,932 | $ 64,632,291 | ||
| Ocado Group PLC (a) | 850,036 | 22,812,448 | ||
| $87,444,739 | ||||
| Tobacco – 1.1% | ||||
| ITC Ltd. | 28,324,565 | $ 84,479,339 | ||
| Swedish Match AB | 8,362,965 | 77,580,116 | ||
| $162,059,455 | ||||
| Total Common Stocks (Identified Cost, $9,284,060,399) | $14,166,718,909 | |||
| Investment Companies (h) – 2.1% | ||||
| Money Market Funds – 2.1% | ||||
| MFS Institutional Money Market Portfolio, 0.03% (v) (Identified Cost, $303,072,581) | 303,073,053 | $ 303,073,053 | ||
| Other Assets, Less Liabilities – 0.3% | 50,490,604 | |||
| Net Assets – 100.0% | $14,520,282,566 | |||
| (a) | Non-income producing security. | |||
| (h) | An affiliated issuer, which may be considered one in which the fund owns 5% or more of the outstanding voting securities, or a company which is under common control. At period end, the aggregate values of the fund's investments in affiliated issuers and in unaffiliated issuers were $303,073,053 and $14,166,718,909, respectively. | |||
| (l) | A portion of this security is on loan. See Note 2 for additional information. |
Table of Contents
| (v) | Affiliated issuer that is available only to investment companies managed by MFS. The rate quoted for the MFS Institutional Money Market Portfolio is the annualized seven-day yield of the fund at period end. |
| The following abbreviations are used in this report and are defined: | |
| ADR | American Depositary Receipt |
Table of Contents
| Assets | |
| Investments in unaffiliated issuers, at value, including $429,174 of securities on loan (identified cost, $9,284,060,399) | $14,166,718,909 |
| Investments in affiliated issuers, at value (identified cost, $303,072,581) | 303,073,053 |
| Receivables for | |
| Fund shares sold | 23,871,703 |
| Interest and dividends | 62,583,708 |
| Other assets | 18,766 |
| Total assets | $14,556,266,139 |
| Liabilities | |
| Payables for | |
| Investments purchased | $8,187,742 |
| Fund shares reacquired | 5,750,998 |
| Payable to affiliates | |
| Investment adviser | 1,320,243 |
| Administrative services fee | 7,722 |
| Shareholder servicing costs | 1,605,147 |
| Distribution and service fees | 38,267 |
| Payable for independent Trustees' compensation | 715 |
| Deferred country tax expense payable | 17,875,472 |
| Accrued expenses and other liabilities | 1,197,267 |
| Total liabilities | $35,983,573 |
| Net assets | $14,520,282,566 |
| Net assets consist of | |
| Paid-in capital | $9,158,819,526 |
| Total distributable earnings (loss) | 5,361,463,040 |
| Net assets | $14,520,282,566 |
| Shares of beneficial interest outstanding | 307,961,894 |
Table of Contents
| Net assets | Shares outstanding | Net asset value per share (a) | |
| Class A | $650,731,113 | 14,242,260 | $45.69 |
| Class B | 2,438,662 | 57,351 | 42.52 |
| Class C | 41,907,103 | 1,017,391 | 41.19 |
| Class I | 3,722,297,587 | 72,524,731 | 51.32 |
| Class R1 | 7,423,562 | 184,544 | 40.23 |
| Class R2 | 40,885,823 | 985,071 | 41.51 |
| Class R3 | 182,925,783 | 4,038,285 | 45.30 |
| Class R4 | 273,948,511 | 5,966,439 | 45.91 |
| Class R6 | 9,597,724,422 | 208,945,822 | 45.93 |
| (a) | Maximum offering price per share was equal to the net asset value per share for all share classes, except for Class A, for which the maximum offering price per share was $48.48 [100 / 94.25 x $45.69]. On sales of $50,000 or more, the maximum offering price of Class A shares is reduced. A contingent deferred sales charge may be imposed on redemptions of Class A, Class B, and Class C shares. Redemption price per share was equal to the net asset value per share for Classes I, R1, R2, R3, R4, and R6. |
Table of Contents
| Net investment income (loss) | |
| Income | |
| Dividends | $237,300,201 |
| Dividends from affiliated issuers | 121,744 |
| Income on securities loaned | 103,266 |
| Other | 212 |
| Foreign taxes withheld | (28,595,917) |
| Total investment income | $208,929,506 |
| Expenses | |
| Management fee | $86,634,626 |
| Distribution and service fees | 2,660,562 |
| Shareholder servicing costs | 4,968,875 |
| Administrative services fee | 557,001 |
| Independent Trustees' compensation | 98,710 |
| Custodian fee | 1,994,838 |
| Shareholder communications | 275,981 |
| Audit and tax fees | 159,364 |
| Legal fees | 92,172 |
| Miscellaneous | 448,330 |
| Total expenses | $97,890,459 |
| Reduction of expenses by investment adviser and distributor | (1,444,855) |
| Net expenses | $96,445,604 |
| Net investment income (loss) | $112,483,902 |
| Realized and unrealized gain (loss) | |
| Realized gain (loss) (identified cost basis) | |
| Unaffiliated issuers | $563,261,477 |
| Affiliated issuers | (4,426) |
| Foreign currency | (927,794) |
| Net realized gain (loss) | $562,329,257 |
| Change in unrealized appreciation or depreciation | |
| Unaffiliated issuers (net of $17,875,472 increase in deferred country tax) | $3,192,959,951 |
| Affiliated issuers | (3,758) |
| Translation of assets and liabilities in foreign currencies | 2,549,234 |
| Net unrealized gain (loss) | $3,195,505,427 |
| Net realized and unrealized gain (loss) | $3,757,834,684 |
| Change in net assets from operations | $3,870,318,586 |
Table of Contents
| Year ended | ||
| 5/31/21 | 5/31/20 | |
| Change in net assets | ||
| From operations | ||
| Net investment income (loss) | $112,483,902 | $94,877,769 |
| Net realized gain (loss) | 562,329,257 | (119,745,414) |
| Net unrealized gain (loss) | 3,195,505,427 | 370,420,805 |
| Change in net assets from operations | $3,870,318,586 | $345,553,160 |
| Total distributions to shareholders | $(94,750,684) | $(158,637,952) |
| Change in net assets from fund share transactions | $(235,009,156) | $2,060,458,436 |
| Total change in net assets | $3,540,558,746 | $2,247,373,644 |
| Net assets | ||
| At beginning of period | 10,979,723,820 | 8,732,350,176 |
| At end of period | $14,520,282,566 | $10,979,723,820 |
Table of Contents
| Class A | Year ended | ||||
| 5/31/21 | 5/31/20 | 5/31/19 | 5/31/18 | 5/31/17 | |
| Net asset value, beginning of period | $33.66 | $32.76 | $34.20 | $31.09 | $26.46 |
| Income (loss) from investment operations | |||||
| Net investment income (loss) (d) | $0.22 | $0.23 | $0.42 | $0.37 | $0.14(c) |
| Net realized and unrealized gain (loss) | 12.05 | 1.20 | (0.73) | 3.50 | 4.75 |
| Total from investment operations | $12.27 | $1.43 | $(0.31) | $3.87 | $4.89 |
| Less distributions declared to shareholders | |||||
| From net investment income | $(0.24) | $(0.35) | $(0.29) | $(0.23) | $(0.26) |
| From net realized gain | — | (0.18) | (0.84) | (0.53) | — |
| Total distributions declared to shareholders | $(0.24) | $(0.53) | $(1.13) | $(0.76) | $(0.26) |
| Net asset value, end of period (x) | $45.69 | $33.66 | $32.76 | $34.20 | $31.09 |
| Total return (%) (r)(s)(t)(x) | 36.52 | 4.24 | (0.64) | 12.53 | 18.69(c) |
| Ratios (%) (to average net assets) and Supplemental data: | |||||
| Expenses before expense reductions (f) | 1.08 | 1.08 | 1.10 | 1.15 | 1.18(c) |
| Expenses after expense reductions (f) | 1.06 | 1.07 | 1.09 | 1.14 | 1.17(c) |
| Net investment income (loss) | 0.53 | 0.66 | 1.28 | 1.12 | 0.51(c) |
| Portfolio turnover | 23 | 17 | 17 | 12 | 21 |
| Net assets at end of period (000 omitted) | $650,731 | $546,391 | $402,964 | $360,401 | $319,266 |
Table of Contents
| Class B | Year ended | ||||
| 5/31/21 | 5/31/20 | 5/31/19 | 5/31/18 | 5/31/17 | |
| Net asset value, beginning of period | $31.38 | $30.67 | $32.01 | $29.15 | $24.82 |
| Income (loss) from investment operations | |||||
| Net investment income (loss) (d) | $(0.09) | $(0.06) | $0.11 | $0.07 | $(0.01)(c) |
| Net realized and unrealized gain (loss) | 11.23 | 1.15 | (0.61) | 3.32 | 4.41 |
| Total from investment operations | $11.14 | $1.09 | $(0.50) | $3.39 | $4.40 |
| Less distributions declared to shareholders | |||||
| From net investment income | $— | $(0.20) | $— | $(0.00)(w) | $(0.07) |
| From net realized gain | — | (0.18) | (0.84) | (0.53) | — |
| Total distributions declared to shareholders | $— | $(0.38) | $(0.84) | $(0.53) | $(0.07) |
| Net asset value, end of period (x) | $42.52 | $31.38 | $30.67 | $32.01 | $29.15 |
| Total return (%) (r)(s)(t)(x) | 35.50 | 3.44 | (1.36) | 11.68 | 17.79(c) |
| Ratios (%) (to average net assets) and Supplemental data: | |||||
| Expenses before expense reductions (f) | 1.82 | 1.83 | 1.85 | 1.90 | 1.93(c) |
| Expenses after expense reductions (f) | 1.81 | 1.82 | 1.84 | 1.89 | 1.92(c) |
| Net investment income (loss) | (0.24) | (0.18) | 0.35 | 0.23 | (0.02)(c) |
| Portfolio turnover | 23 | 17 | 17 | 12 | 21 |
| Net assets at end of period (000 omitted) | $2,439 | $2,922 | $4,599 | $6,537 | $7,799 |
Table of Contents
| Class C | Year ended | ||||
| 5/31/21 | 5/31/20 | 5/31/19 | 5/31/18 | 5/31/17 | |
| Net asset value, beginning of period | $30.40 | $29.76 | $31.15 | $28.43 | $24.22 |
| Income (loss) from investment operations | |||||
| Net investment income (loss) (d) | $(0.08) | $(0.04) | $0.14 | $0.09 | $0.00(c)(w) |
| Net realized and unrealized gain (loss) | 10.87 | 1.10 | (0.64) | 3.21 | 4.30 |
| Total from investment operations | $10.79 | $1.06 | $(0.50) | $3.30 | $4.30 |
| Less distributions declared to shareholders | |||||
| From net investment income | $— | $(0.24) | $(0.05) | $(0.05) | $(0.09) |
| From net realized gain | — | (0.18) | (0.84) | (0.53) | — |
| Total distributions declared to shareholders | $— | $(0.42) | $(0.89) | $(0.58) | $(0.09) |
| Net asset value, end of period (x) | $41.19 | $30.40 | $29.76 | $31.15 | $28.43 |
| Total return (%) (r)(s)(t)(x) | 35.49 | 3.46 | (1.37) | 11.67 | 17.81(c) |
| Ratios (%) (to average net assets) and Supplemental data: | |||||
| Expenses before expense reductions (f) | 1.82 | 1.83 | 1.85 | 1.90 | 1.93(c) |
| Expenses after expense reductions (f) | 1.81 | 1.82 | 1.84 | 1.89 | 1.92(c) |
| Net investment income (loss) | (0.21) | (0.14) | 0.48 | 0.30 | 0.01(c) |
| Portfolio turnover | 23 | 17 | 17 | 12 | 21 |
| Net assets at end of period (000 omitted) | $41,907 | $39,530 | $42,015 | $42,981 | $38,985 |
Table of Contents
| Class I | Year ended | ||||
| 5/31/21 | 5/31/20 | 5/31/19 | 5/31/18 | 5/31/17 | |
| Net asset value, beginning of period | $37.75 | $36.61 | $38.08 | $34.52 | $29.36 |
| Income (loss) from investment operations | |||||
| Net investment income (loss) (d) | $0.39 | $0.34 | $0.60 | $0.50 | $0.34(c) |
| Net realized and unrealized gain (loss) | 13.49 | 1.35 | (0.86) | 3.90 | 5.16 |
| Total from investment operations | $13.88 | $1.69 | $(0.26) | $4.40 | $5.50 |
| Less distributions declared to shareholders | |||||
| From net investment income | $(0.31) | $(0.37) | $(0.37) | $(0.31) | $(0.34) |
| From net realized gain | — | (0.18) | (0.84) | (0.53) | — |
| Total distributions declared to shareholders | $(0.31) | $(0.55) | $(1.21) | $(0.84) | $(0.34) |
| Net asset value, end of period (x) | $51.32 | $37.75 | $36.61 | $38.08 | $34.52 |
| Total return (%) (r)(s)(t)(x) | 36.85 | 4.51 | (0.41) | 12.84 | 18.97(c) |
| Ratios (%) (to average net assets) and Supplemental data: | |||||
| Expenses before expense reductions (f) | 0.83 | 0.83 | 0.85 | 0.90 | 0.93(c) |
| Expenses after expense reductions (f) | 0.82 | 0.82 | 0.84 | 0.89 | 0.92(c) |
| Net investment income (loss) | 0.84 | 0.89 | 1.63 | 1.35 | 1.12(c) |
| Portfolio turnover | 23 | 17 | 17 | 12 | 21 |
| Net assets at end of period (000 omitted) | $3,722,298 | $2,457,330 | $1,974,109 | $1,371,442 | $1,497,306 |
Table of Contents
| Class R1 | Year ended | ||||
| 5/31/21 | 5/31/20 | 5/31/19 | 5/31/18 | 5/31/17 | |
| Net asset value, beginning of period | $29.72 | $29.12 | $30.57 | $27.93 | $23.87 |
| Income (loss) from investment operations | |||||
| Net investment income (loss) (d) | $(0.06) | $(0.03) | $0.18 | $0.14 | $0.02(c) |
| Net realized and unrealized gain (loss) | 10.62 | 1.07 | (0.68) | 3.11 | 4.19 |
| Total from investment operations | $10.56 | $1.04 | $(0.50) | $3.25 | $4.21 |
| Less distributions declared to shareholders | |||||
| From net investment income | $(0.05) | $(0.26) | $(0.11) | $(0.08) | $(0.15) |
| From net realized gain | — | (0.18) | (0.84) | (0.53) | — |
| Total distributions declared to shareholders | $(0.05) | $(0.44) | $(0.95) | $(0.61) | $(0.15) |
| Net asset value, end of period (x) | $40.23 | $29.72 | $29.12 | $30.57 | $27.93 |
| Total return (%) (r)(s)(t)(x) | 35.53 | 3.45 | (1.39) | 11.69 | 17.77(c) |
| Ratios (%) (to average net assets) and Supplemental data: | |||||
| Expenses before expense reductions (f) | 1.83 | 1.83 | 1.85 | 1.90 | 1.93(c) |
| Expenses after expense reductions (f) | 1.81 | 1.82 | 1.84 | 1.89 | 1.92(c) |
| Net investment income (loss) | (0.17) | (0.11) | 0.61 | 0.47 | 0.08(c) |
| Portfolio turnover | 23 | 17 | 17 | 12 | 21 |
| Net assets at end of period (000 omitted) | $7,424 | $4,890 | $4,266 | $3,663 | $2,496 |
Table of Contents
| Class R2 | Year ended | ||||
| 5/31/21 | 5/31/20 | 5/31/19 | 5/31/18 | 5/31/17 | |
| Net asset value, beginning of period | $30.63 | $29.92 | $31.31 | $28.54 | $24.32 |
| Income (loss) from investment operations | |||||
| Net investment income (loss) (d) | $0.10 | $0.15 | $0.28 | $0.25 | $0.14(c) |
| Net realized and unrealized gain (loss) | 10.97 | 1.07 | (0.64) | 3.23 | 4.29 |
| Total from investment operations | $11.07 | $1.22 | $(0.36) | $3.48 | $4.43 |
| Less distributions declared to shareholders | |||||
| From net investment income | $(0.19) | $(0.33) | $(0.19) | $(0.18) | $(0.21) |
| From net realized gain | — | (0.18) | (0.84) | (0.53) | — |
| Total distributions declared to shareholders | $(0.19) | $(0.51) | $(1.03) | $(0.71) | $(0.21) |
| Net asset value, end of period (x) | $41.51 | $30.63 | $29.92 | $31.31 | $28.54 |
| Total return (%) (r)(s)(t)(x) | 36.20 | 3.95 | (0.89) | 12.27 | 18.39(c) |
| Ratios (%) (to average net assets) and Supplemental data: | |||||
| Expenses before expense reductions (f) | 1.33 | 1.33 | 1.35 | 1.40 | 1.43(c) |
| Expenses after expense reductions (f) | 1.31 | 1.32 | 1.34 | 1.39 | 1.42(c) |
| Net investment income (loss) | 0.28 | 0.48 | 0.92 | 0.83 | 0.56(c) |
| Portfolio turnover | 23 | 17 | 17 | 12 | 21 |
| Net assets at end of period (000 omitted) | $40,886 | $34,149 | $18,890 | $23,650 | $22,245 |
Table of Contents
| Class R3 | Year ended | ||||
| 5/31/21 | 5/31/20 | 5/31/19 | 5/31/18 | 5/31/17 | |
| Net asset value, beginning of period | $33.38 | $32.51 | $33.96 | $30.89 | $26.29 |
| Income (loss) from investment operations | |||||
| Net investment income (loss) (d) | $0.23 | $0.23 | $0.48 | $0.36 | $0.20(c) |
| Net realized and unrealized gain (loss) | 11.94 | 1.18 | (0.79) | 3.48 | 4.66 |
| Total from investment operations | $12.17 | $1.41 | $(0.31) | $3.84 | $4.86 |
| Less distributions declared to shareholders | |||||
| From net investment income | $(0.25) | $(0.36) | $(0.30) | $(0.24) | $(0.26) |
| From net realized gain | — | (0.18) | (0.84) | (0.53) | — |
| Total distributions declared to shareholders | $(0.25) | $(0.54) | $(1.14) | $(0.77) | $(0.26) |
| Net asset value, end of period (x) | $45.30 | $33.38 | $32.51 | $33.96 | $30.89 |
| Total return (%) (r)(s)(t)(x) | 36.55 | 4.22 | (0.63) | 12.52 | 18.67(c) |
| Ratios (%) (to average net assets) and Supplemental data: | |||||
| Expenses before expense reductions (f) | 1.08 | 1.08 | 1.10 | 1.15 | 1.18(c) |
| Expenses after expense reductions (f) | 1.06 | 1.07 | 1.09 | 1.14 | 1.17(c) |
| Net investment income (loss) | 0.58 | 0.69 | 1.47 | 1.09 | 0.72(c) |
| Portfolio turnover | 23 | 17 | 17 | 12 | 21 |
| Net assets at end of period (000 omitted) | $182,926 | $124,732 | $59,575 | $30,465 | $26,234 |
Table of Contents
| Class R4 | Year ended | ||||
| 5/31/21 | 5/31/20 | 5/31/19 | 5/31/18 | 5/31/17 | |
| Net asset value, beginning of period | $33.79 | $32.83 | $34.28 | $31.17 | $26.52 |
| Income (loss) from investment operations | |||||
| Net investment income (loss) (d) | $0.31 | $0.31 | $0.53 | $0.45 | $0.26(c) |
| Net realized and unrealized gain (loss) | 12.12 | 1.20 | (0.76) | 3.52 | 4.71 |
| Total from investment operations | $12.43 | $1.51 | $(0.23) | $3.97 | $4.97 |
| Less distributions declared to shareholders | |||||
| From net investment income | $(0.31) | $(0.37) | $(0.38) | $(0.33) | $(0.32) |
| From net realized gain | — | (0.18) | (0.84) | (0.53) | — |
| Total distributions declared to shareholders | $(0.31) | $(0.55) | $(1.22) | $(0.86) | $(0.32) |
| Net asset value, end of period (x) | $45.91 | $33.79 | $32.83 | $34.28 | $31.17 |
| Total return (%) (r)(s)(t)(x) | 36.87 | 4.48 | (0.40) | 12.81 | 18.97(c) |
| Ratios (%) (to average net assets) and Supplemental data: | |||||
| Expenses before expense reductions (f) | 0.83 | 0.83 | 0.85 | 0.90 | 0.93(c) |
| Expenses after expense reductions (f) | 0.81 | 0.82 | 0.84 | 0.89 | 0.92(c) |
| Net investment income (loss) | 0.77 | 0.91 | 1.60 | 1.36 | 0.97(c) |
| Portfolio turnover | 23 | 17 | 17 | 12 | 21 |
| Net assets at end of period (000 omitted) | $273,949 | $262,925 | $209,454 | $167,066 | $124,580 |
Table of Contents
| Class R6 | Year ended | ||||
| 5/31/21 | 5/31/20 | 5/31/19 | 5/31/18 | 5/31/17 | |
| Net asset value, beginning of period | $33.80 | $32.81 | $34.27 | $31.15 | $26.54 |
| Income (loss) from investment operations | |||||
| Net investment income (loss) (d) | $0.39 | $0.34 | $0.56 | $0.51 | $0.34(c) |
| Net realized and unrealized gain (loss) | 12.08 | 1.21 | (0.78) | 3.49 | 4.65 |
| Total from investment operations | $12.47 | $1.55 | $(0.22) | $4.00 | $4.99 |
| Less distributions declared to shareholders | |||||
| From net investment income | $(0.34) | $(0.38) | $(0.40) | $(0.35) | $(0.38) |
| From net realized gain | — | (0.18) | (0.84) | (0.53) | — |
| Total distributions declared to shareholders | $(0.34) | $(0.56) | $(1.24) | $(0.88) | $(0.38) |
| Net asset value, end of period (x) | $45.93 | $33.80 | $32.81 | $34.27 | $31.15 |
| Total return (%) (r)(s)(t)(x) | 37.00 | 4.60 | (0.34) | 12.95 | 19.08(c) |
| Ratios (%) (to average net assets) and Supplemental data: | |||||
| Expenses before expense reductions (f) | 0.72 | 0.74 | 0.77 | 0.80 | 0.82(c) |
| Expenses after expense reductions (f) | 0.71 | 0.73 | 0.76 | 0.79 | 0.81(c) |
| Net investment income (loss) | 0.96 | 1.00 | 1.69 | 1.53 | 1.22(c) |
| Portfolio turnover | 23 | 17 | 17 | 12 | 21 |
| Net assets at end of period (000 omitted) | $9,597,724 | $7,506,854 | $6,016,478 | $4,347,824 | $2,717,276 |
| (c) | Amount reflects a one-time reimbursement of expenses by the custodian (or former custodian) without which net investment income and performance would be lower and expenses would be higher. |
| (d) | Per share data is based on average shares outstanding. |
| (f) | Ratios do not reflect reductions from fees paid indirectly, if applicable. |
| (r) | Certain expenses have been reduced without which performance would have been lower. |
| (s) | From time to time the fund may receive proceeds from litigation settlements, without which performance would be lower. |
| (t) | Total returns do not include any applicable sales charges. |
| (w) | Per share amount was less than $0.01. |
| (x) | The net asset values and total returns have been calculated on net assets which include adjustments made in accordance with U.S. generally accepted accounting principles required at period end for financial reporting purposes. |
Table of Contents
Table of Contents
Table of Contents
| Financial Instruments | Level 1 | Level 2 | Level 3 | Total |
| Equity Securities | $14,166,718,909 | $— | $— | $14,166,718,909 |
| Mutual Funds | 303,073,053 | — | — | 303,073,053 |
| Total | $14,469,791,962 | $— | $— | $14,469,791,962 |
Table of Contents
Table of Contents
| Year ended 5/31/21 | Year ended 5/31/20 | |
| Ordinary income (including any short-term capital gains) | $94,750,684 | $118,011,521 |
| Long-term capital gains | — | 40,626,431 |
| Total distributions | $94,750,684 | $158,637,952 |
| As of 5/31/21 | |
| Cost of investments | $9,686,011,534 |
| Gross appreciation | 5,070,508,709 |
| Gross depreciation | (286,728,281) |
| Net unrealized appreciation (depreciation) | $4,783,780,428 |
| Undistributed ordinary income | 231,786,842 |
| Undistributed long-term capital gain | 344,507,261 |
| Other temporary differences | 1,388,509 |
| Total distributable earnings (loss) | $5,361,463,040 |
Table of Contents
| Year ended 5/31/21 | Year ended 5/31/20 | ||
| Class A | $3,901,296 | $8,054,194 | |
| Class B | — | 44,332 | |
| Class C | — | 575,884 | |
| Class I | 21,579,825 | 32,629,581 | |
| Class R1 | 8,054 | 68,031 | |
| Class R2 | 205,505 | 472,801 | |
| Class R3 | 1,005,653 | 1,703,950 | |
| Class R4 | 2,118,266 | 3,769,910 | |
| Class R6 | 65,932,085 | 111,319,269 | |
| Total | $94,750,684 | $158,637,952 |
| Up to $1 billion | 0.90% |
| In excess of $1 billion and up to $2 billion | 0.80% |
| In excess of $2 billion and up to $5 billion | 0.70% |
| In excess of $5 billion and up to $10 billion | 0.65% |
| In excess of $10 billion and up to $20 billion | 0.62% |
| In excess of $20 billion | 0.60% |
Table of Contents
| Distribution Fee Rate (d) | Service Fee Rate (d) | Total Distribution Plan (d) | Annual Effective Rate (e) | Distribution and Service Fee | |
| Class A | — | 0.25% | 0.25% | 0.25% | $ 1,559,913 |
| Class B | 0.75% | 0.25% | 1.00% | 1.00% | 28,103 |
| Class C | 0.75% | 0.25% | 1.00% | 1.00% | 416,937 |
| Class R1 | 0.75% | 0.25% | 1.00% | 1.00% | 62,665 |
| Class R2 | 0.25% | 0.25% | 0.50% | 0.50% | 197,410 |
| Class R3 | — | 0.25% | 0.25% | 0.25% | 395,534 |
| Total Distribution and Service Fees | $2,660,562 |
| (d) | In accordance with the distribution plan for certain classes, the fund pays distribution and/or service fees equal to these annual percentage rates of each class’s average daily net assets. The distribution and service fee rates disclosed by class represent the current rates in effect at the end of the reporting period. Any rate changes, if applicable, are detailed below. |
| (e) | The annual effective rates represent actual fees incurred under the distribution plan for the year ended May 31, 2021 based on each class's average daily net assets. MFD has voluntarily agreed to rebate a portion of each class's 0.25% service fee attributable to accounts for which there is no financial intermediary specified on the account except for accounts attributable to MFS or its affiliates' seed money. For the year ended May 31, 2021, this rebate amounted to $1,050, $3, and $38 for Class A, Class B, and Class C, respectively, and is included in the reduction of total expenses in the Statement of Operations. |
| Amount | |
| Class A | $2,362 |
| Class B | 3,305 |
| Class C | 3,357 |
Table of Contents
Table of Contents
| Year ended 5/31/21 | Year ended 5/31/20 | ||||
| Shares | Amount | Shares | Amount | ||
| Shares sold | |||||
| Class A | 4,071,400 | $165,297,568 | 7,110,440 | $245,948,585 | |
| Class B | 884 | 31,834 | 1,713 | 53,631 | |
| Class C | 130,371 | 4,815,002 | 288,084 | 9,041,809 | |
| Class I | 24,693,913 | 1,127,365,311 | 29,332,088 | 1,099,001,832 | |
| Class R1 | 45,729 | 1,648,494 | 65,481 | 1,992,292 | |
| Class R2 | 302,310 | 11,155,437 | 902,153 | 28,948,022 | |
| Class R3 | 1,493,327 | 59,644,037 | 2,900,890 | 100,640,646 | |
| Class R4 | 1,821,308 | 73,634,178 | 3,984,941 | 137,814,467 | |
| Class R6 | 39,511,845 | 1,635,234,703 | 61,771,463 | 2,134,382,871 | |
| 72,071,087 | $3,078,826,564 | 106,357,253 | $3,757,824,155 | ||
| Shares issued to shareholders in reinvestment of distributions | |||||
| Class A | 74,872 | $3,112,449 | 181,396 | $6,577,430 | |
| Class B | — | — | 1,287 | 43,672 | |
| Class C | — | — | 15,591 | 512,308 | |
| Class I | 415,191 | 19,364,529 | 710,345 | 28,854,199 | |
| Class R1 | 219 | 8,052 | 2,117 | 68,031 | |
| Class R2 | 5,410 | 204,552 | 13,730 | 453,624 | |
| Class R3 | 24,397 | 1,005,653 | 47,371 | 1,703,950 | |
| Class R4 | 40,702 | 1,698,475 | 77,959 | 2,835,359 | |
| Class R6 | 1,462,981 | 61,035,547 | 2,915,703 | 105,985,806 | |
| 2,023,772 | $86,429,257 | 3,965,499 | $147,034,379 | ||
| Shares reacquired | |||||
| Class A | (6,138,583) | $(252,711,622) | (3,358,128) | $(113,176,248) | |
| Class B | (36,666) | (1,380,152) | (59,824) | (1,882,068) | |
| Class C | (413,506) | (15,105,362) | (415,000) | (12,698,807) | |
| Class I | (17,684,502) | (802,289,119) | (18,859,303) | (695,195,694) | |
| Class R1 | (25,938) | (951,941) | (49,551) | (1,515,499) | |
| Class R2 | (437,606) | (16,396,411) | (432,373) | (13,371,338) | |
| Class R3 | (1,216,058) | (49,125,582) | (1,044,223) | (34,943,677) | |
| Class R4 | (3,676,018) | (149,605,713) | (2,662,266) | (91,208,654) | |
| Class R6 | (54,141,750) | (2,112,699,075) | (25,930,767) | (880,408,113) | |
| (83,770,627) | $(3,400,264,977) | (52,811,435) | $(1,844,400,098) | ||
Table of Contents
| Year ended 5/31/21 | Year ended 5/31/20 | ||||
| Shares | Amount | Shares | Amount | ||
| Net change | |||||
| Class A | (1,992,311) | $(84,301,605) | 3,933,708 | $139,349,767 | |
| Class B | (35,782) | (1,348,318) | (56,824) | (1,784,765) | |
| Class C | (283,135) | (10,290,360) | (111,325) | (3,144,690) | |
| Class I | 7,424,602 | 344,440,721 | 11,183,130 | 432,660,337 | |
| Class R1 | 20,010 | 704,605 | 18,047 | 544,824 | |
| Class R2 | (129,886) | (5,036,422) | 483,510 | 16,030,308 | |
| Class R3 | 301,666 | 11,524,108 | 1,904,038 | 67,400,919 | |
| Class R4 | (1,814,008) | (74,273,060) | 1,400,634 | 49,441,172 | |
| Class R6 | (13,166,924) | (416,428,825) | 38,756,399 | 1,359,960,564 | |
| (9,675,768) | $(235,009,156) | 57,511,317 | $2,060,458,436 | ||
Table of Contents
| Affiliated Issuers | Beginning Value | Purchases | Sales Proceeds | Realized Gain (Loss) | Change in Unrealized Appreciation or Depreciation | Ending Value |
| MFS Institutional Money Market Portfolio | $136,261,868 | $1,687,246,092 | $1,520,426,723 | $(4,426) | $(3,758) | $303,073,053 |
| Affiliated Issuers | Dividend Income | Capital Gain Distributions |
| MFS Institutional Money Market Portfolio | $121,744 | $— |
Table of Contents
Table of Contents

July 16, 2021
Table of Contents
| Name, Age | Position(s) Held with Fund | Trustee/Officer Since(h) | Number of MFS Funds overseen by the Trustee | Principal Occupations During the Past Five Years | Other Directorships During the Past Five Years (j) | |||||
| INTERESTED TRUSTEES | ||||||||||
| Robert J. Manning (k) (age 57) | Trustee | February 2004 | 135 | Massachusetts Financial Services Company, Non-Executive Chairman (since January 2021); Director; Chairman of the Board; Executive Chairman (January 2017-2020); Co-Chief Executive Officer (2015-2016) | N/A | |||||
| Michael W. Roberge (k) (age 54) | Trustee | January 2021 | 135 | Massachusetts Financial Services Company, Chairman (since January 2021); Chief Executive Officer (since January 2017); Director; President (until December 2018); Chief Investment Officer (until December 2018); Co-Chief Executive Officer (until December 2016) | N/A | |||||
| INDEPENDENT TRUSTEES | ||||||||||
| John P. Kavanaugh (age 66) | Trustee and Chair of Trustees | January 2009 | 135 | Private investor | N/A | |||||
| Steven E. Buller (age 69) | Trustee | February 2014 | 135 | Private investor | N/A | |||||
| John A. Caroselli (age 67) | Trustee | March 2017 | 135 | Private investor; JC Global Advisors, LLC (management consulting), President (since 2015) | N/A | |||||
| Maureen R. Goldfarb (age 66) | Trustee | January 2009 | 135 | Private investor | N/A | |||||
| Peter D. Jones (age 65) | Trustee | January 2019 | 135 | Private investor | N/A | |||||
Table of Contents
| Name, Age | Position(s) Held with Fund | Trustee/Officer Since(h) | Number of MFS Funds overseen by the Trustee | Principal Occupations During the Past Five Years | Other Directorships During the Past Five Years (j) | |||||
| James W. Kilman, Jr. (age 60) | Trustee | January 2019 | 135 | Burford Capital Limited (finance and investment management), Senior Advisor (since May 3, 2021), Chief Financial Officer (2019 - May 2, 2021); KielStrand Capital LLC (family office), Chief Executive Officer (since 2016); Morgan Stanley & Co. (financial services), Vice Chairman of Investment Banking, Co-Head of Diversified Financials Coverage – Financial Institutions Investment Banking Group (until 2016) | Alpha-En Corporation, Director (2016-2019) | |||||
| Clarence Otis, Jr. (age 65) | Trustee | March 2017 | 135 | Private investor | VF Corporation, Director; Verizon Communications, Inc., Director; The Travelers Companies, Director | |||||
| Maryanne L. Roepke (age 65) | Trustee | May 2014 | 135 | Private investor | N/A | |||||
| Laurie J. Thomsen (age 63) | Trustee | March 2005 | 135 | Private investor | The Travelers Companies, Director; Dycom Industries, Inc., Director |
| Name, Age | Position(s) Held with Fund | Trustee/Officer Since(h) | Number of MFS Funds for which the Person is an Officer | Principal Occupations During the Past Five Years | ||||
| OFFICERS | ||||||||
| Christopher R. Bohane (k) (age 47) | Assistant Secretary and Assistant Clerk | July 2005 | 135 | Massachusetts Financial Services Company, Senior Vice President and Associate General Counsel | ||||
| Kino Clark (k) (age 53) | Assistant Treasurer | January 2012 | 135 | Massachusetts Financial Services Company, Vice President |
Table of Contents
| Name, Age | Position(s) Held with Fund | Trustee/Officer Since(h) | Number of MFS Funds for which the Person is an Officer | Principal Occupations During the Past Five Years | ||||
| John W. Clark, Jr. (k) (age 54) | Assistant Treasurer | April 2017 | 135 | Massachusetts Financial Services Company, Vice President (since March 2017); Deutsche Bank (financial services), Department Head - Treasurer's Office (until February 2017) | ||||
| Thomas H. Connors (k) (age 61) | Assistant Secretary and Assistant Clerk | September 2012 | 135 | Massachusetts Financial Services Company, Vice President and Senior Counsel | ||||
| David L. DiLorenzo (k) (age 52) | President | July 2005 | 135 | Massachusetts Financial Services Company, Senior Vice President | ||||
| Heidi W. Hardin (k) (age 53) | Secretary and Clerk | April 2017 | 135 | Massachusetts Financial Services Company, Executive Vice President and General Counsel (since March 2017); Harris Associates (investment management), General Counsel (until January 2017) | ||||
| Brian E. Langenfeld (k) (age 48) | Assistant Secretary and Assistant Clerk | June 2006 | 135 | Massachusetts Financial Services Company, Vice President and Senior Counsel | ||||
| Amanda S. Mooradian (k) (age 42) | Assistant Secretary and Assistant Clerk | September 2018 | 135 | Massachusetts Financial Services Company, Assistant Vice President and Senior Counsel | ||||
| Susan A. Pereira (k) (age 50) | Assistant Secretary and Assistant Clerk | July 2005 | 135 | Massachusetts Financial Services Company, Vice President and Assistant General Counsel | ||||
| Kasey L. Phillips (k) (age 50) | Assistant Treasurer | September 2012 | 135 | Massachusetts Financial Services Company, Vice President | ||||
| Matthew A. Stowe (k) (age 46) | Assistant Secretary and Assistant Clerk | October 2014 | 135 | Massachusetts Financial Services Company, Vice President and Assistant General Counsel | ||||
| Martin J. Wolin (k) (age 53) | Chief Compliance Officer | July 2015 | 135 | Massachusetts Financial Services Company, Senior Vice President and Chief Compliance Officer |
Table of Contents
| Name, Age | Position(s) Held with Fund | Trustee/Officer Since(h) | Number of MFS Funds for which the Person is an Officer | Principal Occupations During the Past Five Years | ||||
| James O. Yost (k) (age 61) | Treasurer | September 1990 | 135 | Massachusetts Financial Services Company, Senior Vice President |
| (h) | Date first appointed to serve as Trustee/Officer of an MFS Fund. Each Trustee has served continuously since appointment unless indicated otherwise. For the period from December 15, 2004 until February 22, 2005, Mr. Manning served as Advisory Trustee. From January 2012 through December 2016, Messrs. DiLorenzo and Yost served as Treasurer and Deputy Treasurer of the Funds, respectively. |
| (j) | Directorships or trusteeships of companies required to report to the Securities and Exchange Commission (i.e., “public companies”). |
| (k) | “Interested person” of the Trust within the meaning of the Investment Company Act of 1940 (referred to as the 1940 Act), which is the principal federal law governing investment companies like the fund, as a result of a position with MFS. The address of MFS is 111 Huntington Avenue, Boston, Massachusetts 02199-7618. |
Table of Contents
| Investment Adviser | Custodian |
| Massachusetts Financial Services Company 111 Huntington Avenue Boston, MA 02199-7618 | State Street Bank and Trust Company 1 Lincoln Street Boston, MA 02111-2900 |
| Distributor | Independent Registered Public Accounting Firm |
| MFS Fund Distributors, Inc. 111 Huntington Avenue Boston, MA 02199-7618 | Ernst & Young LLP 200 Clarendon Street Boston, MA 02116 |
| Portfolio Manager(s) | |
| Matthew Barrett Kevin Dwan |
Table of Contents
Table of Contents
Table of Contents
| FACTS | WHAT DOES MFS DO WITH YOUR PERSONAL INFORMATION? |
| Why? | Financial companies choose how they share your personal information. Federal law gives consumers the right to limit some but not all sharing. Federal law also requires us to tell you how we collect, share, and protect your personal information. Please read this notice carefully to understand what we do. |
| What? | The types of personal information we collect and share depend on the product or service you have with us. This information can include: |
| • Social Security number and account balances | |
| • Account transactions and transaction history | |
| • Checking account information and wire transfer instructions | |
| When you are no longer our customer, we continue to share your information as described in this notice. |
| How? | All financial companies need to share customers' personal information to run their everyday business. In the section below, we list the reasons financial companies can share their customers' personal information; the reasons MFS chooses to share; and whether you can limit this sharing. |
| Reasons we can share your personal information | Does MFS share? | Can you limit this sharing? |
| For our everyday business purposes – such as to process your transactions, maintain your account(s), respond to court orders and legal investigations, or report to credit bureaus | Yes | No |
| For our marketing purposes – to offer our products and services to you | No | We don't share |
| For joint marketing with other financial companies | No | We don't share |
| For our affiliates' everyday business purposes – information about your transactions and experiences | No | We don't share |
| For our affiliates' everyday business purposes – information about your creditworthiness | No | We don't share |
| For nonaffiliates to market to you | No | We don't share |
| Questions? | Call 800-225-2606 or go to mfs.com. |

Table of Contents
| Who we are | |
| Who is providing this notice? | MFS Funds, MFS Investment Management, MFS Institutional Advisors, Inc., and MFS Heritage Trust Company. |
| What we do | |
| How does MFS protect my personal information? | To protect your personal information from unauthorized access and use, we use security measures that comply with federal law. These measures include procedural, electronic, and physical safeguards for the protection of the personal information we collect about you. |
| How does MFS collect my personal information? | We collect your personal information, for example, when you |
| • open an account or provide account information | |
| • direct us to buy securities or direct us to sell your securities | |
| • make a wire transfer | |
| We also collect your personal information from others, such as credit bureaus, affiliates, or other companies. | |
| Why can't I limit all sharing? | Federal law gives you the right to limit only |
| • sharing for affiliates' everyday business purposes – information about your creditworthiness | |
| • affiliates from using your information to market to you | |
| • sharing for nonaffiliates to market to you | |
| State laws and individual companies may give you additional rights to limit sharing. | |
| Definitions | |
| Affiliates | Companies related by common ownership or control. They can be financial and nonfinancial companies. |
| • MFS does not share personal information with affiliates, except for everyday business purposes as described on page one of this notice. | |
| Nonaffiliates | Companies not related by common ownership or control. They can be financial and nonfinancial companies. |
| • MFS does not share with nonaffiliates so they can market to you. | |
| Joint marketing | A formal agreement between nonaffiliated financial companies that together market financial products or services to you. |
| • MFS doesn't jointly market. | |
| Other important information |
| If you own an MFS product or receive an MFS service in the name of a third party such as a bank or broker-dealer, their privacy policy may apply to you instead of ours. |
Table of Contents


Table of Contents


Table of Contents
Table of Contents
| 1 | |
| 2 | |
| 4 | |
| 7 | |
| 10 | |
| 12 | |
| 17 | |
| 19 | |
| 20 | |
| 21 | |
| 30 | |
| 44 | |
| 46 | |
| 51 | |
| 52 | |
| 52 | |
| 52 | |
| 52 | |
| 52 | |
| 54 |
| back cover |
Table of Contents
Table of Contents


Table of Contents
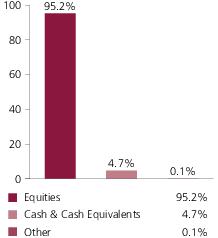
| Nestle S.A. | 4.4% |
| Cadence Design Systems, Inc. | 4.2% |
| Taiwan Semiconductor Manufacturing Co. Ltd., ADR | 3.4% |
| Schneider Electric SE | 3.2% |
| Givaudan S.A. | 3.2% |
| L’Oréal | 2.7% |
| Pernod Ricard S.A. | 2.6% |
| Henkel AG & Co. KGaA | 2.3% |
| ANSYS, Inc. | 2.3% |
| Diageo PLC | 2.3% |
| Consumer Staples | 27.5% |
| Information Technology | 24.7% |
| Industrials | 19.5% |
| Materials | 10.8% |
| Consumer Discretionary | 4.2% |
| Real Estate | 3.3% |
| Financials | 2.7% |
| Health Care | 2.2% |
| Energy | 0.3% |
| Equity Warrants (o) | 0.0% |
| Japan | 17.2% |
| United States | 16.9% |
| France | 14.9% |
| Switzerland | 13.4% |
| United Kingdom | 11.9% |
| Germany | 9.5% |
| Canada | 3.6% |
| Taiwan | 3.4% |
| Denmark | 1.9% |
| Other Countries | 7.3% |
| Euro | 28.8% |
| United States Dollar | 21.3% |
| Swiss Franc | 13.4% |
| Japanese Yen | 13.3% |
| British Pound Sterling | 11.9% |
| Canadian Dollar | 3.6% |
| Taiwan Dollar | 3.4% |
| Danish Krone | 1.9% |
| South Korean Won | 1.8% |
| Other Currencies | 0.6% |
Table of Contents
| (g) | The Global Industry Classification Standard (GICS®) was developed by and/or is the exclusive property of MSCI, Inc. and S&P Global Market Intelligence Inc. (“S&P Global Market Intelligence”). GICS is a service mark of MSCI and S&P Global Market Intelligence and has been licensed for use by MFS. MFS has applied its own internal sector/industry classification methodology for equity securities and non-equity securities that are unclassified by GICS. |
| (o) | Less than 0.1%. |
| (x) | Represents the portfolio’s exposure to issuer countries as a percentage of a portfolio’s net assets. For purposes of this presentation, United States includes Cash & Cash Equivalents and Other. |
| (y) | Represents the portfolio’s exposure to a particular currency as a percentage of a portfolio's net assets. For purposes of this presentation, United States Dollar includes Cash & Cash Equivalents. |
Table of Contents
Table of Contents
Table of Contents
| (b) | Security is not a benchmark constituent. |
Table of Contents
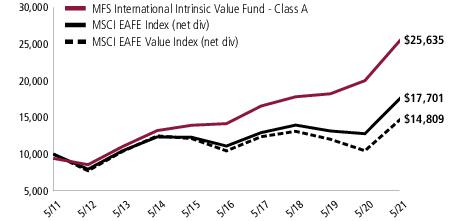
Table of Contents
| Share Class | Class Inception Date | 1-yr | 5-yr | 10-yr |
| A | 10/24/95 | 28.07% | 12.60% | 10.52% |
| B | 10/24/95 | 27.12% | 11.76% | 9.70% |
| C | 7/01/96 | 27.13% | 11.76% | 9.70% |
| I | 1/02/97 | 28.39% | 12.89% | 10.80% |
| R1 | 10/01/08 | 27.11% | 11.76% | 9.70% |
| R2 | 10/01/08 | 27.77% | 12.32% | 10.25% |
| R3 | 10/01/08 | 28.09% | 12.60% | 10.52% |
| R4 | 10/01/08 | 28.39% | 12.88% | 10.80% |
| R6 | 5/01/06 | 28.53% | 13.00% | 10.89% |
| MSCI EAFE Index (net div) (f)(y) | 38.41% | 9.77% | 5.88% |
| MSCI EAFE Value Index (net div) (f) | 41.52% | 7.22% | 4.00% |
| A With Initial Sales Charge (5.75%) | 20.70% | 11.28% | 9.87% |
| B With CDSC (Declining over six years from 4% to 0%) (v) | 23.12% | 11.50% | 9.70% |
| C With CDSC (1% for 12 months) (v) | 26.13% | 11.76% | 9.70% |
| (f) | Source: FactSet Research Systems Inc. |
| (v) | Assuming redemption at the end of the applicable period. |
| (y) | Effective September 30, 2020, the MSCI EAFE Index (net div) replaced the MSCI EAFE Value Index (net div) as the primary benchmark. The fund's investment adviser believes the MSCI EAFE Index (net div) better reflects the investment policies and strategies of the fund. |
Table of Contents
| (e) | Morgan Stanley Capital International (“MSCI”) makes no express or implied warranties or representations and shall have no liability whatsoever with respect to any MSCI data contained herein. The MSCI data may not be further redistributed or used as a basis for other indices or any securities or financial products. This report is not approved, reviewed, or produced by MSCI. |
Table of Contents
December 1, 2020 through May 31, 2021
Table of Contents
| Share Class | Annualized Expense Ratio | Beginning Account Value 12/01/20 | Ending Account Value 5/31/21 | Expenses Paid During Period (p) 12/01/20-5/31/21 | |
| A | Actual | 0.96% | $ 1,000.00 | $ 1,088.93 | $ 5.00 |
| Hypothetical (h) | 0.96% | $ 1,000.00 | $ 1,020.14 | $ 4.84 | |
| B | Actual | 1.71% | $ 1,000.00 | $ 1,084.79 | $ 8.89 |
| Hypothetical (h) | 1.71% | $ 1,000.00 | $ 1,016.40 | $ 8.60 | |
| C | Actual | 1.71% | $ 1,000.00 | $ 1,084.86 | $ 8.89 |
| Hypothetical (h) | 1.71% | $ 1,000.00 | $ 1,016.40 | $ 8.60 | |
| I | Actual | 0.71% | $ 1,000.00 | $ 1,090.22 | $ 3.70 |
| Hypothetical (h) | 0.71% | $ 1,000.00 | $ 1,021.39 | $ 3.58 | |
| R1 | Actual | 1.71% | $ 1,000.00 | $ 1,084.87 | $ 8.89 |
| Hypothetical (h) | 1.71% | $ 1,000.00 | $ 1,016.40 | $ 8.60 | |
| R2 | Actual | 1.21% | $ 1,000.00 | $ 1,087.57 | $ 6.30 |
| Hypothetical (h) | 1.21% | $ 1,000.00 | $ 1,018.90 | $ 6.09 | |
| R3 | Actual | 0.96% | $ 1,000.00 | $ 1,089.06 | $ 5.00 |
| Hypothetical (h) | 0.96% | $ 1,000.00 | $ 1,020.14 | $ 4.84 | |
| R4 | Actual | 0.71% | $ 1,000.00 | $ 1,090.25 | $ 3.70 |
| Hypothetical (h) | 0.71% | $ 1,000.00 | $ 1,021.39 | $ 3.58 | |
| R6 | Actual | 0.61% | $ 1,000.00 | $ 1,090.93 | $ 3.18 |
| Hypothetical (h) | 0.61% | $ 1,000.00 | $ 1,021.89 | $ 3.07 |
| (h) | 5% class return per year before expenses. |
| (p) | “Expenses Paid During Period” are equal to each class’s annualized expense ratio, as shown above, multiplied by the average account value over the period, multiplied by 182/365 (to reflect the one-half year period). Expenses paid do not include any applicable sales charges (loads). If these transaction costs had been included, your costs would have been higher. |
Table of Contents
| Issuer | Shares/Par | Value ($) | ||
| Common Stocks – 92.9% | ||||
| Airlines – 0.8% | ||||
| Ryanair Holdings PLC, ADR (a) | 2,123,728 | $ 247,945,244 | ||
| Alcoholic Beverages – 6.2% | ||||
| Diageo PLC | 15,045,612 | $ 727,615,627 | ||
| Heineken N.V. | 3,639,176 | 434,425,128 | ||
| Pernod Ricard S.A. | 3,774,601 | 831,530,898 | ||
| $1,993,571,653 | ||||
| Apparel Manufacturers – 2.0% | ||||
| Adidas AG | 486,172 | $ 177,373,632 | ||
| Compagnie Financiere Richemont S.A. | 2,241,979 | 273,497,244 | ||
| LVMH Moet Hennessy Louis Vuitton SE | 233,998 | 186,566,135 | ||
| $637,437,011 | ||||
| Automotive – 0.8% | ||||
| Compagnie Generale des Etablissements Michelin (l) | 1,000,223 | $ 153,868,795 | ||
| Knorr-Bremse AG | 923,348 | 114,831,077 | ||
| $268,699,872 | ||||
| Biotechnology – 1.5% | ||||
| Novozymes A.S. | 6,626,042 | $ 483,526,253 | ||
| Brokerage & Asset Managers – 0.6% | ||||
| Euronext N.V. | 1,835,884 | $ 196,999,642 | ||
| Business Services – 6.2% | ||||
| Compass Group PLC (a) | 8,251,589 | $ 188,565,077 | ||
| Experian PLC | 8,891,928 | 341,463,739 | ||
| Intertek Group PLC | 3,830,594 | 295,398,694 | ||
| Nomura Research Institute Ltd. | 7,663,654 | 244,279,409 | ||
| Secom Co. Ltd. | 4,282,600 | 335,207,617 | ||
| SGS S.A. | 155,025 | 483,434,472 | ||
| Sohgo Security Services Co. Ltd. | 2,310,300 | 105,713,791 | ||
| $1,994,062,799 | ||||
| Chemicals – 3.2% | ||||
| Givaudan S.A. | 226,086 | $ 1,009,382,119 | ||
| Computer Software – 8.9% | ||||
| ANSYS, Inc. (a) | 2,154,816 | $ 728,198,519 | ||
| Cadence Design Systems, Inc. (a) | 10,526,633 | 1,336,777,124 | ||
| Dassault Systemes S.A. | 1,287,903 | 296,477,141 | ||
Table of Contents
| Issuer | Shares/Par | Value ($) | ||
| Common Stocks – continued | ||||
| Computer Software – continued | ||||
| OBIC Co. Ltd. | 1,421,200 | $ 266,353,311 | ||
| SAP SE | 1,509,548 | 209,552,277 | ||
| $2,837,358,372 | ||||
| Computer Software - Systems – 3.6% | ||||
| Amadeus IT Group S.A. (a) | 4,305,846 | $ 325,085,944 | ||
| Descartes Systems Group, Inc. (a) | 1,385,045 | 81,071,607 | ||
| Samsung Electronics Co. Ltd. | 8,042,621 | 582,719,941 | ||
| Wix.com Ltd. (a) | 684,384 | 177,844,026 | ||
| $1,166,721,518 | ||||
| Construction – 0.7% | ||||
| Geberit AG | 324,835 | $ 235,120,043 | ||
| Consumer Products – 10.3% | ||||
| Colgate-Palmolive Co. | 6,795,162 | $ 569,298,673 | ||
| Kao Corp. | 7,786,600 | 476,128,295 | ||
| Kobayashi Pharmaceutical Co. Ltd. (h) | 4,119,800 | 365,736,195 | ||
| KOSE Corp. | 482,800 | 75,711,718 | ||
| Lion Corp. | 4,403,700 | 77,101,954 | ||
| L'Oréal | 1,914,751 | 862,357,010 | ||
| Reckitt Benckiser Group PLC | 7,079,608 | 640,493,718 | ||
| ROHTO Pharmaceutical Co. Ltd. (h) | 8,724,900 | 215,154,169 | ||
| $3,281,981,732 | ||||
| Electrical Equipment – 8.0% | ||||
| Halma PLC | 8,575,854 | $ 317,264,126 | ||
| Legrand S.A. | 6,585,683 | 689,684,642 | ||
| OMRON Corp. | 2,735,300 | 215,346,479 | ||
| Schneider Electric SE | 6,403,651 | 1,013,292,913 | ||
| Spectris PLC | 4,812,240 | 219,596,505 | ||
| Yokogawa Electric Corp. | 6,264,500 | 99,154,064 | ||
| $2,554,338,729 | ||||
| Electronics – 7.7% | ||||
| Analog Devices, Inc. | 3,741,515 | $ 615,853,369 | ||
| DISCO Corp. | 332,700 | 102,098,091 | ||
| Hirose Electric Co. Ltd. (h) | 2,630,400 | 374,535,903 | ||
| Infineon Technologies AG | 1,323,116 | 53,821,838 | ||
| Taiwan Semiconductor Manufacturing Co. Ltd., ADR | 9,181,391 | 1,077,528,048 | ||
| Texas Instruments, Inc. | 1,212,932 | 230,238,752 | ||
| $2,454,076,001 | ||||
| Engineering - Construction – 1.3% | ||||
| IMI PLC (h) | 17,400,557 | $ 410,368,340 | ||
Table of Contents
| Issuer | Shares/Par | Value ($) | ||
| Common Stocks – continued | ||||
| Food & Beverages – 8.8% | ||||
| Chocoladefabriken Lindt & Sprungli AG | 6,674 | $ 63,669,745 | ||
| Danone S.A. | 3,960,253 | 282,334,897 | ||
| Ezaki Glico Co. Ltd. | 3,150,700 | 120,284,282 | ||
| ITO EN Ltd. (h) | 5,924,800 | 327,922,988 | ||
| Kerry Group PLC | 1,691,937 | 228,829,699 | ||
| Nestle S.A. | 11,536,115 | 1,420,757,557 | ||
| Nissan Foods Holdings Co. Ltd. | 1,062,700 | 76,967,860 | ||
| Toyo Suisan Kaisha Ltd. (h) | 7,314,700 | 293,282,793 | ||
| $2,814,049,821 | ||||
| Insurance – 0.3% | ||||
| Hiscox Ltd. (a) | 7,940,593 | $ 88,467,221 | ||
| Machinery & Tools – 5.8% | ||||
| Epiroc AB | 8,828,582 | $ 199,902,872 | ||
| GEA Group AG | 5,373,361 | 235,695,054 | ||
| Nordson Corp. | 1,296,359 | 287,389,827 | ||
| Schindler Holding AG | 952,042 | 281,423,552 | ||
| SMC Corp. | 569,900 | 341,034,323 | ||
| Spirax-Sarco Engineering PLC | 2,558,645 | 461,653,745 | ||
| Wartsila Oyj Abp | 4,100,262 | 55,404,745 | ||
| $1,862,504,118 | ||||
| Major Banks – 0.5% | ||||
| UBS Group AG | 10,136,432 | $ 164,476,677 | ||
| Medical Equipment – 3.3% | ||||
| EssilorLuxottica | 1,495,243 | $ 259,421,539 | ||
| Nihon Kohden Corp. (h) | 7,519,400 | 212,897,434 | ||
| Shimadzu Corp. | 9,690,200 | 339,409,234 | ||
| Terumo Corp. | 6,604,300 | 254,364,171 | ||
| $1,066,092,378 | ||||
| Oil Services – 0.3% | ||||
| Core Laboratories N.V. | 2,270,138 | $ 94,891,768 | ||
| Other Banks & Diversified Financials – 1.3% | ||||
| Chiba Bank Ltd. | 10,812,300 | $ 68,731,033 | ||
| Hachijuni Bank Ltd. | 10,607,200 | 35,941,832 | ||
| Julius Baer Group Ltd. | 1,551,505 | 106,327,761 | ||
| Jyske Bank A.S. (a) | 1,346,616 | 68,973,204 | ||
| Mebuki Financial Group, Inc. | 17,862,670 | 37,849,479 | ||
| North Pacific Bank Ltd. | 15,899,900 | 35,433,150 | ||
| Sydbank A.S. | 1,785,583 | 56,988,097 | ||
| $410,244,556 | ||||
Table of Contents
| Issuer | Shares/Par | Value ($) | ||
| Common Stocks – continued | ||||
| Pharmaceuticals – 0.8% | ||||
| Santen Pharmaceutical Co. Ltd. | 18,561,200 | $ 248,013,842 | ||
| Precious Metals & Minerals – 3.4% | ||||
| Agnico-Eagle Mines Ltd. | 3,419,848 | $ 242,279,372 | ||
| Franco-Nevada Corp. | 4,557,751 | 673,655,989 | ||
| Wheaton Precious Metals Corp. | 3,421,323 | 162,335,682 | ||
| $1,078,271,043 | ||||
| Printing & Publishing – 0.3% | ||||
| Wolters Kluwer N.V. | 1,051,715 | $ 100,880,849 | ||
| Real Estate – 3.3% | ||||
| Deutsche Wohnen SE | 7,819,089 | $ 499,113,979 | ||
| LEG Immobilien SE | 1,226,105 | 179,771,119 | ||
| TAG Immobilien AG | 5,134,707 | 162,248,709 | ||
| Vonovia SE, REIT | 3,401,923 | 212,744,469 | ||
| $1,053,878,276 | ||||
| Specialty Chemicals – 2.7% | ||||
| Croda International PLC | 1,217,556 | $ 120,877,216 | ||
| Kansai Paint Co. Ltd. | 5,083,700 | 137,202,790 | ||
| Sika AG | 821,036 | 264,255,120 | ||
| Symrise AG | 2,671,099 | 354,399,253 | ||
| $876,734,379 | ||||
| Specialty Stores – 0.3% | ||||
| Zalando SE (a) | 928,400 | $ 99,247,370 | ||
| Total Common Stocks (Identified Cost, $15,561,421,533) | $29,729,341,626 | |||
| Preferred Stocks – 2.3% | ||||
| Consumer Products – 2.3% | ||||
| Henkel AG & Co. KGaA (Identified Cost, $621,611,218) | 6,411,471 | $ 735,573,687 | ||
| Strike Price | First Exercise | |||
| Warrants – 0.0% | ||||
| Apparel Manufacturers – 0.0% | ||||
| Compagnie Financiere Richemont S.A. (1 share for 2 warrants, Expiration 12/04/23) (a) (Identified Cost, $0) | CHF 67.00 | 11/20/23 | 4,591,082 | $ 3,013,560 |
Table of Contents
| Issuer | Shares/Par | Value ($) | ||
| Investment Companies (h) – 4.1% | ||||
| Money Market Funds – 4.1% | ||||
| MFS Institutional Money Market Portfolio, 0.03% (v) (Identified Cost, $1,317,462,423) | 1,317,578,260 | $ 1,317,578,260 | ||
| Other Assets, Less Liabilities – 0.7% | 220,811,279 | |||
| Net Assets – 100.0% | $32,006,318,412 | |||
| (a) | Non-income producing security. | |||
| (h) | An affiliated issuer, which may be considered one in which the fund owns 5% or more of the outstanding voting securities, or a company which is under common control. At period end, the aggregate values of the fund's investments in affiliated issuers and in unaffiliated issuers were $3,517,476,082 and $28,268,031,051, respectively. | |||
| (l) | A portion of this security is on loan. See Note 2 for additional information. | |||
| (v) | Affiliated issuer that is available only to investment companies managed by MFS. The rate quoted for the MFS Institutional Money Market Portfolio is the annualized seven-day yield of the fund at period end. |
| The following abbreviations are used in this report and are defined: | |
| ADR | American Depositary Receipt |
| REIT | Real Estate Investment Trust |
| Abbreviations indicate amounts shown in currencies other than the U.S. dollar. All amounts are stated in U.S. dollars unless otherwise indicated. A list of abbreviations is shown below: | |
| CHF | Swiss Franc |
| JPY | Japanese Yen |
| Forward Foreign Currency Exchange Contracts | ||||||
| Currency Purchased | Currency Sold | Counterparty | Settlement Date | Unrealized Appreciation (Depreciation) | ||
| Asset Derivatives | ||||||
| USD | 1,261,899,292 | JPY | 133,359,410,000 | HSBC Bank | 8/19/2021 | $43,182,085 |
Table of Contents
| Assets | |
| Investments in unaffiliated issuers, at value, including $18,401,569 of securities on loan (identified cost, $14,842,261,626) | $28,268,031,051 |
| Investments in affiliated issuers, at value (identified cost, $2,658,233,548) | 3,517,476,082 |
| Foreign currency, at value (identified cost, $6,765,982) | 6,776,780 |
| Receivables for | |
| Forward foreign currency exchange contracts | 43,182,085 |
| Fund shares sold | 30,715,095 |
| Interest and dividends | 171,276,240 |
| Other assets | 44,783 |
| Total assets | $32,037,502,116 |
| Liabilities | |
| Payables for | |
| Fund shares reacquired | $21,340,922 |
| Payable to affiliates | |
| Investment adviser | 2,532,922 |
| Administrative services fee | 7,722 |
| Shareholder servicing costs | 5,167,870 |
| Distribution and service fees | 207,554 |
| Payable for independent Trustees' compensation | 1,200 |
| Accrued expenses and other liabilities | 1,925,514 |
| Total liabilities | $31,183,704 |
| Net assets | $32,006,318,412 |
| Net assets consist of | |
| Paid-in capital | $16,493,988,224 |
| Total distributable earnings (loss) | 15,512,330,188 |
| Net assets | $32,006,318,412 |
| Shares of beneficial interest outstanding | 582,455,188 |
Table of Contents
| Net assets | Shares outstanding | Net asset value per share (a) | |
| Class A | $3,046,286,844 | 56,585,746 | $53.83 |
| Class B | 19,910,672 | 392,266 | 50.76 |
| Class C | 264,432,310 | 5,504,063 | 48.04 |
| Class I | 12,285,870,220 | 216,047,259 | 56.87 |
| Class R1 | 11,647,647 | 239,306 | 48.67 |
| Class R2 | 224,998,355 | 4,511,344 | 49.87 |
| Class R3 | 1,383,344,253 | 25,912,717 | 53.38 |
| Class R4 | 1,183,941,985 | 21,931,346 | 53.98 |
| Class R6 | 13,585,886,126 | 251,331,141 | 54.06 |
| (a) | Maximum offering price per share was equal to the net asset value per share for all share classes, except for Class A, for which the maximum offering price per share was $57.11 [100 / 94.25 x $53.83]. On sales of $50,000 or more, the maximum offering price of Class A shares is reduced. A contingent deferred sales charge may be imposed on redemptions of Class A, Class B, and Class C shares. Redemption price per share was equal to the net asset value per share for Classes I, R1, R2, R3, R4, and R6. |
Table of Contents
| Net investment income (loss) | |
| Income | |
| Dividends | $498,791,991 |
| Dividends from affiliated issuers | 34,295,827 |
| Income on securities loaned | 90,791 |
| Other | 1,253 |
| Foreign taxes withheld | (53,672,611) |
| Total investment income | $479,507,251 |
| Expenses | |
| Management fee | $179,813,420 |
| Distribution and service fees | 15,616,047 |
| Shareholder servicing costs | 18,084,565 |
| Administrative services fee | 557,001 |
| Independent Trustees' compensation | 134,465 |
| Custodian fee | 2,527,100 |
| Shareholder communications | 627,879 |
| Audit and tax fees | 359,831 |
| Legal fees | 211,319 |
| Miscellaneous | 743,736 |
| Total expenses | $218,675,363 |
| Reduction of expenses by investment adviser and distributor | (3,418,596) |
| Net expenses | $215,256,767 |
| Net investment income (loss) | $264,250,484 |
| Realized and unrealized gain (loss) | |
| Realized gain (loss) (identified cost basis) | |
| Unaffiliated issuers | $1,757,708,619 |
| Affiliated issuers | 39,216,695 |
| Forward foreign currency exchange contracts | (45,240,957) |
| Foreign currency | 54,389 |
| Net realized gain (loss) | $1,751,738,746 |
| Change in unrealized appreciation or depreciation | |
| Unaffiliated issuers | $5,069,748,404 |
| Affiliated issuers | 109,628,620 |
| Forward foreign currency exchange contracts | 70,705,308 |
| Translation of assets and liabilities in foreign currencies | 6,651,552 |
| Net unrealized gain (loss) | $5,256,733,884 |
| Net realized and unrealized gain (loss) | $7,008,472,630 |
| Change in net assets from operations | $7,272,723,114 |
Table of Contents
| Year ended | ||
| 5/31/21 | 5/31/20 | |
| Change in net assets | ||
| From operations | ||
| Net investment income (loss) | $264,250,484 | $203,403,192 |
| Net realized gain (loss) | 1,751,738,746 | 1,323,905,261 |
| Net unrealized gain (loss) | 5,256,733,884 | 1,027,050,772 |
| Change in net assets from operations | $7,272,723,114 | $2,554,359,225 |
| Total distributions to shareholders | $(1,599,514,295) | $(1,170,503,173) |
| Change in net assets from fund share transactions | $(1,338,808,433) | $(1,492,350,372) |
| Total change in net assets | $4,334,400,386 | $(108,494,320) |
| Net assets | ||
| At beginning of period | 27,671,918,026 | 27,780,412,346 |
| At end of period | $32,006,318,412 | $27,671,918,026 |
Table of Contents
| Class A | Year ended | ||||
| 5/31/21 | 5/31/20 | 5/31/19 | 5/31/18 | 5/31/17 | |
| Net asset value, beginning of period | $44.47 | $42.09 | $42.91 | $40.88 | $35.53 |
| Income (loss) from investment operations | |||||
| Net investment income (loss) (d) | $0.32 | $0.21 | $0.39 | $0.43 | $0.30(c) |
| Net realized and unrealized gain (loss) | 11.78 | 3.93 | 0.45 | 2.67 | 5.62 |
| Total from investment operations | $12.10 | $4.14 | $0.84 | $3.10 | $5.92 |
| Less distributions declared to shareholders | |||||
| From net investment income | $(0.21) | $(0.37) | $(0.51) | $(0.61) | $(0.53) |
| From net realized gain | (2.53) | (1.39) | (1.15) | (0.46) | (0.04) |
| Total distributions declared to shareholders | $(2.74) | $(1.76) | $(1.66) | $(1.07) | $(0.57) |
| Net asset value, end of period (x) | $53.83 | $44.47 | $42.09 | $42.91 | $40.88 |
| Total return (%) (r)(s)(t)(x) | 27.66 | 9.84 | 2.29 | 7.60 | 16.94(c) |
| Ratios (%) (to average net assets) and Supplemental data: | |||||
| Expenses before expense reductions (f) | 0.97 | 0.99 | 0.99 | 0.98 | 1.04(c) |
| Expenses after expense reductions (f) | 0.96 | 0.98 | 0.98 | 0.97 | 1.00(c) |
| Net investment income (loss) | 0.63 | 0.48 | 0.93 | 1.02 | 0.82(c) |
| Portfolio turnover | 7 | 7 | 6 | 14 | 7 |
| Net assets at end of period (000 omitted) | $3,046,287 | $2,651,120 | $2,959,958 | $3,594,359 | $3,927,507 |
Table of Contents
| Class B | Year ended | ||||
| 5/31/21 | 5/31/20 | 5/31/19 | 5/31/18 | 5/31/17 | |
| Net asset value, beginning of period | $42.18 | $39.99 | $40.80 | $38.94 | $33.86 |
| Income (loss) from investment operations | |||||
| Net investment income (loss) (d) | $(0.08) | $(0.12) | $0.06 | $0.11 | $0.09(c) |
| Net realized and unrealized gain (loss) | 11.19 | 3.72 | 0.46 | 2.53 | 5.29 |
| Total from investment operations | $11.11 | $3.60 | $0.52 | $2.64 | $5.38 |
| Less distributions declared to shareholders | |||||
| From net investment income | $— | $(0.02) | $(0.18) | $(0.32) | $(0.26) |
| From net realized gain | (2.53) | (1.39) | (1.15) | (0.46) | (0.04) |
| Total distributions declared to shareholders | $(2.53) | $(1.41) | $(1.33) | $(0.78) | $(0.30) |
| Net asset value, end of period (x) | $50.76 | $42.18 | $39.99 | $40.80 | $38.94 |
| Total return (%) (r)(s)(t)(x) | 26.75 | 8.99 | 1.53 | 6.79 | 16.05(c) |
| Ratios (%) (to average net assets) and Supplemental data: | |||||
| Expenses before expense reductions (f) | 1.72 | 1.74 | 1.74 | 1.73 | 1.79(c) |
| Expenses after expense reductions (f) | 1.71 | 1.73 | 1.73 | 1.72 | 1.75(c) |
| Net investment income (loss) | (0.16) | (0.29) | 0.16 | 0.27 | 0.27(c) |
| Portfolio turnover | 7 | 7 | 6 | 14 | 7 |
| Net assets at end of period (000 omitted) | $19,911 | $25,231 | $35,571 | $46,522 | $52,439 |
Table of Contents
| Class C | Year ended | ||||
| 5/31/21 | 5/31/20 | 5/31/19 | 5/31/18 | 5/31/17 | |
| Net asset value, beginning of period | $40.04 | $38.05 | $38.91 | $37.19 | $32.36 |
| Income (loss) from investment operations | |||||
| Net investment income (loss) (d) | $(0.09) | $(0.11) | $0.07 | $0.11 | $0.09(c) |
| Net realized and unrealized gain (loss) | 10.62 | 3.54 | 0.42 | 2.40 | 5.06 |
| Total from investment operations | $10.53 | $3.43 | $0.49 | $2.51 | $5.15 |
| Less distributions declared to shareholders | |||||
| From net investment income | $— | $(0.05) | $(0.20) | $(0.33) | $(0.28) |
| From net realized gain | (2.53) | (1.39) | (1.15) | (0.46) | (0.04) |
| Total distributions declared to shareholders | $(2.53) | $(1.44) | $(1.35) | $(0.79) | $(0.32) |
| Net asset value, end of period (x) | $48.04 | $40.04 | $38.05 | $38.91 | $37.19 |
| Total return (%) (r)(s)(t)(x) | 26.73 | 9.00 | 1.53 | 6.77 | 16.07(c) |
| Ratios (%) (to average net assets) and Supplemental data: | |||||
| Expenses before expense reductions (f) | 1.72 | 1.74 | 1.74 | 1.73 | 1.79(c) |
| Expenses after expense reductions (f) | 1.71 | 1.73 | 1.73 | 1.72 | 1.75(c) |
| Net investment income (loss) | (0.19) | (0.27) | 0.17 | 0.28 | 0.26(c) |
| Portfolio turnover | 7 | 7 | 6 | 14 | 7 |
| Net assets at end of period (000 omitted) | $264,432 | $395,411 | $496,745 | $627,662 | $719,227 |
Table of Contents
| Class I | Year ended | ||||
| 5/31/21 | 5/31/20 | 5/31/19 | 5/31/18 | 5/31/17 | |
| Net asset value, beginning of period | $46.83 | $44.24 | $45.02 | $42.85 | $37.22 |
| Income (loss) from investment operations | |||||
| Net investment income (loss) (d) | $0.47 | $0.34 | $0.53 | $0.58 | $0.53(c) |
| Net realized and unrealized gain (loss) | 12.44 | 4.13 | 0.47 | 2.77 | 5.77 |
| Total from investment operations | $12.91 | $4.47 | $1.00 | $3.35 | $6.30 |
| Less distributions declared to shareholders | |||||
| From net investment income | $(0.34) | $(0.49) | $(0.63) | $(0.72) | $(0.63) |
| From net realized gain | (2.53) | (1.39) | (1.15) | (0.46) | (0.04) |
| Total distributions declared to shareholders | $(2.87) | $(1.88) | $(1.78) | $(1.18) | $(0.67) |
| Net asset value, end of period (x) | $56.87 | $46.83 | $44.24 | $45.02 | $42.85 |
| Total return (%) (r)(s)(t)(x) | 28.01 | 10.10 | 2.56 | 7.85 | 17.25(c) |
| Ratios (%) (to average net assets) and Supplemental data: | |||||
| Expenses before expense reductions (f) | 0.72 | 0.74 | 0.74 | 0.73 | 0.79(c) |
| Expenses after expense reductions (f) | 0.71 | 0.73 | 0.73 | 0.72 | 0.75(c) |
| Net investment income (loss) | 0.89 | 0.74 | 1.22 | 1.30 | 1.39(c) |
| Portfolio turnover | 7 | 7 | 6 | 14 | 7 |
| Net assets at end of period (000 omitted) | $12,285,870 | $10,468,862 | $10,871,918 | $11,680,254 | $14,934,283 |
Table of Contents
| Class R1 | Year ended | ||||
| 5/31/21 | 5/31/20 | 5/31/19 | 5/31/18 | 5/31/17 | |
| Net asset value, beginning of period | $40.54 | $38.51 | $39.39 | $37.64 | $32.77 |
| Income (loss) from investment operations | |||||
| Net investment income (loss) (d) | $(0.06) | $(0.10) | $0.08 | $0.12 | $0.10(c) |
| Net realized and unrealized gain (loss) | 10.72 | 3.58 | 0.41 | 2.43 | 5.11 |
| Total from investment operations | $10.66 | $3.48 | $0.49 | $2.55 | $5.21 |
| Less distributions declared to shareholders | |||||
| From net investment income | $— | $(0.06) | $(0.22) | $(0.34) | $(0.30) |
| From net realized gain | (2.53) | (1.39) | (1.15) | (0.46) | (0.04) |
| Total distributions declared to shareholders | $(2.53) | $(1.45) | $(1.37) | $(0.80) | $(0.34) |
| Net asset value, end of period (x) | $48.67 | $40.54 | $38.51 | $39.39 | $37.64 |
| Total return (%) (r)(s)(t)(x) | 26.72 | 9.01 | 1.52 | 6.79 | 16.08(c) |
| Ratios (%) (to average net assets) and Supplemental data: | |||||
| Expenses before expense reductions (f) | 1.72 | 1.74 | 1.73 | 1.73 | 1.79(c) |
| Expenses after expense reductions (f) | 1.71 | 1.73 | 1.73 | 1.72 | 1.75(c) |
| Net investment income (loss) | (0.12) | (0.25) | 0.20 | 0.31 | 0.29(c) |
| Portfolio turnover | 7 | 7 | 6 | 14 | 7 |
| Net assets at end of period (000 omitted) | $11,648 | $9,836 | $11,321 | $12,943 | $12,813 |
Table of Contents
| Class R2 | Year ended | ||||
| 5/31/21 | 5/31/20 | 5/31/19 | 5/31/18 | 5/31/17 | |
| Net asset value, beginning of period | $41.36 | $39.25 | $40.13 | $38.32 | $33.36 |
| Income (loss) from investment operations | |||||
| Net investment income (loss) (d) | $0.18 | $0.09 | $0.27 | $0.29 | $0.29(c) |
| Net realized and unrealized gain (loss) | 10.95 | 3.67 | 0.41 | 2.51 | 5.17 |
| Total from investment operations | $11.13 | $3.76 | $0.68 | $2.80 | $5.46 |
| Less distributions declared to shareholders | |||||
| From net investment income | $(0.09) | $(0.26) | $(0.41) | $(0.53) | $(0.46) |
| From net realized gain | (2.53) | (1.39) | (1.15) | (0.46) | (0.04) |
| Total distributions declared to shareholders | $(2.62) | $(1.65) | $(1.56) | $(0.99) | $(0.50) |
| Net asset value, end of period (x) | $49.87 | $41.36 | $39.25 | $40.13 | $38.32 |
| Total return (%) (r)(s)(t)(x) | 27.36 | 9.56 | 2.02 | 7.34 | 16.62(c) |
| Ratios (%) (to average net assets) and Supplemental data: | |||||
| Expenses before expense reductions (f) | 1.22 | 1.24 | 1.24 | 1.23 | 1.29(c) |
| Expenses after expense reductions (f) | 1.21 | 1.23 | 1.23 | 1.22 | 1.25(c) |
| Net investment income (loss) | 0.38 | 0.23 | 0.69 | 0.74 | 0.83(c) |
| Portfolio turnover | 7 | 7 | 6 | 14 | 7 |
| Net assets at end of period (000 omitted) | $224,998 | $219,474 | $295,690 | $358,138 | $429,776 |
Table of Contents
| Class R3 | Year ended | ||||
| 5/31/21 | 5/31/20 | 5/31/19 | 5/31/18 | 5/31/17 | |
| Net asset value, beginning of period | $44.11 | $41.78 | $42.62 | $40.63 | $35.34 |
| Income (loss) from investment operations | |||||
| Net investment income (loss) (d) | $0.31 | $0.21 | $0.40 | $0.45 | $0.39(c) |
| Net realized and unrealized gain (loss) | 11.70 | 3.89 | 0.43 | 2.63 | 5.49 |
| Total from investment operations | $12.01 | $4.10 | $0.83 | $3.08 | $5.88 |
| Less distributions declared to shareholders | |||||
| From net investment income | $(0.21) | $(0.38) | $(0.52) | $(0.63) | $(0.55) |
| From net realized gain | (2.53) | (1.39) | (1.15) | (0.46) | (0.04) |
| Total distributions declared to shareholders | $(2.74) | $(1.77) | $(1.67) | $(1.09) | $(0.59) |
| Net asset value, end of period (x) | $53.38 | $44.11 | $41.78 | $42.62 | $40.63 |
| Total return (%) (r)(s)(t)(x) | 27.68 | 9.81 | 2.28 | 7.61 | 16.93(c) |
| Ratios (%) (to average net assets) and Supplemental data: | |||||
| Expenses before expense reductions (f) | 0.97 | 0.99 | 0.99 | 0.98 | 1.04(c) |
| Expenses after expense reductions (f) | 0.96 | 0.98 | 0.98 | 0.97 | 1.00(c) |
| Net investment income (loss) | 0.62 | 0.49 | 0.97 | 1.06 | 1.08(c) |
| Portfolio turnover | 7 | 7 | 6 | 14 | 7 |
| Net assets at end of period (000 omitted) | $1,383,344 | $1,320,257 | $1,353,427 | $1,450,342 | $1,406,181 |
Table of Contents
| Class R4 | Year ended | ||||
| 5/31/21 | 5/31/20 | 5/31/19 | 5/31/18 | 5/31/17 | |
| Net asset value, beginning of period | $44.58 | $42.20 | $43.03 | $41.01 | $35.66 |
| Income (loss) from investment operations | |||||
| Net investment income (loss) (d) | $0.45 | $0.33 | $0.51 | $0.55 | $0.49(c) |
| Net realized and unrealized gain (loss) | 11.82 | 3.93 | 0.44 | 2.66 | 5.53 |
| Total from investment operations | $12.27 | $4.26 | $0.95 | $3.21 | $6.02 |
| Less distributions declared to shareholders | |||||
| From net investment income | $(0.34) | $(0.49) | $(0.63) | $(0.73) | $(0.63) |
| From net realized gain | (2.53) | (1.39) | (1.15) | (0.46) | (0.04) |
| Total distributions declared to shareholders | $(2.87) | $(1.88) | $(1.78) | $(1.19) | $(0.67) |
| Net asset value, end of period (x) | $53.98 | $44.58 | $42.20 | $43.03 | $41.01 |
| Total return (%) (r)(s)(t)(x) | 27.99 | 10.09 | 2.56 | 7.85 | 17.23(c) |
| Ratios (%) (to average net assets) and Supplemental data: | |||||
| Expenses before expense reductions (f) | 0.72 | 0.74 | 0.74 | 0.73 | 0.79(c) |
| Expenses after expense reductions (f) | 0.71 | 0.73 | 0.73 | 0.72 | 0.75(c) |
| Net investment income (loss) | 0.88 | 0.75 | 1.22 | 1.30 | 1.32(c) |
| Portfolio turnover | 7 | 7 | 6 | 14 | 7 |
| Net assets at end of period (000 omitted) | $1,183,942 | $1,019,909 | $1,048,956 | $1,157,723 | $1,134,929 |
Table of Contents
| Class R6 | Year ended | ||||
| 5/31/21 | 5/31/20 | 5/31/19 | 5/31/18 | 5/31/17 | |
| Net asset value, beginning of period | $44.63 | $42.24 | $43.09 | $41.06 | $35.70 |
| Income (loss) from investment operations | |||||
| Net investment income (loss) (d) | $0.51 | $0.37 | $0.56 | $0.62 | $0.55(c) |
| Net realized and unrealized gain (loss) | 11.84 | 3.94 | 0.42 | 2.64 | 5.52 |
| Total from investment operations | $12.35 | $4.31 | $0.98 | $3.26 | $6.07 |
| Less distributions declared to shareholders | |||||
| From net investment income | $(0.39) | $(0.53) | $(0.68) | $(0.77) | $(0.67) |
| From net realized gain | (2.53) | (1.39) | (1.15) | (0.46) | (0.04) |
| Total distributions declared to shareholders | $(2.92) | $(1.92) | $(1.83) | $(1.23) | $(0.71) |
| Net asset value, end of period (x) | $54.06 | $44.63 | $42.24 | $43.09 | $41.06 |
| Total return (%) (r)(s)(t)(x) | 28.15 | 10.21 | 2.64 | 7.97 | 17.37(c) |
| Ratios (%) (to average net assets) and Supplemental data: | |||||
| Expenses before expense reductions (f) | 0.62 | 0.63 | 0.63 | 0.63 | 0.69(c) |
| Expenses after expense reductions (f) | 0.61 | 0.62 | 0.62 | 0.62 | 0.65(c) |
| Net investment income (loss) | 1.01 | 0.85 | 1.34 | 1.46 | 1.49(c) |
| Portfolio turnover | 7 | 7 | 6 | 14 | 7 |
| Net assets at end of period (000 omitted) | $13,585,886 | $11,561,818 | $10,706,826 | $10,625,510 | $4,751,104 |
| (c) | Amount reflects a one-time reimbursement of expenses by the custodian (or former custodian) without which net investment income and performance would be lower and expenses would be higher. |
| (d) | Per share data is based on average shares outstanding. |
| (f) | Ratios do not reflect reductions from fees paid indirectly, if applicable. |
| (r) | Certain expenses have been reduced without which performance would have been lower. |
| (s) | From time to time the fund may receive proceeds from litigation settlements, without which performance would be lower. |
| (t) | Total returns do not include any applicable sales charges. |
| (x) | The net asset values and total returns have been calculated on net assets which include adjustments made in accordance with U.S. generally accepted accounting principles required at period end for financial reporting purposes. |
Table of Contents
Table of Contents
Table of Contents
| Financial Instruments | Level 1 | Level 2 | Level 3 | Total |
| Equity Securities | $30,467,928,873 | $— | $— | $30,467,928,873 |
| Mutual Funds | 1,317,578,260 | — | — | 1,317,578,260 |
| Total | $31,785,507,133 | $— | $— | $31,785,507,133 |
| Other Financial Instruments | ||||
| Forward Foreign Currency Exchange Contracts – Assets | $— | $43,182,085 | $— | $43,182,085 |
Table of Contents
| Fair Value | |||
| Risk | Derivative Contracts | Asset Derivatives | |
| Foreign Exchange | Forward Foreign Currency Exchange Contracts | $43,182,085 |
| Risk | Forward Foreign Currency Exchange Contracts |
| Foreign Exchange | $(45,240,957) |
| Risk | Forward Foreign Currency Exchange Contracts |
| Foreign Exchange | $70,705,308 |
Table of Contents
Table of Contents
Table of Contents
| Year ended 5/31/21 | Year ended 5/31/20 | |
| Ordinary income (including any short-term capital gains) | $195,661,344 | $318,778,739 |
| Long-term capital gains | 1,403,852,951 | 851,724,434 |
| Total distributions | $1,599,514,295 | $1,170,503,173 |
| As of 5/31/21 | |
| Cost of investments | $17,576,960,595 |
| Gross appreciation | 14,486,756,372 |
| Gross depreciation | (235,027,749) |
| Net unrealized appreciation (depreciation) | $14,251,728,623 |
| Undistributed ordinary income | 344,553,594 |
| Undistributed long-term capital gain | 914,092,527 |
| Other temporary differences | 1,955,444 |
| Total distributable earnings (loss) | $15,512,330,188 |
Table of Contents
| Year ended 5/31/21 | Year ended 5/31/20 | ||
| Class A | $154,672,142 | $113,265,526 | |
| Class B | 1,208,383 | 1,068,147 | |
| Class C | 19,216,979 | 16,217,262 | |
| Class I | 606,917,497 | 434,142,654 | |
| Class R1 | 605,361 | 360,163 | |
| Class R2 | 12,057,297 | 10,019,225 | |
| Class R3 | 76,000,365 | 56,109,021 | |
| Class R4 | 62,034,522 | 43,680,889 | |
| Class R6 | 666,801,749 | 495,640,286 | |
| Total | $1,599,514,295 | $1,170,503,173 |
| Up to $1 billion | 0.90% |
| In excess of $1 billion and up to $2 billion | 0.80% |
| In excess of $2 billion and up to $10 billion | 0.70% |
| In excess of $10 billion and up to $15 billion | 0.65% |
| In excess of $15 billion and up to $20 billion | 0.55% |
| In excess of $20 billion and up to $25 billion | 0.50% |
| In excess of $25 billion and up to $30 billion | 0.45% |
| In excess of $30 billion and up to $35 billion | 0.43% |
| In excess of $35 billion | 0.41% |
Table of Contents
| Distribution Fee Rate (d) | Service Fee Rate (d) | Total Distribution Plan (d) | Annual Effective Rate (e) | Distribution and Service Fee | |
| Class A | — | 0.25% | 0.25% | 0.25% | $ 7,292,475 |
| Class B | 0.75% | 0.25% | 1.00% | 1.00% | 232,339 |
| Class C | 0.75% | 0.25% | 1.00% | 1.00% | 3,396,718 |
| Class R1 | 0.75% | 0.25% | 1.00% | 1.00% | 111,708 |
| Class R2 | 0.25% | 0.25% | 0.50% | 0.50% | 1,123,322 |
| Class R3 | — | 0.25% | 0.25% | 0.25% | 3,459,485 |
| Total Distribution and Service Fees | $15,616,047 |
| (d) | In accordance with the distribution plan for certain classes, the fund pays distribution and/or service fees equal to these annual percentage rates of each class’s average daily net assets. The distribution and service fee rates disclosed by class represent the current rates in effect at the end of the reporting period. Any rate changes, if applicable, are detailed below. |
| (e) | The annual effective rates represent actual fees incurred under the distribution plan for the year ended May 31, 2021 based on each class's average daily net assets. MFD has voluntarily agreed to rebate a portion of each class's 0.25% service fee attributable to accounts for which there is no financial intermediary specified on the account except for accounts attributable to MFS or its affiliates' seed money. For the year ended May 31, 2021, this rebate amounted to $2,531, $9, $88, and $10 for Class A, Class B, Class C, and Class R3, respectively, and is included in the reduction of total expenses in the Statement of Operations. |
| Amount | |
| Class A | $922 |
| Class B | 8,438 |
| Class C | 2,548 |
Table of Contents
Table of Contents
| Year ended 5/31/21 | Year ended 5/31/20 | ||||
| Shares | Amount | Shares | Amount | ||
| Shares sold | |||||
| Class A | 10,188,175 | $510,557,343 | 9,489,966 | $406,662,902 | |
| Class B | 2,376 | 112,694 | 1,899 | 79,845 | |
| Class C | 82,712 | 3,695,600 | 219,520 | 8,683,562 | |
| Class I | 27,774,216 | 1,475,371,115 | 28,106,233 | 1,257,995,288 | |
| Class R1 | 51,869 | 2,390,769 | 43,392 | 1,696,952 | |
| Class R2 | 708,988 | 33,032,124 | 772,296 | 31,195,475 | |
| Class R3 | 4,253,721 | 211,328,017 | 5,835,690 | 250,654,235 | |
| Class R4 | 4,944,841 | 250,877,442 | 5,709,984 | 250,380,836 | |
| Class R6 | 40,416,023 | 2,048,179,078 | 44,611,383 | 1,961,893,209 | |
| 88,422,921 | $4,535,544,182 | 94,790,363 | $4,169,242,304 | ||
| Shares issued to shareholders in reinvestment of distributions | |||||
| Class A | 2,715,673 | $136,299,607 | 2,278,606 | $101,648,593 | |
| Class B | 23,072 | 1,095,693 | 23,423 | 994,760 | |
| Class C | 420,393 | 18,896,653 | 359,759 | 14,501,899 | |
| Class I | 9,984,602 | 528,784,496 | 8,181,128 | 383,858,540 | |
| Class R1 | 13,293 | 605,360 | 8,825 | 360,163 | |
| Class R2 | 257,545 | 11,988,708 | 233,618 | 9,704,485 | |
| Class R3 | 1,527,032 | 76,000,365 | 1,268,000 | 56,109,021 | |
| Class R4 | 1,118,326 | 56,218,250 | 876,284 | 39,143,625 | |
| Class R6 | 12,517,258 | 629,743,270 | 10,561,776 | 472,111,394 | |
| 28,577,194 | $1,459,632,402 | 23,791,419 | $1,078,432,480 | ||
| Shares reacquired | |||||
| Class A | (15,940,030) | $(799,575,038) | (22,469,987) | $(956,526,809) | |
| Class B | (231,307) | (10,978,505) | (316,761) | (12,848,751) | |
| Class C | (4,874,044) | (219,759,973) | (3,759,248) | (146,118,818) | |
| Class I | (45,272,015) | (2,381,574,792) | (58,492,147) | (2,603,033,876) | |
| Class R1 | (68,491) | (3,143,462) | (103,564) | (4,130,127) | |
| Class R2 | (1,761,552) | (81,643,838) | (3,232,204) | (129,090,822) | |
| Class R3 | (9,797,063) | (487,293,200) | (9,570,168) | (408,046,750) | |
| Class R4 | (7,010,934) | (353,335,832) | (8,566,756) | (372,768,236) | |
| Class R6 | (60,652,521) | (2,996,680,377) | (49,587,172) | (2,107,460,967) | |
| (145,607,957) | $(7,333,985,017) | (156,098,007) | $(6,740,025,156) | ||
Table of Contents
| Year ended 5/31/21 | Year ended 5/31/20 | ||||
| Shares | Amount | Shares | Amount | ||
| Net change | |||||
| Class A | (3,036,182) | $(152,718,088) | (10,701,415) | $(448,215,314) | |
| Class B | (205,859) | (9,770,118) | (291,439) | (11,774,146) | |
| Class C | (4,370,939) | (197,167,720) | (3,179,969) | (122,933,357) | |
| Class I | (7,513,197) | (377,419,181) | (22,204,786) | (961,180,048) | |
| Class R1 | (3,329) | (147,333) | (51,347) | (2,073,012) | |
| Class R2 | (795,019) | (36,623,006) | (2,226,290) | (88,190,862) | |
| Class R3 | (4,016,310) | (199,964,818) | (2,466,478) | (101,283,494) | |
| Class R4 | (947,767) | (46,240,140) | (1,980,488) | (83,243,775) | |
| Class R6 | (7,719,240) | (318,758,029) | 5,585,987 | 326,543,636 | |
| (28,607,842) | $(1,338,808,433) | (37,516,225) | $(1,492,350,372) | ||
Table of Contents
| Affiliated Issuers | Beginning Value | Purchases | Sales Proceeds | Realized Gain (Loss) | Change in Unrealized Appreciation or Depreciation | Ending Value |
| Core Laboratories N.V.* | $47,901,362 | $— | $2,575,076 | $(9,174,161) | $58,739,643 | $— |
| Hirose Electric Co. Ltd. | 340,339,867 | $— | 29,914,799 | 52,600 | 64,058,235 | $374,535,903 |
| IMI PLC | 202,609,414 | — | 11,555,003 | (648,974) | 219,962,903 | 410,368,340 |
| ITO EN Ltd. | 409,171,070 | — | 74,595,100 | 29,084,493 | (35,737,475) | 327,922,988 |
| Kobayashi Pharmaceutical Co. Ltd. | 382,700,357 | — | 19,049,598 | 13,480,032 | (11,394,596) | 365,736,195 |
| MFS Institutional Money Market Portfolio | 1,532,254,924 | 3,483,478,140 | 3,698,024,541 | (54,055) | (76,208) | 1,317,578,260 |
| Nihon Kohden Corp. | 261,575,460 | — | 11,039,541 | 2,772,071 | (40,410,556) | 212,897,434 |
| ROHTO Pharmaceutical Co. Ltd. | 218,546,859 | 60,247,698 | 10,166,906 | (661,856) | (52,811,626) | 215,154,169 |
| Toyo Suisan Kaisha Ltd. | 398,493,013 | — | 16,875,065 | 4,366,545 | (92,701,700) | 293,282,793 |
| $3,793,592,326 | $3,543,725,838 | $3,873,795,629 | $39,216,695 | $109,628,620 | $3,517,476,082 |
| Affiliated Issuers | Dividend Income | Capital Gain Distributions |
| Core Laboratories N.V.* | $— | $— |
| Hirose Electric Co. Ltd. | $5,435,739 | — |
| IMI PLC | 11,650,101 | — |
| ITO EN Ltd. | 2,185,499 | — |
| Kobayashi Pharmaceutical Co. Ltd. | 2,762,316 | — |
| MFS Institutional Money Market Portfolio | 1,390,109 | — |
| Nihon Kohden Corp. | 3,445,651 | — |
| ROHTO Pharmaceutical Co. Ltd. | 1,891,211 | — |
| Toyo Suisan Kaisha Ltd. | 5,535,201 | — |
| $34,295,827 | $— |
Table of Contents
Table of Contents
Table of Contents

July 16, 2021
Table of Contents
| Name, Age | Position(s) Held with Fund | Trustee/Officer Since(h) | Number of MFS Funds overseen by the Trustee | Principal Occupations During the Past Five Years | Other Directorships During the Past Five Years (j) | |||||
| INTERESTED TRUSTEES | ||||||||||
| Robert J. Manning (k) (age 57) | Trustee | February 2004 | 135 | Massachusetts Financial Services Company, Non-Executive Chairman (since January 2021); Director; Chairman of the Board; Executive Chairman (January 2017-2020); Co-Chief Executive Officer (2015-2016) | N/A | |||||
| Michael W. Roberge (k) (age 54) | Trustee | January 2021 | 135 | Massachusetts Financial Services Company, Chairman (since January 2021); Chief Executive Officer (since January 2017); Director; President (until December 2018); Chief Investment Officer (until December 2018); Co-Chief Executive Officer (until December 2016) | N/A | |||||
| INDEPENDENT TRUSTEES | ||||||||||
| John P. Kavanaugh (age 66) | Trustee and Chair of Trustees | January 2009 | 135 | Private investor | N/A | |||||
| Steven E. Buller (age 69) | Trustee | February 2014 | 135 | Private investor | N/A | |||||
| John A. Caroselli (age 67) | Trustee | March 2017 | 135 | Private investor; JC Global Advisors, LLC (management consulting), President (since 2015) | N/A | |||||
| Maureen R. Goldfarb (age 66) | Trustee | January 2009 | 135 | Private investor | N/A | |||||
| Peter D. Jones (age 65) | Trustee | January 2019 | 135 | Private investor | N/A | |||||
Table of Contents
| Name, Age | Position(s) Held with Fund | Trustee/Officer Since(h) | Number of MFS Funds overseen by the Trustee | Principal Occupations During the Past Five Years | Other Directorships During the Past Five Years (j) | |||||
| James W. Kilman, Jr. (age 60) | Trustee | January 2019 | 135 | Burford Capital Limited (finance and investment management), Senior Advisor (since May 3, 2021), Chief Financial Officer (2019 - May 2, 2021); KielStrand Capital LLC (family office), Chief Executive Officer (since 2016); Morgan Stanley & Co. (financial services), Vice Chairman of Investment Banking, Co-Head of Diversified Financials Coverage – Financial Institutions Investment Banking Group (until 2016) | Alpha-En Corporation, Director (2016-2019) | |||||
| Clarence Otis, Jr. (age 65) | Trustee | March 2017 | 135 | Private investor | VF Corporation, Director; Verizon Communications, Inc., Director; The Travelers Companies, Director | |||||
| Maryanne L. Roepke (age 65) | Trustee | May 2014 | 135 | Private investor | N/A | |||||
| Laurie J. Thomsen (age 63) | Trustee | March 2005 | 135 | Private investor | The Travelers Companies, Director; Dycom Industries, Inc., Director |
| Name, Age | Position(s) Held with Fund | Trustee/Officer Since(h) | Number of MFS Funds for which the Person is an Officer | Principal Occupations During the Past Five Years | ||||
| OFFICERS | ||||||||
| Christopher R. Bohane (k) (age 47) | Assistant Secretary and Assistant Clerk | July 2005 | 135 | Massachusetts Financial Services Company, Senior Vice President and Associate General Counsel | ||||
| Kino Clark (k) (age 53) | Assistant Treasurer | January 2012 | 135 | Massachusetts Financial Services Company, Vice President |
Table of Contents
| Name, Age | Position(s) Held with Fund | Trustee/Officer Since(h) | Number of MFS Funds for which the Person is an Officer | Principal Occupations During the Past Five Years | ||||
| John W. Clark, Jr. (k) (age 54) | Assistant Treasurer | April 2017 | 135 | Massachusetts Financial Services Company, Vice President (since March 2017); Deutsche Bank (financial services), Department Head - Treasurer's Office (until February 2017) | ||||
| Thomas H. Connors (k) (age 61) | Assistant Secretary and Assistant Clerk | September 2012 | 135 | Massachusetts Financial Services Company, Vice President and Senior Counsel | ||||
| David L. DiLorenzo (k) (age 52) | President | July 2005 | 135 | Massachusetts Financial Services Company, Senior Vice President | ||||
| Heidi W. Hardin (k) (age 53) | Secretary and Clerk | April 2017 | 135 | Massachusetts Financial Services Company, Executive Vice President and General Counsel (since March 2017); Harris Associates (investment management), General Counsel (until January 2017) | ||||
| Brian E. Langenfeld (k) (age 48) | Assistant Secretary and Assistant Clerk | June 2006 | 135 | Massachusetts Financial Services Company, Vice President and Senior Counsel | ||||
| Amanda S. Mooradian (k) (age 42) | Assistant Secretary and Assistant Clerk | September 2018 | 135 | Massachusetts Financial Services Company, Assistant Vice President and Senior Counsel | ||||
| Susan A. Pereira (k) (age 50) | Assistant Secretary and Assistant Clerk | July 2005 | 135 | Massachusetts Financial Services Company, Vice President and Assistant General Counsel | ||||
| Kasey L. Phillips (k) (age 50) | Assistant Treasurer | September 2012 | 135 | Massachusetts Financial Services Company, Vice President | ||||
| Matthew A. Stowe (k) (age 46) | Assistant Secretary and Assistant Clerk | October 2014 | 135 | Massachusetts Financial Services Company, Vice President and Assistant General Counsel | ||||
| Martin J. Wolin (k) (age 53) | Chief Compliance Officer | July 2015 | 135 | Massachusetts Financial Services Company, Senior Vice President and Chief Compliance Officer |
Table of Contents
| Name, Age | Position(s) Held with Fund | Trustee/Officer Since(h) | Number of MFS Funds for which the Person is an Officer | Principal Occupations During the Past Five Years | ||||
| James O. Yost (k) (age 61) | Treasurer | September 1990 | 135 | Massachusetts Financial Services Company, Senior Vice President |
| (h) | Date first appointed to serve as Trustee/Officer of an MFS Fund. Each Trustee has served continuously since appointment unless indicated otherwise. For the period from December 15, 2004 until February 22, 2005, Mr. Manning served as Advisory Trustee. From January 2012 through December 2016, Messrs. DiLorenzo and Yost served as Treasurer and Deputy Treasurer of the Funds, respectively. |
| (j) | Directorships or trusteeships of companies required to report to the Securities and Exchange Commission (i.e., “public companies”). |
| (k) | “Interested person” of the Trust within the meaning of the Investment Company Act of 1940 (referred to as the 1940 Act), which is the principal federal law governing investment companies like the fund, as a result of a position with MFS. The address of MFS is 111 Huntington Avenue, Boston, Massachusetts 02199-7618. |
Table of Contents
| Investment Adviser | Custodian |
| Massachusetts Financial Services Company 111 Huntington Avenue Boston, MA 02199-7618 | State Street Bank and Trust Company 1 Lincoln Street Boston, MA 02111-2900 |
| Distributor | Independent Registered Public Accounting Firm |
| MFS Fund Distributors, Inc. 111 Huntington Avenue Boston, MA 02199-7618 | Ernst & Young LLP 200 Clarendon Street Boston, MA 02116 |
| Portfolio Manager(s) | |
| Pablo de la Mata Philip Evans Benjamin Stone |
Table of Contents
Table of Contents
Table of Contents
Table of Contents
| FACTS | WHAT DOES MFS DO WITH YOUR PERSONAL INFORMATION? |
| Why? | Financial companies choose how they share your personal information. Federal law gives consumers the right to limit some but not all sharing. Federal law also requires us to tell you how we collect, share, and protect your personal information. Please read this notice carefully to understand what we do. |
| What? | The types of personal information we collect and share depend on the product or service you have with us. This information can include: |
| • Social Security number and account balances | |
| • Account transactions and transaction history | |
| • Checking account information and wire transfer instructions | |
| When you are no longer our customer, we continue to share your information as described in this notice. |
| How? | All financial companies need to share customers' personal information to run their everyday business. In the section below, we list the reasons financial companies can share their customers' personal information; the reasons MFS chooses to share; and whether you can limit this sharing. |
| Reasons we can share your personal information | Does MFS share? | Can you limit this sharing? |
| For our everyday business purposes – such as to process your transactions, maintain your account(s), respond to court orders and legal investigations, or report to credit bureaus | Yes | No |
| For our marketing purposes – to offer our products and services to you | No | We don't share |
| For joint marketing with other financial companies | No | We don't share |
| For our affiliates' everyday business purposes – information about your transactions and experiences | No | We don't share |
| For our affiliates' everyday business purposes – information about your creditworthiness | No | We don't share |
| For nonaffiliates to market to you | No | We don't share |
| Questions? | Call 800-225-2606 or go to mfs.com. |

Table of Contents
| Who we are | |
| Who is providing this notice? | MFS Funds, MFS Investment Management, MFS Institutional Advisors, Inc., and MFS Heritage Trust Company. |
| What we do | |
| How does MFS protect my personal information? | To protect your personal information from unauthorized access and use, we use security measures that comply with federal law. These measures include procedural, electronic, and physical safeguards for the protection of the personal information we collect about you. |
| How does MFS collect my personal information? | We collect your personal information, for example, when you |
| • open an account or provide account information | |
| • direct us to buy securities or direct us to sell your securities | |
| • make a wire transfer | |
| We also collect your personal information from others, such as credit bureaus, affiliates, or other companies. | |
| Why can't I limit all sharing? | Federal law gives you the right to limit only |
| • sharing for affiliates' everyday business purposes – information about your creditworthiness | |
| • affiliates from using your information to market to you | |
| • sharing for nonaffiliates to market to you | |
| State laws and individual companies may give you additional rights to limit sharing. | |
| Definitions | |
| Affiliates | Companies related by common ownership or control. They can be financial and nonfinancial companies. |
| • MFS does not share personal information with affiliates, except for everyday business purposes as described on page one of this notice. | |
| Nonaffiliates | Companies not related by common ownership or control. They can be financial and nonfinancial companies. |
| • MFS does not share with nonaffiliates so they can market to you. | |
| Joint marketing | A formal agreement between nonaffiliated financial companies that together market financial products or services to you. |
| • MFS doesn't jointly market. | |
| Other important information |
| If you own an MFS product or receive an MFS service in the name of a third party such as a bank or broker-dealer, their privacy policy may apply to you instead of ours. |
Table of Contents
Table of Contents
Table of Contents
Table of Contents
Table of Contents


Table of Contents


Table of Contents
Table of Contents
| 1 | |
| 2 | |
| 6 | |
| 9 | |
| 18 | |
| 23 | |
| 27 | |
| 30 | |
| 31 | |
| 32 | |
| 57 | |
| 74 | |
| 75 | |
| 78 | |
| 79 | |
| 79 | |
| 79 | |
| 79 | |
| 79 | |
| 80 |
| back cover |
Table of Contents
Table of Contents


Table of Contents

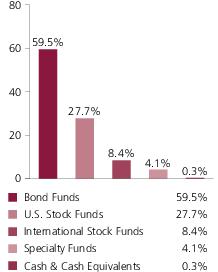
| MFS Total Return Bond Fund | 14.7% |
| MFS Inflation-Adjusted Bond Fund | 9.9% |
| MFS Limited Maturity Fund | 9.8% |
| MFS Government Securities Fund | 9.8% |
| MFS Value Fund | 6.0% |
| MFS Research Fund | 5.9% |
| MFS Growth Fund | 5.9% |
| MFS Global Opportunistic Bond Fund | 5.5% |
| MFS High Income Fund | 4.9% |
| MFS Mid Cap Value Fund | 4.0% |
| MFS Research International Fund | 4.0% |
| MFS Mid Cap Growth Fund | 3.9% |
| MFS Emerging Markets Debt Fund | 2.9% |
| MFS Commodity Strategy Fund | 2.1% |
| MFS Global Real Estate Fund | 2.0% |
| MFS Emerging Markets Debt Local Currency Fund | 2.0% |
| MFS International Growth Fund | 2.0% |
| MFS International Intrinsic Value Fund | 1.9% |
| MFS New Discovery Value Fund | 1.0% |
| MFS New Discovery Fund | 1.0% |
| MFS International Large Cap Value Fund | 0.5% |
| Cash & Cash Equivalents | 0.3% |
Table of Contents
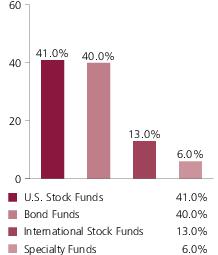
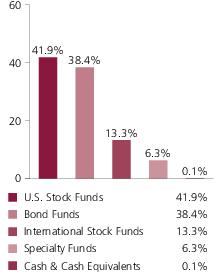
| MFS Government Securities Fund | 9.5% |
| MFS Value Fund | 8.4% |
| MFS Research Fund | 8.2% |
| MFS Growth Fund | 8.0% |
| MFS Total Return Bond Fund | 7.8% |
| MFS Mid Cap Value Fund | 7.5% |
| MFS Inflation-Adjusted Bond Fund | 6.8% |
| MFS Mid Cap Growth Fund | 6.8% |
| MFS Research International Fund | 6.0% |
| MFS High Income Fund | 4.8% |
| MFS Global Opportunistic Bond Fund | 4.7% |
| MFS Commodity Strategy Fund | 3.2% |
| MFS Global Real Estate Fund | 3.1% |
| MFS International Growth Fund | 3.0% |
| MFS International Intrinsic Value Fund | 2.9% |
| MFS Emerging Markets Debt Fund | 2.9% |
| MFS Emerging Markets Debt Local Currency Fund | 1.9% |
| MFS New Discovery Value Fund | 1.6% |
| MFS New Discovery Fund | 1.4% |
| MFS International New Discovery Fund | 1.0% |
| MFS International Large Cap Value Fund | 0.3% |
| MFS Emerging Markets Equity Fund | 0.1% |
| Cash & Cash Equivalents | 0.1% |
Table of Contents
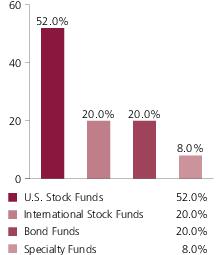

| MFS Value Fund | 11.4% |
| MFS Growth Fund | 10.9% |
| MFS Mid Cap Value Fund | 9.4% |
| MFS Mid Cap Growth Fund | 8.6% |
| MFS Research Fund | 8.2% |
| MFS Research International Fund | 7.0% |
| MFS International Growth Fund | 4.9% |
| MFS International Intrinsic Value Fund | 4.9% |
| MFS Inflation-Adjusted Bond Fund | 4.8% |
| MFS High Income Fund | 4.7% |
| MFS Commodity Strategy Fund | 4.2% |
| MFS Global Real Estate Fund | 4.2% |
| MFS Emerging Markets Debt Fund | 2.9% |
| MFS Total Return Bond Fund | 2.8% |
| MFS New Discovery Value Fund | 2.2% |
| MFS International New Discovery Fund | 1.9% |
| MFS Global Opportunistic Bond Fund | 1.9% |
| MFS New Discovery Fund | 1.9% |
| MFS Emerging Markets Debt Local Currency Fund | 1.9% |
| MFS Emerging Markets Equity Fund | 1.0% |
| MFS International Large Cap Value Fund | 0.1% |
| Cash & Cash Equivalents | 0.2% |
Table of Contents
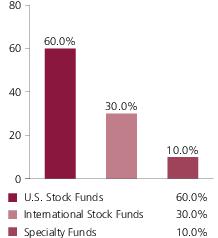
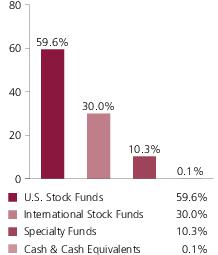
| MFS Value Fund | 13.2% |
| MFS Growth Fund | 12.6% |
| MFS Mid Cap Value Fund | 10.2% |
| MFS Mid Cap Growth Fund | 9.5% |
| MFS Research Fund | 9.1% |
| MFS Research International Fund | 8.0% |
| MFS International Growth Fund | 7.9% |
| MFS International Intrinsic Value Fund | 7.8% |
| MFS Commodity Strategy Fund | 5.2% |
| MFS Global Real Estate Fund | 5.1% |
| MFS International New Discovery Fund | 3.9% |
| MFS New Discovery Value Fund | 2.6% |
| MFS New Discovery Fund | 2.4% |
| MFS Emerging Markets Equity Fund | 2.0% |
| MFS International Large Cap Value Fund | 0.4% |
| Cash & Cash Equivalents | 0.1% |
Table of Contents
Table of Contents
Table of Contents
Table of Contents
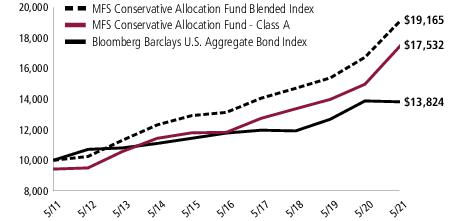
| Share Class | Class Inception Date | 1-yr | 5-yr | 10-yr |
| A | 6/28/02 | 17.10% | 8.19% | 6.40% |
| B | 6/28/02 | 16.18% | 7.37% | 5.60% |
| C | 6/28/02 | 16.22% | 7.37% | 5.60% |
| I | 6/28/02 | 17.39% | 8.45% | 6.67% |
| R1 | 4/01/05 | 16.18% | 7.37% | 5.61% |
| R2 | 10/31/03 | 16.82% | 7.91% | 6.14% |
| R3 | 4/01/05 | 17.05% | 8.17% | 6.40% |
| R4 | 4/01/05 | 17.36% | 8.45% | 6.67% |
| 529A | 7/31/02 | 17.02% | 8.14% | 6.36% |
| 529B | 7/31/02 | 17.03% | 7.53% | 5.66% |
| 529C | 7/31/02 | 16.15% | 7.31% | 5.55% |
| Bloomberg Barclays U.S. Aggregate Bond Index (f) | (0.40)% | 3.25% | 3.29% |
| MFS Conservative Allocation Fund Blended Index (f)(w) | 14.52% | 7.85% | 6.72% |
| Bloomberg Commodity Index (f) | 46.22% | 2.85% | (5.11)% |
| FTSE EPRA Nareit Developed Real Estate Index (net div) (f) | 35.92% | 5.56% | 6.03% |
| MSCI EAFE Index (net div) (f) | 38.41% | 9.77% | 5.88% |
| Standard & Poor’s 500 Stock Index (f) | 40.32% | 17.16% | 14.38% |
Table of Contents
| Share Class | 1-yr | 5-yr | 10-yr |
| A With Initial Sales Charge (5.75%) | 10.37% | 6.91% | 5.77% |
| B With CDSC (Declining over six years from 4% to 0%) (v) | 12.18% | 7.06% | 5.60% |
| C With CDSC (1% for 12 months) (v) | 15.22% | 7.37% | 5.60% |
| 529A With Initial Sales Charge (5.75%) | 10.29% | 6.87% | 5.73% |
| 529B With CDSC (Declining over six years from 4% to 0%) (v) | 13.03% | 7.23% | 5.66% |
| 529C With CDSC (1% for 12 months) (v) | 15.15% | 7.31% | 5.55% |
| (f) | Source: FactSet Research Systems Inc. |
| (v) | Assuming redemption at the end of the applicable period. |
| (w) | As of May 31, 2021, the MFS Conservative Allocation Fund Blended Index (a custom index) was comprised of 60% Bloomberg Barclays U.S. Aggregate Bond Index, 28% Standard & Poor's 500 Stock Index, 8% MSCI EAFE Index (net div), 2% Bloomberg Commodity Index, and 2% FTSE EPRA Nareit Developed Real Estate Index (net div). The components and weightings of the Blended Index may have differed during the period, and may differ in the future. |
Table of Contents
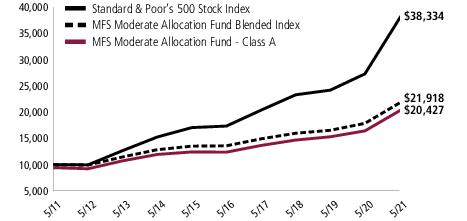
| Share Class | Class Inception Date | 1-yr | 5-yr | 10-yr |
| A | 6/28/02 | 24.23% | 10.53% | 8.04% |
| B | 6/28/02 | 23.30% | 9.70% | 7.23% |
| C | 6/28/02 | 23.25% | 9.69% | 7.23% |
| I | 6/28/02 | 24.55% | 10.79% | 8.31% |
| R1 | 4/01/05 | 23.31% | 9.70% | 7.23% |
| R2 | 10/31/03 | 23.94% | 10.25% | 7.77% |
| R3 | 4/01/05 | 24.27% | 10.53% | 8.04% |
| R4 | 4/01/05 | 24.56% | 10.80% | 8.31% |
| 529A | 7/31/02 | 24.15% | 10.48% | 7.99% |
| 529B | 7/31/02 | 24.16% | 9.83% | 7.27% |
| 529C | 7/31/02 | 23.25% | 9.66% | 7.18% |
| Standard & Poor’s 500 Stock Index (f) | 40.32% | 17.16% | 14.38% |
| MFS Moderate Allocation Fund Blended Index (f)(w) | 22.59% | 10.02% | 8.16% |
| Bloomberg Barclays U.S. Aggregate Bond Index (f) | (0.40)% | 3.25% | 3.29% |
| Bloomberg Commodity Index (f) | 46.22% | 2.85% | (5.11)% |
| FTSE EPRA Nareit Developed Real Estate Index (net div) (f) | 35.92% | 5.56% | 6.03% |
| MSCI EAFE Index (net div) (f) | 38.41% | 9.77% | 5.88% |
Table of Contents
| Share Class | 1-yr | 5-yr | 10-yr |
| A With Initial Sales Charge (5.75%) | 17.09% | 9.22% | 7.40% |
| B With CDSC (Declining over six years from 4% to 0%) (v) | 19.30% | 9.42% | 7.23% |
| C With CDSC (1% for 12 months) (v) | 22.25% | 9.69% | 7.23% |
| 529A With Initial Sales Charge (5.75%) | 17.01% | 9.18% | 7.36% |
| 529B With CDSC (Declining over six years from 4% to 0%) (v) | 20.16% | 9.56% | 7.27% |
| 529C With CDSC (1% for 12 months) (v) | 22.25% | 9.66% | 7.18% |
| (f) | Source: FactSet Research Systems Inc. |
| (v) | Assuming redemption at the end of the applicable period. |
| (w) | As of May 31, 2021, the MFS Moderate Allocation Fund Blended Index (a custom index) was comprised of 40% Bloomberg Barclays U.S. Aggregate Bond Index, 41% Standard & Poor's 500 Stock Index, 13% MSCI EAFE Index (net div), 3% Bloomberg Commodity Index, and 3% FTSE EPRA Nareit Developed Real Estate Index (net div). The components and weightings of the Blended Index may have differed during the period, and may differ in the future. |
Table of Contents
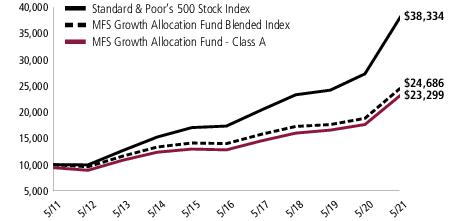
| Share Class | Class Inception Date | 1-yr | 5-yr | 10-yr |
| A | 6/28/02 | 32.00% | 12.69% | 9.47% |
| B | 6/28/02 | 31.03% | 11.84% | 8.65% |
| C | 6/28/02 | 31.03% | 11.84% | 8.65% |
| I | 6/28/02 | 32.34% | 12.98% | 9.74% |
| R1 | 4/01/05 | 31.01% | 11.85% | 8.65% |
| R2 | 10/31/03 | 31.67% | 12.41% | 9.20% |
| R3 | 4/01/05 | 32.04% | 12.69% | 9.47% |
| R4 | 4/01/05 | 32.36% | 12.97% | 9.73% |
| 529A | 7/31/02 | 31.95% | 12.64% | 9.42% |
| 529B | 7/31/02 | 31.40% | 11.86% | 8.64% |
| 529C | 7/31/02 | 30.97% | 11.79% | 8.60% |
| Standard & Poor’s 500 Stock Index (f) | 40.32% | 17.16% | 14.38% |
| MFS Growth Allocation Fund Blended Index (f)(w) | 31.07% | 11.99% | 9.46% |
| Bloomberg Barclays U.S. Aggregate Bond Index (f) | (0.40)% | 3.25% | 3.29% |
| Bloomberg Commodity Index (f) | 46.22% | 2.85% | (5.11)% |
| FTSE EPRA Nareit Developed Real Estate Index (net div) (f) | 35.92% | 5.56% | 6.03% |
| MSCI EAFE Index (net div) (f) | 38.41% | 9.77% | 5.88% |
Table of Contents
| Share Class | 1-yr | 5-yr | 10-yr |
| A With Initial Sales Charge (5.75%) | 24.41% | 11.36% | 8.83% |
| B With CDSC (Declining over six years from 4% to 0%) (v) | 27.03% | 11.59% | 8.65% |
| C With CDSC (1% for 12 months) (v) | 30.03% | 11.84% | 8.65% |
| 529A With Initial Sales Charge (5.75%) | 24.36% | 11.31% | 8.78% |
| 529B With CDSC (Declining over six years from 4% to 0%) (v) | 27.40% | 11.61% | 8.64% |
| 529C With CDSC (1% for 12 months) (v) | 29.97% | 11.79% | 8.60% |
| (f) | Source: FactSet Research Systems Inc. |
| (v) | Assuming redemption at the end of the applicable period. |
| (w) | As of May 31, 2021, the MFS Growth Allocation Fund Blended Index (a custom index) was comprised of 52% Standard & Poor's 500 Stock Index, 20% Bloomberg Barclays U.S. Aggregate Bond Index, 20% MSCI EAFE Index (net div), 4% Bloomberg Commodity Index, and 4% FTSE EPRA Nareit Developed Real Estate Index (net div). The components and weightings of the Blended Index may have differed during the period, and may differ in the future. |
Table of Contents

| Share Class | Class Inception Date | 1-yr | 5-yr | 10-yr |
| A | 6/28/02 | 38.44% | 14.42% | 10.65% |
| B | 6/28/02 | 37.39% | 13.57% | 9.82% |
| C | 6/28/02 | 37.39% | 13.57% | 9.82% |
| I | 6/28/02 | 38.74% | 14.70% | 10.93% |
| R1 | 4/01/05 | 37.42% | 13.57% | 9.82% |
| R2 | 10/31/03 | 38.07% | 14.13% | 10.37% |
| R3 | 4/01/05 | 38.37% | 14.42% | 10.64% |
| R4 | 4/01/05 | 38.75% | 14.70% | 10.94% |
| 529A | 7/31/02 | 38.38% | 14.38% | 10.60% |
| 529B | 7/31/02 | 37.34% | 13.50% | 9.77% |
| 529C | 7/31/02 | 37.34% | 13.52% | 9.77% |
| Standard & Poor’s 500 Stock Index (f) | 40.32% | 17.16% | 14.38% |
| MFS Aggressive Growth Allocation Fund Blended Index (f)(w) | 39.94% | 13.69% | 10.44% |
| Bloomberg Commodity Index (f) | 46.22% | 2.85% | (5.11)% |
| FTSE EPRA Nareit Developed Real Estate Index (net div) (f) | 35.92% | 5.56% | 6.03% |
| MSCI EAFE Index (net div) (f) | 38.41% | 9.77% | 5.88% |
Table of Contents
| Share Class | 1-yr | 5-yr | 10-yr |
| A With Initial Sales Charge (5.75%) | 30.48% | 13.07% | 9.99% |
| B With CDSC (Declining over six years from 4% to 0%) (v) | 33.39% | 13.33% | 9.82% |
| C With CDSC (1% for 12 months) (v) | 36.39% | 13.57% | 9.82% |
| 529A With Initial Sales Charge (5.75%) | 30.42% | 13.03% | 9.95% |
| 529B With CDSC (Declining over six years from 4% to 0%) (v) | 33.34% | 13.26% | 9.77% |
| 529C With CDSC (1% for 12 months) (v) | 36.34% | 13.52% | 9.77% |
| (f) | Source: FactSet Research Systems Inc. |
| (v) | Assuming redemption at the end of the applicable period. |
| (w) | As of May 31, 2021, the MFS Aggressive Growth Allocation Fund Blended Index (a custom index) was comprised of 60% Standard & Poor's 500 Stock Index, 30% MSCI EAFE Index (net div), 5% Bloomberg Commodity Index, and 5% FTSE EPRA Nareit Developed Real Estate Index (net div). The components and weightings of the Blended Index may have differed during the period, and may differ in the future. |
Table of Contents
| (a) | BLOOMBERG ® is a trademark and service mark of Bloomberg Finance L.P. and its affiliates (collectively “Bloomberg”). BARCLAYS® is a trademark and service mark of Barclays Bank Plc (collectively with its affiliates, “Barclays”), used under license. Bloomberg or Bloomberg's licensors, including Barclays, own all proprietary rights in the Bloomberg Barclays Indices. Neither Bloomberg nor Barclays approves or endorses this material, or guarantees the accuracy or completeness of any information herein, or makes any warranty, express or implied, as to the results to be obtained therefrom, and, to the maximum extent allowed by law, neither shall have any liability or responsibility for injury or damages arising in connection therewith. |
| (c) | FTSE International Limited (“FTSE”)© FTSE 2019. “FTSE®” is a trademark of the London Stock Exchange Group companies and is used by FTSE International Limited under license. “FT-SE®”, “FOOTSIE®” and “FTSE4GOOD®” are trademarks of the London Stock Exchange Group companies. “Nareit®” is a trademark of the National Association of Real Estate Investment Trusts (“Nareit”) and “EPRA®” is a trademark of the European Public Real Estate Association (“EPRA”) and all are used by FTSE under license. The FTSE EPRA Nareit Developed Real Estate Index is calculated by FTSE. Neither FTSE, Euronext N.V., Nareit, nor EPRA sponsor, endorse, or promote this product and are not in any way connected to it and do not accept any liability. All intellectual property rights in the index values and constituent list vests in FTSE, Euronext N.V., Nareit, and EPRA. Neither FTSE nor its licensors accept any liability for any errors or omissions in the FTSE indices and/or FTSE ratings or underlying data. No further distribution of FTSE Data is permitted without FTSE's express written consent. |
| (e) | Morgan Stanley Capital International (“MSCI”) makes no express or implied warranties or representations and shall have no liability whatsoever with respect to any MSCI data contained herein. The MSCI data may not be further redistributed or used as a basis for other indices or any securities or financial products. This report is not approved, reviewed, or produced by MSCI. |
| (g) | “Standard & Poor's®” and “S&P®” are registered trademarks of Standard & Poor's Financial Services LLC (“S&P”) and Dow Jones is a registered trademark of Dow Jones Trademark Holdings LLC (“Dow Jones”) and have been licensed for use by S&P Dow Jones Indices LLC and sublicensed for certain purposes by MFS. The S&P 500® is a product of S&P Dow Jones Indices LLC, and has been licensed for use by MFS. MFS's product(s) is not sponsored, endorsed, sold, or promoted by S&P Dow Jones Indices LLC, Dow Jones, S&P, or their respective affiliates, and neither S&P Dow Jones Indices LLC, Dow Jones, S&P, nor their respective affiliates make any representation regarding the advisability of investing in such product(s). |
Table of Contents
December 1, 2020 through May 31, 2021
Table of Contents
| Share Class | Annualized Expense Ratio | Beginning Account Value 12/01/20 | Ending Account Value 5/31/21 | Expenses Paid During Period (p) 12/01/20-5/31/21 | |
| A | Actual | 0.32% | $1,000.00 | $1,061.84 | $1.64 |
| Hypothetical (h) | 0.32% | $1,000.00 | $1,023.34 | $1.61 | |
| B | Actual | 1.07% | $1,000.00 | $1,057.90 | $5.49 |
| Hypothetical (h) | 1.07% | $1,000.00 | $1,019.60 | $5.39 | |
| C | Actual | 1.07% | $1,000.00 | $1,058.01 | $5.49 |
| Hypothetical (h) | 1.07% | $1,000.00 | $1,019.60 | $5.39 | |
| I | Actual | 0.07% | $1,000.00 | $1,063.61 | $0.36 |
| Hypothetical (h) | 0.07% | $1,000.00 | $1,024.58 | $0.35 | |
| R1 | Actual | 1.07% | $1,000.00 | $1,057.96 | $5.49 |
| Hypothetical (h) | 1.07% | $1,000.00 | $1,019.60 | $5.39 | |
| R2 | Actual | 0.57% | $1,000.00 | $1,060.69 | $2.93 |
| Hypothetical (h) | 0.57% | $1,000.00 | $1,022.09 | $2.87 | |
| R3 | Actual | 0.32% | $1,000.00 | $1,061.77 | $1.64 |
| Hypothetical (h) | 0.32% | $1,000.00 | $1,023.34 | $1.61 | |
| R4 | Actual | 0.07% | $1,000.00 | $1,063.04 | $0.36 |
| Hypothetical (h) | 0.07% | $1,000.00 | $1,024.58 | $0.35 | |
| 529A | Actual | 0.36% | $1,000.00 | $1,062.01 | $1.85 |
| Hypothetical (h) | 0.36% | $1,000.00 | $1,023.14 | $1.82 | |
| 529B | Actual | 0.35% | $1,000.00 | $1,061.82 | $1.80 |
| Hypothetical (h) | 0.35% | $1,000.00 | $1,023.19 | $1.77 | |
| 529C | Actual | 1.11% | $1,000.00 | $1,057.07 | $5.69 |
| Hypothetical (h) | 1.11% | $1,000.00 | $1,019.40 | $5.59 |
| (h) | 5% class return per year before expenses. |
| (p) | “Expenses Paid During Period” are equal to each class’s annualized expense ratio, as shown above, multiplied by the average account value over the period, multiplied by 182/365 (to reflect the one-half year period). Expenses paid do not include any applicable sales charges (loads). If these transaction costs had been included, your costs would have been higher. In addition to the fees and expenses which the fund bears directly, the fund indirectly bears a pro rata share of the fees and expenses of the underlying funds in which the fund invests. If these indirect costs were included, your costs would have been higher. |
Table of Contents
| Share Class | Annualized Expense Ratio | Beginning Account Value 12/01/20 | Ending Account Value 5/31/21 | Expenses Paid During Period (p) 12/01/20-5/31/21 | |
| A | Actual | 0.33% | $1,000.00 | $1,095.35 | $1.72 |
| Hypothetical (h) | 0.33% | $1,000.00 | $1,023.29 | $1.66 | |
| B | Actual | 1.08% | $1,000.00 | $1,091.38 | $5.63 |
| Hypothetical (h) | 1.08% | $1,000.00 | $1,019.55 | $5.44 | |
| C | Actual | 1.08% | $1,000.00 | $1,090.88 | $5.63 |
| Hypothetical (h) | 1.08% | $1,000.00 | $1,019.55 | $5.44 | |
| I | Actual | 0.08% | $1,000.00 | $1,096.66 | $0.42 |
| Hypothetical (h) | 0.08% | $1,000.00 | $1,024.53 | $0.40 | |
| R1 | Actual | 1.08% | $1,000.00 | $1,090.95 | $5.63 |
| Hypothetical (h) | 1.08% | $1,000.00 | $1,019.55 | $5.44 | |
| R2 | Actual | 0.58% | $1,000.00 | $1,093.76 | $3.03 |
| Hypothetical (h) | 0.58% | $1,000.00 | $1,022.04 | $2.92 | |
| R3 | Actual | 0.33% | $1,000.00 | $1,095.12 | $1.72 |
| Hypothetical (h) | 0.33% | $1,000.00 | $1,023.29 | $1.66 | |
| R4 | Actual | 0.08% | $1,000.00 | $1,096.76 | $0.42 |
| Hypothetical (h) | 0.08% | $1,000.00 | $1,024.53 | $0.40 | |
| 529A | Actual | 0.37% | $1,000.00 | $1,095.22 | $1.93 |
| Hypothetical (h) | 0.37% | $1,000.00 | $1,023.09 | $1.87 | |
| 529B | Actual | 0.37% | $1,000.00 | $1,094.81 | $1.93 |
| Hypothetical (h) | 0.37% | $1,000.00 | $1,023.09 | $1.87 | |
| 529C | Actual | 1.12% | $1,000.00 | $1,091.09 | $5.84 |
| Hypothetical (h) | 1.12% | $1,000.00 | $1,019.35 | $5.64 |
| (h) | 5% class return per year before expenses. |
| (p) | “Expenses Paid During Period” are equal to each class’s annualized expense ratio, as shown above, multiplied by the average account value over the period, multiplied by 182/365 (to reflect the one-half year period). Expenses paid do not include any applicable sales charges (loads). If these transaction costs had been included, your costs would have been higher. In addition to the fees and expenses which the fund bears directly, the fund indirectly bears a pro rata share of the fees and expenses of the underlying funds in which the fund invests. If these indirect costs were included, your costs would have been higher. |
Table of Contents
| Share Class | Annualized Expense Ratio | Beginning Account Value 12/01/20 | Ending Account Value 5/31/21 | Expenses Paid During Period (p) 12/01/20-5/31/21 | |
| A | Actual | 0.35% | $1,000.00 | $1,129.91 | $1.86 |
| Hypothetical (h) | 0.35% | $1,000.00 | $1,023.19 | $1.77 | |
| B | Actual | 1.10% | $1,000.00 | $1,125.39 | $5.83 |
| Hypothetical (h) | 1.10% | $1,000.00 | $1,019.45 | $5.54 | |
| C | Actual | 1.10% | $1,000.00 | $1,125.68 | $5.83 |
| Hypothetical (h) | 1.10% | $1,000.00 | $1,019.45 | $5.54 | |
| I | Actual | 0.10% | $1,000.00 | $1,131.20 | $0.53 |
| Hypothetical (h) | 0.10% | $1,000.00 | $1,024.43 | $0.50 | |
| R1 | Actual | 1.10% | $1,000.00 | $1,125.99 | $5.83 |
| Hypothetical (h) | 1.10% | $1,000.00 | $1,019.45 | $5.54 | |
| R2 | Actual | 0.60% | $1,000.00 | $1,128.29 | $3.18 |
| Hypothetical (h) | 0.60% | $1,000.00 | $1,021.94 | $3.02 | |
| R3 | Actual | 0.35% | $1,000.00 | $1,130.12 | $1.86 |
| Hypothetical (h) | 0.35% | $1,000.00 | $1,023.19 | $1.77 | |
| R4 | Actual | 0.10% | $1,000.00 | $1,131.43 | $0.53 |
| Hypothetical (h) | 0.10% | $1,000.00 | $1,024.43 | $0.50 | |
| 529A | Actual | 0.39% | $1,000.00 | $1,129.41 | $2.07 |
| Hypothetical (h) | 0.39% | $1,000.00 | $1,022.99 | $1.97 | |
| 529B | Actual | 0.51% | $1,000.00 | $1,129.06 | $2.71 |
| Hypothetical (h) | 0.51% | $1,000.00 | $1,022.39 | $2.57 | |
| 529C | Actual | 1.14% | $1,000.00 | $1,125.18 | $6.04 |
| Hypothetical (h) | 1.14% | $1,000.00 | $1,019.25 | $5.74 |
| (h) | 5% class return per year before expenses. |
| (p) | “Expenses Paid During Period” are equal to each class’s annualized expense ratio, as shown above, multiplied by the average account value over the period, multiplied by 182/365 (to reflect the one-half year period). Expenses paid do not include any applicable sales charges (loads). If these transaction costs had been included, your costs would have been higher. In addition to the fees and expenses which the fund bears directly, the fund indirectly bears a pro rata share of the fees and expenses of the underlying funds in which the fund invests. If these indirect costs were included, your costs would have been higher. |
Table of Contents
| Share Class | Annualized Expense Ratio | Beginning Account Value 12/01/20 | Ending Account Value 5/31/21 | Expenses Paid During Period (p) 12/01/20-5/31/21 | |
| A | Actual | 0.38% | $1,000.00 | $1,158.46 | $2.04 |
| Hypothetical (h) | 0.38% | $1,000.00 | $1,023.04 | $1.92 | |
| B | Actual | 1.13% | $1,000.00 | $1,153.99 | $6.07 |
| Hypothetical (h) | 1.13% | $1,000.00 | $1,019.30 | $5.69 | |
| C | Actual | 1.13% | $1,000.00 | $1,154.39 | $6.07 |
| Hypothetical (h) | 1.13% | $1,000.00 | $1,019.30 | $5.69 | |
| I | Actual | 0.13% | $1,000.00 | $1,159.96 | $0.70 |
| Hypothetical (h) | 0.13% | $1,000.00 | $1,024.28 | $0.66 | |
| R1 | Actual | 1.13% | $1,000.00 | $1,154.21 | $6.07 |
| Hypothetical (h) | 1.13% | $1,000.00 | $1,019.30 | $5.69 | |
| R2 | Actual | 0.63% | $1,000.00 | $1,157.03 | $3.39 |
| Hypothetical (h) | 0.63% | $1,000.00 | $1,021.79 | $3.18 | |
| R3 | Actual | 0.38% | $1,000.00 | $1,158.49 | $2.04 |
| Hypothetical (h) | 0.38% | $1,000.00 | $1,023.04 | $1.92 | |
| R4 | Actual | 0.13% | $1,000.00 | $1,160.11 | $0.70 |
| Hypothetical (h) | 0.13% | $1,000.00 | $1,024.28 | $0.66 | |
| 529A | Actual | 0.42% | $1,000.00 | $1,158.19 | $2.26 |
| Hypothetical (h) | 0.42% | $1,000.00 | $1,022.84 | $2.12 | |
| 529B | Actual | 1.18% | $1,000.00 | $1,154.20 | $6.34 |
| Hypothetical (h) | 1.18% | $1,000.00 | $1,019.05 | $5.94 | |
| 529C | Actual | 1.17% | $1,000.00 | $1,153.94 | $6.28 |
| Hypothetical (h) | 1.17% | $1,000.00 | $1,019.10 | $5.89 |
| (h) | 5% class return per year before expenses. |
| (p) | “Expenses Paid During Period” are equal to each class’s annualized expense ratio, as shown above, multiplied by the average account value over the period, multiplied by 182/365 (to reflect the one-half year period). Expenses paid do not include any applicable sales charges (loads). If these transaction costs had been included, your costs would have been higher. In addition to the fees and expenses which the fund bears directly, the fund indirectly bears a pro rata share of the fees and expenses of the underlying funds in which the fund invests. If these indirect costs were included, your costs would have been higher. |
Table of Contents
| Issuer | Shares/Par | Value ($) | ||
| Investment Companies (h) – 99.9% | ||||
| Bond Funds – 59.5% | ||||
| MFS Emerging Markets Debt Fund - Class R6 | 8,177,588 | $ 122,009,614 | ||
| MFS Emerging Markets Debt Local Currency Fund - Class R6 | 12,571,912 | 83,477,497 | ||
| MFS Global Opportunistic Bond Fund - Class R6 | 24,676,031 | 231,214,408 | ||
| MFS Government Securities Fund - Class R6 | 40,508,268 | 408,728,426 | ||
| MFS High Income Fund - Class R6 | 59,127,762 | 202,808,224 | ||
| MFS Inflation-Adjusted Bond Fund - Class R6 | 36,122,670 | 412,520,884 | ||
| MFS Limited Maturity Fund - Class R6 | 67,325,160 | 410,010,223 | ||
| MFS Total Return Bond Fund - Class R6 | 54,523,579 | 615,025,975 | ||
| $ 2,485,795,251 | ||||
| International Stock Funds – 8.4% | ||||
| MFS International Growth Fund - Class R6 | 1,801,877 | $ 82,760,207 | ||
| MFS International Intrinsic Value Fund - Class R6 | 1,513,089 | 81,797,598 | ||
| MFS International Large Cap Value Fund - Class R6 | 1,469,012 | 20,096,078 | ||
| MFS Research International Fund - Class R6 | 6,957,094 | 166,900,690 | ||
| $ 351,554,573 | ||||
| Specialty Funds – 4.1% | ||||
| MFS Commodity Strategy Fund - Class R6 | 13,704,385 | $ 86,337,625 | ||
| MFS Global Real Estate Fund - Class R6 | 4,187,944 | 84,261,427 | ||
| $ 170,599,052 | ||||
| U.S. Stock Funds – 27.7% | ||||
| MFS Growth Fund - Class R6 | 1,408,450 | $ 245,267,554 | ||
| MFS Mid Cap Growth Fund - Class R6 | 5,245,294 | 161,292,782 | ||
| MFS Mid Cap Value Fund - Class R6 | 5,278,459 | 167,854,999 | ||
| MFS New Discovery Fund - Class R6 | 910,910 | 40,781,442 | ||
| MFS New Discovery Value Fund - Class R6 | 1,990,931 | 42,645,743 | ||
| MFS Research Fund - Class R6 | 4,338,314 | 248,542,001 | ||
| MFS Value Fund - Class R6 | 4,871,522 | 253,075,579 | ||
| $ 1,159,460,100 | ||||
| Money Market Funds – 0.2% | ||||
| MFS Institutional Money Market Portfolio, 0.03% (v) | 8,828,438 | $ 8,828,438 | ||
| Total Investment Companies (Identified Cost, $3,041,143,577) | $4,176,237,414 | |||
| Other Assets, Less Liabilities – 0.1% | 4,780,292 | |||
| Net Assets – 100.0% | $4,181,017,706 | |||
Table of Contents
| Issuer | Shares/Par | Value ($) | ||
| Investment Companies (h) – 99.9% | ||||
| Bond Funds – 38.4% | ||||
| MFS Emerging Markets Debt Fund - Class R6 | 13,833,026 | $ 206,388,741 | ||
| MFS Emerging Markets Debt Local Currency Fund - Class R6 | 20,878,404 | 138,632,601 | ||
| MFS Global Opportunistic Bond Fund - Class R6 | 36,299,655 | 340,127,771 | ||
| MFS Government Securities Fund - Class R6 | 67,346,952 | 679,530,749 | ||
| MFS High Income Fund - Class R6 | 99,180,432 | 340,188,880 | ||
| MFS Inflation-Adjusted Bond Fund - Class R6 | 42,337,239 | 483,491,269 | ||
| MFS Total Return Bond Fund - Class R6 | 49,180,120 | 554,751,755 | ||
| $ 2,743,111,766 | ||||
| International Stock Funds – 13.3% | ||||
| MFS Emerging Markets Equity Fund - Class R6 | 210,173 | $ 9,178,262 | ||
| MFS International Growth Fund - Class R6 | 4,604,563 | 211,487,578 | ||
| MFS International Intrinsic Value Fund - Class R6 | 3,889,279 | 210,254,407 | ||
| MFS International Large Cap Value Fund - Class R6 | 1,320,396 | 18,063,018 | ||
| MFS International New Discovery Fund - Class R6 | 1,762,946 | 70,253,400 | ||
| MFS Research International Fund - Class R6 | 17,792,861 | 426,850,740 | ||
| $ 946,087,405 | ||||
| Specialty Funds – 6.3% | ||||
| MFS Commodity Strategy Fund - Class R6 | 35,889,435 | $ 226,103,440 | ||
| MFS Global Real Estate Fund - Class R6 | 11,065,076 | 222,629,328 | ||
| $ 448,732,768 | ||||
| U.S. Stock Funds – 41.9% | ||||
| MFS Growth Fund - Class R6 | 3,282,500 | $ 571,614,451 | ||
| MFS Mid Cap Growth Fund - Class R6 | 15,676,581 | 482,054,850 | ||
| MFS Mid Cap Value Fund - Class R6 | 16,729,444 | 531,996,322 | ||
| MFS New Discovery Fund - Class R6 | 2,309,115 | 103,379,093 | ||
| MFS New Discovery Value Fund - Class R6 | 5,462,438 | 117,005,428 | ||
| MFS Research Fund - Class R6 | 10,189,276 | 583,743,633 | ||
| MFS Value Fund - Class R6 | 11,537,045 | 599,349,510 | ||
| $ 2,989,143,287 | ||||
| Money Market Funds – 0.0% | ||||
| MFS Institutional Money Market Portfolio, 0.03% (v) | 3,392,010 | $ 3,392,011 | ||
| Total Investment Companies (Identified Cost, $4,441,276,873) | $7,130,467,237 | |||
| Other Assets, Less Liabilities – 0.1% | 5,341,580 | |||
| Net Assets – 100.0% | $7,135,808,817 | |||
Table of Contents
| Issuer | Shares/Par | Value ($) | ||
| Investment Companies (h) – 99.9% | ||||
| Bond Funds – 19.0% | ||||
| MFS Emerging Markets Debt Fund - Class R6 | 12,550,235 | $ 187,249,509 | ||
| MFS Emerging Markets Debt Local Currency Fund - Class R6 | 18,844,022 | 125,124,309 | ||
| MFS Global Opportunistic Bond Fund - Class R6 | 13,447,512 | 126,003,183 | ||
| MFS High Income Fund - Class R6 | 90,696,848 | 311,090,188 | ||
| MFS Inflation-Adjusted Bond Fund - Class R6 | 27,549,031 | 314,609,930 | ||
| MFS Total Return Bond Fund - Class R6 | 16,481,011 | 185,905,803 | ||
| $ 1,249,982,922 | ||||
| International Stock Funds – 19.8% | ||||
| MFS Emerging Markets Equity Fund - Class R6 | 1,518,443 | $ 66,310,385 | ||
| MFS International Growth Fund - Class R6 | 7,013,533 | 322,131,545 | ||
| MFS International Intrinsic Value Fund - Class R6 | 5,905,533 | 319,253,115 | ||
| MFS International Large Cap Value Fund - Class R6 | 607,718 | 8,313,588 | ||
| MFS International New Discovery Fund - Class R6 | 3,220,240 | 128,326,581 | ||
| MFS Research International Fund - Class R6 | 19,126,852 | 458,853,171 | ||
| $ 1,303,188,385 | ||||
| Specialty Funds – 8.4% | ||||
| MFS Commodity Strategy Fund - Class R6 | 43,895,458 | $ 276,541,385 | ||
| MFS Global Real Estate Fund - Class R6 | 13,531,572 | 272,255,235 | ||
| $ 548,796,620 | ||||
| U.S. Stock Funds – 52.6% | ||||
| MFS Growth Fund - Class R6 | 4,107,171 | $ 715,222,835 | ||
| MFS Mid Cap Growth Fund - Class R6 | 18,318,889 | 563,305,823 | ||
| MFS Mid Cap Value Fund - Class R6 | 19,500,637 | 620,120,246 | ||
| MFS New Discovery Fund - Class R6 | 2,800,846 | 125,393,898 | ||
| MFS New Discovery Value Fund - Class R6 | 6,576,608 | 140,870,952 | ||
| MFS Research Fund - Class R6 | 9,416,350 | 539,462,696 | ||
| MFS Value Fund - Class R6 | 14,402,129 | 748,190,584 | ||
| $ 3,452,567,034 | ||||
| Money Market Funds – 0.1% | ||||
| MFS Institutional Money Market Portfolio, 0.03% (v) | 7,988,501 | $ 7,988,501 | ||
| Total Investment Companies (Identified Cost, $3,435,061,138) | $6,562,523,462 | |||
| Other Assets, Less Liabilities – 0.1% | 3,293,051 | |||
| Net Assets – 100.0% | $6,565,816,513 | |||
Table of Contents
| Issuer | Shares/Par | Value ($) | ||
| Investment Companies (h) – 100.0% | ||||
| International Stock Funds – 30.0% | ||||
| MFS Emerging Markets Equity Fund - Class R6 | 1,192,519 | $ 52,077,304 | ||
| MFS International Growth Fund - Class R6 | 4,399,010 | 202,046,529 | ||
| MFS International Intrinsic Value Fund - Class R6 | 3,697,868 | 199,906,724 | ||
| MFS International Large Cap Value Fund - Class R6 | 760,875 | 10,408,771 | ||
| MFS International New Discovery Fund - Class R6 | 2,512,785 | 100,134,470 | ||
| MFS Research International Fund - Class R6 | 8,511,781 | 204,197,637 | ||
| $ 768,771,435 | ||||
| Specialty Funds – 10.3% | ||||
| MFS Commodity Strategy Fund - Class R6 | 21,179,846 | $ 133,433,028 | ||
| MFS Global Real Estate Fund - Class R6 | 6,475,377 | 130,284,596 | ||
| $ 263,717,624 | ||||
| U.S. Stock Funds – 59.6% | ||||
| MFS Growth Fund - Class R6 | 1,851,798 | $ 322,472,132 | ||
| MFS Mid Cap Growth Fund - Class R6 | 7,896,187 | 242,807,745 | ||
| MFS Mid Cap Value Fund - Class R6 | 8,228,677 | 261,671,911 | ||
| MFS New Discovery Fund - Class R6 | 1,363,138 | 61,027,672 | ||
| MFS New Discovery Value Fund - Class R6 | 3,103,951 | 66,486,628 | ||
| MFS Research Fund - Class R6 | 4,075,250 | 233,471,086 | ||
| MFS Value Fund - Class R6 | 6,518,044 | 338,612,396 | ||
| $ 1,526,549,570 | ||||
| Money Market Funds – 0.1% | ||||
| MFS Institutional Money Market Portfolio, 0.03% (v) | 2,046,113 | $ 2,046,113 | ||
| Total Investment Companies (Identified Cost, $1,158,887,646) | $2,561,084,742 | |||
| Other Assets, Less Liabilities – 0.0% | 712,666 | |||
| Net Assets – 100.0% | $2,561,797,408 | |||
| (h) | An affiliated issuer, which may be considered one in which the fund owns 5% or more of the outstanding voting securities, or a company which is under common control. At period end, the aggregate values of each fund’s investments in affiliated issuers were as follows: |
| Affiliated Issuers | |
| MFS Conservative Allocation Fund | $4,176,237,414 |
| MFS Moderate Allocation Fund | 7,130,467,237 |
| MFS Growth Allocation Fund | 6,562,523,462 |
| MFS Aggressive Growth Allocation Fund | 2,561,084,742 |
| (v) | Affiliated issuer that is available only to investment companies managed by MFS. The rate quoted for the MFS Institutional Money Market Portfolio is the annualized seven-day yield of the fund at period end. |
Table of Contents
| MFS Conservative Allocation Fund | MFS Moderate Allocation Fund | MFS Growth Allocation Fund | MFS Aggressive Growth Allocation Fund | |
| Assets | ||||
| Investments in affiliated issuers, at value (identified cost, $3,041,143,577, $4,441,276,873, $3,435,061,138, and $1,158,887,646, respectively) | $4,176,237,414 | $7,130,467,237 | $6,562,523,462 | $2,561,084,742 |
| Receivables for | ||||
| Investments sold | 137,008 | 2,379,788 | 27,477 | — |
| Fund shares sold | 13,860,735 | 16,754,858 | 11,679,337 | 4,914,793 |
| Receivable from investment adviser | — | — | 50,562 | — |
| Other assets | 6,621 | 10,543 | 9,586 | 3,966 |
| Total assets | $4,190,241,778 | $7,149,612,426 | $6,574,290,424 | $2,566,003,501 |
| Liabilities | ||||
| Payables for | ||||
| Investments purchased | $4,544,882 | $4,654,675 | $2,729,343 | $1,450,352 |
| Fund shares reacquired | 3,739,954 | 7,348,975 | 3,804,130 | 1,755,441 |
| Payable to affiliates | ||||
| Administrator | — | — | — | 66,046 |
| Administrative services fee | 238 | 238 | 238 | 238 |
| Shareholder servicing costs | 558,519 | 1,216,125 | 1,403,936 | 704,495 |
| Distribution and service fees | 172,736 | 309,890 | 279,250 | 106,015 |
| Program manager fee | 1,461 | 2,693 | 2,794 | 1,634 |
| Payable for independent Trustees' compensation | 53 | 14 | 11 | 14 |
| Accrued expenses and other liabilities | 206,229 | 270,999 | 254,209 | 121,858 |
| Total liabilities | $9,224,072 | $13,803,609 | $8,473,911 | $4,206,093 |
| Net assets | $4,181,017,706 | $7,135,808,817 | $6,565,816,513 | $2,561,797,408 |
| Net assets consist of | ||||
| Paid-in capital | $3,075,718,438 | $4,439,085,061 | $3,421,520,584 | $1,158,885,283 |
| Total distributable earnings (loss) | 1,105,299,268 | 2,696,723,756 | 3,144,295,929 | 1,402,912,125 |
| Net assets | $4,181,017,706 | $7,135,808,817 | $6,565,816,513 | $2,561,797,408 |
Table of Contents
| MFS Conservative Allocation Fund | MFS Moderate Allocation Fund | MFS Growth Allocation Fund | MFS Aggressive Growth Allocation Fund | |
| Net assets | ||||
| Class A | $2,471,450,503 | $4,687,031,285 | $4,279,763,749 | $1,386,555,368 |
| Class B | 45,913,344 | 116,059,052 | 109,513,512 | 40,146,998 |
| Class C | 484,043,063 | 721,780,607 | 638,016,435 | 264,940,406 |
| Class I | 519,687,692 | 476,797,875 | 434,119,191 | 241,143,940 |
| Class R1 | 13,268,771 | 26,919,015 | 21,518,624 | 18,496,446 |
| Class R2 | 54,728,293 | 128,654,417 | 142,618,663 | 65,485,269 |
| Class R3 | 109,177,332 | 250,644,035 | 170,540,569 | 105,119,963 |
| Class R4 | 269,195,693 | 334,079,734 | 360,878,934 | 200,635,354 |
| Class 529A | 178,144,308 | 331,376,415 | 349,865,501 | 215,339,123 |
| Class 529B | 3,515,226 | 6,551,499 | 8,866,660 | 2,517,721 |
| Class 529C | 31,893,481 | 55,914,883 | 50,114,675 | 21,416,820 |
| Total net assets | $4,181,017,706 | $7,135,808,817 | $6,565,816,513 | $2,561,797,408 |
| Shares of beneficial interest outstanding | ||||
| Class A | 135,868,403 | 217,300,192 | 163,455,239 | 44,691,046 |
| Class B | 2,537,639 | 5,453,521 | 4,213,882 | 1,317,634 |
| Class C | 27,065,564 | 34,201,609 | 24,896,005 | 8,803,703 |
| Class I | 28,274,553 | 21,758,125 | 16,400,026 | 7,625,484 |
| Class R1 | 758,748 | 1,307,748 | 859,986 | 624,854 |
| Class R2 | 3,105,765 | 6,114,855 | 5,588,714 | 2,161,142 |
| Class R3 | 6,057,189 | 11,724,049 | 6,576,154 | 3,417,433 |
| Class R4 | 14,784,597 | 15,502,475 | 13,788,106 | 6,440,299 |
| Class 529A | 9,852,099 | 15,455,385 | 13,488,456 | 6,996,621 |
| Class 529B | 197,579 | 311,185 | 344,687 | 83,779 |
| Class 529C | 1,803,036 | 2,681,542 | 1,985,690 | 724,139 |
| Total shares of beneficial interest outstanding | 230,305,172 | 331,810,686 | 251,596,945 | 82,886,134 |
| Class A shares | ||||
| Net asset value per share (net assets / shares of beneficial interest outstanding) | $18.19 | $21.57 | $26.18 | $31.03 |
| Offering price per share (100 / 94.25 x net asset value per share) | $19.30 | $22.89 | $27.78 | $32.92 |
| Class B shares | ||||
| Net asset value and offering price per share (net assets / shares of beneficial interest outstanding) | $18.09 | $21.28 | $25.99 | $30.47 |
| Class C shares | ||||
| Net asset value and offering price per share (net assets / shares of beneficial interest outstanding) | $17.88 | $21.10 | $25.63 | $30.09 |
| Class I shares | ||||
| Net asset value, offering price, and redemption price per share (net assets / shares of beneficial interest outstanding) | $18.38 | $21.91 | $26.47 | $31.62 |
| Class R1 shares | ||||
| Net asset value, offering price, and redemption price per share (net assets / shares of beneficial interest outstanding) | $17.49 | $20.58 | $25.02 | $29.60 |
| Class R2 shares | ||||
| Net asset value, offering price, and redemption price per share (net assets / shares of beneficial interest outstanding) | $17.62 | $21.04 | $25.52 | $30.30 |
| Class R3 shares | ||||
| Net asset value, offering price, and redemption price per share (net assets / shares of beneficial interest outstanding) | $18.02 | $21.38 | $25.93 | $30.76 |
Table of Contents
| MFS Conservative Allocation Fund | MFS Moderate Allocation Fund | MFS Growth Allocation Fund | MFS Aggressive Growth Allocation Fund | |
| Class R4 shares | ||||
| Net asset value, offering price, and redemption price per share (net assets / shares of beneficial interest outstanding) | $18.21 | $21.55 | $26.17 | $31.15 |
| Class 529A shares | ||||
| Net asset value and redemption price per share (net assets / shares of beneficial interest outstanding) | $18.08 | $21.44 | $25.94 | $30.78 |
| Offering price per share (100 / 94.25 x net asset value per share) | $19.18 | $22.75 | $27.52 | $32.66 |
| Class 529B shares | ||||
| Net asset value and offering price per share (net assets / shares of beneficial interest outstanding) | $17.79 | $21.05 | $25.72 | $30.05 |
| Class 529C shares | ||||
| Net asset value and offering price per share (net assets / shares of beneficial interest outstanding) | $17.69 | $20.85 | $25.24 | $29.58 |
| On sales of $50,000 or more, the maximum offering price of Class A and Class 529A shares is reduced. A contingent deferred sales charge may be imposed on redemptions of Class A, Class B, Class C, Class 529B, and Class 529C shares. | ||||
Table of Contents
| MFS Conservative Allocation Fund | MFS Moderate Allocation Fund | MFS Growth Allocation Fund | MFS Aggressive Growth Allocation Fund | |
| Net investment income (loss) | ||||
| Dividends from affiliated issuers | $67,616,726 | $99,089,877 | $76,187,255 | $19,839,568 |
| Other | 394 | 708 | 648 | 259 |
| Total investment income | $67,617,120 | $99,090,585 | $76,187,903 | $19,839,827 |
| Expenses | ||||
| Distribution and service fees | $12,038,184 | $21,926,675 | $19,513,331 | $7,199,952 |
| Shareholder servicing costs | 1,996,183 | 4,371,421 | 5,149,853 | 2,751,426 |
| Program manager fees | 103,988 | 178,093 | 183,145 | 103,917 |
| Administrative services fee | 17,500 | 17,500 | 17,500 | 17,500 |
| Independent Trustees' compensation | 46,514 | 86,699 | 83,242 | 36,235 |
| Custodian fee | 70,734 | 106,803 | 90,755 | 38,815 |
| Shareholder communications | 125,583 | 231,961 | 277,955 | 111,356 |
| Audit and tax fees | 38,536 | 39,164 | 39,034 | 38,246 |
| Legal fees | 26,232 | 43,652 | 39,214 | 15,457 |
| Miscellaneous | 390,699 | 449,140 | 365,067 | 211,128 |
| Total expenses | $14,854,153 | $27,451,108 | $25,759,096 | $10,524,032 |
| Reduction of expenses by investment adviser and distributor | (30,474) | (53,716) | (324,056) | (366,603) |
| Net expenses | $14,823,679 | $27,397,392 | $25,435,040 | $10,157,429 |
| Net investment income (loss) | $52,793,441 | $71,693,193 | $50,752,863 | $9,682,398 |
| Realized and unrealized gain (loss) | ||||
| Realized gain (loss) (identified cost basis) | ||||
| Investments in affiliated issuers | $31,567,400 | $112,458,927 | $105,014,599 | $36,563,065 |
| Capital gain distributions from affiliated issuers | 28,795,910 | 69,142,003 | 79,746,751 | 38,677,639 |
| Net realized gain (loss) | $60,363,310 | $181,600,930 | $184,761,350 | $75,240,704 |
| Change in unrealized appreciation or depreciation | ||||
| Affiliated issuers | $443,814,322 | $1,083,299,198 | $1,337,128,688 | $620,917,423 |
| Net realized and unrealized gain (loss) | $504,177,632 | $1,264,900,128 | $1,521,890,038 | $696,158,127 |
| Change in net assets from operations | $556,971,073 | $1,336,593,321 | $1,572,642,901 | $705,840,525 |
Table of Contents
| Year ended 5/31/21 | MFS Conservative Allocation Fund | MFS Moderate Allocation Fund | MFS Growth Allocation Fund | MFS Aggressive Growth Allocation Fund |
| Change in net assets | ||||
| From operations | ||||
| Net investment income (loss) | $52,793,441 | $71,693,193 | $50,752,863 | $9,682,398 |
| Net realized gain (loss) | 60,363,310 | 181,600,930 | 184,761,350 | 75,240,704 |
| Net unrealized gain (loss) | 443,814,322 | 1,083,299,198 | 1,337,128,688 | 620,917,423 |
| Change in net assets from operations | $556,971,073 | $1,336,593,321 | $1,572,642,901 | $705,840,525 |
| Total distributions to shareholders | $(98,816,539) | $(225,919,978) | $(203,650,736) | $(78,809,924) |
| Change in net assets from fund share transactions | $702,375,361 | $575,029,385 | $254,795,759 | $78,128,163 |
| Total change in net assets | $1,160,529,895 | $1,685,702,728 | $1,623,787,924 | $705,158,764 |
| Net assets | ||||
| At beginning of period | 3,020,487,811 | 5,450,106,089 | 4,942,028,589 | 1,856,638,644 |
| At end of period | $4,181,017,706 | $7,135,808,817 | $6,565,816,513 | $2,561,797,408 |
| Year ended 5/31/20 | MFS Conservative Allocation Fund | MFS Moderate Allocation Fund | MFS Growth Allocation Fund | MFS Aggressive Growth Allocation Fund |
| Change in net assets | ||||
| From operations | ||||
| Net investment income (loss) | $57,283,379 | $91,191,798 | $72,268,032 | $20,211,603 |
| Net realized gain (loss) | 37,152,930 | 129,183,444 | 138,867,830 | 50,974,973 |
| Net unrealized gain (loss) | 101,115,745 | 153,967,564 | 83,019,624 | 35,666,386 |
| Change in net assets from operations | $195,552,054 | $374,342,806 | $294,155,486 | $106,852,962 |
| Total distributions to shareholders | $(100,086,864) | $(247,398,416) | $(238,946,554) | $(88,421,193) |
| Change in net assets from fund share transactions | $83,099,843 | $(76,719,905) | $23,596,701 | $62,233,205 |
| Total change in net assets | $178,565,033 | $50,224,485 | $78,805,633 | $80,664,974 |
| Net assets | ||||
| At beginning of period | 2,841,922,778 | 5,399,881,604 | 4,863,222,956 | 1,775,973,670 |
| At end of period | $3,020,487,811 | $5,450,106,089 | $4,942,028,589 | $1,856,638,644 |
Table of Contents
| Year ended | |||||
| Class A | 5/31/21 | 5/31/20 | 5/31/19 | 5/31/18 | 5/31/17 |
| Net asset value, beginning of period | $15.98 | $15.45 | $15.50 | $15.43 | $14.69 |
| Income (loss) from investment operations | |||||
| Net investment income (loss) (d)(l) | $0.26 | $0.33 | $0.35 | $0.32 | $0.26(c) |
| Net realized and unrealized gain (loss) | 2.43 | 0.75 | 0.31 | 0.43 | 0.85 |
| Total from investment operations | $2.69 | $1.08 | $0.66 | $0.75 | $1.11 |
| Less distributions declared to shareholders | |||||
| From net investment income | $(0.27) | $(0.34) | $(0.35) | $(0.33) | $(0.26) |
| From net realized gain | (0.21) | (0.21) | (0.36) | (0.35) | (0.11) |
| Total distributions declared to shareholders | $(0.48) | $(0.55) | $(0.71) | $(0.68) | $(0.37) |
| Net asset value, end of period (x) | $18.19 | $15.98 | $15.45 | $15.50 | $15.43 |
| Total return (%) (r)(s)(t)(x) | 17.04 | 7.07 | 4.60 | 4.91 | 7.71(c) |
| Ratios (%) (to average net assets) and Supplemental data: | |||||
| Expenses before expense reductions (f)(h) | 0.32 | 0.33 | 0.33 | 0.32 | 0.33(c) |
| Expenses after expense reductions (f)(h) | 0.32 | 0.33 | 0.33 | 0.32 | 0.33(c) |
| Net investment income (loss) (l) | 1.51 | 2.05 | 2.30 | 2.05 | 1.72(c) |
| Portfolio turnover | 6 | 12 | 4 | 6 | 3 |
| Net assets at end of period (000 omitted) | $2,471,451 | $1,417,121 | $1,294,553 | $1,321,127 | $1,330,751 |
Table of Contents
| Year ended | |||||
| Class B | 5/31/21 | 5/31/20 | 5/31/19 | 5/31/18 | 5/31/17 |
| Net asset value, beginning of period | $15.89 | $15.35 | $15.40 | $15.33 | $14.60 |
| Income (loss) from investment operations | |||||
| Net investment income (loss) (d)(l) | $0.13 | $0.21 | $0.24 | $0.20 | $0.14(c) |
| Net realized and unrealized gain (loss) | 2.42 | 0.76 | 0.30 | 0.43 | 0.85 |
| Total from investment operations | $2.55 | $0.97 | $0.54 | $0.63 | $0.99 |
| Less distributions declared to shareholders | |||||
| From net investment income | $(0.14) | $(0.22) | $(0.23) | $(0.21) | $(0.15) |
| From net realized gain | (0.21) | (0.21) | (0.36) | (0.35) | (0.11) |
| Total distributions declared to shareholders | $(0.35) | $(0.43) | $(0.59) | $(0.56) | $(0.26) |
| Net asset value, end of period (x) | $18.09 | $15.89 | $15.35 | $15.40 | $15.33 |
| Total return (%) (r)(s)(t)(x) | 16.12 | 6.31 | 3.81 | 4.13 | 6.87(c) |
| Ratios (%) (to average net assets) and Supplemental data: | |||||
| Expenses before expense reductions (f)(h) | 1.07 | 1.08 | 1.08 | 1.07 | 1.08(c) |
| Expenses after expense reductions (f)(h) | 1.07 | 1.08 | 1.08 | 1.07 | 1.08(c) |
| Net investment income (loss) (l) | 0.79 | 1.32 | 1.56 | 1.31 | 0.97(c) |
| Portfolio turnover | 6 | 12 | 4 | 6 | 3 |
| Net assets at end of period (000 omitted) | $45,913 | $63,965 | $93,839 | $116,669 | $137,431 |
| Year ended | |||||
| Class C | 5/31/21 | 5/31/20 | 5/31/19 | 5/31/18 | 5/31/17 |
| Net asset value, beginning of period | $15.71 | $15.20 | $15.25 | $15.20 | $14.47 |
| Income (loss) from investment operations | |||||
| Net investment income (loss) (d)(l) | $0.14 | $0.20 | $0.23 | $0.20 | $0.14(c) |
| Net realized and unrealized gain (loss) | 2.38 | 0.75 | 0.32 | 0.41 | 0.85 |
| Total from investment operations | $2.52 | $0.95 | $0.55 | $0.61 | $0.99 |
| Less distributions declared to shareholders | |||||
| From net investment income | $(0.14) | $(0.23) | $(0.24) | $(0.21) | $(0.15) |
| From net realized gain | (0.21) | (0.21) | (0.36) | (0.35) | (0.11) |
| Total distributions declared to shareholders | $(0.35) | $(0.44) | $(0.60) | $(0.56) | $(0.26) |
| Net asset value, end of period (x) | $17.88 | $15.71 | $15.20 | $15.25 | $15.20 |
| Total return (%) (r)(s)(t)(x) | 16.15 | 6.24 | 3.88 | 4.05 | 6.94(c) |
| Ratios (%) (to average net assets) and Supplemental data: | |||||
| Expenses before expense reductions (f)(h) | 1.07 | 1.08 | 1.08 | 1.07 | 1.08(c) |
| Expenses after expense reductions (f)(h) | 1.07 | 1.08 | 1.08 | 1.07 | 1.08(c) |
| Net investment income (loss) (l) | 0.80 | 1.30 | 1.55 | 1.31 | 0.97(c) |
| Portfolio turnover | 6 | 12 | 4 | 6 | 3 |
| Net assets at end of period (000 omitted) | $484,043 | $542,274 | $535,354 | $571,300 | $670,914 |
Table of Contents
| Year ended | |||||
| Class I | 5/31/21 | 5/31/20 | 5/31/19 | 5/31/18 | 5/31/17 |
| Net asset value, beginning of period | $16.14 | $15.60 | $15.64 | $15.57 | $14.82 |
| Income (loss) from investment operations | |||||
| Net investment income (loss) (d)(l) | $0.31 | $0.37 | $0.40 | $0.36 | $0.29(c) |
| Net realized and unrealized gain (loss) | 2.45 | 0.76 | 0.31 | 0.43 | 0.87 |
| Total from investment operations | $2.76 | $1.13 | $0.71 | $0.79 | $1.16 |
| Less distributions declared to shareholders | |||||
| From net investment income | $(0.31) | $(0.38) | $(0.39) | $(0.37) | $(0.30) |
| From net realized gain | (0.21) | (0.21) | (0.36) | (0.35) | (0.11) |
| Total distributions declared to shareholders | $(0.52) | $(0.59) | $(0.75) | $(0.72) | $(0.41) |
| Net asset value, end of period (x) | $18.38 | $16.14 | $15.60 | $15.64 | $15.57 |
| Total return (%) (r)(s)(t)(x) | 17.32 | 7.34 | 4.89 | 5.13 | 7.99(c) |
| Ratios (%) (to average net assets) and Supplemental data: | |||||
| Expenses before expense reductions (f)(h) | 0.07 | 0.08 | 0.08 | 0.07 | 0.08(c) |
| Expenses after expense reductions (f)(h) | N/A | N/A | N/A | N/A | N/A |
| Net investment income (loss) (l) | 1.79 | 2.30 | 2.58 | 2.32 | 1.92(c) |
| Portfolio turnover | 6 | 12 | 4 | 6 | 3 |
| Net assets at end of period (000 omitted) | $519,688 | $400,869 | $367,586 | $358,866 | $271,960 |
| Year ended | |||||
| Class R1 | 5/31/21 | 5/31/20 | 5/31/19 | 5/31/18 | 5/31/17 |
| Net asset value, beginning of period | $15.38 | $14.89 | $14.96 | $14.92 | $14.21 |
| Income (loss) from investment operations | |||||
| Net investment income (loss) (d)(l) | $0.13 | $0.20 | $0.23 | $0.20 | $0.14(c) |
| Net realized and unrealized gain (loss) | 2.34 | 0.73 | 0.30 | 0.41 | 0.83 |
| Total from investment operations | $2.47 | $0.93 | $0.53 | $0.61 | $0.97 |
| Less distributions declared to shareholders | |||||
| From net investment income | $(0.15) | $(0.23) | $(0.24) | $(0.22) | $(0.15) |
| From net realized gain | (0.21) | (0.21) | (0.36) | (0.35) | (0.11) |
| Total distributions declared to shareholders | $(0.36) | $(0.44) | $(0.60) | $(0.57) | $(0.26) |
| Net asset value, end of period (x) | $17.49 | $15.38 | $14.89 | $14.96 | $14.92 |
| Total return (%) (r)(s)(t)(x) | 16.18 | 6.27 | 3.83 | 4.08 | 6.93(c) |
| Ratios (%) (to average net assets) and Supplemental data: | |||||
| Expenses before expense reductions (f)(h) | 1.07 | 1.08 | 1.08 | 1.07 | 1.08(c) |
| Expenses after expense reductions (f)(h) | N/A | N/A | N/A | N/A | N/A |
| Net investment income (loss) (l) | 0.78 | 1.31 | 1.53 | 1.31 | 0.97(c) |
| Portfolio turnover | 6 | 12 | 4 | 6 | 3 |
| Net assets at end of period (000 omitted) | $13,269 | $11,468 | $11,465 | $12,794 | $14,641 |
Table of Contents
| Year ended | |||||
| Class R2 | 5/31/21 | 5/31/20 | 5/31/19 | 5/31/18 | 5/31/17 |
| Net asset value, beginning of period | $15.49 | $14.99 | $15.06 | $15.02 | $14.31 |
| Income (loss) from investment operations | |||||
| Net investment income (loss) (d)(l) | $0.21 | $0.28 | $0.31 | $0.28 | $0.22(c) |
| Net realized and unrealized gain (loss) | 2.36 | 0.74 | 0.30 | 0.40 | 0.82 |
| Total from investment operations | $2.57 | $1.02 | $0.61 | $0.68 | $1.04 |
| Less distributions declared to shareholders | |||||
| From net investment income | $(0.23) | $(0.31) | $(0.32) | $(0.29) | $(0.22) |
| From net realized gain | (0.21) | (0.21) | (0.36) | (0.35) | (0.11) |
| Total distributions declared to shareholders | $(0.44) | $(0.52) | $(0.68) | $(0.64) | $(0.33) |
| Net asset value, end of period (x) | $17.62 | $15.49 | $14.99 | $15.06 | $15.02 |
| Total return (%) (r)(s)(t)(x) | 16.75 | 6.81 | 4.34 | 4.58 | 7.44(c) |
| Ratios (%) (to average net assets) and Supplemental data: | |||||
| Expenses before expense reductions (f)(h) | 0.57 | 0.58 | 0.58 | 0.57 | 0.58(c) |
| Expenses after expense reductions (f)(h) | N/A | 0.58 | 0.58 | 0.57 | 0.58(c) |
| Net investment income (loss) (l) | 1.28 | 1.81 | 2.06 | 1.81 | 1.48(c) |
| Portfolio turnover | 6 | 12 | 4 | 6 | 3 |
| Net assets at end of period (000 omitted) | $54,728 | $56,260 | $64,220 | $72,083 | $85,187 |
| Year ended | |||||
| Class R3 | 5/31/21 | 5/31/20 | 5/31/19 | 5/31/18 | 5/31/17 |
| Net asset value, beginning of period | $15.84 | $15.31 | $15.37 | $15.31 | $14.58 |
| Income (loss) from investment operations | |||||
| Net investment income (loss) (d)(l) | $0.26 | $0.32 | $0.35 | $0.32 | $0.25(c) |
| Net realized and unrealized gain (loss) | 2.40 | 0.76 | 0.30 | 0.42 | 0.85 |
| Total from investment operations | $2.66 | $1.08 | $0.65 | $0.74 | $1.10 |
| Less distributions declared to shareholders | |||||
| From net investment income | $(0.27) | $(0.34) | $(0.35) | $(0.33) | $(0.26) |
| From net realized gain | (0.21) | (0.21) | (0.36) | (0.35) | (0.11) |
| Total distributions declared to shareholders | $(0.48) | $(0.55) | $(0.71) | $(0.68) | $(0.37) |
| Net asset value, end of period (x) | $18.02 | $15.84 | $15.31 | $15.37 | $15.31 |
| Total return (%) (r)(s)(t)(x) | 16.98 | 7.14 | 4.57 | 4.88 | 7.70(c) |
| Ratios (%) (to average net assets) and Supplemental data: | |||||
| Expenses before expense reductions (f)(h) | 0.32 | 0.33 | 0.33 | 0.32 | 0.33(c) |
| Expenses after expense reductions (f)(h) | N/A | N/A | N/A | N/A | 0.33(c) |
| Net investment income (loss) (l) | 1.53 | 2.06 | 2.33 | 2.05 | 1.71(c) |
| Portfolio turnover | 6 | 12 | 4 | 6 | 3 |
| Net assets at end of period (000 omitted) | $109,177 | $95,119 | $101,884 | $112,696 | $146,688 |
Table of Contents
| Year ended | |||||
| Class R4 | 5/31/21 | 5/31/20 | 5/31/19 | 5/31/18 | 5/31/17 |
| Net asset value, beginning of period | $15.99 | $15.46 | $15.51 | $15.44 | $14.70 |
| Income (loss) from investment operations | |||||
| Net investment income (loss) (d)(l) | $0.31 | $0.36 | $0.41 | $0.37 | $0.29(c) |
| Net realized and unrealized gain (loss) | 2.43 | 0.76 | 0.29 | 0.42 | 0.86 |
| Total from investment operations | $2.74 | $1.12 | $0.70 | $0.79 | $1.15 |
| Less distributions declared to shareholders | |||||
| From net investment income | $(0.31) | $(0.38) | $(0.39) | $(0.37) | $(0.30) |
| From net realized gain | (0.21) | (0.21) | (0.36) | (0.35) | (0.11) |
| Total distributions declared to shareholders | $(0.52) | $(0.59) | $(0.75) | $(0.72) | $(0.41) |
| Net asset value, end of period (x) | $18.21 | $15.99 | $15.46 | $15.51 | $15.44 |
| Total return (%) (r)(s)(t)(x) | 17.36 | 7.34 | 4.86 | 5.17 | 7.98(c) |
| Ratios (%) (to average net assets) and Supplemental data: | |||||
| Expenses before expense reductions (f)(h) | 0.07 | 0.08 | 0.08 | 0.07 | 0.08(c) |
| Expenses after expense reductions (f)(h) | N/A | N/A | N/A | N/A | N/A |
| Net investment income (loss) (l) | 1.77 | 2.29 | 2.65 | 2.36 | 1.95(c) |
| Portfolio turnover | 6 | 12 | 4 | 6 | 3 |
| Net assets at end of period (000 omitted) | $269,196 | $234,301 | $179,833 | $196,658 | $135,695 |
| Year ended | |||||
| Class 529A | 5/31/21 | 5/31/20 | 5/31/19 | 5/31/18 | 5/31/17 |
| Net asset value, beginning of period | $15.89 | $15.36 | $15.41 | $15.35 | $14.62 |
| Income (loss) from investment operations | |||||
| Net investment income (loss) (d)(l) | $0.26 | $0.32 | $0.34 | $0.31 | $0.25(c) |
| Net realized and unrealized gain (loss) | 2.41 | 0.76 | 0.32 | 0.43 | 0.84 |
| Total from investment operations | $2.67 | $1.08 | $0.66 | $0.74 | $1.09 |
| Less distributions declared to shareholders | |||||
| From net investment income | $(0.27) | $(0.34) | $(0.35) | $(0.33) | $(0.25) |
| From net realized gain | (0.21) | (0.21) | (0.36) | (0.35) | (0.11) |
| Total distributions declared to shareholders | $(0.48) | $(0.55) | $(0.71) | $(0.68) | $(0.36) |
| Net asset value, end of period (x) | $18.08 | $15.89 | $15.36 | $15.41 | $15.35 |
| Total return (%) (r)(s)(t)(x) | 16.95 | 7.08 | 4.60 | 4.83 | 7.65(c) |
| Ratios (%) (to average net assets) and Supplemental data: | |||||
| Expenses before expense reductions (f)(h) | 0.37 | 0.38 | 0.38 | 0.40 | 0.43(c) |
| Expenses after expense reductions (f)(h) | 0.36 | 0.36 | 0.37 | 0.36 | 0.37(c) |
| Net investment income (loss) (l) | 1.49 | 2.02 | 2.26 | 2.03 | 1.66(c) |
| Portfolio turnover | 6 | 12 | 4 | 6 | 3 |
| Net assets at end of period (000 omitted) | $178,144 | $153,384 | $143,581 | $132,290 | $109,297 |
Table of Contents
| Year ended | |||||
| Class 529B | 5/31/21 | 5/31/20 | 5/31/19 | 5/31/18 | 5/31/17 |
| Net asset value, beginning of period | $15.64 | $15.10 | $15.16 | $15.11 | $14.39 |
| Income (loss) from investment operations | |||||
| Net investment income (loss) (d)(l) | $0.25 | $0.22 | $0.22 | $0.19 | $0.13(c) |
| Net realized and unrealized gain (loss) | 2.38 | 0.75 | 0.31 | 0.42 | 0.84 |
| Total from investment operations | $2.63 | $0.97 | $0.53 | $0.61 | $0.97 |
| Less distributions declared to shareholders | |||||
| From net investment income | $(0.27) | $(0.22) | $(0.23) | $(0.21) | $(0.14) |
| From net realized gain | (0.21) | (0.21) | (0.36) | (0.35) | (0.11) |
| Total distributions declared to shareholders | $(0.48) | $(0.43) | $(0.59) | $(0.56) | $(0.25) |
| Net asset value, end of period (x) | $17.79 | $15.64 | $15.10 | $15.16 | $15.11 |
| Total return (%) (r)(s)(t)(x) | 16.96 | 6.46 | 3.79 | 4.04 | 6.87(c) |
| Ratios (%) (to average net assets) and Supplemental data: | |||||
| Expenses before expense reductions (f)(h) | 0.37 | 0.97 | 1.13 | 1.15 | 1.18(c) |
| Expenses after expense reductions (f)(h) | 0.36 | 0.97 | 1.12 | 1.11 | 1.12(c) |
| Net investment income (loss) (l) | 1.51 | 1.43 | 1.49 | 1.27 | 0.90(c) |
| Portfolio turnover | 6 | 12 | 4 | 6 | 3 |
| Net assets at end of period (000 omitted) | $3,515 | $4,301 | $6,256 | $7,414 | $6,852 |
| Year ended | |||||
| Class 529C | 5/31/21 | 5/31/20 | 5/31/19 | 5/31/18 | 5/31/17 |
| Net asset value, beginning of period | $15.54 | $15.04 | $15.10 | $15.06 | $14.35 |
| Income (loss) from investment operations | |||||
| Net investment income (loss) (d)(l) | $0.13 | $0.20 | $0.23 | $0.19 | $0.13(c) |
| Net realized and unrealized gain (loss) | 2.36 | 0.73 | 0.30 | 0.41 | 0.84 |
| Total from investment operations | $2.49 | $0.93 | $0.53 | $0.60 | $0.97 |
| Less distributions declared to shareholders | |||||
| From net investment income | $(0.13) | $(0.22) | $(0.23) | $(0.21) | $(0.15) |
| From net realized gain | (0.21) | (0.21) | (0.36) | (0.35) | (0.11) |
| Total distributions declared to shareholders | $(0.34) | $(0.43) | $(0.59) | $(0.56) | $(0.26) |
| Net asset value, end of period (x) | $17.69 | $15.54 | $15.04 | $15.10 | $15.06 |
| Total return (%) (r)(s)(t)(x) | 16.15 | 6.20 | 3.82 | 4.00 | 6.84(c) |
| Ratios (%) (to average net assets) and Supplemental data: | |||||
| Expenses before expense reductions (f)(h) | 1.12 | 1.13 | 1.13 | 1.15 | 1.18(c) |
| Expenses after expense reductions (f)(h) | 1.12 | 1.12 | 1.12 | 1.12 | 1.13(c) |
| Net investment income (loss) (l) | 0.78 | 1.27 | 1.51 | 1.27 | 0.90(c) |
| Portfolio turnover | 6 | 12 | 4 | 6 | 3 |
| Net assets at end of period (000 omitted) | $31,893 | $41,425 | $43,352 | $41,601 | $47,113 |
Table of Contents
| (c) | Amount reflects a one-time reimbursement of expenses by the custodian (or former custodian) without which net investment income and performance would be lower and expenses would be higher. |
| (d) | Per share data is based on average shares outstanding. |
| (f) | Ratios do not reflect reductions from fees paid indirectly, if applicable. |
| (h) | In addition to the fees and expenses which the fund bears directly, the fund indirectly bears a pro rata share of the fees and expenses of the underlying affiliated funds in which the fund invests. Accordingly, the expense ratio for the fund reflects only those fees and expenses borne directly by the fund. Because the underlying affiliated funds have varied expense and fee levels and the fund may own different proportions of the underlying affiliated funds at different times, the amount of fees and expenses incurred indirectly by the fund will vary. |
| (l) | The ratios and per share amounts do not include net investment income of the underlying affiliated funds in which the fund invests. |
| (r) | Certain expenses have been reduced without which performance would have been lower. |
| (s) | From time to time the fund may receive proceeds from litigation settlements, without which performance would be lower. |
| (t) | Total returns do not include any applicable sales charges. |
| (x) | The net asset values and total returns have been calculated on net assets which include adjustments made in accordance with U.S. generally accepted accounting principles required at period end for financial reporting purposes. |
Table of Contents
| Year ended | |||||
| Class A | 5/31/21 | 5/31/20 | 5/31/19 | 5/31/18 | 5/31/17 |
| Net asset value, beginning of period | $18.02 | $17.56 | $17.88 | $17.37 | $16.19 |
| Income (loss) from investment operations | |||||
| Net investment income (loss) (d)(l) | $0.25 | $0.33 | $0.37 | $0.34 | $0.26(c) |
| Net realized and unrealized gain (loss) | 4.04 | 0.97 | 0.30 | 0.96 | 1.37 |
| Total from investment operations | $4.29 | $1.30 | $0.67 | $1.30 | $1.63 |
| Less distributions declared to shareholders | |||||
| From net investment income | $(0.24) | $(0.34) | $(0.37) | $(0.38) | $(0.24) |
| From net realized gain | (0.50) | (0.50) | (0.62) | (0.41) | (0.21) |
| Total distributions declared to shareholders | $(0.74) | $(0.84) | $(0.99) | $(0.79) | $(0.45) |
| Net asset value, end of period (x) | $21.57 | $18.02 | $17.56 | $17.88 | $17.37 |
| Total return (%) (r)(s)(t)(x) | 24.18 | 7.35 | 4.25 | 7.56 | 10.30(c) |
| Ratios (%) (to average net assets) and Supplemental data: | |||||
| Expenses before expense reductions (f)(h) | 0.33 | 0.34 | 0.34 | 0.33 | 0.34(c) |
| Expenses after expense reductions (f)(h) | 0.33 | 0.34 | 0.34 | 0.33 | 0.34(c) |
| Net investment income (loss) (l) | 1.23 | 1.79 | 2.09 | 1.93 | 1.55(c) |
| Portfolio turnover | 7 | 8 | 2 | 2 | 1 |
| Net assets at end of period (000 omitted) | $4,687,031 | $3,173,202 | $3,038,919 | $3,071,863 | $3,077,471 |
| Year ended | |||||
| Class B | 5/31/21 | 5/31/20 | 5/31/19 | 5/31/18 | 5/31/17 |
| Net asset value, beginning of period | $17.79 | $17.33 | $17.65 | $17.16 | $16.01 |
| Income (loss) from investment operations | |||||
| Net investment income (loss) (d)(l) | $0.10 | $0.19 | $0.24 | $0.21 | $0.13(c) |
| Net realized and unrealized gain (loss) | 3.99 | 0.97 | 0.30 | 0.94 | 1.35 |
| Total from investment operations | $4.09 | $1.16 | $0.54 | $1.15 | $1.48 |
| Less distributions declared to shareholders | |||||
| From net investment income | $(0.10) | $(0.20) | $(0.24) | $(0.25) | $(0.12) |
| From net realized gain | (0.50) | (0.50) | (0.62) | (0.41) | (0.21) |
| Total distributions declared to shareholders | $(0.60) | $(0.70) | $(0.86) | $(0.66) | $(0.33) |
| Net asset value, end of period (x) | $21.28 | $17.79 | $17.33 | $17.65 | $17.16 |
| Total return (%) (r)(s)(t)(x) | 23.24 | 6.57 | 3.49 | 6.75 | 9.43(c) |
| Ratios (%) (to average net assets) and Supplemental data: | |||||
| Expenses before expense reductions (f)(h) | 1.08 | 1.09 | 1.09 | 1.08 | 1.09(c) |
| Expenses after expense reductions (f)(h) | 1.08 | 1.09 | 1.09 | 1.08 | 1.09(c) |
| Net investment income (loss) (l) | 0.50 | 1.05 | 1.36 | 1.19 | 0.80(c) |
| Portfolio turnover | 7 | 8 | 2 | 2 | 1 |
| Net assets at end of period (000 omitted) | $116,059 | $149,969 | $210,011 | $256,958 | $293,064 |
Table of Contents
| Year ended | |||||
| Class C | 5/31/21 | 5/31/20 | 5/31/19 | 5/31/18 | 5/31/17 |
| Net asset value, beginning of period | $17.65 | $17.21 | $17.53 | $17.05 | $15.91 |
| Income (loss) from investment operations | |||||
| Net investment income (loss) (d)(l) | $0.10 | $0.18 | $0.23 | $0.21 | $0.13(c) |
| Net realized and unrealized gain (loss) | 3.95 | 0.97 | 0.31 | 0.93 | 1.34 |
| Total from investment operations | $4.05 | $1.15 | $0.54 | $1.14 | $1.47 |
| Less distributions declared to shareholders | |||||
| From net investment income | $(0.10) | $(0.21) | $(0.24) | $(0.25) | $(0.12) |
| From net realized gain | (0.50) | (0.50) | (0.62) | (0.41) | (0.21) |
| Total distributions declared to shareholders | $(0.60) | $(0.71) | $(0.86) | $(0.66) | $(0.33) |
| Net asset value, end of period (x) | $21.10 | $17.65 | $17.21 | $17.53 | $17.05 |
| Total return (%) (r)(s)(t)(x) | 23.19 | 6.55 | 3.53 | 6.74 | 9.43(c) |
| Ratios (%) (to average net assets) and Supplemental data: | |||||
| Expenses before expense reductions (f)(h) | 1.08 | 1.09 | 1.09 | 1.08 | 1.09(c) |
| Expenses after expense reductions (f)(h) | 1.08 | 1.09 | 1.09 | 1.08 | 1.09(c) |
| Net investment income (loss) (l) | 0.53 | 1.04 | 1.34 | 1.20 | 0.80(c) |
| Portfolio turnover | 7 | 8 | 2 | 2 | 1 |
| Net assets at end of period (000 omitted) | $721,781 | $874,127 | $917,199 | $990,317 | $1,181,728 |
| Year ended | |||||
| Class I | 5/31/21 | 5/31/20 | 5/31/19 | 5/31/18 | 5/31/17 |
| Net asset value, beginning of period | $18.29 | $17.81 | $18.12 | $17.60 | $16.40 |
| Income (loss) from investment operations | |||||
| Net investment income (loss) (d)(l) | $0.30 | $0.37 | $0.42 | $0.40 | $0.29(c) |
| Net realized and unrealized gain (loss) | 4.11 | 1.00 | 0.31 | 0.95 | 1.40 |
| Total from investment operations | $4.41 | $1.37 | $0.73 | $1.35 | $1.69 |
| Less distributions declared to shareholders | |||||
| From net investment income | $(0.29) | $(0.39) | $(0.42) | $(0.42) | $(0.28) |
| From net realized gain | (0.50) | (0.50) | (0.62) | (0.41) | (0.21) |
| Total distributions declared to shareholders | $(0.79) | $(0.89) | $(1.04) | $(0.83) | $(0.49) |
| Net asset value, end of period (x) | $21.91 | $18.29 | $17.81 | $18.12 | $17.60 |
| Total return (%) (r)(s)(t)(x) | 24.49 | 7.62 | 4.51 | 7.78 | 10.56(c) |
| Ratios (%) (to average net assets) and Supplemental data: | |||||
| Expenses before expense reductions (f)(h) | 0.08 | 0.09 | 0.09 | 0.08 | 0.09(c) |
| Expenses after expense reductions (f)(h) | N/A | N/A | N/A | N/A | N/A |
| Net investment income (loss) (l) | 1.50 | 2.04 | 2.35 | 2.21 | 1.74(c) |
| Portfolio turnover | 7 | 8 | 2 | 2 | 1 |
| Net assets at end of period (000 omitted) | $476,798 | $310,815 | $275,276 | $266,965 | $206,826 |
Table of Contents
| Year ended | |||||
| Class R1 | 5/31/21 | 5/31/20 | 5/31/19 | 5/31/18 | 5/31/17 |
| Net asset value, beginning of period | $17.23 | $16.83 | $17.17 | $16.72 | $15.60 |
| Income (loss) from investment operations | |||||
| Net investment income (loss) (d)(l) | $0.09 | $0.18 | $0.23 | $0.21 | $0.13(c) |
| Net realized and unrealized gain (loss) | 3.87 | 0.93 | 0.30 | 0.90 | 1.32 |
| Total from investment operations | $3.96 | $1.11 | $0.53 | $1.11 | $1.45 |
| Less distributions declared to shareholders | |||||
| From net investment income | $(0.11) | $(0.21) | $(0.25) | $(0.25) | $(0.12) |
| From net realized gain | (0.50) | (0.50) | (0.62) | (0.41) | (0.21) |
| Total distributions declared to shareholders | $(0.61) | $(0.71) | $(0.87) | $(0.66) | $(0.33) |
| Net asset value, end of period (x) | $20.58 | $17.23 | $16.83 | $17.17 | $16.72 |
| Total return (%) (r)(s)(t)(x) | 23.25 | 6.49 | 3.53 | 6.71 | 9.50(c) |
| Ratios (%) (to average net assets) and Supplemental data: | |||||
| Expenses before expense reductions (f)(h) | 1.08 | 1.09 | 1.09 | 1.08 | 1.09(c) |
| Expenses after expense reductions (f)(h) | N/A | 1.09 | 1.09 | N/A | N/A |
| Net investment income (loss) (l) | 0.49 | 1.03 | 1.37 | 1.21 | 0.81(c) |
| Portfolio turnover | 7 | 8 | 2 | 2 | 1 |
| Net assets at end of period (000 omitted) | $26,919 | $24,120 | $26,171 | $27,412 | $31,037 |
| Year ended | |||||
| Class R2 | 5/31/21 | 5/31/20 | 5/31/19 | 5/31/18 | 5/31/17 |
| Net asset value, beginning of period | $17.59 | $17.16 | $17.49 | $17.01 | $15.86 |
| Income (loss) from investment operations | |||||
| Net investment income (loss) (d)(l) | $0.20 | $0.27 | $0.32 | $0.30 | $0.21(c) |
| Net realized and unrealized gain (loss) | 3.95 | 0.96 | 0.30 | 0.92 | 1.35 |
| Total from investment operations | $4.15 | $1.23 | $0.62 | $1.22 | $1.56 |
| Less distributions declared to shareholders | |||||
| From net investment income | $(0.20) | $(0.30) | $(0.33) | $(0.33) | $(0.20) |
| From net realized gain | (0.50) | (0.50) | (0.62) | (0.41) | (0.21) |
| Total distributions declared to shareholders | $(0.70) | $(0.80) | $(0.95) | $(0.74) | $(0.41) |
| Net asset value, end of period (x) | $21.04 | $17.59 | $17.16 | $17.49 | $17.01 |
| Total return (%) (r)(s)(t)(x) | 23.88 | 7.06 | 4.02 | 7.27 | 10.04(c) |
| Ratios (%) (to average net assets) and Supplemental data: | |||||
| Expenses before expense reductions (f)(h) | 0.58 | 0.59 | 0.59 | 0.58 | 0.59(c) |
| Expenses after expense reductions (f)(h) | 0.58 | 0.59 | 0.59 | 0.58 | 0.59(c) |
| Net investment income (loss) (l) | 1.01 | 1.53 | 1.84 | 1.69 | 1.31(c) |
| Portfolio turnover | 7 | 8 | 2 | 2 | 1 |
| Net assets at end of period (000 omitted) | $128,654 | $124,725 | $136,699 | $166,412 | $191,974 |
Table of Contents
| Year ended | |||||
| Class R3 | 5/31/21 | 5/31/20 | 5/31/19 | 5/31/18 | 5/31/17 |
| Net asset value, beginning of period | $17.86 | $17.41 | $17.74 | $17.24 | $16.07 |
| Income (loss) from investment operations | |||||
| Net investment income (loss) (d)(l) | $0.25 | $0.33 | $0.37 | $0.35 | $0.25(c) |
| Net realized and unrealized gain (loss) | 4.01 | 0.96 | 0.29 | 0.94 | 1.37 |
| Total from investment operations | $4.26 | $1.29 | $0.66 | $1.29 | $1.62 |
| Less distributions declared to shareholders | |||||
| From net investment income | $(0.24) | $(0.34) | $(0.37) | $(0.38) | $(0.24) |
| From net realized gain | (0.50) | (0.50) | (0.62) | (0.41) | (0.21) |
| Total distributions declared to shareholders | $(0.74) | $(0.84) | $(0.99) | $(0.79) | $(0.45) |
| Net asset value, end of period (x) | $21.38 | $17.86 | $17.41 | $17.74 | $17.24 |
| Total return (%) (r)(s)(t)(x) | 24.21 | 7.35 | 4.22 | 7.56 | 10.31(c) |
| Ratios (%) (to average net assets) and Supplemental data: | |||||
| Expenses before expense reductions (f)(h) | 0.33 | 0.34 | 0.34 | 0.33 | 0.34(c) |
| Expenses after expense reductions (f)(h) | N/A | N/A | 0.34 | 0.33 | 0.34(c) |
| Net investment income (loss) (l) | 1.24 | 1.83 | 2.09 | 1.95 | 1.53(c) |
| Portfolio turnover | 7 | 8 | 2 | 2 | 1 |
| Net assets at end of period (000 omitted) | $250,644 | $219,996 | $270,597 | $312,677 | $344,821 |
| Year ended | |||||
| Class R4 | 5/31/21 | 5/31/20 | 5/31/19 | 5/31/18 | 5/31/17 |
| Net asset value, beginning of period | $18.00 | $17.54 | $17.86 | $17.36 | $16.18 |
| Income (loss) from investment operations | |||||
| Net investment income (loss) (d)(l) | $0.30 | $0.37 | $0.44 | $0.39 | $0.30(c) |
| Net realized and unrealized gain (loss) | 4.04 | 0.98 | 0.28 | 0.94 | 1.37 |
| Total from investment operations | $4.34 | $1.35 | $0.72 | $1.33 | $1.67 |
| Less distributions declared to shareholders | |||||
| From net investment income | $(0.29) | $(0.39) | $(0.42) | $(0.42) | $(0.28) |
| From net realized gain | (0.50) | (0.50) | (0.62) | (0.41) | (0.21) |
| Total distributions declared to shareholders | $(0.79) | $(0.89) | $(1.04) | $(0.83) | $(0.49) |
| Net asset value, end of period (x) | $21.55 | $18.00 | $17.54 | $17.86 | $17.36 |
| Total return (%) (r)(s)(t)(x) | 24.50 | 7.62 | 4.52 | 7.78 | 10.58(c) |
| Ratios (%) (to average net assets) and Supplemental data: | |||||
| Expenses before expense reductions (f)(h) | 0.08 | 0.09 | 0.09 | 0.08 | 0.09(c) |
| Expenses after expense reductions (f)(h) | N/A | N/A | N/A | N/A | N/A |
| Net investment income (loss) (l) | 1.49 | 2.04 | 2.50 | 2.21 | 1.80(c) |
| Portfolio turnover | 7 | 8 | 2 | 2 | 1 |
| Net assets at end of period (000 omitted) | $334,080 | $252,825 | $210,597 | $280,436 | $264,589 |
Table of Contents
| Year ended | |||||
| Class 529A | 5/31/21 | 5/31/20 | 5/31/19 | 5/31/18 | 5/31/17 |
| Net asset value, beginning of period | $17.92 | $17.46 | $17.79 | $17.29 | $16.11 |
| Income (loss) from investment operations | |||||
| Net investment income (loss) (d)(l) | $0.24 | $0.31 | $0.36 | $0.34 | $0.25(c) |
| Net realized and unrealized gain (loss) | 4.02 | 0.99 | 0.29 | 0.94 | 1.37 |
| Total from investment operations | $4.26 | $1.30 | $0.65 | $1.28 | $1.62 |
| Less distributions declared to shareholders | |||||
| From net investment income | $(0.24) | $(0.34) | $(0.36) | $(0.37) | $(0.23) |
| From net realized gain | (0.50) | (0.50) | (0.62) | (0.41) | (0.21) |
| Total distributions declared to shareholders | $(0.74) | $(0.84) | $(0.98) | $(0.78) | $(0.44) |
| Net asset value, end of period (x) | $21.44 | $17.92 | $17.46 | $17.79 | $17.29 |
| Total return (%) (r)(s)(t)(x) | 24.09 | 7.34 | 4.18 | 7.50 | 10.31(c) |
| Ratios (%) (to average net assets) and Supplemental data: | |||||
| Expenses before expense reductions (f)(h) | 0.38 | 0.39 | 0.39 | 0.41 | 0.44(c) |
| Expenses after expense reductions (f)(h) | 0.38 | 0.38 | 0.38 | 0.37 | 0.38(c) |
| Net investment income (loss) (l) | 1.19 | 1.74 | 2.05 | 1.89 | 1.50(c) |
| Portfolio turnover | 7 | 8 | 2 | 2 | 1 |
| Net assets at end of period (000 omitted) | $331,376 | $248,006 | $233,915 | $230,464 | $210,075 |
| Year ended | |||||
| Class 529B | 5/31/21 | 5/31/20 | 5/31/19 | 5/31/18 | 5/31/17 |
| Net asset value, beginning of period | $17.60 | $17.14 | $17.47 | $16.99 | $15.86 |
| Income (loss) from investment operations | |||||
| Net investment income (loss) (d)(l) | $0.24 | $0.19 | $0.23 | $0.20 | $0.12(c) |
| Net realized and unrealized gain (loss) | 3.94 | 0.97 | 0.29 | 0.93 | 1.34 |
| Total from investment operations | $4.18 | $1.16 | $0.52 | $1.13 | $1.46 |
| Less distributions declared to shareholders | |||||
| From net investment income | $(0.23) | $(0.20) | $(0.23) | $(0.24) | $(0.12) |
| From net realized gain | (0.50) | (0.50) | (0.62) | (0.41) | (0.21) |
| Total distributions declared to shareholders | $(0.73) | $(0.70) | $(0.85) | $(0.65) | $(0.33) |
| Net asset value, end of period (x) | $21.05 | $17.60 | $17.14 | $17.47 | $16.99 |
| Total return (%) (r)(s)(t)(x) | 24.10 | 6.63 | 3.44 | 6.73 | 9.37(c) |
| Ratios (%) (to average net assets) and Supplemental data: | |||||
| Expenses before expense reductions (f)(h) | 0.38 | 1.03 | 1.14 | 1.16 | 1.19(c) |
| Expenses after expense reductions (f)(h) | 0.37 | 1.02 | 1.13 | 1.12 | 1.13(c) |
| Net investment income (loss) (l) | 1.21 | 1.09 | 1.33 | 1.15 | 0.76(c) |
| Portfolio turnover | 7 | 8 | 2 | 2 | 1 |
| Net assets at end of period (000 omitted) | $6,551 | $7,258 | $8,882 | $11,056 | $14,214 |
Table of Contents
| Year ended | |||||
| Class 529C | 5/31/21 | 5/31/20 | 5/31/19 | 5/31/18 | 5/31/17 |
| Net asset value, beginning of period | $17.44 | $17.01 | $17.35 | $16.89 | $15.76 |
| Income (loss) from investment operations | |||||
| Net investment income (loss) (d)(l) | $0.10 | $0.17 | $0.22 | $0.20 | $0.12(c) |
| Net realized and unrealized gain (loss) | 3.90 | 0.96 | 0.29 | 0.92 | 1.34 |
| Total from investment operations | $4.00 | $1.13 | $0.51 | $1.12 | $1.46 |
| Less distributions declared to shareholders | |||||
| From net investment income | $(0.09) | $(0.20) | $(0.23) | $(0.25) | $(0.12) |
| From net realized gain | (0.50) | (0.50) | (0.62) | (0.41) | (0.21) |
| Total distributions declared to shareholders | $(0.59) | $(0.70) | $(0.85) | $(0.66) | $(0.33) |
| Net asset value, end of period (x) | $20.85 | $17.44 | $17.01 | $17.35 | $16.89 |
| Total return (%) (r)(s)(t)(x) | 23.19 | 6.52 | 3.43 | 6.67 | 9.48(c) |
| Ratios (%) (to average net assets) and Supplemental data: | |||||
| Expenses before expense reductions (f)(h) | 1.13 | 1.14 | 1.14 | 1.16 | 1.19(c) |
| Expenses after expense reductions (f)(h) | 1.13 | 1.14 | 1.13 | 1.13 | 1.13(c) |
| Net investment income (loss) (l) | 0.49 | 0.99 | 1.32 | 1.15 | 0.74(c) |
| Portfolio turnover | 7 | 8 | 2 | 2 | 1 |
| Net assets at end of period (000 omitted) | $55,915 | $65,063 | $71,615 | $75,337 | $79,047 |
| (c) | Amount reflects a one-time reimbursement of expenses by the custodian (or former custodian) without which net investment income and performance would be lower and expenses would be higher. |
| (d) | Per share data is based on average shares outstanding. |
| (f) | Ratios do not reflect reductions from fees paid indirectly, if applicable. |
| (h) | In addition to the fees and expenses which the fund bears directly, the fund indirectly bears a pro rata share of the fees and expenses of the underlying affiliated funds in which the fund invests. Accordingly, the expense ratio for the fund reflects only those fees and expenses borne directly by the fund. Because the underlying affiliated funds have varied expense and fee levels and the fund may own different proportions of the underlying affiliated funds at different times, the amount of fees and expenses incurred indirectly by the fund will vary. |
| (l) | The ratios and per share amounts do not include net investment income of the underlying affiliated funds in which the fund invests. |
| (r) | Certain expenses have been reduced without which performance would have been lower. |
| (s) | From time to time the fund may receive proceeds from litigation settlements, without which performance would be lower. |
| (t) | Total returns do not include any applicable sales charges. |
| (x) | The net asset values and total returns have been calculated on net assets which include adjustments made in accordance with U.S. generally accepted accounting principles required at period end for financial reporting purposes. |
Table of Contents
| Year ended | |||||
| Class A | 5/31/21 | 5/31/20 | 5/31/19 | 5/31/18 | 5/31/17 |
| Net asset value, beginning of period | $20.57 | $20.26 | $20.87 | $19.84 | $18.02 |
| Income (loss) from investment operations | |||||
| Net investment income (loss) (d)(l) | $0.23 | $0.33 | $0.38 | $0.36 | $0.25(c) |
| Net realized and unrealized gain (loss) | 6.25 | 1.03 | 0.21 | 1.66 | 2.09 |
| Total from investment operations | $6.48 | $1.36 | $0.59 | $2.02 | $2.34 |
| Less distributions declared to shareholders | |||||
| From net investment income | $(0.23) | $(0.34) | $(0.39) | $(0.40) | $(0.22) |
| From net realized gain | (0.64) | (0.71) | (0.81) | (0.59) | (0.30) |
| Total distributions declared to shareholders | $(0.87) | $(1.05) | $(1.20) | $(0.99) | $(0.52) |
| Net asset value, end of period (x) | $26.18 | $20.57 | $20.26 | $20.87 | $19.84 |
| Total return (%) (r)(s)(t)(x) | 31.90 | 6.41 | 3.58 | 10.27 | 13.26(c) |
| Ratios (%) (to average net assets) and Supplemental data: | |||||
| Expenses before expense reductions (f)(h) | 0.35 | 0.36 | 0.36 | 0.35 | 0.36(c) |
| Expenses after expense reductions (f)(h) | 0.35 | 0.35 | 0.35 | 0.35 | 0.35(c) |
| Net investment income (loss) (l) | 0.96 | 1.57 | 1.87 | 1.72 | 1.34(c) |
| Portfolio turnover | 7 | 4 | 3 | 2 | 1 |
| Net assets at end of period (000 omitted) | $4,279,764 | $2,944,439 | $2,852,131 | $2,852,681 | $2,758,650 |
| Year ended | |||||
| Class B | 5/31/21 | 5/31/20 | 5/31/19 | 5/31/18 | 5/31/17 |
| Net asset value, beginning of period | $20.39 | $20.08 | $20.65 | $19.64 | $17.83 |
| Income (loss) from investment operations | |||||
| Net investment income (loss) (d)(l) | $0.05 | $0.17 | $0.23 | $0.20 | $0.11(c) |
| Net realized and unrealized gain (loss) | 6.21 | 1.00 | 0.23 | 1.64 | 2.08 |
| Total from investment operations | $6.26 | $1.17 | $0.46 | $1.84 | $2.19 |
| Less distributions declared to shareholders | |||||
| From net investment income | $(0.02) | $(0.15) | $(0.22) | $(0.24) | $(0.08) |
| From net realized gain | (0.64) | (0.71) | (0.81) | (0.59) | (0.30) |
| Total distributions declared to shareholders | $(0.66) | $(0.86) | $(1.03) | $(0.83) | $(0.38) |
| Net asset value, end of period (x) | $25.99 | $20.39 | $20.08 | $20.65 | $19.64 |
| Total return (%) (r)(s)(t)(x) | 30.98 | 5.56 | 2.85 | 9.42 | 12.43(c) |
| Ratios (%) (to average net assets) and Supplemental data: | |||||
| Expenses before expense reductions (f)(h) | 1.10 | 1.11 | 1.11 | 1.10 | 1.11(c) |
| Expenses after expense reductions (f)(h) | 1.10 | 1.10 | 1.10 | 1.10 | 1.10(c) |
| Net investment income (loss) (l) | 0.23 | 0.83 | 1.13 | 0.98 | 0.58(c) |
| Portfolio turnover | 7 | 4 | 3 | 2 | 1 |
| Net assets at end of period (000 omitted) | $109,514 | $126,962 | $177,893 | $214,832 | $237,525 |
Table of Contents
| Year ended | |||||
| Class C | 5/31/21 | 5/31/20 | 5/31/19 | 5/31/18 | 5/31/17 |
| Net asset value, beginning of period | $20.12 | $19.85 | $20.43 | $19.44 | $17.66 |
| Income (loss) from investment operations | |||||
| Net investment income (loss) (d)(l) | $0.06 | $0.17 | $0.23 | $0.20 | $0.11(c) |
| Net realized and unrealized gain (loss) | 6.12 | 0.99 | 0.22 | 1.62 | 2.05 |
| Total from investment operations | $6.18 | $1.16 | $0.45 | $1.82 | $2.16 |
| Less distributions declared to shareholders | |||||
| From net investment income | $(0.03) | $(0.18) | $(0.22) | $(0.24) | $(0.08) |
| From net realized gain | (0.64) | (0.71) | (0.81) | (0.59) | (0.30) |
| Total distributions declared to shareholders | $(0.67) | $(0.89) | $(1.03) | $(0.83) | $(0.38) |
| Net asset value, end of period (x) | $25.63 | $20.12 | $19.85 | $20.43 | $19.44 |
| Total return (%) (r)(s)(t)(x) | 30.98 | 5.56 | 2.84 | 9.43 | 12.44(c) |
| Ratios (%) (to average net assets) and Supplemental data: | |||||
| Expenses before expense reductions (f)(h) | 1.10 | 1.11 | 1.11 | 1.10 | 1.11(c) |
| Expenses after expense reductions (f)(h) | 1.10 | 1.10 | 1.10 | 1.10 | 1.10(c) |
| Net investment income (loss) (l) | 0.26 | 0.82 | 1.13 | 1.00 | 0.59(c) |
| Portfolio turnover | 7 | 4 | 3 | 2 | 1 |
| Net assets at end of period (000 omitted) | $638,016 | $694,541 | $714,230 | $764,750 | $934,658 |
| Year ended | |||||
| Class I | 5/31/21 | 5/31/20 | 5/31/19 | 5/31/18 | 5/31/17 |
| Net asset value, beginning of period | $20.78 | $20.45 | $21.06 | $20.02 | $18.17 |
| Income (loss) from investment operations | |||||
| Net investment income (loss) (d)(l) | $0.29 | $0.38 | $0.44 | $0.42 | $0.29(c) |
| Net realized and unrealized gain (loss) | 6.33 | 1.05 | 0.21 | 1.66 | 2.13 |
| Total from investment operations | $6.62 | $1.43 | $0.65 | $2.08 | $2.42 |
| Less distributions declared to shareholders | |||||
| From net investment income | $(0.29) | $(0.39) | $(0.45) | $(0.45) | $(0.27) |
| From net realized gain | (0.64) | (0.71) | (0.81) | (0.59) | (0.30) |
| Total distributions declared to shareholders | $(0.93) | $(1.10) | $(1.26) | $(1.04) | $(0.57) |
| Net asset value, end of period (x) | $26.47 | $20.78 | $20.45 | $21.06 | $20.02 |
| Total return (%) (r)(s)(t)(x) | 32.24 | 6.69 | 3.84 | 10.50 | 13.61(c) |
| Ratios (%) (to average net assets) and Supplemental data: | |||||
| Expenses before expense reductions (f)(h) | 0.10 | 0.11 | 0.11 | 0.10 | 0.11(c) |
| Expenses after expense reductions (f)(h) | 0.10 | 0.10 | 0.10 | N/A | 0.10(c) |
| Net investment income (loss) (l) | 1.23 | 1.80 | 2.13 | 1.99 | 1.53(c) |
| Portfolio turnover | 7 | 4 | 3 | 2 | 1 |
| Net assets at end of period (000 omitted) | $434,119 | $294,213 | $237,232 | $195,227 | $151,865 |
Table of Contents
| Year ended | |||||
| Class R1 | 5/31/21 | 5/31/20 | 5/31/19 | 5/31/18 | 5/31/17 |
| Net asset value, beginning of period | $19.69 | $19.42 | $20.02 | $19.07 | $17.32 |
| Income (loss) from investment operations | |||||
| Net investment income (loss) (d)(l) | $0.05 | $0.16 | $0.23 | $0.19 | $0.11(c) |
| Net realized and unrealized gain (loss) | 5.98 | 0.98 | 0.21 | 1.59 | 2.02 |
| Total from investment operations | $6.03 | $1.14 | $0.44 | $1.78 | $2.13 |
| Less distributions declared to shareholders | |||||
| From net investment income | $(0.06) | $(0.16) | $(0.23) | $(0.24) | $(0.08) |
| From net realized gain | (0.64) | (0.71) | (0.81) | (0.59) | (0.30) |
| Total distributions declared to shareholders | $(0.70) | $(0.87) | $(1.04) | $(0.83) | $(0.38) |
| Net asset value, end of period (x) | $25.02 | $19.69 | $19.42 | $20.02 | $19.07 |
| Total return (%) (r)(s)(t)(x) | 30.91 | 5.59 | 2.85 | 9.40 | 12.48(c) |
| Ratios (%) (to average net assets) and Supplemental data: | |||||
| Expenses before expense reductions (f)(h) | 1.10 | 1.11 | 1.11 | 1.10 | 1.11(c) |
| Expenses after expense reductions (f)(h) | 1.10 | 1.10 | 1.10 | N/A | 1.10(c) |
| Net investment income (loss) (l) | 0.21 | 0.82 | 1.18 | 0.96 | 0.60(c) |
| Portfolio turnover | 7 | 4 | 3 | 2 | 1 |
| Net assets at end of period (000 omitted) | $21,519 | $19,543 | $23,326 | $30,764 | $33,854 |
| Year ended | |||||
| Class R2 | 5/31/21 | 5/31/20 | 5/31/19 | 5/31/18 | 5/31/17 |
| Net asset value, beginning of period | $20.06 | $19.78 | $20.39 | $19.41 | $17.63 |
| Income (loss) from investment operations | |||||
| Net investment income (loss) (d)(l) | $0.17 | $0.27 | $0.33 | $0.30 | $0.20(c) |
| Net realized and unrealized gain (loss) | 6.10 | 1.00 | 0.21 | 1.61 | 2.06 |
| Total from investment operations | $6.27 | $1.27 | $0.54 | $1.91 | $2.26 |
| Less distributions declared to shareholders | |||||
| From net investment income | $(0.17) | $(0.28) | $(0.34) | $(0.34) | $(0.18) |
| From net realized gain | (0.64) | (0.71) | (0.81) | (0.59) | (0.30) |
| Total distributions declared to shareholders | $(0.81) | $(0.99) | $(1.15) | $(0.93) | $(0.48) |
| Net asset value, end of period (x) | $25.52 | $20.06 | $19.78 | $20.39 | $19.41 |
| Total return (%) (r)(s)(t)(x) | 31.62 | 6.12 | 3.34 | 9.94 | 13.03(c) |
| Ratios (%) (to average net assets) and Supplemental data: | |||||
| Expenses before expense reductions (f)(h) | 0.60 | 0.61 | 0.61 | 0.60 | 0.61(c) |
| Expenses after expense reductions (f)(h) | 0.60 | 0.60 | 0.60 | 0.60 | 0.60(c) |
| Net investment income (loss) (l) | 0.72 | 1.30 | 1.64 | 1.46 | 1.10(c) |
| Portfolio turnover | 7 | 4 | 3 | 2 | 1 |
| Net assets at end of period (000 omitted) | $142,619 | $123,459 | $138,541 | $160,632 | $182,744 |
Table of Contents
| Year ended | |||||
| Class R3 | 5/31/21 | 5/31/20 | 5/31/19 | 5/31/18 | 5/31/17 |
| Net asset value, beginning of period | $20.37 | $20.08 | $20.69 | $19.68 | $17.87 |
| Income (loss) from investment operations | |||||
| Net investment income (loss) (d)(l) | $0.23 | $0.33 | $0.39 | $0.36 | $0.25(c) |
| Net realized and unrealized gain (loss) | 6.20 | 1.01 | 0.20 | 1.64 | 2.08 |
| Total from investment operations | $6.43 | $1.34 | $0.59 | $2.00 | $2.33 |
| Less distributions declared to shareholders | |||||
| From net investment income | $(0.23) | $(0.34) | $(0.39) | $(0.40) | $(0.22) |
| From net realized gain | (0.64) | (0.71) | (0.81) | (0.59) | (0.30) |
| Total distributions declared to shareholders | $(0.87) | $(1.05) | $(1.20) | $(0.99) | $(0.52) |
| Net asset value, end of period (x) | $25.93 | $20.37 | $20.08 | $20.69 | $19.68 |
| Total return (%) (r)(s)(t)(x) | 31.94 | 6.35 | 3.59 | 10.25 | 13.32(c) |
| Ratios (%) (to average net assets) and Supplemental data: | |||||
| Expenses before expense reductions (f)(h) | 0.35 | 0.36 | 0.36 | 0.35 | 0.36(c) |
| Expenses after expense reductions (f)(h) | 0.35 | 0.35 | 0.35 | 0.35 | 0.35(c) |
| Net investment income (loss) (l) | 0.98 | 1.59 | 1.90 | 1.75 | 1.34(c) |
| Portfolio turnover | 7 | 4 | 3 | 2 | 1 |
| Net assets at end of period (000 omitted) | $170,541 | $147,888 | $170,299 | $202,407 | $235,279 |
| Year ended | |||||
| Class R4 | 5/31/21 | 5/31/20 | 5/31/19 | 5/31/18 | 5/31/17 |
| Net asset value, beginning of period | $20.55 | $20.24 | $20.86 | $19.84 | $18.01 |
| Income (loss) from investment operations | |||||
| Net investment income (loss) (d)(l) | $0.29 | $0.38 | $0.44 | $0.39 | $0.29(c) |
| Net realized and unrealized gain (loss) | 6.26 | 1.03 | 0.20 | 1.67 | 2.11 |
| Total from investment operations | $6.55 | $1.41 | $0.64 | $2.06 | $2.40 |
| Less distributions declared to shareholders | |||||
| From net investment income | $(0.29) | $(0.39) | $(0.45) | $(0.45) | $(0.27) |
| From net realized gain | (0.64) | (0.71) | (0.81) | (0.59) | (0.30) |
| Total distributions declared to shareholders | $(0.93) | $(1.10) | $(1.26) | $(1.04) | $(0.57) |
| Net asset value, end of period (x) | $26.17 | $20.55 | $20.24 | $20.86 | $19.84 |
| Total return (%) (r)(s)(t)(x) | 32.26 | 6.66 | 3.83 | 10.50 | 13.62(c) |
| Ratios (%) (to average net assets) and Supplemental data: | |||||
| Expenses before expense reductions (f)(h) | 0.11 | 0.11 | 0.11 | 0.10 | 0.11(c) |
| Expenses after expense reductions (f)(h) | 0.10 | 0.10 | 0.10 | N/A | 0.10(c) |
| Net investment income (loss) (l) | 1.23 | 1.81 | 2.16 | 1.90 | 1.55(c) |
| Portfolio turnover | 7 | 4 | 3 | 2 | 1 |
| Net assets at end of period (000 omitted) | $360,879 | $264,076 | $232,530 | $230,032 | $243,760 |
Table of Contents
| Year ended | |||||
| Class 529A | 5/31/21 | 5/31/20 | 5/31/19 | 5/31/18 | 5/31/17 |
| Net asset value, beginning of period | $20.38 | $20.09 | $20.70 | $19.70 | $17.89 |
| Income (loss) from investment operations | |||||
| Net investment income (loss) (d)(l) | $0.22 | $0.32 | $0.37 | $0.34 | $0.24(c) |
| Net realized and unrealized gain (loss) | 6.20 | 1.01 | 0.22 | 1.65 | 2.09 |
| Total from investment operations | $6.42 | $1.33 | $0.59 | $1.99 | $2.33 |
| Less distributions declared to shareholders | |||||
| From net investment income | $(0.22) | $(0.33) | $(0.39) | $(0.40) | $(0.22) |
| From net realized gain | (0.64) | (0.71) | (0.81) | (0.59) | (0.30) |
| Total distributions declared to shareholders | $(0.86) | $(1.04) | $(1.20) | $(0.99) | $(0.52) |
| Net asset value, end of period (x) | $25.94 | $20.38 | $20.09 | $20.70 | $19.70 |
| Total return (%) (r)(s)(t)(x) | 31.90 | 6.33 | 3.57 | 10.17 | 13.27(c) |
| Ratios (%) (to average net assets) and Supplemental data: | |||||
| Expenses before expense reductions (f)(h) | 0.40 | 0.41 | 0.41 | 0.42 | 0.46(c) |
| Expenses after expense reductions (f)(h) | 0.39 | 0.39 | 0.39 | 0.39 | 0.39(c) |
| Net investment income (loss) (l) | 0.92 | 1.53 | 1.83 | 1.68 | 1.28(c) |
| Portfolio turnover | 7 | 4 | 3 | 2 | 1 |
| Net assets at end of period (000 omitted) | $349,866 | $261,099 | $244,869 | $236,768 | $211,825 |
| Year ended | |||||
| Class 529B | 5/31/21 | 5/31/20 | 5/31/19 | 5/31/18 | 5/31/17 |
| Net asset value, beginning of period | $20.15 | $19.86 | $20.45 | $19.46 | $17.67 |
| Income (loss) from investment operations | |||||
| Net investment income (loss) (d)(l) | $0.12 | $0.16 | $0.21 | $0.19 | $0.10(c) |
| Net realized and unrealized gain (loss) | 6.13 | 0.99 | 0.23 | 1.63 | 2.05 |
| Total from investment operations | $6.25 | $1.15 | $0.44 | $1.82 | $2.15 |
| Less distributions declared to shareholders | |||||
| From net investment income | $(0.04) | $(0.15) | $(0.22) | $(0.24) | $(0.06) |
| From net realized gain | (0.64) | (0.71) | (0.81) | (0.59) | (0.30) |
| Total distributions declared to shareholders | $(0.68) | $(0.86) | $(1.03) | $(0.83) | $(0.36) |
| Net asset value, end of period (x) | $25.72 | $20.15 | $19.86 | $20.45 | $19.46 |
| Total return (%) (r)(s)(t)(x) | 31.29 | 5.52 | 2.77 | 9.40 | 12.36(c) |
| Ratios (%) (to average net assets) and Supplemental data: | |||||
| Expenses before expense reductions (f)(h) | 0.84 | 1.16 | 1.16 | 1.18 | 1.21(c) |
| Expenses after expense reductions (f)(h) | 0.82 | 1.15 | 1.15 | 1.15 | 1.15(c) |
| Net investment income (loss) (l) | 0.50 | 0.78 | 1.07 | 0.93 | 0.53(c) |
| Portfolio turnover | 7 | 4 | 3 | 2 | 1 |
| Net assets at end of period (000 omitted) | $8,867 | $8,702 | $10,820 | $11,943 | $12,439 |
Table of Contents
| Year ended | |||||
| Class 529C | 5/31/21 | 5/31/20 | 5/31/19 | 5/31/18 | 5/31/17 |
| Net asset value, beginning of period | $19.82 | $19.56 | $20.16 | $19.21 | $17.46 |
| Income (loss) from investment operations | |||||
| Net investment income (loss) (d)(l) | $0.05 | $0.16 | $0.21 | $0.19 | $0.10(c) |
| Net realized and unrealized gain (loss) | 6.02 | 0.98 | 0.21 | 1.60 | 2.03 |
| Total from investment operations | $6.07 | $1.14 | $0.42 | $1.79 | $2.13 |
| Less distributions declared to shareholders | |||||
| From net investment income | $(0.01) | $(0.17) | $(0.21) | $(0.25) | $(0.08) |
| From net realized gain | (0.64) | (0.71) | (0.81) | (0.59) | (0.30) |
| Total distributions declared to shareholders | $(0.65) | $(0.88) | $(1.02) | $(0.84) | $(0.38) |
| Net asset value, end of period (x) | $25.24 | $19.82 | $19.56 | $20.16 | $19.21 |
| Total return (%) (r)(s)(t)(x) | 30.92 | 5.57 | 2.74 | 9.37 | 12.38(c) |
| Ratios (%) (to average net assets) and Supplemental data: | |||||
| Expenses before expense reductions (f)(h) | 1.15 | 1.16 | 1.16 | 1.17 | 1.21(c) |
| Expenses after expense reductions (f)(h) | 1.14 | 1.14 | 1.14 | 1.14 | 1.15(c) |
| Net investment income (loss) (l) | 0.23 | 0.79 | 1.08 | 0.94 | 0.53(c) |
| Portfolio turnover | 7 | 4 | 3 | 2 | 1 |
| Net assets at end of period (000 omitted) | $50,115 | $57,107 | $61,352 | $70,345 | $74,292 |
| (c) | Amount reflects a one-time reimbursement of expenses by the custodian (or former custodian) without which net investment income and performance would be lower and expenses would be higher. |
| (d) | Per share data is based on average shares outstanding. |
| (f) | Ratios do not reflect reductions from fees paid indirectly, if applicable. |
| (h) | In addition to the fees and expenses which the fund bears directly, the fund indirectly bears a pro rata share of the fees and expenses of the underlying affiliated funds in which the fund invests. Accordingly, the expense ratio for the fund reflects only those fees and expenses borne directly by the fund. Because the underlying affiliated funds have varied expense and fee levels and the fund may own different proportions of the underlying affiliated funds at different times, the amount of fees and expenses incurred indirectly by the fund will vary. |
| (l) | The ratios and per share amounts do not include net investment income of the underlying affiliated funds in which the fund invests. |
| (r) | Certain expenses have been reduced without which performance would have been lower. |
| (s) | From time to time the fund may receive proceeds from litigation settlements, without which performance would be lower. |
| (t) | Total returns do not include any applicable sales charges. |
| (x) | The net asset values and total returns have been calculated on net assets which include adjustments made in accordance with U.S. generally accepted accounting principles required at period end for financial reporting purposes. |
Table of Contents
| Year ended | |||||
| Class A | 5/31/21 | 5/31/20 | 5/31/19 | 5/31/18 | 5/31/17 |
| Net asset value, beginning of period | $23.23 | $22.94 | $23.63 | $21.80 | $19.47 |
| Income (loss) from investment operations | |||||
| Net investment income (loss) (d)(l) | $0.14 | $0.28 | $0.34 | $0.30 | $0.20(c) |
| Net realized and unrealized gain (loss) | 8.66 | 1.18 | 0.16 | 2.47 | 2.70 |
| Total from investment operations | $8.80 | $1.46 | $0.50 | $2.77 | $2.90 |
| Less distributions declared to shareholders | |||||
| From net investment income | $(0.15) | $(0.29) | $(0.34) | $(0.32) | $(0.20) |
| From net realized gain | (0.85) | (0.88) | (0.85) | (0.62) | (0.37) |
| Total distributions declared to shareholders | $(1.00) | $(1.17) | $(1.19) | $(0.94) | $(0.57) |
| Net asset value, end of period (x) | $31.03 | $23.23 | $22.94 | $23.63 | $21.80 |
| Total return (%) (r)(s)(t)(x) | 38.35 | 5.97 | 2.82 | 12.82 | 15.22(c) |
| Ratios (%) (to average net assets) and Supplemental data: | |||||
| Expenses before expense reductions (f)(h) | 0.40 | 0.41 | 0.40 | 0.39 | 0.40(c) |
| Expenses after expense reductions (f)(h) | 0.38 | 0.38 | 0.38 | 0.38 | 0.38(c) |
| Net investment income (loss) (l) | 0.50 | 1.18 | 1.47 | 1.30 | 0.99(c) |
| Portfolio turnover | 7 | 6 | 5 | 2 | 2 |
| Net assets at end of period (000 omitted) | $1,386,555 | $928,555 | $869,146 | $859,070 | $778,995 |
| Year ended | |||||
| Class B | 5/31/21 | 5/31/20 | 5/31/19 | 5/31/18 | 5/31/17 |
| Net asset value, beginning of period | $22.88 | $22.60 | $23.26 | $21.46 | $19.16 |
| Income (loss) from investment operations | |||||
| Net investment income (loss) (d)(l) | $(0.06) | $0.10 | $0.17 | $0.13 | $0.05(c) |
| Net realized and unrealized gain (loss) | 8.50 | 1.15 | 0.17 | 2.43 | 2.66 |
| Total from investment operations | $8.44 | $1.25 | $0.34 | $2.56 | $2.71 |
| Less distributions declared to shareholders | |||||
| From net investment income | $— | $(0.09) | $(0.15) | $(0.14) | $(0.04) |
| From net realized gain | (0.85) | (0.88) | (0.85) | (0.62) | (0.37) |
| Total distributions declared to shareholders | $(0.85) | $(0.97) | $(1.00) | $(0.76) | $(0.41) |
| Net asset value, end of period (x) | $30.47 | $22.88 | $22.60 | $23.26 | $21.46 |
| Total return (%) (r)(s)(t)(x) | 37.30 | 5.18 | 2.03 | 12.02 | 14.39(c) |
| Ratios (%) (to average net assets) and Supplemental data: | |||||
| Expenses before expense reductions (f)(h) | 1.15 | 1.16 | 1.15 | 1.14 | 1.15(c) |
| Expenses after expense reductions (f)(h) | 1.13 | 1.13 | 1.13 | 1.13 | 1.13(c) |
| Net investment income (loss) (l) | (0.22) | 0.44 | 0.73 | 0.57 | 0.23(c) |
| Portfolio turnover | 7 | 6 | 5 | 2 | 2 |
| Net assets at end of period (000 omitted) | $40,147 | $41,016 | $52,512 | $61,264 | $65,287 |
Table of Contents
| Year ended | |||||
| Class C | 5/31/21 | 5/31/20 | 5/31/19 | 5/31/18 | 5/31/17 |
| Net asset value, beginning of period | $22.61 | $22.36 | $23.02 | $21.26 | $18.99 |
| Income (loss) from investment operations | |||||
| Net investment income (loss) (d)(l) | $(0.05) | $0.09 | $0.16 | $0.13 | $0.05(c) |
| Net realized and unrealized gain (loss) | 8.38 | 1.15 | 0.18 | 2.40 | 2.64 |
| Total from investment operations | $8.33 | $1.24 | $0.34 | $2.53 | $2.69 |
| Less distributions declared to shareholders | |||||
| From net investment income | $— | $(0.11) | $(0.15) | $(0.15) | $(0.05) |
| From net realized gain | (0.85) | (0.88) | (0.85) | (0.62) | (0.37) |
| Total distributions declared to shareholders | $(0.85) | $(0.99) | $(1.00) | $(0.77) | $(0.42) |
| Net asset value, end of period (x) | $30.09 | $22.61 | $22.36 | $23.02 | $21.26 |
| Total return (%) (r)(s)(t)(x) | 37.26 | 5.20 | 2.04 | 11.97 | 14.42(c) |
| Ratios (%) (to average net assets) and Supplemental data: | |||||
| Expenses before expense reductions (f)(h) | 1.14 | 1.16 | 1.15 | 1.14 | 1.15(c) |
| Expenses after expense reductions (f)(h) | 1.13 | 1.13 | 1.13 | 1.13 | 1.13(c) |
| Net investment income (loss) (l) | (0.20) | 0.41 | 0.72 | 0.58 | 0.24(c) |
| Portfolio turnover | 7 | 6 | 5 | 2 | 2 |
| Net assets at end of period (000 omitted) | $264,940 | $234,144 | $221,719 | $227,357 | $274,450 |
| Year ended | |||||
| Class I | 5/31/21 | 5/31/20 | 5/31/19 | 5/31/18 | 5/31/17 |
| Net asset value, beginning of period | $23.65 | $23.33 | $24.02 | $22.14 | $19.77 |
| Income (loss) from investment operations | |||||
| Net investment income (loss) (d)(l) | $0.22 | $0.35 | $0.39 | $0.37 | $0.25(c) |
| Net realized and unrealized gain (loss) | 8.80 | 1.20 | 0.17 | 2.51 | 2.74 |
| Total from investment operations | $9.02 | $1.55 | $0.56 | $2.88 | $2.99 |
| Less distributions declared to shareholders | |||||
| From net investment income | $(0.20) | $(0.35) | $(0.40) | $(0.38) | $(0.25) |
| From net realized gain | (0.85) | (0.88) | (0.85) | (0.62) | (0.37) |
| Total distributions declared to shareholders | $(1.05) | $(1.23) | $(1.25) | $(1.00) | $(0.62) |
| Net asset value, end of period (x) | $31.62 | $23.65 | $23.33 | $24.02 | $22.14 |
| Total return (%) (r)(s)(t)(x) | 38.67 | 6.24 | 3.05 | 13.11 | 15.49(c) |
| Ratios (%) (to average net assets) and Supplemental data: | |||||
| Expenses before expense reductions (f)(h) | 0.15 | 0.16 | 0.15 | 0.14 | 0.15(c) |
| Expenses after expense reductions (f)(h) | 0.13 | 0.13 | 0.13 | 0.13 | 0.13(c) |
| Net investment income (loss) (l) | 0.78 | 1.46 | 1.67 | 1.58 | 1.19(c) |
| Portfolio turnover | 7 | 6 | 5 | 2 | 2 |
| Net assets at end of period (000 omitted) | $241,144 | $178,491 | $167,527 | $142,897 | $112,479 |
Table of Contents
| Year ended | |||||
| Class R1 | 5/31/21 | 5/31/20 | 5/31/19 | 5/31/18 | 5/31/17 |
| Net asset value, beginning of period | $22.25 | $22.00 | $22.69 | $20.97 | $18.74 |
| Income (loss) from investment operations | |||||
| Net investment income (loss) (d)(l) | $(0.06) | $0.09 | $0.15 | $0.12 | $0.05(c) |
| Net realized and unrealized gain (loss) | 8.26 | 1.13 | 0.18 | 2.37 | 2.60 |
| Total from investment operations | $8.20 | $1.22 | $0.33 | $2.49 | $2.65 |
| Less distributions declared to shareholders | |||||
| From net investment income | $— | $(0.09) | $(0.17) | $(0.15) | $(0.05) |
| From net realized gain | (0.85) | (0.88) | (0.85) | (0.62) | (0.37) |
| Total distributions declared to shareholders | $(0.85) | $(0.97) | $(1.02) | $(0.77) | $(0.42) |
| Net asset value, end of period (x) | $29.60 | $22.25 | $22.00 | $22.69 | $20.97 |
| Total return (%) (r)(s)(t)(x) | 37.28 | 5.21 | 2.03 | 11.94 | 14.42(c) |
| Ratios (%) (to average net assets) and Supplemental data: | |||||
| Expenses before expense reductions (f)(h) | 1.14 | 1.16 | 1.15 | 1.14 | 1.15(c) |
| Expenses after expense reductions (f)(h) | 1.13 | 1.13 | 1.13 | 1.13 | 1.13(c) |
| Net investment income (loss) (l) | (0.24) | 0.40 | 0.69 | 0.53 | 0.27(c) |
| Portfolio turnover | 7 | 6 | 5 | 2 | 2 |
| Net assets at end of period (000 omitted) | $18,496 | $14,484 | $17,093 | $17,228 | $16,835 |
| Year ended | |||||
| Class R2 | 5/31/21 | 5/31/20 | 5/31/19 | 5/31/18 | 5/31/17 |
| Net asset value, beginning of period | $22.71 | $22.44 | $23.13 | $21.36 | $19.08 |
| Income (loss) from investment operations | |||||
| Net investment income (loss) (d)(l) | $0.07 | $0.21 | $0.28 | $0.25 | $0.15(c) |
| Net realized and unrealized gain (loss) | 8.44 | 1.16 | 0.16 | 2.40 | 2.64 |
| Total from investment operations | $8.51 | $1.37 | $0.44 | $2.65 | $2.79 |
| Less distributions declared to shareholders | |||||
| From net investment income | $(0.07) | $(0.22) | $(0.28) | $(0.26) | $(0.14) |
| From net realized gain | (0.85) | (0.88) | (0.85) | (0.62) | (0.37) |
| Total distributions declared to shareholders | $(0.92) | $(1.10) | $(1.13) | $(0.88) | $(0.51) |
| Net asset value, end of period (x) | $30.30 | $22.71 | $22.44 | $23.13 | $21.36 |
| Total return (%) (r)(s)(t)(x) | 37.93 | 5.73 | 2.56 | 12.50 | 14.96(c) |
| Ratios (%) (to average net assets) and Supplemental data: | |||||
| Expenses before expense reductions (f)(h) | 0.65 | 0.66 | 0.65 | 0.64 | 0.65(c) |
| Expenses after expense reductions (f)(h) | 0.63 | 0.63 | 0.63 | 0.63 | 0.63(c) |
| Net investment income (loss) (l) | 0.27 | 0.91 | 1.23 | 1.09 | 0.76(c) |
| Portfolio turnover | 7 | 6 | 5 | 2 | 2 |
| Net assets at end of period (000 omitted) | $65,485 | $55,453 | $63,038 | $70,426 | $77,558 |
Table of Contents
| Year ended | |||||
| Class R3 | 5/31/21 | 5/31/20 | 5/31/19 | 5/31/18 | 5/31/17 |
| Net asset value, beginning of period | $23.04 | $22.75 | $23.44 | $21.63 | $19.31 |
| Income (loss) from investment operations | |||||
| Net investment income (loss) (d)(l) | $0.15 | $0.29 | $0.34 | $0.30 | $0.19(c) |
| Net realized and unrealized gain (loss) | 8.56 | 1.17 | 0.15 | 2.45 | 2.69 |
| Total from investment operations | $8.71 | $1.46 | $0.49 | $2.75 | $2.88 |
| Less distributions declared to shareholders | |||||
| From net investment income | $(0.14) | $(0.29) | $(0.33) | $(0.32) | $(0.19) |
| From net realized gain | (0.85) | (0.88) | (0.85) | (0.62) | (0.37) |
| Total distributions declared to shareholders | $(0.99) | $(1.17) | $(1.18) | $(0.94) | $(0.56) |
| Net asset value, end of period (x) | $30.76 | $23.04 | $22.75 | $23.44 | $21.63 |
| Total return (%) (r)(s)(t)(x) | 38.28 | 6.00 | 2.78 | 12.82 | 15.28(c) |
| Ratios (%) (to average net assets) and Supplemental data: | |||||
| Expenses before expense reductions (f)(h) | 0.40 | 0.41 | 0.40 | 0.39 | 0.40(c) |
| Expenses after expense reductions (f)(h) | 0.38 | 0.38 | 0.38 | 0.38 | 0.38(c) |
| Net investment income (loss) (l) | 0.54 | 1.20 | 1.48 | 1.33 | 0.94(c) |
| Portfolio turnover | 7 | 6 | 5 | 2 | 2 |
| Net assets at end of period (000 omitted) | $105,120 | $87,315 | $97,866 | $137,905 | $142,459 |
| Year ended | |||||
| Class R4 | 5/31/21 | 5/31/20 | 5/31/19 | 5/31/18 | 5/31/17 |
| Net asset value, beginning of period | $23.32 | $23.01 | $23.71 | $21.87 | $19.53 |
| Income (loss) from investment operations | |||||
| Net investment income (loss) (d)(l) | $0.21 | $0.34 | $0.39 | $0.35 | $0.25(c) |
| Net realized and unrealized gain (loss) | 8.67 | 1.20 | 0.16 | 2.49 | 2.71 |
| Total from investment operations | $8.88 | $1.54 | $0.55 | $2.84 | $2.96 |
| Less distributions declared to shareholders | |||||
| From net investment income | $(0.20) | $(0.35) | $(0.40) | $(0.38) | $(0.25) |
| From net realized gain | (0.85) | (0.88) | (0.85) | (0.62) | (0.37) |
| Total distributions declared to shareholders | $(1.05) | $(1.23) | $(1.25) | $(1.00) | $(0.62) |
| Net asset value, end of period (x) | $31.15 | $23.32 | $23.01 | $23.71 | $21.87 |
| Total return (%) (r)(s)(t)(x) | 38.61 | 6.29 | 3.05 | 13.09 | 15.53(c) |
| Ratios (%) (to average net assets) and Supplemental data: | |||||
| Expenses before expense reductions (f)(h) | 0.15 | 0.16 | 0.15 | 0.14 | 0.15(c) |
| Expenses after expense reductions (f)(h) | 0.13 | 0.13 | 0.13 | 0.13 | 0.13(c) |
| Net investment income (loss) (l) | 0.77 | 1.44 | 1.69 | 1.53 | 1.23(c) |
| Portfolio turnover | 7 | 6 | 5 | 2 | 2 |
| Net assets at end of period (000 omitted) | $200,635 | $137,680 | $109,384 | $91,311 | $72,011 |
Table of Contents
| Year ended | |||||
| Class 529A | 5/31/21 | 5/31/20 | 5/31/19 | 5/31/18 | 5/31/17 |
| Net asset value, beginning of period | $23.05 | $22.77 | $23.47 | $21.66 | $19.34 |
| Income (loss) from investment operations | |||||
| Net investment income (loss) (d)(l) | $0.13 | $0.27 | $0.33 | $0.29 | $0.19(c) |
| Net realized and unrealized gain (loss) | 8.58 | 1.17 | 0.15 | 2.45 | 2.69 |
| Total from investment operations | $8.71 | $1.44 | $0.48 | $2.74 | $2.88 |
| Less distributions declared to shareholders | |||||
| From net investment income | $(0.13) | $(0.28) | $(0.33) | $(0.31) | $(0.19) |
| From net realized gain | (0.85) | (0.88) | (0.85) | (0.62) | (0.37) |
| Total distributions declared to shareholders | $(0.98) | $(1.16) | $(1.18) | $(0.93) | $(0.56) |
| Net asset value, end of period (x) | $30.78 | $23.05 | $22.77 | $23.47 | $21.66 |
| Total return (%) (r)(s)(t)(x) | 38.29 | 5.93 | 2.75 | 12.78 | 15.23(c) |
| Ratios (%) (to average net assets) and Supplemental data: | |||||
| Expenses before expense reductions (f)(h) | 0.45 | 0.46 | 0.45 | 0.46 | 0.50(c) |
| Expenses after expense reductions (f)(h) | 0.42 | 0.42 | 0.42 | 0.42 | 0.42(c) |
| Net investment income (loss) (l) | 0.47 | 1.14 | 1.44 | 1.26 | 0.93(c) |
| Portfolio turnover | 7 | 6 | 5 | 2 | 2 |
| Net assets at end of period (000 omitted) | $215,339 | $154,654 | $145,819 | $146,874 | $129,294 |
| Year ended | |||||
| Class 529B | 5/31/21 | 5/31/20 | 5/31/19 | 5/31/18 | 5/31/17 |
| Net asset value, beginning of period | $22.59 | $22.31 | $22.98 | $21.22 | $18.94 |
| Income (loss) from investment operations | |||||
| Net investment income (loss) (d)(l) | $(0.07) | $0.09 | $0.16 | $0.11 | $0.04(c) |
| Net realized and unrealized gain (loss) | 8.38 | 1.13 | 0.17 | 2.40 | 2.62 |
| Total from investment operations | $8.31 | $1.22 | $0.33 | $2.51 | $2.66 |
| Less distributions declared to shareholders | |||||
| From net investment income | $— | $(0.06) | $(0.15) | $(0.13) | $(0.01) |
| From net realized gain | (0.85) | (0.88) | (0.85) | (0.62) | (0.37) |
| Total distributions declared to shareholders | $(0.85) | $(0.94) | $(1.00) | $(0.75) | $(0.38) |
| Net asset value, end of period (x) | $30.05 | $22.59 | $22.31 | $22.98 | $21.22 |
| Total return (%) (r)(s)(t)(x) | 37.20 | 5.15 | 2.00 | 11.92 | 14.29(c) |
| Ratios (%) (to average net assets) and Supplemental data: | |||||
| Expenses before expense reductions (f)(h) | 1.20 | 1.21 | 1.20 | 1.21 | 1.25(c) |
| Expenses after expense reductions (f)(h) | 1.18 | 1.18 | 1.18 | 1.18 | 1.18(c) |
| Net investment income (loss) (l) | (0.26) | 0.40 | 0.72 | 0.49 | 0.18(c) |
| Portfolio turnover | 7 | 6 | 5 | 2 | 2 |
| Net assets at end of period (000 omitted) | $2,518 | $2,924 | $4,253 | $5,021 | $5,357 |
Table of Contents
| Year ended | |||||
| Class 529C | 5/31/21 | 5/31/20 | 5/31/19 | 5/31/18 | 5/31/17 |
| Net asset value, beginning of period | $22.24 | $22.00 | $22.68 | $20.97 | $18.73 |
| Income (loss) from investment operations | |||||
| Net investment income (loss) (d)(l) | $(0.06) | $0.09 | $0.16 | $0.12 | $0.04(c) |
| Net realized and unrealized gain (loss) | 8.25 | 1.13 | 0.16 | 2.36 | 2.60 |
| Total from investment operations | $8.19 | $1.22 | $0.32 | $2.48 | $2.64 |
| Less distributions declared to shareholders | |||||
| From net investment income | $— | $(0.10) | $(0.15) | $(0.15) | $(0.03) |
| From net realized gain | (0.85) | (0.88) | (0.85) | (0.62) | (0.37) |
| Total distributions declared to shareholders | $(0.85) | $(0.98) | $(1.00) | $(0.77) | $(0.40) |
| Net asset value, end of period (x) | $29.58 | $22.24 | $22.00 | $22.68 | $20.97 |
| Total return (%) (r)(s)(t)(x) | 37.25 | 5.17 | 1.99 | 11.90 | 14.37(c) |
| Ratios (%) (to average net assets) and Supplemental data: | |||||
| Expenses before expense reductions (f)(h) | 1.20 | 1.21 | 1.20 | 1.21 | 1.25(c) |
| Expenses after expense reductions (f)(h) | 1.17 | 1.17 | 1.17 | 1.17 | 1.17(c) |
| Net investment income (loss) (l) | (0.22) | 0.40 | 0.72 | 0.55 | 0.19(c) |
| Portfolio turnover | 7 | 6 | 5 | 2 | 2 |
| Net assets at end of period (000 omitted) | $21,417 | $21,923 | $27,617 | $31,322 | $34,237 |
| (c) | Amount reflects a one-time reimbursement of expenses by the custodian (or former custodian) without which net investment income and performance would be lower and expenses would be higher. |
| (d) | Per share data is based on average shares outstanding. |
| (f) | Ratios do not reflect reductions from fees paid indirectly, if applicable. |
| (h) | In addition to the fees and expenses which the fund bears directly, the fund indirectly bears a pro rata share of the fees and expenses of the underlying affiliated funds in which the fund invests. Accordingly, the expense ratio for the fund reflects only those fees and expenses borne directly by the fund. Because the underlying affiliated funds have varied expense and fee levels and the fund may own different proportions of the underlying affiliated funds at different times, the amount of fees and expenses incurred indirectly by the fund will vary. |
| (l) | The ratios and per share amounts do not include net investment income of the underlying affiliated funds in which the fund invests. |
| (r) | Certain expenses have been reduced without which performance would have been lower. |
| (s) | From time to time the fund may receive proceeds from litigation settlements, without which performance would be lower. |
| (t) | Total returns do not include any applicable sales charges. |
| (x) | The net asset values and total returns have been calculated on net assets which include adjustments made in accordance with U.S. generally accepted accounting principles required at period end for financial reporting purposes. |
Table of Contents
Table of Contents
| Level 1 | Level 2 | Level 3 | Total | |
| MFS Conservative Allocation Fund | ||||
| Financial Instruments | ||||
| Mutual Funds | $3,076,012,778 | $1,100,224,636 | $— | $4,176,237,414 |
| MFS Moderate Allocation Fund | ||||
| Financial Instruments | ||||
| Mutual Funds | $4,468,889,528 | $2,661,577,709 | $— | $7,130,467,237 |
| MFS Growth Allocation Fund | ||||
| Financial Instruments | ||||
| Mutual Funds | $3,386,783,155 | $3,175,740,307 | $— | $6,562,523,462 |
Table of Contents
| Level 1 | Level 2 | Level 3 | Total | |
| MFS Aggressive Growth Allocation Fund | ||||
| Financial Instruments | ||||
| Mutual Funds | $1,028,917,557 | $1,532,167,185 | $— | $2,561,084,742 |
| Year ended 5/31/21 | MFS Conservative Allocation Fund | MFS Moderate Allocation Fund | MFS Growth Allocation Fund | MFS Aggressive Growth Allocation Fund |
| Ordinary income (including any short-term capital gains) | $60,635,735 | $86,057,133 | $50,002,396 | $11,104,503 |
| Long-term capital gains | 38,180,804 | 139,862,845 | 153,648,340 | 67,705,421 |
| Total distributions | $98,816,539 | $225,919,978 | $203,650,736 | $78,809,924 |
| Year ended 5/31/20 | MFS Conservative Allocation Fund | MFS Moderate Allocation Fund | MFS Growth Allocation Fund | MFS Aggressive Growth Allocation Fund |
| Ordinary income (including any short-term capital gains) | $66,046,949 | $113,934,440 | $88,944,802 | $24,821,522 |
| Long-term capital gains | 34,039,915 | 133,463,976 | 150,001,752 | 63,599,671 |
| Total distributions | $100,086,864 | $247,398,416 | $238,946,554 | $88,421,193 |
Table of Contents
| As of 5/31/21 | MFS Conservative Allocation Fund | MFS Moderate Allocation Fund | MFS Growth Allocation Fund | MFS Aggressive Growth Allocation Fund |
| Cost of investments | $3,116,222,130 | $4,544,090,769 | $3,535,875,739 | $1,198,967,296 |
| Gross appreciation | 1,060,015,284 | 2,590,241,070 | 3,035,939,705 | 1,362,117,446 |
| Gross depreciation | — | (3,864,602) | (9,291,982) | — |
| Net unrealized appreciation (depreciation) | $1,060,015,284 | $2,586,376,468 | $3,026,647,723 | $1,362,117,446 |
| Undistributed ordinary income | 17,375,694 | 32,813,480 | 18,105,929 | 5,991,406 |
| Undistributed long-term capital gain | 27,908,290 | 77,533,808 | 99,542,277 | 37,570,202 |
| Late year ordinary loss deferral | — | — | — | (2,766,929) |
| Total distributable earnings (loss) | $1,105,299,268 | $2,696,723,756 | $3,144,295,929 | $1,402,912,125 |
| MFS Conservative Allocation Fund | MFS Moderate Allocation Fund | MFS Growth Allocation Fund | MFS Aggressive Growth Allocation Fund | ||||||||||||
| Year Ended 5/31/21 | Year Ended 5/31/20 | Year Ended 5/31/21 | Year Ended 5/31/20 | Year Ended 5/31/21 | Year Ended 5/31/20 | Year Ended 5/31/21 | Year Ended 5/31/20 | ||||||||
| Class A | $54,722,059 | $47,576,968 | $145,402,158 | $145,270,997 | $131,401,659 | $145,230,645 | $41,124,494 | $44,373,842 | |||||||
| Class B | 1,084,398 | 2,168,533 | 3,989,700 | 7,035,610 | 3,226,849 | 6,304,726 | 1,261,974 | 1,963,075 | |||||||
| Class C | 10,000,935 | 15,108,015 | 22,532,119 | 35,745,540 | 17,806,427 | 30,264,583 | 7,601,984 | 9,500,453 | |||||||
| Class I | 15,137,935 | 14,978,296 | 15,927,837 | 14,370,339 | 14,981,594 | 13,363,611 | 9,053,819 | 9,520,553 | |||||||
| Class R1 | 266,691 | 358,308 | 807,113 | 1,027,258 | 593,487 | 883,981 | 515,458 | 625,251 | |||||||
| Class R2 | 1,439,026 | 2,102,707 | 4,520,696 | 5,813,812 | 4,602,473 | 6,163,426 | 2,054,391 | 2,801,149 | |||||||
| Class R3 | 2,964,928 | 3,623,914 | 8,602,082 | 12,752,047 | 5,945,631 | 8,199,347 | 3,567,584 | 4,665,815 | |||||||
| Class R4 | 7,699,153 | 7,544,576 | 11,501,005 | 11,296,581 | 12,276,669 | 12,830,557 | 6,293,052 | 6,394,276 | |||||||
| Class 529A | 4,675,914 | 5,240,037 | 10,777,610 | 11,039,208 | 11,123,652 | 12,655,147 | 6,614,057 | 7,307,911 | |||||||
| Class 529B | 111,263 | 149,646 | 258,759 | 298,340 | 251,071 | 403,450 | 85,310 | 145,860 | |||||||
| Class 529C | 714,237 | 1,235,864 | 1,600,899 | 2,748,684 | 1,441,224 | 2,647,081 | 637,801 | 1,123,008 | |||||||
| Total | $98,816,539 | $100,086,864 | $225,919,978 | $247,398,416 | $203,650,736 | $238,946,554 | $78,809,924 | $88,421,193 | |||||||
Table of Contents
| Class A | Class 529A | |
| MFS Conservative Allocation Fund | $534,946 | $43,622 |
| MFS Moderate Allocation Fund | 892,330 | 112,630 |
| MFS Growth Allocation Fund | 1,076,707 | 172,266 |
| MFS Aggressive Growth Allocation Fund | 482,907 | 145,162 |
| Class A | |||||
| Distribution Fee Rate (d) | Service Fee Rate (d) | Total Distribution Plan (d) | Annual Effective Rate (e) | Distribution and Service Fee | |
| MFS Conservative Allocation Fund | — | 0.25% | 0.25% | 0.25% | $4,886,459 |
| MFS Moderate Allocation Fund | — | 0.25% | 0.25% | 0.25% | 9,764,147 |
| MFS Growth Allocation Fund | — | 0.25% | 0.25% | 0.25% | 8,972,284 |
| MFS Aggressive Growth Allocation Fund | — | 0.25% | 0.25% | 0.25% | 2,849,642 |
| Class B | |||||
| Distribution Fee Rate (d) | Service Fee Rate (d) | Total Distribution Plan (d) | Annual Effective Rate (e) | Distribution and Service Fee | |
| MFS Conservative Allocation Fund | 0.75% | 0.25% | 1.00% | 1.00% | $555,817 |
| MFS Moderate Allocation Fund | 0.75% | 0.25% | 1.00% | 1.00% | 1,351,433 |
| MFS Growth Allocation Fund | 0.75% | 0.25% | 1.00% | 1.00% | 1,193,997 |
| MFS Aggressive Growth Allocation Fund | 0.75% | 0.25% | 1.00% | 1.00% | 414,076 |
| Class C | |||||
| Distribution Fee Rate (d) | Service Fee Rate (d) | Total Distribution Plan (d) | Annual Effective Rate (e) | Distribution and Service Fee | |
| MFS Conservative Allocation Fund | 0.75% | 0.25% | 1.00% | 1.00% | $5,128,711 |
| MFS Moderate Allocation Fund | 0.75% | 0.25% | 1.00% | 1.00% | 7,988,305 |
| MFS Growth Allocation Fund | 0.75% | 0.25% | 1.00% | 1.00% | 6,703,705 |
| MFS Aggressive Growth Allocation Fund | 0.75% | 0.25% | 1.00% | 1.00% | 2,519,473 |
| Class R1 | |||||
| Distribution Fee Rate (d) | Service Fee Rate (d) | Total Distribution Plan (d) | Annual Effective Rate (e) | Distribution and Service Fee | |
| MFS Conservative Allocation Fund | 0.75% | 0.25% | 1.00% | 1.00% | $124,846 |
| MFS Moderate Allocation Fund | 0.75% | 0.25% | 1.00% | 1.00% | 256,604 |
| MFS Growth Allocation Fund | 0.75% | 0.25% | 1.00% | 1.00% | 200,164 |
| MFS Aggressive Growth Allocation Fund | 0.75% | 0.25% | 1.00% | 1.00% | 162,135 |
Table of Contents
| Class R2 | |||||
| Distribution Fee Rate (d) | Service Fee Rate (d) | Total Distribution Plan (d) | Annual Effective Rate (e) | Distribution and Service Fee | |
| MFS Conservative Allocation Fund | 0.25% | 0.25% | 0.50% | 0.50% | $276,442 |
| MFS Moderate Allocation Fund | 0.25% | 0.25% | 0.50% | 0.50% | 634,892 |
| MFS Growth Allocation Fund | 0.25% | 0.25% | 0.50% | 0.50% | 673,555 |
| MFS Aggressive Growth Allocation Fund | 0.25% | 0.25% | 0.50% | 0.50% | 304,690 |
| Class R3 | |||||
| Distribution Fee Rate (d) | Service Fee Rate (d) | Total Distribution Plan (d) | Annual Effective Rate (e) | Distribution and Service Fee | |
| MFS Conservative Allocation Fund | — | 0.25% | 0.25% | 0.25% | $263,979 |
| MFS Moderate Allocation Fund | — | 0.25% | 0.25% | 0.25% | 584,955 |
| MFS Growth Allocation Fund | — | 0.25% | 0.25% | 0.25% | 404,639 |
| MFS Aggressive Growth Allocation Fund | — | 0.25% | 0.25% | 0.25% | 245,748 |
| Class 529A | |||||
| Distribution Fee Rate (d) | Service Fee Rate (d) | Total Distribution Plan (d) | Annual Effective Rate (e) | Distribution and Service Fee | |
| MFS Conservative Allocation Fund | — | 0.25% | 0.25% | 0.24% | $415,994 |
| MFS Moderate Allocation Fund | — | 0.25% | 0.25% | 0.24% | 720,685 |
| MFS Growth Allocation Fund | — | 0.25% | 0.25% | 0.24% | 756,562 |
| MFS Aggressive Growth Allocation Fund | — | 0.25% | 0.25% | 0.24% | 458,202 |
| Class 529B | |||||
| Distribution Fee Rate (d) | Service Fee Rate (d) | Total Distribution Plan (d) | Annual Effective Rate (e) | Distribution and Service Fee | |
| MFS Conservative Allocation Fund | 0.75% | 0.25% | 1.00% | 0.23% | $9,665 |
| MFS Moderate Allocation Fund | 0.75% | 0.25% | 1.00% | 0.24% | 17,099 |
| MFS Growth Allocation Fund | 0.75% | 0.25% | 1.00% | 0.67% | 60,239 |
| MFS Aggressive Growth Allocation Fund | 0.75% | 0.25% | 1.00% | 1.00% | 27,412 |
| Class 529C | |||||
| Distribution Fee Rate (d) | Service Fee Rate (d) | Total Distribution Plan (d) | Annual Effective Rate (e) | Distribution and Service Fee | |
| MFS Conservative Allocation Fund | 0.75% | 0.25% | 1.00% | 0.99% | $376,271 |
| MFS Moderate Allocation Fund | 0.75% | 0.25% | 1.00% | 0.99% | 608,555 |
| MFS Growth Allocation Fund | 0.75% | 0.25% | 1.00% | 0.99% | 548,186 |
| MFS Aggressive Growth Allocation Fund | 0.75% | 0.25% | 1.00% | 0.99% | 218,574 |
Table of Contents
| MFS Conservative Allocation Fund | MFS Moderate Allocation Fund | MFS Growth Allocation Fund | MFS Aggressive Growth Allocation Fund | |
| Total Distribution and Service Fees | $12,038,184 | $21,926,675 | $19,513,331 | $7,199,952 |
| (d) | In accordance with the distribution plan for certain classes, each fund pays distribution and/or service fees equal to these annual percentage rates of each class’s average daily net assets. The distribution and service fee rates disclosed by class represent the current rates in effect at the end of the reporting period. Any rate changes, if applicable, are detailed below. |
| (e) | The annual effective rates represent actual fees incurred under the distribution plan for the year ended May 31, 2021 based on each class's average daily net assets. MFD has voluntarily agreed to rebate a portion of each class’s 0.25% service fee attributable to accounts for which there is no financial intermediary specified on the account except for accounts attributable to MFS or its affiliates’ seed money. For the year ended May 31, 2021, these rebates amounted to the following and are included in the reduction of total expenses in the Statements of Operations: |
| MFS Conservative Allocation Fund | MFS Moderate Allocation Fund | MFS Growth Allocation Fund | MFS Aggressive Growth Allocation Fund | |
| Class A | $4,254 | $21,103 | $17,173 | $8,376 |
| Class B | 220 | 608 | 674 | 370 |
| Class C | 511 | 1,174 | 1,927 | 489 |
| Class R2 | — | 306 | 254 | — |
| Class 529A | 21,907 | 26,462 | 29,489 | 19,682 |
| Class 529B | 501 | 361 | 567 | 93 |
| Class 529C | 3,081 | 3,702 | 5,162 | 2,043 |
| CDSC Imposed | MFS Conservative Allocation Fund | MFS Moderate Allocation Fund | MFS Growth Allocation Fund | MFS Aggressive Growth Allocation Fund |
| Class A | $52,840 | $46,824 | $24,189 | $12,231 |
| Class B | 30,309 | 56,539 | 69,450 | 32,499 |
| Class C | 52,072 | 72,143 | 82,445 | 50,072 |
| Class 529B | 1 | — | 1,657 | 3,373 |
| Class 529C | 1,735 | 471 | 624 | 430 |
| MFS Conservative Allocation Fund | MFS Moderate Allocation Fund | MFS Growth Allocation Fund | MFS Aggressive Growth Allocation Fund | |
| Class 529A | $83,199 | $144,137 | $151,313 | $91,621 |
| Class 529B | 1,978 | 3,530 | 4,424 | 1,370 |
| Class 529C | 18,811 | 30,426 | 27,408 | 10,926 |
| Total Program Manager Fees | $103,988 | $178,093 | $183,145 | $103,917 |
Table of Contents
| MFS Conservative Allocation Fund | MFS Moderate Allocation Fund | MFS Growth Allocation Fund | MFS Aggressive Growth Allocation Fund | |
| Percentage of average daily net assets | 0.0005% | 0.0003% | 0.0003% | 0.0008% |
| MFS Conservative Allocation Fund | MFS Moderate Allocation Fund | MFS Growth Allocation Fund | MFS Aggressive Growth Allocation Fund | |
| Purchases | $798,326,652 | $729,336,177 | $430,727,130 | $156,638,134 |
| Sales | $221,594,305 | $413,913,353 | $405,266,576 | $168,657,116 |
| MFS Conservative Allocation Fund | MFS Moderate Allocation Fund | ||||||||||
| Year ended 5/31/21 | Year ended 5/31/20 | Year ended 5/31/21 | Year ended 5/31/20 | ||||||||
| Shares | Amount | Shares | Amount | Shares | Amount | Shares | Amount | ||||
| Shares sold | |||||||||||
| Class A | 83,677,557 | $1,446,475,605 | 17,767,890 | $280,516,970 | 78,665,459 | $1,579,624,726 | 22,364,662 | $401,359,896 | |||
| Class B | 190,001 | 3,233,488 | 184,283 | 2,860,968 | 115,401 | 2,268,421 | 169,946 | 3,018,628 | |||
| Class C | 6,327,886 | 107,713,290 | 6,015,830 | 93,916,198 | 5,321,324 | 104,563,792 | 6,356,099 | 112,813,206 | |||
| Class I | 13,450,176 | 234,644,981 | 10,661,179 | 166,144,995 | 9,355,564 | 188,024,948 | 6,132,421 | 112,261,977 | |||
| Class R1 | 152,930 | 2,539,194 | 246,476 | 3,765,576 | 159,837 | 3,057,094 | 185,486 | 3,177,286 | |||
| Class R2 | 813,319 | 13,491,579 | 880,783 | 13,535,427 | 805,670 | 15,692,528 | 868,578 | 15,458,949 | |||
| Class R3 | 1,877,564 | 31,954,032 | 1,809,702 | 28,586,321 | 1,989,223 | 39,797,107 | 3,304,080 | 59,266,545 | |||
| Class R4 | 5,021,700 | 87,073,006 | 6,993,607 | 110,692,186 | 5,018,328 | 100,100,136 | 5,251,520 | 93,745,729 | |||
| Class 529A | 4,955,688 | 85,088,294 | 4,610,433 | 72,422,152 | 4,971,273 | 99,370,823 | 3,784,521 | 67,559,275 | |||
| Class 529B | 89,324 | 1,509,037 | 136,723 | 2,126,717 | 79,229 | 1,530,253 | 103,613 | 1,819,476 | |||
| Class 529C | 888,416 | 14,796,454 | 1,240,039 | 19,194,642 | 779,192 | 15,067,958 | 918,874 | 16,208,077 | |||
| 117,444,561 | $2,028,518,960 | 50,546,945 | $793,762,152 | 107,260,500 | $2,149,097,786 | 49,439,800 | $886,689,044 | ||||
Table of Contents
| MFS Conservative Allocation Fund − continued | MFS Moderate Allocation Fund − continued | ||||||||||
| Year ended 5/31/21 | Year ended 5/31/20 | Year ended 5/31/21 | Year ended 5/31/20 | ||||||||
| Shares | Amount | Shares | Amount | Shares | Amount | Shares | Amount | ||||
| Shares issued to shareholders in reinvestment of distributions | |||||||||||
| Class A | 3,051,241 | $52,694,334 | 2,861,638 | $45,731,722 | 6,988,603 | $140,232,546 | 7,607,124 | $140,320,952 | |||
| Class B | 59,958 | 1,034,598 | 129,578 | 2,074,171 | 194,570 | 3,886,545 | 374,146 | 6,872,822 | |||
| Class C | 566,520 | 9,653,969 | 904,422 | 14,308,836 | 1,109,702 | 21,962,015 | 1,860,008 | 33,869,829 | |||
| Class I | 645,564 | 11,241,482 | 717,871 | 11,557,477 | 636,413 | 12,952,356 | 595,405 | 11,125,090 | |||
| Class R1 | 15,981 | 266,691 | 23,125 | 358,308 | 41,814 | 807,113 | 57,763 | 1,027,258 | |||
| Class R2 | 84,307 | 1,409,470 | 128,515 | 1,996,686 | 226,997 | 4,449,260 | 307,835 | 5,557,880 | |||
| Class R3 | 173,580 | 2,964,915 | 228,714 | 3,623,914 | 432,998 | 8,602,082 | 697,097 | 12,752,047 | |||
| Class R4 | 390,178 | 6,717,455 | 429,329 | 6,851,960 | 473,673 | 9,467,492 | 530,307 | 9,754,679 | |||
| Class 529A | 267,095 | 4,577,057 | 329,809 | 5,239,784 | 532,887 | 10,629,811 | 601,671 | 11,038,896 | |||
| Class 529B | 6,597 | 111,071 | 9,525 | 149,646 | 13,160 | 257,543 | 16,440 | 298,340 | |||
| Class 529C | 41,595 | 700,523 | 78,863 | 1,235,764 | 80,214 | 1,569,238 | 152,735 | 2,748,684 | |||
| 5,302,616 | $91,371,565 | 5,841,389 | $93,128,268 | 10,731,031 | $214,816,001 | 12,800,531 | $235,366,477 | ||||
| Shares reacquired | |||||||||||
| Class A | (39,536,815) | $(683,679,633) | (15,749,875) | $(246,623,081) | (44,448,891) | $(887,456,254) | (26,943,541) | $(480,475,483) | |||
| Class B | (1,738,528) | (29,749,237) | (2,400,946) | (37,660,195) | (3,286,121) | (64,751,280) | (4,230,041) | (74,944,401) | |||
| Class C | (14,339,432) | (244,019,920) | (7,638,573) | (118,346,006) | (21,766,613) | (427,201,220) | (11,983,835) | (210,596,363) | |||
| Class I | (10,657,908) | (188,437,582) | (10,109,138) | (158,281,667) | (5,223,888) | (106,678,258) | (5,189,826) | (93,325,251) | |||
| Class R1 | (155,755) | (2,592,828) | (294,042) | (4,506,213) | (293,384) | (5,574,276) | (399,257) | (6,916,905) | |||
| Class R2 | (1,423,086) | (23,607,122) | (1,661,641) | (25,587,773) | (2,007,519) | (38,871,735) | (2,053,177) | (36,419,402) | |||
| Class R3 | (1,999,902) | (34,430,468) | (2,685,221) | (41,925,662) | (3,012,848) | (59,373,883) | (7,224,797) | (127,825,506) | |||
| Class R4 | (5,277,130) | (91,983,739) | (4,405,117) | (70,081,741) | (4,033,546) | (80,985,916) | (3,741,694) | (67,001,944) | |||
| Class 529A | (5,025,275) | (85,989,272) | (4,632,383) | (72,966,813) | (3,891,084) | (77,058,372) | (3,938,669) | (70,784,473) | |||
| Class 529B | (173,396) | (2,930,157) | (285,507) | (4,426,814) | (193,610) | (3,776,927) | (225,835) | (4,009,780) | |||
| Class 529C | (1,791,905) | (30,095,206) | (1,536,617) | (23,384,612) | (1,908,496) | (37,156,281) | (1,550,616) | (26,475,918) | |||
| (82,119,132) | $(1,417,515,164) | (51,399,060) | $(803,790,577) | (90,066,000) | $(1,788,884,402) | (67,481,288) | $(1,198,775,426) | ||||
| Net change | |||||||||||
| Class A | 47,191,983 | $815,490,306 | 4,879,653 | $79,625,611 | 41,205,171 | $832,401,018 | 3,028,245 | $61,205,365 | |||
| Class B | (1,488,569) | (25,481,151) | (2,087,085) | (32,725,056) | (2,976,150) | (58,596,314) | (3,685,949) | (65,052,951) | |||
| Class C | (7,445,026) | (126,652,661) | (718,321) | (10,120,972) | (15,335,587) | (300,675,413) | (3,767,728) | (63,913,328) | |||
| Class I | 3,437,832 | 57,448,881 | 1,269,912 | 19,420,805 | 4,768,089 | 94,299,046 | 1,538,000 | 30,061,816 | |||
| Class R1 | 13,156 | 213,057 | (24,441) | (382,329) | (91,733) | (1,710,069) | (156,008) | (2,712,361) | |||
| Class R2 | (525,460) | (8,706,073) | (652,343) | (10,055,660) | (974,852) | (18,729,947) | (876,764) | (15,402,573) | |||
| Class R3 | 51,242 | 488,479 | (646,805) | (9,715,427) | (590,627) | (10,974,694) | (3,223,620) | (55,806,914) | |||
| Class R4 | 134,748 | 1,806,722 | 3,017,819 | 47,462,405 | 1,458,455 | 28,581,712 | 2,040,133 | 36,498,464 | |||
| Class 529A | 197,508 | 3,676,079 | 307,859 | 4,695,123 | 1,613,076 | 32,942,262 | 447,523 | 7,813,698 | |||
| Class 529B | (77,475) | (1,310,049) | (139,259) | (2,150,451) | (101,221) | (1,989,131) | (105,782) | (1,891,964) | |||
| Class 529C | (861,894) | (14,598,229) | (217,715) | (2,954,206) | (1,049,090) | (20,519,085) | (479,007) | (7,519,157) | |||
| 40,628,045 | $702,375,361 | 4,989,274 | $83,099,843 | 27,925,531 | $575,029,385 | (5,240,957) | $(76,719,905) | ||||
Table of Contents
| MFS Growth Allocation Fund | MFS Aggressive Growth Allocation Fund | ||||||||||
| Year ended 5/31/21 | Year ended 5/31/20 | Year ended 5/31/21 | Year ended 5/31/20 | ||||||||
| Shares | Amount | Shares | Amount | Shares | Amount | Shares | Amount | ||||
| Shares sold | |||||||||||
| Class A | 45,574,531 | $1,082,172,000 | 16,964,557 | $351,755,022 | 12,430,207 | $342,558,924 | 6,359,443 | $148,247,342 | |||
| Class B | 56,069 | 1,336,063 | 44,425 | 941,621 | 20,272 | 550,222 | 17,042 | 395,307 | |||
| Class C | 3,663,134 | 85,105,771 | 5,543,612 | 112,797,221 | 1,955,754 | 52,396,964 | 2,494,103 | 56,373,562 | |||
| Class I | 6,365,083 | 149,445,578 | 6,498,049 | 137,930,128 | 3,428,900 | 95,136,620 | 2,896,996 | 69,705,103 | |||
| Class R1 | 92,886 | 2,099,857 | 142,203 | 2,848,859 | 68,390 | 1,809,935 | 65,885 | 1,483,465 | |||
| Class R2 | 677,036 | 15,531,206 | 734,076 | 14,782,580 | 318,116 | 8,524,662 | 475,221 | 10,970,235 | |||
| Class R3 | 1,103,194 | 25,785,668 | 1,343,534 | 28,086,686 | 709,801 | 18,941,318 | 933,537 | 21,625,472 | |||
| Class R4 | 3,410,735 | 80,319,352 | 3,818,312 | 79,388,651 | 1,935,164 | 53,219,042 | 2,266,309 | 53,105,070 | |||
| Class 529A | 3,279,153 | 77,721,062 | 2,766,213 | 57,070,560 | 1,454,160 | 39,949,038 | 1,377,747 | 31,542,770 | |||
| Class 529B | 32,218 | 743,694 | 45,724 | 934,652 | 2,342 | 60,140 | 1,982 | 47,983 | |||
| Class 529C | 360,613 | 8,239,780 | 470,627 | 9,556,769 | 125,658 | 3,311,732 | 211,713 | 4,895,956 | |||
| 64,614,652 | $1,528,500,031 | 38,371,332 | $796,092,749 | 22,448,764 | $616,458,597 | 17,099,978 | $398,392,265 | ||||
| Shares issued to shareholders in reinvestment of distributions | |||||||||||
| Class A | 5,336,898 | $127,872,067 | 6,473,770 | $141,322,366 | 1,433,328 | $39,918,176 | 1,713,317 | $43,089,927 | |||
| Class B | 131,353 | 3,134,080 | 284,043 | 6,169,440 | 45,607 | 1,250,988 | 78,166 | 1,942,426 | |||
| Class C | 746,071 | 17,547,597 | 1,366,359 | 29,281,075 | 275,380 | 7,462,793 | 374,645 | 9,197,543 | |||
| Class I | 522,310 | 12,639,904 | 459,961 | 10,132,946 | 242,661 | 6,879,449 | 255,451 | 6,534,435 | |||
| Class R1 | 25,837 | 593,487 | 42,155 | 883,981 | 19,342 | 515,458 | 25,880 | 625,251 | |||
| Class R2 | 195,388 | 4,568,165 | 282,283 | 6,018,278 | 75,116 | 2,044,619 | 109,794 | 2,702,021 | |||
| Class R3 | 250,553 | 5,945,631 | 379,073 | 8,199,347 | 129,214 | 3,567,584 | 187,082 | 4,665,815 | |||
| Class R4 | 455,262 | 10,889,864 | 526,301 | 11,468,094 | 204,634 | 5,715,428 | 224,951 | 5,671,012 | |||
| Class 529A | 463,894 | 11,012,842 | 584,853 | 12,655,147 | 236,207 | 6,526,394 | 292,752 | 7,307,079 | |||
| Class 529B | 10,585 | 249,168 | 18,791 | 403,450 | 3,136 | 84,850 | 5,944 | 145,860 | |||
| Class 529C | 61,653 | 1,428,497 | 125,394 | 2,647,073 | 23,673 | 630,413 | 46,481 | 1,122,978 | |||
| 8,199,804 | $195,881,302 | 10,542,983 | $229,181,197 | 2,688,298 | $74,596,152 | 3,314,463 | $83,004,347 | ||||
| Shares reacquired | |||||||||||
| Class A | (30,616,885) | $(720,826,930) | (21,047,313) | $(435,278,547) | (9,140,309) | $(247,127,536) | (5,991,736) | $(140,943,679) | |||
| Class B | (2,198,913) | (51,136,467) | (2,963,735) | (60,988,307) | (540,657) | (14,562,986) | (626,418) | (14,493,165) | |||
| Class C | (14,027,266) | (324,315,503) | (8,383,637) | (170,228,420) | (3,783,476) | (101,347,436) | (2,428,148) | (56,018,476) | |||
| Class I | (4,647,704) | (112,613,275) | (4,395,486) | (89,290,841) | (3,591,680) | (101,838,846) | (2,786,497) | (65,202,379) | |||
| Class R1 | (251,495) | (5,507,548) | (392,938) | (7,863,082) | (113,834) | (2,876,259) | (217,609) | (5,018,561) | |||
| Class R2 | (1,437,473) | (33,136,267) | (1,865,799) | (37,982,178) | (674,339) | (17,986,393) | (951,975) | (21,901,836) | |||
| Class R3 | (2,036,228) | (47,637,232) | (2,946,435) | (61,490,784) | (1,211,956) | (32,753,524) | (1,631,807) | (38,755,584) | |||
| Class R4 | (2,926,702) | (69,666,620) | (2,981,918) | (61,286,577) | (1,604,698) | (44,400,254) | (1,338,976) | (31,849,451) | |||
| Class 529A | (3,064,738) | (71,568,191) | (2,730,280) | (56,954,215) | (1,402,105) | (37,887,004) | (1,365,549) | (32,414,064) | |||
| Class 529B | (129,952) | �� (2,985,235) | (177,510) | (3,654,445) | (51,159) | (1,342,031) | (69,119) | (1,601,953) | |||
| Class 529C | (1,317,649) | (30,192,306) | (850,876) | (16,659,849) | (410,945) | (10,804,317) | (527,485) | (10,964,259) | |||
| (62,655,005) | $(1,469,585,574) | (48,735,927) | $(1,001,677,245) | (22,525,158) | $(612,926,586) | (17,935,319) | $(419,163,407) | ||||
Table of Contents
| MFS Growth Allocation Fund − continued | MFS Aggressive Growth Allocation Fund − continued | ||||||||||
| Year ended 5/31/21 | Year ended 5/31/20 | Year ended 5/31/21 | Year ended 5/31/20 | ||||||||
| Shares | Amount | Shares | Amount | Shares | Amount | Shares | Amount | ||||
| Net change | |||||||||||
| Class A | 20,294,544 | $489,217,137 | 2,391,014 | $57,798,841 | 4,723,226 | $135,349,564 | 2,081,024 | $50,393,590 | |||
| Class B | (2,011,491) | (46,666,324) | (2,635,267) | (53,877,246) | (474,778) | (12,761,776) | (531,210) | (12,155,432) | |||
| Class C | (9,618,061) | (221,662,135) | (1,473,666) | (28,150,124) | (1,552,342) | (41,487,679) | 440,600 | 9,552,629 | |||
| Class I | 2,239,689 | 49,472,207 | 2,562,524 | 58,772,233 | 79,881 | 177,223 | 365,950 | 11,037,159 | |||
| Class R1 | (132,772) | (2,814,204) | (208,580) | (4,130,242) | (26,102) | (550,866) | (125,844) | (2,909,845) | |||
| Class R2 | (565,049) | (13,036,896) | (849,440) | (17,181,320) | (281,107) | (7,417,112) | (366,960) | (8,229,580) | |||
| Class R3 | (682,481) | (15,905,933) | (1,223,828) | (25,204,751) | (372,941) | (10,244,622) | (511,188) | (12,464,297) | |||
| Class R4 | 939,295 | 21,542,596 | 1,362,695 | 29,570,168 | 535,100 | 14,534,216 | 1,152,284 | 26,926,631 | |||
| Class 529A | 678,309 | 17,165,713 | 620,786 | 12,771,492 | 288,262 | 8,588,428 | 304,950 | 6,435,785 | |||
| Class 529B | (87,149) | (1,992,373) | (112,995) | (2,316,343) | (45,681) | (1,197,041) | (61,193) | (1,408,110) | |||
| Class 529C | (895,383) | (20,524,029) | (254,855) | (4,456,007) | (261,614) | (6,862,172) | (269,291) | (4,945,325) | |||
| 10,159,451 | $254,795,759 | 178,388 | $23,596,701 | 2,611,904 | $78,128,163 | 2,479,122 | $62,233,205 | ||||
| MFS Conservative Allocation Fund | MFS Moderate Allocation Fund | MFS Growth Allocation Fund | MFS Aggressive Growth Allocation Fund | |
| Commitment Fee | $14,546 | $26,533 | $24,818 | $9,117 |
| Interest Expense | — | — | — | — |
Table of Contents
| MFS Conservative Allocation Fund | ||||||
| Affiliated Issuers | Beginning Value | Purchases | Sales Proceeds | Realized Gain (Loss) | Change in Unrealized Appreciation or Depreciation | Ending Value |
| MFS Commodity Strategy Fund | $59,529,980 | $6,008,920 | $9,112,139 | $(4,079,443) | $33,990,307 | $86,337,625 |
| MFS Emerging Markets Debt Fund | 91,489,415 | 28,062,830 | 3,203,848 | (103,593) | 5,764,810 | 122,009,614 |
| MFS Emerging Markets Debt Local Currency Fund (a) | 62,105,211 | 17,751,660 | 1,858,881 | (331,176) | 5,810,683 | 83,477,497 |
| MFS Global Opportunistic Bond Fund | 148,203,673 | 79,209,826 | 62,641 | (3,713) | 3,867,263 | 231,214,408 |
| MFS Global Real Estate Fund | 61,198,206 | 7,983,046 | 7,255,876 | 350,780 | 21,985,271 | 84,261,427 |
| MFS Government Securities Fund | 286,218,916 | 135,459,853 | 229,293 | (2,758) | (12,718,292) | 408,728,426 |
| MFS Growth Fund | 187,108,696 | 37,387,576 | 33,005,135 | 8,848,254 | 44,928,163 | 245,267,554 |
| MFS High Income Fund | 150,918,431 | 44,985,760 | 1,976,773 | (29,040) | 8,909,846 | 202,808,224 |
| MFS Inflation-Adjusted Bond Fund | 292,583,981 | 103,659,131 | 323,979 | (1,109) | 16,602,860 | 412,520,884 |
| MFS Institutional Money Market Portfolio | 305 | 271,912,936 | 263,084,536 | (267) | — | 8,828,438 |
| MFS International Growth Fund | 61,476,483 | 7,150,831 | 7,800,140 | 671,425 | 21,261,608 | 82,760,207 |
| MFS International Intrinsic Value Fund | 62,344,955 | 13,023,560 | 7,141,288 | 556,993 | 13,013,378 | 81,797,598 |
| MFS International Large Cap Value Fund | — | 19,808,440 | — | — | 287,638 | 20,096,078 |
| MFS Limited Maturity Fund | 294,273,570 | 111,609,362 | 357,467 | (1,842) | 4,486,600 | 410,010,223 |
| MFS Mid Cap Growth Fund | 128,445,824 | 16,240,196 | 21,896,879 | 4,343,985 | 34,159,656 | 161,292,782 |
| MFS Mid Cap Value Fund | 126,723,349 | 9,133,195 | 32,095,054 | 8,548,689 | 55,544,820 | 167,854,999 |
| MFS New Discovery Fund | 32,669,315 | 5,694,880 | 9,054,949 | 1,749,659 | 9,722,537 | 40,781,442 |
| MFS New Discovery Value Fund | 31,869,927 | 3,944,285 | 12,935,972 | 4,276,530 | 15,490,973 | 42,645,743 |
| MFS Research Fund | 186,667,819 | 30,523,706 | 25,866,830 | 2,429,091 | 54,788,215 | 248,542,001 |
| MFS Research International Fund | 124,549,084 | 14,819,584 | 16,790,134 | 1,088,016 | 43,234,140 | 166,900,690 |
| MFS Total Return Bond Fund | 444,742,536 | 172,426,879 | 323,811 | (3,448) | (1,816,181) | 615,025,975 |
| MFS Value Fund | 185,767,111 | 29,851,289 | 30,303,215 | 3,260,367 | 64,500,027 | 253,075,579 |
| $3,018,886,787 | $1,166,647,745 | $484,678,840 | $31,567,400 | $443,814,322 | $4,176,237,414 | |
Table of Contents
| MFS Conservative Allocation Fund - continued | ||
| Affiliated Issuers | Dividend Income | Capital Gain Distributions |
| MFS Commodity Strategy Fund | $709,594 | $— |
| MFS Emerging Markets Debt Fund | 4,494,476 | — |
| MFS Emerging Markets Debt Local Currency Fund (a) | 1,694,430 | — |
| MFS Global Opportunistic Bond Fund | 5,597,639 | 1,106,888 |
| MFS Global Real Estate Fund | 798,787 | — |
| MFS Government Securities Fund | 6,370,264 | — |
| MFS Growth Fund | — | 7,893,428 |
| MFS High Income Fund | 8,559,088 | — |
| MFS Inflation-Adjusted Bond Fund | 4,336,614 | — |
| MFS Institutional Money Market Portfolio | 4,477 | — |
| MFS International Growth Fund | 615,339 | — |
| MFS International Intrinsic Value Fund | 567,421 | 3,519,290 |
| MFS International Large Cap Value Fund | — | — |
| MFS Limited Maturity Fund | 7,606,278 | — |
| MFS Mid Cap Growth Fund | — | 1,211,229 |
| MFS Mid Cap Value Fund | 1,730,680 | — |
| MFS New Discovery Fund | 1,431,092 | 2,000,846 |
| MFS New Discovery Value Fund | 405,788 | 386,190 |
| MFS Research Fund | 2,170,855 | 9,633,819 |
| MFS Research International Fund | 1,599,738 | — |
| MFS Total Return Bond Fund | 15,149,308 | 693,703 |
| MFS Value Fund | 3,774,858 | 2,350,517 |
| $67,616,726 | $28,795,910 | |
Table of Contents
| MFS Moderate Allocation Fund | ||||||
| Affiliated Issuers | Beginning Value | Purchases | Sales Proceeds | Realized Gain (Loss) | Change in Unrealized Appreciation or Depreciation | Ending Value |
| MFS Commodity Strategy Fund | $153,041,949 | $14,766,209 | $18,927,166 | $(14,752,332) | $91,974,780 | $226,103,440 |
| MFS Emerging Markets Debt Fund | 161,665,039 | 36,456,424 | 1,711,874 | (45,496) | 10,024,648 | 206,388,741 |
| MFS Emerging Markets Debt Local Currency Fund (a) | 109,663,005 | 20,709,068 | 1,177,531 | (234,105) | 9,672,164 | 138,632,601 |
| MFS Emerging Markets Equity Fund | — | 8,897,781 | — | — | 280,481 | 9,178,262 |
| MFS Global Opportunistic Bond Fund | 258,110,788 | 75,481,792 | 613,349 | (36,627) | 7,185,167 | 340,127,771 |
| MFS Global Real Estate Fund | 161,264,343 | 8,410,629 | 4,575,915 | 51,753 | 57,478,518 | 222,629,328 |
| MFS Government Securities Fund | 491,434,310 | 210,044,899 | 835,805 | (9,060) | (21,103,595) | 679,530,749 |
| MFS Growth Fund | 458,132,759 | 41,246,121 | 51,810,562 | 30,323,123 | 93,723,010 | 571,614,451 |
| MFS High Income Fund | 268,726,372 | 58,148,548 | 2,134,731 | (93,590) | 15,542,281 | 340,188,880 |
| MFS Inflation-Adjusted Bond Fund | 364,239,717 | 100,248,847 | 1,198,006 | (3,461) | 20,204,172 | 483,491,269 |
| MFS Institutional Money Market Portfolio | 3,118,760 | 233,375,922 | 233,102,080 | (591) | — | 3,392,011 |
| MFS International Growth Fund | 165,736,994 | 7,649,118 | 18,694,190 | 3,904,110 | 52,891,546 | 211,487,578 |
| MFS International Intrinsic Value Fund | 167,665,930 | 19,855,515 | 12,606,857 | 3,465,764 | 31,874,055 | 210,254,407 |
| MFS International Large Cap Value Fund | — | 17,792,810 | — | — | 270,208 | 18,063,018 |
| MFS International New Discovery Fund | 57,391,015 | 5,145,335 | 6,635,628 | 682,179 | 13,670,499 | 70,253,400 |
| MFS Mid Cap Growth Fund | 413,640,415 | 24,525,056 | 73,027,965 | 43,149,102 | 73,768,242 | 482,054,850 |
| MFS Mid Cap Value Fund | 396,554,349 | 12,394,735 | 70,082,084 | 17,772,726 | 175,356,596 | 531,996,322 |
| MFS New Discovery Fund | 92,042,491 | 12,714,708 | 31,103,494 | 7,548,660 | 22,176,728 | 103,379,093 |
| MFS New Discovery Value Fund | 86,274,988 | 5,693,716 | 25,259,689 | 7,216,781 | 43,079,632 | 117,005,428 |
| MFS Research Fund | 451,809,353 | 29,714,015 | 28,729,297 | 5,551,617 | 125,397,945 | 583,743,633 |
| MFS Research International Fund | 333,151,254 | 14,124,492 | 34,502,125 | 5,625,074 | 108,452,045 | 426,850,740 |
| MFS Total Return Bond Fund | 416,705,010 | 139,683,966 | 755,337 | (8,707) | (873,177) | 554,751,755 |
| MFS Value Fund | 440,415,562 | 33,860,436 | 29,531,748 | 2,352,007 | 152,253,253 | 599,349,510 |
| $5,450,784,403 | $1,130,940,142 | $647,015,433 | $112,458,927 | $1,083,299,198 | $7,130,467,237 | |
Table of Contents
| MFS Moderate Allocation Fund - continued | ||
| Affiliated Issuers | Dividend Income | Capital Gain Distributions |
| MFS Commodity Strategy Fund | $1,793,041 | $— |
| MFS Emerging Markets Debt Fund | 7,646,900 | — |
| MFS Emerging Markets Debt Local Currency Fund (a) | 2,778,463 | — |
| MFS Emerging Markets Equity Fund | — | — |
| MFS Global Opportunistic Bond Fund | 9,364,725 | 1,846,486 |
| MFS Global Real Estate Fund | 2,038,542 | — |
| MFS Government Securities Fund | 10,759,712 | — |
| MFS Growth Fund | — | 17,879,044 |
| MFS High Income Fund | 14,592,065 | — |
| MFS Inflation-Adjusted Bond Fund | 5,057,191 | — |
| MFS Institutional Money Market Portfolio | 3,836 | — |
| MFS International Growth Fund | 1,578,356 | — |
| MFS International Intrinsic Value Fund | 1,451,239 | 9,000,942 |
| MFS International Large Cap Value Fund | — | — |
| MFS International New Discovery Fund | 320,187 | 2,272,391 |
| MFS Mid Cap Growth Fund | — | 3,693,019 |
| MFS Mid Cap Value Fund | 5,331,631 | — |
| MFS New Discovery Fund | 3,811,060 | 5,328,335 |
| MFS New Discovery Value Fund | 1,074,962 | 1,023,045 |
| MFS Research Fund | 4,974,660 | 22,076,550 |
| MFS Research International Fund | 4,106,126 | — |
| MFS Total Return Bond Fund | 13,683,749 | 609,784 |
| MFS Value Fund | 8,723,432 | 5,412,407 |
| $99,089,877 | $69,142,003 | |
Table of Contents
| MFS Growth Allocation Fund | ||||||
| Affiliated Issuers | Beginning Value | Purchases | Sales Proceeds | Realized Gain (Loss) | Change in Unrealized Appreciation or Depreciation | Ending Value |
| MFS Commodity Strategy Fund | $175,933,286 | $26,999,591 | $19,960,903 | $(17,358,563) | $110,927,974 | $276,541,385 |
| MFS Emerging Markets Debt Fund | 141,568,155 | 37,383,359 | 526,527 | (11,075) | 8,835,597 | 187,249,509 |
| MFS Emerging Markets Debt Local Currency Fund (a) | 95,931,094 | 20,834,215 | 32,958 | 4,351 | 8,387,607 | 125,124,309 |
| MFS Emerging Markets Equity Fund | 46,969,701 | 5,250,385 | 7,400,160 | 698,188 | 20,792,271 | 66,310,385 |
| MFS Global Opportunistic Bond Fund | 90,265,356 | 33,726,348 | 469,804 | (47,221) | 2,528,504 | 126,003,183 |
| MFS Global Real Estate Fund | 189,462,950 | 18,595,040 | 5,640,461 | 129,807 | 69,707,899 | 272,255,235 |
| MFS Growth Fund | 560,267,252 | 59,541,073 | 59,418,631 | 30,310,427 | 124,522,714 | 715,222,835 |
| MFS High Income Fund | 238,105,939 | 61,476,716 | 2,388,594 | (121,919) | 14,018,046 | 311,090,188 |
| MFS Inflation-Adjusted Bond Fund | 237,077,495 | 66,130,918 | 1,635,838 | 1,368 | 13,035,987 | 314,609,930 |
| MFS Institutional Money Market Portfolio | 10,710,743 | 192,361,798 | 195,083,177 | (227) | (636) | 7,988,501 |
| MFS International Growth Fund | 243,949,580 | 9,667,793 | 17,108,337 | 3,331,451 | 82,291,058 | 322,131,545 |
| MFS International Intrinsic Value Fund | 246,627,979 | 29,035,495 | 9,548,297 | 1,962,522 | 51,175,416 | 319,253,115 |
| MFS International Large Cap Value Fund | — | 8,194,645 | — | — | 118,943 | 8,313,588 |
| MFS International New Discovery Fund | 102,117,400 | 8,284,690 | 8,077,430 | 43,542 | 25,958,379 | 128,326,581 |
| MFS Mid Cap Growth Fund | 475,689,267 | 22,765,902 | 70,906,488 | 44,177,654 | 91,579,488 | 563,305,823 |
| MFS Mid Cap Value Fund | 453,444,816 | 13,356,434 | 72,161,993 | 20,228,481 | 205,252,508 | 620,120,246 |
| MFS New Discovery Fund | 109,396,810 | 14,557,021 | 34,410,075 | 7,714,623 | 28,135,519 | 125,393,898 |
| MFS New Discovery Value Fund | 102,589,068 | 5,260,807 | 27,636,687 | 7,994,330 | 52,663,434 | 140,870,952 |
| MFS Research Fund | 404,211,077 | 35,182,065 | 19,436,549 | 2,499,272 | 117,006,831 | 539,462,696 |
| MFS Research International Fund | 342,285,426 | 12,844,130 | 16,830,583 | 1,239,424 | 119,314,774 | 458,853,171 |
| MFS Total Return Bond Fund | 136,634,599 | 50,344,303 | 662,971 | (4,588) | (405,540) | 185,905,803 |
| MFS Value Fund | 538,476,956 | 47,222,254 | 31,013,293 | 2,222,752 | 191,281,915 | 748,190,584 |
| $4,941,714,949 | $779,014,982 | $600,349,756 | $105,014,599 | $1,337,128,688 | $6,562,523,462 | |
| Affiliated Issuers | Dividend Income | Capital Gain Distributions |
| MFS Commodity Strategy Fund | $2,169,112 | $— |
| MFS Emerging Markets Debt Fund | 6,929,864 | — |
| MFS Emerging Markets Debt Local Currency Fund (a) | 2,539,314 | — |
| MFS Emerging Markets Equity Fund | 490,580 | — |
| MFS Global Opportunistic Bond Fund | 3,389,735 | 666,659 |
| MFS Global Real Estate Fund | 2,469,105 | — |
| MFS Growth Fund | — | 22,334,512 |
| MFS High Income Fund | 13,255,558 | — |
| MFS Inflation-Adjusted Bond Fund | 3,270,708 | — |
| MFS Institutional Money Market Portfolio | 7,952 | — |
| MFS International Growth Fund | 2,389,879 | — |
| MFS International Intrinsic Value Fund | 2,202,154 | 13,658,302 |
| MFS International Large Cap Value Fund | — | — |
| MFS International New Discovery Fund | 581,415 | 4,126,353 |
| MFS Mid Cap Growth Fund | — | 4,294,715 |
| MFS Mid Cap Value Fund | 6,206,882 | — |
| MFS New Discovery Fund | 4,580,195 | 6,403,681 |
| MFS New Discovery Value Fund | 1,299,419 | 1,236,663 |
| MFS Research Fund | 4,520,081 | 20,059,220 |
| MFS Research International Fund | 4,346,463 | — |
| MFS Total Return Bond Fund | 4,641,024 | 206,710 |
| MFS Value Fund | 10,897,815 | 6,759,936 |
| $76,187,255 | $79,746,751 | |
Table of Contents
| MFS Aggressive Growth Allocation Fund | ||||||
| Affiliated Issuers | Beginning Value | Purchases | Sales Proceeds | Realized Gain (Loss) | Change in Unrealized Appreciation or Depreciation | Ending Value |
| MFS Commodity Strategy Fund | $84,988,725 | $11,655,502 | $7,481,910 | $(5,224,586) | $49,495,297 | $133,433,028 |
| MFS Emerging Markets Equity Fund | 34,385,841 | 5,945,715 | 4,532,351 | 550,701 | 15,727,398 | 52,077,304 |
| MFS Global Real Estate Fund | 88,022,789 | 11,931,472 | 2,615,308 | 51,110 | 32,894,533 | 130,284,596 |
| MFS Growth Fund | 250,234,867 | 28,966,070 | 26,797,750 | 14,151,360 | 55,917,585 | 322,472,132 |
| MFS Institutional Money Market Portfolio | 2,388,590 | 79,280,901 | 79,623,232 | (146) | — | 2,046,113 |
| MFS International Growth Fund | 146,698,029 | 11,751,603 | 8,858,756 | 663,695 | 51,791,958 | 202,046,529 |
| MFS International Intrinsic Value Fund | 151,009,489 | 24,913,966 | 8,666,823 | 827,360 | 31,822,732 | 199,906,724 |
| MFS International Large Cap Value Fund | — | 10,215,783 | — | — | 192,988 | 10,408,771 |
| MFS International New Discovery Fund | 74,470,724 | 8,906,109 | 2,993,812 | 8,876 | 19,742,573 | 100,134,470 |
| MFS Mid Cap Growth Fund | 195,731,038 | 14,436,469 | 24,890,058 | 14,192,481 | 43,337,815 | 242,807,745 |
| MFS Mid Cap Value Fund | 182,897,369 | 10,465,468 | 26,528,229 | 4,260,975 | 90,576,328 | 261,671,911 |
| MFS New Discovery Fund | 49,897,687 | 8,265,814 | 14,279,015 | 3,009,518 | 14,133,668 | 61,027,672 |
| MFS New Discovery Value Fund | 45,827,260 | 4,708,616 | 12,700,578 | 2,441,319 | 26,210,011 | 66,486,628 |
| MFS Research Fund | 168,351,627 | 21,036,949 | 7,114,242 | 485,426 | 50,711,326 | 233,471,086 |
| MFS Research International Fund | 146,932,679 | 10,499,365 | 5,981,089 | 117,226 | 52,629,456 | 204,197,637 |
| MFS Value Fund | 235,612,831 | 31,455,256 | 15,217,196 | 1,027,750 | 85,733,755 | 338,612,396 |
| $1,857,449,545 | $294,435,058 | $248,280,349 | $36,563,065 | $620,917,423 | $2,561,084,742 | |
| Affiliated Issuers | Dividend Income | Capital Gain Distributions |
| MFS Commodity Strategy Fund | $1,040,648 | $— |
| MFS Emerging Markets Equity Fund | 371,264 | — |
| MFS Global Real Estate Fund | 1,184,422 | — |
| MFS Growth Fund | — | 10,163,842 |
| MFS Institutional Money Market Portfolio | 1,185 | — |
| MFS International Growth Fund | 1,460,299 | — |
| MFS International Intrinsic Value Fund | 1,350,617 | 8,376,863 |
| MFS International Large Cap Value Fund | — | — |
| MFS International New Discovery Fund | 441,723 | 3,134,947 |
| MFS Mid Cap Growth Fund | — | 1,807,517 |
| MFS Mid Cap Value Fund | 2,583,729 | — |
| MFS New Discovery Fund | 2,136,415 | 2,986,974 |
| MFS New Discovery Value Fund | 592,389 | 563,778 |
| MFS Research Fund | 1,940,688 | 8,612,390 |
| MFS Research International Fund | 1,898,995 | — |
| MFS Value Fund | 4,837,194 | 3,031,328 |
| $19,839,568 | $38,677,639 | |
| (a) | Amounts reflect the impact of a return of capital distribution adjustment which has the effect of reducing dividend income and increasing realized gain (loss) and/or change in unrealized appreciation (depreciation). |
Table of Contents

July 16, 2021
Table of Contents
| Name, Age | Position(s) Held with Fund | Trustee/Officer Since(h) | Number of MFS Funds overseen by the Trustee | Principal Occupations During the Past Five Years | Other Directorships During the Past Five Years (j) | |||||
| INTERESTED TRUSTEES | ||||||||||
| Robert J. Manning (k) (age 57) | Trustee | February 2004 | 135 | Massachusetts Financial Services Company, Non-Executive Chairman (since January 2021); Director; Chairman of the Board; Executive Chairman (January 2017-2020); Co-Chief Executive Officer (2015-2016) | N/A | |||||
| Michael W. Roberge (k) (age 54) | Trustee | January 2021 | 135 | Massachusetts Financial Services Company, Chairman (since January 2021); Chief Executive Officer (since January 2017); Director; President (until December 2018); Chief Investment Officer (until December 2018); Co-Chief Executive Officer (until December 2016) | N/A | |||||
| INDEPENDENT TRUSTEES | ||||||||||
| John P. Kavanaugh (age 66) | Trustee and Chair of Trustees | January 2009 | 135 | Private investor | N/A | |||||
| Steven E. Buller (age 69) | Trustee | February 2014 | 135 | Private investor | N/A | |||||
| John A. Caroselli (age 67) | Trustee | March 2017 | 135 | Private investor; JC Global Advisors, LLC (management consulting), President (since 2015) | N/A | |||||
| Maureen R. Goldfarb (age 66) | Trustee | January 2009 | 135 | Private investor | N/A | |||||
| Peter D. Jones (age 65) | Trustee | January 2019 | 135 | Private investor | N/A | |||||
| James W. Kilman, Jr. (age 60) | Trustee | January 2019 | 135 | Burford Capital Limited (finance and investment management), Senior Advisor (since May 3, 2021), Chief Financial Officer (2019 - May 2, 2021); KielStrand Capital LLC (family office), Chief Executive Officer (since 2016); Morgan Stanley & Co. (financial services), Vice Chairman of Investment Banking, Co-Head of Diversified Financials Coverage – Financial Institutions Investment Banking Group (until 2016) | Alpha-En Corporation, Director (2016-2019) | |||||
| Clarence Otis, Jr. (age 65) | Trustee | March 2017 | 135 | Private investor | VF Corporation, Director; Verizon Communications, Inc., Director; The Travelers Companies, Director | |||||
| Maryanne L. Roepke (age 65) | Trustee | May 2014 | 135 | Private investor | N/A | |||||
Table of Contents
| Name, Age | Position(s) Held with Fund | Trustee/Officer Since(h) | Number of MFS Funds overseen by the Trustee | Principal Occupations During the Past Five Years | Other Directorships During the Past Five Years (j) | |||||
| Laurie J. Thomsen (age 63) | Trustee | March 2005 | 135 | Private investor | The Travelers Companies, Director; Dycom Industries, Inc., Director |
| Name, Age | Position(s) Held with Fund | Trustee/Officer Since(h) | Number of MFS Funds for which the Person is an Officer | Principal Occupations During the Past Five Years | ||||
| OFFICERS | ||||||||
| Christopher R. Bohane (k) (age 47) | Assistant Secretary and Assistant Clerk | July 2005 | 135 | Massachusetts Financial Services Company, Senior Vice President and Associate General Counsel | ||||
| Kino Clark (k) (age 53) | Assistant Treasurer | January 2012 | 135 | Massachusetts Financial Services Company, Vice President | ||||
| John W. Clark, Jr. (k) (age 54) | Assistant Treasurer | April 2017 | 135 | Massachusetts Financial Services Company, Vice President (since March 2017); Deutsche Bank (financial services), Department Head - Treasurer's Office (until February 2017) | ||||
| Thomas H. Connors (k) (age 61) | Assistant Secretary and Assistant Clerk | September 2012 | 135 | Massachusetts Financial Services Company, Vice President and Senior Counsel | ||||
| David L. DiLorenzo (k) (age 52) | President | July 2005 | 135 | Massachusetts Financial Services Company, Senior Vice President | ||||
| Heidi W. Hardin (k) (age 53) | Secretary and Clerk | April 2017 | 135 | Massachusetts Financial Services Company, Executive Vice President and General Counsel (since March 2017); Harris Associates (investment management), General Counsel (until January 2017) | ||||
| Brian E. Langenfeld (k) (age 48) | Assistant Secretary and Assistant Clerk | June 2006 | 135 | Massachusetts Financial Services Company, Vice President and Senior Counsel | ||||
| Amanda S. Mooradian (k) (age 42) | Assistant Secretary and Assistant Clerk | September 2018 | 135 | Massachusetts Financial Services Company, Assistant Vice President and Senior Counsel | ||||
| Susan A. Pereira (k) (age 50) | Assistant Secretary and Assistant Clerk | July 2005 | 135 | Massachusetts Financial Services Company, Vice President and Assistant General Counsel | ||||
| Kasey L. Phillips (k) (age 50) | Assistant Treasurer | September 2012 | 135 | Massachusetts Financial Services Company, Vice President | ||||
| Matthew A. Stowe (k) (age 46) | Assistant Secretary and Assistant Clerk | October 2014 | 135 | Massachusetts Financial Services Company, Vice President and Assistant General Counsel | ||||
| Martin J. Wolin (k) (age 53) | Chief Compliance Officer | July 2015 | 135 | Massachusetts Financial Services Company, Senior Vice President and Chief Compliance Officer | ||||
| James O. Yost (k) (age 61) | Treasurer | September 1990 | 135 | Massachusetts Financial Services Company, Senior Vice President |
| (h) | Date first appointed to serve as Trustee/Officer of an MFS Fund. Each Trustee has served continuously since appointment unless indicated otherwise. For the period from December 15, 2004 until February 22, 2005, Mr. Manning served as Advisory Trustee. From January 2012 through December 2016, Messrs. DiLorenzo and Yost served as Treasurer and Deputy Treasurer of the Funds, respectively. |
| (j) | Directorships or trusteeships of companies required to report to the Securities and Exchange Commission (i.e., “public companies”). |
| (k) | “Interested person” of the Trust within the meaning of the Investment Company Act of 1940 (referred to as the 1940 Act), which is the principal federal law governing investment companies like the fund, as a result of a position with MFS. The address of MFS is 111 Huntington Avenue, Boston, Massachusetts 02199-7618. |
Table of Contents
| Investment Adviser | Custodian |
| Massachusetts Financial Services Company 111 Huntington Avenue Boston, MA 02199-7618 | State Street Bank and Trust Company 1 Lincoln Street Boston, MA 02111-2900 |
| Distributor | Independent Registered Public Accounting Firm |
| MFS Fund Distributors, Inc. 111 Huntington Avenue Boston, MA 02199-7618 | Ernst & Young LLP 200 Clarendon Street Boston, MA 02116 |
| Portfolio Manager(s) | |
| Joseph Flaherty Natalie Shapiro |
Table of Contents
Table of Contents
| Capital Gains | |
| MFS Conservative Allocation Fund | $48,547,000 |
| MFS Moderate Allocation Fund | 169,609,000 |
| MFS Growth Allocation Fund | 183,907,000 |
| MFS Aggressive Growth Allocation Fund | 80,319,000 |
| Dividends Received Deductions | |
| MFS Conservative Allocation Fund | 11.29% |
| MFS Moderate Allocation Fund | 18.18% |
| MFS Growth Allocation Fund | 34.51% |
| MFS Aggressive Growth Allocation Fund | 56.98% |
Table of Contents
| FACTS | WHAT DOES MFS DO WITH YOUR PERSONAL INFORMATION? |
| Why? | Financial companies choose how they share your personal information. Federal law gives consumers the right to limit some but not all sharing. Federal law also requires us to tell you how we collect, share, and protect your personal information. Please read this notice carefully to understand what we do. |
| What? | The types of personal information we collect and share depend on the product or service you have with us. This information can include: |
| • Social Security number and account balances | |
| • Account transactions and transaction history | |
| • Checking account information and wire transfer instructions | |
| When you are no longer our customer, we continue to share your information as described in this notice. |
| How? | All financial companies need to share customers' personal information to run their everyday business. In the section below, we list the reasons financial companies can share their customers' personal information; the reasons MFS chooses to share; and whether you can limit this sharing. |
| Reasons we can share your personal information | Does MFS share? | Can you limit this sharing? |
| For our everyday business purposes – such as to process your transactions, maintain your account(s), respond to court orders and legal investigations, or report to credit bureaus | Yes | No |
| For our marketing purposes – to offer our products and services to you | No | We don't share |
| For joint marketing with other financial companies | No | We don't share |
| For our affiliates' everyday business purposes – information about your transactions and experiences | No | We don't share |
| For our affiliates' everyday business purposes – information about your creditworthiness | No | We don't share |
| For nonaffiliates to market to you | No | We don't share |
| Questions? | Call 800-225-2606 or go to mfs.com. |

Table of Contents
| Who we are | |
| Who is providing this notice? | MFS Funds, MFS Investment Management, MFS Institutional Advisors, Inc., and MFS Heritage Trust Company. |
| What we do | |
| How does MFS protect my personal information? | To protect your personal information from unauthorized access and use, we use security measures that comply with federal law. These measures include procedural, electronic, and physical safeguards for the protection of the personal information we collect about you. |
| How does MFS collect my personal information? | We collect your personal information, for example, when you |
| • open an account or provide account information | |
| • direct us to buy securities or direct us to sell your securities | |
| • make a wire transfer | |
| We also collect your personal information from others, such as credit bureaus, affiliates, or other companies. | |
| Why can't I limit all sharing? | Federal law gives you the right to limit only |
| • sharing for affiliates' everyday business purposes – information about your creditworthiness | |
| • affiliates from using your information to market to you | |
| • sharing for nonaffiliates to market to you | |
| State laws and individual companies may give you additional rights to limit sharing. | |
| Definitions | |
| Affiliates | Companies related by common ownership or control. They can be financial and nonfinancial companies. |
| • MFS does not share personal information with affiliates, except for everyday business purposes as described on page one of this notice. | |
| Nonaffiliates | Companies not related by common ownership or control. They can be financial and nonfinancial companies. |
| • MFS does not share with nonaffiliates so they can market to you. | |
| Joint marketing | A formal agreement between nonaffiliated financial companies that together market financial products or services to you. |
| • MFS doesn't jointly market. | |
| Other important information |
| If you own an MFS product or receive an MFS service in the name of a third party such as a bank or broker-dealer, their privacy policy may apply to you instead of ours. |
Table of Contents
Table of Contents
Table of Contents

Table of Contents
Annual Report
May 31, 2021

MFS® Managed Wealth Fund

MGW-ANN
Table of Contents
MFS® Managed Wealth Fund
| Contact information | back cover |
The report is prepared for the general information of shareholders. It is authorized for distribution to prospective investors only when preceded or accompanied by a current prospectus.
NOT FDIC INSURED • MAY LOSE VALUE • NO BANK GUARANTEE
Table of Contents

Dear Shareholders:
Markets have experienced dramatic swings since the coronavirus pandemic brought the global economy to a standstill for several months early in 2020. While the speedy
development of vaccines brightened the economic and market outlook, uncertainty remains as new variants of the virus appear and questions persist over how fast vaccines can be made widely available in the developing world.
Global central banks have taken aggressive steps to cushion the economic and market fallout related to the virus, and governments are deploying unprecedented levels of fiscal support. Having passed a $1.9 trillion stimulus package in March, the U.S. Congress could approve additional stimulus later this year, some of it focused on infrastructure. Along with extraordinary government expenditures, pent-up consumer demand fueled a surge in economic activity as coronavirus restrictions were eased, pushing up inflation, at least temporarily. Markets reacted by pushing up
yields on global government bonds, though some of the rate rise has since been corrected.
A spirited debate is underway among investors over whether the current price pressures will persist or prove to be temporary, caused by pandemic-induced bottlenecks. The policy measures put in place to counteract the pandemic’s effects have helped build a supportive environment and are encouraging economic recovery; however, if markets disconnect from fundamentals, they can sow the seeds of instability. As such, recent dramatic increases in speculative trading in cryptocurrencies, special purpose acquisition companies (SPACs), and the like bear watching.
In the aftermath of the crisis, we could see societal changes as households, businesses, and governments adjust to a new reality, and any such alterations could affect the investment landscape. For investors, events such as the COVID-19 outbreak demonstrate the importance of having a deep understanding of company fundamentals, and we have built our global research platform to do just that.
At MFS®, we put our clients’ assets to work responsibly by carefully navigating the increasing complexity of global markets and economies. Guided by our long-term philosophy and adhering to our commitment to sustainable investing, we tune out the noise and aim to uncover what we believe are the best, most durable investment opportunities in the market. Our unique global investment platform combines collective expertise, long-term discipline, and thoughtful risk management to create sustainable value for investors.
Respectfully,

Michael W. Roberge
Chief Executive Officer
MFS Investment Management
July 16, 2021
The opinions expressed in this letter are subject to change and may not be relied upon for investment advice. No forecasts can be guaranteed.
1
Table of Contents
Portfolio structure
| Active Security Selection (a) | Derivative Overlay Positions (b) | Net Market Exposure (c) | ||||||||||||
| Strategic Allocation | MFS Institutional International Equity Fund | 30.3% | ||||||||||||
| MFS Growth Fund | 30.3% | |||||||||||||
| MFS Value Fund | 30.3% | |||||||||||||
| Market Exposure Overlay | Mini Russell 1000 Growth Index Future JUN 18 21 | (26.4)% | ||||||||||||
| Mini MSCI EAFE Index Future JUN 18 21 | (27.2)% | |||||||||||||
| Mini Russell 1000 Value Index Future JUN 18 21 | (27.4)% | |||||||||||||
| Net Equity Exposure | 9.9% | |||||||||||||
| Standard & Poors 500 Index Option 3750.00 PUT JUN 18 21 | 0.3% | |||||||||||||
| Standard & Poors 500 Index Option 3150.00 PUT JUN 18 21 (o) | (0.0)% | |||||||||||||
| Standard & Poors 500 Index Option 3950.00 PUT JUN 18 21 | (0.7)% | |||||||||||||
| Standard & Poors Index Option PUT(s) | (0.4)% | |||||||||||||
| Downside Hedge(s) | (0.4)% | |||||||||||||
| Net Equivalent Equity Exposure | 90.9% | (81.4)% | 9.5% | |||||||||||
| Limited Maturity U.S. Treasury Notes | 1.5% | |||||||||||||
| Cash | Cash & Cash Equivalent (d) | 7.6% | ||||||||||||
| Other (e) | 81.4% | |||||||||||||
| Total Net Exposure Summary | 100.0% | |||||||||||||
2
Table of Contents
Portfolio Composition – continued
| Top ten holdings (c)(i) | ||||
| Microsoft Corp. | 3.1% | |||
| Amazon.com, Inc. | 2.5% | |||
| Alphabet, Inc., “A” | 1.7% | |||
| Nestle S.A. | 1.6% | |||
| JPMorgan Chase & Co. | 1.4% | |||
| Facebook, Inc. | 1.2% | |||
| Adobe Systems, Inc. | 1.2% | |||
| Mini Russell 1000 Growth Index Future JUN 18 21 | (26.4)% | |||
| Mini MSCI EAFE Index Future JUN 18 21 | (27.2)% | |||
| Mini Russell 1000 Value Index Future JUN 18 21 | (27.4)% |
| (a) | Represents the actively managed portion of the portfolio and for purposes of this presentation, components include the value of securities, less any securities sold short. The bond component will include any accrued interest amounts. This also reflects the equivalent exposure of certain derivative positions. These amounts may be negative from time to time. |
| (b) | Represents the tactical overlay portion of the portfolio which is how the fund manages its exposure to markets and currencies through the use of derivative positions. Percentages reflect the equivalent exposure of those derivative positions. |
| (c) | For purposes of this presentation, the components include the value of securities, less any securities sold short, and reflect the impact of the equivalent exposure of all derivative positions. These amounts may be negative from time to time. The bond component will include any accrued interest amounts. |
| (d) | Cash & Cash Equivalents includes any cash, investments in money market funds, short term securities, and other assets less liabilities. Please see the Statement of Assets and Liabilities for additional information related to the fund’s cash position and other assets and liabilities. |
| (e) | Other includes currency derivatives and/or the offsetting of the leverage produced by the fund’s derivative positions, including payables and/or receivables of the finance leg of interest rate swaps and the unrealized gain or loss in connection with forward currency exchange contracts. |
| (i) | For purposes of this presentation, the components include a look-through to the individual holdings within the underlying affiliated funds. |
| (o) | Less than 0.1%. |
Equivalent exposure is a calculated amount that translates the derivative position into a reasonable approximation of the amount of the underlying asset that the portfolio would have to hold at a given point in time to have the same price sensitivity that results from the portfolio’s ownership of the derivative contract. When dealing with derivatives, equivalent exposure is a more representative measure of the potential impact of a position on portfolio performance than value. The value of derivatives may be different.
Where the fund holds convertible bonds, they are treated as part of the equity portion of the portfolio.
Percentages are based on net assets as of May 31, 2021.
The portfolio is actively managed and current holdings may be different.
3
Table of Contents
Summary of Results
The MFS Managed Wealth Fund’s (fund) investment objective is to seek total return. MFS seeks to achieve the fund’s objective by generating returns from (1) a strategic allocation to three MFS equity funds, referred to as underlying funds, and (2) a tactical asset allocation overlay primarily using derivative instruments to seek to decrease the volatility of the fund’s returns by reducing the fund’s exposure to the equity and/or currency markets as represented by the underlying funds and also to potentially expose the fund to asset classes and/or markets in which the underlying funds have little or no exposure. In addition, MFS may seek to limit the fund’s exposure to certain extreme market events. It is expected that the fund will generally have lower volatility than the overall equity market and will generally underperform the equity markets during periods of rising equity markets.
A committee of portfolio managers (committee) is responsible for selecting the underlying funds, determining the target strategic allocations to the underlying funds, and determining the fund’s tactical allocation overlay.
For the twelve months ended May 31, 2021, Class A shares of the fund provided a total return of -0.36%, at net asset value. This compares with a return of 0.09% for the fund’s benchmark, the ICE BofA 0-3 Month U.S. Treasury Bill Index. The fund’s other benchmark, the Standard & Poor’s 500 Stock Index, generated a return of 40.32%.
Market Environment
The global economy continued to recover from the most unusual recession in memory while financial markets benefited from massive fiscal and monetary intervention aimed at offsetting the economic effects of the pandemic. In developed markets, vaccine distribution broadened after getting off to a slower-than-hoped-for start in some locales, although concerns remained that too few people will be inoculated for herd immunity to be achieved. On balance, emerging markets experienced slower rollouts than developed markets amid ongoing vaccine supply constraints.
Around the world, central banks responded quickly and massively to the crisis with programs to improve liquidity and support markets. These undertakings proved largely successful in helping to restore market function, ease volatility and stimulate a prolonged rebound. In the first half of the period, the US Federal Reserve adopted a new, flexible, average-inflation-targeting framework, which is expected to result in the federal funds rate remaining at low levels longer than under its previous model. Due to relatively manageable external liabilities and balances of payments in many countries and persistently low inflation, even emerging market countries were able to implement countercyclical policies – a departure from the usual market-dictated response to risk-off crises.
Late in the period, markets grappled with the threat of resurgent inflation resulting from pandemic-induced production bottlenecks, monumental levels of economic stimulus and the unleashing of post-lockdown pent-up demand. Meanwhile, raw materials prices rebounded strongly on account of the surprising resilience of the global manufacturing sector during the pandemic. In response to these factors, global
4
Table of Contents
Management Review – continued
government bond yields rose materially in recent months and market leadership shifted from a handful of mega-cap technology companies to a broader array of small-cap and value stocks. At the same time, signs of excess investor enthusiasm were seen in pockets of the market, such as the “meme stocks” popular with users of online message boards and equities issued by special purpose acquisition companies (SPACs).
Factors Affecting Performance
During the reporting period, the fund’s short exposure to futures contracts on the Russell 1000® Value Index, Russell 1000® Growth Index and MSCI EAFE Index detracted from absolute performance.
Conversely, the fund’s allocation to the MFS Value Fund, MFS Institutional International Equity Fund and MFS Growth Fund were the most notable contributors to absolute performance.
Respectfully,
Portfolio Manager(s)
William Adams, Robert Almeida, Mike Roberge, and Barnaby Wiener
The views expressed in this report are those of the portfolio manager(s) only through the end of the period of the report as stated on the cover and do not necessarily reflect the views of MFS or any other person in the MFS organization. These views are subject to change at any time based on market or other conditions, and MFS disclaims any responsibility to update such views. These views may not be relied upon as investment advice or an indication of trading intent on behalf of any MFS portfolio. References to specific securities are not recommendations of such securities, and may not be representative of any MFS portfolio’s current or future investments.
5
Table of Contents
PERFORMANCE SUMMARY THROUGH 5/31/21
The following chart illustrates a representative class of the fund’s historical performance in comparison to its benchmark(s). Performance results include the deduction of the maximum applicable sales charge and reflect the percentage change in net asset value, including reinvestment of dividends and capital gains distributions. The performance of other share classes will be greater than or less than that of the class depicted below. Benchmarks are unmanaged and may not be invested in directly. Benchmark returns do not reflect sales charges, commissions or expenses. (See Notes to Performance Summary.)
Performance data shown represents past performance and is no guarantee of future results. Investment return and principal value fluctuate so your shares, when sold, may be worth more or less than the original cost; current performance may be lower or higher than quoted. The performance shown does not reflect the deduction of taxes, if any, that a shareholder would pay on fund distributions or the redemption of fund shares.
Growth of a Hypothetical $10,000 Investment (t)
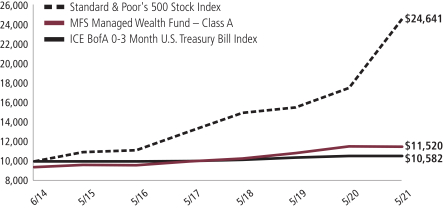
6
Table of Contents
Performance Summary – continued
Total Returns through 5/31/21
Average annual without sales charge
| Share Class | Class Inception Date | 1-yr | 5-yr | Life (t) | ||||||||
| A | 6/27/14 | (0.36)% | 3.71% | 2.94% | ||||||||
| B | 6/27/14 | (1.25)% | 2.80% | 2.02% | ||||||||
| C | 6/27/14 | (1.17)% | 2.81% | 2.04% | ||||||||
| I | 6/27/14 | (0.20)% | 3.83% | 3.05% | ||||||||
| R1 | 6/27/14 | (1.16)% | 2.82% | 2.03% | ||||||||
| R2 | 6/27/14 | (0.61)% | 3.33% | 2.55% | ||||||||
| R3 | 6/27/14 | (0.35)% | 3.60% | 2.81% | ||||||||
| R4 | 6/27/14 | (0.23)% | 3.85% | 3.05% | ||||||||
| R6 | 10/02/17 | (0.09)% | N/A | 4.01% | ||||||||
| Comparative benchmark(s) | ||||||||||||
| ICE BofA 0-3 Month U.S. Treasury Bill Index (f) | 0.09% | 1.12% | 0.82% | |||||||||
| Standard & Poor’s 500 Stock Index (f) | 40.32% | 17.16% | 13.89% | |||||||||
| Average annual with sales charge | ||||||||||||
| A With Initial Sales Charge (5.75%) | (6.09)% | 2.49% | 2.06% | |||||||||
| B With CDSC (Declining over six years from 4% to 0%) (v) | (5.20)% | 2.44% | 2.02% | |||||||||
| C With CDSC (1% for 12 months) (v) | (2.16)% | 2.81% | 2.04% | |||||||||
CDSC – Contingent Deferred Sales Charge.
Class I, R1, R2, R3, R4, and R6 shares do not have a sales charge.
| (f) | Source: FactSet Research Systems Inc. |
| (t) | For the period from the class inception date through the stated period end. The comparative benchmark performance information provided for the “life” period is from the inception date of the Class A shares. (See Notes to Performance Summary.) |
| (v) | Assuming redemption at the end of the applicable period. |
Benchmark Definition(s)
ICE BofA 0-3 Month U.S. Treasury Bill Index (d) – tracks the performance of U.S. dollar denominated U.S. Treasury Bills publicly issued in the U.S. domestic market with a remaining term to final maturity of less than 3 months.
Standard & Poor’s 500 Stock Index (g) – a market capitalization-weighted index of 500 widely held equity securities, designed to measure broad U.S. equity performance.
It is not possible to invest directly in an index.
| (d) | Source: ICE Data Indices, LLC (“ICE Data”), is used with permission. ICE Data, its affiliates and their respective third party suppliers disclaim any and all warranties and representations, express and/or implied, including any warranties of merchantability or fitness for a particular purpose or use, including the indices, index data and any data included in, related to, or |
7
Table of Contents
Performance Summary – continued
| derived therefrom. Neither ICE Data, its affiliates nor their respective third party suppliers shall be subject to any damages or liability with respect the adequacy, accuracy, timeliness or completeness of the indices or the index data or any component thereof, and the indices and the index data and all components thereof are provided on an “as is” basis and your use is at your own risk. ICE Data, its affiliates and their respective third party suppliers do not sponsor, endorse or recommend MFS, or any of its products or services. |
| (g) | “Standard & Poor’s®” and “S&P®” are registered trademarks of Standard & Poor’s Financial Services LLC (“S&P”) and Dow Jones is a registered trademark of Dow Jones Trademark Holdings LLC (“Dow Jones”) and have been licensed for use by S&P Dow Jones Indices LLC and sublicensed for certain purposes by MFS. The S&P 500® is a product of S&P Dow Jones Indices LLC, and has been licensed for use by MFS. MFS’s product(s) is not sponsored, endorsed, sold, or promoted by S&P Dow Jones Indices LLC, Dow Jones, S&P, or their respective affiliates, and neither S&P Dow Jones Indices LLC, Dow Jones, S&P, nor their respective affiliates make any representation regarding the advisability of investing in such product(s). |
Notes to Performance Summary
Average annual total return represents the average annual change in value for each share class for the periods presented. Life returns are presented where the share class has less than 10 years of performance history and represent the average annual total return from the class inception date to the stated period end date. As the fund’s share classes may have different inception dates, the life returns may represent different time periods and may not be comparable.
Performance results reflect any applicable expense subsidies and waivers in effect during the periods shown. Without such subsidies and waivers the fund’s performance results would be less favorable. Please see the prospectus and financial statements for complete details.
Performance results do not include adjustments made for financial reporting purposes in accordance with U.S. generally accepted accounting principles and may differ from amounts reported in the financial highlights.
From time to time the fund may receive proceeds from litigation settlements, without which performance would be lower.
8
Table of Contents
Fund expenses borne by the shareholders during the period, December 1, 2020 through May 31, 2021
As a shareholder of the fund, you incur two types of costs: (1) transaction costs, including sales charges (loads) on certain purchase or redemption payments, and (2) ongoing costs, including management fees; distribution and service (12b-1) fees; and other fund expenses. This example is intended to help you understand your ongoing costs (in dollars) of investing in the fund and to compare these costs with the ongoing costs of investing in other mutual funds.
In addition to the fees and expenses which the fund bears directly, the fund indirectly bears a pro rata share of the fees and expenses of the underlying funds in which the fund invests. Because the underlying funds have varied expenses and fee levels and the fund may own different proportions of the underlying funds at different times, the amount of fees and expenses incurred indirectly by the fund will vary. If these transactional and indirect costs were included, your costs would have been higher.
The example is based on an investment of $1,000 invested at the beginning of the period and held for the entire period December 1, 2020 through May 31, 2021.
Actual Expenses
The first line for each share class in the following table provides information about actual account values and actual expenses. You may use the information in this line, together with the amount you invested, to estimate the expenses that you paid over the period. Simply divide your account value by $1,000 (for example, an $8,600 account value divided by $1,000 = 8.6), then multiply the result by the number in the first line under the heading entitled “Expenses Paid During Period” to estimate the expenses you paid on your account during this period.
Hypothetical Example for Comparison Purposes
The second line for each share class in the following table provides information about hypothetical account values and hypothetical expenses based on the fund’s actual expense ratio and an assumed rate of return of 5% per year before expenses, which is not the fund’s actual return. The hypothetical account values and expenses may not be used to estimate the actual ending account balance or expenses you paid for the period. You may use this information to compare the ongoing costs of investing in the fund and other funds. To do so, compare this 5% hypothetical example with the 5% hypothetical examples that appear in the shareholder reports of the other funds.
Please note that the expenses shown in the table are meant to highlight your ongoing costs only and do not reflect any transactional costs, such as sales charges (loads). Therefore, the second line for each share class in the table is useful in comparing ongoing costs only, and will not help you determine the relative total costs of owning different funds. In addition, if these transactional costs were included, your costs would have been higher.
9
Table of Contents
Expense Table – continued
Share Class | Annualized Expense Ratio | Beginning Account Value 12/01/20 | Ending Account Value 5/31/21 | Expenses Paid During Period (p) 12/01/20-5/31/21 | ||||||||||||||
| A | Actual | 0.92% | $1,000.00 | $998.08 | $4.58 | |||||||||||||
| Hypothetical (h) | 0.92% | $1,000.00 | $1,020.34 | $4.63 | ||||||||||||||
| B | Actual | 1.68% | $1,000.00 | $993.73 | $8.35 | |||||||||||||
| Hypothetical (h) | 1.68% | $1,000.00 | $1,016.55 | $8.45 | ||||||||||||||
| C | Actual | 1.69% | $1,000.00 | $994.51 | $8.40 | |||||||||||||
| Hypothetical (h) | 1.69% | $1,000.00 | $1,016.50 | $8.50 | ||||||||||||||
| I | Actual | 0.68% | $1,000.00 | $998.91 | $3.39 | |||||||||||||
| Hypothetical (h) | 0.68% | $1,000.00 | $1,021.54 | $3.43 | ||||||||||||||
| R1 | Actual | 1.67% | $1,000.00 | $994.62 | $8.30 | |||||||||||||
| Hypothetical (h) | 1.67% | $1,000.00 | $1,016.60 | $8.40 | ||||||||||||||
| R2 | Actual | 1.17% | $1,000.00 | $997.38 | $5.83 | |||||||||||||
| Hypothetical (h) | 1.17% | $1,000.00 | $1,019.10 | $5.89 | ||||||||||||||
| R3 | Actual | 0.93% | $1,000.00 | $998.26 | $4.63 | |||||||||||||
| Hypothetical (h) | 0.93% | $1,000.00 | $1,020.29 | $4.68 | ||||||||||||||
| R4 | Actual | 0.68% | $1,000.00 | $998.59 | $3.39 | |||||||||||||
| Hypothetical (h) | 0.68% | $1,000.00 | $1,021.54 | $3.43 | ||||||||||||||
| R6 | Actual | 0.60% | $1,000.00 | $999.93 | $2.99 | |||||||||||||
| Hypothetical (h) | 0.60% | $1,000.00 | $1,021.94 | $3.02 | ||||||||||||||
| (h) | 5% class return per year before expenses. |
| (p) | “Expenses Paid During Period” are equal to each class’s annualized expense ratio, as shown above, multiplied by the average account value over the period, multiplied by 182/365 (to reflect the one-half year period). Expenses paid do not include any applicable sales charges (loads). If these transaction costs had been included, your costs would have been higher. In addition to the fees and expenses which the fund bears directly, the fund indirectly bears a pro rata share of the fees and expenses of the underlying funds in which the fund invests. If these indirect costs were included, your costs would have been higher. |
Notes to Expense Table
Expense ratios include 0.01% of interest expense on uncovered collateral or margin obligations with the broker (See Note 2 of the Notes to Financial Statements) that are outside of the expense limitation arrangement (See Note 3 of the Notes to Financial Statements).
10
Table of Contents
5/31/21
The Portfolio of Investments is a complete list of all securities owned by your fund. It is categorized by broad-based asset classes.
| Issuer | Shares/Par | Value ($) | ||||||
| Bonds - 1.5% | ||||||||
| U.S. Treasury Obligations - 1.5% | ||||||||
| U.S. Treasury Notes, 2.625%, 6/15/2021 (f) | $ | 650,000 | $ | 650,650 | ||||
| U.S. Treasury Notes, 1.125%, 9/30/2021 (f) | 650,000 | 652,346 | ||||||
| U.S. Treasury Notes, 2%, 12/31/2021 (f) | 650,000 | 657,313 | ||||||
| Total Bonds (Identified Cost, $1,985,418) | $ | 1,960,309 | ||||||
| Investment Companies (h) - 95.0% | ||||||||
| International Stock Funds - 30.3% | ||||||||
| MFS Institutional International Equity Fund | 1,214,115 | $ | 40,563,573 | |||||
| U.S. Stock Funds - 60.6% | ||||||||
| MFS Growth Fund - Class R6 | 232,960 | $ | 40,567,707 | |||||
| MFS Value Fund - Class R6 | 779,277 | 40,483,441 | ||||||
|
| |||||||
| $ | 81,051,148 | |||||||
| Money Market Funds - 4.1% | ||||||||
| MFS Institutional Money Market Portfolio, 0.03% (v) | 5,509,260 | $ | 5,509,260 | |||||
| Total Investment Companies (Identified Cost, $81,634,350) | $ | 127,123,981 | ||||||
| Underlying/Expiration Date/Exercise Price | Put/Call | Counterparty | Notional Amount | Par Amount/ Number of Contracts | ||||||||||||||||
| Purchased Options - 0.0% | ||||||||||||||||||||
| Market Index Securities - 0.0% | ||||||||||||||||||||
| S&P 500 Index - June 2021 @ $3,150 | Put | Exchange Traded | $ | 5,044,932 | 12 | $ | 900 | |||||||||||||
| S&P 500 Index - June 2021 @ $3,950 | Put | Exchange Traded | 10,089,864 | 24 | 23,160 | |||||||||||||||
| Total Purchased Options (Premiums Paid, $217,708) |
| $ | 24,060 | |||||||||||||||||
| Written Options (see table below) - (0.0)% | ||||||||||||||||||||
| (Premiums Received, $60,518) |
| $ | (10,320 | ) | ||||||||||||||||
| Other Assets, Less Liabilities - 3.5% | 4,627,713 | |||||||||||||||||||
| Net Assets - 100.0% | $ | 133,725,743 | ||||||||||||||||||
11
Table of Contents
Portfolio of Investments – continued
| (f) | All or a portion of the security has been segregated as collateral for open futures contracts. |
| (h) | An affiliated issuer, which may be considered one in which the fund owns 5% or more of the outstanding voting securities, or a company which is under common control. At period end, the aggregate values of the fund’s investments in affiliated issuers and in unaffiliated issuers were $127,123,981 and $1,984,369, respectively. |
| (v) | Affiliated issuer that is available only to investment companies managed by MFS. The rate quoted for the MFS Institutional Money Market Portfolio is the annualized seven-day yield of the fund at period end. |
Derivative Contracts at 5/31/21
Written Options
| Underlying | Put/ Call | Counterparty | Par Amount/ Number of Contracts | Notional Amount | Exercise Price | Expiration Date | Value | |||||||||||||||||||
| Liability Derivatives |
| |||||||||||||||||||||||||
| Market Index Securities |
| |||||||||||||||||||||||||
| S&P 500 Index | Put | Exchange Traded | 24 | $10,089,864 | $3,750 | June - 2021 | $(10,320 | ) | ||||||||||||||||||
|
| |||||||||||||||||||||||||
Futures Contracts
| Description | Long/ Short | Currency | Contracts | Notional Amount | Expiration Date | Value/ Unrealized | ||||||||||||||||
| Liability Derivatives | ||||||||||||||||||||||
| Equity Futures | ||||||||||||||||||||||
| Mini MSCI EAFE Index | Short | USD | 311 | $36,340,350 | June - 2021 | $(2,148,249 | ) | |||||||||||||||
| Mini Russell 1000 Growth Index | Short | USD | 274 | 35,237,770 | June - 2021 | (2,103,599 | ) | |||||||||||||||
| Mini Russell 1000 Value Index | Short | USD | 462 | 36,576,540 | June - 2021 | (1,959,005 | ) | |||||||||||||||
|
| |||||||||||||||||||||
| $(6,210,853 | ) | |||||||||||||||||||||
|
| |||||||||||||||||||||
At May 31, 2021, the fund had cash collateral of $4,710,187 and other liquid securities with an aggregate value of $1,960,309 to cover any collateral or margin obligations for certain derivative contracts. Restricted cash and/or deposits with brokers in the Statement of Assets and Liabilities are comprised of cash collateral.
See Notes to Financial Statements
12
Table of Contents
Financial Statements
STATEMENT OF ASSETS AND LIABILITIES
At 5/31/21
This statement represents your fund’s balance sheet, which details the assets and liabilities comprising the total value of the fund.
| Assets | ||||
Investments in unaffiliated issuers, at value (identified cost, $2,203,126) | $1,984,369 | |||
Investments in affiliated issuers, at value (identified cost, $81,634,350) | 127,123,981 | |||
Deposits with brokers for | ||||
Futures contracts | 4,710,187 | |||
Receivables for | ||||
Investments sold | 126,554 | |||
Fund shares sold | 401,427 | |||
Interest | 14,572 | |||
Other assets | 572 | |||
Total assets | $134,361,662 | |||
| Liabilities | ||||
Payables for | ||||
Net daily variation margin on open futures contracts | $109,909 | |||
Fund shares reacquired | 404,283 | |||
Written options (premiums received, $60,518) | 10,320 | |||
Payable to affiliates | ||||
Investment adviser | 6,175 | |||
Administrative services fee | 389 | |||
Shareholder servicing costs | 33,096 | |||
Distribution and service fees | 1,385 | |||
Payable for independent Trustees’ compensation | 24 | |||
Accrued expenses and other liabilities | 70,338 | |||
Total liabilities | $635,919 | |||
Net assets | $133,725,743 | |||
| Net assets consist of | ||||
Paid-in capital | $129,967,223 | |||
Total distributable earnings (loss) | 3,758,520 | |||
Net assets | $133,725,743 | |||
Shares of beneficial interest outstanding | 11,653,733 | |||
13
Table of Contents
Statement of Assets and Liabilities – continued
| Net assets | Shares outstanding | Net asset value per share (a) | ||||||||||
Class A | $14,338,550 | 1,251,325 | $11.46 | |||||||||
Class B | 74,334 | 6,709 | 11.08 | |||||||||
Class C | 6,363,277 | 577,342 | 11.02 | |||||||||
Class I | 105,345,853 | 9,157,635 | 11.50 | |||||||||
Class R1 | 57,479 | 5,187 | 11.08 | |||||||||
Class R2 | 59,197 | 5,198 | 11.39 | |||||||||
Class R3 | 60,016 | 5,228 | 11.48 | |||||||||
Class R4 | 60,858 | 5,290 | 11.50 | |||||||||
Class R6 | 7,366,179 | 639,819 | 11.51 | |||||||||
| (a) | Maximum offering price per share was equal to the net asset value per share for all share classes, except for Class A, for which the maximum offering price per share was $12.16 [100 / 94.25 x $11.46]. On sales of $50,000 or more, the maximum offering price of Class A shares is reduced. A contingent deferred sales charge may be imposed on redemptions of Class A, Class B, and Class C shares. Redemption price per share was equal to the net asset value per share for Classes I, R1, R2, R3, R4, and R6. |
See Notes to Financial Statements
14
Table of Contents
Financial Statements
Year ended 5/31/21
This statement describes how much your fund earned in investment income and accrued in expenses. It also describes any gains and/or losses generated by fund operations.
| Net investment income (loss) | ||||
Income | ||||
Dividends from affiliated issuers | $1,114,281 | |||
Interest | 57,559 | |||
Other | 16 | |||
Total investment income | $1,171,856 | |||
Expenses | ||||
Management fee | $499,808 | |||
Distribution and service fees | 102,521 | |||
Shareholder servicing costs | 102,518 | |||
Administrative services fee | 29,393 | |||
Independent Trustees’ compensation | 2,483 | |||
Custodian fee | 16,130 | |||
Shareholder communications | 18,355 | |||
Audit and tax fees | 51,305 | |||
Legal fees | 3,236 | |||
Registration fees | 150,504 | |||
Miscellaneous | 60,248 | |||
Total expenses | $1,036,501 | |||
Reduction of expenses by investment adviser and distributor | (18,801 | ) | ||
Net expenses | $1,017,700 | |||
Net investment income (loss) | $154,156 | |||
| Realized and unrealized gain (loss) | ||||
Realized gain (loss) (identified cost basis) | ||||
Unaffiliated issuers | $(670,533 | ) | ||
Affiliated issuers | 7,912,163 | |||
Capital gain distributions from affiliated issuers | 2,167,389 | |||
Written options | 181,259 | |||
Futures contracts | (46,712,447 | ) | ||
Net realized gain (loss) | $(37,122,169 | ) | ||
Change in unrealized appreciation or depreciation | ||||
Unaffiliated issuers | $(198,966 | ) | ||
Affiliated issuers | 29,842,464 | |||
Written options | 50,198 | |||
Futures contracts | 6,289,975 | |||
Net unrealized gain (loss) | $35,983,671 | |||
Net realized and unrealized gain (loss) | $(1,138,498 | ) | ||
Change in net assets from operations | $(984,342 | ) | ||
See Notes to Financial Statements
15
Table of Contents
Financial Statements
STATEMENTS OF CHANGES IN NET ASSETS
These statements describe the increases and/or decreases in net assets resulting from operations, any distributions, and any shareholder transactions.
| Year ended | ||||||||
| 5/31/21 | 5/31/20 | |||||||
| Change in net assets | ||||||||
| From operations | ||||||||
Net investment income (loss) | $154,156 | $359,659 | ||||||
Net realized gain (loss) | (37,122,169 | ) | 6,284,975 | |||||
Net unrealized gain (loss) | 35,983,671 | (3,138,779 | ) | |||||
Change in net assets from operations | $(984,342 | ) | $3,505,855 | |||||
Total distributions to shareholders | $(325,002 | ) | $(240,022 | ) | ||||
Change in net assets from fund share transactions | $26,795,436 | $65,580,651 | ||||||
Total change in net assets | $25,486,092 | $68,846,484 | ||||||
| Net assets | ||||||||
At beginning of period | 108,239,651 | 39,393,167 | ||||||
At end of period | $133,725,743 | $108,239,651 | ||||||
See Notes to Financial Statements
16
Table of Contents
Financial Statements
The financial highlights table is intended to help you understand the fund’s financial performance for the past 5 years (or life of a particular share class, if shorter). Certain information reflects financial results for a single fund share. The total returns in the table represent the rate that an investor would have earned (or lost) on an investment in the fund share class (assuming reinvestment of all distributions) held for the entire period.
| Class A | Year ended | |||||||||||||||||||
| 5/31/21 | 5/31/20 | 5/31/19 | 5/31/18 | 5/31/17 | ||||||||||||||||
Net asset value, beginning of period | $11.54 | $10.91 | $10.37 | $10.14 | $10.00 | |||||||||||||||
| Income (loss) from investment operations |
| |||||||||||||||||||
Net investment income (loss) (d) | $(0.01 | ) | $0.09 | $0.07 | $0.04 | $0.05 | ||||||||||||||
Net realized and unrealized gain (loss) | (0.05 | ) | 0.60 | 0.51 | 0.27 | 0.34 | ||||||||||||||
Total from investment operations | $(0.06 | ) | $0.69 | $0.58 | $0.31 | $0.39 | ||||||||||||||
| Less distributions declared to shareholders |
| |||||||||||||||||||
From net investment income | $(0.02 | ) | $(0.06 | ) | $(0.04 | ) | $(0.08 | ) | $— | |||||||||||
From net realized gain | — | — | — | — | (0.25 | ) | ||||||||||||||
Total distributions declared to shareholders | $(0.02 | ) | $(0.06 | ) | $(0.04 | ) | $(0.08 | ) | $(0.25 | ) | ||||||||||
Net asset value, end of period (x) | $11.46 | $11.54 | $10.91 | $10.37 | $10.14 | |||||||||||||||
Total return (%) (r)(s)(t)(x) | (0.54 | ) | 6.30 | 5.59 | 3.08 | 4.09 | ||||||||||||||
| Ratios (%) (to average net assets) and Supplemental data: |
| |||||||||||||||||||
Expenses before expense reductions (f)(h) | 0.91 | 1.20 | 1.43 | 1.73 | 1.14 | |||||||||||||||
Expenses after expense reductions (f)(h) | 0.88 | 0.74 | 0.71 | 0.75 | 0.83 | |||||||||||||||
Net investment income (loss) | (0.07 | ) | 0.77 | 0.64 | 0.41 | 0.48 | ||||||||||||||
Portfolio turnover | 50 | 28 | 17 | 18 | 5 | |||||||||||||||
Net assets at end of period (000 omitted) | $14,339 | $12,826 | $8,205 | $4,698 | $4,842 | |||||||||||||||
See Notes to Financial Statements
17
Table of Contents
Financial Highlights – continued
| Class B | Year ended | |||||||||||||||||||
| 5/31/21 | 5/31/20 | 5/31/19 | 5/31/18 | 5/31/17 | ||||||||||||||||
Net asset value, beginning of period | $11.23 | $10.66 | $10.19 | $9.98 | $9.92 | |||||||||||||||
| Income (loss) from investment operations |
| |||||||||||||||||||
Net investment income (loss) (d) | $(0.09 | ) | $(0.01 | ) | $(0.03 | ) | $(0.04 | ) | $(0.04 | ) | ||||||||||
Net realized and unrealized gain (loss) | (0.06 | ) | 0.58 | 0.50 | 0.25 | 0.35 | ||||||||||||||
Total from investment operations | $(0.15 | ) | $0.57 | $0.47 | $0.21 | $0.31 | ||||||||||||||
| Less distributions declared to shareholders |
| |||||||||||||||||||
From net investment income | $— | $— | $— | $— | $— | |||||||||||||||
From net realized gain | — | — | — | — | (0.25 | ) | ||||||||||||||
Total distributions declared to shareholders | $— | $— | $— | $— | $(0.25 | ) | ||||||||||||||
Net asset value, end of period (x) | $11.08 | $11.23 | $10.66 | $10.19 | $9.98 | |||||||||||||||
Total return (%) (r)(s)(t)(x) | (1.34 | ) | 5.35 | 4.61 | 2.10 | 3.30 | ||||||||||||||
| Ratios (%) (to average net assets) and Supplemental data: |
| |||||||||||||||||||
Expenses before expense reductions (f)(h) | 1.66 | 1.96 | 2.18 | 2.49 | 1.90 | |||||||||||||||
Expenses after expense reductions (f)(h) | 1.65 | 1.67 | 1.65 | 1.64 | 1.66 | |||||||||||||||
Net investment income (loss) | (0.84 | ) | (0.05 | ) | (0.31 | ) | (0.42 | ) | (0.42 | ) | ||||||||||
Portfolio turnover | 50 | 28 | 17 | 18 | 5 | |||||||||||||||
Net assets at end of period (000 omitted) | $74 | $75 | $98 | $89 | $62 | |||||||||||||||
| Class C | Year ended | |||||||||||||||||||
| 5/31/21 | 5/31/20 | 5/31/19 | 5/31/18 | 5/31/17 | ||||||||||||||||
Net asset value, beginning of period | $11.18 | $10.62 | $10.15 | $9.93 | $9.88 | |||||||||||||||
| Income (loss) from investment operations |
| |||||||||||||||||||
Net investment income (loss) (d) | $(0.09 | ) | $(0.02 | ) | $(0.03 | ) | $(0.04 | ) | $(0.03 | ) | ||||||||||
Net realized and unrealized gain (loss) | (0.06 | ) | 0.58 | 0.50 | 0.26 | 0.33 | ||||||||||||||
Total from investment operations | $(0.15 | ) | $0.56 | $0.47 | $0.22 | $0.30 | ||||||||||||||
| Less distributions declared to shareholders |
| |||||||||||||||||||
From net investment income | $(0.01 | ) | $— | $— | $— | $— | ||||||||||||||
From net realized gain | — | — | — | — | (0.25 | ) | ||||||||||||||
Total distributions declared to shareholders | $(0.01 | ) | $— | $— | $— | $(0.25 | ) | |||||||||||||
Net asset value, end of period (x) | $11.02 | $11.18 | $10.62 | $10.15 | $9.93 | |||||||||||||||
Total return (%) (r)(s)(t)(x) | (1.35 | ) | 5.27 | 4.63 | 2.22 | 3.22 | ||||||||||||||
| Ratios (%) (to average net assets) and Supplemental data: |
| |||||||||||||||||||
Expenses before expense reductions (f)(h) | 1.67 | 1.94 | 2.19 | 2.47 | 1.87 | |||||||||||||||
Expenses after expense reductions (f)(h) | 1.66 | 1.67 | 1.65 | 1.65 | 1.66 | |||||||||||||||
Net investment income (loss) | (0.86 | ) | (0.19 | ) | (0.27 | ) | (0.40 | ) | (0.28 | ) | ||||||||||
Portfolio turnover | 50 | 28 | 17 | 18 | 5 | |||||||||||||||
Net assets at end of period (000 omitted) | $6,363 | $2,462 | $1,074 | $905 | $1,668 | |||||||||||||||
See Notes to Financial Statements
18
Table of Contents
Financial Highlights – continued
| Class I | Year ended | |||||||||||||||||||
| 5/31/21 | 5/31/20 | 5/31/19 | 5/31/18 | 5/31/17 | ||||||||||||||||
Net asset value, beginning of period | $11.57 | $10.94 | $10.39 | $10.17 | $10.01 | |||||||||||||||
| Income (loss) from investment operations |
| |||||||||||||||||||
Net investment income (loss) (d) | $0.02 | $0.08 | $0.07 | $0.08 | $0.06 | |||||||||||||||
Net realized and unrealized gain (loss) | (0.06 | ) | 0.61 | 0.52 | 0.24 | 0.35 | ||||||||||||||
Total from investment operations | $(0.04 | ) | $0.69 | $0.59 | $0.32 | $0.41 | ||||||||||||||
| Less distributions declared to shareholders |
| |||||||||||||||||||
From net investment income | $(0.03 | ) | $(0.06 | ) | $(0.04 | ) | $(0.10 | ) | $— | |||||||||||
From net realized gain | — | — | — | — | (0.25 | ) | ||||||||||||||
Total distributions declared to shareholders | $(0.03 | ) | $(0.06 | ) | $(0.04 | ) | $(0.10 | ) | $(0.25 | ) | ||||||||||
Net asset value, end of period (x) | $11.50 | $11.57 | $10.94 | $10.39 | $10.17 | |||||||||||||||
Total return (%) (r)(s)(t)(x) | (0.37 | ) | 6.33 | 5.74 | 3.12 | 4.28 | ||||||||||||||
| Ratios (%) (to average net assets) and Supplemental data: |
| |||||||||||||||||||
Expenses before expense reductions (f)(h) | 0.66 | 0.94 | 1.16 | 1.48 | 0.87 | |||||||||||||||
Expenses after expense reductions (f)(h) | 0.65 | 0.67 | 0.65 | 0.65 | 0.66 | |||||||||||||||
Net investment income (loss) | 0.17 | 0.67 | 0.64 | 0.73 | 0.65 | |||||||||||||||
Portfolio turnover | 50 | 28 | 17 | 18 | 5 | |||||||||||||||
Net assets at end of period (000 omitted) | $105,346 | $78,292 | $24,169 | $14,632 | $17,167 | |||||||||||||||
| Class R1 | Year ended | |||||||||||||||||||
| 5/31/21 | 5/31/20 | 5/31/19 | 5/31/18 | 5/31/17 | ||||||||||||||||
Net asset value, beginning of period | $11.23 | $10.66 | $10.19 | $9.98 | $9.92 | |||||||||||||||
| Income (loss) from investment operations |
| |||||||||||||||||||
Net investment income (loss) (d) | $(0.09 | ) | $(0.01 | ) | $(0.03 | ) | $(0.04 | ) | $(0.04 | ) | ||||||||||
Net realized and unrealized gain (loss) | (0.06 | ) | 0.58 | 0.50 | 0.25 | 0.35 | ||||||||||||||
Total from investment operations | $(0.15 | ) | $0.57 | $0.47 | $0.21 | $0.31 | ||||||||||||||
| Less distributions declared to shareholders |
| |||||||||||||||||||
From net investment income | $— | $— | $— | $— | $— | |||||||||||||||
From net realized gain | — | — | — | — | (0.25 | ) | ||||||||||||||
Total distributions declared to shareholders | $— | $— | $— | $— | $(0.25 | ) | ||||||||||||||
Net asset value, end of period (x) | $11.08 | $11.23 | $10.66 | $10.19 | $9.98 | |||||||||||||||
Total return (%) (r)(s)(t)(x) | (1.34 | ) | 5.35 | 4.61 | 2.10 | 3.30 | ||||||||||||||
| Ratios (%) (to average net assets) and Supplemental data: |
| |||||||||||||||||||
Expenses before expense reductions (f)(h) | 1.66 | 1.96 | 2.19 | 2.48 | 1.90 | |||||||||||||||
Expenses after expense reductions (f)(h) | 1.65 | 1.67 | 1.65 | 1.65 | 1.66 | |||||||||||||||
Net investment income (loss) | (0.83 | ) | (0.10 | ) | (0.29 | ) | (0.36 | ) | (0.42 | ) | ||||||||||
Portfolio turnover | 50 | 28 | 17 | 18 | 5 | |||||||||||||||
Net assets at end of period (000 omitted) | $57 | $58 | $55 | $53 | $52 | |||||||||||||||
See Notes to Financial Statements
19
Table of Contents
Financial Highlights – continued
| Class R2 | Year ended | |||||||||||||||||||
| 5/31/21 | 5/31/20 | 5/31/19 | 5/31/18 | 5/31/17 | ||||||||||||||||
Net asset value, beginning of period | $11.48 | $10.86 | $10.33 | $10.11 | $10.00 | |||||||||||||||
| Income (loss) from investment operations |
| |||||||||||||||||||
Net investment income (loss) (d) | $(0.04 | ) | $0.04 | $0.02 | $0.01 | $0.01 | ||||||||||||||
Net realized and unrealized gain (loss) | (0.05 | ) | 0.59 | 0.51 | 0.26 | 0.35 | ||||||||||||||
Total from investment operations | $(0.09 | ) | $0.63 | $0.53 | $0.27 | $0.36 | ||||||||||||||
| Less distributions declared to shareholders |
| |||||||||||||||||||
From net investment income | $— | $(0.01 | ) | $— | $(0.05 | ) | $— | |||||||||||||
From net realized gain | — | — | — | — | (0.25 | ) | ||||||||||||||
Total distributions declared to shareholders | $— | $(0.01 | ) | $— | $(0.05 | ) | $(0.25 | ) | ||||||||||||
Net asset value, end of period (x) | $11.39 | $11.48 | $10.86 | $10.33 | $10.11 | |||||||||||||||
Total return (%) (r)(s)(t)(x) | (0.78 | ) | 5.79 | 5.13 | 2.66 | 3.78 | ||||||||||||||
| Ratios (%) (to average net assets) and Supplemental data: |
| |||||||||||||||||||
Expenses before expense reductions (f)(h) | 1.16 | 1.46 | 1.69 | 1.98 | 1.40 | |||||||||||||||
Expenses after expense reductions (f)(h) | 1.15 | 1.17 | 1.15 | 1.15 | 1.16 | |||||||||||||||
Net investment income (loss) | (0.33 | ) | 0.40 | 0.21 | 0.13 | 0.08 | ||||||||||||||
Portfolio turnover | 50 | 28 | 17 | 18 | 5 | |||||||||||||||
Net assets at end of period (000 omitted) | $59 | $60 | $56 | $54 | $52 | |||||||||||||||
| Class R3 | Year ended | |||||||||||||||||||
| 5/31/21 | 5/31/20 | 5/31/19 | 5/31/18 | 5/31/17 | ||||||||||||||||
Net asset value, beginning of period | $11.55 | $10.92 | $10.37 | $10.15 | $10.01 | |||||||||||||||
| Income (loss) from investment operations |
| |||||||||||||||||||
Net investment income (loss) (d) | $(0.01 | ) | $0.07 | $0.05 | $0.04 | $0.03 | ||||||||||||||
Net realized and unrealized gain (loss) | (0.06 | ) | 0.59 | 0.52 | 0.25 | 0.36 | ||||||||||||||
Total from investment operations | $(0.07 | ) | $0.66 | $0.57 | $0.29 | $0.39 | ||||||||||||||
| Less distributions declared to shareholders |
| |||||||||||||||||||
From net investment income | $— | $(0.03 | ) | $(0.02 | ) | $(0.07 | ) | $— | ||||||||||||
From net realized gain | — | — | — | — | (0.25 | ) | ||||||||||||||
Total distributions declared to shareholders | $— | $(0.03 | ) | $(0.02 | ) | $(0.07 | ) | $(0.25 | ) | |||||||||||
Net asset value, end of period (x) | $11.48 | $11.55 | $10.92 | $10.37 | $10.15 | |||||||||||||||
Total return (%) (r)(s)(t)(x) | (0.61 | ) | 6.09 | 5.49 | 2.90 | 4.08 | ||||||||||||||
| Ratios (%) (to average net assets) and Supplemental data: |
| |||||||||||||||||||
Expenses before expense reductions (f)(h) | 0.91 | 1.21 | 1.44 | 1.73 | 1.15 | |||||||||||||||
Expenses after expense reductions (f)(h) | 0.90 | 0.92 | 0.90 | 0.90 | 0.91 | |||||||||||||||
Net investment income (loss) | (0.09 | ) | 0.65 | 0.45 | 0.38 | 0.33 | ||||||||||||||
Portfolio turnover | 50 | 28 | 17 | 18 | 5 | |||||||||||||||
Net assets at end of period (000 omitted) | $60 | $60 | $57 | $54 | $52 | |||||||||||||||
See Notes to Financial Statements
20
Table of Contents
Financial Highlights – continued
| Class R4 | Year ended | |||||||||||||||||||
| 5/31/21 | 5/31/20 | 5/31/19 | 5/31/18 | 5/31/17 | ||||||||||||||||
Net asset value, beginning of period | $11.57 | $10.93 | $10.39 | $10.17 | $10.00 | |||||||||||||||
| Income (loss) from investment operations |
| |||||||||||||||||||
Net investment income (loss) (d) | $0.02 | $0.10 | $0.07 | $0.07 | $0.06 | |||||||||||||||
Net realized and unrealized gain (loss) | (0.07 | ) | 0.60 | 0.51 | 0.25 | 0.36 | ||||||||||||||
Total from investment operations | $(0.05 | ) | $0.70 | $0.58 | $0.32 | $0.42 | ||||||||||||||
| Less distributions declared to shareholders |
| |||||||||||||||||||
From net investment income | $(0.02 | ) | $(0.06 | ) | $(0.04 | ) | $(0.10 | ) | $— | |||||||||||
From net realized gain | — | — | — | — | (0.25 | ) | ||||||||||||||
Total distributions declared to shareholders | $(0.02 | ) | $(0.06 | ) | $(0.04 | ) | $(0.10 | ) | $(0.25 | ) | ||||||||||
Net asset value, end of period (x) | $11.50 | $11.57 | $10.93 | $10.39 | $10.17 | |||||||||||||||
Total return (%) (r)(s)(t)(x) | (0.40 | ) | 6.43 | 5.64 | 3.15 | 4.39 | ||||||||||||||
| Ratios (%) (to average net assets) and Supplemental data: |
| |||||||||||||||||||
Expenses before expense reductions (f)(h) | 0.66 | 0.96 | 1.19 | 1.48 | 0.90 | |||||||||||||||
Expenses after expense reductions (f)(h) | 0.65 | 0.67 | 0.65 | 0.65 | 0.66 | |||||||||||||||
Net investment income (loss) | 0.16 | 0.90 | 0.71 | 0.64 | 0.58 | |||||||||||||||
Portfolio turnover | 50 | 28 | 17 | 18 | 5 | |||||||||||||||
Net assets at end of period (000 omitted) | $61 | $61 | $57 | $54 | $53 | |||||||||||||||
| Class R6 | Year ended | |||||||||||||||||||
| 5/31/21 | 5/31/20 | 5/31/19 | 5/31/18 (i) | |||||||||||||||||
Net asset value, beginning of period | $11.57 | $10.93 | $10.39 | $10.21 | ||||||||||||||||
| Income (loss) from investment operations |
| |||||||||||||||||||
Net investment income (loss) (d) | $0.04 | $0.09 | $0.08 | $(0.01 | ) | |||||||||||||||
Net realized and unrealized gain (loss) | (0.07 | ) | 0.61 | 0.51 | 0.29 | |||||||||||||||
Total from investment operations | $(0.03 | ) | $0.70 | $0.59 | $0.28 | |||||||||||||||
| Less distributions declared to shareholders |
| |||||||||||||||||||
From net investment income | $(0.03 | ) | $(0.06 | ) | $(0.05 | ) | $(0.10 | ) | ||||||||||||
From net realized gain | — | — | — | — | ||||||||||||||||
Total distributions declared to shareholders | $(0.03 | ) | $(0.06 | ) | $(0.05 | ) | $(0.10 | ) | ||||||||||||
Net asset value, end of period (x) | $11.51 | $11.57 | $10.93 | $10.39 | ||||||||||||||||
Total return (%) (r)(s)(t)(x) | (0.27 | ) | 6.44 | 5.67 | 2.80 | (n) | ||||||||||||||
| Ratios (%) (to average net assets) and Supplemental data: |
| |||||||||||||||||||
Expenses before expense reductions (f)(h) | 0.59 | 0.91 | 1.18 | 1.53 | (a) | |||||||||||||||
Expenses after expense reductions (f)(h) | 0.58 | 0.62 | 0.64 | 0.64 | (a) | |||||||||||||||
Net investment income (loss) | 0.32 | 0.84 | 0.74 | (0.17 | )(a)(l) | |||||||||||||||
Portfolio turnover | 50 | 28 | 17 | 18 | ||||||||||||||||
Net assets at end of period (000 omitted) | $7,366 | $14,345 | $5,621 | $4,348 | ||||||||||||||||
See Notes to Financial Statements
21
Table of Contents
Financial Highlights – continued
| (a) | Annualized. |
| (d) | Per share data is based on average shares outstanding. |
| (f) | Ratios do not reflect reductions from fees paid indirectly, if applicable. |
| (h) | In addition to the fees and expenses which the fund bears directly, the fund indirectly bears a pro rata share of the fees and expenses of the underlying affiliated funds in which the fund invests. Accordingly, the expense ratio for the fund reflects only those fees and expenses borne directly by the fund. Because the underlying affiliated funds have varied expense and fee levels and the fund may own different proportions of the underlying affiliated funds at different times, the amount of fees and expenses incurred indirectly by the fund will vary. |
| (i) | For Class R6, the period is from the class inception, October 2, 2017, through the stated period end. |
| (l) | Recognition of net investment income by the fund may be affected by the timing of the declaration of dividends by companies in which the fund invests and the actual annual net investment income ratio may differ. |
| (n) | Not annualized. |
| (r) | Certain expenses have been reduced without which performance would have been lower. |
| (s) | From time to time the fund may receive proceeds from litigation settlements, without which performance would be lower. |
| (t) | Total returns do not include any applicable sales charges. |
| (x) | The net asset values and total returns have been calculated on net assets which include adjustments made in accordance with U.S. generally accepted accounting principles required at period end for financial reporting purposes. |
See Notes to Financial Statements
22
Table of Contents
(1) Business and Organization
MFS Managed Wealth Fund (the fund) is a diversified series of MFS Series Trust X (the trust). The trust is organized as a Massachusetts business trust and is registered under the Investment Company Act of 1940, as amended, as an open-end management investment company.
The fund is an investment company and accordingly follows the investment company accounting and reporting guidance of the Financial Accounting Standards Board (FASB) Accounting Standards Codification Topic 946 Financial Services – Investment Companies.
(2) Significant Accounting Policies
General – The preparation of financial statements in conformity with U.S. generally accepted accounting principles requires management to make estimates and assumptions that affect the reported amounts of assets and liabilities, and disclosure of contingent assets and liabilities at the date of the financial statements and the reported amounts of increases and decreases in net assets from operations during the reporting period. Actual results could differ from those estimates. In the preparation of these financial statements, management has evaluated subsequent events occurring after the date of the fund’s Statement of Assets and Liabilities through the date that the financial statements were issued. The fund invests in derivatives as part of its principal investment strategy. Derivatives can be highly volatile and involve risks in addition to the risks of the underlying indicators on which the derivative is based. Derivatives can involve leverage. The fund is a “fund of funds”, which invests the majority of its assets in other MFS mutual funds (underlying funds), which may have different fiscal year ends than the fund. The underlying funds, in turn, may engage in a number of investment techniques and practices, which involve certain risks. Certain underlying funds can invest in foreign securities, including securities of emerging market issuers. Investments in foreign securities are vulnerable to the effects of changes in the relative values of the local currency and the U.S. dollar and to the effects of changes in each country’s market, economic, industrial, political, regulatory, geopolitical, environmental, public health, and other conditions. Investments in emerging markets can involve additional and greater risks than the risks associated with investments in developed foreign markets. Emerging markets can have less developed markets, greater custody and operational risk, less developed legal, regulatory, accounting, and auditing systems, and greater political, social, and economic instability than developed markets.
The accounting policies of the underlying funds in which the fund invests are outlined in the underlying funds’ shareholder reports, which are available without charge by calling 1-800-225-2606, at mfs.com and on the Securities and Exchange Commission (SEC) web site at http://www.sec.gov. The underlying funds’ shareholder reports are not covered by this report.
The investment objective of each of the underlying funds held by the fund at May 31, 2021 was to seek capital appreciation.
In March 2020, the FASB issued Accounting Standards Update 2020-04, Reference Rate Reform (Topic 848) – Facilitation of the Effects of Reference Rate Reform on
23
Table of Contents
Notes to Financial Statements – continued
Financial Reporting (“ASU 2020-04”), which provides optional, temporary relief for certain reference rate-related contract modifications due to the planned discontinuation of the London Interbank Offered Rate (LIBOR) and other IBOR-based reference rates as of the end of 2021. In March 2021, the administrator for LIBOR announced the extension of the publication of the more commonly used U.S. dollar LIBOR settings to the end of June 2023. Management is still evaluating the impact of ASU 2020-04 on the fund’s accounting for investments, derivatives, debt and other contracts that will undergo reference rate-related modifications as a result of the reference rate reform.
Balance Sheet Offsetting – The fund’s accounting policy with respect to balance sheet offsetting is that, absent an event of default by the counterparty or a termination of the agreement, the International Swaps and Derivatives Association (ISDA) Master Agreement, or similar agreement, does not result in an offset of reported amounts of financial assets and financial liabilities in the Statement of Assets and Liabilities across transactions between the fund and the applicable counterparty. The fund’s right to setoff may be restricted or prohibited by the bankruptcy or insolvency laws of the particular jurisdiction to which a specific master netting agreement counterparty is subject. Balance sheet offsetting disclosures, to the extent applicable to the fund, have been included in the fund’s Significant Accounting Policies note under the captions for each of the fund’s in-scope financial instruments and transactions.
Investment Valuations – Open-end investment companies (underlying funds) are generally valued at their net asset value per share. The investments of underlying funds managed by the adviser are valued as described below. For purposes of this policy disclosure, “fund” also refers to the underlying funds in which the fund-of-funds invests.
Equity securities, including restricted equity securities, are generally valued at the last sale or official closing price on their primary market or exchange as provided by a third-party pricing service. Equity securities, for which there were no sales reported that day, are generally valued at the last quoted daily bid quotation on their primary market or exchange as provided by a third-party pricing service. Debt instruments and floating rate loans, including restricted debt instruments, are generally valued at an evaluated or composite bid as provided by a third-party pricing service. Short-term instruments with a maturity at issuance of 60 days or less may be valued at amortized cost, which approximates market value. Exchange-traded options are generally valued at the last sale or official closing price on their primary exchange as provided by a third-party pricing service. Exchange-traded options for which there were no sales reported that day are generally valued at the last daily bid quotation on their primary exchange as provided by a third-party pricing service. For put options, the position may be valued at the last daily ask quotation if there are no trades reported during the day. Options not traded on an exchange are generally valued at a broker/dealer bid quotation. Foreign currency options are generally valued at valuations provided by a third-party pricing service. Futures contracts are generally valued at last posted settlement price on their primary exchange as provided by a third-party pricing service. Futures contracts for which there were no trades that day for a particular position are generally valued at the closing bid quotation on their primary exchange as provided by a third-party pricing service. Open-end investment companies are generally valued at net asset value per
24
Table of Contents
Notes to Financial Statements – continued
share. Securities and other assets generally valued on the basis of information from a third-party pricing service may also be valued at a broker/dealer bid quotation. In determining values, third-party pricing services can utilize both transaction data and market information such as yield, quality, coupon rate, maturity, type of issue, trading characteristics, and other market data. The values of foreign securities and other assets and liabilities expressed in foreign currencies are converted to U.S. dollars using the mean of bid and asked prices for rates provided by a third-party pricing service.
The Board of Trustees has delegated primary responsibility for determining or causing to be determined the value of the fund’s investments (including any fair valuation) to the adviser pursuant to valuation policies and procedures approved by the Board. If the adviser determines that reliable market quotations are not readily available, investments are valued at fair value as determined in good faith by the adviser in accordance with such procedures under the oversight of the Board of Trustees. Under the fund’s valuation policies and procedures, market quotations are not considered to be readily available for most types of debt instruments and floating rate loans and many types of derivatives. These investments are generally valued at fair value based on information from third-party pricing services. In addition, investments may be valued at fair value if the adviser determines that an investment’s value has been materially affected by events occurring after the close of the exchange or market on which the investment is principally traded (such as foreign exchange or market) and prior to the determination of the fund’s net asset value, or after the halt of trading of a specific security where trading does not resume prior to the close of the exchange or market on which the security is principally traded. Events that occur after foreign markets close (such as developments in foreign markets and significant movements in the U.S. markets) and prior to the determination of the fund’s net asset value may be deemed to have a material effect on the value of securities traded in foreign markets. Accordingly, the fund’s foreign equity securities may often be valued at fair value. The adviser generally relies on third-party pricing services or other information (such as the correlation with price movements of similar securities in the same or other markets; the type, cost and investment characteristics of the security; the business and financial condition of the issuer; and trading and other market data) to assist in determining whether to fair value and at what value to fair value an investment. The value of an investment for purposes of calculating the fund’s net asset value can differ depending on the source and method used to determine value. When fair valuation is used, the value of an investment used to determine the fund’s net asset value may differ from quoted or published prices for the same investment. There can be no assurance that the fund could obtain the fair value assigned to an investment if it were to sell the investment at the same time at which the fund determines its net asset value per share.
Various inputs are used in determining the value of the fund’s assets or liabilities. These inputs are categorized into three broad levels. In certain cases, the inputs used to measure fair value may fall into different levels of the fair value hierarchy. In such cases, an investment’s level within the fair value hierarchy is based on the lowest level of input that is significant to the fair value measurement. The fund’s assessment of the significance of a particular input to the fair value measurement in its entirety requires judgment, and considers factors specific to the investment. Level 1 includes unadjusted quoted prices in active markets for identical assets or liabilities. Level 2 includes other
25
Table of Contents
Notes to Financial Statements – continued
significant observable market-based inputs (including quoted prices for similar securities, interest rates, prepayment speed, and credit risk). Investments in certain underlying funds may be categorized as level 2 where the net asset value per share of an underlying fund was adjusted to reflect security valuations in foreign markets open on May 31, 2021, which was a U.S. market holiday. Level 3 includes unobservable inputs, which may include the adviser’s own assumptions in determining the fair value of investments. Other financial instruments are derivative instruments, such as futures contracts and written options. The following is a summary of the levels used as of May 31, 2021 in valuing the fund’s assets or liabilities:
| Financial Instruments | Level 1 | Level 2 | Level 3 | Total | ||||||||||||
| Equity Securities | $24,060 | $— | $— | $24,060 | ||||||||||||
| U.S. Treasury Bonds & U.S. Government Agencies & Equivalents | — | 1,960,309 | — | 1,960,309 | ||||||||||||
| Mutual Funds | 46,076,967 | 81,047,014 | — | 127,123,981 | ||||||||||||
| Total | $46,101,027 | $83,007,323 | $— | $129,108,350 | ||||||||||||
| Other Financial Instruments | ||||||||||||||||
| Futures Contracts – Liabilities | $(6,210,853 | ) | $— | $— | $(6,210,853 | ) | ||||||||||
| Written Options – Liabilities | (10,320 | ) | — | — | (10,320 | ) | ||||||||||
For further information regarding security characteristics, see the Portfolio of Investments. Please refer to the underlying funds’ shareholder reports for further information regarding the levels used in valuing the underlying funds’ assets or liabilities.
Derivatives – The fund uses derivatives primarily to increase or decrease exposure to a particular market or segment of the market, or security, to increase or decrease interest rate or currency exposure, or as alternatives to direct investments. Derivatives are used for hedging or non-hedging purposes. While hedging can reduce or eliminate losses, it can also reduce or eliminate gains. When the fund uses derivatives as an investment to increase market exposure, or for hedging purposes, gains and losses from derivative instruments may be substantially greater than the derivative’s original cost.
The derivative instruments used by the fund during the period were written options, purchased options, and futures contracts. Depending on the type of derivative, a fund may exit a derivative position by entering into an offsetting transaction with a counterparty or exchange, negotiating an agreement with the derivative counterparty, or novating the position to a third party. The fund’s period end derivatives, as presented in the Portfolio of Investments and the associated Derivative Contract tables, generally are indicative of the volume of its derivative activity during the period.
The following table presents, by major type of derivative contract, the fair value, on a gross basis, of the asset and liability components of derivatives held by the fund at May 31, 2021 as reported in the Statement of Assets and Liabilities:
| Fair Value (a) | ||||||||||
| Risk | Derivative Contracts | Asset Derivatives | Liability Derivatives | |||||||
| Equity | Equity Futures | $— | $(6,210,853 | ) | ||||||
| Equity | Purchased Equity Options | 24,060 | — | |||||||
| Equity | Written Equity Options | — | (10,320 | ) | ||||||
| Total | $24,060 | $(6,221,173 | ) | |||||||
| (a) | The value of purchased options outstanding is included in investments in unaffiliated issuers, at value, within the Statement of Assets and Liabilities. Values presented in this table for futures |
26
Table of Contents
Notes to Financial Statements – continued
| contracts correspond to the values reported in the Portfolio of Investments. Only the current day net variation margin for futures contracts is separately reported within the Statement of Assets and Liabilities. |
The following table presents, by major type of derivative contract, the realized gain (loss) on derivatives held by the fund for the year ended May 31, 2021 as reported in the Statement of Operations:
| Risk | Futures Contracts | Unaffiliated Issuers (Purchased Options) | Written Options | |||||||||
| Equity | $(46,712,447 | ) | $(656,073 | ) | $181,259 | |||||||
The following table presents, by major type of derivative contract, the change in unrealized appreciation or depreciation on derivatives held by the fund for the year ended May 31, 2021 as reported in the Statement of Operations:
| Risk | Futures Contracts | Unaffiliated Issuers (Purchased Options) | Written Options | |||||||||
| Equity | $6,289,975 | $(161,268 | ) | $50,198 | ||||||||
Derivative counterparty credit risk is managed through formal evaluation of the creditworthiness of all potential counterparties. On certain, but not all, uncleared derivatives, the fund attempts to reduce its exposure to counterparty credit risk whenever possible by entering into an ISDA Master Agreement on a bilateral basis. The ISDA Master Agreement gives each party to the agreement the right to terminate all transactions traded under such agreement if there is a specified deterioration in the credit quality of the other party. Upon an event of default or a termination of the ISDA Master Agreement, the non-defaulting party has the right to close out all transactions traded under such agreement and to net amounts owed under each agreement to one net amount payable by one party to the other. This right to close out and net payments across all transactions traded under the ISDA Master Agreement could result in a reduction of the fund’s credit risk to such counterparty equal to any amounts payable by the fund under the applicable transactions, if any.
Collateral and margin requirements differ by type of derivative. For cleared derivatives (e.g., futures contracts, cleared swaps, and exchange-traded options), margin requirements are set by the clearing broker and the clearing house and collateral, in the form of cash or securities, is posted by the fund directly with the clearing broker. Collateral terms are counterparty agreement specific for uncleared derivatives (e.g., forward foreign currency exchange contracts, uncleared swap agreements, and uncleared options) and collateral, in the form of cash and securities, is held in segregated accounts with the fund’s custodian in connection with these agreements. For derivatives traded under an ISDA Master Agreement, which contains a collateral support annex, the collateral requirements are netted across all transactions traded under such counterparty-specific agreement and an amount is posted from one party to the other to collateralize such obligations. Cash that has been segregated or delivered to cover the fund’s collateral or margin obligations under derivative contracts, if any, will be reported separately in the Statement of Assets and Liabilities as restricted
27
Table of Contents
Notes to Financial Statements – continued
cash for uncleared derivatives and/or deposits with brokers for cleared derivatives. Securities pledged as collateral or margin for the same purpose, if any, are noted in the Portfolio of Investments. The fund may be required to make payments of interest on uncovered collateral or margin obligations with the broker. Any such payments are included in “Miscellaneous” expense in the Statement of Operations.
The following table presents the fund’s derivative assets and liabilities (by type) on a gross basis as of May 31, 2021:
| Gross Amounts of: | Derivative Assets | Derivative Liabilities | ||||||
| Futures Contracts (a) | $— | $(109,909 | ) | |||||
| Purchased Options | 24,060 | — | ||||||
| Written Options | — | (10,320 | ) | |||||
| Total Gross Amount of Derivative Assets and Liabilities Presented in the Statement of Assets & Liabilities | $24,060 | $(120,229 | ) | |||||
| Less: Derivatives Assets and Liabilities Not Subject to a Master Netting Agreement or Similar Arrangement | 24,060 | (120,229 | ) | |||||
| Total Gross Amount of Derivative Assets and Liabilities Subject to a Master Netting Agreement or Similar Arrangement | $— | $— | ||||||
| (a) | The amount presented here represents the fund’s current day net variation margin for futures contracts. This amount, which is recognized within the fund’s Statement of Assets and Liabilities, differs from the fair value of the futures contracts which is presented in the tables that follow the fund’s Portfolio of Investments. |
Written Options – In exchange for a premium, the fund wrote put options on securities for which it anticipated the price would increase. At the time the option was written, the fund believed the premium received exceeded the potential loss that could result from adverse price changes in the options’ underlying securities. In a written option, the fund as the option writer grants the buyer the right to purchase from, or sell to, the fund a specified number of shares or units of a particular security, currency or index at a specified price within a specified period of time.
The premium received is initially recorded as a liability in the Statement of Assets and Liabilities. The option is subsequently marked-to-market daily with the difference between the premium received and the market value of the written option being recorded as unrealized appreciation or depreciation. When a written option expires, the fund realizes a gain equal to the amount of the premium received. The difference between the premium received and the amount paid on effecting a closing transaction is considered a realized gain or loss. When a written put option is exercised, the premium reduces the cost basis of the security purchased by the fund.
At the initiation of the written option contract, for exchange traded options, the fund is required to deposit securities or cash as collateral with the custodian for the benefit of the broker or directly with the clearing broker, based on the type of option. For uncleared options, the fund may post collateral subject to the terms of an ISDA Master Agreement as generally described above if the market value of the options contract moves against it. The fund, as writer of an option, may have no control over whether the underlying securities may be sold (call) or purchased (put) and, as a result, bears the market risk of an unfavorable change in the price of the securities underlying the
28
Table of Contents
Notes to Financial Statements – continued
written option. Losses from writing options can exceed the premium received and can exceed the potential loss from an ordinary buy and sell transaction. Although the fund’s market risk may be significant, the maximum counterparty credit risk to the fund is equal to the market value of any collateral posted to the broker. For uncleared options, this risk is mitigated in cases where there is an ISDA Master Agreement between the fund and the counterparty providing for netting as described above.
Purchased Options – The fund purchased put options for a premium. Purchased put options entitle the holder to buy and sell a specified number of shares or units of a particular security, currency or index at a specified price at a specified date or within a specified period of time. Purchasing put options may hedge against an anticipated decline in the value of portfolio securities or currency or decrease the fund’s exposure to an underlying instrument.
The premium paid is initially recorded as an investment in the Statement of Assets and Liabilities. That investment is subsequently marked-to-market daily with the difference between the premium paid and the market value of the purchased option being recorded as unrealized appreciation or depreciation. Premiums paid for purchased call and put options which have expired are treated as realized losses on investments in the Statement of Operations. Upon the exercise or closing of a purchased put option, the premium paid is offset against the proceeds on the sale of the underlying security or financial instrument in order to determine the realized gain or loss on investments.
Whether or not the option is exercised, the fund’s maximum risk of loss from purchasing an option is the amount of premium paid. All option contracts involve credit risk if the counterparty to the option contract fails to perform. For uncleared options, this risk is mitigated in cases where there is an ISDA Master Agreement between the fund and the counterparty providing for netting as described above and, where applicable, by the posting of collateral by the counterparty to the fund to cover the fund’s exposure to the counterparty under such ISDA Master Agreement.
Futures Contracts – The fund entered into futures contracts which may be used to hedge against or obtain broad market exposure, interest rate exposure, currency exposure, or to manage duration. A futures contract represents a commitment for the future purchase or sale of an asset at a specified price on a specified date.
Upon entering into a futures contract, the fund is required to deposit with the broker, either in cash or securities, an initial margin in an amount equal to a specified percentage of the notional amount of the contract. Subsequent payments (variation margin) are made or received by the fund each day, depending on the daily fluctuations in the value of the contract, and are recorded for financial statement purposes as unrealized gain or loss by the fund until the contract is closed or expires at which point the gain or loss on futures contracts is realized.
The fund bears the risk of interest rates, exchange rates or securities prices moving unexpectedly, in which case, the fund may not achieve the anticipated benefits of the futures contracts and may realize a loss. While futures contracts may present less counterparty risk to the fund since the contracts are exchange traded and the exchange’s clearinghouse guarantees payments to the broker, there is still counterparty credit risk due to the insolvency of the broker. The fund’s maximum risk of loss due to
29
Table of Contents
Notes to Financial Statements – continued
counterparty credit risk is equal to the margin posted by the fund to the broker plus any gains or minus any losses on the outstanding futures contracts.
Indemnifications – Under the fund’s organizational documents, its officers and Trustees may be indemnified against certain liabilities and expenses arising out of the performance of their duties to the fund. Additionally, in the normal course of business, the fund enters into agreements with service providers that may contain indemnification clauses. The fund’s maximum exposure under these agreements is unknown as this would involve future claims that may be made against the fund that have not yet occurred.
Investment Transactions and Income – Investment transactions are recorded on the trade date. Interest income is recorded on the accrual basis. All premium and discount is amortized or accreted for financial statement purposes in accordance with U.S. generally accepted accounting principles. Distributions of income and capital gains from the underlying funds are recorded on the ex-dividend date. Recognition of net investment income by the fund is affected by the timing of the declaration of distributions by the underlying funds in which the fund invests. In determining the net gain or loss on securities sold, the cost of securities is determined on the identified cost basis.
The fund and/or the underlying funds may receive proceeds from litigation settlements. Any proceeds received from litigation involving portfolio holdings are reflected in the Statement of Operations in realized gain/loss if the security has been disposed of by the fund or in unrealized gain/loss if the security is still held by the fund. Any other proceeds from litigation not related to portfolio holdings are reflected as other income in the Statement of Operations.
Tax Matters and Distributions – The fund intends to qualify as a regulated investment company, as defined under Subchapter M of the Internal Revenue Code, and to distribute all of its taxable income, including realized capital gains. As a result, no provision for federal income tax is required. The fund’s federal tax returns, when filed, will remain subject to examination by the Internal Revenue Service for a three year period. Management has analyzed the fund’s tax positions taken on federal and state tax returns for all open tax years and does not believe that there are any uncertain tax positions that require recognition of a tax liability.
Distributions to shareholders are recorded on the ex-dividend date. Income and capital gain distributions are determined in accordance with income tax regulations, which may differ from U.S. generally accepted accounting principles. Certain capital accounts in the financial statements are periodically adjusted for permanent differences in order to reflect their tax character. These adjustments have no impact on net assets or net asset value per share. Temporary differences which arise from recognizing certain items of income, expense, gain or loss in different periods for financial statement and tax purposes will reverse at some time in the future.
Book/tax differences primarily relate to wash sale loss deferrals and derivative transactions.
30
Table of Contents
Notes to Financial Statements – continued
The tax character of distributions declared to shareholders for the last two fiscal years is as follows:
| Year ended 5/31/21 | Year ended 5/31/20 | |||||||
| Ordinary income (including any short-term capital gains) | $325,002 | $240,022 | ||||||
The federal tax cost and the tax basis components of distributable earnings were as follows:
| As of 5/31/21 | ||||
| Cost of investments | $78,720,392 | |||
| Gross appreciation | 44,385,542 | |||
| Gross depreciation | (218,757 | ) | ||
| Net unrealized appreciation (depreciation) | $44,166,785 | |||
| Undistributed ordinary income | 149,150 | |||
| Capital loss carryforwards | (40,557,415 | ) | ||
| Total distributable earnings (loss) | $3,758,520 | |||
As of May 31, 2021, the fund had capital loss carryforwards available to offset future realized gains. These net capital losses may be carried forward indefinitely and their character is retained as short-term and/or long-term losses. Such losses are characterized as follows:
| Short-Term | $(15,864,416 | ) | ||
| Long-Term | (24,692,999 | ) | ||
| Total | $(40,557,415 | ) |
Multiple Classes of Shares of Beneficial Interest – The fund offers multiple classes of shares, which differ in their respective distribution and service fees. The fund’s income, realized and unrealized gain (loss), and common expenses are allocated to shareholders based on the daily net assets of each class. Dividends are declared separately for each class. Differences in per share dividend rates are generally due to differences in separate class expenses. Class B and Class C shares will convert to Class A shares approximately eight years after purchase. The fund’s distributions declared to shareholders as reported in the Statements of Changes in Net Assets are presented by class as follows:
| Year ended 5/31/21 | Year ended 5/31/20 | |||||||
| Class A | $18,531 | $44,601 | ||||||
| Class C | 6,599 | — | ||||||
| Class I | 261,023 | 161,629 | ||||||
| Class R2 | — | 43 | ||||||
| Class R3 | — | 179 | ||||||
| Class R4 | 125 | 318 | ||||||
| Class R6 | 38,724 | 33,252 | ||||||
| Total | $325,002 | $240,022 | ||||||
31
Table of Contents
Notes to Financial Statements – continued
(3) Transactions with Affiliates
Investment Adviser – The fund has an investment advisory agreement with MFS to provide overall investment management and related administrative services and facilities to the fund. The management fee is computed daily and paid monthly at an annual rate of 0.35% of the fund’s average daily net assets.
MFS has agreed in writing to reduce its management fee by a specified amount if certain MFS mutual fund assets exceed thresholds agreed to by MFS and the fund’s Board of Trustees. For the year ended May 31, 2021, this management fee reduction amounted to $16,300, which is included in the reduction of total expenses in the Statement of Operations. The management fee incurred for the year ended May 31, 2021 was equivalent to an annual effective rate of 0.34% of the fund’s average daily net assets.
The investment adviser has agreed in writing to pay a portion of the fund’s total annual operating expenses, excluding interest, taxes, extraordinary expenses, brokerage and transaction costs, and investment-related expenses (such as fees and expenses associated with investments in investment companies and other similar investment vehicles), such that total fund operating expenses do not exceed the following rates annually of each class’s average daily net assets:
| Classes | ||||||||||||||||||||||||||||||||
| A | B | C | I | R1 | R2 | R3 | R4 | R6 | ||||||||||||||||||||||||
| 0.91% | 1.66% | 1.66% | 0.66% | 1.66% | 1.16% | 0.91% | 0.66% | 0.63% | ||||||||||||||||||||||||
This written agreement will continue until modified by the fund’s Board of Trustees, but such agreement will continue at least until September 30, 2022. For the year ended May 31, 2021, the fund’s actual operating expenses did not exceed the limit and therefore, the investment adviser did not pay any portion of the fund’s expenses related to this agreement.
In addition to the fees and expenses which the fund bears directly, the fund indirectly bears a pro rata share of the fees and expenses of the underlying funds in which the fund invests. Accordingly, the expense ratio for the fund reflects only those fees and expenses borne directly by the fund.
Distributor – MFS Fund Distributors, Inc. (MFD), a wholly-owned subsidiary of MFS, as distributor, received $2,741 for the year ended May 31, 2021, as its portion of the initial sales charge on sales of Class A shares of the fund.
The Board of Trustees has adopted a distribution plan for certain share classes pursuant to Rule 12b-1 of the Investment Company Act of 1940.
The fund’s distribution plan provides that the fund will pay MFD for services provided by MFD and financial intermediaries in connection with the distribution and servicing of certain share classes. One component of the plan is a distribution fee paid to MFD and another component of the plan is a service fee paid to MFD. MFD may subsequently pay all, or a portion, of the distribution and/or service fees to financial intermediaries.
32
Table of Contents
Notes to Financial Statements – continued
Distribution Plan Fee Table:
| Distribution Fee Rate (d) | Service Fee Rate (d) | Total Distribution Plan (d) | Annual Effective Rate (e) | Distribution and Service Fee | ||||||||||||||||
| Class A | — | 0.25% | 0.25% | 0.23% | $29,811 | |||||||||||||||
| Class B | 0.75% | 0.25% | 1.00% | 1.00% | 748 | |||||||||||||||
| Class C | 0.75% | 0.25% | 1.00% | 1.00% | 70,938 | |||||||||||||||
| Class R1 | 0.75% | 0.25% | 1.00% | 1.00% | 577 | |||||||||||||||
| Class R2 | 0.25% | 0.25% | 0.50% | 0.50% | 296 | |||||||||||||||
| Class R3 | — | 0.25% | 0.25% | 0.25% | 151 | |||||||||||||||
| Total Distribution and Service Fees |
| $102,521 | ||||||||||||||||||
| (d) | In accordance with the distribution plan for certain classes, the fund pays distribution and/or service fees equal to these annual percentage rates of each class’s average daily net assets. The distribution and service fee rates disclosed by class represent the current rates in effect at the end of the reporting period. Any rate changes, if applicable, are detailed below. |
| (e) | The annual effective rates represent actual fees incurred under the distribution plan for the year ended May 31, 2021 based on each class’s average daily net assets. MFD has voluntarily agreed to rebate a portion of each class’s 0.25% service fee attributable to accounts for which there is no financial intermediary specified on the account except for accounts attributable to MFS or its affiliates’ seed money. For the year ended May 31, 2021, this rebate amounted to $2,501 for Class A and is included in the reduction of total expenses in the Statement of Operations. |
Certain Class A shares are subject to a contingent deferred sales charge (CDSC) in the event of a shareholder redemption within 18 months of purchase. Class B shares are subject to a CDSC in the event of a shareholder redemption within six years of purchase. Class C shares are subject to a CDSC in the event of a shareholder redemption within 12 months of purchase. All contingent deferred sales charges are paid to MFD and during the year ended May 31, 2021, were as follows:
| Amount | ||||
| Class A | $— | |||
| Class B | — | |||
| Class C | 1,731 | |||
Shareholder Servicing Agent – MFS Service Center, Inc. (MFSC), a wholly-owned subsidiary of MFS, receives a fee from the fund for its services as shareholder servicing agent calculated as a percentage of the average daily net assets of the fund as determined periodically under the supervision of the fund’s Board of Trustees. For the year ended May 31, 2021, the fee was $4,389, which equated to 0.0031% annually of the fund’s average daily net assets. MFSC also receives reimbursement from the fund for out-of-pocket expenses, sub-accounting and other shareholder servicing costs which may be paid to affiliated and unaffiliated service providers. Class R6 shares do not incur sub-accounting fees. For the year ended May 31, 2021, these out-of-pocket expenses, sub-accounting and other shareholder servicing costs amounted to $98,129.
Administrator – MFS provides certain financial, legal, shareholder communications, compliance, and other administrative services to the fund. Under an administrative services agreement, the fund reimburses MFS the costs incurred to provide these services. The fund is charged an annual fixed amount of $17,500 plus a fee based on
33
Table of Contents
Notes to Financial Statements – continued
average daily net assets. The administrative services fee incurred for the year ended May 31, 2021 was equivalent to an annual effective rate of 0.0206% of the fund’s average daily net assets.
Trustees’ and Officers’ Compensation – The fund pays compensation to independent Trustees in the form of a retainer, attendance fees, and additional compensation to Board and Committee chairpersons. The fund does not pay compensation directly to Trustees or officers of the fund who are also officers of the investment adviser, all of whom receive remuneration from MFS for their services to the fund. Certain officers and Trustees of the fund are officers or directors of MFS, MFD, and MFSC.
Other – The fund invests in the MFS Institutional Money Market Portfolio which is managed by MFS and seeks current income consistent with preservation of capital and liquidity. This money market fund does not pay a management fee to MFS but does incur investment and operating costs.
At May 31, 2021, MFS held approximately 77% of the outstanding shares of Class B and 100% of the outstanding shares of Class R1, Class R2, Class R3, and Class R4.
(4) Portfolio Securities
For the year ended May 31, 2021, purchases and sales of investments, other than purchased option transactions and short-term obligations, were as follows:
| Purchases | Sales | |||||||
| U.S. Government securities | $1,122,642 | $800,000 | ||||||
| Non-U.S. Government securities | 63,434,182 | 81,837,022 | ||||||
(5) Shares of Beneficial Interest
The fund’s Declaration of Trust permits the Trustees to issue an unlimited number of full and fractional shares of beneficial interest. Transactions in fund shares were as follows:
| Year ended 5/31/21 | Year ended 5/31/20 | |||||||||||||||
| Shares | Amount | Shares | Amount | |||||||||||||
| Shares sold | ||||||||||||||||
Class A | 1,395,899 | $16,073,828 | 560,712 | $6,354,034 | ||||||||||||
Class C | 554,096 | 6,220,255 | 160,345 | 1,757,588 | ||||||||||||
Class I | 10,465,661 | 120,964,705 | 6,246,135 | 70,818,622 | ||||||||||||
Class R6 | 470,841 | 5,464,757 | 969,170 | 11,085,853 | ||||||||||||
| 12,886,497 | $148,723,545 | 7,936,362 | $90,016,097 | |||||||||||||
| Shares issued to shareholders in reinvestment of distributions |
| |||||||||||||||
Class A | 1,616 | $18,531 | 3,993 | $44,601 | ||||||||||||
Class C | 597 | 6,599 | — | — | ||||||||||||
Class I | 22,698 | 261,023 | 14,444 | 161,629 | ||||||||||||
Class R2 | — | — | 4 | 43 | ||||||||||||
Class R3 | — | — | 16 | 179 | ||||||||||||
Class R4 | 11 | 125 | 28 | 318 | ||||||||||||
Class R6 | 34 | 391 | 27 | 307 | ||||||||||||
| 24,956 | $286,669 | 18,512 | $207,077 | |||||||||||||
34
Table of Contents
Notes to Financial Statements – continued
| Year ended 5/31/21 | Year ended 5/31/20 | |||||||||||||||
| Shares | Amount | Shares | Amount | |||||||||||||
| Shares reacquired |
| |||||||||||||||
Class A | (1,257,388 | ) | $(14,544,236 | ) | (205,297 | ) | $(2,335,764 | ) | ||||||||
Class B | — | — | (2,498 | ) | (27,502 | ) | ||||||||||
Class C | (197,551 | ) | (2,171,868 | ) | (41,354 | ) | (458,453 | ) | ||||||||
Class I | (8,097,683 | ) | (93,224,715 | ) | (1,703,504 | ) | (19,073,479 | ) | ||||||||
Class R6 | (1,070,768 | ) | (12,273,959 | ) | (243,543 | ) | (2,747,325 | ) | ||||||||
| (10,623,390 | ) | $(122,214,778 | ) | (2,196,196 | ) | $(24,642,523 | ) | |||||||||
| Net change |
| |||||||||||||||
Class A | 140,127 | $1,548,123 | 359,408 | $4,062,871 | ||||||||||||
Class B | — | — | (2,498 | ) | (27,502 | ) | ||||||||||
Class C | 357,142 | 4,054,986 | 118,991 | 1,299,135 | ||||||||||||
Class I | 2,390,676 | 28,001,013 | 4,557,075 | 51,906,772 | ||||||||||||
Class R2 | — | — | 4 | 43 | ||||||||||||
Class R3 | — | — | 16 | 179 | ||||||||||||
Class R4 | 11 | 125 | 28 | 318 | ||||||||||||
Class R6 | (599,893 | ) | (6,808,811 | ) | 725,654 | 8,338,835 | ||||||||||
| 2,288,063 | $26,795,436 | 5,758,678 | $65,580,651 | |||||||||||||
Effective June 1, 2019, purchases of the fund’s Class B shares are closed to new and existing investors subject to certain exceptions. Please see the fund’s prospectus for details.
(6) Line of Credit
The fund and certain other funds managed by MFS participate in a $1.25 billion unsecured committed line of credit of which $1 billion is reserved for use by the fund and certain other MFS U.S. funds. The line of credit is provided by a syndicate of banks under a credit agreement. Borrowings may be made for temporary financing needs. Interest is charged to each fund, based on its borrowings, generally at a rate equal to the highest of one month LIBOR, the Federal Funds Effective Rate and the Overnight Bank Funding Rate, plus an agreed upon spread. A commitment fee, based on the average daily, unused portion of the committed line of credit, is allocated among the participating funds. In addition, the fund and other funds managed by MFS have established unsecured uncommitted borrowing arrangements with certain banks for temporary financing needs. Interest is charged to each fund, based on its borrowings, at rates equal to customary reference rates plus an agreed upon spread. For the year ended May 31, 2021, the fund’s commitment fee and interest expense were $610 and $0, respectively, and are included in “Miscellaneous” expense in the Statement of Operations.
35
Table of Contents
Notes to Financial Statements – continued
(7) Investments in Affiliated Issuers
An affiliated issuer may be considered one in which the fund owns 5% or more of the outstanding voting securities, or a company which is under common control. For the purposes of this report, the following were affiliated issuers:
| Affiliated Issuers | Beginning Value | Purchases | Sales Proceeds | Realized Gain (Loss) | Change in Appreciation or | Ending Value | ||||||||||||||||||
| MFS Growth Fund | $32,632,249 | $24,615,952 | $27,766,283 | $2,293,407 | $8,792,382 | $40,567,707 | ||||||||||||||||||
| MFS Institutional International Equity Fund | 33,133,260 | 20,370,356 | 26,426,839 | 2,729,207 | 10,757,589 | 40,563,573 | ||||||||||||||||||
| MFS Institutional Money Market Portfolio | 52,997 | 148,431,036 | 142,974,281 | (492 | ) | — | 5,509,260 | |||||||||||||||||
| MFS Value Fund | 33,219,479 | 21,725,328 | 27,643,900 | 2,890,041 | 10,292,493 | 40,483,441 | ||||||||||||||||||
| $99,037,985 | $215,142,672 | $224,811,303 | $7,912,163 | $29,842,464 | $127,123,981 | |||||||||||||||||||
| Affiliated Issuers | Dividend Income | Capital Gain Distributions | ||||||||||||||||||||||
| MFS Growth Fund |
| $— | $1,599,649 | |||||||||||||||||||||
| MFS Institutional International Equity Fund |
| 367,597 | 99,430 | |||||||||||||||||||||
| MFS Institutional Money Market Portfolio |
| 4,216 | — | |||||||||||||||||||||
| MFS Value Fund |
| 742,468 | 468,310 | |||||||||||||||||||||
| $1,114,281 | $2,167,389 | |||||||||||||||||||||||
(8) Impacts of COVID-19
The pandemic related to the global spread of novel coronavirus disease (COVID-19), which was first detected in December 2019, has resulted in significant disruptions to global business activity and the global economy, as well as the economies of individual countries, the financial performance of individual companies and sectors, and the securities and commodities markets in general. Multiple surges in cases globally, the availability and widespread adoption of vaccines, and the emergence of variant strains of the virus continue to create uncertainty as to the future and long-term impacts resulting from the pandemic including impacts to the prices and liquidity of the fund’s investments and the fund’s performance.
36
Table of Contents
REPORT OF INDEPENDENT REGISTERED PUBLIC ACCOUNTING FIRM
To the Shareholders of MFS Managed Wealth Fund and the Board of Trustees of
MFS Series Trust X
Opinion on the Financial Statements
We have audited the accompanying statement of assets and liabilities of MFS Managed Wealth Fund (the “Fund”) (one of the funds constituting MFS Series Trust X (the “Trust”)), including the portfolio of investments, as of May 31, 2021, and the related statement of operations for the year then ended, the statements of changes in net assets for each of the two years in the period then ended, the financial highlights for each of the five years in the period then ended and the related notes (collectively referred to as the “financial statements”). In our opinion, the financial statements present fairly, in all material respects, the financial position of the Fund (one of the funds constituting MFS Series Trust X) at May 31, 2021, the results of its operations for the year then ended, the changes in its net assets for each of the two years in the period then ended and its financial highlights for each of the five years in the period then ended, in conformity with U.S. generally accepted accounting principles.
Basis for Opinion
These financial statements are the responsibility of the Trust’s management. Our responsibility is to express an opinion on the Fund’s financial statements based on our audits. We are a public accounting firm registered with the Public Company Accounting Oversight Board (United States) (“PCAOB”) and are required to be independent with respect to the Trust in accordance with the U.S. federal securities laws and the applicable rules and regulations of the Securities and Exchange Commission and the PCAOB.
We conducted our audits in accordance with the standards of the PCAOB. Those standards require that we plan and perform the audit to obtain reasonable assurance about whether the financial statements are free of material misstatement, whether due to error or fraud. The Trust is not required to have, nor were we engaged to perform, an audit of the Trust’s internal control over financial reporting. As part of our audits, we are required to obtain an understanding of internal control over financial reporting but not for the purpose of expressing an opinion on the effectiveness of the Trust’s internal control over financial reporting. Accordingly, we express no such opinion.
Our audits included performing procedures to assess the risks of material misstatement of the financial statements, whether due to error or fraud, and performing procedures that respond to those risks. Such procedures included examining, on a test basis, evidence regarding the amounts and disclosures in the financial statements. Our procedures included confirmation of securities owned as of May 31, 2021, by correspondence with the custodian and others. Our audits also included evaluating the
37
Table of Contents
Report of Independent Registered Public Accounting Firm – continued
accounting principles used and significant estimates made by management, as well as evaluating the overall presentation of the financial statements. We believe that our audits provide a reasonable basis for our opinion.

We have served as the auditor of one or more MFS investment companies since 1993.
Boston, Massachusetts
July 16, 2021
38
Table of Contents
TRUSTEES AND OFFICERS — IDENTIFICATION AND BACKGROUND
The Trustees and Officers of the Trust, as of July 1, 2021, are listed below, together with their principal occupations during the past five years. (Their titles may have varied during that period.) The address of each Trustee and Officer is 111 Huntington Avenue, Boston, Massachusetts 02199-7618.
Name, Age | Position(s) with Fund | Trustee/Officer Since (h) | Number of | Principal the Past Five Years | Other Directorships | |||||
| INTERESTED TRUSTEES | ||||||||||
| Robert J. Manning (k) (age 57) | Trustee | February 2004 | 135 | Massachusetts Financial Services Company, Non-Executive Chairman (since January 2021); Director; Chairman of the Board; Executive Chairman (January 2017-2020); Co-Chief Executive Officer (2015-2016) | N/A | |||||
Michael W. Roberge (k) (age 54) | Trustee | January 2021 | 135 | Massachusetts Financial Services Company, Chairman (since January 2021); Chief Executive Officer (since January 2017); Director; President (until December 2018); Chief Investment Officer (until December 2018); Co-Chief Executive Officer (until December 2016) | N/A | |||||
| INDEPENDENT TRUSTEES | ||||||||||
John P. Kavanaugh (age 66) | Trustee and Chair of Trustees | January 2009 | 135 | Private investor | N/A | |||||
Steven E. Buller (age 69) | Trustee | February 2014 | 135 | Private investor | N/A | |||||
John A. Caroselli (age 67) | Trustee | March 2017 | 135 | Private investor; JC Global Advisors, LLC (management consulting), President (since 2015) | N/A | |||||
39
Table of Contents
Trustees and Officers – continued
Name, Age | Position(s) with Fund | Trustee/Officer Since (h) | Number of | Principal the Past Five Years | Other Directorships | |||||
Maureen R. Goldfarb (age 66) | Trustee | January 2009 | 135 | Private investor | N/A | |||||
| Peter D. Jones (age 65) | Trustee | January 2019 | 135 | Private investor | N/A | |||||
| James W. Kilman, Jr. (age 60) | Trustee | January 2019 | 135 | Burford Capital Limited (finance and investment management), Senior Advisor (since May 3, 2021), Chief Financial Officer (2019-May 2, 2021); KielStrand Capital LLC (family office), Chief Executive Officer (since 2016); Morgan Stanley & Co. (financial services), Vice Chairman of Investment Banking, Co-Head of Diversified Financials Coverage – Financial Institutions Investment Banking Group (until 2016) | Alpha-En Corporation, Director (2016-2019) | |||||
Clarence Otis, Jr. (age 65) | Trustee | March 2017 | 135 | Private investor | VF Corporation, Director; Verizon Communications, Inc., Director; The Travelers Companies, Director | |||||
Maryanne L. Roepke (age 65) | Trustee | May 2014 | 135 | Private investor | N/A | |||||
| Laurie J. Thomsen (age 63) | Trustee | March 2005 | 135 | Private investor | The Travelers Companies, Director; Dycom Industries, Inc., Director | |||||
40
Table of Contents
Trustees and Officers – continued
Name, Age | Position(s) Held with Fund | Trustee/Officer Since (h) | Number of | Principal the Past Five Years | ||||
| OFFICERS | ||||||||
| Christopher R. Bohane (k) (age 47) | Assistant Secretary and Assistant Clerk | July 2005 | 135 | Massachusetts Financial Services Company, Senior Vice President and Associate General Counsel | ||||
Kino Clark (k) (age 53) | Assistant Treasurer | January 2012 | 135 | Massachusetts Financial Services Company, Vice President | ||||
John W. Clark, Jr. (k) (age 54) | Assistant Treasurer | April 2017 | 135 | Massachusetts Financial Services Company, Vice President (since March 2017); Deutsche Bank (financial services), Department Head – Treasurer’s Office (until February 2017) | ||||
Thomas H. Connors (k) (age 61) | Assistant Secretary and Assistant Clerk | September 2012 | 135 | Massachusetts Financial Services Company, Vice President and Senior Counsel | ||||
| David L. DiLorenzo (k) (age 52) | President | July 2005 | 135 | Massachusetts Financial Services Company, Senior Vice President | ||||
Heidi W. Hardin (k) (age 53) | Secretary and Clerk | April 2017 | 135 | Massachusetts Financial Services Company, Executive Vice President and General Counsel (since March 2017); Harris Associates (investment management), General Counsel (until January 2017) | ||||
Brian E. Langenfeld (k) (age 48) | Assistant Secretary and Assistant Clerk | June 2006 | 135 | Massachusetts Financial Services Company, Vice President and Senior Counsel | ||||
Amanda S. Mooradian (k) (age 42) | Assistant Secretary and Assistant Clerk | September 2018 | 135 | Massachusetts Financial Services Company, Assistant Vice President and Senior Counsel | ||||
| Susan A. Pereira (k) (age 50) | Assistant Secretary and Assistant Clerk | July 2005 | 135 | Massachusetts Financial Services Company, Vice President and Assistant General Counsel | ||||
Kasey L. Phillips (k) (age 50) | Assistant Treasurer | September 2012 | 135 | Massachusetts Financial Services Company, Vice President | ||||
41
Table of Contents
Trustees and Officers – continued
Name, Age | Position(s) Held with Fund | Trustee/Officer Since (h) | Number of | Principal the Past Five Years | ||||
Matthew A. Stowe (k) (age 46) | Assistant Secretary and Assistant Clerk | October 2014 | 135 | Massachusetts Financial Services Company, Vice President and Assistant General Counsel | ||||
Martin J. Wolin (k) (age 53) | Chief Compliance Officer | July 2015 | 135 | Massachusetts Financial Services Company, Senior Vice President and Chief Compliance Officer | ||||
| James O. Yost (k) (age 61) | Treasurer | September 1990 | 135 | Massachusetts Financial Services Company, Senior Vice President | ||||
| (h) | Date first appointed to serve as Trustee/Officer of an MFS Fund. Each Trustee has served continuously since appointment unless indicated otherwise. For the period from December 15, 2004 until February 22, 2005, Mr. Manning served as Advisory Trustee. From January 2012 through December 2016, Messrs. DiLorenzo and Yost served as Treasurer and Deputy Treasurer of the Funds, respectively. |
| (j) | Directorships or trusteeships of companies required to report to the Securities and Exchange Commission (i.e., “public companies”). |
| (k) | “Interested person” of the Trust within the meaning of the Investment Company Act of 1940 (referred to as the 1940 Act), which is the principal federal law governing investment companies like the fund, as a result of a position with MFS. The address of MFS is 111 Huntington Avenue, Boston, Massachusetts 02199-7618. |
Each Trustee (other than Messrs. Jones, Kilman and Roberge) has been elected by shareholders and each Trustee and Officer holds office until his or her successor is chosen and qualified or until his or her earlier death, resignation, retirement or removal. Mr. Roberge became a Trustee of the Funds on January 1, 2021 and Messrs. Jones and Kilman became Trustees of the Funds on January 1, 2019. The Trust does not hold annual meetings for the purpose of electing Trustees, and Trustees are not elected for fixed terms. Under the terms of the Board’s retirement policy, an Independent Trustee shall retire at the end of the calendar year in which he or she reaches the earlier of 75 years of age or 15 years of service on the Board (or, in the case of any Independent Trustee who joined the Board prior to 2015, 20 years of service on the Board).
Messrs. Buller, Kilman and Otis and Ms. Roepke are members of the Trust’s Audit Committee.
Each of the Interested Trustees and certain Officers hold comparable officer positions with certain affiliates of MFS.
42
Table of Contents
Trustees and Officers – continued
The Statement of Additional Information for a Fund includes further information about the Trustees and is available without charge upon request by calling 1-800-225-2606.
| Investment Adviser | Custodian | |
Massachusetts Financial Services Company Boston, MA 02199-7618 | State Street Bank and Trust Company 1 Lincoln Street Boston, MA 02111-2900 | |
| Distributor | Independent Registered Public Accounting Firm | |
MFS Fund Distributors, Inc. Boston, MA 02199-7618 | Ernst & Young LLP 200 Clarendon Street Boston, MA 02116 | |
| Portfolio Manager(s) | ||
William Adams Robert Almeida Mike Roberge Barnaby Wiener |
43
Table of Contents
STATEMENT REGARDING LIQUIDITY RISK MANAGEMENT PROGRAM
The fund has adopted and implemented a liquidity risk management program (the “Program”) as required by Rule 22e-4 under the Investment Company Act of 1940, as amended. The fund’s Board of Trustees (the “Board”) has designated MFS as the administrator of the Program. The Program is reasonably designed to assess and manage the liquidity risk of the fund. Liquidity risk is the risk that the fund could not meet requests to redeem shares issued by the fund without significant dilution of remaining investors’ interests.
MFS provided a written report to the Board for consideration at its April 2021 meeting that addressed the operation of the Program and provided an assessment of the adequacy and effectiveness of the Program during the period from January 1, 2020 to December 31, 2020 (the “Covered Period”). The report concluded that during the Covered Period the Program had operated effectively and had adequately and effectively been implemented to assess and manage the fund’s liquidity risk. MFS also reported that there were no liquidity events that impacted the fund or its ability to timely meet redemptions without dilution to existing shareholders during the Covered Period.
There can be no assurance that the Program will achieve its objectives in the future. Further information on liquidity risk, and other principal risks to which an investment in the fund may be subject, can be found in the prospectus.
44
Table of Contents
PROXY VOTING POLICIES AND INFORMATION
MFS votes proxies on behalf of the fund pursuant to proxy voting policies and procedures that are available without charge, upon request, by calling 1-800-225-2606, by visiting mfs.com/proxyvoting, or by visiting the SEC Web site at http://www.sec.gov.
Information regarding how the fund voted proxies relating to portfolio securities during the most recent twelve-month period ended June 30 is available by August 31 of each year without charge by visiting mfs.com/proxyvoting, or by visiting the SEC’s Web site at http://www.sec.gov.
QUARTERLY PORTFOLIO DISCLOSURE
The fund files a complete schedule of portfolio holdings with the SEC for the first and third quarters of each fiscal year as an exhibit to its reports on Form N-PORT. The fund’s Form N-PORT reports are available on the SEC’s Web site at http://www.sec.gov. A shareholder can obtain the portfolio holdings report for the first and third quarters of the fund’s fiscal year at mfs.com/openendfunds by choosing the fund’s name and then scrolling to the “Resources” section and clicking on the “Prospectus and Reports” tab.
From time to time, MFS may post important information about the fund or the MFS Funds on the MFS Web site (mfs.com). This information is available at https://www.mfs.com/announcements or at mfs.com/openendfunds by choosing the fund’s name and then scrolling to the “Resources” section and clicking on the “Announcements” tab, if any.
INFORMATION ABOUT FUND CONTRACTS AND LEGAL CLAIMS
The fund has entered into contractual arrangements with an investment adviser, administrator, distributor, shareholder servicing agent, 529 program manager (if applicable), and custodian who each provide services to the fund. Unless expressly stated otherwise, shareholders are not parties to, or intended beneficiaries of these contractual arrangements, and these contractual arrangements are not intended to create any shareholder right to enforce them against the service providers or to seek any remedy under them against the service providers, either directly or on behalf of the fund.
Under the Trust’s By-Laws and Declaration of Trust, any claims asserted against or on behalf of the MFS Funds, including claims against Trustees and Officers, must be brought in state and federal courts located within the Commonwealth of Massachusetts.
FEDERAL TAX INFORMATION (unaudited)
The fund will notify shareholders of amounts for use in preparing 2021 income tax forms in January 2022. The following information is provided pursuant to provisions of the Internal Revenue Code.
The fund designates the maximum amount allowable as qualified dividend income eligible to be taxed at the same rate as long-term capital gain.
For corporate shareholders, 91.98% of the ordinary income dividends paid during the fiscal year qualify for the corporate dividends received deduction.
45
Table of Contents
rev. 3/16
| WHAT DOES MFS DO WITH YOUR PERSONAL INFORMATION? |  | ||
| Why? | Financial companies choose how they share your personal information. Federal law gives consumers the right to limit some but not all sharing. Federal law also requires us to tell you how we collect, share, and protect your personal information. Please read this notice carefully to understand what we do. |
| What? | The types of personal information we collect and share depend on the product or service you have with us. This information can include:
• Social Security number and account balances • Account transactions and transaction history • Checking account information and wire transfer instructions
When you are no longer our customer, we continue to share your information as described in this notice. |
| How? | All financial companies need to share customers’ personal information to run their everyday business. In the section below, we list the reasons financial companies can share their customers’ personal information; the reasons MFS chooses to share; and whether you can limit this sharing. |
| Reasons we can share your personal information | Does MFS share? | Can you limit this sharing? | ||
For our everyday business purposes – such as to process your transactions, maintain your account(s), respond to court orders and legal investigations, or report to credit bureaus | Yes | No | ||
For our marketing purposes – to offer our products and services to you | No | We don’t share | ||
For joint marketing with other financial companies | No | We don’t share | ||
For our affiliates’ everyday business purposes – information about your transactions and experiences | No | We don’t share | ||
For our affiliates’ everyday business purposes – information about your creditworthiness | No | We don’t share | ||
| For nonaffiliates to market to you | No | We don’t share |
| Questions? | Call 800-225-2606 or go to mfs.com. | |
46
Table of Contents
| Page 2 |
| Who we are | ||
| Who is providing this notice? | MFS Funds, MFS Investment Management, MFS Institutional Advisors, Inc., and MFS Heritage Trust Company. | |
| What we do | ||
| How does MFS protect my personal information? | To protect your personal information from unauthorized access and use, we use security measures that comply with federal law. These measures include procedural, electronic, and physical safeguards for the protection of the personal information we collect about you. | |
| How does MFS collect my personal information? | We collect your personal information, for example, when you
• open an account or provide account information • direct us to buy securities or direct us to sell your securities • make a wire transfer
We also collect your personal information from others, such as credit bureaus, affiliates, or other companies. | |
| Why can’t I limit all sharing? | Federal law gives you the right to limit only
• sharing for affiliates’ everyday business purposes – information about your creditworthiness • affiliates from using your information to market to you • sharing for nonaffiliates to market to you
State laws and individual companies may give you additional rights to limit sharing. | |
| Definitions | ||
| Affiliates | Companies related by common ownership or control. They can be financial and nonfinancial companies.
• MFS does not share personal information with affiliates, except for everyday business purposes as described on page one of this notice. | |
| Nonaffiliates | Companies not related by common ownership or control. They can be financial and nonfinancial companies.
• MFS does not share with nonaffiliates so they can market to you. | |
| Joint marketing | A formal agreement between nonaffiliated financial companies that together market financial products or services to you.
• MFS doesn’t jointly market. | |
| Other important information | ||
| If you own an MFS product or receive an MFS service in the name of a third party such as a bank or broker-dealer, their privacy policy may apply to you instead of ours. | ||
47
Table of Contents
Save paper with eDelivery.
| MFS® will send you prospectuses, |

reports, and proxies directly via e-mail so you will get information faster with less mailbox clutter.
To sign up:
1. Go to mfs.com.
2. Log in via MFS® Access.
3. Select eDelivery.
If you own your MFS fund shares through a financial institution or a retirement plan, MFS® TALK, MFS® Access, or eDelivery may not be available to you.
WEB SITE
mfs.com
MFS TALK
1-800-637-8255
24 hours a day
ACCOUNT SERVICE AND LITERATURE
Shareholders
1-800-225-2606
Financial advisors
1-800-343-2829
Retirement plan services
1-800-637-1255
MAILING ADDRESS
MFS Service Center, Inc.
P.O. Box 219341
Kansas City, MO 64121-9341
OVERNIGHT MAIL
MFS Service Center, Inc.
Suite 219341
430 W 7th Street
Kansas City, MO 64105-1407
Table of Contents
Annual Report
May 31, 2021

MFS® Blended Research®
Growth Equity Fund

BRW-ANN
Table of Contents
MFS® Blended Research® Growth Equity Fund
| Contact information | back cover |
The report is prepared for the general information of shareholders. It is authorized for distribution to prospective investors only when preceded or accompanied by a current prospectus.
NOT FDIC INSURED • MAY LOSE VALUE • NO BANK GUARANTEE
Table of Contents

Dear Shareholders:
Markets have experienced dramatic swings since the coronavirus pandemic brought the global economy to a standstill for several months early in 2020. While the speedy
development of vaccines brightened the economic and market outlook, uncertainty remains as new variants of the virus appear, and questions persist over how fast vaccines can be made widely available in the developing world.
Global central banks have taken aggressive steps to cushion the economic and market fallout related to the virus, and governments are deploying unprecedented levels of fiscal support. Having passed a $1.9 trillion stimulus package in March, the U.S. Congress could approve additional stimulus later this year, some of it focused on infrastructure. Along with extraordinary government expenditures, pent-up consumer demand fueled a surge in economic activity as coronavirus restrictions were eased, pushing up inflation, at least temporarily. Markets reacted by pushing up
yields on global government bonds, though some of the rate rise has since been corrected.
A spirited debate is underway among investors over whether the current price pressures will persist or prove to be temporary, caused by pandemic-induced bottlenecks. The policy measures put in place to counteract the pandemic’s effects have helped build a supportive environment and are encouraging economic recovery; however, if markets disconnect from fundamentals, they can sow the seeds of instability. As such, recent dramatic increases in speculative trading in cryptocurrencies, special purpose acquisition companies (SPACs), and the like bear watching.
In the aftermath of the crisis, we could see societal changes as households, businesses, and governments adjust to a new reality, and any such alterations could affect the investment landscape. For investors, events such as the COVID-19 outbreak demonstrate the importance of having a deep understanding of company fundamentals, and we have built our global research platform to do just that.
At MFS®, we put our clients’ assets to work responsibly by carefully navigating the increasing complexity of global markets and economies. Guided by our long-term philosophy and adhering to our commitment to sustainable investing, we tune out the noise and aim to uncover what we believe are the best, most durable investment opportunities in the market. Our unique global investment platform combines collective expertise, long-term discipline, and thoughtful risk management to create sustainable value for investors.
Respectfully,

Michael W. Roberge
Chief Executive Officer
MFS Investment Management
July 16, 2021
The opinions expressed in this letter are subject to change and may not be relied upon for investment advice. No forecasts can be guaranteed.
1
Table of Contents
Portfolio structure

| Top ten holdings | ||||
| Apple, Inc. | 9.0% | |||
| Microsoft Corp. | 8.9% | |||
| Amazon.com, Inc. | 6.1% | |||
| Facebook, Inc., “A “ | 5.3% | |||
| Alphabet, Inc., “A” | 2.7% | |||
| Alphabet, Inc., “C” | 2.6% | |||
| PayPal Holdings, Inc. | 2.4% | |||
| Adobe Systems, Inc. | 2.4% | |||
| Applied Materials, Inc. | 2.0% | |||
| Home Depot, Inc. | 1.8% |
| GICS equity sectors (g) |
| |||
| Information Technology | 43.1% | |||
| Consumer Discretionary | 15.0% | |||
| Health Care | 14.5% | |||
| Communication Services | 13.2% | |||
| Industrials | 4.6% | |||
| Consumer Staples | 3.9% | |||
| Real Estate | 2.8% | |||
| Financials | 1.2% | |||
| Materials | 0.9% | |||
| (g) | The Global Industry Classification Standard (GICS®) was developed by and/or is the exclusive property of MSCI, Inc. and S&P Global Market Intelligence Inc. (“S&P Global Market Intelligence”). GICS is a service mark of MSCI and S&P Global Market Intelligence and has been licensed for use by MFS. MFS has applied its own internal sector/industry classification methodology for equity securities and non-equity securities that are unclassified by GICS. |
Cash & Cash Equivalents includes any cash, investments in money market funds, short-term securities, and other assets less liabilities. Please see the Statement of Assets and Liabilities for additional information related to the fund’s cash position and other assets and liabilities.
Percentages are based on net assets as of May 31, 2021.
The portfolio is actively managed and current holdings may be different.
2
Table of Contents
Summary of Results
For the twelve months ended May 31, 2021, Class A shares of the MFS Blended Research Growth Equity Fund (fund) provided a total return of 35.89%, at net asset value. This compares with a return of 39.92% for the fund’s benchmark, the Russell 1000® Growth Index.
Market Environment
The global economy continued to recover from the most unusual recession in memory while financial markets benefited from massive fiscal and monetary intervention aimed at offsetting the economic effects of the pandemic. In developed markets, vaccine distribution broadened after getting off to a slower-than-hoped-for start in some locales, although concerns remained that too few people will be inoculated for herd immunity to be achieved. On balance, emerging markets experienced slower rollouts than developed markets amid ongoing vaccine supply constraints.
Around the world, central banks responded quickly and massively to the crisis with programs to improve liquidity and support markets. These undertakings proved largely successful in helping to restore market function, ease volatility and stimulate a prolonged rebound. In the first half of the period, the US Federal Reserve adopted a new, flexible, average-inflation-targeting framework, which is expected to result in the federal funds rate remaining at low levels longer than under its previous model. Due to relatively manageable external liabilities and balances of payments in many countries and persistently low inflation, even emerging market countries were able to implement countercyclical policies – a departure from the usual market-dictated response to risk-off crises.
Late in the period, markets grappled with the threat of resurgent inflation resulting from pandemic-induced production bottlenecks, monumental levels of economic stimulus and the unleashing of post-lockdown pent-up demand. Meanwhile, raw materials prices rebounded strongly on account of the surprising resilience of the global manufacturing sector during the pandemic. In response to these factors, global government bond yields rose materially in recent months and market leadership shifted from a handful of mega-cap technology companies to a broader array of small-cap and value stocks. At the same time, signs of excess investor enthusiasm were seen in pockets of the market, such as the “meme stocks” popular with users of online message boards and equities issued by special purpose acquisition companies (SPACs).
Detractors from Performance
Stock selection within the consumer discretionary sector detracted from performance relative to the Russell® 1000 Growth Index. Within this sector, the timing of the fund’s ownership in shares of electric vehicle manufacturer Tesla, and an overweight position in pizza delivery company Domino’s Pizza (h), held back relative results. The stock price of Tesla advanced as the company posted solid earnings results during the period, driven by strong gross profits, revenue and margin results due, in part, to higher regulatory credits.
3
Table of Contents
Management Review – continued
Stock selection in the health care sector also weakened relative returns. Within this sector, the fund’s overweight positions in biotechnology company Biogen (h), pharmaceutical company Incyte Corp and health care provider Humana hindered relative performance.
Elsewhere, the fund’s holdings of office and consumer paper products maker Kimberly-Clark (b) and semiconductor company Intel (b) dampened relative results. The stock price of Kimberly-Clark depreciated as the company reported disappointing financial results and guidance that missed market expectations. Weakness in the company’s professional division and higher selling, general and administration costs, weighed on the company’s results. In addition, the timing of the fund’s ownership in shares of information technology services provider Leidos (h) and power generation company NRG Energy (h) weakened relative returns.
The fund’s cash and/or cash equivalents position during the period was also a detractor from relative performance. Under normal market conditions, the fund strives to be fully invested and generally holds cash to buy new holdings and to provide liquidity. In a period when equity markets appreciated, as measured by the fund’s benchmark, holding cash hurt performance versus the benchmark, which has no cash position.
Contributors to Performance
Stock selection in the industrials sector contributed to relative performance. Within this sector, the fund’s holdings of agricultural equipment manufacturer AGCO (b) and railroad company Kansas City Southern (b) benefited relative returns. The stock price of AGCO appreciated as the company’s earnings results exceeded consensus estimates on the back of strong sales performance.
The timing of the fund’s exposure to the real estate sector also bolstered relative returns, led by not holding shares of broadcast and communication tower management firm American Tower.
Within other sectors, an overweight position in semiconductor chips and electronics engineering solutions provider Applied Materials, software engineering solutions and technology services provider EPAM Systems, hospital operator HCA Healthcare and cybersecurity technology company CrowdStrike, and not holding shares of biotechnology firm Amgen, helped relative performance. The stock price of Applied Materials advanced as the company reported solid revenue figures and provided favorable guidance, driven by stronger-than-anticipated semiconductor and services sales. Additionally, the fund’s holdings of insurance company MetLife (b) and automotive seating manufacturer Lear (b) further benefited relative returns.
Respectfully,
Portfolio Manager(s)
Jim Fallon, Matt Krummell, Jonathan Sage, and Jed Stocks
| (b) | Security is not a benchmark constituent. |
| (h) | Security was not held in the portfolio at period end. |
4
Table of Contents
Management Review – continued
The views expressed in this report are those of the portfolio manager(s) only through the end of the period of the report as stated on the cover and do not necessarily reflect the views of MFS or any other person in the MFS organization. These views are subject to change at any time based on market or other conditions, and MFS disclaims any responsibility to update such views. These views may not be relied upon as investment advice or an indication of trading intent on behalf of any MFS portfolio. References to specific securities are not recommendations of such securities, and may not be representative of any MFS portfolio’s current or future investments.
5
Table of Contents
PERFORMANCE SUMMARY THROUGH 5/31/21
The following chart illustrates a representative class of the fund’s historical performance in comparison to its benchmark(s). Performance results include the deduction of the maximum applicable sales charge and reflect the percentage change in net asset value, including reinvestment of dividends and capital gains distributions. The performance of other share classes will be greater than or less than that of the class depicted below. Benchmarks are unmanaged and may not be invested in directly. Benchmark returns do not reflect sales charges, commissions or expenses. (See Notes to Performance Summary.)
Performance data shown represents past performance and is no guarantee of future results. Investment return and principal value fluctuate so your shares, when sold, may be worth more or less than the original cost; current performance may be lower or higher than quoted. The performance shown does not reflect the deduction of taxes, if any, that a shareholder would pay on fund distributions or the redemption of fund shares.
Growth of a Hypothetical $10,000 Investment (t)
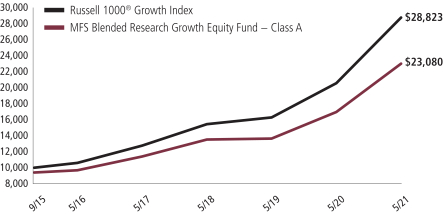
6
Table of Contents
Performance Summary – continued
Total Returns through 5/31/21
Average annual without sales charge
| Share Class | Class Inception Date | 1-yr | 5-yr | Life (t) | ||||||||
| A | 9/15/15 | 35.89% | 18.95% | 16.97% | ||||||||
| B | 9/15/15 | 34.89% | 18.07% | 16.11% | ||||||||
| C | 9/15/15 | 34.91% | 18.07% | 16.10% | ||||||||
| I | 9/15/15 | 36.23% | 19.26% | 17.27% | ||||||||
| R1 | 9/15/15 | 34.91% | 18.06% | 16.10% | ||||||||
| R2 | 9/15/15 | 35.52% | 18.66% | 16.68% | ||||||||
| R3 | 9/15/15 | 35.85% | 18.96% | 16.97% | ||||||||
| R4 | 9/15/15 | 36.34% | 19.28% | 17.28% | ||||||||
| R6 | 9/15/15 | 36.37% | 19.37% | 17.36% | ||||||||
| Comparative benchmark(s) | ||||||||||||
| Russell 1000® Growth Index (f) | 39.92% | 22.07% | 20.35% | |||||||||
| Average annual with sales charge | ||||||||||||
| A With Initial Sales Charge (5.75%) | 28.07% | 17.55% | 15.77% | |||||||||
| B With CDSC (Declining over six years from 4% to 0%) (v) | 30.89% | 17.87% | 16.02% | |||||||||
| C With CDSC (1% for 12 months) (v) | 33.91% | 18.07% | 16.10% | |||||||||
CDSC – Contingent Deferred Sales Charge.
Class I, R1, R2, R3, R4, and R6 shares do not have a sales charge.
| (f) | Source: FactSet Research Systems Inc. |
| (t) | For the period from the class inception date through the stated period end. (See Notes to Performance Summary.) |
| (v) | Assuming redemption at the end of the applicable period. |
Benchmark Definition(s)
Russell 1000® Growth Index (h) – constructed to provide a comprehensive barometer for growth securities in the large-cap segment of the U.S. equity universe. Companies in this index generally have higher price-to-book ratios and higher forecasted growth values.
It is not possible to invest directly in an index.
| (h) | Frank Russell Company (“Russell”) is the source and owner of the trademarks, service marks, and copyrights related to the Russell Indexes. Russell® is a trademark of Frank Russell Company. Neither Russell nor its licensors accept any liability for any errors or omissions in the Russell Indexes and/or Russell ratings or underlying data and no party may rely on any Russell Indexes and/or Russell ratings and/or underlying data contained in this document. No further distribution of Russell Data is permitted without Russell’s express written consent. Russell does not promote, sponsor, or endorse the content of this document. |
7
Table of Contents
Performance Summary – continued
Notes to Performance Summary
Average annual total return represents the average annual change in value for each share class for the periods presented. Life returns are presented where the share class has less than 10 years of performance history and represent the average annual total return from the class inception date to the stated period end date.
Performance results reflect any applicable expense subsidies and waivers in effect during the periods shown. Without such subsidies and waivers the fund’s performance results would be less favorable. Please see the prospectus and financial statements for complete details.
Performance results do not include adjustments made for financial reporting purposes in accordance with U.S. generally accepted accounting principles and may differ from amounts reported in the financial highlights.
From time to time the fund may receive proceeds from litigation settlements, without which performance would be lower.
8
Table of Contents
Fund expenses borne by the shareholders during the period, December 1, 2020 through May 31, 2021
As a shareholder of the fund, you incur two types of costs: (1) transaction costs, including sales charges (loads) on certain purchase or redemption payments, and (2) ongoing costs, including management fees; distribution and service (12b-1) fees; and other fund expenses. This example is intended to help you understand your ongoing costs (in dollars) of investing in the fund and to compare these costs with the ongoing costs of investing in other mutual funds.
The example is based on an investment of $1,000 invested at the beginning of the period and held for the entire period December 1, 2020 through May 31, 2021.
Actual Expenses
The first line for each share class in the following table provides information about actual account values and actual expenses. You may use the information in this line, together with the amount you invested, to estimate the expenses that you paid over the period. Simply divide your account value by $1,000 (for example, an $8,600 account value divided by $1,000 = 8.6), then multiply the result by the number in the first line under the heading entitled “Expenses Paid During Period” to estimate the expenses you paid on your account during this period.
Hypothetical Example for Comparison Purposes
The second line for each share class in the following table provides information about hypothetical account values and hypothetical expenses based on the fund’s actual expense ratio and an assumed rate of return of 5% per year before expenses, which is not the fund’s actual return. The hypothetical account values and expenses may not be used to estimate the actual ending account balance or expenses you paid for the period. You may use this information to compare the ongoing costs of investing in the fund and other funds. To do so, compare this 5% hypothetical example with the 5% hypothetical examples that appear in the shareholder reports of the other funds.
Please note that the expenses shown in the table are meant to highlight your ongoing costs only and do not reflect any transactional costs, such as sales charges (loads). Therefore, the second line for each share class in the table is useful in comparing ongoing costs only, and will not help you determine the relative total costs of owning different funds. In addition, if these transactional costs were included, your costs would have been higher.
9
Table of Contents
Expense Table – continued
| Share Class | Annualized Expense Ratio | Beginning Account Value 12/01/20 | Ending Account Value 5/31/21 | Expenses Paid During Period (p) 12/01/20-5/31/21 | ||||||||||||||
| A | Actual | 0.74% | $1,000.00 | $1,135.87 | $3.94 | |||||||||||||
| Hypothetical (h) | 0.74% | $1,000.00 | $1,021.24 | $3.73 | ||||||||||||||
| B | Actual | 1.49% | $1,000.00 | $1,131.32 | $7.92 | |||||||||||||
| Hypothetical (h) | 1.49% | $1,000.00 | $1,017.50 | $7.49 | ||||||||||||||
| C | Actual | 1.49% | $1,000.00 | $1,131.40 | $7.92 | |||||||||||||
| Hypothetical (h) | 1.49% | $1,000.00 | $1,017.50 | $7.49 | ||||||||||||||
| I | Actual | 0.49% | $1,000.00 | $1,137.29 | $2.61 | |||||||||||||
| Hypothetical (h) | 0.49% | $1,000.00 | $1,022.49 | $2.47 | ||||||||||||||
| R1 | Actual | 1.49% | $1,000.00 | $1,131.40 | $7.92 | |||||||||||||
| Hypothetical (h) | 1.49% | $1,000.00 | $1,017.50 | $7.49 | ||||||||||||||
| R2 | Actual | 0.99% | $1,000.00 | $1,134.00 | $5.27 | |||||||||||||
| Hypothetical (h) | 0.99% | $1,000.00 | $1,020.00 | $4.99 | ||||||||||||||
| R3 | Actual | 0.74% | $1,000.00 | $1,135.69 | $3.94 | |||||||||||||
| Hypothetical (h) | 0.74% | $1,000.00 | $1,021.24 | $3.73 | ||||||||||||||
| R4 | Actual | 0.49% | $1,000.00 | $1,137.62 | $2.61 | |||||||||||||
| Hypothetical (h) | 0.49% | $1,000.00 | $1,022.49 | $2.47 | ||||||||||||||
| R6 | Actual | 0.40% | $1,000.00 | $1,137.39 | $2.13 | |||||||||||||
| Hypothetical (h) | 0.40% | $1,000.00 | $1,022.94 | $2.02 | ||||||||||||||
| (h) | 5% class return per year before expenses. |
| (p) | “Expenses Paid During Period” are equal to each class’s annualized expense ratio, as shown above, multiplied by the average account value over the period, multiplied by 182/365 (to reflect the one-half year period). Expenses paid do not include any applicable sales charges (loads). If these transaction costs had been included, your costs would have been higher. |
10
Table of Contents
5/31/21
The Portfolio of Investments is a complete list of all securities owned by your fund. It is categorized by broad-based asset classes.
| Issuer | Shares/Par | Value ($) | ||||||
| Common Stocks - 99.2% | ||||||||
| Aerospace & Defense - 0.1% | ||||||||
| Northrop Grumman Corp. | 901 | $ | 329,649 | |||||
| Apparel Manufacturers - 0.4% | ||||||||
| NIKE, Inc., “B” | 7,319 | $ | 998,751 | |||||
| Automotive - 2.2% | ||||||||
| Lear Corp. | 10,804 | $ | 2,089,061 | |||||
| Tesla, Inc. (a) | 5,958 | 3,725,061 | ||||||
|
| |||||||
| $ | 5,814,122 | |||||||
| Biotechnology - 2.2% | ||||||||
| Illumina, Inc. (a) | 1,814 | $ | 735,831 | |||||
| Incyte Corp. (a) | 15,194 | 1,272,953 | ||||||
| Moderna, Inc. (a) | 1,910 | 353,369 | ||||||
| Regeneron Pharmaceuticals, Inc. (a) | 1,825 | 916,935 | ||||||
| Vertex Pharmaceuticals, Inc. (a) | 12,498 | 2,607,458 | ||||||
|
| |||||||
| $ | 5,886,546 | |||||||
| Broadcasting - 0.2% | ||||||||
| Discovery Communications, Inc., “C” (a) | 9,001 | $ | 270,480 | |||||
| Netflix, Inc. (a) | 517 | 259,953 | ||||||
|
| |||||||
| $ | 530,433 | |||||||
| Business Services - 5.3% | ||||||||
| Accenture PLC, “A” | 15,473 | $ | 4,365,862 | |||||
| CBRE Group, Inc., “A” (a) | 3,616 | 317,412 | ||||||
| Dropbox, Inc. (a) | 43,246 | 1,182,778 | ||||||
| Etsy, Inc. (a) | 808 | 133,102 | ||||||
| Fiserv, Inc. (a) | 11,125 | 1,281,600 | ||||||
| PayPal Holdings, Inc. (a) | 24,201 | 6,292,744 | ||||||
| Syneos Health, Inc. (a) | 3,818 | 335,602 | ||||||
|
| |||||||
| $ | 13,909,100 | |||||||
| Cable TV - 1.2% | ||||||||
| Charter Communications, Inc., “A” (a) | 4,324 | $ | 3,003,148 | |||||
| Comcast Corp., “A” | 4,680 | 268,351 | ||||||
|
| |||||||
| $ | 3,271,499 | |||||||
| Computer Software - 16.3% | ||||||||
| Adobe Systems, Inc. (a) | 12,353 | $ | 6,233,077 | |||||
| Atlassian Corp. PLC, “A” (a) | 13,427 | 3,132,250 | ||||||
11
Table of Contents
Portfolio of Investments – continued
| Issuer | Shares/Par | Value ($) | ||||||
| Common Stocks - continued | ||||||||
| Computer Software - continued | ||||||||
| Autodesk, Inc. (a) | 4,681 | $ | 1,338,111 | |||||
| Cadence Design Systems, Inc. (a) | 10,015 | 1,271,805 | ||||||
| CrowdStrike Holdings, Inc. (a) | 14,073 | 3,126,317 | ||||||
| DocuSign, Inc. (a) | 12,880 | 2,596,865 | ||||||
| Microsoft Corp. | 94,052 | 23,482,903 | ||||||
| Okta, Inc. (a) | 963 | 214,210 | ||||||
| salesforce.com, inc. (a) | 1,436 | 341,912 | ||||||
| Zoom Video Communications, Inc. (a) | 3,905 | 1,294,625 | ||||||
|
| |||||||
| $ | 43,032,075 | |||||||
| Computer Software - Systems - 13.3% | ||||||||
| Apple, Inc. | 191,181 | $ | 23,823,065 | |||||
| EPAM Systems, Inc. (a) | 5,656 | 2,701,306 | ||||||
| HP, Inc. | 35,667 | 1,042,546 | ||||||
| ServiceNow, Inc. (a) | 8,931 | 4,232,222 | ||||||
| Square, Inc., “A” (a) | 6,540 | 1,455,281 | ||||||
| SS&C Technologies Holdings, Inc. | 12,441 | 919,017 | ||||||
| Zebra Technologies Corp., “A” (a) | 1,967 | 977,697 | ||||||
|
| |||||||
| $ | 35,151,134 | |||||||
| Construction - 1.1% | ||||||||
| D.R. Horton, Inc. | 28,145 | $ | 2,681,937 | |||||
| Sherwin-Williams Co. | 760 | 215,483 | ||||||
|
| |||||||
| $ | 2,897,420 | |||||||
| Consumer Products - 1.1% | ||||||||
| Energizer Holdings, Inc. | 11,592 | $ | 533,696 | |||||
| Kimberly-Clark Corp. | 18,218 | 2,379,817 | ||||||
|
| |||||||
| $ | 2,913,513 | |||||||
| Containers - 0.3% | ||||||||
| Graphic Packaging Holding Co. | 37,530 | $ | 663,530 | |||||
| Electrical Equipment - 0.2% | ||||||||
| Sensata Technologies Holding PLC (a) | 8,722 | $ | 518,348 | |||||
| Electronics - 6.0% | ||||||||
| Advanced Micro Devices (a) | 22,050 | $ | 1,765,764 | |||||
| Applied Materials, Inc. | 38,881 | 5,370,633 | ||||||
| Intel Corp. | 16,996 | 970,811 | ||||||
| Lam Research Corp. | 1,469 | 954,630 | ||||||
| NVIDIA Corp. | 3,758 | 2,441,873 | ||||||
| Texas Instruments, Inc. | 22,248 | 4,223,115 | ||||||
|
| |||||||
| $ | 15,726,826 | |||||||
12
Table of Contents
Portfolio of Investments – continued
| Issuer | Shares/Par | Value ($) | ||||||
| Common Stocks - continued | ||||||||
| Engineering - Construction - 0.4% | ||||||||
| Quanta Services, Inc. | 11,807 | $ | 1,125,797 | |||||
| Food & Beverages - 1.0% | ||||||||
| General Mills, Inc. | 15,764 | $ | 990,925 | |||||
| PepsiCo, Inc. | 10,579 | 1,565,057 | ||||||
|
| |||||||
| $ | 2,555,982 | |||||||
| Food & Drug Stores - 1.0% | ||||||||
| Albertsons Cos., Inc., “A” | 35,962 | $ | 690,111 | |||||
| Wal-Mart Stores, Inc. | 13,735 | 1,950,782 | ||||||
|
| |||||||
| $ | 2,640,893 | |||||||
| General Merchandise - 0.2% | ||||||||
| Dollar General Corp. | 2,758 | $ | 559,764 | |||||
| Health Maintenance Organizations - 1.4% | ||||||||
| Cigna Corp. | 4,092 | $ | 1,059,214 | |||||
| Humana, Inc. | 3,043 | 1,331,921 | ||||||
| UnitedHealth Group, Inc. | 3,430 | 1,412,886 | ||||||
|
| |||||||
| $ | 3,804,021 | |||||||
| Insurance - 0.4% | ||||||||
| MetLife, Inc. | 16,607 | $ | 1,085,434 | |||||
| Internet - 10.7% | ||||||||
| Alphabet, Inc., “A” (a) | 2,972 | $ | 7,004,558 | |||||
| Alphabet, Inc., “C” (a) | 2,871 | 6,923,589 | ||||||
| Facebook, Inc., “A” (a) | 42,315 | 13,910,210 | ||||||
| GoDaddy, Inc. (a) | 3,132 | 253,566 | ||||||
| Roku, Inc. (a) | 625 | 216,694 | ||||||
|
| |||||||
| $ | 28,308,617 | |||||||
| Leisure & Toys - 1.3% | ||||||||
| Electronic Arts, Inc. | 6,853 | $ | 979,499 | |||||
| Polaris, Inc. | 3,571 | 468,587 | ||||||
| Take-Two Interactive Software, Inc. (a) | 11,074 | 2,054,891 | ||||||
|
| |||||||
| $ | 3,502,977 | |||||||
| Machinery & Tools - 1.2% | ||||||||
| AGCO Corp. | 6,970 | $ | 964,439 | |||||
| Eaton Corp. PLC | 15,239 | 2,213,465 | ||||||
|
| |||||||
| $ | 3,177,904 | |||||||
| Medical & Health Technology & Services - 3.7% | ||||||||
| Charles River Laboratories International, Inc. (a) | 1,336 | $ | 451,555 | |||||
| HCA Healthcare, Inc. | 11,750 | 2,523,782 | ||||||
13
Table of Contents
Portfolio of Investments – continued
| Issuer | Shares/Par | Value ($) | ||||||
| Common Stocks - continued | ||||||||
| Medical & Health Technology & Services - continued | ||||||||
| IDEXX Laboratories, Inc. (a) | 6,015 | $ | 3,357,032 | |||||
| Laboratory Corp. of America Holdings (a) | 430 | 118,026 | ||||||
| McKesson Corp. | 14,779 | 2,843,332 | ||||||
| Quest Diagnostics, Inc. | 3,305 | 435,169 | ||||||
|
| |||||||
| $ | 9,728,896 | |||||||
| Medical Equipment - 3.1% | ||||||||
| Abbott Laboratories | 4,174 | $ | 486,897 | |||||
| Align Technology, Inc. (a) | 2,571 | 1,517,276 | ||||||
| Avantor, Inc. (a) | 53,191 | 1,710,091 | ||||||
| Danaher Corp. | 7,121 | 1,823,973 | ||||||
| Maravai Lifesciences Holdings, Inc., “A” (a) | 8,140 | 305,576 | ||||||
| QIAGEN N.V. (a) | 21,826 | 1,077,331 | ||||||
| Thermo Fisher Scientific, Inc. | 2,475 | 1,162,012 | ||||||
|
| |||||||
| $ | 8,083,156 | |||||||
| Other Banks & Diversified Financials - 3.2% | ||||||||
| Mastercard, Inc., “A” | 10,713 | $ | 3,862,894 | |||||
| Moody’s Corp. | 4,457 | 1,494,655 | ||||||
| SLM Corp. | 34,670 | 702,067 | ||||||
| Visa, Inc., “A” | 11,024 | 2,505,755 | ||||||
|
| |||||||
| $ | 8,565,371 | |||||||
| Pharmaceuticals - 4.0% | ||||||||
| Bristol-Myers Squibb Co. | 3,076 | $ | 202,155 | |||||
| Eli Lilly & Co. | 22,411 | 4,476,373 | ||||||
| Johnson & Johnson | 17,392 | 2,943,596 | ||||||
| Merck & Co., Inc. | 37,052 | 2,811,876 | ||||||
|
| |||||||
| $ | 10,434,000 | |||||||
| Railroad & Shipping - 0.9% | ||||||||
| Kansas City Southern Co. | 7,992 | $ | 2,379,059 | |||||
| Real Estate - 2.7% | ||||||||
| Extra Space Storage, Inc., REIT | 19,574 | $ | 2,932,381 | |||||
| Public Storage, Inc., REIT | 10,244 | 2,893,725 | ||||||
| Simon Property Group, Inc., REIT | 4,820 | 619,322 | ||||||
| VICI Properties, Inc., REIT | 17,310 | 538,860 | ||||||
|
| |||||||
| $ | 6,984,288 | |||||||
| Restaurants - 1.7% | ||||||||
| Starbucks Corp. | 28,456 | $ | 3,240,569 | |||||
| Texas Roadhouse, Inc. | 9,903 | 997,331 | ||||||
| Yum China Holdings, Inc. | 5,373 | 363,430 | ||||||
|
| |||||||
| $ | 4,601,330 | |||||||
14
Table of Contents
Portfolio of Investments – continued
| Issuer | Shares/Par | Value ($) | ||||||
| Common Stocks - continued | ||||||||
| Specialty Chemicals - 0.6% | ||||||||
| Linde PLC | 4,948 | $ | 1,487,369 | |||||
| Specialty Stores - 9.2% | ||||||||
| Amazon.com, Inc. (a) | 4,985 | $ | 16,067,004 | |||||
| AutoZone, Inc. (a) | 1,226 | 1,724,492 | ||||||
| Home Depot, Inc. | 15,224 | 4,855,086 | ||||||
| Ross Stores, Inc. | 6,838 | 864,255 | ||||||
| TJX Cos., Inc. | 9,736 | 657,569 | ||||||
|
| |||||||
| $ | 24,168,406 | |||||||
| Tobacco - 0.8% | ||||||||
| Altria Group, Inc. | 24,735 | $ | 1,217,457 | |||||
| Philip Morris International, Inc. | 8,803 | 848,873 | ||||||
|
| |||||||
| $ | 2,066,330 | |||||||
| Trucking - 1.8% | ||||||||
| J.B. Hunt Transport Services, Inc. | 2,133 | $ | 365,895 | |||||
| United Parcel Service, Inc., “B” | 20,150 | 4,324,190 | ||||||
|
| |||||||
| $ | 4,690,085 | |||||||
| Total Common Stocks (Identified Cost, $154,633,448) | $ | 261,592,625 | ||||||
| Investment Companies (h) - 0.8% | ||||||||
| Money Market Funds - 0.8% | ||||||||
| MFS Institutional Money Market Portfolio, 0.03% (v) (Identified Cost, $1,942,970) | 1,942,970 | $ | 1,942,970 | |||||
| Other Assets, Less Liabilities - 0.0% | 111,790 | |||||||
| Net Assets - 100.0% | $ | 263,647,385 | ||||||
| (a) | Non-income producing security. |
| (h) | An affiliated issuer, which may be considered one in which the fund owns 5% or more of the outstanding voting securities, or a company which is under common control. At period end, the aggregate values of the fund’s investments in affiliated issuers and in unaffiliated issuers were $1,942,970 and $261,592,625, respectively. |
| (v) | Affiliated issuer that is available only to investment companies managed by MFS. The rate quoted for the MFS Institutional Money Market Portfolio is the annualized seven-day yield of the fund at period end. |
The following abbreviations are used in this report and are defined:
| REIT | Real Estate Investment Trust |
See Notes to Financial Statements
15
Table of Contents
Financial Statements
STATEMENT OF ASSETS AND LIABILITIES
At 5/31/21
This statement represents your fund’s balance sheet, which details the assets and liabilities comprising the total value of the fund.
| Assets | ||||
Investments in unaffiliated issuers, at value (identified cost, $154,633,448) | $261,592,625 | |||
Investments in affiliated issuers, at value (identified cost, $1,942,970) | 1,942,970 | |||
Receivables for | ||||
Fund shares sold | 94,913 | |||
Dividends | 205,463 | |||
Other assets | 593 | |||
Total assets | $263,836,564 | |||
| Liabilities | ||||
Payables for | ||||
Fund shares reacquired | $82,111 | |||
Payable to affiliates | ||||
Investment adviser | 6,756 | |||
Administrative services fee | 620 | |||
Shareholder servicing costs | 26,281 | |||
Distribution and service fees | 2,688 | |||
Payable for independent Trustees’ compensation | 14 | |||
Accrued expenses and other liabilities | 70,709 | |||
Total liabilities | $189,179 | |||
Net assets | $263,647,385 | |||
| Net assets consist of | ||||
Paid-in capital | $142,123,009 | |||
Total distributable earnings (loss) | 121,524,376 | |||
Net assets | $263,647,385 | |||
Shares of beneficial interest outstanding | 13,058,926 | |||
16
Table of Contents
Statement of Assets and Liabilities – continued
| Net assets | Shares outstanding | Net asset value per share (a) | ||||||||||
Class A | $71,048,805 | 3,535,487 | $20.10 | |||||||||
Class B | 549,973 | 27,963 | 19.67 | |||||||||
Class C | 858,999 | 43,699 | 19.66 | |||||||||
Class I | 4,866,004 | 240,778 | 20.21 | |||||||||
Class R1 | 319,848 | 16,272 | 19.66 | |||||||||
Class R2 | 181,877 | 9,024 | 20.15 | |||||||||
Class R3 | 130,035 | 6,447 | 20.17 | |||||||||
Class R4 | 124,265 | 6,144 | 20.23 | |||||||||
Class R6 | 185,567,579 | 9,173,112 | 20.23 | |||||||||
| (a) | Maximum offering price per share was equal to the net asset value per share for all share classes, except for Class A, for which the maximum offering price per share was $21.33 [100 / 94.25 x $20.10]. On sales of $50,000 or more, the maximum offering price of Class A shares is reduced. A contingent deferred sales charge may be imposed on redemptions of Class A, Class B, and Class C shares. Redemption price per share was equal to the net asset value per share for Classes I, R1, R2, R3, R4, and R6. |
See Notes to Financial Statements
17
Table of Contents
Financial Statements
Year ended 5/31/21
This statement describes how much your fund earned in investment income and accrued in expenses. It also describes any gains and/or losses generated by fund operations.
| Net investment income (loss) | ||||
Income | ||||
Dividends | $1,930,155 | |||
Income on securities loaned | 4,750 | |||
Other | 4,275 | |||
Dividends from affiliated issuers | 2,023 | |||
Total investment income | $1,941,203 | |||
Expenses | ||||
Management fee | $944,738 | |||
Distribution and service fees | 172,830 | |||
Shareholder servicing costs | 68,023 | |||
Administrative services fee | 41,380 | |||
Independent Trustees’ compensation | 7,178 | |||
Custodian fee | 15,890 | |||
Shareholder communications | 9,821 | |||
Audit and tax fees | 57,034 | |||
Legal fees | 1,812 | |||
Registration fees | 110,264 | |||
Miscellaneous | 30,725 | |||
Total expenses | $1,459,695 | |||
Reduction of expenses by investment adviser and distributor | (272,449 | ) | ||
Net expenses | $1,187,246 | |||
Net investment income (loss) | $753,957 | |||
| Realized and unrealized gain (loss) | ||||
Realized gain (loss) (identified cost basis) | ||||
Unaffiliated issuers | $26,224,267 | |||
Affiliated issuers | (274 | ) | ||
Net realized gain (loss) | $26,223,993 | |||
Change in unrealized appreciation or depreciation | ||||
Unaffiliated issuers | $45,439,399 | |||
Affiliated issuers | 1 | |||
Net unrealized gain (loss) | $45,439,400 | |||
Net realized and unrealized gain (loss) | $71,663,393 | |||
Change in net assets from operations | $72,417,350 | |||
See Notes to Financial Statements
18
Table of Contents
Financial Statements
STATEMENTS OF CHANGES IN NET ASSETS
These statements describe the increases and/or decreases in net assets resulting from operations, any distributions, and any shareholder transactions.
| Year ended | ||||||||
| 5/31/21 | 5/31/20 | |||||||
| Change in net assets | ||||||||
| From operations | ||||||||
Net investment income (loss) | $753,957 | $1,317,283 | ||||||
Net realized gain (loss) | 26,223,993 | 12,146,955 | ||||||
Net unrealized gain (loss) | 45,439,400 | 30,271,560 | ||||||
Change in net assets from operations | $72,417,350 | $43,735,798 | ||||||
Total distributions to shareholders | $(15,472,121 | ) | $(9,123,061 | ) | ||||
Change in net assets from fund share transactions | $(582,973 | ) | $(10,019,311 | ) | ||||
Total change in net assets | $56,362,256 | $24,593,426 | ||||||
| Net assets | ||||||||
At beginning of period | 207,285,129 | 182,691,703 | ||||||
At end of period | $263,647,385 | $207,285,129 | ||||||
See Notes to Financial Statements
19
Table of Contents
Financial Statements
The financial highlights table is intended to help you understand the fund’s financial performance for the past 5 years (or life of a particular share class, if shorter). Certain information reflects financial results for a single fund share. The total returns in the table represent the rate that an investor would have earned (or lost) on an investment in the fund share class (assuming reinvestment of all distributions) held for the entire period.
| Class A | Year ended | |||||||||||||||||||
| 5/31/21 | 5/31/20 | 5/31/19 | 5/31/18 | 5/31/17 | ||||||||||||||||
Net asset value, beginning of period | $15.79 | $13.25 | $14.09 | $12.07 | $10.25 | |||||||||||||||
| Income (loss) from investment operations |
| |||||||||||||||||||
Net investment income (loss) (d) | $0.02 | $0.06 | $0.08 | $0.08 | $0.08 | |||||||||||||||
Net realized and unrealized gain (loss) | 5.50 | 3.12 | (0.03 | )(g) | 2.12 | 1.77 | ||||||||||||||
Total from investment operations | $5.52 | $3.18 | $0.05 | $2.20 | $1.85 | |||||||||||||||
| Less distributions declared to shareholders |
| |||||||||||||||||||
From net investment income | $(0.04 | ) | $(0.08 | ) | $(0.07 | ) | $(0.07 | ) | $(0.03 | ) | ||||||||||
From net realized gain | (1.17 | ) | (0.56 | ) | (0.82 | ) | (0.11 | ) | — | |||||||||||
Total distributions declared to shareholders | $(1.21 | ) | $(0.64 | ) | $(0.89 | ) | $(0.18 | ) | $(0.03 | ) | ||||||||||
Net asset value, end of period (x) | $20.10 | $15.79 | $13.25 | $14.09 | $12.07 | |||||||||||||||
Total return (%) (r)(s)(t)(x) | 35.89 | 24.34 | 0.95 | 18.28 | 18.05 | |||||||||||||||
| Ratios (%) (to average net assets) and Supplemental data: |
| |||||||||||||||||||
Expenses before expense reductions (f) | 0.86 | 0.90 | 0.89 | 0.90 | 1.47 | |||||||||||||||
Expenses after expense reductions (f) | 0.74 | 0.74 | 0.74 | 0.74 | 0.74 | |||||||||||||||
Net investment income (loss) | 0.08 | 0.42 | 0.59 | 0.61 | 0.68 | |||||||||||||||
Portfolio turnover | 71 | 61 | 60 | 73 | 57 | |||||||||||||||
Net assets at end of period (000 omitted) | $71,049 | $57,531 | $52,918 | $55,474 | $1,318 | |||||||||||||||
See Notes to Financial Statements
20
Table of Contents
Financial Highlights – continued
| Class B | Year ended | |||||||||||||||||||
| 5/31/21 | 5/31/20 | 5/31/19 | 5/31/18 | 5/31/17 | ||||||||||||||||
Net asset value, beginning of period | $15.55 | $13.08 | $13.95 | $11.98 | $10.22 | |||||||||||||||
| Income (loss) from investment operations |
| |||||||||||||||||||
Net investment income (loss) (d) | $(0.12 | ) | $(0.05 | ) | $(0.02 | ) | $(0.03 | ) | $(0.01 | ) | ||||||||||
Net realized and unrealized gain (loss) | 5.41 | 3.08 | (0.03 | )(g) | 2.11 | 1.77 | ||||||||||||||
Total from investment operations | $5.29 | $3.03 | $(0.05 | ) | $2.08 | $1.76 | ||||||||||||||
| Less distributions declared to shareholders |
| |||||||||||||||||||
From net investment income | $— | $— | $— | $— | $— | |||||||||||||||
From net realized gain | (1.17 | ) | (0.56 | ) | (0.82 | ) | (0.11 | ) | — | |||||||||||
Total distributions declared to shareholders | $(1.17 | ) | $(0.56 | ) | $(0.82 | ) | $(0.11 | ) | $— | |||||||||||
Net asset value, end of period (x) | $19.67 | $15.55 | $13.08 | $13.95 | $11.98 | |||||||||||||||
Total return (%) (r)(s)(t)(x) | 34.89 | 23.42 | 0.17 | 17.40 | 17.22 | |||||||||||||||
| Ratios (%) (to average net assets) and Supplemental data: |
| |||||||||||||||||||
Expenses before expense reductions (f) | 1.61 | 1.65 | 1.64 | 1.65 | 2.42 | |||||||||||||||
Expenses after expense reductions (f) | 1.49 | 1.49 | 1.49 | 1.49 | 1.49 | |||||||||||||||
Net investment income (loss) | (0.67 | ) | (0.33 | ) | (0.14 | ) | (0.25 | ) | (0.08 | ) | ||||||||||
Portfolio turnover | 71 | 61 | 60 | 73 | 57 | |||||||||||||||
Net assets at end of period (000 omitted) | $550 | $408 | $428 | $333 | $249 | |||||||||||||||
| Class C | Year ended | |||||||||||||||||||
| 5/31/21 | 5/31/20 | 5/31/19 | 5/31/18 | 5/31/17 | ||||||||||||||||
Net asset value, beginning of period | $15.54 | $13.07 | $13.95 | $11.97 | $10.22 | |||||||||||||||
| Income (loss) from investment operations |
| |||||||||||||||||||
Net investment income (loss) (d) | $(0.12 | ) | $(0.05 | ) | $(0.01 | ) | $(0.03 | ) | $(0.01 | ) | ||||||||||
Net realized and unrealized gain (loss) | 5.41 | 3.08 | (0.05 | )(g) | 2.12 | 1.76 | ||||||||||||||
Total from investment operations | $5.29 | $3.03 | $(0.06 | ) | $2.09 | $1.75 | ||||||||||||||
| Less distributions declared to shareholders |
| |||||||||||||||||||
From net investment income | $— | $— | $(0.00 | )(w) | $— | $— | ||||||||||||||
From net realized gain | (1.17 | ) | (0.56 | ) | (0.82 | ) | (0.11 | ) | — | |||||||||||
Total distributions declared to shareholders | $(1.17 | ) | $(0.56 | ) | $(0.82 | ) | $(0.11 | ) | $— | |||||||||||
Net asset value, end of period (x) | $19.66 | $15.54 | $13.07 | $13.95 | $11.97 | |||||||||||||||
Total return (%) (r)(s)(t)(x) | 34.91 | 23.44 | 0.13 | 17.50 | 17.12 | |||||||||||||||
| Ratios (%) (to average net assets) and Supplemental data: |
| |||||||||||||||||||
Expenses before expense reductions (f) | 1.60 | 1.65 | 1.65 | 1.65 | 2.41 | |||||||||||||||
Expenses after expense reductions (f) | 1.49 | 1.49 | 1.49 | 1.49 | 1.49 | |||||||||||||||
Net investment income (loss) | (0.67 | ) | (0.33 | ) | (0.11 | ) | (0.26 | ) | (0.05 | ) | ||||||||||
Portfolio turnover | 71 | 61 | 60 | 73 | 57 | |||||||||||||||
Net assets at end of period (000 omitted) | $859 | $613 | $525 | $338 | $159 | |||||||||||||||
See Notes to Financial Statements
21
Table of Contents
Financial Highlights – continued
| Class I | Year ended | |||||||||||||||||||
| 5/31/21 | 5/31/20 | 5/31/19 | 5/31/18 | 5/31/17 | ||||||||||||||||
Net asset value, beginning of period | $15.87 | $13.31 | $14.17 | $12.10 | $10.26 | |||||||||||||||
| Income (loss) from investment operations |
| |||||||||||||||||||
Net investment income (loss) (d) | $0.06 | $0.10 | $0.13 | $0.10 | $0.10 | |||||||||||||||
Net realized and unrealized gain (loss) | 5.54 | 3.14 | (0.05 | )(g) | 2.14 | 1.78 | ||||||||||||||
Total from investment operations | $5.60 | $3.24 | $0.08 | $2.24 | $1.88 | |||||||||||||||
| Less distributions declared to shareholders |
| |||||||||||||||||||
From net investment income | $(0.09 | ) | $(0.12 | ) | $(0.12 | ) | $(0.06 | ) | $(0.04 | ) | ||||||||||
From net realized gain | (1.17 | ) | (0.56 | ) | (0.82 | ) | (0.11 | ) | — | |||||||||||
Total distributions declared to shareholders | $(1.26 | ) | $(0.68 | ) | $(0.94 | ) | $(0.17 | ) | $(0.04 | ) | ||||||||||
Net asset value, end of period (x) | $20.21 | $15.87 | $13.31 | $14.17 | $12.10 | |||||||||||||||
Total return (%) (r)(s)(t)(x) | 36.23 | 24.71 | 1.18 | 18.57 | 18.38 | |||||||||||||||
| Ratios (%) (to average net assets) and Supplemental data: |
| |||||||||||||||||||
Expenses before expense reductions (f) | 0.60 | 0.65 | 0.64 | 0.65 | 1.32 | |||||||||||||||
Expenses after expense reductions (f) | 0.49 | 0.49 | 0.49 | 0.49 | 0.49 | |||||||||||||||
Net investment income (loss) | 0.33 | 0.68 | 0.98 | 0.75 | 0.91 | |||||||||||||||
Portfolio turnover | 71 | 61 | 60 | 73 | 57 | |||||||||||||||
Net assets at end of period (000 omitted) | $4,866 | $2,366 | $1,560 | $195 | $673 | |||||||||||||||
| Class R1 | Year ended | |||||||||||||||||||
| 5/31/21 | 5/31/20 | 5/31/19 | 5/31/18 | 5/31/17 | ||||||||||||||||
Net asset value, beginning of period | $15.54 | $13.08 | $13.95 | $11.98 | $10.22 | |||||||||||||||
| Income (loss) from investment operations |
| |||||||||||||||||||
Net investment income (loss) (d) | $(0.12 | ) | $(0.05 | ) | $(0.02 | ) | $(0.04 | ) | $(0.01 | ) | ||||||||||
Net realized and unrealized gain (loss) | 5.41 | 3.07 | (0.03 | )(g) | 2.12 | 1.77 | ||||||||||||||
Total from investment operations | $5.29 | $3.02 | $(0.05 | ) | $2.08 | $1.76 | ||||||||||||||
| Less distributions declared to shareholders |
| |||||||||||||||||||
From net investment income | $— | $— | $— | $— | $— | |||||||||||||||
From net realized gain | (1.17 | ) | (0.56 | ) | (0.82 | ) | (0.11 | ) | — | |||||||||||
Total distributions declared to shareholders | $(1.17 | ) | $(0.56 | ) | $(0.82 | ) | $(0.11 | ) | $— | |||||||||||
Net asset value, end of period (x) | $19.66 | $15.54 | $13.08 | $13.95 | $11.98 | |||||||||||||||
Total return (%) (r)(s)(t)(x) | 34.91 | 23.34 | 0.18 | 17.40 | 17.22 | |||||||||||||||
| Ratios (%) (to average net assets) and Supplemental data: |
| |||||||||||||||||||
Expenses before expense reductions (f) | 1.60 | 1.64 | 1.64 | 1.65 | 2.49 | |||||||||||||||
Expenses after expense reductions (f) | 1.49 | 1.49 | 1.49 | 1.49 | 1.49 | |||||||||||||||
Net investment income (loss) | (0.67 | ) | (0.33 | ) | (0.16 | ) | (0.27 | ) | (0.05 | ) | ||||||||||
Portfolio turnover | 71 | 61 | 60 | 73 | 57 | |||||||||||||||
Net assets at end of period (000 omitted) | $320 | $87 | $170 | $166 | $175 | |||||||||||||||
See Notes to Financial Statements
22
Table of Contents
Financial Highlights – continued
| Class R2 | Year ended | |||||||||||||||||||
| 5/31/21 | 5/31/20 | 5/31/19 | 5/31/18 | 5/31/17 | ||||||||||||||||
Net asset value, beginning of period | $15.84 | $13.29 | $14.10 | $12.06 | $10.24 | |||||||||||||||
| Income (loss) from investment operations |
| |||||||||||||||||||
Net investment income (loss) (d) | $(0.03 | ) | $0.03 | $0.04 | $0.03 | $0.05 | ||||||||||||||
Net realized and unrealized gain (loss) | 5.52 | 3.13 | (0.03 | )(g) | 2.14 | 1.77 | ||||||||||||||
Total from investment operations | $5.49 | $3.16 | $0.01 | $2.17 | $1.82 | |||||||||||||||
| Less distributions declared to shareholders |
| |||||||||||||||||||
From net investment income | $(0.01 | ) | $(0.05 | ) | $— | $(0.02 | ) | $— | ||||||||||||
From net realized gain | (1.17 | ) | (0.56 | ) | (0.82 | ) | (0.11 | ) | — | |||||||||||
Total distributions declared to shareholders | $(1.18 | ) | $(0.61 | ) | $(0.82 | ) | $(0.13 | ) | $— | |||||||||||
Net asset value, end of period (x) | $20.15 | $15.84 | $13.29 | $14.10 | $12.06 | |||||||||||||||
Total return (%) (r)(s)(t)(x) | 35.52 | 24.10 | 0.61 | 18.04 | 17.77 | |||||||||||||||
| Ratios (%) (to average net assets) and Supplemental data: |
| |||||||||||||||||||
Expenses before expense reductions (f) | 1.11 | 1.16 | 1.14 | 1.15 | 2.02 | |||||||||||||||
Expenses after expense reductions (f) | 0.99 | 0.99 | 0.99 | 0.99 | 0.99 | |||||||||||||||
Net investment income (loss) | (0.17 | ) | 0.17 | 0.29 | 0.25 | 0.44 | ||||||||||||||
Portfolio turnover | 71 | 61 | 60 | 73 | 57 | |||||||||||||||
Net assets at end of period (000 omitted) | $182 | $266 | $106 | $175 | $130 | |||||||||||||||
| Class R3 | Year ended | |||||||||||||||||||
| 5/31/21 | 5/31/20 | 5/31/19 | 5/31/18 | 5/31/17 | ||||||||||||||||
Net asset value, beginning of period | $15.85 | $13.30 | $14.14 | $12.09 | $10.25 | |||||||||||||||
| Income (loss) from investment operations |
| |||||||||||||||||||
Net investment income (loss) (d) | $0.02 | $0.06 | $0.08 | $0.07 | $0.07 | |||||||||||||||
Net realized and unrealized gain (loss) | 5.52 | 3.14 | (0.03 | )(g) | 2.13 | 1.79 | ||||||||||||||
Total from investment operations | $5.54 | $3.20 | $0.05 | $2.20 | $1.86 | |||||||||||||||
| Less distributions declared to shareholders |
| |||||||||||||||||||
From net investment income | $(0.05 | ) | $(0.09 | ) | $(0.07 | ) | $(0.04 | ) | $(0.02 | ) | ||||||||||
From net realized gain | (1.17 | ) | (0.56 | ) | (0.82 | ) | (0.11 | ) | — | |||||||||||
Total distributions declared to shareholders | $(1.22 | ) | $(0.65 | ) | $(0.89 | ) | $(0.15 | ) | $(0.02 | ) | ||||||||||
Net asset value, end of period (x) | $20.17 | $15.85 | $13.30 | $14.14 | $12.09 | |||||||||||||||
Total return (%) (r)(s)(t)(x) | 35.85 | 24.35 | 0.98 | 18.23 | 18.11 | |||||||||||||||
| Ratios (%) (to average net assets) and Supplemental data: |
| |||||||||||||||||||
Expenses before expense reductions (f) | 0.85 | 0.90 | 0.89 | 0.90 | 1.84 | |||||||||||||||
Expenses after expense reductions (f) | 0.74 | 0.74 | 0.74 | 0.74 | 0.74 | |||||||||||||||
Net investment income (loss) | 0.08 | 0.42 | 0.59 | 0.49 | 0.67 | |||||||||||||||
Portfolio turnover | 71 | 61 | 60 | 73 | 57 | |||||||||||||||
Net assets at end of period (000 omitted) | $130 | $90 | $72 | $72 | $61 | |||||||||||||||
See Notes to Financial Statements
23
Table of Contents
Financial Highlights – continued
| Class R4 | Year ended | |||||||||||||||||||
| 5/31/21 | 5/31/20 | 5/31/19 | 5/31/18 | 5/31/17 | ||||||||||||||||
Net asset value, beginning of period | $15.87 | $13.32 | $14.17 | $12.10 | $10.26 | |||||||||||||||
| Income (loss) from investment operations |
| |||||||||||||||||||
Net investment income (loss) (d) | $0.06 | $0.10 | $0.12 | $0.10 | $0.10 | |||||||||||||||
Net realized and unrealized gain (loss) | 5.56 | 3.13 | (0.04 | )(g) | 2.15 | 1.78 | ||||||||||||||
Total from investment operations | $5.62 | $3.23 | $0.08 | $2.25 | $1.88 | |||||||||||||||
| Less distributions declared to shareholders |
| |||||||||||||||||||
From net investment income | $(0.09 | ) | $(0.12 | ) | $(0.11 | ) | $(0.07 | ) | $(0.04 | ) | ||||||||||
From net realized gain | (1.17 | ) | (0.56 | ) | (0.82 | ) | (0.11 | ) | — | |||||||||||
Total distributions declared to shareholders | $(1.26 | ) | $(0.68 | ) | $(0.93 | ) | $(0.18 | ) | $(0.04 | ) | ||||||||||
Net asset value, end of period (x) | $20.23 | $15.87 | $13.32 | $14.17 | $12.10 | |||||||||||||||
Total return (%) (r)(s)(t)(x) | 36.34 | 24.60 | 1.18 | 18.65 | 18.37 | |||||||||||||||
| Ratios (%) (to average net assets) and Supplemental data: |
| |||||||||||||||||||
Expenses before expense reductions (f) | 0.60 | 0.65 | 0.64 | 0.65 | 1.58 | |||||||||||||||
Expenses after expense reductions (f) | 0.49 | 0.49 | 0.49 | 0.49 | 0.49 | |||||||||||||||
Net investment income (loss) | 0.33 | 0.67 | 0.84 | 0.74 | 0.93 | |||||||||||||||
Portfolio turnover | 71 | 61 | 60 | 73 | 57 | |||||||||||||||
Net assets at end of period (000 omitted) | $124 | $91 | $73 | $72 | $61 | |||||||||||||||
| Class R6 | Year ended | |||||||||||||||||||
| 5/31/21 | 5/31/20 | 5/31/19 | 5/31/18 | 5/31/17 | ||||||||||||||||
Net asset value, beginning of period | $15.89 | $13.32 | $14.18 | $12.11 | $10.26 | |||||||||||||||
| Income (loss) from investment operations |
| |||||||||||||||||||
Net investment income (loss) (d) | $0.08 | $0.11 | $0.13 | $0.11 | $0.11 | |||||||||||||||
Net realized and unrealized gain (loss) | 5.53 | 3.16 | (0.05 | )(g) | 2.15 | 1.78 | ||||||||||||||
Total from investment operations | $5.61 | $3.27 | $0.08 | $2.26 | $1.89 | |||||||||||||||
| Less distributions declared to shareholders |
| |||||||||||||||||||
From net investment income | $(0.10 | ) | $(0.14 | ) | $(0.12 | ) | $(0.08 | ) | $(0.04 | ) | ||||||||||
From net realized gain | (1.17 | ) | (0.56 | ) | (0.82 | ) | (0.11 | ) | — | |||||||||||
Total distributions declared to shareholders | $(1.27 | ) | $(0.70 | ) | $(0.94 | ) | $(0.19 | ) | $(0.04 | ) | ||||||||||
Net asset value, end of period (x) | $20.23 | $15.89 | $13.32 | $14.18 | $12.11 | |||||||||||||||
Total return (%) (r)(s)(t)(x) | 36.29 | 24.86 | 1.22 | 18.71 | 18.51 | |||||||||||||||
| Ratios (%) (to average net assets) and Supplemental data: |
| |||||||||||||||||||
Expenses before expense reductions (f) | 0.52 | 0.55 | 0.55 | 0.57 | 0.65 | |||||||||||||||
Expenses after expense reductions (f) | 0.40 | 0.39 | 0.40 | 0.39 | 0.43 | |||||||||||||||
Net investment income (loss) | 0.42 | 0.77 | 0.93 | 0.83 | 0.97 | |||||||||||||||
Portfolio turnover | 71 | 61 | 60 | 73 | 57 | |||||||||||||||
Net assets at end of period (000 omitted) | $185,568 | $145,833 | $126,840 | $128,183 | $122,177 | |||||||||||||||
See Notes to Financial Statements
24
Table of Contents
Financial Highlights – continued
| (d) | Per share data is based on average shares outstanding. |
| (f) | Ratios do not reflect reductions from fees paid indirectly, if applicable. |
| (g) | The per share amount varies from the net realized and unrealized gain/loss for the period because of the timing of sales of fund shares and the per share amount of realized and unrealized gains and losses at such time. |
| (r) | Certain expenses have been reduced without which performance would have been lower. |
| (s) | From time to time the fund may receive proceeds from litigation settlements, without which performance would be lower. |
| (t) | Total returns do not include any applicable sales charges. |
| (w) | Per share amount was less than $0.01. |
| (x) | The net asset values and total returns have been calculated on net assets which include adjustments made in accordance with U.S. generally accepted accounting principles required at period end for financial reporting purposes. |
See Notes to Financial Statements
25
Table of Contents
(1) Business and Organization
MFS Blended Research Growth Equity Fund (the fund) is a diversified series of MFS Series Trust X (the trust). The trust is organized as a Massachusetts business trust and is registered under the Investment Company Act of 1940, as amended, as an open-end management investment company.
The fund is an investment company and accordingly follows the investment company accounting and reporting guidance of the Financial Accounting Standards Board (FASB) Accounting Standards Codification Topic 946 Financial Services – Investment Companies.
(2) Significant Accounting Policies
General – The preparation of financial statements in conformity with U.S. generally accepted accounting principles requires management to make estimates and assumptions that affect the reported amounts of assets and liabilities, and disclosure of contingent assets and liabilities at the date of the financial statements and the reported amounts of increases and decreases in net assets from operations during the reporting period. Actual results could differ from those estimates. In the preparation of these financial statements, management has evaluated subsequent events occurring after the date of the fund’s Statement of Assets and Liabilities through the date that the financial statements were issued.
In March 2020, the FASB issued Accounting Standards Update 2020-04, Reference Rate Reform (Topic 848) – Facilitation of the Effects of Reference Rate Reform on Financial Reporting (“ASU 2020-04”), which provides optional, temporary relief for certain reference rate-related contract modifications due to the planned discontinuation of the London Interbank Offered Rate (LIBOR) and other IBOR-based reference rates as of the end of 2021. In March 2021, the administrator for LIBOR announced the extension of the publication of the more commonly used U.S. dollar LIBOR settings to the end of June 2023. Management is still evaluating the impact of ASU 2020-04 on the fund’s accounting for investments, derivatives, debt and other contracts that will undergo reference rate-related modifications as a result of the reference rate reform.
Balance Sheet Offsetting – The fund’s accounting policy with respect to balance sheet offsetting is that, absent an event of default by the counterparty or a termination of the agreement, the International Swaps and Derivatives Association (ISDA) Master Agreement, or similar agreement, does not result in an offset of reported amounts of financial assets and financial liabilities in the Statement of Assets and Liabilities across transactions between the fund and the applicable counterparty. The fund’s right to setoff may be restricted or prohibited by the bankruptcy or insolvency laws of the particular jurisdiction to which a specific master netting agreement counterparty is subject. Balance sheet offsetting disclosures, to the extent applicable to the fund, have been included in the fund’s Significant Accounting Policies note under the captions for each of the fund’s in-scope financial instruments and transactions.
Investment Valuations – Equity securities, including restricted equity securities, are generally valued at the last sale or official closing price on their primary market or
26
Table of Contents
Notes to Financial Statements – continued
exchange as provided by a third-party pricing service. Equity securities, for which there were no sales reported that day, are generally valued at the last quoted daily bid quotation on their primary market or exchange as provided by a third-party pricing service. Short-term instruments with a maturity at issuance of 60 days or less may be valued at amortized cost, which approximates market value. Open-end investment companies are generally valued at net asset value per share. Securities and other assets generally valued on the basis of information from a third-party pricing service may also be valued at a broker/dealer bid quotation. In determining values, third-party pricing services can utilize both transaction data and market information such as yield, quality, coupon rate, maturity, type of issue, trading characteristics, and other market data. The values of foreign securities and other assets and liabilities expressed in foreign currencies are converted to U.S. dollars using the mean of bid and asked prices for rates provided by a third-party pricing service.
The Board of Trustees has delegated primary responsibility for determining or causing to be determined the value of the fund’s investments (including any fair valuation) to the adviser pursuant to valuation policies and procedures approved by the Board. If the adviser determines that reliable market quotations are not readily available, investments are valued at fair value as determined in good faith by the adviser in accordance with such procedures under the oversight of the Board of Trustees. Under the fund’s valuation policies and procedures, market quotations are not considered to be readily available for most types of debt instruments and floating rate loans and many types of derivatives. These investments are generally valued at fair value based on information from third-party pricing services. In addition, investments may be valued at fair value if the adviser determines that an investment’s value has been materially affected by events occurring after the close of the exchange or market on which the investment is principally traded (such as foreign exchange or market) and prior to the determination of the fund’s net asset value, or after the halt of trading of a specific security where trading does not resume prior to the close of the exchange or market on which the security is principally traded. Events that occur after foreign markets close (such as developments in foreign markets and significant movements in the U.S. markets) and prior to the determination of the fund’s net asset value may be deemed to have a material effect on the value of securities traded in foreign markets. Accordingly, the fund’s foreign equity securities may often be valued at fair value. The adviser generally relies on third-party pricing services or other information (such as the correlation with price movements of similar securities in the same or other markets; the type, cost and investment characteristics of the security; the business and financial condition of the issuer; and trading and other market data) to assist in determining whether to fair value and at what value to fair value an investment. The value of an investment for purposes of calculating the fund’s net asset value can differ depending on the source and method used to determine value. When fair valuation is used, the value of an investment used to determine the fund’s net asset value may differ from quoted or published prices for the same investment. There can be no assurance that the fund could obtain the fair value assigned to an investment if it were to sell the investment at the same time at which the fund determines its net asset value per share.
Various inputs are used in determining the value of the fund’s assets or liabilities. These inputs are categorized into three broad levels. In certain cases, the inputs used to
27
Table of Contents
Notes to Financial Statements – continued
measure fair value may fall into different levels of the fair value hierarchy. In such cases, an investment’s level within the fair value hierarchy is based on the lowest level of input that is significant to the fair value measurement. The fund’s assessment of the significance of a particular input to the fair value measurement in its entirety requires judgment, and considers factors specific to the investment. Level 1 includes unadjusted quoted prices in active markets for identical assets or liabilities. Level 2 includes other significant observable market-based inputs (including quoted prices for similar securities, interest rates, prepayment speed, and credit risk). Level 3 includes unobservable inputs, which may include the adviser’s own assumptions in determining the fair value of investments. The following is a summary of the levels used as of May 31, 2021 in valuing the fund’s assets or liabilities:
| Financial Instruments | Level 1 | Level 2 | Level 3 | Total | ||||||||||||
| Equity Securities | $261,592,625 | $— | $— | $261,592,625 | ||||||||||||
| Mutual Funds | 1,942,970 | — | — | 1,942,970 | ||||||||||||
| Total | $263,535,595 | $— | $— | $263,535,595 | ||||||||||||
For further information regarding security characteristics, see the Portfolio of Investments.
Security Loans – Under its Securities Lending Agency Agreement with the fund, State Street Bank and Trust Company, as lending agent, loans the securities of the fund to certain qualified institutions (the “Borrowers”) approved by the fund. Security loans can be terminated at the discretion of either the lending agent or the fund and the related securities must be returned within the earlier of the standard trade settlement period for such securities or within three business days. The loans are collateralized by cash and/or U.S. Treasury and federal agency obligations in an amount typically at least equal to the market value of the securities loaned. On loans collateralized by cash, the cash collateral is invested in a money market fund. The market value of the loaned securities is determined at the close of business of the fund and any additional required collateral is delivered to the fund on the next business day. The lending agent provides the fund with indemnification against Borrower default. In the event of Borrower default, the lending agent will, for the benefit of the fund, either purchase securities identical to those loaned or, when such purchase is commercially impracticable, pay the fund the market value of the loaned securities. In return, the lending agent assumes the fund’s rights to the related collateral. If the collateral value is less than the cost to purchase identical securities, the lending agent is responsible for the shortfall, but only to the extent that such shortfall is not due to a decline in collateral value resulting from collateral reinvestment for which the fund bears the risk of loss. A portion of the income generated upon investment of the collateral is remitted to the Borrowers, and the remainder is allocated between the fund and the lending agent. On loans collateralized by U.S. Treasury and/or federal agency obligations, a fee is received from the Borrower, and is allocated between the fund and the lending agent. Income from securities lending is separately reported in the Statement of Operations. The dividend and interest income earned on the securities loaned is accounted for in the same manner as other dividend and interest income. At May 31, 2021, there were no securities on loan or collateral outstanding.
Indemnifications – Under the fund’s organizational documents, its officers and Trustees may be indemnified against certain liabilities and expenses arising out of the
28
Table of Contents
Notes to Financial Statements – continued
performance of their duties to the fund. Additionally, in the normal course of business, the fund enters into agreements with service providers that may contain indemnification clauses. The fund’s maximum exposure under these agreements is unknown as this would involve future claims that may be made against the fund that have not yet occurred.
Investment Transactions and Income – Investment transactions are recorded on the trade date. Dividends received in cash are recorded on the ex-dividend date. Certain dividends from foreign securities will be recorded when the fund is informed of the dividend if such information is obtained subsequent to the ex-dividend date. Dividend payments received in additional securities are recorded on the ex-dividend date in an amount equal to the value of the security on such date.
The fund may receive proceeds from litigation settlements. Any proceeds received from litigation involving portfolio holdings are reflected in the Statement of Operations in realized gain/loss if the security has been disposed of by the fund or in unrealized gain/loss if the security is still held by the fund. Any other proceeds from litigation not related to portfolio holdings are reflected as other income in the Statement of Operations.
Tax Matters and Distributions – The fund intends to qualify as a regulated investment company, as defined under Subchapter M of the Internal Revenue Code, and to distribute all of its taxable income, including realized capital gains. As a result, no provision for federal income tax is required. The fund’s federal tax returns, when filed, will remain subject to examination by the Internal Revenue Service for a three year period. Management has analyzed the fund’s tax positions taken on federal and state tax returns for all open tax years and does not believe that there are any uncertain tax positions that require recognition of a tax liability. Foreign taxes, if any, have been accrued by the fund in the accompanying financial statements in accordance with the applicable foreign tax law. Foreign income taxes may be withheld by certain countries in which the fund invests. Additionally, capital gains realized by the fund on securities issued in or by certain foreign countries may be subject to capital gains tax imposed by those countries.
Distributions to shareholders are recorded on the ex-dividend date. Income and capital gain distributions are determined in accordance with income tax regulations, which may differ from U.S. generally accepted accounting principles. Certain capital accounts in the financial statements are periodically adjusted for permanent differences in order to reflect their tax character. These adjustments have no impact on net assets or net asset value per share. Temporary differences which arise from recognizing certain items of income, expense, gain or loss in different periods for financial statement and tax purposes will reverse at some time in the future.
Book/tax differences primarily relate to wash sale loss deferrals and treating a portion of the proceeds from redemptions as a distribution for tax purposes.
29
Table of Contents
Notes to Financial Statements – continued
The tax character of distributions declared to shareholders for the last two fiscal years is as follows:
| Year ended 5/31/21 | Year ended 5/31/20 | |||||||
| Ordinary income (including any short-term capital gains) | $3,415,180 | $1,625,026 | ||||||
| Long-term capital gains | 12,056,941 | 7,498,035 | ||||||
| Total distributions | $15,472,121 | $9,123,061 | ||||||
The federal tax cost and the tax basis components of distributable earnings were as follows:
| As of 5/31/21 | ||||
| Cost of investments | $157,126,993 | |||
| Gross appreciation | 107,281,121 | |||
| Gross depreciation | (872,519 | ) | ||
| Net unrealized appreciation (depreciation) | $106,408,602 | |||
| Undistributed ordinary income | 7,138,745 | |||
| Undistributed long-term capital gain | 7,977,029 | |||
| Total distributable earnings (loss) | $121,524,376 | |||
Multiple Classes of Shares of Beneficial Interest – The fund offers multiple classes of shares, which differ in their respective distribution and service fees. The fund’s income, realized and unrealized gain (loss), and common expenses are allocated to shareholders based on the daily net assets of each class. Dividends are declared separately for each class. Differences in per share dividend rates are generally due to differences in separate class expenses. Class B and Class C shares will convert to Class A shares approximately eight years after purchase. The fund’s distributions declared to shareholders as reported in the Statements of Changes in Net Assets are presented by class as follows:
| Year ended 5/31/21 | Year ended 5/31/20 | |||||||
| Class A | $3,947,086 | $2,343,673 | ||||||
| Class B | 35,800 | 14,943 | ||||||
| Class C | 51,162 | 22,006 | ||||||
| Class I | 217,273 | 84,493 | ||||||
| Class R1 | 8,173 | 7,293 | ||||||
| Class R2 | 20,775 | 5,012 | ||||||
| Class R3 | 7,351 | 3,519 | ||||||
| Class R4 | 7,230 | 3,741 | ||||||
| Class R6 | 11,177,271 | 6,638,381 | ||||||
| Total | $15,472,121 | $9,123,061 | ||||||
(3) Transactions with Affiliates
Investment Adviser – The fund has an investment advisory agreement with MFS to provide overall investment management and related administrative services and
30
Table of Contents
Notes to Financial Statements – continued
facilities to the fund. The management fee is computed daily and paid monthly at the following annual rates based on the fund’s average daily net assets:
| Up to $1 billion | 0.40 | % | ||
| In excess of $1 billion and up to $2.5 billion | 0.375 | % | ||
| In excess of $2.5 billion | 0.35 | % |
MFS has agreed in writing to reduce its management fee by a specified amount if certain MFS mutual fund assets exceed thresholds agreed to by MFS and the fund’s Board of Trustees. For the year ended May 31, 2021, this management fee reduction amounted to $27,076, which is included in the reduction of total expenses in the Statement of Operations. The management fee incurred for the year ended May 31, 2021 was equivalent to an annual effective rate of 0.39% of the fund’s average daily net assets.
The investment adviser has agreed in writing to pay a portion of the fund’s total annual operating expenses, excluding interest, taxes, extraordinary expenses, brokerage and transaction costs, and investment-related expenses , such that total fund operating expenses do not exceed the following rates annually of each class’s average daily net assets:
| Classes | ||||||||||||||||||||||||||||||||
| A | B | C | I | R1 | R2 | R3 | R4 | R6 | ||||||||||||||||||||||||
| 0.74% | 1.49% | 1.49% | 0.49% | 1.49% | 0.99% | 0.74% | 0.49% | 0.45% | ||||||||||||||||||||||||
This written agreement will continue until modified by the fund’s Board of Trustees, but such agreement will continue at least until September 30, 2022. For the year ended May 31, 2021, this reduction amounted to $245,350, which is included in the reduction of total expenses in the Statement of Operations.
Distributor – MFS Fund Distributors, Inc. (MFD), a wholly-owned subsidiary of MFS, as distributor, received $12,031 for the year ended May 31, 2021, as its portion of the initial sales charge on sales of Class A shares of the fund.
The Board of Trustees has adopted a distribution plan for certain share classes pursuant to Rule 12b-1 of the Investment Company Act of 1940.
The fund’s distribution plan provides that the fund will pay MFD for services provided by MFD and financial intermediaries in connection with the distribution and servicing of certain share classes. One component of the plan is a distribution fee paid to MFD and another component of the plan is a service fee paid to MFD. MFD may subsequently pay all, or a portion, of the distribution and/or service fees to financial intermediaries.
Distribution Plan Fee Table:
| Distribution Fee Rate (d) | Service Fee Rate (d) | Total Distribution Plan (d) | Annual Effective Rate (e) | Distribution and Service Fee | ||||||||||||||||
| Class A | — | 0.25% | 0.25% | 0.25% | $156,877 | |||||||||||||||
| Class B | 0.75% | 0.25% | 1.00% | 1.00% | 5,205 | |||||||||||||||
| Class C | 0.75% | 0.25% | 1.00% | 1.00% | 7,317 | |||||||||||||||
| Class R1 | 0.75% | 0.25% | 1.00% | 1.00% | 1,839 | |||||||||||||||
| Class R2 | 0.25% | 0.25% | 0.50% | 0.50% | 1,312 | |||||||||||||||
| Class R3 | — | 0.25% | 0.25% | 0.25% | 280 | |||||||||||||||
| Total Distribution and Service Fees |
| $172,830 | ||||||||||||||||||
31
Table of Contents
Notes to Financial Statements – continued
| (d) | In accordance with the distribution plan for certain classes, the fund pays distribution and/or service fees equal to these annual percentage rates of each class’s average daily net assets. The distribution and service fee rates disclosed by class represent the current rates in effect at the end of the reporting period. Any rate changes, if applicable, are detailed below. |
| (e) | The annual effective rates represent actual fees incurred under the distribution plan for the year ended May 31, 2021 based on each class’s average daily net assets. MFD has voluntarily agreed to rebate a portion of each class’s 0.25% service fee attributable to accounts for which there is no financial intermediary specified on the account except for accounts attributable to MFS or its affiliates’ seed money. For the year ended May 31, 2021, this rebate amounted to $23 for Class A and is included in the reduction of total expenses in the Statement of Operations. |
Certain Class A shares are subject to a contingent deferred sales charge (CDSC) in the event of a shareholder redemption within 18 months of purchase. Class B shares are subject to a CDSC in the event of a shareholder redemption within six years of purchase. Class C shares are subject to a CDSC in the event of a shareholder redemption within 12 months of purchase. All contingent deferred sales charges are paid to MFD and during the year ended May 31, 2021, were as follows:
| Amount | ||||
| Class A | $6 | |||
| Class B | 713 | |||
| Class C | 157 | |||
Shareholder Servicing Agent – MFS Service Center, Inc. (MFSC), a wholly-owned subsidiary of MFS, receives a fee from the fund for its services as shareholder servicing agent calculated as a percentage of the average daily net assets of the fund as determined periodically under the supervision of the fund’s Board of Trustees. For the year ended May 31, 2021, the fee was $5,112, which equated to 0.0022% annually of the fund’s average daily net assets. MFSC also receives reimbursement from the fund for out-of-pocket expenses, sub-accounting and other shareholder servicing costs which may be paid to affiliated and unaffiliated service providers. Class R6 shares do not incur sub-accounting fees. For the year ended May 31, 2021, these out-of-pocket expenses, sub-accounting and other shareholder servicing costs amounted to $62,911.
Administrator – MFS provides certain financial, legal, shareholder communications, compliance, and other administrative services to the fund. Under an administrative services agreement, the fund reimburses MFS the costs incurred to provide these services. The fund is charged an annual fixed amount of $17,500 plus a fee based on average daily net assets. The administrative services fee incurred for the year ended May 31, 2021 was equivalent to an annual effective rate of 0.0175% of the fund’s average daily net assets.
Trustees’ and Officers’ Compensation – The fund pays compensation to independent Trustees in the form of a retainer, attendance fees, and additional compensation to Board and Committee chairpersons. The fund does not pay compensation directly to Trustees or officers of the fund who are also officers of the investment adviser, all of whom receive remuneration from MFS for their services to the fund. Certain officers and Trustees of the fund are officers or directors of MFS, MFD, and MFSC.
32
Table of Contents
Notes to Financial Statements – continued
Other – The fund invests in the MFS Institutional Money Market Portfolio which is managed by MFS and seeks current income consistent with preservation of capital and liquidity. This money market fund does not pay a management fee to MFS but does incur investment and operating costs.
At May 31, 2021 MFS held approximately 66% and 94% of the outstanding shares of Class R2 and Class R3, respectively, and 100% of the outstanding shares of Class R4.
The adviser has voluntarily undertaken to reimburse the fund from its own resources on a quarterly basis for the cost of investment research embedded in the cost of the fund’s securities trades. This agreement may be rescinded at any time. For the year ended May 31, 2021, this reimbursement amounted to $4,236, which is included in “Other” income in the Statement of Operations.
(4) Portfolio Securities
For the year ended May 31, 2021, purchases and sales of investments, other than short-term obligations, aggregated $166,290,270 and $182,862,902, respectively.
(5) Shares of Beneficial Interest
The fund’s Declaration of Trust permits the Trustees to issue an unlimited number of full and fractional shares of beneficial interest. Transactions in fund shares were as follows:
| Year ended 5/31/21 | Year ended 5/31/20 | |||||||||||||||
| Shares | Amount | Shares | Amount | |||||||||||||
| Shares sold | ||||||||||||||||
Class A | 1,231,442 | $22,383,881 | 1,821,174 | $26,290,288 | ||||||||||||
Class B | 8,752 | 155,490 | 145 | 2,200 | ||||||||||||
Class C | 19,399 | 350,582 | 8,800 | 124,505 | ||||||||||||
Class I | 111,722 | 2,106,401 | 85,947 | 1,232,685 | ||||||||||||
Class R1 | 10,217 | 182,668 | 104 | 2,216 | ||||||||||||
Class R2 | 1,123 | 20,514 | 9,332 | 141,727 | ||||||||||||
Class R3 | 355 | 6,585 | — | — | ||||||||||||
Class R6 | 2,368,613 | 41,313,522 | 1,212,208 | 17,325,820 | ||||||||||||
| 3,751,623 | $66,519,643 | 3,137,710 | $45,119,441 | |||||||||||||
| Shares issued to shareholders in reinvestment of distributions |
| |||||||||||||||
Class A | 34,337 | $617,724 | 10,332 | $152,909 | ||||||||||||
Class B | 2,026 | 35,800 | 1,021 | 14,943 | ||||||||||||
Class C | 2,897 | 51,162 | 1,505 | 22,006 | ||||||||||||
Class I | 12,013 | 217,070 | 5,686 | 84,493 | ||||||||||||
Class R1 | 463 | 8,173 | 499 | 7,293 | ||||||||||||
Class R2 | 1,150 | 20,775 | 337 | 5,012 | ||||||||||||
Class R3 | 407 | 7,351 | 237 | 3,519 | ||||||||||||
Class R4 | 400 | 7,230 | 251 | 3,741 | ||||||||||||
Class R6 | 618,212 | 11,177,271 | 446,428 | 6,638,381 | ||||||||||||
| 671,905 | $12,142,556 | 466,296 | $6,932,297 | |||||||||||||
33
Table of Contents
Notes to Financial Statements – continued
| Year ended 5/31/21 | Year ended 5/31/20 | |||||||||||||||
| Shares | Amount | Shares | Amount | |||||||||||||
| Shares reacquired | ||||||||||||||||
Class A | (1,374,155 | ) | $(24,377,812 | ) | (2,182,341 | ) | $(31,479,205 | ) | ||||||||
Class B | (9,077 | ) | (164,195 | ) | (7,591 | ) | (105,958 | ) | ||||||||
Class C | (18,007 | ) | (319,710 | ) | (11,025 | ) | (158,336 | ) | ||||||||
Class I | (32,033 | ) | (595,111 | ) | (59,776 | ) | (885,829 | ) | ||||||||
Class R1 | (16 | ) | (270 | ) | (7,986 | ) | (119,952 | ) | ||||||||
Class R2 | (10,065 | ) | (186,015 | ) | (828 | ) | (12,719 | ) | ||||||||
Class R3 | (1 | ) | (10 | ) | — | — | ||||||||||
Class R6 | (2,994,107 | ) | (53,602,049 | ) | (1,998,491 | ) | (29,309,050 | ) | ||||||||
| (4,437,461 | ) | $(79,245,172 | ) | (4,268,038 | ) | $(62,071,049 | ) | |||||||||
| Net change | ||||||||||||||||
Class A | (108,376 | ) | $(1,376,207 | ) | (350,835 | ) | $(5,036,008 | ) | ||||||||
Class B | 1,701 | 27,095 | (6,425 | ) | (88,815 | ) | ||||||||||
Class C | 4,289 | 82,034 | (720 | ) | (11,825 | ) | ||||||||||
Class I | 91,702 | 1,728,360 | 31,857 | 431,349 | ||||||||||||
Class R1 | 10,664 | 190,571 | (7,383 | ) | (110,443 | ) | ||||||||||
Class R2 | (7,792 | ) | (144,726 | ) | 8,841 | 134,020 | ||||||||||
Class R3 | 761 | 13,926 | 237 | 3,519 | ||||||||||||
Class R4 | 400 | 7,230 | 251 | 3,741 | ||||||||||||
Class R6 | (7,282 | ) | (1,111,256 | ) | (339,855 | ) | (5,344,849 | ) | ||||||||
| (13,933 | ) | $(582,973 | ) | (664,032 | ) | $(10,019,311 | ) | |||||||||
Effective June 1, 2019, purchases of the fund’s Class B shares are closed to new and existing investors subject to certain exceptions. Please see the fund’s prospectus for details.
The fund is one of several mutual funds in which certain MFS funds may invest. The MFS funds do not invest in the underlying funds for the purpose of exercising management or control. At the end of the period, the MFS Lifetime 2040 Fund, the MFS Lifetime 2030 Fund, the MFS Lifetime 2035 Fund, the MFS Lifetime 2045 Fund, the MFS Lifetime 2050 Fund, the MFS Lifetime Income Fund, the MFS Lifetime 2025 Fund, the MFS Lifetime 2055 Fund, the MFS Lifetime 2020 Fund, and the MFS Lifetime 2060 Fund were the owners of record of approximately 13%, 12%, 10%, 8%, 8%, 5%, 5%, 5%, 3%, and 1%, respectively, of the value of outstanding voting shares of the fund.
(6) Line of Credit
The fund and certain other funds managed by MFS participate in a $1.25 billion unsecured committed line of credit of which $1 billion is reserved for use by the fund and certain other MFS U.S. funds. The line of credit is provided by a syndicate of banks under a credit agreement. Borrowings may be made for temporary financing needs. Interest is charged to each fund, based on its borrowings, generally at a rate equal to the highest of one month LIBOR, the Federal Funds Effective Rate and the Overnight Bank Funding Rate, plus an agreed upon spread. A commitment fee, based on the average daily, unused portion of the committed line of credit, is allocated among the
34
Table of Contents
Notes to Financial Statements – continued
participating funds. In addition, the fund and other funds managed by MFS have established unsecured uncommitted borrowing arrangements with certain banks for temporary financing needs. Interest is charged to each fund, based on its borrowings, at rates equal to customary reference rates plus an agreed upon spread. For the year ended May 31, 2021, the fund’s commitment fee and interest expense were $1,002 and $0, respectively, and are included in “Miscellaneous” expense in the Statement of Operations.
(7) Investments in Affiliated Issuers
An affiliated issuer may be considered one in which the fund owns 5% or more of the outstanding voting securities, or a company which is under common control. For the purposes of this report, the following were affiliated issuers:
| Affiliated Issuers | Beginning Value | Purchases | Sales Proceeds | Realized Gain (Loss) | Change in Unrealized Appreciation or Depreciation | Ending Value | ||||||||||||||||||
| MFS Institutional Money Market Portfolio | $837,500 | $61,936,094 | $60,830,351 | $(274 | ) | $1 | $1,942,970 | |||||||||||||||||
| Affiliated Issuers | Dividend Income | Capital Gain Distributions | ||||||||||||||||||||||
| MFS Institutional Money Market Portfolio |
| $2,023 | $— | |||||||||||||||||||||
(8) Impacts of COVID-19
The pandemic related to the global spread of novel coronavirus disease (COVID-19), which was first detected in December 2019, has resulted in significant disruptions to global business activity and the global economy, as well as the economies of individual countries, the financial performance of individual companies and sectors, and the securities and commodities markets in general. Multiple surges in cases globally, the availability and widespread adoption of vaccines, and the emergence of variant strains of the virus continue to create uncertainty as to the future and long-term impacts resulting from the pandemic including impacts to the prices and liquidity of the fund’s investments and the fund’s performance.
35
Table of Contents
REPORT OF INDEPENDENT REGISTERED PUBLIC ACCOUNTING FIRM
To the Board of Trustees of MFS Series Trust X and the Shareholders of
MFS Blended Research Growth Equity Fund:
Opinion on the Financial Statements and Financial Highlights
We have audited the accompanying statement of assets and liabilities of MFS Blended Research Growth Equity Fund (the “Fund”), including the portfolio of investments, as of May 31, 2021, the related statement of operations for the year then ended, the statements of changes in net assets for each of the two years in the period then ended, the financial highlights for each of the five years in the period then ended, and the related notes. In our opinion, the financial statements and financial highlights present fairly, in all material respects, the financial position of the Fund as of May 31, 2021, and the results of its operations for the year then ended, the changes in its net assets for each of the two years in the period then ended, and the financial highlights for each of the five years in the period then ended, in conformity with accounting principles generally accepted in the United States of America.
Basis for Opinion
These financial statements and financial highlights are the responsibility of the Fund’s management. Our responsibility is to express an opinion on the Fund’s financial statements and financial highlights based on our audits. We are a public accounting firm registered with the Public Company Accounting Oversight Board (United States) (PCAOB) and are required to be independent with respect to the Fund in accordance with the U.S. federal securities laws and the applicable rules and regulations of the Securities and Exchange Commission and the PCAOB.
We conducted our audits in accordance with the standards of the PCAOB. Those standards require that we plan and perform the audit to obtain reasonable assurance about whether the financial statements and financial highlights are free of material misstatement, whether due to error or fraud. The Fund is not required to have, nor were we engaged to perform, an audit of its internal control over financial reporting. As part of our audits we are required to obtain an understanding of internal control over financial reporting but not for the purpose of expressing an opinion on the effectiveness of the Fund’s internal control over financial reporting. Accordingly, we express no such opinion.
Our audits included performing procedures to assess the risks of material misstatement of the financial statements and financial highlights, whether due to error or fraud, and performing procedures that respond to those risks. Such procedures included examining, on a test basis, evidence regarding the amounts and disclosures in the financial statements and financial highlights. Our audits also included evaluating the accounting principles used and significant estimates made by management, as well as evaluating the overall presentation of the financial statements and financial highlights.
36
Table of Contents
Report of Independent Registered Public Accounting Firm – continued
Our procedures included confirmation of securities owned as of May 31, 2021, by correspondence with the custodian. We believe that our audits provide a reasonable basis for our opinion.
DELOITTE & TOUCHE LLP
Boston, Massachusetts
July 16, 2021
We have served as the auditor of one or more of the MFS investment companies since 1924.
37
Table of Contents
TRUSTEES AND OFFICERS — IDENTIFICATION AND BACKGROUND
The Trustees and Officers of the Trust, as of July 1, 2021, are listed below, together with their principal occupations during the past five years. (Their titles may have varied during that period.) The address of each Trustee and Officer is 111 Huntington Avenue, Boston, Massachusetts 02199-7618.
Name, Age | Position(s) with Fund | Trustee/Officer Since (h) | Number of | Principal the Past Five Years | Other Directorships | |||||
| INTERESTED TRUSTEES | ||||||||||
| Robert J. Manning (k) (age 57) | Trustee | February 2004 | 135 | Massachusetts Financial Services Company, Non-Executive Chairman (since January 2021); Director; Chairman of the Board; Executive Chairman (January 2017-2020); Co-Chief Executive Officer (2015-2016) | N/A | |||||
Michael W. Roberge (k) (age 54) | Trustee | January 2021 | 135 | Massachusetts Financial Services Company, Chairman (since January 2021); Chief Executive Officer (since January 2017); Director; President (until December 2018); Chief Investment Officer (until December 2018); Co-Chief Executive Officer (until December 2016) | N/A | |||||
| INDEPENDENT TRUSTEES | ||||||||||
John P. Kavanaugh (age 66) | Trustee and Chair of Trustees | January 2009 | 135 | Private investor | N/A | |||||
Steven E. Buller (age 69) | Trustee | February 2014 | 135 | Private investor | N/A | |||||
John A. Caroselli (age 67) | Trustee | March 2017 | 135 | Private investor; JC Global Advisors, LLC (management consulting), President (since 2015) | N/A | |||||
38
Table of Contents
Trustees and Officers – continued
Name, Age | Position(s) with Fund | Trustee/Officer Since (h) | Number of | Principal the Past Five Years | Other Directorships | |||||
Maureen R. Goldfarb (age 66) | Trustee | January 2009 | 135 | Private investor | N/A | |||||
| Peter D. Jones (age 65) | Trustee | January 2019 | 135 | Private investor | N/A | |||||
| James W. Kilman, Jr. (age 60) | Trustee | January 2019 | 135 | Burford Capital Limited (finance and investment management), Senior Advisor (since May 3, 2021), Chief Financial Officer (2019-May 2, 2021); KielStrand Capital LLC (family office), Chief Executive Officer (since 2016); Morgan Stanley & Co. (financial services), Vice Chairman of Investment Banking, Co-Head of Diversified Financials Coverage – Financial Institutions Investment Banking Group (until 2016) | Alpha-En Corporation, Director (2016-2019) | |||||
Clarence Otis, Jr. (age 65) | Trustee | March 2017 | 135 | Private investor | VF Corporation, Director; Verizon Communications, Inc., Director; The Travelers Companies, Director | |||||
Maryanne L. Roepke (age 65) | Trustee | May 2014 | 135 | Private investor | N/A | |||||
| Laurie J. Thomsen (age 63) | Trustee | March 2005 | 135 | Private investor | The Travelers Companies, Director; Dycom Industries, Inc., Director | |||||
39
Table of Contents
Trustees and Officers – continued
Name, Age | Position(s) Held with Fund | Trustee/Officer Since (h) | Number of | Principal the Past Five Years | ||||
| OFFICERS | ||||||||
| Christopher R. Bohane (k) (age 47) | Assistant Secretary and Assistant Clerk | July 2005 | 135 | Massachusetts Financial Services Company, Senior Vice President and Associate General Counsel | ||||
Kino Clark (k) (age 53) | Assistant Treasurer | January 2012 | 135 | Massachusetts Financial Services Company, Vice President | ||||
John W. Clark, Jr. (k) (age 54) | Assistant Treasurer | April 2017 | 135 | Massachusetts Financial Services Company, Vice President (since March 2017); Deutsche Bank (financial services), Department Head –Treasurer’s Office (until February 2017) | ||||
Thomas H. Connors (k) (age 61) | Assistant Secretary and Assistant Clerk | September 2012 | 135 | Massachusetts Financial Services Company, Vice President and Senior Counsel | ||||
| David L. DiLorenzo (k) (age 52) | President | July 2005 | 135 | Massachusetts Financial Services Company, Senior Vice President | ||||
Heidi W. Hardin (k) (age 53) | Secretary and Clerk | April 2017 | 135 | Massachusetts Financial Services Company, Executive Vice President and General Counsel (since March 2017); Harris Associates (investment management), General Counsel (until January 2017) | ||||
Brian E. Langenfeld (k) (age 48) | Assistant Secretary and Assistant Clerk | June 2006 | 135 | Massachusetts Financial Services Company, Vice President and Senior Counsel | ||||
Amanda S. Mooradian (k) (age 42) | Assistant Secretary and Assistant Clerk | September 2018 | 135 | Massachusetts Financial Services Company, Assistant Vice President and Senior Counsel | ||||
| Susan A. Pereira (k) (age 50) | Assistant Secretary and Assistant Clerk | July 2005 | 135 | Massachusetts Financial Services Company, Vice President and Assistant General Counsel | ||||
Kasey L. Phillips (k) (age 50) | Assistant Treasurer | September 2012 | 135 | Massachusetts Financial Services Company, Vice President | ||||
40
Table of Contents
Trustees and Officers – continued
Name, Age | Position(s) Held with Fund | Trustee/Officer Since (h) | Number of | Principal the Past Five Years | ||||
Matthew A. Stowe (k) (age 46) | Assistant Secretary and Assistant Clerk | October 2014 | 135 | Massachusetts Financial Services Company, Vice President and Assistant General Counsel | ||||
Martin J. Wolin (k) (age 53) | Chief Compliance Officer | July 2015 | 135 | Massachusetts Financial Services Company, Senior Vice President and Chief Compliance Officer | ||||
| James O. Yost (k) (age 61) | Treasurer | September 1990 | 135 | Massachusetts Financial Services Company, Senior Vice President | ||||
| (h) | Date first appointed to serve as Trustee/Officer of an MFS Fund. Each Trustee has served continuously since appointment unless indicated otherwise. For the period from December 15, 2004 until February 22, 2005, Mr. Manning served as Advisory Trustee. From January 2012 through December 2016, Messrs. DiLorenzo and Yost served as Treasurer and Deputy Treasurer of the Funds, respectively. |
| (j) | Directorships or trusteeships of companies required to report to the Securities and Exchange Commission (i.e., “public companies”). |
| (k) | “Interested person” of the Trust within the meaning of the Investment Company Act of 1940 (referred to as the 1940 Act), which is the principal federal law governing investment companies like the fund, as a result of a position with MFS. The address of MFS is 111 Huntington Avenue, Boston, Massachusetts 02199-7618. |
Each Trustee (other than Messrs. Jones, Kilman and Roberge) has been elected by shareholders and each Trustee and Officer holds office until his or her successor is chosen and qualified or until his or her earlier death, resignation, retirement or removal. Mr. Roberge became a Trustee of the Funds on January 1, 2021 and Messrs. Jones and Kilman became Trustees of the Funds on January 1, 2019. The Trust does not hold annual meetings for the purpose of electing Trustees, and Trustees are not elected for fixed terms. Under the terms of the Board’s retirement policy, an Independent Trustee shall retire at the end of the calendar year in which he or she reaches the earlier of 75 years of age or 15 years of service on the Board (or, in the case of any Independent Trustee who joined the Board prior to 2015, 20 years of service on the Board).
Messrs. Buller, Kilman and Otis and Ms. Roepke are members of the Trust’s Audit Committee.
Each of the Interested Trustees and certain Officers hold comparable officer positions with certain affiliates of MFS.
41
Table of Contents
Trustees and Officers – continued
The Statement of Additional Information for a Fund includes further information about the Trustees and is available without charge upon request by calling 1-800-225-2606.
| Investment Adviser | Custodian | |
Massachusetts Financial Services Company Boston, MA 02199-7618 | State Street Bank and Trust Company 1 Lincoln Street Boston, MA 02111-2900 | |
| Distributor | Independent Registered Public Accounting Firm | |
MFS Fund Distributors, Inc. Boston, MA 02199-7618 | Deloitte & Touche LLP 200 Berkeley Street Boston, MA 02116 | |
| Portfolio Manager(s) | ||
Jim Fallon Matt Krummell Jonathan Sage Jed Stocks |
42
Table of Contents
STATEMENT REGARDING LIQUIDITY RISK MANAGEMENT PROGRAM
The fund has adopted and implemented a liquidity risk management program (the “Program”) as required by Rule 22e-4 under the Investment Company Act of 1940, as amended. The fund’s Board of Trustees (the “Board”) has designated MFS as the administrator of the Program. The Program is reasonably designed to assess and manage the liquidity risk of the fund. Liquidity risk is the risk that the fund could not meet requests to redeem shares issued by the fund without significant dilution of remaining investors’ interests.
MFS provided a written report to the Board for consideration at its April 2021 meeting that addressed the operation of the Program and provided an assessment of the adequacy and effectiveness of the Program during the period from January 1, 2020 to December 31, 2020 (the “Covered Period”). The report concluded that during the Covered Period the Program had operated effectively and had adequately and effectively been implemented to assess and manage the fund’s liquidity risk. MFS also reported that there were no liquidity events that impacted the fund or its ability to timely meet redemptions without dilution to existing shareholders during the Covered Period.
There can be no assurance that the Program will achieve its objectives in the future. Further information on liquidity risk, and other principal risks to which an investment in the fund may be subject, can be found in the prospectus.
43
Table of Contents
PROXY VOTING POLICIES AND INFORMATION
MFS votes proxies on behalf of the fund pursuant to proxy voting policies and procedures that are available without charge, upon request, by calling 1-800-225-2606, by visiting mfs.com/proxyvoting, or by visiting the SEC Web site at http://www.sec.gov.
Information regarding how the fund voted proxies relating to portfolio securities during the most recent twelve-month period ended June 30 is available by August 31 of each year without charge by visiting mfs.com/proxyvoting, or by visiting the SEC’s Web site at http://www.sec.gov.
QUARTERLY PORTFOLIO DISCLOSURE
The fund files a complete schedule of portfolio holdings with the SEC for the first and third quarters of each fiscal year as an exhibit to its reports on Form N-PORT. The fund’s Form N-PORT reports are available on the SEC’s Web site at http://www.sec.gov. A shareholder can obtain the portfolio holdings report for the first and third quarters of the fund’s fiscal year at mfs.com/openendfunds by choosing the fund’s name and then scrolling to the “Resources” section and clicking on the “Prospectus and Reports” tab.
From time to time, MFS may post important information about the fund or the MFS Funds on the MFS Web site (mfs.com). This information is available at https://www.mfs.com/announcements or at mfs.com/openendfunds by choosing the fund’s name and then scrolling to the “Resources” section and clicking on the “Announcements” tab, if any.
INFORMATION ABOUT FUND CONTRACTS AND LEGAL CLAIMS
The fund has entered into contractual arrangements with an investment adviser, administrator, distributor, shareholder servicing agent, 529 program manager (if applicable), and custodian who each provide services to the fund. Unless expressly stated otherwise, shareholders are not parties to, or intended beneficiaries of these contractual arrangements, and these contractual arrangements are not intended to create any shareholder right to enforce them against the service providers or to seek any remedy under them against the service providers, either directly or on behalf of the fund.
Under the Trust’s By-Laws and Declaration of Trust, any claims asserted against or on behalf of the MFS Funds, including claims against Trustees and Officers, must be brought in state and federal courts located within the Commonwealth of Massachusetts.
FEDERAL TAX INFORMATION (unaudited)
The fund will notify shareholders of amounts for use in preparing 2021 income tax forms in January 2022. The following information is provided pursuant to provisions of the Internal Revenue Code.
The fund designates the maximum amount allowable as qualified dividend income eligible to be taxed at the same rate as long-term capital gain.
The fund designates $14,813,000 as capital gain dividends paid during the fiscal year.
For corporate shareholders, 28.74% of the ordinary income dividends paid during the fiscal year qualify for the corporate dividends received deduction.
The fund designates the maximum amount allowable as Section 199A dividends as defined in Proposed Treasury Regulation §1.199A-3(d).
44
Table of Contents
rev. 3/16
| WHAT DOES MFS DO WITH YOUR PERSONAL INFORMATION? |  | ||
| Why? | Financial companies choose how they share your personal information. Federal law gives consumers the right to limit some but not all sharing. Federal law also requires us to tell you how we collect, share, and protect your personal information. Please read this notice carefully to understand what we do. |
| What? | The types of personal information we collect and share depend on the product or service you have with us. This information can include:
• Social Security number and account balances • Account transactions and transaction history • Checking account information and wire transfer instructions
When you are no longer our customer, we continue to share your information as described in this notice. |
| How? | All financial companies need to share customers’ personal information to run their everyday business. In the section below, we list the reasons financial companies can share their customers’ personal information; the reasons MFS chooses to share; and whether you can limit this sharing. |
| Reasons we can share your personal information | Does MFS share? | Can you limit this sharing? | ||
For our everyday business purposes – such as to process your transactions, maintain your account(s), respond to court orders and legal investigations, or report to credit bureaus | Yes | No | ||
For our marketing purposes – to offer our products and services to you | No | We don’t share | ||
For joint marketing with other financial companies | No | We don’t share | ||
For our affiliates’ everyday business purposes – information about your transactions and experiences | No | We don’t share | ||
For our affiliates’ everyday business purposes – information about your creditworthiness | No | We don’t share | ||
| For nonaffiliates to market to you | No | We don’t share |
| Questions? | Call 800-225-2606 or go to mfs.com. | |
45
Table of Contents
| Page 2 |
| Who we are | ||
| Who is providing this notice? | MFS Funds, MFS Investment Management, MFS Institutional Advisors, Inc., and MFS Heritage Trust Company. | |
| What we do | ||
| How does MFS protect my personal information? | To protect your personal information from unauthorized access and use, we use security measures that comply with federal law. These measures include procedural, electronic, and physical safeguards for the protection of the personal information we collect about you. | |
| How does MFS collect my personal information? | We collect your personal information, for example, when you
• open an account or provide account information • direct us to buy securities or direct us to sell your securities • make a wire transfer
We also collect your personal information from others, such as credit bureaus, affiliates, or other companies. | |
| Why can’t I limit all sharing? | Federal law gives you the right to limit only
• sharing for affiliates’ everyday business purposes – information about your creditworthiness • affiliates from using your information to market to you • sharing for nonaffiliates to market to you
State laws and individual companies may give you additional rights to limit sharing. | |
| Definitions | ||
| Affiliates | Companies related by common ownership or control. They can be financial and nonfinancial companies.
• MFS does not share personal information with affiliates, except for everyday business purposes as described on page one of this notice. | |
| Nonaffiliates | Companies not related by common ownership or control. They can be financial and nonfinancial companies.
• MFS does not share with nonaffiliates so they can market to you. | |
| Joint marketing | A formal agreement between nonaffiliated financial companies that together market financial products or services to you.
• MFS doesn’t jointly market. | |
| Other important information | ||
| If you own an MFS product or receive an MFS service in the name of a third party such as a bank or broker-dealer, their privacy policy may apply to you instead of ours. | ||
46
Table of Contents
Save paper with eDelivery.
| MFS® will send you prospectuses, |

reports, and proxies directly via e-mail so you will get information faster with less mailbox clutter.
To sign up:
1. Go to mfs.com.
2. Log in via MFS® Access.
3. Select eDelivery.
If you own your MFS fund shares through a financial institution or a retirement plan, MFS® TALK, MFS® Access, or eDelivery may not be available to you.
WEB SITE
mfs.com
MFS TALK
1-800-637-8255
24 hours a day
ACCOUNT SERVICE AND LITERATURE
Shareholders
1-800-225-2606
Financial advisors
1-800-343-2829
Retirement plan services
1-800-637-1255
MAILING ADDRESS
MFS Service Center, Inc.
P.O. Box 219341
Kansas City, MO 64121-9341
OVERNIGHT MAIL
MFS Service Center, Inc.
Suite 219341
430 W 7th Street
Kansas City, MO 64105-1407
Table of Contents

Small Cap Equity Fund

Table of Contents
Table of Contents
Small Cap Equity Fund
| 1 | |
| 2 | |
| 3 | |
| 6 | |
| 9 | |
| 12 | |
| 20 | |
| 22 | |
| 23 | |
| 24 | |
| 36 | |
| 47 | |
| 49 | |
| 54 | |
| 55 | |
| 55 | |
| 55 | |
| 55 | |
| 55 | |
| 57 |
| back cover |
Table of Contents
Table of Contents


Table of Contents

| CNO Financial Group, Inc. | 1.6% |
| Evercore Partners, Inc. | 1.5% |
| Texas Roadhouse, Inc. | 1.5% |
| Box, Inc., “A” | 1.5% |
| Prestige Consumer Healthcare, Inc. | 1.5% |
| Univar Solutions, Inc. | 1.4% |
| Builders FirstSource, Inc. | 1.4% |
| Funko, Inc., “A” | 1.4% |
| Eagle Materials, Inc. | 1.4% |
| Element Solutions, Inc. | 1.4% |
| Health Care | 19.0% |
| Industrials | 14.9% |
| Financials | 14.6% |
| Consumer Discretionary | 13.7% |
| Information Technology | 13.2% |
| Real Estate | 7.2% |
| Materials | 5.0% |
| Energy | 3.3% |
| Consumer Staples | 3.3% |
| Communication Services | 2.6% |
| Utilities | 1.8% |
| (g) | The Global Industry Classification Standard (GICS®) was developed by and/or is the exclusive property of MSCI, Inc. and S&P Global Market Intelligence Inc. (“S&P Global Market Intelligence”). GICS is a service mark of MSCI and S&P Global Market Intelligence and has been licensed for use by MFS. MFS has applied its own internal sector/industry classification methodology for equity securities and non-equity securities that are unclassified by GICS. |
Table of Contents
Table of Contents
| (b) | Security is not a benchmark constituent. |
| (h) | Security was not held in the portfolio at period end. |
Table of Contents
Table of Contents
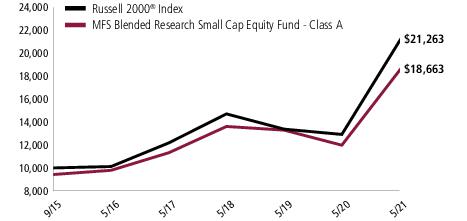
Table of Contents
| Share Class | Class Inception Date | 1-yr | 5-yr | Life (t) |
| A | 9/15/15 | 55.75% | 13.77% | 12.70% |
| B | 9/15/15 | 54.50% | 12.91% | 11.85% |
| C | 9/15/15 | 54.55% | 12.91% | 11.86% |
| I | 9/15/15 | 56.17% | 14.04% | 12.99% |
| R1 | 9/15/15 | 54.64% | 12.91% | 11.86% |
| R2 | 9/15/15 | 55.37% | 13.48% | 12.41% |
| R3 | 9/15/15 | 55.83% | 13.77% | 12.70% |
| R4 | 9/15/15 | 56.23% | 14.05% | 12.98% |
| R6 | 9/15/15 | 56.40% | 14.16% | 13.07% |
| 529A | 7/14/16 | 55.75% | N/A | 13.25% |
| 529B | 7/14/16 | 55.66% | N/A | 12.62% |
| 529C | 7/14/16 | 54.47% | N/A | 12.38% |
| Russell 2000® Index (f) | 64.56% | 16.01% | 14.11% |
| A With Initial Sales Charge (5.75%) | 46.79% | 12.43% | 11.54% |
| B With CDSC (Declining over six years from 4% to 0%) (v) | 50.50% | 12.66% | 11.75% |
| C With CDSC (1% for 12 months) (v) | 53.55% | 12.91% | 11.86% |
| 529A With Initial Sales Charge (5.75%) | 46.79% | N/A | 11.88% |
| 529B With CDSC (Declining over six years from 4% to 0%) (v) | 51.66% | N/A | 12.36% |
| 529C With CDSC (1% for 12 months) (v) | 53.47% | N/A | 12.38% |
| (f) | Source: FactSet Research Systems Inc. |
| (t) | For the period from the class inception date through the stated period end. The comparative benchmark performance information provided for the “life” period is from the inception date of the Class A shares. (See Notes to Performance Summary.) |
| (v) | Assuming redemption at the end of the applicable period. |
Table of Contents
| (h) | Frank Russell Company (“Russell”) is the source and owner of the trademarks, service marks, and copyrights related to the Russell Indexes. Russell® is a trademark of Frank Russell Company. Neither Russell nor its licensors accept any liability for any errors or omissions in the Russell Indexes and/or Russell ratings or underlying data and no party may rely on any Russell Indexes and/or Russell ratings and/or underlying data contained in this document. No further distribution of Russell Data is permitted without Russell's express written consent. Russell does not promote, sponsor, or endorse the content of this document. |
Table of Contents
December 1, 2020 through May 31, 2021
Table of Contents
| Share Class | Annualized Expense Ratio | Beginning Account Value 12/01/20 | Ending Account Value 5/31/21 | Expenses Paid During Period (p) 12/01/20-5/31/21 | |
| A | Actual | 0.99% | $1,000.00 | $1,298.48 | $5.67 |
| Hypothetical (h) | 0.99% | $1,000.00 | $1,020.00 | $4.99 | |
| B | Actual | 1.73% | $1,000.00 | $1,293.36 | $9.89 |
| Hypothetical (h) | 1.73% | $1,000.00 | $1,016.31 | $8.70 | |
| C | Actual | 1.74% | $1,000.00 | $1,293.59 | $9.95 |
| Hypothetical (h) | 1.74% | $1,000.00 | $1,016.26 | $8.75 | |
| I | Actual | 0.74% | $1,000.00 | $1,300.24 | $4.24 |
| Hypothetical (h) | 0.74% | $1,000.00 | $1,021.24 | $3.73 | |
| R1 | Actual | 1.74% | $1,000.00 | $1,293.36 | $9.95 |
| Hypothetical (h) | 1.74% | $1,000.00 | $1,016.26 | $8.75 | |
| R2 | Actual | 1.24% | $1,000.00 | $1,297.01 | $7.10 |
| Hypothetical (h) | 1.24% | $1,000.00 | $1,018.75 | $6.24 | |
| R3 | Actual | 0.99% | $1,000.00 | $1,298.57 | $5.67 |
| Hypothetical (h) | 0.99% | $1,000.00 | $1,020.00 | $4.99 | |
| R4 | Actual | 0.74% | $1,000.00 | $1,299.80 | $4.24 |
| Hypothetical (h) | 0.74% | $1,000.00 | $1,021.24 | $3.73 | |
| R6 | Actual | 0.65% | $1,000.00 | $1,301.40 | $3.73 |
| Hypothetical (h) | 0.65% | $1,000.00 | $1,021.69 | $3.28 | |
| 529A | Actual | 1.01% | $1,000.00 | $1,298.65 | $5.79 |
| Hypothetical (h) | 1.01% | $1,000.00 | $1,019.90 | $5.09 | |
| 529B | Actual | 1.04% | $1,000.00 | $1,298.32 | $5.96 |
| Hypothetical (h) | 1.04% | $1,000.00 | $1,019.75 | $5.24 | |
| 529C | Actual | 1.79% | $1,000.00 | $1,293.50 | $10.24 |
| Hypothetical (h) | 1.79% | $1,000.00 | $1,016.01 | $9.00 |
| (h) | 5% class return per year before expenses. |
| (p) | “Expenses Paid During Period” are equal to each class’s annualized expense ratio, as shown above, multiplied by the average account value over the period, multiplied by 182/365 (to reflect the one-half year period). Expenses paid do not include any applicable sales charges (loads). If these transaction costs had been included, your costs would have been higher. |
Table of Contents
Table of Contents
| Issuer | Shares/Par | Value ($) | ||
| Common Stocks – 98.6% | ||||
| Aerospace & Defense – 0.7% | ||||
| CACI International, Inc., “A” (a) | 9,297 | $ 2,370,363 | ||
| Apparel Manufacturers – 1.4% | ||||
| FIGS, Inc. (a) | 15,870 | $ 541,961 | ||
| Skechers USA, Inc., “A” (a) | 93,312 | 4,432,320 | ||
| $4,974,281 | ||||
| Automotive – 0.2% | ||||
| American Axle & Manufacturing, Inc. (a) | 17,665 | $ 197,848 | ||
| REV Group, Inc. (a) | 9,526 | 178,327 | ||
| Stoneridge, Inc. (a) | 4,960 | 150,982 | ||
| XPEL, Inc. (a) | 2,990 | 245,180 | ||
| $772,337 | ||||
| Biotechnology – 7.0% | ||||
| Adaptive Biotechnologies Corp. (a) | 34,691 | $ 1,311,667 | ||
| Agios Pharmaceuticals, Inc. (a) | 4,832 | 269,529 | ||
| Alkermes PLC (a) | 53,820 | 1,220,099 | ||
| AnaptysBio, Inc. (a) | 26,467 | 631,767 | ||
| Avid Bioservices, Inc. (a) | 20,710 | 440,709 | ||
| Calithera Biosciences, Inc. (a) | 113,458 | 258,684 | ||
| Clovis Oncology, Inc. (a)(l) | 99,182 | 508,804 | ||
| Coherus BioSciences, Inc. (a) | 85,192 | 1,121,127 | ||
| CymaBay Therapeutics, Inc. (a) | 184,244 | 779,352 | ||
| CytomX Therapeutics, Inc. (a) | 225,962 | 1,617,888 | ||
| Eiger BioPharmaceuticals, Inc. (a) | 24,253 | 190,629 | ||
| Exelixis, Inc. (a) | 14,479 | 326,501 | ||
| ImmunoGen, Inc. (a) | 67,689 | 418,318 | ||
| Lexicon Pharmaceuticals, Inc. (a) | 115,668 | 507,783 | ||
| Macrogenics, Inc. (a) | 61,500 | 1,979,685 | ||
| Meridian Bioscience, Inc. (a) | 96,179 | 1,996,676 | ||
| Novavax, Inc. (a) | 13,431 | 1,982,684 | ||
| Organogenesis Holdings, Inc. (a) | 24,862 | 443,289 | ||
| Prothena Corp. PLC (a) | 56,518 | 1,648,630 | ||
| Radius Health, Inc. (a) | 38,061 | 734,197 | ||
| Sorrento Therapeutics, Inc. (a)(l) | 78,849 | 592,944 | ||
| Translate Bio, Inc. (a) | 53,945 | 971,549 | ||
| Travere Therapeutics, Inc. (a) | 76,239 | 1,156,546 | ||
| Vanda Pharmaceuticals, Inc. (a) | 118,342 | 2,093,470 | ||
| Varex Imaging Corp. (a) | 48,851 | 1,225,672 | ||
Table of Contents
| Issuer | Shares/Par | Value ($) | ||
| Common Stocks – continued | ||||
| Biotechnology – continued | ||||
| Vir Biotechnology, Inc. (a) | 15,530 | $ 650,862 | ||
| $25,079,061 | ||||
| Brokerage & Asset Managers – 1.5% | ||||
| Evercore Partners, Inc. | 37,098 | $ 5,411,114 | ||
| Business Services – 3.3% | ||||
| Forrester Research, Inc. (a) | 60,764 | $ 2,607,383 | ||
| MoneyGram International, Inc. (a) | 167,538 | 1,641,873 | ||
| RE/MAX Holdings, Inc., “A” | 72,716 | 2,545,787 | ||
| Rush Enterprises, Inc., “A” | 31,824 | 1,521,187 | ||
| Syneos Health, Inc. (a) | 40,950 | 3,599,505 | ||
| $11,915,735 | ||||
| Chemicals – 1.9% | ||||
| Element Solutions, Inc. | 207,286 | $ 4,848,420 | ||
| Rayonier Advanced Materials, Inc. (a) | 252,892 | 1,952,326 | ||
| $6,800,746 | ||||
| Computer Software – 3.5% | ||||
| ACI Worldwide, Inc. (a) | 44,192 | $ 1,690,786 | ||
| Altair Engineering, Inc., “A” (a) | 2,746 | 184,998 | ||
| Appian Corp. (a) | 3,573 | 323,285 | ||
| Cornerstone OnDemand, Inc. (a) | 42,736 | 1,879,102 | ||
| Pagerduty, Inc. (a) | 71,441 | 2,904,076 | ||
| Paylocity Holding Corp. (a) | 16,384 | 2,782,495 | ||
| Sprout Social, Inc. (a) | 15,957 | 1,107,735 | ||
| Tenable Holdings, Inc. (a) | 35,444 | 1,481,559 | ||
| $12,354,036 | ||||
| Computer Software - Systems – 3.1% | ||||
| Box, Inc., “A” (a) | 227,819 | $ 5,310,461 | ||
| Five9, Inc. (a) | 21,860 | 3,871,406 | ||
| Pitney Bowes, Inc. | 41,712 | 349,547 | ||
| Rimini Street, Inc. (a) | 22,528 | 146,657 | ||
| Verint Systems, Inc. (a) | 26,630 | 1,227,909 | ||
| $10,905,980 | ||||
| Construction – 3.5% | ||||
| Builders FirstSource, Inc. (a) | 113,781 | $ 5,067,806 | ||
| Century Communities, Inc. | 12,968 | 1,055,336 | ||
| Eagle Materials, Inc. | 33,458 | 4,910,296 | ||
| GMS, Inc. (a) | 29,074 | 1,331,298 | ||
| $12,364,736 | ||||
Table of Contents
| Issuer | Shares/Par | Value ($) | ||
| Common Stocks – continued | ||||
| Consumer Products – 2.9% | ||||
| Energizer Holdings, Inc. | 72,174 | $ 3,322,891 | ||
| Nu Skin Enterprises, Inc., “A” | 20,658 | 1,242,785 | ||
| Prestige Consumer Healthcare, Inc. (a) | 106,109 | 5,291,656 | ||
| Tupperware Brands Corp. (a) | 26,610 | 682,281 | ||
| $10,539,613 | ||||
| Consumer Services – 1.2% | ||||
| BrightView Holdings, Inc. (a) | 20,282 | $ 351,893 | ||
| Grand Canyon Education, Inc. (a) | 38,868 | 3,534,656 | ||
| Medifast, Inc. | 1,669 | 554,525 | ||
| $4,441,074 | ||||
| Electrical Equipment – 1.9% | ||||
| Advanced Drainage Systems, Inc. | 23,333 | $ 2,646,429 | ||
| TriMas Corp. (a) | 123,965 | 4,018,945 | ||
| $6,665,374 | ||||
| Electronics – 5.2% | ||||
| Advanced Energy Industries, Inc. | 41,197 | $ 4,202,506 | ||
| Alpha and Omega Semiconductor Ltd. (a) | 13,837 | 445,690 | ||
| Amkor Technology, Inc. | 141,879 | 2,993,647 | ||
| Jabil Circuit, Inc. | 36,054 | 2,035,248 | ||
| Plexus Corp. (a) | 39,401 | 3,893,213 | ||
| Sanmina Corp. (a) | 40,506 | 1,705,707 | ||
| Silicon Laboratories, Inc. (a) | 23,173 | 3,164,505 | ||
| $18,440,516 | ||||
| Energy - Independent – 1.2% | ||||
| Antero Resources Corp. (a) | 47,208 | $ 609,455 | ||
| CONSOL Energy, Inc. (a) | 45,074 | 691,435 | ||
| Magnolia Oil & Gas Corp., “A” (a) | 228,966 | 2,958,241 | ||
| $4,259,131 | ||||
| Engineering - Construction – 2.6% | ||||
| APi Group, Inc. (a) | 183,197 | $ 3,874,616 | ||
| Construction Partners, Inc., “A” (a) | 31,714 | 1,021,508 | ||
| Quanta Services, Inc. | 47,551 | 4,533,988 | ||
| $9,430,112 | ||||
| Food & Beverages – 1.1% | ||||
| Hostess Brands, Inc. (a) | 261,607 | $ 4,101,998 | ||
Table of Contents
| Issuer | Shares/Par | Value ($) | ||
| Common Stocks – continued | ||||
| Forest & Paper Products – 0.6% | ||||
| Clearwater Paper Corp. (a) | 25,459 | $ 726,345 | ||
| Verso Corp., “A” | 83,201 | 1,415,249 | ||
| $2,141,594 | ||||
| Gaming & Lodging – 2.5% | ||||
| Everi Holdings, Inc. (a) | 94,977 | $ 1,968,873 | ||
| Penn National Gaming, Inc. (a) | 39,921 | 3,272,324 | ||
| Wyndham Hotels & Resorts, Inc. | 48,611 | 3,648,742 | ||
| $8,889,939 | ||||
| Insurance – 2.9% | ||||
| CNO Financial Group, Inc. | 218,501 | $ 5,803,387 | ||
| Heritage Insurance Holdings, Inc. | 40,041 | 333,542 | ||
| Reinsurance Group of America, Inc. | 32,514 | 4,097,739 | ||
| $10,234,668 | ||||
| Internet – 2.7% | ||||
| Brightcove, Inc. (a) | 26,108 | $ 378,566 | ||
| Cars.com, Inc. (a) | 203,724 | 2,976,408 | ||
| Digital Turbine, Inc. (a) | 35,384 | 2,341,359 | ||
| QuinStreet, Inc. (a) | 91,851 | 1,663,422 | ||
| TechTarget (a) | 25,428 | 1,787,843 | ||
| TrueCar, Inc. (a) | 83,451 | 493,195 | ||
| $9,640,793 | ||||
| Leisure & Toys – 3.8% | ||||
| Brunswick Corp. | 44,853 | $ 4,585,322 | ||
| Funko, Inc., “A” (a) | 187,526 | 4,922,558 | ||
| Malibu Boats, Inc., “A” (a) | 48,651 | 3,815,211 | ||
| Nautilus, Inc. (a) | 19,198 | 345,756 | ||
| $13,668,847 | ||||
| Machinery & Tools – 2.2% | ||||
| ACCO Brands Corp. | 27,473 | $ 250,279 | ||
| AGCO Corp. | 2,711 | 375,121 | ||
| ITT, Inc. | 19,569 | 1,837,529 | ||
| Regal Beloit Corp. | 33,724 | 4,796,565 | ||
| Titan Machinery, Inc. (a) | 25,485 | 781,880 | ||
| $8,041,374 | ||||
| Medical & Health Technology & Services – 2.3% | ||||
| Covetrus, Inc. (a) | 18,517 | $ 513,662 | ||
| Owens & Minor, Inc. | 60,535 | 2,706,520 | ||
| Signify Health, Inc., “A” (a) | 36,969 | 935,316 | ||
Table of Contents
| Issuer | Shares/Par | Value ($) | ||
| Common Stocks – continued | ||||
| Medical & Health Technology & Services – continued | ||||
| Tenet Healthcare Corp. (a) | 59,472 | $ 3,979,271 | ||
| $8,134,769 | ||||
| Medical Equipment – 4.2% | ||||
| Accuray, Inc. (a) | 161,654 | $ 688,646 | ||
| Alphatec Holdings, Inc. (a) | 71,480 | 1,036,460 | ||
| AngioDynamics, Inc. (a) | 62,917 | 1,454,641 | ||
| Avanos Medical, Inc. (a) | 39,297 | 1,575,810 | ||
| Bio-Techne Corp. | 4,492 | 1,858,924 | ||
| Envista Holdings Corp. (a) | 9,266 | 404,368 | ||
| Integer Holdings Corp. (a) | 29,333 | 2,653,757 | ||
| LivaNova PLC (a) | 4,683 | 391,218 | ||
| Merit Medical Systems, Inc. (a) | 19,201 | 1,158,588 | ||
| OraSure Technologies, Inc. (a) | 63,356 | 608,851 | ||
| Orthofix Medical, Inc. (a) | 15,901 | 647,171 | ||
| Quidel Corp. (a) | 16,062 | 1,897,083 | ||
| Zynex, Inc. (a)(l) | 50,433 | 767,590 | ||
| $15,143,107 | ||||
| Metals & Mining – 0.9% | ||||
| Ryerson Holding Corp. (a) | 75,405 | $ 1,248,707 | ||
| TimkenSteel Corp. (a) | 86,738 | 1,314,081 | ||
| United States Steel Corp. | 24,477 | 634,688 | ||
| $3,197,476 | ||||
| Natural Gas - Distribution – 0.3% | ||||
| MDU Resources Group, Inc. | 33,060 | $ 1,112,800 | ||
| Natural Gas - Pipeline – 0.6% | ||||
| Antero Midstream Corp. | 75,374 | $ 723,591 | ||
| Equitrans Midstream Corp. | 169,517 | 1,396,820 | ||
| $2,120,411 | ||||
| Network & Telecom – 0.6% | ||||
| Cambium Networks Corp. (a) | 24,772 | $ 1,429,592 | ||
| QTS Realty Trust, Inc., REIT, “A” | 7,440 | 471,547 | ||
| Ribbon Communications, Inc. (a) | 35,704 | 265,638 | ||
| $2,166,777 | ||||
| Oil Services – 2.4% | ||||
| Cactus, Inc., “A” | 133,896 | $ 4,691,716 | ||
| ChampionX Corp. (a) | 16,594 | 439,741 | ||
| Liberty Oilfield Services, Inc. (a) | 32,267 | 482,714 | ||
Table of Contents
| Issuer | Shares/Par | Value ($) | ||
| Common Stocks – continued | ||||
| Oil Services – continued | ||||
| MRC Global, Inc. (a) | 288,593 | $ 3,099,489 | ||
| $8,713,660 | ||||
| Other Banks & Diversified Financials – 10.7% | ||||
| Bank OZK | 100,355 | $ 4,286,162 | ||
| Cathay General Bancorp, Inc. | 112,800 | 4,701,504 | ||
| First Hawaiian, Inc. | 86,473 | 2,435,080 | ||
| Hanmi Financial Corp. | 193,933 | 4,068,714 | ||
| Herc Holdings, Inc. (a) | 14,163 | 1,629,028 | ||
| Prosperity Bancshares, Inc. | 41,072 | 3,090,668 | ||
| Signature Bank | 11,476 | 2,866,131 | ||
| SLM Corp. | 215,006 | 4,353,871 | ||
| UMB Financial Corp. | 49,839 | 4,819,930 | ||
| Umpqua Holdings Corp. | 129,432 | 2,469,563 | ||
| Wintrust Financial Corp. | 43,719 | 3,515,882 | ||
| $38,236,533 | ||||
| Pharmaceuticals – 3.0% | ||||
| Amneal Pharmaceuticals, Inc. (a) | 62,498 | $ 353,739 | ||
| Aquestive Therapeutics, Inc. (a) | 42,006 | 155,842 | ||
| Collegium Pharmaceutical, Inc. (a) | 54,253 | 1,296,104 | ||
| Emergent BioSolutions, Inc. (a) | 21,738 | 1,318,410 | ||
| G1 Therapeutics, Inc. (a) | 30,502 | 662,503 | ||
| Gritstone bio, Inc. (a) | 59,123 | 543,932 | ||
| IDEAYA Biosciences, Inc. (a) | 52,787 | 1,063,658 | ||
| KalVista Pharmaceuticals, Inc. (a) | 33,305 | 899,235 | ||
| OPKO Health, Inc. (a) | 34,049 | 130,067 | ||
| Phibro Animal Health Corp., “A” | 47,337 | 1,334,430 | ||
| TCR Therapeutics, Inc. (a) | 4,446 | 85,141 | ||
| United Therapeutics Corp. (a) | 15,462 | 2,874,386 | ||
| $10,717,447 | ||||
| Pollution Control – 0.2% | ||||
| U.S. Ecology, Inc. (a) | 19,260 | $ 763,274 | ||
| Printing & Publishing – 0.2% | ||||
| Gannett Co., Inc. (a) | 122,232 | $ 627,050 | ||
| Railroad & Shipping – 0.1% | ||||
| Genco Shipping & Trading Ltd. | 13,837 | $ 218,625 | ||
| Real Estate – 6.3% | ||||
| Broadstone Net Lease, Inc. | 79,822 | $ 1,743,312 | ||
| Corporate Office Properties Trust, REIT | 31,243 | 862,307 | ||
| Empire State Realty Trust, REIT, “A” | 162,877 | 1,926,835 | ||
Table of Contents
| Issuer | Shares/Par | Value ($) | ||
| Common Stocks – continued | ||||
| Real Estate – continued | ||||
| Industrial Logistics Properties Trust, REIT | 39,030 | $ 978,092 | ||
| Innovative Industrial Properties, Inc., REIT | 6,994 | 1,260,529 | ||
| Life Storage, Inc., REIT | 1,614 | 160,496 | ||
| National Storage Affiliates Trust, REIT | 83,435 | 3,846,353 | ||
| Spirit Realty Capital, Inc., REIT | 67,295 | 3,180,362 | ||
| STAG Industrial, Inc., REIT | 108,779 | 3,884,498 | ||
| STORE Capital Corp., REIT | 107,810 | 3,708,664 | ||
| Uniti Group, Inc., REIT | 98,940 | 1,074,488 | ||
| $22,625,936 | ||||
| Restaurants – 2.2% | ||||
| Performance Food Group Co. (a) | 48,428 | $ 2,427,696 | ||
| Texas Roadhouse, Inc. | 53,526 | 5,390,603 | ||
| $7,818,299 | ||||
| Specialty Chemicals – 1.6% | ||||
| Kraton Corp. (a) | 19,814 | $ 672,685 | ||
| Univar Solutions, Inc. (a) | 188,530 | 5,107,278 | ||
| $5,779,963 | ||||
| Specialty Stores – 2.8% | ||||
| Bed Bath & Beyond, Inc. (a) | 6,318 | $ 176,841 | ||
| Camping World Holdings, Inc. “A” | 48,347 | 2,146,123 | ||
| Lumber Liquidators Holdings, Inc. (a) | 42,527 | 968,765 | ||
| Overstock.com, Inc. (a) | 30,264 | 2,585,454 | ||
| Petco Health & Wellness Co., Inc. (a)(l) | 70,970 | 1,607,470 | ||
| Signet Jewelers Ltd. (a) | 4,450 | 269,581 | ||
| Urban Outfitters, Inc. (a) | 62,088 | 2,431,366 | ||
| $10,185,600 | ||||
| Telecommunications - Wireless – 0.3% | ||||
| Telephone and Data Systems, Inc. | 40,227 | $ 1,034,638 | ||
| Telephone Services – 0.2% | ||||
| Consolidated Communications Holdings, Inc. (a) | 80,888 | $ 757,112 | ||
| Trucking – 1.3% | ||||
| Daseke, Inc. (a) | 40,934 | $ 296,362 | ||
| Forward Air Corp. | 44,281 | 4,290,386 | ||
| $4,586,748 | ||||
Table of Contents
| Issuer | Shares/Par | Value ($) | ||
| Common Stocks – continued | ||||
| Utilities - Electric Power – 1.5% | ||||
| NRG Energy, Inc. | 32,704 | $ 1,051,434 | ||
| Portland General Electric Co. | 92,042 | 4,412,493 | ||
| $5,463,927 | ||||
| Total Common Stocks (Identified Cost, $256,387,986) | $ 352,847,574 | |||
| Investment Companies (h) – 1.5% | ||||
| Money Market Funds – 1.5% | ||||
| MFS Institutional Money Market Portfolio, 0.03% (v) (Identified Cost, $5,215,555) | 5,215,555 | $ 5,215,555 | ||
| Collateral for Securities Loaned – 0.3% | ||||
| State Street Navigator Securities Lending Government Money Market Portfolio, 0.01% (j) (Identified Cost, $1,165,932) | 1,165,932 | $ 1,165,932 | ||
| Other Assets, Less Liabilities – (0.4)% | (1,309,104) | |||
| Net Assets – 100.0% | $ 357,919,957 | |||
| (a) | Non-income producing security. | |||
| (h) | An affiliated issuer, which may be considered one in which the fund owns 5% or more of the outstanding voting securities, or a company which is under common control. At period end, the aggregate values of the fund's investments in affiliated issuers and in unaffiliated issuers were $5,215,555 and $354,013,506, respectively. | |||
| (j) | The rate quoted is the annualized seven-day yield of the fund at period end. | |||
| (l) | A portion of this security is on loan. See Note 2 for additional information. | |||
| (v) | Affiliated issuer that is available only to investment companies managed by MFS. The rate quoted for the MFS Institutional Money Market Portfolio is the annualized seven-day yield of the fund at period end. |
| The following abbreviations are used in this report and are defined: | |
| REIT | Real Estate Investment Trust |
Table of Contents
| Assets | |
| Investments in unaffiliated issuers, at value, including $1,358,593 of securities on loan (identified cost, $257,553,918) | $354,013,506 |
| Investments in affiliated issuers, at value (identified cost, $5,215,555) | 5,215,555 |
| Receivables for | |
| Fund shares sold | 609,435 |
| Interest and dividends | 267,944 |
| Other assets | 735 |
| Total assets | $360,107,175 |
| Liabilities | |
| Payables for | |
| Investments purchased | $349,140 |
| Fund shares reacquired | 486,011 |
| Collateral for securities loaned, at value (c) | 1,165,932 |
| Payable to affiliates | |
| Investment adviser | 21,768 |
| Administrative services fee | 788 |
| Shareholder servicing costs | 73,237 |
| Distribution and service fees | 5,516 |
| Program manager fees | 89 |
| Payable for independent Trustees' compensation | 17 |
| Accrued expenses and other liabilities | 84,720 |
| Total liabilities | $2,187,218 |
| Net assets | $357,919,957 |
| Net assets consist of | |
| Paid-in capital | $250,269,046 |
| Total distributable earnings (loss) | 107,650,911 |
| Net assets | $357,919,957 |
| Shares of beneficial interest outstanding | 20,302,919 |
| (c) | Non-cash collateral is not included. |
Table of Contents
| Net assets | Shares outstanding | Net asset value per share (a) | |
| Class A | $73,141,403 | 4,161,750 | $17.57 |
| Class B | 615,488 | 35,879 | 17.15 |
| Class C | 7,502,598 | 437,699 | 17.14 |
| Class I | 80,950,408 | 4,582,182 | 17.67 |
| Class R1 | 4,996,344 | 291,300 | 17.15 |
| Class R2 | 16,869,754 | 961,634 | 17.54 |
| Class R3 | 666,720 | 37,866 | 17.61 |
| Class R4 | 23,280,889 | 1,316,724 | 17.68 |
| Class R6 | 136,883,295 | 7,735,450 | 17.70 |
| Class 529A | 11,395,953 | 648,005 | 17.59 |
| Class 529B | 297,110 | 17,235 | 17.24 |
| Class 529C | 1,319,995 | 77,195 | 17.10 |
| (a) | Maximum offering price per share was equal to the net asset value per share for all share classes, except for Classes A and 529A, for which the maximum offering prices per share were $18.64 [100 / 94.25 x $17.57] and $18.66 [100 / 94.25 x $17.59], respectively. On sales of $50,000 or more, the maximum offering prices of Class A and Class 529A shares are reduced. A contingent deferred sales charge may be imposed on redemptions of Class A, Class B, Class C, Class 529B, and Class 529C shares. Redemption price per share was equal to the net asset value per share for Classes I, R1, R2, R3, R4, R6, and 529A. |
Table of Contents
| Net investment income (loss) | |
| Income | |
| Dividends | $3,666,272 |
| Other | 69,469 |
| Income on securities loaned | 41,132 |
| Dividends from affiliated issuers | 2,129 |
| Foreign taxes withheld | (1,457) |
| Total investment income | $3,777,545 |
| Expenses | |
| Management fee | $1,981,730 |
| Distribution and service fees | 361,104 |
| Shareholder servicing costs | 230,637 |
| Program manager fees | 5,216 |
| Administrative services fee | 50,068 |
| Independent Trustees' compensation | 7,728 |
| Custodian fee | 21,275 |
| Shareholder communications | 23,181 |
| Audit and tax fees | 58,666 |
| Legal fees | 2,197 |
| Miscellaneous | 154,818 |
| Total expenses | $2,896,620 |
| Reduction of expenses by investment adviser and distributor | (386,222) |
| Net expenses | $2,510,398 |
| Net investment income (loss) | $1,267,147 |
| Realized and unrealized gain (loss) | |
| Realized gain (loss) (identified cost basis) | |
| Unaffiliated issuers | $39,487,628 |
| Affiliated issuers | (158) |
| Net realized gain (loss) | $39,487,470 |
| Change in unrealized appreciation or depreciation | |
| Unaffiliated issuers | $95,961,919 |
| Net realized and unrealized gain (loss) | $135,449,389 |
| Change in net assets from operations | $136,716,536 |
Table of Contents
| Year ended | ||
| 5/31/21 | 5/31/20 | |
| Change in net assets | ||
| From operations | ||
| Net investment income (loss) | $1,267,147 | $1,554,819 |
| Net realized gain (loss) | 39,487,470 | (23,468,433) |
| Net unrealized gain (loss) | 95,961,919 | (3,474,916) |
| Change in net assets from operations | $136,716,536 | $(25,388,530) |
| Total distributions to shareholders | $(1,950,036) | $(4,783,135) |
| Change in net assets from fund share transactions | $(35,913,426) | $108,097,955 |
| Total change in net assets | $98,853,074 | $77,926,290 |
| Net assets | ||
| At beginning of period | 259,066,883 | 181,140,593 |
| At end of period | $357,919,957 | $259,066,883 |
Table of Contents
| Class A | Year ended | ||||
| 5/31/21 | 5/31/20 | 5/31/19 | 5/31/18 | 5/31/17 | |
| Net asset value, beginning of period | $11.33 | $12.77 | $13.83 | $11.91 | $10.36 |
| Income (loss) from investment operations | |||||
| Net investment income (loss) (d) | $0.04 | $0.06 | $0.06 | $0.05 | $0.05 |
| Net realized and unrealized gain (loss) | 6.26 | (1.28) | (0.44) | 2.32 | 1.57 |
| Total from investment operations | $6.30 | $(1.22) | $(0.38) | $2.37 | $1.62 |
| Less distributions declared to shareholders | |||||
| From net investment income | $(0.06) | $(0.05) | $(0.04) | $(0.06) | $(0.03) |
| From net realized gain | — | (0.17) | (0.64) | (0.39) | (0.04) |
| Total distributions declared to shareholders | $(0.06) | $(0.22) | $(0.68) | $(0.45) | $(0.07) |
| Net asset value, end of period (x) | $17.57 | $11.33 | $12.77 | $13.83 | $11.91 |
| Total return (%) (r)(s)(t)(x) | 55.75 | (9.87) | (2.28) | 20.15 | 15.63 |
| Ratios (%) (to average net assets) and Supplemental data: | |||||
| Expenses before expense reductions (f) | 1.12 | 1.16 | 1.22 | 1.28 | 1.88 |
| Expenses after expense reductions (f) | 0.99 | 0.99 | 0.99 | 0.99 | 0.96 |
| Net investment income (loss) | 0.26 | 0.48 | 0.41 | 0.41 | 0.45 |
| Portfolio turnover | 80 | 75 | 64 | 90 | 90 |
| Net assets at end of period (000 omitted) | $73,141 | $57,133 | $60,929 | $43,682 | $3,700 |
Table of Contents
| Class B | Year ended | ||||
| 5/31/21 | 5/31/20 | 5/31/19 | 5/31/18 | 5/31/17 | |
| Net asset value, beginning of period | $11.10 | $12.56 | $13.67 | $11.81 | $10.33 |
| Income (loss) from investment operations | |||||
| Net investment income (loss) (d) | $(0.07) | $(0.03) | $(0.05) | $(0.05) | $(0.04) |
| Net realized and unrealized gain (loss) | 6.12 | (1.26) | (0.42) | 2.30 | 1.56 |
| Total from investment operations | $6.05 | $(1.29) | $(0.47) | $2.25 | $1.52 |
| Less distributions declared to shareholders | |||||
| From net investment income | $— | $— | $— | $— | $— |
| From net realized gain | — | (0.17) | (0.64) | (0.39) | (0.04) |
| Total distributions declared to shareholders | $— | $(0.17) | $(0.64) | $(0.39) | $(0.04) |
| Net asset value, end of period (x) | $17.15 | $11.10 | $12.56 | $13.67 | $11.81 |
| Total return (%) (r)(s)(t)(x) | 54.50 | (10.53) | (3.00) | 19.28 | 14.73 |
| Ratios (%) (to average net assets) and Supplemental data: | |||||
| Expenses before expense reductions (f) | 1.86 | 1.91 | 1.97 | 2.07 | 3.04 |
| Expenses after expense reductions (f) | 1.74 | 1.74 | 1.74 | 1.74 | 1.74 |
| Net investment income (loss) | (0.52) | (0.27) | (0.36) | (0.39) | (0.34) |
| Portfolio turnover | 80 | 75 | 64 | 90 | 90 |
| Net assets at end of period (000 omitted) | $615 | $387 | $500 | $403 | $243 |
Table of Contents
| Class C | Year ended | ||||
| 5/31/21 | 5/31/20 | 5/31/19 | 5/31/18 | 5/31/17 | |
| Net asset value, beginning of period | $11.09 | $12.55 | $13.66 | $11.80 | $10.33 |
| Income (loss) from investment operations | |||||
| Net investment income (loss) (d) | $(0.07) | $(0.03) | $(0.03) | $(0.05) | $(0.03) |
| Net realized and unrealized gain (loss) | 6.12 | (1.26) | (0.44) | 2.30 | 1.54 |
| Total from investment operations | $6.05 | $(1.29) | $(0.47) | $2.25 | $1.51 |
| Less distributions declared to shareholders | |||||
| From net investment income | $— | $(0.00)(w) | $(0.00)(w) | $— | $— |
| From net realized gain | — | (0.17) | (0.64) | (0.39) | (0.04) |
| Total distributions declared to shareholders | $— | $(0.17) | $(0.64) | $(0.39) | $(0.04) |
| Net asset value, end of period (x) | $17.14 | $11.09 | $12.55 | $13.66 | $11.80 |
| Total return (%) (r)(s)(t)(x) | 54.55 | (10.53) | (2.97) | 19.30 | 14.64 |
| Ratios (%) (to average net assets) and Supplemental data: | |||||
| Expenses before expense reductions (f) | 1.87 | 1.91 | 1.97 | 2.07 | 2.87 |
| Expenses after expense reductions (f) | 1.74 | 1.74 | 1.74 | 1.74 | 1.74 |
| Net investment income (loss) | (0.50) | (0.26) | (0.21) | (0.40) | (0.28) |
| Portfolio turnover | 80 | 75 | 64 | 90 | 90 |
| Net assets at end of period (000 omitted) | $7,503 | $5,133 | $3,234 | $406 | $408 |
Table of Contents
| Class I | Year ended | ||||
| 5/31/21 | 5/31/20 | 5/31/19 | 5/31/18 | 5/31/17 | |
| Net asset value, beginning of period | $11.39 | $12.83 | $13.90 | $11.94 | $10.38 |
| Income (loss) from investment operations | |||||
| Net investment income (loss) (d) | $0.07 | $0.09 | $0.09 | $0.08 | $0.08 |
| Net realized and unrealized gain (loss) | 6.31 | (1.27) | (0.45) | 2.33 | 1.55 |
| Total from investment operations | $6.38 | $(1.18) | $(0.36) | $2.41 | $1.63 |
| Less distributions declared to shareholders | |||||
| From net investment income | $(0.10) | $(0.09) | $(0.07) | $(0.06) | $(0.03) |
| From net realized gain | — | (0.17) | (0.64) | (0.39) | (0.04) |
| Total distributions declared to shareholders | $(0.10) | $(0.26) | $(0.71) | $(0.45) | $(0.07) |
| Net asset value, end of period (x) | $17.67 | $11.39 | $12.83 | $13.90 | $11.94 |
| Total return (%) (r)(s)(t)(x) | 56.17 | (9.58) | (2.06) | 20.49 | 15.77 |
| Ratios (%) (to average net assets) and Supplemental data: | |||||
| Expenses before expense reductions (f) | 0.87 | 0.91 | 0.97 | 1.05 | 2.02 |
| Expenses after expense reductions (f) | 0.74 | 0.74 | 0.74 | 0.74 | 0.74 |
| Net investment income (loss) | 0.46 | 0.74 | 0.69 | 0.64 | 0.68 |
| Portfolio turnover | 80 | 75 | 64 | 90 | 90 |
| Net assets at end of period (000 omitted) | $80,950 | $53,562 | $39,397 | $12,225 | $752 |
Table of Contents
| Class R1 | Year ended | ||||
| 5/31/21 | 5/31/20 | 5/31/19 | 5/31/18 | 5/31/17 | |
| Net asset value, beginning of period | $11.09 | $12.56 | $13.67 | $11.81 | $10.33 |
| Income (loss) from investment operations | |||||
| Net investment income (loss) (d) | $(0.07) | $(0.03) | $0.07 | $(0.05) | $(0.04) |
| Net realized and unrealized gain (loss) | 6.13 | (1.27) | (0.54)(g) | 2.30 | 1.56 |
| Total from investment operations | $6.06 | $(1.30) | $(0.47) | $2.25 | $1.52 |
| Less distributions declared to shareholders | |||||
| From net investment income | $— | $(0.00)(w) | $— | $— | $— |
| From net realized gain | — | (0.17) | (0.64) | (0.39) | (0.04) |
| Total distributions declared to shareholders | $— | $(0.17) | $(0.64) | $(0.39) | $(0.04) |
| Net asset value, end of period (x) | $17.15 | $11.09 | $12.56 | $13.67 | $11.81 |
| Total return (%) (r)(s)(t)(x) | 54.64 | (10.59) | (3.00) | 19.28 | 14.73 |
| Ratios (%) (to average net assets) and Supplemental data: | |||||
| Expenses before expense reductions (f) | 1.86 | 1.91 | 1.97 | 2.07 | 3.32 |
| Expenses after expense reductions (f) | 1.74 | 1.74 | 1.74 | 1.74 | 1.74 |
| Net investment income (loss) | (0.52) | (0.27) | 0.54 | (0.39) | (0.35) |
| Portfolio turnover | 80 | 75 | 64 | 90 | 90 |
| Net assets at end of period (000 omitted) | $4,996 | $2,897 | $3,339 | $79 | $63 |
Table of Contents
| Class R2 | Year ended | ||||
| 5/31/21 | 5/31/20 | 5/31/19 | 5/31/18 | 5/31/17 | |
| Net asset value, beginning of period | $11.32 | $12.78 | $13.84 | $11.89 | $10.35 |
| Income (loss) from investment operations | |||||
| Net investment income (loss) (d) | $(0.00)(w) | $0.03 | $0.16 | $0.01 | $0.02 |
| Net realized and unrealized gain (loss) | 6.26 | (1.27) | (0.58)(g) | 2.33 | 1.56 |
| Total from investment operations | $6.26 | $(1.24) | $(0.42) | $2.34 | $1.58 |
| Less distributions declared to shareholders | |||||
| From net investment income | $(0.04) | $(0.05) | $(0.00)(w) | $— | $— |
| From net realized gain | — | (0.17) | (0.64) | (0.39) | (0.04) |
| Total distributions declared to shareholders | $(0.04) | $(0.22) | $(0.64) | $(0.39) | $(0.04) |
| Net asset value, end of period (x) | $17.54 | $11.32 | $12.78 | $13.84 | $11.89 |
| Total return (%) (r)(s)(t)(x) | 55.37 | (10.07) | (2.57) | 19.91 | 15.29 |
| Ratios (%) (to average net assets) and Supplemental data: | |||||
| Expenses before expense reductions (f) | 1.36 | 1.41 | 1.47 | 1.57 | 2.84 |
| Expenses after expense reductions (f) | 1.24 | 1.24 | 1.24 | 1.24 | 1.24 |
| Net investment income (loss) | (0.03) | 0.23 | 1.22 | 0.11 | 0.15 |
| Portfolio turnover | 80 | 75 | 64 | 90 | 90 |
| Net assets at end of period (000 omitted) | $16,870 | $9,315 | $9,647 | $72 | $60 |
Table of Contents
| Class R3 | Year ended | ||||
| 5/31/21 | 5/31/20 | 5/31/19 | 5/31/18 | 5/31/17 | |
| Net asset value, beginning of period | $11.35 | $12.83 | $13.88 | $11.92 | $10.36 |
| Income (loss) from investment operations | |||||
| Net investment income (loss) (d) | $0.03 | $0.06 | $0.05 | $0.05 | $0.05 |
| Net realized and unrealized gain (loss) | 6.29 | (1.28) | (0.42) | 2.33 | 1.56 |
| Total from investment operations | $6.32 | $(1.22) | $(0.37) | $2.38 | $1.61 |
| Less distributions declared to shareholders | |||||
| From net investment income | $(0.06) | $(0.09) | $(0.04) | $(0.03) | $(0.01) |
| From net realized gain | — | (0.17) | (0.64) | (0.39) | (0.04) |
| Total distributions declared to shareholders | $(0.06) | $(0.26) | $(0.68) | $(0.42) | $(0.05) |
| Net asset value, end of period (x) | $17.61 | $11.35 | $12.83 | $13.88 | $11.92 |
| Total return (%) (r)(s)(t)(x) | 55.83 | (9.92) | (2.23) | 20.21 | 15.54 |
| Ratios (%) (to average net assets) and Supplemental data: | |||||
| Expenses before expense reductions (f) | 1.12 | 1.16 | 1.21 | 1.32 | 2.59 |
| Expenses after expense reductions (f) | 0.99 | 0.99 | 0.99 | 0.99 | 0.99 |
| Net investment income (loss) | 0.23 | 0.52 | 0.38 | 0.36 | 0.40 |
| Portfolio turnover | 80 | 75 | 64 | 90 | 90 |
| Net assets at end of period (000 omitted) | $667 | $537 | $70 | $72 | $60 |
Table of Contents
| Class R4 | Year ended | ||||
| 5/31/21 | 5/31/20 | 5/31/19 | 5/31/18 | 5/31/17 | |
| Net asset value, beginning of period | $11.40 | $12.84 | $13.91 | $11.94 | $10.37 |
| Income (loss) from investment operations | |||||
| Net investment income (loss) (d) | $0.07 | $0.10 | $0.09 | $0.08 | $0.07 |
| Net realized and unrealized gain (loss) | 6.30 | (1.28) | (0.45) | 2.34 | 1.57 |
| Total from investment operations | $6.37 | $(1.18) | $(0.36) | $2.42 | $1.64 |
| Less distributions declared to shareholders | |||||
| From net investment income | $(0.09) | $(0.09) | $(0.07) | $(0.06) | $(0.03) |
| From net realized gain | — | (0.17) | (0.64) | (0.39) | (0.04) |
| Total distributions declared to shareholders | $(0.09) | $(0.26) | $(0.71) | $(0.45) | $(0.07) |
| Net asset value, end of period (x) | $17.68 | $11.40 | $12.84 | $13.91 | $11.94 |
| Total return (%) (r)(s)(t)(x) | 56.09 | (9.60) | (2.09) | 20.54 | 15.87 |
| Ratios (%) (to average net assets) and Supplemental data: | |||||
| Expenses before expense reductions (f) | 0.87 | 0.95 | 0.96 | 1.07 | 2.34 |
| Expenses after expense reductions (f) | 0.74 | 0.74 | 0.74 | 0.74 | 0.74 |
| Net investment income (loss) | 0.53 | 0.96 | 0.63 | 0.61 | 0.65 |
| Portfolio turnover | 80 | 75 | 64 | 90 | 90 |
| Net assets at end of period (000 omitted) | $23,281 | $19,044 | $71 | $73 | $60 |
Table of Contents
| Class R6 | Year ended | ||||
| 5/31/21 | 5/31/20 | 5/31/19 | 5/31/18 | 5/31/17 | |
| Net asset value, beginning of period | $11.40 | $12.85 | $13.91 | $11.94 | $10.37 |
| Income (loss) from investment operations | |||||
| Net investment income (loss) (d) | $0.09 | $0.10 | $0.10 | $0.09 | $0.08 |
| Net realized and unrealized gain (loss) | 6.32 | (1.28) | (0.44) | 2.34 | 1.57 |
| Total from investment operations | $6.41 | $(1.18) | $(0.34) | $2.43 | $1.65 |
| Less distributions declared to shareholders | |||||
| From net investment income | $(0.11) | $(0.10) | $(0.08) | $(0.07) | $(0.04) |
| From net realized gain | — | (0.17) | (0.64) | (0.39) | (0.04) |
| Total distributions declared to shareholders | $(0.11) | $(0.27) | $(0.72) | $(0.46) | $(0.08) |
| Net asset value, end of period (x) | $17.70 | $11.40 | $12.85 | $13.91 | $11.94 |
| Total return (%) (r)(s)(t)(x) | 56.40 | (9.59) | (1.93) | 20.62 | 15.90 |
| Ratios (%) (to average net assets) and Supplemental data: | |||||
| Expenses before expense reductions (f) | 0.77 | 0.82 | 0.88 | 0.99 | 1.22 |
| Expenses after expense reductions (f) | 0.65 | 0.65 | 0.66 | 0.65 | 0.69 |
| Net investment income (loss) | 0.60 | 0.83 | 0.72 | 0.71 | 0.73 |
| Portfolio turnover | 80 | 75 | 64 | 90 | 90 |
| Net assets at end of period (000 omitted) | $136,883 | $102,332 | $53,947 | $49,503 | $46,259 |
Table of Contents
| Class 529A | Year ended | ||||
| 5/31/21 | 5/31/20 | 5/31/19 | 5/31/18 | 5/31/17(i) | |
| Net asset value, beginning of period | $11.34 | $12.78 | $13.85 | $11.90 | $10.74 |
| Income (loss) from investment operations | |||||
| Net investment income (loss) (d) | $0.03 | $0.06 | $0.05 | $0.02 | $0.04 |
| Net realized and unrealized gain (loss) | 6.28 | (1.28) | (0.44) | 2.35 | 1.19 |
| Total from investment operations | $6.31 | $(1.22) | $(0.39) | $2.37 | $1.23 |
| Less distributions declared to shareholders | |||||
| From net investment income | $(0.06) | $(0.05) | $(0.04) | $(0.03) | $(0.03) |
| From net realized gain | — | (0.17) | (0.64) | (0.39) | (0.04) |
| Total distributions declared to shareholders | $(0.06) | $(0.22) | $(0.68) | $(0.42) | $(0.07) |
| Net asset value, end of period (x) | $17.59 | $11.34 | $12.78 | $13.85 | $11.90 |
| Total return (%) (r)(s)(t)(x) | 55.75 | (9.88) | (2.34) | 20.13 | 11.47(n) |
| Ratios (%) (to average net assets) and Supplemental data: | |||||
| Expenses before expense reductions (f) | 1.16 | 1.21 | 1.27 | 1.34 | 1.77(a) |
| Expenses after expense reductions (f) | 1.02 | 1.02 | 1.02 | 1.03 | 1.04(a) |
| Net investment income (loss) | 0.20 | 0.45 | 0.35 | 0.17 | 0.36(a) |
| Portfolio turnover | 80 | 75 | 64 | 90 | 90 |
| Net assets at end of period (000 omitted) | $11,396 | $7,188 | $8,049 | $8,175 | $287 |
Table of Contents
| Class 529B | Year ended | ||||
| 5/31/21 | 5/31/20 | 5/31/19 | 5/31/18 | 5/31/17(i) | |
| Net asset value, beginning of period | $11.11 | $12.54 | $13.66 | $11.80 | $10.70 |
| Income (loss) from investment operations | |||||
| Net investment income (loss) (d) | $0.03 | $(0.02) | $(0.06) | $(0.07) | $(0.04) |
| Net realized and unrealized gain (loss) | 6.14 | (1.24) | (0.42) | 2.32 | 1.18 |
| Total from investment operations | $6.17 | $(1.26) | $(0.48) | $2.25 | $1.14 |
| Less distributions declared to shareholders | |||||
| From net investment income | $(0.04) | $— | $— | $— | $— |
| From net realized gain | — | (0.17) | (0.64) | (0.39) | (0.04) |
| Total distributions declared to shareholders | $(0.04) | $(0.17) | $(0.64) | $(0.39) | $(0.04) |
| Net asset value, end of period (x) | $17.24 | $11.11 | $12.54 | $13.66 | $11.80 |
| Total return (%) (r)(s)(t)(x) | 55.66 | (10.31) | (3.08) | 19.30 | 10.67(n) |
| Ratios (%) (to average net assets) and Supplemental data: | |||||
| Expenses before expense reductions (f) | 1.17 | 1.76 | 2.01 | 2.10 | 2.91(a) |
| Expenses after expense reductions (f) | 1.04 | 1.59 | 1.79 | 1.79 | 1.79(a) |
| Net investment income (loss) | 0.22 | (0.12) | (0.43) | (0.54) | (0.42)(a) |
| Portfolio turnover | 80 | 75 | 64 | 90 | 90 |
| Net assets at end of period (000 omitted) | $297 | $261 | $369 | $459 | $55 |
Table of Contents
| Class 529C | Year ended | ||||
| 5/31/21 | 5/31/20 | 5/31/19 | 5/31/18 | 5/31/17(i) | |
| Net asset value, beginning of period | $11.07 | $12.53 | $13.65 | $11.79 | $10.69 |
| Income (loss) from investment operations | |||||
| Net investment income (loss) (d) | $(0.07) | $(0.04) | $(0.06) | $(0.08) | $(0.04) |
| Net realized and unrealized gain (loss) | 6.10 | (1.25) | (0.42) | 2.33 | 1.18 |
| Total from investment operations | $6.03 | $(1.29) | $(0.48) | $2.25 | $1.14 |
| Less distributions declared to shareholders | |||||
| From net investment income | $— | $— | $— | $— | $— |
| From net realized gain | — | (0.17) | (0.64) | (0.39) | (0.04) |
| Total distributions declared to shareholders | $— | $(0.17) | $(0.64) | $(0.39) | $(0.04) |
| Net asset value, end of period (x) | $17.10 | $11.07 | $12.53 | $13.65 | $11.79 |
| Total return (%) (r)(s)(t)(x) | 54.47 | (10.56) | (3.08) | 19.31 | 10.68(n) |
| Ratios (%) (to average net assets) and Supplemental data: | |||||
| Expenses before expense reductions (f) | 1.92 | 1.96 | 2.02 | 2.08 | 2.84(a) |
| Expenses after expense reductions (f) | 1.79 | 1.79 | 1.79 | 1.79 | 1.79(a) |
| Net investment income (loss) | (0.51) | (0.32) | (0.43) | (0.61) | (0.39)(a) |
| Portfolio turnover | 80 | 75 | 64 | 90 | 90 |
| Net assets at end of period (000 omitted) | $1,320 | $1,278 | $1,588 | $1,721 | $78 |
| (a) | Annualized. |
| (d) | Per share data is based on average shares outstanding. |
| (f) | Ratios do not reflect reductions from fees paid indirectly, if applicable. |
| (g) | The per share amount varies from the net realized and unrealized gain/loss for the period because of the timing of sales of fund shares and the per share amount of realized and unrealized gains and losses at such time. |
| (i) | For Class 529A, Class 529B, and Class 529C, the period is from the class inception, July 14, 2016, through the stated period end. |
| (n) | Not annualized. |
| (r) | Certain expenses have been reduced without which performance would have been lower. |
| (s) | From time to time the fund may receive proceeds from litigation settlements, without which performance would be lower. |
| (t) | Total returns do not include any applicable sales charges. |
| (w) | Per share amount was less than $0.01. |
| (x) | The net asset values and total returns have been calculated on net assets which include adjustments made in accordance with U.S. generally accepted accounting principles required at period end for financial reporting purposes. |
Table of Contents
Table of Contents
Table of Contents
| Financial Instruments | Level 1 | Level 2 | Level 3 | Total |
| Equity Securities | $352,847,574 | $— | $— | $352,847,574 |
| Mutual Funds | 6,381,487 | — | — | 6,381,487 |
| Total | $359,229,061 | $— | $— | $359,229,061 |
Table of Contents
Table of Contents
| Year ended 5/31/21 | Year ended 5/31/20 | |
| Ordinary income (including any short-term capital gains) | $1,950,036 | $3,362,096 |
| Long-term capital gains | — | 1,421,039 |
| Total distributions | $1,950,036 | $4,783,135 |
| As of 5/31/21 | |
| Cost of investments | $267,423,941 |
| Gross appreciation | 97,831,122 |
| Gross depreciation | (6,026,002) |
| Net unrealized appreciation (depreciation) | $ 91,805,120 |
| Undistributed ordinary income | 6,726,643 |
| Undistributed long-term capital gain | 9,382,402 |
| Late year ordinary loss deferral | (263,254) |
| Total distributable earnings (loss) | $107,650,911 |
| Year ended 5/31/21 | Year ended 5/31/20 | ||
| Class A | $281,690 | $994,396 | |
| Class B | — | 6,379 | |
| Class C | — | 68,104 | |
| Class I | 538,727 | 1,366,399 | |
| Class R1 | — | 47,825 | |
| Class R2 | 35,392 | 165,195 | |
| Class R3 | 2,852 | 11,984 | |
| Class R4 | 126,083 | 1,532 | |
| Class R6 | 929,489 | 1,960,249 | |
| Class 529A | 34,882 | 135,468 | |
| Class 529B | 921 | 4,658 | |
| Class 529C | — | 20,946 | |
| Total | $1,950,036 | $4,783,135 |
Table of Contents
| Up to $1 billion | 0.65% |
| In excess of $1 billion and up to $2.5 billion | 0.60% |
| In excess of $2.5 billion | 0.575% |
| Classes | |||||||||||
| A | B | C | I | R1 | R2 | R3 | R4 | R6 | 529A | 529B | 529C |
| 0.99% | 1.74% | 1.74% | 0.74% | 1.74% | 1.24% | 0.99% | 0.74% | 0.70% | 1.04% | 1.79% | 1.79% |
Table of Contents
| Distribution Fee Rate (d) | Service Fee Rate (d) | Total Distribution Plan (d) | Annual Effective Rate (e) | Distribution and Service Fee | |
| Class A | — | 0.25% | 0.25% | 0.25% | $ 155,705 |
| Class B | 0.75% | 0.25% | 1.00% | 1.00% | 4,548 |
| Class C | 0.75% | 0.25% | 1.00% | 1.00% | 61,290 |
| Class R1 | 0.75% | 0.25% | 1.00% | 1.00% | 38,952 |
| Class R2 | 0.25% | 0.25% | 0.50% | 0.50% | 63,100 |
| Class R3 | — | 0.25% | 0.25% | 0.25% | 1,669 |
| Class 529A | — | 0.25% | 0.25% | 0.22% | 22,140 |
| Class 529B | 0.75% | 0.25% | 1.00% | 0.25% | 694 |
| Class 529C | 0.75% | 0.25% | 1.00% | 1.00% | 13,006 |
| Total Distribution and Service Fees | $361,104 |
| (d) | In accordance with the distribution plan for certain classes, the fund pays distribution and/or service fees equal to these annual percentage rates of each class’s average daily net assets. The distribution and service fee rates disclosed by class represent the current rates in effect at the end of the reporting period. Any rate changes, if applicable, are detailed below. |
| (e) | The annual effective rates represent actual fees incurred under the distribution plan for the year ended May 31, 2021 based on each class's average daily net assets. MFD has voluntarily agreed to rebate a portion of each class's 0.25% service fee attributable to accounts for which there is no financial intermediary specified on the account except for accounts attributable to MFS or its affiliates' seed money. For the year ended May 31, 2021, this rebate amounted to $34, $17, $2,231, and $10 for Class A, Class B, Class 529A, and Class 529C, respectively, and is included in the reduction of total expenses in the Statement of Operations. |
| Amount | |
| Class A | $473 |
| Class B | 608 |
| Class C | 972 |
| Class 529B | — |
| Class 529C | 36 |
Table of Contents
| Fee | |
| Class 529A | $4,428 |
| Class 529B | 139 |
| Class 529C | 649 |
| Total Program Manager Fees | $5,216 |
Table of Contents
| Year ended 5/31/21 | Year ended 5/31/20 | ||||
| Shares | Amount | Shares | Amount | ||
| Shares sold | |||||
| Class A | 1,342,830 | $19,548,164 | 2,947,246 | $35,152,616 | |
| Class B | 8,948 | 144,089 | 2,217 | 28,276 | |
| Class C | 152,971 | 2,115,401 | 288,444 | 3,498,617 | |
| Class I | 2,871,267 | 41,326,762 | 4,824,238 | 58,982,956 | |
| Class R1 | 94,078 | 1,255,898 | 81,580 | 1,034,944 | |
| Class R2 | 398,449 | 5,382,155 | 328,867 | 4,228,600 | |
| Class R3 | 8,625 | 126,678 | 44,525 | 601,618 | |
| Class R4 | 233,355 | 3,608,175 | 2,145,894 | 28,234,586 | |
| Class R6 | 2,363,787 | 30,749,204 | 6,042,226 | 74,362,922 | |
| Class 529A | 128,389 | 1,903,742 | 73,562 | 888,156 | |
| Class 529B | 121 | 1,418 | — | — | |
| Class 529C | 11,439 | 147,696 | 14,951 | 185,177 | |
| 7,614,259 | $106,309,382 | 16,793,750 | $207,198,468 | ||
| Shares issued to shareholders in reinvestment of distributions | |||||
| Class A | 6,883 | $99,523 | 29,221 | $412,313 | |
| Class B | — | — | 460 | 6,379 | |
| Class C | — | — | 4,917 | 68,104 | |
| Class I | 37,095 | 538,621 | 96,409 | 1,366,111 | |
| Class R1 | — | — | 3,451 | 47,825 | |
| Class R2 | 2,449 | 35,392 | 11,708 | 165,195 | |
| Class R3 | 197 | 2,852 | 848 | 11,984 | |
| Class R4 | 8,677 | 126,083 | 108 | 1,532 | |
| Class R6 | 63,842 | 928,265 | 137,656 | 1,951,962 | |
| Class 529A | 2,399 | 34,720 | 9,595 | 135,468 | |
| Class 529B | 65 | 921 | 323 | 4,476 | |
| Class 529C | — | — | 1,513 | 20,946 | |
| 121,607 | $1,766,377 | 296,209 | $4,192,295 | ||
Table of Contents
| Year ended 5/31/21 | Year ended 5/31/20 | ||||
| Shares | Amount | Shares | Amount | ||
| Shares reacquired | |||||
| Class A | (2,229,873) | $(30,946,092) | (2,705,401) | $(34,562,796) | |
| Class B | (7,956) | (107,610) | (7,625) | (85,235) | |
| Class C | (178,187) | (2,440,120) | (88,189) | (1,038,234) | |
| Class I | (3,029,703) | (44,006,528) | (3,286,638) | (39,224,188) | |
| Class R1 | (63,920) | (879,182) | (89,781) | (1,112,560) | |
| Class R2 | (262,117) | (3,503,670) | (272,281) | (3,464,069) | |
| Class R3 | (18,265) | (297,969) | (3,560) | (50,247) | |
| Class R4 | (596,473) | (8,606,409) | (480,377) | (4,923,233) | |
| Class R6 | (3,665,758) | (50,853,322) | (1,404,880) | (17,428,205) | |
| Class 529A | (116,676) | (1,580,828) | (79,114) | (995,061) | |
| Class 529B | (6,471) | (90,447) | (6,230) | (80,280) | |
| Class 529C | (49,697) | (677,008) | (27,715) | (328,700) | |
| (10,225,096) | $(143,989,185) | (8,451,791) | $(103,292,808) | ||
| Net change | |||||
| Class A | (880,160) | $(11,298,405) | 271,066 | $1,002,133 | |
| Class B | 992 | 36,479 | (4,948) | (50,580) | |
| Class C | (25,216) | (324,719) | 205,172 | 2,528,487 | |
| Class I | (121,341) | (2,141,145) | 1,634,009 | 21,124,879 | |
| Class R1 | 30,158 | 376,716 | (4,750) | (29,791) | |
| Class R2 | 138,781 | 1,913,877 | 68,294 | 929,726 | |
| Class R3 | (9,443) | (168,439) | 41,813 | 563,355 | |
| Class R4 | (354,441) | (4,872,151) | 1,665,625 | 23,312,885 | |
| Class R6 | (1,238,129) | (19,175,853) | 4,775,002 | 58,886,679 | |
| Class 529A | 14,112 | 357,634 | 4,043 | 28,563 | |
| Class 529B | (6,285) | (88,108) | (5,907) | (75,804) | |
| Class 529C | (38,258) | (529,312) | (11,251) | (122,577) | |
| (2,489,230) | $(35,913,426) | 8,638,168 | $108,097,955 | ||
Table of Contents
| Affiliated Issuers | Beginning Value | Purchases | Sales Proceeds | Realized Gain (Loss) | Change in Unrealized Appreciation or Depreciation | Ending Value |
| MFS Institutional Money Market Portfolio | $2,526,382 | $64,647,169 | $61,957,838 | $(158) | $— | $5,215,555 |
| Affiliated Issuers | Dividend Income | Capital Gain Distributions |
| MFS Institutional Money Market Portfolio | $2,129 | $— |
Table of Contents
Table of Contents
July 16, 2021
Table of Contents
| Name, Age | Position(s) Held with Fund | Trustee/Officer Since(h) | Number of MFS Funds overseen by the Trustee | Principal Occupations During the Past Five Years | Other Directorships During the Past Five Years (j) | |||||
| INTERESTED TRUSTEES | ||||||||||
| Robert J. Manning (k) (age 57) | Trustee | February 2004 | 135 | Massachusetts Financial Services Company, Non-Executive Chairman (since January 2021); Director; Chairman of the Board; Executive Chairman (January 2017-2020); Co-Chief Executive Officer (2015-2016) | N/A | |||||
| Michael W. Roberge (k) (age 54) | Trustee | January 2021 | 135 | Massachusetts Financial Services Company, Chairman (since January 2021); Chief Executive Officer (since January 2017); Director; President (until December 2018); Chief Investment Officer (until December 2018); Co-Chief Executive Officer (until December 2016) | N/A | |||||
| INDEPENDENT TRUSTEES | ||||||||||
| John P. Kavanaugh (age 66) | Trustee and Chair of Trustees | January 2009 | 135 | Private investor | N/A | |||||
| Steven E. Buller (age 69) | Trustee | February 2014 | 135 | Private investor | N/A | |||||
| John A. Caroselli (age 67) | Trustee | March 2017 | 135 | Private investor; JC Global Advisors, LLC (management consulting), President (since 2015) | N/A | |||||
| Maureen R. Goldfarb (age 66) | Trustee | January 2009 | 135 | Private investor | N/A | |||||
| Peter D. Jones (age 65) | Trustee | January 2019 | 135 | Private investor | N/A | |||||
Table of Contents
| Name, Age | Position(s) Held with Fund | Trustee/Officer Since(h) | Number of MFS Funds overseen by the Trustee | Principal Occupations During the Past Five Years | Other Directorships During the Past Five Years (j) | |||||
| James W. Kilman, Jr. (age 60) | Trustee | January 2019 | 135 | Burford Capital Limited (finance and investment management), Senior Advisor (since May 3, 2021), Chief Financial Officer (2019 - May 2, 2021); KielStrand Capital LLC (family office), Chief Executive Officer (since 2016); Morgan Stanley & Co. (financial services), Vice Chairman of Investment Banking, Co-Head of Diversified Financials Coverage – Financial Institutions Investment Banking Group (until 2016) | Alpha-En Corporation, Director (2016-2019) | |||||
| Clarence Otis, Jr. (age 65) | Trustee | March 2017 | 135 | Private investor | VF Corporation, Director; Verizon Communications, Inc., Director; The Travelers Companies, Director | |||||
| Maryanne L. Roepke (age 65) | Trustee | May 2014 | 135 | Private investor | N/A | |||||
| Laurie J. Thomsen (age 63) | Trustee | March 2005 | 135 | Private investor | The Travelers Companies, Director; Dycom Industries, Inc., Director |
| Name, Age | Position(s) Held with Fund | Trustee/Officer Since(h) | Number of MFS Funds for which the Person is an Officer | Principal Occupations During the Past Five Years | ||||
| OFFICERS | ||||||||
| Christopher R. Bohane (k) (age 47) | Assistant Secretary and Assistant Clerk | July 2005 | 135 | Massachusetts Financial Services Company, Senior Vice President and Associate General Counsel | ||||
| Kino Clark (k) (age 53) | Assistant Treasurer | January 2012 | 135 | Massachusetts Financial Services Company, Vice President |
Table of Contents
| Name, Age | Position(s) Held with Fund | Trustee/Officer Since(h) | Number of MFS Funds for which the Person is an Officer | Principal Occupations During the Past Five Years | ||||
| John W. Clark, Jr. (k) (age 54) | Assistant Treasurer | April 2017 | 135 | Massachusetts Financial Services Company, Vice President (since March 2017); Deutsche Bank (financial services), Department Head - Treasurer's Office (until February 2017) | ||||
| Thomas H. Connors (k) (age 61) | Assistant Secretary and Assistant Clerk | September 2012 | 135 | Massachusetts Financial Services Company, Vice President and Senior Counsel | ||||
| David L. DiLorenzo (k) (age 52) | President | July 2005 | 135 | Massachusetts Financial Services Company, Senior Vice President | ||||
| Heidi W. Hardin (k) (age 53) | Secretary and Clerk | April 2017 | 135 | Massachusetts Financial Services Company, Executive Vice President and General Counsel (since March 2017); Harris Associates (investment management), General Counsel (until January 2017) | ||||
| Brian E. Langenfeld (k) (age 48) | Assistant Secretary and Assistant Clerk | June 2006 | 135 | Massachusetts Financial Services Company, Vice President and Senior Counsel | ||||
| Amanda S. Mooradian (k) (age 42) | Assistant Secretary and Assistant Clerk | September 2018 | 135 | Massachusetts Financial Services Company, Assistant Vice President and Senior Counsel | ||||
| Susan A. Pereira (k) (age 50) | Assistant Secretary and Assistant Clerk | July 2005 | 135 | Massachusetts Financial Services Company, Vice President and Assistant General Counsel | ||||
| Kasey L. Phillips (k) (age 50) | Assistant Treasurer | September 2012 | 135 | Massachusetts Financial Services Company, Vice President | ||||
| Matthew A. Stowe (k) (age 46) | Assistant Secretary and Assistant Clerk | October 2014 | 135 | Massachusetts Financial Services Company, Vice President and Assistant General Counsel | ||||
| Martin J. Wolin (k) (age 53) | Chief Compliance Officer | July 2015 | 135 | Massachusetts Financial Services Company, Senior Vice President and Chief Compliance Officer |
Table of Contents
| Name, Age | Position(s) Held with Fund | Trustee/Officer Since(h) | Number of MFS Funds for which the Person is an Officer | Principal Occupations During the Past Five Years | ||||
| James O. Yost (k) (age 61) | Treasurer | September 1990 | 135 | Massachusetts Financial Services Company, Senior Vice President |
| (h) | Date first appointed to serve as Trustee/Officer of an MFS Fund. Each Trustee has served continuously since appointment unless indicated otherwise. For the period from December 15, 2004 until February 22, 2005, Mr. Manning served as Advisory Trustee. From January 2012 through December 2016, Messrs. DiLorenzo and Yost served as Treasurer and Deputy Treasurer of the Funds, respectively. |
| (j) | Directorships or trusteeships of companies required to report to the Securities and Exchange Commission (i.e., “public companies”). |
| (k) | “Interested person” of the Trust within the meaning of the Investment Company Act of 1940 (referred to as the 1940 Act), which is the principal federal law governing investment companies like the fund, as a result of a position with MFS. The address of MFS is 111 Huntington Avenue, Boston, Massachusetts 02199-7618. |
Table of Contents
| Investment Adviser | Custodian |
| Massachusetts Financial Services Company 111 Huntington Avenue Boston, MA 02199-7618 | State Street Bank and Trust Company 1 Lincoln Street Boston, MA 02111-2900 |
| Distributor | Independent Registered Public Accounting Firm |
| MFS Fund Distributors, Inc. 111 Huntington Avenue Boston, MA 02199-7618 | Deloitte & Touche LLP 200 Berkeley Street Boston, MA 02116 |
| Portfolio Manager(s) | |
| Jim Fallon Matt Krummell Jonathan Sage Jed Stocks |
Table of Contents
Table of Contents
Table of Contents
Table of Contents
| FACTS | WHAT DOES MFS DO WITH YOUR PERSONAL INFORMATION? |
| Why? | Financial companies choose how they share your personal information. Federal law gives consumers the right to limit some but not all sharing. Federal law also requires us to tell you how we collect, share, and protect your personal information. Please read this notice carefully to understand what we do. |
| What? | The types of personal information we collect and share depend on the product or service you have with us. This information can include: |
| • Social Security number and account balances | |
| • Account transactions and transaction history | |
| • Checking account information and wire transfer instructions | |
| When you are no longer our customer, we continue to share your information as described in this notice. |
| How? | All financial companies need to share customers' personal information to run their everyday business. In the section below, we list the reasons financial companies can share their customers' personal information; the reasons MFS chooses to share; and whether you can limit this sharing. |
| Reasons we can share your personal information | Does MFS share? | Can you limit this sharing? |
| For our everyday business purposes – such as to process your transactions, maintain your account(s), respond to court orders and legal investigations, or report to credit bureaus | Yes | No |
| For our marketing purposes – to offer our products and services to you | No | We don't share |
| For joint marketing with other financial companies | No | We don't share |
| For our affiliates' everyday business purposes – information about your transactions and experiences | No | We don't share |
| For our affiliates' everyday business purposes – information about your creditworthiness | No | We don't share |
| For nonaffiliates to market to you | No | We don't share |
| Questions? | Call 800-225-2606 or go to mfs.com. |

Table of Contents
| Who we are | |
| Who is providing this notice? | MFS Funds, MFS Investment Management, MFS Institutional Advisors, Inc., and MFS Heritage Trust Company. |
| What we do | |
| How does MFS protect my personal information? | To protect your personal information from unauthorized access and use, we use security measures that comply with federal law. These measures include procedural, electronic, and physical safeguards for the protection of the personal information we collect about you. |
| How does MFS collect my personal information? | We collect your personal information, for example, when you |
| • open an account or provide account information | |
| • direct us to buy securities or direct us to sell your securities | |
| • make a wire transfer | |
| We also collect your personal information from others, such as credit bureaus, affiliates, or other companies. | |
| Why can't I limit all sharing? | Federal law gives you the right to limit only |
| • sharing for affiliates' everyday business purposes – information about your creditworthiness | |
| • affiliates from using your information to market to you | |
| • sharing for nonaffiliates to market to you | |
| State laws and individual companies may give you additional rights to limit sharing. | |
| Definitions | |
| Affiliates | Companies related by common ownership or control. They can be financial and nonfinancial companies. |
| • MFS does not share personal information with affiliates, except for everyday business purposes as described on page one of this notice. | |
| Nonaffiliates | Companies not related by common ownership or control. They can be financial and nonfinancial companies. |
| • MFS does not share with nonaffiliates so they can market to you. | |
| Joint marketing | A formal agreement between nonaffiliated financial companies that together market financial products or services to you. |
| • MFS doesn't jointly market. | |
| Other important information |
| If you own an MFS product or receive an MFS service in the name of a third party such as a bank or broker-dealer, their privacy policy may apply to you instead of ours. |
Table of Contents
Table of Contents


Table of Contents
Annual Report
May 31, 2021

MFS® Blended Research®
Value Equity Fund

BRU-ANN
Table of Contents
MFS® Blended Research® Value Equity Fund
| Contact information | back cover |
The report is prepared for the general information of shareholders. It is authorized for distribution to prospective investors only when preceded or accompanied by a current prospectus.
NOT FDIC INSURED • MAY LOSE VALUE • NO BANK GUARANTEE
Table of Contents

Dear Shareholders:
Markets have experienced dramatic swings since the coronavirus pandemic brought the global economy to a standstill for several months early in 2020. While the speedy
development of vaccines brightened the economic and market outlook, uncertainty remains as new variants of the virus appear, and questions persist over how fast vaccines can be made widely available in the developing world.
Global central banks have taken aggressive steps to cushion the economic and market fallout related to the virus, and governments are deploying unprecedented levels of fiscal support. Having passed a $1.9 trillion stimulus package in March, the U.S. Congress could approve additional stimulus later this year, some of it focused on infrastructure. Along with extraordinary government expenditures, pent-up consumer demand fueled a surge in economic activity as coronavirus restrictions were eased, pushing up inflation, at least temporarily. Markets reacted by pushing up
yields on global government bonds, though some of the rate rise has since been corrected.
A spirited debate is underway among investors over whether the current price pressures will persist or prove to be temporary, caused by pandemic-induced bottlenecks. The policy measures put in place to counteract the pandemic’s effects have helped build a supportive environment and are encouraging economic recovery; however, if markets disconnect from fundamentals, they can sow the seeds of instability. As such, recent dramatic increases in speculative trading in cryptocurrencies, special purpose acquisition companies (SPACs), and the like bear watching.
In the aftermath of the crisis, we could see societal changes as households, businesses, and governments adjust to a new reality, and any such alterations could affect the investment landscape. For investors, events such as the COVID-19 outbreak demonstrate the importance of having a deep understanding of company fundamentals, and we have built our global research platform to do just that.
At MFS®, we put our clients’ assets to work responsibly by carefully navigating the increasing complexity of global markets and economies. Guided by our long-term philosophy and adhering to our commitment to sustainable investing, we tune out the noise and aim to uncover what we believe are the best, most durable investment opportunities in the market. Our unique global investment platform combines collective expertise, long-term discipline, and thoughtful risk management to create sustainable value for investors.
Respectfully,

Michael W. Roberge
Chief Executive Officer
MFS Investment Management
July 16, 2021
The opinions expressed in this letter are subject to change and may not be relied upon for investment advice. No forecasts can be guaranteed.
1
Table of Contents
Portfolio structure
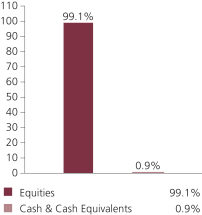
| Top ten holdings | ||||
| Johnson & Johnson | 3.1% | |||
| Bank of America Corp. | 2.9% | |||
| Comcast Corp., “A” | 2.1% | |||
| Medtronic PLC | 2.1% | |||
| Alphabet, Inc., “A” | 2.0% | |||
| Citigroup, Inc. | 2.0% | |||
| Goldman Sachs Group, Inc. | 1.9% | |||
| Intel Corp. | 1.8% | |||
| PNC Financial Services Group, Inc. | 1.8% | |||
| Eaton Corp. PLC | 1.7% |
| GICS equity sectors (g) | ||||
| Financials | 21.2% | |||
| Health Care | 13.1% | |||
| Industrials | 12.8% | |||
| Communication Services | 9.4% | |||
| Information Technology | 9.2% | |||
| Consumer Discretionary | 7.7% | |||
| Consumer Staples | 6.7% | |||
| Energy | 5.2% | |||
| Real Estate | 5.0% | |||
| Utilities | 4.7% | |||
| Materials | 4.1% |
| (g) | The Global Industry Classification Standard (GICS®) was developed by and/or is the exclusive property of MSCI, Inc. and S&P Global Market Intelligence Inc. (“S&P Global Market Intelligence”). GICS is a service mark of MSCI and S&P Global Market Intelligence and has been licensed for use by MFS. MFS has applied its own internal sector/industry classification methodology for equity securities and non-equity securities that are unclassified by GICS. |
Cash & Cash Equivalents includes any cash, investments in money market funds, short-term securities, and other assets less liabilities. Please see the Statement of Assets and Liabilities for additional information related to the fund’s cash position and other assets and liabilities.
Percentages are based on net assets as of May 31, 2021.
The portfolio is actively managed and current holdings may be different.
2
Table of Contents
Summary of Results
For the twelve months ended May 31, 2021, Class A shares of the MFS Blended Research Value Equity Fund (fund) provided a total return of 44.17%, at net asset value. This compares with a return of 44.38% for the fund’s benchmark, the Russell 1000® Value Index.
Market Environment
The global economy continued to recover from the most unusual recession in memory while financial markets benefited from massive fiscal and monetary intervention aimed at offsetting the economic effects of the pandemic. In developed markets, vaccine distribution broadened after getting off to a slower-than-hoped-for start in some locales, although concerns remained that too few people will be inoculated for herd immunity to be achieved. On balance, emerging markets experienced slower rollouts than developed markets amid ongoing vaccine supply constraints.
Around the world, central banks responded quickly and massively to the crisis with programs to improve liquidity and support markets. These undertakings proved largely successful in helping to restore market function, ease volatility and stimulate a prolonged rebound. In the first half of the period, the US Federal Reserve adopted a new, flexible, average-inflation-targeting framework, which is expected to result in the federal funds rate remaining at low levels longer than under its previous model. Due to relatively manageable external liabilities and balances of payments in many countries and persistently low inflation, even emerging market countries were able to implement countercyclical policies – a departure from the usual market-dictated response to risk-off crises.
Late in the period, markets grappled with the threat of resurgent inflation resulting from pandemic-induced production bottlenecks, monumental levels of economic stimulus and the unleashing of post-lockdown pent-up demand. Meanwhile, raw materials prices rebounded strongly on account of the surprising resilience of the global manufacturing sector during the pandemic. In response to these factors, global government bond yields rose materially in recent months and market leadership shifted from a handful of mega-cap technology companies to a broader array of small-cap and value stocks. At the same time, signs of excess investor enthusiasm were seen in pockets of the market, such as the “meme stocks” popular with users of online message boards and equities issued by special purpose acquisition companies (SPACs).
Detractors from Performance
Stock selection in the health care sector hindered performance relative to the Russell 1000® Value Index. Within this sector, the fund’s overweight positions in pharmaceutical company Merck, biotechnology company Biogen, diversified medical products maker Johnson & Johnson and health care provider Humana weakened relative returns. The stock price of Merck traded lower after the company announced disappointing financial results and the discontinuation of its COVID-19 vaccine development.
Stock selection in both the communication services and consumer staples sectors also detracted from relative performance. Within the communication services sector, there
3
Table of Contents
Management Review – continued
were no individual stocks, either in the fund or in the benchmark, that were among the fund’s top relative detractors during the reporting period. Within the consumer staples sector, the fund’s overweight position in office and consumer paper products maker Kimberly-Clark held back relative returns. The stock price of Kimberly-Clark depreciated as the company reported disappointing financial results and guidance that missed market expectations. Weakness in the company’s professional division and higher selling, general and administration costs, weighed on the company’s results.
Within other sectors, the fund’s overweight positions in semiconductor company Intel, energy infrastructure company Sempra Energy and financial technology services provider Fiserv hindered relative results. In addition, not holding shares of strong-performing mining company Freeport-McMoRan dampened relative performance.
The fund’s cash and/or cash equivalents position during the period was also a detractor from relative performance. Under normal market conditions, the fund strives to be fully invested and generally holds cash to buy new holdings and to provide liquidity. In a period when equity markets appreciated, as measured by the fund’s benchmark, holding cash hurt performance versus the benchmark, which has no cash position.
Contributors to Performance
Stock selection within both the financials and energy sectors contributed to relative returns. Within the financials sector, the fund’s overweight position in financial services firms Bank of America and Goldman Sachs benefited relative results. The stock price of Bank of America advanced during the period as the company reported strong earnings results, driven by lower-than-expected credit costs. Within the energy sector, the fund’s overweight position in oil and natural gas company Diamondback Energy helped relative returns.
Elsewhere, the fund’s overweight positions in agricultural equipment manufacturer AGCO, diversified industrial manufacturer Eaton (Ireland), contracting services provider Quanta Services and hospital operator HCA Healthcare, and the timing of the fund’s ownership in shares of semiconductor chips and electronics engineering solutions provider Applied Materials, aided relative returns. The stock price of AGCO appreciated as the company’s earnings results exceeded consensus estimates on the back of strong sales performance. Additionally, not holding shares of network equipment company Cisco Systems, and an underweight position in biopharmaceutical company Pfizer, further supported relative performance.
Respectfully,
Portfolio Manager(s)
Jim Fallon, Matt Krummell, Jonathan Sage, and Jed Stocks
The views expressed in this report are those of the portfolio manager(s) only through the end of the period of the report as stated on the cover and do not necessarily reflect the views of MFS or any other person in the MFS organization. These views are subject to change at any time based on market or other conditions, and MFS disclaims any responsibility to update such views. These views may not be relied upon as investment advice or an indication of trading intent on behalf of any MFS portfolio. References to specific securities are not recommendations of such securities, and may not be representative of any MFS portfolio’s current or future investments.
4
Table of Contents
PERFORMANCE SUMMARY THROUGH 5/31/21
The following chart illustrates a representative class of the fund’s historical performance in comparison to its benchmark(s). Performance results include the deduction of the maximum applicable sales charge and reflect the percentage change in net asset value, including reinvestment of dividends and capital gains distributions. The performance of other share classes will be greater than or less than that of the class depicted below. Benchmarks are unmanaged and may not be invested in directly. Benchmark returns do not reflect sales charges, commissions or expenses. (See Notes to Performance Summary.)
Performance data shown represents past performance and is no guarantee of future results. Investment return and principal value fluctuate so your shares, when sold, may be worth more or less than the original cost; current performance may be lower or higher than quoted. The performance shown does not reflect the deduction of taxes, if any, that a shareholder would pay on fund distributions or the redemption of fund shares.
Growth of a Hypothetical $10,000 Investment (t)
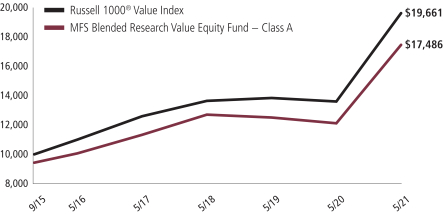
5
Table of Contents
Performance Summary – continued
Total Returns through 5/31/21
Average annual without sales charge
| Share Class | Class Inception Date | 1-yr | 5-yr | Life (t) | ||||||||
| A | 9/15/15 | 44.17% | 11.70% | 11.43% | ||||||||
| B | 9/15/15 | 43.10% | 10.85% | 10.60% | ||||||||
| C | 9/15/15 | 43.08% | 10.86% | 10.59% | ||||||||
| I | 9/15/15 | 44.51% | 11.95% | 11.70% | ||||||||
| R1 | 9/15/15 | 43.07% | 10.86% | 10.60% | ||||||||
| R2 | 9/15/15 | 43.83% | 11.42% | 11.15% | ||||||||
| R3 | 9/15/15 | 44.17% | 11.70% | 11.43% | ||||||||
| R4 | 9/15/15 | 44.52% | 11.97% | 11.70% | ||||||||
| R6 | 9/15/15 | 44.57% | 12.08% | 11.80% | ||||||||
| Comparative benchmark(s) | ||||||||||||
| Russell 1000® Value Index (f) | 44.38% | 12.33% | 12.56% | |||||||||
| Average annual with sales charge | ||||||||||||
| A With Initial Sales Charge (5.75%) | 35.88% | 10.38% | 10.28% | |||||||||
| B With CDSC (Declining over six years from 4% to 0%) (v) | 39.10% | 10.59% | 10.49% | |||||||||
| C With CDSC (1% for 12 months) (v) | 42.08% | 10.86% | 10.59% | |||||||||
CDSC – Contingent Deferred Sales Charge.
Class I, R1, R2, R3, R4, and R6 shares do not have a sales charge.
| (f) | Source: FactSet Research Systems Inc. |
| (t) | For the period from the class inception date through the stated period end. (See Notes to Performance Summary.) |
| (v) | Assuming redemption at the end of the applicable period. |
Benchmark Definition(s)
Russell 1000® Value Index (h) – constructed to provide a comprehensive barometer for the value securities in the large-cap segment of the U.S. equity universe. Companies in this index generally have lower price-to-book ratios and lower forecasted growth values.
It is not possible to invest directly in an index.
| (h) | Frank Russell Company (“Russell”) is the source and owner of the trademarks, service marks, and copyrights related to the Russell Indexes. Russell® is a trademark of Frank Russell Company. Neither Russell nor its licensors accept any liability for any errors or omissions in the Russell Indexes and/or Russell ratings or underlying data and no party may rely on any Russell Indexes and/or Russell ratings and/or underlying data contained in this document. No further distribution of Russell Data is permitted without Russell’s express written consent. Russell does not promote, sponsor, or endorse the content of this document. |
6
Table of Contents
Performance Summary – continued
Notes to Performance Summary
Average annual total return represents the average annual change in value for each share class for the periods presented. Life returns are presented where the share class has less than 10 years of performance history and represent the average annual total return from the class inception date to the stated period end date.
Performance results reflect any applicable expense subsidies and waivers in effect during the periods shown. Without such subsidies and waivers the fund’s performance results would be less favorable. Please see the prospectus and financial statements for complete details.
Performance results do not include adjustments made for financial reporting purposes in accordance with U.S. generally accepted accounting principles and may differ from amounts reported in the financial highlights.
From time to time the fund may receive proceeds from litigation settlements, without which performance would be lower.
7
Table of Contents
Fund expenses borne by the shareholders during the period, December 1, 2020 through May 31, 2021
As a shareholder of the fund, you incur two types of costs: (1) transaction costs, including sales charges (loads) on certain purchase or redemption payments, and (2) ongoing costs, including management fees; distribution and service (12b-1) fees; and other fund expenses. This example is intended to help you understand your ongoing costs (in dollars) of investing in the fund and to compare these costs with the ongoing costs of investing in other mutual funds.
The example is based on an investment of $1,000 invested at the beginning of the period and held for the entire period December 1, 2020 through May 31, 2021.
Actual Expenses
The first line for each share class in the following table provides information about actual account values and actual expenses. You may use the information in this line, together with the amount you invested, to estimate the expenses that you paid over the period. Simply divide your account value by $1,000 (for example, an $8,600 account value divided by $1,000 = 8.6), then multiply the result by the number in the first line under the heading entitled “Expenses Paid During Period” to estimate the expenses you paid on your account during this period.
Hypothetical Example for Comparison Purposes
The second line for each share class in the following table provides information about hypothetical account values and hypothetical expenses based on the fund’s actual expense ratio and an assumed rate of return of 5% per year before expenses, which is not the fund’s actual return. The hypothetical account values and expenses may not be used to estimate the actual ending account balance or expenses you paid for the period. You may use this information to compare the ongoing costs of investing in the fund and other funds. To do so, compare this 5% hypothetical example with the 5% hypothetical examples that appear in the shareholder reports of the other funds.
Please note that the expenses shown in the table are meant to highlight your ongoing costs only and do not reflect any transactional costs, such as sales charges (loads). Therefore, the second line for each share class in the table is useful in comparing ongoing costs only, and will not help you determine the relative total costs of owning different funds. In addition, if these transactional costs were included, your costs would have been higher.
8
Table of Contents
Expense Table – continued
| Share Class | Annualized Expense Ratio | Beginning Account Value 12/01/20 | Ending Account Value 5/31/21 | Expenses Paid During Period (p) 12/01/20-5/31/21 | ||||||||||||||
| A | Actual | 0.74% | $1,000.00 | $1,244.42 | $4.14 | |||||||||||||
| Hypothetical (h) | 0.74% | $1,000.00 | $1,021.24 | $3.73 | ||||||||||||||
| B | Actual | 1.49% | $1,000.00 | $1,239.59 | $8.32 | |||||||||||||
| Hypothetical (h) | 1.49% | $1,000.00 | $1,017.50 | $7.49 | ||||||||||||||
| C | Actual | 1.49% | $1,000.00 | $1,240.21 | $8.32 | |||||||||||||
| Hypothetical (h) | 1.49% | $1,000.00 | $1,017.50 | $7.49 | ||||||||||||||
| I | Actual | 0.49% | $1,000.00 | $1,246.40 | $2.74 | |||||||||||||
| Hypothetical (h) | 0.49% | $1,000.00 | $1,022.49 | $2.47 | ||||||||||||||
| R1 | Actual | 1.49% | $1,000.00 | $1,240.06 | $8.32 | |||||||||||||
| Hypothetical (h) | 1.49% | $1,000.00 | $1,017.50 | $7.49 | ||||||||||||||
| R2 | Actual | 0.99% | $1,000.00 | $1,243.64 | $5.54 | |||||||||||||
| Hypothetical (h) | 0.99% | $1,000.00 | $1,020.00 | $4.99 | ||||||||||||||
| R3 | Actual | 0.74% | $1,000.00 | $1,245.18 | $4.14 | |||||||||||||
| Hypothetical (h) | 0.74% | $1,000.00 | $1,021.24 | $3.73 | ||||||||||||||
| R4 | Actual | 0.49% | $1,000.00 | $1,245.55 | $2.74 | |||||||||||||
| Hypothetical (h) | 0.49% | $1,000.00 | $1,022.49 | $2.47 | ||||||||||||||
| R6 | Actual | 0.39% | $1,000.00 | $1,246.28 | $2.18 | |||||||||||||
| Hypothetical (h) | 0.39% | $1,000.00 | $1,022.99 | $1.97 | ||||||||||||||
| (h) | 5% class return per year before expenses. |
| (p) | “Expenses Paid During Period” are equal to each class’s annualized expense ratio, as shown above, multiplied by the average account value over the period, multiplied by 182/365 (to reflect the one-half year period). Expenses paid do not include any applicable sales charges (loads). If these transaction costs had been included, your costs would have been higher. |
9
Table of Contents
5/31/21
The Portfolio of Investments is a complete list of all securities owned by your fund. It is categorized by broad-based asset classes.
| Issuer | Shares/Par | Value ($) | ||||||
| Common Stocks - 99.1% | ||||||||
| Aerospace & Defense - 3.8% | ||||||||
| Honeywell International, Inc. | 17,190 | $ | 3,969,343 | |||||
| Huntington Ingalls Industries, Inc. | 4,289 | 927,325 | ||||||
| L3Harris Technologies, Inc. | 5,384 | 1,174,035 | ||||||
| Northrop Grumman Corp. | 5,249 | 1,920,452 | ||||||
| Raytheon Technologies Corp. | 23,005 | 2,040,773 | ||||||
|
| |||||||
| $ | 10,031,928 | |||||||
| Apparel Manufacturers - 0.3% | ||||||||
| PVH Corp. (a) | 7,595 | $ | 872,058 | |||||
| Automotive - 1.6% | ||||||||
| Ford Motor Co. (a) | 60,707 | $ | 882,073 | |||||
| Lear Corp. | 16,975 | 3,282,286 | ||||||
|
| |||||||
| $ | 4,164,359 | |||||||
| Biotechnology - 1.1% | ||||||||
| Biogen, Inc. (a) | 3,991 | $ | 1,067,513 | |||||
| Gilead Sciences, Inc. | 19,336 | 1,278,303 | ||||||
| Vertex Pharmaceuticals, Inc. (a) | 3,010 | 627,976 | ||||||
|
| |||||||
| $ | 2,973,792 | |||||||
| Broadcasting - 0.7% | ||||||||
| Discovery Communications, Inc., “A” (a) | 23,930 | $ | 768,392 | |||||
| Walt Disney Co. (a) | 6,308 | 1,126,924 | ||||||
|
| |||||||
| $ | 1,895,316 | |||||||
| Brokerage & Asset Managers - 0.9% | ||||||||
| Charles Schwab Corp. | 22,365 | $ | 1,651,655 | |||||
| Jefferies Financial Group, Inc. | 26,040 | 836,665 | ||||||
|
| |||||||
| $ | 2,488,320 | |||||||
| Business Services - 2.5% | ||||||||
| Accenture PLC, “A” | 8,030 | $ | 2,265,745 | |||||
| Amdocs Ltd. | 27,220 | 2,125,882 | ||||||
| Cognizant Technology Solutions Corp., “A” | 12,634 | 904,089 | ||||||
| Fiserv, Inc. (a) | 9,836 | 1,133,107 | ||||||
|
| |||||||
| $ | 6,428,823 | |||||||
| Cable TV - 3.4% | ||||||||
| Charter Communications, Inc., “A” (a) | 4,732 | $ | 3,286,516 | |||||
| Comcast Corp., “A” | 96,714 | 5,545,581 | ||||||
|
| |||||||
| $ | 8,832,097 | |||||||
10
Table of Contents
Portfolio of Investments – continued
| Issuer | Shares/Par | Value ($) | ||||||
| Common Stocks - continued | ||||||||
| Chemicals - 1.1% | ||||||||
| Eastman Chemical Co. | 21,978 | $ | 2,756,041 | |||||
| Computer Software - 1.5% | ||||||||
| Autodesk, Inc. (a) | 2,340 | $ | 668,913 | |||||
| Microsoft Corp. | 13,068 | 3,262,818 | ||||||
|
| |||||||
| $ | 3,931,731 | |||||||
| Computer Software - Systems - 1.1% | ||||||||
| Arrow Electronics, Inc. (a) | 6,802 | $ | 818,485 | |||||
| HP, Inc. | 31,510 | 921,037 | ||||||
| Zebra Technologies Corp., “A” (a) | 2,043 | 1,015,473 | ||||||
|
| |||||||
| $ | 2,754,995 | |||||||
| Construction - 1.1% | ||||||||
| D.R. Horton, Inc. | 15,024 | $ | 1,431,637 | |||||
| Sherwin-Williams Co. | 2,193 | 621,781 | ||||||
| Toll Brothers, Inc. | 11,623 | 758,285 | ||||||
|
| |||||||
| $ | 2,811,703 | |||||||
| Consumer Products - 2.1% | ||||||||
| Colgate-Palmolive Co. | 42,053 | $ | 3,523,200 | |||||
| Kimberly-Clark Corp. | 16,201 | 2,116,337 | ||||||
|
| |||||||
| $ | 5,639,537 | |||||||
| Containers - 0.4% | ||||||||
| Graphic Packaging Holding Co. | 66,382 | $ | 1,173,634 | |||||
| Electrical Equipment - 1.1% | ||||||||
| Amphenol Corp., “A” | 8,530 | $ | 573,728 | |||||
| Johnson Controls International PLC | 26,980 | 1,795,249 | ||||||
| Littlefuse, Inc. | 1,737 | 453,774 | ||||||
|
| |||||||
| $ | 2,822,751 | |||||||
| Electronics - 3.8% | ||||||||
| Applied Materials, Inc. | 25,827 | $ | 3,567,484 | |||||
| Intel Corp. | 83,542 | 4,771,919 | ||||||
| Texas Instruments, Inc. | 9,026 | 1,713,315 | ||||||
|
| |||||||
| $ | 10,052,718 | |||||||
| Energy - Independent - 2.8% | ||||||||
| ConocoPhillips | 40,375 | $ | 2,250,502 | |||||
| Diamondback Energy, Inc. | 11,753 | 941,063 | ||||||
| EOG Resources, Inc. | 23,241 | 1,867,182 | ||||||
| Valero Energy Corp. | 27,382 | 2,201,513 | ||||||
|
| |||||||
| $ | 7,260,260 | |||||||
11
Table of Contents
Portfolio of Investments – continued
| Issuer | Shares/Par | Value ($) | ||||||
| Common Stocks - continued | ||||||||
| Energy - Integrated - 0.9% | ||||||||
| Exxon Mobil Corp. | 39,207 | $ | 2,288,513 | |||||
| Engineering - Construction - 0.6% | ||||||||
| Quanta Services, Inc. | 17,190 | $ | 1,639,067 | |||||
| Food & Beverages - 3.0% | ||||||||
| General Mills, Inc. | 27,308 | $ | 1,716,581 | |||||
| J.M. Smucker Co. | 8,057 | 1,073,918 | ||||||
| Mondelez International, Inc. | 49,057 | 3,116,591 | ||||||
| PepsiCo, Inc. | 12,794 | 1,892,744 | ||||||
|
| |||||||
| $ | 7,799,834 | |||||||
| Food & Drug Stores - 0.6% | ||||||||
| Wal-Mart Stores, Inc. | 10,308 | $ | 1,464,045 | |||||
| Forest & Paper Products - 0.7% | ||||||||
| Weyerhaeuser Co., REIT | 49,947 | $ | 1,895,988 | |||||
| Gaming & Lodging - 0.8% | ||||||||
| Marriott International, Inc., “A” (a) | 14,078 | $ | 2,021,319 | |||||
| General Merchandise - 0.3% | ||||||||
| Dollar General Corp. | 4,252 | $ | 862,986 | |||||
| Health Maintenance Organizations - 1.4% | ||||||||
| Cigna Corp. | 6,802 | $ | 1,760,698 | |||||
| Humana, Inc. | 4,573 | 2,001,602 | ||||||
|
| |||||||
| $ | 3,762,300 | |||||||
| Insurance - 4.7% | ||||||||
| Berkshire Hathaway, Inc., “B” (a) | 12,499 | $ | 3,617,710 | |||||
| Chubb Ltd. | 21,043 | 3,577,100 | ||||||
| Equitable Holdings, Inc. | 20,697 | 657,130 | ||||||
| MetLife, Inc. | 54,541 | 3,564,800 | ||||||
| Reinsurance Group of America, Inc. | 6,875 | 866,456 | ||||||
|
| |||||||
| $ | 12,283,196 | |||||||
| Internet - 2.6% | ||||||||
| Alphabet, Inc., “A” (a) | 2,280 | $ | 5,373,618 | |||||
| Facebook, Inc., “A” (a) | 4,802 | 1,578,561 | ||||||
|
| |||||||
| $ | 6,952,179 | |||||||
12
Table of Contents
Portfolio of Investments – continued
| Issuer | Shares/Par | Value ($) | ||||||
| Common Stocks - continued | ||||||||
| Leisure & Toys - 1.9% | ||||||||
| Brunswick Corp. | 10,783 | $ | 1,102,346 | |||||
| Electronic Arts, Inc. | 15,953 | 2,280,162 | ||||||
| Mattel, Inc. (a) | 54,029 | 1,145,955 | ||||||
| Polaris, Inc. | 4,391 | 576,187 | ||||||
|
| |||||||
| $ | 5,104,650 | |||||||
| Machinery & Tools - 4.1% | ||||||||
| AGCO Corp. | 15,251 | $ | 2,110,281 | |||||
| Eaton Corp. PLC | 31,355 | 4,554,313 | ||||||
| Regal Beloit Corp. | 21,108 | 3,002,191 | ||||||
| Roper Technologies, Inc. | 2,283 | 1,027,373 | ||||||
|
| |||||||
| $ | 10,694,158 | |||||||
| Major Banks - 10.5% | ||||||||
| Bank of America Corp. | 182,078 | $ | 7,718,286 | |||||
| Goldman Sachs Group, Inc. | 13,526 | 5,031,943 | ||||||
| JPMorgan Chase & Co. | 27,333 | 4,489,172 | ||||||
| Morgan Stanley | 20,926 | 1,903,220 | ||||||
| PNC Financial Services Group, Inc. | 24,149 | 4,701,327 | ||||||
| State Street Corp. | 8,099 | 704,451 | ||||||
| Wells Fargo & Co. | 65,909 | 3,079,268 | ||||||
|
| |||||||
| $ | 27,627,667 | |||||||
| Medical & Health Technology & Services - 2.0% | ||||||||
| HCA Healthcare, Inc. | 13,541 | $ | 2,908,471 | |||||
| McKesson Corp. | 8,500 | 1,635,315 | ||||||
| Universal Health Services, Inc. | 4,179 | 667,094 | ||||||
|
| |||||||
| $ | 5,210,880 | |||||||
| Medical Equipment - 3.8% | ||||||||
| Abbott Laboratories | 7,924 | $ | 924,335 | |||||
| Boston Scientific Corp. (a) | 23,733 | 1,009,839 | ||||||
| Danaher Corp. | 7,211 | 1,847,026 | ||||||
| Medtronic PLC | 42,986 | 5,441,598 | ||||||
| Thermo Fisher Scientific, Inc. | 1,457 | 684,061 | ||||||
|
| |||||||
| $ | 9,906,859 | |||||||
| Natural Gas - Distribution - 1.7% | ||||||||
| Sempra Energy | 18,617 | $ | 2,522,418 | |||||
| UGI Corp. | 44,865 | 2,066,033 | ||||||
|
| |||||||
| $ | 4,588,451 | |||||||
13
Table of Contents
Portfolio of Investments – continued
| Issuer | Shares/Par | Value ($) | ||||||
| Common Stocks - continued | ||||||||
| Natural Gas - Pipeline - 0.4% | ||||||||
| Equitrans Midstream Corp. | 44,103 | $ | 363,409 | |||||
| Targa Resources Corp. | 14,890 | 578,625 | ||||||
|
| |||||||
| $ | 942,034 | |||||||
| Oil Services - 1.2% | ||||||||
| NOV, Inc. (a) | 102,819 | $ | 1,657,442 | |||||
| Schlumberger Ltd. | 51,782 | 1,622,330 | ||||||
|
| |||||||
| $ | 3,279,772 | |||||||
| Other Banks & Diversified Financials - 4.2% | ||||||||
| Citigroup, Inc. | 67,082 | $ | 5,280,024 | |||||
| Moody’s Corp. | 3,910 | 1,311,219 | ||||||
| S&P Global, Inc. | 919 | 348,733 | ||||||
| SLM Corp. | 33,932 | 687,123 | ||||||
| Synchrony Financial | 35,696 | 1,692,347 | ||||||
| U.S. Bancorp | 29,214 | 1,775,627 | ||||||
|
| |||||||
| $ | 11,095,073 | |||||||
| Pharmaceuticals - 4.8% | ||||||||
| Eli Lilly & Co. | 8,815 | $ | 1,760,708 | |||||
| Johnson & Johnson | 47,995 | 8,123,154 | ||||||
| Merck & Co., Inc. | 32,496 | 2,466,121 | ||||||
| Pfizer, Inc. | 6,687 | 258,988 | ||||||
|
| |||||||
| $ | 12,608,971 | |||||||
| Pollution Control - 0.6% | ||||||||
| Waste Management, Inc. | 11,521 | $ | 1,620,774 | |||||
| Railroad & Shipping - 1.8% | ||||||||
| CSX Corp. | 31,370 | $ | 3,140,764 | |||||
| Kansas City Southern Co. | 5,176 | 1,540,792 | ||||||
|
| |||||||
| $ | 4,681,556 | |||||||
| Real Estate - 5.2% | ||||||||
| Extra Space Storage, Inc., REIT | 10,990 | $ | 1,646,412 | |||||
| Omega Healthcare Investors, Inc., REIT | 87,498 | 3,204,177 | ||||||
| Public Storage, Inc., REIT | 9,297 | 2,626,217 | ||||||
| Spirit Realty Capital, Inc., REIT | 38,029 | 1,797,250 | ||||||
| STAG Industrial, Inc., REIT | 14,541 | 519,259 | ||||||
| Starwood Property Trust, Inc., REIT | 87,151 | 2,212,764 | ||||||
| STORE Capital Corp., REIT | 43,885 | 1,509,644 | ||||||
|
| |||||||
| $ | 13,515,723 | |||||||
| Restaurants - 0.7% | ||||||||
| Starbucks Corp. | 17,255 | $ | 1,964,999 | |||||
14
Table of Contents
Portfolio of Investments – continued
| Issuer | Shares/Par | Value ($) | ||||||
| Common Stocks - continued | ||||||||
| Specialty Chemicals - 2.4% | ||||||||
| Corteva, Inc. | 13,182 | $ | 599,781 | |||||
| Dow, Inc. | 29,908 | 2,046,305 | ||||||
| DuPont de Nemours, Inc. | 19,466 | 1,646,629 | ||||||
| Linde PLC | 6,490 | 1,950,894 | ||||||
|
| |||||||
| $ | 6,243,609 | |||||||
| Specialty Stores - 2.0% | ||||||||
| Home Depot, Inc. | 8,475 | $ | 2,702,762 | |||||
| Target Corp. | 7,199 | 1,633,597 | ||||||
| TJX Cos., Inc. | 13,331 | 900,376 | ||||||
|
| |||||||
| $ | 5,236,735 | |||||||
| Telecommunications - Wireless - 1.2% | ||||||||
| T-Mobile USA, Inc. (a) | 22,226 | $ | 3,143,868 | |||||
| Telephone Services - 0.6% | ||||||||
| AT&T, Inc. | 24,870 | $ | 731,924 | |||||
| Verizon Communications, Inc. | 13,345 | 753,859 | ||||||
|
| |||||||
| $ | 1,485,783 | |||||||
| Tobacco - 1.0% | ||||||||
| Philip Morris International, Inc. | 26,672 | $ | 2,571,981 | |||||
| Trucking - 1.2% | ||||||||
| Knight-Swift Transportation Holdings, Inc. | 20,646 | $ | 985,433 | |||||
| United Parcel Service, Inc., “B” | 9,963 | 2,138,060 | ||||||
|
| |||||||
| $ | 3,123,493 | |||||||
| Utilities - Electric Power - 2.9% | ||||||||
| CenterPoint Energy, Inc. | 38,246 | $ | 967,624 | |||||
| Edison International | 11,552 | 645,410 | ||||||
| Exelon Corp. | 82,074 | 3,703,179 | ||||||
| NRG Energy, Inc. | 24,473 | 786,807 | ||||||
| Southern Co. | 24,191 | 1,546,289 | ||||||
|
| |||||||
| $ | 7,649,309 | |||||||
| Total Common Stocks (Identified Cost, $180,695,070) | $ | 260,155,835 | ||||||
| Investment Companies (h) - 0.7% | ||||||||
| Money Market Funds - 0.7% | ||||||||
| MFS Institutional Money Market Portfolio, 0.03% (v) (Identified Cost, $1,723,582) | 1,723,582 | $ | 1,723,582 | |||||
| Other Assets, Less Liabilities - 0.2% | 529,032 | |||||||
| Net Assets - 100.0% | $ | 262,408,449 | ||||||
15
Table of Contents
Portfolio of Investments – continued
| (a) | Non-income producing security. |
| (h) | An affiliated issuer, which may be considered one in which the fund owns 5% or more of the outstanding voting securities, or a company which is under common control. At period end, the aggregate values of the fund’s investments in affiliated issuers and in unaffiliated issuers were $1,723,582 and $260,155,835, respectively. |
| (v) | Affiliated issuer that is available only to investment companies managed by MFS. The rate quoted for the MFS Institutional Money Market Portfolio is the annualized seven-day yield of the fund at period end. |
The following abbreviations are used in this report and are defined:
| REIT | Real Estate Investment Trust |
See Notes to Financial Statements
16
Table of Contents
Financial Statements
STATEMENT OF ASSETS AND LIABILITIES
At 5/31/21
This statement represents your fund’s balance sheet, which details the assets and liabilities comprising the total value of the fund.
| Assets | ||||
Investments in unaffiliated issuers, at value (identified cost, $180,695,070) | $260,155,835 | |||
Investments in affiliated issuers, at value (identified cost, $1,723,582) | 1,723,582 | |||
Receivables for | ||||
Fund shares sold | 273,567 | |||
Dividends | 489,926 | |||
Other assets | 596 | |||
Total assets | $262,643,506 | |||
| Liabilities | ||||
Payables for | ||||
Fund shares reacquired | $134,211 | |||
Payable to affiliates | ||||
Investment adviser | 1,734 | |||
Administrative services fee | 617 | |||
Shareholder servicing costs | 25,537 | |||
Distribution and service fees | 2,503 | |||
Payable for independent Trustees’ compensation | 12 | |||
Accrued expenses and other liabilities | 70,443 | |||
Total liabilities | $235,057 | |||
Net assets | $262,408,449 | |||
| Net assets consist of | ||||
Paid-in capital | $177,349,046 | |||
Total distributable earnings (loss) | 85,059,403 | |||
Net assets | $262,408,449 | |||
Shares of beneficial interest outstanding | 16,040,133 | |||
17
Table of Contents
Statement of Assets and Liabilities – continued
| Net assets | Shares outstanding | Net asset value per share (a) | ||||||||||
Class A | $68,612,472 | 4,215,668 | $16.28 | |||||||||
Class B | 140,037 | 8,602 | 16.28 | |||||||||
Class C | 872,746 | 53,815 | 16.22 | |||||||||
Class I | 1,517,450 | 92,717 | 16.37 | |||||||||
Class R1 | 88,886 | 5,481 | 16.22 | |||||||||
Class R2 | 104,493 | 6,408 | 16.31 | |||||||||
Class R3 | 103,436 | 6,324 | 16.36 | |||||||||
Class R4 | 94,107 | 5,748 | 16.37 | |||||||||
Class R6 | 190,874,822 | 11,645,370 | 16.39 | |||||||||
| (a) | Maximum offering price per share was equal to the net asset value per share for all share classes, except for Class A, for which the maximum offering price per share was $17.27 [100 / 94.25 x $16.28]. On sales of $50,000 or more, the maximum offering price of Class A shares is reduced. A contingent deferred sales charge may be imposed on redemptions of Class A, Class B, and Class C shares. Redemption price per share was equal to the net asset value per share for Classes I, R1, R2, R3, R4, and R6. |
See Notes to Financial Statements
18
Table of Contents
Financial Statements
Year ended 5/31/21
This statement describes how much your fund earned in investment income and accrued in expenses. It also describes any gains and/or losses generated by fund operations.
| Net investment income (loss) | ||||
Income | ||||
Dividends | $5,060,401 | |||
Other | 6,436 | |||
Dividends from affiliated issuers | 1,601 | |||
Income on securities loaned | 20 | |||
Total investment income | $5,068,458 | |||
Expenses | ||||
Management fee | $910,638 | |||
Distribution and service fees | 153,609 | |||
Shareholder servicing costs | 60,088 | |||
Administrative services fee | 40,283 | |||
Independent Trustees’ compensation | 7,120 | |||
Custodian fee | 15,659 | |||
Shareholder communications | 8,855 | |||
Audit and tax fees | 57,031 | |||
Legal fees | 1,723 | |||
Registration fees | 110,710 | |||
Miscellaneous | 30,453 | |||
Total expenses | $1,396,169 | |||
Reduction of expenses by investment adviser and distributor | (281,359 | ) | ||
Net expenses | $1,114,810 | |||
Net investment income (loss) | $3,953,648 | |||
| Realized and unrealized gain (loss) | ||||
| Realized gain (loss) (identified cost basis) | ||||
Unaffiliated issuers | $10,332,892 | |||
Affiliated issuers | (166 | ) | ||
Net realized gain (loss) | $10,332,726 | |||
| Change in unrealized appreciation or depreciation | ||||
Unaffiliated issuers | $71,032,229 | |||
Net realized and unrealized gain (loss) | $81,364,955 | |||
Change in net assets from operations | $85,318,603 | |||
See Notes to Financial Statements
19
Table of Contents
Financial Statements
STATEMENTS OF CHANGES IN NET ASSETS
These statements describe the increases and/or decreases in net assets resulting from operations, any distributions, and any shareholder transactions.
| Year ended | ||||||||
| 5/31/21 | 5/31/20 | |||||||
| Change in net assets | ||||||||
| From operations | ||||||||
Net investment income (loss) | $3,953,648 | $4,182,238 | ||||||
Net realized gain (loss) | 10,332,726 | (5,145,146 | ) | |||||
Net unrealized gain (loss) | 71,032,229 | (1,500,809 | ) | |||||
Change in net assets from operations | $85,318,603 | $(2,463,717 | ) | |||||
Total distributions to shareholders | $(4,300,007 | ) | $(4,275,227 | ) | ||||
Change in net assets from fund share transactions | $(13,157,696 | ) | $25,805,690 | |||||
Total change in net assets | $67,860,900 | $19,066,746 | ||||||
| Net assets | ||||||||
At beginning of period | 194,547,549 | 175,480,803 | ||||||
At end of period | $262,408,449 | $194,547,549 | ||||||
See Notes to Financial Statements
20
Table of Contents
Financial Statements
The financial highlights table is intended to help you understand the fund’s financial performance for the past 5 years (or life of a particular share class, if shorter). Certain information reflects financial results for a single fund share. The total returns in the table represent the rate that an investor would have earned (or lost) on an investment in the fund share class (assuming reinvestment of all distributions) held for the entire period.
| Class A | Year ended | |||||||||||||||||||
| 5/31/21 | 5/31/20 | 5/31/19 | 5/31/18 | 5/31/17 | ||||||||||||||||
Net asset value, beginning of period | $11.48 | $12.07 | $12.84 | $11.85 | $10.57 | |||||||||||||||
| Income (loss) from investment operations |
| |||||||||||||||||||
Net investment income (loss) (d) | $0.20 | $0.24 | $0.23 | $0.22 | $0.18 | |||||||||||||||
Net realized and unrealized gain (loss) | 4.82 | (0.57 | ) | (0.47 | ) | 1.22 | 1.16 | |||||||||||||
Total from investment operations | $5.02 | $(0.33 | ) | $(0.24 | ) | $1.44 | $1.34 | |||||||||||||
| Less distributions declared to shareholders |
| |||||||||||||||||||
From net investment income | $(0.22 | ) | $(0.26 | ) | $(0.22 | ) | $(0.16 | ) | $(0.06 | ) | ||||||||||
From net realized gain | — | — | (0.31 | ) | (0.29 | ) | — | |||||||||||||
Total distributions declared to shareholders | $(0.22 | ) | $(0.26 | ) | $(0.53 | ) | $(0.45 | ) | $(0.06 | ) | ||||||||||
Net asset value, end of period (x) | $16.28 | $11.48 | $12.07 | $12.84 | $11.85 | |||||||||||||||
Total return (%) (r)(s)(t)(x) | 44.17 | (3.04 | ) | (1.62 | ) | 12.18 | 12.71 | |||||||||||||
| Ratios (%) (to average net assets) and Supplemental data: |
| |||||||||||||||||||
Expenses before expense reductions (f) | 0.86 | 0.91 | 0.90 | 0.91 | 1.90 | |||||||||||||||
Expenses after expense reductions (f) | 0.74 | 0.74 | 0.74 | 0.74 | 0.74 | |||||||||||||||
Net investment income (loss) | 1.48 | 1.96 | 1.83 | 1.72 | 1.59 | |||||||||||||||
Portfolio turnover | 57 | 45 | 43 | 61 | 51 | |||||||||||||||
Net assets at end of period (000 omitted) | $68,612 | $52,735 | $51,642 | $53,388 | $1,012 | |||||||||||||||
See Notes to Financial Statements
21
Table of Contents
Financial Highlights – continued
| Class B | Year ended | |||||||||||||||||||
| 5/31/21 | 5/31/20 | 5/31/19 | 5/31/18 | 5/31/17 | ||||||||||||||||
Net asset value, beginning of period | $11.46 | $12.07 | $12.81 | $11.79 | $10.55 | |||||||||||||||
| Income (loss) from investment operations |
| |||||||||||||||||||
Net investment income (loss) (d) | $0.10 | $0.15 | $0.14 | $0.10 | $0.10 | |||||||||||||||
Net realized and unrealized gain (loss) | 4.82 | (0.59 | ) | (0.45 | ) | 1.24 | 1.15 | |||||||||||||
Total from investment operations | $4.92 | $(0.44 | ) | $(0.31 | ) | $1.34 | $1.25 | |||||||||||||
| Less distributions declared to shareholders |
| |||||||||||||||||||
From net investment income | $(0.10 | ) | $(0.17 | ) | $(0.12 | ) | $(0.03 | ) | $(0.01 | ) | ||||||||||
From net realized gain | — | — | (0.31 | ) | (0.29 | ) | — | |||||||||||||
Total distributions declared to shareholders | $(0.10 | ) | $(0.17 | ) | $(0.43 | ) | $(0.32 | ) | $(0.01 | ) | ||||||||||
Net asset value, end of period (x) | $16.28 | $11.46 | $12.07 | $12.81 | $11.79 | |||||||||||||||
Total return (%) (r)(s)(t)(x) | 43.10 | (3.87 | ) | (2.26 | ) | 11.36 | 11.80 | |||||||||||||
| Ratios (%) (to average net assets) and Supplemental data: |
| |||||||||||||||||||
Expenses before expense reductions (f) | 1.61 | 1.65 | 1.64 | 1.66 | 2.53 | |||||||||||||||
Expenses after expense reductions (f) | 1.49 | 1.49 | 1.49 | 1.49 | 1.49 | |||||||||||||||
Net investment income (loss) | 0.73 | 1.20 | 1.08 | 0.80 | 0.84 | |||||||||||||||
Portfolio turnover | 57 | 45 | 43 | 61 | 51 | |||||||||||||||
Net assets at end of period (000 omitted) | $140 | $132 | $163 | $164 | $148 | |||||||||||||||
| Class C | Year ended | |||||||||||||||||||
| 5/31/21 | 5/31/20 | 5/31/19 | 5/31/18 | 5/31/17 | ||||||||||||||||
Net asset value, beginning of period | $11.45 | $12.05 | $12.76 | $11.74 | $10.53 | |||||||||||||||
| Income (loss) from investment operations |
| |||||||||||||||||||
Net investment income (loss) (d) | $0.10 | $0.15 | $0.14 | $0.10 | $0.10 | |||||||||||||||
Net realized and unrealized gain (loss) | 4.81 | (0.58 | ) | (0.46 | ) | 1.23 | 1.14 | |||||||||||||
Total from investment operations | $4.91 | $(0.43 | ) | $(0.32 | ) | $1.33 | $1.24 | |||||||||||||
| Less distributions declared to shareholders |
| |||||||||||||||||||
From net investment income | $(0.14 | ) | $(0.17 | ) | $(0.08 | ) | $(0.02 | ) | $(0.03 | ) | ||||||||||
From net realized gain | — | — | (0.31 | ) | (0.29 | ) | — | |||||||||||||
Total distributions declared to shareholders | $(0.14 | ) | $(0.17 | ) | $(0.39 | ) | $(0.31 | ) | $(0.03 | ) | ||||||||||
Net asset value, end of period (x) | $16.22 | $11.45 | $12.05 | $12.76 | $11.74 | |||||||||||||||
Total return (%) (r)(s)(t)(x) | 43.08 | (3.76 | ) | (2.32 | ) | 11.33 | 11.81 | |||||||||||||
| Ratios (%) (to average net assets) and Supplemental data: |
| |||||||||||||||||||
Expenses before expense reductions (f) | 1.61 | 1.66 | 1.65 | 1.67 | 2.33 | |||||||||||||||
Expenses after expense reductions (f) | 1.49 | 1.49 | 1.49 | 1.49 | 1.49 | |||||||||||||||
Net investment income (loss) | 0.72 | 1.20 | 1.07 | 0.77 | 0.83 | |||||||||||||||
Portfolio turnover | 57 | 45 | 43 | 61 | 51 | |||||||||||||||
Net assets at end of period (000 omitted) | $873 | $456 | $470 | $539 | $586 | |||||||||||||||
See Notes to Financial Statements
22
Table of Contents
Financial Highlights – continued
| Class I | Year ended | |||||||||||||||||||
| 5/31/21 | 5/31/20 | 5/31/19 | 5/31/18 | 5/31/17 | ||||||||||||||||
Net asset value, beginning of period | $11.54 | $12.13 | $12.91 | $11.89 | $10.60 | |||||||||||||||
| Income (loss) from investment operations |
| |||||||||||||||||||
Net investment income (loss) (d) | $0.24 | $0.28 | $0.27 | $0.23 | $0.21 | |||||||||||||||
Net realized and unrealized gain (loss) | 4.84 | (0.58 | ) | (0.48 | ) | 1.24 | 1.16 | |||||||||||||
Total from investment operations | $5.08 | $(0.30 | ) | $(0.21 | ) | $1.47 | $1.37 | |||||||||||||
| Less distributions declared to shareholders |
| |||||||||||||||||||
From net investment income | $(0.25 | ) | $(0.29 | ) | $(0.26 | ) | $(0.16 | ) | $(0.08 | ) | ||||||||||
From net realized gain | — | — | (0.31 | ) | (0.29 | ) | — | |||||||||||||
Total distributions declared to shareholders | $(0.25 | ) | $(0.29 | ) | $(0.57 | ) | $(0.45 | ) | $(0.08 | ) | ||||||||||
Net asset value, end of period (x) | $16.37 | $11.54 | $12.13 | $12.91 | $11.89 | |||||||||||||||
Total return (%) (r)(s)(t)(x) | 44.51 | (2.84 | ) | (1.37 | ) | 12.40 | 12.96 | |||||||||||||
| Ratios (%) (to average net assets) and Supplemental data: |
| |||||||||||||||||||
Expenses before expense reductions (f) | 0.61 | 0.65 | 0.65 | 0.67 | 1.43 | |||||||||||||||
Expenses after expense reductions (f) | 0.49 | 0.49 | 0.49 | 0.49 | 0.49 | |||||||||||||||
Net investment income (loss) | 1.70 | 2.18 | 2.14 | 1.81 | 1.84 | |||||||||||||||
Portfolio turnover | 57 | 45 | 43 | 61 | 51 | |||||||||||||||
Net assets at end of period (000 omitted) | $1,517 | $488 | $923 | $822 | $533 | |||||||||||||||
| Class R1 | Year ended | |||||||||||||||||||
| 5/31/21 | 5/31/20 | 5/31/19 | 5/31/18 | 5/31/17 | ||||||||||||||||
Net asset value, beginning of period | $11.45 | $12.05 | $12.81 | $11.80 | $10.55 | |||||||||||||||
| Income (loss) from investment operations |
| |||||||||||||||||||
Net investment income (loss) (d) | $0.10 | $0.15 | $0.14 | $0.10 | $0.10 | |||||||||||||||
Net realized and unrealized gain (loss) | 4.80 | (0.58 | ) | (0.47 | ) | 1.24 | 1.15 | |||||||||||||
Total from investment operations | $4.90 | $(0.43 | ) | $(0.33 | ) | $1.34 | $1.25 | |||||||||||||
| Less distributions declared to shareholders |
| |||||||||||||||||||
From net investment income | $(0.13 | ) | $(0.17 | ) | $(0.12 | ) | $(0.04 | ) | $— | |||||||||||
From net realized gain | — | — | (0.31 | ) | (0.29 | ) | — | |||||||||||||
Total distributions declared to shareholders | $(0.13 | ) | $(0.17 | ) | $(0.43 | ) | $(0.33 | ) | $— | |||||||||||
Net asset value, end of period (x) | $16.22 | $11.45 | $12.05 | $12.81 | $11.80 | |||||||||||||||
Total return (%) (r)(s)(t)(x) | 43.07 | (3.79 | ) | (2.35 | ) | 11.37 | 11.85 | |||||||||||||
| Ratios (%) (to average net assets) and Supplemental data: |
| |||||||||||||||||||
Expenses before expense reductions (f) | 1.61 | 1.65 | 1.64 | 1.66 | 3.03 | |||||||||||||||
Expenses after expense reductions (f) | 1.49 | 1.49 | 1.49 | 1.49 | 1.49 | |||||||||||||||
Net investment income (loss) | 0.72 | 1.21 | 1.09 | 0.78 | 0.85 | |||||||||||||||
Portfolio turnover | 57 | 45 | 43 | 61 | 51 | |||||||||||||||
Net assets at end of period (000 omitted) | $89 | $62 | $65 | $66 | $59 | |||||||||||||||
See Notes to Financial Statements
23
Table of Contents
Financial Highlights – continued
| Class R2 | Year ended | |||||||||||||||||||
| 5/31/21 | 5/31/20 | 5/31/19 | 5/31/18 | 5/31/17 | ||||||||||||||||
Net asset value, beginning of period | $11.50 | $12.10 | $12.87 | $11.85 | $10.57 | |||||||||||||||
| Income (loss) from investment operations |
| |||||||||||||||||||
Net investment income (loss) (d) | $0.17 | $0.21 | $0.20 | $0.16 | $0.15 | |||||||||||||||
Net realized and unrealized gain (loss) | 4.83 | (0.57 | ) | (0.47 | ) | 1.25 | 1.16 | |||||||||||||
Total from investment operations | $5.00 | $(0.36 | ) | $(0.27 | ) | $1.41 | $1.31 | |||||||||||||
| Less distributions declared to shareholders |
| |||||||||||||||||||
From net investment income | $(0.19 | ) | $(0.24 | ) | $(0.19 | ) | $(0.10 | ) | $(0.03 | ) | ||||||||||
From net realized gain | — | — | (0.31 | ) | (0.29 | ) | — | |||||||||||||
Total distributions declared to shareholders | $(0.19 | ) | $(0.24 | ) | $(0.50 | ) | $(0.39 | ) | $(0.03 | ) | ||||||||||
Net asset value, end of period (x) | $16.31 | $11.50 | $12.10 | $12.87 | $11.85 | |||||||||||||||
Total return (%) (r)(s)(t)(x) | 43.83 | (3.31 | ) | (1.85 | ) | 11.93 | 12.38 | |||||||||||||
| Ratios (%) (to average net assets) and Supplemental data: |
| |||||||||||||||||||
Expenses before expense reductions (f) | 1.11 | 1.16 | 1.14 | 1.16 | 2.53 | |||||||||||||||
Expenses after expense reductions (f) | 0.99 | 0.99 | 0.99 | 0.99 | 0.99 | |||||||||||||||
Net investment income (loss) | 1.23 | 1.71 | 1.59 | 1.29 | 1.35 | |||||||||||||||
Portfolio turnover | 57 | 45 | 43 | 61 | 51 | |||||||||||||||
Net assets at end of period (000 omitted) | $104 | $77 | $78 | $69 | $60 | |||||||||||||||
| Class R3 | Year ended | |||||||||||||||||||
| 5/31/21 | 5/31/20 | 5/31/19 | 5/31/18 | 5/31/17 | ||||||||||||||||
Net asset value, beginning of period | $11.53 | $12.13 | $12.90 | $11.87 | $10.58 | |||||||||||||||
| Income (loss) from investment operations |
| |||||||||||||||||||
Net investment income (loss) (d) | $0.20 | $0.25 | $0.23 | $0.21 | $0.18 | |||||||||||||||
Net realized and unrealized gain (loss) | 4.85 | (0.58 | ) | (0.47 | ) | 1.24 | 1.16 | |||||||||||||
Total from investment operations | $5.05 | $(0.33 | ) | $(0.24 | ) | $1.45 | $1.34 | |||||||||||||
| Less distributions declared to shareholders |
| |||||||||||||||||||
From net investment income | $(0.22 | ) | $(0.27 | ) | $(0.22 | ) | $(0.13 | ) | $(0.05 | ) | ||||||||||
From net realized gain | — | — | (0.31 | ) | (0.29 | ) | — | |||||||||||||
Total distributions declared to shareholders | $(0.22 | ) | $(0.27 | ) | $(0.53 | ) | $(0.42 | ) | $(0.05 | ) | ||||||||||
Net asset value, end of period (x) | $16.36 | $11.53 | $12.13 | $12.90 | $11.87 | |||||||||||||||
Total return (%) (r)(s)(t)(x) | 44.17 | (3.09 | ) | (1.64 | ) | 12.24 | 12.72 | |||||||||||||
| Ratios (%) (to average net assets) and Supplemental data: |
| |||||||||||||||||||
Expenses before expense reductions (f) | 0.86 | 0.90 | 0.90 | 0.91 | 2.27 | |||||||||||||||
Expenses after expense reductions (f) | 0.74 | 0.74 | 0.74 | 0.74 | 0.74 | |||||||||||||||
Net investment income (loss) | 1.48 | 1.93 | 1.77 | 1.64 | 1.60 | |||||||||||||||
Portfolio turnover | 57 | 45 | 43 | 61 | 51 | |||||||||||||||
Net assets at end of period (000 omitted) | $103 | $71 | $122 | $187 | $60 | |||||||||||||||
See Notes to Financial Statements
24
Table of Contents
Financial Highlights – continued
| Class R4 | Year ended | |||||||||||||||||||
| 5/31/21 | 5/31/20 | 5/31/19 | 5/31/18 | 5/31/17 | ||||||||||||||||
Net asset value, beginning of period | $11.54 | $12.14 | $12.91 | $11.88 | $10.59 | |||||||||||||||
| Income (loss) from investment operations |
| |||||||||||||||||||
Net investment income (loss) (d) | $0.23 | $0.28 | $0.27 | $0.23 | $0.21 | |||||||||||||||
Net realized and unrealized gain (loss) | 4.85 | (0.58 | ) | (0.48 | ) | 1.25 | 1.16 | |||||||||||||
Total from investment operations | $5.08 | $(0.30 | ) | $(0.21 | ) | $1.48 | $1.37 | |||||||||||||
| Less distributions declared to shareholders |
| |||||||||||||||||||
From net investment income | $(0.25 | ) | $(0.30 | ) | $(0.25 | ) | $(0.16 | ) | $(0.08 | ) | ||||||||||
From net realized gain | — | — | (0.31 | ) | (0.29 | ) | — | |||||||||||||
Total distributions declared to shareholders | $(0.25 | ) | $(0.30 | ) | $(0.56 | ) | $(0.45 | ) | $(0.08 | ) | ||||||||||
Net asset value, end of period (x) | $16.37 | $11.54 | $12.14 | $12.91 | $11.88 | |||||||||||||||
Total return (%) (r)(s)(t)(x) | 44.52 | (2.86 | ) | (1.33 | ) | 12.49 | 12.96 | |||||||||||||
| Ratios (%) (to average net assets) and Supplemental data: |
| |||||||||||||||||||
Expenses before expense reductions (f) | 0.61 | 0.66 | 0.64 | 0.66 | 2.02 | |||||||||||||||
Expenses after expense reductions (f) | 0.49 | 0.49 | 0.49 | 0.49 | 0.49 | |||||||||||||||
Net investment income (loss) | 1.73 | 2.21 | 2.09 | 1.78 | 1.85 | |||||||||||||||
Portfolio turnover | 57 | 45 | 43 | 61 | 51 | |||||||||||||||
Net assets at end of period (000 omitted) | $94 | $65 | $67 | $68 | $60 | |||||||||||||||
| Class R6 | Year ended | |||||||||||||||||||
| 5/31/21 | 5/31/20 | 5/31/19 | 5/31/18 | 5/31/17 | ||||||||||||||||
Net asset value, beginning of period | $11.56 | $12.15 | $12.92 | $11.89 | $10.59 | |||||||||||||||
| Income (loss) from investment operations |
| |||||||||||||||||||
Net investment income (loss) (d) | $0.25 | $0.29 | $0.28 | $0.24 | $0.22 | |||||||||||||||
Net realized and unrealized gain (loss) | 4.85 | (0.57 | ) | (0.47 | ) | 1.25 | 1.16 | |||||||||||||
Total from investment operations | $5.10 | $(0.28 | ) | $(0.19 | ) | $1.49 | $1.38 | |||||||||||||
| Less distributions declared to shareholders |
| |||||||||||||||||||
From net investment income | $(0.27 | ) | $(0.31 | ) | $(0.27 | ) | $(0.17 | ) | $(0.08 | ) | ||||||||||
From net realized gain | — | — | (0.31 | ) | (0.29 | ) | — | |||||||||||||
Total distributions declared to shareholders | $(0.27 | ) | $(0.31 | ) | $(0.58 | ) | $(0.46 | ) | $(0.08 | ) | ||||||||||
Net asset value, end of period (x) | $16.39 | $11.56 | $12.15 | $12.92 | $11.89 | |||||||||||||||
Total return (%) (r)(s)(t)(x) | 44.57 | (2.69 | ) | (1.23 | ) | 12.55 | 13.08 | |||||||||||||
| Ratios (%) (to average net assets) and Supplemental data: |
| |||||||||||||||||||
Expenses before expense reductions (f) | 0.52 | 0.56 | 0.55 | 0.57 | 0.65 | |||||||||||||||
Expenses after expense reductions (f) | 0.40 | 0.39 | 0.39 | 0.39 | 0.45 | |||||||||||||||
Net investment income (loss) | 1.83 | 2.32 | 2.18 | 1.87 | 1.88 | |||||||||||||||
Portfolio turnover | 57 | 45 | 43 | 61 | 51 | |||||||||||||||
Net assets at end of period (000 omitted) | $190,875 | $140,463 | $121,952 | $120,575 | $115,619 | |||||||||||||||
See Notes to Financial Statements
25
Table of Contents
Financial Highlights – continued
| (d) | Per share data is based on average shares outstanding. |
| (f) | Ratios do not reflect reductions from fees paid indirectly, if applicable. |
| (r) | Certain expenses have been reduced without which performance would have been lower. |
| (s) | From time to time the fund may receive proceeds from litigation settlements, without which performance would be lower. |
| (t) | Total returns do not include any applicable sales charges. |
| (x) | The net asset values and total returns have been calculated on net assets which include adjustments made in accordance with U.S. generally accepted accounting principles required at period end for financial reporting purposes. |
See Notes to Financial Statements
26
Table of Contents
(1) Business and Organization
MFS Blended Research Value Equity Fund (the fund) is a diversified series of MFS Series Trust X (the trust). The trust is organized as a Massachusetts business trust and is registered under the Investment Company Act of 1940, as amended, as an open-end management investment company.
The fund is an investment company and accordingly follows the investment company accounting and reporting guidance of the Financial Accounting Standards Board (FASB) Accounting Standards Codification Topic 946 Financial Services – Investment Companies.
(2) Significant Accounting Policies
General – The preparation of financial statements in conformity with U.S. generally accepted accounting principles requires management to make estimates and assumptions that affect the reported amounts of assets and liabilities, and disclosure of contingent assets and liabilities at the date of the financial statements and the reported amounts of increases and decreases in net assets from operations during the reporting period. Actual results could differ from those estimates. In the preparation of these financial statements, management has evaluated subsequent events occurring after the date of the fund’s Statement of Assets and Liabilities through the date that the financial statements were issued.
In March 2020, the FASB issued Accounting Standards Update 2020-04, Reference Rate Reform (Topic 848) – Facilitation of the Effects of Reference Rate Reform on Financial Reporting (“ASU 2020-04”), which provides optional, temporary relief for certain reference rate-related contract modifications due to the planned discontinuation of the London Interbank Offered Rate (LIBOR) and other IBOR-based reference rates as of the end of 2021. In March 2021, the administrator for LIBOR announced the extension of the publication of the more commonly used U.S. dollar LIBOR settings to the end of June 2023. Management is still evaluating the impact of ASU 2020-04 on the fund’s accounting for investments, derivatives, debt and other contracts that will undergo reference rate-related modifications as a result of the reference rate reform.
Balance Sheet Offsetting – The fund’s accounting policy with respect to balance sheet offsetting is that, absent an event of default by the counterparty or a termination of the agreement, the International Swaps and Derivatives Association (ISDA) Master Agreement, or similar agreement, does not result in an offset of reported amounts of financial assets and financial liabilities in the Statement of Assets and Liabilities across transactions between the fund and the applicable counterparty. The fund’s right to setoff may be restricted or prohibited by the bankruptcy or insolvency laws of the particular jurisdiction to which a specific master netting agreement counterparty is subject. Balance sheet offsetting disclosures, to the extent applicable to the fund, have been included in the fund’s Significant Accounting Policies note under the captions for each of the fund’s in-scope financial instruments and transactions.
Investment Valuations – Equity securities, including restricted equity securities, are generally valued at the last sale or official closing price on their primary market or
27
Table of Contents
Notes to Financial Statements – continued
exchange as provided by a third-party pricing service. Equity securities, for which there were no sales reported that day, are generally valued at the last quoted daily bid quotation on their primary market or exchange as provided by a third-party pricing service. Short-term instruments with a maturity at issuance of 60 days or less may be valued at amortized cost, which approximates market value. Open-end investment companies are generally valued at net asset value per share. Securities and other assets generally valued on the basis of information from a third-party pricing service may also be valued at a broker/dealer bid quotation. In determining values, third-party pricing services can utilize both transaction data and market information such as yield, quality, coupon rate, maturity, type of issue, trading characteristics, and other market data. The values of foreign securities and other assets and liabilities expressed in foreign currencies are converted to U.S. dollars using the mean of bid and asked prices for rates provided by a third-party pricing service.
The Board of Trustees has delegated primary responsibility for determining or causing to be determined the value of the fund’s investments (including any fair valuation) to the adviser pursuant to valuation policies and procedures approved by the Board. If the adviser determines that reliable market quotations are not readily available, investments are valued at fair value as determined in good faith by the adviser in accordance with such procedures under the oversight of the Board of Trustees. Under the fund’s valuation policies and procedures, market quotations are not considered to be readily available for most types of debt instruments and floating rate loans and many types of derivatives. These investments are generally valued at fair value based on information from third-party pricing services. In addition, investments may be valued at fair value if the adviser determines that an investment’s value has been materially affected by events occurring after the close of the exchange or market on which the investment is principally traded (such as foreign exchange or market) and prior to the determination of the fund’s net asset value, or after the halt of trading of a specific security where trading does not resume prior to the close of the exchange or market on which the security is principally traded. Events that occur after foreign markets close (such as developments in foreign markets and significant movements in the U.S. markets) and prior to the determination of the fund’s net asset value may be deemed to have a material effect on the value of securities traded in foreign markets. Accordingly, the fund’s foreign equity securities may often be valued at fair value. The adviser generally relies on third-party pricing services or other information (such as the correlation with price movements of similar securities in the same or other markets; the type, cost and investment characteristics of the security; the business and financial condition of the issuer; and trading and other market data) to assist in determining whether to fair value and at what value to fair value an investment. The value of an investment for purposes of calculating the fund’s net asset value can differ depending on the source and method used to determine value. When fair valuation is used, the value of an investment used to determine the fund’s net asset value may differ from quoted or published prices for the same investment. There can be no assurance that the fund could obtain the fair value assigned to an investment if it were to sell the investment at the same time at which the fund determines its net asset value per share.
Various inputs are used in determining the value of the fund’s assets or liabilities. These inputs are categorized into three broad levels. In certain cases, the inputs used to
28
Table of Contents
Notes to Financial Statements – continued
measure fair value may fall into different levels of the fair value hierarchy. In such cases, an investment’s level within the fair value hierarchy is based on the lowest level of input that is significant to the fair value measurement. The fund’s assessment of the significance of a particular input to the fair value measurement in its entirety requires judgment, and considers factors specific to the investment. Level 1 includes unadjusted quoted prices in active markets for identical assets or liabilities. Level 2 includes other significant observable market-based inputs (including quoted prices for similar securities, interest rates, prepayment speed, and credit risk). Level 3 includes unobservable inputs, which may include the adviser’s own assumptions in determining the fair value of investments. The following is a summary of the levels used as of May 31, 2021 in valuing the fund’s assets or liabilities:
| Financial Instruments | Level 1 | Level 2 | Level 3 | Total | ||||||||||||
| Equity Securities | $260,155,835 | $— | $— | $260,155,835 | ||||||||||||
| Mutual Funds | 1,723,582 | — | — | 1,723,582 | ||||||||||||
| Total | $261,879,417 | $— | $— | $261,879,417 | ||||||||||||
For further information regarding security characteristics, see the Portfolio of Investments.
Security Loans – Under its Securities Lending Agency Agreement with the fund, State Street Bank and Trust Company, as lending agent, loans the securities of the fund to certain qualified institutions (the “Borrowers”) approved by the fund. Security loans can be terminated at the discretion of either the lending agent or the fund and the related securities must be returned within the earlier of the standard trade settlement period for such securities or within three business days. The loans are collateralized by cash and/or U.S. Treasury and federal agency obligations in an amount typically at least equal to the market value of the securities loaned. On loans collateralized by cash, the cash collateral is invested in a money market fund. The market value of the loaned securities is determined at the close of business of the fund and any additional required collateral is delivered to the fund on the next business day. The lending agent provides the fund with indemnification against Borrower default. In the event of Borrower default, the lending agent will, for the benefit of the fund, either purchase securities identical to those loaned or, when such purchase is commercially impracticable, pay the fund the market value of the loaned securities. In return, the lending agent assumes the fund’s rights to the related collateral. If the collateral value is less than the cost to purchase identical securities, the lending agent is responsible for the shortfall, but only to the extent that such shortfall is not due to a decline in collateral value resulting from collateral reinvestment for which the fund bears the risk of loss. A portion of the income generated upon investment of the collateral is remitted to the Borrowers, and the remainder is allocated between the fund and the lending agent. On loans collateralized by U.S. Treasury and/or federal agency obligations, a fee is received from the Borrower, and is allocated between the fund and the lending agent. Income from securities lending is separately reported in the Statement of Operations. The dividend and interest income earned on the securities loaned is accounted for in the same manner as other dividend and interest income. At May 31, 2021, there were no securities on loan or collateral outstanding.
Indemnifications – Under the fund’s organizational documents, its officers and Trustees may be indemnified against certain liabilities and expenses arising out of the
29
Table of Contents
Notes to Financial Statements – continued
performance of their duties to the fund. Additionally, in the normal course of business, the fund enters into agreements with service providers that may contain indemnification clauses. The fund’s maximum exposure under these agreements is unknown as this would involve future claims that may be made against the fund that have not yet occurred.
Investment Transactions and Income – Investment transactions are recorded on the trade date. Dividends received in cash are recorded on the ex-dividend date. Certain dividends from foreign securities will be recorded when the fund is informed of the dividend if such information is obtained subsequent to the ex-dividend date. Dividend payments received in additional securities are recorded on the ex-dividend date in an amount equal to the value of the security on such date.
The fund may receive proceeds from litigation settlements. Any proceeds received from litigation involving portfolio holdings are reflected in the Statement of Operations in realized gain/loss if the security has been disposed of by the fund or in unrealized gain/loss if the security is still held by the fund. Any other proceeds from litigation not related to portfolio holdings are reflected as other income in the Statement of Operations.
Tax Matters and Distributions – The fund intends to qualify as a regulated investment company, as defined under Subchapter M of the Internal Revenue Code, and to distribute all of its taxable income, including realized capital gains. As a result, no provision for federal income tax is required. The fund’s federal tax returns, when filed, will remain subject to examination by the Internal Revenue Service for a three year period. Management has analyzed the fund’s tax positions taken on federal and state tax returns for all open tax years and does not believe that there are any uncertain tax positions that require recognition of a tax liability. Foreign taxes, if any, have been accrued by the fund in the accompanying financial statements in accordance with the applicable foreign tax law. Foreign income taxes may be withheld by certain countries in which the fund invests. Additionally, capital gains realized by the fund on securities issued in or by certain foreign countries may be subject to capital gains tax imposed by those countries.
Distributions to shareholders are recorded on the ex-dividend date. Income and capital gain distributions are determined in accordance with income tax regulations, which may differ from U.S. generally accepted accounting principles. Certain capital accounts in the financial statements are periodically adjusted for permanent differences in order to reflect their tax character. These adjustments have no impact on net assets or net asset value per share. Temporary differences which arise from recognizing certain items of income, expense, gain or loss in different periods for financial statement and tax purposes will reverse at some time in the future.
Book/tax differences primarily relate to wash sale loss deferrals.
The tax character of distributions declared to shareholders for the last two fiscal years is as follows:
| Year ended 5/31/21 | Year ended 5/31/20 | |||||||
| Ordinary income (including any short-term capital gains) | $4,300,007 | $4,275,227 | ||||||
30
Table of Contents
Notes to Financial Statements – continued
The federal tax cost and the tax basis components of distributable earnings were as follows:
| As of 5/31/21 | ||||
| Cost of investments | $185,285,931 | |||
| Gross appreciation | 77,531,914 | |||
| Gross depreciation | (938,428 | ) | ||
| Net unrealized appreciation (depreciation) | $76,593,486 | |||
| Undistributed ordinary income | 3,593,567 | |||
| Undistributed long-term capital gain | 4,872,350 | |||
| Total distributable earnings (loss) | $85,059,403 | |||
Multiple Classes of Shares of Beneficial Interest – The fund offers multiple classes of shares, which differ in their respective distribution and service fees. The fund’s income, realized and unrealized gain (loss), and common expenses are allocated to shareholders based on the daily net assets of each class. Dividends are declared separately for each class. Differences in per share dividend rates are generally due to differences in separate class expenses. Class B and Class C shares will convert to Class A shares approximately eight years after purchase. The fund’s distributions declared to shareholders as reported in the Statements of Changes in Net Assets are presented by class as follows:
| Year ended 5/31/21 | Year ended 5/31/20 | |||||||
| Class A | $972,614 | $1,051,815 | ||||||
| Class B | 841 | 2,221 | ||||||
| Class C | 5,422 | 6,791 | ||||||
| Class I | 11,417 | 17,348 | ||||||
| Class R1 | 725 | 913 | ||||||
| Class R2 | 1,194 | 1,523 | ||||||
| Class R3 | 1,313 | 2,653 | ||||||
| Class R4 | 1,433 | 1,643 | ||||||
| Class R6 | 3,305,048 | 3,190,320 | ||||||
| Total | $4,300,007 | $4,275,227 | ||||||
(3) Transactions with Affiliates
Investment Adviser – The fund has an investment advisory agreement with MFS to provide overall investment management and related administrative services and facilities to the fund. The management fee is computed daily and paid monthly at the following annual rates based on the fund’s average daily net assets:
| Up to $1 billion | 0.40 | % | ||
| In excess of $1 billion and up to $2.5 billion | 0.375 | % | ||
| In excess of $2.5 billion | 0.35 | % |
MFS has agreed in writing to reduce its management fee by a specified amount if certain MFS mutual fund assets exceed thresholds agreed to by MFS and the fund’s Board of Trustees. For the year ended May 31, 2021, this management fee reduction
31
Table of Contents
Notes to Financial Statements – continued
amounted to $26,109, which is included in the reduction of total expenses in the Statement of Operations. The management fee incurred for the year ended May 31, 2021 was equivalent to an annual effective rate of 0.39% of the fund’s average daily net assets.
The investment adviser has agreed in writing to pay a portion of the fund’s total annual operating expenses, excluding interest, taxes, extraordinary expenses, brokerage and transaction costs, and investment-related expenses , such that total fund operating expenses do not exceed the following rates annually of each class’s average daily net assets:
| Classes | ||||||||||||||||||||||||||||||||
| A | B | C | I | R1 | R2 | R3 | R4 | R6 | ||||||||||||||||||||||||
| 0.74% | 1.49% | 1.49% | 0.49% | 1.49% | 0.99% | 0.74% | 0.49% | 0.45% | ||||||||||||||||||||||||
This written agreement will continue until modified by the fund’s Board of Trustees, but such agreement will continue at least until September 30, 2022. For the year ended May 31, 2021, this reduction amounted to $255,249, which is included in the reduction of total expenses in the Statement of Operations.
Distributor – MFS Fund Distributors, Inc. (MFD), a wholly-owned subsidiary of MFS, as distributor, received $7,312 for the year ended May 31, 2021, as its portion of the initial sales charge on sales of Class A shares of the fund.
The Board of Trustees has adopted a distribution plan for certain share classes pursuant to Rule 12b-1 of the Investment Company Act of 1940.
The fund’s distribution plan provides that the fund will pay MFD for services provided by MFD and financial intermediaries in connection with the distribution and servicing of certain share classes. One component of the plan is a distribution fee paid to MFD and another component of the plan is a service fee paid to MFD. MFD may subsequently pay all, or a portion, of the distribution and/or service fees to financial intermediaries.
Distribution Plan Fee Table:
| Distribution Fee Rate (d) | Service Fee Rate (d) | Total Distribution Plan (d) | Annual Effective Rate (e) | Distribution and Service Fee | ||||||||||||||||
| Class A | — | 0.25% | 0.25% | 0.25% | $145,617 | |||||||||||||||
| Class B | 0.75% | 0.25% | 1.00% | 1.00% | 1,182 | |||||||||||||||
| Class C | 0.75% | 0.25% | 1.00% | 1.00% | 5,442 | |||||||||||||||
| Class R1 | 0.75% | 0.25% | 1.00% | 1.00% | 729 | |||||||||||||||
| Class R2 | 0.25% | 0.25% | 0.50% | 0.50% | 432 | |||||||||||||||
| Class R3 | — | 0.25% | 0.25% | 0.25% | 207 | |||||||||||||||
| Total Distribution and Service Fees |
| $153,609 | ||||||||||||||||||
| (d) | In accordance with the distribution plan for certain classes, the fund pays distribution and/or service fees equal to these annual percentage rates of each class’s average daily net assets. The distribution and service fee rates disclosed by class represent the current rates in effect at the end of the reporting period. Any rate changes, if applicable, are detailed below. |
| (e) | The annual effective rates represent actual fees incurred under the distribution plan for the year ended May 31, 2021 based on each class’s average daily net assets. MFD has voluntarily agreed to rebate a portion of each class’s 0.25% service fee attributable to accounts for which there is no financial intermediary specified on the account except for accounts attributable to |
32
Table of Contents
Notes to Financial Statements – continued
| MFS or its affiliates’ seed money. For the year ended May 31, 2021, this rebate amounted to $1 for Class A and is included in the reduction of total expenses in the Statement of Operations. |
Certain Class A shares are subject to a contingent deferred sales charge (CDSC) in the event of a shareholder redemption within 18 months of purchase. Class B shares are subject to a CDSC in the event of a shareholder redemption within six years of purchase. Class C shares are subject to a CDSC in the event of a shareholder redemption within 12 months of purchase. All contingent deferred sales charges are paid to MFD and during the year ended May 31, 2021, were as follows:
| Amount | ||||
| Class A | $— | |||
| Class B | 133 | |||
| Class C | 9 | |||
Shareholder Servicing Agent – MFS Service Center, Inc. (MFSC), a wholly-owned subsidiary of MFS, receives a fee from the fund for its services as shareholder servicing agent calculated as a percentage of the average daily net assets of the fund as determined periodically under the supervision of the fund’s Board of Trustees. For the year ended May 31, 2021, the fee was $2,237, which equated to 0.0010% annually of the fund’s average daily net assets. MFSC also receives reimbursement from the fund for out-of-pocket expenses, sub-accounting and other shareholder servicing costs which may be paid to affiliated and unaffiliated service providers. Class R6 shares do not incur sub-accounting fees. For the year ended May 31, 2021, these out-of-pocket expenses, sub-accounting and other shareholder servicing costs amounted to $57,851.
Administrator – MFS provides certain financial, legal, shareholder communications, compliance, and other administrative services to the fund. Under an administrative services agreement, the fund reimburses MFS the costs incurred to provide these services. The fund is charged an annual fixed amount of $17,500 plus a fee based on average daily net assets. The administrative services fee incurred for the year ended May 31, 2021 was equivalent to an annual effective rate of 0.0177% of the fund’s average daily net assets.
Trustees’ and Officers’ Compensation – The fund pays compensation to independent Trustees in the form of a retainer, attendance fees, and additional compensation to Board and Committee chairpersons. The fund does not pay compensation directly to Trustees or officers of the fund who are also officers of the investment adviser, all of whom receive remuneration from MFS for their services to the fund. Certain officers and Trustees of the fund are officers or directors of MFS, MFD, and MFSC.
Other – The fund invests in the MFS Institutional Money Market Portfolio which is managed by MFS and seeks current income consistent with preservation of capital and liquidity. This money market fund does not pay a management fee to MFS but does incur investment and operating costs.
At May 31, 2021, MFS held approximately 52%, 88%, and 90% of the outstanding shares of Class B, Class R2, and Class R3, respectively, and 100% of the outstanding shares of Class R1 and Class R4.
The adviser has voluntarily undertaken to reimburse the fund from its own resources on a quarterly basis for the cost of investment research embedded in the cost of the fund’s
33
Table of Contents
Notes to Financial Statements – continued
securities trades. This agreement may be rescinded at any time. For the year ended May 31, 2021, this reimbursement amounted to $6,397, which is included in “Other” income in the Statement of Operations.
(4) Portfolio Securities
For the year ended May 31, 2021, purchases and sales of investments, other than short-term obligations, aggregated $128,184,606 and $141,506,521, respectively.
(5) Shares of Beneficial Interest
The fund’s Declaration of Trust permits the Trustees to issue an unlimited number of full and fractional shares of beneficial interest. Transactions in fund shares were as follows:
| Year ended 5/31/21 | Year ended 5/31/20 | |||||||||||||||
| Shares | Amount | Shares | Amount | |||||||||||||
| Shares sold | ||||||||||||||||
Class A | 1,322,883 | $17,975,724 | 2,522,641 | $30,373,323 | ||||||||||||
Class B | 1,018 | 15,213 | — | — | ||||||||||||
Class C | 23,867 | 356,130 | 6,473 | 76,714 | ||||||||||||
Class I | 65,408 | 970,362 | 14,917 | 158,176 | ||||||||||||
Class R2 | 117 | 1,575 | 173 | 2,155 | ||||||||||||
Class R3 | 281 | 3,814 | 229 | 2,735 | ||||||||||||
Class R6 | 3,214,544 | 38,703,960 | 3,156,025 | 36,841,779 | ||||||||||||
| 4,628,118 | $58,026,778 | 5,700,458 | $67,454,882 | |||||||||||||
| Shares issued to shareholders in reinvestment of distributions |
| |||||||||||||||
Class A | 4,089 | $55,002 | 4,802 | $65,063 | ||||||||||||
Class B | 62 | 841 | 163 | 2,221 | ||||||||||||
Class C | 403 | 5,422 | 501 | 6,791 | ||||||||||||
Class I | 845 | 11,417 | 1,275 | 17,348 | ||||||||||||
Class R1 | 53 | 725 | 68 | 913 | ||||||||||||
Class R2 | 89 | �� | 1,194 | 112 | 1,523 | |||||||||||
Class R3 | 97 | 1,313 | 195 | 2,653 | ||||||||||||
Class R4 | 106 | 1,433 | 121 | 1,643 | ||||||||||||
Class R6 | 244,456 | 3,305,048 | 234,238 | 3,190,320 | ||||||||||||
| 250,200 | $3,382,395 | 241,475 | $3,288,475 | |||||||||||||
| Shares reacquired | ||||||||||||||||
Class A | (1,704,774 | ) | $(22,813,664 | ) | (2,210,914 | ) | $(28,350,259 | ) | ||||||||
Class B | (3,961 | ) | (49,164 | ) | (2,191 | ) | (22,754 | ) | ||||||||
Class C | (10,290 | ) | (139,242 | ) | (6,099 | ) | (74,556 | ) | ||||||||
Class I | (15,792 | ) | (224,467 | ) | (50,013 | ) | (601,667 | ) | ||||||||
Class R2 | (487 | ) | (5,976 | ) | (1 | ) | (10 | ) | ||||||||
Class R3 | (171 | ) | (1,991 | ) | (4,348 | ) | (42,807 | ) | ||||||||
Class R6 | (3,968,363 | ) | (51,332,365 | ) | (1,271,527 | ) | (15,845,614 | ) | ||||||||
| (5,703,838 | ) | $(74,566,869 | ) | (3,545,093 | ) | $(44,937,667 | ) | |||||||||
34
Table of Contents
Notes to Financial Statements – continued
| Year ended 5/31/21 | Year ended 5/31/20 | |||||||||||||||
| Shares | Amount | Shares | Amount | |||||||||||||
| Net change | ||||||||||||||||
Class A | (377,802 | ) | $(4,782,938 | ) | 316,529 | $2,088,127 | ||||||||||
Class B | (2,881 | ) | (33,110 | ) | (2,028 | ) | (20,533 | ) | ||||||||
Class C | 13,980 | 222,310 | 875 | 8,949 | ||||||||||||
Class I | 50,461 | 757,312 | (33,821 | ) | (426,143 | ) | ||||||||||
Class R1 | 53 | 725 | 68 | 913 | ||||||||||||
Class R2 | (281 | ) | (3,207 | ) | 284 | 3,668 | ||||||||||
Class R3 | 207 | 3,136 | (3,924 | ) | (37,419 | ) | ||||||||||
Class R4 | 106 | 1,433 | 121 | 1,643 | ||||||||||||
Class R6 | (509,363 | ) | (9,323,357 | ) | 2,118,736 | 24,186,485 | ||||||||||
| (825,520 | ) | $(13,157,696 | ) | 2,396,840 | $25,805,690 | |||||||||||
Effective June 1, 2019, purchases of the fund’s Class B shares are closed to new and existing investors subject to certain exceptions. Please see the fund’s prospectus for details.
The fund is one of several mutual funds in which certain MFS funds may invest. The MFS funds do not invest in the underlying funds for the purpose of exercising management or control. At the end of the period, the MFS Lifetime 2040 Fund, the MFS Lifetime 2030 Fund, the MFS Lifetime 2035 Fund, the MFS Lifetime 2050 Fund, the MFS Lifetime 2045 Fund, the MFS Lifetime Income Fund, the MFS Lifetime 2025 Fund, the MFS Lifetime 2055 Fund, the MFS Lifetime 2020 Fund, and the MFS Lifetime 2060 Fund were the owners of record of approximately 14%, 12%, 10%, 8%, 8%, 6%, 5%, 5%, 3%, and 1%, respectively, of the value of outstanding voting shares of the fund.
(6) Line of Credit
The fund and certain other funds managed by MFS participate in a $1.25 billion unsecured committed line of credit of which $1 billion is reserved for use by the fund and certain other MFS U.S. funds. The line of credit is provided by a syndicate of banks under a credit agreement. Borrowings may be made for temporary financing needs. Interest is charged to each fund, based on its borrowings, generally at a rate equal to the highest of one month LIBOR, the Federal Funds Effective Rate and the Overnight Bank Funding Rate, plus an agreed upon spread. A commitment fee, based on the average daily, unused portion of the committed line of credit, is allocated among the participating funds. In addition, the fund and other funds managed by MFS have established unsecured uncommitted borrowing arrangements with certain banks for temporary financing needs. Interest is charged to each fund, based on its borrowings, at rates equal to customary reference rates plus an agreed upon spread. For the year ended May 31, 2021, the fund’s commitment fee and interest expense were $922 and $0, respectively, and are included in “Miscellaneous” expense in the Statement of Operations.
35
Table of Contents
Notes to Financial Statements – continued
(7) Investments in Affiliated Issuers
An affiliated issuer may be considered one in which the fund owns 5% or more of the outstanding voting securities, or a company which is under common control. For the purposes of this report, the following were affiliated issuers:
| Affiliated Issuers | Beginning Value | Purchases | Sales Proceeds | Realized Gain (Loss) | Change in Unrealized Appreciation or Depreciation | Ending Value | ||||||||||||||||||
| MFS Institutional Money Market Portfolio | $1,980,316 | $62,395,931 | $62,652,499 | $(166 | ) | $— | $1,723,582 | |||||||||||||||||
| Affiliated Issuers | Dividend Income | Capital Gain Distributions | ||||||||||||||||||||||
| MFS Institutional Money Market Portfolio |
| $1,601 | $— | |||||||||||||||||||||
(8) Impacts of COVID-19
The pandemic related to the global spread of novel coronavirus disease (COVID-19), which was first detected in December 2019, has resulted in significant disruptions to global business activity and the global economy, as well as the economies of individual countries, the financial performance of individual companies and sectors, and the securities and commodities markets in general. Multiple surges in cases globally, the availability and widespread adoption of vaccines, and the emergence of variant strains of the virus continue to create uncertainty as to the future and long-term impacts resulting from the pandemic including impacts to the prices and liquidity of the fund’s investments and the fund’s performance.
36
Table of Contents
REPORT OF INDEPENDENT REGISTERED PUBLIC ACCOUNTING FIRM
To the Board of Trustees of MFS Series Trust X and the Shareholders of
MFS Blended Research Value Equity Fund:
Opinion on the Financial Statements and Financial Highlights
We have audited the accompanying statement of assets and liabilities of MFS Blended Research Value Equity Fund (the “Fund”), including the portfolio of investments, as of May 31, 2021, the related statement of operations for the year then ended, the statements of changes in net assets for each of the two years in the period then ended, the financial highlights for each of the five years in the period then ended, and the related notes. In our opinion, the financial statements and financial highlights present fairly, in all material respects, the financial position of the Fund as of May 31, 2021, and the results of its operations for the year then ended, the changes in its net assets for each of the two years in the period then ended, and the financial highlights for each of the five years in the period then ended, in conformity with accounting principles generally accepted in the United States of America.
Basis for Opinion
These financial statements and financial highlights are the responsibility of the Fund’s management. Our responsibility is to express an opinion on the Fund’s financial statements and financial highlights based on our audits. We are a public accounting firm registered with the Public Company Accounting Oversight Board (United States) (PCAOB) and are required to be independent with respect to the Fund in accordance with the U.S. federal securities laws and the applicable rules and regulations of the Securities and Exchange Commission and the PCAOB.
We conducted our audits in accordance with the standards of the PCAOB. Those standards require that we plan and perform the audit to obtain reasonable assurance about whether the financial statements and financial highlights are free of material misstatement, whether due to error or fraud. The Fund is not required to have, nor were we engaged to perform, an audit of its internal control over financial reporting. As part of our audits we are required to obtain an understanding of internal control over financial reporting but not for the purpose of expressing an opinion on the effectiveness of the Fund’s internal control over financial reporting. Accordingly, we express no such opinion.
Our audits included performing procedures to assess the risks of material misstatement of the financial statements and financial highlights, whether due to error or fraud, and performing procedures that respond to those risks. Such procedures included examining, on a test basis, evidence regarding the amounts and disclosures in the financial statements and financial highlights. Our audits also included evaluating the accounting principles used and significant estimates made by management, as well as evaluating the overall presentation of the financial statements and financial highlights.
37
Table of Contents
Report of Independent Registered Public Accounting Firm – continued
Our procedures included confirmation of securities owned as of May 31, 2021, by
correspondence with the custodian. We believe that our audits provide a reasonable basis for our opinion.
DELOITTE & TOUCHE LLP
Boston, Massachusetts
July 16, 2021
We have served as the auditor of one or more of the MFS investment companies since 1924.
38
Table of Contents
TRUSTEES AND OFFICERS — IDENTIFICATION AND BACKGROUND
The Trustees and Officers of the Trust, as of July 1, 2021, are listed below, together with their principal occupations during the past five years. (Their titles may have varied during that period.) The address of each Trustee and Officer is 111 Huntington Avenue, Boston, Massachusetts 02199-7618.
Name, Age | Position(s) with Fund | Trustee/Officer Since (h) | Number of | Principal the Past Five Years | Other Directorships | |||||
| INTERESTED TRUSTEES | ||||||||||
| Robert J. Manning (k) (age 57) | Trustee | February 2004 | 135 | Massachusetts Financial Services Company, Non-Executive Chairman (since January 2021); Director; Chairman of the Board; Executive Chairman (January 2017-2020); Co-Chief Executive Officer (2015-2016) | N/A | |||||
Michael W. Roberge (k) (age 54) | Trustee | January 2021 | 135 | Massachusetts Financial Services Company, Chairman (since January 2021); Chief Executive Officer (since January 2017); Director; President (until December 2018); Chief Investment Officer (until December 2018); Co-Chief Executive Officer (until December 2016) | N/A | |||||
| INDEPENDENT TRUSTEES | ||||||||||
John P. Kavanaugh (age 66) | Trustee and Chair of Trustees | January 2009 | 135 | Private investor | N/A | |||||
Steven E. Buller (age 69) | Trustee | February 2014 | 135 | Private investor | N/A | |||||
John A. Caroselli (age 67) | Trustee | March 2017 | 135 | Private investor; JC Global Advisors, LLC (management consulting), President (since 2015) | N/A | |||||
39
Table of Contents
Trustees and Officers – continued
Name, Age | Position(s) with Fund | Trustee/Officer Since (h) | Number of | Principal the Past Five Years | Other Directorships | |||||
Maureen R. Goldfarb (age 66) | Trustee | January 2009 | 135 | Private investor | N/A | |||||
| Peter D. Jones (age 65) | Trustee | January 2019 | 135 | Private investor | N/A | |||||
| James W. Kilman, Jr. (age 60) | Trustee | January 2019 | 135 | Burford Capital Limited (finance and investment management), Senior Advisor (since May 3, 2021), Chief Financial Officer (2019-May 2, 2021); KielStrand Capital LLC (family office), Chief Executive Officer (since 2016); Morgan Stanley & Co. (financial services), Vice Chairman of Investment Banking, Co-Head of Diversified Financials Coverage – Financial Institutions Investment Banking Group (until 2016) | Alpha-En Corporation, Director (2016-2019) | |||||
Clarence Otis, Jr. (age 65) | Trustee | March 2017 | 135 | Private investor | VF Corporation, Director; Verizon Communications, Inc., Director; The Travelers Companies, Director | |||||
Maryanne L. Roepke (age 65) | Trustee | May 2014 | 135 | Private investor | N/A | |||||
| Laurie J. Thomsen (age 63) | Trustee | March 2005 | 135 | Private investor | The Travelers Companies, Director; Dycom Industries, Inc., Director | |||||
40
Table of Contents
Trustees and Officers – continued
Name, Age | Position(s) Held with Fund | Trustee/Officer Since (h) | Number of | Principal the Past Five Years | ||||
| OFFICERS | ||||||||
| Christopher R. Bohane (k) (age 47) | Assistant Secretary and Assistant Clerk | July 2005 | 135 | Massachusetts Financial Services Company, Senior Vice President and Associate General Counsel | ||||
Kino Clark (k) (age 53) | Assistant Treasurer | January 2012 | 135 | Massachusetts Financial Services Company, Vice President | ||||
John W. Clark, Jr. (k) (age 54) | Assistant Treasurer | April 2017 | 135 | Massachusetts Financial Services Company, Vice President (since March 2017); Deutsche Bank (financial services), Department Head – Treasurer’s Office (until February 2017) | ||||
Thomas H. Connors (k) (age 61) | Assistant Secretary and Assistant Clerk | September 2012 | 135 | Massachusetts Financial Services Company, Vice President and Senior Counsel | ||||
| David L. DiLorenzo (k) (age 52) | President | July 2005 | 135 | Massachusetts Financial Services Company, Senior Vice President | ||||
Heidi W. Hardin (k) (age 53) | Secretary and Clerk | April 2017 | 135 | Massachusetts Financial Services Company, Executive Vice President and General Counsel (since March 2017); Harris Associates (investment management), General Counsel (until January 2017) | ||||
Brian E. Langenfeld (k) (age 48) | Assistant Secretary and Assistant Clerk | June 2006 | 135 | Massachusetts Financial Services Company, Vice President and Senior Counsel | ||||
Amanda S. Mooradian (k) (age 42) | Assistant Secretary and Assistant Clerk | September 2018 | 135 | Massachusetts Financial Services Company, Assistant Vice President and Senior Counsel | ||||
| Susan A. Pereira (k) (age 50) | Assistant Secretary and Assistant Clerk | July 2005 | 135 | Massachusetts Financial Services Company, Vice President and Assistant General Counsel | ||||
Kasey L. Phillips (k) (age 50) | Assistant Treasurer | September 2012 | 135 | Massachusetts Financial Services Company, Vice President | ||||
41
Table of Contents
Trustees and Officers – continued
Name, Age | Position(s) Held with Fund | Trustee/Officer Since (h) | Number of | Principal the Past Five Years | ||||
Matthew A. Stowe (k) (age 46) | Assistant Secretary and Assistant Clerk | October 2014 | 135 | Massachusetts Financial Services Company, Vice President and Assistant General Counsel | ||||
Martin J. Wolin (k) (age 53) | Chief Compliance Officer | July 2015 | 135 | Massachusetts Financial Services Company, Senior Vice President and Chief Compliance Officer | ||||
| James O. Yost (k) (age 61) | Treasurer | September 1990 | 135 | Massachusetts Financial Services Company, Senior Vice President | ||||
| (h) | Date first appointed to serve as Trustee/Officer of an MFS Fund. Each Trustee has served continuously since appointment unless indicated otherwise. For the period from December 15, 2004 until February 22, 2005, Mr. Manning served as Advisory Trustee. From January 2012 through December 2016, Messrs. DiLorenzo and Yost served as Treasurer and Deputy Treasurer of the Funds, respectively. |
| (j) | Directorships or trusteeships of companies required to report to the Securities and Exchange Commission (i.e., “public companies”). |
| (k) | “Interested person” of the Trust within the meaning of the Investment Company Act of 1940 (referred to as the 1940 Act), which is the principal federal law governing investment companies like the fund, as a result of a position with MFS. The address of MFS is 111 Huntington Avenue, Boston, Massachusetts 02199-7618. |
Each Trustee (other than Messrs. Jones, Kilman and Roberge) has been elected by shareholders and each Trustee and Officer holds office until his or her successor is chosen and qualified or until his or her earlier death, resignation, retirement or removal. Mr. Roberge became a Trustee of the Funds on January 1, 2021 and Messrs. Jones and Kilman became Trustees of the Funds on January 1, 2019. The Trust does not hold annual meetings for the purpose of electing Trustees, and Trustees are not elected for fixed terms. Under the terms of the Board’s retirement policy, an Independent Trustee shall retire at the end of the calendar year in which he or she reaches the earlier of 75 years of age or 15 years of service on the Board (or, in the case of any Independent Trustee who joined the Board prior to 2015, 20 years of service on the Board).
Messrs. Buller, Kilman and Otis and Ms. Roepke are members of the Trust’s Audit Committee.
Each of the Interested Trustees and certain Officers hold comparable officer positions with certain affiliates of MFS.
42
Table of Contents
Trustees and Officers – continued
The Statement of Additional Information for a Fund includes further information about the Trustees and is available without charge upon request by calling 1-800-225-2606.
| Investment Adviser | Custodian | |
Massachusetts Financial Services Company Boston, MA 02199-7618 | State Street Bank and Trust Company 1 Lincoln Street Boston, MA 02111-2900 | |
| Distributor | Independent Registered Public Accounting Firm | |
MFS Fund Distributors, Inc. Boston, MA 02199-7618 | Deloitte & Touche LLP 200 Berkeley Street Boston, MA 02116 | |
| Portfolio Manager(s) | ||
Jim Fallon Matt Krummell Jonathan Sage Jed Stocks |
43
Table of Contents
STATEMENT REGARDING LIQUIDITY RISK MANAGEMENT PROGRAM
The fund has adopted and implemented a liquidity risk management program (the “Program”) as required by Rule 22e-4 under the Investment Company Act of 1940, as amended. The fund’s Board of Trustees (the “Board”) has designated MFS as the administrator of the Program. The Program is reasonably designed to assess and manage the liquidity risk of the fund. Liquidity risk is the risk that the fund could not meet requests to redeem shares issued by the fund without significant dilution of remaining investors’ interests.
MFS provided a written report to the Board for consideration at its April 2021 meeting that addressed the operation of the Program and provided an assessment of the adequacy and effectiveness of the Program during the period from January 1, 2020 to December 31, 2020 (the “Covered Period”). The report concluded that during the Covered Period the Program had operated effectively and had adequately and effectively been implemented to assess and manage the fund’s liquidity risk. MFS also reported that there were no liquidity events that impacted the fund or its ability to timely meet redemptions without dilution to existing shareholders during the Covered Period.
There can be no assurance that the Program will achieve its objectives in the future. Further information on liquidity risk, and other principal risks to which an investment in the fund may be subject, can be found in the prospectus.
44
Table of Contents
PROXY VOTING POLICIES AND INFORMATION
MFS votes proxies on behalf of the fund pursuant to proxy voting policies and procedures that are available without charge, upon request, by calling 1-800-225-2606, by visiting mfs.com/proxyvoting, or by visiting the SEC Web site at http://www.sec.gov.
Information regarding how the fund voted proxies relating to portfolio securities during the most recent twelve-month period ended June 30 is available by August 31 of each year without charge by visiting mfs.com/proxyvoting, or by visiting the SEC’s Web site at http://www.sec.gov.
QUARTERLY PORTFOLIO DISCLOSURE
The fund files a complete schedule of portfolio holdings with the SEC for the first and third quarters of each fiscal year as an exhibit to its reports on Form N-PORT. The fund’s Form N-PORT reports are available on the SEC’s Web site at http://www.sec.gov. A shareholder can obtain the portfolio holdings report for the first and third quarters of the fund’s fiscal year at mfs.com/openendfunds by choosing the fund’s name and then scrolling to the “Resources” section and clicking on the “Prospectus and Reports” tab.
From time to time, MFS may post important information about the fund or the MFS Funds on the MFS Web site (mfs.com). This information is available at https://www.mfs.com/announcements or at mfs.com/openendfunds by choosing the fund’s name and then scrolling to the “Resources” section and clicking on the “Announcements” tab, if any.
INFORMATION ABOUT FUND CONTRACTS AND LEGAL CLAIMS
The fund has entered into contractual arrangements with an investment adviser, administrator, distributor, shareholder servicing agent, 529 program manager (if applicable), and custodian who each provide services to the fund. Unless expressly stated otherwise, shareholders are not parties to, or intended beneficiaries of these contractual arrangements, and these contractual arrangements are not intended to create any shareholder right to enforce them against the service providers or to seek any remedy under them against the service providers, either directly or on behalf of the fund.
Under the Trust’s By-Laws and Declaration of Trust, any claims asserted against or on behalf of the MFS Funds, including claims against Trustees and Officers, must be brought in state and federal courts located within the Commonwealth of Massachusetts.
FEDERAL TAX INFORMATION (unaudited)
The fund will notify shareholders of amounts for use in preparing 2021 income tax forms in January 2022. The following information is provided pursuant to provisions of the Internal Revenue Code.
The fund designates the maximum amount allowable as qualified dividend income eligible to be taxed at the same rate as long-term capital gain.
The fund designates $82,094 as capital gain dividends paid during the fiscal year.
For corporate shareholders, 77.48% of the ordinary income dividends paid during the fiscal year qualify for the corporate dividends received deduction.
The fund designates the maximum amount allowable as Section 199A dividends as defined in Proposed Treasury Regulation §1.199A-3(d).
45
Table of Contents
rev. 3/16
| WHAT DOES MFS DO WITH YOUR PERSONAL INFORMATION? |  | ||
| Why? | Financial companies choose how they share your personal information. Federal law gives consumers the right to limit some but not all sharing. Federal law also requires us to tell you how we collect, share, and protect your personal information. Please read this notice carefully to understand what we do. |
| What? | The types of personal information we collect and share depend on the product or service you have with us. This information can include:
• Social Security number and account balances • Account transactions and transaction history • Checking account information and wire transfer instructions
When you are no longer our customer, we continue to share your information as described in this notice. |
| How? | All financial companies need to share customers’ personal information to run their everyday business. In the section below, we list the reasons financial companies can share their customers’ personal information; the reasons MFS chooses to share; and whether you can limit this sharing. |
| Reasons we can share your personal information | Does MFS share? | Can you limit this sharing? | ||
For our everyday business purposes – such as to process your transactions, maintain your account(s), respond to court orders and legal investigations, or report to credit bureaus | Yes | No | ||
For our marketing purposes – to offer our products and services to you | No | We don’t share | ||
For joint marketing with other financial companies | No | We don’t share | ||
For our affiliates’ everyday business purposes – information about your transactions and experiences | No | We don’t share | ||
For our affiliates’ everyday business purposes – information about your creditworthiness | No | We don’t share | ||
| For nonaffiliates to market to you | No | We don’t share |
| Questions? | Call 800-225-2606 or go to mfs.com. | |
46
Table of Contents
| Page 2 |
| Who we are | ||
| Who is providing this notice? | MFS Funds, MFS Investment Management, MFS Institutional Advisors, Inc., and MFS Heritage Trust Company. | |
| What we do | ||
| How does MFS protect my personal information? | To protect your personal information from unauthorized access and use, we use security measures that comply with federal law. These measures include procedural, electronic, and physical safeguards for the protection of the personal information we collect about you. | |
| How does MFS collect my personal information? | We collect your personal information, for example, when you
• open an account or provide account information • direct us to buy securities or direct us to sell your securities • make a wire transfer
We also collect your personal information from others, such as credit bureaus, affiliates, or other companies. | |
| Why can’t I limit all sharing? | Federal law gives you the right to limit only
• sharing for affiliates’ everyday business purposes – information about your creditworthiness • affiliates from using your information to market to you • sharing for nonaffiliates to market to you
State laws and individual companies may give you additional rights to limit sharing. | |
| Definitions | ||
| Affiliates | Companies related by common ownership or control. They can be financial and nonfinancial companies.
• MFS does not share personal information with affiliates, except for everyday business purposes as described on page one of this notice. | |
| Nonaffiliates | Companies not related by common ownership or control. They can be financial and nonfinancial companies.
• MFS does not share with nonaffiliates so they can market to you. | |
| Joint marketing | A formal agreement between nonaffiliated financial companies that together market financial products or services to you.
• MFS doesn’t jointly market. | |
| Other important information | ||
| If you own an MFS product or receive an MFS service in the name of a third party such as a bank or broker-dealer, their privacy policy may apply to you instead of ours. | ||
47
Table of Contents
Save paper with eDelivery.
| MFS® will send you prospectuses, |

reports, and proxies directly via e-mail so you will get information faster with less mailbox clutter.
To sign up:
1. Go to mfs.com.
2. Log in via MFS® Access.
3. Select eDelivery.
If you own your MFS fund shares through a financial institution or a retirement plan, MFS® TALK, MFS® Access, or eDelivery may not be available to you.
CONTACT
WEB SITE
mfs.com
MFS TALK
1-800-637-8255
24 hours a day
ACCOUNT SERVICE AND LITERATURE
Shareholders
1-800-225-2606
Financial advisors
1-800-343-2829
Retirement plan services
1-800-637-1255
MAILING ADDRESS
MFS Service Center, Inc.
P.O. Box 219341
Kansas City, MO 64121-9341
OVERNIGHT MAIL
MFS Service Center, Inc.
Suite 219341
430 W 7th Street
Kansas City, MO 64105-1407
Table of Contents

Mid Cap Equity Fund

Table of Contents
Table of Contents
Mid Cap Equity Fund
| 1 | |
| 2 | |
| 3 | |
| 5 | |
| 8 | |
| 10 | |
| 17 | |
| 19 | |
| 20 | |
| 21 | |
| 30 | |
| 41 | |
| 43 | |
| 48 | |
| 49 | |
| 49 | |
| 49 | |
| 49 | |
| 49 | |
| 51 |
| back cover |
Table of Contents
Table of Contents


Table of Contents
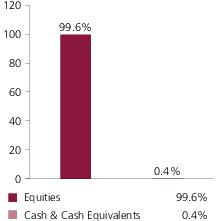
| Quanta Services, Inc. | 1.7% |
| IDEXX Laboratories, Inc. | 1.6% |
| Brunswick Corp. | 1.6% |
| CrowdStrike Holdings, Inc. | 1.6% |
| McKesson Corp. | 1.6% |
| Cadence Design Systems, Inc. | 1.6% |
| EPAM Systems, Inc. | 1.5% |
| Avantor, Inc. | 1.5% |
| Charles River Laboratories International, Inc. | 1.5% |
| Regal Beloit Corp. | 1.5% |
| Information Technology | 16.9% |
| Industrials | 16.6% |
| Health Care | 13.5% |
| Consumer Discretionary | 12.7% |
| Financials | 11.0% |
| Real Estate | 7.8% |
| Utilities | 5.9% |
| Materials | 4.9% |
| Communication Services | 4.5% |
| Energy | 3.2% |
| Consumer Staples | 2.6% |
| (g) | The Global Industry Classification Standard (GICS®) was developed by and/or is the exclusive property of MSCI, Inc. and S&P Global Market Intelligence Inc. (“S&P Global Market Intelligence”). GICS is a service mark of MSCI and S&P Global Market Intelligence and has been licensed for use by MFS. MFS has applied its own internal sector/industry classification methodology for equity securities and non-equity securities that are unclassified by GICS. |
Table of Contents
Table of Contents
| (b) | Security is not a benchmark constituent. |
| (h) | Security was not held in the portfolio at period end. |
Table of Contents

Table of Contents
| Share Class | Class Inception Date | 1-yr | Life (t) |
| A | 8/19/16 | 44.61% | 13.23% |
| B | 8/19/16 | 43.56% | 12.38% |
| C | 8/19/16 | 43.49% | 12.37% |
| I | 8/19/16 | 44.98% | 13.50% |
| R1 | 8/19/16 | 43.45% | 12.37% |
| R2 | 8/19/16 | 44.24% | 12.93% |
| R3 | 8/19/16 | 44.60% | 13.23% |
| R4 | 8/19/16 | 44.95% | 13.50% |
| R6 | 8/19/16 | 45.02% | 13.58% |
| Russell Midcap® Index (f) | 50.29% | 14.86% |
| A With Initial Sales Charge (5.75%) | 36.29% | 11.84% |
| B With CDSC (Declining over six years from 4% to 0%) (v) | 39.56% | 12.11% |
| C With CDSC (1% for 12 months) (v) | 42.49% | 12.37% |
| (f) | Source: FactSet Research Systems Inc. |
| (t) | For the period from the class inception date through the stated period end. (See Notes to Performance Summary.) |
| (v) | Assuming redemption at the end of the applicable period. |
| (h) | Frank Russell Company (“Russell”) is the source and owner of the trademarks, service marks, and copyrights related to the Russell Indexes. Russell® is a trademark of Frank Russell Company. Neither Russell nor its licensors accept any liability for any errors or omissions in the Russell Indexes and/or Russell ratings or underlying data and no party may rely on any Russell |
Table of Contents
Table of Contents
December 1, 2020 through May 31, 2021
Table of Contents
| Share Class | Annualized Expense Ratio | Beginning Account Value 12/01/20 | Ending Account Value 5/31/21 | Expenses Paid During Period (p) 12/01/20-5/31/21 | |
| A | Actual | 0.84% | $1,000.00 | $1,221.24 | $4.65 |
| Hypothetical (h) | 0.84% | $1,000.00 | $1,020.74 | $4.23 | |
| B | Actual | 1.59% | $1,000.00 | $1,217.13 | $8.79 |
| Hypothetical (h) | 1.59% | $1,000.00 | $1,017.00 | $8.00 | |
| C | Actual | 1.59% | $1,000.00 | $1,215.51 | $8.78 |
| Hypothetical (h) | 1.59% | $1,000.00 | $1,017.00 | $8.00 | |
| I | Actual | 0.59% | $1,000.00 | $1,222.61 | $3.27 |
| Hypothetical (h) | 0.59% | $1,000.00 | $1,021.99 | $2.97 | |
| R1 | Actual | 1.59% | $1,000.00 | $1,216.38 | $8.79 |
| Hypothetical (h) | 1.59% | $1,000.00 | $1,017.00 | $8.00 | |
| R2 | Actual | 1.09% | $1,000.00 | $1,219.10 | $6.03 |
| Hypothetical (h) | 1.09% | $1,000.00 | $1,019.50 | $5.49 | |
| R3 | Actual | 0.81% | $1,000.00 | $1,220.35 | $4.48 |
| Hypothetical (h) | 0.81% | $1,000.00 | $1,020.89 | $4.08 | |
| R4 | Actual | 0.59% | $1,000.00 | $1,221.56 | $3.27 |
| Hypothetical (h) | 0.59% | $1,000.00 | $1,021.99 | $2.97 | |
| R6 | Actual | 0.51% | $1,000.00 | $1,222.40 | $2.83 |
| Hypothetical (h) | 0.51% | $1,000.00 | $1,022.39 | $2.57 |
| (h) | 5% class return per year before expenses. |
| (p) | “Expenses Paid During Period” are equal to each class’s annualized expense ratio, as shown above, multiplied by the average account value over the period, multiplied by 182/365 (to reflect the one-half year period). Expenses paid do not include any applicable sales charges (loads). If these transaction costs had been included, your costs would have been higher. |
Table of Contents
| Issuer | Shares/Par | Value ($) | ||
| Common Stocks – 99.6% | ||||
| Aerospace & Defense – 1.7% | ||||
| CACI International, Inc., “A” (a) | 13,496 | $ 3,440,940 | ||
| Huntington Ingalls Industries, Inc. | 20,507 | 4,433,819 | ||
| $7,874,759 | ||||
| Apparel Manufacturers – 0.3% | ||||
| PVH Corp. (a) | 9,876 | $ 1,133,962 | ||
| Automotive – 2.1% | ||||
| Adient PLC (a) | 29,524 | $ 1,477,971 | ||
| Lear Corp. | 32,535 | 6,290,968 | ||
| LKQ Corp. (a) | 31,697 | 1,615,279 | ||
| $9,384,218 | ||||
| Biotechnology – 1.0% | ||||
| Incyte Corp. (a) | 55,474 | $ 4,647,612 | ||
| Broadcasting – 1.1% | ||||
| Discovery Communications, Inc., “A” (a) | 16,668 | $ 535,210 | ||
| Discovery Communications, Inc., “C” (a) | 91,949 | 2,763,067 | ||
| Trade Desk, Inc. (a) | 3,021 | 1,776,771 | ||
| $5,075,048 | ||||
| Brokerage & Asset Managers – 0.9% | ||||
| Evercore Partners, Inc. | 23,965 | $ 3,495,535 | ||
| Jefferies Financial Group, Inc. | 19,693 | 632,736 | ||
| $4,128,271 | ||||
| Business Services – 3.4% | ||||
| Amdocs Ltd. | 50,259 | $ 3,925,228 | ||
| CBRE Group, Inc., “A” (a) | 40,552 | 3,559,654 | ||
| CoStar Group, Inc. (a) | 908 | 775,432 | ||
| Dropbox, Inc. (a) | 76,977 | 2,105,321 | ||
| Etsy, Inc. (a) | 14,655 | 2,414,118 | ||
| Fiserv, Inc. (a) | 11,289 | 1,300,493 | ||
| Verisk Analytics, Inc., “A” | 8,570 | 1,481,153 | ||
| $15,561,399 | ||||
| Cable TV – 0.8% | ||||
| Altice USA, Inc., “A” (a) | 60,227 | $ 2,171,786 | ||
| Cable One, Inc. | 879 | 1,595,877 | ||
| $3,767,663 | ||||
Table of Contents
| Issuer | Shares/Par | Value ($) | ||
| Common Stocks – continued | ||||
| Chemicals – 1.6% | ||||
| Celanese Corp. | 4,004 | $ 662,462 | ||
| Eastman Chemical Co. | 51,769 | 6,491,832 | ||
| $7,154,294 | ||||
| Computer Software – 5.9% | ||||
| ACI Worldwide, Inc. (a) | 18,721 | $ 716,265 | ||
| Altair Engineering, Inc., “A” (a) | 6,294 | 424,027 | ||
| Atlassian Corp. PLC, “A” (a) | 4,716 | 1,100,148 | ||
| Cadence Design Systems, Inc. (a) | 55,850 | 7,092,392 | ||
| CrowdStrike Holdings, Inc. (a) | 32,610 | 7,244,312 | ||
| DocuSign, Inc. (a) | 31,862 | 6,424,016 | ||
| Okta, Inc. (a) | 8,237 | 1,832,238 | ||
| Paylocity Holding Corp. (a) | 9,425 | 1,600,648 | ||
| $26,434,046 | ||||
| Computer Software - Systems – 7.8% | ||||
| EPAM Systems, Inc. (a) | 14,412 | $ 6,883,171 | ||
| Hewlett Packard Enterprise | 120,243 | 1,919,078 | ||
| HP, Inc. | 97,769 | 2,857,788 | ||
| Juniper Networks, Inc. | 43,714 | 1,150,990 | ||
| ServiceNow, Inc. (a) | 9,459 | 4,482,431 | ||
| SS&C Technologies Holdings, Inc. | 69,736 | 5,151,398 | ||
| TransUnion | 45,828 | 4,903,596 | ||
| Western Digital Corp. (a) | 28,365 | 2,133,899 | ||
| Zebra Technologies Corp., “A” (a) | 11,062 | 5,498,367 | ||
| $34,980,718 | ||||
| Construction – 3.3% | ||||
| D.R. Horton, Inc. | 39,451 | $ 3,759,286 | ||
| Eagle Materials, Inc. | 15,617 | 2,291,951 | ||
| Pulte Homes, Inc. | 48,297 | 2,791,083 | ||
| Stanley Black & Decker, Inc. | 20,626 | 4,471,717 | ||
| Taylor Morrison Home Corp. (a) | 51,895 | 1,537,130 | ||
| $14,851,167 | ||||
| Consumer Products – 0.6% | ||||
| Energizer Holdings, Inc. | 31,473 | $ 1,449,017 | ||
| Newell Brands, Inc. | 41,545 | 1,191,926 | ||
| $2,640,943 | ||||
| Consumer Services – 0.8% | ||||
| Grand Canyon Education, Inc. (a) | 8,142 | $ 740,433 | ||
| Robert Half International, Inc. | 29,840 | 2,649,494 | ||
| $3,389,927 | ||||
Table of Contents
| Issuer | Shares/Par | Value ($) | ||
| Common Stocks – continued | ||||
| Containers – 1.5% | ||||
| Graphic Packaging Holding Co. | 312,851 | $ 5,531,205 | ||
| Pactiv Evergreen, Inc. | 78,852 | 1,170,164 | ||
| $6,701,369 | ||||
| Electrical Equipment – 2.0% | ||||
| Advanced Drainage Systems, Inc. | 10,292 | $ 1,167,319 | ||
| AMETEK, Inc. | 17,882 | 2,415,858 | ||
| Fortive Corp. | 22,704 | 1,646,494 | ||
| Johnson Controls International PLC | 8,906 | 592,605 | ||
| Sensata Technologies Holding PLC (a) | 53,401 | 3,173,622 | ||
| $8,995,898 | ||||
| Electronics – 2.2% | ||||
| Advanced Energy Industries, Inc. | 2,430 | $ 247,884 | ||
| Amkor Technology, Inc. | 39,929 | 842,502 | ||
| Cirrus Logic, Inc. (a) | 33,923 | 2,648,369 | ||
| Lam Research Corp. | 6,882 | 4,472,268 | ||
| Silicon Laboratories, Inc. (a) | 2,417 | 330,065 | ||
| Skyworks Solutions, Inc. | 8,118 | 1,380,060 | ||
| $9,921,148 | ||||
| Energy - Independent – 0.5% | ||||
| Diamondback Energy, Inc. | 30,207 | $ 2,418,675 | ||
| Engineering - Construction – 1.7% | ||||
| APi Group, Inc. (a) | 13,177 | $ 278,694 | ||
| Quanta Services, Inc. | 78,070 | 7,443,974 | ||
| $7,722,668 | ||||
| Entertainment – 0.2% | ||||
| Spotify Technology S.A. (a) | 3,223 | $ 778,580 | ||
| Food & Beverages – 1.6% | ||||
| J.M. Smucker Co. | 32,893 | $ 4,384,308 | ||
| Tyson Foods, Inc., “A” | 37,006 | 2,941,977 | ||
| $7,326,285 | ||||
| Food & Drug Stores – 0.6% | ||||
| Albertsons Cos., Inc., “A” | 144,939 | $ 2,781,379 | ||
| Forest & Paper Products – 0.8% | ||||
| Weyerhaeuser Co., REIT | 89,573 | $ 3,400,191 | ||
Table of Contents
| Issuer | Shares/Par | Value ($) | ||
| Common Stocks – continued | ||||
| Gaming & Lodging – 1.3% | ||||
| Marriott International, Inc., “A” (a) | 20,276 | $ 2,911,228 | ||
| Penn National Gaming, Inc. (a) | 34,146 | 2,798,948 | ||
| $5,710,176 | ||||
| General Merchandise – 0.6% | ||||
| Dollar General Corp. | 13,410 | $ 2,721,694 | ||
| Insurance – 3.2% | ||||
| CNO Financial Group, Inc. | 88,645 | $ 2,354,411 | ||
| Equitable Holdings, Inc. | 113,979 | 3,618,833 | ||
| Everest Re Group Ltd. | 17,359 | 4,512,646 | ||
| Reinsurance Group of America, Inc. | 29,858 | 3,763,004 | ||
| $14,248,894 | ||||
| Internet – 0.2% | ||||
| GoDaddy, Inc. (a) | 6,727 | $ 544,618 | ||
| Pinterest, Inc. (a) | 5,044 | 329,373 | ||
| Roku, Inc. (a) | 577 | 200,052 | ||
| $1,074,043 | ||||
| Leisure & Toys – 4.8% | ||||
| Brunswick Corp. | 71,042 | $ 7,262,624 | ||
| Electronic Arts, Inc. | 41,541 | 5,937,455 | ||
| Mattel, Inc. (a) | 40,587 | 860,850 | ||
| Polaris, Inc. | 10,372 | 1,361,014 | ||
| Take-Two Interactive Software, Inc. (a) | 33,070 | 6,136,469 | ||
| $21,558,412 | ||||
| Machinery & Tools – 4.5% | ||||
| AGCO Corp. | 42,958 | $ 5,944,099 | ||
| Cummins, Inc. | 3,765 | 968,659 | ||
| ITT, Inc. | 18,283 | 1,716,774 | ||
| Regal Beloit Corp. | 46,518 | 6,616,255 | ||
| Roper Technologies, Inc. | 5,455 | 2,454,805 | ||
| Timken Co. | 28,420 | 2,513,749 | ||
| $20,214,341 | ||||
| Major Banks – 1.5% | ||||
| Comerica, Inc. | 38,242 | $ 3,001,615 | ||
| State Street Corp. | 41,473 | 3,607,321 | ||
| $6,608,936 | ||||
Table of Contents
| Issuer | Shares/Par | Value ($) | ||
| Common Stocks – continued | ||||
| Medical & Health Technology & Services – 6.3% | ||||
| Charles River Laboratories International, Inc. (a) | 19,611 | $ 6,628,322 | ||
| IDEXX Laboratories, Inc. (a) | 13,232 | 7,384,912 | ||
| Laboratory Corp. of America Holdings (a) | 4,905 | 1,346,324 | ||
| McKesson Corp. | 37,634 | 7,240,405 | ||
| Quest Diagnostics, Inc. | 12,735 | 1,676,818 | ||
| Tenet Healthcare Corp. (a) | 19,764 | 1,322,409 | ||
| Universal Health Services, Inc. | 18,010 | 2,874,936 | ||
| $28,474,126 | ||||
| Medical Equipment – 5.1% | ||||
| Align Technology, Inc. (a) | 8,484 | $ 5,006,833 | ||
| Avantor, Inc. (a) | 209,101 | 6,722,597 | ||
| Hologic, Inc. (a) | 22,478 | 1,417,463 | ||
| PerkinElmer, Inc. | 30,198 | 4,380,824 | ||
| STERIS PLC | 2,903 | 554,066 | ||
| West Pharmaceutical Services, Inc. | 14,510 | 5,042,370 | ||
| $23,124,153 | ||||
| Metals & Mining – 0.6% | ||||
| Reliance Steel & Aluminum Co. | 15,414 | $ 2,590,631 | ||
| Natural Gas - Distribution – 1.8% | ||||
| Sempra Energy | 38,910 | $ 5,271,916 | ||
| UGI Corp. | 60,339 | 2,778,611 | ||
| $8,050,527 | ||||
| Natural Gas - Pipeline – 1.2% | ||||
| ONEOK, Inc. | 5,472 | $ 288,593 | ||
| Targa Resources Corp. | 98,484 | 3,827,088 | ||
| Williams Cos., Inc. | 45,657 | 1,202,606 | ||
| $5,318,287 | ||||
| Oil Services – 1.5% | ||||
| ChampionX Corp. (a) | 136,503 | $ 3,617,329 | ||
| NOV, Inc. (a) | 207,080 | 3,338,130 | ||
| $6,955,459 | ||||
| Other Banks & Diversified Financials – 4.9% | ||||
| Bank OZK | 25,790 | $ 1,101,491 | ||
| Northern Trust Corp. | 47,581 | 5,766,341 | ||
| SLM Corp. | 159,621 | 3,232,325 | ||
| Synchrony Financial | 119,903 | 5,684,601 | ||
| Umpqua Holdings Corp. | 120,660 | 2,302,193 | ||
Table of Contents
| Issuer | Shares/Par | Value ($) | ||
| Common Stocks – continued | ||||
| Other Banks & Diversified Financials – continued | ||||
| Zions Bancorp NA | 70,378 | $ 4,073,479 | ||
| $22,160,430 | ||||
| Pharmaceuticals – 1.0% | ||||
| United Therapeutics Corp. (a) | 1,732 | $ 321,979 | ||
| Zoetis, Inc. | 24,956 | 4,409,226 | ||
| $4,731,205 | ||||
| Pollution Control – 0.9% | ||||
| Republic Services, Inc. | 35,372 | $ 3,861,915 | ||
| Real Estate – 6.8% | ||||
| Empire State Realty Trust, REIT, “A” | 102,642 | $ 1,214,255 | ||
| Extra Space Storage, Inc., REIT | 39,365 | 5,897,271 | ||
| Omega Healthcare Investors, Inc., REIT | 166,435 | 6,094,850 | ||
| Simon Property Group, Inc., REIT | 7,866 | 1,010,702 | ||
| Spirit Realty Capital, Inc., REIT | 53,475 | 2,527,228 | ||
| STAG Industrial, Inc., REIT | 154,358 | 5,512,124 | ||
| Starwood Property Trust, Inc., REIT | 100,050 | 2,540,269 | ||
| STORE Capital Corp., REIT | 169,154 | 5,818,898 | ||
| $30,615,597 | ||||
| Restaurants – 2.2% | ||||
| Texas Roadhouse, Inc. | 39,561 | $ 3,984,188 | ||
| Yum China Holdings, Inc. | 89,397 | 6,046,813 | ||
| $10,031,001 | ||||
| Specialty Chemicals – 0.9% | ||||
| Corteva, Inc. | 70,106 | $ 3,189,823 | ||
| Univar Solutions, Inc. (a) | 40,672 | 1,101,805 | ||
| $4,291,628 | ||||
| Specialty Stores – 1.4% | ||||
| AutoZone, Inc. (a) | 3,246 | $ 4,565,823 | ||
| Petco Health & Wellness Co., Inc. (a) | 24,561 | 556,307 | ||
| Urban Outfitters, Inc. (a) | 33,443 | 1,309,628 | ||
| $6,431,758 | ||||
| Trucking – 2.4% | ||||
| Forward Air Corp. | 37,883 | $ 3,670,484 | ||
| Old Dominion Freight Line, Inc. | 18,792 | 4,988,336 | ||
| Ryder System, Inc. | 28,219 | 2,308,032 | ||
| $10,966,852 | ||||
Table of Contents
| Issuer | Shares/Par | Value ($) | ||
| Common Stocks – continued | ||||
| Utilities - Electric Power – 4.1% | ||||
| CenterPoint Energy, Inc. | 79,115 | $ 2,001,609 | ||
| DTE Energy Co. | 16,925 | 2,335,481 | ||
| Edison International | 30,094 | 1,681,352 | ||
| NRG Energy, Inc. | 101,420 | 3,260,653 | ||
| PG&E Corp. (a) | 202,076 | 2,049,051 | ||
| Portland General Electric Co. | 68,296 | 3,274,110 | ||
| Xcel Energy, Inc. | 55,645 | 3,944,118 | ||
| $18,546,374 | ||||
| Total Common Stocks (Identified Cost, $339,577,250) | $ 449,356,659 | |||
| Investment Companies (h) – 0.6% | ||||
| Money Market Funds – 0.6% | ||||
| MFS Institutional Money Market Portfolio, 0.03% (v) (Identified Cost, $2,543,227) | 2,543,227 | $ 2,543,227 | ||
| Other Assets, Less Liabilities – (0.2)% | (786,104) | |||
| Net Assets – 100.0% | $ 451,113,782 | |||
| (a) | Non-income producing security. | |||
| (h) | An affiliated issuer, which may be considered one in which the fund owns 5% or more of the outstanding voting securities, or a company which is under common control. At period end, the aggregate values of the fund's investments in affiliated issuers and in unaffiliated issuers were $2,543,227 and $449,356,659, respectively. | |||
| (v) | Affiliated issuer that is available only to investment companies managed by MFS. The rate quoted for the MFS Institutional Money Market Portfolio is the annualized seven-day yield of the fund at period end. |
| The following abbreviations are used in this report and are defined: | |
| REIT | Real Estate Investment Trust |
Table of Contents
| Assets | |
| Investments in unaffiliated issuers, at value (identified cost, $339,577,250) | $449,356,659 |
| Investments in affiliated issuers, at value (identified cost, $2,543,227) | 2,543,227 |
| Receivables for | |
| Fund shares sold | 394,894 |
| Interest and dividends | 585,285 |
| Other assets | 831 |
| Total assets | $452,880,896 |
| Liabilities | |
| Payables for | |
| Fund shares reacquired | $1,605,860 |
| Payable to affiliates | |
| Investment adviser | 41,216 |
| Administrative services fee | 955 |
| Shareholder servicing costs | 43,461 |
| Distribution and service fees | 4,679 |
| Payable for independent Trustees' compensation | 11 |
| Accrued expenses and other liabilities | 70,932 |
| Total liabilities | $1,767,114 |
| Net assets | $451,113,782 |
| Net assets consist of | |
| Paid-in capital | $304,566,000 |
| Total distributable earnings (loss) | 146,547,782 |
| Net assets | $451,113,782 |
| Shares of beneficial interest outstanding | 29,314,143 |
Table of Contents
| Net assets | Shares outstanding | Net asset value per share (a) | |
| Class A | $133,584,285 | 8,698,892 | $15.36 |
| Class B | 125,540 | 8,228 | 15.26 |
| Class C | 349,761 | 22,930 | 15.25 |
| Class I | 5,410,042 | 351,717 | 15.38 |
| Class R1 | 141,695 | 9,286 | 15.26 |
| Class R2 | 253,104 | 16,512 | 15.33 |
| Class R3 | 1,422,467 | 92,593 | 15.36 |
| Class R4 | 953,127 | 61,913 | 15.39 |
| Class R6 | 308,873,761 | 20,052,072 | 15.40 |
| (a) | Maximum offering price per share was equal to the net asset value per share for all share classes, except for Class A, for which the maximum offering price per share was $16.30 [100 / 94.25 x $15.36]. On sales of $50,000 or more, the maximum offering price of Class A shares is reduced. A contingent deferred sales charge may be imposed on redemptions of Class A, Class B, and Class C shares. Redemption price per share was equal to the net asset value per share for Classes I, R1, R2, R3, R4, and R6. |
Table of Contents
| Net investment income (loss) | |
| Income | |
| Dividends | $5,365,175 |
| Income on securities loaned | 30,690 |
| Other | 29,736 |
| Dividends from affiliated issuers | 3,144 |
| Total investment income | $5,428,745 |
| Expenses | |
| Management fee | $1,889,230 |
| Distribution and service fees | 253,248 |
| Shareholder servicing costs | 96,124 |
| Administrative services fee | 59,483 |
| Independent Trustees' compensation | 8,370 |
| Custodian fee | 32,649 |
| Shareholder communications | 7,389 |
| Audit and tax fees | 56,025 |
| Legal fees | 2,618 |
| Miscellaneous | 146,912 |
| Total expenses | $2,552,048 |
| Fees paid indirectly | (1) |
| Reduction of expenses by investment adviser and distributor | (297,778) |
| Net expenses | $2,254,269 |
| Net investment income (loss) | $3,174,476 |
| Realized and unrealized gain (loss) | |
| Realized gain (loss) (identified cost basis) | |
| Unaffiliated issuers | $47,187,742 |
| Affiliated issuers | (209) |
| Net realized gain (loss) | $47,187,533 |
| Change in unrealized appreciation or depreciation | |
| Unaffiliated issuers | $89,799,345 |
| Net realized and unrealized gain (loss) | $136,986,878 |
| Change in net assets from operations | $140,161,354 |
Table of Contents
| Year ended | ||
| 5/31/21 | 5/31/20 | |
| Change in net assets | ||
| From operations | ||
| Net investment income (loss) | $3,174,476 | $3,440,093 |
| Net realized gain (loss) | 47,187,533 | 4,684,508 |
| Net unrealized gain (loss) | 89,799,345 | 77,653 |
| Change in net assets from operations | $140,161,354 | $8,202,254 |
| Total distributions to shareholders | $(3,558,854) | $(14,604,385) |
| Change in net assets from fund share transactions | $(476,675) | $45,074,144 |
| Total change in net assets | $136,125,825 | $38,672,013 |
| Net assets | ||
| At beginning of period | 314,987,957 | 276,315,944 |
| At end of period | $451,113,782 | $314,987,957 |
Table of Contents
| Class A | Year ended | ||||
| 5/31/21 | 5/31/20 | 5/31/19 | 5/31/18 | 5/31/17(c) | |
| Net asset value, beginning of period | $10.70 | $11.14 | $12.07 | $11.03 | $10.00 |
| Income (loss) from investment operations | |||||
| Net investment income (loss) (d) | $0.08 | $0.10 | $0.11 | $0.09 | $0.06 |
| Net realized and unrealized gain (loss) | 4.68 | 0.02 | (0.27) | 1.36 | 1.01 |
| Total from investment operations | $4.76 | $0.12 | $(0.16) | $1.45 | $1.07 |
| Less distributions declared to shareholders | |||||
| From net investment income | $(0.10) | $(0.10) | $(0.09) | $(0.10) | $(0.04) |
| From net realized gain | (0.00)(w) | (0.46) | (0.68) | (0.31) | — |
| Total distributions declared to shareholders | $(0.10) | $(0.56) | $(0.77) | $(0.41) | $(0.04) |
| Net asset value, end of period (x) | $15.36 | $10.70 | $11.14 | $12.07 | $11.03 |
| Total return (%) (r)(s)(t)(x) | 44.61 | 0.51 | (0.52) | 13.20 | 10.72(n) |
| Ratios (%) (to average net assets) and Supplemental data: | |||||
| Expenses before expense reductions (f) | 0.92 | 0.96 | 0.97 | 0.94 | 0.96(a) |
| Expenses after expense reductions (f) | 0.84 | 0.84 | 0.84 | 0.84 | 0.81(a) |
| Net investment income (loss) | 0.58 | 0.89 | 0.96 | 0.71 | 0.76(a) |
| Portfolio turnover | 103 | 81 | 80 | 84 | 68(n) |
| Net assets at end of period (000 omitted) | $133,584 | $74,843 | $74,051 | $77,738 | $73 |
Table of Contents
| Class B | Year ended | ||||
| 5/31/21 | 5/31/20 | 5/31/19 | 5/31/18 | 5/31/17(c) | |
| Net asset value, beginning of period | $10.64 | $11.08 | $12.03 | $10.99 | $10.00 |
| Income (loss) from investment operations | |||||
| Net investment income (loss) (d) | $(0.02) | $0.02 | $0.02 | $(0.00)(w) | $0.00(w) |
| Net realized and unrealized gain (loss) | 4.65 | 0.01 | (0.26) | 1.35 | 1.00 |
| Total from investment operations | $4.63 | $0.03 | $(0.24) | $1.35 | $1.00 |
| Less distributions declared to shareholders | |||||
| From net investment income | $(0.01) | $(0.01) | $(0.03) | $— | $(0.01) |
| From net realized gain | (0.00)(w) | (0.46) | (0.68) | (0.31) | — |
| Total distributions declared to shareholders | $(0.01) | $(0.47) | $(0.71) | $(0.31) | $(0.01) |
| Net asset value, end of period (x) | $15.26 | $10.64 | $11.08 | $12.03 | $10.99 |
| Total return (%) (r)(s)(t)(x) | 43.56 | (0.23) | (1.27) | 12.35 | 10.02(n) |
| Ratios (%) (to average net assets) and Supplemental data: | |||||
| Expenses before expense reductions (f) | 1.67 | 1.71 | 1.72 | 1.67 | 1.73(a) |
| Expenses after expense reductions (f) | 1.59 | 1.59 | 1.59 | 1.59 | 1.56(a) |
| Net investment income (loss) | (0.16) | 0.15 | 0.21 | (0.04) | 0.02(a) |
| Portfolio turnover | 103 | 81 | 80 | 84 | 68(n) |
| Net assets at end of period (000 omitted) | $126 | $92 | $99 | $66 | $57 |
Table of Contents
| Class C | Year ended | ||||
| 5/31/21 | 5/31/20 | 5/31/19 | 5/31/18 | 5/31/17(c) | |
| Net asset value, beginning of period | $10.64 | $11.10 | $12.03 | $10.99 | $10.00 |
| Income (loss) from investment operations | |||||
| Net investment income (loss) (d) | $(0.02) | $0.02 | $0.02 | $(0.00)(w) | $0.00(w) |
| Net realized and unrealized gain (loss) | 4.64 | 0.01 | (0.25) | 1.35 | 1.00 |
| Total from investment operations | $4.62 | $0.03 | $(0.23) | $1.35 | $1.00 |
| Less distributions declared to shareholders | |||||
| From net investment income | $(0.01) | $(0.03) | $(0.02) | $(0.00)(w) | $(0.01) |
| From net realized gain | (0.00)(w) | (0.46) | (0.68) | (0.31) | — |
| Total distributions declared to shareholders | $(0.01) | $(0.49) | $(0.70) | $(0.31) | $(0.01) |
| Net asset value, end of period (x) | $15.25 | $10.64 | $11.10 | $12.03 | $10.99 |
| Total return (%) (r)(s)(t)(x) | 43.49 | (0.28) | (1.27) | 12.40 | 10.02(n) |
| Ratios (%) (to average net assets) and Supplemental data: | |||||
| Expenses before expense reductions (f) | 1.66 | 1.71 | 1.72 | 1.67 | 1.73(a) |
| Expenses after expense reductions (f) | 1.59 | 1.59 | 1.59 | 1.59 | 1.56(a) |
| Net investment income (loss) | (0.16) | 0.16 | 0.21 | (0.04) | 0.01(a) |
| Portfolio turnover | 103 | 81 | 80 | 84 | 68(n) |
| Net assets at end of period (000 omitted) | $350 | $138 | $109 | $98 | $64 |
Table of Contents
| Class I | Year ended | ||||
| 5/31/21 | 5/31/20 | 5/31/19 | 5/31/18 | 5/31/17(c) | |
| Net asset value, beginning of period | $10.71 | $11.16 | $12.11 | $11.04 | $10.00 |
| Income (loss) from investment operations | |||||
| Net investment income (loss) (d) | $0.11 | $0.13 | $0.14 | $0.11 | $0.08 |
| Net realized and unrealized gain (loss) | 4.68 | 0.02 | (0.28) | 1.37 | 1.01 |
| Total from investment operations | $4.79 | $0.15 | $(0.14) | $1.48 | $1.09 |
| Less distributions declared to shareholders | |||||
| From net investment income | $(0.12) | $(0.14) | $(0.13) | $(0.10) | $(0.05) |
| From net realized gain | (0.00)(w) | (0.46) | (0.68) | (0.31) | — |
| Total distributions declared to shareholders | $(0.12) | $(0.60) | $(0.81) | $(0.41) | $(0.05) |
| Net asset value, end of period (x) | $15.38 | $10.71 | $11.16 | $12.11 | $11.04 |
| Total return (%) (r)(s)(t)(x) | 44.98 | 0.71 | (0.30) | 13.51 | 10.91(n) |
| Ratios (%) (to average net assets) and Supplemental data: | |||||
| Expenses before expense reductions (f) | 0.67 | 0.71 | 0.71 | 0.67 | 0.74(a) |
| Expenses after expense reductions (f) | 0.59 | 0.59 | 0.59 | 0.59 | 0.56(a) |
| Net investment income (loss) | 0.84 | 1.18 | 1.26 | 0.95 | 1.02(a) |
| Portfolio turnover | 103 | 81 | 80 | 84 | 68(n) |
| Net assets at end of period (000 omitted) | $5,410 | $4,368 | $2,336 | $69 | $55 |
Table of Contents
| Class R1 | Year ended | ||||
| 5/31/21 | 5/31/20 | 5/31/19 | 5/31/18 | 5/31/17(c) | |
| Net asset value, beginning of period | $10.65 | $11.09 | $12.03 | $10.99 | $10.00 |
| Income (loss) from investment operations | |||||
| Net investment income (loss) (d) | $(0.02) | $0.02 | $0.02 | $(0.01) | $0.00(w) |
| Net realized and unrealized gain (loss) | 4.64 | 0.02 | (0.26) | 1.36 | 1.00 |
| Total from investment operations | $4.62 | $0.04 | $(0.24) | $1.35 | $1.00 |
| Less distributions declared to shareholders | |||||
| From net investment income | $(0.01) | $(0.02) | $(0.02) | $— | $(0.01) |
| From net realized gain | (0.00)(w) | (0.46) | (0.68) | (0.31) | — |
| Total distributions declared to shareholders | $(0.01) | $(0.48) | $(0.70) | $(0.31) | $(0.01) |
| Net asset value, end of period (x) | $15.26 | $10.65 | $11.09 | $12.03 | $10.99 |
| Total return (%) (r)(s)(t)(x) | 43.45 | (0.16) | (1.31) | 12.35 | 10.02(n) |
| Ratios (%) (to average net assets) and Supplemental data: | |||||
| Expenses before expense reductions (f) | 1.67 | 1.71 | 1.72 | 1.67 | 1.73(a) |
| Expenses after expense reductions (f) | 1.59 | 1.59 | 1.59 | 1.59 | 1.56(a) |
| Net investment income (loss) | (0.16) | 0.15 | 0.22 | (0.05) | 0.02(a) |
| Portfolio turnover | 103 | 81 | 80 | 84 | 68(n) |
| Net assets at end of period (000 omitted) | $142 | $98 | $97 | $62 | $55 |
Table of Contents
| Class R2 | Year ended | ||||
| 5/31/21 | 5/31/20 | 5/31/19 | 5/31/18 | 5/31/17(c) | |
| Net asset value, beginning of period | $10.70 | $11.15 | $12.07 | $11.02 | $10.00 |
| Income (loss) from investment operations | |||||
| Net investment income (loss) (d) | $0.04 | $0.07 | $0.08 | $0.05 | $0.04 |
| Net realized and unrealized gain (loss) | 4.68 | 0.02 | (0.25) | 1.35 | 1.01 |
| Total from investment operations | $4.72 | $0.09 | $(0.17) | $1.40 | $1.05 |
| Less distributions declared to shareholders | |||||
| From net investment income | $(0.09) | $(0.08) | $(0.07) | $(0.04) | $(0.03) |
| From net realized gain | (0.00)(w) | (0.46) | (0.68) | (0.31) | — |
| Total distributions declared to shareholders | $(0.09) | $(0.54) | $(0.75) | $(0.35) | $(0.03) |
| Net asset value, end of period (x) | $15.33 | $10.70 | $11.15 | $12.07 | $11.02 |
| Total return (%) (r)(s)(t)(x) | 44.24 | 0.21 | (0.71) | 12.82 | 10.51(n) |
| Ratios (%) (to average net assets) and Supplemental data: | |||||
| Expenses before expense reductions (f) | 1.17 | 1.21 | 1.22 | 1.17 | 1.23(a) |
| Expenses after expense reductions (f) | 1.09 | 1.09 | 1.09 | 1.09 | 1.06(a) |
| Net investment income (loss) | 0.30 | 0.65 | 0.70 | 0.45 | 0.52(a) |
| Portfolio turnover | 103 | 81 | 80 | 84 | 68(n) |
| Net assets at end of period (000 omitted) | $253 | $62 | $62 | $62 | $55 |
Table of Contents
| Class R3 | Year ended | ||||
| 5/31/21 | 5/31/20 | 5/31/19 | 5/31/18 | 5/31/17(c) | |
| Net asset value, beginning of period | $10.71 | $11.16 | $12.09 | $11.03 | $10.00 |
| Income (loss) from investment operations | |||||
| Net investment income (loss) (d) | $0.08 | $0.07 | $0.11 | $0.08 | $0.06 |
| Net realized and unrealized gain (loss) | 4.68 | 0.05 | (0.26) | 1.36 | 1.01 |
| Total from investment operations | $4.76 | $0.12 | $(0.15) | $1.44 | $1.07 |
| Less distributions declared to shareholders | |||||
| From net investment income | $(0.11) | $(0.11) | $(0.10) | $(0.07) | $(0.04) |
| From net realized gain | (0.00)(w) | (0.46) | (0.68) | (0.31) | — |
| Total distributions declared to shareholders | $(0.11) | $(0.57) | $(0.78) | $(0.38) | $(0.04) |
| Net asset value, end of period (x) | $15.36 | $10.71 | $11.16 | $12.09 | $11.03 |
| Total return (%) (r)(s)(t)(x) | 44.60 | 0.51 | (0.50) | 13.17 | 10.71(n) |
| Ratios (%) (to average net assets) and Supplemental data: | |||||
| Expenses before expense reductions (f) | 0.92 | 1.00 | 0.97 | 0.92 | 0.98(a) |
| Expenses after expense reductions (f) | 0.82 | 0.84 | 0.84 | 0.84 | 0.81(a) |
| Net investment income (loss) | 0.62 | 0.72 | 0.95 | 0.71 | 0.77(a) |
| Portfolio turnover | 103 | 81 | 80 | 84 | 68(n) |
| Net assets at end of period (000 omitted) | $1,422 | $1,015 | $62 | $63 | $55 |
Table of Contents
| Class R4 | Year ended | ||||
| 5/31/21 | 5/31/20 | 5/31/19 | 5/31/18 | 5/31/17(c) | |
| Net asset value, beginning of period | $10.72 | $11.17 | $12.11 | $11.04 | $10.00 |
| Income (loss) from investment operations | |||||
| Net investment income (loss) (d) | $0.11 | $0.13 | $0.14 | $0.11 | $0.08 |
| Net realized and unrealized gain (loss) | 4.69 | 0.02 | (0.27) | 1.37 | 1.01 |
| Total from investment operations | $4.80 | $0.15 | $(0.13) | $1.48 | $1.09 |
| Less distributions declared to shareholders | |||||
| From net investment income | $(0.13) | $(0.14) | $(0.13) | $(0.10) | $(0.05) |
| From net realized gain | (0.00)(w) | (0.46) | (0.68) | (0.31) | — |
| Total distributions declared to shareholders | $(0.13) | $(0.60) | $(0.81) | $(0.41) | $(0.05) |
| Net asset value, end of period (x) | $15.39 | $10.72 | $11.17 | $12.11 | $11.04 |
| Total return (%) (r)(s)(t)(x) | 44.95 | 0.73 | (0.30) | 13.51 | 10.91(n) |
| Ratios (%) (to average net assets) and Supplemental data: | |||||
| Expenses before expense reductions (f) | 0.67 | 0.71 | 0.72 | 0.67 | 0.74(a) |
| Expenses after expense reductions (f) | 0.59 | 0.59 | 0.59 | 0.59 | 0.56(a) |
| Net investment income (loss) | 0.84 | 1.18 | 1.21 | 0.96 | 1.02(a) |
| Portfolio turnover | 103 | 81 | 80 | 84 | 68(n) |
| Net assets at end of period (000 omitted) | $953 | $685 | $63 | $63 | $55 |
Table of Contents
| Class R6 | Year ended | ||||
| 5/31/21 | 5/31/20 | 5/31/19 | 5/31/18 | 5/31/17(c) | |
| Net asset value, beginning of period | $10.73 | $11.17 | $12.11 | $11.04 | $10.00 |
| Income (loss) from investment operations | |||||
| Net investment income (loss) (d) | $0.12 | $0.14 | $0.15 | $0.12 | $0.09 |
| Net realized and unrealized gain (loss) | 4.69 | 0.02 | (0.27) | 1.36 | 1.00 |
| Total from investment operations | $4.81 | $0.16 | $(0.12) | $1.48 | $1.09 |
| Less distributions declared to shareholders | |||||
| From net investment income | $(0.14) | $(0.14) | $(0.14) | $(0.10) | $(0.05) |
| From net realized gain | (0.00)(w) | (0.46) | (0.68) | (0.31) | — |
| Total distributions declared to shareholders | $(0.14) | $(0.60) | $(0.82) | $(0.41) | $(0.05) |
| Net asset value, end of period (x) | $15.40 | $10.73 | $11.17 | $12.11 | $11.04 |
| Total return (%) (r)(s)(t)(x) | 45.02 | 0.87 | (0.17) | 13.52 | 10.91(n) |
| Ratios (%) (to average net assets) and Supplemental data: | |||||
| Expenses before expense reductions (f) | 0.58 | 0.61 | 0.61 | 0.62 | 0.60(a) |
| Expenses after expense reductions (f) | 0.51 | 0.49 | 0.48 | 0.52 | 0.55(a) |
| Net investment income (loss) | 0.94 | 1.25 | 1.32 | 1.03 | 1.05(a) |
| Portfolio turnover | 103 | 81 | 80 | 84 | 68(n) |
| Net assets at end of period (000 omitted) | $308,874 | $233,687 | $199,437 | $196,721 | $187,594 |
| (a) | Annualized. |
| (c) | For the period from the commencement of the fund’s investment operations, August 19, 2016, through the stated period end. |
| (d) | Per share data is based on average shares outstanding. |
| (f) | Ratios do not reflect reductions from fees paid indirectly, if applicable. |
| (n) | Not annualized. |
| (r) | Certain expenses have been reduced without which performance would have been lower. |
| (s) | From time to time the fund may receive proceeds from litigation settlements, without which performance would be lower. |
| (t) | Total returns do not include any applicable sales charges. |
| (w) | Per share amount was less than $0.01. |
| (x) | The net asset values and total returns have been calculated on net assets which include adjustments made in accordance with U.S. generally accepted accounting principles required at period end for financial reporting purposes. |
Table of Contents
Table of Contents
Table of Contents
| Financial Instruments | Level 1 | Level 2 | Level 3 | Total |
| Equity Securities | $449,356,659 | $— | $— | $449,356,659 |
| Mutual Funds | 2,543,227 | — | — | 2,543,227 |
| Total | $451,899,886 | $— | $— | $451,899,886 |
Table of Contents
Table of Contents
| Year ended 5/31/21 | Year ended 5/31/20 | |
| Ordinary income (including any short-term capital gains) | $3,550,203 | $4,617,234 |
| Long-term capital gains | 8,651 | 9,987,151 |
| Total distributions | $3,558,854 | $14,604,385 |
| As of 5/31/21 | |
| Cost of investments | $345,360,042 |
| Gross appreciation | 108,840,097 |
| Gross depreciation | (2,300,253) |
| Net unrealized appreciation (depreciation) | $106,539,844 |
| Undistributed ordinary income | 14,418,956 |
| Undistributed long-term capital gain | 25,588,982 |
| Total distributable earnings (loss) | $146,547,782 |
| Year ended 5/31/21 | Year ended 5/31/20 | ||
| Class A | $599,387 | $3,300,966 | |
| Class B | 110 | 3,896 | |
| Class C | 176 | 5,124 | |
| Class I | 44,087 | 182,704 | |
| Class R1 | 142 | 4,201 | |
| Class R2 | 1,186 | 2,965 | |
| Class R3 | 10,583 | 4,017 | |
| Class R4 | 8,216 | 34,334 | |
| Class R6 | 2,894,967 | 11,066,178 | |
| Total | $3,558,854 | $14,604,385 |
Table of Contents
| Up to $1 billion | 0.50% |
| In excess of $1 billion and up to $2.5 billion | 0.475% |
| In excess of $2.5 billion | 0.45% |
| Classes | ||||||||
| A | B | C | I | R1 | R2 | R3 | R4 | R6 |
| 0.84% | 1.59% | 1.59% | 0.59% | 1.59% | 1.09% | 0.84% | 0.59% | 0.55% |
Table of Contents
| Distribution Fee Rate (d) | Service Fee Rate (d) | Total Distribution Plan (d) | Annual Effective Rate (e) | Distribution and Service Fee | |
| Class A | — | 0.25% | 0.25% | 0.25% | $ 245,227 |
| Class B | 0.75% | 0.25% | 1.00% | 1.00% | 1,087 |
| Class C | 0.75% | 0.25% | 1.00% | 1.00% | 1,857 |
| Class R1 | 0.75% | 0.25% | 1.00% | 1.00% | 1,184 |
| Class R2 | 0.25% | 0.25% | 0.50% | 0.50% | 861 |
| Class R3 | — | 0.25% | 0.25% | 0.23% | 3,032 |
| Total Distribution and Service Fees | $253,248 |
| (d) | In accordance with the distribution plan for certain classes, the fund pays distribution and/or service fees equal to these annual percentage rates of each class’s average daily net assets. The distribution and service fee rates disclosed by class represent the current rates in effect at the end of the reporting period. Any rate changes, if applicable, are detailed below. |
| (e) | The annual effective rates represent actual fees incurred under the distribution plan for the year ended May 31, 2021 based on each class's average daily net assets. MFD has voluntarily agreed to rebate a portion of each class's 0.25% service fee attributable to accounts for which there is no financial intermediary specified on the account except for accounts attributable to MFS or its affiliates' seed money. For the year ended May 31, 2021, this rebate amounted to $32 and $216 for Class A and Class R3, respectively, and is included in the reduction of total expenses in the Statement of Operations. |
| Amount | |
| Class A | $37 |
| Class B | 11 |
| Class C | 2 |
Table of Contents
| Year ended 5/31/21 | Year ended 5/31/20 | ||||
| Shares | Amount | Shares | Amount | ||
| Shares sold | |||||
| Class A | 6,770,794 | $93,287,331 | 3,823,986 | $42,204,128 | |
| Class B | 253 | 3,521 | 710 | 8,449 | |
| Class C | 13,059 | 182,208 | 3,318 | 36,721 | |
| Class I | 67,402 | 868,050 | 264,349 | 3,025,189 | |
| Class R1 | 235 | 2,941 | 183 | 2,105 | |
| Class R2 | 10,839 | 128,538 | — | — | |
| Class R3 | 17,319 | 215,100 | 89,966 | 808,205 | |
| Class R4 | 8,396 | 108,320 | 59,833 | 707,821 | |
| Class R6 | 4,680,797 | 54,105,937 | 5,594,966 | 57,701,440 | |
| 11,569,094 | $148,901,946 | 9,837,311 | $104,494,058 | ||
Table of Contents
| Year ended 5/31/21 | Year ended 5/31/20 | ||||
| Shares | Amount | Shares | Amount | ||
| Shares issued to shareholders in reinvestment of distributions | |||||
| Class A | 737 | $9,638 | 2,782 | $33,521 | |
| Class B | 8 | 110 | 324 | 3,896 | |
| Class C | 13 | 176 | 426 | 5,124 | |
| Class I | 3,371 | 44,087 | 15,150 | 182,704 | |
| Class R1 | 11 | 142 | 349 | 4,201 | |
| Class R2 | 91 | 1,186 | 246 | 2,965 | |
| Class R3 | 809 | 10,583 | 333 | 4,017 | |
| Class R4 | 627 | 8,216 | 2,844 | 34,334 | |
| Class R6 | 220,990 | 2,894,967 | 916,833 | 11,066,178 | |
| 226,657 | $2,969,105 | 939,287 | $11,336,940 | ||
| Shares reacquired | |||||
| Class A | (5,067,733) | $(70,014,300) | (3,480,093) | $(41,089,073) | |
| Class B | (685) | (9,648) | (1,322) | (15,577) | |
| Class C | (3,154) | (36,078) | (517) | (6,282) | |
| Class I | (126,696) | (1,581,510) | (81,218) | (812,162) | |
| Class R1 | (144) | (1,937) | (87) | (1,015) | |
| Class R2 | (215) | (2,748) | — | — | |
| Class R3 | (20,308) | (257,778) | (1,111) | (11,154) | |
| Class R4 | (10,982) | (143,875) | (4,423) | (51,279) | |
| Class R6 | (6,629,459) | (80,299,852) | (2,588,276) | (28,770,312) | |
| (11,859,376) | $(152,347,726) | (6,157,047) | $(70,756,854) | ||
| Net change | |||||
| Class A | 1,703,798 | $23,282,669 | 346,675 | $1,148,576 | |
| Class B | (424) | (6,017) | (288) | (3,232) | |
| Class C | 9,918 | 146,306 | 3,227 | 35,563 | |
| Class I | (55,923) | (669,373) | 198,281 | 2,395,731 | |
| Class R1 | 102 | 1,146 | 445 | 5,291 | |
| Class R2 | 10,715 | 126,976 | 246 | 2,965 | |
| Class R3 | (2,180) | (32,095) | 89,188 | 801,068 | |
| Class R4 | (1,959) | (27,339) | 58,254 | 690,876 | |
| Class R6 | (1,727,672) | (23,298,948) | 3,923,523 | 39,997,306 | |
| (63,625) | $(476,675) | 4,619,551 | $45,074,144 | ||
Table of Contents
| Affiliated Issuers | Beginning Value | Purchases | Sales Proceeds | Realized Gain (Loss) | Change in Unrealized Appreciation or Depreciation | Ending Value |
| MFS Institutional Money Market Portfolio | $2,229,472 | $145,345,471 | $145,031,507 | $(209) | $— | $2,543,227 |
| Affiliated Issuers | Dividend Income | Capital Gain Distributions |
| MFS Institutional Money Market Portfolio | $3,144 | $— |
Table of Contents
Table of Contents
Table of Contents
July 16, 2021
Table of Contents
| Name, Age | Position(s) Held with Fund | Trustee/Officer Since(h) | Number of MFS Funds overseen by the Trustee | Principal Occupations During the Past Five Years | Other Directorships During the Past Five Years (j) | |||||
| INTERESTED TRUSTEES | ||||||||||
| Robert J. Manning (k) (age 57) | Trustee | February 2004 | 135 | Massachusetts Financial Services Company, Non-Executive Chairman (since January 2021); Director; Chairman of the Board; Executive Chairman (January 2017-2020); Co-Chief Executive Officer (2015-2016) | N/A | |||||
| Michael W. Roberge (k) (age 54) | Trustee | January 2021 | 135 | Massachusetts Financial Services Company, Chairman (since January 2021); Chief Executive Officer (since January 2017); Director; President (until December 2018); Chief Investment Officer (until December 2018); Co-Chief Executive Officer (until December 2016) | N/A | |||||
| INDEPENDENT TRUSTEES | ||||||||||
| John P. Kavanaugh (age 66) | Trustee and Chair of Trustees | January 2009 | 135 | Private investor | N/A | |||||
| Steven E. Buller (age 69) | Trustee | February 2014 | 135 | Private investor | N/A | |||||
| John A. Caroselli (age 67) | Trustee | March 2017 | 135 | Private investor; JC Global Advisors, LLC (management consulting), President (since 2015) | N/A | |||||
| Maureen R. Goldfarb (age 66) | Trustee | January 2009 | 135 | Private investor | N/A | |||||
| Peter D. Jones (age 65) | Trustee | January 2019 | 135 | Private investor | N/A | |||||
Table of Contents
| Name, Age | Position(s) Held with Fund | Trustee/Officer Since(h) | Number of MFS Funds overseen by the Trustee | Principal Occupations During the Past Five Years | Other Directorships During the Past Five Years (j) | |||||
| James W. Kilman, Jr. (age 60) | Trustee | January 2019 | 135 | Burford Capital Limited (finance and investment management), Senior Advisor (since May 3, 2021), Chief Financial Officer (2019 - May 2, 2021); KielStrand Capital LLC (family office), Chief Executive Officer (since 2016); Morgan Stanley & Co. (financial services), Vice Chairman of Investment Banking, Co-Head of Diversified Financials Coverage – Financial Institutions Investment Banking Group (until 2016) | Alpha-En Corporation, Director (2016-2019) | |||||
| Clarence Otis, Jr. (age 65) | Trustee | March 2017 | 135 | Private investor | VF Corporation, Director; Verizon Communications, Inc., Director; The Travelers Companies, Director | |||||
| Maryanne L. Roepke (age 65) | Trustee | May 2014 | 135 | Private investor | N/A | |||||
| Laurie J. Thomsen (age 63) | Trustee | March 2005 | 135 | Private investor | The Travelers Companies, Director; Dycom Industries, Inc., Director |
| Name, Age | Position(s) Held with Fund | Trustee/Officer Since(h) | Number of MFS Funds for which the Person is an Officer | Principal Occupations During the Past Five Years | ||||
| OFFICERS | ||||||||
| Christopher R. Bohane (k) (age 47) | Assistant Secretary and Assistant Clerk | July 2005 | 135 | Massachusetts Financial Services Company, Senior Vice President and Associate General Counsel | ||||
| Kino Clark (k) (age 53) | Assistant Treasurer | January 2012 | 135 | Massachusetts Financial Services Company, Vice President |
Table of Contents
| Name, Age | Position(s) Held with Fund | Trustee/Officer Since(h) | Number of MFS Funds for which the Person is an Officer | Principal Occupations During the Past Five Years | ||||
| John W. Clark, Jr. (k) (age 54) | Assistant Treasurer | April 2017 | 135 | Massachusetts Financial Services Company, Vice President (since March 2017); Deutsche Bank (financial services), Department Head - Treasurer's Office (until February 2017) | ||||
| Thomas H. Connors (k) (age 61) | Assistant Secretary and Assistant Clerk | September 2012 | 135 | Massachusetts Financial Services Company, Vice President and Senior Counsel | ||||
| David L. DiLorenzo (k) (age 52) | President | July 2005 | 135 | Massachusetts Financial Services Company, Senior Vice President | ||||
| Heidi W. Hardin (k) (age 53) | Secretary and Clerk | April 2017 | 135 | Massachusetts Financial Services Company, Executive Vice President and General Counsel (since March 2017); Harris Associates (investment management), General Counsel (until January 2017) | ||||
| Brian E. Langenfeld (k) (age 48) | Assistant Secretary and Assistant Clerk | June 2006 | 135 | Massachusetts Financial Services Company, Vice President and Senior Counsel | ||||
| Amanda S. Mooradian (k) (age 42) | Assistant Secretary and Assistant Clerk | September 2018 | 135 | Massachusetts Financial Services Company, Assistant Vice President and Senior Counsel | ||||
| Susan A. Pereira (k) (age 50) | Assistant Secretary and Assistant Clerk | July 2005 | 135 | Massachusetts Financial Services Company, Vice President and Assistant General Counsel | ||||
| Kasey L. Phillips (k) (age 50) | Assistant Treasurer | September 2012 | 135 | Massachusetts Financial Services Company, Vice President | ||||
| Matthew A. Stowe (k) (age 46) | Assistant Secretary and Assistant Clerk | October 2014 | 135 | Massachusetts Financial Services Company, Vice President and Assistant General Counsel | ||||
| Martin J. Wolin (k) (age 53) | Chief Compliance Officer | July 2015 | 135 | Massachusetts Financial Services Company, Senior Vice President and Chief Compliance Officer |
Table of Contents
| Name, Age | Position(s) Held with Fund | Trustee/Officer Since(h) | Number of MFS Funds for which the Person is an Officer | Principal Occupations During the Past Five Years | ||||
| James O. Yost (k) (age 61) | Treasurer | September 1990 | 135 | Massachusetts Financial Services Company, Senior Vice President |
| (h) | Date first appointed to serve as Trustee/Officer of an MFS Fund. Each Trustee has served continuously since appointment unless indicated otherwise. For the period from December 15, 2004 until February 22, 2005, Mr. Manning served as Advisory Trustee. From January 2012 through December 2016, Messrs. DiLorenzo and Yost served as Treasurer and Deputy Treasurer of the Funds, respectively. |
| (j) | Directorships or trusteeships of companies required to report to the Securities and Exchange Commission (i.e., “public companies”). |
| (k) | “Interested person” of the Trust within the meaning of the Investment Company Act of 1940 (referred to as the 1940 Act), which is the principal federal law governing investment companies like the fund, as a result of a position with MFS. The address of MFS is 111 Huntington Avenue, Boston, Massachusetts 02199-7618. |
Table of Contents
| Investment Adviser | Custodian |
| Massachusetts Financial Services Company 111 Huntington Avenue Boston, MA 02199-7618 | State Street Bank and Trust Company 1 Lincoln Street Boston, MA 02111-2900 |
| Distributor | Independent Registered Public Accounting Firm |
| MFS Fund Distributors, Inc. 111 Huntington Avenue Boston, MA 02199-7618 | Deloitte & Touche LLP 200 Berkeley Street Boston, MA 02116 |
| Portfolio Manager(s) | |
| Jim Fallon Matt Krummell Jonathan Sage Jed Stocks |
Table of Contents
Table of Contents
Table of Contents
Table of Contents
| FACTS | WHAT DOES MFS DO WITH YOUR PERSONAL INFORMATION? |
| Why? | Financial companies choose how they share your personal information. Federal law gives consumers the right to limit some but not all sharing. Federal law also requires us to tell you how we collect, share, and protect your personal information. Please read this notice carefully to understand what we do. |
| What? | The types of personal information we collect and share depend on the product or service you have with us. This information can include: |
| • Social Security number and account balances | |
| • Account transactions and transaction history | |
| • Checking account information and wire transfer instructions | |
| When you are no longer our customer, we continue to share your information as described in this notice. |
| How? | All financial companies need to share customers' personal information to run their everyday business. In the section below, we list the reasons financial companies can share their customers' personal information; the reasons MFS chooses to share; and whether you can limit this sharing. |
| Reasons we can share your personal information | Does MFS share? | Can you limit this sharing? |
| For our everyday business purposes – such as to process your transactions, maintain your account(s), respond to court orders and legal investigations, or report to credit bureaus | Yes | No |
| For our marketing purposes – to offer our products and services to you | No | We don't share |
| For joint marketing with other financial companies | No | We don't share |
| For our affiliates' everyday business purposes – information about your transactions and experiences | No | We don't share |
| For our affiliates' everyday business purposes – information about your creditworthiness | No | We don't share |
| For nonaffiliates to market to you | No | We don't share |
| Questions? | Call 800-225-2606 or go to mfs.com. |

Table of Contents
| Who we are | |
| Who is providing this notice? | MFS Funds, MFS Investment Management, MFS Institutional Advisors, Inc., and MFS Heritage Trust Company. |
| What we do | |
| How does MFS protect my personal information? | To protect your personal information from unauthorized access and use, we use security measures that comply with federal law. These measures include procedural, electronic, and physical safeguards for the protection of the personal information we collect about you. |
| How does MFS collect my personal information? | We collect your personal information, for example, when you |
| • open an account or provide account information | |
| • direct us to buy securities or direct us to sell your securities | |
| • make a wire transfer | |
| We also collect your personal information from others, such as credit bureaus, affiliates, or other companies. | |
| Why can't I limit all sharing? | Federal law gives you the right to limit only |
| • sharing for affiliates' everyday business purposes – information about your creditworthiness | |
| • affiliates from using your information to market to you | |
| • sharing for nonaffiliates to market to you | |
| State laws and individual companies may give you additional rights to limit sharing. | |
| Definitions | |
| Affiliates | Companies related by common ownership or control. They can be financial and nonfinancial companies. |
| • MFS does not share personal information with affiliates, except for everyday business purposes as described on page one of this notice. | |
| Nonaffiliates | Companies not related by common ownership or control. They can be financial and nonfinancial companies. |
| • MFS does not share with nonaffiliates so they can market to you. | |
| Joint marketing | A formal agreement between nonaffiliated financial companies that together market financial products or services to you. |
| • MFS doesn't jointly market. | |
| Other important information |
| If you own an MFS product or receive an MFS service in the name of a third party such as a bank or broker-dealer, their privacy policy may apply to you instead of ours. |
Table of Contents
Table of Contents
Table of Contents
Table of Contents
Table of Contents
Table of Contents
Table of Contents
Table of Contents


Table of Contents
Annual Report
May 31, 2021

MFS® International Large Cap Value Fund

MKV-ANN
Table of Contents
MFS® International Large Cap Value Fund
| Contact information | back cover |
The report is prepared for the general information of shareholders. It is authorized for distribution to prospective investors only when preceded or accompanied by a current prospectus.
NOT FDIC INSURED • MAY LOSE VALUE • NO BANK GUARANTEE
Table of Contents

Dear Shareholders:
Markets have experienced dramatic swings since the coronavirus pandemic brought the global economy to a standstill for several months early in 2020. While the speedy
development of vaccines brightened the economic and market outlook, uncertainty remains as new variants of the virus appear, and questions persist over how fast vaccines can be made widely available in the developing world.
Global central banks have taken aggressive steps to cushion the economic and market fallout related to the virus, and governments are deploying unprecedented levels of fiscal support. Having passed a $1.9 trillion stimulus package in March, the U.S. Congress could approve additional stimulus later this year, some of it focused on infrastructure. Along with extraordinary government expenditures, pent-up consumer demand fueled a surge in economic activity as coronavirus restrictions were eased, pushing up inflation, at least temporarily. Markets reacted by
pushing up yields on global government bonds, though some of the rate rise has since been corrected.
A spirited debate is underway among investors over whether the current price pressures will persist or prove to be temporary, caused by pandemic-induced bottlenecks. The policy measures put in place to counteract the pandemic’s effects have helped build a supportive environment and are encouraging economic recovery; however, if markets disconnect from fundamentals, they can sow the seeds of instability. As such, recent dramatic increases in speculative trading in cryptocurrencies, special purpose acquisition companies (SPACs), and the like bear watching.
In the aftermath of the crisis, we could see societal changes as households, businesses, and governments adjust to a new reality, and any such alterations could affect the investment landscape. For investors, events such as the COVID-19 outbreak demonstrate the importance of having a deep understanding of company fundamentals, and we have built our global research platform to do just that.
At MFS®, we put our clients’ assets to work responsibly by carefully navigating the increasing complexity of global markets and economies. Guided by our long-term philosophy and adhering to our commitment to sustainable investing, we tune out the noise and aim to uncover what we believe are the best, most durable investment opportunities in the market. Our unique global investment platform combines collective expertise, long-term discipline, and thoughtful risk management to create sustainable value for investors.
Respectfully,

Michael W. Roberge
Chief Executive Officer
MFS Investment Management
July 16, 2021
The opinions expressed in this letter are subject to change and may not be relied upon for investment advice. No forecasts can be guaranteed.
1
Table of Contents
Portfolio structure
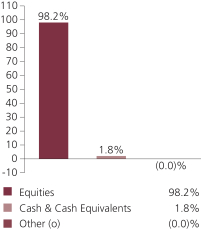
| Top ten holdings | ||||
| BNP Paribas | 2.8% | |||
| Vodafone Group PLC | 2.6% | |||
| Rio Tinto PLC | 2.5% | |||
| UBS Group AG | 2.4% | |||
| Willis Towers Watson PLC | 2.4% | |||
| Barclays PLC | 2.4% | |||
| Schneider Electric SE | 2.3% | |||
| Toronto-Dominion Bank | 2.1% | |||
| Canadian Pacific Railway Ltd. | 2.1% | |||
| KDDI Corp. | 1.9% |
| GICS equity sectors (g) |
| |||
| Financials | 30.3% | |||
| Industrials | 16.3% | |||
| Information Technology | 10.1% | |||
| Consumer Staples | 9.9% | |||
| Consumer Discretionary | 6.9% | |||
| Communication Services | 6.5% | |||
| Materials | 5.1% | |||
| Utilities | 5.1% | |||
| Health Care | 4.6% | |||
| Energy | 3.4% | |||
| Equity Warrants | 0.0% | |||
| (g) | The Global Industry Classification Standard (GICS®) was developed by and/or is the exclusive property of MSCI, Inc. and S&P Global Market Intelligence Inc. (“S&P Global Market Intelligence”). GICS is a service mark of MSCI and S&P Global Market Intelligence and has been licensed for use by MFS. MFS has applied its own internal sector/industry classification methodology for equity securities and non-equity securities that are unclassified by GICS. |
| (o) | Less than 0.1%. |
Cash & Cash Equivalents includes any cash, investments in money market funds, short-term securities, and other assets less liabilities. Please see the Statement of Assets and Liabilities for additional information related to the fund’s cash position and other assets and liabilities.
Other includes equivalent exposure from currency derivatives and/or any offsets to derivative positions and may be negative.
Percentages are based on net assets as of May 31, 2021.
The portfolio is actively managed and current holdings may be different.
2
Table of Contents
Summary of Results
For the period June 30, 2020 to May 31, 2021, Class A shares of the MFS International Large Cap Value Fund (fund) provided a total return of 37.76%, at net asset value. This compares with a return of 36.99% for the fund’s benchmark, the MSCI EAFE Value Index (net div).
Market Environment
The global economy continued to recover from the most unusual recession in memory while financial markets benefited from massive fiscal and monetary intervention aimed at offsetting the economic effects of the pandemic. In developed markets, vaccine distribution broadened after getting off to a slower-than-hoped-for start in some locales, although concerns remained that too few people will be inoculated for herd immunity to be achieved. On balance, emerging markets experienced slower rollouts than developed markets amid ongoing vaccine supply constraints.
Around the world, central banks responded quickly and massively to the crisis with programs to improve liquidity and support markets. These undertakings proved largely successful in helping to restore market function, ease volatility and stimulate a prolonged rebound. In the first half of the period, the US Federal Reserve adopted a new, flexible, average-inflation-targeting framework, which is expected to result in the federal funds rate remaining at low levels longer than under its previous model. Due to relatively manageable external liabilities and balances of payments in many countries and persistently low inflation, even emerging market countries were able to implement countercyclical policies – a departure from the usual market-dictated response to risk-off crises.
Late in the period, markets grappled with the threat of resurgent inflation resulting from pandemic-induced production bottlenecks, monumental levels of economic stimulus and the unleashing of post-lockdown pent-up demand. Meanwhile, raw materials prices rebounded strongly on account of the surprising resilience of the global manufacturing sector during the pandemic. In response to these factors, global government bond yields rose materially in recent months and market leadership shifted from a handful of mega-cap technology companies to a broader array of small-cap and value stocks. At the same time, signs of excess investor enthusiasm were seen in pockets of the market, such as the “meme stocks” popular with users of online message boards and equities issued by special purpose acquisition companies (SPACs).
Contributors to Performance
Stock selection in the financials sector contributed to the fund’s outperformance relative to the MSCI EAFE Value Index. Within this sector, the fund’s positions in financial and banking services providers, Bank Of Ireland Group (b) (Ireland), AIB Group (b) (Ireland) and Toronto-Dominion Bank (b) (Canada), and wealth management company St James’s Place (b) (United Kingdom) aided relative results. The share price of Bank of Ireland appreciated, primarily due to higher net interest income and lower-than-expected operating costs. The fund’s overweight positions in diversified financial services firms, Barclays (United Kingdom) and BNP Paribas (France), also supported relative returns.
3
Table of Contents
Management Review – continued
A combination of security selection and an underweight position in the health care sector bolstered relative performance, led by the fund’s avoidance of pharmaceutical firms GlaxoSmithKline (United Kingdom) and Sanofi (France). The share price of GlaxoSmithKline reacted negatively to an announced dividend cut and lowered outlook, particularly within the company’s Pharma division, as well as declining earnings and a thin new products pipeline.
Elsewhere, the fund’s position in semiconductor manufacturer Taiwan Semiconductor Manufacturing (b) (Taiwan), and not owning shares of consumer goods producer Unilever (United Kingdom), further boosted relative performance. The share price of Taiwan Semiconductor Manufacturing appreciated during the period as the company reported better-than-expected sales and outlook growth. Management cited strong demand across all application platforms, particularly within its smartphones business. Additionally, the company benefited from higher 5G penetration rates that boosted revenue.
Detractors from Performance
An underweight position and stock selection within the materials sector detracted from relative results. Here, not owning mining giant BHP Group (United Kingdom) held back relative returns. The share price of BHP Group benefited from stronger volume growth and better pricing of iron ore and copper, driven in part by improved Chinese steel end-use demand within its automotive, machinery and home appliance sectors. Security selection in the communication services sector further hindered relative results, led by the fund’s overweight position in telecommunications companies Vodafone Group (United Kingdom) and KDDI (Japan).
Despite subdued performance at the beginning of the period, due to a decline in roaming revenues that were driven by travel restrictions related to the COVID-19 outbreak, the share price of Vodafone recovered on the back of strong service revenue growth and an encouraging growth outlook.
An underweight position in the consumer discretionary sector further dampened the fund’s relative performance. Within this sector, not owning shares of automotive manufacturer Daimler (Germany) weighed on relative returns. The share price of Daimler rose as the company reported impressive operating results during the period, driven by strong Mercedes Benz sales, appropriate cost controls that were supported by temporary labor reduction and robust growth in car deliveries in China.
Elsewhere, the fund’s holdings of German stock exchange Deutsche Boerse (b) and pharmaceutical and diagnostic company Roche Holding (b) (Switzerland) detracted from relative performance. Additionally, not owning shares of diversified bank Commonwealth Bank of Australia (Australia), and the fund’s overweight positions in industrial automation and measurement solutions provider Yokogawa Electric (Japan), household and industrial products manufacturer Kao (Japan) and food processing company Danone (France), further weakened relative results.
Respectfully,
Portfolio Manager(s)
Steven Gorham and David Shindler
| (b) | Security is not a benchmark constituent. |
4
Table of Contents
Management Review – continued
The views expressed in this report are those of the portfolio manager(s) only through the end of the period of the report as stated on the cover and do not necessarily reflect the views of MFS or any other person in the MFS organization. These views are subject to change at any time based on market or other conditions, and MFS disclaims any responsibility to update such views. These views may not be relied upon as investment advice or an indication of trading intent on behalf of any MFS portfolio. References to specific securities are not recommendations of such securities, and may not be representative of any MFS portfolio’s current or future investments.
5
Table of Contents
PERFORMANCE SUMMARY THROUGH 5/31/21
The following chart illustrates a representative class of the fund’s historical performance in comparison to its benchmark(s). Performance results include the deduction of the maximum applicable sales charge and reflect the percentage change in net asset value, including reinvestment of dividends and capital gains distributions. The performance of other share classes will be greater than or less than that of the class depicted below. Benchmarks are unmanaged and may not be invested in directly. Benchmark returns do not reflect sales charges, commissions or expenses. (See Notes to Performance Summary.)
Performance data shown represents past performance and is no guarantee of future results. Investment return and principal value fluctuate so your shares, when sold, may be worth more or less than the original cost; current performance may be lower or higher than quoted. The performance shown does not reflect the deduction of taxes, if any, that a shareholder would pay on fund distributions or the redemption of fund shares.
Growth of a Hypothetical $10,000 Investment (t)
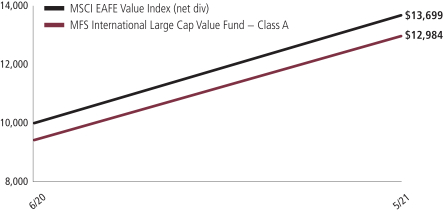
6
Table of Contents
Performance Summary – continued
Total Returns through 5/31/21
Average annual without sales charge
| Share Class | Class Inception Date | Life (t) | ||||||
| A | 6/30/20 | 37.76% | ||||||
| C | 6/30/20 | 36.71% | ||||||
| I | 6/30/20 | 38.08% | ||||||
| R1 | 6/30/20 | 36.71% | ||||||
| R2 | 6/30/20 | 37.23% | ||||||
| R3 | 6/30/20 | 37.75% | ||||||
| R4 | 6/30/20 | 38.28% | ||||||
| R6 | 6/30/20 | 38.09% | ||||||
| Comparative benchmark(s) | ||||||||
| MSCI EAFE Value Index (net div) (f) | 36.99% | |||||||
| Average annual with sales charge | ||||||||
| A With Initial Sales Charge (5.75%) | 29.84% | |||||||
| C With CDSC (1% for 12 months) (v) | 35.71% | |||||||
CDSC – Contingent Deferred Sales Charge.
Class I, R1, R2, R3, R4, and R6 shares do not have a sales charge.
| (f) | Source: FactSet Research Systems Inc. |
| (t) | For the period from the class inception date through the stated period end. (See Notes to Performance Summary.) |
| (v) | Assuming redemption at the end of the applicable period. |
Benchmark Definition(s)
MSCI EAFE (Europe, Australasia, Far East) Value Index (e) (net div) – a market capitalization-weighted index that is designed to measure equity market performance for value securities in the developed markets, excluding the U.S. and Canada.
It is not possible to invest directly in an index.
| (e) | Morgan Stanley Capital International (“MSCI”) makes no express or implied warranties or representations and shall have no liability whatsoever with respect to any MSCI data contained herein. The MSCI data may not be further redistributed or used as a basis for other indices or any securities or financial products. This report is not approved, reviewed, or produced by MSCI. |
Notes to Performance Summary
Average annual total return represents the average annual change in value for each share class for the periods presented. Life returns are presented where the share class has less than 10 years of performance history and represent the average annual total return from the class inception date to the stated period end date.
7
Table of Contents
Performance Summary – continued
Performance results reflect any applicable expense subsidies and waivers in effect during the periods shown. Without such subsidies and waivers the fund’s performance results would be less favorable. Please see the prospectus and financial statements for complete details.
Performance results do not include adjustments made for financial reporting purposes in accordance with U.S. generally accepted accounting principles and may differ from amounts reported in the financial highlights.
From time to time the fund may receive proceeds from litigation settlements, without which performance would be lower.
8
Table of Contents
Fund expenses borne by the shareholders during the period, December 1, 2020 through May 31, 2021
As a shareholder of the fund, you incur two types of costs: (1) transaction costs, including sales charges (loads) on certain purchase or redemption payments, and (2) ongoing costs, including management fees; distribution and service (12b-1) fees; and other fund expenses. This example is intended to help you understand your ongoing costs (in dollars) of investing in the fund and to compare these costs with the ongoing costs of investing in other mutual funds.
The example is based on an investment of $1,000 invested at the beginning of the period and held for the entire period December 1, 2020 through May 31, 2021.
Actual Expenses
The first line for each share class in the following table provides information about actual account values and actual expenses. You may use the information in this line, together with the amount you invested, to estimate the expenses that you paid over the period. Simply divide your account value by $1,000 (for example, an $8,600 account value divided by $1,000 = 8.6), then multiply the result by the number in the first line under the heading entitled “Expenses Paid During Period” to estimate the expenses you paid on your account during this period.
Hypothetical Example for Comparison Purposes
The second line for each share class in the following table provides information about hypothetical account values and hypothetical expenses based on the fund’s actual expense ratio and an assumed rate of return of 5% per year before expenses, which is not the fund’s actual return. The hypothetical account values and expenses may not be used to estimate the actual ending account balance or expenses you paid for the period. You may use this information to compare the ongoing costs of investing in the fund and other funds. To do so, compare this 5% hypothetical example with the 5% hypothetical examples that appear in the shareholder reports of the other funds.
Please note that the expenses shown in the table are meant to highlight your ongoing costs only and do not reflect any transactional costs, such as sales charges (loads). Therefore, the second line for each share class in the table is useful in comparing ongoing costs only, and will not help you determine the relative total costs of owning different funds. In addition, if these transactional costs were included, your costs would have been higher.
9
Table of Contents
Expense Table – continued
Share Class | Annualized Expense Ratio | Beginning Account Value 12/01/20 | Ending Account Value 5/31/21 | Expenses Paid During Period (p) 12/01/20-5/31/21 | ||||||||||||||
| A | Actual | 0.93% | $1,000.00 | $1,202.09 | $5.11 | |||||||||||||
| Hypothetical (h) | 0.93% | $1,000.00 | $1,020.29 | $4.68 | ||||||||||||||
| C | Actual | 1.68% | $1,000.00 | $1,198.16 | $9.21 | |||||||||||||
| Hypothetical (h) | 1.68% | $1,000.00 | $1,016.55 | $8.45 | ||||||||||||||
| I | Actual | 0.68% | $1,000.00 | $1,202.83 | $3.73 | |||||||||||||
| Hypothetical (h) | 0.68% | $1,000.00 | $1,021.54 | $3.43 | ||||||||||||||
| R1 | Actual | 1.68% | $1,000.00 | $1,198.16 | $9.21 | |||||||||||||
| Hypothetical (h) | 1.68% | $1,000.00 | $1,016.55 | $8.45 | ||||||||||||||
| R2 | Actual | 1.18% | $1,000.00 | $1,200.62 | $6.47 | |||||||||||||
| Hypothetical (h) | 1.18% | $1,000.00 | $1,019.05 | $5.94 | ||||||||||||||
| R3 | Actual | 0.93% | $1,000.00 | $1,202.03 | $5.11 | |||||||||||||
| Hypothetical (h) | 0.93% | $1,000.00 | $1,020.29 | $4.68 | ||||||||||||||
| R4 | Actual | 0.68% | $1,000.00 | $1,203.45 | $3.74 | |||||||||||||
| Hypothetical (h) | 0.68% | $1,000.00 | $1,021.54 | $3.43 | ||||||||||||||
| R6 | Actual | 0.67% | $1,000.00 | $1,203.93 | $3.68 | |||||||||||||
| Hypothetical (h) | 0.67% | $1,000.00 | $1,021.59 | $3.38 | ||||||||||||||
| (h) | 5% class return per year before expenses. |
| (p) | “Expenses Paid During Period” are equal to each class’s annualized expense ratio, as shown above, multiplied by the average account value over the period, multiplied by 182/365 (to reflect the one-half year period). Expenses paid do not include any applicable sales charges (loads). If these transaction costs had been included, your costs would have been higher. |
10
Table of Contents
5/31/21
The Portfolio of Investments is a complete list of all securities owned by your fund. It is categorized by broad-based asset classes.
| Issuer | Shares/Par | Value ($) | ||||||
| Common Stocks - 97.1% | ||||||||
| Aerospace & Defense - 0.6% | ||||||||
| Dassault Aviation S.A. | 26,009 | $ | 32,663,844 | |||||
| Airlines - 2.0% | ||||||||
| Aena S.A. (a) | 236,002 | $ | 41,413,390 | |||||
| Ryanair Holdings PLC, ADR (a) | 625,547 | 73,032,612 | ||||||
|
| |||||||
| $ | 114,446,002 | |||||||
| Alcoholic Beverages - 2.1% | ||||||||
| Diageo PLC | 1,750,704 | $ | 84,665,145 | |||||
| Heineken N.V. | 312,176 | 37,265,890 | ||||||
|
| |||||||
| $ | 121,931,035 | |||||||
| Apparel Manufacturers - 2.9% | ||||||||
| Adidas AG | 156,092 | $ | 56,948,184 | |||||
| Burberry Group PLC | 1,058,992 | 32,136,332 | ||||||
| Compagnie Financiere Richemont S.A. | 644,256 | 78,592,279 | ||||||
|
| |||||||
| $ | 167,676,795 | |||||||
| Automotive - 3.1% | ||||||||
| Compagnie Generale des Etablissements Michelin SCA | 178,610 | $ | 27,476,386 | |||||
| Continental AG | 356,947 | 52,771,961 | ||||||
| Koito Manufacturing Co. Ltd. | 1,065,500 | 69,190,839 | ||||||
| Toyota Industries Corp. | 340,500 | 29,046,214 | ||||||
|
| |||||||
| $ | 178,485,400 | |||||||
| Brokerage & Asset Managers - 2.3% | ||||||||
| Deutsche Boerse AG | 484,635 | $ | 79,235,422 | |||||
| IG Group Holdings PLC | 4,568,096 | 55,618,391 | ||||||
|
| |||||||
| $ | 134,853,813 | |||||||
| Business Services - 2.8% | ||||||||
| Capgemini (l) | 361,145 | $ | 67,414,234 | |||||
| CGI, Inc. (a) | 613,801 | 54,575,910 | ||||||
| Secom Co. Ltd. | 518,600 | 40,591,853 | ||||||
|
| |||||||
| $ | 162,581,997 | |||||||
| Computer Software - 0.4% | ||||||||
| SAP SE | 176,068 | $ | 24,441,396 | |||||
11
Table of Contents
Portfolio of Investments – continued
| Issuer | Shares/Par | Value ($) | ||||||
| Common Stocks - continued | ||||||||
| Computer Software - Systems - 4.8% | ||||||||
| Amadeus IT Group S.A. (a) | 1,022,253 | $ | 77,178,834 | |||||
| Fujitsu Ltd. | 455,000 | 73,907,891 | ||||||
| Hitachi Ltd. | 1,218,000 | 63,809,005 | ||||||
| Samsung Electronics Co. Ltd., GDR | 35,186 | 63,616,288 | ||||||
|
| |||||||
| $ | 278,512,018 | |||||||
| Conglomerates - 1.3% | ||||||||
| Smiths Group PLC | 3,490,528 | $ | 76,839,598 | |||||
| Construction - 0.7% | ||||||||
| Techtronic Industries Co. Ltd. | 2,252,500 | $ | 41,588,009 | |||||
| Consumer Products - 1.3% | ||||||||
| Kao Corp. | 302,700 | $ | 18,509,238 | |||||
| Reckitt Benckiser Group PLC | 598,652 | 54,160,152 | ||||||
|
| |||||||
| $ | 72,669,390 | |||||||
| Electrical Equipment - 3.2% | ||||||||
| Schneider Electric SE | 855,442 | $ | 135,362,397 | |||||
| Yokogawa Electric Corp. | 3,046,700 | 48,222,953 | ||||||
|
| |||||||
| $ | 183,585,350 | |||||||
| Electronics - 2.2% | ||||||||
| Kyocera Corp. | 609,100 | $ | 37,394,924 | |||||
| NXP Semiconductors N.V. | 146,004 | 30,868,166 | ||||||
| Taiwan Semiconductor Manufacturing Co. Ltd., ADR | 487,412 | 57,202,672 | ||||||
|
| |||||||
| $ | 125,465,762 | |||||||
| Energy - Integrated - 3.4% | ||||||||
| BP PLC | 7,163,591 | $ | 31,157,846 | |||||
| Eni S.p.A. | 5,988,909 | 73,645,493 | ||||||
| Galp Energia SGPS S.A. | 3,646,802 | 45,397,627 | ||||||
| Idemitsu Kosan Co. Ltd. | 761,700 | 17,983,327 | ||||||
| Suncor Energy, Inc. | 1,152,023 | 26,781,910 | ||||||
|
| |||||||
| $ | 194,966,203 | |||||||
| Food & Beverages - 1.9% | ||||||||
| Danone S.A. | 939,220 | $ | 66,959,018 | |||||
| Nestle S.A. | 353,502 | 43,536,376 | ||||||
|
| |||||||
| $ | 110,495,394 | |||||||
| Food & Drug Stores - 1.2% | ||||||||
| Tesco PLC | 21,910,984 | $ | 69,495,347 | |||||
12
Table of Contents
Portfolio of Investments – continued
| Issuer | Shares/Par | Value ($) | ||||||
| Common Stocks - continued | ||||||||
| General Merchandise - 0.2% | ||||||||
| B&M European Value Retail S.A. | 1,777,804 | $ | 14,548,182 | |||||
| Insurance - 7.7% | ||||||||
| Chubb Ltd. | 405,813 | $ | 68,984,152 | |||||
| Manulife Financial Corp. | 3,186,601 | 66,715,333 | ||||||
| Sampo Oyj | 1,175,145 | 54,750,693 | ||||||
| St. James’s Place PLC | 4,610,965 | 91,547,402 | ||||||
| Swiss Re Ltd. | 266,931 | 25,658,162 | ||||||
| Willis Towers Watson PLC | 524,509 | 137,085,672 | ||||||
|
| |||||||
| $ | 444,741,414 | |||||||
| Leisure & Toys - 0.6% | ||||||||
| Nintendo Co. Ltd. | 45,600 | $ | 28,195,452 | |||||
| Sankyo Co. Ltd. | 379,700 | 9,252,348 | ||||||
|
| |||||||
| $ | 37,447,800 | |||||||
| Machinery & Tools - 2.7% | ||||||||
| Aalberts Industries N.V. | 687,108 | $ | 38,827,029 | |||||
| Daikin Industries Ltd. | 232,400 | 45,858,088 | ||||||
| SMC Corp. | 124,200 | 74,322,623 | ||||||
|
| |||||||
| $ | 159,007,740 | |||||||
| Major Banks - 15.9% | ||||||||
| Bank of Ireland Group PLC (a) | 10,388,169 | $ | 66,615,437 | |||||
| Barclays PLC | 52,743,708 | 137,202,297 | ||||||
| BNP Paribas | 2,402,272 | 164,065,984 | ||||||
| Mitsubishi UFJ Financial Group, Inc. | 16,190,400 | 91,680,044 | ||||||
| National Australia Bank Ltd. | 3,041,195 | 63,429,003 | ||||||
| NatWest Group PLC | 37,752,300 | 111,023,814 | ||||||
| Resona Holdings, Inc. | 6,814,200 | 29,076,575 | ||||||
| Toronto-Dominion Bank | 1,704,009 | 122,683,001 | ||||||
| UBS Group AG | 8,546,972 | 138,685,639 | ||||||
|
| |||||||
| $ | 924,461,794 | |||||||
| Medical Equipment - 0.4% | ||||||||
| Koninklijke Philips N.V. | 419,596 | $ | 23,615,564 | |||||
| Metals & Mining - 3.0% | ||||||||
| Glencore PLC | 6,788,274 | $ | 31,000,962 | |||||
| Rio Tinto PLC | 1,685,469 | 145,205,258 | ||||||
|
| |||||||
| $ | 176,206,220 | |||||||
| Natural Gas - Distribution - 0.3% | ||||||||
| Italgas S.p.A. | 2,366,377 | $ | 15,666,622 | |||||
13
Table of Contents
Portfolio of Investments – continued
| Issuer | Shares/Par | Value ($) | ||||||
| Common Stocks - continued | ||||||||
| Network & Telecom - 0.9% | ||||||||
| LM Ericsson Telephone Co., “B” | 3,768,571 | $ | 49,989,091 | |||||
| Other Banks & Diversified Financials - 4.4% | ||||||||
| AIB Group PLC (a) | 23,652,988 | $ | 78,875,903 | |||||
| ING Groep N.V. | 3,415,854 | 47,368,054 | ||||||
| Julius Baer Group Ltd. | 722,298 | 49,500,536 | ||||||
| KBC Group N.V. | 1,008,367 | 82,468,497 | ||||||
|
| |||||||
| $ | 258,212,990 | |||||||
| Pharmaceuticals - 4.2% | ||||||||
| Bayer AG | 625,905 | $ | 39,402,171 | |||||
| Novartis AG | 490,177 | 43,038,069 | ||||||
| Novo Nordisk A.S., “B” | 925,849 | 73,271,419 | ||||||
| Roche Holding AG | 255,766 | 88,978,170 | ||||||
|
| |||||||
| $ | 244,689,829 | |||||||
| Printing & Publishing - 2.8% | ||||||||
| RELX PLC | 2,745,725 | $ | 71,852,851 | |||||
| Wolters Kluwer N.V. | 968,680 | 92,916,129 | ||||||
|
| |||||||
| $ | 164,768,980 | |||||||
| Railroad & Shipping - 2.1% | ||||||||
| Canadian Pacific Railway Ltd. | 1,488,182 | $ | 119,671,040 | |||||
| Restaurants - 0.5% | ||||||||
| Yum China Holdings, Inc. | 443,187 | $ | 29,977,169 | |||||
| Specialty Chemicals - 2.1% | ||||||||
| Linde PLC | 288,658 | $ | 87,081,508 | |||||
| Nitto Denko Corp. | 455,000 | 35,281,304 | ||||||
|
| |||||||
| $ | 122,362,812 | |||||||
| Telecommunications - Wireless - 5.3% | ||||||||
| KDDI Corp. | 3,315,300 | $ | 112,548,818 | |||||
| Rogers Communications, Inc. | 841,292 | 43,075,265 | ||||||
| Vodafone Group PLC | 84,075,567 | 153,249,421 | ||||||
|
| |||||||
| $ | 308,873,504 | |||||||
| Telephone Services - 0.7% | ||||||||
| Quebecor, Inc., “B” | 1,413,651 | $ | 38,357,142 | |||||
| Tobacco - 2.3% | ||||||||
| Imperial Brands PLC | 3,831,957 | $ | 87,104,981 | |||||
| Philip Morris International, Inc. | 483,255 | 46,600,280 | ||||||
|
| |||||||
| $ | 133,705,261 | |||||||
14
Table of Contents
Portfolio of Investments – continued
| Issuer | Shares/Par | Value ($) | ||||||
| Common Stocks - continued | ||||||||
| Utilities - Electric Power - 4.8% | ||||||||
| E.ON SE | 5,879,115 | $ | 71,080,370 | |||||
| Iberdrola S.A. | 8,214,571 | 110,446,845 | ||||||
| National Grid PLC | 7,382,572 | 98,507,241 | ||||||
|
| |||||||
| $ | 280,034,456 | |||||||
| Total Common Stocks (Identified Cost, $4,492,448,572) |
| $ | 5,637,034,963 | |||||
| Preferred Stocks - 1.1% | ||||||||
| Consumer Products - 1.1% | ||||||||
| Henkel AG & Co. KGaA (Identified Cost, $57,946,845) | 561,980 | $ | 64,474,722 | |||||
| First Exercise | ||||||||||||||||
| Warrants - 0.0% | ||||||||||||||||
| Apparel Manufacturers - 0.0% | ||||||||||||||||
| Compagnie Financiere Richemont S.A. (1 share for 2 warrants, Expiration date 12/04/2023) (a) (Identified Cost, $0) | CHF 67.00 | 11/22/23 | 1,175,592 | $ | 771,652 | |||||||||||
| Investment Companies (h) - 1.2% |
| |||||||||||||||
| Money Market Funds - 1.2% | ||||||||||||||||
| MFS Institutional Money Market Portfolio, 0.03% (v) (Identified Cost, $65,730,231) |
| 65,730,231 | $ | 65,730,231 | ||||||||||||
| Collateral for Securities Loaned - 0.6% |
| |||||||||||||||
| JPMorgan U.S. Government Money Market Fund, 0.03% (j) (Identified Cost, $34,922,900) |
| 34,922,900 | $ | 34,922,900 | ||||||||||||
| Other Assets, Less Liabilities - 0.0% | 2,501,951 | |||||||||||||||
| Net Assets - 100.0% | $ | 5,805,436,419 | ||||||||||||||
| (a) | Non-income producing security. |
| (h) | An affiliated issuer, which may be considered one in which the fund owns 5% or more of the outstanding voting securities, or a company which is under common control. At period end, the aggregate values of the fund’s investments in affiliated issuers and in unaffiliated issuers were $65,730,231 and $5,737,204,237, respectively. |
| (j) | The rate quoted is the annualized seven-day yield of the fund at period end. |
| (l) | A portion of this security is on loan. See Note 2 for additional information |
| (v) | Affiliated issuer that is available only to investment companies managed by MFS. The rate quoted for the MFS Institutional Money Market Portfolio is the annualized seven-day yield of the fund at period end. |
The following abbreviations are used in this report and are defined:
| ADR | American Depositary Receipt |
| GDR | Global Depositary Receipt |
Abbreviations indicate amounts shown in currencies other than the U.S. dollar. All amounts are stated in U.S. dollars unless otherwise indicated. A list of abbreviations is shown below:
| CHF | Swiss Franc |
See Notes to Financial Statements
15
Table of Contents
Financial Statements
STATEMENT OF ASSETS AND LIABILITIES
At 5/31/21
This statement represents your fund’s balance sheet, which details the assets and liabilities comprising the total value of the fund.
| Assets | ||||
Investments in unaffiliated issuers, at value, including $33,409,224 of securities on loan (identified cost, $4,585,318,317) | $5,737,204,237 | |||
Investments in affiliated issuers, at value (identified cost, $65,730,231) | 65,730,231 | |||
Cash | 1,593,710 | |||
Foreign currency, at value (identified cost, $1,949,537) | 1,951,599 | |||
Receivables for | ||||
Fund shares sold | 15,089,156 | |||
Interest and dividends | 20,780,727 | |||
Other assets | 7,624 | |||
Total assets | $5,842,357,284 | |||
| Liabilities | ||||
Payables for | ||||
Investments purchased | $1,224,319 | |||
Fund shares reacquired | 54,601 | |||
Collateral for securities loaned, at value | 34,922,900 | |||
Payable to affiliates | ||||
Investment adviser | 41,140 | |||
Administrative services fee | 7,722 | |||
Shareholder servicing costs | 322 | |||
Distribution and service fees | 149 | |||
Payable for independent Trustees’ compensation | 15 | |||
Accrued expenses and other liabilities | 669,697 | |||
Total liabilities | $36,920,865 | |||
Net assets | $5,805,436,419 | |||
| Net assets consist of | ||||
Paid-in capital | $4,521,632,355 | |||
Total distributable earnings (loss) | 1,283,804,064 | |||
Net assets | $5,805,436,419 | |||
Shares of beneficial interest outstanding | 424,326,359 | |||
16
Table of Contents
Statement of Assets and Liabilities – continued
| Net assets | Shares outstanding | Net asset value per share (a) | ||||||||||
Class A | $1,187,299 | 86,915 | $13.66 | |||||||||
Class C | 636,118 | 46,726 | 13.61 | |||||||||
Class I | 2,775,168 | 202,766 | 13.69 | |||||||||
Class R1 | 90,896 | 6,677 | 13.61 | |||||||||
Class R2 | 91,561 | 6,702 | 13.66 | |||||||||
Class R3 | 91,895 | 6,717 | 13.68 | |||||||||
Class R4 | 92,229 | 6,730 | 13.70 | |||||||||
Class R6 | 5,800,471,253 | 423,963,126 | 13.68 | |||||||||
| (a) | Maximum offering price per share was equal to the net asset value per share for all share classes, except for Class A, for which the maximum offering price per share was $14.49 [100 / 94.25 x $13.66]. On sales of $50,000 or more, the maximum offering price of Class A shares is reduced. A contingent deferred sales charge may be imposed on redemptions of Class A and Class C shares. Redemption price per share was equal to the net asset value per share for Classes I, R1, R2, R3, R4, and R6. |
See Notes to Financial Statements
17
Table of Contents
Financial Statements
Year ended 5/31/21 (c)
This statement describes how much your fund earned in investment income and accrued in expenses. It also describes any gains and/or losses generated by fund operations.
| Net investment income (loss) | ||||
Income | ||||
Dividends | $131,824,094 | |||
Dividends from affiliated issuers | 36,511 | |||
Income on securities loaned | 36,219 | |||
Foreign taxes withheld | (9,189,864 | ) | ||
Total investment income | $122,706,960 | |||
Expenses | ||||
Management fee | $26,277,358 | |||
Distribution and service fees | 4,796 | |||
Shareholder servicing costs | 893 | |||
Administrative services fee | 404,178 | |||
Independent Trustees’ compensation | 34,000 | |||
Custodian fee | 572,128 | |||
Shareholder communications | 6,301 | |||
Audit and tax fees | 43,078 | |||
Legal fees | 16,272 | |||
Miscellaneous | 576,979 | |||
Total expenses | $27,935,983 | |||
Fees paid indirectly | (317 | ) | ||
Reduction of expenses by investment adviser | (3,841,273 | ) | ||
Net expenses | $24,094,393 | |||
Net investment income (loss) | $98,612,567 | |||
| Realized and unrealized gain (loss) | ||||
Realized gain (loss) (identified cost basis) | ||||
Unaffiliated issuers | $55,928,294 | |||
Affiliated issuers | (297 | ) | ||
Foreign currency | 50,833 | |||
Net realized gain (loss) | $55,978,830 | |||
Change in unrealized appreciation or depreciation | ||||
Unaffiliated issuers | $1,151,885,920 | |||
Translation of assets and liabilities in foreign currencies | 151,695 | |||
Net unrealized gain (loss) | $1,152,037,615 | |||
Net realized and unrealized gain (loss) | $1,208,016,445 | |||
Change in net assets from operations | $1,306,629,012 | |||
| (c) | For the period from the commencement of the fund’s investment operations, June 30, 2020, through the stated period end. |
See Notes to Financial Statements
18
Table of Contents
Financial Statements
STATEMENT OF CHANGES IN NET ASSETS
This statement describes the increases and/or decreases in net assets resulting from operations, any distributions, and any shareholder transactions.
| Year ended | ||||
| 5/31/21 (c) | ||||
| Change in net assets | ||||
| From operations | ||||
Net investment income (loss) | $98,612,567 | |||
Net realized gain (loss) | 55,978,830 | |||
Net unrealized gain (loss) | 1,152,037,615 | |||
Change in net assets from operations | $1,306,629,012 | |||
Total distributions to shareholders | $(22,826,639 | ) | ||
Change in net assets from fund share transactions | $4,521,634,046 | |||
Total change in net assets | $5,805,436,419 | |||
| Net assets | ||||
At beginning of period | — | |||
At end of period | $5,805,436,419 | |||
| (c) | For the period from the commencement of the fund’s investment operations, June 30, 2020, through the stated period end. |
See Notes to Financial Statements
19
Table of Contents
Financial Statements
The financial highlights table is intended to help you understand the fund’s financial performance for the past 5 years (or life of a particular share class, if shorter). Certain information reflects financial results for a single fund share. The total returns in the table represent the rate that an investor would have earned (or lost) on an investment in the fund share class (assuming reinvestment of all distributions) held for the entire period.
| Class A | Year ended | |||
| 5/31/21 (c) | ||||
Net asset value, beginning of period | $10.00 | |||
| Income (loss) from investment operations |
| |||
Net investment income (loss) (d) | $0.29 | |||
Net realized and unrealized gain (loss) | 3.42 | |||
Total from investment operations | $3.71 | |||
| Less distributions declared to shareholders |
| |||
From net investment income | $(0.05 | ) | ||
From net realized gain | (0.00 | )(w) | ||
Total distributions declared to shareholders | $(0.05 | ) | ||
Net asset value, end of period (x) | $13.66 | |||
Total return (%) (r)(s)(t)(x) | 37.16 | (n) | ||
| Ratios (%) (to average net assets) and Supplemental data: |
| |||
Expenses before expense reductions (f) | 1.04 | (a) | ||
Expenses after expense reductions (f) | 0.93 | (a) | ||
Net investment income (loss) | 2.61 | (a) | ||
Portfolio turnover | 18 | (n) | ||
Net assets at end of period (000 omitted) | $1,187 | |||
See Notes to Financial Statements
20
Table of Contents
Financial Highlights – continued
| Class C | Year ended | |||
| 5/31/21 (c) | ||||
Net asset value, beginning of period | $10.00 | |||
| Income (loss) from investment operations |
| |||
Net investment income (loss) (d) | $0.16 | |||
Net realized and unrealized gain (loss) | 3.45 | |||
Total from investment operations | $3.61 | |||
| Less distributions declared to shareholders |
| |||
From net investment income | $— | |||
From net realized gain | (0.00 | )(w) | ||
Total distributions declared to shareholders | $(0.00 | )(w) | ||
Net asset value, end of period (x) | $13.61 | |||
Total return (%) (r)(s)(t)(x) | 36.11 | (n) | ||
| Ratios (%) (to average net assets) and Supplemental data: |
| |||
Expenses before expense reductions (f) | 1.81 | (a) | ||
Expenses after expense reductions (f) | 1.68 | (a) | ||
Net investment income (loss) | 1.49 | (a) | ||
Portfolio turnover | 18 | (n) | ||
Net assets at end of period (000 omitted) | $636 | |||
| Class I | Year ended | |||
| 5/31/21 (c) | ||||
Net asset value, beginning of period | $10.00 | |||
| Income (loss) from investment operations |
| |||
Net investment income (loss) (d) | $0.31 | |||
Net realized and unrealized gain (loss) | 3.44 | |||
Total from investment operations | $3.75 | |||
| Less distributions declared to shareholders |
| |||
From net investment income | $(0.06 | ) | ||
From net realized gain | (0.00 | )(w) | ||
Total distributions declared to shareholders | $(0.06 | ) | ||
Net asset value, end of period (x) | $13.69 | |||
Total return (%) (r)(s)(t)(x) | 37.58 | (n) | ||
| Ratios (%) (to average net assets) and Supplemental data: |
| |||
Expenses before expense reductions (f) | 0.79 | (a) | ||
Expenses after expense reductions (f) | 0.68 | (a) | ||
Net investment income (loss) | 2.82 | (a) | ||
Portfolio turnover | 18 | (n) | ||
Net assets at end of period (000 omitted) | $2,775 | |||
See Notes to Financial Statements
21
Table of Contents
Financial Highlights – continued
| Class R1 | Year ended | |||
| 5/31/21 (c) | ||||
Net asset value, beginning of period | $10.00 | |||
| Income (loss) from investment operations |
| |||
Net investment income (loss) (d) | $0.09 | |||
Net realized and unrealized gain (loss) | 3.52 | |||
Total from investment operations | $3.61 | |||
| Less distributions declared to shareholders |
| |||
From net investment income | $— | |||
From net realized gain | (0.00 | )(w) | ||
Total distributions declared to shareholders | $(0.00 | )(w) | ||
Net asset value, end of period (x) | $13.61 | |||
Total return (%) (r)(s)(t)(x) | 36.11 | (n) | ||
| Ratios (%) (to average net assets) and Supplemental data: |
| |||
Expenses before expense reductions (f) | 1.83 | (a) | ||
Expenses after expense reductions (f) | 1.68 | (a) | ||
Net investment income (loss) | 0.85 | (a) | ||
Portfolio turnover | 18 | (n) | ||
Net assets at end of period (000 omitted) | $91 | |||
| Class R2 | Year ended | |||
| 5/31/21 (c) | ||||
Net asset value, beginning of period | $10.00 | |||
| Income (loss) from investment operations |
| |||
Net investment income (loss) (d) | $0.14 | |||
Net realized and unrealized gain (loss) | 3.52 | |||
Total from investment operations | $3.66 | |||
| Less distributions declared to shareholders |
| |||
From net investment income | $(0.00 | )(w) | ||
From net realized gain | (0.00 | )(w) | ||
Total distributions declared to shareholders | $(0.00 | )(w) | ||
Net asset value, end of period (x) | $13.66 | |||
Total return (%) (r)(s)(t)(x) | 36.63 | (n) | ||
| Ratios (%) (to average net assets) and Supplemental data: |
| |||
Expenses before expense reductions (f) | 1.33 | (a) | ||
Expenses after expense reductions (f) | 1.18 | (a) | ||
Net investment income (loss) | 1.36 | (a) | ||
Portfolio turnover | 18 | (n) | ||
Net assets at end of period (000 omitted) | $92 | |||
See Notes to Financial Statements
22
Table of Contents
Financial Highlights – continued
| Class R3 | Year ended | |||
| 5/31/21 (c) | ||||
Net asset value, beginning of period | $10.00 | |||
| Income (loss) from investment operations |
| |||
Net investment income (loss) (d) | $0.17 | |||
Net realized and unrealized gain (loss) | 3.54 | |||
Total from investment operations | $3.71 | |||
| Less distributions declared to shareholders |
| |||
From net investment income | $(0.03 | ) | ||
From net realized gain | (0.00 | )(w) | ||
Total distributions declared to shareholders | $(0.03 | ) | ||
Net asset value, end of period (x) | $13.68 | |||
Total return (%) (r)(s)(t)(x) | 37.15 | (n) | ||
| Ratios (%) (to average net assets) and Supplemental data: |
| |||
Expenses before expense reductions (f) | 1.08 | (a) | ||
Expenses after expense reductions (f) | 0.93 | (a) | ||
Net investment income (loss) | 1.61 | (a) | ||
Portfolio turnover | 18 | (n) | ||
Net assets at end of period (000 omitted) | $92 | |||
| Class R4 | Year ended | |||
| 5/31/21 (c) | ||||
Net asset value, beginning of period | $10.00 | |||
| Income (loss) from investment operations |
| |||
Net investment income (loss) (d) | $0.19 | |||
Net realized and unrealized gain (loss) | 3.57 | |||
Total from investment operations | $3.76 | |||
| Less distributions declared to shareholders |
| |||
From net investment income | $(0.06 | ) | ||
From net realized gain | (0.00 | )(w) | ||
Total distributions declared to shareholders | $(0.06 | ) | ||
Net asset value, end of period (x) | $13.70 | |||
Total return (%) (r)(s)(t)(x) | 37.67 | (n) | ||
| Ratios (%) (to average net assets) and Supplemental data: |
| |||
Expenses before expense reductions (f) | 0.83 | (a) | ||
Expenses after expense reductions (f) | 0.68 | (a) | ||
Net investment income (loss) | 1.86 | (a) | ||
Portfolio turnover | 18 | (n) | ||
Net assets at end of period (000 omitted) | $92 | |||
See Notes to Financial Statements
23
Table of Contents
Financial Highlights – continued
| Class R6 | Year ended | |||
| 5/31/21 (c) | ||||
Net asset value, beginning of period | $10.00 | |||
| Income (loss) from investment operations |
| |||
Net investment income (loss) (d) | $0.30 | |||
Net realized and unrealized gain (loss) | 3.44 | |||
Total from investment operations | $3.74 | |||
| Less distributions declared to shareholders |
| |||
From net investment income | $(0.06 | ) | ||
From net realized gain | (0.00 | )(w) | ||
Total distributions declared to shareholders | $(0.06 | ) | ||
Net asset value, end of period (x) | $13.68 | |||
Total return (%) (r)(s)(t)(x) | 37.49 | (n) | ||
| Ratios (%) (to average net assets) and Supplemental data: |
| |||
Expenses before expense reductions (f) | 0.78 | (a) | ||
Expenses after expense reductions (f) | 0.67 | (a) | ||
Net investment income (loss) | 2.74 | (a) | ||
Portfolio turnover | 18 | (n) | ||
Net assets at end of period (000 omitted) | $5,800,471 | |||
| (a) | Annualized. |
| (c) | For the period from the commencement of the fund’s investment operations, June 30, 2020, through the stated period end. |
| (d) | Per share data is based on average shares outstanding. |
| (f) | Ratios do not reflect reductions from fees paid indirectly, if applicable. |
| (r) | Certain expenses have been reduced without which performance would have been lower. |
| (n) | Not annualized. |
| (s) | From time to time the fund may receive proceeds from litigation settlements, without which performance would be lower. |
| (t) | Total returns do not include any applicable sales charges. |
| (w) | Per share amount was less than $0.01. |
| (x) | The net asset values and total returns have been calculated on net assets which include adjustments made in accordance with U.S. generally accepted accounting principles required at period end for financial reporting purposes. |
See Notes to Financial Statements
24
Table of Contents
(1) Business and Organization
MFS International Large Cap Value Fund (the fund) is a diversified series of MFS Series Trust X (the trust). The trust is organized as a Massachusetts business trust and is registered under the Investment Company Act of 1940, as amended, as an open-end management investment company.
The fund is an investment company and accordingly follows the investment company accounting and reporting guidance of the Financial Accounting Standards Board (FASB) Accounting Standards Codification Topic 946 Financial Services – Investment Companies.
(2) Significant Accounting Policies
General – The preparation of financial statements in conformity with U.S. generally accepted accounting principles requires management to make estimates and assumptions that affect the reported amounts of assets and liabilities, and disclosure of contingent assets and liabilities at the date of the financial statements and the reported amounts of increases and decreases in net assets from operations during the reporting period. Actual results could differ from those estimates. In the preparation of these financial statements, management has evaluated subsequent events occurring after the date of the fund’s Statement of Assets and Liabilities through the date that the financial statements were issued. The fund invests in foreign securities. Investments in foreign securities are vulnerable to the effects of changes in the relative values of the local currency and the U.S. dollar and to the effects of changes in each country’s market, economic, industrial, political, regulatory, geopolitical, environmental, public health, and other conditions.
In March 2020, the FASB issued Accounting Standards Update 2020-04, Reference Rate Reform (Topic 848) – Facilitation of the Effects of Reference Rate Reform on Financial Reporting (“ASU 2020-04”), which provides optional, temporary relief for certain reference rate-related contract modifications due to the planned discontinuation of the London Interbank Offered Rate (LIBOR) and other IBOR-based reference rates as of the end of 2021. In March 2021, the administrator for LIBOR announced the extension of the publication of the more commonly used U.S. dollar LIBOR settings to the end of June 2023. Management is still evaluating the impact of ASU 2020-04 on the fund’s accounting for investments, derivatives, debt and other contracts that will undergo reference rate-related modifications as a result of the reference rate reform.
Balance Sheet Offsetting – The fund’s accounting policy with respect to balance sheet offsetting is that, absent an event of default by the counterparty or a termination of the agreement, the International Swaps and Derivatives Association (ISDA) Master Agreement, or similar agreement, does not result in an offset of reported amounts of financial assets and financial liabilities in the Statement of Assets and Liabilities across transactions between the fund and the applicable counterparty. The fund’s right to setoff may be restricted or prohibited by the bankruptcy or insolvency laws of the particular jurisdiction to which a specific master netting agreement counterparty is
25
Table of Contents
Notes to Financial Statements – continued
subject. Balance sheet offsetting disclosures, to the extent applicable to the fund, have been included in the fund’s Significant Accounting Policies note under the captions for each of the fund’s in-scope financial instruments and transactions.
Investment Valuations – Equity securities, including restricted equity securities, are generally valued at the last sale or official closing price on their primary market or exchange as provided by a third-party pricing service. Equity securities, for which there were no sales reported that day, are generally valued at the last quoted daily bid quotation on their primary market or exchange as provided by a third-party pricing service. Short-term instruments with a maturity at issuance of 60 days or less may be valued at amortized cost, which approximates market value. Open-end investment companies are generally valued at net asset value per share. Securities and other assets generally valued on the basis of information from a third-party pricing service may also be valued at a broker/dealer bid quotation. In determining values, third-party pricing services can utilize both transaction data and market information such as yield, quality, coupon rate, maturity, type of issue, trading characteristics, and other market data. The values of foreign securities and other assets and liabilities expressed in foreign currencies are converted to U.S. dollars using the mean of bid and asked prices for rates provided by a third-party pricing service.
The Board of Trustees has delegated primary responsibility for determining or causing to be determined the value of the fund’s investments (including any fair valuation) to the adviser pursuant to valuation policies and procedures approved by the Board. If the adviser determines that reliable market quotations are not readily available, investments are valued at fair value as determined in good faith by the adviser in accordance with such procedures under the oversight of the Board of Trustees. Under the fund’s valuation policies and procedures, market quotations are not considered to be readily available for most types of debt instruments and floating rate loans and many types of derivatives. These investments are generally valued at fair value based on information from third-party pricing services. In addition, investments may be valued at fair value if the adviser determines that an investment’s value has been materially affected by events occurring after the close of the exchange or market on which the investment is principally traded (such as foreign exchange or market) and prior to the determination of the fund’s net asset value, or after the halt of trading of a specific security where trading does not resume prior to the close of the exchange or market on which the security is principally traded. Events that occur after foreign markets close (such as developments in foreign markets and significant movements in the U.S. markets) and prior to the determination of the fund’s net asset value may be deemed to have a material effect on the value of securities traded in foreign markets. Accordingly, the fund’s foreign equity securities may often be valued at fair value. The adviser generally relies on third-party pricing services or other information (such as the correlation with price movements of similar securities in the same or other markets; the type, cost and investment characteristics of the security; the business and financial condition of the issuer; and trading and other market data) to assist in determining whether to fair value and at what value to fair value an investment. The value of an investment for purposes of calculating the fund’s net asset value can differ depending on the source and method used to determine value. When fair valuation is used, the value of an investment used to determine the fund’s net asset value may differ from quoted or
26
Table of Contents
Notes to Financial Statements – continued
published prices for the same investment. There can be no assurance that the fund could obtain the fair value assigned to an investment if it were to sell the investment at the same time at which the fund determines its net asset value per share.
Various inputs are used in determining the value of the fund’s assets or liabilities. These inputs are categorized into three broad levels. In certain cases, the inputs used to measure fair value may fall into different levels of the fair value hierarchy. In such cases, an investment’s level within the fair value hierarchy is based on the lowest level of input that is significant to the fair value measurement. The fund’s assessment of the significance of a particular input to the fair value measurement in its entirety requires judgment, and considers factors specific to the investment. Level 1 includes unadjusted quoted prices in active markets for identical assets or liabilities. Level 2 includes other significant observable market-based inputs (including quoted prices for similar securities, interest rates, prepayment speed, and credit risk). Level 3 includes unobservable inputs, which may include the adviser’s own assumptions in determining the fair value of investments. The following is a summary of the levels used as of May 31, 2021 in valuing the fund’s assets or liabilities:
| Financial Instruments | Level 1 | Level 2 | Level 3 | Total | ||||||||||||
| Equity Securities | $5,702,281,337 | $— | $— | $5,702,281,337 | ||||||||||||
| Mutual Funds | 100,653,131 | — | — | 100,653,131 | ||||||||||||
| Total | $5,802,934,468 | $— | $— | $5,802,934,468 | ||||||||||||
For further information regarding security characteristics, see the Portfolio of Investments.
Foreign Currency Translation – Purchases and sales of foreign investments, income, and expenses are converted into U.S. dollars based upon currency exchange rates prevailing on the respective dates of such transactions or on the reporting date for foreign denominated receivables and payables. Gains and losses attributable to foreign currency exchange rates on sales of securities are recorded for financial statement purposes as net realized gains and losses on investments. Gains and losses attributable to foreign exchange rate movements on receivables, payables, income and expenses are recorded for financial statement purposes as foreign currency transaction gains and losses. That portion of both realized and unrealized gains and losses on investments that results from fluctuations in foreign currency exchange rates is not separately disclosed.
Security Loans – Under its Securities Lending Agency Agreement with the fund, JPMorgan Chase and Co., as lending agent, loans the securities of the fund to certain qualified institutions (the “Borrowers”) approved by the fund. Security loans can be terminated at the discretion of either the lending agent or the fund and the related securities must be returned within the earlier of the standard trade settlement period for such securities or within three business days. The loans are collateralized by cash and/or U.S. Treasury and federal agency obligations in an amount typically at least equal to the market value of the securities loaned. On loans collateralized by cash, the cash collateral is invested in a money market fund. The market value of the loaned securities is determined at the close of business of the fund and any additional required
27
Table of Contents
Notes to Financial Statements – continued
collateral is delivered to the fund on the next business day. The lending agent provides the fund with indemnification against Borrower default. In the event of Borrower default, the lending agent will, for the benefit of the fund, either purchase securities identical to those loaned or, when such purchase is commercially impracticable, pay the fund the market value of the loaned securities. In return, the lending agent assumes the fund’s rights to the related collateral. If the collateral value is less than the cost to purchase identical securities, the lending agent is responsible for the shortfall, but only to the extent that such shortfall is not due to a decline in collateral value resulting from collateral reinvestment for which the fund bears the risk of loss. At period end, the fund had investment securities on loan, all of which were classified as equity securities in the fund’s Portfolio of Investments, with a fair value of $33,409,224. The fair value of the fund’s investment securities on loan and a related liability of $34,922,900 for cash collateral received on securities loaned are both presented gross in the Statement of Assets and Liabilities. The collateral on securities loaned exceeded the value of securities on loan at period end. A portion of the income generated upon investment of the collateral is remitted to the Borrowers, and the remainder is allocated between the fund and the lending agent. On loans collateralized by U.S. Treasury and/or federal agency obligations, a fee is received from the Borrower, and is allocated between the fund and the lending agent. Income from securities lending is separately reported in the Statement of Operations. The dividend and interest income earned on the securities loaned is accounted for in the same manner as other dividend and interest income.
Indemnifications – Under the fund’s organizational documents, its officers and Trustees may be indemnified against certain liabilities and expenses arising out of the performance of their duties to the fund. Additionally, in the normal course of business, the fund enters into agreements with service providers that may contain indemnification clauses. The fund’s maximum exposure under these agreements is unknown as this would involve future claims that may be made against the fund that have not yet occurred.
Investment Transactions and Income – Investment transactions are recorded on the trade date. Dividends received in cash are recorded on the ex-dividend date. Certain dividends from foreign securities will be recorded when the fund is informed of the dividend if such information is obtained subsequent to the ex-dividend date. Dividend payments received in additional securities are recorded on the ex-dividend date in an amount equal to the value of the security on such date.
The fund may receive proceeds from litigation settlements. Any proceeds received from litigation involving portfolio holdings are reflected in the Statement of Operations in realized gain/loss if the security has been disposed of by the fund or in unrealized gain/loss if the security is still held by the fund. Any other proceeds from litigation not related to portfolio holdings are reflected as other income in the Statement of Operations.
Fees Paid Indirectly – The fund’s custody fee may be reduced by a credit earned under an arrangement that measures the value of U.S. dollars deposited with the custodian by the fund. The amount of the credit, for the period ended May 31, 2021, is shown as a reduction of total expenses in the Statement of Operations.
28
Table of Contents
Notes to Financial Statements – continued
Tax Matters and Distributions – The fund intends to qualify as a regulated investment company, as defined under Subchapter M of the Internal Revenue Code, and to distribute all of its taxable income, including realized capital gains. As a result, no provision for federal income tax is required. The fund’s federal tax returns, when filed, will remain subject to examination by the Internal Revenue Service for a three year period. Management has analyzed the fund’s tax positions taken on federal and state tax returns for all open tax years and does not believe that there are any uncertain tax positions that require recognition of a tax liability. Foreign taxes, if any, have been accrued by the fund in the accompanying financial statements in accordance with the applicable foreign tax law. Foreign income taxes may be withheld by certain countries in which the fund invests. Additionally, capital gains realized by the fund on securities issued in or by certain foreign countries may be subject to capital gains tax imposed by those countries.
Distributions to shareholders are recorded on the ex-dividend date. Income and capital gain distributions are determined in accordance with income tax regulations, which may differ from U.S. generally accepted accounting principles. Certain capital accounts in the financial statements are periodically adjusted for permanent differences in order to reflect their tax character. These adjustments have no impact on net assets or net asset value per share. Temporary differences which arise from recognizing certain items of income, expense, gain or loss in different periods for financial statement and tax purposes will reverse at some time in the future.
Book/tax differences primarily relate to passive foreign investment companies and wash sale loss deferrals.
The tax character of distributions declared to shareholders for the last fiscal period is as follows:
| 5/31/21 (c) | ||||
| Ordinary income (including any short-term capital gains) | $22,826,639 | |||
| (c) | For the period from the commencement of the fund’s investment operations, June 30, 2020, through the stated period end. |
The federal tax cost and the tax basis components of distributable earnings were as follows:
| As of 5/31/21 | ||||
| Cost of investments | $4,672,393,436 | |||
| Gross appreciation | 1,160,057,344 | |||
| Gross depreciation | (29,516,312 | ) | ||
| Net unrealized appreciation (depreciation) | $1,130,541,032 | |||
| Undistributed ordinary income | 154,206,597 | |||
| Other temporary differences | (943,565 | ) | ||
| Total distributable earnings (loss) | $1,283,804,064 | |||
Multiple Classes of Shares of Beneficial Interest – The fund offers multiple classes of shares, which differ in their respective distribution and service fees. The fund’s income, realized and unrealized gain (loss), and common expenses are allocated to
29
Table of Contents
Notes to Financial Statements – continued
shareholders based on the daily net assets of each class. Dividends are declared separately for each class. Differences in per share dividend rates are generally due to differences in separate class expenses. Class C shares will convert to Class A shares approximately eight years after purchase. The fund’s distributions declared to shareholders as reported in the Statements of Changes in Net Assets are presented by class as follows:
| Year ended 5/31/21 (c) | ||||
| Class A | $1,936 | |||
| Class C | 5 | |||
| Class I | 7,461 | |||
| Class R1 | 5 | |||
| Class R2 | 18 | |||
| Class R3 | 203 | |||
| Class R4 | 389 | |||
| Class R6 | 22,816,622 | |||
| Total | $22,826,639 | |||
| (c) | For the period from the commencement of the fund’s investment operations, June 30, 2020, through the stated period end. |
(3) Transactions with Affiliates
Investment Adviser – The fund has an investment advisory agreement with MFS to provide overall investment management and related administrative services and facilities to the fund. The management fee is computed daily and paid monthly at the following annual rates based on the fund’s average daily net assets:
| Up to $2.5 billion | 0.75 | % | ||
| In excess of $2.5 billion and up to $5 billion | 0.70 | % | ||
| In excess of $5 billion and up to $10 billion | 0.65 | % | ||
| In excess of $10 billion and up to $20 billion | 0.62 | % | ||
| In excess of $20 billion | 0.60 | % |
MFS has agreed in writing to reduce its management fee by a specified amount if certain MFS mutual fund assets exceed thresholds agreed to by MFS and the fund’s Board of Trustees. For the period ended May 31, 2021, this management fee reduction amounted to $414,123, which is included in the reduction of total expenses in the Statement of Operations. The management fee incurred for the period ended May 31, 2021 was equivalent to an annual effective rate of 0.72% of the fund’s average daily net assets.
The investment adviser has agreed in writing to pay a portion of the fund’s total annual operating expenses, excluding interest, taxes, extraordinary expenses, brokerage and transaction costs, and investment-related expenses, such that total fund operating expenses do not exceed the following rates annually of each class’s average daily net assets:
| Classes | ||||||||||||||||||||||||||||
| A | C | I | R1 | R2 | R3 | R4 | R6 | |||||||||||||||||||||
| 0.96% | 1.71% | 0.71% | 1.71% | 1.21% | 0.96% | 0.71% | 0.67% | |||||||||||||||||||||
30
Table of Contents
Notes to Financial Statements – continued
This written agreement will continue until modified by the fund’s Board of Trustees, but such agreement will continue at least until September 30, 2022. For the period ended May 31, 2021, this reduction amounted to $3,427,150, which is included in the reduction of total expenses in the Statement of Operations.
Distributor – MFS Fund Distributors, Inc. (MFD), a wholly-owned subsidiary of MFS, as distributor, received $267 for the period ended May 31, 2021, as its portion of the initial sales charge on sales of Class A shares of the fund.
The Board of Trustees has adopted a distribution plan for certain share classes pursuant to Rule 12b-1 of the Investment Company Act of 1940.
The fund’s distribution plan provides that the fund will pay MFD for services provided by MFD and financial intermediaries in connection with the distribution and servicing of certain share classes. One component of the plan is a distribution fee paid to MFD and another component of the plan is a service fee paid to MFD. MFD may subsequently pay all, or a portion, of the distribution and/or service fees to financial intermediaries.
Distribution Plan Fee Table:
| Distribution Fee Rate (d) | Service Fee Rate (d) | Total Distribution Plan (d) | Annual Effective Rate (e) | Distribution and Service Fee | ||||||||||||||||
| Class A | — | 0.25% | 0.25% | 0.25% | $1,237 | |||||||||||||||
| Class C | 0.75% | 0.25% | 1.00% | 1.00% | 1,638 | |||||||||||||||
| Class R1 | 0.75% | 0.25% | 1.00% | 1.00% | 1,097 | |||||||||||||||
| Class R2 | 0.25% | 0.25% | 0.50% | 0.50% | 549 | |||||||||||||||
| Class R3 | — | 0.25% | 0.25% | 0.25% | 275 | |||||||||||||||
| Total Distribution and Service Fees |
| $4,796 | ||||||||||||||||||
| (d) | In accordance with the distribution plan for certain classes, the fund pays distribution and/or service fees equal to these annual percentage rates of each class’s average daily net assets. The distribution and service fee rates disclosed by class represent the current rates in effect at the end of the reporting period. Any rate changes, if applicable, are detailed below. |
| (e) | The annual effective rates represent actual fees incurred under the distribution plan for the period ended May 31, 2021 based on each class’s average daily net assets. MFD has voluntarily agreed to rebate a portion of each class’s 0.25% service fee attributable to accounts for which there is no financial intermediary specified on the account except for accounts attributable to MFS or its affiliates’ seed money. There were no service fee rebates for the period ended May 31, 2021. |
Certain Class A shares are subject to a contingent deferred sales charge (CDSC) in the event of a shareholder redemption within 18 months of purchase. Class C shares are subject to a CDSC in the event of a shareholder redemption within 12 months of purchase. There were no contingent deferred sales charges imposed during the period ended May 31, 2021.
Shareholder Servicing Agent – MFS Service Center, Inc. (MFSC), a wholly-owned subsidiary of MFS, receives a fee from the fund for its services as shareholder servicing agent calculated as a percentage of the average daily net assets of the fund as determined periodically under the supervision of the fund’s Board of Trustees. For the period ended May 31, 2021, the fee was $393, which equated to 0.00001% annually of the fund’s average daily net assets. MFSC also receives reimbursement from the fund for out-of-pocket expenses, sub-accounting and other shareholder servicing costs
31
Table of Contents
Notes to Financial Statements – continued
which may be paid to affiliated and unaffiliated service providers. Class R6 shares do not incur sub-accounting fees. For the period ended May 31, 2021, these out-of-pocket expenses, sub-accounting and other shareholder servicing costs amounted to $500.
Administrator – MFS provides certain financial, legal, shareholder communications, compliance, and other administrative services to the fund. Under an administrative services agreement, the fund reimburses MFS the costs incurred to provide these services. The fund is charged an annual fixed amount of $17,500 plus a fee based on average daily net assets. The administrative services fee incurred for the period ended May 31, 2021 was equivalent to an annual effective rate of 0.0112% of the fund’s average daily net assets.
Trustees’ and Officers’ Compensation – The fund pays compensation to independent Trustees in the form of a retainer, attendance fees, and additional compensation to Board and Committee chairpersons. The fund does not pay compensation directly to Trustees or officers of the fund who are also officers of the investment adviser, all of whom receive remuneration from MFS for their services to the fund. Certain officers and Trustees of the fund are officers or directors of MFS, MFD, and MFSC.
Other – The fund invests in the MFS Institutional Money Market Portfolio which is managed by MFS and seeks current income consistent with preservation of capital and liquidity. This money market fund does not pay a management fee to MFS but does incur investment and operating costs.
On June 29, 2020, MFS purchased 185,000 shares of Class R6 and 5,000 shares each of Class A, Class C, Class I, Class R1, Class R2, Class R3, and Class R4 for an aggregate amount of $2,200,000 as an initial investment in the fund.
On July 14, 2020, MFS purchased 25,218 shares each of Class A, Class C, Class R1, Class R2, and Class R3, and 25,193 shares each of Class I and Class R4 for an aggregate amount of $1,820,000.
On July 14, 2020, MFS redeemed 176,528 shares of Class R6 for an aggregate amount of $1,820,000.
On September 9, 2020, MFS redeemed 23,541 shares each of Class C and Class R1, 23,496 shares each of Class I and Class R4, and 23,518 shares each of Class R2 and Class R3 for an aggregate amount of $1,500,000.
At May 31, 2021, MFS held 100% of the outstanding shares each of Class R1, Class R2, Class R3, and Class R4.
The fund is permitted to engage in purchase and sale transactions with funds and accounts for which MFS serves as investment adviser or sub-adviser (“cross-trades”) pursuant to a policy adopted by the Board of Trustees. This policy has been designed to ensure that cross-trades conducted by the fund comply with Rule 17a-7 under the Investment Company Act of 1940. During the period ended May 31, 2021, the fund engaged in purchase transactions pursuant to this policy, which amounted to $1,910,223.
32
Table of Contents
Notes to Financial Statements – continued
(4) Portfolio Securities
For the period ended May 31, 2021, purchases and sales of investments, other than short-term obligations, aggregated $5,144,713,135 and $650,334,918, respectively.
(5) Shares of Beneficial Interest
The fund’s Declaration of Trust permits the Trustees to issue an unlimited number of full and fractional shares of beneficial interest. Transactions in fund shares were as follows:
| Year ended 5/31/21 (c) | ||||||||
| Shares | Amount | |||||||
| Shares sold | ||||||||
Class A | 87,104 | $1,024,100 | ||||||
Class C | 71,033 | 848,052 | ||||||
Class I | 229,684 | 2,607,596 | ||||||
Class R1 | 30,218 | 310,006 | ||||||
Class R2 | 30,218 | 309,999 | ||||||
Class R3 | 30,218 | 310,000 | ||||||
Class R4 | 30,193 | 310,000 | ||||||
Class R6 | 425,699,919 | 4,541,501,282 | ||||||
| 426,208,587 | $4,547,221,035 | |||||||
| Shares issued to shareholders in reinvestment of distributions | ||||||||
Class A | 164 | $1,936 | ||||||
Class C | 1 | 5 | ||||||
Class I | 633 | 7,461 | ||||||
Class R2 | 2 | 18 | ||||||
Class R3 | 17 | 203 | ||||||
Class R4 | 33 | 389 | ||||||
Class R6 | 1,936,895 | 22,816,622 | ||||||
| 1,937,745 | $22,826,634 | |||||||
| Shares reacquired | ||||||||
Class A | (353 | ) | $(4,403 | ) | ||||
Class C | (24,308 | ) | (260,209 | ) | ||||
Class I | (27,551 | ) | (305,479 | ) | ||||
Class R1 | (23,541 | ) | (250,000 | ) | ||||
Class R2 | (23,518 | ) | (250,000 | ) | ||||
Class R3 | (23,518 | ) | (250,000 | ) | ||||
Class R4 | (23,496 | ) | (250,000 | ) | ||||
Class R6 | (3,673,688 | ) | (46,843,532 | ) | ||||
| (3,819,973 | ) | $(48,413,623 | ) | |||||
33
Table of Contents
Notes to Financial Statements – continued
| Year ended 5/31/21 (c) | ||||||||
| Shares | Amount | |||||||
| Net change | ||||||||
Class A | 86,915 | $1,021,633 | ||||||
Class C | 46,726 | 587,848 | ||||||
Class I | 202,766 | 2,309,578 | ||||||
Class R1 | 6,677 | 60,006 | ||||||
Class R2 | 6,702 | 60,017 | ||||||
Class R3 | 6,717 | 60,203 | ||||||
Class R4 | 6,730 | 60,389 | ||||||
Class R6 | 423,963,126 | 4,517,474,372 | ||||||
| 424,326,359 | $4,521,634,046 | |||||||
| (c) | For the period from the commencement of the fund’s investment operations, June 30, 2020, through the stated period end. |
(6) Line of Credit
The fund and certain other funds managed by MFS participate in a $1.25 billion unsecured committed line of credit of which $1 billion is reserved for use by the fund and certain other MFS U.S. funds. The line of credit is provided by a syndicate of banks under a credit agreement. Borrowings may be made for temporary financing needs. Interest is charged to each fund, based on its borrowings, generally at a rate equal to the highest of one month LIBOR, the Federal Funds Effective Rate and the Overnight Bank Funding Rate, plus an agreed upon spread. A commitment fee, based on the average daily, unused portion of the committed line of credit, is allocated among the participating funds. In addition, the fund and other funds managed by MFS have established unsecured uncommitted borrowing arrangements with certain banks for temporary financing needs. Interest is charged to each fund, based on its borrowings, at rates equal to customary reference rates plus an agreed upon spread. For the year ended May 31, 2021, the fund’s commitment fee and interest expense were $6,500 and $0, respectively, and are included in “Miscellaneous” expense in the Statement of
Operations.
(7) Investments in Affiliated Issuers
An affiliated issuer may be considered one in which the fund owns 5% or more of the outstanding voting securities, or a company which is under common control. For the purposes of this report, the following were affiliated issuers:
| Affiliated Issuers | Beginning Value | Purchases | Sales Proceeds | Realized Gain (Loss) | Change in Unrealized Appreciation or Depreciation | Ending Value | ||||||||||||||||||
| MFS Institutional Money Market Portfolio | $— | $1,343,021,398 | $1,277,290,870 | $(297 | ) | $— | $65,730,231 | |||||||||||||||||
| Affiliated Issuers | Dividend Income | Capital Gain Distributions | ||||||||||||||||||||||
| MFS Institutional Money Market Portfolio | $36,511 | $— | ||||||||||||||||||||||
34
Table of Contents
Notes to Financial Statements – continued
(8) Impacts of COVID-19
The pandemic related to the global spread of novel coronavirus disease (COVID-19), which was first detected in December 2019, has resulted in significant disruptions to global business activity and the global economy, as well as the economies of individual countries, the financial performance of individual companies and sectors, and the securities and commodities markets in general. Multiple surges in cases globally, the availability and widespread adoption of vaccines, and the emergence of variant strains of the virus continue to create uncertainty as to the future and long-term impacts resulting from the pandemic including impacts to the prices and liquidity of the fund’s investments and the fund’s performance.
35
Table of Contents
REPORT OF INDEPENDENT REGISTERED PUBLIC ACCOUNTING FIRM
To the Shareholders of MFS International Large Cap Value Fund and the Board of Trustees of MFS Series Trust X
Opinion on the Financial Statements
We have audited the accompanying statement of assets and liabilities of MFS International Large Cap Value Fund (the “Fund”) (one of the funds constituting MFS Series Trust X (the “Trust”)), including the portfolio of investments, as of May 31, 2021, and the related statements of operations, changes in net assets and the financial highlights for the period from June 30, 2020 (commencement of operations) through May 31, 2021 and the related notes (collectively referred to as the “financial statements”). In our opinion, the financial statements present fairly, in all material respects, the financial position of the Fund (one of the funds constituting MFS Series Trust X) at May 31, 2021, the results of its operations, the changes in its net assets and its financial highlights for the period from June 30, 2020 (commencement of operations) through May 31, 2021, in conformity with U.S. generally accepted accounting principles.
Basis for Opinion
These financial statements are the responsibility of the Trust’s management. Our responsibility is to express an opinion on the Fund’s financial statements based on our audit. We are a public accounting firm registered with the Public Company Accounting Oversight Board (United States) (“PCAOB”) and are required to be independent with respect to the Trust in accordance with the U.S. federal securities laws and the applicable rules and regulations of the Securities and Exchange Commission and the PCAOB.
We conducted our audit in accordance with the standards of the PCAOB. Those standards require that we plan and perform the audit to obtain reasonable assurance about whether the financial statements are free of material misstatement, whether due to error or fraud. The Trust is not required to have, nor were we engaged to perform, an audit of the Trust’s internal control over financial reporting. As part of our audit, we are required to obtain an understanding of internal control over financial reporting but not for the purpose of expressing an opinion on the effectiveness of the Trust’s internal control over financial reporting. Accordingly, we express no such opinion.
Our audit included performing procedures to assess the risks of material misstatement of the financial statements, whether due to error or fraud, and performing procedures that respond to those risks. Such procedures included examining, on a test basis, evidence regarding the amounts and disclosures in the financial statements. Our procedures included confirmation of securities owned as of May 31, 2021, by correspondence with the custodian and others. Our audit also included evaluating the
36
Table of Contents
Report of Independent Registered Public Accounting Firm – continued
accounting principles used and significant estimates made by management, as well as evaluating the overall presentation of the financial statements. We believe that our audit provides a reasonable basis for our opinion.

We have served as the auditor of one or more MFS investment companies since 1993.
Boston, Massachusetts
July 16, 2021
37
Table of Contents
TRUSTEES AND OFFICERS — IDENTIFICATION AND BACKGROUND
The Trustees and Officers of the Trust, as of July 1, 2021, are listed below, together with their principal occupations during the past five years. (Their titles may have varied during that period.) The address of each Trustee and Officer is 111 Huntington Avenue, Boston, Massachusetts 02199-7618.
Name, Age | Position(s) with Fund | Trustee/Officer Since (h) | Number of | Principal the Past Five Years | Other Directorships | |||||
| INTERESTED TRUSTEES | ||||||||||
| Robert J. Manning (k) (age 57) | Trustee | February 2004 | 135 | Massachusetts Financial Services Company, Non-Executive Chairman (since January 2021); Director; Chairman of the Board; Executive Chairman (January 2017-2020); Co-Chief Executive Officer (2015-2016) | N/A | |||||
Michael W. Roberge (k) (age 54) | Trustee | January 2021 | 135 | Massachusetts Financial Services Company, Chairman (since January 2021); Chief Executive Officer (since January 2017); Director; President (until December 2018); Chief Investment Officer (until December 2018); Co-Chief Executive Officer (until December 2016) | N/A | |||||
| INDEPENDENT TRUSTEES | ||||||||||
John P. Kavanaugh (age 66) | Trustee and Chair of Trustees | January 2009 | 135 | Private investor | N/A | |||||
Steven E. Buller (age 69) | Trustee | February 2014 | 135 | Private investor | N/A | |||||
John A. Caroselli (age 67) | Trustee | March 2017 | 135 | Private investor; JC Global Advisors, LLC (management consulting), President (since 2015) | N/A | |||||
38
Table of Contents
Trustees and Officers – continued
Name, Age | Position(s) with Fund | Trustee/Officer Since (h) | Number of | Principal the Past Five Years | Other Directorships | |||||
Maureen R. Goldfarb (age 66) | Trustee | January 2009 | 135 | Private investor | N/A | |||||
| Peter D. Jones (age 65) | Trustee | January 2019 | 135 | Private investor | N/A | |||||
| James W. Kilman, Jr. (age 60) | Trustee | January 2019 | 135 | Burford Capital Limited (finance and investment management), Senior Advisor (since May 3, 2021), Chief Financial Officer (2019-May 2, 2021); KielStrand Capital LLC (family office), Chief Executive Officer (since 2016); Morgan Stanley & Co. (financial services), Vice Chairman of Investment Banking, Co-Head of Diversified Financials Coverage – Financial Institutions Investment Banking Group (until 2016) | Alpha-En Corporation, Director (2016-2019) | |||||
| Clarence Otis, Jr. (age 65) | Trustee | March 2017 | 135 | Private investor | VF Corporation, Director; Verizon Communications, Inc., Director; The Travelers Companies, Director | |||||
| Maryanne L. Roepke (age 65) | Trustee | May 2014 | 135 | Private investor | N/A | |||||
| Laurie J. Thomsen (age 63) | Trustee | March 2005 | 135 | Private investor | The Travelers Companies, Director; Dycom Industries, Inc., Director | |||||
39
Table of Contents
Trustees and Officers – continued
Name, Age | Position(s) Held with Fund | Trustee/Officer Since (h) | Number of | Principal the Past Five Years | ||||
| OFFICERS | ||||||||
| Christopher R. Bohane (k) (age 47) | Assistant Secretary and Assistant Clerk | July 2005 | 135 | Massachusetts Financial Services Company, Senior Vice President and Associate General Counsel | ||||
Kino Clark (k) (age 53) | Assistant Treasurer | January 2012 | 135 | Massachusetts Financial Services Company, Vice President | ||||
John W. Clark, Jr. (k) (age 54) | Assistant Treasurer | April 2017 | 135 | Massachusetts Financial Services Company, Vice President (since March 2017); Deutsche Bank (financial services), Department Head – Treasurer’s Office (until February 2017) | ||||
Thomas H. Connors (k) (age 61) | Assistant Secretary and Assistant Clerk | September 2012 | 135 | Massachusetts Financial Services Company, Vice President and Senior Counsel | ||||
| David L. DiLorenzo (k) (age 52) | President | July 2005 | 135 | Massachusetts Financial Services Company, Senior Vice President | ||||
Heidi W. Hardin (k) (age 53) | Secretary and Clerk | April 2017 | 135 | Massachusetts Financial Services Company, Executive Vice President and General Counsel (since March 2017); Harris Associates (investment management), General Counsel (until January 2017) | ||||
Brian E. Langenfeld (k) (age 48) | Assistant Secretary and Assistant Clerk | June 2006 | 135 | Massachusetts Financial Services Company, Vice President and Senior Counsel | ||||
Amanda S. Mooradian (k) (age 42) | Assistant Secretary and Assistant Clerk | September 2018 | 135 | Massachusetts Financial Services Company, Assistant Vice President and Senior Counsel | ||||
| Susan A. Pereira (k) (age 50) | Assistant Secretary and Assistant Clerk | July 2005 | 135 | Massachusetts Financial Services Company, Vice President and Assistant General Counsel | ||||
Kasey L. Phillips (k) (age 50) | Assistant Treasurer | September 2012 | 135 | Massachusetts Financial Services Company, Vice President | ||||
40
Table of Contents
Trustees and Officers – continued
Name, Age | Position(s) Held with Fund | Trustee/Officer Since (h) | Number of | Principal the Past Five Years | ||||
Matthew A. Stowe (k) (age 46) | Assistant Secretary and Assistant Clerk | October 2014 | 135 | Massachusetts Financial Services Company, Vice President and Assistant General Counsel | ||||
Martin J. Wolin (k) (age 53) | Chief Compliance Officer | July 2015 | 135 | Massachusetts Financial Services Company, Senior Vice President and Chief Compliance Officer | ||||
| James O. Yost (k) (age 61) | Treasurer | September 1990 | 135 | Massachusetts Financial Services Company, Senior Vice President | ||||
| (h) | Date first appointed to serve as Trustee/Officer of an MFS Fund. Each Trustee has served continuously since appointment unless indicated otherwise. For the period from December 15, 2004 until February 22, 2005, Mr. Manning served as Advisory Trustee. From January 2012 through December 2016, Messrs. DiLorenzo and Yost served as Treasurer and Deputy Treasurer of the Funds, respectively. |
| (j) | Directorships or trusteeships of companies required to report to the Securities and Exchange Commission (i.e., “public companies”). |
| (k) | “Interested person” of the Trust within the meaning of the Investment Company Act of 1940 (referred to as the 1940 Act), which is the principal federal law governing investment companies like the fund, as a result of a position with MFS. The address of MFS is 111 Huntington Avenue, Boston, Massachusetts 02199-7618. |
Each Trustee (other than Messrs. Jones, Kilman and Roberge) has been elected by shareholders and each Trustee and Officer holds office until his or her successor is chosen and qualified or until his or her earlier death, resignation, retirement or removal. Mr. Roberge became a Trustee of the Funds on January 1, 2021 and Messrs. Jones and Kilman became Trustees of the Funds on January 1, 2019. The Trust does not hold annual meetings for the purpose of electing Trustees, and Trustees are not elected for fixed terms. Under the terms of the Board’s retirement policy, an Independent Trustee shall retire at the end of the calendar year in which he or she reaches the earlier of 75 years of age or 15 years of service on the Board (or, in the case of any Independent Trustee who joined the Board prior to 2015, 20 years of service on the Board).
Messrs. Buller, Kilman and Otis and Ms. Roepke are members of the Trust’s Audit Committee.
Each of the Interested Trustees and certain Officers hold comparable officer positions with certain affiliates of MFS.
41
Table of Contents
Trustees and Officers – continued
The Statement of Additional Information for a Fund includes further information about the Trustees and is available without charge upon request by calling 1-800-225-2606.
| Investment Adviser | Custodian | |
Massachusetts Financial Services Company Boston, MA 02199-7618 | JPMorgan Chase Bank, NA 4 Metrotech Center New York, NY 11245 | |
| Distributor | Independent Registered Public Accounting Firm | |
MFS Fund Distributors, Inc. Boston, MA 02199-7618 | Ernst & Young LLP 200 Clarendon Street Boston, MA 02116 | |
| Portfolio Manager(s) | ||
Steven Gorham David Shindler |
42
Table of Contents
STATEMENT REGARDING LIQUIDITY RISK MANAGEMENT PROGRAM
The fund has adopted and implemented a liquidity risk management program (the “Program”) as required by Rule 22e-4 under the Investment Company Act of 1940, as amended. The fund’s Board of Trustees (the “Board”) has designated MFS as the administrator of the Program. The Program is reasonably designed to assess and manage the liquidity risk of the fund. Liquidity risk is the risk that the fund could not meet requests to redeem shares issued by the fund without significant dilution of remaining investors’ interests.
MFS provided a written report to the Board for consideration at its April 2021 meeting that addressed the operation of the Program and provided an assessment of the adequacy and effectiveness of the Program during the period from June 30, 2020 to December 31, 2020 (the “Covered Period”). The report concluded that during the Covered Period the Program had operated effectively and had adequately and effectively been implemented to assess and manage the fund’s liquidity risk. MFS also reported that there were no liquidity events that impacted the fund or its ability to timely meet redemptions without dilution to existing shareholders during the Covered Period.
There can be no assurance that the Program will achieve its objectives in the future. Further information on liquidity risk, and other principal risks to which an investment in the fund may be subject, can be found in the prospectus.
43
Table of Contents
PROXY VOTING POLICIES AND INFORMATION
MFS votes proxies on behalf of the fund pursuant to proxy voting policies and procedures that are available without charge, upon request, by calling 1-800-225-2606, by visiting mfs.com/proxyvoting, or by visiting the SEC Web site at http://www.sec.gov.
Information regarding how the fund voted proxies relating to portfolio securities during the most recent twelve-month period ended June 30 is available by August 31 of each year without charge by visiting mfs.com/proxyvoting, or by visiting the SEC’s Web site at http://www.sec.gov.
QUARTERLY PORTFOLIO DISCLOSURE
The fund files a complete schedule of portfolio holdings with the SEC for the first and third quarters of each fiscal year as an exhibit to its reports on Form N-PORT. The fund’s Form N-PORT reports are available on the SEC’s Web site at http://www.sec.gov. A shareholder can obtain the portfolio holdings report for the first and third quarters of the fund’s fiscal year at mfs.com/openendfunds by choosing the fund’s name and then scrolling to the “Resources” section and clicking on the “Prospectus and Reports” tab.
From time to time, MFS may post important information about the fund or the MFS Funds on the MFS Web site (mfs.com). This information is available at https://www.mfs.com/announcements or at mfs.com/openendfunds by choosing the fund’s name and then scrolling to the “Resources” section and clicking on the “Announcements” tab, if any.
INFORMATION ABOUT FUND CONTRACTS AND LEGAL CLAIMS
The fund has entered into contractual arrangements with an investment adviser, administrator, distributor, shareholder servicing agent, 529 program manager (if applicable), and custodian who each provide services to the fund. Unless expressly stated otherwise, shareholders are not parties to, or intended beneficiaries of these contractual arrangements, and these contractual arrangements are not intended to create any shareholder right to enforce them against the service providers or to seek any remedy under them against the service providers, either directly or on behalf of the fund.
Under the Trust’s By-Laws and Declaration of Trust, any claims asserted against or on behalf of the MFS Funds, including claims against Trustees and Officers, must be brought in state and federal courts located within the Commonwealth of Massachusetts.
FEDERAL TAX INFORMATION (unaudited)
The fund will notify shareholders of amounts for use in preparing 2021 income tax forms in January 2022. The following information is provided pursuant to provisions of the Internal Revenue Code.
The fund designates the maximum amount allowable as qualified dividend income eligible to be taxed at the same rate as long-term capital gain.
Income derived from foreign sources was $130,205,295. The fund intends to pass through foreign tax credits of $8,086,127 for the fiscal year.
44
Table of Contents
rev. 3/16
| WHAT DOES MFS DO WITH YOUR PERSONAL INFORMATION? |  | ||
| Why? | Financial companies choose how they share your personal information. Federal law gives consumers the right to limit some but not all sharing. Federal law also requires us to tell you how we collect, share, and protect your personal information. Please read this notice carefully to understand what we do. |
| What? | The types of personal information we collect and share depend on the product or service you have with us. This information can include:
• Social Security number and account balances • Account transactions and transaction history • Checking account information and wire transfer instructions
When you are no longer our customer, we continue to share your information as described in this notice. |
| How? | All financial companies need to share customers’ personal information to run their everyday business. In the section below, we list the reasons financial companies can share their customers’ personal information; the reasons MFS chooses to share; and whether you can limit this sharing. |
| Reasons we can share your personal information | Does MFS share? | Can you limit this sharing? | ||
For our everyday business purposes – such as to process your transactions, maintain your account(s), respond to court orders and legal investigations, or report to credit bureaus | Yes | No | ||
For our marketing purposes – to offer our products and services to you | No | We don’t share | ||
For joint marketing with other financial companies | No | We don’t share | ||
For our affiliates’ everyday business purposes – information about your transactions and experiences | No | We don’t share | ||
For our affiliates’ everyday business purposes – information about your creditworthiness | No | We don’t share | ||
| For nonaffiliates to market to you | No | We don’t share |
| Questions? | Call 800-225-2606 or go to mfs.com. | |
45
Table of Contents
| Page 2 |
| Who we are | ||
| Who is providing this notice? | MFS Funds, MFS Investment Management, MFS Institutional Advisors, Inc., and MFS Heritage Trust Company. | |
| What we do | ||
| How does MFS protect my personal information? | To protect your personal information from unauthorized access and use, we use security measures that comply with federal law. These measures include procedural, electronic, and physical safeguards for the protection of the personal information we collect about you. | |
| How does MFS collect my personal information? | We collect your personal information, for example, when you
• open an account or provide account information • direct us to buy securities or direct us to sell your securities • make a wire transfer
We also collect your personal information from others, such as credit bureaus, affiliates, or other companies. | |
| Why can’t I limit all sharing? | Federal law gives you the right to limit only
• sharing for affiliates’ everyday business purposes – information about your creditworthiness • affiliates from using your information to market to you • sharing for nonaffiliates to market to you
State laws and individual companies may give you additional rights to limit sharing. | |
| Definitions | ||
| Affiliates | Companies related by common ownership or control. They can be financial and nonfinancial companies.
• MFS does not share personal information with affiliates, except for everyday business purposes as described on page one of this notice. | |
| Nonaffiliates | Companies not related by common ownership or control. They can be financial and nonfinancial companies.
• MFS does not share with nonaffiliates so they can market to you. | |
| Joint marketing | A formal agreement between nonaffiliated financial companies that together market financial products or services to you.
• MFS doesn’t jointly market. | |
| Other important information | ||
| If you own an MFS product or receive an MFS service in the name of a third party such as a bank or broker-dealer, their privacy policy may apply to you instead of ours. | ||
46
Table of Contents
Save paper with eDelivery.
| MFS® will send you prospectuses, |

reports, and proxies directly via e-mail so you will get information faster with less mailbox clutter.
To sign up:
1. Go to mfs.com.
2. Log in via MFS® Access.
3. Select eDelivery.
If you own your MFS fund shares through a financial institution or a retirement plan, MFS® TALK, MFS® Access, or eDelivery may not be available to you.
WEB SITE
mfs.com
MFS TALK
1-800-637-8255
24 hours a day
ACCOUNT SERVICE AND LITERATURE
Shareholders
1-800-225-2606
Financial advisors
1-800-343-2829
Retirement plan services
1-800-637-1255
MAILING ADDRESS
MFS Service Center, Inc.
P.O. Box 219341
Kansas City, MO 64121-9341
OVERNIGHT MAIL
MFS Service Center, Inc.
Suite 219341
430 W 7th Street
Kansas City, MO 64105-1407
Table of Contents
| Item 1(b): |
Not applicable
Table of Contents
| ITEM 2. | CODE OF ETHICS. |
The Registrant has adopted a Code of Ethics (the “Code”) pursuant to Section 406 of the Sarbanes-Oxley Act and as defined in Form N-CSR that applies to the Registrant’s principal executive officer and principal financial and accounting officer. During the period covered by this report, the Registrant has not amended any provision in the Code that relates to an element of the Code’s definition enumerated in paragraph (b) of Item 2 of this Form N-CSR. During the period covered by this report, the Registrant did not grant a waiver, including an implicit waiver, from any provision of the Code.
A copy of the Code of Ethics is filed as an exhibit to this Form N-CSR.
| ITEM 3. | AUDIT COMMITTEE FINANCIAL EXPERT. |
Messrs. Steven E. Buller, James Kilman, and Clarence Otis, Jr. and Ms. Maryanne L. Roepke, members of the Audit Committee, have been determined by the Board of Trustees in their reasonable business judgment to meet the definition of “audit committee financial expert” as such term is defined in Form N-CSR. In addition, Messrs. Buller, Kilman, and Otis and Ms. Roepke are “independent” members of the Audit Committee (as such term has been defined by the Securities and Exchange Commission in regulations implementing Section 407 of the Sarbanes-Oxley Act of 2002). The Securities and Exchange Commission has stated that the designation of a person as an audit committee financial expert pursuant to this Item 3 on the Form N-CSR does not impose on such a person any duties, obligations or liability that are greater than the duties, obligations or liability imposed on such person as a member of the Audit Committee and the Board of Trustees in the absence of such designation or identification.
| ITEM 4. | PRINCIPAL ACCOUNTANT FEES AND SERVICES. |
Items 4(a) through 4(d) and 4(g):
The Board of Trustees has appointed Deloitte & Touche LLP (“Deloitte”) to serve as independent accountants to certain series of the Registrant and Ernst & Young LLP (“E&Y”) to serve in the same capacity to certain other series of the Registrant (each a “Fund” and collectively the “Funds”). The tables below set forth the audit fees billed to each Fund as well as fees for non-audit services provided to each Fund and/or to each Fund’s investment adviser, Massachusetts Financial Services Company (“MFS”), and to various entities either controlling, controlled by, or under common control with MFS that provide ongoing services to the Funds (“MFS Related Entities”).
Table of Contents
For the fiscal years ended May 31, 2021 and 2020, audit fees billed to each Fund by Deloitte and E&Y were as follows:
| Audit Fees | ||||||||
| 2021 | 2020 | |||||||
Fees billed by Deloitte: | ||||||||
MFS Blended Research Growth Equity Fund | 48,089 | 47,436 | ||||||
MFS Blended Research Mid Cap Equity Fund | 47,161 | 46,521 | ||||||
MFS Blended Research Small Cap Equity Fund | 49,705 | 49,030 | ||||||
MFS Blended Research Value Equity Fund | 48,089 | 47,436 | ||||||
MFS International Diversification Fund | 30,689 | 30,276 | ||||||
|
|
|
| |||||
Total | 223,733 | 220,699 | ||||||
| Audit Fees | ||||||||
| 2021 | 2020 | |||||||
Fees billed by E&Y: | ||||||||
MFS Aggressive Growth Allocation Fund | 30,796 | 30,382 | ||||||
MFS Conservative Allocation Fund | 30,796 | 30,382 | ||||||
MFS Emerging Markets Equity Fund | 56,503 | 55,734 | ||||||
MFS Growth Allocation Fund | 30,796 | 30,382 | ||||||
MFS International Growth Fund | 56,624 | 55,853 | ||||||
MFS International Intrinsic Value Fund | 56,624 | 55,853 | ||||||
MFS International Large Cap Value Fund** | 28,300 | N/A** | ||||||
MFS Managed Wealth Fund | 36,875 | 36,377 | ||||||
MFS Moderate Allocation Fund | 30,796 | 30,382 | ||||||
|
|
|
| |||||
Total | 358,110 | 325,345 | ||||||
For the fiscal years ended May 31, 2021 and 2020, fees billed by Deloitte and E&Y for audit-related, tax and other services provided to each Fund and for audit-related, tax and other services provided to MFS and MFS Related Entities were as follows:
| Audit-Related Fees1 | Tax Fees2 | All Other Fees3 | ||||||||||||||||||||||
| 2021 | 2020 | 2021 | 2020 | 2021 | 2020 | |||||||||||||||||||
Fees billed by Deloitte: | ||||||||||||||||||||||||
To MFS Blended Research Growth Equity Fund | 0 | 0 | 7,622 | 7,122 | 0 | 0 | ||||||||||||||||||
To MFS Blended Research Mid Cap Equity Fund | 0 | 0 | 7,515 | 7,017 | 0 | 0 | ||||||||||||||||||
To MFS Blended Research Small Cap Equity Fund | 0 | 0 | 7,622 | 7,122 | 0 | 0 | ||||||||||||||||||
To MFS Blended Research Value Equity Fund | 0 | 0 | 7,622 | 7,122 | 0 | 0 | ||||||||||||||||||
To MFS International Diversification Fund | 0 | 0 | 8,248 | 7,740 | 0 | 0 | ||||||||||||||||||
Total fees billed by Deloitte To above Funds: | 0 | 0 | 38,629 | 36,123 | 0 | 0 | ||||||||||||||||||
Table of Contents
| Audit-Related Fees1 | Tax Fees2 | All Other Fees3 | ||||||||||||||||||||||
| 2021 | 2020 | 2021 | 2020 | 2021 | 2020 | |||||||||||||||||||
Fees billed by Deloitte: | ||||||||||||||||||||||||
To MFS and MFS Related Entities of MFS Blended Research Growth Equity Fund* | 0 | 0 | 0 | 0 | 3,790 | 5,390 | ||||||||||||||||||
To MFS and MFS Related Entities of MFS Blended Research Mid Cap Equity Fund* | 0 | 0 | 0 | 0 | 3,790 | 5,390 | ||||||||||||||||||
To MFS and MFS Related Entities of MFS Blended Research Small Cap Equity Fund* | 0 | 0 | 0 | 0 | 3,790 | 5,390 | ||||||||||||||||||
To MFS and MFS Related Entities of MFS Blended Research Value Equity Fund* | 0 | 0 | 0 | 0 | 3,790 | 5,390 | ||||||||||||||||||
To MFS and MFS Related Entities of MFS International Diversification Fund* | 0 | 0 | 0 | 0 | 3,790 | 5,390 | ||||||||||||||||||
Aggregate fees for non-audit services | ||||||||
| 2021 | 2020 | |||||||
Fees billed by Deloitte: | ||||||||
To MFS Blended Research Growth Equity Fund, MFS and MFS Related Entities# | 555,162 | 362,512 | ||||||
To MFS Blended Research Mid Cap Equity Fund, MFS and MFS Related Entities# | 555,055 | 362,407 | ||||||
To MFS Blended Research Small Cap Equity Fund, MFS and MFS Related Entities# | 555,162 | 362,512 | ||||||
To MFS Blended Research Value Equity Fund, MFS and MFS Related Entities# | 555,162 | 362,512 | ||||||
To MFS International Diversification Fund, MFS and MFS Related Entities# | 555,788 | 363,130 | ||||||
| Audit-Related Fees1 | Tax Fees2 | All Other Fees4 | ||||||||||||||||||||||
| 2021 | 2020 | 2021 | 2020 | 2021 | 2020 | |||||||||||||||||||
Fees billed by E&Y: | ||||||||||||||||||||||||
To MFS Aggressive Growth Allocation Fund | 0 | 0 | 5,575 | 5,498 | 1,469 | 1,485 | ||||||||||||||||||
To MFS Conservative Allocation Fund | 0 | 0 | 5,575 | 5,498 | 1,762 | 1,768 | ||||||||||||||||||
To MFS Emerging Markets Equity Fund | 0 | 0 | 10,790 | 10,641 | 1,964 | 1,623 | ||||||||||||||||||
To MFS Growth Allocation Fund | 0 | 0 | 5,575 | 5,498 | 2,249 | 2,301 | ||||||||||||||||||
To MFS International Growth Fund | 0 | 0 | 10,790 | 10,641 | 3,691 | 3,207 | ||||||||||||||||||
To MFS International Intrinsic Value Fund | 0 | 0 | 10,790 | 10,641 | 7,916 | 8,280 | ||||||||||||||||||
To MFS International Large Cap Value Fund** | 0 | N/A | ** | 13,567 | N/A | ** | 1,476 | N/A | ** | |||||||||||||||
To MFS Managed Wealth Fund | 0 | 0 | 8,475 | 8,361 | 2,964 | 3,615 | ||||||||||||||||||
To MFS Moderate Allocation Fund | 0 | 0 | 5,575 | 5,498 | 2,376 | 2,448 | ||||||||||||||||||
Total fees billed by E&Y To above Funds: | 0 | 0 | 76,712 | 62,276 | 25,867 | 24,727 | ||||||||||||||||||
Table of Contents
| Audit-Related Fees1 | Tax Fees2 | All Other Fees4 | ||||||||||||||||||||||
| 2021 | 2020 | 2021 | 2020 | 2021 | 2020 | |||||||||||||||||||
Fees billed by E&Y: | ||||||||||||||||||||||||
To MFS and MFS Related Entities of MFS Aggressive Growth Allocation Fund* | 1,771,127 | 1,744,294 | 0 | 0 | 107,150 | 104,750 | ||||||||||||||||||
To MFS and MFS Related Entities of MFS Conservative Allocation Fund* | 1,771,127 | 1,744,294 | 0 | 0 | 107,150 | 104,750 | ||||||||||||||||||
To MFS and MFS Related Entities of MFS Emerging Markets Equity Fund* | 1,771,127 | 1,744,294 | 0 | 0 | 107,150 | 104,750 | ||||||||||||||||||
To MFS and MFS Related Entities of MFS Growth Allocation Fund* | 1,771,127 | 1,744,294 | 0 | 0 | 107,150 | 104,750 | ||||||||||||||||||
To MFS and MFS Related Entities of MFS International Growth Fund* | 1,771,127 | 1,744,294 | 0 | 0 | 107,150 | 104,750 | ||||||||||||||||||
To MFS and MFS Related Entities of MFS International Intrinsic Value Fund* | 1,771,127 | 1,744,294 | 0 | 0 | 107,150 | 104,750 | ||||||||||||||||||
To MFS and MFS Related Entities of MFS International Large Cap Value Fund*** | 1,771,127 | N/A | ** | 0 | N/A | ** | 107,150 | N/A | ** | |||||||||||||||
To MFS and MFS Related Entities of MFS Managed Wealth Fund* | 1,771,127 | 1,744,294 | 0 | 0 | 107,150 | 104,750 | ||||||||||||||||||
To MFS and MFS Related Entities of MFS Moderate Allocation Fund* | 1,771,127 | 1,744,294 | 0 | 0 | 107,150 | 104,750 | ||||||||||||||||||
Aggregate fees for non-audit services | ||||||||
| 2021 | 2020 | |||||||
Fees billed by E&Y: | ||||||||
To MFS Aggressive Growth Allocation Fund, MFS and MFS Related Entities# | 2,077,551 | 2,090,027 | ||||||
To MFS Conservative Allocation Fund, MFS and MFS Related Entities# | 2,077,844 | 2,090,310 | ||||||
To MFS Emerging Markets Equity Fund, MFS and MFS Related Entities# | 2,083,261 | 2,095,308 | ||||||
To MFS Growth Allocation Fund, MFS and MFS Related Entities# | 2,078,331 | 2,090,843 | ||||||
To MFS International Growth Fund, MFS and MFS Related Entities# | 2,084,988 | 2,096,892 | ||||||
To MFS International Intrinsic Value Fund, MFS and MFS Related Entities# | 2,089,213 | 2,101,965 | ||||||
To MFS International Large Cap Value Fund, MFS and MFS Related Entities# ** | 2,085,550 | N/A | ** | |||||
To MFS Managed Wealth Fund, MFS and MFS Related Entities# | 2,081,946 | 2,095,020 | ||||||
To MFS Moderate Allocation Fund, MFS and MFS Related Entities# | 2,078,458 | 2,090,990 | ||||||
| ** | MFS International Large Cap Value Fund commenced investment operations on June 30, 2020. |
Table of Contents
| * | This amount reflects the fees billed to MFS and MFS Related Entities for non-audit services relating directly to the operations and financial reporting of the Funds (portions of which services also related to the operations and financial reporting of other funds within the MFS Funds complex). |
| # | This amount reflects the aggregate fees billed by Deloitte or E&Y for non-audit services rendered to the Funds and for non-audit services rendered to MFS and the MFS Related Entities. |
| 1 | The fees included under “Audit-Related Fees” are fees related to assurance and related services that are reasonably related to the performance of the audit or review of financial statements, but not reported under ‘‘Audit Fees,’’ including accounting consultations, agreed-upon procedure reports, attestation reports, comfort letters and internal control reviews. |
| 2 | The fees included under “Tax Fees” are fees associated with tax compliance, tax advice and tax planning, including services relating to the filing or amendment of federal, state or local income tax returns, regulated investment company qualification reviews and tax distribution and analysis. |
| 3 | The fees included under “All Other Fees” are fees for products and services provided by Deloitte other than those reported under “Audit Fees,” “Audit-Related Fees” and “Tax Fees”. |
| 4 | The fees included under “All Other Fees” are fees for products and services provided by E&Y other than those reported under “Audit Fees,” “Audit-Related Fees” and “Tax Fees,” including fees for services related to review of internal controls and review of Rule 38a-1 compliance program. |
| Item 4(e)(1): |
Set forth below are the policies and procedures established by the Audit Committee of the Board of Trustees relating to the pre-approval of audit and non-audit related services:
To the extent required by applicable law, pre-approval by the Audit Committee of the Board is needed for all audit and permissible non-audit services rendered to the Fund and all permissible non-audit services rendered to MFS or MFS Related Entities if the services relate directly to the operations and financial reporting of the Registrant. Pre-approval is currently on an engagement-by-engagement basis. In the event pre-approval of such services is necessary between regular meetings of the Audit Committee and it is not practical to wait to seek pre-approval at the next regular meeting of the Audit Committee, pre-approval of such services may be referred to the Chair of the Audit Committee for approval; provided that the Chair may not pre-approve any individual engagement for such services exceeding $50,000 or multiple engagements for such services in the aggregate exceeding $100,000 in each period between regular meetings of the Audit Committee. Any engagement pre-approved by the Chair between regular meetings of the Audit Committee shall be presented for ratification by the entire Audit Committee at its next regularly scheduled meeting.
| Item 4(e)(2): |
None, or 0%, of the services relating to the Audit-Related Fees, Tax Fees and All Other Fees paid by the Fund and MFS and MFS Related Entities relating directly to the operations and financial reporting of the Registrant disclosed above were approved by the audit committee pursuant to paragraphs (c)(7)(i)(C) of Rule 2-01 of Regulation S-X (which permits audit committee approval after the start of the engagement with respect to services other than audit, review or attest services, if certain conditions are satisfied).
| Item 4(f): |
Not applicable.
Table of Contents
| Item 4(h): |
The Registrant’s Audit Committee has considered whether the provision by a Registrant’s independent registered public accounting firm of non-audit services to MFS and MFS Related Entities that were not pre-approved by the Committee (because such services did not relate directly to the operations and financial reporting of the Registrant) was compatible with maintaining the independence of the independent registered public accounting firm as the Registrant’s principal auditors.
| ITEM 5. | AUDIT COMMITTEE OF LISTED REGISTRANTS. |
Not applicable to the Registrant.
| ITEM 6. | INVESTMENTS. |
A schedule of investments of the Registrant is included as part of the report to shareholders of such series under Item 1(a) of this Form N-CSR.
| ITEM 7. | DISCLOSURE OF PROXY VOTING POLICIES AND PROCEDURES FOR CLOSED-END MANAGEMENT INVESTMENT COMPANIES. |
Not applicable to the Registrant.
| ITEM 8. | PORTFOLIO MANAGERS OF CLOSED-END MANAGEMENT INVESTMENT COMPANIES. |
Not applicable to the Registrant.
| ITEM 9. | PURCHASES OF EQUITY SECURITIES BY CLOSED-END MANAGEMENT INVESTMENT COMPANY AND AFFILIATED PURCHASERS. |
Not applicable to the Registrant.
| ITEM 10. | SUBMISSION OF MATTERS TO A VOTE OF SECURITY HOLDERS. |
There were no material changes to the procedures by which shareholders may send recommendations to the Board for nominees to the Registrant’s Board since the Registrant last provided disclosure as to such procedures in response to the requirements of Item 407 (c)(2)(iv) of Regulation S-K or this Item.
Table of Contents
| ITEM 11. | CONTROLS AND PROCEDURES. |
| (a) | Based upon their evaluation of the effectiveness of the registrant’s disclosure controls and procedures (as defined in Rule 30a-3(c) under the Investment Company Act of 1940 (the “Act”)) as conducted within 90 days of the filing date of this report on Form N-CSR, the registrant’s principal financial officer and principal executive officer have concluded that those disclosure controls and procedures provide reasonable assurance that the material information required to be disclosed by the registrant on this report is recorded, processed, summarized and reported within the time periods specified in the Securities and Exchange Commission’s rules and forms. |
| (b) | There were no changes in the registrant’s internal controls over financial reporting (as defined in Rule 30a-3(d) under the Act) that occurred during the period covered by the report that have materially affected, or are reasonably likely to materially affect, the registrant’s internal control over financial reporting. |
| ITEM 12. | DISCLOSURE OF SECURITIES LENDING ACTIVITIES FOR CLOSED-END MANAGEMENT INVESTMENT COMPANIES. |
Not applicable to the Registrant.
| ITEM 13. | EXHIBITS. |
| (a) | (1) | Any code of ethics, or amendment thereto, that is the subject of the disclosure required by Item 2, to the extent that the registrant intends to satisfy the Item 2 requirements through filing of an exhibit: Attached hereto as EX-99.COE. |
| (2) | A separate certification for each principal executive officer and principal financial officer of the registrant as required by Rule 30a-2(a) under the Act (17 CFR 270.30a-2): Attached hereto as EX-99.302CERT. |
| (3) | Any written solicitation to purchase securities under Rule 23c-1 under the Act (17 CFR 270.23c-1) sent or given during the period covered by the report by or on behalf of the registrant to 10 or more persons. Not applicable. |
| (4) | Change in the registrant’s independent public accountant. Not applicable. |
| (b) | If the report is filed under Section 13(a) or 15(d) of the Exchange Act, provide the certifications required by Rule 30a-2(b) under the Act (17 CFR 270.30a-2(b)), Rule 13a-14(b) or Rule 15d-14(b) under the Exchange Act (17 CFR 240.13a-14(b) or 240.15d-14(b)) and Section 1350 of Chapter 63 of Title 18 of the United States Code (18 U.S.C. 1350) as an exhibit. A certification furnished pursuant to this paragraph will not be deemed “filed” for the purposes of Section 18 of the Exchange Act (15 U.S.C. 78r), or otherwise subject to the liability of that section. Such certification will not be deemed to be incorporated by reference into any filing under the Securities Act of 1933 or the Exchange Act, except to the extent that the registrant specifically incorporates it by reference: Attached hereto as EX-99.906CERT. |
Table of Contents
Notice
A copy of the Amended and Restated Declaration of Trust, as amended, of the Registrant is on file with the Secretary of State of The Commonwealth of Massachusetts and notice is hereby given that this instrument is executed on behalf of the Registrant by an officer of the Registrant as an officer and not individually and the obligations of or arising out of this instrument are not binding upon any of the Trustees or shareholders individually, but are binding only upon the assets and property of the respective constituent series of the Registrant.
Table of Contents
SIGNATURES
Pursuant to the requirements of the Securities Exchange Act of 1934 and the Investment Company Act of 1940, the registrant has duly caused this report to be signed on its behalf by the undersigned, thereunto duly authorized.
(Registrant) MFS SERIES TRUST X
| By (Signature and Title)* | /S/ DAVID L. DILORENZO | |
| David L. DiLorenzo, President |
Date: July 16, 2021
Pursuant to the requirements of the Securities Exchange Act of 1934 and the Investment Company Act of 1940, this report has been signed below by the following persons on behalf of the registrant and in the capacities and on the dates indicated.
| By (Signature and Title)* | /S/ DAVID L. DILORENZO | |
| David L. DiLorenzo, President (Principal Executive Officer) |
Date: July 16, 2021
| By (Signature and Title)* | /S/ JAMES O. YOST | |
| James O. Yost, Treasurer (Principal Financial Officer and Accounting Officer) |
Date: July 16, 2021
| * | Print name and title of each signing officer under his or her signature. |