UNITED STATES
SECURITIES AND EXCHANGE COMMISSION
Washington, D.C. 20549
FORM N-CSR
CERTIFIED SHAREHOLDER REPORT OF REGISTERED
MANAGEMENT INVESTMENT COMPANIES
Investment Company Act file number 811-04492
MFS SERIES TRUST X
(Exact name of registrant as specified in charter)
111 Huntington Avenue, Boston, Massachusetts 02199 (Address of principal executive offices) (Zip code)
Christopher R. Bohane
Massachusetts Financial Services Company
111Huntington Avenue Boston, Massachusetts 02199
(Name and address of agents for service)
Registrant's telephone number, including area code: (617) 954-5000
Date of fiscal year end: November 30*
Date of reporting period: May 31, 2023
*This Form N-CSR pertains only to the following series of the Registrant: MFS Global Opportunistic Bond Fund. The remaining series of the Registrant have fiscal year ends other than November 30.
ITEM 1. REPORTS TO STOCKHOLDERS.
Item 1(a):

Bond Fund

Bond Fund
| 1 | |
| 3 | |
| 5 | |
| 31 | |
| 33 | |
| 35 | |
| 36 | |
| 45 | |
| 67 | |
| 68 | |
| 68 | |
| 68 | |
| 68 | |
| 68 |
| back cover |
| Emerging Markets Bonds | 27.6% |
| Investment Grade Corporates | 22.2% |
| Non-U.S. Government Bonds | 13.6% |
| U.S. Treasury Securities | 13.0% |
| High Yield Corporates | 7.5% |
| Mortgage-Backed Securities | 5.9% |
| Collateralized Debt Obligations | 3.4% |
| Commercial Mortgage-Backed Securities | 2.7% |
| Municipal Bonds | 1.1% |
| Asset-Backed Securities | 0.8% |
| AAA | 10.4% |
| AA | 11.2% |
| A | 18.7% |
| BBB | 24.8% |
| BB | 11.8% |
| B | 3.7% |
| CCC | 1.1% |
| U.S. Government | 1.2% |
| Federal Agencies | 5.9% |
| Not Rated | 9.0% |
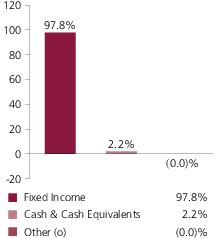
| Cash & Cash Equivalents | 2.2% |
| Other (o) | (0.0)% |
| Average Duration (d) | 7.6 |
| Average Effective Maturity (m) | 9.1 yrs. |
| United States | 44.3% |
| United Kingdom | 8.6% |
| South Korea | 8.5% |
| Canada | 8.3% |
| Japan | 5.8% |
| Australia | 4.6% |
| Greece | 4.0% |
| Mexico | 3.8% |
| Germany | (15.3)% |
| Other Countries | 27.4% |
| (a) | For all securities other than those specifically described below, ratings are assigned to underlying securities utilizing ratings from Moody’s, Fitch, and Standard & Poor’s rating agencies and applying the following hierarchy: If all three agencies provide a rating, the middle rating (after dropping the highest and lowest ratings) is assigned; if two of the three agencies rate a security, the lower of the two is assigned. If none of the 3 rating agencies above assign a rating, but the security is rated by DBRS Morningstar, then the DBRS Morningstar rating is assigned. If none of the 4 rating agencies listed above rate the security, but the security is rated by the Kroll Bond Rating Agency (KBRA), then the KBRA rating is assigned. Ratings are shown in the S&P and Fitch scale (e.g., AAA). Securities rated BBB or higher are considered investment grade. All ratings are subject to change. U.S. Government |
| (d) | Duration is a measure of how much a bond’s price is likely to fluctuate with general changes in interest rates, e.g., if rates rise 1.00%, a bond with a 5-year duration is likely to lose about 5.00% of its value due to the interest rate move. The Average Duration calculation reflects the impact of the equivalent exposure of derivative positions, if any. |
| (i) | For purposes of this presentation, the components include the value of securities, and reflect the impact of the equivalent exposure of derivative positions, if any. These amounts may be negative from time to time. Equivalent exposure is a calculated amount that translates the derivative position into a reasonable approximation of the amount of the underlying asset that the portfolio would have to hold at a given point in time to have the same price sensitivity that results from the portfolio’s ownership of the derivative contract. When dealing with derivatives, equivalent exposure is a more representative measure of the potential impact of a position on portfolio performance than value. The bond component will include any accrued interest amounts. |
| (m) | In determining each instrument’s effective maturity for purposes of calculating the fund’s dollar-weighted average effective maturity, MFS uses the instrument’s stated maturity or, if applicable, an earlier date on which MFS believes it is probable that a maturity-shortening feature (such as a put, pre-refunding or prepayment) will cause the instrument to be repaid. Such an earlier date can be substantially shorter than the instrument’s stated maturity. |
| (o) | Less than 0.1%. |
| (x) | Represents the portfolio’s exposure to issuer countries as a percentage of a portfolio’s net assets. For purposes of this presentation, United States includes Cash & Cash Equivalents and Other. |
December 1, 2022 through May 31, 2023
| Share Class | Annualized Expense Ratio | Beginning Account Value 12/01/22 | Ending Account Value 5/31/23 | Expenses Paid During Period (p) 12/01/22-5/31/23 | |
| A | Actual | 0.95% | $1,000.00 | $1,020.64 | $4.79 |
| Hypothetical (h) | 0.95% | $1,000.00 | $1,020.19 | $4.78 | |
| B | Actual | 1.70% | $1,000.00 | $1,016.91 | $8.55 |
| Hypothetical (h) | 1.70% | $1,000.00 | $1,016.45 | $8.55 | |
| C | Actual | 1.70% | $1,000.00 | $1,016.91 | $8.55 |
| Hypothetical (h) | 1.70% | $1,000.00 | $1,016.45 | $8.55 | |
| I | Actual | 0.69% | $1,000.00 | $1,021.99 | $3.48 |
| Hypothetical (h) | 0.69% | $1,000.00 | $1,021.49 | $3.48 | |
| R1 | Actual | 1.70% | $1,000.00 | $1,016.93 | $8.55 |
| Hypothetical (h) | 1.70% | $1,000.00 | $1,016.45 | $8.55 | |
| R2 | Actual | 1.20% | $1,000.00 | $1,019.47 | $6.04 |
| Hypothetical (h) | 1.20% | $1,000.00 | $1,018.95 | $6.04 | |
| R3 | Actual | 0.94% | $1,000.00 | $1,019.43 | $4.73 |
| Hypothetical (h) | 0.94% | $1,000.00 | $1,020.24 | $4.73 | |
| R4 | Actual | 0.70% | $1,000.00 | $1,021.99 | $3.53 |
| Hypothetical (h) | 0.70% | $1,000.00 | $1,021.44 | $3.53 | |
| R6 | Actual | 0.61% | $1,000.00 | $1,022.44 | $3.08 |
| Hypothetical (h) | 0.61% | $1,000.00 | $1,021.89 | $3.07 |
| (h) | 5% class return per year before expenses. |
| (p) | “Expenses Paid During Period” are equal to each class’s annualized expense ratio, as shown above, multiplied by the average account value over the period, multiplied by 182/365 (to reflect the one-half year period). Expenses paid do not include any applicable sales charges (loads). If these transaction costs had been included, your costs would have been higher. |
| Issuer | Shares/Par | Value ($) | ||
| Bonds – 95.5% | ||||
| Aerospace & Defense – 0.2% | ||||
| Boeing Co., 5.805%, 5/01/2050 | $ | 1,040,000 | $1,018,160 | |
| Raytheon Technologies Corp., 2.82%, 9/01/2051 | 1,862,000 | 1,224,277 | ||
| $2,242,437 | ||||
| Apparel Manufacturers – 0.1% | ||||
| Tapestry, Inc., 3.05%, 3/15/2032 | $ | 934,000 | $751,616 | |
| Asset-Backed & Securitized – 6.8% | ||||
| 3650R Commercial Mortgage Trust, 2021-PF1, “XA”, 1.025%, 11/15/2054 (i) | $ | 11,837,348 | $630,954 | |
| AA Bond Co. Ltd., 3.25%, 7/31/2028 | GBP | 630,000 | 608,870 | |
| ACREC 2021-FL1 Ltd., “C”, FLR, 7.261% (LIBOR - 1mo. + 2.15%), 10/16/2036 (n) | $ | 2,557,500 | 2,421,123 | |
| ACRES 2021-FL2 Issuer Ltd., “AS”, FLR, 6.858% (LIBOR - 1mo. + 1.75%), 1/15/2037 (n) | 1,595,500 | 1,547,454 | ||
| ACRES 2021-FL2 Issuer Ltd., “B”, FLR, 7.357% (LIBOR - 1mo. + 2.25%), 1/15/2037 (n) | 2,479,000 | 2,393,035 | ||
| Arbor Realty Trust, Inc., CLO, 2019-FL2, “AS”, FLR, 6.624% (LIBOR - 1mo. + 1.45%), 9/15/2034 (n) | 174,319 | 173,163 | ||
| Arbor Realty Trust, Inc., CLO, 2021-FL1, “C”, FLR, 7.105% (LIBOR - 1mo. + 2%), 12/15/2035 (n) | 204,000 | 191,172 | ||
| Arbor Realty Trust, Inc., CLO, 2021-FL2, “B”, FLR, 6.707% (LIBOR - 1mo. + 1.6%), 5/15/2036 (n) | 418,000 | 394,926 | ||
| Arbor Realty Trust, Inc., CLO, 2021-FL2, “C”, FLR, 7.057% (LIBOR - 1mo. + 1.95%), 5/15/2036 (n) | 1,359,500 | 1,273,612 | ||
| Arbor Realty Trust, Inc., CLO, 2021-FL3, “B”, FLR, 6.707% (LIBOR - 1mo. + 1.6%), 8/15/2034 (n) | 1,205,000 | 1,136,954 | ||
| Arbor Realty Trust, Inc., CLO, 2021-FL3, “C”, FLR, 6.957% (LIBOR - 1mo. + 1.85%), 8/15/2034 (n) | 1,049,500 | 976,692 | ||
| Arbor Realty Trust, Inc., CLO, 2022-FL1, “C”, FLR, 7.172% (SOFR - 30 day + 2.3%), 1/15/2037 (n) | 3,751,000 | 3,484,308 | ||
| Arbor Realty Trust, Inc., CLO, 2022-FL1, “D”, FLR, 7.872% (SOFR - 30 day + 3%), 1/15/2037 (n) | 2,400,000 | 2,231,424 | ||
| AREIT 2022-CRE6 Trust, “C”, FLR, 7.064% (SOFR - 30 day + 2.15%), 1/20/2037 (n) | 533,500 | 497,406 | ||
| AREIT 2022-CRE6 Trust, “D”, FLR, 7.764% (SOFR - 30 day + 2.85%), 1/20/2037 (n) | 569,500 | 515,142 | ||
| BBCMS Mortgage Trust, 2020-C7, “XA”, 1.62%, 4/15/2053 (i) | 1,432,372 | 99,646 | ||
| BBCMS Mortgage Trust, 2021-C10, “XA”, 1.293%, 7/15/2054 (i) | 9,729,669 | 649,674 | ||
| Issuer | Shares/Par | Value ($) | ||
| Bonds – continued | ||||
| Asset-Backed & Securitized – continued | ||||
| BBCMS Mortgage Trust, 2021-C9, “XA”, 1.619%, 2/15/2054 (i) | $ | 15,067,440 | $1,321,758 | |
| BBCMS Mortgage Trust, 2022-C18, “AS”, 6.148%, 12/15/2055 | 1,004,922 | 1,053,868 | ||
| Benchmark 2020-B18 Mortgage Trust, “XA”, 1.788%, 7/15/2053 (i) | 12,900,336 | 953,675 | ||
| Benchmark 2021-B24 Mortgage Trust, “XA”, 1.15%, 3/15/2054 (i) | 6,400,554 | 382,033 | ||
| Benchmark 2021-B26 Mortgage Trust, “XA”, 0.885%, 6/15/2054 (i) | 19,814,790 | 948,358 | ||
| Benchmark 2021-B27 Mortgage Trust, “XA”, 1.264%, 7/15/2054 (i) | 20,247,448 | 1,422,351 | ||
| Benchmark 2021-B28 Mortgage Trust, “XA”, 1.279%, 8/15/2054 (i) | 20,953,439 | 1,487,879 | ||
| Benchmark 2022-B37 Mortgage Trust, “AS”, 5.751%, 11/15/2055 | 394,000 | 397,845 | ||
| BSPRT 2021-FL7 Issuer Ltd., “B”, FLR, 7.157% (LIBOR - 1mo. + 2.05%), 12/15/2038 (n) | 632,000 | 615,520 | ||
| BSPRT 2021-FL7 Issuer Ltd., “C”, FLR, 7.407% (LIBOR - 1mo. + 2.3%), 12/15/2038 (n) | 572,500 | 537,793 | ||
| Business Jet Securities LLC, 2020-1A, “A”, 2.981%, 11/15/2035 (n) | 209,505 | 198,128 | ||
| Business Jet Securities LLC, 2021-1A, “A”, 2.162%, 4/15/2036 (n) | 375,199 | 345,187 | ||
| BXMT 2021-FL4 Ltd., “AS”, FLR, 6.407% (LIBOR - 1mo. + 1.3%), 5/15/2038 (n) | 1,100,000 | 1,039,697 | ||
| BXMT 2021-FL4 Ltd., “B”, FLR, 6.657% (LIBOR - 1mo. + 1.55%), 5/15/2038 (n) | 2,995,500 | 2,803,511 | ||
| Capital Automotive, 2020-1A, “A4”, REIT, 3.19%, 2/15/2050 (n) | 490,128 | 458,371 | ||
| CF Hippolyta Issuer LLC, 2020-1, “A1”, 1.69%, 7/15/2060 (n) | 381,350 | 344,352 | ||
| Chesapeake Funding II LLC, 2023-1A, “A1”, 5.65%, 5/15/2035 (n) | 1,166,594 | 1,162,022 | ||
| CNH Equipment Trust 2023-A, “A2”, 5.34%, 9/15/2026 | 586,549 | 584,348 | ||
| Commercial Mortgage Pass-Through Certificates, 2021-BN32, “XA”, 0.777%, 4/15/2054 (i) | 7,800,475 | 326,175 | ||
| Commercial Mortgage Pass-Through Certificates, 2021-BN34, “XA”, 0.975%, 6/15/2063 (i) | 11,359,752 | 614,753 | ||
| Commercial Mortgage Pass-Through Certificates, 2021-BN35, “XA”, 1.044%, 6/15/2064 (i) | 9,470,845 | 552,664 | ||
| Commercial Mortgage Pass-Through Certificates, 2022-BNK41, “AS”, 3.79%, 4/15/2065 | 2,344,000 | 2,011,201 | ||
| DT Auto Owner Trust, 2023-1A, “A”, 5.48%, 4/15/2027 (n) | 1,021,693 | 1,016,046 | ||
| Fortress CBO Investments Ltd., 2022-FL3, “AS”, FLR, 7.19% (SOFR - 30 day + 2.25%), 2/23/2039 (n) | 990,500 | 957,509 | ||
| Issuer | Shares/Par | Value ($) | ||
| Bonds – continued | ||||
| Asset-Backed & Securitized – continued | ||||
| FS Rialto 2021-FL2 Issuer Ltd., “AS”, FLR, 6.655% (LIBOR - 1mo. + 1.6%), 5/16/2038 (n) | $ | 2,483,500 | $2,329,178 | |
| GreatAmerica Leasing Receivables Funding LLC, 2023-1, “A2”, 5.35%, 2/16/2026 (n) | 560,000 | 557,767 | ||
| KREF 2021-FL2 Ltd., “B”, FLR, 6.758% (LIBOR - 1mo. + 1.65%), 2/15/2039 (n) | 2,155,000 | 2,032,626 | ||
| LoanCore 2021-CRE5 Ltd., “B”, FLR, 7.107% (LIBOR - 1mo. + 2%), 7/15/2036 (n) | 1,395,500 | 1,305,826 | ||
| MF1 2021-FL5 Ltd., “B”, FLR, 6.631% (LIBOR - 1mo. + 1.45%), 7/15/2036 (n) | 2,542,500 | 2,455,386 | ||
| MF1 2021-FL5 Ltd., “C”, FLR, 6.88% (LIBOR - 1mo. + 1.7%), 7/15/2036 (n) | 645,000 | 604,079 | ||
| MF1 2021-FL6 Ltd., “AS”, FLR, 6.561% (LIBOR - 1mo. + 1.45%), 7/16/2036 (n) | 2,500,000 | 2,409,531 | ||
| MF1 2021-FL6 Ltd., “B”, FLR, 6.761% (LIBOR - 1mo. + 1.65%), 7/16/2036 (n) | 3,800,000 | 3,613,898 | ||
| MF1 2022-FL8 Ltd., “C”, FLR, 7.122% (SOFR - 30 day + 2.2%), 2/19/2037 (n) | 1,130,366 | 1,052,842 | ||
| Morgan Stanley Capital I Trust, 2021-L5, “XA”, 1.294%, 5/15/2054 (i) | 5,709,465 | 379,626 | ||
| Morgan Stanley Capital I Trust, 2021-L6, “XA”, 1.224%, 6/15/2054 (i) | 17,301,249 | 1,052,693 | ||
| Navistar Financial Dealer Note Master Owner Trust, 2022-1, “A”, FLR, 6.181% (SOFR - 30 day + 1.25%), 5/25/2027 (n) | 947,000 | 948,011 | ||
| RAC Bond Co. PLC, 4.87%, 5/06/2026 | GBP | 670,000 | 759,516 | |
| Shelter Growth CRE 2021-FL3 Ltd., “C”, FLR, 7.257% (LIBOR - 1mo. + 2.15%), 9/15/2036 (n) | $ | 1,212,000 | 1,132,588 | |
| Starwood Commercial Mortgage, 2021-FL2, “B”, FLR, 6.911% (LIBOR - 1mo. + 1.8%), 4/18/2038 (n) | 1,223,000 | 1,143,011 | ||
| Starwood Commercial Mortgage, 2021-FL2, “C”, FLR, 7.211% (LIBOR - 1mo. + 2.1%), 4/18/2038 (n) | 238,000 | 219,227 | ||
| TPG Real Estate Finance, 2021-FL4, “AS”, FLR, 6.508% (LIBOR - 1mo. + 1.4%), 3/15/2038 (n) | 800,000 | 780,162 | ||
| Wells Fargo Commercial Mortgage Trust, 2021-C59, “XA”, 1.531%, 4/15/2054 (i) | 9,327,536 | 771,613 | ||
| Wells Fargo Commercial Mortgage Trust, 2021-C60, “XA”, 1.532%, 8/15/2054 (i) | 15,626,058 | 1,269,169 | ||
| Westlake Automobile Receivables Trust, 2023-1A, “A2B”, FLR, 5.722% (SOFR - 1mo. + 0.85%), 6/15/2026 (n) | 472,000 | 471,721 | ||
| $66,049,069 | ||||
| Issuer | Shares/Par | Value ($) | ||
| Bonds – continued | ||||
| Automotive – 0.9% | ||||
| Clarios Global LP/Clarios U.S. Finance Co., 6.75%, 5/15/2028 (n) | $ | 1,715,000 | $1,715,000 | |
| Hyundai Capital America, 6.375%, 4/08/2030 (n) | 466,000 | 486,007 | ||
| LKQ Corp., 6.25%, 6/15/2033 (n) | 689,000 | 693,415 | ||
| RAC Bond Co. PLC, 5.25%, 11/04/2027 (n) | GBP | 1,950,000 | 1,927,329 | |
| RAC Bond Co. PLC, 5.25%, 11/04/2027 | 200,000 | 197,675 | ||
| TI Automotive Finance PLC, 3.75%, 4/15/2029 (n) | EUR | 2,590,000 | 2,194,252 | |
| TI Automotive Finance PLC, 3.75%, 4/15/2029 | 1,050,000 | 889,562 | ||
| Volkswagen Financial Services N.V. , 5.875%, 5/23/2029 | GBP | 800,000 | 974,913 | |
| $9,078,153 | ||||
| Broadcasting – 1.0% | ||||
| Discovery Communications LLC, 4.125%, 5/15/2029 | $ | 1,860,000 | $1,696,112 | |
| Prosus N.V., 3.061%, 7/13/2031 (n) | 895,000 | 686,720 | ||
| Prosus N.V., 4.027%, 8/03/2050 | 1,000,000 | 605,243 | ||
| Summer (BC) Holdco S.à r.l., “A”, 9.25%, 10/31/2027 | EUR | 2,230,105 | 1,887,675 | |
| Ubisoft Entertainment S.A., 0.878%, 11/24/2027 | 2,400,000 | 1,818,456 | ||
| WarnerMedia Holdings, Inc., 4.279%, 3/15/2032 | $ | 976,000 | 852,674 | |
| WMG Acquisition Corp., 2.25%, 8/15/2031 (n) | EUR | 1,764,000 | 1,447,465 | |
| WMG Acquisition Corp., 2.25%, 8/15/2031 | 1,360,000 | 1,115,959 | ||
| $10,110,304 | ||||
| Brokerage & Asset Managers – 0.2% | ||||
| Ameriprise Financial, Inc., 4.5%, 5/13/2032 | $ | 551,000 | $527,034 | |
| Low Income Investment Fund, 3.386%, 7/01/2026 | 310,000 | 291,866 | ||
| Low Income Investment Fund, 3.711%, 7/01/2029 | 840,000 | 746,091 | ||
| LPL Holdings, Inc., 4%, 3/15/2029 (n) | 876,000 | 769,209 | ||
| $2,334,200 | ||||
| Building – 0.6% | ||||
| Holcim Sterling Finance (Netherlands) B.V., 2.25%, 4/04/2034 | GBP | 1,020,000 | $887,076 | |
| New Enterprise Stone & Lime Co., Inc., 5.25%, 7/15/2028 (n) | $ | 2,134,000 | 1,888,590 | |
| Standard Industries, Inc., 4.75%, 1/15/2028 (n) | 1,770,000 | 1,622,708 | ||
| Vulcan Materials Co., 3.5%, 6/01/2030 | 1,618,000 | 1,461,006 | ||
| $5,859,380 | ||||
| Business Services – 0.9% | ||||
| Corning, Inc., 4.125%, 5/15/2031 | EUR | 620,000 | $665,700 | |
| Entegris Escrow Corp., 5.95%, 6/15/2030 (n) | $ | 2,241,000 | 2,158,866 | |
| Euronet Worldwide, Inc., 1.375%, 5/22/2026 | EUR | 770,000 | 731,895 | |
| Fiserv, Inc., 2.65%, 6/01/2030 | $ | 1,341,000 | 1,151,269 | |
| Fiserv, Inc., 4.4%, 7/01/2049 | 669,000 | 552,794 | ||
| Mastercard, Inc., 3.3%, 3/26/2027 | 1,960,000 | 1,886,212 | ||
| Mastercard, Inc., 3.85%, 3/26/2050 | 691,000 | 588,593 | ||
| Issuer | Shares/Par | Value ($) | ||
| Bonds – continued | ||||
| Business Services – continued | ||||
| Visa, Inc., 3.65%, 9/15/2047 | $ | 1,125,000 | $956,521 | |
| $8,691,850 | ||||
| Cable TV – 1.1% | ||||
| CCO Holdings LLC/CCO Holdings Capital Corp., 4.5%, 8/15/2030 (n) | $ | 2,998,000 | $2,467,809 | |
| Charter Communications Operating LLC/Charter Communications Operating Capital Corp., 4.908%, 7/23/2025 | 607,000 | 596,901 | ||
| Charter Communications Operating LLC/Charter Communications Operating Capital Corp., 4.8%, 3/01/2050 | 1,014,000 | 742,355 | ||
| Comcast Corp., 3.75%, 4/01/2040 | 585,000 | 488,741 | ||
| SES S.A., 3.5%, 1/14/2029 | EUR | 1,040,000 | 1,012,623 | |
| Virgin Media Finance PLC, 3.75%, 7/15/2030 | 2,750,000 | 2,260,280 | ||
| VTR Comunicaciones S.p.A., 5.125%, 1/15/2028 | $ | 1,900,000 | 893,000 | |
| Ziggo B.V., 3.375%, 2/28/2030 | EUR | 2,875,000 | 2,200,423 | |
| $10,662,132 | ||||
| Chemicals – 0.6% | ||||
| Axalta Coating Systems Ltd., 3.375%, 2/15/2029 (n) | $ | 2,700,000 | $2,313,144 | |
| Lonza Finance International N.V., 3.875%, 5/25/2033 | EUR | 180,000 | 193,739 | |
| LYB International Finance III, LLC, 4.2%, 5/01/2050 | $ | 1,382,000 | 1,037,016 | |
| Nutrien Ltd., 4.9%, 3/27/2028 | 451,000 | 447,067 | ||
| Sasol Financing (USA) LLC, 4.375%, 9/18/2026 | 500,000 | 437,212 | ||
| Synthos S.A., 2.5%, 6/07/2028 (n) | EUR | 1,286,000 | 1,084,509 | |
| $5,512,687 | ||||
| Computer Software – 0.2% | ||||
| Microsoft Corp., 3.3%, 2/06/2027 | $ | 774,000 | $756,825 | |
| Microsoft Corp., 2.525%, 6/01/2050 | 888,000 | 611,255 | ||
| Microsoft Corp., 2.675%, 6/01/2060 | 1,112,000 | 743,382 | ||
| $2,111,462 | ||||
| Computer Software - Systems – 0.2% | ||||
| Apple, Inc., 3.2%, 5/11/2027 | $ | 1,023,000 | $987,954 | |
| Apple, Inc., 4.5%, 2/23/2036 | 953,000 | 975,852 | ||
| $1,963,806 | ||||
| Conglomerates – 0.9% | ||||
| Johnson Controls International PLC, 4.25%, 5/23/2035 | EUR | 615,000 | $664,089 | |
| nVent Finance S.à r.l., 5.65%, 5/15/2033 | $ | 602,000 | 590,114 | |
| Regal Rexnord Corp., 6.05%, 4/15/2028 (n) | 1,259,000 | 1,244,192 | ||
| Siemens Financieringsmaatschappij N.V., 3.625%, 2/24/2043 | EUR | 700,000 | 722,272 | |
| TriMas Corp., 4.125%, 4/15/2029 (n) | $ | 3,265,000 | 2,898,798 | |
| Issuer | Shares/Par | Value ($) | ||
| Bonds – continued | ||||
| Conglomerates – continued | ||||
| Westinghouse Air Brake Technologies Corp., 4.95%, 9/15/2028 | $ | 2,727,000 | $2,653,725 | |
| $8,773,190 | ||||
| Consumer Products – 0.3% | ||||
| JAB Holdings B.V., 2.25%, 12/19/2039 | EUR | 1,900,000 | $1,419,281 | |
| Kenvue, Inc., 5.05%, 3/22/2053 (n) | $ | 1,239,000 | 1,247,192 | |
| $2,666,473 | ||||
| Consumer Services – 0.5% | ||||
| Booking Holdings, Inc., 4.125%, 5/12/2033 | EUR | 700,000 | $756,383 | |
| Toll Road Investors Partnership II LP, Capital Appreciation, NPFG, 0%, 2/15/2027 (n) | $ | 1,754,000 | 1,369,688 | |
| TriNet Group, Inc., 3.5%, 3/01/2029 (n) | 3,190,000 | 2,732,671 | ||
| $4,858,742 | ||||
| Containers – 0.3% | ||||
| Ardagh Metal Packaging Finance USA LLC, 3%, 9/01/2029 (n) | EUR | 1,800,000 | $1,411,534 | |
| Ardagh Metal Packaging Finance USA LLC, 3%, 9/01/2029 | 450,000 | 352,884 | ||
| Can-Pack S.A./Eastern PA Land Investment Holding LLC, 3.125%, 11/01/2025 | $ | 900,000 | 797,783 | |
| $2,562,201 | ||||
| Electrical Equipment – 0.4% | ||||
| Arrow Electronics, Inc., 2.95%, 2/15/2032 | $ | 1,371,000 | $1,128,389 | |
| Telefonaktiebolaget LM Ericsson, 1.125%, 2/08/2027 | EUR | 1,390,000 | 1,306,316 | |
| Telefonaktiebolaget LM Ericsson, 1%, 5/26/2029 | 1,830,000 | 1,541,788 | ||
| $3,976,493 | ||||
| Electronics – 0.2% | ||||
| Broadcom, Inc., 3.419%, 4/15/2033 (n) | $ | 1,069,000 | $887,841 | |
| Intel Corp., 5.7%, 2/10/2053 | 526,000 | 519,608 | ||
| SK Hynix, Inc., 6.375%, 1/17/2028 (n) | 459,000 | 464,608 | ||
| $1,872,057 | ||||
| Emerging Market Quasi-Sovereign – 2.3% | ||||
| Abu Dhabi National Energy Co. PJSC, 4.696%, 4/24/2033 (n) | $ | 655,000 | $653,898 | |
| CEZ A.S. (Czech Republic), 2.375%, 4/06/2027 | EUR | 1,045,000 | 1,041,268 | |
| Comision Federal de Electricidad (United Mexican States), 3.348%, 2/09/2031 | $ | 600,000 | 472,806 | |
| Comision Federal de Electricidad (United Mexican States), 3.875%, 7/26/2033 (n) | 844,000 | 643,592 | ||
| DAE Funding LLC (United Arab Emirates), 3.375%, 3/20/2028 | 850,000 | 772,560 | ||
| Dua Capital Ltd. (Federation of Malaysia), 2.78%, 5/11/2031 | 3,445,000 | 2,957,684 | ||
| Issuer | Shares/Par | Value ($) | ||
| Bonds – continued | ||||
| Emerging Market Quasi-Sovereign – continued | ||||
| Eskom Holdings SOC Ltd. (Republic of South Africa), 7.125%, 2/11/2025 | $ | 1,200,000 | $1,147,111 | |
| Indian Railway Finance Corp., 2.8%, 2/10/2031 | 1,850,000 | 1,545,298 | ||
| Ipoteka Bank (Republic of Uzbekistan), 5.5%, 11/19/2025 | 1,102,000 | 997,310 | ||
| KazMunayGas National Co., JSC (Republic of Kazakhstan), 3.5%, 4/14/2033 | 637,000 | 476,517 | ||
| KazMunayGas National Co., JSC (Republic of Kazakhstan), 6.375%, 10/24/2048 | 1,097,000 | 894,055 | ||
| Krung Thai Bank PLC (Cayman Islands Branch), 4.4% to 3/25/2026, FLR (CMT - 5yr. + 3.53%) to 9/25/2169 | 1,000,000 | 910,500 | ||
| Magyar Export-Import Bank PLC (Republic of Hungary), 6.125%, 12/04/2027 (n) | 957,000 | 949,648 | ||
| MDGH - GMTN RSC Ltd. (United Arab Emirates), 5.084%, 5/22/2053 (n) | 200,000 | 199,208 | ||
| Office Cherifien des Phosphates S.A. (Kingdom of Morocco), 3.75%, 6/23/2031 (n) | 677,000 | 554,531 | ||
| Petroleos Mexicanos, 10%, 2/07/2033 (n) | 948,000 | 850,280 | ||
| Petroleos Mexicanos, 7.69%, 1/23/2050 | 2,090,000 | 1,354,615 | ||
| PT Freeport Indonesia, 5.315%, 4/14/2032 (n) | 755,000 | 706,778 | ||
| REC Ltd. (Republic of India), 5.625%, 4/11/2028 (n) | 955,000 | 955,127 | ||
| Southern Gas Corridor CJSC (Republic of Azerbaijan), 6.875%, 3/24/2026 | 1,120,000 | 1,143,325 | ||
| SPP-Distribucia A.S. (Republic of Slovakia), 1%, 6/09/2031 | EUR | 2,800,000 | 2,072,334 | |
| State Oil Company of the Azerbaijan Republic, 6.95%, 3/18/2030 | $ | 1,000,000 | 1,028,160 | |
| $22,326,605 | ||||
| Emerging Market Sovereign – 21.0% | ||||
| Arab Republic of Egypt, 8.875%, 5/29/2050 | $ | 1,050,000 | $540,139 | |
| Dominican Republic, 7.05%, 2/03/2031 (n) | 789,000 | 782,829 | ||
| Dominican Republic, 4.875%, 9/23/2032 | 1,300,000 | 1,090,362 | ||
| Dominican Republic, 5.875%, 1/30/2060 | 2,400,000 | 1,776,633 | ||
| Hellenic Republic (Republic of Greece), 3.875%, 6/15/2028 (n) | EUR | 10,680,000 | 11,697,824 | |
| Hellenic Republic (Republic of Greece), 1.75%, 6/18/2032 (n) | 14,486,000 | 13,240,999 | ||
| Hellenic Republic (Republic of Greece), 4.25%, 6/15/2033 (n) | 12,059,000 | 13,404,735 | ||
| Kingdom of Morocco, 5.95%, 3/08/2028 (n) | $ | 815,000 | 824,392 | |
| Kingdom of Saudi Arabia, 3.25%, 11/17/2051 (n) | 1,300,000 | 901,748 | ||
| Oriental Republic of Uruguay, 8.25%, 5/21/2031 | UYU | 482,632,000 | 11,231,959 | |
| People's Republic of China, 3.13%, 11/21/2029 | CNY | 13,220,000 | 1,915,408 | |
| People's Republic of China, 2.88%, 2/25/2033 | 112,300,000 | 16,011,073 | ||
| Republic of Angola, 9.125%, 11/26/2049 | $ | 900,000 | 670,295 | |
| Republic of Benin, 6.875%, 1/19/2052 | EUR | 1,500,000 | 1,095,665 | |
| Republic of Cote d'Ivoire, 6.875%, 10/17/2040 | 2,600,000 | 2,019,062 | ||
| Issuer | Shares/Par | Value ($) | ||
| Bonds – continued | ||||
| Emerging Market Sovereign – continued | ||||
| Republic of Guatemala, 6.125%, 6/01/2050 | $ | 800,000 | $721,305 | |
| Republic of Hungary, 6.125%, 5/22/2028 (n) | 1,031,000 | 1,047,754 | ||
| Republic of Hungary, 5.5%, 6/16/2034 (n) | 1,364,000 | 1,301,360 | ||
| Republic of Indonesia, 3.55%, 3/31/2032 | 580,000 | 532,768 | ||
| Republic of Korea, 2.125%, 6/10/2027 | KRW | 15,663,000,000 | 11,202,183 | |
| Republic of Korea, 2.375%, 12/10/2027 | 14,000,000,000 | 10,058,695 | ||
| Republic of Korea, 1.875%, 6/10/2029 | 49,064,110,000 | 33,749,242 | ||
| Republic of Korea, 1.375%, 6/10/2030 | 37,732,080,000 | 24,704,780 | ||
| Republic of Paraguay, 6.1%, 8/11/2044 (n) | $ | 1,760,000 | 1,638,016 | |
| Republic of Paraguay, 5.6%, 3/13/2048 | 2,000,000 | 1,717,022 | ||
| Republic of Poland, 5.75%, 11/16/2032 | 478,000 | 507,175 | ||
| Republic of Romania, 2%, 1/28/2032 | EUR | 2,220,000 | 1,703,784 | |
| Republic of Senegal, 6.25%, 5/23/2033 | $ | 1,150,000 | 914,572 | |
| Republic of Serbia, 1.65%, 3/03/2033 | EUR | 728,000 | 496,567 | |
| Republic of Serbia, 2.05%, 9/23/2036 (n) | 696,000 | 437,073 | ||
| Republic of Serbia, 2.05%, 9/23/2036 | 100,000 | 62,798 | ||
| Sultanate of Oman, 7%, 1/25/2051 | $ | 2,550,000 | 2,467,150 | |
| United Mexican States, 7.5%, 6/03/2027 | MXN | 465,300,000 | 24,846,162 | |
| United Mexican States, 7.75%, 5/29/2031 | 105,000,000 | 5,570,241 | ||
| United Mexican States, 4.875%, 5/19/2033 | $ | 1,049,000 | 1,001,848 | |
| United Mexican States, 6.35%, 2/09/2035 | 371,000 | 390,950 | ||
| United Mexican States, 6.338%, 5/04/2053 | 496,000 | 497,381 | ||
| $202,771,949 | ||||
| Energy - Independent – 0.3% | ||||
| Energean Israel Finance Ltd., 4.875%, 3/30/2026 | $ | 1,050,000 | $964,740 | |
| Medco Bell Pte. Ltd., 6.375%, 1/30/2027 | 668,000 | 602,439 | ||
| Tengizchevroil Finance Co. International Ltd., 4%, 8/15/2026 (n) | 1,200,000 | 1,056,000 | ||
| $2,623,179 | ||||
| Energy - Integrated – 0.6% | ||||
| BP Capital Markets America, Inc., 4.812%, 2/13/2033 | $ | 621,000 | $614,040 | |
| BP Capital Markets B.V., 4.323%, 5/12/2035 | EUR | 830,000 | 893,642 | |
| BP Capital Markets PLC, 3.625%, 6/22/2170 | 1,280,000 | 1,183,500 | ||
| Eni S.p.A., 3.625%, 5/19/2027 | 700,000 | 745,649 | ||
| Eni S.p.A., 4.25%, 5/09/2029 (n) | $ | 1,139,000 | 1,089,585 | |
| Galp Energia SGPS S.A., 2%, 1/15/2026 | EUR | 900,000 | 908,103 | |
| $5,434,519 | ||||
| Engineering - Construction – 0.1% | ||||
| Arcadis N.V., 4.875%, 2/28/2028 | EUR | 909,000 | $981,434 | |
| Issuer | Shares/Par | Value ($) | ||
| Bonds – continued | ||||
| Entertainment – 0.2% | ||||
| Motion Finco S.à r.l., 7.375%, 6/15/2030 (n) | EUR | 1,424,000 | $1,514,077 | |
| Financial Institutions – 1.6% | ||||
| AerCap Ireland Capital DAC/AerCap Global Aviation Trust, 5.75%, 6/06/2028 (w) | $ | 803,000 | $796,214 | |
| Avolon Holdings Funding Ltd., 3.95%, 7/01/2024 (n) | 773,000 | 747,680 | ||
| Avolon Holdings Funding Ltd., 4.375%, 5/01/2026 (n) | 1,336,000 | 1,233,788 | ||
| CTP N.V., 0.875%, 1/20/2026 | EUR | 880,000 | 792,089 | |
| EXOR N.V., 2.25%, 4/29/2030 | 1,000,000 | 945,025 | ||
| Global Aircraft Leasing Co. Ltd., 6.5% (6.5% Cash or 7.25% PIK), 9/15/2024 (n)(p) | $ | 2,071,593 | 1,848,897 | |
| Global Aircraft Leasing Co. Ltd., 6.5% (6.5% Cash or 7.25% PIK), 9/15/2024 (n)(p) | 1,253,862 | 1,119,072 | ||
| Grand City Properties S.A., 1.5%, 12/09/2069 | EUR | 1,200,000 | 468,178 | |
| Logicor Financing S.à r.l., 1.625%, 1/17/2030 | 1,100,000 | 847,074 | ||
| Logicor Financing S.à r.l., 0.875%, 1/14/2031 | 970,000 | 669,338 | ||
| Nationstar Mortgage Holdings, Inc., 6%, 1/15/2027 (n) | $ | 2,021,000 | 1,843,152 | |
| P3 Group S.à r.l., 1.625%, 1/26/2029 | EUR | 870,000 | 715,982 | |
| Samhallsbyggnadsbolaget i Norden AB, 1.75%, 1/14/2025 | 780,000 | 664,159 | ||
| Samhallsbyggnadsbolaget i Norden AB, 2.875% to 1/30/2027, FLR (EUR Swap Rate - 5yr. + 3.223%) to 1/30/32, FLR (EUR Swap Rate - 5yr. + 3.473%) to 1/30/47, FLR (EUR Swap Rate - 5yr. + 4.473%) to 1/30/2171 | 2,600,000 | 571,886 | ||
| SBB Treasury Oyj, 0.75%, 12/14/2028 | 730,000 | 488,232 | ||
| SBB Treasury Oyj, 1.125%, 11/26/2029 | 580,000 | 382,021 | ||
| VGP N.V., 1.5%, 4/08/2029 | 1,500,000 | 1,086,270 | ||
| $15,219,057 | ||||
| Food & Beverages – 0.8% | ||||
| Anheuser-Busch InBev Worldwide, Inc., 4.375%, 4/15/2038 | $ | 1,112,000 | $1,042,281 | |
| Anheuser-Busch InBev Worldwide, Inc., 5.55%, 1/23/2049 | 364,000 | 380,652 | ||
| Carlsberg Breweries A/S, 3.5%, 11/26/2026 | EUR | 710,000 | 756,460 | |
| Central America Bottling Co., 5.25%, 4/27/2029 (n) | $ | 960,000 | 892,800 | |
| Compania Cervecerias Unidas S.A., 3.35%, 1/19/2032 | 578,000 | 490,722 | ||
| Constellation Brands, Inc., 4.75%, 12/01/2025 | 667,000 | 661,295 | ||
| Constellation Brands, Inc., 3.15%, 8/01/2029 | 403,000 | 363,682 | ||
| Constellation Brands, Inc., 2.25%, 8/01/2031 | 760,000 | 620,503 | ||
| JBS USA Lux S.A./JBS USA Food Co./JBS USA Finance, Inc., 3.625%, 1/15/2032 (n) | 1,595,000 | 1,290,525 | ||
| Kraft Heinz Foods Co., 3.875%, 5/15/2027 | 1,624,000 | 1,572,982 | ||
| $8,071,902 | ||||
| Forest & Paper Products – 0.1% | ||||
| Stora Enso Oyj, 4.25%, 9/01/2029 (w) | EUR | 465,000 | $501,701 | |
| Issuer | Shares/Par | Value ($) | ||
| Bonds – continued | ||||
| Gaming & Lodging – 0.3% | ||||
| Las Vegas Sands Corp., 3.9%, 8/08/2029 | $ | 925,000 | $818,206 | |
| Marriott International, Inc., 2.85%, 4/15/2031 | 1,632,000 | 1,372,358 | ||
| VICI Properties LP, REIT, 4.95%, 2/15/2030 | 1,034,000 | 961,921 | ||
| $3,152,485 | ||||
| Industrial – 0.5% | ||||
| Albion Financing 1 S.à r.l., 5.25%, 10/15/2026 | EUR | 2,370,000 | $2,340,155 | |
| Dar Al-Arkan Sukuk Co. Ltd., 6.875%, 2/26/2027 | $ | 1,000,000 | 974,450 | |
| Trustees of the University of Pennsylvania, 2.396%, 10/01/2050 | 1,894,000 | 1,225,310 | ||
| $4,539,915 | ||||
| Insurance – 0.8% | ||||
| AIA Group Ltd., 0.88%, 9/09/2033 | EUR | 1,280,000 | $1,084,443 | |
| ASR Nederland N.V., 7% to 12/07/2033, FLR (EUR Swap Rate - 5yr. + 5.3%) to 12/07/2043 | 920,000 | 1,023,068 | ||
| Assicurazioni Generali S.p.A., 5.399%, 4/20/2033 | 1,160,000 | 1,243,029 | ||
| Axa S.A., 5.5% to 7/11/2033, FLR (EURIBOR - 3mo. + 3.6%) to 7/11/2043 | 740,000 | 790,303 | ||
| Corebridge Financial, Inc., 4.35%, 4/05/2042 | $ | 1,562,000 | 1,249,156 | |
| Equitable Holdings, Inc., 5.594%, 1/11/2033 | 1,100,000 | 1,078,424 | ||
| NN Group N.V., 6.367% to 11/03/2033, FLR (EURIBOR - 3mo. + 4%) to 11/03/2043 | EUR | 720,000 | 770,180 | |
| $7,238,603 | ||||
| Insurance - Health – 0.3% | ||||
| Humana, Inc., 5.5%, 3/15/2053 | $ | 247,000 | $241,819 | |
| UnitedHealth Group, Inc., 4.625%, 7/15/2035 | 1,611,000 | 1,580,454 | ||
| UnitedHealth Group, Inc., 3.5%, 8/15/2039 | 670,000 | 558,138 | ||
| UnitedHealth Group, Inc., 3.25%, 5/15/2051 | 701,000 | 511,409 | ||
| $2,891,820 | ||||
| Insurance - Property & Casualty – 0.4% | ||||
| Acrisure LLC/Acrisure Finance, Inc., 4.25%, 2/15/2029 (n) | $ | 1,677,000 | $1,410,809 | |
| American International Group, Inc., 5.125%, 3/27/2033 | 758,000 | 742,730 | ||
| Aon Corp./Aon Global Holdings PLC, 2.6%, 12/02/2031 | 204,000 | 169,054 | ||
| Aon Corp./Aon Global Holdings PLC, 3.9%, 2/28/2052 | 931,000 | 718,146 | ||
| QBE Insurance Group Ltd., 2.5% to 9/13/2028, FLR (GBP Government Yield - 5yr. + 2.061%) to 9/13/2038 | GBP | 685,000 | 661,597 | |
| $3,702,336 | ||||
| Issuer | Shares/Par | Value ($) | ||
| Bonds – continued | ||||
| International Market Quasi-Sovereign – 1.0% | ||||
| Electricite de France S.A., 6.25%, 5/23/2033 (n) | $ | 1,450,000 | $1,468,965 | |
| Electricite de France S.A., 2.625% to 6/01/2028, FLR (EUR Swap Rate - 5yr. + 2.86%) to 6/01/2033, FLR (EUR Swap Rate - 5yr. + 3.11%) to 6/01/2048, FLR (EUR Swap Rate - 5yr. + 3.86%) to 12/29/2049 | EUR | 600,000 | 508,262 | |
| Electricite de France S.A., 2.875% to 3/15/2027, FLR (EUR Swap Rate - 5yr. + 3.373%) to 3/15/2031, FLR (EUR Swap Rate - 5yr. + 3.623%) to 3/15/2047, FLR (EUR Swap Rate - 5yr. + 4.373%) to 3/15/2070 | 1,400,000 | 1,260,768 | ||
| Electricite de France S.A., 5.875% to 1/22/2029, FLR (GBP Swap Rate - 15yr. + 3.323%) to 1/22/2049, FLR (GBP Swap Rate - 15yr. + 4.073%) to 12/31/2165 | GBP | 1,000,000 | 1,020,039 | |
| EnBW International Finance B.V., 3.5%, 7/24/2028 | EUR | 825,000 | 874,373 | |
| La Banque Postale S.A., 4%, 5/03/2028 | 1,800,000 | 1,915,566 | ||
| Landsbankinn Bank (Republic of Iceland), 0.375%, 5/23/2025 | 1,040,000 | 976,541 | ||
| NBN Co. Ltd., 4.375%, 3/15/2033 | 453,000 | 489,645 | ||
| Ontario Teachers' Cadillac Fairview Properties, 2.5%, 10/15/2031 (n) | $ | 878,000 | 693,892 | |
| $9,208,051 | ||||
| International Market Sovereign – 23.0% | ||||
| Commonwealth of Australia, 2.75%, 11/21/2028 | AUD | 8,661,000 | $5,451,745 | |
| Commonwealth of Australia, 1%, 11/21/2031 | 38,939,000 | 20,581,195 | ||
| Commonwealth of Australia, 3.25%, 6/21/2039 | 8,590,000 | 5,125,967 | ||
| Federal Republic of Germany, 1.7%, 8/15/2032 | EUR | 2,255,000 | 2,304,313 | |
| Federal Republic of Germany, 0%, 8/15/2052 | 1,835,375 | 986,115 | ||
| Government of Bermuda, 2.375%, 8/20/2030 (n) | $ | 508,000 | 428,193 | |
| Government of Bermuda, 5%, 7/15/2032 (n) | 1,933,000 | 1,899,336 | ||
| Government of Japan, 0.1%, 12/20/2026 | JPY | 2,488,500,000 | 17,937,383 | |
| Government of Japan, 2.1%, 12/20/2027 | 1,466,000,000 | 11,497,880 | ||
| Government of Japan, 1.7%, 6/20/2044 | 1,114,900,000 | 8,964,892 | ||
| Government of Japan, 0.3%, 6/20/2046 | 1,378,950,000 | 8,262,615 | ||
| Government of Japan, 1.6%, 12/20/2052 | 1,117,850,000 | 8,657,089 | ||
| Government of New Zealand, 1.5%, 5/15/2031 | NZD | 8,044,000 | 3,953,860 | |
| Government of New Zealand , 2%, 5/15/2032 | 18,975,000 | 9,511,526 | ||
| Kingdom of Belgium, 3%, 6/22/2033 (n) | EUR | 15,667,000 | 16,803,860 | |
| Kingdom of Belgium, 0.4%, 6/22/2040 | 4,456,000 | 2,970,218 | ||
| Kingdom of Spain, 2.55%, 10/31/2032 | 4,737,000 | 4,771,982 | ||
| Kingdom of Spain, 3.15%, 4/30/2033 | 15,842,000 | 16,681,408 | ||
| Kingdom of Spain, 3.9%, 7/30/2039 (n) | 4,357,000 | 4,741,667 | ||
| Kingdom of Spain, 1%, 10/31/2050 | 5,699,000 | 3,179,323 | ||
| Kingdom of Sweden, 1.75%, 11/11/2033 | SEK | 254,690,000 | 22,347,277 | |
| Republic of Finland, 3%, 9/15/2033 | EUR | 3,974,000 | 4,283,184 | |
| Issuer | Shares/Par | Value ($) | ||
| Bonds – continued | ||||
| International Market Sovereign – continued | ||||
| Republic of Italy, 0.5%, 7/15/2028 | EUR | 10,609,000 | $9,742,069 | |
| United Kingdom Treasury, 1.25%, 7/22/2027 | GBP | 24,445,000 | 27,036,071 | |
| United Kingdom Treasury, 1.25%, 10/22/2041 | 2,711,000 | 2,025,277 | ||
| United Kingdom Treasury, 1.25%, 7/31/2051 | 2,469,805 | 1,498,889 | ||
| $221,643,334 | ||||
| Local Authorities – 0.6% | ||||
| City of Oslo, 4.45%, 4/13/2029 | NOK | 8,000,000 | $731,664 | |
| City of Oslo, 2.17%, 5/18/2029 | 26,000,000 | 2,101,559 | ||
| Province of Alberta, 4.5%, 12/01/2040 | CAD | 760,000 | 577,852 | |
| Province of British Columbia, 2.95%, 6/18/2050 | 765,000 | 456,143 | ||
| Province of Ontario (Canada), 1.9%, 12/02/2051 | 3,056,000 | 1,429,510 | ||
| $5,296,728 | ||||
| Machinery & Tools – 0.2% | ||||
| Sarens Finance Co. N.V., 5.75%, 2/21/2027 | EUR | 1,611,000 | $1,456,204 | |
| Major Banks – 4.6% | ||||
| Australia and New Zealand Banking Group Ltd., 2.57% to 11/25/2030, FLR (CMT - 5yr. + 1.7%) to 11/25/2035 (n) | $ | 1,133,000 | $862,969 | |
| Banco de Sabadell S.A., 0%, 6/07/2029 (w) | EUR | 500,000 | 533,291 | |
| Banco de Sabadell S.A., 5%, 6/07/2029 (w) | 500,000 | 533,291 | ||
| Bank of America Corp., 5.202% to 4/25/2033, FLR (SOFR - 1 day + 1.63%) to 4/25/2029 | $ | 1,223,000 | 1,218,712 | |
| Bank of America Corp., 2.687% to 4/22/2031, FLR (SOFR - 1 day + 1.32%) to 4/22/2032 | 2,325,000 | 1,921,353 | ||
| Barclays Bank PLC, 8.407% to 11/14/2027, FLR (GBP Swap Rate - 5yr. + 4.75%) to 11/14/2032 | GBP | 400,000 | 505,029 | |
| Barclays Bank PLC, 5.235%, 8/14/2171 | $ | 1,150,000 | 1,016,600 | |
| BNP Paribas S.A., 4.25% to 4/13/2030, FLR (EURIBOR - 3mo. + 1.37%) to 4/13/2031 | EUR | 900,000 | 953,265 | |
| BNP Paribas S.A., FLR, 5.285% (LIBOR - 6mo. + 0.075%), 3/23/2172 | $ | 950,000 | 795,036 | |
| Capital One Financial Corp., 0.8%, 6/12/2024 | EUR | 277,000 | 278,675 | |
| Commonwealth Bank of Australia, 2.688%, 3/11/2031 (n) | $ | 1,696,000 | 1,336,525 | |
| Credit Agricole S.A., 4.75%, 3/23/2171 (n) | 348,000 | 274,607 | ||
| Credit Suisse AG (London), 2.125%, 5/31/2024 | EUR | 890,000 | 922,818 | |
| Credit Suisse AG (London), 5.5%, 8/20/2026 | 480,000 | 523,128 | ||
| Credit Suisse Group AG, 7.75% to 3/01/2028, FLR (EUR ICE Swap Rate - 1yr. + 4.95%) to 3/01/2029 | 1,480,000 | 1,750,458 | ||
| Goldman Sachs Group, Inc., 2.383% to 7/21/2031, FLR (SOFR - 1 day + 1.248%) to 7/21/2032 | $ | 1,562,000 | 1,257,677 | |
| Goldman Sachs Group, Inc., 3.436% to 2/24/2042, FLR (SOFR - 1 day + 1.632%) to 2/24/2043 | 816,000 | 610,697 | ||
| Issuer | Shares/Par | Value ($) | ||
| Bonds – continued | ||||
| Major Banks – continued | ||||
| HSBC Bank PLC, 5.46%, 3/18/2171 | $ | 420,000 | $416,850 | |
| HSBC Bank PLC, 5.251%, 6/11/2171 | 210,000 | 209,213 | ||
| HSBC Bank PLC, 5.401%, 12/19/2171 | 550,000 | 545,875 | ||
| HSBC Holdings PLC, 4.375%, 11/23/2026 | 2,272,000 | 2,179,243 | ||
| HSBC Holdings PLC, 4.787%, 3/10/2032 | EUR | 910,000 | 982,959 | |
| HSBC Holdings PLC, 4.856% to 5/23/2032, FLR (EURIBOR - 3mo. + 1.942%) to 5/23/2033 | 1,070,000 | 1,157,676 | ||
| HSBC Holdings PLC, 4% to 9/09/2026, FLR (CMT - 1yr. + 3.222%) to 9/09/2170 | $ | 908,000 | 767,301 | |
| ING Groep N.V., 1%, 11/16/2032 | EUR | 1,100,000 | 980,190 | |
| ING Groep N.V., 6.25%, 5/20/2033 | GBP | 1,000,000 | 1,183,952 | |
| JPMorgan Chase & Co., 1.47% to 9/22/2026, FLR (SOFR - 1 day + 0.765%) to 9/22/2027 | $ | 1,107,000 | 981,068 | |
| JPMorgan Chase & Co., 3.328% to 4/22/2051, FLR (SOFR - 1 day + 1.58%) to 4/22/2052 | 2,081,000 | 1,490,341 | ||
| mBank S.A., 0.966% to 9/21/2026, FLR (EURIBOR - 3mo. + 1.25%) to 9/21/2027 | EUR | 1,300,000 | 1,076,083 | |
| Morgan Stanley, 3.125%, 7/27/2026 | $ | 643,000 | 606,444 | |
| Morgan Stanley, 1.593% to 5/04/2026, FLR (SOFR - 1 day + 0.879%) to 5/04/2027 | 1,525,000 | 1,371,532 | ||
| Morgan Stanley, 3.622% to 4/01/2030, FLR (SOFR - 1 day + 3.12%) to 4/01/2031 | 1,682,000 | 1,520,292 | ||
| Nationwide Building Society, 0.25%, 9/14/2028 | EUR | 1,420,000 | 1,247,144 | |
| NatWest Group PLC, 4.771%, 2/16/2029 | 730,000 | 782,813 | ||
| NatWest Group PLC, 5.763% to 2/28/2029, FLR (EUR Swap Rate - 5yr. + 2.6%) to 2/28/2034 | 620,000 | 665,767 | ||
| NatWest Group PLC, 4.5%, 3/31/2171 | GBP | 960,000 | 907,287 | |
| Société Générale S.A., 5.625%, 6/02/2033 (w) | EUR | 900,000 | 957,329 | |
| Standard Chartered PLC, 0.8% to 11/17/2028, FLR (EUR Swap Rate - 1yr. + 0.85%) to 11/17/2029 | 910,000 | 798,887 | ||
| Standard Chartered PLC, 4.874%, 5/10/2031 | 1,390,000 | 1,492,502 | ||
| Toronto-Dominion Bank, 4.108%, 6/08/2027 | $ | 2,190,000 | 2,108,051 | |
| Unicaja Banco S.A., 1%, 12/01/2026 | EUR | 700,000 | 668,476 | |
| Unicaja Banco S.A., 5.125% to 2/21/2028, FLR (EUR Swap Rate - 1yr. + 2.15%) to 2/21/2029 | 900,000 | 928,638 | ||
| UniCredit S.p.A., 2.569% to 9/22/2025, FLR (CMT - 1yr. + 2.3%) to 9/22/2026 (n) | $ | 1,350,000 | 1,220,344 | |
| Wells Fargo & Co., 3.526% to 3/24/2027, FLR (SOFR - 1 day + 1.51%) to 3/24/2028 | 780,000 | 731,070 | ||
| Wells Fargo & Co., 2.572% to 2/11/2030, FLR (LIBOR - 3mo. +1%) to 2/11/2031 | 746,000 | 629,761 | ||
| Issuer | Shares/Par | Value ($) | ||
| Bonds – continued | ||||
| Major Banks – continued | ||||
| Wells Fargo & Co., 3.35% to 3/02/2032, FLR (SOFR - 1 day + 1.5%) to 3/02/2033 | $ | 709,000 | $609,014 | |
| $44,510,233 | ||||
| Medical & Health Technology & Services – 0.7% | ||||
| Alcon Finance Corp., 2.6%, 5/27/2030 (n) | $ | 1,443,000 | $1,238,912 | |
| Becton, Dickinson and Co., 4.298%, 8/22/2032 | 428,000 | 406,910 | ||
| CVS Health Corp., 5.25%, 1/30/2031 (w) | 330,000 | 331,252 | ||
| CVS Health Corp., 5.625%, 2/21/2053 | 856,000 | 834,746 | ||
| HCA, Inc., 5.125%, 6/15/2039 | 1,542,000 | 1,411,137 | ||
| New York Society for the Relief of the Ruptured & Crippled, 2.667%, 10/01/2050 | 1,500,000 | 935,274 | ||
| ProMedica Toledo Hospital, “B”, AGM, 6.015%, 11/15/2048 | 675,000 | 638,206 | ||
| Thermo Fisher Scientific Finance I B.V., 2%, 10/18/2051 | EUR | 920,000 | 645,453 | |
| Thermo Fisher Scientific, Inc., 1.75%, 10/15/2028 | $ | 559,000 | 488,519 | |
| $6,930,409 | ||||
| Metals & Mining – 0.7% | ||||
| Anglo American Capital PLC, 5.625%, 4/01/2030 (n) | $ | 451,000 | $450,585 | |
| Anglo American Capital PLC, 4.75%, 9/21/2032 | EUR | 610,000 | 652,519 | |
| Coeur Mining, Inc., 5.125%, 2/15/2029 (n) | $ | 2,384,000 | 2,008,520 | |
| Glencore Funding LLC, 2.85%, 4/27/2031 (n) | 788,000 | 647,641 | ||
| Kaiser Aluminum Corp., 4.625%, 3/01/2028 (n) | 1,677,000 | 1,465,681 | ||
| Novelis Sheet Ingot GmbH, 3.375%, 4/15/2029 | EUR | 1,990,000 | 1,844,780 | |
| $7,069,726 | ||||
| Midstream – 1.1% | ||||
| DT Midstream, Inc., 4.125%, 6/15/2029 (n) | $ | 3,165,000 | $2,744,691 | |
| Enbridge, Inc., 5.7%, 3/08/2033 | 695,000 | 706,754 | ||
| Enbridge, Inc., 5.375%, 9/27/2077 | CAD | 1,400,000 | 950,092 | |
| EQM Midstream Partners LP, 7.5%, 6/01/2030 (n) | $ | 1,325,000 | 1,331,625 | |
| Plains All American Pipeline LP/PAA Finance Corp., 3.55%, 12/15/2029 | 839,000 | 742,260 | ||
| Sabine Pass Liquefaction LLC, 4.2%, 3/15/2028 | 792,000 | 754,495 | ||
| Sabine Pass Liquefaction LLC, 4.5%, 5/15/2030 | 1,093,000 | 1,033,464 | ||
| Targa Resources Corp., 4.2%, 2/01/2033 | 280,000 | 247,129 | ||
| Targa Resources Corp., 4.95%, 4/15/2052 | 716,000 | 568,839 | ||
| Venture Global Calcasieu Pass LLC, 6.25%, 1/15/2030 (n) | 1,833,000 | 1,817,196 | ||
| $10,896,545 | ||||
| Mortgage-Backed – 5.9% | ||||
| Fannie Mae, 5%, 8/01/2040 | $ | 289,864 | $290,668 | |
| Fannie Mae, 4%, 9/01/2040 - 11/01/2044 | 191,972 | 185,399 | ||
| Fannie Mae, 4.5%, 2/01/2041 - 4/01/2044 | 1,357,412 | 1,348,346 | ||
| Issuer | Shares/Par | Value ($) | ||
| Bonds – continued | ||||
| Mortgage-Backed – continued | ||||
| Fannie Mae, 3.5%, 9/01/2045 - 12/01/2047 | $ | 661,221 | $618,923 | |
| Fannie Mae, UMBS, 5.5%, 4/01/2031 - 2/01/2053 | 3,051,080 | 3,054,616 | ||
| Fannie Mae, UMBS, 2%, 4/01/2042 - 5/01/2052 | 5,667,893 | 4,716,981 | ||
| Fannie Mae, UMBS, 3.5%, 5/01/2049 - 5/01/2052 | 203,238 | 190,899 | ||
| Fannie Mae, UMBS, 2.5%, 3/01/2050 - 2/01/2053 | 12,065,832 | 10,336,099 | ||
| Fannie Mae, UMBS, 3%, 12/01/2051 - 7/01/2052 | 3,575,266 | 3,176,812 | ||
| Fannie Mae, UMBS, 4%, 6/01/2052 - 12/01/2052 | 3,858,606 | 3,645,696 | ||
| Fannie Mae, UMBS, 6%, 12/01/2052 - 2/01/2053 | 548,528 | 556,338 | ||
| Freddie Mac, 0.209%, 9/25/2026 (i) | 62,189,000 | 421,691 | ||
| Freddie Mac, 1.367%, 3/25/2027 (i) | 1,517,000 | 69,395 | ||
| Freddie Mac, 0.293%, 2/25/2028 (i) | 46,151,000 | 637,262 | ||
| Freddie Mac, 0.108%, 4/25/2028 (i) | 46,683,000 | 313,397 | ||
| Freddie Mac, 0.111%, 5/25/2028 (i) | 47,225,000 | 341,234 | ||
| Freddie Mac, 1.799%, 4/25/2030 (i) | 2,395,024 | 247,536 | ||
| Freddie Mac, 1.868%, 4/25/2030 (i) | 2,589,254 | 270,699 | ||
| Freddie Mac, 1.665%, 5/25/2030 (i) | 3,408,930 | 327,806 | ||
| Freddie Mac, 1.798%, 5/25/2030 (i) | 7,523,890 | 778,348 | ||
| Freddie Mac, 1.342%, 6/25/2030 (i) | 3,170,959 | 250,334 | ||
| Freddie Mac, 1.6%, 8/25/2030 (i) | 2,931,170 | 277,113 | ||
| Freddie Mac, 1.17%, 9/25/2030 (i) | 1,901,519 | 134,368 | ||
| Freddie Mac, 1.08%, 11/25/2030 (i) | 3,948,102 | 262,002 | ||
| Freddie Mac, 0.329%, 1/25/2031 (i) | 15,720,989 | 302,258 | ||
| Freddie Mac, 0.516%, 3/25/2031 (i) | 20,442,496 | 643,691 | ||
| Freddie Mac, 0.938%, 7/25/2031 (i) | 5,068,698 | 314,565 | ||
| Freddie Mac, 0.536%, 9/25/2031 (i) | 21,590,988 | 743,643 | ||
| Freddie Mac, 0.568%, 12/25/2031 (i) | 5,486,706 | 213,334 | ||
| Freddie Mac, 4.35%, 1/25/2033 (i) | 622,477 | 621,436 | ||
| Freddie Mac, 4.5%, 12/01/2039 - 5/01/2042 | 618,494 | 615,812 | ||
| Freddie Mac, 5%, 7/01/2041 | 291,875 | 295,329 | ||
| Freddie Mac, 4%, 4/01/2044 | 31,652 | 30,521 | ||
| Freddie Mac, UMBS, 3%, 6/01/2050 - 4/01/2052 | 353,691 | 315,817 | ||
| Freddie Mac, UMBS, 2.5%, 8/01/2051 - 3/01/2053 | 2,923,835 | 2,504,002 | ||
| Freddie Mac, UMBS, 2%, 2/01/2052 | 645,094 | 531,385 | ||
| Freddie Mac, UMBS, 5%, 8/01/2052 | 509,214 | 502,738 | ||
| Freddie Mac, UMBS, 5.5%, 12/01/2052 - 1/01/2053 | 951,764 | 953,983 | ||
| Freddie Mac, UMBS, 6%, 12/01/2052 | 273,716 | 281,817 | ||
| Ginnie Mae, 2.5%, 8/20/2051 | 210,473 | 184,113 | ||
| Ginnie Mae, 2%, 1/20/2052 - 4/20/2052 | 3,146,700 | 2,666,886 | ||
| Ginnie Mae, 3%, 5/20/2052 - 10/20/2052 | 2,817,722 | 2,535,847 | ||
| Ginnie Mae, 4%, 10/20/2052 - 11/20/2052 | 1,081,307 | 1,027,360 | ||
| Ginnie Mae, 3.5%, 11/20/2052 | 2,325,000 | 2,156,178 | ||
| Ginnie Mae, 6%, 12/20/2052 - 4/20/2053 | 298,988 | 301,936 | ||
| Ginnie Mae, 5%, 1/20/2053 - 5/20/2053 | 1,823,489 | 1,801,125 | ||
| Issuer | Shares/Par | Value ($) | ||
| Bonds – continued | ||||
| Mortgage-Backed – continued | ||||
| Ginnie Mae, 5.5%, 2/20/2053 - 4/20/2053 | $ | 924,946 | $924,507 | |
| UMBS, TBA, 2%, 6/15/2038 | 1,625,000 | 1,456,025 | ||
| UMBS, TBA, 4.5%, 6/13/2053 | 1,975,000 | 1,912,934 | ||
| UMBS, TBA, 5.5%, 6/25/2053 | 725,000 | 724,547 | ||
| $57,013,751 | ||||
| Municipals – 1.1% | ||||
| Iowa Student Loan Liquidity Corp. Rev., Taxable, “A”, 5.08%, 12/01/2039 | $ | 1,130,000 | $1,054,559 | |
| Massachusetts Educational Financing Authority, Education Loan Rev., Taxable, “M-A”, 2.641%, 7/01/2037 | 1,060,000 | 974,060 | ||
| Massachusetts Educational Financing Authority, Education Loan Rev., Taxable, “M-A”, 4.949%, 7/01/2038 | 2,690,000 | 2,626,965 | ||
| Massachusetts Housing Finance Agency, Single Family Housing Rev., Taxable, “226”, 5.562%, 12/01/2052 | 1,855,000 | 1,878,177 | ||
| Michigan Finance Authority Hospital Rev., Taxable (Trinity Health Credit Group), 3.384%, 12/01/2040 | 1,040,000 | 853,472 | ||
| Minnesota Housing Finance Agency, Residential Housing, Taxable, “G”, 4.337%, 1/01/2047 | 1,775,000 | 1,718,616 | ||
| New Jersey Economic Development Authority State Pension Funding Rev., Taxable, “A”, NPFG, 7.425%, 2/15/2029 | 890,000 | 967,902 | ||
| Oklahoma Development Finance Authority, Health System Rev., Taxable (OU Medicine Project), “C”, 5.45%, 8/15/2028 | 742,000 | 631,898 | ||
| $10,705,649 | ||||
| Natural Gas - Distribution – 0.2% | ||||
| Engie S.A., 4.25%, 1/11/2043 | EUR | 900,000 | $953,698 | |
| NiSource, Inc., 2.95%, 9/01/2029 | $ | 1,406,000 | 1,238,683 | |
| $2,192,381 | ||||
| Natural Gas - Pipeline – 0.3% | ||||
| APA Infrastructure Ltd., 0.75%, 3/15/2029 | EUR | 1,700,000 | $1,478,551 | |
| APA Infrastructure Ltd., 2.5%, 3/15/2036 | GBP | 1,750,000 | 1,436,188 | |
| $2,914,739 | ||||
| Network & Telecom – 0.0% | ||||
| AT&T, Inc., 3.5%, 9/15/2053 | $ | 335,000 | $232,558 | |
| Oil Services – 0.1% | ||||
| MV24 Capital B.V., 6.748%, 6/01/2034 | $ | 942,150 | $835,027 | |
| Oils – 0.3% | ||||
| Neste Oyj, 3.875%, 3/16/2029 | EUR | 680,000 | $734,554 | |
| Parkland Corp., 4.625%, 5/01/2030 (n) | $ | 2,832,000 | 2,448,264 | |
| $3,182,818 | ||||
| Issuer | Shares/Par | Value ($) | ||
| Bonds – continued | ||||
| Other Banks & Diversified Financials – 2.1% | ||||
| AIB Group PLC, 5.75% to 2/16/2028, FLR (EUR Swap Rate - 1yr. + 2.85%) to 2/16/2029 | EUR | 650,000 | $719,361 | |
| Arion Banki HF, 4.875%, 12/21/2024 | 1,650,000 | 1,715,223 | ||
| Banque Federative du Credit Mutuel S.A., 4.375%, 5/02/2030 | 900,000 | 962,760 | ||
| BPCE S.A., 2.277% to 1/20/2031, FLR (SOFR - 1 day + 1.312%) to 1/20/2032 (n) | $ | 1,240,000 | 960,720 | |
| CaixaBank S.A., 4.625% to 5/16/2026, FLR (EURIBOR - 3mo. + 1.5%) to 5/16/2027 | EUR | 600,000 | 641,019 | |
| CaixaBank S.A., 6.875% to 10/25/2028, FLR (GBP Swap Rate - 5yr. + 3.7%) to 10/25/2033 | GBP | 500,000 | 593,183 | |
| Deutsche Bank AG, 1.875% to 2/23/2027, FLR (EURIBOR - 3mo. + 1.38%) to 2/23/2028 | EUR | 700,000 | 662,937 | |
| Deutsche Bank AG, 3.25% to 5/24/2027, FLR (EURIBOR - 3mo. + 1.93%) to 5/24/2028 | 400,000 | 394,676 | ||
| Deutsche Bank AG, 6.125% to 12/12/2029, FLR (SONIA + 2.621%) to 12/12/2030 | GBP | 1,000,000 | 1,170,077 | |
| Deutsche Bank AG, 1.375% to 2/17/2031, FLR (EURIBOR - 3mo. + 1.5%) to 2/17/2032 | EUR | 800,000 | 634,360 | |
| Deutsche Bank AG, 4%, 6/24/2032 | 700,000 | 663,589 | ||
| Groupe BPCE S.A., 4.5%, 3/15/2025 (n) | $ | 1,100,000 | 1,061,055 | |
| Groupe BPCE S.A., 1.75%, 2/02/2034 | EUR | 1,100,000 | 959,974 | |
| Groupe des Assurances du Credit Mutuel, 1.85% to 4/21/2032, FLR (EURIBOR - 3mo. + 2.65%) to 4/21/2042 | 1,800,000 | 1,410,999 | ||
| Intesa Sanpaolo S.p.A., 4.875%, 5/19/2030 | 870,000 | 933,436 | ||
| M&T Bank Corp., 4.553% to 8/16/2027, FLR (SOFR - 1 day + 1.78%) to 8/16/2028 | $ | 788,000 | 735,134 | |
| Shinhan Bank Co., Ltd., 4.375%, 4/13/2032 (n) | 1,650,000 | 1,520,607 | ||
| Skipton Building Society, 6.25%, 4/25/2029 | GBP | 980,000 | 1,180,548 | |
| United Overseas Bank Ltd., 2% to 10/14/2026, FLR (CMT - 5yr. + 1.23%) to 10/14/2031 (n) | $ | 800,000 | 708,713 | |
| Uzbek Industrial and Construction Bank, 5.75%, 12/02/2024 | 1,230,000 | 1,143,900 | ||
| Virgin Money UK PLC, 5.125% to 12/11/2025, FLR (GBP Government Yield - 5yr. + 5.25%) to 12/11/2030 | GBP | 960,000 | 1,089,998 | |
| $19,862,269 | ||||
| Pharmaceuticals – 0.3% | ||||
| Amgen, Inc., 5.25%, 3/02/2030 | $ | 361,000 | $363,802 | |
| Amgen, Inc., 5.6%, 3/02/2043 | 368,000 | 364,490 | ||
| Bayer AG, 4.25%, 8/26/2029 | EUR | 335,000 | 365,867 | |
| Bayer AG, 4.625%, 5/26/2033 | 975,000 | 1,064,292 | ||
| Pfizer Investment Enterprises Pte. Ltd., 4.75%, 5/19/2033 | $ | 1,055,000 | 1,059,231 | |
| $3,217,682 | ||||
| Issuer | Shares/Par | Value ($) | ||
| Bonds – continued | ||||
| Pollution Control – 0.2% | ||||
| Waste Connections, Inc., 4.2%, 1/15/2033 | $ | 927,000 | $874,221 | |
| Waste Management, Inc., 4.625%, 2/15/2033 | 1,029,000 | 1,016,973 | ||
| $1,891,194 | ||||
| Precious Metals & Minerals – 0.1% | ||||
| Northern Star Resources Ltd. Co., 6.125%, 4/11/2033 (n) | $ | 1,160,000 | $1,135,754 | |
| Printing & Publishing – 0.1% | ||||
| Wolters Kluwer N.V., 3.75%, 4/03/2031 | EUR | 930,000 | $998,799 | |
| Real Estate - Office – 0.2% | ||||
| Corporate Office Property LP, REIT, 2.25%, 3/15/2026 | $ | 841,000 | $744,109 | |
| Corporate Office Property LP, REIT, 2%, 1/15/2029 | 382,000 | 292,845 | ||
| Corporate Office Property LP, REIT, 2.75%, 4/15/2031 | 946,000 | 705,330 | ||
| $1,742,284 | ||||
| Real Estate - Other – 0.2% | ||||
| EPR Properties, REIT, 3.6%, 11/15/2031 | $ | 694,000 | $530,387 | |
| Lexington Realty Trust Co., 2.7%, 9/15/2030 | 880,000 | 705,621 | ||
| W.P. Carey, Inc., REIT, 2.4%, 2/01/2031 | 911,000 | 729,334 | ||
| $1,965,342 | ||||
| Real Estate - Retail – 0.3% | ||||
| Regency Centers Corp., 3.7%, 6/15/2030 | $ | 679,000 | $610,933 | |
| STORE Capital Corp., REIT, 2.75%, 11/18/2030 | 1,370,000 | 992,817 | ||
| WEA Finance LLC, 2.875%, 1/15/2027 (n) | 1,010,000 | 872,912 | ||
| $2,476,662 | ||||
| Restaurants – 0.1% | ||||
| McDonald's Corp., 4.25%, 3/07/2035 | EUR | 710,000 | $770,808 | |
| Retailers – 0.3% | ||||
| AutoZone, Inc., 4.75%, 8/01/2032 | $ | 450,000 | $438,112 | |
| BK LC Lux Finco 1 S.à r.l., 5.25%, 4/30/2029 | EUR | 1,510,000 | 1,465,354 | |
| Home Depot, Inc., 3.625%, 4/15/2052 | $ | 1,278,000 | 994,976 | |
| Nordstrom, Inc., 4.25%, 8/01/2031 | 597,000 | 453,839 | ||
| $3,352,281 | ||||
| Specialty Chemicals – 0.2% | ||||
| CTEC II GmbH, 5.25%, 2/15/2030 (n) | EUR | 1,669,000 | $1,460,392 | |
| International Flavors & Fragrances, Inc., 1.832%, 10/15/2027 (n) | $ | 917,000 | 775,161 | |
| $2,235,553 | ||||
| Issuer | Shares/Par | Value ($) | ||
| Bonds – continued | ||||
| Specialty Stores – 0.2% | ||||
| DICK'S Sporting Goods, 3.15%, 1/15/2032 | $ | 923,000 | $746,629 | |
| Michael Cos., Inc., 7.875%, 5/01/2029 (n) | 2,653,000 | 1,630,109 | ||
| $2,376,738 | ||||
| Supranational – 0.2% | ||||
| International Bank for Reconstruction and Development, 4.25%, 6/24/2025 | AUD | 590,000 | $385,581 | |
| West African Development Bank, 4.7%, 10/22/2031 | $ | 1,576,000 | 1,276,560 | |
| $1,662,141 | ||||
| Telecommunications - Wireless – 0.7% | ||||
| American Tower Corp., REIT, 2.75%, 1/15/2027 | $ | 680,000 | $625,289 | |
| Crown Castle, Inc., REIT, 3.7%, 6/15/2026 | 2,033,000 | 1,947,885 | ||
| Millicom International Cellular S.A., 5.125%, 1/15/2028 | 720,000 | 620,155 | ||
| Rogers Communications, Inc., 3.8%, 3/15/2032 (n) | 821,000 | 725,538 | ||
| Rogers Communications, Inc., 3.7%, 11/15/2049 | 532,000 | 373,773 | ||
| Tele2 AB, 3.75%, 11/22/2029 | EUR | 430,000 | 457,935 | |
| T-Mobile USA, Inc., 3.875%, 4/15/2030 | $ | 582,000 | 539,979 | |
| Vodafone Group PLC, 3.375%, 8/08/2049 | GBP | 860,000 | 676,015 | |
| Vodafone Group PLC, 5.625%, 2/10/2053 | $ | 730,000 | 697,136 | |
| $6,663,705 | ||||
| Telephone Services – 0.2% | ||||
| Telstra Group Ltd., 3.75%, 5/04/2031 | EUR | 1,159,000 | $1,252,017 | |
| TELUS Corp., 2.85%, 11/13/2031 | CAD | 1,475,000 | 919,737 | |
| $2,171,754 | ||||
| Tobacco – 0.2% | ||||
| B.A.T. International Finance PLC, 2.25%, 1/16/2030 | EUR | 830,000 | $740,466 | |
| Philip Morris International, Inc., 5.125%, 11/17/2027 | $ | 1,203,000 | 1,215,385 | |
| $1,955,851 | ||||
| Transportation - Services – 1.0% | ||||
| Autostrade per L'Italia S.p.A., 4.75%, 1/24/2031 | EUR | 910,000 | $966,534 | |
| Holding d'Infrastructures de Transport, 1.475%, 1/18/2031 | 800,000 | 694,696 | ||
| Q-Park Holding I B.V., 2%, 3/01/2027 | 3,100,000 | 2,799,983 | ||
| Sydney Airport Finance Co. Pty Ltd., 4.375%, 5/03/2033 | 1,171,000 | 1,265,926 | ||
| Transurban Finance Co. Pty Ltd., 4.225%, 4/26/2033 | 1,150,000 | 1,242,604 | ||
| Triton International Ltd., 3.15%, 6/15/2031 (n) | $ | 1,009,000 | 781,803 | |
| United Parcel Service, 5.05%, 3/03/2053 | 1,557,000 | 1,555,307 | ||
| $9,306,853 | ||||
| U.S. Treasury Obligations – 1.2% | ||||
| U.S. Treasury Bonds, 1.125%, 8/15/2040 (f) | $ | 18,055,000 | $11,630,664 | |
| Issuer | Shares/Par | Value ($) | ||
| Bonds – continued | ||||
| Utilities - Electric Power – 3.2% | ||||
| Adani Transmission Ltd., 4.25%, 5/21/2036 | $ | 1,059,500 | $814,813 | |
| American Electric Power Co., Inc., 5.699%, 8/15/2025 (w) | 579,000 | 529,177 | ||
| American Electric Power Co., Inc., 5.625%, 3/01/2033 | 1,222,000 | 1,246,422 | ||
| American Transmission Systems, Inc., 2.65%, 1/15/2032 (n) | 1,316,000 | 1,091,750 | ||
| Bruce Power LP, 2.68%, 12/21/2028 | CAD | 1,650,000 | 1,085,925 | |
| Clearway Energy Operating LLC, 3.75%, 2/15/2031 (n) | $ | 3,260,000 | 2,734,610 | |
| ContourGlobal Power Holdings S.A., 2.75%, 1/01/2026 | EUR | 2,300,000 | 2,226,022 | |
| Duke Energy Corp., 2.55%, 6/15/2031 | $ | 1,238,000 | 1,024,422 | |
| E.ON International Finance B.V., 5.875%, 10/30/2037 | GBP | 1,150,000 | 1,388,015 | |
| Enel Finance International N.V., 3.5%, 4/06/2028 (n) | $ | 505,000 | 466,047 | |
| Enel Finance International N.V., 4.5%, 2/20/2043 | EUR | 530,000 | 547,942 | |
| Enel S.p.A., 2.25% to 3/10/2027, FLR (EUR Swap Rate - 5yr. + 2.679%) to 3/10/2032, FLR (EUR Swap Rate - 5yr. + 2.929%) to 3/10/2047, FLR (EUR Swap Rate - 5yr. + 3.679%) to 3/10/2070 | 1,780,000 | 1,646,166 | ||
| Enel S.p.A., 1.875%, 3/08/2170 | 1,395,000 | 1,076,153 | ||
| Energuate Trust, 5.875%, 5/03/2027 | $ | 1,100,000 | 1,024,155 | |
| ENGIE Energía Chile S.A., 4.5%, 1/29/2025 (n) | 620,000 | 595,409 | ||
| ENGIE Energía Chile S.A., 4.5%, 1/29/2025 | 858,000 | 823,969 | ||
| Evergy, Inc., 2.9%, 9/15/2029 | 846,000 | 747,123 | ||
| Florida Power & Light Co., 2.875%, 12/04/2051 | 710,000 | 480,885 | ||
| Georgia Power Co., 4.95%, 5/17/2033 | 1,276,000 | 1,258,007 | ||
| Investment Energy Resources Ltd., 6.25%, 4/26/2029 (n) | 820,000 | 765,470 | ||
| Jersey Central Power & Light Co., 2.75%, 3/01/2032 (n) | 294,000 | 244,407 | ||
| Listrindo Capital B.V., 4.95%, 9/14/2026 | 1,196,000 | 1,130,272 | ||
| Mong Duong Finance Holdings B.V., 5.125%, 5/07/2029 | 1,450,000 | 1,261,500 | ||
| National Grid Electricity Transmission PLC, 2%, 4/17/2040 | GBP | 1,000,000 | 736,224 | |
| National Grid PLC, 3.875%, 1/16/2029 | EUR | 530,000 | 567,250 | |
| National Grid PLC, 4.275%, 1/16/2035 | 490,000 | 519,643 | ||
| NextEra Energy Capital Holdings, Inc., 6.051%, 3/01/2025 | $ | 509,000 | 514,629 | |
| PPL Electric Utilities Corp, 1st Mortgage, 5.25%, 5/15/2053 | 1,212,000 | 1,214,733 | ||
| Southern California Edison Co., 3.65%, 2/01/2050 | 1,010,000 | 750,044 | ||
| Southern Co., 1.875%, 9/15/2081 | EUR | 100,000 | 83,416 | |
| Star Energy Geothermal (Wayang Windu) Ltd., 6.75%, 4/24/2033 | $ | 810,800 | 791,334 | |
| Virginia Electric & Power Co., 3.5%, 3/15/2027 | 558,000 | 533,973 | ||
| WEC Energy Group, Inc., 1.8%, 10/15/2030 | 1,182,000 | 947,830 | ||
| Xcel Energy, Inc., 4.6%, 6/01/2032 | 422,000 | 406,149 | ||
| $31,273,886 | ||||
| Total Bonds (Identified Cost, $996,450,892) | $921,824,207 | |||
| Issuer | Shares/Par | Value ($) | ||
| Investment Companies (h) – 2.2% | ||||
| Money Market Funds – 2.2% | ||||
| MFS Institutional Money Market Portfolio, 4.88% (v) (Identified Cost, $21,234,474) | 21,234,598 | $21,232,475 | ||
| Other Assets, Less Liabilities – 2.3% | 21,906,689 | |||
| Net Assets – 100.0% | $964,963,371 | |||
| (f) | All or a portion of the security has been segregated as collateral for open futures contracts and cleared swap agreements. | |||
| (h) | An affiliated issuer, which may be considered one in which the fund owns 5% or more of the outstanding voting securities, or a company which is under common control. At period end, the aggregate values of the fund's investments in affiliated issuers and in unaffiliated issuers were $21,232,475 and $921,824,207, respectively. | |||
| (i) | Interest only security for which the fund receives interest on notional principal (Par amount). Par amount shown is the notional principal and does not reflect the cost of the security. | |||
| (n) | Securities exempt from registration under Rule 144A of the Securities Act of 1933. These securities may be sold in the ordinary course of business in transactions exempt from registration, normally to qualified institutional buyers. At period end, the aggregate value of these securities was $207,732,054, representing 21.5% of net assets. | |||
| (p) | Payment-in-kind (PIK) security for which interest income may be received in additional securities and/or cash. | |||
| (v) | Affiliated issuer that is available only to investment companies managed by MFS. The rate quoted for the MFS Institutional Money Market Portfolio is the annualized seven-day yield of the fund at period end. | |||
| (w) | When-issued security. |
| The following abbreviations are used in this report and are defined: | |
| AGM | Assured Guaranty Municipal |
| BZDIOVRA | Brazil Interbank Deposit Rate |
| CLO | Collateralized Loan Obligation |
| CMT | Constant Maturity Treasury |
| EURIBOR | Euro Interbank Offered Rate |
| FLR | Floating Rate. Interest rate resets periodically based on the parenthetically disclosed reference rate plus a spread (if any). The period-end rate reported may not be the current rate. All reference rates are USD unless otherwise noted. |
| ICE | Intercontinental Exchange |
| LIBOR | London Interbank Offered Rate |
| NPFG | National Public Finance Guarantee Corp. |
| REIT | Real Estate Investment Trust |
| SOFR | Secured Overnight Financing Rate |
| SONIA | Sterling Overnight Index Average |
| TBA | To Be Announced |
| UMBS | Uniform Mortgage-Backed Security |
| Abbreviations indicate amounts shown in currencies other than the U.S. dollar. All amounts are stated in U.S. dollars unless otherwise indicated. A list of abbreviations is shown below: | |
| AUD | Australian Dollar |
| BRL | Brazilian Real |
| CAD | Canadian Dollar |
| CLP | Chilean Peso |
| CNH | Chinese Yuan Renminbi (Offshore) |
| CNY | China Yuan Renminbi |
| EUR | Euro |
| GBP | British Pound |
| IDR | Indonesian Rupiah |
| JPY | Japanese Yen |
| KRW | South Korean Won |
| MXN | Mexican Peso |
| NOK | Norwegian Krone |
| NZD | New Zealand Dollar |
| SEK | Swedish Krona |
| SGD | Singapore Dollar |
| TWD | Taiwan Dollar |
| UYU | Uruguayan Peso |
| Forward Foreign Currency Exchange Contracts | ||||||
| Currency Purchased | Currency Sold | Counterparty | Settlement Date | Unrealized Appreciation (Depreciation) | ||
| Asset Derivatives | ||||||
| BRL | 23,916,279 | USD | 4,693,240 | Goldman Sachs International | 6/02/2023 | $20,907 |
| CAD | 6,122,010 | USD | 4,497,738 | Merrill Lynch International | 7/21/2023 | 17,386 |
| CLP | 10,587,812 | USD | 12,790 | Goldman Sachs International | 6/02/2023 | 281 |
| EUR | 5,628,194 | USD | 6,004,050 | State Street Bank Corp. | 7/21/2023 | 29,061 |
| GBP | 1,783,656 | USD | 2,206,377 | Merrill Lynch International | 7/21/2023 | 14,593 |
| GBP | 6,041,644 | USD | 7,486,989 | State Street Bank Corp. | 7/21/2023 | 35,939 |
| KRW | 6,464,986,928 | USD | 4,829,916 | Barclays Bank PLC | 6/15/2023 | 44,238 |
| USD | 1,750,547 | AUD | 2,606,651 | Deutsche Bank AG | 7/21/2023 | 51,905 |
| USD | 589,566 | AUD | 869,468 | Goldman Sachs International | 7/21/2023 | 22,971 |
| USD | 3,766,926 | AUD | 5,685,471 | HSBC Bank | 7/21/2023 | 61,950 |
| USD | 5,666,031 | AUD | 8,542,177 | JPMorgan Chase Bank N.A. | 7/21/2023 | 99,463 |
| USD | 10,543,702 | AUD | 15,922,660 | Merrill Lynch International | 7/21/2023 | 167,590 |
| USD | 41,055,974 | AUD | 60,801,119 | Morgan Stanley Capital Services, Inc. | 7/21/2023 | 1,434,507 |
| USD | 2,416,918 | AUD | 3,585,108 | State Street Bank Corp. | 7/21/2023 | 80,658 |
| USD | 4,726,771 | BRL | 23,916,279 | Goldman Sachs International | 6/02/2023 | 12,624 |
| USD | 965,396 | CAD | 1,300,325 | Deutsche Bank AG | 7/21/2023 | 6,376 |
| USD | 2,406,222 | CAD | 3,231,074 | Goldman Sachs International | 7/21/2023 | 23,229 |
| USD | 26,939,939 | CAD | 36,115,790 | HSBC Bank | 7/21/2023 | 303,707 |
| USD | 31,959,722 | CNH | 218,170,360 | Barclays Bank PLC | 7/21/2023 | 1,169,906 |
| USD | 11,557,230 | CNH | 80,606,031 | State Street Bank Corp. | 7/21/2023 | 181,510 |
| USD | 64,914 | EUR | 58,425 | Barclays Bank PLC | 7/21/2023 | 2,286 |
| USD | 2,101,923 | EUR | 1,914,000 | Citibank N.A. | 7/21/2023 | 50,222 |
| USD | 13,229,660 | EUR | 12,022,309 | HSBC Bank | 7/21/2023 | 342,413 |
| USD | 14,250,255 | EUR | 13,057,912 | JPMorgan Chase Bank N.A. | 7/21/2023 | 252,903 |
| USD | 14,977,997 | EUR | 13,634,109 | Merrill Lynch International | 7/21/2023 | 362,993 |
| USD | 970,429 | EUR | 897,750 | Morgan Stanley Capital Services, Inc. | 7/21/2023 | 8,091 |
| Forward Foreign Currency Exchange Contracts - continued | ||||||
| Currency Purchased | Currency Sold | Counterparty | Settlement Date | Unrealized Appreciation (Depreciation) | ||
| Asset Derivatives - continued | ||||||
| USD | 10,463,348 | EUR | 9,517,550 | State Street Bank Corp. | 7/21/2023 | $261,066 |
| USD | 220,808,303 | EUR | 200,628,773 | UBS AG | 7/21/2023 | 5,745,440 |
| USD | 909,594 | GBP | 725,894 | Barclays Bank PLC | 7/21/2023 | 5,726 |
| USD | 907,075 | GBP | 725,225 | JPMorgan Chase Bank N.A. | 7/21/2023 | 4,040 |
| USD | 84,481,897 | GBP | 67,513,034 | State Street Bank Corp. | 7/21/2023 | 416,092 |
| USD | 999,064 | GBP | 798,872 | UBS AG | 7/21/2023 | 4,325 |
| USD | 4,377,328 | JPY | 582,157,871 | Barclays Bank PLC | 7/21/2023 | 166,460 |
| USD | 1,165,554 | JPY | 154,019,356 | Brown Brothers Harriman | 7/21/2023 | 51,500 |
| USD | 36,915,156 | JPY | 4,851,643,049 | JPMorgan Chase Bank N.A. | 7/21/2023 | 1,822,222 |
| USD | 2,786,635 | JPY | 368,507,468 | UBS AG | 7/21/2023 | 121,145 |
| USD | 7,680,688 | KRW | 10,126,130,000 | Barclays Bank PLC | 6/15/2023 | 46,285 |
| USD | 36,392,831 | KRW | 47,784,515,227 | Citibank N.A. | 7/10/2023 | 312,703 |
| USD | 914,685 | KRW | 1,205,975,422 | JPMorgan Chase Bank N.A. | 8/04/2023 | 2,766 |
| USD | 15,136,184 | KRW | 19,670,984,368 | Merrill Lynch International | 6/15/2023 | 305,619 |
| USD | 2,295,407 | KRW | 3,011,590,754 | Morgan Stanley Capital Services, Inc. | 6/15/2023 | 24,875 |
| USD | 1,043,372 | MXN | 18,617,756 | State Street Bank Corp. | 7/21/2023 | 1,627 |
| USD | 4,883,882 | NOK | 52,019,209 | Brown Brothers Harriman | 7/21/2023 | 186,506 |
| USD | 9,144,863 | NOK | 98,633,566 | Deutsche Bank AG | 7/21/2023 | 238,173 |
| USD | 2,014,598 | NOK | 21,220,434 | UBS AG | 7/21/2023 | 98,376 |
| USD | 2,451,383 | NZD | 4,055,214 | HSBC Bank | 7/21/2023 | 9,563 |
| USD | 4,761,881 | NZD | 7,858,771 | JPMorgan Chase Bank N.A. | 7/21/2023 | 29,775 |
| USD | 8,857,815 | NZD | 14,466,054 | State Street Bank Corp. | 7/21/2023 | 147,178 |
| USD | 7,139,532 | NZD | 11,693,895 | UBS AG | 7/21/2023 | 98,132 |
| USD | 2,755,826 | SEK | 28,334,882 | Citibank N.A. | 7/21/2023 | 137,722 |
| USD | 983,337 | SEK | 10,042,760 | Deutsche Bank AG | 7/21/2023 | 55,400 |
| USD | 2,391,268 | SEK | 24,617,201 | HSBC Bank | 7/21/2023 | 116,673 |
| USD | 1,500,095 | SEK | 16,039,167 | JPMorgan Chase Bank N.A. | 7/21/2023 | 18,098 |
| USD | 16,379,784 | SEK | 168,602,339 | State Street Bank Corp. | 7/21/2023 | 801,160 |
| USD | 5,415,198 | SGD | 7,202,755 | Merrill Lynch International | 7/21/2023 | 79,095 |
| USD | 9,682,216 | SGD | 12,812,845 | State Street Bank Corp. | 7/21/2023 | 189,923 |
| USD | 17,209,531 | TOF | 579,203,248 | Barclays Bank PLC | 7/19/2023 | 442,367 |
| USD | 979,119 | TWD | 29,794,584 | Barclays Bank PLC | 8/03/2023 | 2,614 |
| $16,740,355 | ||||||
| Liability Derivatives | ||||||
| AUD | 5,721,040 | USD | 3,816,676 | HSBC Bank | 7/21/2023 | $(88,520) |
| AUD | 6,220,957 | USD | 4,219,729 | Merrill Lynch International | 7/21/2023 | (165,799) |
| BRL | 23,916,279 | USD | 4,824,262 | Barclays Bank PLC | 6/02/2023 | (110,116) |
| BRL | 23,916,279 | USD | 4,649,472 | Goldman Sachs International | 9/01/2023 | (15,058) |
| CAD | 1,303,873 | USD | 978,492 | HSBC Bank | 7/21/2023 | (16,855) |
| CAD | 15,562,197 | USD | 11,620,030 | Merrill Lynch International | 7/21/2023 | (142,550) |
| EUR | 1,770,133 | USD | 1,940,205 | Barclays Bank PLC | 7/21/2023 | (42,721) |
| EUR | 12,985,900 | USD | 14,275,730 | Brown Brothers Harriman | 7/21/2023 | (355,569) |
| EUR | 4,243,839 | USD | 4,628,080 | Deutsche Bank AG | 7/21/2023 | (78,921) |
| EUR | 2,958,955 | USD | 3,262,205 | HSBC Bank | 7/21/2023 | (90,371) |
| Forward Foreign Currency Exchange Contracts - continued | ||||||
| Currency Purchased | Currency Sold | Counterparty | Settlement Date | Unrealized Appreciation (Depreciation) | ||
| Liability Derivatives - continued | ||||||
| EUR | 1,765,233 | USD | 1,961,680 | JPMorgan Chase Bank N.A. | 7/21/2023 | $(69,448) |
| EUR | 10,490,370 | USD | 11,308,812 | Merrill Lynch International | 7/21/2023 | (63,720) |
| EUR | 9,243,976 | USD | 10,165,660 | State Street Bank Corp. | 7/21/2023 | (256,635) |
| EUR | 4,547,682 | USD | 5,027,749 | UBS AG | 7/21/2023 | (152,888) |
| GBP | 2,908,663 | USD | 3,646,737 | Brown Brothers Harriman | 7/21/2023 | (24,931) |
| GBP | 20,188,543 | USD | 25,164,506 | HSBC Bank | 7/21/2023 | (26,158) |
| GBP | 637,985 | USD | 796,643 | JPMorgan Chase Bank N.A. | 7/21/2023 | (2,238) |
| GBP | 465,188 | USD | 585,739 | Merrill Lynch International | 7/21/2023 | (6,497) |
| GBP | 500,115 | USD | 627,296 | State Street Bank Corp. | 7/21/2023 | (4,563) |
| IDR | 35,783,007,809 | USD | 2,420,060 | Barclays Bank PLC | 8/07/2023 | (34,693) |
| IDR | 71,472,650,695 | USD | 4,835,768 | JPMorgan Chase Bank N.A. | 7/17/2023 | (70,043) |
| JPY | 219,614,087 | USD | 1,682,692 | Deutsche Bank AG | 7/21/2023 | (94,178) |
| JPY | 257,255,027 | USD | 1,960,442 | State Street Bank Corp. | 7/21/2023 | (99,664) |
| JPY | 390,978,412 | USD | 2,975,541 | UBS AG | 7/21/2023 | (147,514) |
| NOK | 140,883,310 | USD | 13,422,599 | HSBC Bank | 7/21/2023 | (700,722) |
| NZD | 7,459,112 | USD | 4,674,153 | Merrill Lynch International | 7/21/2023 | (182,699) |
| NZD | 521,000 | USD | 323,302 | UBS AG | 7/21/2023 | (9,585) |
| SEK | 2,098,000 | USD | 203,851 | State Street Bank Corp. | 7/21/2023 | (9,998) |
| SGD | 19,870,547 | USD | 14,940,674 | BNP Paribas S.A. | 7/21/2023 | (219,739) |
| TOF | 411,388,870 | USD | 12,092,241 | Barclays Bank PLC | 7/19/2023 | (183,080) |
| TOF | 168,372,485 | USD | 4,926,629 | JPMorgan Chase Bank N.A. | 6/13/2023 | (70,633) |
| TWD | 74,022,057 | USD | 2,437,341 | Barclays Bank PLC | 8/03/2023 | (11,301) |
| USD | 4,693,239 | BRL | 23,916,279 | Barclays Bank PLC | 6/02/2023 | (20,907) |
| USD | 1,931,917 | CAD | 2,628,243 | JPMorgan Chase Bank N.A. | 7/21/2023 | (6,473) |
| USD | 12,658 | CLP | 10,587,812 | Goldman Sachs International | 6/02/2023 | (413) |
| USD | 533,083 | EUR | 499,665 | Brown Brothers Harriman | 7/21/2023 | (2,530) |
| USD | 3,832,889 | EUR | 3,580,968 | JPMorgan Chase Bank N.A. | 7/21/2023 | (5,709) |
| USD | 672,033 | GBP | 541,918 | Deutsche Bank AG | 7/21/2023 | (2,752) |
| USD | 774,733 | GBP | 623,866 | HSBC Bank | 7/21/2023 | (2,092) |
| USD | 1,214,890 | GBP | 976,149 | JPMorgan Chase Bank N.A. | 7/21/2023 | (590) |
| USD | 37,771,675 | KRW | 50,183,066,532 | Barclays Bank PLC | 7/10/2023 | (119,501) |
| USD | 1,452,367 | KRW | 1,927,871,991 | Citibank N.A. | 7/10/2023 | (3,290) |
| USD | 6,610,062 | MXN | 121,704,954 | HSBC Bank | 7/21/2023 | (199,861) |
| USD | 4,734,622 | MXN | 86,018,086 | State Street Bank Corp. | 7/21/2023 | (78,466) |
| USD | 2,380,865 | NZD | 3,971,841 | Merrill Lynch International | 7/21/2023 | (10,752) |
| USD | 14,294,205 | TWD | 436,330,613 | Barclays Bank PLC | 8/03/2023 | (6,339) |
| USD | 14,021,627 | TWD | 429,037,942 | Citibank N.A. | 8/03/2023 | (39,903) |
| $(4,046,985) | ||||||
| Futures Contracts | ||||||
| Description | Long/ Short | Currency | Contracts | Notional Amount | Expiration Date | Value/Unrealized Appreciation (Depreciation) |
| Asset Derivatives | ||||||
| Interest Rate Futures | ||||||
| Canadian Treasury Bond 10 yr | Long | CAD | 428 | $38,991,352 | September – 2023 | $12,587 |
| Euro-Buxl 30 yr | Long | EUR | 41 | 6,078,514 | June – 2023 | 294,455 |
| Long Gilt 10yr | Long | GBP | 178 | 21,431,542 | September – 2023 | 342,326 |
| U.S. Treasury Bond | Long | USD | 195 | 25,027,031 | September – 2023 | 235,843 |
| U.S. Treasury Note 10 yr | Long | USD | 194 | 22,206,938 | September – 2023 | 16,817 |
| U.S. Treasury Note 5 yr | Long | USD | 456 | 49,739,625 | September – 2023 | 2,839 |
| U.S. Treasury Ultra Bond | Long | USD | 43 | 5,885,625 | September – 2023 | 96,254 |
| U.S. Treasury Ultra Note 10 yr | Long | USD | 244 | 29,390,562 | September – 2023 | 123,003 |
| $1,124,124 | ||||||
| Liability Derivatives | ||||||
| Interest Rate Futures | ||||||
| Canadian Treasury Bond 5 yr | Long | CAD | 337 | $27,640,206 | September – 2023 | $(62,382) |
| Euro-Bobl 5 yr | Short | EUR | 774 | 97,740,601 | June – 2023 | (2,357,907) |
| Euro-BTP 10 yr | Short | EUR | 247 | 30,615,562 | June – 2023 | (1,231,744) |
| Euro-Bund 10 yr | Long | EUR | 122 | 17,741,709 | June – 2023 | (87,057) |
| Euro-Schatz 2 yr | Short | EUR | 799 | 90,204,877 | June – 2023 | (651,382) |
| U.S. Treasury Note 2 yr | Short | USD | 93 | 19,142,016 | September – 2023 | (32,695) |
| $(4,423,167) | ||||||
| Cleared Swap Agreements | ||||||||||
| Maturity Date | Notional Amount | Counterparty | Cash Flows to Receive/ Frequency | Cash Flows to Pay/ Frequency | Unrealized Appreciation (Depreciation) | Net Unamortized Upfront Payments (Receipts) | Value | |||
| Asset Derivatives | ||||||||||
| Interest Rate Swaps | ||||||||||
| 1/02/26 | BRL | 31,200,000 | centrally cleared | 11.095%/At Maturity | Average Daily BZDIOVRA | $29,083 | $— | $29,083 | ||
| Uncleared Swap Agreements | ||||||||||
| Maturity Date | Notional Amount | Counterparty | Cash Flows to Receive/ Frequency | Cash Flows to Pay/ Frequency | Unrealized Appreciation (Depreciation) | Net Unamortized Upfront Payments (Receipts) | Value | |||
| Asset Derivatives | ||||||||||
| Credit Default Swaps | ||||||||||
| 6/20/28 | EUR | 1,350,000 | Barclays Bank PLC | 5.00%/Quarterly | (1) | $8,565 | $199,954 | $208,519 | ||
| (1) | Fund, as protection seller, to pay notional amount upon a defined credit event by Glencore International AG, 1.875%, 9/13/23, a BBB+ rated bond. The fund entered into the contract to gain issuer exposure. |
| Assets | |
| Investments in unaffiliated issuers, at value (identified cost, $996,450,892) | $921,824,207 |
| Investments in affiliated issuers, at value (identified cost, $21,234,474) | 21,232,475 |
| Cash | 126,187 |
| Receivables for | |
| Forward foreign currency exchange contracts | 16,740,355 |
| Net daily variation margin on open futures contracts | 458,165 |
| Investments sold | 14,629,663 |
| Fund shares sold | 112,018 |
| Interest and dividends | 8,902,675 |
| Uncleared swaps, at value (net of unamortized premiums paid, $199,954) | 208,519 |
| Other assets | 58,923 |
| Total assets | $984,293,187 |
| Liabilities | |
| Payable to custodian | $71,841 |
| Payables for | |
| Distributions | 587 |
| Net daily variation margin on open cleared swap agreements | 1,073 |
| Forward foreign currency exchange contracts | 4,046,985 |
| Investments purchased | 6,072,075 |
| When-issued investments purchased | 4,220,818 |
| TBA purchase commitments | 4,106,573 |
| Fund shares reacquired | 609,843 |
| Payable to affiliates | |
| Investment adviser | 28,205 |
| Administrative services fee | 808 |
| Shareholder servicing costs | 15,438 |
| Distribution and service fees | 277 |
| Accrued expenses and other liabilities | 155,293 |
| Total liabilities | $19,329,816 |
| Net assets | $964,963,371 |
| Net assets consist of | |
| Paid-in capital | $1,109,702,082 |
| Total distributable earnings (loss) | (144,738,711) |
| Net assets | $964,963,371 |
| Shares of beneficial interest outstanding | 122,433,764 |
| Net assets | Shares outstanding | Net asset value per share (a) | |
| Class A | $14,459,117 | 1,824,082 | $7.93 |
| Class B | 137,299 | 17,414 | 7.88 |
| Class C | 397,110 | 50,350 | 7.89 |
| Class I | 15,923,094 | 2,018,129 | 7.89 |
| Class R1 | 585,739 | 74,312 | 7.88 |
| Class R2 | 429,813 | 54,523 | 7.88 |
| Class R3 | 592,984 | 75,216 | 7.88 |
| Class R4 | 188,206 | 23,857 | 7.89 |
| Class R6 | 932,250,009 | 118,295,881 | 7.88 |
| (a) | Maximum offering price per share was equal to the net asset value per share for all share classes, except for Class A, for which the maximum offering price per share was $8.28 [100 / 95.75 x $7.93]. On sales of $100,000 or more, the maximum offering price of Class A shares is reduced. A contingent deferred sales charge may be imposed on redemptions of Class A, Class B, and Class C shares. Redemption price per share was equal to the net asset value per share for Classes I, R1, R2, R3, R4, and R6. |
| Net investment income (loss) | |
| Income | |
| Interest | $19,455,234 |
| Dividends from affiliated issuers | 547,173 |
| Other | 11,316 |
| Foreign taxes withheld | (152,487) |
| Total investment income | $19,861,236 |
| Expenses | |
| Management fee | $2,632,608 |
| Distribution and service fees | 26,085 |
| Shareholder servicing costs | 33,932 |
| Administrative services fee | 75,197 |
| Independent Trustees' compensation | 8,695 |
| Custodian fee | 86,097 |
| Shareholder communications | 12,020 |
| Audit and tax fees | 46,917 |
| Legal fees | 2,343 |
| Miscellaneous | 103,783 |
| Total expenses | $3,027,677 |
| Reduction of expenses by investment adviser | (61,962) |
| Net expenses | $2,965,715 |
| Net investment income (loss) | $16,895,521 |
| Realized and unrealized gain (loss) | |
| Realized gain (loss) (identified cost basis) | |
| Unaffiliated issuers | $(28,797,126) |
| Affiliated issuers | 12,562 |
| Futures contracts | (190,684) |
| Swap agreements | 564,814 |
| Forward foreign currency exchange contracts | (41,701,831) |
| Foreign currency | 284,620 |
| Net realized gain (loss) | $(69,827,645) |
| Change in unrealized appreciation or depreciation | |
| Unaffiliated issuers | $36,000,722 |
| Affiliated issuers | (2,511) |
| Futures contracts | (5,047,559) |
| Swap agreements | 182,630 |
| Forward foreign currency exchange contracts | 42,490,749 |
| Translation of assets and liabilities in foreign currencies | (91,661) |
| Net unrealized gain (loss) | $73,532,370 |
| Net realized and unrealized gain (loss) | $3,704,725 |
| Change in net assets from operations | $20,600,246 |
| Six months ended | Year ended | |
| 5/31/23 (unaudited) | 11/30/22 | |
| Change in net assets | ||
| From operations | ||
| Net investment income (loss) | $16,895,521 | $27,670,839 |
| Net realized gain (loss) | (69,827,645) | (13,464,886) |
| Net unrealized gain (loss) | 73,532,370 | (136,846,051) |
| Change in net assets from operations | $20,600,246 | $(122,640,098) |
| Distributions to shareholders | $(24,931,738) | $(53,126,048) |
| Tax return of capital distributions to shareholders | $— | $(8,616,179) |
| Change in net assets from fund share transactions | $10,531,029 | $(49,743,385) |
| Total change in net assets | $6,199,537 | $(234,125,710) |
| Net assets | ||
| At beginning of period | 958,763,834 | 1,192,889,544 |
| At end of period | $964,963,371 | $958,763,834 |
| Class A | Six months ended | Year ended | ||||
| 5/31/23 (unaudited) | 11/30/22 | 11/30/21 | 11/30/20 | 11/30/19 | 11/30/18 | |
| Net asset value, beginning of period | $7.96 | $9.33 | $9.82 | $9.11 | $8.44 | $8.97 |
| Income (loss) from investment operations | ||||||
| Net investment income (loss) (d) | $0.13 | $0.18 | $0.13 | $0.10 | $0.16 | $0.15 |
| Net realized and unrealized gain (loss) | 0.04 | (1.10) | (0.28) | 0.75 | 0.67 | (0.52) |
| Total from investment operations | $0.17 | $(0.92) | $(0.15) | $0.85 | $0.83 | $(0.37) |
| Less distributions declared to shareholders | ||||||
| From net investment income | $(0.05) | $(0.16) | $(0.18) | $(0.13) | $(0.16) | $(0.16) |
| From net realized gain | (0.15) | (0.26) | (0.16) | (0.01) | — | — |
| From tax return of capital | — | (0.03) | — | — | — | — |
| Total distributions declared to shareholders | $(0.20) | $(0.45) | $(0.34) | $(0.14) | $(0.16) | $(0.16) |
| Net asset value, end of period (x) | $7.93 | $7.96 | $9.33 | $9.82 | $9.11 | $8.44 |
| Total return (%) (r)(s)(t)(x) | 2.06(n) | (10.28) | (1.64) | 9.55 | 9.91 | (4.16) |
| Ratios (%) (to average net assets) and Supplemental data: | ||||||
| Expenses before expense reductions (f) | 0.96(a) | 0.95 | 1.05 | 1.10 | 1.13 | 1.13 |
| Expenses after expense reductions (f) | 0.95(a) | 0.94 | 0.99 | 1.04 | 1.05 | 1.05 |
| Net investment income (loss) | 3.20(a) | 2.23 | 1.40 | 1.13 | 1.78 | 1.72 |
| Portfolio turnover | 72(n) | 150 | 216 | 210 | 126 | 108 |
| Net assets at end of period (000 omitted) | $14,459 | $15,419 | $21,218 | $19,934 | $16,487 | $14,062 |
| Class B | Six months ended | Year ended | ||||
| 5/31/23 (unaudited) | 11/30/22 | 11/30/21 | 11/30/20 | 11/30/19 | 11/30/18 | |
| Net asset value, beginning of period | $7.92 | $9.28 | $9.77 | $9.06 | $8.40 | $8.92 |
| Income (loss) from investment operations | ||||||
| Net investment income (loss) (d) | $0.10 | $0.12 | $0.06 | $0.04 | $0.09 | $0.08 |
| Net realized and unrealized gain (loss) | 0.03 | (1.09) | (0.29) | 0.74 | 0.67 | (0.51) |
| Total from investment operations | $0.13 | $(0.97) | $(0.23) | $0.78 | $0.76 | $(0.43) |
| Less distributions declared to shareholders | ||||||
| From net investment income | $(0.02) | $(0.11) | $(0.10) | $(0.06) | $(0.10) | $(0.09) |
| From net realized gain | (0.15) | (0.26) | (0.16) | (0.01) | — | — |
| From tax return of capital | — | (0.02) | — | — | — | — |
| Total distributions declared to shareholders | $(0.17) | $(0.39) | $(0.26) | $(0.07) | $(0.10) | $(0.09) |
| Net asset value, end of period (x) | $7.88 | $7.92 | $9.28 | $9.77 | $9.06 | $8.40 |
| Total return (%) (r)(s)(t)(x) | 1.56(n) | (10.92) | (2.40) | 8.78 | 9.01 | (4.80) |
| Ratios (%) (to average net assets) and Supplemental data: | ||||||
| Expenses before expense reductions (f) | 1.71(a) | 1.70 | 1.80 | 1.86 | 1.88 | 1.89 |
| Expenses after expense reductions (f) | 1.70(a) | 1.69 | 1.75 | 1.79 | 1.80 | 1.80 |
| Net investment income (loss) | 2.45(a) | 1.47 | 0.64 | 0.42 | 1.04 | 0.97 |
| Portfolio turnover | 72(n) | 150 | 216 | 210 | 126 | 108 |
| Net assets at end of period (000 omitted) | $137 | $165 | $268 | $373 | $605 | $712 |
| Class C | Six months ended | Year ended | ||||
| 5/31/23 (unaudited) | 11/30/22 | 11/30/21 | 11/30/20 | 11/30/19 | 11/30/18 | |
| Net asset value, beginning of period | $7.92 | $9.28 | $9.77 | $9.06 | $8.40 | $8.92 |
| Income (loss) from investment operations | ||||||
| Net investment income (loss) (d) | $0.10 | $0.12 | $0.06 | $0.04 | $0.09 | $0.09 |
| Net realized and unrealized gain (loss) | 0.04 | (1.09) | (0.29) | 0.74 | 0.67 | (0.52) |
| Total from investment operations | $0.14 | $(0.97) | $(0.23) | $0.78 | $0.76 | $(0.43) |
| Less distributions declared to shareholders | ||||||
| From net investment income | $(0.02) | $(0.11) | $(0.10) | $(0.06) | $(0.10) | $(0.09) |
| From net realized gain | (0.15) | (0.26) | (0.16) | (0.01) | — | — |
| From tax return of capital | — | (0.02) | — | — | — | — |
| Total distributions declared to shareholders | $(0.17) | $(0.39) | $(0.26) | $(0.07) | $(0.10) | $(0.09) |
| Net asset value, end of period (x) | $7.89 | $7.92 | $9.28 | $9.77 | $9.06 | $8.40 |
| Total return (%) (r)(s)(t)(x) | 1.69(n) | (10.92) | (2.40) | 8.78 | 9.01 | (4.80) |
| Ratios (%) (to average net assets) and Supplemental data: | ||||||
| Expenses before expense reductions (f) | 1.71(a) | 1.70 | 1.80 | 1.86 | 1.88 | 1.88 |
| Expenses after expense reductions (f) | 1.70(a) | 1.69 | 1.75 | 1.79 | 1.80 | 1.80 |
| Net investment income (loss) | 2.45(a) | 1.47 | 0.63 | 0.44 | 1.04 | 0.97 |
| Portfolio turnover | 72(n) | 150 | 216 | 210 | 126 | 108 |
| Net assets at end of period (000 omitted) | $397 | $420 | $812 | $1,353 | $2,229 | $2,332 |
| Class I | Six months ended | Year ended | ||||
| 5/31/23 (unaudited) | 11/30/22 | 11/30/21 | 11/30/20 | 11/30/19 | 11/30/18 | |
| Net asset value, beginning of period | $7.92 | $9.29 | $9.78 | $9.07 | $8.41 | $8.93 |
| Income (loss) from investment operations | ||||||
| Net investment income (loss) (d) | $0.14 | $0.21 | $0.16 | $0.12 | $0.18 | $0.17 |
| Net realized and unrealized gain (loss) | 0.04 | (1.11) | (0.29) | 0.76 | 0.66 | (0.51) |
| Total from investment operations | $0.18 | $(0.90) | $(0.13) | $0.88 | $0.84 | $(0.34) |
| Less distributions declared to shareholders | ||||||
| From net investment income | $(0.06) | $(0.18) | $(0.20) | $(0.16) | $(0.18) | $(0.18) |
| From net realized gain | (0.15) | (0.26) | (0.16) | (0.01) | — | — |
| From tax return of capital | — | (0.03) | — | — | — | — |
| Total distributions declared to shareholders | $(0.21) | $(0.47) | $(0.36) | $(0.17) | $(0.18) | $(0.18) |
| Net asset value, end of period (x) | $7.89 | $7.92 | $9.29 | $9.78 | $9.07 | $8.41 |
| Total return (%) (r)(s)(t)(x) | 2.20(n) | (10.11) | (1.40) | 9.86 | 10.09 | (3.83) |
| Ratios (%) (to average net assets) and Supplemental data: | ||||||
| Expenses before expense reductions (f) | 0.71(a) | 0.70 | 0.80 | 0.85 | 0.88 | 0.89 |
| Expenses after expense reductions (f) | 0.69(a) | 0.68 | 0.74 | 0.79 | 0.80 | 0.80 |
| Net investment income (loss) | 3.44(a) | 2.48 | 1.64 | 1.30 | 2.05 | 1.98 |
| Portfolio turnover | 72(n) | 150 | 216 | 210 | 126 | 108 |
| Net assets at end of period (000 omitted) | $15,923 | $9,541 | $12,395 | $9,731 | $862 | $1,160 |
| Class R1 | Six months ended | Year ended | ||||
| 5/31/23 (unaudited) | 11/30/22 | 11/30/21 | 11/30/20 | 11/30/19 | 11/30/18 | |
| Net asset value, beginning of period | $7.91 | $9.28 | $9.77 | $9.07 | $8.40 | $8.93 |
| Income (loss) from investment operations | ||||||
| Net investment income (loss) (d) | $0.10 | $0.12 | $0.06 | $0.03 | $0.09 | $0.09 |
| Net realized and unrealized gain (loss) | 0.04 | (1.10) | (0.29) | 0.75 | 0.68 | (0.53) |
| Total from investment operations | $0.14 | $(0.98) | $(0.23) | $0.78 | $0.77 | $(0.44) |
| Less distributions declared to shareholders | ||||||
| From net investment income | $(0.02) | $(0.11) | $(0.10) | $(0.07) | $(0.10) | $(0.09) |
| From net realized gain | (0.15) | (0.26) | (0.16) | (0.01) | — | — |
| From tax return of capital | — | (0.02) | — | — | — | — |
| Total distributions declared to shareholders | $(0.17) | $(0.39) | $(0.26) | $(0.08) | $(0.10) | $(0.09) |
| Net asset value, end of period (x) | $7.88 | $7.91 | $9.28 | $9.77 | $9.07 | $8.40 |
| Total return (%) (r)(s)(t)(x) | 1.69(n) | (11.03) | (2.40) | 8.66 | 9.13 | (4.90) |
| Ratios (%) (to average net assets) and Supplemental data: | ||||||
| Expenses before expense reductions (f) | 1.71(a) | 1.70 | 1.80 | 1.85 | 1.88 | 1.88 |
| Expenses after expense reductions (f) | 1.70(a) | 1.69 | 1.74 | 1.79 | 1.80 | 1.80 |
| Net investment income (loss) | 2.46(a) | 1.51 | 0.65 | 0.33 | 1.03 | 0.99 |
| Portfolio turnover | 72(n) | 150 | 216 | 210 | 126 | 108 |
| Net assets at end of period (000 omitted) | $586 | $579 | $615 | $494 | $243 | $214 |
| Class R2 | Six months ended | Year ended | ||||
| 5/31/23 (unaudited) | 11/30/22 | 11/30/21 | 11/30/20 | 11/30/19 | 11/30/18 | |
| Net asset value, beginning of period | $7.91 | $9.28 | $9.77 | $9.06 | $8.39 | $8.92 |
| Income (loss) from investment operations | ||||||
| Net investment income (loss) (d) | $0.12 | $0.16 | $0.11 | $0.07 | $0.14 | $0.13 |
| Net realized and unrealized gain (loss) | 0.04 | (1.10) | (0.29) | 0.76 | 0.67 | (0.52) |
| Total from investment operations | $0.16 | $(0.94) | $(0.18) | $0.83 | $0.81 | $(0.39) |
| Less distributions declared to shareholders | ||||||
| From net investment income | $(0.04) | $(0.15) | $(0.15) | $(0.11) | $(0.14) | $(0.14) |
| From net realized gain | (0.15) | (0.26) | (0.16) | (0.01) | — | — |
| From tax return of capital | — | (0.02) | — | — | — | — |
| Total distributions declared to shareholders | $(0.19) | $(0.43) | $(0.31) | $(0.12) | $(0.14) | $(0.14) |
| Net asset value, end of period (x) | $7.88 | $7.91 | $9.28 | $9.77 | $9.06 | $8.39 |
| Total return (%) (r)(s)(t)(x) | 1.95(n) | (10.58) | (1.91) | 9.32 | 9.68 | (4.43) |
| Ratios (%) (to average net assets) and Supplemental data: | ||||||
| Expenses before expense reductions (f) | 1.21(a) | 1.20 | 1.30 | 1.35 | 1.38 | 1.39 |
| Expenses after expense reductions (f) | 1.20(a) | 1.19 | 1.24 | 1.29 | 1.30 | 1.30 |
| Net investment income (loss) | 2.96(a) | 2.00 | 1.16 | 0.79 | 1.53 | 1.47 |
| Portfolio turnover | 72(n) | 150 | 216 | 210 | 126 | 108 |
| Net assets at end of period (000 omitted) | $430 | $656 | $822 | $621 | $240 | $208 |
| Class R3 | Six months ended | Year ended | ||||
| 5/31/23 (unaudited) | 11/30/22 | 11/30/21 | 11/30/20 | 11/30/19 | 11/30/18 | |
| Net asset value, beginning of period | $7.92 | $9.28 | $9.77 | $9.07 | $8.40 | $8.93 |
| Income (loss) from investment operations | ||||||
| Net investment income (loss) (d) | $0.13 | $0.19 | $0.13 | $0.10 | $0.16 | $0.15 |
| Net realized and unrealized gain (loss) | 0.03 | (1.10) | (0.28) | 0.75 | 0.67 | (0.52) |
| Total from investment operations | $0.16 | $(0.91) | $(0.15) | $0.85 | $0.83 | $(0.37) |
| Less distributions declared to shareholders | ||||||
| From net investment income | $(0.05) | $(0.16) | $(0.18) | $(0.14) | $(0.16) | $(0.16) |
| From net realized gain | (0.15) | (0.26) | (0.16) | (0.01) | — | — |
| From tax return of capital | — | (0.03) | — | — | — | — |
| Total distributions declared to shareholders | $(0.20) | $(0.45) | $(0.34) | $(0.15) | $(0.16) | $(0.16) |
| Net asset value, end of period (x) | $7.88 | $7.92 | $9.28 | $9.77 | $9.07 | $8.40 |
| Total return (%) (r)(s)(t)(x) | 1.94(n) | (10.24) | (1.66) | 9.47 | 9.94 | (4.18) |
| Ratios (%) (to average net assets) and Supplemental data: | ||||||
| Expenses before expense reductions (f) | 0.95(a) | 0.95 | 1.05 | 1.10 | 1.13 | 1.14 |
| Expenses after expense reductions (f) | 0.94(a) | 0.94 | 1.00 | 1.04 | 1.05 | 1.05 |
| Net investment income (loss) | 3.19(a) | 2.25 | 1.39 | 1.02 | 1.80 | 1.73 |
| Portfolio turnover | 72(n) | 150 | 216 | 210 | 126 | 108 |
| Net assets at end of period (000 omitted) | $593 | $435 | $566 | $510 | $60 | $71 |
| Class R4 | Six months ended | Year ended | ||||
| 5/31/23 (unaudited) | 11/30/22 | 11/30/21 | 11/30/20 | 11/30/19 | 11/30/18 | |
| Net asset value, beginning of period | $7.92 | $9.29 | $9.77 | $9.07 | $8.40 | $8.93 |
| Income (loss) from investment operations | ||||||
| Net investment income (loss) (d) | $0.14 | $0.21 | $0.15 | $0.12 | $0.18 | $0.17 |
| Net realized and unrealized gain (loss) | 0.04 | (1.11) | (0.27) | 0.75 | 0.67 | (0.52) |
| Total from investment operations | $0.18 | $(0.90) | $(0.12) | $0.87 | $0.85 | $(0.35) |
| Less distributions declared to shareholders | ||||||
| From net investment income | $(0.06) | $(0.18) | $(0.20) | $(0.16) | $(0.18) | $(0.18) |
| From net realized gain | (0.15) | (0.26) | (0.16) | (0.01) | — | — |
| From tax return of capital | — | (0.03) | — | — | — | — |
| Total distributions declared to shareholders | $(0.21) | $(0.47) | $(0.36) | $(0.17) | $(0.18) | $(0.18) |
| Net asset value, end of period (x) | $7.89 | $7.92 | $9.29 | $9.77 | $9.07 | $8.40 |
| Total return (%) (r)(s)(t)(x) | 2.20(n) | (10.11) | (1.30) | 9.74 | 10.22 | (3.95) |
| Ratios (%) (to average net assets) and Supplemental data: | ||||||
| Expenses before expense reductions (f) | 0.71(a) | 0.70 | 0.81 | 0.84 | 0.88 | 0.88 |
| Expenses after expense reductions (f) | 0.70(a) | 0.69 | 0.76 | 0.79 | 0.80 | 0.80 |
| Net investment income (loss) | 3.46(a) | 2.51 | 1.61 | 1.33 | 2.03 | 1.96 |
| Portfolio turnover | 72(n) | 150 | 216 | 210 | 126 | 108 |
| Net assets at end of period (000 omitted) | $188 | $181 | $213 | $557 | $77 | $53 |
| Class R6 | Six months ended | Year ended | ||||
| 5/31/23 (unaudited) | 11/30/22 | 11/30/21 | 11/30/20 | 11/30/19 | 11/30/18 | |
| Net asset value, beginning of period | $7.91 | $9.28 | $9.76 | $9.06 | $8.39 | $8.92 |
| Income (loss) from investment operations | ||||||
| Net investment income (loss) (d) | $0.14 | $0.21 | $0.17 | $0.13 | $0.19 | $0.18 |
| Net realized and unrealized gain (loss) | 0.05 | (1.10) | (0.28) | 0.75 | 0.67 | (0.52) |
| Total from investment operations | $0.19 | $(0.89) | $(0.11) | $0.88 | $0.86 | $(0.34) |
| Less distributions declared to shareholders | ||||||
| From net investment income | $(0.07) | $(0.19) | $(0.21) | $(0.17) | $(0.19) | $(0.19) |
| From net realized gain | (0.15) | (0.26) | (0.16) | (0.01) | — | — |
| From tax return of capital | — | (0.03) | — | — | — | — |
| Total distributions declared to shareholders | $(0.22) | $(0.48) | $(0.37) | $(0.18) | $(0.19) | $(0.19) |
| Net asset value, end of period (x) | $7.88 | $7.91 | $9.28 | $9.76 | $9.06 | $8.39 |
| Total return (%) (r)(s)(t)(x) | 2.24(n) | (10.05) | (1.22) | 9.84 | 10.33 | (3.84) |
| Ratios (%) (to average net assets) and Supplemental data: | ||||||
| Expenses before expense reductions (f) | 0.62(a) | 0.61 | 0.70 | 0.77 | 0.78 | 0.78 |
| Expenses after expense reductions (f) | 0.61(a) | 0.60 | 0.65 | 0.71 | 0.70 | 0.69 |
| Net investment income (loss) | 3.54(a) | 2.58 | 1.75 | 1.46 | 2.13 | 2.07 |
| Portfolio turnover | 72(n) | 150 | 216 | 210 | 126 | 108 |
| Net assets at end of period (000 omitted) | $932,250 | $931,367 | $1,155,980 | $728,743 | $630,673 | $601,381 |
| (a) | Annualized. |
| (d) | Per share data is based on average shares outstanding. |
| (f) | Ratios do not reflect reductions from fees paid indirectly, if applicable. See Note 2 in the Notes to Financial Statements for additional information. |
| (n) | Not annualized. |
| (r) | Certain expenses have been reduced without which performance would have been lower. |
| (s) | From time to time the fund may receive proceeds from litigation settlements, without which performance would be lower. |
| (t) | Total returns do not include any applicable sales charges. |
| (x) | The net asset values and total returns have been calculated on net assets which include adjustments made in accordance with U.S. generally accepted accounting principles required at period end for financial reporting purposes. |
| Financial Instruments | Level 1 | Level 2 | Level 3 | Total |
| U.S. Treasury Bonds & U.S. Government Agencies & Equivalents | $— | $11,630,664 | $— | $11,630,664 |
| Non - U.S. Sovereign Debt | — | 457,612,080 | — | 457,612,080 |
| Municipal Bonds | — | 10,705,649 | — | 10,705,649 |
| U.S. Corporate Bonds | — | 146,365,717 | — | 146,365,717 |
| Residential Mortgage-Backed Securities | — | 57,013,751 | — | 57,013,751 |
| Commercial Mortgage-Backed Securities | — | 26,041,228 | — | 26,041,228 |
| Asset-Backed Securities (including CDOs) | — | 40,007,841 | — | 40,007,841 |
| Foreign Bonds | — | 172,447,277 | — | 172,447,277 |
| Mutual Funds | 21,232,475 | — | — | 21,232,475 |
| Total | $21,232,475 | $921,824,207 | $— | $943,056,682 |
| Other Financial Instruments | ||||
| Futures Contracts – Assets | $1,124,124 | $— | $— | $1,124,124 |
| Futures Contracts – Liabilities | (4,423,167) | — | — | (4,423,167) |
| Forward Foreign Currency Exchange Contracts – Assets | — | 16,740,355 | — | 16,740,355 |
| Forward Foreign Currency Exchange Contracts – Liabilities | — | (4,046,985) | — | (4,046,985) |
| Swap Agreements – Assets | — | 237,602 | — | 237,602 |
| Fair Value (a) | |||
| Risk | Derivative Contracts | Asset Derivatives | Liability Derivatives |
| Interest Rate | Futures Contracts | $1,124,124 | $(4,423,167) |
| Foreign Exchange | Forward Foreign Currency Exchange Contracts | 16,740,355 | (4,046,985) |
| Interest Rate | Cleared Swap Agreements | 29,083 | — |
| Credit | Uncleared Swap Agreements | 208,519 | — |
| Total | $18,102,081 | $(8,470,152) | |
| Risk | Futures Contracts | Swap Agreements | Forward Foreign Currency Exchange Contracts | Unaffiliated Issuers (Purchased Options) |
| Interest Rate | $(190,684) | $— | $— | $— |
| Foreign Exchange | — | — | (41,701,831) | — |
| Credit | — | 564,814 | — | 580,735 |
| Total | $(190,684) | $564,814 | $(41,701,831) | $580,735 |
| Risk | Futures Contracts | Swap Agreements | Forward Foreign Currency Exchange Contracts | Unaffiliated Issuers (Purchased Options) |
| Interest Rate | $(5,047,559) | $29,083 | $— | $— |
| Foreign Exchange | — | — | 42,490,749 | — |
| Credit | — | 153,547 | — | (164,409) |
| Total | $(5,047,559) | $182,630 | $42,490,749 | $(164,409) |
| Gross Amounts of: | Derivative Assets | Derivative Liabilities |
| Futures Contracts (a) | $458,165 | $— |
| Uncleared Swaps, at value | 208,519 | — |
| Cleared Swap Agreements (a) | — | 1,073 |
| Forward Foreign Currency Exchange Contracts | 16,740,355 | 4,046,985 |
| Total Gross Amount of Derivative Assets and Liabilities Presented in the Statement of Assets & Liabilities | $17,407,039 | $4,048,058 |
| Less: Derivative Assets and Liabilities Not Subject to a Master Netting Agreement or Similar Arrangement | 9,504,103 | 1,884,964 |
| Total Gross Amount of Derivative Assets and Liabilities Subject to a Master Netting Agreement or Similar Arrangement | $7,902,936 | $2,163,094 |
| (a) | The amount presented here represents the fund's current day net variation margin for futures contracts and for cleared swap agreements. This amount, which is recognized within the Statement of Assets and Liabilities, differs from the fair value of the futures contracts and cleared swap agreements which is presented in the tables that follow the Portfolio of Investments. |
| Amounts Not Offset in the Statement of Assets & Liabilities | |||||
| Gross Amount of Derivative Assets Subject to a Master Netting Agreement (or Similar Arrangement) by Counterparty | Financial Instruments Available for Offset | Financial Instruments Collateral Received (b) | Cash Collateral Received (b) | Net Amount of Derivative Assets by Counterparty | |
| Barclays Bank PLC | $2,088,401 | $(528,658) | $(1,475,381) | $— | $84,362 |
| Brown Brothers Harriman | 238,006 | (238,006) | — | — | — |
| Citibank N.A. | 500,647 | (43,193) | (320,000) | — | 137,454 |
| Deutche Bank AG | 351,853 | (175,851) | (176,002) | — | — |
| Goldman Sachs International | 80,012 | (15,471) | — | — | 64,541 |
| JP Morgan Chase Bank N.A. | 2,229,266 | (225,134) | (2,004,132) | — | — |
| Merrill Lynch International | 947,276 | (572,018) | (235,508) | — | 139,750 |
| Morgan Stanley Capital Services, Inc. | 1,467,475 | — | (1,283,895) | — | 183,580 |
| Total | $7,902,936 | $(1,798,331) | $(5,494,918) | $— | $609,687 |
| Amounts Not Offset in the Statement of Assets & Liabilities | |||||
| Gross Amount of Derivative Liabilities Subject to a Master Netting Agreement (or Similar Arrangement) by Counterparty | Financial Instruments Available for Offset | Financial Instruments Collateral Pledged (b) | Cash Collateral Pledged (b) | Net Amount of Derivative Liabilities by Counterparty | |
| Barclays Bank PLC | $(528,658) | $528,658 | $— | $— | $— |
| BNP Paribas | (219,739) | — | — | — | (219,739) |
| Brown Brothers Harriman | (383,030) | 238,006 | — | — | (145,024) |
| Citibank N.A. | (43,193) | 43,193 | — | — | — |
| Deutche Bank AG | (175,851) | 175,851 | — | — | — |
| Goldman Sachs International | (15,471) | 15,471 | — | — | — |
| JPMorgan Chase Bank N.A. | (225,134) | 225,134 | — | — | — |
| Merrill Lynch International | (572,018) | 572,018 | — | — | — |
| Total | $(2,163,094) | $1,798,331 | $— | $— | $(364,763) |
| (b) | The amount presented here may be less than the total amount of collateral (received)/pledged as the excess collateral (received)/pledged is not shown for purposes of this presentation. |
| Year ended 11/30/22 | |
| Ordinary income (including any short-term capital gains) (a) | $22,993,014 |
| Long-term capital gains | 30,133,034 |
| Tax return of capital (b) | 8,616,179 |
| Total distributions | $61,742,227 |
| (a) | Included in the fund’s distributions from ordinary income for the year ended November 30, 2022 is $6,255,559 in excess of investment company taxable income which, in accordance with applicable U.S. tax law, is taxable to shareholders as ordinary income distributions. |
| (b) | Distributions in excess of tax basis earnings and profits are reported in the financial statements as a tax return of capital. |
| As of 5/31/23 | |
| Cost of investments | $1,027,469,526 |
| Gross appreciation | 7,604,038 |
| Gross depreciation | (92,016,882) |
| Net unrealized appreciation (depreciation) | $(84,412,844) |
| As of 11/30/22 | |
| Undistributed long-term capital gain | 17,935,000 |
| Post-October capital loss deferral | (30,632,470) |
| Post-October currency loss deferral | (6,447,157) |
| Other temporary differences | (1,031,123) |
| Net unrealized appreciation (depreciation) | (120,231,469) |
| From net investment income | From tax return of capital | ||||||
| Six months ended 5/31/23 | Year ended 11/30/22 | Six months ended 5/31/23 | Year ended 11/30/22 | ||||
| Class A | $366,023 | $874,181 | $— | $141,778 | |||
| Class B | 3,392 | 9,011 | — | 1,462 | |||
| Class C | 8,634 | 27,446 | — | 4,451 | |||
| Class I | 260,052 | 539,345 | — | 87,473 | |||
| Class R1 | 11,966 | 22,745 | — | 3,689 | |||
| Class R2 | 14,370 | 33,184 | — | 5,382 | |||
| Class R3 | 11,328 | 24,218 | — | 3,928 | |||
| Class R4 | 4,689 | 9,461 | — | 1,534 | |||
| Class R6 | 24,251,284 | 51,586,457 | — | 8,366,482 | |||
| Total | $24,931,738 | $53,126,048 | $— | $8,616,179 | |||
| Up to 1 billion | 0.55% |
| In excess of $1 billion and up to $2.5 billion | 0.45% |
| In excess of $2.5 billion | 0.425% |
| Classes | ||||||||
| A | B | C | I | R1 | R2 | R3 | R4 | R6 |
| 0.97% | 1.72% | 1.72% | 0.72% | 1.72% | 1.22% | 0.97% | 0.72% | 0.64% |
| Distribution Fee Rate (d) | Service Fee Rate (d) | Total Distribution Plan (d) | Annual Effective Rate (e) | Distribution and Service Fee | |
| Class A | — | 0.25% | 0.25% | 0.25% | $ 18,505 |
| Class B | 0.75% | 0.25% | 1.00% | 1.00% | 769 |
| Class C | 0.75% | 0.25% | 1.00% | 1.00% | 2,067 |
| Class R1 | 0.75% | 0.25% | 1.00% | 1.00% | 2,893 |
| Class R2 | 0.25% | 0.25% | 0.50% | 0.50% | 1,161 |
| Class R3 | — | 0.25% | 0.25% | 0.25% | 690 |
| Total Distribution and Service Fees | $26,085 |
| (d) | In accordance with the distribution plan for certain classes, the fund pays distribution and/or service fees equal to these annual percentage rates of each class’s average daily net assets. The distribution and service fee rates disclosed by class represent the current rates in effect at the end of the reporting period. Any rate changes, if applicable, are detailed below. |
| (e) | The annual effective rates represent actual fees incurred under the distribution plan for the six months ended May 31, 2023 based on each class's average daily net assets. MFD has voluntarily agreed to rebate a portion of each class's 0.25% service fee attributable to accounts for which there is no financial intermediary specified on the account except for accounts attributable to MFS or its affiliates' seed money. There were no service fee rebates for the six months ended May 31, 2023. |
| Amount | |
| Class A | $731 |
| Class B | — |
| Class C | 2 |
| Purchases | Sales | |
| U.S. Government securities | $134,752,254 | $183,032,629 |
| Non-U.S. Government securities | 531,189,016 | 496,134,673 |
| Six months ended 5/31/23 | Year ended 11/30/22 | ||||
| Shares | Amount | Shares | Amount | ||
| Shares sold | |||||
| Class A | 104,434 | $826,018 | 271,901 | $2,333,894 | |
| Class B | — | — | 423 | 3,623 | |
| Class C | 1,654 | 13,087 | 3,597 | 29,888 | |
| Class I | 924,538 | 7,360,577 | 376,217 | 3,127,999 | |
| Class R1 | 1,418 | 11,179 | 18,923 | 158,404 | |
| Class R2 | 2,718 | 21,392 | 6,294 | 52,157 | |
| Class R3 | 21,165 | 167,244 | 21,698 | 177,012 | |
| Class R4 | 1,460 | 11,520 | 2,978 | 24,400 | |
| Class R6 | 2,939,768 | 23,218,581 | 9,093,518 | 76,148,841 | |
| 3,997,155 | $31,629,598 | 9,795,549 | $82,056,218 | ||
| Six months ended 5/31/23 | Year ended 11/30/22 | ||||
| Shares | Amount | Shares | Amount | ||
| Shares issued to shareholders in reinvestment of distributions | |||||
| Class A | 45,915 | $363,546 | 114,205 | $1,010,081 | |
| Class B | 430 | 3,392 | 1,168 | 10,415 | |
| Class C | 1,096 | 8,634 | 3,526 | 31,500 | |
| Class I | 32,880 | 259,120 | 71,135 | 624,538 | |
| Class R1 | 1,521 | 11,966 | 2,969 | 26,434 | |
| Class R2 | 1,810 | 14,246 | 4,373 | 38,551 | |
| Class R3 | 1,438 | 11,328 | 3,204 | 28,127 | |
| Class R4 | 595 | 4,689 | 1,255 | 10,994 | |
| Class R6 | 3,080,838 | 24,240,914 | 6,527,121 | 57,122,570 | |
| 3,166,523 | $24,917,835 | 6,728,956 | $58,903,210 | ||
| Shares reacquired | |||||
| Class A | (264,023) | $(2,095,156) | (722,762) | $(5,955,242) | |
| Class B | (3,866) | (30,489) | (9,667) | (82,084) | |
| Class C | (5,441) | (42,745) | (41,616) | (358,208) | |
| Class I | (144,048) | (1,137,533) | (577,312) | (4,751,916) | |
| Class R1 | (1,747) | (13,751) | (15,036) | (129,237) | |
| Class R2 | (32,867) | (254,847) | (16,448) | (128,949) | |
| Class R3 | (2,379) | (18,777) | (30,883) | (241,921) | |
| Class R4 | (1,088) | (8,490) | (4,254) | (33,927) | |
| Class R6 | (5,445,641) | (42,414,616) | (22,517,546) | (179,021,329) | |
| (5,901,100) | $(46,016,404) | (23,935,524) | $(190,702,813) | ||
| Net change | |||||
| Class A | (113,674) | $(905,592) | (336,656) | $(2,611,267) | |
| Class B | (3,436) | (27,097) | (8,076) | (68,046) | |
| Class C | (2,691) | (21,024) | (34,493) | (296,820) | |
| Class I | 813,370 | 6,482,164 | (129,960) | (999,379) | |
| Class R1 | 1,192 | 9,394 | 6,856 | 55,601 | |
| Class R2 | (28,339) | (219,209) | (5,781) | (38,241) | |
| Class R3 | 20,224 | 159,795 | (5,981) | (36,782) | |
| Class R4 | 967 | 7,719 | (21) | 1,467 | |
| Class R6 | 574,965 | 5,044,879 | (6,896,907) | (45,749,918) | |
| 1,262,578 | $10,531,029 | (7,411,019) | $(49,743,385) | ||
| Affiliated Issuers | Beginning Value | Purchases | Sales Proceeds | Realized Gain (Loss) | Change in Unrealized Appreciation or Depreciation | Ending Value |
| MFS Institutional Money Market Portfolio | $41,764,910 | $297,813,998 | $318,356,484 | $12,562 | $(2,511) | $21,232,475 |
| Affiliated Issuers | Dividend Income | Capital Gain Distributions |
| MFS Institutional Money Market Portfolio | $547,173 | $— |

Item 1(b):
Not applicable.
ITEM 2. CODE OF ETHICS.
During the period covered by this report, the Registrant has not amended any provision in its Code of Ethics (the "Code") that relates to an element of the Code's definition enumerated in paragraph (b) of Item 2 of this Form N-CSR. During the period covered by this report, the Registrant did not grant a waiver, including an implicit waiver, from any provision of the Code.
ITEM 3. AUDIT COMMITTEE FINANCIAL EXPERT.
Not applicable for semi-annual reports.
ITEM 4. PRINCIPAL ACCOUNTANT FEES AND SERVICES.
Not applicable for semi-annual reports.
ITEM 5. AUDIT COMMITTEE OF LISTED REGISTRANTS.
Not applicable to the Registrant.
ITEM 6. INVESTMENTS
A schedule of investments for each series covered by this Form N-CSR is included as part of the report to shareholders of such series under Item 1(a) of this Form N-CSR.
ITEM 7. DISCLOSURE OF PROXY VOTING POLICIES AND PROCEDURES FOR CLOSED-END MANAGEMENT INVESTMENT COMPANIES.
Not applicable to the Registrant.
ITEM 8. PORTFOLIO MANAGERS OF CLOSED-END MANAGEMENT INVESTMENT COMPANIES.
Not applicable to the Registrant.
ITEM 9. PURCHASES OF EQUITY SECURITIES BY CLOSED-END MANAGEMENT INVESTMENT COMPANY AND AFFILIATED PURCHASERS.
Not applicable to the Registrant.
ITEM 10. SUBMISSION OF MATTERS TO A VOTE OF SECURITY HOLDERS.
There were no material changes to the procedures by which shareholders may send recommendations to the Board for nominees to the Registrant's Board since the Registrant last provided disclosure as to such procedures in response to the requirements of Item 407 (c)(2)(iv) of Regulation S-K or this Item.
ITEM 11. CONTROLS AND PROCEDURES.
(a)Based upon their evaluation of the effectiveness of the registrant's disclosure controls and procedures (as defined in Rule 30a-3(c) under the Investment Company Act of 1940 (the "Act")) as conducted within 90 days of the filing date of this report on Form N-CSR, the Registrant's principal financial officer and principal executive officer have concluded that those disclosure controls and procedures provide reasonable assurance that the material information required to be disclosed by the Registrant on this report is recorded, processed, summarized and reported within the time periods specified in the Securities and Exchange Commission's rules and forms.
(b)There were no changes in the Registrant's internal controls over financial reporting (as defined in Rule 30a-3(d) under the Act) that occurred during the period covered by the report that have materially affected, or are reasonably likely to materially affect, the Registrant's internal control over financial reporting.
ITEM 12. DISCLOSURE OF SECURITIES LENDING ACTIVITIES FOR CLOSED-END MANAGEMENT INVESTMENT COMPANIES.
Not applicable to the Registrant.
ITEM 13. EXHIBITS.
(a)(1) Any code of ethics, or amendment thereto, that is the subject of the disclosure required by Item 2, to the extent that the registrant intends to satisfy the Item 2 requirements through filing of an exhibit: Not applicable.
(2)A separate certification for each principal executive officer and principal financial officer of the registrant as required by Rule 30a-2(a) under the Act (17 CFR 270.30a-2): Attached hereto as EX-99.302CERT.
(3)Any written solicitation to purchase securities under Rule 23c-1 under the Act (17 CFR 270.23c-1) sent or given during the period covered by the report by or on behalf of the registrant to 10 or more persons. Not applicable.
(4)Change in the registrant's independent public accountant. Not applicable.
(b)If the report is filed under Section 13(a) or 15(d) of the Exchange Act, provide the certifications required by Rule 30a-2(b) under the Act (17 CFR 270.30a-2(b)), Rule 13a-14(b) or Rule 15d-14(b) under the Exchange Act (17 CFR 240.13a-14(b) or 240.15d-14(b)) and Section 1350 of Chapter 63 of Title 18 of the United States Code (18 U.S.C. 1350) as an exhibit. A certification furnished pursuant to this paragraph will not be deemed "filed" for the purposes of Section 18 of the Exchange Act (15 U.S.C. 78r), or otherwise subject to the liability of that section. Such certification will not be deemed to be incorporated by reference into any filing under the Securities Act of 1933 or the Exchange Act, except to the extent that the registrant specifically incorporates it by reference. Attached hereto as EX-99.906CERT.
Notice
A copy of the Amended and Restated Declaration of Trust, as amended, of the Registrant is on file with the Secretary of State of The Commonwealth of Massachusetts and notice is hereby given that this instrument is executed on behalf of the Registrant by an officer of the Registrant as an officer and not individually and the obligations of or arising out of this instrument are not binding upon any of the Trustees or shareholders individually, but are binding only upon the assets and property of the respective constituent series of the Registrant.
SIGNATURES
Pursuant to the requirements of the Securities Exchange Act of 1934 and the Investment Company Act of 1940, the registrant has duly caused this report to be signed on its behalf by the undersigned, thereunto duly authorized.
(Registrant) MFS SERIES TRUST X
By (Signature and Title)*
/S/ DAVID L. DILORENZO
David L. DiLorenzo, President
Date: July 14, 2023
Pursuant to the requirements of the Securities Exchange Act of 1934 and the Investment Company Act of 1940, this report has been signed below by the following persons on behalf of the registrant and in the capacities and on the dates indicated.
By (Signature and Title)*
/S/ DAVID L. DILORENZO
David L. DiLorenzo, President (Principal Executive Officer)
Date: July 14, 2023
By (Signature and Title)*
/S/ JAMES O. YOST
James O. Yost, Treasurer (Principal Financial Officer and Accounting Officer) Date: July 14, 2023
* Print name and title of each signing officer under his or her signature.