UNITED STATES
SECURITIES AND EXCHANGE COMMISSION
Washington, D.C. 20549
FORM N-CSR
CERTIFIED SHAREHOLDER REPORT OF REGISTERED
MANAGEMENT INVESTMENT COMPANIES
Investment Company Act file number 811-04492
MFS SERIES TRUST X
(Exact name of registrant as specified in charter)
111 Huntington Avenue, Boston, Massachusetts 02199 (Address of principal executive offices) (Zip code)
Christopher R. Bohane
Massachusetts Financial Services Company
111Huntington Avenue Boston, Massachusetts 02199
(Name and address of agents for service)
Registrant's telephone number, including area code: (617) 954-5000
Date of fiscal year end: May 31*
Date of reporting period: May 31, 2023
*This Form N-CSR pertains to the following series of the Registrant: MFS Aggressive Growth Allocation Fund, MFS Blended Research Growth Equity Fund, MFS Blended Research Small Cap Equity Fund, MFS Blended Research Value Equity Fund, MFS Blended Research Mid Cap Equity Fund, MFS Conservative Allocation Fund, MFS Emerging Markets Equity Fund, MFS Growth Allocation Fund, MFS International Diversification Fund, MFS International Growth Fund, MFS International Intrinsic Value Fund, MFS International Large Cap Value Fund, MFS Managed Wealth Fund, and MFS Moderate Allocation Fund. The remaining series of the Registrant have fiscal year ends other than May 31.
ITEM 1. REPORTS TO STOCKHOLDERS.
Item 1(a):


| 1 | |
| 5 | |
| 8 | |
| 17 | |
| 22 | |
| 26 | |
| 29 | |
| 30 | |
| 31 | |
| 52 | |
| 69 | |
| 70 | |
| 73 | |
| 74 | |
| 74 | |
| 74 | |
| 74 | |
| 74 | |
| 75 |
| back cover |

| MFS Total Return Bond Fund | 15.1% |
| MFS Government Securities Fund | 10.1% |
| MFS Limited Maturity Fund | 10.0% |
| MFS Inflation-Adjusted Bond Fund | 10.0% |
| MFS Global Opportunistic Bond Fund | 7.0% |
| MFS Growth Fund | 6.1% |
| MFS Research Fund | 6.0% |
| MFS Value Fund | 5.9% |
| MFS High Income Fund | 4.0% |
| MFS Mid Cap Growth Fund | 4.0% |
| MFS Mid Cap Value Fund | 3.9% |
| MFS Research International Fund | 3.4% |
| MFS Emerging Markets Debt Fund | 2.0% |
| MFS Emerging Markets Debt Local Currency Fund | 2.0% |
| MFS Global Real Estate Fund | 2.0% |
| MFS Commodity Strategy Fund | 1.9% |
| MFS International Intrinsic Value Fund | 1.5% |
| MFS International Growth Fund | 1.5% |
| MFS International Large Cap Value Fund | 1.4% |
| MFS New Discovery Fund | 1.0% |
| MFS New Discovery Value Fund | 0.9% |
| Cash & Cash Equivalents | 0.3% |

| MFS Government Securities Fund | 10.0% |
| MFS Total Return Bond Fund | 9.1% |
| MFS Growth Fund | 8.5% |
| MFS Research Fund | 8.2% |
| MFS Value Fund | 7.8% |
| MFS Mid Cap Growth Fund | 7.1% |
| MFS Inflation-Adjusted Bond Fund | 7.0% |
| MFS Mid Cap Value Fund | 6.7% |
| MFS Global Opportunistic Bond Fund | 5.0% |
| MFS Research International Fund | 5.0% |
| MFS High Income Fund | 4.1% |
| MFS Emerging Markets Debt Fund | 3.0% |
| MFS Global Real Estate Fund | 2.9% |
| MFS Commodity Strategy Fund | 2.7% |
| MFS Emerging Markets Debt Local Currency Fund | 2.0% |
| MFS International Intrinsic Value Fund | 2.0% |
| MFS International Growth Fund | 2.0% |
| MFS International Large Cap Value Fund | 2.0% |
| MFS New Discovery Fund | 1.4% |
| MFS New Discovery Value Fund | 1.4% |
| MFS Emerging Markets Equity Fund | 1.0% |
| MFS International New Discovery Fund | 1.0% |
| Cash & Cash Equivalents | 0.1% |
| MFS Growth Fund | 10.7% |
| MFS Research Fund | 10.3% |
| MFS Value Fund | 9.7% |
| MFS Mid Cap Growth Fund | 9.1% |
| MFS Mid Cap Value Fund | 8.6% |
| MFS Research International Fund | 7.0% |
| MFS Inflation-Adjusted Bond Fund | 5.0% |
| MFS High Income Fund | 4.1% |
| MFS Global Real Estate Fund | 3.8% |
| MFS Commodity Strategy Fund | 3.5% |
| MFS International Growth Fund | 3.1% |
| MFS International Intrinsic Value Fund | 3.0% |
| MFS Global Opportunistic Bond Fund | 3.0% |
| MFS Total Return Bond Fund | 3.0% |
| MFS Emerging Markets Debt Fund | 3.0% |
| MFS International Large Cap Value Fund | 3.0% |
| MFS Emerging Markets Debt Local Currency Fund | 2.1% |
| MFS International New Discovery Fund | 2.0% |
| MFS Emerging Markets Equity Fund | 2.0% |
| MFS New Discovery Fund | 1.9% |
| MFS New Discovery Value Fund | 1.9% |
| Cash & Cash Equivalents | 0.2% |
| MFS Growth Fund | 12.9% |
| MFS Value Fund | 11.6% |
| MFS Research Fund | 11.3% |
| MFS Mid Cap Growth Fund | 10.1% |
| MFS Mid Cap Value Fund | 9.6% |
| MFS Research International Fund | 8.1% |
| MFS International Growth Fund | 5.1% |
| MFS International Intrinsic Value Fund | 5.1% |
| MFS International Large Cap Value Fund | 5.0% |
| MFS Global Real Estate Fund | 4.8% |
| MFS Commodity Strategy Fund | 4.5% |
| MFS International New Discovery Fund | 4.0% |
| MFS Emerging Markets Equity Fund | 3.0% |
| MFS New Discovery Fund | 2.4% |
| MFS New Discovery Value Fund | 2.4% |
| Cash & Cash Equivalents | 0.1% |
| Share Class | Class Inception Date | 1-yr | 5-yr | 10-yr | Life (t) |
| A | 6/28/02 | (1.61)% | 3.97% | 4.38% | N/A |
| B | 6/28/02 | (2.27)% | 3.20% | 3.60% | N/A |
| C | 6/28/02 | (2.31)% | 3.20% | 3.60% | N/A |
| I | 6/28/02 | (1.34)% | 4.24% | 4.64% | N/A |
| R1 | 4/01/05 | (2.38)% | 3.19% | 3.60% | N/A |
| R2 | 10/31/03 | (1.79)% | 3.72% | 4.13% | N/A |
| R3 | 4/01/05 | (1.57)% | 3.98% | 4.38% | N/A |
| R4 | 4/01/05 | (1.35)% | 4.24% | 4.64% | N/A |
| R6 | 9/30/21 | (1.27)% | N/A | N/A | (4.96)% |
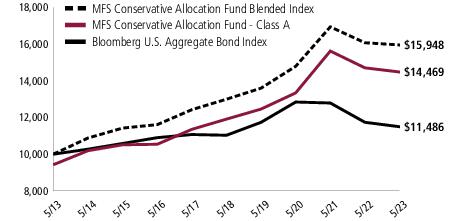
| Bloomberg U.S. Aggregate Bond Index (f) | (2.14)% | 0.81% | 1.39% | N/A |
| MFS Conservative Allocation Fund Blended Index (f)(w) | (0.77)% | 4.18% | 4.78% | N/A |
| Bloomberg Commodity Index (f) | (22.48)% | 3.17% | (1.86)% | N/A |
| FTSE EPRA Nareit Developed Real Estate Index (net div) (f) | (15.39)% | (0.41)% | 2.30% | N/A |
| MSCI EAFE Index (net div) (f) | 3.06% | 3.21% | 4.56% | N/A |
| Standard & Poor’s 500 Stock Index (f) | 2.92% | 11.01% | 11.99% | N/A |
| Share Class | 1-yr | 5-yr | 10-yr | Life (t) |
| A With Initial Sales Charge (5.75%) | (7.27)% | 2.75% | 3.76% | N/A |
| B With CDSC (Declining over six years from 4% to 0%) (v) | (6.08)% | 2.85% | 3.60% | N/A |
| C With CDSC (1% for 12 months) (v) | (3.26)% | 3.20% | 3.60% | N/A |
| (f) | Source: FactSet Research Systems Inc. |
| (t) | For the period from the class inception date through the stated period end (for those share classes with less than 10 years of performance history). No comparative benchmark performance information is provided for “life” periods. (See Notes to Performance Summary.) |
| (v) | Assuming redemption at the end of the applicable period. |
| (w) | The MFS Conservative Allocation Fund Blended Index (a custom index) was comprised of the following at the beginning and at the end of the reporting period: |
| 5/31/23 | 5/31/22 | |
| Bloomberg U.S. Aggregate Bond Index | 60% | 60% |
| Standard & Poor’s 500 Stock Index | 28% | 28% |
| MSCI EAFE Index (net div) | 8% | 8% |
| FTSE EPRA Nareit Developed Real Estate Index (net div) | 2% | 2% |
| Bloomberg Commodity Index | 2% | 2% |
| Share Class | Class Inception Date | 1-yr | 5-yr | 10-yr | Life (t) |
| A | 6/28/02 | (1.99)% | 5.08% | 5.78% | N/A |
| B | 6/28/02 | (2.69)% | 4.30% | 4.99% | N/A |
| C | 6/28/02 | (2.67)% | 4.31% | 4.99% | N/A |
| I | 6/28/02 | (1.76)% | 5.35% | 6.05% | N/A |
| R1 | 4/01/05 | (2.70)% | 4.30% | 4.99% | N/A |
| R2 | 10/31/03 | (2.24)% | 4.82% | 5.51% | N/A |
| R3 | 4/01/05 | (1.96)% | 5.08% | 5.78% | N/A |
| R4 | 4/01/05 | (1.74)% | 5.34% | 6.04% | N/A |
| R6 | 9/30/21 | (1.69)% | N/A | N/A | (5.46)% |
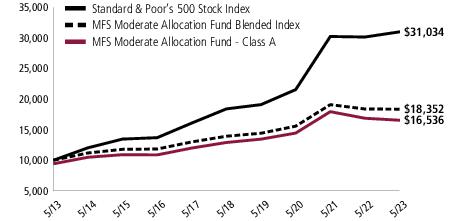
| Standard & Poor’s 500 Stock Index (f) | 2.92% | 11.01% | 11.99% | N/A |
| MFS Moderate Allocation Fund Blended Index (f)(w) | (0.20)% | 5.66% | 6.26% | N/A |
| Bloomberg Commodity Index (f) | (22.48)% | 3.17% | (1.86)% | N/A |
| Bloomberg U.S. Aggregate Bond Index (f) | (2.14)% | 0.81% | 1.39% | N/A |
| FTSE EPRA Nareit Developed Real Estate Index (net div) (f) | (15.39)% | (0.41)% | 2.30% | N/A |
| MSCI EAFE Index (net div) (f) | 3.06% | 3.21% | 4.56% | N/A |
| A With Initial Sales Charge (5.75%) | (7.62)% | 3.84% | 5.16% | N/A |
| B With CDSC (Declining over six years from 4% to 0%) (v) | (6.45)% | 3.96% | 4.99% | N/A |
| C With CDSC (1% for 12 months) (v) | (3.61)% | 4.31% | 4.99% | N/A |
| (f) | Source: FactSet Research Systems Inc. |
| (t) | For the period from the class inception date through the stated period end (for those share classes with less than 10 years of performance history). No comparative benchmark performance information is provided for “life” periods. (See Notes to Performance Summary.) |
| (v) | Assuming redemption at the end of the applicable period. |
| (w) | The MFS Moderate Allocation Fund Blended Index (a custom index) was comprised of the following at the beginning and at the end of the reporting period: |
| 5/31/23 | 5/31/22 | |
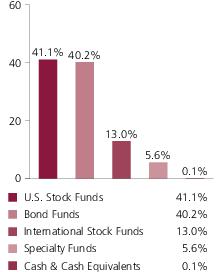
| Standard & Poor's 500 Stock Index | 41% | 41% |
| Bloomberg U.S. Aggregate Bond Index | 40% | 40% |
| MSCI EAFE Index (net div) | 13% | 13% |
| Bloomberg Commodity Index | 3% | 3% |
| FTSE EPRA Nareit Developed Real Estate Index (net div) | 3% | 3% |
| Share Class | Class Inception Date | 1-yr | 5-yr | 10-yr | Life (t) |
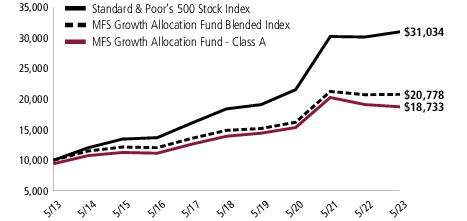
| A | 6/28/02 | (1.97)% | 6.10% | 7.11% | N/A |
| B | 6/28/02 | (2.69)% | 5.32% | 6.31% | N/A |
| C | 6/28/02 | (2.67)% | 5.31% | 6.31% | N/A |
| I | 6/28/02 | (1.69)% | 6.37% | 7.38% | N/A |
| R1 | 4/01/05 | (2.67)% | 5.31% | 6.31% | N/A |
| R2 | 10/31/03 | (2.18)% | 5.85% | 6.84% | N/A |
| R3 | 4/01/05 | (1.97)% | 6.10% | 7.11% | N/A |
| R4 | 4/01/05 | (1.67)% | 6.38% | 7.38% | N/A |
| R6 | 9/30/21 | (1.65)% | N/A | N/A | (5.37)% |
| Standard & Poor’s 500 Stock Index (f) | 2.92% | 11.01% | 11.99% | N/A |
| MFS Growth Allocation Fund Blended Index (f)(w) | 0.29% | 6.90% | 7.59% | N/A |
| Bloomberg Commodity Index (f) | (22.48)% | 3.17% | (1.86)% | N/A |
| Bloomberg U.S. Aggregate Bond Index (f) | (2.14)% | 0.81% | 1.39% | N/A |
| FTSE EPRA Nareit Developed Real Estate Index (net div) (f) | (15.39)% | (0.41)% | 2.30% | N/A |
| MSCI EAFE Index (net div) (f) | 3.06% | 3.21% | 4.56% | N/A |
| A With Initial Sales Charge (5.75%) | (7.60)% | 4.85% | 6.48% | N/A |
| B With CDSC (Declining over six years from 4% to 0%) (v) | (6.44)% | 4.99% | 6.31% | N/A |
| C With CDSC (1% for 12 months) (v) | (3.61)% | 5.31% | 6.31% | N/A |
| (f) | Source: FactSet Research Systems Inc. |
| (t) | For the period from the class inception date through the stated period end (for those share classes with less than 10 years of performance history). No comparative benchmark performance information is provided for “life” periods. (See Notes to Performance Summary.) |
| (v) | Assuming redemption at the end of the applicable period. |
| (w) | The MFS Growth Allocation Fund Blended Index (a custom index) was comprised of the following at the beginning and at the end of the reporting period: |
| 5/31/23 | 5/31/22 | |
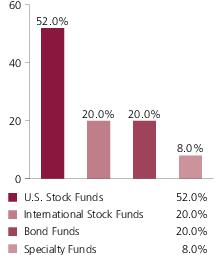
| Standard & Poor’s 500 Stock Index | 52% | 52% |
| Bloomberg U.S. Aggregate Bond Index | 20% | 20% |
| MSCI EAFE Index (net div) | 20% | 20% |
| Bloomberg Commodity Index | 4% | 4% |
| FTSE EPRA Nareit Developed Real Estate Index (net div) | 4% | 4% |

| Share Class | Class Inception Date | 1-yr | 5-yr | 10-yr | Life (t) |
| A | 6/28/02 | (1.95)% | 6.85% | 8.24% | N/A |
| B | 6/28/02 | (2.68)% | 6.04% | 7.43% | N/A |
| C | 6/28/02 | (2.70)% | 6.04% | 7.43% | N/A |
| I | 6/28/02 | (1.74)% | 7.10% | 8.50% | N/A |
| R1 | 4/01/05 | (2.70)% | 6.05% | 7.43% | N/A |
| R2 | 10/31/03 | (2.19)% | 6.58% | 7.97% | N/A |
| R3 | 4/01/05 | (1.98)% | 6.84% | 8.23% | N/A |
| R4 | 4/01/05 | (1.73)% | 7.11% | 8.50% | N/A |
| R6 | 9/30/21 | (1.64)% | N/A | N/A | (5.42)% |
| Standard & Poor’s 500 Stock Index (f) | 2.92% | 11.01% | 11.99% | N/A |
| MFS Aggressive Growth Allocation Fund Blended Index (f)(w) | 0.71% | 7.80% | 8.65% | N/A |
| Bloomberg Commodity Index (f) | (22.48)% | 3.17% | (1.86)% | N/A |
| FTSE EPRA Nareit Developed Real Estate Index (net div) (f) | (15.39)% | (0.41)% | 2.30% | N/A |
| MSCI EAFE Index (net div) (f) | 3.06% | 3.21% | 4.56% | N/A |
| A With Initial Sales Charge (5.75%) | (7.59)% | 5.59% | 7.60% | N/A |
| B With CDSC (Declining over six years from 4% to 0%) (v) | (6.45)% | 5.73% | 7.43% | N/A |
| C With CDSC (1% for 12 months) (v) | (3.64)% | 6.04% | 7.43% | N/A |
| (f) | Source: FactSet Research Systems Inc. |
| (t) | For the period from the class inception date through the stated period end (for those share classes with less than 10 years of performance history). No comparative benchmark performance information is provided for “life” periods. (See Notes to Performance Summary.) |
| (v) | Assuming redemption at the end of the applicable period. |
| (w) | The MFS Aggressive Growth Allocation Fund Blended Index (a custom index) was comprised of the following at the beginning and at the end of the reporting period: |
| 5/31/23 | 5/31/22 | |
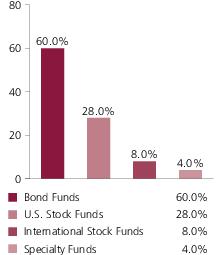
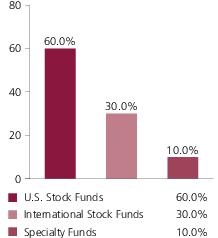
| Standard & Poor’s 500 Stock Index | 60% | 60% |
| MSCI EAFE Index (net div) | 30% | 30% |
| Bloomberg Commodity Index | 5% | 5% |
| FTSE EPRA Nareit Developed Real Estate Index (net div) | 5% | 5% |
| (a) | Source: Bloomberg Index Services Limited. BLOOMBERG® is a trademark and service mark of Bloomberg Finance L.P. and its affiliates (collectively “Bloomberg”). Bloomberg or Bloomberg's licensors own all proprietary rights in the Bloomberg Indices. Bloomberg neither approves or endorses this material, or guarantees the accuracy or completeness of any information herein, or makes any warranty, express or implied, as to the results to be obtained therefrom and, to the maximum extent allowed by law, neither shall have any liability or responsibility for injury or damages arising in connection therewith. |
| (c) | FTSE International Limited (“FTSE”)© FTSE 2019. “FTSE®” is a trademark of the London Stock Exchange Group companies and is used by FTSE International Limited under license. “FT-SE®”, “FOOTSIE®” and “FTSE4GOOD®” are trademarks of the London Stock Exchange Group companies. “Nareit®” is a trademark of the National Association of Real Estate Investment Trusts (“Nareit”) and “EPRA®” is a trademark of the European Public Real Estate Association (“EPRA”) and all are used by FTSE under license. The FTSE EPRA Nareit Developed Real Estate Index is calculated by FTSE. Neither FTSE, Euronext N.V., Nareit, nor EPRA sponsor, endorse, or promote this product and are not in any way connected to it and do not accept any liability. All intellectual property rights in the index values and constituent list vests in FTSE, Euronext N.V., Nareit, and EPRA. Neither FTSE nor its licensors accept any liability for any errors or omissions in the FTSE indices and/or FTSE ratings or underlying data. No further distribution of FTSE Data is permitted without FTSE's express written consent. |
| (e) | Morgan Stanley Capital International (“MSCI”) makes no express or implied warranties or representations and shall have no liability whatsoever with respect to any MSCI data contained herein. The MSCI data may not be further redistributed or used as a basis for other indices or any securities or financial products. This report is not approved, reviewed, or produced by MSCI. |
| (g) | “Standard & Poor's®” and “S&P®” are registered trademarks of Standard & Poor's Financial Services LLC (“S&P”) and Dow Jones is a registered trademark of Dow Jones Trademark Holdings LLC (“Dow Jones”) and have been licensed for use by S&P Dow Jones Indices LLC and sublicensed for certain purposes by MFS. The S&P 500® is a product of S&P Dow Jones Indices LLC, and has been licensed for use by MFS. MFS's product(s) is not sponsored, endorsed, sold, or promoted by S&P Dow Jones Indices LLC, Dow Jones, S&P, or their respective affiliates, and neither S&P Dow Jones Indices LLC, Dow Jones, S&P, nor their respective affiliates make any representation regarding the advisability of investing in such product(s). |
December 1, 2022 through May 31, 2023
| Share Class | Annualized Expense Ratio | Beginning Account Value 12/01/22 | Ending Account Value 5/31/23 | Expenses Paid During Period (p) 12/01/22-5/31/23 | |
| A | Actual | 0.33% | $1,000.00 | $1,011.30 | $1.65 |
| Hypothetical (h) | 0.33% | $1,000.00 | $1,023.29 | $1.66 | |
| B | Actual | 1.08% | $1,000.00 | $1,007.91 | $5.41 |
| Hypothetical (h) | 1.08% | $1,000.00 | $1,019.55 | $5.44 | |
| C | Actual | 1.08% | $1,000.00 | $1,007.56 | $5.41 |
| Hypothetical (h) | 1.08% | $1,000.00 | $1,019.55 | $5.44 | |
| I | Actual | 0.08% | $1,000.00 | $1,012.41 | $0.40 |
| Hypothetical (h) | 0.08% | $1,000.00 | $1,024.53 | $0.40 | |
| R1 | Actual | 1.08% | $1,000.00 | $1,007.34 | $5.40 |
| Hypothetical (h) | 1.08% | $1,000.00 | $1,019.55 | $5.44 | |
| R2 | Actual | 0.58% | $1,000.00 | $1,010.44 | $2.91 |
| Hypothetical (h) | 0.58% | $1,000.00 | $1,022.04 | $2.92 | |
| R3 | Actual | 0.33% | $1,000.00 | $1,011.43 | $1.65 |
| Hypothetical (h) | 0.33% | $1,000.00 | $1,023.29 | $1.66 | |
| R4 | Actual | 0.08% | $1,000.00 | $1,012.55 | $0.40 |
| Hypothetical (h) | 0.08% | $1,000.00 | $1,024.53 | $0.40 | |
| R6 | Actual | 0.02% | $1,000.00 | $1,012.74 | $0.10 |
| Hypothetical (h) | 0.02% | $1,000.00 | $1,024.83 | $0.10 |
| (h) | 5% class return per year before expenses. |
| (p) | “Expenses Paid During Period” are equal to each class’s annualized expense ratio, as shown above, multiplied by the average account value over the period, multiplied by 182/365 (to reflect the one-half year period). Expenses paid do not include any applicable sales charges (loads). If these transaction costs had been included, your costs would have been higher. In addition to the fees and expenses which the fund bears directly, the fund indirectly bears a pro rata share of the fees and expenses of the underlying funds in which the fund invests. If these indirect costs were included, your costs would have been higher. |
| Share Class | Annualized Expense Ratio | Beginning Account Value 12/01/22 | Ending Account Value 5/31/23 | Expenses Paid During Period (p) 12/01/22-5/31/23 | |
| A | Actual | 0.33% | $1,000.00 | $1,005.67 | $1.65 |
| Hypothetical (h) | 0.33% | $1,000.00 | $1,023.29 | $1.66 | |
| B | Actual | 1.08% | $1,000.00 | $1,001.69 | $5.39 |
| Hypothetical (h) | 1.08% | $1,000.00 | $1,019.55 | $5.44 | |
| C | Actual | 1.08% | $1,000.00 | $1,001.92 | $5.39 |
| Hypothetical (h) | 1.08% | $1,000.00 | $1,019.55 | $5.44 | |
| I | Actual | 0.08% | $1,000.00 | $1,006.79 | $0.40 |
| Hypothetical (h) | 0.08% | $1,000.00 | $1,024.53 | $0.40 | |
| R1 | Actual | 1.08% | $1,000.00 | $1,001.65 | $5.39 |
| Hypothetical (h) | 1.08% | $1,000.00 | $1,019.55 | $5.44 | |
| R2 | Actual | 0.58% | $1,000.00 | $1,004.02 | $2.90 |
| Hypothetical (h) | 0.58% | $1,000.00 | $1,022.04 | $2.92 | |
| R3 | Actual | 0.33% | $1,000.00 | $1,005.69 | $1.65 |
| Hypothetical (h) | 0.33% | $1,000.00 | $1,023.29 | $1.66 | |
| R4 | Actual | 0.08% | $1,000.00 | $1,006.36 | $0.40 |
| Hypothetical (h) | 0.08% | $1,000.00 | $1,024.53 | $0.40 | |
| R6 | Actual | 0.02% | $1,000.00 | $1,007.12 | $0.10 |
| Hypothetical (h) | 0.02% | $1,000.00 | $1,024.83 | $0.10 |
| (h) | 5% class return per year before expenses. |
| (p) | “Expenses Paid During Period” are equal to each class’s annualized expense ratio, as shown above, multiplied by the average account value over the period, multiplied by 182/365 (to reflect the one-half year period). Expenses paid do not include any applicable sales charges (loads). If these transaction costs had been included, your costs would have been higher. In addition to the fees and expenses which the fund bears directly, the fund indirectly bears a pro rata share of the fees and expenses of the underlying funds in which the fund invests. If these indirect costs were included, your costs would have been higher. |
| Share Class | Annualized Expense Ratio | Beginning Account Value 12/01/22 | Ending Account Value 5/31/23 | Expenses Paid During Period (p) 12/01/22-5/31/23 | |
| A | Actual | 0.35% | $1,000.00 | $1,001.62 | $1.75 |
| Hypothetical (h) | 0.35% | $1,000.00 | $1,023.19 | $1.77 | |
| B | Actual | 1.10% | $1,000.00 | $997.97 | $5.48 |
| Hypothetical (h) | 1.10% | $1,000.00 | $1,019.45 | $5.54 | |
| C | Actual | 1.10% | $1,000.00 | $998.08 | $5.48 |
| Hypothetical (h) | 1.10% | $1,000.00 | $1,019.45 | $5.54 | |
| I | Actual | 0.10% | $1,000.00 | $1,002.87 | $0.50 |
| Hypothetical (h) | 0.10% | $1,000.00 | $1,024.43 | $0.50 | |
| R1 | Actual | 1.10% | $1,000.00 | $997.84 | $5.48 |
| Hypothetical (h) | 1.10% | $1,000.00 | $1,019.45 | $5.54 | |
| R2 | Actual | 0.60% | $1,000.00 | $1,000.49 | $2.99 |
| Hypothetical (h) | 0.60% | $1,000.00 | $1,021.94 | $3.02 | |
| R3 | Actual | 0.35% | $1,000.00 | $1,001.75 | $1.75 |
| Hypothetical (h) | 0.35% | $1,000.00 | $1,023.19 | $1.77 | |
| R4 | Actual | 0.10% | $1,000.00 | $1,003.37 | $0.50 |
| Hypothetical (h) | 0.10% | $1,000.00 | $1,024.43 | $0.50 | |
| R6 | Actual | 0.02% | $1,000.00 | $1,003.25 | $0.10 |
| Hypothetical (h) | 0.02% | $1,000.00 | $1,024.83 | $0.10 |
| (h) | 5% class return per year before expenses. |
| (p) | “Expenses Paid During Period” are equal to each class’s annualized expense ratio, as shown above, multiplied by the average account value over the period, multiplied by 182/365 (to reflect the one-half year period). Expenses paid do not include any applicable sales charges (loads). If these transaction costs had been included, your costs would have been higher. In addition to the fees and expenses which the fund bears directly, the fund indirectly bears a pro rata share of the fees and expenses of the underlying funds in which the fund invests. If these indirect costs were included, your costs would have been higher. |
| Share Class | Annualized Expense Ratio | Beginning Account Value 12/01/22 | Ending Account Value 5/31/23 | Expenses Paid During Period (p) 12/01/22-5/31/23 | |
| A | Actual | 0.38% | $1,000.00 | $999.07 | $1.89 |
| Hypothetical (h) | 0.38% | $1,000.00 | $1,023.04 | $1.92 | |
| B | Actual | 1.13% | $1,000.00 | $995.00 | $5.62 |
| Hypothetical (h) | 1.13% | $1,000.00 | $1,019.30 | $5.69 | |
| C | Actual | 1.13% | $1,000.00 | $994.71 | $5.62 |
| Hypothetical (h) | 1.13% | $1,000.00 | $1,019.30 | $5.69 | |
| I | Actual | 0.13% | $1,000.00 | $999.79 | $0.65 |
| Hypothetical (h) | 0.13% | $1,000.00 | $1,024.28 | $0.66 | |
| R1 | Actual | 1.13% | $1,000.00 | $995.14 | $5.62 |
| Hypothetical (h) | 1.13% | $1,000.00 | $1,019.30 | $5.69 | |
| R2 | Actual | 0.63% | $1,000.00 | $997.55 | $3.14 |
| Hypothetical (h) | 0.63% | $1,000.00 | $1,021.79 | $3.18 | |
| R3 | Actual | 0.38% | $1,000.00 | $999.01 | $1.89 |
| Hypothetical (h) | 0.38% | $1,000.00 | $1,023.04 | $1.92 | |
| R4 | Actual | 0.13% | $1,000.00 | $1,000.11 | $0.65 |
| Hypothetical (h) | 0.13% | $1,000.00 | $1,024.28 | $0.66 | |
| R6 | Actual | 0.04% | $1,000.00 | $1,000.73 | $0.20 |
| Hypothetical (h) | 0.04% | $1,000.00 | $1,024.73 | $0.20 |
| (h) | 5% class return per year before expenses. |
| (p) | “Expenses Paid During Period” are equal to each class’s annualized expense ratio, as shown above, multiplied by the average account value over the period, multiplied by 182/365 (to reflect the one-half year period). Expenses paid do not include any applicable sales charges (loads). If these transaction costs had been included, your costs would have been higher. In addition to the fees and expenses which the fund bears directly, the fund indirectly bears a pro rata share of the fees and expenses of the underlying funds in which the fund invests. If these indirect costs were included, your costs would have been higher. |
| Issuer | Shares/Par | Value ($) | ||
| Investment Companies (h) – 100.0% | ||||
| Bond Funds – 60.2% | ||||
| MFS Emerging Markets Debt Fund - Class R6 | 6,701,977 | $76,268,504 | ||
| MFS Emerging Markets Debt Local Currency Fund - Class R6 | 13,753,110 | 75,779,634 | ||
| MFS Global Opportunistic Bond Fund - Class R6 | 33,860,816 | 266,823,231 | ||
| MFS Government Securities Fund - Class R6 | 43,438,010 | 381,385,725 | ||
| MFS High Income Fund - Class R6 | 51,879,006 | 152,524,279 | ||
| MFS Inflation-Adjusted Bond Fund - Class R6 | 40,262,775 | 378,872,709 | ||
| MFS Limited Maturity Fund - Class R6 | 66,905,573 | 381,361,767 | ||
| MFS Total Return Bond Fund - Class R6 | 60,772,982 | 573,089,219 | ||
| $2,286,105,068 | ||||
| International Stock Funds – 7.8% | ||||
| MFS International Growth Fund - Class R6 | 1,429,887 | $55,837,083 | ||
| MFS International Intrinsic Value Fund - Class R6 | 1,444,714 | 55,982,688 | ||
| MFS International Large Cap Value Fund - Class R6 | 4,467,222 | 55,482,896 | ||
| MFS Research International Fund - Class R6 | 6,209,307 | 129,774,510 | ||
| $297,077,177 | ||||
| Specialty Funds – 3.9% | ||||
| MFS Commodity Strategy Fund - Class R6 | 21,578,287 | $72,503,046 | ||
| MFS Global Real Estate Fund - Class R6 | 4,798,099 | 73,890,721 | ||
| $146,393,767 | ||||
| U.S. Stock Funds – 27.8% | ||||
| MFS Growth Fund - Class R6 | 1,478,746 | $231,246,333 | ||
| MFS Mid Cap Growth Fund - Class R6 (a) | 5,952,101 | 151,897,621 | ||
| MFS Mid Cap Value Fund - Class R6 | 5,401,419 | 148,214,921 | ||
| MFS New Discovery Fund - Class R6 | 1,419,072 | 37,137,108 | ||
| MFS New Discovery Value Fund - Class R6 | 2,260,762 | 36,669,556 | ||
| MFS Research Fund - Class R6 | 4,611,165 | 228,298,787 | ||
| MFS Value Fund - Class R6 | 4,909,865 | 223,349,753 | ||
| $1,056,814,079 | ||||
| Money Market Funds – 0.3% | ||||
| MFS Institutional Money Market Portfolio, 4.88% (v) | 12,437,612 | $12,436,368 | ||
| Total Investment Companies (Identified Cost, $3,295,879,063) | $3,798,826,459 | |||
| Other Assets, Less Liabilities – 0.0% | 1,497,935 | |||
| Net Assets – 100.0% | $3,800,324,394 | |||
| Issuer | Shares/Par | Value ($) | ||
| Investment Companies (h) – 100.0% | ||||
| Bond Funds – 40.2% | ||||
| MFS Emerging Markets Debt Fund - Class R6 | 16,709,649 | $190,155,811 | ||
| MFS Emerging Markets Debt Local Currency Fund - Class R6 | 23,167,109 | 127,650,772 | ||
| MFS Global Opportunistic Bond Fund - Class R6 | 40,212,801 | 316,876,871 | ||
| MFS Government Securities Fund - Class R6 | 71,897,287 | 631,258,175 | ||
| MFS High Income Fund - Class R6 | 86,834,763 | 255,294,203 | ||
| MFS Inflation-Adjusted Bond Fund - Class R6 | 46,602,019 | 438,525,001 | ||
| MFS Total Return Bond Fund - Class R6 | 60,571,200 | 571,186,411 | ||
| $2,530,947,244 | ||||
| International Stock Funds – 13.0% | ||||
| MFS Emerging Markets Equity Fund - Class R6 | 2,040,725 | $62,793,109 | ||
| MFS International Growth Fund - Class R6 | 3,245,591 | 126,740,340 | ||
| MFS International Intrinsic Value Fund - Class R6 | 3,273,575 | 126,851,033 | ||
| MFS International Large Cap Value Fund - Class R6 | 10,078,550 | 125,175,589 | ||
| MFS International New Discovery Fund - Class R6 | 2,064,711 | 62,787,870 | ||
| MFS Research International Fund - Class R6 | 15,044,242 | 314,424,655 | ||
| $818,772,596 | ||||
| Specialty Funds – 5.6% | ||||
| MFS Commodity Strategy Fund - Class R6 | 49,967,528 | $167,890,892 | ||
| MFS Global Real Estate Fund - Class R6 | 11,869,453 | 182,789,583 | ||
| $350,680,475 | ||||
| U.S. Stock Funds – 41.1% | ||||
| MFS Growth Fund - Class R6 | 3,423,030 | $535,293,375 | ||
| MFS Mid Cap Growth Fund - Class R6 (a) | 17,500,856 | 446,621,851 | ||
| MFS Mid Cap Value Fund - Class R6 | 15,436,045 | 423,565,084 | ||
| MFS New Discovery Fund - Class R6 | 3,502,878 | 91,670,307 | ||
| MFS New Discovery Value Fund - Class R6 | 5,436,647 | 88,182,411 | ||
| MFS Research Fund - Class R6 | 10,427,003 | 516,240,930 | ||
| MFS Value Fund - Class R6 | 10,749,286 | 488,985,047 | ||
| $2,590,559,005 | ||||
| Money Market Funds – 0.1% | ||||
| MFS Institutional Money Market Portfolio, 4.88% (v) | 7,302,154 | $7,301,423 | ||
| Total Investment Companies (Identified Cost, $4,862,107,940) | $6,298,260,743 | |||
| Other Assets, Less Liabilities – 0.0% | 1,825,725 | |||
| Net Assets – 100.0% | $6,300,086,468 | |||
| Issuer | Shares/Par | Value ($) | ||
| Investment Companies (h) – 100.0% | ||||
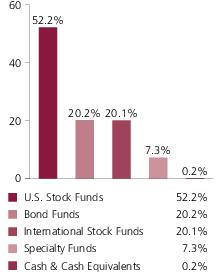
| Bond Funds – 20.2% | ||||
| MFS Emerging Markets Debt Fund - Class R6 | 15,744,711 | $179,174,808 | ||
| MFS Emerging Markets Debt Local Currency Fund - Class R6 | 21,944,111 | 120,912,054 | ||
| MFS Global Opportunistic Bond Fund - Class R6 | 22,774,426 | 179,462,474 | ||
| MFS High Income Fund - Class R6 | 82,023,462 | 241,148,978 | ||
| MFS Inflation-Adjusted Bond Fund - Class R6 | 31,359,819 | 295,095,902 | ||
| MFS Total Return Bond Fund - Class R6 | 19,019,025 | 179,349,405 | ||
| $1,195,143,621 | ||||
| International Stock Funds – 20.1% | ||||
| MFS Emerging Markets Equity Fund - Class R6 | 3,847,045 | $118,373,563 | ||
| MFS International Growth Fund - Class R6 | 4,623,985 | 180,566,624 | ||
| MFS International Intrinsic Value Fund - Class R6 | 4,653,048 | 180,305,609 | ||
| MFS International Large Cap Value Fund - Class R6 | 14,327,628 | 177,949,139 | ||
| MFS International New Discovery Fund - Class R6 | 3,907,836 | 118,837,289 | ||
| MFS Research International Fund - Class R6 | 19,952,095 | 416,998,795 | ||
| $1,193,031,019 | ||||
| Specialty Funds – 7.3% | ||||
| MFS Commodity Strategy Fund - Class R6 | 62,813,941 | $211,054,840 | ||
| MFS Global Real Estate Fund - Class R6 | 14,551,676 | 224,095,810 | ||
| $435,150,650 | ||||
| U.S. Stock Funds – 52.2% | ||||
| MFS Growth Fund - Class R6 | 4,049,254 | $633,222,274 | ||
| MFS Mid Cap Growth Fund - Class R6 (a) | 21,185,194 | 540,646,144 | ||
| MFS Mid Cap Value Fund - Class R6 | 18,674,943 | 512,440,451 | ||
| MFS New Discovery Fund - Class R6 | 4,365,517 | 114,245,588 | ||
| MFS New Discovery Value Fund - Class R6 | 6,798,179 | 110,266,464 | ||
| MFS Research Fund - Class R6 | 12,347,225 | 611,311,117 | ||
| MFS Value Fund - Class R6 | 12,687,597 | 577,158,788 | ||
| $3,099,290,826 | ||||
| Money Market Funds – 0.2% | ||||
| MFS Institutional Money Market Portfolio, 4.88% (v) | 10,043,550 | $10,042,546 | ||
| Total Investment Companies (Identified Cost, $4,082,244,199) | $5,932,658,662 | |||
| Other Assets, Less Liabilities – 0.0% | 1,853,201 | |||
| Net Assets – 100.0% | $5,934,511,863 | |||
| Issuer | Shares/Par | Value ($) | ||
| Investment Companies (h) – 100.0% | ||||
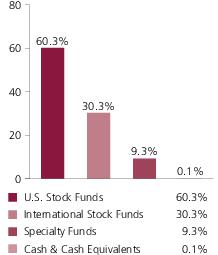
| International Stock Funds – 30.3% | ||||
| MFS Emerging Markets Equity Fund - Class R6 | 2,354,887 | $72,459,865 | ||
| MFS International Growth Fund - Class R6 | 3,162,293 | 123,487,547 | ||
| MFS International Intrinsic Value Fund - Class R6 | 3,179,895 | 123,220,948 | ||
| MFS International Large Cap Value Fund - Class R6 | 9,762,213 | 121,246,688 | ||
| MFS International New Discovery Fund - Class R6 | 3,193,382 | 97,110,750 | ||
| MFS Research International Fund - Class R6 | 9,336,654 | 195,136,064 | ||
| $732,661,862 | ||||
| Specialty Funds – 9.3% | ||||
| MFS Commodity Strategy Fund - Class R6 | 32,454,758 | $109,047,987 | ||
| MFS Global Real Estate Fund - Class R6 | 7,546,952 | 116,223,060 | ||
| $225,271,047 | ||||
| U.S. Stock Funds – 60.3% | ||||
| MFS Growth Fund - Class R6 | 2,002,139 | $313,094,452 | ||
| MFS Mid Cap Growth Fund - Class R6 (a) | 9,564,223 | 244,078,959 | ||
| MFS Mid Cap Value Fund - Class R6 | 8,467,151 | 232,338,630 | ||
| MFS New Discovery Fund - Class R6 | 2,233,902 | 58,461,228 | ||
| MFS New Discovery Value Fund - Class R6 | 3,490,546 | 56,616,656 | ||
| MFS Research Fund - Class R6 | 5,516,019 | 273,098,109 | ||
| MFS Value Fund - Class R6 | 6,179,786 | 281,118,467 | ||
| $1,458,806,501 | ||||
| Money Market Funds – 0.1% | ||||
| MFS Institutional Money Market Portfolio, 4.88% (v) | 3,002,739 | $3,002,438 | ||
| Total Investment Companies (Identified Cost, $1,526,555,354) | $2,419,741,848 | |||
| Other Assets, Less Liabilities – 0.0% | 131,643 | |||
| Net Assets – 100.0% | $2,419,873,491 | |||
| (a) | Non-income producing security. |
| (h) | An affiliated issuer, which may be considered one in which the fund owns 5% or more of the outstanding voting securities, or a company which is under common control. At period end, the aggregate values of each fund’s investments in affiliated issuers were as follows: |
| Affiliated Issuers | |
| MFS Conservative Allocation Fund | $3,798,826,459 |
| MFS Moderate Allocation Fund | 6,298,260,743 |
| MFS Growth Allocation Fund | 5,932,658,662 |
| MFS Aggressive Growth Allocation Fund | 2,419,741,848 |
| (v) | Affiliated issuer that is available only to investment companies managed by MFS. The rate quoted for the MFS Institutional Money Market Portfolio is the annualized seven-day yield of the fund at period end. |
| MFS Conservative Allocation Fund | MFS Moderate Allocation Fund | MFS Growth Allocation Fund | MFS Aggressive Growth Allocation Fund | |
| Assets | ||||
| Investments in affiliated issuers, at value (identified cost, $3,295,879,063, $4,862,107,940, $4,082,244,199, and $1,526,555,354, respectively) | $3,798,826,459 | $6,298,260,743 | $5,932,658,662 | $2,419,741,848 |
| Receivables for | ||||
| Investments sold | 4,506,040 | 9,274,570 | 4,535,658 | 2,413,818 |
| Fund shares sold | 9,809,059 | 8,255,450 | 6,139,470 | 2,785,684 |
| Receivable from investment adviser | — | 11,531 | 66,955 | 34,253 |
| Other assets | 7,145 | 11,176 | 10,445 | 4,423 |
| Total assets | $3,813,148,703 | $6,315,813,470 | $5,943,411,190 | $2,424,980,026 |
| Liabilities | ||||
| Payables for | ||||
| Investments purchased | $1,423,271 | $2,317,016 | $566,833 | $989,736 |
| Fund shares reacquired | 10,510,733 | 11,870,607 | 6,744,564 | 3,406,079 |
| Payable to affiliates | ||||
| Administrative services fee | 94 | 94 | 94 | 94 |
| Shareholder servicing costs | 718,368 | 1,281,009 | 1,317,457 | 571,059 |
| Distribution and service fees | 54,673 | 94,589 | 88,143 | 35,661 |
| Payable for independent Trustees' compensation | 182 | 148 | 252 | 76 |
| Accrued expenses and other liabilities | 116,988 | 163,539 | 181,984 | 103,830 |
| Total liabilities | $12,824,309 | $15,727,002 | $8,899,327 | $5,106,535 |
| Net assets | $3,800,324,394 | $6,300,086,468 | $5,934,511,863 | $2,419,873,491 |
| Net assets consist of | ||||
| Paid-in capital | $3,364,421,174 | $4,881,524,713 | $4,071,402,389 | $1,511,984,357 |
| Total distributable earnings (loss) | 435,903,220 | 1,418,561,755 | 1,863,109,474 | 907,889,134 |
| Net assets | $3,800,324,394 | $6,300,086,468 | $5,934,511,863 | $2,419,873,491 |
| MFS Conservative Allocation Fund | MFS Moderate Allocation Fund | MFS Growth Allocation Fund | MFS Aggressive Growth Allocation Fund | |
| Net assets | ||||
| Class A | $2,605,100,414 | $4,676,730,771 | $4,249,188,550 | $1,422,920,043 |
| Class B | 17,273,848 | 43,398,691 | 46,181,006 | 19,808,491 |
| Class C | 282,607,883 | 403,805,118 | 396,611,570 | 217,393,154 |
| Class I | 400,795,759 | 416,669,632 | 421,284,007 | 238,895,943 |
| Class R1 | 9,883,732 | 21,035,606 | 16,462,593 | 12,268,765 |
| Class R2 | 41,999,861 | 94,298,785 | 107,528,490 | 49,019,247 |
| Class R3 | 77,249,652 | 163,133,569 | 115,250,198 | 77,815,489 |
| Class R4 | 279,463,333 | 247,047,778 | 307,902,964 | 167,605,291 |
| Class R6 | 85,949,912 | 233,966,518 | 274,102,485 | 214,147,068 |
| Total net assets | $3,800,324,394 | $6,300,086,468 | $5,934,511,863 | $2,419,873,491 |
| Shares of beneficial interest outstanding | ||||
| Class A | 165,808,546 | 258,787,674 | 196,692,513 | 55,311,627 |
| Class B | 1,104,101 | 2,436,727 | 2,144,859 | 782,724 |
| Class C | 18,305,260 | 22,896,938 | 18,759,581 | 8,736,090 |
| Class I | 25,224,170 | 22,656,853 | 19,260,443 | 9,088,762 |
| Class R1 | 656,080 | 1,226,595 | 800,980 | 502,023 |
| Class R2 | 2,765,717 | 5,362,602 | 5,118,813 | 1,954,792 |
| Class R3 | 4,964,880 | 9,114,733 | 5,389,603 | 3,051,797 |
| Class R4 | 17,767,369 | 13,684,196 | 14,257,469 | 6,483,905 |
| Class R6 | 5,408,910 | 12,722,078 | 12,525,555 | 8,146,338 |
| Total shares of beneficial interest outstanding | 242,005,033 | 348,888,396 | 274,949,816 | 94,058,058 |
| Class A shares | ||||
| Net asset value per share (net assets / shares of beneficial interest outstanding) | $15.71 | $18.07 | $21.60 | $25.73 |
| Offering price per share (100 / 94.25 x net asset value per share) | $16.67 | $19.17 | $22.92 | $27.30 |
| Class B shares | ||||
| Net asset value and offering price per share (net assets / shares of beneficial interest outstanding) | $15.65 | $17.81 | $21.53 | $25.31 |
| Class C shares | ||||
| Net asset value and offering price per share (net assets / shares of beneficial interest outstanding) | $15.44 | $17.64 | $21.14 | $24.88 |
| Class I shares | ||||
| Net asset value, offering price, and redemption price per share (net assets / shares of beneficial interest outstanding) | $15.89 | $18.39 | $21.87 | $26.28 |
| Class R1 shares | ||||
| Net asset value, offering price, and redemption price per share (net assets / shares of beneficial interest outstanding) | $15.06 | $17.15 | $20.55 | $24.44 |
| Class R2 shares | ||||
| Net asset value, offering price, and redemption price per share (net assets / shares of beneficial interest outstanding) | $15.19 | $17.58 | $21.01 | $25.08 |
| Class R3 shares | ||||
| Net asset value, offering price, and redemption price per share (net assets / shares of beneficial interest outstanding) | $15.56 | $17.90 | $21.38 | $25.50 |
| Class R4 shares | ||||
| Net asset value, offering price, and redemption price per share (net assets / shares of beneficial interest outstanding) | $15.73 | $18.05 | $21.60 | $25.85 |
| MFS Conservative Allocation Fund | MFS Moderate Allocation Fund | MFS Growth Allocation Fund | MFS Aggressive Growth Allocation Fund | |
| Class R6 shares | ||||
| Net asset value, offering price, and redemption price per share (net assets / shares of beneficial interest outstanding) | $15.89 | $18.39 | $21.88 | $26.29 |
| On sales of $50,000 or more, the maximum offering price of Class A shares is reduced. A contingent deferred sales charge may be imposed on redemptions of Class A, Class B, and Class C shares. | ||||
| MFS Conservative Allocation Fund | MFS Moderate Allocation Fund | MFS Growth Allocation Fund | MFS Aggressive Growth Allocation Fund | |
| Net investment income (loss) | ||||
| Dividends from affiliated issuers | $116,552,894 | $176,336,138 | $153,143,493 | $49,610,715 |
| Other | 435 | 675 | 628 | 271 |
| Total investment income | $116,553,329 | $176,336,813 | $153,144,121 | $49,610,986 |
| Expenses | ||||
| Distribution and service fees | $10,582,259 | $17,880,784 | $16,413,916 | $6,473,153 |
| Shareholder servicing costs | 2,836,816 | 4,919,468 | 5,495,847 | 2,659,131 |
| Administrative services fee | 17,500 | 17,500 | 17,500 | 17,500 |
| Independent Trustees' compensation | 64,387 | 103,113 | 95,915 | 39,687 |
| Custodian fee | 74,768 | 110,129 | 97,152 | 40,928 |
| Shareholder communications | 109,589 | 193,457 | 233,373 | 106,185 |
| Audit and tax fees | 42,224 | 42,325 | 40,803 | 40,651 |
| Legal fees | 19,346 | 30,512 | 29,228 | 11,110 |
| Miscellaneous | 290,513 | 343,718 | 346,703 | 251,730 |
| Total expenses | $14,037,402 | $23,641,006 | $22,770,437 | $9,640,075 |
| Reduction of expenses by investment adviser and distributor | (560) | (527,968) | (935,659) | (252,905) |
| Net expenses | $14,036,842 | $23,113,038 | $21,834,778 | $9,387,170 |
| Net investment income (loss) | $102,516,487 | $153,223,775 | $131,309,343 | $40,223,816 |
| Realized and unrealized gain (loss) | ||||
| Realized gain (loss) (identified cost basis) | ||||
| Investments in affiliated issuers | $(54,555,496) | $(31,016,717) | $(18,522,979) | $(14,289,189) |
| Capital gain distributions from affiliated issuers | 52,970,065 | 120,258,461 | 144,985,281 | 73,093,881 |
| Net realized gain (loss) | $(1,585,431) | $89,241,744 | $126,462,302 | $58,804,692 |
| Change in unrealized appreciation or depreciation | ||||
| Affiliated issuers | $(177,539,829) | $(384,454,116) | $(382,067,726) | $(147,153,319) |
| Net realized and unrealized gain (loss) | $(179,125,260) | $(295,212,372) | $(255,605,424) | $(88,348,627) |
| Change in net assets from operations | $(76,608,773) | $(141,988,597) | $(124,296,081) | $(48,124,811) |
| Year ended 5/31/23 | MFS Conservative Allocation Fund | MFS Moderate Allocation Fund | MFS Growth Allocation Fund | MFS Aggressive Growth Allocation Fund |
| Change in net assets | ||||
| From operations | ||||
| Net investment income (loss) | $102,516,487 | $153,223,775 | $131,309,343 | $40,223,816 |
| Net realized gain (loss) | (1,585,431) | 89,241,744 | 126,462,302 | 58,804,692 |
| Net unrealized gain (loss) | (177,539,829) | (384,454,116) | (382,067,726) | (147,153,319) |
| Change in net assets from operations | $(76,608,773) | $(141,988,597) | $(124,296,081) | $(48,124,811) |
| Total distributions to shareholders | $(129,292,758) | $(252,540,814) | $(255,517,410) | $(96,901,778) |
| Change in net assets from fund share transactions | $(167,373,931) | $(7,651,472) | $132,279,330 | $106,951,553 |
| Total change in net assets | $(373,275,462) | $(402,180,883) | $(247,534,161) | $(38,075,036) |
| Net assets | ||||
| At beginning of period | 4,173,599,856 | 6,702,267,351 | 6,182,046,024 | 2,457,948,527 |
| At end of period | $3,800,324,394 | $6,300,086,468 | $5,934,511,863 | $2,419,873,491 |
| Year ended 5/31/22 | MFS Conservative Allocation Fund | MFS Moderate Allocation Fund | MFS Growth Allocation Fund | MFS Aggressive Growth Allocation Fund |
| Change in net assets | ||||
| From operations | ||||
| Net investment income (loss) | $124,444,472 | $214,421,199 | $214,514,692 | $78,617,916 |
| Net realized gain (loss) | 42,146,426 | 200,984,852 | 284,205,403 | 123,762,212 |
| Net unrealized gain (loss) | (454,606,612) | (868,583,445) | (894,980,135) | (361,857,283) |
| Change in net assets from operations | $(288,015,714) | $(453,177,394) | $(396,260,040) | $(159,477,155) |
| Total distributions to shareholders | $(164,329,909) | $(402,198,738) | $(471,264,055) | $(176,765,468) |
| Change in net assets from fund share transactions | $444,927,773 | $421,834,666 | $483,753,606 | $232,393,742 |
| Total change in net assets | $(7,417,850) | $(433,541,466) | $(383,770,489) | $(103,848,881) |
| Net assets | ||||
| At beginning of period | 4,181,017,706 | 7,135,808,817 | 6,565,816,513 | 2,561,797,408 |
| At end of period | $4,173,599,856 | $6,702,267,351 | $6,182,046,024 | $2,457,948,527 |
| Year ended | |||||
| Class A | 5/31/23 | 5/31/22 | 5/31/21 | 5/31/20 | 5/31/19 |
| Net asset value, beginning of period | $16.53 | $18.19 | $15.98 | $15.45 | $15.50 |
| Income (loss) from investment operations | |||||
| Net investment income (loss) (d)(l) | $0.42 | $0.51 | $0.26 | $0.33 | $0.35 |
| Net realized and unrealized gain (loss) | (0.70) | (1.50) | 2.43 | 0.75 | 0.31 |
| Total from investment operations | $(0.28) | $(0.99) | $2.69 | $1.08 | $0.66 |
| Less distributions declared to shareholders | |||||
| From net investment income | $(0.42) | $(0.47) | $(0.27) | $(0.34) | $(0.35) |
| From net realized gain | (0.12) | (0.20) | (0.21) | (0.21) | (0.36) |
| Total distributions declared to shareholders | $(0.54) | $(0.67) | $(0.48) | $(0.55) | $(0.71) |
| Net asset value, end of period (x) | $15.71 | $16.53 | $18.19 | $15.98 | $15.45 |
| Total return (%) (r)(s)(t)(x) | (1.61) | (5.80) | 17.04 | 7.07 | 4.60 |
| Ratios (%) (to average net assets) and Supplemental data: | |||||
| Expenses before expense reductions (h) | 0.34 | 0.34 | 0.32 | 0.33 | 0.33 |
| Expenses after expense reductions (h) | 0.34 | 0.34 | 0.32 | 0.33 | 0.33 |
| Net investment income (loss) (l) | 2.67 | 2.83 | 1.51 | 2.05 | 2.30 |
| Portfolio turnover | 4 | 9 | 6 | 12 | 4 |
| Net assets at end of period (000 omitted) | $2,605,100 | $2,760,128 | $2,471,451 | $1,417,121 | $1,294,553 |
| Year ended | |||||
| Class B | 5/31/23 | 5/31/22 | 5/31/21 | 5/31/20 | 5/31/19 |
| Net asset value, beginning of period | $16.44 | $18.09 | $15.89 | $15.35 | $15.40 |
| Income (loss) from investment operations | |||||
| Net investment income (loss) (d)(l) | $0.30 | $0.36 | $0.13 | $0.21 | $0.24 |
| Net realized and unrealized gain (loss) | (0.69) | (1.49) | 2.42 | 0.76 | 0.30 |
| Total from investment operations | $(0.39) | $(1.13) | $2.55 | $0.97 | $0.54 |
| Less distributions declared to shareholders | |||||
| From net investment income | $(0.28) | $(0.32) | $(0.14) | $(0.22) | $(0.23) |
| From net realized gain | (0.12) | (0.20) | (0.21) | (0.21) | (0.36) |
| Total distributions declared to shareholders | $(0.40) | $(0.52) | $(0.35) | $(0.43) | $(0.59) |
| Net asset value, end of period (x) | $15.65 | $16.44 | $18.09 | $15.89 | $15.35 |
| Total return (%) (r)(s)(t)(x) | (2.27) | (6.53) | 16.12 | 6.31 | 3.81 |
| Ratios (%) (to average net assets) and Supplemental data: | |||||
| Expenses before expense reductions (h) | 1.09 | 1.09 | 1.07 | 1.08 | 1.08 |
| Expenses after expense reductions (h) | 1.09 | 1.09 | 1.07 | 1.08 | 1.08 |
| Net investment income (loss) (l) | 1.93 | 2.02 | 0.79 | 1.32 | 1.56 |
| Portfolio turnover | 4 | 9 | 6 | 12 | 4 |
| Net assets at end of period (000 omitted) | $17,274 | $28,023 | $45,913 | $63,965 | $93,839 |
| Year ended | |||||
| Class C | 5/31/23 | 5/31/22 | 5/31/21 | 5/31/20 | 5/31/19 |
| Net asset value, beginning of period | $16.24 | $17.88 | $15.71 | $15.20 | $15.25 |
| Income (loss) from investment operations | |||||
| Net investment income (loss) (d)(l) | $0.30 | $0.37 | $0.14 | $0.20 | $0.23 |
| Net realized and unrealized gain (loss) | (0.69) | (1.48) | 2.38 | 0.75 | 0.32 |
| Total from investment operations | $(0.39) | $(1.11) | $2.52 | $0.95 | $0.55 |
| Less distributions declared to shareholders | |||||
| From net investment income | $(0.29) | $(0.33) | $(0.14) | $(0.23) | $(0.24) |
| From net realized gain | (0.12) | (0.20) | (0.21) | (0.21) | (0.36) |
| Total distributions declared to shareholders | $(0.41) | $(0.53) | $(0.35) | $(0.44) | $(0.60) |
| Net asset value, end of period (x) | $15.44 | $16.24 | $17.88 | $15.71 | $15.20 |
| Total return (%) (r)(s)(t)(x) | (2.31) | (6.50) | 16.15 | 6.24 | 3.88 |
| Ratios (%) (to average net assets) and Supplemental data: | |||||
| Expenses before expense reductions (h) | 1.09 | 1.09 | 1.07 | 1.08 | 1.08 |
| Expenses after expense reductions (h) | 1.09 | 1.09 | 1.07 | 1.08 | 1.08 |
| Net investment income (loss) (l) | 1.92 | 2.07 | 0.80 | 1.30 | 1.55 |
| Portfolio turnover | 4 | 9 | 6 | 12 | 4 |
| Net assets at end of period (000 omitted) | $282,608 | $392,290 | $484,043 | $542,274 | $535,354 |
| Year ended | |||||
| Class I | 5/31/23 | 5/31/22 | 5/31/21 | 5/31/20 | 5/31/19 |
| Net asset value, beginning of period | $16.71 | $18.38 | $16.14 | $15.60 | $15.64 |
| Income (loss) from investment operations | |||||
| Net investment income (loss) (d)(l) | $0.46 | $0.55 | $0.31 | $0.37 | $0.40 |
| Net realized and unrealized gain (loss) | (0.71) | (1.51) | 2.45 | 0.76 | 0.31 |
| Total from investment operations | $(0.25) | $(0.96) | $2.76 | $1.13 | $0.71 |
| Less distributions declared to shareholders | |||||
| From net investment income | $(0.45) | $(0.51) | $(0.31) | $(0.38) | $(0.39) |
| From net realized gain | (0.12) | (0.20) | (0.21) | (0.21) | (0.36) |
| Total distributions declared to shareholders | $(0.57) | $(0.71) | $(0.52) | $(0.59) | $(0.75) |
| Net asset value, end of period (x) | $15.89 | $16.71 | $18.38 | $16.14 | $15.60 |
| Total return (%) (r)(s)(t)(x) | (1.34) | (5.57) | 17.32 | 7.34 | 4.89 |
| Ratios (%) (to average net assets) and Supplemental data: | |||||
| Expenses before expense reductions (h) | 0.09 | 0.09 | 0.07 | 0.08 | 0.08 |
| Expenses after expense reductions (h) | N/A | 0.09 | N/A | N/A | N/A |
| Net investment income (loss) (l) | 2.91 | 3.06 | 1.79 | 2.30 | 2.58 |
| Portfolio turnover | 4 | 9 | 6 | 12 | 4 |
| Net assets at end of period (000 omitted) | $400,796 | $508,191 | $519,688 | $400,869 | $367,586 |
| Year ended | |||||
| Class R1 | 5/31/23 | 5/31/22 | 5/31/21 | 5/31/20 | 5/31/19 |
| Net asset value, beginning of period | $15.87 | $17.49 | $15.38 | $14.89 | $14.96 |
| Income (loss) from investment operations | |||||
| Net investment income (loss) (d)(l) | $0.29 | $0.35 | $0.13 | $0.20 | $0.23 |
| Net realized and unrealized gain (loss) | (0.68) | (1.44) | 2.34 | 0.73 | 0.30 |
| Total from investment operations | $(0.39) | $(1.09) | $2.47 | $0.93 | $0.53 |
| Less distributions declared to shareholders | |||||
| From net investment income | $(0.30) | $(0.33) | $(0.15) | $(0.23) | $(0.24) |
| From net realized gain | (0.12) | (0.20) | (0.21) | (0.21) | (0.36) |
| Total distributions declared to shareholders | $(0.42) | $(0.53) | $(0.36) | $(0.44) | $(0.60) |
| Net asset value, end of period (x) | $15.06 | $15.87 | $17.49 | $15.38 | $14.89 |
| Total return (%) (r)(s)(t)(x) | (2.38) | (6.51) | 16.18 | 6.27 | 3.83 |
| Ratios (%) (to average net assets) and Supplemental data: | |||||
| Expenses before expense reductions (h) | 1.09 | 1.09 | 1.07 | 1.08 | 1.08 |
| Expenses after expense reductions (h) | N/A | 1.09 | N/A | N/A | N/A |
| Net investment income (loss) (l) | 1.94 | 2.03 | 0.78 | 1.31 | 1.53 |
| Portfolio turnover | 4 | 9 | 6 | 12 | 4 |
| Net assets at end of period (000 omitted) | $9,884 | $11,188 | $13,269 | $11,468 | $11,465 |
| Year ended | |||||
| Class R2 | 5/31/23 | 5/31/22 | 5/31/21 | 5/31/20 | 5/31/19 |
| Net asset value, beginning of period | $15.99 | $17.62 | $15.49 | $14.99 | $15.06 |
| Income (loss) from investment operations | |||||
| Net investment income (loss) (d)(l) | $0.37 | $0.44 | $0.21 | $0.28 | $0.31 |
| Net realized and unrealized gain (loss) | (0.67) | (1.45) | 2.36 | 0.74 | 0.30 |
| Total from investment operations | $(0.30) | $(1.01) | $2.57 | $1.02 | $0.61 |
| Less distributions declared to shareholders | |||||
| From net investment income | $(0.38) | $(0.42) | $(0.23) | $(0.31) | $(0.32) |
| From net realized gain | (0.12) | (0.20) | (0.21) | (0.21) | (0.36) |
| Total distributions declared to shareholders | $(0.50) | $(0.62) | $(0.44) | $(0.52) | $(0.68) |
| Net asset value, end of period (x) | $15.19 | $15.99 | $17.62 | $15.49 | $14.99 |
| Total return (%) (r)(s)(t)(x) | (1.79) | (6.06) | 16.75 | 6.81 | 4.34 |
| Ratios (%) (to average net assets) and Supplemental data: | |||||
| Expenses before expense reductions (h) | 0.59 | 0.59 | 0.57 | 0.58 | 0.58 |
| Expenses after expense reductions (h) | N/A | 0.59 | N/A | 0.58 | 0.58 |
| Net investment income (loss) (l) | 2.42 | 2.55 | 1.28 | 1.81 | 2.06 |
| Portfolio turnover | 4 | 9 | 6 | 12 | 4 |
| Net assets at end of period (000 omitted) | $42,000 | $48,041 | $54,728 | $56,260 | $64,220 |
| Year ended | |||||
| Class R3 | 5/31/23 | 5/31/22 | 5/31/21 | 5/31/20 | 5/31/19 |
| Net asset value, beginning of period | $16.37 | $18.02 | $15.84 | $15.31 | $15.37 |
| Income (loss) from investment operations | |||||
| Net investment income (loss) (d)(l) | $0.42 | $0.51 | $0.26 | $0.32 | $0.35 |
| Net realized and unrealized gain (loss) | (0.70) | (1.50) | 2.40 | 0.76 | 0.30 |
| Total from investment operations | $(0.28) | $(0.99) | $2.66 | $1.08 | $0.65 |
| Less distributions declared to shareholders | |||||
| From net investment income | $(0.41) | $(0.46) | $(0.27) | $(0.34) | $(0.35) |
| From net realized gain | (0.12) | (0.20) | (0.21) | (0.21) | (0.36) |
| Total distributions declared to shareholders | $(0.53) | $(0.66) | $(0.48) | $(0.55) | $(0.71) |
| Net asset value, end of period (x) | $15.56 | $16.37 | $18.02 | $15.84 | $15.31 |
| Total return (%) (r)(s)(t)(x) | (1.57) | (5.81) | 16.98 | 7.14 | 4.57 |
| Ratios (%) (to average net assets) and Supplemental data: | |||||
| Expenses before expense reductions (h) | 0.34 | 0.34 | 0.32 | 0.33 | 0.33 |
| Expenses after expense reductions (h) | N/A | 0.34 | N/A | N/A | N/A |
| Net investment income (loss) (l) | 2.67 | 2.84 | 1.53 | 2.06 | 2.33 |
| Portfolio turnover | 4 | 9 | 6 | 12 | 4 |
| Net assets at end of period (000 omitted) | $77,250 | $91,528 | $109,177 | $95,119 | $101,884 |
| Year ended | |||||
| Class R4 | 5/31/23 | 5/31/22 | 5/31/21 | 5/31/20 | 5/31/19 |
| Net asset value, beginning of period | $16.55 | $18.21 | $15.99 | $15.46 | $15.51 |
| Income (loss) from investment operations | |||||
| Net investment income (loss) (d)(l) | $0.45 | $0.54 | $0.31 | $0.36 | $0.41 |
| Net realized and unrealized gain (loss) | (0.69) | (1.49) | 2.43 | 0.76 | 0.29 |
| Total from investment operations | $(0.24) | $(0.95) | $2.74 | $1.12 | $0.70 |
| Less distributions declared to shareholders | |||||
| From net investment income | $(0.46) | $(0.51) | $(0.31) | $(0.38) | $(0.39) |
| From net realized gain | (0.12) | (0.20) | (0.21) | (0.21) | (0.36) |
| Total distributions declared to shareholders | $(0.58) | $(0.71) | $(0.52) | $(0.59) | $(0.75) |
| Net asset value, end of period (x) | $15.73 | $16.55 | $18.21 | $15.99 | $15.46 |
| Total return (%) (r)(s)(t)(x) | (1.35) | (5.57) | 17.36 | 7.34 | 4.86 |
| Ratios (%) (to average net assets) and Supplemental data: | |||||
| Expenses before expense reductions (h) | 0.09 | 0.09 | 0.07 | 0.08 | 0.08 |
| Expenses after expense reductions (h) | N/A | 0.09 | N/A | N/A | N/A |
| Net investment income (loss) (l) | 2.89 | 3.00 | 1.77 | 2.29 | 2.65 |
| Portfolio turnover | 4 | 9 | 6 | 12 | 4 |
| Net assets at end of period (000 omitted) | $279,463 | $267,840 | $269,196 | $234,301 | $179,833 |
| Year ended | ||
| Class R6 | 5/31/23 | 5/31/22(i) |
| Net asset value, beginning of period | $16.71 | $18.54 |
| Income (loss) from investment operations | ||
| Net investment income (loss) (d)(l) | $0.47 | $0.16 |
| Net realized and unrealized gain (loss) | (0.70) | (1.39) |
| Total from investment operations | $(0.23) | $(1.23) |
| Less distributions declared to shareholders | ||
| From net investment income | $(0.47) | $(0.40) |
| From net realized gain | (0.12) | (0.20) |
| Total distributions declared to shareholders | $(0.59) | $(0.60) |
| Net asset value, end of period (x) | $15.89 | $16.71 |
| Total return (%) (r)(s)(t)(x) | (1.27) | (6.95)(n) |
| Ratios (%) (to average net assets) and Supplemental data: | ||
| Expenses before expense reductions (h) | 0.03 | 0.04(a) |
| Expenses after expense reductions (h) | N/A | 0.03(a) |
| Net investment income (loss) (l) | 2.95 | 1.44(a) |
| Portfolio turnover | 4 | 9 |
| Net assets at end of period (000 omitted) | $85,950 | $66,370 |
| (a) | Annualized. |
| (d) | Per share data is based on average shares outstanding. |
| (h) | In addition to the fees and expenses which the fund bears directly, the fund indirectly bears a pro rata share of the fees and expenses of the underlying affiliated funds in which the fund invests. Accordingly, the expense ratio for the fund reflects only those fees and expenses borne directly by the fund. Because the underlying affiliated funds have varied expense and fee levels and the fund may own different proportions of the underlying affiliated funds at different times, the amount of fees and expenses incurred indirectly by the fund will vary. |
| (i) | For Class R6, the period is from the class inception, September 30, 2021, through the stated period end. |
| (l) | The ratios and per share amounts do not include net investment income of the underlying affiliated funds in which the fund invests. |
| (n) | Not annualized. |
| (r) | Certain expenses have been reduced without which performance would have been lower. |
| (s) | From time to time the fund may receive proceeds from litigation settlements, without which performance would be lower. |
| (t) | Total returns do not include any applicable sales charges. |
| (x) | The net asset values and total returns have been calculated on net assets which include adjustments made in accordance with U.S. generally accepted accounting principles required at period end for financial reporting purposes. |
| Year ended | |||||
| Class A | 5/31/23 | 5/31/22 | 5/31/21 | 5/31/20 | 5/31/19 |
| Net asset value, beginning of period | $19.22 | $21.57 | $18.02 | $17.56 | $17.88 |
| Income (loss) from investment operations | |||||
| Net investment income (loss) (d)(l) | $0.44 | $0.63 | $0.25 | $0.33 | $0.37 |
| Net realized and unrealized gain (loss) | (0.85) | (1.79) | 4.04 | 0.97 | 0.30 |
| Total from investment operations | $(0.41) | $(1.16) | $4.29 | $1.30 | $0.67 |
| Less distributions declared to shareholders | |||||
| From net investment income | $(0.45) | $(0.61) | $(0.24) | $(0.34) | $(0.37) |
| From net realized gain | (0.29) | (0.58) | (0.50) | (0.50) | (0.62) |
| Total distributions declared to shareholders | $(0.74) | $(1.19) | $(0.74) | $(0.84) | $(0.99) |
| Net asset value, end of period (x) | $18.07 | $19.22 | $21.57 | $18.02 | $17.56 |
| Total return (%) (r)(s)(t)(x) | (1.99) | (5.96) | 24.18 | 7.35 | 4.25 |
| Ratios (%) (to average net assets) and Supplemental data: | |||||
| Expenses before expense reductions (h) | 0.34 | 0.36 | 0.33 | 0.34 | 0.34 |
| Expenses after expense reductions (h) | 0.33 | 0.35 | 0.33 | 0.34 | 0.34 |
| Net investment income (loss) (l) | 2.44 | 2.99 | 1.23 | 1.79 | 2.09 |
| Portfolio turnover | 2 | 11 | 7 | 8 | 2 |
| Net assets at end of period (000 omitted) | $4,676,731 | $4,812,425 | $4,687,031 | $3,173,202 | $3,038,919 |
| Year ended | |||||
| Class B | 5/31/23 | 5/31/22 | 5/31/21 | 5/31/20 | 5/31/19 |
| Net asset value, beginning of period | $18.93 | $21.28 | $17.79 | $17.33 | $17.65 |
| Income (loss) from investment operations | |||||
| Net investment income (loss) (d)(l) | $0.31 | $0.46 | $0.10 | $0.19 | $0.24 |
| Net realized and unrealized gain (loss) | (0.84) | (1.76) | 3.99 | 0.97 | 0.30 |
| Total from investment operations | $(0.53) | $(1.30) | $4.09 | $1.16 | $0.54 |
| Less distributions declared to shareholders | |||||
| From net investment income | $(0.30) | $(0.47) | $(0.10) | $(0.20) | $(0.24) |
| From net realized gain | (0.29) | (0.58) | (0.50) | (0.50) | (0.62) |
| Total distributions declared to shareholders | $(0.59) | $(1.05) | $(0.60) | $(0.70) | $(0.86) |
| Net asset value, end of period (x) | $17.81 | $18.93 | $21.28 | $17.79 | $17.33 |
| Total return (%) (r)(s)(t)(x) | (2.69) | (6.67) | 23.24 | 6.57 | 3.49 |
| Ratios (%) (to average net assets) and Supplemental data: | |||||
| Expenses before expense reductions (h) | 1.09 | 1.11 | 1.08 | 1.09 | 1.09 |
| Expenses after expense reductions (h) | 1.08 | 1.10 | 1.08 | 1.09 | 1.09 |
| Net investment income (loss) (l) | 1.71 | 2.20 | 0.50 | 1.05 | 1.36 |
| Portfolio turnover | 2 | 11 | 7 | 8 | 2 |
| Net assets at end of period (000 omitted) | $43,399 | $69,914 | $116,059 | $149,969 | $210,011 |
| Year ended | |||||
| Class C | 5/31/23 | 5/31/22 | 5/31/21 | 5/31/20 | 5/31/19 |
| Net asset value, beginning of period | $18.76 | $21.10 | $17.65 | $17.21 | $17.53 |
| Income (loss) from investment operations | |||||
| Net investment income (loss) (d)(l) | $0.30 | $0.46 | $0.10 | $0.18 | $0.23 |
| Net realized and unrealized gain (loss) | (0.83) | (1.75) | 3.95 | 0.97 | 0.31 |
| Total from investment operations | $(0.53) | $(1.29) | $4.05 | $1.15 | $0.54 |
| Less distributions declared to shareholders | |||||
| From net investment income | $(0.30) | $(0.47) | $(0.10) | $(0.21) | $(0.24) |
| From net realized gain | (0.29) | (0.58) | (0.50) | (0.50) | (0.62) |
| Total distributions declared to shareholders | $(0.59) | $(1.05) | $(0.60) | $(0.71) | $(0.86) |
| Net asset value, end of period (x) | $17.64 | $18.76 | $21.10 | $17.65 | $17.21 |
| Total return (%) (r)(s)(t)(x) | (2.67) | (6.66) | 23.19 | 6.55 | 3.53 |
| Ratios (%) (to average net assets) and Supplemental data: | |||||
| Expenses before expense reductions (h) | 1.09 | 1.11 | 1.08 | 1.09 | 1.09 |
| Expenses after expense reductions (h) | 1.08 | 1.10 | 1.08 | 1.09 | 1.09 |
| Net investment income (loss) (l) | 1.70 | 2.22 | 0.53 | 1.04 | 1.34 |
| Portfolio turnover | 2 | 11 | 7 | 8 | 2 |
| Net assets at end of period (000 omitted) | $403,805 | $537,508 | $721,781 | $874,127 | $917,199 |
| Year ended | |||||
| Class I | 5/31/23 | 5/31/22 | 5/31/21 | 5/31/20 | 5/31/19 |
| Net asset value, beginning of period | $19.55 | $21.91 | $18.29 | $17.81 | $18.12 |
| Income (loss) from investment operations | |||||
| Net investment income (loss) (d)(l) | $0.50 | $0.70 | $0.30 | $0.37 | $0.42 |
| Net realized and unrealized gain (loss) | (0.88) | (1.82) | 4.11 | 1.00 | 0.31 |
| Total from investment operations | $(0.38) | $(1.12) | $4.41 | $1.37 | $0.73 |
| Less distributions declared to shareholders | |||||
| From net investment income | $(0.49) | $(0.66) | $(0.29) | $(0.39) | $(0.42) |
| From net realized gain | (0.29) | (0.58) | (0.50) | (0.50) | (0.62) |
| Total distributions declared to shareholders | $(0.78) | $(1.24) | $(0.79) | $(0.89) | $(1.04) |
| Net asset value, end of period (x) | $18.39 | $19.55 | $21.91 | $18.29 | $17.81 |
| Total return (%) (r)(s)(t)(x) | (1.76) | (5.69) | 24.49 | 7.62 | 4.51 |
| Ratios (%) (to average net assets) and Supplemental data: | |||||
| Expenses before expense reductions (h) | 0.09 | 0.11 | 0.08 | 0.09 | 0.09 |
| Expenses after expense reductions (h) | 0.08 | 0.10 | N/A | N/A | N/A |
| Net investment income (loss) (l) | 2.69 | 3.26 | 1.50 | 2.04 | 2.35 |
| Portfolio turnover | 2 | 11 | 7 | 8 | 2 |
| Net assets at end of period (000 omitted) | $416,670 | $448,966 | $476,798 | $310,815 | $275,276 |
| Year ended | |||||
| Class R1 | 5/31/23 | 5/31/22 | 5/31/21 | 5/31/20 | 5/31/19 |
| Net asset value, beginning of period | $18.27 | $20.58 | $17.23 | $16.83 | $17.17 |
| Income (loss) from investment operations | |||||
| Net investment income (loss) (d)(l) | $0.29 | $0.45 | $0.09 | $0.18 | $0.23 |
| Net realized and unrealized gain (loss) | (0.81) | (1.70) | 3.87 | 0.93 | 0.30 |
| Total from investment operations | $(0.52) | $(1.25) | $3.96 | $1.11 | $0.53 |
| Less distributions declared to shareholders | |||||
| From net investment income | $(0.31) | $(0.48) | $(0.11) | $(0.21) | $(0.25) |
| From net realized gain | (0.29) | (0.58) | (0.50) | (0.50) | (0.62) |
| Total distributions declared to shareholders | $(0.60) | $(1.06) | $(0.61) | $(0.71) | $(0.87) |
| Net asset value, end of period (x) | $17.15 | $18.27 | $20.58 | $17.23 | $16.83 |
| Total return (%) (r)(s)(t)(x) | (2.70) | (6.65) | 23.25 | 6.49 | 3.53 |
| Ratios (%) (to average net assets) and Supplemental data: | |||||
| Expenses before expense reductions (h) | 1.09 | 1.11 | 1.08 | 1.09 | 1.09 |
| Expenses after expense reductions (h) | 1.08 | 1.10 | N/A | 1.09 | 1.09 |
| Net investment income (loss) (l) | 1.69 | 2.21 | 0.49 | 1.03 | 1.37 |
| Portfolio turnover | 2 | 11 | 7 | 8 | 2 |
| Net assets at end of period (000 omitted) | $21,036 | $25,035 | $26,919 | $24,120 | $26,171 |
| Year ended | |||||
| Class R2 | 5/31/23 | 5/31/22 | 5/31/21 | 5/31/20 | 5/31/19 |
| Net asset value, beginning of period | $18.72 | $21.04 | $17.59 | $17.16 | $17.49 |
| Income (loss) from investment operations | |||||
| Net investment income (loss) (d)(l) | $0.39 | $0.56 | $0.20 | $0.27 | $0.32 |
| Net realized and unrealized gain (loss) | (0.84) | (1.74) | 3.95 | 0.96 | 0.30 |
| Total from investment operations | $(0.45) | $(1.18) | $4.15 | $1.23 | $0.62 |
| Less distributions declared to shareholders | |||||
| From net investment income | $(0.40) | $(0.56) | $(0.20) | $(0.30) | $(0.33) |
| From net realized gain | (0.29) | (0.58) | (0.50) | (0.50) | (0.62) |
| Total distributions declared to shareholders | $(0.69) | $(1.14) | $(0.70) | $(0.80) | $(0.95) |
| Net asset value, end of period (x) | $17.58 | $18.72 | $21.04 | $17.59 | $17.16 |
| Total return (%) (r)(s)(t)(x) | (2.24) | (6.20) | 23.88 | 7.06 | 4.02 |
| Ratios (%) (to average net assets) and Supplemental data: | |||||
| Expenses before expense reductions (h) | 0.59 | 0.61 | 0.58 | 0.59 | 0.59 |
| Expenses after expense reductions (h) | 0.58 | 0.60 | 0.58 | 0.59 | 0.59 |
| Net investment income (loss) (l) | 2.18 | 2.70 | 1.01 | 1.53 | 1.84 |
| Portfolio turnover | 2 | 11 | 7 | 8 | 2 |
| Net assets at end of period (000 omitted) | $94,299 | $107,117 | $128,654 | $124,725 | $136,699 |
| Year ended | |||||
| Class R3 | 5/31/23 | 5/31/22 | 5/31/21 | 5/31/20 | 5/31/19 |
| Net asset value, beginning of period | $19.04 | $21.38 | $17.86 | $17.41 | $17.74 |
| Income (loss) from investment operations | |||||
| Net investment income (loss) (d)(l) | $0.44 | $0.63 | $0.25 | $0.33 | $0.37 |
| Net realized and unrealized gain (loss) | (0.85) | (1.78) | 4.01 | 0.96 | 0.29 |
| Total from investment operations | $(0.41) | $(1.15) | $4.26 | $1.29 | $0.66 |
| Less distributions declared to shareholders | |||||
| From net investment income | $(0.44) | $(0.61) | $(0.24) | $(0.34) | $(0.37) |
| From net realized gain | (0.29) | (0.58) | (0.50) | (0.50) | (0.62) |
| Total distributions declared to shareholders | $(0.73) | $(1.19) | $(0.74) | $(0.84) | $(0.99) |
| Net asset value, end of period (x) | $17.90 | $19.04 | $21.38 | $17.86 | $17.41 |
| Total return (%) (r)(s)(t)(x) | (1.96) | (5.97) | 24.21 | 7.35 | 4.22 |
| Ratios (%) (to average net assets) and Supplemental data: | |||||
| Expenses before expense reductions (h) | 0.34 | 0.36 | 0.33 | 0.34 | 0.34 |
| Expenses after expense reductions (h) | 0.33 | 0.35 | N/A | N/A | 0.34 |
| Net investment income (loss) (l) | 2.44 | 2.97 | 1.24 | 1.83 | 2.09 |
| Portfolio turnover | 2 | 11 | 7 | 8 | 2 |
| Net assets at end of period (000 omitted) | $163,134 | $196,975 | $250,644 | $219,996 | $270,597 |
| Year ended | |||||
| Class R4 | 5/31/23 | 5/31/22 | 5/31/21 | 5/31/20 | 5/31/19 |
| Net asset value, beginning of period | $19.20 | $21.55 | $18.00 | $17.54 | $17.86 |
| Income (loss) from investment operations | |||||
| Net investment income (loss) (d)(l) | $0.49 | $0.69 | $0.30 | $0.37 | $0.44 |
| Net realized and unrealized gain (loss) | (0.86) | (1.80) | 4.04 | 0.98 | 0.28 |
| Total from investment operations | $(0.37) | $(1.11) | $4.34 | $1.35 | $0.72 |
| Less distributions declared to shareholders | |||||
| From net investment income | $(0.49) | $(0.66) | $(0.29) | $(0.39) | $(0.42) |
| From net realized gain | (0.29) | (0.58) | (0.50) | (0.50) | (0.62) |
| Total distributions declared to shareholders | $(0.78) | $(1.24) | $(0.79) | $(0.89) | $(1.04) |
| Net asset value, end of period (x) | $18.05 | $19.20 | $21.55 | $18.00 | $17.54 |
| Total return (%) (r)(s)(t)(x) | (1.74) | (5.74) | 24.50 | 7.62 | 4.52 |
| Ratios (%) (to average net assets) and Supplemental data: | |||||
| Expenses before expense reductions (h) | 0.09 | 0.11 | 0.08 | 0.09 | 0.09 |
| Expenses after expense reductions (h) | 0.08 | 0.10 | N/A | N/A | N/A |
| Net investment income (loss) (l) | 2.72 | 3.24 | 1.49 | 2.04 | 2.50 |
| Portfolio turnover | 2 | 11 | 7 | 8 | 2 |
| Net assets at end of period (000 omitted) | $247,048 | $296,478 | $334,080 | $252,825 | $210,597 |
| Year ended | ||
| Class R6 | 5/31/23 | 5/31/22(i) |
| Net asset value, beginning of period | $19.55 | $22.22 |
| Income (loss) from investment operations | ||
| Net investment income (loss) (d)(l) | $0.51 | $0.15 |
| Net realized and unrealized gain (loss) | (0.88) | (1.67) |
| Total from investment operations | $(0.37) | $(1.52) |
| Less distributions declared to shareholders | ||
| From net investment income | $(0.50) | $(0.57) |
| From net realized gain | (0.29) | (0.58) |
| Total distributions declared to shareholders | $(0.79) | $(1.15) |
| Net asset value, end of period (x) | $18.39 | $19.55 |
| Total return (%) (r)(s)(t)(x) | (1.69) | (7.39)(n) |
| Ratios (%) (to average net assets) and Supplemental data: | ||
| Expenses before expense reductions (h) | 0.03 | 0.03(a) |
| Expenses after expense reductions (h) | 0.02 | 0.02(a) |
| Net investment income (loss) (l) | 2.74 | 1.12(a) |
| Portfolio turnover | 2 | 11 |
| Net assets at end of period (000 omitted) | $233,967 | $207,850 |
| (a) | Annualized. |
| (d) | Per share data is based on average shares outstanding. |
| (h) | In addition to the fees and expenses which the fund bears directly, the fund indirectly bears a pro rata share of the fees and expenses of the underlying affiliated funds in which the fund invests. Accordingly, the expense ratio for the fund reflects only those fees and expenses borne directly by the fund. Because the underlying affiliated funds have varied expense and fee levels and the fund may own different proportions of the underlying affiliated funds at different times, the amount of fees and expenses incurred indirectly by the fund will vary. |
| (i) | For Class R6, the period is from the class inception, September 30, 2021, through the stated period end. |
| (l) | The ratios and per share amounts do not include net investment income of the underlying affiliated funds in which the fund invests. |
| (n) | Not annualized. |
| (r) | Certain expenses have been reduced without which performance would have been lower. |
| (s) | From time to time the fund may receive proceeds from litigation settlements, without which performance would be lower. |
| (t) | Total returns do not include any applicable sales charges. |
| (x) | The net asset values and total returns have been calculated on net assets which include adjustments made in accordance with U.S. generally accepted accounting principles required at period end for financial reporting purposes. |
| Year ended | |||||
| Class A | 5/31/23 | 5/31/22 | 5/31/21 | 5/31/20 | 5/31/19 |
| Net asset value, beginning of period | $23.06 | $26.18 | $20.57 | $20.26 | $20.87 |
| Income (loss) from investment operations | |||||
| Net investment income (loss) (d)(l) | $0.49 | $0.83 | $0.23 | $0.33 | $0.38 |
| Net realized and unrealized gain (loss) | (0.99) | (2.10) | 6.25 | 1.03 | 0.21 |
| Total from investment operations | $(0.50) | $(1.27) | $6.48 | $1.36 | $0.59 |
| Less distributions declared to shareholders | |||||
| From net investment income | $(0.48) | $(0.83) | $(0.23) | $(0.34) | $(0.39) |
| From net realized gain | (0.48) | (1.02) | (0.64) | (0.71) | (0.81) |
| Total distributions declared to shareholders | $(0.96) | $(1.85) | $(0.87) | $(1.05) | $(1.20) |
| Net asset value, end of period (x) | $21.60 | $23.06 | $26.18 | $20.57 | $20.26 |
| Total return (%) (r)(s)(t)(x) | (1.97) | (5.64) | 31.90 | 6.41 | 3.58 |
| Ratios (%) (to average net assets) and Supplemental data: | |||||
| Expenses before expense reductions (h) | 0.36 | 0.37 | 0.35 | 0.36 | 0.36 |
| Expenses after expense reductions (h) | 0.34 | 0.35 | 0.35 | 0.35 | 0.35 |
| Net investment income (loss) (l) | 2.25 | 3.24 | 0.96 | 1.57 | 1.87 |
| Portfolio turnover | 2 | 11 | 7 | 4 | 3 |
| Net assets at end of period (000 omitted) | $4,249,189 | $4,361,480 | $4,279,764 | $2,944,439 | $2,852,131 |
| Year ended | |||||
| Class B | 5/31/23 | 5/31/22 | 5/31/21 | 5/31/20 | 5/31/19 |
| Net asset value, beginning of period | $22.92 | $25.99 | $20.39 | $20.08 | $20.65 |
| Income (loss) from investment operations | |||||
| Net investment income (loss) (d)(l) | $0.33 | $0.63 | $0.05 | $0.17 | $0.23 |
| Net realized and unrealized gain (loss) | (0.98) | (2.10) | 6.21 | 1.00 | 0.23 |
| Total from investment operations | $(0.65) | $(1.47) | $6.26 | $1.17 | $0.46 |
| Less distributions declared to shareholders | |||||
| From net investment income | $(0.26) | $(0.58) | $(0.02) | $(0.15) | $(0.22) |
| From net realized gain | (0.48) | (1.02) | (0.64) | (0.71) | (0.81) |
| Total distributions declared to shareholders | $(0.74) | $(1.60) | $(0.66) | $(0.86) | $(1.03) |
| Net asset value, end of period (x) | $21.53 | $22.92 | $25.99 | $20.39 | $20.08 |
| Total return (%) (r)(s)(t)(x) | (2.69) | (6.36) | 30.98 | 5.56 | 2.85 |
| Ratios (%) (to average net assets) and Supplemental data: | |||||
| Expenses before expense reductions (h) | 1.11 | 1.12 | 1.10 | 1.11 | 1.11 |
| Expenses after expense reductions (h) | 1.09 | 1.10 | 1.10 | 1.10 | 1.10 |
| Net investment income (loss) (l) | 1.52 | 2.46 | 0.23 | 0.83 | 1.13 |
| Portfolio turnover | 2 | 11 | 7 | 4 | 3 |
| Net assets at end of period (000 omitted) | $46,181 | $69,836 | $109,514 | $126,962 | $177,893 |
| Year ended | |||||
| Class C | 5/31/23 | 5/31/22 | 5/31/21 | 5/31/20 | 5/31/19 |
| Net asset value, beginning of period | $22.55 | $25.63 | $20.12 | $19.85 | $20.43 |
| Income (loss) from investment operations | |||||
| Net investment income (loss) (d)(l) | $0.32 | $0.62 | $0.06 | $0.17 | $0.23 |
| Net realized and unrealized gain (loss) | (0.95) | (2.07) | 6.12 | 0.99 | 0.22 |
| Total from investment operations | $(0.63) | $(1.45) | $6.18 | $1.16 | $0.45 |
| Less distributions declared to shareholders | |||||
| From net investment income | $(0.30) | $(0.61) | $(0.03) | $(0.18) | $(0.22) |
| From net realized gain | (0.48) | (1.02) | (0.64) | (0.71) | (0.81) |
| Total distributions declared to shareholders | $(0.78) | $(1.63) | $(0.67) | $(0.89) | $(1.03) |
| Net asset value, end of period (x) | $21.14 | $22.55 | $25.63 | $20.12 | $19.85 |
| Total return (%) (r)(s)(t)(x) | (2.67) | (6.39) | 30.98 | 5.56 | 2.84 |
| Ratios (%) (to average net assets) and Supplemental data: | |||||
| Expenses before expense reductions (h) | 1.11 | 1.12 | 1.10 | 1.11 | 1.11 |
| Expenses after expense reductions (h) | 1.09 | 1.10 | 1.10 | 1.10 | 1.10 |
| Net investment income (loss) (l) | 1.51 | 2.46 | 0.26 | 0.82 | 1.13 |
| Portfolio turnover | 2 | 11 | 7 | 4 | 3 |
| Net assets at end of period (000 omitted) | $396,612 | $490,305 | $638,016 | $694,541 | $714,230 |
| Year ended | |||||
| Class I | 5/31/23 | 5/31/22 | 5/31/21 | 5/31/20 | 5/31/19 |
| Net asset value, beginning of period | $23.33 | $26.47 | $20.78 | $20.45 | $21.06 |
| Income (loss) from investment operations | |||||
| Net investment income (loss) (d)(l) | $0.54 | $0.91 | $0.29 | $0.38 | $0.44 |
| Net realized and unrealized gain (loss) | (0.98) | (2.13) | 6.33 | 1.05 | 0.21 |
| Total from investment operations | $(0.44) | $(1.22) | $6.62 | $1.43 | $0.65 |
| Less distributions declared to shareholders | |||||
| From net investment income | $(0.54) | $(0.90) | $(0.29) | $(0.39) | $(0.45) |
| From net realized gain | (0.48) | (1.02) | (0.64) | (0.71) | (0.81) |
| Total distributions declared to shareholders | $(1.02) | $(1.92) | $(0.93) | $(1.10) | $(1.26) |
| Net asset value, end of period (x) | $21.87 | $23.33 | $26.47 | $20.78 | $20.45 |
| Total return (%) (r)(s)(t)(x) | (1.69) | (5.44) | 32.24 | 6.69 | 3.84 |
| Ratios (%) (to average net assets) and Supplemental data: | |||||
| Expenses before expense reductions (h) | 0.11 | 0.12 | 0.10 | 0.11 | 0.11 |
| Expenses after expense reductions (h) | 0.09 | 0.10 | 0.10 | 0.10 | 0.10 |
| Net investment income (loss) (l) | 2.47 | 3.50 | 1.23 | 1.80 | 2.13 |
| Portfolio turnover | 2 | 11 | 7 | 4 | 3 |
| Net assets at end of period (000 omitted) | $421,284 | $421,692 | $434,119 | $294,213 | $237,232 |
| Year ended | |||||
| Class R1 | 5/31/23 | 5/31/22 | 5/31/21 | 5/31/20 | 5/31/19 |
| Net asset value, beginning of period | $21.97 | $25.02 | $19.69 | $19.42 | $20.02 |
| Income (loss) from investment operations | |||||
| Net investment income (loss) (d)(l) | $0.32 | $0.62 | $0.05 | $0.16 | $0.23 |
| Net realized and unrealized gain (loss) | (0.94) | (2.02) | 5.98 | 0.98 | 0.21 |
| Total from investment operations | $(0.62) | $(1.40) | $6.03 | $1.14 | $0.44 |
| Less distributions declared to shareholders | |||||
| From net investment income | $(0.32) | $(0.63) | $(0.06) | $(0.16) | $(0.23) |
| From net realized gain | (0.48) | (1.02) | (0.64) | (0.71) | (0.81) |
| Total distributions declared to shareholders | $(0.80) | $(1.65) | $(0.70) | $(0.87) | $(1.04) |
| Net asset value, end of period (x) | $20.55 | $21.97 | $25.02 | $19.69 | $19.42 |
| Total return (%) (r)(s)(t)(x) | (2.67) | (6.38) | 30.91 | 5.59 | 2.85 |
| Ratios (%) (to average net assets) and Supplemental data: | |||||
| Expenses before expense reductions (h) | 1.11 | 1.12 | 1.10 | 1.11 | 1.11 |
| Expenses after expense reductions (h) | 1.09 | 1.10 | 1.10 | 1.10 | 1.10 |
| Net investment income (loss) (l) | 1.53 | 2.53 | 0.21 | 0.82 | 1.18 |
| Portfolio turnover | 2 | 11 | 7 | 4 | 3 |
| Net assets at end of period (000 omitted) | $16,463 | $18,598 | $21,519 | $19,543 | $23,326 |
| Year ended | |||||
| Class R2 | 5/31/23 | 5/31/22 | 5/31/21 | 5/31/20 | 5/31/19 |
| Net asset value, beginning of period | $22.44 | $25.52 | $20.06 | $19.78 | $20.39 |
| Income (loss) from investment operations | |||||
| Net investment income (loss) (d)(l) | $0.42 | $0.75 | $0.17 | $0.27 | $0.33 |
| Net realized and unrealized gain (loss) | (0.95) | (2.05) | 6.10 | 1.00 | 0.21 |
| Total from investment operations | $(0.53) | $(1.30) | $6.27 | $1.27 | $0.54 |
| Less distributions declared to shareholders | |||||
| From net investment income | $(0.42) | $(0.76) | $(0.17) | $(0.28) | $(0.34) |
| From net realized gain | (0.48) | (1.02) | (0.64) | (0.71) | (0.81) |
| Total distributions declared to shareholders | $(0.90) | $(1.78) | $(0.81) | $(0.99) | $(1.15) |
| Net asset value, end of period (x) | $21.01 | $22.44 | $25.52 | $20.06 | $19.78 |
| Total return (%) (r)(s)(t)(x) | (2.18) | (5.89) | 31.62 | 6.12 | 3.34 |
| Ratios (%) (to average net assets) and Supplemental data: | |||||
| Expenses before expense reductions (h) | 0.61 | 0.62 | 0.60 | 0.61 | 0.61 |
| Expenses after expense reductions (h) | 0.59 | 0.60 | 0.60 | 0.60 | 0.60 |
| Net investment income (loss) (l) | 1.98 | 2.97 | 0.72 | 1.30 | 1.64 |
| Portfolio turnover | 2 | 11 | 7 | 4 | 3 |
| Net assets at end of period (000 omitted) | $107,528 | $122,694 | $142,619 | $123,459 | $138,541 |
| Year ended | |||||
| Class R3 | 5/31/23 | 5/31/22 | 5/31/21 | 5/31/20 | 5/31/19 |
| Net asset value, beginning of period | $22.83 | $25.93 | $20.37 | $20.08 | $20.69 |
| Income (loss) from investment operations | |||||
| Net investment income (loss) (d)(l) | $0.49 | $0.82 | $0.23 | $0.33 | $0.39 |
| Net realized and unrealized gain (loss) | (0.98) | (2.07) | 6.20 | 1.01 | 0.20 |
| Total from investment operations | $(0.49) | $(1.25) | $6.43 | $1.34 | $0.59 |
| Less distributions declared to shareholders | |||||
| From net investment income | $(0.48) | $(0.83) | $(0.23) | $(0.34) | $(0.39) |
| From net realized gain | (0.48) | (1.02) | (0.64) | (0.71) | (0.81) |
| Total distributions declared to shareholders | $(0.96) | $(1.85) | $(0.87) | $(1.05) | $(1.20) |
| Net asset value, end of period (x) | $21.38 | $22.83 | $25.93 | $20.37 | $20.08 |
| Total return (%) (r)(s)(t)(x) | (1.97) | (5.64) | 31.94 | 6.35 | 3.59 |
| Ratios (%) (to average net assets) and Supplemental data: | |||||
| Expenses before expense reductions (h) | 0.36 | 0.37 | 0.35 | 0.36 | 0.36 |
| Expenses after expense reductions (h) | 0.34 | 0.35 | 0.35 | 0.35 | 0.35 |
| Net investment income (loss) (l) | 2.26 | 3.22 | 0.98 | 1.59 | 1.90 |
| Portfolio turnover | 2 | 11 | 7 | 4 | 3 |
| Net assets at end of period (000 omitted) | $115,250 | $140,484 | $170,541 | $147,888 | $170,299 |
| Year ended | |||||
| Class R4 | 5/31/23 | 5/31/22 | 5/31/21 | 5/31/20 | 5/31/19 |
| Net asset value, beginning of period | $23.05 | $26.17 | $20.55 | $20.24 | $20.86 |
| Income (loss) from investment operations | |||||
| Net investment income (loss) (d)(l) | $0.54 | $0.91 | $0.29 | $0.38 | $0.44 |
| Net realized and unrealized gain (loss) | (0.97) | (2.11) | 6.26 | 1.03 | 0.20 |
| Total from investment operations | $(0.43) | $(1.20) | $6.55 | $1.41 | $0.64 |
| Less distributions declared to shareholders | |||||
| From net investment income | $(0.54) | $(0.90) | $(0.29) | $(0.39) | $(0.45) |
| From net realized gain | (0.48) | (1.02) | (0.64) | (0.71) | (0.81) |
| Total distributions declared to shareholders | $(1.02) | $(1.92) | $(0.93) | $(1.10) | $(1.26) |
| Net asset value, end of period (x) | $21.60 | $23.05 | $26.17 | $20.55 | $20.24 |
| Total return (%) (r)(s)(t)(x) | (1.67) | (5.43) | 32.26 | 6.66 | 3.83 |
| Ratios (%) (to average net assets) and Supplemental data: | |||||
| Expenses before expense reductions (h) | 0.11 | 0.12 | 0.11 | 0.11 | 0.11 |
| Expenses after expense reductions (h) | 0.09 | 0.10 | 0.10 | 0.10 | 0.10 |
| Net investment income (loss) (l) | 2.51 | 3.52 | 1.23 | 1.81 | 2.16 |
| Portfolio turnover | 2 | 11 | 7 | 4 | 3 |
| Net assets at end of period (000 omitted) | $307,903 | $328,631 | $360,879 | $264,076 | $232,530 |
| Year ended | ||
| Class R6 | 5/31/23 | 5/31/22(i) |
| Net asset value, beginning of period | $23.35 | $27.02 |
| Income (loss) from investment operations | ||
| Net investment income (loss) (d)(l) | $0.56 | $0.12 |
| Net realized and unrealized gain (loss) | (0.99) | (1.87) |
| Total from investment operations | $(0.43) | $(1.75) |
| Less distributions declared to shareholders | ||
| From net investment income | $(0.56) | $(0.90) |
| From net realized gain | (0.48) | (1.02) |
| Total distributions declared to shareholders | $(1.04) | $(1.92) |
| Net asset value, end of period (x) | $21.88 | $23.35 |
| Total return (%) (r)(s)(t)(x) | (1.65) | (7.27)(n) |
| Ratios (%) (to average net assets) and Supplemental data: | ||
| Expenses before expense reductions (h) | 0.04 | 0.04(a) |
| Expenses after expense reductions (h) | 0.02 | 0.02(a) |
| Net investment income (loss) (l) | 2.55 | 0.75(a) |
| Portfolio turnover | 2 | 11 |
| Net assets at end of period (000 omitted) | $274,102 | $228,326 |
| (a) | Annualized. |
| (d) | Per share data is based on average shares outstanding. |
| (h) | In addition to the fees and expenses which the fund bears directly, the fund indirectly bears a pro rata share of the fees and expenses of the underlying affiliated funds in which the fund invests. Accordingly, the expense ratio for the fund reflects only those fees and expenses borne directly by the fund. Because the underlying affiliated funds have varied expense and fee levels and the fund may own different proportions of the underlying affiliated funds at different times, the amount of fees and expenses incurred indirectly by the fund will vary. |
| (i) | For Class R6, the period is from the class inception, September 30, 2021, through the stated period end. |
| (l) | The ratios and per share amounts do not include net investment income of the underlying affiliated funds in which the fund invests. |
| (n) | Not annualized. |
| (r) | Certain expenses have been reduced without which performance would have been lower. |
| (s) | From time to time the fund may receive proceeds from litigation settlements, without which performance would be lower. |
| (t) | Total returns do not include any applicable sales charges. |
| (x) | The net asset values and total returns have been calculated on net assets which include adjustments made in accordance with U.S. generally accepted accounting principles required at period end for financial reporting purposes. |
| Year ended | |||||
| Class A | 5/31/23 | 5/31/22 | 5/31/21 | 5/31/20 | 5/31/19 |
| Net asset value, beginning of period | $27.39 | $31.03 | $23.23 | $22.94 | $23.63 |
| Income (loss) from investment operations | |||||
| Net investment income (loss) (d)(l) | $0.44 | $0.92 | $0.14 | $0.28 | $0.34 |
| Net realized and unrealized gain (loss) | (1.02) | (2.46) | 8.66 | 1.18 | 0.16 |
| Total from investment operations | $(0.58) | $(1.54) | $8.80 | $1.46 | $0.50 |
| Less distributions declared to shareholders | |||||
| From net investment income | $(0.45) | $(0.94) | $(0.15) | $(0.29) | $(0.34) |
| From net realized gain | (0.63) | (1.16) | (0.85) | (0.88) | (0.85) |
| Total distributions declared to shareholders | $(1.08) | $(2.10) | $(1.00) | $(1.17) | $(1.19) |
| Net asset value, end of period (x) | $25.73 | $27.39 | $31.03 | $23.23 | $22.94 |
| Total return (%) (r)(s)(t)(x) | (1.95) | (5.78) | 38.35 | 5.97 | 2.82 |
| Ratios (%) (to average net assets) and Supplemental data: | |||||
| Expenses before expense reductions (h) | 0.39 | 0.39 | 0.40 | 0.41 | 0.40 |
| Expenses after expense reductions (h) | 0.38 | 0.38 | 0.38 | 0.38 | 0.38 |
| Net investment income (loss) (l) | 1.71 | 3.02 | 0.50 | 1.18 | 1.47 |
| Portfolio turnover | 4 | 13 | 7 | 6 | 5 |
| Net assets at end of period (000 omitted) | $1,422,920 | $1,424,073 | $1,386,555 | $928,555 | $869,146 |
| Year ended | |||||
| Class B | 5/31/23 | 5/31/22 | 5/31/21 | 5/31/20 | 5/31/19 |
| Net asset value, beginning of period | $26.90 | $30.47 | $22.88 | $22.60 | $23.26 |
| Income (loss) from investment operations | |||||
| Net investment income (loss) (d)(l) | $0.25 | $0.69 | $(0.06) | $0.10 | $0.17 |
| Net realized and unrealized gain (loss) | (1.01) | (2.44) | 8.50 | 1.15 | 0.17 |
| Total from investment operations | $(0.76) | $(1.75) | $8.44 | $1.25 | $0.34 |
| Less distributions declared to shareholders | |||||
| From net investment income | $(0.20) | $(0.66) | $— | $(0.09) | $(0.15) |
| From net realized gain | (0.63) | (1.16) | (0.85) | (0.88) | (0.85) |
| Total distributions declared to shareholders | $(0.83) | $(1.82) | $(0.85) | $(0.97) | $(1.00) |
| Net asset value, end of period (x) | $25.31 | $26.90 | $30.47 | $22.88 | $22.60 |
| Total return (%) (r)(s)(t)(x) | (2.68) | (6.48) | 37.30 | 5.18 | 2.03 |
| Ratios (%) (to average net assets) and Supplemental data: | |||||
| Expenses before expense reductions (h) | 1.14 | 1.14 | 1.15 | 1.16 | 1.15 |
| Expenses after expense reductions (h) | 1.13 | 1.13 | 1.13 | 1.13 | 1.13 |
| Net investment income (loss) (l) | 0.98 | 2.27 | (0.22) | 0.44 | 0.73 |
| Portfolio turnover | 4 | 13 | 7 | 6 | 5 |
| Net assets at end of period (000 omitted) | $19,808 | $27,855 | $40,147 | $41,016 | $52,512 |
| Year ended | |||||
| Class C | 5/31/23 | 5/31/22 | 5/31/21 | 5/31/20 | 5/31/19 |
| Net asset value, beginning of period | $26.51 | $30.09 | $22.61 | $22.36 | $23.02 |
| Income (loss) from investment operations | |||||
| Net investment income (loss) (d)(l) | $0.24 | $0.67 | $(0.05) | $0.09 | $0.16 |
| Net realized and unrealized gain (loss) | (0.99) | (2.39) | 8.38 | 1.15 | 0.18 |
| Total from investment operations | $(0.75) | $(1.72) | $8.33 | $1.24 | $0.34 |
| Less distributions declared to shareholders | |||||
| From net investment income | $(0.25) | $(0.70) | $— | $(0.11) | $(0.15) |
| From net realized gain | (0.63) | (1.16) | (0.85) | (0.88) | (0.85) |
| Total distributions declared to shareholders | $(0.88) | $(1.86) | $(0.85) | $(0.99) | $(1.00) |
| Net asset value, end of period (x) | $24.88 | $26.51 | $30.09 | $22.61 | $22.36 |
| Total return (%) (r)(s)(t)(x) | (2.70) | (6.47) | 37.26 | 5.20 | 2.04 |
| Ratios (%) (to average net assets) and Supplemental data: | |||||
| Expenses before expense reductions (h) | 1.14 | 1.14 | 1.14 | 1.16 | 1.15 |
| Expenses after expense reductions (h) | 1.13 | 1.13 | 1.13 | 1.13 | 1.13 |
| Net investment income (loss) (l) | 0.96 | 2.27 | (0.20) | 0.41 | 0.72 |
| Portfolio turnover | 4 | 13 | 7 | 6 | 5 |
| Net assets at end of period (000 omitted) | $217,393 | $232,876 | $264,940 | $234,144 | $221,719 |
| Year ended | |||||
| Class I | 5/31/23 | 5/31/22 | 5/31/21 | 5/31/20 | 5/31/19 |
| Net asset value, beginning of period | $27.96 | $31.62 | $23.65 | $23.33 | $24.02 |
| Income (loss) from investment operations | |||||
| Net investment income (loss) (d)(l) | $0.51 | $1.00 | $0.22 | $0.35 | $0.39 |
| Net realized and unrealized gain (loss) | (1.05) | (2.48) | 8.80 | 1.20 | 0.17 |
| Total from investment operations | $(0.54) | $(1.48) | $9.02 | $1.55 | $0.56 |
| Less distributions declared to shareholders | |||||
| From net investment income | $(0.51) | $(1.02) | $(0.20) | $(0.35) | $(0.40) |
| From net realized gain | (0.63) | (1.16) | (0.85) | (0.88) | (0.85) |
| Total distributions declared to shareholders | $(1.14) | $(2.18) | $(1.05) | $(1.23) | $(1.25) |
| Net asset value, end of period (x) | $26.28 | $27.96 | $31.62 | $23.65 | $23.33 |
| Total return (%) (r)(s)(t)(x) | (1.74) | (5.52) | 38.67 | 6.24 | 3.05 |
| Ratios (%) (to average net assets) and Supplemental data: | |||||
| Expenses before expense reductions (h) | 0.14 | 0.14 | 0.15 | 0.16 | 0.15 |
| Expenses after expense reductions (h) | 0.13 | 0.13 | 0.13 | 0.13 | 0.13 |
| Net investment income (loss) (l) | 1.95 | 3.22 | 0.78 | 1.46 | 1.67 |
| Portfolio turnover | 4 | 13 | 7 | 6 | 5 |
| Net assets at end of period (000 omitted) | $238,896 | $240,621 | $241,144 | $178,491 | $167,527 |
| Year ended | |||||
| Class R1 | 5/31/23 | 5/31/22 | 5/31/21 | 5/31/20 | 5/31/19 |
| Net asset value, beginning of period | $26.07 | $29.60 | $22.25 | $22.00 | $22.69 |
| Income (loss) from investment operations | |||||
| Net investment income (loss) (d)(l) | $0.27 | $0.69 | $(0.06) | $0.09 | $0.15 |
| Net realized and unrealized gain (loss) | (1.01) | (2.37) | 8.26 | 1.13 | 0.18 |
| Total from investment operations | $(0.74) | $(1.68) | $8.20 | $1.22 | $0.33 |
| Less distributions declared to shareholders | |||||
| From net investment income | $(0.26) | $(0.69) | $— | $(0.09) | $(0.17) |
| From net realized gain | (0.63) | (1.16) | (0.85) | (0.88) | (0.85) |
| Total distributions declared to shareholders | $(0.89) | $(1.85) | $(0.85) | $(0.97) | $(1.02) |
| Net asset value, end of period (x) | $24.44 | $26.07 | $29.60 | $22.25 | $22.00 |
| Total return (%) (r)(s)(t)(x) | (2.70) | (6.46) | 37.28 | 5.21 | 2.03 |
| Ratios (%) (to average net assets) and Supplemental data: | |||||
| Expenses before expense reductions (h) | 1.14 | 1.14 | 1.14 | 1.16 | 1.15 |
| Expenses after expense reductions (h) | 1.13 | 1.13 | 1.13 | 1.13 | 1.13 |
| Net investment income (loss) (l) | 1.12 | 2.34 | (0.24) | 0.40 | 0.69 |
| Portfolio turnover | 4 | 13 | 7 | 6 | 5 |
| Net assets at end of period (000 omitted) | $12,269 | $15,536 | $18,496 | $14,484 | $17,093 |
| Year ended | |||||
| Class R2 | 5/31/23 | 5/31/22 | 5/31/21 | 5/31/20 | 5/31/19 |
| Net asset value, beginning of period | $26.71 | $30.30 | $22.71 | $22.44 | $23.13 |
| Income (loss) from investment operations | |||||
| Net investment income (loss) (d)(l) | $0.36 | $0.83 | $0.07 | $0.21 | $0.28 |
| Net realized and unrealized gain (loss) | (0.99) | (2.40) | 8.44 | 1.16 | 0.16 |
| Total from investment operations | $(0.63) | $(1.57) | $8.51 | $1.37 | $0.44 |
| Less distributions declared to shareholders | |||||
| From net investment income | $(0.37) | $(0.86) | $(0.07) | $(0.22) | $(0.28) |
| From net realized gain | (0.63) | (1.16) | (0.85) | (0.88) | (0.85) |
| Total distributions declared to shareholders | $(1.00) | $(2.02) | $(0.92) | $(1.10) | $(1.13) |
| Net asset value, end of period (x) | $25.08 | $26.71 | $30.30 | $22.71 | $22.44 |
| Total return (%) (r)(s)(t)(x) | (2.19) | (6.01) | 37.93 | 5.73 | 2.56 |
| Ratios (%) (to average net assets) and Supplemental data: | |||||
| Expenses before expense reductions (h) | 0.64 | 0.64 | 0.65 | 0.66 | 0.65 |
| Expenses after expense reductions (h) | 0.63 | 0.63 | 0.63 | 0.63 | 0.63 |
| Net investment income (loss) (l) | 1.45 | 2.76 | 0.27 | 0.91 | 1.23 |
| Portfolio turnover | 4 | 13 | 7 | 6 | 5 |
| Net assets at end of period (000 omitted) | $49,019 | $55,975 | $65,485 | $55,453 | $63,038 |
| Year ended | |||||
| Class R3 | 5/31/23 | 5/31/22 | 5/31/21 | 5/31/20 | 5/31/19 |
| Net asset value, beginning of period | $27.15 | $30.76 | $23.04 | $22.75 | $23.44 |
| Income (loss) from investment operations | |||||
| Net investment income (loss) (d)(l) | $0.44 | $0.91 | $0.15 | $0.29 | $0.34 |
| Net realized and unrealized gain (loss) | (1.02) | (2.43) | 8.56 | 1.17 | 0.15 |
| Total from investment operations | $(0.58) | $(1.52) | $8.71 | $1.46 | $0.49 |
| Less distributions declared to shareholders | |||||
| From net investment income | $(0.44) | $(0.93) | $(0.14) | $(0.29) | $(0.33) |
| From net realized gain | (0.63) | (1.16) | (0.85) | (0.88) | (0.85) |
| Total distributions declared to shareholders | $(1.07) | $(2.09) | $(0.99) | $(1.17) | $(1.18) |
| Net asset value, end of period (x) | $25.50 | $27.15 | $30.76 | $23.04 | $22.75 |
| Total return (%) (r)(s)(t)(x) | (1.98) | (5.75) | 38.28 | 6.00 | 2.78 |
| Ratios (%) (to average net assets) and Supplemental data: | |||||
| Expenses before expense reductions (h) | 0.39 | 0.39 | 0.40 | 0.41 | 0.40 |
| Expenses after expense reductions (h) | 0.38 | 0.38 | 0.38 | 0.38 | 0.38 |
| Net investment income (loss) (l) | 1.71 | 3.00 | 0.54 | 1.20 | 1.48 |
| Portfolio turnover | 4 | 13 | 7 | 6 | 5 |
| Net assets at end of period (000 omitted) | $77,815 | $91,223 | $105,120 | $87,315 | $97,866 |
| Year ended | |||||
| Class R4 | 5/31/23 | 5/31/22 | 5/31/21 | 5/31/20 | 5/31/19 |
| Net asset value, beginning of period | $27.52 | $31.15 | $23.32 | $23.01 | $23.71 |
| Income (loss) from investment operations | |||||
| Net investment income (loss) (d)(l) | $0.52 | $1.02 | $0.21 | $0.34 | $0.39 |
| Net realized and unrealized gain (loss) | (1.05) | (2.47) | 8.67 | 1.20 | 0.16 |
| Total from investment operations | $(0.53) | $(1.45) | $8.88 | $1.54 | $0.55 |
| Less distributions declared to shareholders | |||||
| From net investment income | $(0.51) | $(1.02) | $(0.20) | $(0.35) | $(0.40) |
| From net realized gain | (0.63) | (1.16) | (0.85) | (0.88) | (0.85) |
| Total distributions declared to shareholders | $(1.14) | $(2.18) | $(1.05) | $(1.23) | $(1.25) |
| Net asset value, end of period (x) | $25.85 | $27.52 | $31.15 | $23.32 | $23.01 |
| Total return (%) (r)(s)(t)(x) | (1.73) | (5.51) | 38.61 | 6.29 | 3.05 |
| Ratios (%) (to average net assets) and Supplemental data: | |||||
| Expenses before expense reductions (h) | 0.14 | 0.14 | 0.15 | 0.16 | 0.15 |
| Expenses after expense reductions (h) | 0.13 | 0.13 | 0.13 | 0.13 | 0.13 |
| Net investment income (loss) (l) | 2.00 | 3.31 | 0.77 | 1.44 | 1.69 |
| Portfolio turnover | 4 | 13 | 7 | 6 | 5 |
| Net assets at end of period (000 omitted) | $167,605 | $183,201 | $200,635 | $137,680 | $109,384 |
| Year ended | ||
| Class R6 | 5/31/23 | 5/31/22(i) |
| Net asset value, beginning of period | $27.97 | $32.28 |
| Income (loss) from investment operations | ||
| Net investment income (loss) (d)(l) | $0.53 | $0.01 |
| Net realized and unrealized gain (loss) | (1.04) | (2.12) |
| Total from investment operations | $(0.51) | $(2.11) |
| Less distributions declared to shareholders | ||
| From net investment income | $(0.54) | $(1.04) |
| From net realized gain | (0.63) | (1.16) |
| Total distributions declared to shareholders | $(1.17) | $(2.20) |
| Net asset value, end of period (x) | $26.29 | $27.97 |
| Total return (%) (r)(s)(t)(x) | (1.64) | (7.35)(n) |
| Ratios (%) (to average net assets) and Supplemental data: | ||
| Expenses before expense reductions (h) | 0.05 | 0.08(a) |
| Expenses after expense reductions (h) | 0.04 | 0.05(a) |
| Net investment income (loss) (l) | 2.03 | 0.05(a) |
| Portfolio turnover | 4 | 13 |
| Net assets at end of period (000 omitted) | $214,147 | $186,590 |
| (a) | Annualized. |
| (d) | Per share data is based on average shares outstanding. |
| (h) | In addition to the fees and expenses which the fund bears directly, the fund indirectly bears a pro rata share of the fees and expenses of the underlying affiliated funds in which the fund invests. Accordingly, the expense ratio for the fund reflects only those fees and expenses borne directly by the fund. Because the underlying affiliated funds have varied expense and fee levels and the fund may own different proportions of the underlying affiliated funds at different times, the amount of fees and expenses incurred indirectly by the fund will vary. |
| (i) | For Class R6, the period is from the class inception, September 30, 2021, through the stated period end. |
| (l) | The ratios and per share amounts do not include net investment income of the underlying affiliated funds in which the fund invests. |
| (n) | Not annualized. |
| (r) | Certain expenses have been reduced without which performance would have been lower. |
| (s) | From time to time the fund may receive proceeds from litigation settlements, without which performance would be lower. |
| (t) | Total returns do not include any applicable sales charges. |
| (x) | The net asset values and total returns have been calculated on net assets which include adjustments made in accordance with U.S. generally accepted accounting principles required at period end for financial reporting purposes. |
| Level 1 | Level 2 | Level 3 | Total | |
| MFS Conservative Allocation Fund | ||||
| Financial Instruments | ||||
| Mutual Funds | $3,798,826,459 | $— | $— | $3,798,826,459 |
| MFS Moderate Allocation Fund | ||||
| Financial Instruments | ||||
| Mutual Funds | $6,298,260,743 | $— | $— | $6,298,260,743 |
| MFS Growth Allocation Fund | ||||
| Financial Instruments | ||||
| Mutual Funds | $5,932,658,662 | $— | $— | $5,932,658,662 |
| Level 1 | Level 2 | Level 3 | Total | |
| MFS Aggressive Growth Allocation Fund | ||||
| Financial Instruments | ||||
| Mutual Funds | $2,419,741,848 | $— | $— | $2,419,741,848 |
| Year ended 5/31/23 | MFS Conservative Allocation Fund | MFS Moderate Allocation Fund | MFS Growth Allocation Fund | MFS Aggressive Growth Allocation Fund |
| Ordinary income (including any short-term capital gains) | $100,420,494 | $151,962,285 | $127,003,030 | $40,001,978 |
| Long-term capital gains | 28,872,264 | 100,578,529 | 128,514,380 | 56,899,800 |
| Total distributions | $129,292,758 | $252,540,814 | $255,517,410 | $96,901,778 |
| Year ended 5/31/22 | MFS Conservative Allocation Fund | MFS Moderate Allocation Fund | MFS Growth Allocation Fund | MFS Aggressive Growth Allocation Fund |
| Ordinary income (including any short-term capital gains) | $130,737,104 | $243,876,428 | $237,936,259 | $92,864,812 |
| Long-term capital gains | 33,592,805 | 158,322,310 | 233,327,796 | 83,900,656 |
| Total distributions | $164,329,909 | $402,198,738 | $471,264,055 | $176,765,468 |
| As of 5/31/23 | MFS Conservative Allocation Fund | MFS Moderate Allocation Fund | MFS Growth Allocation Fund | MFS Aggressive Growth Allocation Fund |
| Cost of investments | $3,402,127,754 | $4,991,132,925 | $4,202,884,489 | $1,568,022,522 |
| Gross appreciation | 666,842,748 | 1,761,114,733 | 2,044,636,884 | 934,037,455 |
| Gross depreciation | (270,144,043) | (453,986,915) | (314,862,711) | (82,318,129) |
| Net unrealized appreciation (depreciation) | $396,698,705 | $1,307,127,818 | $1,729,774,173 | $851,719,326 |
| Undistributed ordinary income | 13,179,055 | 15,591,878 | 12,155,672 | — |
| Undistributed long-term capital gain | 26,025,460 | 95,842,059 | 121,179,629 | 58,198,645 |
| Late year ordinary loss deferral | — | — | — | (2,028,837) |
| Total distributable earnings (loss) | $435,903,220 | $1,418,561,755 | $1,863,109,474 | $907,889,134 |
| MFS Conservative Allocation Fund | MFS Moderate Allocation Fund | MFS Growth Allocation Fund | MFS Aggressive Growth Allocation Fund | ||||||||||||
| Year Ended 5/31/23 | Year Ended 5/31/22 (i) | Year Ended 5/31/23 | Year Ended 5/31/22 (i) | Year Ended 5/31/23 | Year Ended 5/31/22 (i) | Year Ended 5/31/23 | Year Ended 5/31/22 (i) | ||||||||
| Class A | $88,233,628 | $103,815,228 | $186,379,749 | $276,567,034 | $183,476,015 | $319,597,176 | $56,847,622 | $98,862,321 | |||||||
| Class B | 551,054 | 1,042,785 | 1,749,757 | 4,499,766 | 1,862,086 | 5,492,859 | 742,226 | 2,062,940 | |||||||
| Class C | 8,532,531 | 13,721,590 | 14,987,202 | 32,006,084 | 15,332,055 | 36,297,415 | 7,536,422 | 15,834,763 | |||||||
| Class I | 15,553,250 | 21,657,438 | 17,474,004 | 28,009,118 | 18,133,070 | 32,588,097 | 10,105,815 | 17,809,105 | |||||||
| Class R1 | 281,997 | 389,398 | 766,632 | 1,381,570 | 664,580 | 1,300,149 | 531,872 | 1,027,487 | |||||||
| Class R2 | 1,407,491 | 1,861,528 | 3,682,781 | 6,454,199 | 4,521,967 | 9,351,146 | 1,955,027 | 4,123,946 | |||||||
| Class R3 | 2,892,075 | 4,011,626 | 6,969,078 | 13,005,624 | 5,398,317 | 11,541,626 | 3,192,361 | 6,811,884 | |||||||
| Class R4 | 9,258,872 | 10,300,331 | 11,422,962 | 18,863,008 | 14,229,181 | 26,880,368 | 7,201,511 | 14,448,809 | |||||||
| Class R6 | 2,581,860 | 15,372 | 9,108,649 | 33,821 | 11,900,139 | 27,228 | 8,788,922 | 5,690 | |||||||
| Class 529A | — | 6,591,833 | — | 18,455,392 | — | 24,828,235 | — | 14,466,884 | |||||||
| Class 529B | — | 102,684 | — | 321,991 | — | 532,633 | — | 120,341 | |||||||
| Class 529C | — | 820,096 | — | 2,601,131 | — | 2,827,123 | — | 1,191,298 | |||||||
| Total | $129,292,758 | $164,329,909 | $252,540,814 | $402,198,738 | $255,517,410 | $471,264,055 | $96,901,778 | $176,765,468 | |||||||
| (i) | For Class R6, the period is from the class inception, September 30, 2021, through the stated period end. |
| MFS Conservative Allocation Fund | MFS Moderate Allocation Fund | MFS Growth Allocation Fund | MFS Aggressive Growth Allocation Fund | |
| Class A | 0.10% | 0.10% | 0.10% | 0.13% |
| Class B | 0.10% | 0.10% | 0.10% | 0.13% |
| Class C | 0.10% | 0.10% | 0.10% | 0.13% |
| Class I | 0.10% | 0.10% | 0.10% | 0.13% |
| Class R1 | 0.10% | 0.10% | 0.10% | 0.13% |
| Class R2 | 0.10% | 0.10% | 0.10% | 0.13% |
| Class R3 | 0.10% | 0.10% | 0.10% | 0.13% |
| Class R4 | 0.10% | 0.10% | 0.10% | 0.13% |
| Class R6 | 0.03% | 0.02% | 0.02% | 0.05% |
| MFS Conservative Allocation Fund | MFS Moderate Allocation Fund | MFS Growth Allocation Fund | MFS Aggressive Growth Allocation Fund |
| $185,659 | $499,160 | $850,487 | $458,223 |
| Class A | |||||
| Distribution Fee Rate (d) | Service Fee Rate (d) | Total Distribution Plan (d) | Annual Effective Rate (e) | Distribution and Service Fee | |
| MFS Conservative Allocation Fund | — | 0.25% | 0.25% | 0.25% | $6,546,560 |
| MFS Moderate Allocation Fund | — | 0.25% | 0.25% | 0.25% | 11,597,218 |
| MFS Growth Allocation Fund | — | 0.25% | 0.25% | 0.25% | 10,502,892 |
| MFS Aggressive Growth Allocation Fund | — | 0.25% | 0.25% | 0.25% | 3,458,731 |
| Class B | |||||
| Distribution Fee Rate (d) | Service Fee Rate (d) | Total Distribution Plan (d) | Annual Effective Rate (e) | Distribution and Service Fee | |
| MFS Conservative Allocation Fund | 0.75% | 0.25% | 1.00% | 1.00% | $219,330 |
| MFS Moderate Allocation Fund | 0.75% | 0.25% | 1.00% | 1.00% | 553,760 |
| MFS Growth Allocation Fund | 0.75% | 0.25% | 1.00% | 1.00% | 564,355 |
| MFS Aggressive Growth Allocation Fund | 0.75% | 0.25% | 1.00% | 1.00% | 232,968 |
| Class C | |||||
| Distribution Fee Rate (d) | Service Fee Rate (d) | Total Distribution Plan (d) | Annual Effective Rate (e) | Distribution and Service Fee | |
| MFS Conservative Allocation Fund | 0.75% | 0.25% | 1.00% | 1.00% | $3,283,216 |
| MFS Moderate Allocation Fund | 0.75% | 0.25% | 1.00% | 1.00% | 4,585,795 |
| MFS Growth Allocation Fund | 0.75% | 0.25% | 1.00% | 1.00% | 4,312,768 |
| MFS Aggressive Growth Allocation Fund | 0.75% | 0.25% | 1.00% | 1.00% | 2,184,731 |
| Class R1 | |||||
| Distribution Fee Rate (d) | Service Fee Rate (d) | Total Distribution Plan (d) | Annual Effective Rate (e) | Distribution and Service Fee | |
| MFS Conservative Allocation Fund | 0.75% | 0.25% | 1.00% | 1.00% | $102,486 |
| MFS Moderate Allocation Fund | 0.75% | 0.25% | 1.00% | 1.00% | 222,750 |
| MFS Growth Allocation Fund | 0.75% | 0.25% | 1.00% | 1.00% | 171,375 |
| MFS Aggressive Growth Allocation Fund | 0.75% | 0.25% | 1.00% | 1.00% | 137,195 |
| Class R2 | |||||
| Distribution Fee Rate (d) | Service Fee Rate (d) | Total Distribution Plan (d) | Annual Effective Rate (e) | Distribution and Service Fee | |
| MFS Conservative Allocation Fund | 0.25% | 0.25% | 0.50% | 0.50% | $217,904 |
| MFS Moderate Allocation Fund | 0.25% | 0.25% | 0.50% | 0.50% | 483,366 |
| MFS Growth Allocation Fund | 0.25% | 0.25% | 0.50% | 0.50% | 553,348 |
| MFS Aggressive Growth Allocation Fund | 0.25% | 0.25% | 0.50% | 0.50% | 255,952 |
| Class R3 | |||||
| Distribution Fee Rate (d) | Service Fee Rate (d) | Total Distribution Plan (d) | Annual Effective Rate (e) | Distribution and Service Fee | |
| MFS Conservative Allocation Fund | — | 0.25% | 0.25% | 0.25% | $212,763 |
| MFS Moderate Allocation Fund | — | 0.25% | 0.25% | 0.25% | 437,895 |
| MFS Growth Allocation Fund | — | 0.25% | 0.25% | 0.25% | 309,178 |
| MFS Aggressive Growth Allocation Fund | — | 0.25% | 0.25% | 0.25% | 203,576 |
| MFS Conservative Allocation Fund | MFS Moderate Allocation Fund | MFS Growth Allocation Fund | MFS Aggressive Growth Allocation Fund | |
| Total Distribution and Service Fees | $10,582,259 | $17,880,784 | $16,413,916 | $6,473,153 |
| (d) | In accordance with the distribution plan for certain classes, each fund pays distribution and/or service fees equal to these annual percentage rates of each class’s average daily net assets. The distribution and service fee rates disclosed by class represent the current rates in effect at the end of the reporting period. Any rate changes, if applicable, are detailed below. |
| (e) | The annual effective rates represent actual fees incurred under the distribution plan for the year ended May 31, 2023 based on each class's average daily net assets. MFD has voluntarily agreed to rebate a portion of each class’s 0.25% service fee attributable to accounts for which there is no financial intermediary specified on the account except for accounts attributable to MFS or its affiliates’ seed money. For the year ended May 31, 2023, these rebates amounted to the following and are included in the reduction of total expenses in the Statements of Operations: |
| MFS Conservative Allocation Fund | MFS Moderate Allocation Fund | MFS Growth Allocation Fund | MFS Aggressive Growth Allocation Fund | |
| Class A | $504 | $1,248 | $2,181 | $623 |
| Class B | 19 | 17 | 17 | 11 |
| Class C | 37 | 63 | 91 | 119 |
| Class R2 | — | 60 | 97 | — |
| CDSC Imposed | MFS Conservative Allocation Fund | MFS Moderate Allocation Fund | MFS Growth Allocation Fund | MFS Aggressive Growth Allocation Fund |
| Class A | $499,394 | $309,814 | $208,995 | $88,126 |
| Class B | 17,433 | 23,562 | 26,080 | 8,258 |
| Class C | 36,703 | 49,293 | 55,641 | 37,948 |
| MFS Conservative Allocation Fund | MFS Moderate Allocation Fund | MFS Growth Allocation Fund | MFS Aggressive Growth Allocation Fund | |
| Expenses paid | $287,626 | $689,935 | $901,191 | $470,432 |
| Annual percentage of average daily net assets | 0.0074% | 0.0109% | 0.0153% | 0.0198% |
| MFS Conservative Allocation Fund | MFS Moderate Allocation Fund | MFS Growth Allocation Fund | MFS Aggressive Growth Allocation Fund |
| $2,549,190 | $4,229,533 | $4,594,656 | $2,188,699 |
| MFS Conservative Allocation Fund | MFS Moderate Allocation Fund | MFS Growth Allocation Fund | MFS Aggressive Growth Allocation Fund | |
| Percentage of average daily net assets | 0.0005% | 0.0003% | 0.0003% | 0.0007% |
| Fund | Class | Shares | Amount |
| MFS Conservative Allocation Fund | Class R6 | 2,697 | $50,000 |
| MFS Moderate Allocation Fund | Class R6 | 2,250 | 50,000 |
| MFS Growth Allocation Fund | Class R6 | 1,850 | 50,000 |
| MFS Aggressive Growth Allocation Fund | Class R6 | 1,549 | 50,000 |
| Fund | Class | Shares | Amount |
| MFS Conservative Allocation Fund | Class R6 | 2,795 | $46,285 |
| MFS Moderate Allocation Fund | Class R6 | 2,375 | 45,909 |
| MFS Growth Allocation Fund | Class R6 | 1,983 | 45,708 |
| MFS Aggressive Growth Allocation Fund | Class R6 | 1,654 | 45,568 |
| MFS Conservative Allocation Fund | MFS Moderate Allocation Fund | MFS Growth Allocation Fund | MFS Aggressive Growth Allocation Fund | |
| Purchases | $146,267,423 | $154,527,537 | $143,802,744 | $105,440,053 |
| Sales | $457,633,081 | $439,134,157 | $289,874,060 | $104,916,040 |
| MFS Conservative Allocation Fund | MFS Moderate Allocation Fund | ||||||||||
| Year ended 5/31/23 | Year ended 5/31/22 (i) | Year ended 5/31/23 | Year ended 5/31/22 (i) | ||||||||
| Shares | Amount | Shares | Amount | Shares | Amount | Shares | Amount | ||||
| Shares sold | |||||||||||
| Class A | 37,597,375 | $ 591,621,421 | 67,679,957 | $ 1,221,314,304 | 46,981,387 | $ 853,255,104 | 64,087,563 | $ 1,359,111,133 | |||
| Class B | 29,659 | 465,128 | 93,027 | 1,665,420 | 33,325 | 597,196 | 36,785 | 762,264 | |||
| Class C | 1,537,381 | 23,804,412 | 4,830,361 | 86,218,196 | 2,701,858 | 47,904,872 | 4,234,381 | 87,982,540 | |||
| Class I | 5,480,882 | 87,200,127 | 11,090,692 | 201,830,274 | 5,448,925 | 99,942,454 | 5,790,239 | 125,696,224 | |||
| Class R1 | 86,648 | 1,311,268 | 126,121 | 2,165,139 | 124,713 | 2,151,471 | 148,640 | 3,003,937 | |||
| Class R2 | 476,567 | 7,261,937 | 802,943 | 13,797,950 | 760,462 | 13,439,800 | 1,100,525 | 22,278,112 | |||
| Class R3 | 718,640 | 11,166,747 | 1,835,554 | 32,616,119 | 1,156,234 | 20,770,328 | 2,001,055 | 41,362,889 | |||
| Class R4 | 6,679,758 | 105,742,649 | 5,579,880 | 98,938,943 | 2,712,963 | 49,113,409 | 3,178,768 | 66,866,175 | |||
| Class R6 | 2,287,454 | 36,331,465 | 4,011,762 | 66,084,891 | 3,366,805 | 62,378,611 | 10,755,093 | 205,732,457 | |||
| Class 529A | — | — | 7,021,015 | 124,154,124 | — | — | 7,030,533 | 145,839,839 | |||
| Class 529B | — | — | 59,317 | 1,058,613 | — | — | 54,771 | 1,158,960 | |||
| Class 529C | — | — | 619,502 | 11,001,161 | — | — | 501,716 | 10,539,056 | |||
| 54,894,364 | $864,905,154 | 103,750,131 | $1,860,845,134 | 63,286,672 | $1,149,553,245 | 98,920,069 | $2,070,333,586 | ||||
| Shares issued to shareholders in reinvestment of distributions | |||||||||||
| Class A | 5,591,735 | $ 85,545,181 | 5,509,883 | $ 100,451,582 | 10,382,941 | $ 181,424,544 | 12,475,152 | $ 268,574,303 | |||
| Class B | 35,638 | 542,514 | 55,157 | 1,004,048 | 99,991 | 1,720,619 | 207,077 | 4,400,978 | |||
| Class C | 545,605 | 8,198,110 | 735,835 | 13,226,348 | 853,001 | 14,535,933 | 1,477,992 | 31,133,054 | |||
| Class I | 870,965 | 13,475,036 | 993,915 | 18,297,574 | 839,629 | 14,931,694 | 1,084,011 | 23,712,133 | |||
| Class R1 | 19,227 | 281,997 | 22,170 | 389,398 | 46,254 | 766,632 | 67,341 | 1,381,570 | |||
| Class R2 | 93,115 | 1,377,208 | 102,661 | 1,813,555 | 215,826 | 3,670,020 | 306,461 | 6,431,465 | |||
| Class R3 | 190,915 | 2,892,033 | 222,035 | 4,011,206 | 402,459 | 6,968,783 | 609,638 | 13,005,624 | |||
| Class R4 | 532,325 | 8,155,247 | 492,350 | 8,976,215 | 521,506 | 9,107,009 | 697,878 | 15,003,351 | |||
| Class R6 | 166,594 | 2,576,426 | 878 | 15,372 | 511,716 | 9,100,067 | 1,640 | 33,821 | |||
| Class 529A | — | — | 353,307 | 6,399,773 | — | — | 846,016 | 18,099,800 | |||
| Class 529B | — | — | 5,727 | 102,348 | — | — | 15,125 | 317,806 | |||
| Class 529C | — | — | 44,437 | 789,847 | — | — | 122,704 | 2,551,571 | |||
| 8,046,119 | $123,043,752 | 8,538,355 | $155,477,266 | 13,873,323 | $242,225,301 | 17,911,035 | $384,645,476 | ||||
| MFS Conservative Allocation Fund − continued | MFS Moderate Allocation Fund − continued | ||||||||||
| Year ended 5/31/23 | Year ended 5/31/22 (i) | Year ended 5/31/23 | Year ended 5/31/22 (i) | ||||||||
| Shares | Amount | Shares | Amount | Shares | Amount | Shares | Amount | ||||
| Shares reacquired | |||||||||||
| Class A | (44,394,576) | $ (696,624,120) | (42,044,231) | $ (749,032,903) | (48,962,398) | $ (886,124,461) | (43,477,163) | $ (912,895,376) | |||
| Class B | (665,501) | (10,389,594) | (981,518) | (17,507,879) | (1,389,235) | (24,811,061) | (2,004,737) | (41,816,299) | |||
| Class C | (7,935,902) | (122,340,446) | (8,473,584) | (148,571,403) | (9,305,377) | (164,439,281) | (11,266,526) | (232,666,725) | |||
| Class I | (11,544,700) | (182,917,659) | (9,942,137) | (174,501,245) | (6,601,580) | (121,440,572) | (5,662,496) | (121,101,541) | |||
| Class R1 | (155,008) | (2,334,046) | (201,826) | (3,392,524) | (314,554) | (5,438,793) | (153,547) | (3,078,840) | |||
| Class R2 | (808,219) | (12,250,995) | (1,007,115) | (17,330,569) | (1,335,256) | (23,436,423) | (1,800,271) | (36,971,719) | |||
| Class R3 | (1,535,471) | (23,986,963) | (2,523,982) | (43,995,048) | (2,788,370) | (49,956,775) | (3,990,332) | (82,425,614) | |||
| Class R4 | (5,632,937) | (88,328,982) | (4,668,604) | (83,521,684) | (4,989,299) | (90,680,459) | (3,940,095) | (82,866,417) | |||
| Class R6 | (1,017,138) | (16,150,032) | (40,640) | (679,766) | (1,789,813) | (33,102,193) | (123,363) | (2,401,071) | |||
| Class 529A | — | — | (17,226,421) | (286,120,415) | — | — | (23,331,934) | (443,822,099) | |||
| Class 529B | — | — | (262,623) | (4,524,684) | — | — | (381,081) | (7,643,019) | |||
| Class 529C | — | — | (2,466,975) | (42,216,507) | — | — | (3,305,962) | (65,455,676) | |||
| (73,689,452) | $(1,155,322,837) | (89,839,656) | $(1,571,394,627) | (77,475,882) | $(1,399,430,018) | (99,437,507) | $(2,033,144,396) | ||||
| Net change | |||||||||||
| Class A | (1,205,466) | $ (19,457,518) | 31,145,609 | $ 572,732,983 | 8,401,930 | $ 148,555,187 | 33,085,552 | $ 714,790,060 | |||
| Class B | (600,204) | (9,381,952) | (833,334) | (14,838,411) | (1,255,919) | (22,493,246) | (1,760,875) | (36,653,057) | |||
| Class C | (5,852,916) | (90,337,924) | (2,907,388) | (49,126,859) | (5,750,518) | (101,998,476) | (5,554,153) | (113,551,131) | |||
| Class I | (5,192,853) | (82,242,496) | 2,142,470 | 45,626,603 | (313,026) | (6,566,424) | 1,211,754 | 28,306,816 | |||
| Class R1 | (49,133) | (740,781) | (53,535) | (837,987) | (143,587) | (2,520,690) | 62,434 | 1,306,667 | |||
| Class R2 | (238,537) | (3,611,850) | (101,511) | (1,719,064) | (358,968) | (6,326,603) | (393,285) | (8,262,142) | |||
| Class R3 | (625,916) | (9,928,183) | (466,393) | (7,367,723) | (1,229,677) | (22,217,664) | (1,379,639) | (28,057,101) | |||
| Class R4 | 1,579,146 | 25,568,914 | 1,403,626 | 24,393,474 | (1,754,830) | (32,460,041) | (63,449) | (996,891) | |||
| Class R6 | 1,436,910 | 22,757,859 | 3,972,000 | 65,420,497 | 2,088,708 | 38,376,485 | 10,633,370 | 203,365,207 | |||
| Class 529A | — | — | (9,852,099) | (155,566,518) | — | — | (15,455,385) | (279,882,460) | |||
| Class 529B | — | — | (197,579) | (3,363,723) | — | — | (311,185) | (6,166,253) | |||
| Class 529C | — | — | (1,803,036) | (30,425,499) | — | — | (2,681,542) | (52,365,049) | |||
| (10,748,969) | $(167,373,931) | 22,448,830 | $444,927,773 | (315,887) | $(7,651,472) | 17,393,597 | $421,834,666 | ||||
| MFS Growth Allocation Fund | MFS Aggressive Growth Allocation Fund | ||||||||||
| Year ended 5/31/23 | Year ended 5/31/22 (i) | Year ended 5/31/23 | Year ended 5/31/22 (i) | ||||||||
| Shares | Amount | Shares | Amount | Shares | Amount | Shares | Amount | ||||
| Shares sold | |||||||||||
| Class A | 30,776,017 | $ 667,959,723 | 42,486,620 | $ 1,089,837,005 | 9,583,393 | $ 246,677,174 | 12,227,052 | $ 371,603,360 | |||
| Class B | 19,129 | 415,795 | 16,966 | 431,802 | 6,872 | 176,142 | 3,830 | 120,168 | |||
| Class C | 2,637,090 | 55,985,350 | 3,167,900 | 79,542,973 | 1,799,519 | 44,779,870 | 2,034,053 | 59,961,959 | |||
| Class I | 4,928,354 | 108,881,252 | 4,398,105 | 114,910,801 | 2,425,302 | 64,360,728 | 2,976,116 | 92,283,196 | |||
| Class R1 | 86,356 | 1,783,131 | 164,341 | 3,928,779 | 63,113 | 1,545,129 | 85,168 | 2,449,701 | |||
| Class R2 | 553,256 | 11,692,751 | 936,936 | 22,514,274 | 326,185 | 8,178,283 | 484,136 | 14,072,406 | |||
| Class R3 | 737,300 | 15,860,568 | 1,400,278 | 35,173,792 | 561,613 | 14,323,497 | 663,636 | 19,830,110 | |||
| Class R4 | 2,341,234 | 50,925,746 | 2,448,459 | 63,516,154 | 1,249,773 | 32,445,981 | 1,342,716 | 41,535,284 | |||
| Class R6 | 3,167,944 | 70,172,433 | 9,810,608 | 221,561,239 | 1,692,782 | 44,823,422 | 6,695,872 | 180,042,173 | |||
| Class 529A | — | — | 5,009,586 | 125,064,969 | — | — | 1,945,476 | 58,222,496 | |||
| Class 529B | — | — | 18,369 | 474,433 | — | — | 919 | 27,627 | |||
| Class 529C | — | — | 238,070 | 6,028,200 | — | — | 70,856 | 2,121,609 | |||
| 45,246,680 | $983,676,749 | 70,096,238 | $1,762,984,421 | 17,708,552 | $457,310,226 | 28,529,830 | $842,270,089 | ||||
| MFS Growth Allocation Fund − continued | MFS Aggressive Growth Allocation Fund − continued | ||||||||||
| Year ended 5/31/23 | Year ended 5/31/22 (i) | Year ended 5/31/23 | Year ended 5/31/22 (i) | ||||||||
| Shares | Amount | Shares | Amount | Shares | Amount | Shares | Amount | ||||
| Shares issued to shareholders in reinvestment of distributions | |||||||||||
| Class A | 8,686,879 | $ 179,731,409 | 12,000,801 | $ 312,260,853 | 2,262,272 | $ 55,493,539 | 3,087,985 | $ 96,345,134 | |||
| Class B | 88,537 | 1,831,836 | 206,595 | 5,361,134 | 30,492 | 737,911 | 66,577 | 2,046,565 | |||
| Class C | 743,117 | 15,100,131 | 1,400,635 | 35,758,201 | 311,415 | 7,411,676 | 511,180 | 15,488,749 | |||
| Class I | 779,825 | 16,321,747 | 1,109,514 | 29,191,324 | 345,963 | 8,659,451 | 470,323 | 14,965,686 | |||
| Class R1 | 33,650 | 664,580 | 52,257 | 1,300,149 | 22,759 | 531,872 | 34,491 | 1,027,487 | |||
| Class R2 | 224,310 | 4,517,610 | 368,587 | 9,343,689 | 81,698 | 1,955,027 | 135,389 | 4,123,946 | |||
| Class R3 | 263,590 | 5,398,317 | 448,045 | 11,541,626 | 131,315 | 3,192,264 | 220,307 | 6,811,884 | |||
| Class R4 | 577,683 | 11,934,922 | 895,617 | 23,277,073 | 261,343 | 6,434,260 | 423,080 | 13,246,638 | |||
| Class R6 | 567,876 | 11,885,645 | 1,035 | 27,227 | 350,424 | 8,771,105 | 179 | 5,690 | |||
| Class 529A | — | — | 952,223 | 24,538,771 | — | — | 463,564 | 14,342,681 | |||
| Class 529B | — | — | 20,809 | 531,680 | — | — | 3,968 | 120,314 | |||
| Class 529C | — | — | 111,480 | 2,800,278 | — | — | 39,442 | 1,173,784 | |||
| 11,965,467 | $247,386,197 | 17,567,598 | $455,932,005 | 3,797,681 | $93,187,105 | 5,456,485 | $169,698,558 | ||||
| Shares reacquired | |||||||||||
| Class A | (31,929,871) | $ (692,353,729) | (28,783,172) | $ (733,349,747) | (8,524,792) | $ (219,554,901) | (8,015,329) | $ (243,001,870) | |||
| Class B | (1,010,053) | (21,767,670) | (1,390,197) | (35,406,190) | (289,995) | (7,321,441) | (352,686) | (10,532,362) | |||
| Class C | (6,361,520) | (134,910,759) | (7,723,646) | (194,063,690) | (2,157,720) | (53,702,027) | (2,566,060) | (75,602,980) | |||
| Class I | (4,519,803) | (99,004,696) | (3,835,578) | (98,174,500) | (2,287,667) | (60,211,165) | (2,466,759) | (73,773,013) | |||
| Class R1 | (165,371) | (3,404,388) | (230,239) | (5,645,494) | (179,786) | (4,408,288) | (148,576) | (4,406,606) | |||
| Class R2 | (1,127,162) | (23,632,097) | (1,425,828) | (35,217,718) | (548,378) | (13,689,392) | (685,380) | (20,121,709) | |||
| Class R3 | (1,765,878) | (38,049,796) | (2,269,886) | (56,210,144) | (1,001,400) | (25,627,319) | (941,107) | (28,192,601) | |||
| Class R4 | (2,917,324) | (63,847,203) | (2,876,306) | (72,971,374) | (1,684,695) | (44,002,875) | (1,548,611) | (46,551,128) | |||
| Class R6 | (990,236) | (21,813,278) | (31,672) | (734,488) | (568,974) | (15,028,370) | (23,945) | (671,629) | |||
| Class 529A | — | — | (19,450,265) | (438,339,175) | — | — | (9,405,661) | (250,775,106) | |||
| Class 529B | — | — | (383,865) | (9,333,936) | — | — | (88,666) | (2,545,589) | |||
| Class 529C | — | — | (2,335,240) | (55,716,364) | — | — | (834,437) | (23,400,312) | |||
| (50,787,218) | $(1,098,783,616) | (70,735,894) | $(1,735,162,820) | (17,243,407) | $(443,545,778) | (27,077,217) | $(779,574,905) | ||||
| Net change | |||||||||||
| Class A | 7,533,025 | $ 155,337,403 | 25,704,249 | $ 668,748,111 | 3,320,873 | $ 82,615,812 | 7,299,708 | $ 224,946,624 | |||
| Class B | (902,387) | (19,520,039) | (1,166,636) | (29,613,254) | (252,631) | (6,407,388) | (282,279) | (8,365,629) | |||
| Class C | (2,981,313) | (63,825,278) | (3,155,111) | (78,762,516) | (46,786) | (1,510,481) | (20,827) | (152,272) | |||
| Class I | 1,188,376 | 26,198,303 | 1,672,041 | 45,927,625 | 483,598 | 12,809,014 | 979,680 | 33,475,869 | |||
| Class R1 | (45,365) | (956,677) | (13,641) | (416,566) | (93,914) | (2,331,287) | (28,917) | (929,418) | |||
| Class R2 | (349,596) | (7,421,736) | (120,305) | (3,359,755) | (140,495) | (3,556,082) | (65,855) | (1,925,357) | |||
| Class R3 | (764,988) | (16,790,911) | (421,563) | (9,494,726) | (308,472) | (8,111,558) | (57,164) | (1,550,607) | |||
| Class R4 | 1,593 | (986,535) | 467,770 | 13,821,853 | (173,579) | (5,122,634) | 217,185 | 8,230,794 | |||
| Class R6 | 2,745,584 | 60,244,800 | 9,779,971 | 220,853,978 | 1,474,232 | 38,566,157 | 6,672,106 | 179,376,234 | |||
| Class 529A | — | — | (13,488,456) | (288,735,435) | — | — | (6,996,621) | (178,209,929) | |||
| Class 529B | — | — | (344,687) | (8,327,823) | — | — | (83,779) | (2,397,648) | |||
| Class 529C | — | — | (1,985,690) | (46,887,886) | — | — | (724,139) | (20,104,919) | |||
| 6,424,929 | $132,279,330 | 16,927,942 | $483,753,606 | 4,262,826 | $106,951,553 | 6,909,098 | $232,393,742 | ||||
| (i) | For Class R6, the period is from the class inception, September 30, 2021, through the stated period end. |
| MFS Conservative Allocation Fund | MFS Moderate Allocation Fund | MFS Growth Allocation Fund | MFS Aggressive Growth Allocation Fund | |
| Commitment Fee | $20,500 | $32,464 | $30,744 | $12,333 |
| Interest Expense | — | — | — | — |
| MFS Conservative Allocation Fund | ||||||
| Affiliated Issuers | Beginning Value | Purchases | Sales Proceeds | Realized Gain (Loss) | Change in Unrealized Appreciation or Depreciation | Ending Value |
| MFS Commodity Strategy Fund | $83,079,130 | $31,236,273 | $3,876,721 | $(320,720) | $(37,614,916) | $72,503,046 |
| MFS Emerging Markets Debt Fund | 83,643,879 | 8,237,242 | 9,228,363 | (2,523,389) | (3,860,865) | 76,268,504 |
| MFS Emerging Markets Debt Local Currency Fund | 83,343,589 | 3,650,895 | 13,432,150 | (3,814,681) | 6,031,981 | 75,779,634 |
| MFS Global Opportunistic Bond Fund | 287,935,623 | 12,168,323 | 27,778,828 | (5,486,384) | (15,503) | 266,823,231 |
| MFS Global Real Estate Fund | 84,318,651 | 12,252,517 | 5,969,139 | (793,683) | (15,917,625) | 73,890,721 |
| MFS Government Securities Fund | 409,673,533 | 26,082,910 | 34,116,103 | (6,066,169) | (14,188,446) | 381,385,725 |
| MFS Growth Fund | 247,247,275 | 9,329,686 | 36,542,847 | (5,817,570) | 17,029,789 | 231,246,333 |
| MFS High Income Fund | 169,119,202 | 13,063,677 | 21,335,917 | (3,740,707) | (4,581,976) | 152,524,279 |
| MFS Inflation-Adjusted Bond Fund | 410,899,456 | 42,911,379 | 31,155,073 | (5,741,479) | (38,041,574) | 378,872,709 |
| MFS Institutional Money Market Portfolio | 7,733,465 | 249,838,087 | 245,152,844 | 18,807 | (1,147) | 12,436,368 |
| MFS International Growth Fund | 63,110,627 | 2,442,315 | 11,662,759 | 887,827 | 1,019,073 | 55,837,083 |
| MFS International Intrinsic Value Fund | 62,794,817 | 8,399,725 | 9,974,159 | (2,000,099) | (3,237,596) | 55,982,688 |
| MFS International Large Cap Value Fund | 63,383,869 | 3,556,793 | 11,291,962 | (1,587,192) | 1,421,388 | 55,482,896 |
| MFS Limited Maturity Fund | 411,792,685 | 27,820,703 | 51,635,319 | (3,962,543) | (2,653,759) | 381,361,767 |
| MFS Mid Cap Growth Fund | 165,518,903 | 2,381,019 | 19,233,588 | (4,629,921) | 7,861,208 | 151,897,621 |
| MFS Mid Cap Value Fund | 171,691,951 | 14,568,549 | 19,856,894 | 2,235,564 | (20,424,249) | 148,214,921 |
| MFS New Discovery Fund | 41,090,110 | 1,722,106 | 4,532,641 | (2,518,591) | 1,376,124 | 37,137,108 |
| MFS New Discovery Value Fund | 42,809,500 | 6,162,883 | 5,708,524 | (485,141) | (6,109,162) | 36,669,556 |
| MFS Research Fund | 256,826,968 | 18,083,323 | 33,715,161 | (3,530,028) | (9,366,315) | 228,298,787 |
| MFS Research International Fund | 147,472,537 | 6,414,553 | 23,593,271 | 2,177,276 | (2,696,585) | 129,774,510 |
| MFS Total Return Bond Fund | 619,252,579 | 40,124,999 | 51,565,873 | (11,301,664) | (23,420,822) | 573,089,219 |
| MFS Value Fund | 255,701,666 | 24,819,737 | 31,467,789 | 4,444,991 | (30,148,852) | 223,349,753 |
| $4,168,440,015 | $565,267,694 | $702,825,925 | $(54,555,496) | $(177,539,829) | $3,798,826,459 | |
| MFS Conservative Allocation Fund - continued | ||
| Affiliated Issuers | Dividend Income | Capital Gain Distributions |
| MFS Commodity Strategy Fund | $15,785,530 | $— |
| MFS Emerging Markets Debt Fund | 5,491,032 | — |
| MFS Emerging Markets Debt Local Currency Fund | 823,697 | — |
| MFS Global Opportunistic Bond Fund | 610,579 | 4,993,098 |
| MFS Global Real Estate Fund | 499,383 | 3,848,283 |
| MFS Government Securities Fund | 9,801,225 | — |
| MFS Growth Fund | — | 2,276,823 |
| MFS High Income Fund | 9,075,509 | — |
| MFS Inflation-Adjusted Bond Fund | 25,486,449 | — |
| MFS Institutional Money Market Portfolio | 360,778 | — |
| MFS International Growth Fund | 698,912 | 1,024,204 |
| MFS International Intrinsic Value Fund | 654,199 | 6,894,032 |
| MFS International Large Cap Value Fund | 1,089,026 | 595,085 |
| MFS Limited Maturity Fund | 10,795,165 | — |
| MFS Mid Cap Growth Fund | — | — |
| MFS Mid Cap Value Fund | 2,810,081 | 4,984,817 |
| MFS New Discovery Fund | 33,366 | — |
| MFS New Discovery Value Fund | 1,054,649 | 2,012,460 |
| MFS Research Fund | 2,296,642 | 14,263,802 |
| MFS Research International Fund | 2,381,329 | — |
| MFS Total Return Bond Fund | 22,053,916 | — |
| MFS Value Fund | 4,751,427 | 12,077,461 |
| $116,552,894 | $52,970,065 | |
| MFS Moderate Allocation Fund | ||||||
| Affiliated Issuers | Beginning Value | Purchases | Sales Proceeds | Realized Gain (Loss) | Change in Unrealized Appreciation or Depreciation | Ending Value |
| MFS Commodity Strategy Fund | $210,700,131 | $57,009,057 | $6,981,245 | $(387,882) | $(92,449,169) | $167,890,892 |
| MFS Emerging Markets Debt Fund | 200,428,491 | 17,351,569 | 12,290,446 | (3,816,472) | (11,517,331) | 190,155,811 |
| MFS Emerging Markets Debt Local Currency Fund | 133,760,968 | 3,673,046 | 13,633,008 | (4,121,972) | 7,971,738 | 127,650,772 |
| MFS Emerging Markets Equity Fund | 66,622,912 | 5,263,758 | 6,411,676 | (2,637,839) | (44,046) | 62,793,109 |
| MFS Global Opportunistic Bond Fund | 330,921,434 | 10,049,811 | 17,774,243 | (3,136,163) | (3,183,968) | 316,876,871 |
| MFS Global Real Estate Fund | 203,024,043 | 28,343,311 | 7,817,310 | (628,847) | (40,131,614) | 182,789,583 |
| MFS Government Securities Fund | 660,526,138 | 29,880,658 | 26,220,179 | (4,616,089) | (28,312,353) | 631,258,175 |
| MFS Growth Fund | 514,962,048 | 27,764,874 | 33,838,640 | (5,545,123) | 31,950,216 | 535,293,375 |
| MFS High Income Fund | 271,874,741 | 15,625,522 | 18,715,831 | (3,878,106) | (9,612,123) | 255,294,203 |
| MFS Inflation-Adjusted Bond Fund | 464,531,396 | 40,486,621 | 16,650,878 | (2,784,458) | (47,057,680) | 438,525,001 |
| MFS Institutional Money Market Portfolio | 5,161,027 | 173,706,924 | 171,562,348 | (3,485) | (695) | 7,301,423 |
| MFS International Growth Fund | 134,460,460 | 4,796,665 | 17,068,531 | (1,944,510) | 6,496,256 | 126,740,340 |
| MFS International Intrinsic Value Fund | 131,563,973 | 21,184,009 | 14,697,848 | (4,781,240) | (6,417,861) | 126,851,033 |
| MFS International Large Cap Value Fund | 136,048,402 | 8,187,938 | 19,233,175 | (2,435,330) | 2,607,754 | 125,175,589 |
| MFS International New Discovery Fund | 66,744,542 | 5,860,004 | 6,821,182 | (1,945,849) | (1,049,645) | 62,787,870 |
| MFS Mid Cap Growth Fund | 450,283,906 | 6,259,460 | 19,009,752 | (4,961,942) | 14,050,179 | 446,621,851 |
| MFS Mid Cap Value Fund | 485,841,457 | 28,509,125 | 37,861,920 | 13,594,154 | (66,517,732) | 423,565,084 |
| MFS New Discovery Fund | 95,346,143 | 3,250,050 | 4,041,443 | (2,517,436) | (367,007) | 91,670,307 |
| MFS New Discovery Value Fund | 103,507,549 | 9,330,204 | 8,315,142 | (335,486) | (16,004,714) | 88,182,411 |
| MFS Research Fund | 548,401,577 | 37,887,999 | 41,476,478 | (4,516,585) | (24,055,583) | 516,240,930 |
| MFS Research International Fund | 336,749,493 | 17,970,317 | 40,353,110 | 953,799 | (895,844) | 314,424,655 |
| MFS Total Return Bond Fund | 597,146,048 | 30,198,725 | 22,523,034 | (4,892,156) | (28,743,172) | 571,186,411 |
| MFS Value Fund | 551,193,371 | 42,038,179 | 47,399,081 | 14,322,300 | (71,169,722) | 488,985,047 |
| $6,699,800,250 | $624,627,826 | $610,696,500 | $(31,016,717) | $(384,454,116) | $6,298,260,743 | |
| MFS Moderate Allocation Fund - continued | ||
| Affiliated Issuers | Dividend Income | Capital Gain Distributions |
| MFS Commodity Strategy Fund | $38,507,046 | $— |
| MFS Emerging Markets Debt Fund | 13,578,515 | — |
| MFS Emerging Markets Debt Local Currency Fund | 1,464,679 | — |
| MFS Emerging Markets Equity Fund | 875,167 | — |
| MFS Global Opportunistic Bond Fund | 798,370 | 5,851,386 |
| MFS Global Real Estate Fund | 1,240,375 | 9,558,415 |
| MFS Government Securities Fund | 15,986,444 | — |
| MFS Growth Fund | — | 4,975,809 |
| MFS High Income Fund | 14,909,549 | — |
| MFS Inflation-Adjusted Bond Fund | 29,029,032 | — |
| MFS Institutional Money Market Portfolio | 201,230 | — |
| MFS International Growth Fund | 1,564,128 | 2,292,112 |
| MFS International Intrinsic Value Fund | 1,454,213 | 15,324,686 |
| MFS International Large Cap Value Fund | 2,447,814 | 1,337,576 |
| MFS International New Discovery Fund | 570,083 | 3,061,984 |
| MFS Mid Cap Growth Fund | — | — |
| MFS Mid Cap Value Fund | 8,188,025 | 14,524,780 |
| MFS New Discovery Fund | 82,349 | — |
| MFS New Discovery Value Fund | 2,597,557 | 4,972,208 |
| MFS Research Fund | 5,057,847 | 31,412,864 |
| MFS Research International Fund | 5,702,957 | — |
| MFS Total Return Bond Fund | 21,636,945 | — |
| MFS Value Fund | 10,443,813 | 26,946,641 |
| $176,336,138 | $120,258,461 | |
| MFS Growth Allocation Fund | ||||||
| Affiliated Issuers | Beginning Value | Purchases | Sales Proceeds | Realized Gain (Loss) | Change in Unrealized Appreciation or Depreciation | Ending Value |
| MFS Commodity Strategy Fund | $271,870,893 | $65,677,701 | $9,717,963 | $(589,858) | $(116,185,933) | $211,054,840 |
| MFS Emerging Markets Debt Fund | 183,237,446 | 16,588,782 | 6,482,160 | (2,117,341) | (12,051,919) | 179,174,808 |
| MFS Emerging Markets Debt Local Currency Fund | 122,656,283 | 3,634,303 | 9,059,381 | (2,639,767) | 6,320,616 | 120,912,054 |
| MFS Emerging Markets Equity Fund | 120,509,064 | 7,816,035 | 4,902,240 | (1,816,473) | (3,232,823) | 118,373,563 |
| MFS Global Opportunistic Bond Fund | 182,689,616 | 6,960,680 | 6,721,172 | (1,194,597) | (2,272,053) | 179,462,474 |
| MFS Global Real Estate Fund | 248,747,533 | 25,715,564 | 97,727 | 1,189 | (50,270,749) | 224,095,810 |
| MFS Growth Fund | 587,441,178 | 34,095,203 | 19,268,950 | (3,363,627) | 34,318,470 | 633,222,274 |
| MFS High Income Fund | 250,545,543 | 15,365,060 | 12,469,973 | (2,612,079) | (9,679,573) | 241,148,978 |
| MFS Inflation-Adjusted Bond Fund | 306,605,869 | 29,182,556 | 7,719,611 | (1,231,668) | (31,741,244) | 295,095,902 |
| MFS Institutional Money Market Portfolio | 9,163,193 | 162,938,901 | 162,058,847 | (68) | (633) | 10,042,546 |
| MFS International Growth Fund | 184,773,980 | 7,160,723 | 17,851,182 | (1,625,066) | 8,108,169 | 180,566,624 |
| MFS International Intrinsic Value Fund | 179,999,861 | 28,843,366 | 13,166,810 | (4,563,462) | (10,807,346) | 180,305,609 |
| MFS International Large Cap Value Fund | 188,054,381 | 8,977,954 | 19,303,804 | (2,226,225) | 2,446,833 | 177,949,139 |
| MFS International New Discovery Fund | 121,814,970 | 9,643,147 | 7,081,495 | (2,227,085) | (3,312,248) | 118,837,289 |
| MFS Mid Cap Growth Fund | 523,762,248 | 13,370,935 | 7,508,003 | (2,047,626) | 13,068,590 | 540,646,144 |
| MFS Mid Cap Value Fund | 577,903,960 | 31,402,495 | 33,369,684 | 8,603,759 | (72,100,079) | 512,440,451 |
| MFS New Discovery Fund | 113,656,895 | 6,124,755 | 1,976,289 | (1,289,182) | (2,270,591) | 114,245,588 |
| MFS New Discovery Value Fund | 127,317,535 | 10,660,865 | 7,450,203 | (122,706) | (20,139,027) | 110,266,464 |
| MFS Research Fund | 627,776,569 | 43,496,050 | 27,065,598 | (4,928,593) | (27,967,311) | 611,311,117 |
| MFS Research International Fund | 431,585,030 | 17,200,035 | 31,575,804 | (4,117,215) | 3,906,749 | 416,998,795 |
| MFS Total Return Bond Fund | 182,878,819 | 11,109,651 | 4,284,818 | (938,971) | (9,415,276) | 179,349,405 |
| MFS Value Fund | 637,635,658 | 48,590,990 | 42,801,194 | 12,523,682 | (78,790,348) | 577,158,788 |
| $6,180,626,524 | $604,555,751 | $451,932,908 | $(18,522,979) | $(382,067,726) | $5,932,658,662 | |
| Affiliated Issuers | Dividend Income | Capital Gain Distributions |
| MFS Commodity Strategy Fund | $47,813,143 | $— |
| MFS Emerging Markets Debt Fund | 12,617,016 | — |
| MFS Emerging Markets Debt Local Currency Fund | 1,443,694 | — |
| MFS Emerging Markets Equity Fund | 1,577,847 | — |
| MFS Global Opportunistic Bond Fund | 490,875 | 3,300,713 |
| MFS Global Real Estate Fund | 1,456,077 | 11,220,628 |
| MFS Growth Fund | — | 5,651,049 |
| MFS High Income Fund | 14,000,634 | — |
| MFS Inflation-Adjusted Bond Fund | 19,248,910 | — |
| MFS Institutional Money Market Portfolio | 314,669 | — |
| MFS International Growth Fund | 2,181,615 | 3,196,992 |
| MFS International Intrinsic Value Fund | 2,008,272 | 21,163,419 |
| MFS International Large Cap Value Fund | 3,402,073 | 1,859,019 |
| MFS International New Discovery Fund | 1,044,008 | 5,607,490 |
| MFS Mid Cap Growth Fund | — | — |
| MFS Mid Cap Value Fund | 9,969,602 | 17,685,129 |
| MFS New Discovery Fund | 101,039 | — |
| MFS New Discovery Value Fund | 3,224,507 | 6,185,150 |
| MFS Research Fund | 5,956,802 | 36,996,026 |
| MFS Research International Fund | 7,315,973 | — |
| MFS Total Return Bond Fund | 6,728,827 | — |
| MFS Value Fund | 12,247,910 | 32,119,666 |
| $153,143,493 | $144,985,281 | |
| MFS Aggressive Growth Allocation Fund | ||||||
| Affiliated Issuers | Beginning Value | Purchases | Sales Proceeds | Realized Gain (Loss) | Change in Unrealized Appreciation or Depreciation | Ending Value |
| MFS Commodity Strategy Fund | $128,366,427 | $42,913,904 | $4,261,377 | $(120,977) | $(57,849,990) | $109,047,987 |
| MFS Emerging Markets Equity Fund | 74,019,796 | 5,768,320 | 4,256,423 | (1,571,535) | (1,500,293) | 72,459,865 |
| MFS Global Real Estate Fund | 122,877,985 | 18,788,043 | 281,622 | (44,247) | (25,117,099) | 116,223,060 |
| MFS Growth Fund | 285,251,490 | 21,711,444 | 9,879,213 | (2,175,248) | 18,185,979 | 313,094,452 |
| MFS Institutional Money Market Portfolio | 3,096,144 | 80,480,020 | 80,570,363 | (3,155) | (208) | 3,002,438 |
| MFS International Growth Fund | 122,862,802 | 6,082,366 | 9,752,756 | (1,200,690) | 5,495,825 | 123,487,547 |
| MFS International Intrinsic Value Fund | 121,197,148 | 20,589,006 | 8,128,415 | (2,968,117) | (7,468,674) | 123,220,948 |
| MFS International Large Cap Value Fund | 123,538,274 | 8,914,162 | 11,528,027 | (1,396,885) | 1,719,164 | 121,246,688 |
| MFS International New Discovery Fund | 97,747,463 | 8,863,135 | 5,012,093 | (1,708,979) | (2,778,776) | 97,110,750 |
| MFS Mid Cap Growth Fund | 237,643,119 | 6,232,968 | 4,789,970 | (1,393,907) | 6,386,749 | 244,078,959 |
| MFS Mid Cap Value Fund | 250,933,890 | 17,399,630 | 7,882,111 | 1,392,271 | (29,505,050) | 232,338,630 |
| MFS New Discovery Fund | 59,162,678 | 2,897,152 | 1,796,586 | (1,214,485) | (587,531) | 58,461,228 |
| MFS New Discovery Value Fund | 62,354,074 | 6,761,202 | 2,403,919 | (251,431) | (9,843,270) | 56,616,656 |
| MFS Research Fund | 272,828,655 | 23,267,157 | 8,891,126 | (1,652,213) | (12,454,364) | 273,098,109 |
| MFS Research International Fund | 196,713,758 | 11,324,127 | 12,924,979 | (2,108,101) | 2,131,259 | 195,136,064 |
| MFS Value Fund | 299,536,142 | 26,548,280 | 13,127,425 | 2,128,510 | (33,967,040) | 281,118,467 |
| $2,458,129,845 | $308,540,916 | $185,486,405 | $(14,289,189) | $(147,153,319) | $2,419,741,848 | |
| Affiliated Issuers | Dividend Income | Capital Gain Distributions |
| MFS Commodity Strategy Fund | $23,983,905 | $— |
| MFS Emerging Markets Equity Fund | 972,585 | — |
| MFS Global Real Estate Fund | 749,445 | 5,775,274 |
| MFS Growth Fund | — | 2,751,812 |
| MFS Institutional Money Market Portfolio | 83,755 | — |
| MFS International Growth Fund | 1,464,464 | 2,146,062 |
| MFS International Intrinsic Value Fund | 1,360,670 | 14,338,911 |
| MFS International Large Cap Value Fund | 2,295,376 | 1,254,279 |
| MFS International New Discovery Fund | 846,240 | 4,545,258 |
| MFS Mid Cap Growth Fund | — | — |
| MFS Mid Cap Value Fund | 4,401,860 | 7,808,482 |
| MFS New Discovery Fund | 51,063 | — |
| MFS New Discovery Value Fund | 1,592,878 | 3,060,333 |
| MFS Research Fund | 2,592,341 | 16,100,300 |
| MFS Research International Fund | 3,394,293 | — |
| MFS Value Fund | 5,821,840 | 15,313,170 |
| $49,610,715 | $73,093,881 | |
MFS Aggressive Growth Allocation Fund and the Board of Trustees of MFS Series Trust X

July 14, 2023
| Name, Age | Position(s) Held with Fund | Trustee/Officer Since(h) | Number of MFS Funds overseen by the Trustee | Principal Occupations During the Past Five Years | Other Directorships During the Past Five Years (j) | |||||
| INTERESTED TRUSTEE | ||||||||||
| Michael W. Roberge (k) (age 56) | Trustee | January 2021 | 136 | Massachusetts Financial Services Company, Chairman (since January 2021); Chief Executive Officer (since January 2017); Director; Chairman of the Board (since January 2022); President (until December 2018); Chief Investment Officer (until December 2018) | N/A | |||||
| INDEPENDENT TRUSTEES | ||||||||||
| John P. Kavanaugh (age 68) | Trustee and Chair of Trustees | January 2009 | 136 | Private investor | N/A | |||||
| Steven E. Buller (age 71) | Trustee | February 2014 | 136 | Private investor | N/A | |||||
| John A. Caroselli (age 69) | Trustee | March 2017 | 136 | Private investor; JC Global Advisors, LLC (management consulting), President (since 2015) | N/A | |||||
| Maureen R. Goldfarb (age 68) | Trustee | January 2009 | 136 | Private investor | N/A | |||||
| Peter D. Jones (age 67) | Trustee | January 2019 | 136 | Private investor | N/A | |||||
| James W. Kilman, Jr. (age 62) | Trustee | January 2019 | 136 | Burford Capital Limited (finance and investment management), Senior Advisor (since May 3, 2021), Chief Financial Officer (2019 - May 2, 2021); KielStrand Capital LLC (family office), Chief Executive Officer (since 2016) | Alpha-En Corporation, Director (2016-2019) | |||||
| Clarence Otis, Jr. (age 67) | Trustee | March 2017 | 136 | Private investor | VF Corporation, Director; Verizon Communications, Inc., Director; The Travelers Companies, Director | |||||
| Maryanne L. Roepke (age 67) | Trustee | May 2014 | 136 | Private investor | N/A | |||||
| Laurie J. Thomsen (age 65) | Trustee | March 2005 | 136 | Private investor | The Travelers Companies, Director; Dycom Industries, Inc., Director |
| Name, Age | Position(s) Held with Fund | Trustee/Officer Since(h) | Number of MFS Funds for which the Person is an Officer | Principal Occupations During the Past Five Years | ||||
| OFFICERS | ||||||||
| Christopher R. Bohane (k) (age 49) | Assistant Secretary and Assistant Clerk | July 2005 | 136 | Massachusetts Financial Services Company, Senior Vice President and Senior Managing Counsel |
| Name, Age | Position(s) Held with Fund | Trustee/Officer Since(h) | Number of MFS Funds for which the Person is an Officer | Principal Occupations During the Past Five Years | ||||
| Kino Clark (k) (age 55) | Assistant Treasurer | January 2012 | 136 | Massachusetts Financial Services Company, Vice President | ||||
| John W. Clark, Jr. (k) (age 56) | Assistant Treasurer | April 2017 | 136 | Massachusetts Financial Services Company, Vice President | ||||
| David L. DiLorenzo (k) (age 54) | President | July 2005 | 136 | Massachusetts Financial Services Company, Senior Vice President | ||||
| Heidi W. Hardin (k) (age 55) | Secretary and Clerk | April 2017 | 136 | Massachusetts Financial Services Company, Executive Vice President and General Counsel | ||||
| Brian E. Langenfeld (k) (age 50) | Assistant Secretary and Assistant Clerk | June 2006 | 136 | Massachusetts Financial Services Company, Vice President and Managing Counsel | ||||
| Rosa E. Licea-Mailloux (k) (age 46) | Chief Compliance Officer | March 2022 | 136 | Massachusetts Financial Services Company, Vice President (since 2018); Director of Corporate Compliance (2018-2021), Senior Director Compliance (2021-2022), Senior Managing Director of North American Compliance & Chief Compliance Officer (since March 2022); Natixis Investment Managers (investment management), Funds Chief Compliance Officer, Deputy General Counsel & Senior Vice President (until 2018) | ||||
| Amanda S. Mooradian (k) (age 44) | Assistant Secretary and Assistant Clerk | September 2018 | 136 | Massachusetts Financial Services Company, Assistant Vice President and Senior Counsel | ||||
| Susan A. Pereira (k) (age 52) | Assistant Secretary and Assistant Clerk | July 2005 | 136 | Massachusetts Financial Services Company, Vice President and Managing Counsel | ||||
| Kasey L. Phillips (k) (age 52) | Assistant Treasurer | September 2012 | 136 | Massachusetts Financial Services Company, Vice President | ||||
| Matthew A. Stowe (k) (age 48) | Assistant Secretary and Assistant Clerk | October 2014 | 136 | Massachusetts Financial Services Company, Vice President and Senior Managing Counsel | ||||
| William B. Wilson (k) (age 40) | Assistant Secretary and Assistant Clerk | October 2022 | 136 | Massachusetts Financial Services Company, Assistant Vice President and Senior Counsel | ||||
| James O. Yost (k) (age 63) | Treasurer | September 1990 | 136 | Massachusetts Financial Services Company, Senior Vice President |
| (h) | Date first appointed to serve as Trustee/Officer of an MFS Fund. Each Trustee has served continuously since appointment unless indicated otherwise. From January 2012 through December 2016, Messrs. DiLorenzo and Yost served as Treasurer and Deputy Treasurer of the Funds, respectively. |
| (j) | Directorships or trusteeships of companies required to report to the Securities and Exchange Commission (i.e., “public companies”). |
| (k) | “Interested person” of the Trust within the meaning of the Investment Company Act of 1940 (referred to as the 1940 Act), which is the principal federal law governing investment companies like the fund, as a result of a position with MFS. The address of MFS is 111 Huntington Avenue, Boston, Massachusetts 02199-7618. |
| Investment Adviser | Custodian |
| Massachusetts Financial Services Company 111 Huntington Avenue Boston, MA 02199-7618 | State Street Bank and Trust Company 1 Congress Street, Suite 1 Boston, MA 02114-2016 |
| Distributor | Independent Registered Public Accounting Firm |
| MFS Fund Distributors, Inc. 111 Huntington Avenue Boston, MA 02199-7618 | Ernst & Young LLP 200 Clarendon Street Boston, MA 02116 |
| Portfolio Manager(s) | |
| Joseph Flaherty Natalie Shapiro |
| Capital Gains | |
| MFS Conservative Allocation Fund | $34,000,000 |
| MFS Moderate Allocation Fund | 121,121,000 |
| MFS Growth Allocation Fund | 154,194,000 |
| MFS Aggressive Growth Allocation Fund | 68,112,000 |
| Dividends Received Deductions | |
| MFS Conservative Allocation Fund | 10.57% |
| MFS Moderate Allocation Fund | 16.31% |
| MFS Growth Allocation Fund | 21.63% |
| MFS Aggressive Growth Allocation Fund | 29.85% |
| FACTS | WHAT DOES MFS DO WITH YOUR PERSONAL INFORMATION? |
| Why? | Financial companies choose how they share your personal information. Federal law gives consumers the right to limit some but not all sharing. Federal law also requires us to tell you how we collect, share, and protect your personal information. Please read this notice carefully to understand what we do. |
| What? | The types of personal information we collect and share depend on the product or service you have with us. This information can include: |
| • Social Security number and account balances | |
| • Account transactions and transaction history | |
| • Checking account information and wire transfer instructions | |
| When you are no longer our customer, we continue to share your information as described in this notice. |
| How? | All financial companies need to share customers' personal information to run their everyday business. In the section below, we list the reasons financial companies can share their customers' personal information; the reasons MFS chooses to share; and whether you can limit this sharing. |
| Reasons we can share your personal information | Does MFS share? | Can you limit this sharing? |
| For our everyday business purposes – such as to process your transactions, maintain your account(s), respond to court orders and legal investigations, or report to credit bureaus | Yes | No |
| For our marketing purposes – to offer our products and services to you | No | We don't share |
| For joint marketing with other financial companies | No | We don't share |
| For our affiliates' everyday business purposes – information about your transactions and experiences | No | We don't share |
| For our affiliates' everyday business purposes – information about your creditworthiness | No | We don't share |
| For nonaffiliates to market to you | No | We don't share |
| Questions? | Call 800-225-2606 or go to mfs.com. |

| Who we are | |
| Who is providing this notice? | MFS Funds, MFS Investment Management, MFS Institutional Advisors, Inc., and MFS Heritage Trust Company. |
| What we do | |
| How does MFS protect my personal information? | To protect your personal information from unauthorized access and use, we use security measures that comply with federal law. These measures include procedural, electronic, and physical safeguards for the protection of the personal information we collect about you. |
| How does MFS collect my personal information? | We collect your personal information, for example, when you |
| • open an account or provide account information | |
| • direct us to buy securities or direct us to sell your securities | |
| • make a wire transfer | |
| We also collect your personal information from others, such as credit bureaus, affiliates, or other companies. | |
| Why can't I limit all sharing? | Federal law gives you the right to limit only |
| • sharing for affiliates' everyday business purposes – information about your creditworthiness | |
| • affiliates from using your information to market to you | |
| • sharing for nonaffiliates to market to you | |
| State laws and individual companies may give you additional rights to limit sharing. | |
| Definitions | |
| Affiliates | Companies related by common ownership or control. They can be financial and nonfinancial companies. |
| • MFS does not share personal information with affiliates, except for everyday business purposes as described on page one of this notice. | |
| Nonaffiliates | Companies not related by common ownership or control. They can be financial and nonfinancial companies. |
| • MFS does not share with nonaffiliates so they can market to you. | |
| Joint marketing | A formal agreement between nonaffiliated financial companies that together market financial products or services to you. |
| • MFS doesn't jointly market. | |
| Other important information |
| If you own an MFS product or receive an MFS service in the name of a third party such as a bank or broker-dealer, their privacy policy may apply to you instead of ours. |


| 1 | |
| 2 | |
| 4 | |
| 7 | |
| 9 | |
| 10 | |
| 12 | |
| 13 | |
| 14 | |
| 23 | |
| 35 | |
| 37 | |
| 41 | |
| 42 | |
| 42 | |
| 42 | |
| 42 | |
| 42 | |
| 43 |
| back cover |


| MFS Research International Fund | 27.3% |
| MFS Emerging Markets Equity Fund | 17.7% |
| MFS International Intrinsic Value Fund | 15.0% |
| MFS International Growth Fund | 14.9% |
| MFS International Large Cap Value Fund | 14.9% |
| MFS International New Discovery Fund | 10.0% |
| Cash & Cash Equivalents | 0.2% |
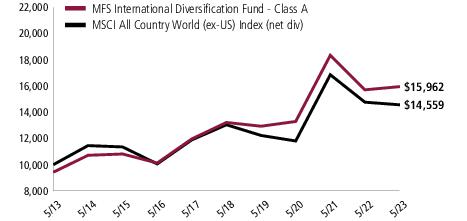
| Share Class | Class Inception Date | 1-yr | 5-yr | 10-yr | Life (t) |
| A | 9/30/04 | 1.61% | 3.85% | 5.41% | N/A |
| B | 9/30/04 | 0.83% | 3.07% | 4.63% | N/A |
| C | 9/30/04 | 0.84% | 3.08% | 4.63% | N/A |
| I | 9/30/04 | 1.85% | 4.10% | 5.68% | N/A |
| R1 | 4/01/05 | 0.86% | 3.07% | 4.63% | N/A |
| R2 | 9/30/04 | 1.36% | 3.59% | 5.15% | N/A |
| R3 | 4/01/05 | 1.59% | 3.85% | 5.41% | N/A |
| R4 | 4/01/05 | 1.86% | 4.11% | 5.68% | N/A |
| R6 | 10/02/17 | 1.92% | 4.20% | N/A | 4.77% |
| MSCI All Country World (ex-US) Index (net div) (f) | (1.41)% | 2.22% | 3.83% | N/A |
| A With Initial Sales Charge (5.75%) | (4.24)% | 2.62% | 4.79% | N/A |
| B With CDSC (Declining over six years from 4% to 0%) (v) | (3.12)% | 2.71% | 4.63% | N/A |
| C With CDSC (1% for 12 months) (v) | (0.15)% | 3.08% | 4.63% | N/A |
| (f) | Source: FactSet Research Systems Inc. |
| (t) | For the period from the class inception date through the stated period end (for those share classes with less than 10 years of performance history). No comparative benchmark performance information is provided for “life” periods. (See Notes to Performance Summary.) |
| (v) | Assuming redemption at the end of the applicable period. |
| (e) | Morgan Stanley Capital International (“MSCI”) makes no express or implied warranties or representations and shall have no liability whatsoever with respect to any MSCI data contained herein. The MSCI data may not be further redistributed or used as a basis for other indices or any securities or financial products. This report is not approved, reviewed, or produced by MSCI. |
December 1, 2022 through May 31, 2023
| Share Class | Annualized Expense Ratio | Beginning Account Value 12/01/22 | Ending Account Value 5/31/23 | Expenses Paid During Period (p) 12/01/22-5/31/23 | |
| A | Actual | 0.35% | $1,000.00 | $1,039.40 | $1.78 |
| Hypothetical (h) | 0.35% | $1,000.00 | $1,023.19 | $1.77 | |
| B | Actual | 1.10% | $1,000.00 | $1,035.76 | $5.58 |
| Hypothetical (h) | 1.10% | $1,000.00 | $1,019.45 | $5.54 | |
| C | Actual | 1.10% | $1,000.00 | $1,035.81 | $5.58 |
| Hypothetical (h) | 1.10% | $1,000.00 | $1,019.45 | $5.54 | |
| I | Actual | 0.10% | $1,000.00 | $1,040.61 | $0.51 |
| Hypothetical (h) | 0.10% | $1,000.00 | $1,024.43 | $0.50 | |
| R1 | Actual | 1.10% | $1,000.00 | $1,035.92 | $5.58 |
| Hypothetical (h) | 1.10% | $1,000.00 | $1,019.45 | $5.54 | |
| R2 | Actual | 0.60% | $1,000.00 | $1,038.39 | $3.05 |
| Hypothetical (h) | 0.60% | $1,000.00 | $1,021.94 | $3.02 | |
| R3 | Actual | 0.35% | $1,000.00 | $1,039.50 | $1.78 |
| Hypothetical (h) | 0.35% | $1,000.00 | $1,023.19 | $1.77 | |
| R4 | Actual | 0.10% | $1,000.00 | $1,040.85 | $0.51 |
| Hypothetical (h) | 0.10% | $1,000.00 | $1,024.43 | $0.50 | |
| R6 | Actual | 0.00% | $1,000.00 | $1,041.35 | $0.00 |
| Hypothetical (h) | 0.00% | $1,000.00 | $1,024.93 | $0.00 |
| (h) | 5% class return per year before expenses. |
| (p) | “Expenses Paid During Period” are equal to each class’s annualized expense ratio, as shown above, multiplied by the average account value over the period, multiplied by 182/365 (to reflect the one-half year period). Expenses paid do not include any applicable sales charges (loads). If these transaction costs had been included, your costs would have been higher. In addition to the fees and expenses which the fund bears directly, the fund indirectly bears a pro rata share of the fees and expenses of the underlying funds in which the fund invests. If these indirect costs were included, your costs would have been higher. |
| Issuer | Shares/Par | Value ($) | ||
| Investment Companies (h) – 100.0% | ||||
| International Stock Funds – 99.8% | ||||
| MFS Emerging Markets Equity Fund - Class R6 | 202,825,570 | $6,240,942,781 | ||
| MFS International Growth Fund - Class R6 | 135,219,380 | 5,280,316,780 | ||
| MFS International Intrinsic Value Fund - Class R6 | 136,946,750 | 5,306,686,571 | ||
| MFS International Large Cap Value Fund - Class R6 | 424,815,606 | 5,276,209,820 | ||
| MFS International New Discovery Fund - Class R6 | 115,663,532 | 3,517,328,016 | ||
| MFS Research International Fund - Class R6 | 462,542,579 | 9,667,139,905 | ||
| $35,288,623,873 | ||||
| Money Market Funds – 0.2% | ||||
| MFS Institutional Money Market Portfolio, 4.88% (v) | 60,880,897 | $60,874,809 | ||
| Total Investment Companies (Identified Cost, $33,041,415,705) | $35,349,498,682 | |||
| Other Assets, Less Liabilities – 0.0% | 14,892,431 | |||
| Net Assets – 100.0% | $35,364,391,113 | |||
| (h) | An affiliated issuer, which may be considered one in which the fund owns 5% or more of the outstanding voting securities, or a company which is under common control. At period end, the aggregate value of the fund’s investments in affiliated issuers was $35,349,498,682. | |||
| (v) | Affiliated issuer that is available only to investment companies managed by MFS. The rate quoted for the MFS Institutional Money Market Portfolio is the annualized seven-day yield of the fund at period end. |
| Assets | |
| Investments in affiliated issuers, at value (identified cost, $33,041,415,705) | $35,349,498,682 |
| Receivables for | |
| Investments sold | 1,023,032 |
| Fund shares sold | 79,215,280 |
| Receivable from investment adviser | 768,513 |
| Other assets | 48,889 |
| Total assets | $35,430,554,396 |
| Liabilities | |
| Payables for | |
| Investments purchased | $30,724,402 |
| Fund shares reacquired | 28,895,268 |
| Payable to affiliates | |
| Administrative services fee | 94 |
| Shareholder servicing costs | 5,623,038 |
| Distribution and service fees | 84,864 |
| Payable for independent Trustees' compensation | 1,099 |
| Accrued expenses and other liabilities | 834,518 |
| Total liabilities | $66,163,283 |
| Net assets | $35,364,391,113 |
| Net assets consist of | |
| Paid-in capital | $32,842,080,980 |
| Total distributable earnings (loss) | 2,522,310,133 |
| Net assets | $35,364,391,113 |
| Shares of beneficial interest outstanding | 1,651,092,080 |
| Net assets | Shares outstanding | Net asset value per share (a) | |
| Class A | $3,498,537,561 | 164,991,354 | $21.20 |
| Class B | 9,428,426 | 451,707 | 20.87 |
| Class C | 304,133,071 | 14,802,242 | 20.55 |
| Class I | 14,757,461,895 | 687,531,793 | 21.46 |
| Class R1 | 7,177,113 | 355,370 | 20.20 |
| Class R2 | 61,252,864 | 2,943,478 | 20.81 |
| Class R3 | 1,216,238,870 | 57,880,695 | 21.01 |
| Class R4 | 987,867,916 | 46,187,942 | 21.39 |
| Class R6 | 14,522,293,397 | 675,947,499 | 21.48 |
| (a) | Maximum offering price per share was equal to the net asset value per share for all share classes, except for Class A, for which the maximum offering price per share was $22.49 [100 / 94.25 x $21.20]. On sales of $50,000 or more, the maximum offering price of Class A shares is reduced. A contingent deferred sales charge may be imposed on redemptions of Class A, Class B, and Class C shares. Redemption price per share was equal to the net asset value per share for Classes I, R1, R2, R3, R4, and R6. |
| Net investment income (loss) | |
| Income | |
| Dividends from affiliated issuers | $463,281,124 |
| Excess expense reimbursement from investment adviser | 458,219 |
| Other | 3,278 |
| Total investment income | $463,742,621 |
| Expenses | |
| Distribution and service fees | $15,063,763 |
| Shareholder servicing costs | 21,746,564 |
| Administrative services fee | 17,500 |
| Independent Trustees' compensation | 139,674 |
| Custodian fee | 100,382 |
| Shareholder communications | 1,973,686 |
| Audit and tax fees | 42,038 |
| Legal fees | 163,393 |
| Miscellaneous | 1,083,193 |
| Total expenses | $40,330,193 |
| Reduction of expenses by investment adviser and distributor | (5,057,329) |
| Net expenses | $35,272,864 |
| Net investment income (loss) | $428,469,757 |
| Realized and unrealized gain (loss) | |
| Realized gain (loss) (identified cost basis) | |
| Investments in affiliated issuers | $(624,153,666) |
| Capital gain distributions from affiliated issuers | 857,603,328 |
| Net realized gain (loss) | $233,449,662 |
| Change in unrealized appreciation or depreciation | |
| Affiliated issuers | $(166,459,221) |
| Net realized and unrealized gain (loss) | $66,990,441 |
| Change in net assets from operations | $495,460,198 |
| Year ended | ||
| 5/31/23 | 5/31/22 | |
| Change in net assets | ||
| From operations | ||
| Net investment income (loss) | $428,469,757 | $735,326,573 |
| Net realized gain (loss) | 233,449,662 | 658,157,333 |
| Net unrealized gain (loss) | (166,459,221) | (7,082,594,212) |
| Change in net assets from operations | $495,460,198 | $(5,689,110,306) |
| Total distributions to shareholders | $(833,326,578) | $(1,060,185,290) |
| Change in net assets from fund share transactions | $1,098,722,015 | $2,882,410,782 |
| Total change in net assets | $760,855,635 | $(3,866,884,814) |
| Net assets | ||
| At beginning of period | 34,603,535,478 | 38,470,420,292 |
| At end of period | $35,364,391,113 | $34,603,535,478 |
| Class A | Year ended | ||||
| 5/31/23 | 5/31/22 | 5/31/21 | 5/31/20 | 5/31/19 | |
| Net asset value, beginning of period | $21.37 | $25.51 | $18.80 | $18.71 | $19.68 |
| Income (loss) from investment operations | |||||
| Net investment income (loss) (d)(l) | $0.22 | $0.40 | $0.10 | $0.25 | $0.37 |
| Net realized and unrealized gain (loss) | 0.09 | (3.92) | 6.96 | 0.32 | (0.85) |
| Total from investment operations | $0.31 | $(3.52) | $7.06 | $0.57 | $(0.48) |
| Less distributions declared to shareholders | |||||
| From net investment income | $(0.08) | $(0.41) | $(0.12) | $(0.26) | $(0.37) |
| From net realized gain | (0.40) | (0.21) | (0.23) | (0.22) | (0.12) |
| Total distributions declared to shareholders | $(0.48) | $(0.62) | $(0.35) | $(0.48) | $(0.49) |
| Net asset value, end of period (x) | $21.20 | $21.37 | $25.51 | $18.80 | $18.71 |
| Total return (%) (r)(s)(t)(x) | 1.61 | (14.16) | 37.66 | 2.80 | (2.15) |
| Ratios (%) (to average net assets) and Supplemental data: | |||||
| Expenses before expense reductions (h) | 0.37 | 0.37 | 0.36 | 0.37 | 0.36 |
| Expenses after expense reductions (h) | 0.35 | 0.35 | 0.34 | 0.35 | 0.34 |
| Net investment income (loss) (l) | 1.07 | 1.64 | 0.46 | 1.31 | 1.96 |
| Portfolio turnover | 7 | 4 | 9 | 6 | 1 |
| Net assets at end of period (000 omitted) | $3,498,538 | $3,644,253 | $4,381,231 | $2,778,815 | $2,458,587 |
| Class B | Year ended | ||||
| 5/31/23 | 5/31/22 | 5/31/21 | 5/31/20 | 5/31/19 | |
| Net asset value, beginning of period | $21.12 | $25.16 | $18.61 | $18.50 | $19.43 |
| Income (loss) from investment operations | |||||
| Net investment income (loss) (d)(l) | $0.06 | $0.21 | $(0.06) | $0.10 | $0.22 |
| Net realized and unrealized gain (loss) | 0.09 | (3.86) | 6.84 | 0.31 | (0.82) |
| Total from investment operations | $0.15 | $(3.65) | $6.78 | $0.41 | $(0.60) |
| Less distributions declared to shareholders | |||||
| From net investment income | $— | $(0.18) | $— | $(0.08) | $(0.21) |
| From net realized gain | (0.40) | (0.21) | (0.23) | (0.22) | (0.12) |
| Total distributions declared to shareholders | $(0.40) | $(0.39) | $(0.23) | $(0.30) | $(0.33) |
| Net asset value, end of period (x) | $20.87 | $21.12 | $25.16 | $18.61 | $18.50 |
| Total return (%) (r)(s)(t)(x) | 0.83 | (14.73) | 36.51 | 2.08 | (2.93) |
| Ratios (%) (to average net assets) and Supplemental data: | |||||
| Expenses before expense reductions (h) | 1.12 | 1.12 | 1.11 | 1.12 | 1.11 |
| Expenses after expense reductions (h) | 1.10 | 1.10 | 1.09 | 1.10 | 1.09 |
| Net investment income (loss) (l) | 0.30 | 0.89 | (0.28) | 0.53 | 1.20 |
| Portfolio turnover | 7 | 4 | 9 | 6 | 1 |
| Net assets at end of period (000 omitted) | $9,428 | $13,672 | $21,542 | $20,424 | $27,434 |
| Class C | Year ended | ||||
| 5/31/23 | 5/31/22 | 5/31/21 | 5/31/20 | 5/31/19 | |
| Net asset value, beginning of period | $20.80 | $24.83 | $18.36 | $18.28 | $19.20 |
| Income (loss) from investment operations | |||||
| Net investment income (loss) (d)(l) | $0.06 | $0.22 | $(0.06) | $0.10 | $0.22 |
| Net realized and unrealized gain (loss) | 0.09 | (3.82) | 6.76 | 0.30 | (0.81) |
| Total from investment operations | $0.15 | $(3.60) | $6.70 | $0.40 | $(0.59) |
| Less distributions declared to shareholders | |||||
| From net investment income | $— | $(0.22) | $— | $(0.10) | $(0.21) |
| From net realized gain | (0.40) | (0.21) | (0.23) | (0.22) | (0.12) |
| Total distributions declared to shareholders | $(0.40) | $(0.43) | $(0.23) | $(0.32) | $(0.33) |
| Net asset value, end of period (x) | $20.55 | $20.80 | $24.83 | $18.36 | $18.28 |
| Total return (%) (r)(s)(t)(x) | 0.84 | (14.75) | 36.57 | 2.04 | (2.87) |
| Ratios (%) (to average net assets) and Supplemental data: | |||||
| Expenses before expense reductions (h) | 1.12 | 1.12 | 1.11 | 1.12 | 1.11 |
| Expenses after expense reductions (h) | 1.10 | 1.10 | 1.09 | 1.10 | 1.09 |
| Net investment income (loss) (l) | 0.29 | 0.92 | (0.28) | 0.53 | 1.21 |
| Portfolio turnover | 7 | 4 | 9 | 6 | 1 |
| Net assets at end of period (000 omitted) | $304,133 | $379,572 | $489,683 | $419,045 | $472,251 |
| Class I | Year ended | ||||
| 5/31/23 | 5/31/22 | 5/31/21 | 5/31/20 | 5/31/19 | |
| Net asset value, beginning of period | $21.63 | $25.81 | $19.01 | $18.91 | $19.89 |
| Income (loss) from investment operations | |||||
| Net investment income (loss) (d)(l) | $0.26 | $0.47 | $0.16 | $0.30 | $0.42 |
| Net realized and unrealized gain (loss) | 0.10 | (3.97) | 7.03 | 0.32 | (0.86) |
| Total from investment operations | $0.36 | $(3.50) | $7.19 | $0.62 | $(0.44) |
| Less distributions declared to shareholders | |||||
| From net investment income | $(0.13) | $(0.47) | $(0.16) | $(0.30) | $(0.42) |
| From net realized gain | (0.40) | (0.21) | (0.23) | (0.22) | (0.12) |
| Total distributions declared to shareholders | $(0.53) | $(0.68) | $(0.39) | $(0.52) | $(0.54) |
| Net asset value, end of period (x) | $21.46 | $21.63 | $25.81 | $19.01 | $18.91 |
| Total return (%) (r)(s)(t)(x) | 1.85 | (13.93) | 38.00 | 3.04 | (1.91) |
| Ratios (%) (to average net assets) and Supplemental data: | |||||
| Expenses before expense reductions (h) | 0.12 | 0.12 | 0.11 | 0.12 | 0.11 |
| Expenses after expense reductions (h) | 0.10 | 0.10 | 0.09 | 0.10 | 0.09 |
| Net investment income (loss) (l) | 1.28 | 1.94 | 0.71 | 1.56 | 2.21 |
| Portfolio turnover | 7 | 4 | 9 | 6 | 1 |
| Net assets at end of period (000 omitted) | $14,757,462 | $15,504,823 | $17,850,569 | $9,936,595 | $7,848,998 |
| Class R1 | Year ended | ||||
| 5/31/23 | 5/31/22 | 5/31/21 | 5/31/20 | 5/31/19 | |
| Net asset value, beginning of period | $20.45 | $24.40 | $18.04 | $17.99 | $18.93 |
| Income (loss) from investment operations | |||||
| Net investment income (loss) (d)(l) | $0.06 | $0.20 | $(0.07) | $0.12 | $0.22 |
| Net realized and unrealized gain (loss) | 0.09 | (3.75) | 6.66 | 0.28 | (0.81) |
| Total from investment operations | $0.15 | $(3.55) | $6.59 | $0.40 | $(0.59) |
| Less distributions declared to shareholders | |||||
| From net investment income | $— | $(0.19) | $— | $(0.13) | $(0.23) |
| From net realized gain | (0.40) | (0.21) | (0.23) | (0.22) | (0.12) |
| Total distributions declared to shareholders | $(0.40) | $(0.40) | $(0.23) | $(0.35) | $(0.35) |
| Net asset value, end of period (x) | $20.20 | $20.45 | $24.40 | $18.04 | $17.99 |
| Total return (%) (r)(s)(t)(x) | 0.86 | (14.78) | 36.61 | 2.04 | (2.91) |
| Ratios (%) (to average net assets) and Supplemental data: | |||||
| Expenses before expense reductions (h) | 1.12 | 1.12 | 1.11 | 1.12 | 1.11 |
| Expenses after expense reductions (h) | 1.10 | 1.10 | 1.09 | 1.10 | 1.09 |
| Net investment income (loss) (l) | 0.32 | 0.86 | (0.31) | 0.67 | 1.23 |
| Portfolio turnover | 7 | 4 | 9 | 6 | 1 |
| Net assets at end of period (000 omitted) | $7,177 | $7,056 | $10,359 | $7,756 | $8,625 |
| Class R2 | Year ended | ||||
| 5/31/23 | 5/31/22 | 5/31/21 | 5/31/20 | 5/31/19 | |
| Net asset value, beginning of period | $20.98 | $25.05 | $18.49 | $18.39 | $19.34 |
| Income (loss) from investment operations | |||||
| Net investment income (loss) (d)(l) | $0.16 | $0.34 | $0.06 | $0.19 | $0.33 |
| Net realized and unrealized gain (loss) | 0.10 | (3.85) | 6.80 | 0.33 | (0.84) |
| Total from investment operations | $0.26 | $(3.51) | $6.86 | $0.52 | $(0.51) |
| Less distributions declared to shareholders | |||||
| From net investment income | $(0.03) | $(0.35) | $(0.07) | $(0.20) | $(0.32) |
| From net realized gain | (0.40) | (0.21) | (0.23) | (0.22) | (0.12) |
| Total distributions declared to shareholders | $(0.43) | $(0.56) | $(0.30) | $(0.42) | $(0.44) |
| Net asset value, end of period (x) | $20.81 | $20.98 | $25.05 | $18.49 | $18.39 |
| Total return (%) (r)(s)(t)(x) | 1.36 | (14.34) | 37.21 | 2.60 | (2.41) |
| Ratios (%) (to average net assets) and Supplemental data: | |||||
| Expenses before expense reductions (h) | 0.62 | 0.62 | 0.61 | 0.62 | 0.61 |
| Expenses after expense reductions (h) | 0.60 | 0.60 | 0.59 | 0.60 | 0.59 |
| Net investment income (loss) (l) | 0.80 | 1.43 | 0.26 | 1.02 | 1.75 |
| Portfolio turnover | 7 | 4 | 9 | 6 | 1 |
| Net assets at end of period (000 omitted) | $61,253 | $65,430 | $74,611 | $53,110 | $61,929 |
| Class R3 | Year ended | ||||
| 5/31/23 | 5/31/22 | 5/31/21 | 5/31/20 | 5/31/19 | |
| Net asset value, beginning of period | $21.19 | $25.30 | $18.66 | $18.57 | $19.54 |
| Income (loss) from investment operations | |||||
| Net investment income (loss) (d)(l) | $0.22 | $0.40 | $0.11 | $0.24 | $0.35 |
| Net realized and unrealized gain (loss) | 0.09 | (3.89) | 6.88 | 0.33 | (0.82) |
| Total from investment operations | $0.31 | $(3.49) | $6.99 | $0.57 | $(0.47) |
| Less distributions declared to shareholders | |||||
| From net investment income | $(0.09) | $(0.41) | $(0.12) | $(0.26) | $(0.38) |
| From net realized gain | (0.40) | (0.21) | (0.23) | (0.22) | (0.12) |
| Total distributions declared to shareholders | $(0.49) | $(0.62) | $(0.35) | $(0.48) | $(0.50) |
| Net asset value, end of period (x) | $21.01 | $21.19 | $25.30 | $18.66 | $18.57 |
| Total return (%) (r)(s)(t)(x) | 1.59 | (14.14) | 37.61 | 2.83 | (2.15) |
| Ratios (%) (to average net assets) and Supplemental data: | |||||
| Expenses before expense reductions (h) | 0.37 | 0.37 | 0.36 | 0.38 | 0.36 |
| Expenses after expense reductions (h) | 0.35 | 0.35 | 0.34 | 0.35 | 0.34 |
| Net investment income (loss) (l) | 1.08 | 1.66 | 0.49 | 1.25 | 1.86 |
| Portfolio turnover | 7 | 4 | 9 | 6 | 1 |
| Net assets at end of period (000 omitted) | $1,216,239 | $1,178,451 | $1,318,182 | $724,023 | $523,367 |
| Class R4 | Year ended | ||||
| 5/31/23 | 5/31/22 | 5/31/21 | 5/31/20 | 5/31/19 | |
| Net asset value, beginning of period | $21.56 | $25.72 | $18.95 | $18.85 | $19.82 |
| Income (loss) from investment operations | |||||
| Net investment income (loss) (d)(l) | $0.28 | $0.47 | $0.18 | $0.32 | $0.42 |
| Net realized and unrealized gain (loss) | 0.09 | (3.95) | 6.99 | 0.30 | (0.85) |
| Total from investment operations | $0.37 | $(3.48) | $7.17 | $0.62 | $(0.43) |
| Less distributions declared to shareholders | |||||
| From net investment income | $(0.14) | $(0.47) | $(0.17) | $(0.30) | $(0.42) |
| From net realized gain | (0.40) | (0.21) | (0.23) | (0.22) | (0.12) |
| Total distributions declared to shareholders | $(0.54) | $(0.68) | $(0.40) | $(0.52) | $(0.54) |
| Net asset value, end of period (x) | $21.39 | $21.56 | $25.72 | $18.95 | $18.85 |
| Total return (%) (r)(s)(t)(x) | 1.86 | (13.91) | 37.96 | 3.04 | (1.89) |
| Ratios (%) (to average net assets) and Supplemental data: | |||||
| Expenses before expense reductions (h) | 0.12 | 0.12 | 0.11 | 0.12 | 0.11 |
| Expenses after expense reductions (h) | 0.10 | 0.10 | 0.09 | 0.10 | 0.09 |
| Net investment income (loss) (l) | 1.33 | 1.91 | 0.77 | 1.62 | 2.22 |
| Portfolio turnover | 7 | 4 | 9 | 6 | 1 |
| Net assets at end of period (000 omitted) | $987,868 | $1,017,358 | $1,277,938 | $721,937 | $779,264 |
| Class R6 | Year ended | ||||
| 5/31/23 | 5/31/22 | 5/31/21 | 5/31/20 | 5/31/19 | |
| Net asset value, beginning of period | $21.66 | $25.84 | $19.03 | $18.92 | $19.90 |
| Income (loss) from investment operations | |||||
| Net investment income (loss) (d)(l) | $0.29 | $0.49 | $0.19 | $0.32 | $0.43 |
| Net realized and unrealized gain (loss) | 0.09 | (3.97) | 7.03 | 0.33 | (0.85) |
| Total from investment operations | $0.38 | $(3.48) | $7.22 | $0.65 | $(0.42) |
| Less distributions declared to shareholders | |||||
| From net investment income | $(0.16) | $(0.49) | $(0.18) | $(0.32) | $(0.44) |
| From net realized gain | (0.40) | (0.21) | (0.23) | (0.22) | (0.12) |
| Total distributions declared to shareholders | $(0.56) | $(0.70) | $(0.41) | $(0.54) | $(0.56) |
| Net asset value, end of period (x) | $21.48 | $21.66 | $25.84 | $19.03 | $18.92 |
| Total return (%) (r)(s)(t)(x) | 1.92 | (13.84) | 38.12 | 3.17 | (1.82) |
| Ratios (%) (to average net assets) and Supplemental data: | |||||
| Expenses before expense reductions (h) | 0.01 | 0.01 | 0.02 | 0.02 | 0.02 |
| Expenses after expense reductions (h) | 0.00 | 0.00 | 0.00 | 0.00 | 0.00 |
| Net investment income (loss) (l) | 1.42 | 2.03 | 0.81 | 1.65 | 2.25 |
| Portfolio turnover | 7 | 4 | 9 | 6 | 1 |
| Net assets at end of period (000 omitted) | $14,522,293 | $12,792,920 | $13,046,306 | $6,984,049 | $4,526,554 |
| (d) | Per share data is based on average shares outstanding. |
| (h) | In addition to the fees and expenses which the fund bears directly, the fund indirectly bears a pro rata share of the fees and expenses of the underlying affiliated funds in which the fund invests. Accordingly, the expense ratio for the fund reflects only those fees and expenses borne directly by the fund. Because the underlying affiliated funds have varied expense and fee levels and the fund may own different proportions of the underlying affiliated funds at different times, the amount of fees and expenses incurred indirectly by the fund will vary. |
| (l) | The ratios and per share amounts do not include net investment income of the underlying affiliated funds in which the fund invests. |
| (r) | Certain expenses have been reduced without which performance would have been lower. |
| (s) | From time to time the fund may receive proceeds from litigation settlements, without which performance would be lower. |
| (t) | Total returns do not include any applicable sales charges. |
| (x) | The net asset values and total returns have been calculated on net assets which include adjustments made in accordance with U.S. generally accepted accounting principles required at period end for financial reporting purposes. |
| Financial Instruments | Level 1 | Level 2 | Level 3 | Total |
| Mutual Funds | $35,349,498,682 | $— | $— | $35,349,498,682 |
| Year ended 5/31/23 | Year ended 5/31/22 | |
| Ordinary income (including any short-term capital gains) | $210,003,444 | $738,095,672 |
| Long-term capital gains | 623,323,134 | 322,089,618 |
| Total distributions | $833,326,578 | $1,060,185,290 |
| As of 5/31/23 | |
| Cost of investments | $33,603,850,583 |
| Gross appreciation | 3,360,863,142 |
| Gross depreciation | (1,615,215,043) |
| Net unrealized appreciation (depreciation) | $1,745,648,099 |
| Undistributed ordinary income | 205,035,001 |
| Undistributed long-term capital gain | 571,627,033 |
| Total distributable earnings (loss) | $2,522,310,133 |
| Year ended 5/31/23 | Year ended 5/31/22 | ||
| Class A | $78,648,831 | $102,576,698 | |
| Class B | 204,155 | 284,895 | |
| Class C | 6,261,377 | 8,280,369 | |
| Class I | 345,885,676 | 495,699,263 | |
| Class R1 | 138,543 | 137,313 | |
| Class R2 | 1,260,498 | 1,683,327 | |
| Class R3 | 27,318,746 | 32,728,112 | |
| Class R4 | 24,966,626 | 32,021,282 | |
| Class R6 | 348,642,126 | 386,774,031 | |
| Total | $833,326,578 | $1,060,185,290 |
| Distribution Fee Rate (d) | Service Fee Rate (d) | Total Distribution Plan (d) | Annual Effective Rate (e) | Distribution and Service Fee | |
| Class A | — | 0.25% | 0.25% | 0.25% | $ 8,508,460 |
| Class B | 0.75% | 0.25% | 1.00% | 1.00% | 107,880 |
| Class C | 0.75% | 0.25% | 1.00% | 1.00% | 3,236,496 |
| Class R1 | 0.75% | 0.25% | 1.00% | 1.00% | 68,120 |
| Class R2 | 0.25% | 0.25% | 0.50% | 0.50% | 301,840 |
| Class R3 | — | 0.25% | 0.25% | 0.25% | 2,840,967 |
| Total Distribution and Service Fees | $15,063,763 |
| (d) | In accordance with the distribution plan for certain classes, the fund pays distribution and/or service fees equal to these annual percentage rates of each class’s average daily net assets. The distribution and service fee rates disclosed by class represent the current rates in effect at the end of the reporting period. Any rate changes, if applicable, are detailed below. |
| (e) | The annual effective rates represent actual fees incurred under the distribution plan for the year ended May 31, 2023 based on each class's average daily net assets. MFD has voluntarily agreed to rebate a portion of each class's 0.25% service fee attributable to accounts for which there is no financial intermediary specified on the account except for accounts attributable to MFS or its affiliates' seed money. For the year ended May 31, 2023, this rebate amounted to $154, $137, and $6 for Class A, Class C, and Class R3 shares, respectively, and is included in the reduction of total expenses in the Statement of Operations. |
| Amount | |
| Class A | $59,782 |
| Class B | 12,618 |
| Class C | 17,066 |
| Year ended 5/31/23 | Year ended 5/31/22 | ||||
| Shares | Amount | Shares | Amount | ||
| Shares sold | |||||
| Class A | 25,915,511 | $530,821,078 | 31,079,218 | $752,544,000 | |
| Class B | 6,146 | 127,274 | 5,666 | 132,851 | |
| Class C | 1,205,739 | 24,103,189 | 2,264,870 | 54,187,044 | |
| Class I | 229,901,631 | 4,768,174,744 | 221,220,798 | 5,381,413,886 | |
| Class R1 | 65,933 | 1,288,945 | 73,863 | 1,672,639 | |
| Class R2 | 709,018 | 14,229,944 | 830,211 | 19,908,525 | |
| Class R3 | 14,688,003 | 299,240,494 | 13,456,389 | 322,800,274 | |
| Class R4 | 6,701,681 | 137,492,853 | 7,618,750 | 184,547,758 | |
| Class R6 | 186,197,598 | 3,841,197,796 | 156,784,794 | 3,836,352,557 | |
| 465,391,260 | $9,616,676,317 | 433,334,559 | $10,553,559,534 | ||
| Year ended 5/31/23 | Year ended 5/31/22 | ||||
| Shares | Amount | Shares | Amount | ||
| Shares issued to shareholders in reinvestment of distributions | |||||
| Class A | 3,560,602 | $70,820,122 | 3,779,417 | $93,578,375 | |
| Class B | 10,205 | 200,416 | 11,292 | 277,227 | |
| Class C | 291,348 | 5,634,665 | 305,025 | 7,372,464 | |
| Class I | 15,068,236 | 303,022,227 | 17,086,810 | 427,853,723 | |
| Class R1 | 7,288 | 138,543 | 5,777 | 137,313 | |
| Class R2 | 63,536 | 1,241,501 | 68,185 | 1,659,616 | |
| Class R3 | 1,386,035 | 27,318,741 | 1,333,120 | 32,728,103 | |
| Class R4 | 1,223,167 | 24,512,272 | 1,248,994 | 31,162,393 | |
| Class R6 | 16,676,415 | 335,529,477 | 14,853,691 | 372,084,952 | |
| 38,286,832 | $768,417,964 | 38,692,311 | $966,854,166 | ||
| Shares reacquired | |||||
| Class A | (34,978,872) | $(710,786,055) | (36,108,897) | $(871,737,061) | |
| Class B | (211,978) | (4,218,059) | (225,749) | (5,334,966) | |
| Class C | (4,947,013) | (97,104,308) | (4,040,802) | (93,133,886) | |
| Class I | (274,179,277) | (5,555,952,093) | (213,070,176) | (5,032,296,815) | |
| Class R1 | (62,890) | (1,235,145) | (159,181) | (3,746,980) | |
| Class R2 | (947,321) | (18,581,745) | (758,075) | (18,129,820) | |
| Class R3 | (13,803,663) | (281,574,395) | (11,274,550) | (270,832,851) | |
| Class R4 | (8,925,556) | (184,250,711) | (11,361,347) | (277,056,068) | |
| Class R6 | (117,662,650) | (2,432,669,755) | (85,835,831) | (2,065,734,471) | |
| (455,719,220) | $(9,286,372,266) | (362,834,608) | $(8,638,002,918) | ||
| Net change | |||||
| Class A | (5,502,759) | $(109,144,855) | (1,250,262) | $(25,614,686) | |
| Class B | (195,627) | (3,890,369) | (208,791) | (4,924,888) | |
| Class C | (3,449,926) | (67,366,454) | (1,470,907) | (31,574,378) | |
| Class I | (29,209,410) | (484,755,122) | 25,237,432 | 776,970,794 | |
| Class R1 | 10,331 | 192,343 | (79,541) | (1,937,028) | |
| Class R2 | (174,767) | (3,110,300) | 140,321 | 3,438,321 | |
| Class R3 | 2,270,375 | 44,984,840 | 3,514,959 | 84,695,526 | |
| Class R4 | (1,000,708) | (22,245,586) | (2,493,603) | (61,345,917) | |
| Class R6 | 85,211,363 | 1,744,057,518 | 85,802,654 | 2,142,703,038 | |
| 47,958,872 | $1,098,722,015 | 109,192,262 | $2,882,410,782 | ||
| Affiliated Issuers | Beginning Value | Purchases | Sales Proceeds | Realized Gain (Loss) | Change in Unrealized Appreciation or Depreciation | Ending Value |
| MFS Emerging Markets Equity Fund | $6,124,405,478 | $1,047,812,703 | $657,448,741 | $(274,485,070) | $658,411 | $6,240,942,781 |
| MFS Institutional Money Market Portfolio | 44,389,736 | 1,102,731,606 | 1,086,219,729 | (21,331) | (5,473) | 60,874,809 |
| MFS International Growth Fund | 5,171,427,369 | 309,007,505 | 355,124,427 | (86,735,931) | 241,742,264 | 5,280,316,780 |
| MFS International Intrinsic Value Fund | 5,116,992,818 | 879,366,429 | 253,294,039 | (91,157,350) | (345,221,287) | 5,306,686,571 |
| MFS International Large Cap Value Fund | 5,183,541,096 | 512,191,137 | 397,881,750 | (27,626,718) | 5,986,055 | 5,276,209,820 |
| MFS International New Discovery Fund | 3,429,640,120 | 423,634,857 | 169,263,811 | (60,354,548) | (106,328,602) | 3,517,328,016 |
| MFS Research International Fund | 9,505,614,419 | 560,104,537 | 351,515,744 | (83,772,718) | 36,709,411 | 9,667,139,905 |
| $34,576,011,036 | $4,834,848,774 | $3,270,748,241 | $(624,153,666) | $(166,459,221) | $35,349,498,682 |
| Affiliated Issuers | Dividend Income | Capital Gain Distributions |
| MFS Emerging Markets Equity Fund | $76,642,141 | $— |
| MFS Institutional Money Market Portfolio | 1,697,618 | — |
| MFS International Growth Fund | 57,740,698 | 84,614,628 |
| MFS International Intrinsic Value Fund | 54,234,929 | 571,534,620 |
| MFS International Large Cap Value Fund | 89,975,280 | 49,165,828 |
| MFS International New Discovery Fund | 28,353,160 | 152,288,252 |
| MFS Research International Fund | 154,637,298 | — |
| $463,281,124 | $857,603,328 |
July 14, 2023
| Name, Age | Position(s) Held with Fund | Trustee/Officer Since(h) | Number of MFS Funds overseen by the Trustee | Principal Occupations During the Past Five Years | Other Directorships During the Past Five Years (j) | |||||
| INTERESTED TRUSTEE | ||||||||||
| Michael W. Roberge (k) (age 56) | Trustee | January 2021 | 136 | Massachusetts Financial Services Company, Chairman (since January 2021); Chief Executive Officer (since January 2017); Director; Chairman of the Board (since January 2022); President (until December 2018); Chief Investment Officer (until December 2018) | N/A | |||||
| INDEPENDENT TRUSTEES | ||||||||||
| John P. Kavanaugh (age 68) | Trustee and Chair of Trustees | January 2009 | 136 | Private investor | N/A | |||||
| Steven E. Buller (age 71) | Trustee | February 2014 | 136 | Private investor | N/A | |||||
| John A. Caroselli (age 69) | Trustee | March 2017 | 136 | Private investor; JC Global Advisors, LLC (management consulting), President (since 2015) | N/A | |||||
| Maureen R. Goldfarb (age 68) | Trustee | January 2009 | 136 | Private investor | N/A | |||||
| Peter D. Jones (age 67) | Trustee | January 2019 | 136 | Private investor | N/A | |||||
| James W. Kilman, Jr. (age 62) | Trustee | January 2019 | 136 | Burford Capital Limited (finance and investment management), Senior Advisor (since May 3, 2021), Chief Financial Officer (2019 - May 2, 2021); KielStrand Capital LLC (family office), Chief Executive Officer (since 2016) | Alpha-En Corporation, Director (2016-2019) |
| Name, Age | Position(s) Held with Fund | Trustee/Officer Since(h) | Number of MFS Funds overseen by the Trustee | Principal Occupations During the Past Five Years | Other Directorships During the Past Five Years (j) | |||||
| Clarence Otis, Jr. (age 67) | Trustee | March 2017 | 136 | Private investor | VF Corporation, Director; Verizon Communications, Inc., Director; The Travelers Companies, Director | |||||
| Maryanne L. Roepke (age 67) | Trustee | May 2014 | 136 | Private investor | N/A | |||||
| Laurie J. Thomsen (age 65) | Trustee | March 2005 | 136 | Private investor | The Travelers Companies, Director; Dycom Industries, Inc., Director |
| Name, Age | Position(s) Held with Fund | Trustee/Officer Since(h) | Number of MFS Funds for which the Person is an Officer | Principal Occupations During the Past Five Years | ||||
| OFFICERS | ||||||||
| Christopher R. Bohane (k) (age 49) | Assistant Secretary and Assistant Clerk | July 2005 | 136 | Massachusetts Financial Services Company, Senior Vice President and Senior Managing Counsel | ||||
| Kino Clark (k) (age 55) | Assistant Treasurer | January 2012 | 136 | Massachusetts Financial Services Company, Vice President | ||||
| John W. Clark, Jr. (k) (age 56) | Assistant Treasurer | April 2017 | 136 | Massachusetts Financial Services Company, Vice President | ||||
| David L. DiLorenzo (k) (age 54) | President | July 2005 | 136 | Massachusetts Financial Services Company, Senior Vice President | ||||
| Heidi W. Hardin (k) (age 55) | Secretary and Clerk | April 2017 | 136 | Massachusetts Financial Services Company, Executive Vice President and General Counsel | ||||
| Brian E. Langenfeld (k) (age 50) | Assistant Secretary and Assistant Clerk | June 2006 | 136 | Massachusetts Financial Services Company, Vice President and Managing Counsel |
| Name, Age | Position(s) Held with Fund | Trustee/Officer Since(h) | Number of MFS Funds for which the Person is an Officer | Principal Occupations During the Past Five Years | ||||
| Rosa E. Licea-Mailloux (k) (age 46) | Chief Compliance Officer | March 2022 | 136 | Massachusetts Financial Services Company, Vice President (since 2018); Director of Corporate Compliance (2018-2021), Senior Director Compliance (2021-2022), Senior Managing Director of North American Compliance & Chief Compliance Officer (since March 2022); Natixis Investment Managers (investment management), Funds Chief Compliance Officer, Deputy General Counsel & Senior Vice President (until 2018) | ||||
| Amanda S. Mooradian (k) (age 44) | Assistant Secretary and Assistant Clerk | September 2018 | 136 | Massachusetts Financial Services Company, Assistant Vice President and Senior Counsel | ||||
| Susan A. Pereira (k) (age 52) | Assistant Secretary and Assistant Clerk | July 2005 | 136 | Massachusetts Financial Services Company, Vice President and Managing Counsel | ||||
| Kasey L. Phillips (k) (age 52) | Assistant Treasurer | September 2012 | 136 | Massachusetts Financial Services Company, Vice President | ||||
| Matthew A. Stowe (k) (age 48) | Assistant Secretary and Assistant Clerk | October 2014 | 136 | Massachusetts Financial Services Company, Vice President and Senior Managing Counsel | ||||
| William B. Wilson (k) (age 40) | Assistant Secretary and Assistant Clerk | October 2022 | 136 | Massachusetts Financial Services Company, Assistant Vice President and Senior Counsel | ||||
| James O. Yost (k) (age 63) | Treasurer | September 1990 | 136 | Massachusetts Financial Services Company, Senior Vice President |
| (h) | Date first appointed to serve as Trustee/Officer of an MFS Fund. Each Trustee has served continuously since appointment unless indicated otherwise. From January 2012 through December 2016, Messrs. DiLorenzo and Yost served as Treasurer and Deputy Treasurer of the Funds, respectively. |
| (j) | Directorships or trusteeships of companies required to report to the Securities and Exchange Commission (i.e., “public companies”). |
| (k) | “Interested person” of the Trust within the meaning of the Investment Company Act of 1940 (referred to as the 1940 Act), which is the principal federal law governing investment companies like the fund, as a result of a position with MFS. The address of MFS is 111 Huntington Avenue, Boston, Massachusetts 02199-7618. |
| Investment Adviser | Custodian |
| Massachusetts Financial Services Company 111 Huntington Avenue Boston, MA 02199-7618 | State Street Bank and Trust Company 1 Congress Street, Suite 1 Boston, MA 02114-2016 |
| Distributor | Independent Registered Public Accounting Firm |
| MFS Fund Distributors, Inc. 111 Huntington Avenue Boston, MA 02199-7618 | Deloitte & Touche LLP 200 Berkeley Street Boston, MA 02116 |
| Portfolio Manager(s) | |
| Camille Humphries Lee Nicholas Paul |
| FACTS | WHAT DOES MFS DO WITH YOUR PERSONAL INFORMATION? |
| Why? | Financial companies choose how they share your personal information. Federal law gives consumers the right to limit some but not all sharing. Federal law also requires us to tell you how we collect, share, and protect your personal information. Please read this notice carefully to understand what we do. |
| What? | The types of personal information we collect and share depend on the product or service you have with us. This information can include: |
| • Social Security number and account balances | |
| • Account transactions and transaction history | |
| • Checking account information and wire transfer instructions | |
| When you are no longer our customer, we continue to share your information as described in this notice. |
| How? | All financial companies need to share customers' personal information to run their everyday business. In the section below, we list the reasons financial companies can share their customers' personal information; the reasons MFS chooses to share; and whether you can limit this sharing. |
| Reasons we can share your personal information | Does MFS share? | Can you limit this sharing? |
| For our everyday business purposes – such as to process your transactions, maintain your account(s), respond to court orders and legal investigations, or report to credit bureaus | Yes | No |
| For our marketing purposes – to offer our products and services to you | No | We don't share |
| For joint marketing with other financial companies | No | We don't share |
| For our affiliates' everyday business purposes – information about your transactions and experiences | No | We don't share |
| For our affiliates' everyday business purposes – information about your creditworthiness | No | We don't share |
| For nonaffiliates to market to you | No | We don't share |
| Questions? | Call 800-225-2606 or go to mfs.com. |

| Who we are | |
| Who is providing this notice? | MFS Funds, MFS Investment Management, MFS Institutional Advisors, Inc., and MFS Heritage Trust Company. |
| What we do | |
| How does MFS protect my personal information? | To protect your personal information from unauthorized access and use, we use security measures that comply with federal law. These measures include procedural, electronic, and physical safeguards for the protection of the personal information we collect about you. |
| How does MFS collect my personal information? | We collect your personal information, for example, when you |
| • open an account or provide account information | |
| • direct us to buy securities or direct us to sell your securities | |
| • make a wire transfer | |
| We also collect your personal information from others, such as credit bureaus, affiliates, or other companies. | |
| Why can't I limit all sharing? | Federal law gives you the right to limit only |
| • sharing for affiliates' everyday business purposes – information about your creditworthiness | |
| • affiliates from using your information to market to you | |
| • sharing for nonaffiliates to market to you | |
| State laws and individual companies may give you additional rights to limit sharing. | |
| Definitions | |
| Affiliates | Companies related by common ownership or control. They can be financial and nonfinancial companies. |
| • MFS does not share personal information with affiliates, except for everyday business purposes as described on page one of this notice. | |
| Nonaffiliates | Companies not related by common ownership or control. They can be financial and nonfinancial companies. |
| • MFS does not share with nonaffiliates so they can market to you. | |
| Joint marketing | A formal agreement between nonaffiliated financial companies that together market financial products or services to you. |
| • MFS doesn't jointly market. | |
| Other important information |
| If you own an MFS product or receive an MFS service in the name of a third party such as a bank or broker-dealer, their privacy policy may apply to you instead of ours. |


| 1 | |
| 3 | |
| 5 | |
| 8 | |
| 10 | |
| 12 | |
| 14 | |
| 15 | |
| 16 | |
| 22 | |
| 37 | |
| 39 | |
| 43 | |
| 44 | |
| 44 | |
| 44 | |
| 44 | |
| 44 | |
| 45 |
| back cover |
| Active Security Selection (a) | Derivative Overlay Positions (b) | Net Market Exposure (c) | |||
| Strategic Allocation | MFS Growth Fund | 31.1% | |||
| MFS Value Fund | 30.1% | ||||
| MFS International Equity Fund | 29.8% | ||||
| Market Exposure Overlay | Mini MSCI EAFE Index Future JUN 16 23 | (23.1)% | |||
| Mini Russell 1000 Value Index Future JUN 16 23 | (23.5)% | ||||
| Mini Russell 1000 Growth Future JUN 16 23 | (24.8)% | ||||
| Net Equity Exposure | 19.6% | ||||
| Standard & Poor's 500 Index Option 3650.00 PUT JUN 16 23 | 0.1% | ||||
| Standard & Poor's 500 Index Option 3920.00 PUT JUN 16 23 | (0.4)% | ||||
| Standard & Poor's 500 Index Option 3250.00 PUT DEC 16 23 | (0.6)% | ||||
| Standard & Poors Index Option PUT(s) | (0.9)% | ||||
| Downside Hedge(s) | (0.9)% | ||||
| Net Equivalent Equity Exposure | 91.0% | (72.3)% | 18.7% | ||
| Limited Maturity U.S. Treasury Notes | 6.7% | ||||
| Cash | Cash & Cash Equivalents (d) | 2.3% | |||
| Other (e) | 72.3% | ||||
| Total Net Exposure Summary | 100.0% | ||||
| Microsoft Corp. | 4.4% |
| Alphabet, Inc., “A” | 1.9% |
| Apple, Inc. | 1.9% |
| Amazon.com, Inc. | 1.8% |
| U.S. Treasury Notes, 1.375%, 6/30/2023 | 1.7% |
| U.S. Treasury Notes, 1.375%, 9/30/2023 | 1.7% |
| U.S. Treasury Notes, 2.25%, 3/31/2024 | 1.7% |
| Mini MSCI EAFE Index Future JUN 16 23 | (23.1)% |
| Mini Russell 1000 Value Index Future JUN 16 23 | (23.5)% |
| Mini Russell 1000 Growth Future JUN 16 23 | (24.8)% |
| (a) | Represents the actively managed portion of the portfolio and for purposes of this presentation, components include the value of securities, less any securities sold short. The bond component will include any accrued interest amounts. This also reflects the equivalent exposure of certain derivative positions. These amounts may be negative from time to time. |
| (b) | Represents the tactical overlay portion of the portfolio which is how the fund manages its exposure to markets and currencies through the use of derivative positions. Percentages reflect the equivalent exposure of those derivative positions. |
| (c) | For purposes of this presentation, the components include the value of securities, less any securities sold short, and reflect the impact of the equivalent exposure of all derivative positions. These amounts may be negative from time to time. The bond component will include any accrued interest amounts. |
| (d) | Cash & Cash Equivalents includes any cash, investments in money market funds, short-term securities, and other assets less liabilities. Please see the Statement of Assets and Liabilities for additional information related to the fund’s cash position and other assets and liabilities. |
| (e) | Other includes currency derivatives and/or the offsetting of the leverage produced by the fund’s derivative positions. |
| (i) | For purposes of this presentation, the components include a look-through to the individual holdings within the underlying affiliated funds. |

| Share Class | Class Inception Date | 1-yr | 5-yr | Life (t) |
| A | 6/27/14 | 2.22% | 2.30% | 2.29% |
| B | 6/27/14 | 1.48% | 1.45% | 1.42% |
| C | 6/27/14 | 1.40% | 1.43% | 1.42% |
| I | 6/27/14 | 2.49% | 2.47% | 2.44% |
| R1 | 6/27/14 | 1.39% | 1.45% | 1.42% |
| R2 | 6/27/14 | 1.94% | 1.94% | 1.93% |
| R3 | 6/27/14 | 2.17% | 2.21% | 2.18% |
| R4 | 6/27/14 | 2.51% | 2.47% | 2.44% |
| R6 | 10/02/17 | 2.50% | 2.52% | 2.71% |
| ICE BofA 0-3 Month U.S. Treasury Bill Index (f) | 3.31% | 1.48% | 1.02% |
| Standard & Poor's 500 Stock Index (f) | 2.92% | 11.01% | 10.94% |
| A With Initial Sales Charge (5.75%) | (3.66)% | 1.09% | 1.62% |
| B With CDSC (Declining over six years from 4% to 0%) (v) | (2.52)% | 1.07% | 1.42% |
| C With CDSC (1% for 12 months) (v) | 0.40% | 1.43% | 1.42% |
| (f) | Source: FactSet Research Systems Inc. |
| (t) | For the period from the class inception date through the stated period end. The comparative benchmark performance information provided for the “life” period is from the inception date of the Class A shares. (See Notes to Performance Summary.) |
| (v) | Assuming redemption at the end of the applicable period. |
| (d) | Source ICE Data Indices, LLC (“ICE Data”), is used with permission. ICE Data, its affiliates and their respective third party suppliers disclaim any and all warranties and representations, express and/or implied, including any warranties of merchantability or fitness for a particular purpose or use, including the indices, index data and any data included in, related to, or derived therefrom. Neither ICE Data, its affiliates nor their respective third party suppliers shall |
| (g) | “Standard & Poor's®” and “S&P®” are registered trademarks of Standard & Poor's Financial Services LLC (“S&P”) and Dow Jones is a registered trademark of Dow Jones Trademark Holdings LLC (“Dow Jones”) and have been licensed for use by S&P Dow Jones Indices LLC and sublicensed for certain purposes by MFS. The S&P 500® is a product of S&P Dow Jones Indices LLC, and has been licensed for use by MFS. MFS's product(s) is not sponsored, endorsed, sold, or promoted by S&P Dow Jones Indices LLC, Dow Jones, S&P, or their respective affiliates, and neither S&P Dow Jones Indices LLC, Dow Jones, S&P, nor their respective affiliates make any representation regarding the advisability of investing in such product(s). |
December 1, 2022 through May 31, 2023
| Share Class | Annualized Expense Ratio | Beginning Account Value 12/01/22 | Ending Account Value 5/31/23 | Expenses Paid During Period (p) 12/01/22-5/31/23 | |
| A | Actual | 0.94% | $1,000.00 | $1,014.11 | $4.72 |
| Hypothetical (h) | 0.94% | $1,000.00 | $1,020.24 | $4.73 | |
| B | Actual | 1.69% | $1,000.00 | $1,011.08 | $8.47 |
| Hypothetical (h) | 1.69% | $1,000.00 | $1,016.50 | $8.50 | |
| C | Actual | 1.69% | $1,000.00 | $1,010.20 | $8.47 |
| Hypothetical (h) | 1.69% | $1,000.00 | $1,016.50 | $8.50 | |
| I | Actual | 0.69% | $1,000.00 | $1,015.88 | $3.47 |
| Hypothetical (h) | 0.69% | $1,000.00 | $1,021.49 | $3.48 | |
| R1 | Actual | 1.69% | $1,000.00 | $1,010.15 | $8.47 |
| Hypothetical (h) | 1.69% | $1,000.00 | $1,016.50 | $8.50 | |
| R2 | Actual | 1.19% | $1,000.00 | $1,013.01 | $5.97 |
| Hypothetical (h) | 1.19% | $1,000.00 | $1,019.00 | $5.99 | |
| R3 | Actual | 0.94% | $1,000.00 | $1,014.49 | $4.72 |
| Hypothetical (h) | 0.94% | $1,000.00 | $1,020.24 | $4.73 | |
| R4 | Actual | 0.69% | $1,000.00 | $1,016.11 | $3.47 |
| Hypothetical (h) | 0.69% | $1,000.00 | $1,021.49 | $3.48 | |
| R6 | Actual | 0.61% | $1,000.00 | $1,015.18 | $3.06 |
| Hypothetical (h) | 0.61% | $1,000.00 | $1,021.89 | $3.07 |
| (h) | 5% class return per year before expenses. |
| (p) | “Expenses Paid During Period” are equal to each class’s annualized expense ratio, as shown above, multiplied by the average account value over the period, multiplied by 182/365 (to reflect the one-half year period). Expenses paid do not include any applicable sales charges (loads). If these transaction costs had been included, your costs would have been higher. In addition to the fees and expenses which the fund bears directly, the fund indirectly bears a pro rata share of the fees and expenses of the underlying funds in which the fund invests. If these indirect costs were included, your costs would have been higher. |
| Issuer | Shares/Par | Value ($) | ||
| Bonds – 6.7% | ||||
| U.S. Treasury Obligations – 6.7% | ||||
| U.S. Treasury Notes, 1.375%, 6/30/2023 | $ | 1,000,000 | $996,901 | |
| U.S. Treasury Notes, 1.375%, 9/30/2023 (f) | 1,000,000 | 986,875 | ||
| U.S. Treasury Notes, 0.75%, 12/31/2023 (f) | 1,000,000 | 973,867 | ||
| U.S. Treasury Notes, 2.25%, 3/31/2024 (f) | 1,000,000 | 975,586 | ||
| Total Bonds (Identified Cost, $3,996,969) | $3,933,229 | |||
| Investment Companies (h) – 92.6% | ||||
| International Stock Funds – 29.8% | ||||
| MFS International Equity Fund - Class R6 | 569,390 | $17,508,732 | ||
| U.S. Stock Funds – 61.2% | ||||
| MFS Growth Fund - Class R6 | 116,762 | $18,259,258 | ||
| MFS Value Fund - Class R6 | 387,406 | 17,623,099 | ||
| $35,882,357 | ||||
| Money Market Funds – 1.6% | ||||
| MFS Institutional Money Market Portfolio, 4.88% (v) | 958,614 | $958,518 | ||
| Total Investment Companies (Identified Cost, $34,698,091) | $54,349,607 | |||
| Underlying/Expiration Date/Exercise Price | Put/Call | Counterparty | Notional Amount | Par Amount/ Number of Contracts | |
| Purchased Options – 0.1% | |||||
| Market Index Securities – 0.1% | |||||
| S&P 500 Index – June 2023 @ $3,920 | Put | Exchange Traded | $ 3,343,864 | 8 | $6,064 |
| S&P 500 Index – December 2023 @ $3,250 | Put | Exchange Traded | 4,179,830 | 10 | 35,050 |
| Total Purchased Options (Premiums Paid, $101,386) | $41,114 | ||||
| Written Options (see table below) – (0.0)% | ||||
| (Premiums Received, $7,968) | $(2,056) | |||
| Other Assets, Less Liabilities – 0.6% | 334,540 | |||
| Net Assets – 100.0% | $58,656,434 | |||
| (f) | All or a portion of the security has been segregated as collateral for open futures contracts. |
| (h) | An affiliated issuer, which may be considered one in which the fund owns 5% or more of the outstanding voting securities, or a company which is under common control. At period end, the aggregate values of the fund's investments in affiliated issuers and in unaffiliated issuers were $54,349,607 and $3,974,343, respectively. | |||
| (v) | Affiliated issuer that is available only to investment companies managed by MFS. The rate quoted for the MFS Institutional Money Market Portfolio is the annualized seven-day yield of the fund at period end. |
| Written Options | |||||||
| Underlying | Put/ Call | Counterparty | Par Amount/ Number of Contracts | Notional Amount | Exercise Price | Expiration Date | Value |
| Liability Derivatives | |||||||
| Market Index Securities | |||||||
| S&P 500 Index | Put | Exchange Traded | 8 | $3,343,864 | $3,650.00 | June – 2023 | $(2,056) |
| Futures Contracts | ||||||
| Description | Long/ Short | Currency | Contracts | Notional Amount | Expiration Date | Value/Unrealized Appreciation (Depreciation) |
| Asset Derivatives | ||||||
| Equity Futures | ||||||
| Mini Russell 1000 Value Index | Short | USD | 188 | $13,755,960 | June – 2023 | $23,026 |
| Liability Derivatives | ||||||
| Equity Futures | ||||||
| Mini MSCI EAFE Index | Short | USD | 132 | $13,552,440 | June – 2023 | $(135,581) |
| Mini Russell 1000 Growth Index | Short | USD | 112 | 14,568,400 | June – 2023 | (1,824,458) |
| $(1,960,039) | ||||||
| Assets | |
| Investments in unaffiliated issuers, at value (identified cost, $4,098,355) | $3,974,343 |
| Investments in affiliated issuers, at value (identified cost, $34,698,091) | 54,349,607 |
| Receivables for | |
| Net daily variation margin on open futures contracts | 325,522 |
| Investments sold | 125,308 |
| Fund shares sold | 5,238 |
| Interest | 15,063 |
| Receivable from investment adviser | 6,779 |
| Other assets | 334 |
| Total assets | $58,802,194 |
| Liabilities | |
| Payables for | |
| Fund shares reacquired | $66,410 |
| Written options (premiums received, $7,968) | 2,056 |
| Payable to affiliates | |
| Administrative services fee | 103 |
| Shareholder servicing costs | 14,495 |
| Distribution and service fees | 191 |
| Payable for independent Trustees' compensation | 30 |
| Accrued expenses and other liabilities | 62,475 |
| Total liabilities | $145,760 |
| Net assets | $58,656,434 |
| Net assets consist of | |
| Paid-in capital | $56,002,200 |
| Total distributable earnings (loss) | 2,654,234 |
| Net assets | $58,656,434 |
| Shares of beneficial interest outstanding | 5,113,218 |
| Net assets | Shares outstanding | Net asset value per share (a) | |
| Class A | $3,646,307 | 317,112 | $11.50 |
| Class B | 71,419 | 6,525 | 10.95 |
| Class C | 2,369,300 | 217,597 | 10.89 |
| Class I | 46,564,068 | 4,049,639 | 11.50 |
| Class R1 | 56,787 | 5,187 | 10.95 |
| Class R2 | 59,073 | 5,210 | 11.34 |
| Class R3 | 60,190 | 5,253 | 11.46 |
| Class R4 | 61,340 | 5,336 | 11.50 |
| Class R6 | 5,767,950 | 501,359 | 11.50 |
| (a) | Maximum offering price per share was equal to the net asset value per share for all share classes, except for Class A, for which the maximum offering price per share was $12.20 [100 / 94.25 x $11.50]. On sales of $50,000 or more, the maximum offering price of Class A shares is reduced. A contingent deferred sales charge may be imposed on redemptions of Class A, Class B, and Class C shares. Redemption price per share was equal to the net asset value per share for Classes I, R1, R2, R3, R4, and R6. |
| Net investment income (loss) | |
| Income | |
| Dividends from affiliated issuers | $848,664 |
| Interest | 91,596 |
| Other | 24 |
| Total investment income | $940,284 |
| Expenses | |
| Management fee | $297,144 |
| Distribution and service fees | 44,880 |
| Shareholder servicing costs | 71,721 |
| Administrative services fee | 22,948 |
| Independent Trustees' compensation | 3,623 |
| Custodian fee | 11,093 |
| Shareholder communications | 13,347 |
| Audit and tax fees | 49,803 |
| Legal fees | 443 |
| Registration fees | 125,280 |
| Miscellaneous | 58,074 |
| Total expenses | $698,356 |
| Reduction of expenses by investment adviser | (80,700) |
| Net expenses | $617,656 |
| Net investment income (loss) | $322,628 |
| Realized and unrealized gain (loss) | |
| Realized gain (loss) (identified cost basis) | |
| Unaffiliated issuers | $(377,253) |
| Affiliated issuers | 10,165,467 |
| Capital gain distributions from affiliated issuers | 1,764,380 |
| Written options | 11,055 |
| Futures contracts | 2,040,506 |
| Net realized gain (loss) | $13,604,155 |
| Change in unrealized appreciation or depreciation | |
| Unaffiliated issuers | $(14,275) |
| Affiliated issuers | (9,854,933) |
| Written options | 5,912 |
| Futures contracts | (2,392,971) |
| Net unrealized gain (loss) | $(12,256,267) |
| Net realized and unrealized gain (loss) | $1,347,888 |
| Change in net assets from operations | $1,670,516 |
| Year ended | ||
| 5/31/23 | 5/31/22 | |
| Change in net assets | ||
| From operations | ||
| Net investment income (loss) | $322,628 | $564,356 |
| Net realized gain (loss) | 13,604,155 | 6,634,967 |
| Net unrealized gain (loss) | (12,256,267) | (9,257,549) |
| Change in net assets from operations | $1,670,516 | $(2,058,226) |
| Total distributions to shareholders | $(565,489) | $(151,087) |
| Change in net assets from fund share transactions | $(46,142,741) | $(27,822,282) |
| Total change in net assets | $(45,037,714) | $(30,031,595) |
| Net assets | ||
| At beginning of period | 103,694,148 | 133,725,743 |
| At end of period | $58,656,434 | $103,694,148 |
| Class A | Year ended | ||||
| 5/31/23 | 5/31/22 | 5/31/21 | 5/31/20 | 5/31/19 | |
| Net asset value, beginning of period | $11.25 | $11.46 | $11.54 | $10.91 | $10.37 |
| Income (loss) from investment operations | |||||
| Net investment income (loss) (d) | $0.01 | $0.03 | $(0.01) | $0.09 | $0.07 |
| Net realized and unrealized gain (loss) | 0.24 | (0.24) | (0.05) | 0.60 | 0.51 |
| Total from investment operations | $0.25 | $(0.21) | $(0.06) | $0.69 | $0.58 |
| Less distributions declared to shareholders | |||||
| From net investment income | $— | $— | $(0.02) | $(0.06) | $(0.04) |
| Net asset value, end of period (x) | $11.50 | $11.25 | $11.46 | $11.54 | $10.91 |
| Total return (%) (r)(s)(t)(x) | 2.22 | (1.83) | (0.54) | 6.30 | 5.59 |
| Ratios (%) (to average net assets) and Supplemental data: | |||||
| Expenses before expense reductions (h) | 1.02 | 0.94 | 0.91 | 1.20 | 1.43 |
| Expenses after expense reductions (h) | 0.93 | 0.92 | 0.88 | 0.74 | 0.71 |
| Net investment income (loss) | 0.11(l) | 0.29 | (0.07) | 0.77 | 0.64 |
| Portfolio turnover | 19 | 19 | 50 | 28 | 17 |
| Net assets at end of period (000 omitted) | $3,646 | $10,280 | $14,339 | $12,826 | $8,205 |
| Class B | Year ended | ||||
| 5/31/23 | 5/31/22 | 5/31/21 | 5/31/20 | 5/31/19 | |
| Net asset value, beginning of period | $10.79 | $11.08 | $11.23 | $10.66 | $10.19 |
| Income (loss) from investment operations | |||||
| Net investment income (loss) (d) | $(0.06) | $(0.06) | $(0.09) | $(0.01) | $(0.03) |
| Net realized and unrealized gain (loss) | 0.22 | (0.23) | (0.06) | 0.58 | 0.50 |
| Total from investment operations | $0.16 | $(0.29) | $(0.15) | $0.57 | $0.47 |
| Less distributions declared to shareholders | |||||
| From net investment income | $— | $— | $— | $— | $— |
| Net asset value, end of period (x) | $10.95 | $10.79 | $11.08 | $11.23 | $10.66 |
| Total return (%) (r)(s)(t)(x) | 1.48 | (2.62) | (1.34) | 5.35 | 4.61 |
| Ratios (%) (to average net assets) and Supplemental data: | |||||
| Expenses before expense reductions (h) | 1.78 | 1.69 | 1.66 | 1.96 | 2.18 |
| Expenses after expense reductions (h) | 1.68 | 1.67 | 1.65 | 1.67 | 1.65 |
| Net investment income (loss) | (0.58)(l) | (0.53) | (0.84) | (0.05) | (0.31) |
| Portfolio turnover | 19 | 19 | 50 | 28 | 17 |
| Net assets at end of period (000 omitted) | $71 | $80 | $74 | $75 | $98 |
| Class C | Year ended | ||||
| 5/31/23 | 5/31/22 | 5/31/21 | 5/31/20 | 5/31/19 | |
| Net asset value, beginning of period | $10.74 | $11.02 | $11.18 | $10.62 | $10.15 |
| Income (loss) from investment operations | |||||
| Net investment income (loss) (d) | $(0.06) | $(0.06) | $(0.09) | $(0.02) | $(0.03) |
| Net realized and unrealized gain (loss) | 0.21 | (0.22) | (0.06) | 0.58 | 0.50 |
| Total from investment operations | $0.15 | $(0.28) | $(0.15) | $0.56 | $0.47 |
| Less distributions declared to shareholders | |||||
| From net investment income | $— | $— | $(0.01) | $— | $— |
| Net asset value, end of period (x) | $10.89 | $10.74 | $11.02 | $11.18 | $10.62 |
| Total return (%) (r)(s)(t)(x) | 1.40 | (2.54) | (1.35) | 5.27 | 4.63 |
| Ratios (%) (to average net assets) and Supplemental data: | |||||
| Expenses before expense reductions (h) | 1.78 | 1.69 | 1.67 | 1.94 | 2.19 |
| Expenses after expense reductions (h) | 1.68 | 1.67 | 1.66 | 1.67 | 1.65 |
| Net investment income (loss) | (0.57)(l) | (0.54) | (0.86) | (0.19) | (0.27) |
| Portfolio turnover | 19 | 19 | 50 | 28 | 17 |
| Net assets at end of period (000 omitted) | $2,369 | $3,870 | $6,363 | $2,462 | $1,074 |
| Class I | Year ended | ||||
| 5/31/23 | 5/31/22 | 5/31/21 | 5/31/20 | 5/31/19 | |
| Net asset value, beginning of period | $11.30 | $11.50 | $11.57 | $10.94 | $10.39 |
| Income (loss) from investment operations | |||||
| Net investment income (loss) (d) | $0.05 | $0.06 | $0.02 | $0.08 | $0.07 |
| Net realized and unrealized gain (loss) | 0.23 | (0.24) | (0.06) | 0.61 | 0.52 |
| Total from investment operations | $0.28 | $(0.18) | $(0.04) | $0.69 | $0.59 |
| Less distributions declared to shareholders | |||||
| From net investment income | $(0.08) | $(0.02) | $(0.03) | $(0.06) | $(0.04) |
| Net asset value, end of period (x) | $11.50 | $11.30 | $11.50 | $11.57 | $10.94 |
| Total return (%) (r)(s)(t)(x) | 2.49 | (1.61) | (0.37) | 6.33 | 5.74 |
| Ratios (%) (to average net assets) and Supplemental data: | |||||
| Expenses before expense reductions (h) | 0.78 | 0.69 | 0.66 | 0.94 | 1.16 |
| Expenses after expense reductions (h) | 0.68 | 0.67 | 0.65 | 0.67 | 0.65 |
| Net investment income (loss) | 0.43(l) | 0.54 | 0.17 | 0.67 | 0.64 |
| Portfolio turnover | 19 | 19 | 50 | 28 | 17 |
| Net assets at end of period (000 omitted) | $46,564 | $82,106 | $105,346 | $78,292 | $24,169 |
| Class R1 | Year ended | ||||
| 5/31/23 | 5/31/22 | 5/31/21 | 5/31/20 | 5/31/19 | |
| Net asset value, beginning of period | $10.80 | $11.08 | $11.23 | $10.66 | $10.19 |
| Income (loss) from investment operations | |||||
| Net investment income (loss) (d) | $(0.06) | $(0.06) | $(0.09) | $(0.01) | $(0.03) |
| Net realized and unrealized gain (loss) | 0.21 | (0.22) | (0.06) | 0.58 | 0.50 |
| Total from investment operations | $0.15 | $(0.28) | $(0.15) | $0.57 | $0.47 |
| Less distributions declared to shareholders | |||||
| From net investment income | $— | $— | $— | $— | $— |
| Net asset value, end of period (x) | $10.95 | $10.80 | $11.08 | $11.23 | $10.66 |
| Total return (%) (r)(s)(t)(x) | 1.39 | (2.53) | (1.34) | 5.35 | 4.61 |
| Ratios (%) (to average net assets) and Supplemental data: | |||||
| Expenses before expense reductions (h) | 1.78 | 1.68 | 1.66 | 1.96 | 2.19 |
| Expenses after expense reductions (h) | 1.68 | 1.67 | 1.65 | 1.67 | 1.65 |
| Net investment income (loss) | (0.60)(l) | (0.51) | (0.83) | (0.10) | (0.29) |
| Portfolio turnover | 19 | 19 | 50 | 28 | 17 |
| Net assets at end of period (000 omitted) | $57 | $56 | $57 | $58 | $55 |
| Class R2 | Year ended | ||||
| 5/31/23 | 5/31/22 | 5/31/21 | 5/31/20 | 5/31/19 | |
| Net asset value, beginning of period | $11.15 | $11.39 | $11.48 | $10.86 | $10.33 |
| Income (loss) from investment operations | |||||
| Net investment income (loss) (d) | $(0.01) | $(0.00)(w) | $(0.04) | $0.04 | $0.02 |
| Net realized and unrealized gain (loss) | 0.23 | (0.24) | (0.05) | 0.59 | 0.51 |
| Total from investment operations | $0.22 | $(0.24) | $(0.09) | $0.63 | $0.53 |
| Less distributions declared to shareholders | |||||
| From net investment income | $(0.03) | $— | $— | $(0.01) | $— |
| Net asset value, end of period (x) | $11.34 | $11.15 | $11.39 | $11.48 | $10.86 |
| Total return (%) (r)(s)(t)(x) | 1.94 | (2.11) | (0.78) | 5.79 | 5.13 |
| Ratios (%) (to average net assets) and Supplemental data: | |||||
| Expenses before expense reductions (h) | 1.28 | 1.19 | 1.16 | 1.46 | 1.69 |
| Expenses after expense reductions (h) | 1.18 | 1.17 | 1.15 | 1.17 | 1.15 |
| Net investment income (loss) | (0.10)(l) | (0.01) | (0.33) | 0.40 | 0.21 |
| Portfolio turnover | 19 | 19 | 50 | 28 | 17 |
| Net assets at end of period (000 omitted) | $59 | $58 | $59 | $60 | $56 |
| Class R3 | Year ended | ||||
| 5/31/23 | 5/31/22 | 5/31/21 | 5/31/20 | 5/31/19 | |
| Net asset value, beginning of period | $11.27 | $11.48 | $11.55 | $10.92 | $10.37 |
| Income (loss) from investment operations | |||||
| Net investment income (loss) (d) | $0.02 | $0.03 | $(0.01) | $0.07 | $0.05 |
| Net realized and unrealized gain (loss) | 0.22 | (0.24) | (0.06) | 0.59 | 0.52 |
| Total from investment operations | $0.24 | $(0.21) | $(0.07) | $0.66 | $0.57 |
| Less distributions declared to shareholders | |||||
| From net investment income | $(0.05) | $— | $— | $(0.03) | $(0.02) |
| Net asset value, end of period (x) | $11.46 | $11.27 | $11.48 | $11.55 | $10.92 |
| Total return (%) (r)(s)(t)(x) | 2.17 | (1.83) | (0.61) | 6.09 | 5.49 |
| Ratios (%) (to average net assets) and Supplemental data: | |||||
| Expenses before expense reductions (h) | 1.03 | 0.94 | 0.91 | 1.21 | 1.44 |
| Expenses after expense reductions (h) | 0.93 | 0.92 | 0.90 | 0.92 | 0.90 |
| Net investment income (loss) | 0.15(l) | 0.24 | (0.09) | 0.65 | 0.45 |
| Portfolio turnover | 19 | 19 | 50 | 28 | 17 |
| Net assets at end of period (000 omitted) | $60 | $59 | $60 | $60 | $57 |
| Class R4 | Year ended | ||||
| 5/31/23 | 5/31/22 | 5/31/21 | 5/31/20 | 5/31/19 | |
| Net asset value, beginning of period | $11.30 | $11.50 | $11.57 | $10.93 | $10.39 |
| Income (loss) from investment operations | |||||
| Net investment income (loss) (d) | $0.05 | $0.06 | $0.02 | $0.10 | $0.07 |
| Net realized and unrealized gain (loss) | 0.23 | (0.24) | (0.07) | 0.60 | 0.51 |
| Total from investment operations | $0.28 | $(0.18) | $(0.05) | $0.70 | $0.58 |
| Less distributions declared to shareholders | |||||
| From net investment income | $(0.08) | $(0.02) | $(0.02) | $(0.06) | $(0.04) |
| Net asset value, end of period (x) | $11.50 | $11.30 | $11.50 | $11.57 | $10.93 |
| Total return (%) (r)(s)(t)(x) | 2.51 | (1.60) | (0.40) | 6.43 | 5.64 |
| Ratios (%) (to average net assets) and Supplemental data: | |||||
| Expenses before expense reductions (h) | 0.78 | 0.69 | 0.66 | 0.96 | 1.19 |
| Expenses after expense reductions (h) | 0.68 | 0.67 | 0.65 | 0.67 | 0.65 |
| Net investment income (loss) | 0.40(l) | 0.49 | 0.16 | 0.90 | 0.71 |
| Portfolio turnover | 19 | 19 | 50 | 28 | 17 |
| Net assets at end of period (000 omitted) | $61 | $60 | $61 | $61 | $57 |
| Class R6 | Year ended | ||||
| 5/31/23 | 5/31/22 | 5/31/21 | 5/31/20 | 5/31/19 | |
| Net asset value, beginning of period | $11.31 | $11.51 | $11.57 | $10.93 | $10.39 |
| Income (loss) from investment operations | |||||
| Net investment income (loss) (d) | $0.06 | $0.07 | $0.04 | $0.09 | $0.08 |
| Net realized and unrealized gain (loss) | 0.22 | (0.24) | (0.07) | 0.61 | 0.51 |
| Total from investment operations | $0.28 | $(0.17) | $(0.03) | $0.70 | $0.59 |
| Less distributions declared to shareholders | |||||
| From net investment income | $(0.09) | $(0.03) | $(0.03) | $(0.06) | $(0.05) |
| Net asset value, end of period (x) | $11.50 | $11.31 | $11.51 | $11.57 | $10.93 |
| Total return (%) (r)(s)(t)(x) | 2.50 | (1.53) | (0.27) | 6.44 | 5.67 |
| Ratios (%) (to average net assets) and Supplemental data: | |||||
| Expenses before expense reductions (h) | 0.70 | 0.61 | 0.59 | 0.91 | 1.18 |
| Expenses after expense reductions (h) | 0.60 | 0.59 | 0.58 | 0.62 | 0.64 |
| Net investment income (loss) | 0.51(l) | 0.59 | 0.32 | 0.84 | 0.74 |
| Portfolio turnover | 19 | 19 | 50 | 28 | 17 |
| Net assets at end of period (000 omitted) | $5,768 | $7,125 | $7,366 | $14,345 | $5,621 |
| (d) | Per share data is based on average shares outstanding. |
| (h) | In addition to the fees and expenses which the fund bears directly, the fund indirectly bears a pro rata share of the fees and expenses of the underlying affiliated funds in which the fund invests. Accordingly, the expense ratio for the fund reflects only those fees and expenses borne directly by the fund. Because the underlying affiliated funds have varied expense and fee levels and the fund may own different proportions of the underlying affiliated funds at different times, the amount of fees and expenses incurred indirectly by the fund will vary. |
| (l) | The ratios and per share amounts do not include net investment income of the underlying affiliated funds in which the fund invests. |
| (r) | Certain expenses have been reduced without which performance would have been lower. |
| (s) | From time to time the fund may receive proceeds from litigation settlements, without which performance would be lower. |
| (t) | Total returns do not include any applicable sales charges. |
| (w) | Per share amount was less than $0.01. |
| (x) | The net asset values and total returns have been calculated on net assets which include adjustments made in accordance with U.S. generally accepted accounting principles required at period end for financial reporting purposes. |
| Financial Instruments | Level 1 | Level 2 | Level 3 | Total |
| Equity Securities | $41,114 | $— | $— | $41,114 |
| U.S. Treasury Bonds & U.S. Government Agencies & Equivalents | — | 3,933,229 | — | 3,933,229 |
| Mutual Funds | 54,349,607 | — | — | 54,349,607 |
| Total | $54,390,721 | $3,933,229 | $— | $58,323,950 |
| Other Financial Instruments | ||||
| Futures Contracts – Assets | $23,026 | $— | $— | $23,026 |
| Futures Contracts – Liabilities | (1,960,039) | — | — | (1,960,039) |
| Written Options - Liabilities | (2,056) | — | — | (2,056) |
| Fair Value (a) | |||
| Risk | Derivative Contracts | Asset Derivatives | Liability Derivatives |
| Equity | Written Option Contracts | $— | $(2,056) |
| Equity | Purchased Option Contracts | 41,114 | — |
| Equity | Futures Contracts | 23,026 | (1,960,039) |
| Total | $64,140 | $(1,962,095) | |
| (a) | The value of purchased options outstanding is included in investments in unaffiliated issuers, at value, within the Statement of Assets and Liabilities. Values presented in this table for futures contracts correspond to the values reported in the Portfolio of Investments. Only the current day net variation margin for futures contracts is reported separately within the Statement of Assets and Liabilities. |
| Risk | Futures Contracts | Unaffiliated Issuers (Purchased Options) | Written Options |
| Equity | $2,040,506 | $(360,056) | $11,055 |
| Risk | Futures Contracts | Unaffiliated Issuers (Purchased Options) | Written Options |
| Equity | $(2,392,971) | $(33,492) | $5,912 |
| Gross Amounts of: | Derivative Assets | Derivative Liabilities |
| Futures Contracts (a) | $325,522 | $— |
| Purchased Options | 41,114 | — |
| Written Options | — | (2,056) |
| Total Gross Amount of Derivative Assets and Liabilities Presented in the Statement of Assets & Liabilities | $366,636 | $(2,056) |
| Less: Derivative Assets and Liabilities Not Subject to a Master Netting Agreement or Similar Arrangement | 366,636 | (2,056) |
| Total Gross Amount of Derivative Assets and Liabilities Subject to a Master Netting Agreement or Similar Arrangement | $— | $— |
| (a) | The amount presented here represents the fund's current day net variation margin for futures contracts. This amount, which is recognized within the Statement of Assets and Liabilities, differs from the fair value of the futures contracts which is presented in the tables that follow the Portfolio of Investments. |
| Year ended 5/31/23 | Year ended 5/31/22 | |
| Ordinary income (including any short-term capital gains) | $565,489 | $151,087 |
| As of 5/31/23 | |
| Cost of investments | $37,848,776 |
| Gross appreciation | 18,599,931 |
| Gross depreciation | (63,826) |
| Net unrealized appreciation (depreciation) | $18,536,105 |
| Undistributed ordinary income | 319,558 |
| Capital loss carryforwards | (16,201,429) |
| Total distributable earnings (loss) | $2,654,234 |
| Short-Term | $(13,752,271) |
| Long-Term | (2,449,158) |
| Total | $(16,201,429) |
| Year ended 5/31/23 | Year ended 5/31/22 | |
| Class I | $514,052 | $133,675 |
| Class R2 | 133 | — |
| Class R3 | 280 | — |
| Class R4 | 435 | 89 |
| Class R6 | 50,589 | 17,323 |
| Total | $565,489 | $151,087 |
closing agreement expenses), and investment-related expenses (such as fees and expenses associated with investments in investment companies and other similar investment vehicles), such that total fund operating expenses do not exceed the following rates annually of each class’s average daily net assets:
| Classes | ||||||||
| A | B | C | I | R1 | R2 | R3 | R4 | R6 |
| 0.91% | 1.66% | 1.66% | 0.66% | 1.66% | 1.16% | 0.91% | 0.66% | 0.63% |
| Distribution Fee Rate (d) | Service Fee Rate (d) | Total Distribution Plan (d) | Annual Effective Rate (e) | Distribution and Service Fee | |
| Class A | — | 0.25% | 0.25% | 0.25% | $ 11,609 |
| Class B | 0.75% | 0.25% | 1.00% | 1.00% | 763 |
| Class C | 0.75% | 0.25% | 1.00% | 1.00% | 31,512 |
| Class R1 | 0.75% | 0.25% | 1.00% | 1.00% | 558 |
| Class R2 | 0.25% | 0.25% | 0.50% | 0.50% | 290 |
| Class R3 | — | 0.25% | 0.25% | 0.25% | 148 |
| Total Distribution and Service Fees | $44,880 |
| (d) | In accordance with the distribution plan for certain classes, the fund pays distribution and/or service fees equal to these annual percentage rates of each class’s average daily net assets. The distribution and service fee rates disclosed by class represent the current rates in effect at the end of the reporting period. Any rate changes, if applicable, are detailed below. |
| (e) | The annual effective rates represent actual fees incurred under the distribution plan for the year ended May 31, 2023 based on each class's average daily net assets. MFD has voluntarily agreed to rebate a portion of each class's 0.25% service fee attributable to accounts for which there is no financial intermediary specified on the account except for accounts attributable to MFS or its affiliates' seed money. For the year ended May 31, 2023, there were no service fee rebates. |
| Amount | |
| Class A | $— |
| Class B | — |
| Class C | 30 |
| Purchases | Sales | |
| U.S. Government securities | $970,980 | $1,000,000 |
| Non-U.S. Government securities | 14,551,190 | 57,663,606 |
| Year ended 5/31/23 | Year ended 5/31/22 | ||||
| Shares | Amount | Shares | Amount | ||
| Shares sold | |||||
| Class A | 85,213 | $954,991 | 305,058 | $3,514,808 | |
| Class B | — | — | 926 | 10,000 | |
| Class C | 24,881 | 266,864 | 42,571 | 467,117 | |
| Class I | 1,631,940 | 18,412,053 | 3,433,370 | 39,470,696 | |
| Class R6 | 11,335 | 128,413 | 159,359 | 1,845,380 | |
| 1,753,369 | $19,762,321 | 3,941,284 | $45,308,001 | ||
| Year ended 5/31/23 | Year ended 5/31/22 | ||||
| Shares | Amount | Shares | Amount | ||
| Shares issued to shareholders in reinvestment of distributions | |||||
| Class I | 45,244 | $511,263 | 11,407 | $132,667 | |
| Class R2 | 12 | 133 | — | — | |
| Class R3 | 25 | 280 | — | — | |
| Class R4 | 39 | 435 | 7 | 89 | |
| Class R6 | 24 | 275 | 18 | 211 | |
| 45,344 | $512,386 | 11,432 | $132,967 | ||
| Shares reacquired | |||||
| Class A | (682,150) | $(7,594,286) | (642,334) | $(7,261,632) | |
| Class B | (914) | (9,952) | (196) | (2,119) | |
| Class C | (167,709) | (1,801,193) | (259,488) | (2,851,807) | |
| Class I | (4,891,424) | (55,415,825) | (5,338,533) | (61,202,601) | |
| Class R6 | (139,802) | (1,596,192) | (169,394) | (1,945,091) | |
| (5,881,999) | $(66,417,448) | (6,409,945) | $(73,263,250) | ||
| Net change | |||||
| Class A | (596,937) | $(6,639,295) | (337,276) | $(3,746,824) | |
| Class B | (914) | (9,952) | 730 | 7,881 | |
| Class C | (142,828) | (1,534,329) | (216,917) | (2,384,690) | |
| Class I | (3,214,240) | (36,492,509) | (1,893,756) | (21,599,238) | |
| Class R2 | 12 | 133 | — | — | |
| Class R3 | 25 | 280 | — | — | |
| Class R4 | 39 | 435 | 7 | 89 | |
| Class R6 | (128,443) | (1,467,504) | (10,017) | (99,500) | |
| (4,083,286) | $(46,142,741) | (2,457,229) | $(27,822,282) | ||
| Affiliated Issuers | Beginning Value | Purchases | Sales Proceeds | Realized Gain (Loss) | Change in Unrealized Appreciation or Depreciation | Ending Value |
| MFS Growth Fund | $29,971,176 | $6,178,652 | $18,969,526 | $2,882,021 | $(1,803,065) | $18,259,258 |
| MFS Institutional Money Market Portfolio | 3,547,981 | 102,519,599 | 105,107,225 | (1,752) | (85) | 958,518 |
| MFS International Equity Fund | 31,678,368 | 5,313,538 | 21,118,908 | 4,022,903 | (2,387,169) | 17,508,732 |
| MFS Value Fund | 32,007,066 | 5,586,663 | 17,568,311 | 3,262,295 | (5,664,614) | 17,623,099 |
| $97,204,591 | $119,598,452 | $162,763,970 | $10,165,467 | $(9,854,933) | $54,349,607 |
| Affiliated Issuers | Dividend Income | Capital Gain Distributions |
| MFS Growth Fund | $— | $264,978 |
| MFS Institutional Money Market Portfolio | 85,381 | — |
| MFS International Equity Fund | 226,108 | 107,114 |
| MFS Value Fund | 537,175 | 1,392,288 |
| $848,664 | $1,764,380 |

July 14, 2023
| Name, Age | Position(s) Held with Fund | Trustee/Officer Since(h) | Number of MFS Funds overseen by the Trustee | Principal Occupations During the Past Five Years | Other Directorships During the Past Five Years (j) | |||||
| INTERESTED TRUSTEE | ||||||||||
| Michael W. Roberge (k) (age 56) | Trustee | January 2021 | 136 | Massachusetts Financial Services Company, Chairman (since January 2021); Chief Executive Officer (since January 2017); Director; Chairman of the Board (since January 2022); President (until December 2018); Chief Investment Officer (until December 2018) | N/A | |||||
| INDEPENDENT TRUSTEES | ||||||||||
| John P. Kavanaugh (age 68) | Trustee and Chair of Trustees | January 2009 | 136 | Private investor | N/A | |||||
| Steven E. Buller (age 71) | Trustee | February 2014 | 136 | Private investor | N/A | |||||
| John A. Caroselli (age 69) | Trustee | March 2017 | 136 | Private investor; JC Global Advisors, LLC (management consulting), President (since 2015) | N/A | |||||
| Maureen R. Goldfarb (age 68) | Trustee | January 2009 | 136 | Private investor | N/A | |||||
| Peter D. Jones (age 67) | Trustee | January 2019 | 136 | Private investor | N/A | |||||
| James W. Kilman, Jr. (age 62) | Trustee | January 2019 | 136 | Burford Capital Limited (finance and investment management), Senior Advisor (since May 3, 2021), Chief Financial Officer (2019 - May 2, 2021); KielStrand Capital LLC (family office), Chief Executive Officer (since 2016) | Alpha-En Corporation, Director (2016-2019) |
| Name, Age | Position(s) Held with Fund | Trustee/Officer Since(h) | Number of MFS Funds overseen by the Trustee | Principal Occupations During the Past Five Years | Other Directorships During the Past Five Years (j) | |||||
| Clarence Otis, Jr. (age 67) | Trustee | March 2017 | 136 | Private investor | VF Corporation, Director; Verizon Communications, Inc., Director; The Travelers Companies, Director | |||||
| Maryanne L. Roepke (age 67) | Trustee | May 2014 | 136 | Private investor | N/A | |||||
| Laurie J. Thomsen (age 65) | Trustee | March 2005 | 136 | Private investor | The Travelers Companies, Director; Dycom Industries, Inc., Director |
| Name, Age | Position(s) Held with Fund | Trustee/Officer Since(h) | Number of MFS Funds for which the Person is an Officer | Principal Occupations During the Past Five Years | ||||
| OFFICERS | ||||||||
| Christopher R. Bohane (k) (age 49) | Assistant Secretary and Assistant Clerk | July 2005 | 136 | Massachusetts Financial Services Company, Senior Vice President and Senior Managing Counsel | ||||
| Kino Clark (k) (age 55) | Assistant Treasurer | January 2012 | 136 | Massachusetts Financial Services Company, Vice President | ||||
| John W. Clark, Jr. (k) (age 56) | Assistant Treasurer | April 2017 | 136 | Massachusetts Financial Services Company, Vice President | ||||
| David L. DiLorenzo (k) (age 54) | President | July 2005 | 136 | Massachusetts Financial Services Company, Senior Vice President | ||||
| Heidi W. Hardin (k) (age 55) | Secretary and Clerk | April 2017 | 136 | Massachusetts Financial Services Company, Executive Vice President and General Counsel | ||||
| Brian E. Langenfeld (k) (age 50) | Assistant Secretary and Assistant Clerk | June 2006 | 136 | Massachusetts Financial Services Company, Vice President and Managing Counsel |
| Name, Age | Position(s) Held with Fund | Trustee/Officer Since(h) | Number of MFS Funds for which the Person is an Officer | Principal Occupations During the Past Five Years | ||||
| Rosa E. Licea-Mailloux (k) (age 46) | Chief Compliance Officer | March 2022 | 136 | Massachusetts Financial Services Company, Vice President (since 2018); Director of Corporate Compliance (2018-2021), Senior Director Compliance (2021-2022), Senior Managing Director of North American Compliance & Chief Compliance Officer (since March 2022); Natixis Investment Managers (investment management), Funds Chief Compliance Officer, Deputy General Counsel & Senior Vice President (until 2018) | ||||
| Amanda S. Mooradian (k) (age 44) | Assistant Secretary and Assistant Clerk | September 2018 | 136 | Massachusetts Financial Services Company, Assistant Vice President and Senior Counsel | ||||
| Susan A. Pereira (k) (age 52) | Assistant Secretary and Assistant Clerk | July 2005 | 136 | Massachusetts Financial Services Company, Vice President and Managing Counsel | ||||
| Kasey L. Phillips (k) (age 52) | Assistant Treasurer | September 2012 | 136 | Massachusetts Financial Services Company, Vice President | ||||
| Matthew A. Stowe (k) (age 48) | Assistant Secretary and Assistant Clerk | October 2014 | 136 | Massachusetts Financial Services Company, Vice President and Senior Managing Counsel | ||||
| William B. Wilson (k) (age 40) | Assistant Secretary and Assistant Clerk | October 2022 | 136 | Massachusetts Financial Services Company, Assistant Vice President and Senior Counsel | ||||
| James O. Yost (k) (age 63) | Treasurer | September 1990 | 136 | Massachusetts Financial Services Company, Senior Vice President |
| (h) | Date first appointed to serve as Trustee/Officer of an MFS Fund. Each Trustee has served continuously since appointment unless indicated otherwise. From January 2012 through December 2016, Messrs. DiLorenzo and Yost served as Treasurer and Deputy Treasurer of the Funds, respectively. |
| (j) | Directorships or trusteeships of companies required to report to the Securities and Exchange Commission (i.e., “public companies”). |
| (k) | “Interested person” of the Trust within the meaning of the Investment Company Act of 1940 (referred to as the 1940 Act), which is the principal federal law governing investment companies like the fund, as a result of a position with MFS. The address of MFS is 111 Huntington Avenue, Boston, Massachusetts 02199-7618. |
| Investment Adviser | Custodian |
| Massachusetts Financial Services Company 111 Huntington Avenue Boston, MA 02199-7618 | State Street Bank and Trust Company 1 Congress Street, Suite 1 Boston, MA 02114-2016 |
| Distributor | Independent Registered Public Accounting Firm |
| MFS Fund Distributors, Inc. 111 Huntington Avenue Boston, MA 02199-7618 | Ernst & Young LLP 200 Clarendon Street Boston, MA 02116 |
| Portfolio Manager(s) | |
| William Adams Robert Almeida David Cole Mike Roberge Barnaby Wiener |
| FACTS | WHAT DOES MFS DO WITH YOUR PERSONAL INFORMATION? |
| Why? | Financial companies choose how they share your personal information. Federal law gives consumers the right to limit some but not all sharing. Federal law also requires us to tell you how we collect, share, and protect your personal information. Please read this notice carefully to understand what we do. |
| What? | The types of personal information we collect and share depend on the product or service you have with us. This information can include: |
| • Social Security number and account balances | |
| • Account transactions and transaction history | |
| • Checking account information and wire transfer instructions | |
| When you are no longer our customer, we continue to share your information as described in this notice. |
| How? | All financial companies need to share customers' personal information to run their everyday business. In the section below, we list the reasons financial companies can share their customers' personal information; the reasons MFS chooses to share; and whether you can limit this sharing. |
| Reasons we can share your personal information | Does MFS share? | Can you limit this sharing? |
| For our everyday business purposes – such as to process your transactions, maintain your account(s), respond to court orders and legal investigations, or report to credit bureaus | Yes | No |
| For our marketing purposes – to offer our products and services to you | No | We don't share |
| For joint marketing with other financial companies | No | We don't share |
| For our affiliates' everyday business purposes – information about your transactions and experiences | No | We don't share |
| For our affiliates' everyday business purposes – information about your creditworthiness | No | We don't share |
| For nonaffiliates to market to you | No | We don't share |
| Questions? | Call 800-225-2606 or go to mfs.com. |

| Who we are | |
| Who is providing this notice? | MFS Funds, MFS Investment Management, MFS Institutional Advisors, Inc., and MFS Heritage Trust Company. |
| What we do | |
| How does MFS protect my personal information? | To protect your personal information from unauthorized access and use, we use security measures that comply with federal law. These measures include procedural, electronic, and physical safeguards for the protection of the personal information we collect about you. |
| How does MFS collect my personal information? | We collect your personal information, for example, when you |
| • open an account or provide account information | |
| • direct us to buy securities or direct us to sell your securities | |
| • make a wire transfer | |
| We also collect your personal information from others, such as credit bureaus, affiliates, or other companies. | |
| Why can't I limit all sharing? | Federal law gives you the right to limit only |
| • sharing for affiliates' everyday business purposes – information about your creditworthiness | |
| • affiliates from using your information to market to you | |
| • sharing for nonaffiliates to market to you | |
| State laws and individual companies may give you additional rights to limit sharing. | |
| Definitions | |
| Affiliates | Companies related by common ownership or control. They can be financial and nonfinancial companies. |
| • MFS does not share personal information with affiliates, except for everyday business purposes as described on page one of this notice. | |
| Nonaffiliates | Companies not related by common ownership or control. They can be financial and nonfinancial companies. |
| • MFS does not share with nonaffiliates so they can market to you. | |
| Joint marketing | A formal agreement between nonaffiliated financial companies that together market financial products or services to you. |
| • MFS doesn't jointly market. | |
| Other important information |
| If you own an MFS product or receive an MFS service in the name of a third party such as a bank or broker-dealer, their privacy policy may apply to you instead of ours. |


Equity Fund

Equity Fund
| 1 | |
| 3 | |
| 6 | |
| 9 | |
| 11 | |
| 16 | |
| 18 | |
| 19 | |
| 20 | |
| 26 | |
| 38 | |
| 40 | |
| 44 | |
| 45 | |
| 45 | |
| 45 | |
| 45 | |
| 45 | |
| 46 |
| back cover |

| Taiwan Semiconductor Manufacturing Co. Ltd. | 8.9% |
| Samsung Electronics Co. Ltd. | 6.8% |
| Tencent Holdings Ltd. | 5.3% |
| Alibaba Group Holding Ltd. | 3.4% |
| Yum China Holdings, Inc. | 2.1% |
| Ping An Insurance Co. of China Ltd., “H” | 2.0% |
| Tata Consultancy Services Ltd. | 2.0% |
| HDFC Bank Ltd. | 2.0% |
| Hon Hai Precision Industry Co. Ltd. | 1.9% |
| Kotak Mahindra Bank Ltd. | 1.8% |
| Information Technology | 24.0% |
| Financials | 20.8% |
| Consumer Discretionary | 13.3% |
| Communication Services | 11.9% |
| Consumer Staples | 9.8% |
| Energy | 6.6% |
| Materials | 4.9% |
| Industrials | 2.8% |
| Real Estate | 2.3% |
| Health Care | 1.2% |
| Utilities | 0.7% |
| China | 28.5% |
| South Korea | 14.6% |
| India | 13.4% |
| Taiwan | 12.1% |
| Brazil | 8.5% |
| Hong Kong | 3.2% |
| Mexico | 2.6% |
| United States | 2.3% |
| United Arab Emirates | 2.1% |
| Other Countries | 12.7% |
| Hong Kong Dollar | 22.0% |
| South Korean Won | 14.6% |
| Indian Rupee | 12.9% |
| Taiwan Dollar | 12.1% |
| Brazilian Real | 8.5% |
| Chinese Renminbi | 7.6% |
| United States Dollar | 6.4% |
| Euro | 3.3% |
| Mexican Peso | 2.6% |
| Other Currencies | 10.0% |
| (g) | The Global Industry Classification Standard (GICS®) was developed by and/or is the exclusive property of MSCI, Inc. and S&P Global Market Intelligence Inc. (“S&P Global Market Intelligence”). GICS is a service mark of MSCI and S&P Global Market Intelligence and has been licensed for use by MFS. MFS has applied its own internal sector/industry classification methodology for equity securities and non-equity securities that are unclassified by GICS. |
| (x) | Represents the portfolio’s exposure to issuer countries as a percentage of a portfolio’s net assets. For purposes of this presentation, United States includes Cash & Cash Equivalents. |
| (y) | Represents the portfolio’s exposure to a particular currency as a percentage of a portfolio's net assets. For purposes of this presentation, United States Dollar includes Cash & Cash Equivalents. |
| (b) | Security is not a benchmark constituent. |
| (h) | Security was not held in the portfolio at period end. |
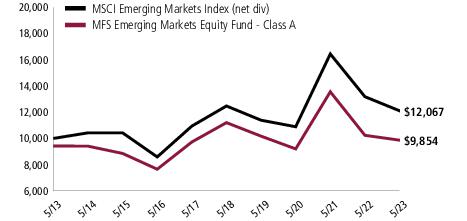
| Share Class | Class Inception Date | 1-yr | 5-yr | 10-yr |
| A | 10/24/95 | (3.75)% | (2.54)% | 0.45% |
| B | 10/24/95 | (4.47)% | (3.27)% | (0.31)% |
| C | 6/27/96 | (4.45)% | (3.27)% | (0.31)% |
| I | 1/02/97 | (3.54)% | (2.30)% | 0.69% |
| R1 | 10/01/08 | (4.47)% | (3.27)% | (0.31)% |
| R2 | 10/01/08 | (3.99)% | (2.79)% | 0.19% |
| R3 | 10/01/08 | (3.78)% | (2.54)% | 0.44% |
| R4 | 10/01/08 | (3.53)% | (2.30)% | 0.69% |
| R6 | 6/01/12 | (3.37)% | (2.17)% | 0.81% |
| MSCI Emerging Markets Index (net div) (f) | (8.49)% | (0.67)% | 1.90% |
| A With Initial Sales Charge (5.75%) | (9.28)% | (3.69)% | (0.15)% |
| B With CDSC (Declining over six years from 4% to 0%) (v) | (8.29)% | (3.65)% | (0.31)% |
| C With CDSC (1% for 12 months) (v) | (5.41)% | (3.27)% | (0.31)% |
| (f) | Source: FactSet Research Systems Inc. |
| (v) | Assuming redemption at the end of the applicable period. |
| (e) | Morgan Stanley Capital International (“MSCI”) makes no express or implied warranties or representations and shall have no liability whatsoever with respect to any MSCI data contained herein. The MSCI data may not be further redistributed or used as a basis for other indices or any securities or financial products. This report is not approved, reviewed, or produced by MSCI. |
December 1, 2022 through May 31, 2023
| Share Class | Annualized Expense Ratio | Beginning Account Value 12/01/22 | Ending Account value 5/31/23 | Expenses Paid During Period (p) 12/01/22–5/31/23 | |
| A | Actual | 1.31% | $1,000.00 | $1,032.17 | $6.64 |
| Hypothetical (h) | 1.31% | $1,000.00 | $1,018.40 | $6.59 | |
| B | Actual | 2.06% | $1,000.00 | $1,028.51 | $10.42 |
| Hypothetical (h) | 2.06% | $1,000.00 | $1,014.66 | $10.35 | |
| C | Actual | 2.06% | $1,000.00 | $1,028.39 | $10.42 |
| Hypothetical (h) | 2.06% | $1,000.00 | $1,014.66 | $10.35 | |
| I | Actual | 1.06% | $1,000.00 | $1,033.54 | $5.37 |
| Hypothetical (h) | 1.06% | $1,000.00 | $1,019.65 | $5.34 | |
| R1 | Actual | 2.06% | $1,000.00 | $1,028.53 | $10.42 |
| Hypothetical (h) | 2.06% | $1,000.00 | $1,014.66 | $10.35 | |
| R2 | Actual | 1.56% | $1,000.00 | $1,031.01 | $7.90 |
| Hypothetical (h) | 1.56% | $1,000.00 | $1,017.15 | $7.85 | |
| R3 | Actual | 1.31% | $1,000.00 | $1,032.19 | $6.64 |
| Hypothetical (h) | 1.31% | $1,000.00 | $1,018.40 | $6.59 | |
| R4 | Actual | 1.06% | $1,000.00 | $1,033.33 | $5.37 |
| Hypothetical (h) | 1.06% | $1,000.00 | $1,019.65 | $5.34 | |
| R6 | Actual | 0.89% | $1,000.00 | $1,034.25 | $4.51 |
| Hypothetical (h) | 0.89% | $1,000.00 | $1,020.49 | $4.48 |
| (h) | 5% class return per year before expenses. |
| (p) | “Expenses Paid During Period” are equal to each class’s annualized expense ratio, as shown above, multiplied by the average account value over the period, multiplied by 182/365 (to reflect the one-half year period). Expenses paid do not include any applicable sales charges (loads). If these transaction costs had been included, your costs would have been higher. |
| Issuer | Shares/Par | Value ($) | ||
| Common Stocks – 98.3% | ||||
| Alcoholic Beverages – 4.4% | ||||
| Ambev S.A., ADR | 29,127,819 | $81,266,615 | ||
| China Resources Beer Holdings Co. Ltd. | 9,426,000 | 59,465,854 | ||
| Jiangsu Yanghe Brewery JSC Ltd., “A” | 857,818 | 16,208,756 | ||
| Kweichow Moutai Co. Ltd., “A” | 439,409 | 100,747,892 | ||
| Wuliangye Yibin Co. Ltd., “A” | 1,949,418 | 44,227,126 | ||
| $301,916,243 | ||||
| Automotive – 2.6% | ||||
| BYD Co. Ltd. | 1,273,000 | $38,431,661 | ||
| Hero MotoCorp Ltd. | 1,579,314 | 52,685,224 | ||
| Mahindra & Mahindra Ltd. | 5,400,387 | 86,098,717 | ||
| $177,215,602 | ||||
| Biotechnology – 0.8% | ||||
| Hugel, Inc. (a)(h) | 637,003 | $52,217,688 | ||
| Brokerage & Asset Managers – 1.5% | ||||
| B3 Brasil Bolsa Balcao S.A. | 38,593,700 | $101,328,146 | ||
| Moscow Exchange MICEX-RTS PJSC (a)(u) | 65,313,565 | 0 | ||
| $101,328,146 | ||||
| Business Services – 4.7% | ||||
| Cognizant Technology Solutions Corp., “A” | 643,701 | $40,224,875 | ||
| Infosys Ltd. | 2,928,737 | 46,668,262 | ||
| Kingsoft Cloud Holdings, ADR (a)(l) | 2,935,686 | 13,093,159 | ||
| Tata Consultancy Services Ltd. | 3,475,724 | 138,198,133 | ||
| Tech Mahindra Ltd. | 6,397,943 | 86,269,327 | ||
| $324,453,756 | ||||
| Chemicals – 1.6% | ||||
| UPL Ltd. | 12,974,006 | $107,437,295 | ||
| Computer Software - Systems – 8.6% | ||||
| Hon Hai Precision Industry Co. Ltd. | 36,962,000 | $128,108,469 | ||
| Samsung Electronics Co. Ltd. | 8,703,383 | 468,202,333 | ||
| $596,310,802 | ||||
| Conglomerates – 0.6% | ||||
| LG Corp. | 647,851 | $41,977,914 | ||
| Issuer | Shares/Par | Value ($) | ||
| Common Stocks – continued | ||||
| Construction – 3.9% | ||||
| Anhui Conch Cement Co. Ltd. | 15,742,000 | $41,815,426 | ||
| Gree Electric Appliances, Inc., “A” | 14,883,982 | 69,094,325 | ||
| Midea Group Co. Ltd., “A” | 6,317,532 | 45,644,800 | ||
| Techtronic Industries Co. Ltd. | 8,637,000 | 80,133,077 | ||
| Zhejiang Supor Co. Ltd., “A” | 4,778,152 | 30,070,263 | ||
| $266,757,891 | ||||
| Consumer Products – 0.4% | ||||
| AmorePacific Corp. | 309,611 | $24,376,982 | ||
| Electronics – 9.2% | ||||
| SK Hynix, Inc. | 256,653 | $21,000,200 | ||
| Taiwan Semiconductor Manufacturing Co. Ltd. | 33,667,695 | 611,392,851 | ||
| $632,393,051 | ||||
| Energy - Independent – 0.6% | ||||
| Reliance Industries Ltd. | 1,509,512 | $45,065,370 | ||
| Energy - Integrated – 4.9% | ||||
| China Petroleum & Chemical Corp. | 137,660,000 | $86,669,834 | ||
| Galp Energia SGPS S.A., “B” | 9,423,041 | 99,675,390 | ||
| LUKOIL PJSC (a)(u) | 1,176,212 | 0 | ||
| Petroleo Brasileiro S.A., ADR | 10,578,217 | 122,072,624 | ||
| Petroleo Brasileiro S.A., ADR | 3,046,411 | 31,317,105 | ||
| $339,734,953 | ||||
| Engineering - Construction – 0.7% | ||||
| Doosan Bobcat, Inc. | 1,228,584 | $49,522,881 | ||
| Food & Beverages – 3.4% | ||||
| Gruma S.A.B. de C.V. | 3,887,053 | $59,744,020 | ||
| Inner Mongolia Yili Industrial Group Co. Ltd., “A” | 25,526,950 | 103,517,740 | ||
| Orion Corp. | 489,589 | 47,658,616 | ||
| Tingyi (Cayman Islands) Holding Corp. | 18,080,000 | 27,106,897 | ||
| $238,027,273 | ||||
| Food & Drug Stores – 0.4% | ||||
| BIM Birlesik Magazalar A.S. | 3,974,355 | $27,023,391 | ||
| Forest & Paper Products – 0.8% | ||||
| Suzano S.A. | 6,475,000 | $57,152,248 | ||
| Insurance – 5.8% | ||||
| AIA Group Ltd. | 9,722,200 | $93,243,328 | ||
| Discovery Ltd. (a) | 6,810,040 | 45,735,840 | ||
| Ping An Insurance Co. of China Ltd., “H” | 22,026,500 | 139,802,572 | ||
| Issuer | Shares/Par | Value ($) | ||
| Common Stocks – continued | ||||
| Insurance – continued | ||||
| Prudential PLC | 1,537,151 | $20,192,184 | ||
| Samsung Fire & Marine Insurance Co. Ltd. | 582,210 | 98,917,578 | ||
| $397,891,502 | ||||
| Internet – 9.0% | ||||
| Baidu, Inc., ADR (a) | 172,333 | $21,171,109 | ||
| MakeMyTrip Ltd. (a) | 1,441,138 | 37,570,468 | ||
| NAVER Corp. | 671,879 | 100,990,665 | ||
| NetEase, Inc., ADR | 1,106,815 | 94,167,820 | ||
| Tencent Holdings Ltd. | 9,288,300 | 368,426,589 | ||
| $622,326,651 | ||||
| Leisure & Toys – 0.3% | ||||
| NCsoft Corp. | 80,438 | $19,454,208 | ||
| Machinery & Tools – 1.4% | ||||
| Delta Electronics, Inc. | 9,645,000 | $99,345,619 | ||
| Major Banks – 3.1% | ||||
| Banco Bradesco S.A., ADR | 15,305,468 | $47,140,841 | ||
| Bandhan Bank Ltd. (a) | 16,148,152 | 52,309,989 | ||
| Erste Group Bank AG | 2,047,334 | 66,242,741 | ||
| Nedbank Group Ltd. | 4,629,147 | 48,869,707 | ||
| $214,563,278 | ||||
| Medical & Health Technology & Services – 0.1% | ||||
| Burning Rock Biotech Ltd., ADR (a)(l) | 3,436,036 | $8,968,054 | ||
| Metals & Mining – 1.5% | ||||
| PT United Tractors Tbk | 47,224,400 | $70,017,498 | ||
| Vale S.A., ADR | 2,806,509 | 35,586,534 | ||
| $105,604,032 | ||||
| Natural Gas - Distribution – 0.7% | ||||
| China Resources Gas Group Ltd. | 15,694,200 | $51,609,505 | ||
| Network & Telecom – 0.1% | ||||
| GDS Holdings Ltd., “A” (a) | 4,767,600 | $5,881,529 | ||
| Other Banks & Diversified Financials – 10.8% | ||||
| Bangkok Bank Public Co. Ltd. | 5,646,900 | $26,449,560 | ||
| China Construction Bank Corp. | 151,324,490 | 96,818,918 | ||
| China Merchants Bank Co Ltd. “A” | 9,173,400 | 41,706,663 | ||
| Credicorp Ltd. | 821,941 | 106,400,262 | ||
| Emirates NBD PJSC | 13,366,862 | 49,676,055 | ||
| Grupo Financiero Inbursa S.A. de C.V. (a) | 6,159,739 | 13,681,731 | ||
| Issuer | Shares/Par | Value ($) | ||
| Common Stocks – continued | ||||
| Other Banks & Diversified Financials – continued | ||||
| HDFC Bank Ltd. | 6,946,733 | $135,257,922 | ||
| KB Financial Group, Inc. | 1,627,162 | 58,846,318 | ||
| Komercní banka A.S. | 227,746 | 6,787,821 | ||
| Kotak Mahindra Bank Ltd. | 5,065,769 | 123,340,958 | ||
| Muthoot Finance Ltd. | 1,265,556 | 17,063,886 | ||
| Sberbank of Russia PJSC (a)(u) | 50,760,059 | 0 | ||
| SK Square Co. Ltd. (a) | 622,913 | 21,659,397 | ||
| Tisco Financial Group PCL | 17,783,300 | 49,312,887 | ||
| $747,002,378 | ||||
| Pharmaceuticals – 0.3% | ||||
| Genomma Lab Internacional S.A., “B” | 24,720,693 | $20,753,140 | ||
| Precious Metals & Minerals – 0.9% | ||||
| Gold Fields Ltd., ADR | 2,983,916 | $45,116,810 | ||
| Polymetal International PLC (a) | 6,292,661 | 14,481,345 | ||
| $59,598,155 | ||||
| Real Estate – 2.0% | ||||
| Emaar Properties PJSC | 54,830,970 | $91,809,163 | ||
| ESR Group Ltd. | 15,618,600 | 23,057,553 | ||
| Hang Lung Properties Ltd. | 16,061,000 | 25,433,583 | ||
| $140,300,299 | ||||
| Restaurants – 2.1% | ||||
| Yum China Holdings, Inc. | 2,558,015 | $144,425,527 | ||
| Specialty Chemicals – 0.5% | ||||
| Saudi Basic Industries Corp. | 1,460,624 | $34,346,549 | ||
| Specialty Stores – 7.5% | ||||
| Alibaba Group Holding Ltd. (a) | 23,518,448 | $233,969,580 | ||
| JD.com, Inc., “A” | 1,773,209 | 28,510,113 | ||
| JD.com, Inc., ADR | 114,190 | 3,722,594 | ||
| Lojas Renner S.A. | 23,805,877 | 91,266,889 | ||
| Multiplan Empreendimentos Imobiliarios S.A. | 4,349,997 | 22,747,604 | ||
| Vipshop Holdings Ltd., ADR (a) | 3,825,374 | 54,779,356 | ||
| Walmart de Mexico S.A.B. de C.V. | 21,885,772 | 83,168,160 | ||
| $518,164,296 | ||||
| Telecommunications - Wireless – 2.3% | ||||
| Advanced Info Service Public Co. Ltd. | 6,398,800 | $38,797,322 | ||
| Etihad Etisalat Co. | 5,077,073 | 58,204,687 | ||
| PT Telekom Indonesia | 224,869,600 | 60,605,282 | ||
| $157,607,291 | ||||
| Issuer | Shares/Par | Value ($) | ||
| Common Stocks – continued | ||||
| Telephone Services – 0.8% | ||||
| Hellenic Telecommunications Organization S.A. | 3,827,377 | $58,584,326 | ||
| Total Common Stocks (Identified Cost, $7,047,272,476) | $6,789,337,825 | |||
| Investment Companies (h) – 1.5% | ||||
| Money Market Funds – 1.5% | ||||
| MFS Institutional Money Market Portfolio, 4.88% (v) (Identified Cost, $102,828,866) | 102,827,113 | $102,816,830 | ||
| Collateral for Securities Loaned – 0.0% | ||||
| State Street Navigator Securities Lending Government Money Market Portfolio, 5.11% (j) (Identified Cost, $1,012,369) | 1,012,368 | $1,012,368 | ||
| Other Assets, Less Liabilities – 0.2% | 11,686,068 | |||
| Net Assets – 100.0% | $6,904,853,091 | |||
| (a) | Non-income producing security. | |||
| (h) | An affiliated issuer, which may be considered one in which the fund owns 5% or more of the outstanding voting securities, or a company which is under common control. At period end, the aggregate values of the fund's investments in affiliated issuers and in unaffiliated issuers were $155,034,518 and $6,738,132,505, respectively. | |||
| (j) | The rate quoted is the annualized seven-day yield of the fund at period end. | �� | ||
| (l) | A portion of this security is on loan. See Note 2 for additional information. | |||
| (u) | The security was valued using significant unobservable inputs and is considered level 3 under the fair value hierarchy. For further information about the fund’s level 3 holdings, please see Note 2 in the Notes to Financial Statements. | |||
| (v) | Affiliated issuer that is available only to investment companies managed by MFS. The rate quoted for the MFS Institutional Money Market Portfolio is the annualized seven-day yield of the fund at period end. |
| The following abbreviations are used in this report and are defined: | |
| ADR | American Depositary Receipt |
| PCL | Public Company Limited |
| Assets | |
| Investments in unaffiliated issuers, at value, including $939,688 of securities on loan (identified cost, $6,966,237,915) | $6,738,132,505 |
| Investments in affiliated issuers, at value (identified cost, $184,875,796) | 155,034,518 |
| Cash | 40,044 |
| Foreign currency, at value (identified cost, $87,997) | 87,170 |
| Receivables for | |
| Investments sold | 2,424,278 |
| Fund shares sold | 776,783 |
| Interest and dividends | 25,013,780 |
| Receivable from investment adviser | 706,873 |
| Other assets | 9,662 |
| Total assets | $6,922,225,613 |
| Liabilities | |
| Payables for | |
| Investments purchased | $4,743,469 |
| Fund shares reacquired | 1,206,715 |
| Collateral for securities loaned, at value | 1,012,368 |
| Payable to affiliates | |
| Administrative services fee | 3,389 |
| Shareholder servicing costs | 105,607 |
| Distribution and service fees | 2,574 |
| Payable for independent Trustees' compensation | 12 |
| Deferred foreign capital gains tax expense payable | 8,101,144 |
| Accrued expenses and other liabilities | 2,197,244 |
| Total liabilities | $17,372,522 |
| Net assets | $6,904,853,091 |
| Net assets consist of | |
| Paid-in capital | $7,868,146,126 |
| Total distributable earnings (loss) | (963,293,035) |
| Net assets | $6,904,853,091 |
| Shares of beneficial interest outstanding | 224,749,065 |
| Net assets | Shares outstanding | Net asset value per share (a) | |
| Class A | $157,908,579 | 5,426,566 | $29.10 |
| Class B | 673,307 | 25,216 | 26.70 |
| Class C | 3,702,425 | 142,427 | 26.00 |
| Class I | 95,628,880 | 3,109,567 | 30.75 |
| Class R1 | 1,295,640 | 50,973 | 25.42 |
| Class R2 | 2,028,360 | 76,718 | 26.44 |
| Class R3 | 1,286,087 | 44,221 | 29.08 |
| Class R4 | 4,137,882 | 142,763 | 28.98 |
| Class R6 | 6,638,191,931 | 215,730,614 | 30.77 |
| (a) | Maximum offering price per share was equal to the net asset value per share for all share classes, except for Class A, for which the maximum offering price per share was $30.88 [100 / 94.25 x $29.10]. On sales of $50,000 or more, the maximum offering price of Class A shares is reduced. A contingent deferred sales charge may be imposed on redemptions of Class A, Class B, and Class C shares. Redemption price per share was equal to the net asset value per share for Classes I, R1, R2, R3, R4, and R6. |
| Net investment income (loss) | |
| Income | |
| Dividends | $242,882,267 |
| Dividends from affiliated issuers | 3,571,279 |
| Other | 1,252,290 |
| Income on securities loaned | 37,484 |
| Interest | 6,539 |
| Foreign taxes withheld | (22,679,787) |
| Total investment income | $225,070,072 |
| Expenses | |
| Management fee | $57,334,584 |
| Distribution and service fees | 465,782 |
| Shareholder servicing costs | 546,658 |
| Administrative services fee | 664,235 |
| Independent Trustees' compensation | 104,243 |
| Custodian fee | 3,008,981 |
| Shareholder communications | 83,430 |
| Audit and tax fees | 133,260 |
| Legal fees | 30,998 |
| Miscellaneous | 545,084 |
| Total expenses | $62,917,255 |
| Reduction of expenses by investment adviser and distributor | (4,500,400) |
| Net expenses | $58,416,855 |
| Net investment income (loss) | $166,653,217 |
| Realized and unrealized gain (loss) | |
| Realized gain (loss) (identified cost basis) | |
| Unaffiliated issuers (net of $8,097,709 foreign capital gains tax) | $(326,507,947) |
| Affiliated issuers | (6,757,881) |
| Foreign currency | (3,669,607) |
| Net realized gain (loss) | $(336,935,435) |
| Change in unrealized appreciation or depreciation | |
| Unaffiliated issuers (net of $1,413,389 increase in deferred foreign capital gains tax) | $(48,363,558) |
| Affiliated issuers | (578,189) |
| Translation of assets and liabilities in foreign currencies | (119,671) |
| Net unrealized gain (loss) | $(49,061,418) |
| Net realized and unrealized gain (loss) | $(385,996,853) |
| Change in net assets from operations | $(219,343,636) |
| Year ended | ||
| 5/31/23 | 5/31/22 | |
| Change in net assets | ||
| From operations | ||
| Net investment income (loss) | $166,653,217 | $129,143,215 |
| Net realized gain (loss) | (336,935,435) | (264,573,890) |
| Net unrealized gain (loss) | (49,061,418) | (1,931,641,505) |
| Change in net assets from operations | $(219,343,636) | $(2,067,072,180) |
| Total distributions to shareholders | $(84,500,407) | $(166,001,001) |
| Change in net assets from fund share transactions | $406,972,932 | $1,602,080,719 |
| Total change in net assets | $103,128,889 | $(630,992,462) |
| Net assets | ||
| At beginning of period | 6,801,724,202 | 7,432,716,664 |
| At end of period | $6,904,853,091 | $6,801,724,202 |
| Class A | Year ended | ||||
| 5/31/23 | 5/31/22 | 5/31/21 | 5/31/20 | 5/31/19 | |
| Net asset value, beginning of period | $30.53 | $41.38 | $28.13 | $31.63 | $34.99 |
| Income (loss) from investment operations | |||||
| Net investment income (loss) (d) | $0.62 | $0.49 | $0.33 | $0.58 | $0.24 |
| Net realized and unrealized gain (loss) | (1.77) | (10.64) | 13.12 | (3.50) | (3.46) |
| Total from investment operations | $(1.15) | $(10.15) | $13.45 | $(2.92) | $(3.22) |
| Less distributions declared to shareholders | |||||
| From net investment income | $(0.28) | $(0.70) | $(0.20) | $(0.58) | $(0.14) |
| Net asset value, end of period (x) | $29.10 | $30.53 | $41.38 | $28.13 | $31.63 |
| Total return (%) (r)(s)(t)(x) | (3.75) | (24.78) | 47.89 | (9.55) | (9.19) |
| Ratios (%) (to average net assets) and Supplemental data: | |||||
| Expenses before expense reductions | 1.38 | 1.35 | 1.34 | 1.39 | 1.44 |
| Expenses after expense reductions | 1.31 | 1.31 | 1.31 | 1.30 | 1.42 |
| Net investment income (loss) | 2.18 | 1.38 | 0.89 | 1.82 | 0.72 |
| Portfolio turnover | 36 | 38 | 37 | 32 | 27 |
| Net assets at end of period (000 omitted) | $157,909 | $168,750 | $204,557 | $118,726 | $120,862 |
| Class B | Year ended | ||||
| 5/31/23 | 5/31/22 | 5/31/21 | 5/31/20 | 5/31/19 | |
| Net asset value, beginning of period | $27.95 | $37.84 | $25.78 | $29.01 | $32.18 |
| Income (loss) from investment operations | |||||
| Net investment income (loss) (d) | $0.36 | $0.20 | $0.05 | $0.35 | $(0.01) |
| Net realized and unrealized gain (loss) | (1.61) | (9.73) | 12.01 | (3.26) | (3.16) |
| Total from investment operations | $(1.25) | $(9.53) | $12.06 | $(2.91) | $(3.17) |
| Less distributions declared to shareholders | |||||
| From net investment income | $— | $(0.36) | $— | $(0.32) | $— |
| Net asset value, end of period (x) | $26.70 | $27.95 | $37.84 | $25.78 | $29.01 |
| Total return (%) (r)(s)(t)(x) | (4.47) | (25.33) | 46.78 | (10.24) | (9.85) |
| Ratios (%) (to average net assets) and Supplemental data: | |||||
| Expenses before expense reductions | 2.13 | 2.09 | 2.09 | 2.13 | 2.19 |
| Expenses after expense reductions | 2.06 | 2.06 | 2.06 | 2.06 | 2.17 |
| Net investment income (loss) | 1.40 | 0.59 | 0.16 | 1.19 | (0.04) |
| Portfolio turnover | 36 | 38 | 37 | 32 | 27 |
| Net assets at end of period (000 omitted) | $673 | $1,166 | $2,396 | $2,393 | $3,672 |
| Class C | Year ended | ||||
| 5/31/23 | 5/31/22 | 5/31/21 | 5/31/20 | 5/31/19 | |
| Net asset value, beginning of period | $27.23 | $36.91 | $25.15 | $28.33 | $31.42 |
| Income (loss) from investment operations | |||||
| Net investment income (loss) (d) | $0.35 | $0.20 | $0.06 | $0.33 | $(0.01) |
| Net realized and unrealized gain (loss) | (1.56) | (9.49) | 11.70 | (3.17) | (3.08) |
| Total from investment operations | $(1.21) | $(9.29) | $11.76 | $(2.84) | $(3.09) |
| Less distributions declared to shareholders | |||||
| From net investment income | $(0.02) | $(0.39) | $— | $(0.34) | $— |
| Net asset value, end of period (x) | $26.00 | $27.23 | $36.91 | $25.15 | $28.33 |
| Total return (%) (r)(s)(t)(x) | (4.45) | (25.33) | 46.76 | (10.23) | (9.83) |
| Ratios (%) (to average net assets) and Supplemental data: | |||||
| Expenses before expense reductions | 2.13 | 2.09 | 2.09 | 2.13 | 2.19 |
| Expenses after expense reductions | 2.06 | 2.06 | 2.06 | 2.06 | 2.17 |
| Net investment income (loss) | 1.39 | 0.62 | 0.18 | 1.16 | (0.04) |
| Portfolio turnover | 36 | 38 | 37 | 32 | 27 |
| Net assets at end of period (000 omitted) | $3,702 | $5,427 | $10,467 | $10,082 | $14,116 |
| Class I | Year ended | ||||
| 5/31/23 | 5/31/22 | 5/31/21 | 5/31/20 | 5/31/19 | |
| Net asset value, beginning of period | $32.24 | $43.63 | $29.64 | $33.29 | $36.85 |
| Income (loss) from investment operations | |||||
| Net investment income (loss) (d) | $0.74 | $0.60 | $0.43 | $0.66 | $0.32 |
| Net realized and unrealized gain (loss) | (1.88) | (11.21) | 13.84 | (3.65) | (3.63) |
| Total from investment operations | $(1.14) | $(10.61) | $14.27 | $(2.99) | $(3.31) |
| Less distributions declared to shareholders | |||||
| From net investment income | $(0.35) | $(0.78) | $(0.28) | $(0.66) | $(0.25) |
| Net asset value, end of period (x) | $30.75 | $32.24 | $43.63 | $29.64 | $33.29 |
| Total return (%) (r)(s)(t)(x) | (3.51) | (24.59) | 48.24 | (9.32) | (8.96) |
| Ratios (%) (to average net assets) and Supplemental data: | |||||
| Expenses before expense reductions | 1.13 | 1.09 | 1.09 | 1.15 | 1.20 |
| Expenses after expense reductions | 1.06 | 1.06 | 1.06 | 1.06 | 1.17 |
| Net investment income (loss) | 2.44 | 1.59 | 1.11 | 1.98 | 0.92 |
| Portfolio turnover | 36 | 38 | 37 | 32 | 27 |
| Net assets at end of period (000 omitted) | $95,629 | $93,329 | $168,061 | $94,350 | $69,443 |
| Class R1 | Year ended | ||||
| 5/31/23 | 5/31/22 | 5/31/21 | 5/31/20 | 5/31/19 | |
| Net asset value, beginning of period | $26.70 | $36.41 | $24.80 | $27.97 | $31.17 |
| Income (loss) from investment operations | |||||
| Net investment income (loss) (d) | $0.35 | $0.16 | $0.05 | $0.30 | $(0.05) |
| Net realized and unrealized gain (loss) | (1.54) | (9.30) | 11.56 | (3.09) | (3.04) |
| Total from investment operations | $(1.19) | $(9.14) | $11.61 | $(2.79) | $(3.09) |
| Less distributions declared to shareholders | |||||
| From net investment income | $(0.09) | $(0.57) | $— | $(0.38) | $(0.11) |
| Net asset value, end of period (x) | $25.42 | $26.70 | $36.41 | $24.80 | $27.97 |
| Total return (%) (r)(s)(t)(x) | (4.47) | (25.33) | 46.81 | (10.22) | (9.89) |
| Ratios (%) (to average net assets) and Supplemental data: | |||||
| Expenses before expense reductions | 2.13 | 2.10 | 2.09 | 2.14 | 2.19 |
| Expenses after expense reductions | 2.06 | 2.06 | 2.06 | 2.06 | 2.17 |
| Net investment income (loss) | 1.42 | 0.53 | 0.16 | 1.08 | (0.18) |
| Portfolio turnover | 36 | 38 | 37 | 32 | 27 |
| Net assets at end of period (000 omitted) | $1,296 | $1,414 | $725 | $1,742 | $1,844 |
| Class R2 | Year ended | ||||
| 5/31/23 | 5/31/22 | 5/31/21 | 5/31/20 | 5/31/19 | |
| Net asset value, beginning of period | $27.77 | $37.68 | $25.64 | $28.87 | $31.96 |
| Income (loss) from investment operations | |||||
| Net investment income (loss) (d) | $0.50 | $0.36 | $0.22 | $0.49 | $0.14 |
| Net realized and unrealized gain (loss) | (1.61) | (9.68) | 11.94 | (3.22) | (3.15) |
| Total from investment operations | $(1.11) | $(9.32) | $12.16 | $(2.73) | $(3.01) |
| Less distributions declared to shareholders | |||||
| From net investment income | $(0.22) | $(0.59) | $(0.12) | $(0.50) | $(0.08) |
| Net asset value, end of period (x) | $26.44 | $27.77 | $37.68 | $25.64 | $28.87 |
| Total return (%) (r)(s)(t)(x) | (3.99) | (24.96) | 47.47 | (9.76) | (9.42) |
| Ratios (%) (to average net assets) and Supplemental data: | |||||
| Expenses before expense reductions | 1.63 | 1.59 | 1.59 | 1.63 | 1.69 |
| Expenses after expense reductions | 1.56 | 1.56 | 1.56 | 1.56 | 1.67 |
| Net investment income (loss) | 1.92 | 1.11 | 0.67 | 1.68 | 0.48 |
| Portfolio turnover | 36 | 38 | 37 | 32 | 27 |
| Net assets at end of period (000 omitted) | $2,028 | $2,427 | $4,227 | $3,431 | $4,614 |
| Class R3 | Year ended | ||||
| 5/31/23 | 5/31/22 | 5/31/21 | 5/31/20 | 5/31/19 | |
| Net asset value, beginning of period | $30.51 | $41.17 | $27.95 | $31.47 | $34.84 |
| Income (loss) from investment operations | |||||
| Net investment income (loss) (d) | $0.63 | $0.56 | $0.41 | $0.51 | $0.21 |
| Net realized and unrealized gain (loss) | (1.78) | (10.69) | 12.96 | (3.41) | (3.42) |
| Total from investment operations | $(1.15) | $(10.13) | $13.37 | $(2.90) | $(3.21) |
| Less distributions declared to shareholders | |||||
| From net investment income | $(0.28) | $(0.53) | $(0.15) | $(0.62) | $(0.16) |
| Net asset value, end of period (x) | $29.08 | $30.51 | $41.17 | $27.95 | $31.47 |
| Total return (%) (r)(s)(t)(x) | (3.75) | (24.78) | 47.89 | (9.55) | (9.19) |
| Ratios (%) (to average net assets) and Supplemental data: | |||||
| Expenses before expense reductions | 1.38 | 1.34 | 1.34 | 1.39 | 1.44 |
| Expenses after expense reductions | 1.31 | 1.31 | 1.31 | 1.31 | 1.42 |
| Net investment income (loss) | 2.20 | 1.52 | 1.13 | 1.64 | 0.66 |
| Portfolio turnover | 36 | 38 | 37 | 32 | 27 |
| Net assets at end of period (000 omitted) | $1,286 | $1,406 | $5,103 | $6,246 | $2,405 |
| Class R4 | Year ended | ||||
| 5/31/23 | 5/31/22 | 5/31/21 | 5/31/20 | 5/31/19 | |
| Net asset value, beginning of period | $30.43 | $41.24 | $28.03 | $31.47 | $34.85 |
| Income (loss) from investment operations | |||||
| Net investment income (loss) (d) | $0.70 | $0.60 | $0.43 | $0.81 | $0.30 |
| Net realized and unrealized gain (loss) | (1.78) | (10.62) | 13.06 | (3.63) | (3.43) |
| Total from investment operations | $(1.08) | $(10.02) | $13.49 | $(2.82) | $(3.13) |
| Less distributions declared to shareholders | |||||
| From net investment income | $(0.37) | $(0.79) | $(0.28) | $(0.62) | $(0.25) |
| Net asset value, end of period (x) | $28.98 | $30.43 | $41.24 | $28.03 | $31.47 |
| Total return (%) (r)(s)(t)(x) | (3.53) | (24.57) | 48.20 | (9.31) | (8.97) |
| Ratios (%) (to average net assets) and Supplemental data: | |||||
| Expenses before expense reductions | 1.13 | 1.10 | 1.09 | 1.13 | 1.19 |
| Expenses after expense reductions | 1.06 | 1.06 | 1.06 | 1.06 | 1.17 |
| Net investment income (loss) | 2.46 | 1.70 | 1.20 | 2.54 | 0.93 |
| Portfolio turnover | 36 | 38 | 37 | 32 | 27 |
| Net assets at end of period (000 omitted) | $4,138 | $3,264 | $3,037 | $2,673 | $6,917 |
| Class R6 | Year ended | ||||
| 5/31/23 | 5/31/22 | 5/31/21 | 5/31/20 | 5/31/19 | |
| Net asset value, beginning of period | $32.26 | $43.67 | $29.66 | $33.30 | $36.86 |
| Income (loss) from investment operations | |||||
| Net investment income (loss) (d) | $0.79 | $0.66 | $0.47 | $0.70 | $0.37 |
| Net realized and unrealized gain (loss) | (1.88) | (11.24) | 13.86 | (3.64) | (3.65) |
| Total from investment operations | $(1.09) | $(10.58) | $14.33 | $(2.94) | $(3.28) |
| Less distributions declared to shareholders | |||||
| From net investment income | $(0.40) | $(0.83) | $(0.32) | $(0.70) | $(0.28) |
| Net asset value, end of period (x) | $30.77 | $32.26 | $43.67 | $29.66 | $33.30 |
| Total return (%) (r)(s)(t)(x) | (3.34) | (24.49) | 48.43 | (9.21) | (8.86) |
| Ratios (%) (to average net assets) and Supplemental data: | |||||
| Expenses before expense reductions | 0.97 | 0.95 | 0.98 | 1.03 | 1.06 |
| Expenses after expense reductions | 0.90 | 0.92 | 0.95 | 0.95 | 1.04 |
| Net investment income (loss) | 2.62 | 1.76 | 1.20 | 2.10 | 1.07 |
| Portfolio turnover | 36 | 38 | 37 | 32 | 27 |
| Net assets at end of period (000 omitted) | $6,638,192 | $6,524,541 | $7,034,144 | $3,336,889 | $1,817,161 |
| (d) | Per share data is based on average shares outstanding. |
| (r) | Certain expenses have been reduced without which performance would have been lower. |
| (s) | From time to time the fund may receive proceeds from litigation settlements, without which performance would be lower. |
| (t) | Total returns do not include any applicable sales charges. |
| (x) | The net asset values and total returns have been calculated on net assets which include adjustments made in accordance with U.S. generally accepted accounting principles required at period end for financial reporting purposes. |
| Financial Instruments | Level 1 | Level 2 | Level 3 | Total |
| Equity Securities: | ||||
| China | $1,970,053,662 | $— | $— | $1,970,053,662 |
| South Korea | 1,004,824,780 | — | — | 1,004,824,780 |
| India | 927,965,551 | — | — | 927,965,551 |
| Taiwan | 838,846,939 | — | — | 838,846,939 |
| Brazil | 589,878,606 | — | — | 589,878,606 |
| Hong Kong | 221,867,541 | — | — | 221,867,541 |
| Mexico | 177,347,051 | — | — | 177,347,051 |
| United Arab Emirates | 141,485,218 | — | — | 141,485,218 |
| South Africa | 139,722,357 | — | — | 139,722,357 |
| Other Countries | 689,235,911 | 88,110,209 | 0 | 777,346,120 |
| Mutual Funds | 103,829,198 | — | — | 103,829,198 |
| Total | $6,805,056,814 | $88,110,209 | $0 | $6,893,167,023 |
| Equity Securities | |
| Balance as of 5/31/22 | $9,364,582 |
| Change in unrealized appreciation or depreciation | (9,364,582) |
| Balance as of 5/31/23 | $0 |
| Year ended 5/31/23 | Year ended 5/31/22 | |
| Ordinary income (including any short-term capital gains) | $84,500,407 | $166,001,001 |
| As of 5/31/23 | |
| Cost of investments | $7,344,729,861 |
| Gross appreciation | 1,033,455,172 |
| Gross depreciation | (1,485,018,010) |
| Net unrealized appreciation (depreciation) | $(451,562,838) |
| Undistributed ordinary income | 97,874,717 |
| Capital loss carryforwards | (600,894,870) |
| Other temporary differences | (8,710,044) |
| Total distributable earnings (loss) | $(963,293,035) |
| Short-Term | $(121,464,022) |
| Long-Term | (479,430,848) |
| Total | $(600,894,870) |
| Year ended 5/31/23 | Year ended 5/31/22 | |
| Class A | $1,488,810 | $3,746,308 |
| Class B | — | 19,273 |
| Class C | 2,881 | 92,736 |
| Class I | 1,014,675 | 2,540,071 |
| Class R1 | 4,210 | 30,209 |
| Class R2 | 18,291 | 60,871 |
| Class R3 | 11,900 | 24,405 |
| Class R4 | 51,534 | 67,017 |
| Class R6 | 81,908,106 | 159,420,111 |
| Total | $84,500,407 | $166,001,001 |
| Up to $500 million | 1.05% |
| In excess of $500 million and up to $1 billion | 0.95% |
| In excess of $1 billion and up to $4 billion | 0.90% |
| In excess of $4 billion and up to $10 billion | 0.85% |
| In excess of $10 billion | 0.80% |
| Classes | ||||||||
| A | B | C | I | R1 | R2 | R3 | R4 | R6 |
| 1.31% | 2.06% | 2.06% | 1.06% | 2.06% | 1.56% | 1.31% | 1.06% | 0.95% |
| Distribution Fee Rate (d) | Service Fee Rate (d) | Total Distribution Plan (d) | Annual Effective Rate (e) | Distribution and Service Fee | |
| Class A | — | 0.25% | 0.25% | 0.25% | $ 388,035 |
| Class B | 0.75% | 0.25% | 1.00% | 1.00% | 8,190 |
| Class C | 0.75% | 0.25% | 1.00% | 1.00% | 43,208 |
| Class R1 | 0.75% | 0.25% | 1.00% | 1.00% | 12,508 |
| Class R2 | 0.25% | 0.25% | 0.50% | 0.50% | 10,756 |
| Class R3 | — | 0.25% | 0.25% | 0.25% | 3,085 |
| Total Distribution and Service Fees | $465,782 |
| (d) | In accordance with the distribution plan for certain classes, the fund pays distribution and/or service fees equal to these annual percentage rates of each class’s average daily net assets. The distribution and service fee rates disclosed by class represent the current rates in effect at the end of the reporting period. Any rate changes, if applicable, are detailed below. |
| (e) | The annual effective rates represent actual fees incurred under the distribution plan for the year ended May 31, 2023 based on each class's average daily net assets. MFD has voluntarily agreed to rebate a portion of each class's 0.25% service fee attributable to accounts for which there is no financial intermediary specified on the account except for accounts attributable to MFS or its affiliates' seed money. For the year ended May 31, 2023, this rebate amounted to $44 for Class A shares and is included in the reduction of total expenses in the Statement of Operations. |
| Amount | |
| Class A | $8,085 |
| Class B | 808 |
| Class C | 284 |
| Year ended 5/31/23 | Year ended 5/31/22 | ||||
| Shares | Amount | Shares | Amount | ||
| Shares sold | |||||
| Class A | 1,116,192 | $31,586,724 | 1,679,530 | $60,751,635 | |
| Class B | 47 | 1,236 | 963 | 31,949 | |
| Class C | 17,092 | 443,639 | 40,334 | 1,296,195 | |
| Class I | 1,596,262 | 48,699,126 | 1,072,350 | 40,125,547 | |
| Class R1 | 6,926 | 174,653 | 36,663 | 1,236,444 | |
| Class R2 | 13,923 | 362,690 | 15,641 | 502,926 | |
| Class R3 | 9,392 | 267,227 | 19,233 | 670,524 | |
| Class R4 | 88,076 | 2,424,825 | 73,753 | 2,450,523 | |
| Class R6 | 34,564,768 | 1,031,265,983 | 40,873,031 | 1,604,441,159 | |
| 37,412,678 | $1,115,226,103 | 43,811,498 | $1,711,506,902 | ||
| Shares issued to shareholders in reinvestment of distributions | |||||
| Class A | 51,966 | $1,467,510 | 102,772 | $3,671,014 | |
| Class B | — | — | 569 | 18,679 | |
| Class C | 107 | 2,710 | 2,639 | 84,368 | |
| Class I | 31,705 | 945,138 | 61,187 | 2,305,538 | |
| Class R1 | 170 | 4,210 | 964 | 30,209 | |
| Class R2 | 704 | 18,096 | 1,847 | 60,076 | |
| Class R3 | 422 | 11,900 | 684 | 24,404 | |
| Class R4 | 1,834 | 51,534 | 1,885 | 67,017 | |
| Class R6 | 2,747,172 | 81,893,191 | 4,230,665 | 159,411,469 | |
| 2,834,080 | $84,394,289 | 4,403,212 | $165,672,774 | ||
| Shares reacquired | |||||
| Class A | (1,269,057) | $(35,587,500) | (1,198,700) | $(41,848,332) | |
| Class B | (16,562) | (425,997) | (23,115) | (723,772) | |
| Class C | (74,066) | (1,867,043) | (127,255) | (3,991,921) | |
| Class I | (1,412,925) | (41,605,263) | (2,090,700) | (76,600,389) | |
| Class R1 | (9,102) | (220,402) | (4,550) | (137,415) | |
| Class R2 | (25,307) | (662,203) | (42,273) | (1,371,669) | |
| Class R3 | (11,677) | (332,283) | (97,790) | (3,639,461) | |
| Class R4 | (54,401) | (1,536,328) | (42,018) | (1,471,477) | |
| Class R6 | (23,799,936) | (710,410,441) | (3,973,878) | (145,314,521) | |
| (26,673,033) | $(792,647,460) | (7,600,279) | $(275,098,957) | ||
| Year ended 5/31/23 | Year ended 5/31/22 | ||||
| Shares | Amount | Shares | Amount | ||
| Net change | |||||
| Class A | (100,899) | $(2,533,266) | 583,602 | $22,574,317 | |
| Class B | (16,515) | (424,761) | (21,583) | (673,144) | |
| Class C | (56,867) | (1,420,694) | (84,282) | (2,611,358) | |
| Class I | 215,042 | 8,039,001 | (957,163) | (34,169,304) | |
| Class R1 | (2,006) | (41,539) | 33,077 | 1,129,238 | |
| Class R2 | (10,680) | (281,417) | (24,785) | (808,667) | |
| Class R3 | (1,863) | (53,156) | (77,873) | (2,944,533) | |
| Class R4 | 35,509 | 940,031 | 33,620 | 1,046,063 | |
| Class R6 | 13,512,004 | 402,748,733 | 41,129,818 | 1,618,538,107 | |
| 13,573,725 | $406,972,932 | 40,614,431 | $1,602,080,719 | ||
| Affiliated Issuers | Beginning Value | Purchases | Sales Proceeds | Realized Gain (Loss) | Change in Unrealized Appreciation or Depreciation | Ending Value |
| Hugel, Inc. | $47,738,861 | $20,596,443 | $8,793,023 | $(6,758,440) | $(566,153) | $52,217,688 |
| MFS Institutional Money Market Portfolio | 149,697,470 | 1,545,799,770 | 1,592,668,933 | 559 | (12,036) | 102,816,830 |
| $197,436,331 | $1,566,396,213 | $1,601,461,956 | $(6,757,881) | $(578,189) | $155,034,518 |
| Affiliated Issuers | Dividend Income | Capital Gain Distributions |
| Hugel, Inc. | $— | $— |
| MFS Institutional Money Market Portfolio | 3,571,279 | — |
| $3,571,279 | $— |

July 14, 2023
| Name, Age | Position(s) Held with Fund | Trustee/Officer Since(h) | Number of MFS Funds overseen by the Trustee | Principal Occupations During the Past Five Years | Other Directorships During the Past Five Years (j) | |||||
| INTERESTED TRUSTEE | ||||||||||
| Michael W. Roberge (k) (age 56) | Trustee | January 2021 | 136 | Massachusetts Financial Services Company, Chairman (since January 2021); Chief Executive Officer (since January 2017); Director; Chairman of the Board (since January 2022); President (until December 2018); Chief Investment Officer (until December 2018) | N/A | |||||
| INDEPENDENT TRUSTEES | ||||||||||
| John P. Kavanaugh (age 68) | Trustee and Chair of Trustees | January 2009 | 136 | Private investor | N/A | |||||
| Steven E. Buller (age 71) | Trustee | February 2014 | 136 | Private investor | N/A | |||||
| John A. Caroselli (age 69) | Trustee | March 2017 | 136 | Private investor; JC Global Advisors, LLC (management consulting), President (since 2015) | N/A | |||||
| Maureen R. Goldfarb (age 68) | Trustee | January 2009 | 136 | Private investor | N/A | |||||
| Peter D. Jones (age 67) | Trustee | January 2019 | 136 | Private investor | N/A | |||||
| James W. Kilman, Jr. (age 62) | Trustee | January 2019 | 136 | Burford Capital Limited (finance and investment management), Senior Advisor (since May 3, 2021), Chief Financial Officer (2019 - May 2, 2021); KielStrand Capital LLC (family office), Chief Executive Officer (since 2016) | Alpha-En Corporation, Director (2016-2019) |
| Name, Age | Position(s) Held with Fund | Trustee/Officer Since(h) | Number of MFS Funds overseen by the Trustee | Principal Occupations During the Past Five Years | Other Directorships During the Past Five Years (j) | |||||
| Clarence Otis, Jr. (age 67) | Trustee | March 2017 | 136 | Private investor | VF Corporation, Director; Verizon Communications, Inc., Director; The Travelers Companies, Director | |||||
| Maryanne L. Roepke (age 67) | Trustee | May 2014 | 136 | Private investor | N/A | |||||
| Laurie J. Thomsen (age 65) | Trustee | March 2005 | 136 | Private investor | The Travelers Companies, Director; Dycom Industries, Inc., Director |
| Name, Age | Position(s) Held with Fund | Trustee/Officer Since(h) | Number of MFS Funds for which the Person is an Officer | Principal Occupations During the Past Five Years | ||||
| OFFICERS | ||||||||
| Christopher R. Bohane (k) (age 49) | Assistant Secretary and Assistant Clerk | July 2005 | 136 | Massachusetts Financial Services Company, Senior Vice President and Senior Managing Counsel | ||||
| Kino Clark (k) (age 55) | Assistant Treasurer | January 2012 | 136 | Massachusetts Financial Services Company, Vice President | ||||
| John W. Clark, Jr. (k) (age 56) | Assistant Treasurer | April 2017 | 136 | Massachusetts Financial Services Company, Vice President | ||||
| David L. DiLorenzo (k) (age 54) | President | July 2005 | 136 | Massachusetts Financial Services Company, Senior Vice President | ||||
| Heidi W. Hardin (k) (age 55) | Secretary and Clerk | April 2017 | 136 | Massachusetts Financial Services Company, Executive Vice President and General Counsel | ||||
| Brian E. Langenfeld (k) (age 50) | Assistant Secretary and Assistant Clerk | June 2006 | 136 | Massachusetts Financial Services Company, Vice President and Managing Counsel |
| Name, Age | Position(s) Held with Fund | Trustee/Officer Since(h) | Number of MFS Funds for which the Person is an Officer | Principal Occupations During the Past Five Years | ||||
| Rosa E. Licea-Mailloux (k) (age 46) | Chief Compliance Officer | March 2022 | 136 | Massachusetts Financial Services Company, Vice President (since 2018); Director of Corporate Compliance (2018-2021), Senior Director Compliance (2021-2022), Senior Managing Director of North American Compliance & Chief Compliance Officer (since March 2022); Natixis Investment Managers (investment management), Funds Chief Compliance Officer, Deputy General Counsel & Senior Vice President (until 2018) | ||||
| Amanda S. Mooradian (k) (age 44) | Assistant Secretary and Assistant Clerk | September 2018 | 136 | Massachusetts Financial Services Company, Assistant Vice President and Senior Counsel | ||||
| Susan A. Pereira (k) (age 52) | Assistant Secretary and Assistant Clerk | July 2005 | 136 | Massachusetts Financial Services Company, Vice President and Managing Counsel | ||||
| Kasey L. Phillips (k) (age 52) | Assistant Treasurer | September 2012 | 136 | Massachusetts Financial Services Company, Vice President | ||||
| Matthew A. Stowe (k) (age 48) | Assistant Secretary and Assistant Clerk | October 2014 | 136 | Massachusetts Financial Services Company, Vice President and Senior Managing Counsel | ||||
| William B. Wilson (k) (age 40) | Assistant Secretary and Assistant Clerk | October 2022 | 136 | Massachusetts Financial Services Company, Assistant Vice President and Senior Counsel | ||||
| James O. Yost (k) (age 63) | Treasurer | September 1990 | 136 | Massachusetts Financial Services Company, Senior Vice President |
| (h) | Date first appointed to serve as Trustee/Officer of an MFS Fund. Each Trustee has served continuously since appointment unless indicated otherwise. From January 2012 through December 2016, Messrs. DiLorenzo and Yost served as Treasurer and Deputy Treasurer of the Funds, respectively. |
| (j) | Directorships or trusteeships of companies required to report to the Securities and Exchange Commission (i.e., “public companies”). |
| (k) | “Interested person” of the Trust within the meaning of the Investment Company Act of 1940 (referred to as the 1940 Act), which is the principal federal law governing investment companies like the fund, as a result of a position with MFS. The address of MFS is 111 Huntington Avenue, Boston, Massachusetts 02199-7618. |
| Investment Adviser | Custodian |
| Massachusetts Financial Services Company 111 Huntington Avenue Boston, MA 02199-7618 | State Street Bank and Trust Company 1 Congress Street, Suite 1 Boston, MA 02114-2016 |
| Distributor | Independent Registered Public Accounting Firm |
| MFS Fund Distributors, Inc. 111 Huntington Avenue Boston, MA 02199-7618 | Ernst & Young LLP 200 Clarendon Street Boston, MA 02116 |
| Portfolio Manager(s) | |
| Rajesh Nair Harry Purcell |
| FACTS | WHAT DOES MFS DO WITH YOUR PERSONAL INFORMATION? |
| Why? | Financial companies choose how they share your personal information. Federal law gives consumers the right to limit some but not all sharing. Federal law also requires us to tell you how we collect, share, and protect your personal information. Please read this notice carefully to understand what we do. |
| What? | The types of personal information we collect and share depend on the product or service you have with us. This information can include: |
| • Social Security number and account balances | |
| • Account transactions and transaction history | |
| • Checking account information and wire transfer instructions | |
| When you are no longer our customer, we continue to share your information as described in this notice. |
| How? | All financial companies need to share customers' personal information to run their everyday business. In the section below, we list the reasons financial companies can share their customers' personal information; the reasons MFS chooses to share; and whether you can limit this sharing. |
| Reasons we can share your personal information | Does MFS share? | Can you limit this sharing? |
| For our everyday business purposes – such as to process your transactions, maintain your account(s), respond to court orders and legal investigations, or report to credit bureaus | Yes | No |
| For our marketing purposes – to offer our products and services to you | No | We don't share |
| For joint marketing with other financial companies | No | We don't share |
| For our affiliates' everyday business purposes – information about your transactions and experiences | No | We don't share |
| For our affiliates' everyday business purposes – information about your creditworthiness | No | We don't share |
| For nonaffiliates to market to you | No | We don't share |
| Questions? | Call 800-225-2606 or go to mfs.com. |

| Who we are | |
| Who is providing this notice? | MFS Funds, MFS Investment Management, MFS Institutional Advisors, Inc., and MFS Heritage Trust Company. |
| What we do | |
| How does MFS protect my personal information? | To protect your personal information from unauthorized access and use, we use security measures that comply with federal law. These measures include procedural, electronic, and physical safeguards for the protection of the personal information we collect about you. |
| How does MFS collect my personal information? | We collect your personal information, for example, when you |
| • open an account or provide account information | |
| • direct us to buy securities or direct us to sell your securities | |
| • make a wire transfer | |
| We also collect your personal information from others, such as credit bureaus, affiliates, or other companies. | |
| Why can't I limit all sharing? | Federal law gives you the right to limit only |
| • sharing for affiliates' everyday business purposes – information about your creditworthiness | |
| • affiliates from using your information to market to you | |
| • sharing for nonaffiliates to market to you | |
| State laws and individual companies may give you additional rights to limit sharing. | |
| Definitions | |
| Affiliates | Companies related by common ownership or control. They can be financial and nonfinancial companies. |
| • MFS does not share personal information with affiliates, except for everyday business purposes as described on page one of this notice. | |
| Nonaffiliates | Companies not related by common ownership or control. They can be financial and nonfinancial companies. |
| • MFS does not share with nonaffiliates so they can market to you. | |
| Joint marketing | A formal agreement between nonaffiliated financial companies that together market financial products or services to you. |
| • MFS doesn't jointly market. | |
| Other important information |
| If you own an MFS product or receive an MFS service in the name of a third party such as a bank or broker-dealer, their privacy policy may apply to you instead of ours. |


| 1 | |
| 3 | |
| 6 | |
| 9 | |
| 11 | |
| 16 | |
| 18 | |
| 19 | |
| 20 | |
| 29 | |
| 40 | |
| 42 | |
| 46 | |
| 47 | |
| 47 | |
| 47 | |
| 47 | |
| 47 | |
| 48 |
| back cover |

| Roche Holding AG | 4.5% |
| Nestle S.A. | 4.4% |
| SAP SE | 4.1% |
| LVMH Moet Hennessy Louis Vuitton SE | 3.7% |
| Hitachi Ltd. | 3.6% |
| Schneider Electric SE | 3.5% |
| Taiwan Semiconductor Manufacturing Co. Ltd., ADR | 3.4% |
| Linde PLC | 3.1% |
| Reckitt Benckiser Group PLC | 2.5% |
| AIA Group Ltd. | 2.5% |
| Industrials | 15.1% |
| Information Technology | 15.0% |
| Health Care | 15.0% |
| Consumer Staples | 13.4% |
| Materials | 12.4% |
| Consumer Discretionary | 12.3% |
| Financials | 10.9% |
| Communication Services | 2.5% |
| Energy | 0.9% |
| Utilities | 0.4% |
| France | 17.0% |
| Switzerland | 12.6% |
| Germany | 10.7% |
| Japan | 9.4% |
| United Kingdom | 8.5% |
| Canada | 5.9% |
| United States | 5.2% |
| Taiwan | 4.8% |
| India | 4.1% |
| Other Countries | 21.8% |
| Euro | 32.6% |
| Swiss Franc | 12.6% |
| British Pound Sterling | 9.8% |
| Japanese Yen | 9.4% |
| United States Dollar | 7.4% |
| Hong Kong Dollar | 5.5% |
| Canadian Dollar | 5.1% |
| Taiwan Dollar | 4.8% |
| Indian Rupee | 4.1% |
| Other Currencies | 8.7% |
| (g) | The Global Industry Classification Standard (GICS®) was developed by and/or is the exclusive property of MSCI, Inc. and S&P Global Market Intelligence Inc. (“S&P Global Market Intelligence”). GICS is a service mark of MSCI and S&P Global Market Intelligence and has been licensed for use by MFS. MFS has applied its own internal sector/industry classification methodology for equity securities and non-equity securities that are unclassified by GICS. |
| (x) | Represents the portfolio’s exposure to issuer countries as a percentage of a portfolio’s net assets. For purposes of this presentation, United States includes Cash & Cash Equivalents. |
| (y) | Represents the portfolio’s exposure to a particular currency as a percentage of a portfolio's net assets. For purposes of this presentation, United States Dollar includes Cash & Cash Equivalents. |
Matthew Barrett and Kevin Dwan
| (b) | Security is not a benchmark constituent. |
| (h) | Security was not held in the portfolio at period end. |

| Share Class | Class Inception Date | 1-yr | 5-yr | 10-yr |
| A | 10/24/95 | 6.12% | 5.63% | 6.36% |
| B | 10/24/95 | 5.32% | 4.85% | 5.56% |
| C | 7/01/96 | 5.33% | 4.85% | 5.56% |
| I | 1/02/97 | 6.37% | 5.90% | 6.62% |
| R1 | 10/01/08 | 5.30% | 4.85% | 5.56% |
| R2 | 10/01/08 | 5.85% | 5.37% | 6.09% |
| R3 | 10/01/08 | 6.11% | 5.64% | 6.36% |
| R4 | 10/01/08 | 6.38% | 5.90% | 6.62% |
| R6 | 5/01/06 | 6.53% | 6.01% | 6.74% |
| MSCI All Country World (ex-US) Growth Index (net div) (f) | 0.23% | 2.95% | 4.78% |
| A With Initial Sales Charge (5.75%) | 0.01% | 4.39% | 5.73% |
| B With CDSC (Declining over six years from 4% to 0%) (v) | 1.32% | 4.51% | 5.56% |
| C With CDSC (1% for 12 months) (v) | 4.33% | 4.85% | 5.56% |
| (f) | Source: FactSet Research Systems Inc. |
| (v) | Assuming redemption at the end of the applicable period. |
| (e) | Morgan Stanley Capital International (“MSCI”) makes no express or implied warranties or representations and shall have no liability whatsoever with respect to any MSCI data contained herein. The MSCI data may not be further redistributed or used as a basis for other indices or any securities or financial products. This report is not approved, reviewed, or produced by MSCI. |
December 1, 2022 through May 31, 2023
| Share Class | Annualized Expense Ratio | Beginning Account Value 12/01/22 | Ending Account Value 5/31/23 | Expenses Paid During Period (p) 12/01/22-5/31/23 | |
| A | Actual | 1.08% | $1,000.00 | $1,044.74 | $5.51 |
| Hypothetical (h) | 1.08% | $1,000.00 | $1,019.55 | $5.44 | |
| B | Actual | 1.83% | $1,000.00 | $1,040.89 | $9.31 |
| Hypothetical (h) | 1.83% | $1,000.00 | $1,015.81 | $9.20 | |
| C | Actual | 1.83% | $1,000.00 | $1,040.96 | $9.31 |
| Hypothetical (h) | 1.83% | $1,000.00 | $1,015.81 | $9.20 | |
| I | Actual | 0.83% | $1,000.00 | $1,046.02 | $4.23 |
| Hypothetical (h) | 0.83% | $1,000.00 | $1,020.79 | $4.18 | |
| R1 | Actual | 1.83% | $1,000.00 | $1,040.95 | $9.31 |
| Hypothetical (h) | 1.83% | $1,000.00 | $1,015.81 | $9.20 | |
| R2 | Actual | 1.33% | $1,000.00 | $1,043.68 | $6.78 |
| Hypothetical (h) | 1.33% | $1,000.00 | $1,018.30 | $6.69 | |
| R3 | Actual | 1.08% | $1,000.00 | $1,044.85 | $5.51 |
| Hypothetical (h) | 1.08% | $1,000.00 | $1,019.55 | $5.44 | |
| R4 | Actual | 0.83% | $1,000.00 | $1,046.04 | $4.23 |
| Hypothetical (h) | 0.83% | $1,000.00 | $1,020.79 | $4.18 | |
| R6 | Actual | 0.70% | $1,000.00 | $1,046.72 | $3.57 |
| Hypothetical (h) | 0.70% | $1,000.00 | $1,021.44 | $3.53 |
| (h) | 5% class return per year before expenses. |
| (p) | “Expenses Paid During Period” are equal to each class’s annualized expense ratio, as shown above, multiplied by the average account value over the period, multiplied by 182/365 (to reflect the one-half year period). Expenses paid do not include any applicable sales charges (loads). If these transaction costs had been included, your costs would have been higher. |
| Issuer | Shares/Par | Value ($) | ||
| Common Stocks – 97.9% | ||||
| Aerospace & Defense – 1.5% | ||||
| Rolls-Royce Holdings PLC (a) | 93,098,040 | $165,954,702 | ||
| Singapore Technologies Engineering Ltd. | 16,670,900 | 45,119,791 | ||
| $211,074,493 | ||||
| Alcoholic Beverages – 4.5% | ||||
| Diageo PLC | 7,701,759 | $320,662,719 | ||
| Pernod Ricard S.A. | 1,555,425 | 336,010,279 | ||
| $656,672,998 | ||||
| Apparel Manufacturers – 5.4% | ||||
| Burberry Group PLC | 3,739,980 | $100,211,558 | ||
| Kering S.A. | 273,424 | 145,649,256 | ||
| LVMH Moet Hennessy Louis Vuitton SE | 627,926 | 546,281,746 | ||
| $792,142,560 | ||||
| Automotive – 0.5% | ||||
| Koito Manufacturing Co. Ltd. | 3,507,800 | $66,014,366 | ||
| Brokerage & Asset Managers – 1.8% | ||||
| Deutsche Boerse AG | 942,342 | $162,674,039 | ||
| London Stock Exchange Group PLC | 969,470 | 103,110,602 | ||
| $265,784,641 | ||||
| Business Services – 1.9% | ||||
| Experian PLC | 5,033,791 | $177,333,695 | ||
| Nomura Research Institute Ltd. | 3,881,900 | 97,796,296 | ||
| $275,129,991 | ||||
| Chemicals – 0.7% | ||||
| UPL Ltd. | 12,452,966 | $103,122,580 | ||
| Computer Software – 6.6% | ||||
| Dassault Systemes SE | 2,269,710 | $99,736,707 | ||
| Kingsoft Corp. | 12,846,600 | 46,674,938 | ||
| NICE Systems Ltd., ADR (a) | 332,850 | 68,547,129 | ||
| Oracle Corp. Japan (l) | 1,218,000 | 93,366,158 | ||
| SAP SE | 4,617,067 | 602,980,784 | ||
| Wisetech Global Ltd. | 893,132 | 43,471,574 | ||
| $954,777,290 | ||||
| Issuer | Shares/Par | Value ($) | ||
| Common Stocks – continued | ||||
| Computer Software - Systems – 6.9% | ||||
| Amadeus IT Group S.A. (a) | 4,453,983 | $318,501,768 | ||
| Cap Gemini S.A. | 932,742 | 162,312,927 | ||
| Hitachi Ltd. | 9,196,400 | 531,090,862 | ||
| $1,011,905,557 | ||||
| Construction – 0.3% | ||||
| Kingspan Group PLC | 725,669 | $48,153,455 | ||
| Consumer Products – 3.4% | ||||
| AmorePacific Corp. | 1,214,671 | $95,636,180 | ||
| KOSE Corp. | 309,600 | 31,109,994 | ||
| Reckitt Benckiser Group PLC | 4,775,364 | 371,031,938 | ||
| $497,778,112 | ||||
| Electrical Equipment – 3.5% | ||||
| Schneider Electric SE | 2,943,681 | $507,656,524 | ||
| Electronics – 5.6% | ||||
| ASML Holding N.V. | 227,604 | $163,366,529 | ||
| SK Hynix, Inc. | 1,924,180 | 157,442,794 | ||
| Taiwan Semiconductor Manufacturing Co. Ltd., ADR | 4,997,230 | 492,676,906 | ||
| $813,486,229 | ||||
| Energy - Independent – 0.9% | ||||
| Reliance Industries Ltd. | 4,465,574 | $133,316,426 | ||
| Entertainment – 0.2% | ||||
| Lottery Corp. Ltd. | 9,327,031 | $30,212,505 | ||
| Food & Beverages – 4.4% | ||||
| Nestle S.A. | 5,457,058 | $646,518,318 | ||
| Food & Drug Stores – 0.4% | ||||
| Ocado Group PLC (a) | 1,922,002 | $8,822,325 | ||
| Sugi Holdings Co. Ltd. | 1,304,400 | 54,207,615 | ||
| $63,029,940 | ||||
| Gaming & Lodging – 1.9% | ||||
| Aristocrat Leisure Ltd. | 3,661,088 | $88,467,337 | ||
| Flutter Entertainment PLC (a) | 957,452 | 187,407,338 | ||
| $275,874,675 | ||||
| Insurance – 3.0% | ||||
| AIA Group Ltd. | 38,375,600 | $368,051,333 | ||
| Ping An Insurance Co. of China Ltd., “H” | 11,049,000 | 70,128,192 | ||
| $438,179,525 | ||||
| Issuer | Shares/Par | Value ($) | ||
| Common Stocks – continued | ||||
| Internet – 2.2% | ||||
| NAVER Corp. | 588,891 | $88,516,673 | ||
| Tencent Holdings Ltd. | 3,768,000 | 149,460,223 | ||
| Z Holdings Corp. | 29,743,500 | 74,099,902 | ||
| $312,076,798 | ||||
| Leisure & Toys – 0.5% | ||||
| Prosus N.V. | 999,153 | $65,756,445 | ||
| Machinery & Tools – 5.2% | ||||
| Assa Abloy AB | 10,458,635 | $232,075,721 | ||
| Delta Electronics, Inc. | 20,405,000 | 210,175,982 | ||
| GEA Group AG | 3,689,287 | 154,939,320 | ||
| RB Global, Inc. (l) | 3,174,780 | 165,836,943 | ||
| $763,027,966 | ||||
| Major Banks – 1.4% | ||||
| DBS Group Holdings Ltd. | 9,023,700 | $202,187,466 | ||
| Medical & Health Technology & Services – 0.3% | ||||
| Alcon, Inc. | 611,815 | $47,467,305 | ||
| Medical Equipment – 5.2% | ||||
| EssilorLuxottica | 2,019,518 | $363,605,242 | ||
| QIAGEN N.V. (a) | 3,752,875 | 169,323,262 | ||
| Sonova Holding AG | 428,001 | 109,684,802 | ||
| Terumo Corp. | 3,959,700 | 120,673,865 | ||
| $763,287,171 | ||||
| Natural Gas - Distribution – 0.4% | ||||
| China Resources Gas Group Ltd. | 15,405,900 | $50,661,447 | ||
| Other Banks & Diversified Financials – 4.7% | ||||
| AEON Financial Service Co. Ltd. | 1,124,300 | $9,602,849 | ||
| Credicorp Ltd. | 917,930 | 118,826,039 | ||
| Element Fleet Management Corp. | 8,556,787 | 129,785,815 | ||
| Grupo Financiero Banorte S.A. de C.V. | 13,171,209 | 105,576,671 | ||
| HDFC Bank Ltd. | 9,745,705 | 189,755,933 | ||
| Kasikornbank Co. Ltd. | 13,873,400 | 51,626,589 | ||
| Kotak Mahindra Bank Ltd. | 3,347,291 | 81,499,586 | ||
| $686,673,482 | ||||
| Pharmaceuticals – 9.4% | ||||
| Bayer AG | 3,407,450 | $189,905,566 | ||
| Chugai Pharmaceutical Co. Ltd. | 2,936,200 | 79,134,621 | ||
| Hypera S.A. | 6,822,592 | 54,894,882 | ||
| Merck KGaA | 844,239 | 146,866,783 | ||
| Issuer | Shares/Par | Value ($) | ||
| Common Stocks – continued | ||||
| Pharmaceuticals – continued | ||||
| Novartis AG | 2,556,315 | $244,642,784 | ||
| Roche Holding AG | 2,070,198 | 655,098,615 | ||
| $1,370,543,251 | ||||
| Precious Metals & Minerals – 2.6% | ||||
| Agnico Eagle Mines Ltd. | 3,570,315 | $181,684,980 | ||
| Franco-Nevada Corp. | 1,369,167 | 198,975,518 | ||
| $380,660,498 | ||||
| Railroad & Shipping – 1.2% | ||||
| Canadian National Railway Co. | 936,116 | $105,528,357 | ||
| Canadian Pacific Kansas City Ltd. | 948,498 | 72,274,499 | ||
| $177,802,856 | ||||
| Restaurants – 1.1% | ||||
| Sodexo | 312,952 | $33,802,687 | ||
| Yum China Holdings, Inc. | 1,537,316 | 86,796,861 | ||
| Yum China Holdings, Inc. | 656,150 | 36,584,755 | ||
| $157,184,303 | ||||
| Specialty Chemicals – 9.1% | ||||
| Akzo Nobel N.V. | 1,488,838 | $112,099,575 | ||
| L'Air Liquide S.A. | 1,712,155 | 286,670,450 | ||
| Linde PLC | 1,277,468 | 451,789,333 | ||
| Nitto Denko Corp. | 2,024,100 | 144,262,071 | ||
| Showa Denko K. K. | 4,386,800 | 67,159,838 | ||
| Sika AG | 471,606 | 128,626,879 | ||
| Symrise AG | 1,253,785 | 133,990,305 | ||
| $1,324,598,451 | ||||
| Specialty Stores – 0.6% | ||||
| Alibaba Group Holding Ltd. (a) | 8,589,000 | $85,446,315 | ||
| Just Eat Takeaway.com (a) | 256,927 | 3,863,486 | ||
| $89,309,801 | ||||
| Tobacco – 0.6% | ||||
| ITC Ltd. | 15,787,434 | $85,013,179 | ||
| Total Common Stocks (Identified Cost, $11,265,153,911) | $14,267,080,604 | |||
| Issuer | Shares/Par | Value ($) | ||
| Investment Companies (h) – 1.5% | ||||
| Money Market Funds – 1.5% | ||||
| MFS Institutional Money Market Portfolio, 4.88% (v) (Identified Cost, $219,823,976) | 219,830,981 | $219,808,998 | ||
| Other Assets, Less Liabilities – 0.6% | 94,550,420 | |||
| Net Assets – 100.0% | $14,581,440,022 | |||
| (a) | Non-income producing security. | |||
| (h) | An affiliated issuer, which may be considered one in which the fund owns 5% or more of the outstanding voting securities, or a company which is under common control. At period end, the aggregate values of the fund's investments in affiliated issuers and in unaffiliated issuers were $219,808,998 and $14,267,080,604, respectively. | |||
| (l) | A portion of this security is on loan. See Note 2 for additional information. | |||
| (v) | Affiliated issuer that is available only to investment companies managed by MFS. The rate quoted for the MFS Institutional Money Market Portfolio is the annualized seven-day yield of the fund at period end. |
| The following abbreviations are used in this report and are defined: | |
| ADR | American Depositary Receipt |
| Assets | |
| Investments in unaffiliated issuers, at value, including $15,092,900 of securities on loan (identified cost, $11,265,153,911) | $14,267,080,604 |
| Investments in affiliated issuers, at value (identified cost, $219,823,976) | 219,808,998 |
| Foreign currency, at value (identified cost, $5,807,900) | 5,807,236 |
| Receivables for | |
| Investments sold | 59,340,340 |
| Fund shares sold | 31,138,514 |
| Interest and dividends | 79,762,354 |
| Other assets | 19,491 |
| Total assets | $14,662,957,537 |
| Liabilities | |
| Payables for | |
| Investments purchased | $57,537,654 |
| Fund shares reacquired | 7,383,284 |
| Payable to affiliates | |
| Investment adviser | 539,238 |
| Administrative services fee | 3,389 |
| Shareholder servicing costs | 1,517,772 |
| Distribution and service fees | 15,490 |
| Payable for independent Trustees' compensation | 14 |
| Deferred foreign capital gains tax expense payable | 13,275,610 |
| Accrued expenses and other liabilities | 1,245,064 |
| Total liabilities | $81,517,515 |
| Net assets | $14,581,440,022 |
| Net assets consist of | |
| Paid-in capital | $11,458,545,865 |
| Total distributable earnings (loss) | 3,122,894,157 |
| Net assets | $14,581,440,022 |
| Shares of beneficial interest outstanding | 363,359,483 |
| Net assets | Shares outstanding | Net asset value per share (a) | |
| Class A | $626,068,211 | 16,126,427 | $38.82 |
| Class B | 1,138,241 | 31,676 | 35.93 |
| Class C | 27,497,834 | 793,166 | 34.67 |
| Class I | 3,576,682,745 | 81,101,371 | 44.10 |
| Class R1 | 7,181,752 | 213,150 | 33.69 |
| Class R2 | 37,317,094 | 1,069,578 | 34.89 |
| Class R3 | 269,664,201 | 7,013,887 | 38.45 |
| Class R4 | 237,042,177 | 6,072,668 | 39.03 |
| Class R6 | 9,798,847,767 | 250,937,560 | 39.05 |
| (a) | Maximum offering price per share was equal to the net asset value per share for all share classes, except for Class A, for which the maximum offering price per share was $41.19 [100 / 94.25 x $38.82]. On sales of $50,000 or more, the maximum offering price of Class A shares is reduced. A contingent deferred sales charge may be imposed on redemptions of Class A, Class B, and Class C shares. Redemption price per share was equal to the net asset value per share for Classes I, R1, R2, R3, R4, and R6. |
| Net investment income (loss) | |
| Income | |
| Dividends | $278,647,559 |
| Dividends from affiliated issuers | 7,338,919 |
| Income on securities loaned | 30,745 |
| Interest | 29,818 |
| Other | 21,285 |
| Foreign taxes withheld | (30,784,095) |
| Total investment income | $255,284,231 |
| Expenses | |
| Management fee | $87,755,169 |
| Distribution and service fees | 2,305,921 |
| Shareholder servicing costs | 5,563,724 |
| Administrative services fee | 664,236 |
| Independent Trustees' compensation | 125,734 |
| Custodian fee | 1,423,094 |
| Shareholder communications | 323,967 |
| Audit and tax fees | 103,668 |
| Legal fees | 62,550 |
| Miscellaneous | 889,097 |
| Total expenses | $99,217,160 |
| Reduction of expenses by investment adviser and distributor | (1,708,685) |
| Net expenses | $97,508,475 |
| Net investment income (loss) | $157,775,756 |
| Realized and unrealized gain (loss) | |
| Realized gain (loss) (identified cost basis) | |
| Unaffiliated issuers (net of $7,391,988 foreign capital gains tax) | $149,252,128 |
| Affiliated issuers | (18,224) |
| Foreign currency | 1,836,174 |
| Net realized gain (loss) | $151,070,078 |
| Change in unrealized appreciation or depreciation | |
| Unaffiliated issuers (net of $877,691 decrease in deferred foreign capital gains tax) | $528,411,036 |
| Affiliated issuers | (15,451) |
| Translation of assets and liabilities in foreign currencies | 567,893 |
| Net unrealized gain (loss) | $528,963,478 |
| Net realized and unrealized gain (loss) | $680,033,556 |
| Change in net assets from operations | $837,809,312 |
| Year ended | ||
| 5/31/23 | 5/31/22 | |
| Change in net assets | ||
| From operations | ||
| Net investment income (loss) | $157,775,756 | $116,011,781 |
| Net realized gain (loss) | 151,070,078 | 543,815,219 |
| Net unrealized gain (loss) | 528,963,478 | (2,408,457,443) |
| Change in net assets from operations | $837,809,312 | $(1,748,630,443) |
| Total distributions to shareholders | $(356,010,679) | $(922,994,870) |
| Change in net assets from fund share transactions | $1,536,798,438 | $714,185,698 |
| Total change in net assets | $2,018,597,071 | $(1,957,439,615) |
| Net assets | ||
| At beginning of period | 12,562,842,951 | 14,520,282,566 |
| At end of period | $14,581,440,022 | $12,562,842,951 |
| Class A | Year ended | ||||
| 5/31/23 | 5/31/22 | 5/31/21 | 5/31/20 | 5/31/19 | |
| Net asset value, beginning of period | $37.54 | $45.69 | $33.66 | $32.76 | $34.20 |
| Income (loss) from investment operations | |||||
| Net investment income (loss) (d) | $0.35 | $0.21 | $0.22 | $0.23 | $0.42 |
| Net realized and unrealized gain (loss) | 1.90 | (5.48) | 12.05 | 1.20 | (0.73) |
| Total from investment operations | $2.25 | $(5.27) | $12.27 | $1.43 | $(0.31) |
| Less distributions declared to shareholders | |||||
| From net investment income | $(0.31) | $(0.32) | $(0.24) | $(0.35) | $(0.29) |
| From net realized gain | (0.66) | (2.56) | — | (0.18) | (0.84) |
| Total distributions declared to shareholders | $(0.97) | $(2.88) | $(0.24) | $(0.53) | $(1.13) |
| Net asset value, end of period (x) | $38.82 | $37.54 | $45.69 | $33.66 | $32.76 |
| Total return (%) (r)(s)(t)(x) | 6.12 | (12.34) | 36.52 | 4.24 | (0.64) |
| Ratios (%) (to average net assets) and Supplemental data: | |||||
| Expenses before expense reductions | 1.09 | 1.08 | 1.08 | 1.08 | 1.10 |
| Expenses after expense reductions | 1.08 | 1.06 | 1.06 | 1.07 | 1.09 |
| Net investment income (loss) | 0.94 | 0.49 | 0.53 | 0.66 | 1.28 |
| Portfolio turnover | 17 | 12 | 23 | 17 | 17 |
| Net assets at end of period (000 omitted) | $626,068 | $534,840 | $650,731 | $546,391 | $402,964 |
| Class B | Year ended | ||||
| 5/31/23 | 5/31/22 | 5/31/21 | 5/31/20 | 5/31/19 | |
| Net asset value, beginning of period | $34.77 | $42.52 | $31.38 | $30.67 | $32.01 |
| Income (loss) from investment operations | |||||
| Net investment income (loss) (d) | $0.00(w) | $(0.13) | $(0.09) | $(0.06) | $0.11 |
| Net realized and unrealized gain (loss) | 1.82 | (5.06) | 11.23 | 1.15 | (0.61) |
| Total from investment operations | $1.82 | $(5.19) | $11.14 | $1.09 | $(0.50) |
| Less distributions declared to shareholders | |||||
| From net investment income | $— | $— | $— | $(0.20) | $— |
| From net realized gain | (0.66) | (2.56) | — | (0.18) | (0.84) |
| Total distributions declared to shareholders | $(0.66) | $(2.56) | $— | $(0.38) | $(0.84) |
| Net asset value, end of period (x) | $35.93 | $34.77 | $42.52 | $31.38 | $30.67 |
| Total return (%) (r)(s)(t)(x) | 5.32 | (12.99) | 35.50 | 3.44 | (1.36) |
| Ratios (%) (to average net assets) and Supplemental data: | |||||
| Expenses before expense reductions | 1.84 | 1.83 | 1.82 | 1.83 | 1.85 |
| Expenses after expense reductions | 1.83 | 1.81 | 1.81 | 1.82 | 1.84 |
| Net investment income (loss) | 0.00(w) | (0.33) | (0.24) | (0.18) | 0.35 |
| Portfolio turnover | 17 | 12 | 23 | 17 | 17 |
| Net assets at end of period (000 omitted) | $1,138 | $1,559 | $2,439 | $2,922 | $4,599 |
| Class C | Year ended | ||||
| 5/31/23 | 5/31/22 | 5/31/21 | 5/31/20 | 5/31/19 | |
| Net asset value, beginning of period | $33.61 | $41.19 | $30.40 | $29.76 | $31.15 |
| Income (loss) from investment operations | |||||
| Net investment income (loss) (d) | $0.03 | $(0.11) | $(0.08) | $(0.04) | $0.14 |
| Net realized and unrealized gain (loss) | 1.73 | (4.91) | 10.87 | 1.10 | (0.64) |
| Total from investment operations | $1.76 | $(5.02) | $10.79 | $1.06 | $(0.50) |
| Less distributions declared to shareholders | |||||
| From net investment income | $(0.04) | $(0.00)(w) | $— | $(0.24) | $(0.05) |
| From net realized gain | (0.66) | (2.56) | — | (0.18) | (0.84) |
| Total distributions declared to shareholders | $(0.70) | $(2.56) | $— | $(0.42) | $(0.89) |
| Net asset value, end of period (x) | $34.67 | $33.61 | $41.19 | $30.40 | $29.76 |
| Total return (%) (r)(s)(t)(x) | 5.33 | (12.99) | 35.49 | 3.46 | (1.37) |
| Ratios (%) (to average net assets) and Supplemental data: | |||||
| Expenses before expense reductions | 1.84 | 1.83 | 1.82 | 1.83 | 1.85 |
| Expenses after expense reductions | 1.83 | 1.81 | 1.81 | 1.82 | 1.84 |
| Net investment income (loss) | 0.09 | (0.29) | (0.21) | (0.14) | 0.48 |
| Portfolio turnover | 17 | 12 | 23 | 17 | 17 |
| Net assets at end of period (000 omitted) | $27,498 | $30,292 | $41,907 | $39,530 | $42,015 |
| Class I | Year ended | ||||
| 5/31/23 | 5/31/22 | 5/31/21 | 5/31/20 | 5/31/19 | |
| Net asset value, beginning of period | $42.50 | $51.32 | $37.75 | $36.61 | $38.08 |
| Income (loss) from investment operations | |||||
| Net investment income (loss) (d) | $0.48 | $0.37 | $0.39 | $0.34 | $0.60 |
| Net realized and unrealized gain (loss) | 2.18 | (6.20) | 13.49 | 1.35 | (0.86) |
| Total from investment operations | $2.66 | $(5.83) | $13.88 | $1.69 | $(0.26) |
| Less distributions declared to shareholders | |||||
| From net investment income | $(0.40) | $(0.43) | $(0.31) | $(0.37) | $(0.37) |
| From net realized gain | (0.66) | (2.56) | — | (0.18) | (0.84) |
| Total distributions declared to shareholders | $(1.06) | $(2.99) | $(0.31) | $(0.55) | $(1.21) |
| Net asset value, end of period (x) | $44.10 | $42.50 | $51.32 | $37.75 | $36.61 |
| Total return (%) (r)(s)(t)(x) | 6.37 | (12.10) | 36.85 | 4.51 | (0.41) |
| Ratios (%) (to average net assets) and Supplemental data: | |||||
| Expenses before expense reductions | 0.84 | 0.83 | 0.83 | 0.83 | 0.85 |
| Expenses after expense reductions | 0.83 | 0.81 | 0.82 | 0.82 | 0.84 |
| Net investment income (loss) | 1.14 | 0.77 | 0.84 | 0.89 | 1.63 |
| Portfolio turnover | 17 | 12 | 23 | 17 | 17 |
| Net assets at end of period (000 omitted) | $3,576,683 | $3,251,727 | $3,722,298 | $2,457,330 | $1,974,109 |
| Class R1 | Year ended | ||||
| 5/31/23 | 5/31/22 | 5/31/21 | 5/31/20 | 5/31/19 | |
| Net asset value, beginning of period | $32.73 | $40.23 | $29.72 | $29.12 | $30.57 |
| Income (loss) from investment operations | |||||
| Net investment income (loss) (d) | $0.04 | $(0.08) | $(0.06) | $(0.03) | $0.18 |
| Net realized and unrealized gain (loss) | 1.66 | (4.81) | 10.62 | 1.07 | (0.68) |
| Total from investment operations | $1.70 | $(4.89) | $10.56 | $1.04 | $(0.50) |
| Less distributions declared to shareholders | |||||
| From net investment income | $(0.08) | $(0.05) | $(0.05) | $(0.26) | $(0.11) |
| From net realized gain | (0.66) | (2.56) | — | (0.18) | (0.84) |
| Total distributions declared to shareholders | $(0.74) | $(2.61) | $(0.05) | $(0.44) | $(0.95) |
| Net asset value, end of period (x) | $33.69 | $32.73 | $40.23 | $29.72 | $29.12 |
| Total return (%) (r)(s)(t)(x) | 5.30 | (12.99) | 35.53 | 3.45 | (1.39) |
| Ratios (%) (to average net assets) and Supplemental data: | |||||
| Expenses before expense reductions | 1.84 | 1.83 | 1.83 | 1.83 | 1.85 |
| Expenses after expense reductions | 1.83 | 1.81 | 1.81 | 1.82 | 1.84 |
| Net investment income (loss) | 0.13 | (0.21) | (0.17) | (0.11) | 0.61 |
| Portfolio turnover | 17 | 12 | 23 | 17 | 17 |
| Net assets at end of period (000 omitted) | $7,182 | $6,895 | $7,424 | $4,890 | $4,266 |
| Class R2 | Year ended | ||||
| 5/31/23 | 5/31/22 | 5/31/21 | 5/31/20 | 5/31/19 | |
| Net asset value, beginning of period | $33.87 | $41.51 | $30.63 | $29.92 | $31.31 |
| Income (loss) from investment operations | |||||
| Net investment income (loss) (d) | $0.21 | $0.10 | $0.10 | $0.15 | $0.28 |
| Net realized and unrealized gain (loss) | 1.73 | (4.96) | 10.97 | 1.07 | (0.64) |
| Total from investment operations | $1.94 | $(4.86) | $11.07 | $1.22 | $(0.36) |
| Less distributions declared to shareholders | |||||
| From net investment income | $(0.26) | $(0.22) | $(0.19) | $(0.33) | $(0.19) |
| From net realized gain | (0.66) | (2.56) | — | (0.18) | (0.84) |
| Total distributions declared to shareholders | $(0.92) | $(2.78) | $(0.19) | $(0.51) | $(1.03) |
| Net asset value, end of period (x) | $34.89 | $33.87 | $41.51 | $30.63 | $29.92 |
| Total return (%) (r)(s)(t)(x) | 5.85 | (12.55) | 36.20 | 3.95 | (0.89) |
| Ratios (%) (to average net assets) and Supplemental data: | |||||
| Expenses before expense reductions | 1.34 | 1.33 | 1.33 | 1.33 | 1.35 |
| Expenses after expense reductions | 1.33 | 1.31 | 1.31 | 1.32 | 1.34 |
| Net investment income (loss) | 0.62 | 0.26 | 0.28 | 0.48 | 0.92 |
| Portfolio turnover | 17 | 12 | 23 | 17 | 17 |
| Net assets at end of period (000 omitted) | $37,317 | $34,618 | $40,886 | $34,149 | $18,890 |
| Class R3 | Year ended | ||||
| 5/31/23 | 5/31/22 | 5/31/21 | 5/31/20 | 5/31/19 | |
| Net asset value, beginning of period | $37.20 | $45.30 | $33.38 | $32.51 | $33.96 |
| Income (loss) from investment operations | |||||
| Net investment income (loss) (d) | $0.38 | $0.21 | $0.23 | $0.23 | $0.48 |
| Net realized and unrealized gain (loss) | 1.85 | (5.43) | 11.94 | 1.18 | (0.79) |
| Total from investment operations | $2.23 | $(5.22) | $12.17 | $1.41 | $(0.31) |
| Less distributions declared to shareholders | |||||
| From net investment income | $(0.32) | $(0.32) | $(0.25) | $(0.36) | $(0.30) |
| From net realized gain | (0.66) | (2.56) | — | (0.18) | (0.84) |
| Total distributions declared to shareholders | $(0.98) | $(2.88) | $(0.25) | $(0.54) | $(1.14) |
| Net asset value, end of period (x) | $38.45 | $37.20 | $45.30 | $33.38 | $32.51 |
| Total return (%) (r)(s)(t)(x) | 6.11 | (12.33) | 36.55 | 4.22 | (0.63) |
| Ratios (%) (to average net assets) and Supplemental data: | |||||
| Expenses before expense reductions | 1.09 | 1.08 | 1.08 | 1.08 | 1.10 |
| Expenses after expense reductions | 1.08 | 1.06 | 1.06 | 1.07 | 1.09 |
| Net investment income (loss) | 1.03 | 0.49 | 0.58 | 0.69 | 1.47 |
| Portfolio turnover | 17 | 12 | 23 | 17 | 17 |
| Net assets at end of period (000 omitted) | $269,664 | $149,194 | $182,926 | $124,732 | $59,575 |
| Class R4 | Year ended | ||||
| 5/31/23 | 5/31/22 | 5/31/21 | 5/31/20 | 5/31/19 | |
| Net asset value, beginning of period | $37.74 | $45.91 | $33.79 | $32.83 | $34.28 |
| Income (loss) from investment operations | |||||
| Net investment income (loss) (d) | $0.41 | $0.33 | $0.31 | $0.31 | $0.53 |
| Net realized and unrealized gain (loss) | 1.94 | (5.51) | 12.12 | 1.20 | (0.76) |
| Total from investment operations | $2.35 | $(5.18) | $12.43 | $1.51 | $(0.23) |
| Less distributions declared to shareholders | |||||
| From net investment income | $(0.40) | $(0.43) | $(0.31) | $(0.37) | $(0.38) |
| From net realized gain | (0.66) | (2.56) | — | (0.18) | (0.84) |
| Total distributions declared to shareholders | $(1.06) | $(2.99) | $(0.31) | $(0.55) | $(1.22) |
| Net asset value, end of period (x) | $39.03 | $37.74 | $45.91 | $33.79 | $32.83 |
| Total return (%) (r)(s)(t)(x) | 6.38 | (12.11) | 36.87 | 4.48 | (0.40) |
| Ratios (%) (to average net assets) and Supplemental data: | |||||
| Expenses before expense reductions | 0.84 | 0.83 | 0.83 | 0.83 | 0.85 |
| Expenses after expense reductions | 0.83 | 0.81 | 0.81 | 0.82 | 0.84 |
| Net investment income (loss) | 1.12 | 0.76 | 0.77 | 0.91 | 1.60 |
| Portfolio turnover | 17 | 12 | 23 | 17 | 17 |
| Net assets at end of period (000 omitted) | $237,042 | $224,116 | $273,949 | $262,925 | $209,454 |
| Class R6 | Year ended | ||||
| 5/31/23 | 5/31/22 | 5/31/21 | 5/31/20 | 5/31/19 | |
| Net asset value, beginning of period | $37.75 | $45.93 | $33.80 | $32.81 | $34.27 |
| Income (loss) from investment operations | |||||
| Net investment income (loss) (d) | $0.48 | $0.38 | $0.39 | $0.34 | $0.56 |
| Net realized and unrealized gain (loss) | 1.93 | (5.51) | 12.08 | 1.21 | (0.78) |
| Total from investment operations | $2.41 | $(5.13) | $12.47 | $1.55 | $(0.22) |
| Less distributions declared to shareholders | |||||
| From net investment income | $(0.45) | $(0.49) | $(0.34) | $(0.38) | $(0.40) |
| From net realized gain | (0.66) | (2.56) | — | (0.18) | (0.84) |
| Total distributions declared to shareholders | $(1.11) | $(3.05) | $(0.34) | $(0.56) | $(1.24) |
| Net asset value, end of period (x) | $39.05 | $37.75 | $45.93 | $33.80 | $32.81 |
| Total return (%) (r)(s)(t)(x) | 6.53 | (12.01) | 37.00 | 4.60 | (0.34) |
| Ratios (%) (to average net assets) and Supplemental data: | |||||
| Expenses before expense reductions | 0.72 | 0.71 | 0.72 | 0.74 | 0.77 |
| Expenses after expense reductions | 0.70 | 0.69 | 0.71 | 0.73 | 0.76 |
| Net investment income (loss) | 1.30 | 0.89 | 0.96 | 1.00 | 1.69 |
| Portfolio turnover | 17 | 12 | 23 | 17 | 17 |
| Net assets at end of period (000 omitted) | $9,798,848 | $8,329,602 | $9,597,724 | $7,506,854 | $6,016,478 |
| (d) | Per share data is based on average shares outstanding. |
| (r) | Certain expenses have been reduced without which performance would have been lower. |
| (s) | From time to time the fund may receive proceeds from litigation settlements, without which performance would be lower. |
| (t) | Total returns do not include any applicable sales charges. |
| (w) | Per share amount was less than $0.01 and total return or ratio was less than 0.01%, as applicable. |
| (x) | The net asset values and total returns have been calculated on net assets which include adjustments made in accordance with U.S. generally accepted accounting principles required at period end for financial reporting purposes. |
| Financial Instruments | Level 1 | Level 2 | Level 3 | Total |
| Equity Securities: | ||||
| France | $2,481,725,818 | $— | $— | $2,481,725,818 |
| Switzerland | 1,832,038,703 | — | — | 1,832,038,703 |
| Germany | 1,560,680,059 | — | — | 1,560,680,059 |
| Japan | 1,368,518,437 | — | — | 1,368,518,437 |
| United Kingdom | 1,247,127,539 | — | — | 1,247,127,539 |
| Canada | 854,086,112 | — | — | 854,086,112 |
| Taiwan | 702,852,888 | — | — | 702,852,888 |
| India | 592,707,704 | — | — | 592,707,704 |
| China | 525,752,731 | — | — | 525,752,731 |
| Other Countries | 3,049,964,024 | 51,626,589 | — | 3,101,590,613 |
| Mutual Funds | 219,808,998 | — | — | 219,808,998 |
| Total | $14,435,263,013 | $51,626,589 | $— | $14,486,889,602 |
| Year ended 5/31/23 | Year ended 5/31/22 | |
| Ordinary income (including any short-term capital gains) | $140,003,197 | $270,917,484 |
| Long-term capital gains | 216,007,482 | 652,077,386 |
| Total distributions | $356,010,679 | $922,994,870 |
| As of 5/31/23 | |
| Cost of investments | $11,626,831,933 |
| Gross appreciation | 3,696,876,098 |
| Gross depreciation | (836,818,429) |
| Net unrealized appreciation (depreciation) | $2,860,057,669 |
| Undistributed ordinary income | 184,949,324 |
| Undistributed long-term capital gain | 95,334,197 |
| Other temporary differences | (17,447,033) |
| Total distributable earnings (loss) | $3,122,894,157 |
| Year ended 5/31/23 | Year ended 5/31/22 | ||
| Class A | $13,864,705 | $40,847,465 | |
| Class B | 23,920 | 125,004 | |
| Class C | 574,032 | 2,420,107 | |
| Class I | 79,049,206 | 215,860,122 | |
| Class R1 | 151,707 | 494,877 | |
| Class R2 | 1,037,429 | 2,697,084 | |
| Class R3 | 4,166,824 | 11,487,587 | |
| Class R4 | 6,242,876 | 16,174,642 | |
| Class R6 | 250,899,980 | 632,887,982 | |
| Total | $356,010,679 | $922,994,870 |
| Up to $1 billion | 0.90% |
| In excess of $1 billion and up to $2 billion | 0.80% |
| In excess of $2 billion and up to $5 billion | 0.70% |
| In excess of $5 billion and up to $10 billion | 0.65% |
| In excess of $10 billion and up to $20 billion | 0.62% |
| In excess of $20 billion | 0.60% |
| Distribution Fee Rate (d) | Service Fee Rate (d) | Total Distribution Plan (d) | Annual Effective Rate (e) | Distribution and Service Fee | |
| Class A | — | 0.25% | 0.25% | 0.25% | $ 1,362,278 |
| Class B | 0.75% | 0.25% | 1.00% | 1.00% | 12,775 |
| Class C | 0.75% | 0.25% | 1.00% | 1.00% | 273,104 |
| Class R1 | 0.75% | 0.25% | 1.00% | 1.00% | 67,076 |
| Class R2 | 0.25% | 0.25% | 0.50% | 0.50% | 176,256 |
| Class R3 | — | 0.25% | 0.25% | 0.25% | 414,432 |
| Total Distribution and Service Fees | $2,305,921 |
| (d) | In accordance with the distribution plan for certain classes, the fund pays distribution and/or service fees equal to these annual percentage rates of each class’s average daily net assets. The distribution and service fee rates disclosed by class represent the current rates in effect at the end of the reporting period. Any rate changes, if applicable, are detailed below. |
| (e) | The annual effective rates represent actual fees incurred under the distribution plan for the year ended May 31, 2023 based on each class's average daily net assets. MFD has voluntarily agreed to rebate a portion of each class's 0.25% service fee attributable to accounts for which there is no financial intermediary specified on the account except for accounts attributable to MFS or its affiliates' seed money. For the year ended May 31, 2023, this rebate amounted to $48 for Class A shares, and is included in the reduction of total expenses in the Statement of Operations. |
| Amount | |
| Class A | $5,506 |
| Class B | 963 |
| Class C | 1,263 |
| Year ended 5/31/23 | Year ended 5/31/22 | ||||
| Shares | Amount | Shares | Amount | ||
| Shares sold | |||||
| Class A | 4,504,817 | $166,583,891 | 2,493,395 | $106,890,437 | |
| Class B | 496 | 17,215 | 132 | 5,134 | |
| Class C | 97,601 | 3,242,887 | 80,222 | 3,100,489 | |
| Class I | 32,566,074 | 1,354,125,285 | 19,757,359 | 939,764,882 | |
| Class R1 | 46,580 | 1,461,454 | 53,432 | 1,982,428 | |
| Class R2 | 417,278 | 13,556,114 | 385,551 | 14,647,471 | |
| Class R3 | 4,373,276 | 167,394,146 | 971,524 | 41,597,776 | |
| Class R4 | 2,851,626 | 106,448,088 | 2,067,677 | 86,536,916 | |
| Class R6 | 53,466,197 | 1,986,555,517 | 22,626,945 | 985,839,048 | |
| 98,323,945 | $3,799,384,597 | 48,436,237 | $2,180,364,581 | ||
| Shares issued to shareholders in reinvestment of distributions | |||||
| Class A | 266,869 | $9,831,448 | 718,108 | $30,857,117 | |
| Class B | 683 | 23,377 | 3,070 | 122,629 | |
| Class C | 15,756 | 520,269 | 56,734 | 2,189,925 | |
| Class I | 1,742,229 | 72,825,173 | 4,036,074 | 196,072,454 | |
| Class R1 | 4,728 | 151,707 | 13,165 | 494,877 | |
| Class R2 | 30,915 | 1,024,838 | 69,164 | 2,684,269 | |
| Class R3 | 114,191 | 4,166,824 | 269,852 | 11,487,587 | |
| Class R4 | 123,923 | 4,585,147 | 323,071 | 13,937,302 | |
| Class R6 | 6,396,422 | 236,603,642 | 13,956,815 | 601,957,439 | |
| 8,695,716 | $329,732,425 | 19,446,053 | $859,803,599 | ||
| Shares reacquired | |||||
| Class A | (2,891,874) | $(106,033,271) | (3,207,148) | $(134,098,035) | |
| Class B | (14,325) | (483,478) | (15,731) | (629,324) | |
| Class C | (221,462) | (7,201,560) | (253,076) | (9,625,780) | |
| Class I | (29,723,143) | (1,219,905,266) | (19,801,953) | (934,132,572) | |
| Class R1 | (48,856) | (1,532,234) | (40,443) | (1,521,928) | |
| Class R2 | (400,770) | (13,374,756) | (417,631) | (15,887,122) | |
| Class R3 | (1,484,657) | (54,600,487) | (1,268,584) | (53,863,640) | |
| Class R4 | (2,841,076) | (105,190,267) | (2,418,992) | (104,302,465) | |
| Class R6 | (29,553,645) | (1,083,997,265) | (24,900,996) | (1,071,921,616) | |
| (67,179,808) | $(2,592,318,584) | (52,324,554) | $(2,325,982,482) | ||
| Year ended 5/31/23 | Year ended 5/31/22 | ||||
| Shares | Amount | Shares | Amount | ||
| Net change | |||||
| Class A | 1,879,812 | $70,382,068 | 4,355 | $3,649,519 | |
| Class B | (13,146) | (442,886) | (12,529) | (501,561) | |
| Class C | (108,105) | (3,438,404) | (116,120) | (4,335,366) | |
| Class I | 4,585,160 | 207,045,192 | 3,991,480 | 201,704,764 | |
| Class R1 | 2,452 | 80,927 | 26,154 | 955,377 | |
| Class R2 | 47,423 | 1,206,196 | 37,084 | 1,444,618 | |
| Class R3 | 3,002,810 | 116,960,483 | (27,208) | (778,277) | |
| Class R4 | 134,473 | 5,842,968 | (28,244) | (3,828,247) | |
| Class R6 | 30,308,974 | 1,139,161,894 | 11,682,764 | 515,874,871 | |
| 39,839,853 | $1,536,798,438 | 15,557,736 | $714,185,698 | ||
| Affiliated Issuers | Beginning Value | Purchases | Sales Proceeds | Realized Gain (Loss) | Change in Unrealized Appreciation or Depreciation | Ending Value |
| MFS Institutional Money Market Portfolio | $95,663,451 | $2,274,102,434 | $2,149,923,212 | $(18,224) | $(15,451) | $219,808,998 |
| Affiliated Issuers | Dividend Income | Capital Gain Distributions |
| MFS Institutional Money Market Portfolio | $7,338,919 | $— |
We have audited the accompanying statement of assets and liabilities of MFS International Growth Fund (the “Fund”) (one of the funds constituting MFS Series Trust X (the “Trust”)), including the portfolio of investments, as of May 31, 2023, and the related statements of operations for the year then ended, the statements of changes in net assets for each of the two years in the period then ended, the financial highlights for each of the five years in the period then ended and the related notes (collectively referred to as the “financial statements”). In our opinion, the financial statements present fairly, in all material respects, the financial position of the Fund (one of the funds constituting MFS Series Trust X) at May 31, 2023, the results of its operations for the year then ended, the changes in its net assets for each of the two years in the period then ended and its financial highlights for each of the five years in the period then ended, in conformity with U.S. generally accepted accounting principles.
These financial statements are the responsibility of the Trust’s management. Our responsibility is to express an opinion on the Fund’s financial statements based on our audits. We are a public accounting firm registered with the Public Company Accounting Oversight Board (United States) (“PCAOB”) and are required to be independent with respect to the Trust in accordance with the U.S. federal securities laws and the applicable rules and regulations of the Securities and Exchange Commission and the PCAOB.

July 14, 2023
| Name, Age | Position(s) Held with Fund | Trustee/Officer Since(h) | Number of MFS Funds overseen by the Trustee | Principal Occupations During the Past Five Years | Other Directorships During the Past Five Years (j) | |||||
| INTERESTED TRUSTEE | ||||||||||
| Michael W. Roberge (k) (age 56) | Trustee | January 2021 | 136 | Massachusetts Financial Services Company, Chairman (since January 2021); Chief Executive Officer (since January 2017); Director; Chairman of the Board (since January 2022); President (until December 2018); Chief Investment Officer (until December 2018) | N/A | |||||
| INDEPENDENT TRUSTEES | ||||||||||
| John P. Kavanaugh (age 68) | Trustee and Chair of Trustees | January 2009 | 136 | Private investor | N/A | |||||
| Steven E. Buller (age 71) | Trustee | February 2014 | 136 | Private investor | N/A | |||||
| John A. Caroselli (age 69) | Trustee | March 2017 | 136 | Private investor; JC Global Advisors, LLC (management consulting), President (since 2015) | N/A | |||||
| Maureen R. Goldfarb (age 68) | Trustee | January 2009 | 136 | Private investor | N/A | |||||
| Peter D. Jones (age 67) | Trustee | January 2019 | 136 | Private investor | N/A | |||||
| James W. Kilman, Jr. (age 62) | Trustee | January 2019 | 136 | Burford Capital Limited (finance and investment management), Senior Advisor (since May 3, 2021), Chief Financial Officer (2019 - May 2, 2021); KielStrand Capital LLC (family office), Chief Executive Officer (since 2016) | Alpha-En Corporation, Director (2016-2019) |
| Name, Age | Position(s) Held with Fund | Trustee/Officer Since(h) | Number of MFS Funds overseen by the Trustee | Principal Occupations During the Past Five Years | Other Directorships During the Past Five Years (j) | |||||
| Clarence Otis, Jr. (age 67) | Trustee | March 2017 | 136 | Private investor | VF Corporation, Director; Verizon Communications, Inc., Director; The Travelers Companies, Director | |||||
| Maryanne L. Roepke (age 67) | Trustee | May 2014 | 136 | Private investor | N/A | |||||
| Laurie J. Thomsen (age 65) | Trustee | March 2005 | 136 | Private investor | The Travelers Companies, Director; Dycom Industries, Inc., Director |
| Name, Age | Position(s) Held with Fund | Trustee/Officer Since(h) | Number of MFS Funds for which the Person is an Officer | Principal Occupations During the Past Five Years | ||||
| OFFICERS | ||||||||
| Christopher R. Bohane (k) (age 49) | Assistant Secretary and Assistant Clerk | July 2005 | 136 | Massachusetts Financial Services Company, Senior Vice President and Senior Managing Counsel | ||||
| Kino Clark (k) (age 55) | Assistant Treasurer | January 2012 | 136 | Massachusetts Financial Services Company, Vice President | ||||
| John W. Clark, Jr. (k) (age 56) | Assistant Treasurer | April 2017 | 136 | Massachusetts Financial Services Company, Vice President | ||||
| David L. DiLorenzo (k) (age 54) | President | July 2005 | 136 | Massachusetts Financial Services Company, Senior Vice President | ||||
| Heidi W. Hardin (k) (age 55) | Secretary and Clerk | April 2017 | 136 | Massachusetts Financial Services Company, Executive Vice President and General Counsel | ||||
| Brian E. Langenfeld (k) (age 50) | Assistant Secretary and Assistant Clerk | June 2006 | 136 | Massachusetts Financial Services Company, Vice President and Managing Counsel |
| Name, Age | Position(s) Held with Fund | Trustee/Officer Since(h) | Number of MFS Funds for which the Person is an Officer | Principal Occupations During the Past Five Years | ||||
| Rosa E. Licea-Mailloux (k) (age 46) | Chief Compliance Officer | March 2022 | 136 | Massachusetts Financial Services Company, Vice President (since 2018); Director of Corporate Compliance (2018-2021), Senior Director Compliance (2021-2022), Senior Managing Director of North American Compliance & Chief Compliance Officer (since March 2022); Natixis Investment Managers (investment management), Funds Chief Compliance Officer, Deputy General Counsel & Senior Vice President (until 2018) | ||||
| Amanda S. Mooradian (k) (age 44) | Assistant Secretary and Assistant Clerk | September 2018 | 136 | Massachusetts Financial Services Company, Assistant Vice President and Senior Counsel | ||||
| Susan A. Pereira (k) (age 52) | Assistant Secretary and Assistant Clerk | July 2005 | 136 | Massachusetts Financial Services Company, Vice President and Managing Counsel | ||||
| Kasey L. Phillips (k) (age 52) | Assistant Treasurer | September 2012 | 136 | Massachusetts Financial Services Company, Vice President | ||||
| Matthew A. Stowe (k) (age 48) | Assistant Secretary and Assistant Clerk | October 2014 | 136 | Massachusetts Financial Services Company, Vice President and Senior Managing Counsel | ||||
| William B. Wilson (k) (age 40) | Assistant Secretary and Assistant Clerk | October 2022 | 136 | Massachusetts Financial Services Company, Assistant Vice President and Senior Counsel | ||||
| James O. Yost (k) (age 63) | Treasurer | September 1990 | 136 | Massachusetts Financial Services Company, Senior Vice President |
| (h) | Date first appointed to serve as Trustee/Officer of an MFS Fund. Each Trustee has served continuously since appointment unless indicated otherwise. From January 2012 through December 2016, Messrs. DiLorenzo and Yost served as Treasurer and Deputy Treasurer of the Funds, respectively. |
| (j) | Directorships or trusteeships of companies required to report to the Securities and Exchange Commission (i.e., “public companies”). |
| (k) | “Interested person” of the Trust within the meaning of the Investment Company Act of 1940 (referred to as the 1940 Act), which is the principal federal law governing investment companies like the fund, as a result of a position with MFS. The address of MFS is 111 Huntington Avenue, Boston, Massachusetts 02199-7618. |
| Investment Adviser | Custodian |
| Massachusetts Financial Services Company 111 Huntington Avenue Boston, MA 02199-7618 | State Street Bank and Trust Company 1 Congress Street, Suite 1 Boston, MA 02114-2016 |
| Distributor | Independent Registered Public Accounting Firm |
| MFS Fund Distributors, Inc. 111 Huntington Avenue Boston, MA 02199-7618 | Ernst & Young LLP 200 Clarendon Street Boston, MA 02116 |
| Portfolio Manager(s) | |
| Matthew Barrett Kevin Dwan |
| FACTS | WHAT DOES MFS DO WITH YOUR PERSONAL INFORMATION? |
| Why? | Financial companies choose how they share your personal information. Federal law gives consumers the right to limit some but not all sharing. Federal law also requires us to tell you how we collect, share, and protect your personal information. Please read this notice carefully to understand what we do. |
| What? | The types of personal information we collect and share depend on the product or service you have with us. This information can include: |
| • Social Security number and account balances | |
| • Account transactions and transaction history | |
| • Checking account information and wire transfer instructions | |
| When you are no longer our customer, we continue to share your information as described in this notice. |
| How? | All financial companies need to share customers' personal information to run their everyday business. In the section below, we list the reasons financial companies can share their customers' personal information; the reasons MFS chooses to share; and whether you can limit this sharing. |
| Reasons we can share your personal information | Does MFS share? | Can you limit this sharing? |
| For our everyday business purposes – such as to process your transactions, maintain your account(s), respond to court orders and legal investigations, or report to credit bureaus | Yes | No |
| For our marketing purposes – to offer our products and services to you | No | We don't share |
| For joint marketing with other financial companies | No | We don't share |
| For our affiliates' everyday business purposes – information about your transactions and experiences | No | We don't share |
| For our affiliates' everyday business purposes – information about your creditworthiness | No | We don't share |
| For nonaffiliates to market to you | No | We don't share |
| Questions? | Call 800-225-2606 or go to mfs.com. |

| Who we are | |
| Who is providing this notice? | MFS Funds, MFS Investment Management, MFS Institutional Advisors, Inc., and MFS Heritage Trust Company. |
| What we do | |
| How does MFS protect my personal information? | To protect your personal information from unauthorized access and use, we use security measures that comply with federal law. These measures include procedural, electronic, and physical safeguards for the protection of the personal information we collect about you. |
| How does MFS collect my personal information? | We collect your personal information, for example, when you |
| • open an account or provide account information | |
| • direct us to buy securities or direct us to sell your securities | |
| • make a wire transfer | |
| We also collect your personal information from others, such as credit bureaus, affiliates, or other companies. | |
| Why can't I limit all sharing? | Federal law gives you the right to limit only |
| • sharing for affiliates' everyday business purposes – information about your creditworthiness | |
| • affiliates from using your information to market to you | |
| • sharing for nonaffiliates to market to you | |
| State laws and individual companies may give you additional rights to limit sharing. | |
| Definitions | |
| Affiliates | Companies related by common ownership or control. They can be financial and nonfinancial companies. |
| • MFS does not share personal information with affiliates, except for everyday business purposes as described on page one of this notice. | |
| Nonaffiliates | Companies not related by common ownership or control. They can be financial and nonfinancial companies. |
| • MFS does not share with nonaffiliates so they can market to you. | |
| Joint marketing | A formal agreement between nonaffiliated financial companies that together market financial products or services to you. |
| • MFS doesn't jointly market. | |
| Other important information |
| If you own an MFS product or receive an MFS service in the name of a third party such as a bank or broker-dealer, their privacy policy may apply to you instead of ours. |


| 1 | |
| 3 | |
| 6 | |
| 9 | |
| 11 | |
| 16 | |
| 18 | |
| 19 | |
| 20 | |
| 29 | |
| 40 | |
| 42 | |
| 46 | |
| 47 | |
| 47 | |
| 47 | |
| 47 | |
| 47 | |
| 49 |
| back cover |

| Schneider Electric SE | 3.9% |
| Nestle S.A. | 3.6% |
| Franco-Nevada Corp. | 3.2% |
| Cadence Design Systems, Inc. | 2.8% |
| Legrand S.A. | 2.6% |
| TotalEnergies SE | 2.5% |
| Samsung Electronics Co. Ltd. | 2.4% |
| Pernod Ricard S.A. | 2.3% |
| Diageo PLC | 2.1% |
| Deutsche Boerse AG | 2.0% |
| Industrials | 19.9% |
| Information Technology | 19.2% |
| Consumer Staples | 16.2% |
| Financials | 14.2% |
| Materials | 11.3% |
| Health Care | 5.4% |
| Energy | 5.2% |
| Consumer Discretionary | 3.9% |
| Real Estate | 0.9% |
| France | 16.9% |
| Japan | 13.3% |
| Switzerland | 13.0% |
| United Kingdom | 12.2% |
| United States | 10.9% |
| Germany | 9.6% |
| Ireland | 5.0% |
| Canada | 4.8% |
| Spain | 2.6% |
| Other Countries | 11.7% |
| Euro | 36.3% |
| Japanese Yen | 13.3% |
| Swiss Franc | 13.0% |
| British Pound Sterling | 12.2% |
| United States Dollar | 10.9% |
| Canadian Dollar | 4.8% |
| South Korean Won | 2.4% |
| Taiwan Dollar | 1.9% |
| Australian Dollar | 1.8% |
| Other Currencies | 3.4% |
| (g) | The Global Industry Classification Standard (GICS®) was developed by and/or is the exclusive property of MSCI, Inc. and S&P Global Market Intelligence Inc. (“S&P Global Market Intelligence”). GICS is a service mark of MSCI and S&P Global Market Intelligence and has been licensed for use by MFS. MFS has applied its own internal sector/industry classification methodology for equity securities and non-equity securities that are unclassified by GICS. |
| (x) | Represents the portfolio’s exposure to issuer countries as a percentage of a portfolio’s net assets. For purposes of this presentation, United States includes Cash & Cash Equivalents. |
| (y) | Represents the portfolio’s exposure to a particular currency as a percentage of a portfolio's net assets. For purposes of this presentation, United States Dollar includes Cash & Cash Equivalents. |
| (b) | Security is not a benchmark constituent. |

| Share Class | Class Inception Date | 1-yr | 5-yr | 10-yr |
| A | 10/24/95 | 3.67% | 4.77% | 7.38% |
| B | 10/24/95 | 2.91% | 3.99% | 6.58% |
| C | 7/01/96 | 2.90% | 3.99% | 6.57% |
| I | 1/02/97 | 3.93% | 5.03% | 7.65% |
| R1 | 10/01/08 | 2.89% | 3.99% | 6.57% |
| R2 | 10/01/08 | 3.42% | 4.51% | 7.11% |
| R3 | 10/01/08 | 3.66% | 4.77% | 7.38% |
| R4 | 10/01/08 | 3.94% | 5.03% | 7.65% |
| R6 | 5/01/06 | 4.07% | 5.15% | 7.75% |
| MSCI EAFE Index (net div) (f) | 3.06% | 3.21% | 4.56% |
| A With Initial Sales Charge (5.75%) | (2.29)% | 3.53% | 6.74% |
| B With CDSC (Declining over six years from 4% to 0%) (v) | (0.69)% | 3.69% | 6.58% |
| C With CDSC (1% for 12 months) (v) | 2.01% | 3.99% | 6.57% |
| (f) | Source: FactSet Research Systems Inc. |
| (v) | Assuming redemption at the end of the applicable period. |
| (e) | Morgan Stanley Capital International (“MSCI”) makes no express or implied warranties or representations and shall have no liability whatsoever with respect to any MSCI data contained herein. The MSCI data may not be further redistributed or used as a basis for other indices or any securities or financial products. This report is not approved, reviewed, or produced by MSCI. |
December 1, 2022 through May 31, 2023
| Share Class | Annualized Expense Ratio | Beginning Account Value 12/01/22 | Ending Account Value 5/31/23 | Expenses Paid During Period (p) 12/01/22-5/31/23 | |
| A | Actual | 1.05% | $1,000.00 | $1,049.31 | $5.36 |
| Hypothetical (h) | 1.05% | $1,000.00 | $1,019.70 | $5.29 | |
| B | Actual | 1.80% | $1,000.00 | $1,045.65 | $9.18 |
| Hypothetical (h) | 1.80% | $1,000.00 | $1,015.96 | $9.05 | |
| C | Actual | 1.80% | $1,000.00 | $1,045.47 | $9.18 |
| Hypothetical (h) | 1.80% | $1,000.00 | $1,015.96 | $9.05 | |
| I | Actual | 0.80% | $1,000.00 | $1,050.73 | $4.09 |
| Hypothetical (h) | 0.80% | $1,000.00 | $1,020.94 | $4.03 | |
| R1 | Actual | 1.80% | $1,000.00 | $1,045.50 | $9.18 |
| Hypothetical (h) | 1.80% | $1,000.00 | $1,015.96 | $9.05 | |
| R2 | Actual | 1.30% | $1,000.00 | $1,048.18 | $6.64 |
| Hypothetical (h) | 1.30% | $1,000.00 | $1,018.45 | $6.54 | |
| R3 | Actual | 1.05% | $1,000.00 | $1,049.37 | $5.36 |
| Hypothetical (h) | 1.05% | $1,000.00 | $1,019.70 | $5.29 | |
| R4 | Actual | 0.80% | $1,000.00 | $1,050.77 | $4.09 |
| Hypothetical (h) | 0.80% | $1,000.00 | $1,020.94 | $4.03 | |
| R6 | Actual | 0.67% | $1,000.00 | $1,051.52 | $3.43 |
| Hypothetical (h) | 0.67% | $1,000.00 | $1,021.59 | $3.38 |
| (h) | 5% class return per year before expenses. |
| (p) | “Expenses Paid During Period” are equal to each class’s annualized expense ratio, as shown above, multiplied by the average account value over the period, multiplied by 182/365 (to reflect the one-half year period). Expenses paid do not include any applicable sales charges (loads). If these transaction costs had been included, your costs would have been higher. |
| Issuer | Shares/Par | Value ($) | ||
| Common Stocks – 96.2% | ||||
| Airlines – 1.0% | ||||
| Ryanair Holdings PLC, ADR (a) | 2,069,998 | $217,515,390 | ||
| Alcoholic Beverages – 4.3% | ||||
| Diageo PLC | 10,456,980 | $435,376,339 | ||
| Pernod Ricard S.A. | 2,230,419 | 481,825,681 | ||
| $917,202,020 | ||||
| Apparel Manufacturers – 1.8% | ||||
| Adidas AG | 927,377 | $150,177,935 | ||
| Compagnie Financiere Richemont S.A. | 792,118 | 125,721,281 | ||
| LVMH Moet Hennessy Louis Vuitton SE | 119,153 | 103,660,478 | ||
| $379,559,694 | ||||
| Automotive – 1.1% | ||||
| Compagnie Generale des Etablissements Michelin | 3,899,672 | $110,711,651 | ||
| Knorr-Bremse AG | 1,887,895 | 129,109,811 | ||
| $239,821,462 | ||||
| Brokerage & Asset Managers – 2.7% | ||||
| Deutsche Boerse AG | 2,400,341 | $414,364,599 | ||
| Euronext N.V. | 2,403,295 | 159,656,054 | ||
| $574,020,653 | ||||
| Business Services – 4.4% | ||||
| Experian PLC | 8,576,017 | $302,121,558 | ||
| Intertek Group PLC | 3,733,679 | 192,932,905 | ||
| Nomura Research Institute Ltd. | 7,469,854 | 188,187,242 | ||
| SGS S.A. | 2,744,375 | 243,596,239 | ||
| $926,837,944 | ||||
| Chemicals – 0.9% | ||||
| Givaudan S.A. | 60,635 | $199,464,683 | ||
| Computer Software – 6.3% | ||||
| ANSYS, Inc. (a) | 559,307 | $180,986,152 | ||
| Cadence Design Systems, Inc. (a) | 2,575,213 | 594,642,434 | ||
| Dassault Systemes SE | 3,689,310 | 162,117,464 | ||
| NICE Systems Ltd., ADR (a) | 337,429 | 69,490,128 | ||
| SAP SE | 2,572,010 | 335,899,957 | ||
| $1,343,136,135 | ||||
| Issuer | Shares/Par | Value ($) | ||
| Common Stocks – continued | ||||
| Computer Software - Systems – 4.5% | ||||
| Amadeus IT Group S.A. (a) | 3,990,335 | $285,346,566 | ||
| Cap Gemini S.A. | 906,717 | 157,784,135 | ||
| Samsung Electronics Co. Ltd. | 9,456,193 | 508,700,079 | ||
| $951,830,780 | ||||
| Construction – 1.8% | ||||
| CRH PLC | 4,862,210 | $229,197,289 | ||
| Geberit AG | 277,371 | 146,916,026 | ||
| $376,113,315 | ||||
| Consumer Products – 6.5% | ||||
| Beiersdorf AG | 1,645,064 | $209,514,469 | ||
| Haleon PLC | 59,980,134 | 237,416,250 | ||
| KOSE Corp. | 470,700 | 47,298,044 | ||
| L’Oréal S.A. | 573,611 | 244,640,041 | ||
| Lion Corp. | 6,167,500 | 59,583,384 | ||
| Reckitt Benckiser Group PLC | 2,599,049 | 201,938,572 | ||
| ROHTO Pharmaceutical Co. Ltd. (h) | 13,023,400 | 277,620,657 | ||
| Svenska Cellulosa Aktiebolaget | 7,751,914 | 102,794,045 | ||
| $1,380,805,462 | ||||
| Electrical Equipment – 7.1% | ||||
| Legrand S.A. | 5,839,142 | $552,119,577 | ||
| Schneider Electric SE | 4,801,795 | 828,100,110 | ||
| Yokogawa Electric Corp. | 6,106,100 | 115,350,836 | ||
| $1,495,570,523 | ||||
| Electronics – 6.7% | ||||
| Analog Devices, Inc. | 2,034,084 | $361,436,386 | ||
| ASML Holding N.V. | 198,948 | 142,798,212 | ||
| DISCO Corp. | 1,402,800 | 204,894,886 | ||
| Hirose Electric Co. Ltd. (h) | 2,315,600 | 314,452,912 | ||
| Taiwan Semiconductor Manufacturing Co. Ltd., ADR | 4,078,005 | 402,050,513 | ||
| $1,425,632,909 | ||||
| Energy - Independent – 1.8% | ||||
| Woodside Energy Group Ltd. | 17,071,816 | $380,879,687 | ||
| Energy - Integrated – 3.4% | ||||
| Galp Energia SGPS S.A., “B” | 8,187,236 | $86,603,246 | ||
| Petroleo Brasileiro S.A., ADR | 9,955,033 | 102,337,739 | ||
| TotalEnergies SE | 9,272,712 | 526,107,945 | ||
| $715,048,930 | ||||
| Issuer | Shares/Par | Value ($) | ||
| Common Stocks – continued | ||||
| Food & Beverages – 5.8% | ||||
| Chocoladefabriken Lindt & Sprungli AG | 6,507 | $77,805,358 | ||
| Ezaki Glico Co. Ltd. | 3,071,100 | 81,117,158 | ||
| ITO EN Ltd. | 908,300 | 26,924,666 | ||
| Nestle S.A. | 6,492,348 | 769,173,043 | ||
| Toyo Suisan Kaisha Ltd. (h) | 6,070,300 | 265,337,355 | ||
| $1,220,357,580 | ||||
| Food & Drug Stores – 0.1% | ||||
| Ocado Group PLC (a) | 3,229,077 | $14,822,027 | ||
| Insurance – 0.5% | ||||
| Hiscox Ltd. | 7,739,693 | $112,837,688 | ||
| Machinery & Tools – 6.5% | ||||
| Epiroc AB | 8,804,323 | $154,151,511 | ||
| GEA Group AG | 4,524,169 | 190,001,935 | ||
| IMI PLC (h) | 16,393,349 | 325,056,485 | ||
| Schindler Holding AG | 1,187,002 | 245,806,838 | ||
| SMC Corp. | 535,300 | 288,464,554 | ||
| Spirax-Sarco Engineering PLC | 1,213,241 | 164,881,283 | ||
| $1,368,362,606 | ||||
| Major Banks – 5.4% | ||||
| Bank of Ireland Group PLC | 29,318,215 | $275,588,545 | ||
| NatWest Group PLC | 89,659,604 | 289,537,178 | ||
| Resona Holdings, Inc. | 61,404,200 | 279,200,149 | ||
| UBS Group AG | 15,553,877 | 294,426,395 | ||
| $1,138,752,267 | ||||
| Medical Equipment – 4.4% | ||||
| Agilent Technologies, Inc. | 1,490,289 | $172,381,730 | ||
| Bruker BioSciences Corp. | 2,544,172 | 175,802,285 | ||
| EssilorLuxottica | 1,399,748 | 252,018,408 | ||
| Shimadzu Corp. | 10,331,500 | 320,345,092 | ||
| $920,547,515 | ||||
| Metals & Mining – 1.1% | ||||
| Glencore PLC | 44,349,382 | $226,990,391 | ||
| Other Banks & Diversified Financials – 5.6% | ||||
| AIB Group PLC | 82,105,181 | $336,304,933 | ||
| CaixaBank S.A. | 75,147,321 | 275,273,739 | ||
| Chiba Bank Ltd. | 20,799,100 | 130,027,031 | ||
| Hachijuni Bank Ltd. | 10,338,900 | 43,559,550 | ||
| Julius Baer Group Ltd. | 2,203,109 | 134,593,450 | ||
| Issuer | Shares/Par | Value ($) | ||
| Common Stocks – continued | ||||
| Other Banks & Diversified Financials – continued | ||||
| Jyske Bank A.S. (a) | 1,312,546 | $90,113,721 | ||
| Mebuki Financial Group, Inc. | 26,689,070 | 62,831,617 | ||
| North Pacific Bank Ltd. | 15,497,700 | 28,587,180 | ||
| Sydbank A.S. | 1,740,408 | 72,697,599 | ||
| $1,173,988,820 | ||||
| Pharmaceuticals – 2.5% | ||||
| Bayer AG | 3,221,744 | $179,555,714 | ||
| Roche Holding AG | 1,131,698 | 358,117,336 | ||
| $537,673,050 | ||||
| Precious Metals & Minerals – 4.8% | ||||
| Agnico Eagle Mines Ltd. | 3,377,598 | $171,878,062 | ||
| Franco-Nevada Corp. | 4,612,540 | 670,321,835 | ||
| Wheaton Precious Metals Corp. | 3,645,261 | 165,198,127 | ||
| $1,007,398,024 | ||||
| Printing & Publishing – 1.1% | ||||
| Wolters Kluwer N.V. | 2,081,632 | $237,636,082 | ||
| Real Estate – 0.9% | ||||
| LEG Immobilien SE (a) | 1,195,086 | $61,968,019 | ||
| TAG Immobilien AG (a) | 5,004,797 | 40,068,719 | ||
| Vonovia SE, REIT | 5,170,613 | 94,841,080 | ||
| $196,877,818 | ||||
| Specialty Chemicals – 3.0% | ||||
| Croda International PLC | 1,186,752 | $90,051,850 | ||
| Kansai Paint Co. Ltd. | 4,955,300 | 74,476,212 | ||
| Novozymes A.S. | 2,824,149 | 136,086,472 | ||
| Sika AG | 566,829 | 154,598,214 | ||
| Symrise AG | 1,684,613 | 180,032,311 | ||
| $635,245,059 | ||||
| Specialty Stores – 0.2% | ||||
| Zalando SE (a) | 1,525,982 | $44,105,553 | ||
| Total Common Stocks (Identified Cost, $15,656,693,476) | $20,359,034,067 | |||
| Issuer | Shares/Par | Value ($) | ||
| Investment Companies (h) – 3.1% | ||||
| Money Market Funds – 3.1% | ||||
| MFS Institutional Money Market Portfolio, 4.88% (v) (Identified Cost, $662,336,886) | 662,415,103 | $662,348,862 | ||
| Other Assets, Less Liabilities – 0.7% | 151,729,158 | |||
| Net Assets – 100.0% | $21,173,112,087 | |||
| (a) | Non-income producing security. | |||
| (h) | An affiliated issuer, which may be considered one in which the fund owns 5% or more of the outstanding voting securities, or a company which is under common control. At period end, the aggregate values of the fund's investments in affiliated issuers and in unaffiliated issuers were $1,844,816,271 and $19,176,566,658, respectively. | |||
| (v) | Affiliated issuer that is available only to investment companies managed by MFS. The rate quoted for the MFS Institutional Money Market Portfolio is the annualized seven-day yield of the fund at period end. |
| The following abbreviations are used in this report and are defined: | |
| ADR | American Depositary Receipt |
| REIT | Real Estate Investment Trust |
| Assets | |
| Investments in unaffiliated issuers, at value (identified cost, $14,858,931,467) | $19,176,566,658 |
| Investments in affiliated issuers, at value (identified cost, $1,460,098,895) | 1,844,816,271 |
| Foreign currency, at value (identified cost, $4,472,925) | 4,471,973 |
| Receivables for | |
| Fund shares sold | 8,677,480 |
| Interest and dividends | 165,857,104 |
| Other assets | 33,118 |
| Total assets | $21,200,422,604 |
| Liabilities | |
| Payables for | |
| Investments purchased | $2,608,448 |
| Fund shares reacquired | 19,480,122 |
| Payable to affiliates | |
| Investment adviser | 754,077 |
| Administrative services fee | 3,389 |
| Shareholder servicing costs | 3,144,869 |
| Distribution and service fees | 46,105 |
| Payable for independent Trustees' compensation | 742 |
| Accrued expenses and other liabilities | 1,272,765 |
| Total liabilities | $27,310,517 |
| Net assets | $21,173,112,087 |
| Net assets consist of | |
| Paid-in capital | $14,749,350,236 |
| Total distributable earnings (loss) | 6,423,761,851 |
| Net assets | $21,173,112,087 |
| Shares of beneficial interest outstanding | 537,461,711 |
| Net assets | Shares outstanding | Net asset value per share (a) | |
| Class A | $1,899,508,938 | 49,358,393 | $38.48 |
| Class B | 2,312,677 | 64,801 | 35.69 |
| Class C | 33,852,367 | 1,016,256 | 33.31 |
| Class I | 6,689,895,007 | 162,297,439 | 41.22 |
| Class R1 | 8,148,620 | 241,266 | 33.77 |
| Class R2 | 132,772,421 | 3,800,460 | 34.94 |
| Class R3 | 977,367,986 | 25,671,546 | 38.07 |
| Class R4 | 622,734,290 | 16,107,447 | 38.66 |
| Class R6 | 10,806,519,781 | 278,904,103 | 38.75 |
| (a) | Maximum offering price per share was equal to the net asset value per share for all share classes, except for Class A, for which the maximum offering price per share was $40.83 [100 / 94.25 x $38.48]. On sales of $50,000 or more, the maximum offering price of Class A shares is reduced. A contingent deferred sales charge may be imposed on redemptions of Class A, Class B, and Class C shares. Redemption price per share was equal to the net asset value per share for Classes I, R1, R2, R3, R4, and R6. |
| Net investment income (loss) | |
| Income | |
| Dividends | $440,639,182 |
| Dividends from affiliated issuers | 42,878,164 |
| Interest | 1,386,963 |
| Income on securities loaned | 295,294 |
| Other | 32,264 |
| Foreign taxes withheld | (37,885,460) |
| Total investment income | $447,346,407 |
| Expenses | |
| Management fee | $141,282,105 |
| Distribution and service fees | 9,048,518 |
| Shareholder servicing costs | 12,869,173 |
| Administrative services fee | 664,236 |
| Independent Trustees' compensation | 131,741 |
| Custodian fee | 1,459,433 |
| Shareholder communications | 598,089 |
| Audit and tax fees | 74,434 |
| Legal fees | 106,936 |
| Miscellaneous | 2,716,406 |
| Total expenses | $168,951,071 |
| Reduction of expenses by investment adviser and distributor | (2,908,407) |
| Net expenses | $166,042,664 |
| Net investment income (loss) | $281,303,743 |
| Realized and unrealized gain (loss) | |
| Realized gain (loss) (identified cost basis) | |
| Unaffiliated issuers | $3,047,462,336 |
| Affiliated issuers | 59,283,363 |
| Foreign currency | (492,686) |
| Net realized gain (loss) | $3,106,253,013 |
| Change in unrealized appreciation or depreciation | |
| Unaffiliated issuers | $(2,846,133,718) |
| Affiliated issuers | 89,958,884 |
| Translation of assets and liabilities in foreign currencies | 2,152,222 |
| Net unrealized gain (loss) | $(2,754,022,612) |
| Net realized and unrealized gain (loss) | $352,230,401 |
| Change in net assets from operations | $633,534,144 |
| Year ended | ||
| 5/31/23 | 5/31/22 | |
| Change in net assets | ||
| From operations | ||
| Net investment income (loss) | $281,303,743 | $194,762,942 |
| Net realized gain (loss) | 3,106,253,013 | 2,354,393,584 |
| Net unrealized gain (loss) | (2,754,022,612) | (6,880,011,146) |
| Change in net assets from operations | $633,534,144 | $(4,330,854,620) |
| Total distributions to shareholders | $(2,677,004,803) | $(2,264,172,425) |
| Change in net assets from fund share transactions | $(1,305,337,635) | $(889,370,986) |
| Total change in net assets | $(3,348,808,294) | $(7,484,398,031) |
| Net assets | ||
| At beginning of period | 24,521,920,381 | 32,006,318,412 |
| At end of period | $21,173,112,087 | $24,521,920,381 |
| Class A | Year ended | ||||
| 5/31/23 | 5/31/22 | 5/31/21 | 5/31/20 | 5/31/19 | |
| Net asset value, beginning of period | $42.44 | $53.83 | $44.47 | $42.09 | $42.91 |
| Income (loss) from investment operations | |||||
| Net investment income (loss) (d) | $0.39 | $0.20 | $0.32 | $0.21 | $0.39 |
| Net realized and unrealized gain (loss) | 0.83 | (7.57) | 11.78 | 3.93 | 0.45 |
| Total from investment operations | $1.22 | $(7.37) | $12.10 | $4.14 | $0.84 |
| Less distributions declared to shareholders | |||||
| From net investment income | $(0.30) | $(0.39) | $(0.21) | $(0.37) | $(0.51) |
| From net realized gain | (4.88) | (3.63) | (2.53) | (1.39) | (1.15) |
| Total distributions declared to shareholders | $(5.18) | $(4.02) | $(2.74) | $(1.76) | $(1.66) |
| Net asset value, end of period (x) | $38.48 | $42.44 | $53.83 | $44.47 | $42.09 |
| Total return (%) (r)(s)(t)(x) | 3.67 | (15.10) | 27.66 | 9.84 | 2.29 |
| Ratios (%) (to average net assets) and Supplemental data: | |||||
| Expenses before expense reductions | 1.04 | 0.98 | 0.97 | 0.99 | 0.99 |
| Expenses after expense reductions | 1.03 | 0.96 | 0.96 | 0.98 | 0.98 |
| Net investment income (loss) | 1.00 | 0.40 | 0.63 | 0.48 | 0.93 |
| Portfolio turnover | 19 | 10 | 7 | 7 | 6 |
| Net assets at end of period (000 omitted) | $1,899,509 | $2,345,833 | $3,046,287 | $2,651,120 | $2,959,958 |
| Class B | Year ended | ||||
| 5/31/23 | 5/31/22 | 5/31/21 | 5/31/20 | 5/31/19 | |
| Net asset value, beginning of period | $39.72 | $50.76 | $42.18 | $39.99 | $40.80 |
| Income (loss) from investment operations | |||||
| Net investment income (loss) (d) | $(0.04) | $(0.25) | $(0.08) | $(0.12) | $0.06 |
| Net realized and unrealized gain (loss) | 0.89 | (7.01) | 11.19 | 3.72 | 0.46 |
| Total from investment operations | $0.85 | $(7.26) | $11.11 | $3.60 | $0.52 |
| Less distributions declared to shareholders | |||||
| From net investment income | $— | $(0.15) | $— | $(0.02) | $(0.18) |
| From net realized gain | (4.88) | (3.63) | (2.53) | (1.39) | (1.15) |
| Total distributions declared to shareholders | $(4.88) | $(3.78) | $(2.53) | $(1.41) | $(1.33) |
| Net asset value, end of period (x) | $35.69 | $39.72 | $50.76 | $42.18 | $39.99 |
| Total return (%) (r)(s)(t)(x) | 2.91 | (15.74) | 26.75 | 8.99 | 1.53 |
| Ratios (%) (to average net assets) and Supplemental data: | |||||
| Expenses before expense reductions | 1.79 | 1.72 | 1.72 | 1.74 | 1.74 |
| Expenses after expense reductions | 1.78 | 1.71 | 1.71 | 1.73 | 1.73 |
| Net investment income (loss) | (0.10) | (0.52) | (0.16) | (0.29) | 0.16 |
| Portfolio turnover | 19 | 10 | 7 | 7 | 6 |
| Net assets at end of period (000 omitted) | $2,313 | $8,336 | $19,911 | $25,231 | $35,571 |
| Class C | Year ended | ||||
| 5/31/23 | 5/31/22 | 5/31/21 | 5/31/20 | 5/31/19 | |
| Net asset value, beginning of period | $37.41 | $48.04 | $40.04 | $38.05 | $38.91 |
| Income (loss) from investment operations | |||||
| Net investment income (loss) (d) | $(0.04) | $(0.23) | $(0.09) | $(0.11) | $0.07 |
| Net realized and unrealized gain (loss) | 0.82 | (6.60) | 10.62 | 3.54 | 0.42 |
| Total from investment operations | $0.78 | $(6.83) | $10.53 | $3.43 | $0.49 |
| Less distributions declared to shareholders | |||||
| From net investment income | $— | $(0.17) | $— | $(0.05) | $(0.20) |
| From net realized gain | (4.88) | (3.63) | (2.53) | (1.39) | (1.15) |
| Total distributions declared to shareholders | $(4.88) | $(3.80) | $(2.53) | $(1.44) | $(1.35) |
| Net asset value, end of period (x) | $33.31 | $37.41 | $48.04 | $40.04 | $38.05 |
| Total return (%) (r)(s)(t)(x) | 2.90 | (15.73) | 26.73 | 9.00 | 1.53 |
| Ratios (%) (to average net assets) and Supplemental data: | |||||
| Expenses before expense reductions | 1.79 | 1.73 | 1.72 | 1.74 | 1.74 |
| Expenses after expense reductions | 1.78 | 1.71 | 1.71 | 1.73 | 1.73 |
| Net investment income (loss) | (0.10) | (0.50) | (0.19) | (0.27) | 0.17 |
| Portfolio turnover | 19 | 10 | 7 | 7 | 6 |
| Net assets at end of period (000 omitted) | $33,852 | $117,583 | $264,432 | $395,411 | $496,745 |
| Class I | Year ended | ||||
| 5/31/23 | 5/31/22 | 5/31/21 | 5/31/20 | 5/31/19 | |
| Net asset value, beginning of period | $45.09 | $56.87 | $46.83 | $44.24 | $45.02 |
| Income (loss) from investment operations | |||||
| Net investment income (loss) (d) | $0.51 | $0.34 | $0.47 | $0.34 | $0.53 |
| Net realized and unrealized gain (loss) | 0.91 | (8.04) | 12.44 | 4.13 | 0.47 |
| Total from investment operations | $1.42 | $(7.70) | $12.91 | $4.47 | $1.00 |
| Less distributions declared to shareholders | |||||
| From net investment income | $(0.41) | $(0.45) | $(0.34) | $(0.49) | $(0.63) |
| From net realized gain | (4.88) | (3.63) | (2.53) | (1.39) | (1.15) |
| Total distributions declared to shareholders | $(5.29) | $(4.08) | $(2.87) | $(1.88) | $(1.78) |
| Net asset value, end of period (x) | $41.22 | $45.09 | $56.87 | $46.83 | $44.24 |
| Total return (%) (r)(s)(t)(x) | 3.93 | (14.89) | 28.01 | 10.10 | 2.56 |
| Ratios (%) (to average net assets) and Supplemental data: | |||||
| Expenses before expense reductions | 0.79 | 0.73 | 0.72 | 0.74 | 0.74 |
| Expenses after expense reductions | 0.78 | 0.71 | 0.71 | 0.73 | 0.73 |
| Net investment income (loss) | 1.23 | 0.63 | 0.89 | 0.74 | 1.22 |
| Portfolio turnover | 19 | 10 | 7 | 7 | 6 |
| Net assets at end of period (000 omitted) | $6,689,895 | $8,888,439 | $12,285,870 | $10,468,862 | $10,871,918 |
| Class R1 | Year ended | ||||
| 5/31/23 | 5/31/22 | 5/31/21 | 5/31/20 | 5/31/19 | |
| Net asset value, beginning of period | $37.88 | $48.67 | $40.54 | $38.51 | $39.39 |
| Income (loss) from investment operations | |||||
| Net investment income (loss) (d) | $0.11 | $(0.17) | $(0.06) | $(0.10) | $0.08 |
| Net realized and unrealized gain (loss) | 0.68 | (6.74) | 10.72 | 3.58 | 0.41 |
| Total from investment operations | $0.79 | $(6.91) | $10.66 | $3.48 | $0.49 |
| Less distributions declared to shareholders | |||||
| From net investment income | $(0.02) | $(0.25) | $— | $(0.06) | $(0.22) |
| From net realized gain | (4.88) | (3.63) | (2.53) | (1.39) | (1.15) |
| Total distributions declared to shareholders | $(4.90) | $(3.88) | $(2.53) | $(1.45) | $(1.37) |
| Net asset value, end of period (x) | $33.77 | $37.88 | $48.67 | $40.54 | $38.51 |
| Total return (%) (r)(s)(t)(x) | 2.89 | (15.73) | 26.72 | 9.01 | 1.52 |
| Ratios (%) (to average net assets) and Supplemental data: | |||||
| Expenses before expense reductions | 1.79 | 1.73 | 1.72 | 1.74 | 1.73 |
| Expenses after expense reductions | 1.78 | 1.71 | 1.71 | 1.73 | 1.73 |
| Net investment income (loss) | 0.32 | (0.37) | (0.12) | (0.25) | 0.20 |
| Portfolio turnover | 19 | 10 | 7 | 7 | 6 |
| Net assets at end of period (000 omitted) | $8,149 | $8,909 | $11,648 | $9,836 | $11,321 |
| Class R2 | Year ended | ||||
| 5/31/23 | 5/31/22 | 5/31/21 | 5/31/20 | 5/31/19 | |
| Net asset value, beginning of period | $39.03 | $49.87 | $41.36 | $39.25 | $40.13 |
| Income (loss) from investment operations | |||||
| Net investment income (loss) (d) | $0.28 | $0.06 | $0.18 | $0.09 | $0.27 |
| Net realized and unrealized gain (loss) | 0.72 | (6.94) | 10.95 | 3.67 | 0.41 |
| Total from investment operations | $1.00 | $(6.88) | $11.13 | $3.76 | $0.68 |
| Less distributions declared to shareholders | |||||
| From net investment income | $(0.21) | $(0.33) | $(0.09) | $(0.26) | $(0.41) |
| From net realized gain | (4.88) | (3.63) | (2.53) | (1.39) | (1.15) |
| Total distributions declared to shareholders | $(5.09) | $(3.96) | $(2.62) | $(1.65) | $(1.56) |
| Net asset value, end of period (x) | $34.94 | $39.03 | $49.87 | $41.36 | $39.25 |
| Total return (%) (r)(s)(t)(x) | 3.42 | (15.30) | 27.36 | 9.56 | 2.02 |
| Ratios (%) (to average net assets) and Supplemental data: | |||||
| Expenses before expense reductions | 1.29 | 1.23 | 1.22 | 1.24 | 1.24 |
| Expenses after expense reductions | 1.28 | 1.21 | 1.21 | 1.23 | 1.23 |
| Net investment income (loss) | 0.79 | 0.12 | 0.38 | 0.23 | 0.69 |
| Portfolio turnover | 19 | 10 | 7 | 7 | 6 |
| Net assets at end of period (000 omitted) | $132,772 | $153,967 | $224,998 | $219,474 | $295,690 |
| Class R3 | Year ended | ||||
| 5/31/23 | 5/31/22 | 5/31/21 | 5/31/20 | 5/31/19 | |
| Net asset value, beginning of period | $42.06 | $53.38 | $44.11 | $41.78 | $42.62 |
| Income (loss) from investment operations | |||||
| Net investment income (loss) (d) | $0.41 | $0.20 | $0.31 | $0.21 | $0.40 |
| Net realized and unrealized gain (loss) | 0.79 | (7.49) | 11.70 | 3.89 | 0.43 |
| Total from investment operations | $1.20 | $(7.29) | $12.01 | $4.10 | $0.83 |
| Less distributions declared to shareholders | |||||
| From net investment income | $(0.31) | $(0.40) | $(0.21) | $(0.38) | $(0.52) |
| From net realized gain | (4.88) | (3.63) | (2.53) | (1.39) | (1.15) |
| Total distributions declared to shareholders | $(5.19) | $(4.03) | $(2.74) | $(1.77) | $(1.67) |
| Net asset value, end of period (x) | $38.07 | $42.06 | $53.38 | $44.11 | $41.78 |
| Total return (%) (r)(s)(t)(x) | 3.66 | (15.09) | 27.68 | 9.81 | 2.28 |
| Ratios (%) (to average net assets) and Supplemental data: | |||||
| Expenses before expense reductions | 1.04 | 0.98 | 0.97 | 0.99 | 0.99 |
| Expenses after expense reductions | 1.03 | 0.96 | 0.96 | 0.98 | 0.98 |
| Net investment income (loss) | 1.07 | 0.39 | 0.62 | 0.49 | 0.97 |
| Portfolio turnover | 19 | 10 | 7 | 7 | 6 |
| Net assets at end of period (000 omitted) | $977,368 | $1,034,115 | $1,383,344 | $1,320,257 | $1,353,427 |
| Class R4 | Year ended | ||||
| 5/31/23 | 5/31/22 | 5/31/21 | 5/31/20 | 5/31/19 | |
| Net asset value, beginning of period | $42.63 | $53.98 | $44.58 | $42.20 | $43.03 |
| Income (loss) from investment operations | |||||
| Net investment income (loss) (d) | $0.48 | $0.32 | $0.45 | $0.33 | $0.51 |
| Net realized and unrealized gain (loss) | 0.84 | (7.59) | 11.82 | 3.93 | 0.44 |
| Total from investment operations | $1.32 | $(7.27) | $12.27 | $4.26 | $0.95 |
| Less distributions declared to shareholders | |||||
| From net investment income | $(0.41) | $(0.45) | $(0.34) | $(0.49) | $(0.63) |
| From net realized gain | (4.88) | (3.63) | (2.53) | (1.39) | (1.15) |
| Total distributions declared to shareholders | $(5.29) | $(4.08) | $(2.87) | $(1.88) | $(1.78) |
| Net asset value, end of period (x) | $38.66 | $42.63 | $53.98 | $44.58 | $42.20 |
| Total return (%) (r)(s)(t)(x) | 3.94 | (14.89) | 27.99 | 10.09 | 2.56 |
| Ratios (%) (to average net assets) and Supplemental data: | |||||
| Expenses before expense reductions | 0.79 | 0.73 | 0.72 | 0.74 | 0.74 |
| Expenses after expense reductions | 0.78 | 0.71 | 0.71 | 0.73 | 0.73 |
| Net investment income (loss) | 1.22 | 0.61 | 0.88 | 0.75 | 1.22 |
| Portfolio turnover | 19 | 10 | 7 | 7 | 6 |
| Net assets at end of period (000 omitted) | $622,734 | $781,557 | $1,183,942 | $1,019,909 | $1,048,956 |
| Class R6 | Year ended | ||||
| 5/31/23 | 5/31/22 | 5/31/21 | 5/31/20 | 5/31/19 | |
| Net asset value, beginning of period | $42.72 | $54.06 | $44.63 | $42.24 | $43.09 |
| Income (loss) from investment operations | |||||
| Net investment income (loss) (d) | $0.57 | $0.40 | $0.51 | $0.37 | $0.56 |
| Net realized and unrealized gain (loss) | 0.80 | (7.63) | 11.84 | 3.94 | 0.42 |
| Total from investment operations | $1.37 | $(7.23) | $12.35 | $4.31 | $0.98 |
| Less distributions declared to shareholders | |||||
| From net investment income | $(0.46) | $(0.48) | $(0.39) | $(0.53) | $(0.68) |
| From net realized gain | (4.88) | (3.63) | (2.53) | (1.39) | (1.15) |
| Total distributions declared to shareholders | $(5.34) | $(4.11) | $(2.92) | $(1.92) | $(1.83) |
| Net asset value, end of period (x) | $38.75 | $42.72 | $54.06 | $44.63 | $42.24 |
| Total return (%) (r)(s)(t)(x) | 4.07 | (14.81) | 28.15 | 10.21 | 2.64 |
| Ratios (%) (to average net assets) and Supplemental data: | |||||
| Expenses before expense reductions | 0.68 | 0.62 | 0.62 | 0.63 | 0.63 |
| Expenses after expense reductions | 0.67 | 0.60 | 0.61 | 0.62 | 0.62 |
| Net investment income (loss) | 1.45 | 0.78 | 1.01 | 0.85 | 1.34 |
| Portfolio turnover | 19 | 10 | 7 | 7 | 6 |
| Net assets at end of period (000 omitted) | $10,806,520 | $11,183,181 | $13,585,886 | $11,561,818 | $10,706,826 |
| (d) | Per share data is based on average shares outstanding. |
| (r) | Certain expenses have been reduced without which performance would have been lower. |
| (s) | From time to time the fund may receive proceeds from litigation settlements, without which performance would be lower. |
| (t) | Total returns do not include any applicable sales charges. |
| (x) | The net asset values and total returns have been calculated on net assets which include adjustments made in accordance with U.S. generally accepted accounting principles required at period end for financial reporting purposes. |
| Financial Instruments | Level 1 | Level 2 | Level 3 | Total |
| Equity Securities | $20,359,034,067 | $— | $— | $20,359,034,067 |
| Mutual Funds | 662,348,862 | — | — | 662,348,862 |
| Total | $21,021,382,929 | $— | $— | $21,021,382,929 |
| Year ended 5/31/23 | Year ended 5/31/22 | |
| Ordinary income (including any short-term capital gains) | $210,000,377 | $358,168,433 |
| Long-term capital gains | 2,467,004,426 | 1,906,003,992 |
| Total distributions | $2,677,004,803 | $2,264,172,425 |
| As of 5/31/23 | |
| Cost of investments | $16,347,777,613 |
| Gross appreciation | 6,012,682,922 |
| Gross depreciation | (1,339,077,606) |
| Net unrealized appreciation (depreciation) | $4,673,605,316 |
| Undistributed ordinary income | 264,993,749 |
| Undistributed long-term capital gain | 1,490,490,370 |
| Other temporary differences | (5,327,584) |
| Total distributable earnings (loss) | $6,423,761,851 |
| Year ended 5/31/23 | Year ended 5/31/22 | ||
| Class A | $250,141,889 | $217,763,508 | |
| Class B | 741,849 | 1,129,603 | |
| Class C | 10,379,415 | 17,012,360 | |
| Class I | 850,925,336 | 832,113,114 | |
| Class R1 | 1,067,280 | 901,313 | |
| Class R2 | 18,790,693 | 15,548,735 | |
| Class R3 | 124,224,318 | 102,200,406 | |
| Class R4 | 89,717,095 | 78,381,372 | |
| Class R6 | 1,331,016,928 | 999,122,014 | |
| Total | $2,677,004,803 | $2,264,172,425 |
| Up to $1 billion | 0.90% |
| In excess of $1 billion and up to $2 billion | 0.80% |
| In excess of $2 billion and up to $10 billion | 0.70% |
| In excess of $10 billion and up to $15 billion | 0.65% |
| In excess of $15 billion and up to $20 billion | 0.55% |
| In excess of $20 billion and up to $25 billion | 0.50% |
| In excess of $25 billion and up to $30 billion | 0.45% |
| In excess of $30 billion and up to $35 billion | 0.43% |
| In excess of $35 billion | 0.41% |
| Distribution Fee Rate (d) | Service Fee Rate (d) | Total Distribution Plan (d) | Annual Effective Rate (e) | Distribution and Service Fee | |
| Class A | — | 0.25% | 0.25% | 0.25% | $ 5,024,628 |
| Class B | 0.75% | 0.25% | 1.00% | 1.00% | 55,823 |
| Class C | 0.75% | 0.25% | 1.00% | 1.00% | 759,095 |
| Class R1 | 0.75% | 0.25% | 1.00% | 1.00% | 80,594 |
| Class R2 | 0.25% | 0.25% | 0.50% | 0.50% | 693,760 |
| Class R3 | — | 0.25% | 0.25% | 0.25% | 2,434,618 |
| Total Distribution and Service Fees | $9,048,518 |
| (d) | In accordance with the distribution plan for certain classes, the fund pays distribution and/or service fees equal to these annual percentage rates of each class’s average daily net assets. The distribution and service fee rates disclosed by class represent the current rates in effect at the end of the reporting period. Any rate changes, if applicable, are detailed below. |
| (e) | The annual effective rates represent actual fees incurred under the distribution plan for the year ended May 31, 2023 based on each class's average daily net assets. MFD has voluntarily agreed to rebate a portion of each class's 0.25% service fee attributable to accounts for which there is no financial intermediary specified on the account except for accounts attributable to MFS or its affiliates' seed money. For the year ended May 31, 2023, this rebate amounted to $686 and $5 for Class A and Class R3 shares, respectively, and is included in the reduction of total expenses in the Statement of Operations. |
| Amount | |
| Class A | $621 |
| Class B | 1,616 |
| Class C | 521 |
| Year ended 5/31/23 | Year ended 5/31/22 | ||||
| Shares | Amount | Shares | Amount | ||
| Shares sold | |||||
| Class A | 13,274,910 | $504,319,325 | 10,279,910 | $495,582,124 | |
| Class B | 1,729 | 58,270 | 1,926 | 94,710 | |
| Class C | 24,121 | 806,356 | 34,925 | 1,610,985 | |
| Class I | 19,747,889 | 804,023,747 | 20,052,793 | 1,069,026,618 | |
| Class R1 | 29,533 | 1,010,493 | 23,934 | 1,099,404 | |
| Class R2 | 539,797 | 19,124,041 | 506,846 | 23,169,895 | |
| Class R3 | 4,447,231 | 169,949,070 | 7,979,778 | 410,670,659 | |
| Class R4 | 3,482,316 | 134,984,438 | 3,231,877 | 164,071,767 | |
| Class R6 | 24,791,219 | 957,292,755 | 33,455,875 | 1,649,747,940 | |
| 66,338,745 | $2,591,568,495 | 75,567,864 | $3,815,074,102 | ||
| Year ended 5/31/23 | Year ended 5/31/22 | ||||
| Shares | Amount | Shares | Amount | ||
| Shares issued to shareholders in reinvestment of distributions | |||||
| Class A | 6,031,312 | $217,850,991 | 3,702,121 | $193,620,921 | |
| Class B | 19,600 | 658,950 | 20,645 | 1,014,099 | |
| Class C | 324,856 | 10,193,970 | 361,686 | 16,731,614 | |
| Class I | 19,793,303 | 764,813,222 | 13,385,203 | 742,878,767 | |
| Class R1 | 33,552 | 1,067,280 | 19,238 | 901,313 | |
| Class R2 | 570,926 | 18,743,509 | 321,831 | 15,496,148 | |
| Class R3 | 3,476,751 | 124,224,318 | 1,971,839 | 102,200,405 | |
| Class R4 | 2,141,473 | 77,606,998 | 1,345,419 | 70,607,593 | |
| Class R6 | 35,244,961 | 1,279,392,088 | 18,110,430 | 951,884,189 | |
| 67,636,734 | $2,494,551,326 | 39,238,412 | $2,095,335,049 | ||
| Shares reacquired | |||||
| Class A | (25,222,219) | $(962,732,107) | (15,293,387) | $(762,719,283) | |
| Class B | (166,406) | (5,994,846) | (204,959) | (9,719,254) | |
| Class C | (2,476,103) | (83,280,740) | (2,757,292) | (121,228,370) | |
| Class I | (74,388,009) | (3,066,817,687) | (52,340,999) | (2,750,887,414) | |
| Class R1 | (57,011) | (1,941,099) | (47,286) | (2,169,741) | |
| Class R2 | (1,255,606) | (44,254,079) | (1,394,678) | (66,449,940) | |
| Class R3 | (6,841,682) | (259,542,613) | (11,275,088) | (571,149,040) | |
| Class R4 | (7,848,495) | (297,563,127) | (8,176,489) | (416,568,844) | |
| Class R6 | (42,903,713) | (1,669,331,158) | (41,125,810) | (2,098,888,251) | |
| (161,159,244) | $(6,391,457,456) | (132,615,988) | $(6,799,780,137) | ||
| Net change | |||||
| Class A | (5,915,997) | $(240,561,791) | (1,311,356) | $(73,516,238) | |
| Class B | (145,077) | (5,277,626) | (182,388) | (8,610,445) | |
| Class C | (2,127,126) | (72,280,414) | (2,360,681) | (102,885,771) | |
| Class I | (34,846,817) | (1,497,980,718) | (18,903,003) | (938,982,029) | |
| Class R1 | 6,074 | 136,674 | (4,114) | (169,024) | |
| Class R2 | (144,883) | (6,386,529) | (566,001) | (27,783,897) | |
| Class R3 | 1,082,300 | 34,630,775 | (1,323,471) | (58,277,976) | |
| Class R4 | (2,224,706) | (84,971,691) | (3,599,193) | (181,889,484) | |
| Class R6 | 17,132,467 | 567,353,685 | 10,440,495 | 502,743,878 | |
| (27,183,765) | $(1,305,337,635) | (17,809,712) | $(889,370,986) | ||
| Affiliated Issuers | Beginning Value | Purchases | Sales Proceeds | Realized Gain (Loss) | Change in Unrealized Appreciation or Depreciation | Ending Value |
| Hirose Electric Co. Ltd. | $356,896,633 | $— | $31,514,447 | $(755,074) | $(10,174,200) | $314,452,912 |
| IMI PLC | 301,554,515 | — | 10,695,221 | 1,617,670 | 32,579,521 | 325,056,485 |
| ITO EN Ltd.* | 191,926,495 | $— | 126,954,976 | 48,253,688 | (86,300,541) | — |
| MFS Institutional Money Market Portfolio | 919,522,220 | 3,885,143,737 | 4,142,337,217 | 116,273 | (96,151) | 662,348,862 |
| ROHTO Pharmaceutical Co. Ltd. | 196,795,568 | — | 41,907,604 | 7,952,916 | 114,779,777 | 277,620,657 |
| Toyo Suisan Kaisha Ltd. | 266,668,004 | — | 42,599,017 | 2,097,890 | 39,170,478 | 265,337,355 |
| $2,233,363,435 | $3,885,143,737 | $4,396,008,482 | $59,283,363 | $89,958,884 | $1,844,816,271 |
| Affiliated Issuers | Dividend Income | Capital Gain Distributions |
| Hirose Electric Co. Ltd. | $7,914,393 | $— |
| IMI PLC | 5,268,077 | — |
| ITO EN Ltd.* | — | — |
| MFS Institutional Money Market Portfolio | 23,526,974 | — |
| ROHTO Pharmaceutical Co. Ltd. | 2,058,623 | — |
| Toyo Suisan Kaisha Ltd. | 4,110,097 | — |
| $42,878,164 | $— |

July 14, 2023
| Name, Age | Position(s) Held with Fund | Trustee/Officer Since(h) | Number of MFS Funds overseen by the Trustee | Principal Occupations During the Past Five Years | Other Directorships During the Past Five Years (j) | |||||
| INTERESTED TRUSTEE | ||||||||||
| Michael W. Roberge (k) (age 56) | Trustee | January 2021 | 136 | Massachusetts Financial Services Company, Chairman (since January 2021); Chief Executive Officer (since January 2017); Director; Chairman of the Board (since January 2022); President (until December 2018); Chief Investment Officer (until December 2018) | N/A | |||||
| INDEPENDENT TRUSTEES | ||||||||||
| John P. Kavanaugh (age 68) | Trustee and Chair of Trustees | January 2009 | 136 | Private investor | N/A | |||||
| Steven E. Buller (age 71) | Trustee | February 2014 | 136 | Private investor | N/A | |||||
| John A. Caroselli (age 69) | Trustee | March 2017 | 136 | Private investor; JC Global Advisors, LLC (management consulting), President (since 2015) | N/A | |||||
| Maureen R. Goldfarb (age 68) | Trustee | January 2009 | 136 | Private investor | N/A | |||||
| Peter D. Jones (age 67) | Trustee | January 2019 | 136 | Private investor | N/A | |||||
| James W. Kilman, Jr. (age 62) | Trustee | January 2019 | 136 | Burford Capital Limited (finance and investment management), Senior Advisor (since May 3, 2021), Chief Financial Officer (2019 - May 2, 2021); KielStrand Capital LLC (family office), Chief Executive Officer (since 2016) | Alpha-En Corporation, Director (2016-2019) |
| Name, Age | Position(s) Held with Fund | Trustee/Officer Since(h) | Number of MFS Funds overseen by the Trustee | Principal Occupations During the Past Five Years | Other Directorships During the Past Five Years (j) | |||||
| Clarence Otis, Jr. (age 67) | Trustee | March 2017 | 136 | Private investor | VF Corporation, Director; Verizon Communications, Inc., Director; The Travelers Companies, Director | |||||
| Maryanne L. Roepke (age 67) | Trustee | May 2014 | 136 | Private investor | N/A | |||||
| Laurie J. Thomsen (age 65) | Trustee | March 2005 | 136 | Private investor | The Travelers Companies, Director; Dycom Industries, Inc., Director |
| Name, Age | Position(s) Held with Fund | Trustee/Officer Since(h) | Number of MFS Funds for which the Person is an Officer | Principal Occupations During the Past Five Years | ||||
| OFFICERS | ||||||||
| Christopher R. Bohane (k) (age 49) | Assistant Secretary and Assistant Clerk | July 2005 | 136 | Massachusetts Financial Services Company, Senior Vice President and Senior Managing Counsel | ||||
| Kino Clark (k) (age 55) | Assistant Treasurer | January 2012 | 136 | Massachusetts Financial Services Company, Vice President | ||||
| John W. Clark, Jr. (k) (age 56) | Assistant Treasurer | April 2017 | 136 | Massachusetts Financial Services Company, Vice President | ||||
| David L. DiLorenzo (k) (age 54) | President | July 2005 | 136 | Massachusetts Financial Services Company, Senior Vice President | ||||
| Heidi W. Hardin (k) (age 55) | Secretary and Clerk | April 2017 | 136 | Massachusetts Financial Services Company, Executive Vice President and General Counsel | ||||
| Brian E. Langenfeld (k) (age 50) | Assistant Secretary and Assistant Clerk | June 2006 | 136 | Massachusetts Financial Services Company, Vice President and Managing Counsel |
| Name, Age | Position(s) Held with Fund | Trustee/Officer Since(h) | Number of MFS Funds for which the Person is an Officer | Principal Occupations During the Past Five Years | ||||
| Rosa E. Licea-Mailloux (k) (age 46) | Chief Compliance Officer | March 2022 | 136 | Massachusetts Financial Services Company, Vice President (since 2018); Director of Corporate Compliance (2018-2021), Senior Director Compliance (2021-2022), Senior Managing Director of North American Compliance & Chief Compliance Officer (since March 2022); Natixis Investment Managers (investment management), Funds Chief Compliance Officer, Deputy General Counsel & Senior Vice President (until 2018) | ||||
| Amanda S. Mooradian (k) (age 44) | Assistant Secretary and Assistant Clerk | September 2018 | 136 | Massachusetts Financial Services Company, Assistant Vice President and Senior Counsel | ||||
| Susan A. Pereira (k) (age 52) | Assistant Secretary and Assistant Clerk | July 2005 | 136 | Massachusetts Financial Services Company, Vice President and Managing Counsel | ||||
| Kasey L. Phillips (k) (age 52) | Assistant Treasurer | September 2012 | 136 | Massachusetts Financial Services Company, Vice President | ||||
| Matthew A. Stowe (k) (age 48) | Assistant Secretary and Assistant Clerk | October 2014 | 136 | Massachusetts Financial Services Company, Vice President and Senior Managing Counsel | ||||
| William B. Wilson (k) (age 40) | Assistant Secretary and Assistant Clerk | October 2022 | 136 | Massachusetts Financial Services Company, Assistant Vice President and Senior Counsel | ||||
| James O. Yost (k) (age 63) | Treasurer | September 1990 | 136 | Massachusetts Financial Services Company, Senior Vice President |
| (h) | Date first appointed to serve as Trustee/Officer of an MFS Fund. Each Trustee has served continuously since appointment unless indicated otherwise. From January 2012 through December 2016, Messrs. DiLorenzo and Yost served as Treasurer and Deputy Treasurer of the Funds, respectively. |
| (j) | Directorships or trusteeships of companies required to report to the Securities and Exchange Commission (i.e., “public companies”). |
| (k) | “Interested person” of the Trust within the meaning of the Investment Company Act of 1940 (referred to as the 1940 Act), which is the principal federal law governing investment companies like the fund, as a result of a position with MFS. The address of MFS is 111 Huntington Avenue, Boston, Massachusetts 02199-7618. |
| Investment Adviser | Custodian |
| Massachusetts Financial Services Company 111 Huntington Avenue Boston, MA 02199-7618 | State Street Bank and Trust Company 1 Congress Street, Suite 1 Boston, MA 02114-2016 |
| Distributor | Independent Registered Public Accounting Firm |
| MFS Fund Distributors, Inc. 111 Huntington Avenue Boston, MA 02199-7618 | Ernst & Young LLP 200 Clarendon Street Boston, MA 02116 |
| Portfolio Manager(s) | |
| Philip Evans Benjamin Stone |
| FACTS | WHAT DOES MFS DO WITH YOUR PERSONAL INFORMATION? |
| Why? | Financial companies choose how they share your personal information. Federal law gives consumers the right to limit some but not all sharing. Federal law also requires us to tell you how we collect, share, and protect your personal information. Please read this notice carefully to understand what we do. |
| What? | The types of personal information we collect and share depend on the product or service you have with us. This information can include: |
| • Social Security number and account balances | |
| • Account transactions and transaction history | |
| • Checking account information and wire transfer instructions | |
| When you are no longer our customer, we continue to share your information as described in this notice. |
| How? | All financial companies need to share customers' personal information to run their everyday business. In the section below, we list the reasons financial companies can share their customers' personal information; the reasons MFS chooses to share; and whether you can limit this sharing. |
| Reasons we can share your personal information | Does MFS share? | Can you limit this sharing? |
| For our everyday business purposes – such as to process your transactions, maintain your account(s), respond to court orders and legal investigations, or report to credit bureaus | Yes | No |
| For our marketing purposes – to offer our products and services to you | No | We don't share |
| For joint marketing with other financial companies | No | We don't share |
| For our affiliates' everyday business purposes – information about your transactions and experiences | No | We don't share |
| For our affiliates' everyday business purposes – information about your creditworthiness | No | We don't share |
| For nonaffiliates to market to you | No | We don't share |
| Questions? | Call 800-225-2606 or go to mfs.com. |

| Who we are | |
| Who is providing this notice? | MFS Funds, MFS Investment Management, MFS Institutional Advisors, Inc., and MFS Heritage Trust Company. |
| What we do | |
| How does MFS protect my personal information? | To protect your personal information from unauthorized access and use, we use security measures that comply with federal law. These measures include procedural, electronic, and physical safeguards for the protection of the personal information we collect about you. |
| How does MFS collect my personal information? | We collect your personal information, for example, when you |
| • open an account or provide account information | |
| • direct us to buy securities or direct us to sell your securities | |
| • make a wire transfer | |
| We also collect your personal information from others, such as credit bureaus, affiliates, or other companies. | |
| Why can't I limit all sharing? | Federal law gives you the right to limit only |
| • sharing for affiliates' everyday business purposes – information about your creditworthiness | |
| • affiliates from using your information to market to you | |
| • sharing for nonaffiliates to market to you | |
| State laws and individual companies may give you additional rights to limit sharing. | |
| Definitions | |
| Affiliates | Companies related by common ownership or control. They can be financial and nonfinancial companies. |
| • MFS does not share personal information with affiliates, except for everyday business purposes as described on page one of this notice. | |
| Nonaffiliates | Companies not related by common ownership or control. They can be financial and nonfinancial companies. |
| • MFS does not share with nonaffiliates so they can market to you. | |
| Joint marketing | A formal agreement between nonaffiliated financial companies that together market financial products or services to you. |
| • MFS doesn't jointly market. | |
| Other important information |
| If you own an MFS product or receive an MFS service in the name of a third party such as a bank or broker-dealer, their privacy policy may apply to you instead of ours. |


Growth Equity Fund

Growth Equity Fund
| 1 | |
| 2 | |
| 4 | |
| 7 | |
| 9 | |
| 14 | |
| 16 | |
| 17 | |
| 18 | |
| 27 | |
| 37 | |
| 39 | |
| 43 | |
| 44 | |
| 44 | |
| 44 | |
| 44 | |
| 44 | |
| 46 |
| back cover |

| Apple, Inc. | 13.2% |
| Microsoft Corp. | 12.3% |
| Amazon.com, Inc. | 5.3% |
| Alphabet, Inc., “A” | 3.8% |
| Alphabet, Inc., “C” | 3.6% |
| NVIDIA Corp. | 2.7% |
| Visa, Inc., “A” | 2.2% |
| Applied Materials, Inc. | 2.1% |
| Adobe Systems, Inc. | 2.0% |
| PepsiCo, Inc. | 1.8% |
| Information Technology | 43.8% |
| Consumer Discretionary | 12.9% |
| Health Care | 10.4% |
| Communication Services | 8.5% |
| Financials | 7.2% |
| Industrials | 6.5% |
| Consumer Staples | 4.9% |
| Real Estate | 2.4% |
| Energy | 1.2% |
| Utilities | 1.0% |
| Materials | 0.6% |
| (g) | The Global Industry Classification Standard (GICS®) was developed by and/or is the exclusive property of MSCI, Inc. and S&P Global Market Intelligence Inc. (“S&P Global Market Intelligence”). GICS is a service mark of MSCI and S&P Global Market Intelligence and has been licensed for use by MFS. MFS has applied its own internal sector/industry classification methodology for equity securities and non-equity securities that are unclassified by GICS. |
| (b) | Security is not a benchmark constituent. |
| (h) | Security was not held in the portfolio at period end. |
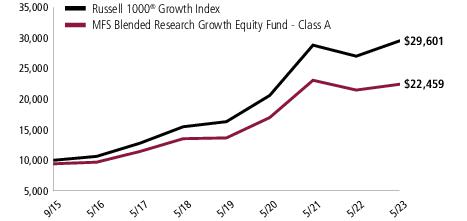
| Share Class | Class Inception Date | 1-yr | 5-yr | Life (t) |
| A | 9/15/15 | 4.54% | 10.67% | 11.92% |
| B | 9/15/15 | 3.77% | 9.85% | 11.10% |
| C | 9/15/15 | 3.77% | 9.84% | 11.09% |
| I | 9/15/15 | 4.81% | 10.96% | 12.21% |
| R1 | 9/15/15 | 3.77% | 9.84% | 11.09% |
| R2 | 9/15/15 | 4.28% | 10.40% | 11.65% |
| R3 | 9/15/15 | 4.52% | 10.68% | 11.93% |
| R4 | 9/15/15 | 4.80% | 10.96% | 12.22% |
| R6 | 9/15/15 | 4.91% | 11.04% | 12.30% |
| Russell 1000® Growth Index (f) | 9.55% | 13.84% | 15.10% |
| A With Initial Sales Charge (5.75%) | (1.47)% | 9.36% | 11.06% |
| B With CDSC (Declining over six years from 4% to 0%) (v) | (0.23)% | 9.57% | 11.10% |
| C With CDSC (1% for 12 months) (v) | 2.77% | 9.84% | 11.09% |
| (f) | Source: FactSet Research Systems Inc. |
| (t) | For the period from the class inception date through the stated period end. (See Notes to Performance Summary.) |
| (v) | Assuming redemption at the end of the applicable period. |
| (h) | Frank Russell Company (“Russell”) is the source and owner of the trademarks, service marks, and copyrights related to the Russell Indexes. Russell® is a trademark of Frank Russell Company. Neither Russell nor its licensors accept any liability for any errors or omissions in the Russell Indexes and/or Russell ratings or underlying data and no party may rely on any Russell Indexes and/or Russell ratings and/or underlying data contained in this document. No further distribution of Russell Data is permitted without Russell's express written consent. Russell does not promote, sponsor, or endorse the content of this document. |
December 1, 2022 through May 31, 2023
| Share Class | Annualized Expense Ratio | Beginning Account Value 12/01/22 | Ending Account Value 5/31/23 | Expenses Paid During Period (p) 12/01/22-5/31/23 | |
| A | Actual | 0.74% | $1,000.00 | $1,088.58 | $3.85 |
| Hypothetical (h) | 0.74% | $1,000.00 | $1,021.24 | $3.73 | |
| B | Actual | 1.49% | $1,000.00 | $1,084.26 | $7.74 |
| Hypothetical (h) | 1.49% | $1,000.00 | $1,017.50 | $7.49 | |
| C | Actual | 1.49% | $1,000.00 | $1,084.30 | $7.74 |
| Hypothetical (h) | 1.49% | $1,000.00 | $1,017.50 | $7.49 | |
| I | Actual | 0.49% | $1,000.00 | $1,089.69 | $2.55 |
| Hypothetical (h) | 0.49% | $1,000.00 | $1,022.49 | $2.47 | |
| R1 | Actual | 1.49% | $1,000.00 | $1,084.30 | $7.74 |
| Hypothetical (h) | 1.49% | $1,000.00 | $1,017.50 | $7.49 | |
| R2 | Actual | 0.99% | $1,000.00 | $1,087.17 | $5.15 |
| Hypothetical (h) | 0.99% | $1,000.00 | $1,020.00 | $4.99 | |
| R3 | Actual | 0.74% | $1,000.00 | $1,088.17 | $3.85 |
| Hypothetical (h) | 0.74% | $1,000.00 | $1,021.24 | $3.73 | |
| R4 | Actual | 0.49% | $1,000.00 | $1,090.18 | $2.55 |
| Hypothetical (h) | 0.49% | $1,000.00 | $1,022.49 | $2.47 | |
| R6 | Actual | 0.41% | $1,000.00 | $1,090.55 | $2.14 |
| Hypothetical (h) | 0.41% | $1,000.00 | $1,022.89 | $2.07 |
| (h) | 5% class return per year before expenses. |
| (p) | “Expenses Paid During Period” are equal to each class’s annualized expense ratio, as shown above, multiplied by the average account value over the period, multiplied by 182/365 (to reflect the one-half year period). Expenses paid do not include any applicable sales charges (loads). If these transaction costs had been included, your costs would have been higher. |
| Issuer | Shares/Par | Value ($) | ||
| Common Stocks – 99.4% | ||||
| Aerospace & Defense – 0.9% | ||||
| General Dynamics Corp. | 6,617 | $1,351,059 | ||
| Howmet Aerospace, Inc. | 15,013 | 641,806 | ||
| Textron, Inc. | 4,701 | 290,851 | ||
| $2,283,716 | ||||
| Apparel Manufacturers – 0.3% | ||||
| NIKE, Inc., “B” | 2,310 | $243,150 | ||
| Skechers USA, Inc., “A” (a) | 9,554 | 490,789 | ||
| $733,939 | ||||
| Automotive – 1.6% | ||||
| Allison Transmission Holdings, Inc. | 6,706 | $317,194 | ||
| Tesla, Inc. (a) | 17,241 | 3,515,957 | ||
| $3,833,151 | ||||
| Biotechnology – 0.1% | ||||
| Exelixis, Inc. (a) | 18,570 | $358,030 | ||
| Broadcasting – 0.7% | ||||
| Netflix, Inc. (a) | 4,181 | $1,652,457 | ||
| Brokerage & Asset Managers – 1.5% | ||||
| Apollo Global Management, Inc. | 40,113 | $2,681,554 | ||
| LPL Financial Holdings, Inc. | 5,849 | 1,139,268 | ||
| $3,820,822 | ||||
| Business Services – 2.1% | ||||
| Dropbox, Inc. (a) | 90,703 | $2,087,983 | ||
| Fiserv, Inc. (a) | 5,949 | 667,418 | ||
| GoDaddy, Inc. (a) | 20,640 | 1,514,563 | ||
| Verisk Analytics, Inc., “A” | 4,072 | 892,216 | ||
| $5,162,180 | ||||
| Computer Software – 17.3% | ||||
| Adobe Systems, Inc. (a) | 11,717 | $4,895,246 | ||
| Atlassian Corp. (a) | 11,614 | 2,099,695 | ||
| Autodesk, Inc. (a) | 9,385 | 1,871,275 | ||
| Microsoft Corp. | 92,257 | 30,296,276 | ||
| Palo Alto Networks, Inc. (a) | 15,342 | 3,273,829 | ||
| $42,436,321 | ||||
| Issuer | Shares/Par | Value ($) | ||
| Common Stocks – continued | ||||
| Computer Software - Systems – 14.4% | ||||
| Apple, Inc. | 182,733 | $32,389,424 | ||
| ServiceNow, Inc. (a) | 5,575 | 3,037,149 | ||
| $35,426,573 | ||||
| Construction – 0.5% | ||||
| Masco Corp. | 25,022 | $1,209,063 | ||
| Consumer Products – 2.0% | ||||
| Colgate-Palmolive Co. | 29,589 | $2,200,830 | ||
| Kimberly-Clark Corp. | 19,685 | 2,643,302 | ||
| $4,844,132 | ||||
| Consumer Services – 2.7% | ||||
| Booking Holdings, Inc. (a) | 1,735 | $4,352,716 | ||
| Expedia Group, Inc. (a) | 24,918 | 2,384,902 | ||
| $6,737,618 | ||||
| Electronics – 8.5% | ||||
| Analog Devices, Inc. | 2,195 | $390,029 | ||
| Applied Materials, Inc. | 38,810 | 5,173,373 | ||
| Lam Research Corp. | 7,135 | 4,400,154 | ||
| NVIDIA Corp. | 17,741 | 6,712,130 | ||
| NXP Semiconductors N.V. | 7,689 | 1,377,100 | ||
| Texas Instruments, Inc. | 15,653 | 2,721,744 | ||
| $20,774,530 | ||||
| Energy - Independent – 0.9% | ||||
| EOG Resources, Inc. | 15,106 | $1,620,723 | ||
| Phillips 66 | 6,742 | 617,634 | ||
| $2,238,357 | ||||
| Energy - Renewables – 0.7% | ||||
| Enphase Energy, Inc. (a) | 10,478 | $1,821,915 | ||
| Food & Beverages – 2.6% | ||||
| Archer Daniels Midland Co. | 25,662 | $1,813,020 | ||
| PepsiCo, Inc. | 24,671 | 4,498,757 | ||
| $6,311,777 | ||||
| Gaming & Lodging – 0.5% | ||||
| Las Vegas Sands Corp. (a) | 10,932 | $602,681 | ||
| Marriott International, Inc., “A” | 3,669 | 615,622 | ||
| $1,218,303 | ||||
| Issuer | Shares/Par | Value ($) | ||
| Common Stocks – continued | ||||
| Health Maintenance Organizations – 2.1% | ||||
| Cigna Group | 10,087 | $2,495,625 | ||
| UnitedHealth Group, Inc. | 5,368 | 2,615,504 | ||
| $5,111,129 | ||||
| Insurance – 2.6% | ||||
| Ameriprise Financial, Inc. | 8,938 | $2,667,725 | ||
| Equitable Holdings, Inc. | 85,860 | 2,107,004 | ||
| Everest Re Group Ltd. | 774 | 263,176 | ||
| MetLife, Inc. | 28,937 | 1,433,828 | ||
| $6,471,733 | ||||
| Internet – 9.3% | ||||
| Alphabet, Inc., “A” (a) | 76,565 | $9,407,541 | ||
| Alphabet, Inc., “C” (a) | 71,221 | 8,786,535 | ||
| Gartner, Inc. (a) | 10,588 | 3,630,202 | ||
| Meta Platforms, Inc., “A” (a) | 3,576 | 946,639 | ||
| $22,770,917 | ||||
| Leisure & Toys – 0.6% | ||||
| Brunswick Corp. | 8,279 | $625,064 | ||
| Polaris, Inc. | 8,032 | 865,127 | ||
| $1,490,191 | ||||
| Machinery & Tools – 3.1% | ||||
| AGCO Corp. | 11,848 | $1,306,597 | ||
| Ingersoll Rand, Inc. | 42,095 | 2,385,103 | ||
| RB Global, Inc. | 16,811 | 875,517 | ||
| Timken Co. | 22,258 | 1,592,560 | ||
| United Rentals, Inc. | 4,141 | 1,382,224 | ||
| $7,542,001 | ||||
| Medical & Health Technology & Services – 2.8% | ||||
| IQVIA Holdings, Inc. (a) | 14,268 | $2,809,512 | ||
| McKesson Corp. | 7,819 | 3,055,978 | ||
| Veeva Systems, Inc. (a) | 5,579 | 924,440 | ||
| $6,789,930 | ||||
| Medical Equipment – 1.3% | ||||
| Abbott Laboratories | 2,567 | $261,834 | ||
| Agilent Technologies, Inc. | 3,964 | 458,516 | ||
| Align Technology, Inc. (a) | 8,056 | 2,277,109 | ||
| Bruker BioSciences Corp. | 2,349 | 162,316 | ||
| $3,159,775 | ||||
| Issuer | Shares/Par | Value ($) | ||
| Common Stocks – continued | ||||
| Natural Gas - Pipeline – 0.3% | ||||
| Cheniere Energy, Inc. | 3,834 | $535,878 | ||
| Targa Resources Corp. | 2,871 | 195,372 | ||
| $731,250 | ||||
| Network & Telecom – 1.3% | ||||
| Equinix, Inc., REIT | 4,379 | $3,264,763 | ||
| Other Banks & Diversified Financials – 2.8% | ||||
| Mastercard, Inc., “A” | 3,949 | $1,441,464 | ||
| Visa, Inc., “A” | 24,120 | 5,331,243 | ||
| $6,772,707 | ||||
| Pharmaceuticals – 4.1% | ||||
| AbbVie, Inc. | 4,227 | $583,157 | ||
| Eli Lilly & Co. | 4,702 | 2,019,321 | ||
| Incyte Corp. (a) | 7,200 | 443,160 | ||
| Merck & Co., Inc. | 33,533 | 3,702,379 | ||
| Vertex Pharmaceuticals, Inc. (a) | 10,583 | 3,424,341 | ||
| $10,172,358 | ||||
| Railroad & Shipping – 1.5% | ||||
| CSX Corp. | 81,743 | $2,507,058 | ||
| Union Pacific Corp. | 5,679 | 1,093,321 | ||
| $3,600,379 | ||||
| Real Estate – 0.4% | ||||
| Simon Property Group, Inc., REIT | 9,811 | $1,031,627 | ||
| Specialty Chemicals – 0.6% | ||||
| Chemours Co. | 53,697 | $1,422,433 | ||
| Specialty Stores – 7.7% | ||||
| Amazon.com, Inc. (a) | 108,657 | $13,101,861 | ||
| Costco Wholesale Corp. | 362 | 185,185 | ||
| Home Depot, Inc. | 6,711 | 1,902,233 | ||
| O'Reilly Automotive, Inc. (a) | 3,052 | 2,756,902 | ||
| Ulta Beauty, Inc. (a) | 831 | 340,569 | ||
| Walmart Stores, Inc. | 4,530 | 665,321 | ||
| $18,952,071 | ||||
| Telecommunications - Wireless – 0.6% | ||||
| SBA Communications Corp., REIT | 7,070 | $1,567,985 | ||
| Utilities - Electric Power – 1.0% | ||||
| Vistra Corp. | 100,261 | $2,403,256 | ||
| Total Common Stocks (Identified Cost, $157,226,432) | $244,117,389 | |||
| Issuer | Shares/Par | Value ($) | ||
| Investment Companies (h) – 0.1% | ||||
| Money Market Funds – 0.1% | ||||
| MFS Institutional Money Market Portfolio, 4.88% (v) (Identified Cost, $298,163) | 298,164 | $298,134 | ||
| Other Assets, Less Liabilities – 0.5% | 1,213,253 | |||
| Net Assets – 100.0% | $245,628,776 | |||
| (a) | Non-income producing security. | |||
| (h) | An affiliated issuer, which may be considered one in which the fund owns 5% or more of the outstanding voting securities, or a company which is under common control. At period end, the aggregate values of the fund's investments in affiliated issuers and in unaffiliated issuers were $298,134 and $244,117,389, respectively. | |||
| (v) | Affiliated issuer that is available only to investment companies managed by MFS. The rate quoted for the MFS Institutional Money Market Portfolio is the annualized seven-day yield of the fund at period end. |
| The following abbreviations are used in this report and are defined: | |
| REIT | Real Estate Investment Trust |
| Assets | |
| Investments in unaffiliated issuers, at value (identified cost, $157,226,432) | $244,117,389 |
| Investments in affiliated issuers, at value (identified cost, $298,163) | 298,134 |
| Receivables for | |
| Investments sold | 1,700,453 |
| Fund shares sold | 114,531 |
| Dividends | 247,394 |
| Receivable from investment adviser | 21,855 |
| Other assets | 1,111 |
| Total assets | $246,500,867 |
| Liabilities | |
| Payables for | |
| Fund shares reacquired | $776,161 |
| Payable to affiliates | |
| Administrative services fee | 251 |
| Shareholder servicing costs | 19,329 |
| Distribution and service fees | 415 |
| Payable for independent Trustees' compensation | 13 |
| Accrued expenses and other liabilities | 75,922 |
| Total liabilities | $872,091 |
| Net assets | $245,628,776 |
| Net assets consist of | |
| Paid-in capital | $169,485,255 |
| Total distributable earnings (loss) | 76,143,521 |
| Net assets | $245,628,776 |
| Shares of beneficial interest outstanding | 14,982,689 |
| Net assets | Shares outstanding | Net asset value per share (a) | |
| Class A | $19,925,325 | 1,226,305 | $16.25 |
| Class B | 477,754 | 30,649 | 15.59 |
| Class C | 1,055,774 | 67,768 | 15.58 |
| Class I | 54,444,513 | 3,322,164 | 16.39 |
| Class R1 | 917,918 | 58,920 | 15.58 |
| Class R2 | 252,951 | 15,588 | 16.23 |
| Class R3 | 146,570 | 8,976 | 16.33 |
| Class R4 | 121,578 | 7,406 | 16.42 |
| Class R6 | 168,286,393 | 10,244,913 | 16.43 |
| (a) | Maximum offering price per share was equal to the net asset value per share for all share classes, except for Class A, for which the maximum offering price per share was $17.24 [100 / 94.25 x $16.25]. On sales of $50,000 or more, the maximum offering price of Class A shares is reduced. A contingent deferred sales charge may be imposed on redemptions of Class A, Class B, and Class C shares. Redemption price per share was equal to the net asset value per share for Classes I, R1, R2, R3, R4, and R6. |
| Net investment income (loss) | |
| Income | |
| Dividends | $2,770,923 |
| Dividends from affiliated issuers | 66,635 |
| Other | 6,913 |
| Foreign taxes withheld | (6,492) |
| Total investment income | $2,837,979 |
| Expenses | |
| Management fee | $913,806 |
| Distribution and service fees | 61,707 |
| Shareholder servicing costs | 74,097 |
| Administrative services fee | 44,984 |
| Independent Trustees' compensation | 5,824 |
| Custodian fee | 15,494 |
| Shareholder communications | 12,736 |
| Audit and tax fees | 63,670 |
| Legal fees | 8,657 |
| Registration fees | 124,941 |
| Miscellaneous | 32,857 |
| Total expenses | $1,358,773 |
| Reduction of expenses by investment adviser and distributor | (290,573) |
| Net expenses | $1,068,200 |
| Net investment income (loss) | $1,769,779 |
| Realized and unrealized gain (loss) | |
| Realized gain (loss) (identified cost basis) | |
| Unaffiliated issuers | $(11,772,642) |
| Affiliated issuers | (1,157) |
| Net realized gain (loss) | $(11,773,799) |
| Change in unrealized appreciation or depreciation | |
| Unaffiliated issuers | $23,371,207 |
| Affiliated issuers | (29) |
| Net unrealized gain (loss) | $23,371,178 |
| Net realized and unrealized gain (loss) | $11,597,379 |
| Change in net assets from operations | $13,367,158 |
| Year ended | ||
| 5/31/23 | 5/31/22 | |
| Change in net assets | ||
| From operations | ||
| Net investment income (loss) | $1,769,779 | $735,983 |
| Net realized gain (loss) | (11,773,799) | 31,068,981 |
| Net unrealized gain (loss) | 23,371,178 | (43,439,427) |
| Change in net assets from operations | $13,367,158 | $(11,634,463) |
| Total distributions to shareholders | $(5,461,940) | $(39,168,208) |
| Change in net assets from fund share transactions | $8,348,641 | $16,530,203 |
| Total change in net assets | $16,253,859 | $(34,272,468) |
| Net assets | ||
| At beginning of period | 229,374,917 | 263,647,385 |
| At end of period | $245,628,776 | $229,374,917 |
| Class A | Year ended | ||||
| 5/31/23 | 5/31/22 | 5/31/21 | 5/31/20 | 5/31/19 | |
| Net asset value, beginning of period | $15.89 | $20.10 | $15.79 | $13.25 | $14.09 |
| Income (loss) from investment operations | |||||
| Net investment income (loss) (d) | $0.07 | $0.01 | $0.02 | $0.06 | $0.08 |
| Net realized and unrealized gain (loss) | 0.62 | (0.76) | 5.50 | 3.12 | (0.03)(g) |
| Total from investment operations | $0.69 | $(0.75) | $5.52 | $3.18 | $0.05 |
| Less distributions declared to shareholders | |||||
| From net investment income | $(0.00)(w) | $— | $(0.04) | $(0.08) | $(0.07) |
| From net realized gain | (0.33) | (3.46) | (1.17) | (0.56) | (0.82) |
| Total distributions declared to shareholders | $(0.33) | $(3.46) | $(1.21) | $(0.64) | $(0.89) |
| Net asset value, end of period (x) | $16.25 | $15.89 | $20.10 | $15.79 | $13.25 |
| Total return (%) (r)(s)(t)(x) | 4.54 | (6.92) | 35.89 | 24.34 | 0.95 |
| Ratios (%) (to average net assets) and Supplemental data: | |||||
| Expenses before expense reductions | 0.87 | 0.86 | 0.86 | 0.90 | 0.89 |
| Expenses after expense reductions | 0.74 | 0.74 | 0.74 | 0.74 | 0.74 |
| Net investment income (loss) | 0.50 | 0.03 | 0.08 | 0.42 | 0.59 |
| Portfolio turnover | 64 | 55 | 71 | 61 | 60 |
| Net assets at end of period (000 omitted) | $19,925 | $15,472 | $71,049 | $57,531 | $52,918 |
| Class B | Year ended | ||||
| 5/31/23 | 5/31/22 | 5/31/21 | 5/31/20 | 5/31/19 | |
| Net asset value, beginning of period | $15.37 | $19.67 | $15.55 | $13.08 | $13.95 |
| Income (loss) from investment operations | |||||
| Net investment income (loss) (d) | $(0.04) | $(0.14) | $(0.12) | $(0.05) | $(0.02) |
| Net realized and unrealized gain (loss) | 0.59 | (0.70) | 5.41 | 3.08 | (0.03)(g) |
| Total from investment operations | $0.55 | $(0.84) | $5.29 | $3.03 | $(0.05) |
| Less distributions declared to shareholders | |||||
| From net investment income | $— | $— | $— | $— | $— |
| From net realized gain | (0.33) | (3.46) | (1.17) | (0.56) | (0.82) |
| Total distributions declared to shareholders | $(0.33) | $(3.46) | $(1.17) | $(0.56) | $(0.82) |
| Net asset value, end of period (x) | $15.59 | $15.37 | $19.67 | $15.55 | $13.08 |
| Total return (%) (r)(s)(t)(x) | 3.77 | (7.58) | 34.89 | 23.42 | 0.17 |
| Ratios (%) (to average net assets) and Supplemental data: | |||||
| Expenses before expense reductions | 1.62 | 1.63 | 1.61 | 1.65 | 1.64 |
| Expenses after expense reductions | 1.49 | 1.49 | 1.49 | 1.49 | 1.49 |
| Net investment income (loss) | (0.24) | (0.73) | (0.67) | (0.33) | (0.14) |
| Portfolio turnover | 64 | 55 | 71 | 61 | 60 |
| Net assets at end of period (000 omitted) | $478 | $467 | $550 | $408 | $428 |
| Class C | Year ended | ||||
| 5/31/23 | 5/31/22 | 5/31/21 | 5/31/20 | 5/31/19 | |
| Net asset value, beginning of period | $15.36 | $19.66 | $15.54 | $13.07 | $13.95 |
| Income (loss) from investment operations | |||||
| Net investment income (loss) (d) | $(0.04) | $(0.14) | $(0.12) | $(0.05) | $(0.01) |
| Net realized and unrealized gain (loss) | 0.59 | (0.70) | 5.41 | 3.08 | (0.05)(g) |
| Total from investment operations | $0.55 | $(0.84) | $5.29 | $3.03 | $(0.06) |
| Less distributions declared to shareholders | |||||
| From net investment income | $— | $— | $— | $— | $(0.00)(w) |
| From net realized gain | (0.33) | (3.46) | (1.17) | (0.56) | (0.82) |
| Total distributions declared to shareholders | $(0.33) | $(3.46) | $(1.17) | $(0.56) | $(0.82) |
| Net asset value, end of period (x) | $15.58 | $15.36 | $19.66 | $15.54 | $13.07 |
| Total return (%) (r)(s)(t)(x) | 3.77 | (7.58) | 34.91 | 23.44 | 0.13 |
| Ratios (%) (to average net assets) and Supplemental data: | |||||
| Expenses before expense reductions | 1.62 | 1.63 | 1.60 | 1.65 | 1.65 |
| Expenses after expense reductions | 1.49 | 1.49 | 1.49 | 1.49 | 1.49 |
| Net investment income (loss) | (0.26) | (0.74) | (0.67) | (0.33) | (0.11) |
| Portfolio turnover | 64 | 55 | 71 | 61 | 60 |
| Net assets at end of period (000 omitted) | $1,056 | $874 | $859 | $613 | $525 |
| Class I | Year ended | ||||
| 5/31/23 | 5/31/22 | 5/31/21 | 5/31/20 | 5/31/19 | |
| Net asset value, beginning of period | $16.00 | $20.21 | $15.87 | $13.31 | $14.17 |
| Income (loss) from investment operations | |||||
| Net investment income (loss) (d) | $0.11 | $0.05 | $0.06 | $0.10 | $0.13 |
| Net realized and unrealized gain (loss) | 0.63 | (0.75) | 5.54 | 3.14 | (0.05)(g) |
| Total from investment operations | $0.74 | $(0.70) | $5.60 | $3.24 | $0.08 |
| Less distributions declared to shareholders | |||||
| From net investment income | $(0.02) | $(0.05) | $(0.09) | $(0.12) | $(0.12) |
| From net realized gain | (0.33) | (3.46) | (1.17) | (0.56) | (0.82) |
| Total distributions declared to shareholders | $(0.35) | $(3.51) | $(1.26) | $(0.68) | $(0.94) |
| Net asset value, end of period (x) | $16.39 | $16.00 | $20.21 | $15.87 | $13.31 |
| Total return (%) (r)(s)(t)(x) | 4.81 | (6.66) | 36.23 | 24.71 | 1.18 |
| Ratios (%) (to average net assets) and Supplemental data: | |||||
| Expenses before expense reductions | 0.62 | 0.64 | 0.60 | 0.65 | 0.64 |
| Expenses after expense reductions | 0.49 | 0.49 | 0.49 | 0.49 | 0.49 |
| Net investment income (loss) | 0.76 | 0.27 | 0.33 | 0.68 | 0.98 |
| Portfolio turnover | 64 | 55 | 71 | 61 | 60 |
| Net assets at end of period (000 omitted) | $54,445 | $53,045 | $4,866 | $2,366 | $1,560 |
| Class R1 | Year ended | ||||
| 5/31/23 | 5/31/22 | 5/31/21 | 5/31/20 | 5/31/19 | |
| Net asset value, beginning of period | $15.36 | $19.66 | $15.54 | $13.08 | $13.95 |
| Income (loss) from investment operations | |||||
| Net investment income (loss) (d) | $(0.03) | $(0.13) | $(0.12) | $(0.05) | $(0.02) |
| Net realized and unrealized gain (loss) | 0.58 | (0.71) | 5.41 | 3.07 | (0.03)(g) |
| Total from investment operations | $0.55 | $(0.84) | $5.29 | $3.02 | $(0.05) |
| Less distributions declared to shareholders | |||||
| From net investment income | $— | $— | $— | $— | $— |
| From net realized gain | (0.33) | (3.46) | (1.17) | (0.56) | (0.82) |
| Total distributions declared to shareholders | $(0.33) | $(3.46) | $(1.17) | $(0.56) | $(0.82) |
| Net asset value, end of period (x) | $15.58 | $15.36 | $19.66 | $15.54 | $13.08 |
| Total return (%) (r)(s)(t)(x) | 3.77 | (7.58) | 34.91 | 23.34 | 0.18 |
| Ratios (%) (to average net assets) and Supplemental data: | |||||
| Expenses before expense reductions | 1.62 | 1.63 | 1.60 | 1.64 | 1.64 |
| Expenses after expense reductions | 1.49 | 1.49 | 1.49 | 1.49 | 1.49 |
| Net investment income (loss) | (0.23) | (0.70) | (0.67) | (0.33) | (0.16) |
| Portfolio turnover | 64 | 55 | 71 | 61 | 60 |
| Net assets at end of period (000 omitted) | $918 | $495 | $320 | $87 | $170 |
| Class R2 | Year ended | ||||
| 5/31/23 | 5/31/22 | 5/31/21 | 5/31/20 | 5/31/19 | |
| Net asset value, beginning of period | $15.91 | $20.15 | $15.84 | $13.29 | $14.10 |
| Income (loss) from investment operations | |||||
| Net investment income (loss) (d) | $0.04 | $(0.04) | $(0.03) | $0.03 | $0.04 |
| Net realized and unrealized gain (loss) | 0.61 | (0.74) | 5.52 | 3.13 | (0.03)(g) |
| Total from investment operations | $0.65 | $(0.78) | $5.49 | $3.16 | $0.01 |
| Less distributions declared to shareholders | |||||
| From net investment income | $— | $— | $(0.01) | $(0.05) | $— |
| From net realized gain | (0.33) | (3.46) | (1.17) | (0.56) | (0.82) |
| Total distributions declared to shareholders | $(0.33) | $(3.46) | $(1.18) | $(0.61) | $(0.82) |
| Net asset value, end of period (x) | $16.23 | $15.91 | $20.15 | $15.84 | $13.29 |
| Total return (%) (r)(s)(t)(x) | 4.28 | (7.07) | 35.52 | 24.10 | 0.61 |
| Ratios (%) (to average net assets) and Supplemental data: | |||||
| Expenses before expense reductions | 1.12 | 1.13 | 1.11 | 1.16 | 1.14 |
| Expenses after expense reductions | 0.99 | 0.99 | 0.99 | 0.99 | 0.99 |
| Net investment income (loss) | 0.25 | (0.23) | (0.17) | 0.17 | 0.29 |
| Portfolio turnover | 64 | 55 | 71 | 61 | 60 |
| Net assets at end of period (000 omitted) | $253 | $200 | $182 | $266 | $106 |
| Class R3 | Year ended | ||||
| 5/31/23 | 5/31/22 | 5/31/21 | 5/31/20 | 5/31/19 | |
| Net asset value, beginning of period | $15.97 | $20.17 | $15.85 | $13.30 | $14.14 |
| Income (loss) from investment operations | |||||
| Net investment income (loss) (d) | $0.08 | $0.00 | $0.02 | $0.06 | $0.08 |
| Net realized and unrealized gain (loss) | 0.61 | (0.74) | 5.52 | 3.14 | (0.03)(g) |
| Total from investment operations | $0.69 | $(0.74) | $5.54 | $3.20 | $0.05 |
| Less distributions declared to shareholders | |||||
| From net investment income | $(0.00)(w) | $— | $(0.05) | $(0.09) | $(0.07) |
| From net realized gain | (0.33) | (3.46) | (1.17) | (0.56) | (0.82) |
| Total distributions declared to shareholders | $(0.33) | $(3.46) | $(1.22) | $(0.65) | $(0.89) |
| Net asset value, end of period (x) | $16.33 | $15.97 | $20.17 | $15.85 | $13.30 |
| Total return (%) (r)(s)(t)(x) | 4.52 | (6.85) | 35.85 | 24.35 | 0.98 |
| Ratios (%) (to average net assets) and Supplemental data: | |||||
| Expenses before expense reductions | 0.87 | 0.88 | 0.85 | 0.90 | 0.89 |
| Expenses after expense reductions | 0.74 | 0.74 | 0.74 | 0.74 | 0.74 |
| Net investment income (loss) | 0.51 | 0.02 | 0.08 | 0.42 | 0.59 |
| Portfolio turnover | 64 | 55 | 71 | 61 | 60 |
| Net assets at end of period (000 omitted) | $147 | $122 | $130 | $90 | $72 |
| Class R4 | Year ended | ||||
| 5/31/23 | 5/31/22 | 5/31/21 | 5/31/20 | 5/31/19 | |
| Net asset value, beginning of period | $16.03 | $20.23 | $15.87 | $13.32 | $14.17 |
| Income (loss) from investment operations | |||||
| Net investment income (loss) (d) | $0.11 | $0.05 | $0.06 | $0.10 | $0.12 |
| Net realized and unrealized gain (loss) | 0.63 | (0.75) | 5.56 | 3.13 | (0.04)(g) |
| Total from investment operations | $0.74 | $(0.70) | $5.62 | $3.23 | $0.08 |
| Less distributions declared to shareholders | |||||
| From net investment income | $(0.02) | $(0.04) | $(0.09) | $(0.12) | $(0.11) |
| From net realized gain | (0.33) | (3.46) | (1.17) | (0.56) | (0.82) |
| Total distributions declared to shareholders | $(0.35) | $(3.50) | $(1.26) | $(0.68) | $(0.93) |
| Net asset value, end of period (x) | $16.42 | $16.03 | $20.23 | $15.87 | $13.32 |
| Total return (%) (r)(s)(t)(x) | 4.80 | (6.64) | 36.34 | 24.60 | 1.18 |
| Ratios (%) (to average net assets) and Supplemental data: | |||||
| Expenses before expense reductions | 0.62 | 0.63 | 0.60 | 0.65 | 0.64 |
| Expenses after expense reductions | 0.49 | 0.49 | 0.49 | 0.49 | 0.49 |
| Net investment income (loss) | 0.76 | 0.27 | 0.33 | 0.67 | 0.84 |
| Portfolio turnover | 64 | 55 | 71 | 61 | 60 |
| Net assets at end of period (000 omitted) | $122 | $116 | $124 | $91 | $73 |
| Class R6 | Year ended | ||||
| 5/31/23 | 5/31/22 | 5/31/21 | 5/31/20 | 5/31/19 | |
| Net asset value, beginning of period | $16.03 | $20.23 | $15.89 | $13.32 | $14.18 |
| Income (loss) from investment operations | |||||
| Net investment income (loss) (d) | $0.13 | $0.07 | $0.08 | $0.11 | $0.13 |
| Net realized and unrealized gain (loss) | 0.62 | (0.75) | 5.53 | 3.16 | (0.05)(g) |
| Total from investment operations | $0.75 | $(0.68) | $5.61 | $3.27 | $0.08 |
| Less distributions declared to shareholders | |||||
| From net investment income | $(0.02) | $(0.06) | $(0.10) | $(0.14) | $(0.12) |
| From net realized gain | (0.33) | (3.46) | (1.17) | (0.56) | (0.82) |
| Total distributions declared to shareholders | $(0.35) | $(3.52) | $(1.27) | $(0.70) | $(0.94) |
| Net asset value, end of period (x) | $16.43 | $16.03 | $20.23 | $15.89 | $13.32 |
| Total return (%) (r)(s)(t)(x) | 4.91 | (6.57) | 36.29 | 24.86 | 1.22 |
| Ratios (%) (to average net assets) and Supplemental data: | |||||
| Expenses before expense reductions | 0.54 | 0.54 | 0.52 | 0.55 | 0.55 |
| Expenses after expense reductions | 0.42 | 0.40 | 0.40 | 0.39 | 0.40 |
| Net investment income (loss) | 0.82 | 0.36 | 0.42 | 0.77 | 0.93 |
| Portfolio turnover | 64 | 55 | 71 | 61 | 60 |
| Net assets at end of period (000 omitted) | $168,286 | $158,585 | $185,568 | $145,833 | $126,840 |
| (d) | Per share data is based on average shares outstanding. |
| (g) | The per share amount varies from the net realized and unrealized gain/loss for the period because of the timing of sales of fund shares and the per share amount of realized and unrealized gains and losses at such time. |
| (r) | Certain expenses have been reduced without which performance would have been lower. |
| (s) | From time to time the fund may receive proceeds from litigation settlements, without which performance would be lower. |
| (t) | Total returns do not include any applicable sales charges. |
| (w) | Per share amount was less than $0.01. |
| (x) | The net asset values and total returns have been calculated on net assets which include adjustments made in accordance with U.S. generally accepted accounting principles required at period end for financial reporting purposes. |
| Financial Instruments | Level 1 | Level 2 | Level 3 | Total |
| Equity Securities | $244,117,389 | $— | $— | $244,117,389 |
| Mutual Funds | 298,134 | — | — | 298,134 |
| Total | $244,415,523 | $— | $— | $244,415,523 |
| Year ended 5/31/23 | Year ended 5/31/22 | |
| Ordinary income (including any short-term capital gains) | $745,942 | $14,461,131 |
| Long-term capital gains | 4,715,998 | 24,707,077 |
| Total distributions | $5,461,940 | $39,168,208 |
| As of 5/31/23 | |
| Cost of investments | $161,321,993 |
| Gross appreciation | 90,014,751 |
| Gross depreciation | (6,921,221) |
| Net unrealized appreciation (depreciation) | $83,093,530 |
| Undistributed ordinary income | 1,767,564 |
| Capital loss carryforwards | (8,717,573) |
| Total distributable earnings (loss) | $76,143,521 |
| Short-Term | $(8,717,573) |
| Year ended 5/31/23 | Year ended 5/31/22 | ||
| Class A | $338,546 | $2,461,208 | |
| Class B | 9,542 | 93,259 | |
| Class C | 17,332 | 175,029 | |
| Class I | 1,217,939 | 10,085,787 | |
| Class R1 | 18,068 | 54,367 | |
| Class R2 | 4,676 | 32,290 | |
| Class R3 | 2,831 | 22,372 | |
| Class R4 | 2,480 | 21,500 | |
| Class R6 | 3,850,526 | 26,222,396 | |
| Total | $5,461,940 | $39,168,208 |
| Up to $1 billion | 0.40% |
| In excess of $1 billion and up to $2.5 billion | 0.375% |
| In excess of $2.5 billion | 0.35% |
| Classes | ||||||||
| A | B | C | I | R1 | R2 | R3 | R4 | R6 |
| 0.74% | 1.49% | 1.49% | 0.49% | 1.49% | 0.99% | 0.74% | 0.49% | 0.45% |
| Distribution Fee Rate (d) | Service Fee Rate (d) | Total Distribution Plan (d) | Annual Effective Rate (e) | Distribution and Service Fee | |
| Class A | — | 0.25% | 0.25% | 0.25% | $ 39,870 |
| Class B | 0.75% | 0.25% | 1.00% | 1.00% | 4,293 |
| Class C | 0.75% | 0.25% | 1.00% | 1.00% | 8,294 |
| Class R1 | 0.75% | 0.25% | 1.00% | 1.00% | 7,865 |
| Class R2 | 0.25% | 0.25% | 0.50% | 0.50% | 1,066 |
| Class R3 | — | 0.25% | 0.25% | 0.25% | 319 |
| Total Distribution and Service Fees | $61,707 |
| (d) | In accordance with the distribution plan for certain classes, the fund pays distribution and/or service fees equal to these annual percentage rates of each class’s average daily net assets. The distribution and service fee rates disclosed by class represent the current rates in effect at the end of the reporting period. Any rate changes, if applicable, are detailed below. |
| (e) | The annual effective rates represent actual fees incurred under the distribution plan for the year ended May 31, 2023 based on each class's average daily net assets. MFD has voluntarily agreed to rebate a portion of each class's 0.25% service fee attributable to accounts for which there is no financial intermediary specified on the account except for accounts attributable to MFS or its affiliates' seed money. For the year ended May 31, 2023, this rebate amounted to $2 for Class A shares and is included in the reduction of total expenses in the Statement of Operations. |
| Amount | |
| Class A | $1,630 |
| Class B | 122 |
| Class C | 60 |
| Year ended 5/31/23 | Year ended 5/31/22 | ||||
| Shares | Amount | Shares | Amount | ||
| Shares sold | |||||
| Class A | 529,892 | $7,946,781 | 558,522 | $11,123,957 | |
| Class B | 4,107 | 62,366 | 2,389 | 51,520 | |
| Class C | 21,513 | 312,361 | 59,481 | 1,153,404 | |
| Class I | 1,411,693 | 20,837,569 | 3,225,480 | 70,888,946 | |
| Class R1 | 26,115 | 386,804 | 14,526 | 237,520 | |
| Class R2 | 2,938 | 43,879 | 1,924 | 35,541 | |
| Class R3 | 1,153 | 16,635 | 48 | 980 | |
| Class R6 | 2,814,295 | 41,250,454 | 2,084,953 | 37,340,839 | |
| 4,811,706 | $70,856,849 | 5,947,323 | $120,832,707 | ||
| Shares issued to shareholders in reinvestment of distributions | |||||
| Class A | 23,021 | $337,951 | 126,281 | $2,461,208 | |
| Class B | 675 | 9,542 | 4,929 | 93,259 | |
| Class C | 1,219 | 17,222 | 9,059 | 171,304 | |
| Class I | 82,345 | 1,217,884 | 514,290 | 10,085,224 | |
| Class R1 | 1,279 | 18,068 | 2,875 | 54,367 | |
| Class R2 | 319 | 4,676 | 1,653 | 32,290 | |
| Class R3 | 192 | 2,831 | 1,142 | 22,372 | |
| Class R4 | 168 | 2,480 | 1,094 | 21,500 | |
| Class R6 | 259,820 | 3,850,526 | 1,335,153 | 26,222,396 | |
| 369,038 | $5,461,180 | 1,996,476 | $39,163,920 | ||
| Shares reacquired | |||||
| Class A | (300,344) | $(4,492,034) | (3,246,554) | $(71,734,979) | |
| Class B | (4,487) | (64,034) | (4,927) | (99,573) | |
| Class C | (11,835) | (168,932) | (55,368) | (945,146) | |
| Class I | (1,487,006) | (22,812,158) | (665,416) | (12,973,803) | |
| Class R1 | (701) | (9,963) | (1,446) | (27,220) | |
| Class R2 | (217) | (3,682) | (53) | (1,051) | |
| Class R3 | (4) | (58) | (2) | (43) | |
| Class R6 | (2,721,736) | (40,418,527) | (2,700,684) | (57,684,609) | |
| (4,526,330) | $(67,969,388) | (6,674,450) | $(143,466,424) | ||
| Year ended 5/31/23 | Year ended 5/31/22 | ||||
| Shares | Amount | Shares | Amount | ||
| Net change | |||||
| Class A | 252,569 | $3,792,698 | (2,561,751) | $(58,149,814) | |
| Class B | 295 | 7,874 | 2,391 | 45,206 | |
| Class C | 10,897 | 160,651 | 13,172 | 379,562 | |
| Class I | 7,032 | (756,705) | 3,074,354 | 68,000,367 | |
| Class R1 | 26,693 | 394,909 | 15,955 | 264,667 | |
| Class R2 | 3,040 | 44,873 | 3,524 | 66,780 | |
| Class R3 | 1,341 | 19,408 | 1,188 | 23,309 | |
| Class R4 | 168 | 2,480 | 1,094 | 21,500 | |
| Class R6 | 352,379 | 4,682,453 | 719,422 | 5,878,626 | |
| 654,414 | $8,348,641 | 1,269,349 | $16,530,203 | ||
| Affiliated Issuers | Beginning Value | Purchases | Sales Proceeds | Realized Gain (Loss) | Change in Unrealized Appreciation or Depreciation | Ending Value |
| MFS Institutional Money Market Portfolio | $1,776,491 | $70,505,546 | $71,982,717 | $(1,157) | $(29) | $298,134 |
| Affiliated Issuers | Dividend Income | Capital Gain Distributions |
| MFS Institutional Money Market Portfolio | $66,635 | $— |
MFS Blended Research Growth Equity Fund:
July 14, 2023
| Name, Age | Position(s) Held with Fund | Trustee/Officer Since(h) | Number of MFS Funds overseen by the Trustee | Principal Occupations During the Past Five Years | Other Directorships During the Past Five Years (j) | |||||
| INTERESTED TRUSTEE | ||||||||||
| Michael W. Roberge (k) (age 56) | Trustee | January 2021 | 136 | Massachusetts Financial Services Company, Chairman (since January 2021); Chief Executive Officer (since January 2017); Director; Chairman of the Board (since January 2022); President (until December 2018); Chief Investment Officer (until December 2018) | N/A | |||||
| INDEPENDENT TRUSTEES | ||||||||||
| John P. Kavanaugh (age 68) | Trustee and Chair of Trustees | January 2009 | 136 | Private investor | N/A | |||||
| Steven E. Buller (age 71) | Trustee | February 2014 | 136 | Private investor | N/A | |||||
| John A. Caroselli (age 69) | Trustee | March 2017 | 136 | Private investor; JC Global Advisors, LLC (management consulting), President (since 2015) | N/A | |||||
| Maureen R. Goldfarb (age 68) | Trustee | January 2009 | 136 | Private investor | N/A | |||||
| Peter D. Jones (age 67) | Trustee | January 2019 | 136 | Private investor | N/A | |||||
| James W. Kilman, Jr. (age 62) | Trustee | January 2019 | 136 | Burford Capital Limited (finance and investment management), Senior Advisor (since May 3, 2021), Chief Financial Officer (2019 - May 2, 2021); KielStrand Capital LLC (family office), Chief Executive Officer (since 2016) | Alpha-En Corporation, Director (2016-2019) |
| Name, Age | Position(s) Held with Fund | Trustee/Officer Since(h) | Number of MFS Funds overseen by the Trustee | Principal Occupations During the Past Five Years | Other Directorships During the Past Five Years (j) | |||||
| Clarence Otis, Jr. (age 67) | Trustee | March 2017 | 136 | Private investor | VF Corporation, Director; Verizon Communications, Inc., Director; The Travelers Companies, Director | |||||
| Maryanne L. Roepke (age 67) | Trustee | May 2014 | 136 | Private investor | N/A | |||||
| Laurie J. Thomsen (age 65) | Trustee | March 2005 | 136 | Private investor | The Travelers Companies, Director; Dycom Industries, Inc., Director |
| Name, Age | Position(s) Held with Fund | Trustee/Officer Since(h) | Number of MFS Funds for which the Person is an Officer | Principal Occupations During the Past Five Years | ||||
| OFFICERS | ||||||||
| Christopher R. Bohane (k) (age 49) | Assistant Secretary and Assistant Clerk | July 2005 | 136 | Massachusetts Financial Services Company, Senior Vice President and Senior Managing Counsel | ||||
| Kino Clark (k) (age 55) | Assistant Treasurer | January 2012 | 136 | Massachusetts Financial Services Company, Vice President | ||||
| John W. Clark, Jr. (k) (age 56) | Assistant Treasurer | April 2017 | 136 | Massachusetts Financial Services Company, Vice President | ||||
| David L. DiLorenzo (k) (age 54) | President | July 2005 | 136 | Massachusetts Financial Services Company, Senior Vice President | ||||
| Heidi W. Hardin (k) (age 55) | Secretary and Clerk | April 2017 | 136 | Massachusetts Financial Services Company, Executive Vice President and General Counsel | ||||
| Brian E. Langenfeld (k) (age 50) | Assistant Secretary and Assistant Clerk | June 2006 | 136 | Massachusetts Financial Services Company, Vice President and Managing Counsel |
| Name, Age | Position(s) Held with Fund | Trustee/Officer Since(h) | Number of MFS Funds for which the Person is an Officer | Principal Occupations During the Past Five Years | ||||
| Rosa E. Licea-Mailloux (k) (age 46) | Chief Compliance Officer | March 2022 | 136 | Massachusetts Financial Services Company, Vice President (since 2018); Director of Corporate Compliance (2018-2021), Senior Director Compliance (2021-2022), Senior Managing Director of North American Compliance & Chief Compliance Officer (since March 2022); Natixis Investment Managers (investment management), Funds Chief Compliance Officer, Deputy General Counsel & Senior Vice President (until 2018) | ||||
| Amanda S. Mooradian (k) (age 44) | Assistant Secretary and Assistant Clerk | September 2018 | 136 | Massachusetts Financial Services Company, Assistant Vice President and Senior Counsel | ||||
| Susan A. Pereira (k) (age 52) | Assistant Secretary and Assistant Clerk | July 2005 | 136 | Massachusetts Financial Services Company, Vice President and Managing Counsel | ||||
| Kasey L. Phillips (k) (age 52) | Assistant Treasurer | September 2012 | 136 | Massachusetts Financial Services Company, Vice President | ||||
| Matthew A. Stowe (k) (age 48) | Assistant Secretary and Assistant Clerk | October 2014 | 136 | Massachusetts Financial Services Company, Vice President and Senior Managing Counsel | ||||
| William B. Wilson (k) (age 40) | Assistant Secretary and Assistant Clerk | October 2022 | 136 | Massachusetts Financial Services Company, Assistant Vice President and Senior Counsel | ||||
| James O. Yost (k) (age 63) | Treasurer | September 1990 | 136 | Massachusetts Financial Services Company, Senior Vice President |
| (h) | Date first appointed to serve as Trustee/Officer of an MFS Fund. Each Trustee has served continuously since appointment unless indicated otherwise. From January 2012 through December 2016, Messrs. DiLorenzo and Yost served as Treasurer and Deputy Treasurer of the Funds, respectively. |
| (j) | Directorships or trusteeships of companies required to report to the Securities and Exchange Commission (i.e., “public companies”). |
| (k) | “Interested person” of the Trust within the meaning of the Investment Company Act of 1940 (referred to as the 1940 Act), which is the principal federal law governing investment companies like the fund, as a result of a position with MFS. The address of MFS is 111 Huntington Avenue, Boston, Massachusetts 02199-7618. |
| Investment Adviser | Custodian |
| Massachusetts Financial Services Company 111 Huntington Avenue Boston, MA 02199-7618 | State Street Bank and Trust Company 1 Congress Street, Suite 1 Boston, MA 02114-2016 |
| Distributor | Independent Registered Public Accounting Firm |
| MFS Fund Distributors, Inc. 111 Huntington Avenue Boston, MA 02199-7618 | Deloitte & Touche LLP 200 Berkeley Street Boston, MA 02116 |
| Portfolio Manager(s) | |
| Jim Fallon Matt Krummell Jonathan Sage Jed Stocks |
| FACTS | WHAT DOES MFS DO WITH YOUR PERSONAL INFORMATION? |
| Why? | Financial companies choose how they share your personal information. Federal law gives consumers the right to limit some but not all sharing. Federal law also requires us to tell you how we collect, share, and protect your personal information. Please read this notice carefully to understand what we do. |
| What? | The types of personal information we collect and share depend on the product or service you have with us. This information can include: |
| • Social Security number and account balances | |
| • Account transactions and transaction history | |
| • Checking account information and wire transfer instructions | |
| When you are no longer our customer, we continue to share your information as described in this notice. |
| How? | All financial companies need to share customers' personal information to run their everyday business. In the section below, we list the reasons financial companies can share their customers' personal information; the reasons MFS chooses to share; and whether you can limit this sharing. |
| Reasons we can share your personal information | Does MFS share? | Can you limit this sharing? |
| For our everyday business purposes – such as to process your transactions, maintain your account(s), respond to court orders and legal investigations, or report to credit bureaus | Yes | No |
| For our marketing purposes – to offer our products and services to you | No | We don't share |
| For joint marketing with other financial companies | No | We don't share |
| For our affiliates' everyday business purposes – information about your transactions and experiences | No | We don't share |
| For our affiliates' everyday business purposes – information about your creditworthiness | No | We don't share |
| For nonaffiliates to market to you | No | We don't share |
| Questions? | Call 800-225-2606 or go to mfs.com. |

| Who we are | |
| Who is providing this notice? | MFS Funds, MFS Investment Management, MFS Institutional Advisors, Inc., and MFS Heritage Trust Company. |
| What we do | |
| How does MFS protect my personal information? | To protect your personal information from unauthorized access and use, we use security measures that comply with federal law. These measures include procedural, electronic, and physical safeguards for the protection of the personal information we collect about you. |
| How does MFS collect my personal information? | We collect your personal information, for example, when you |
| • open an account or provide account information | |
| • direct us to buy securities or direct us to sell your securities | |
| • make a wire transfer | |
| We also collect your personal information from others, such as credit bureaus, affiliates, or other companies. | |
| Why can't I limit all sharing? | Federal law gives you the right to limit only |
| • sharing for affiliates' everyday business purposes – information about your creditworthiness | |
| • affiliates from using your information to market to you | |
| • sharing for nonaffiliates to market to you | |
| State laws and individual companies may give you additional rights to limit sharing. | |
| Definitions | |
| Affiliates | Companies related by common ownership or control. They can be financial and nonfinancial companies. |
| • MFS does not share personal information with affiliates, except for everyday business purposes as described on page one of this notice. | |
| Nonaffiliates | Companies not related by common ownership or control. They can be financial and nonfinancial companies. |
| • MFS does not share with nonaffiliates so they can market to you. | |
| Joint marketing | A formal agreement between nonaffiliated financial companies that together market financial products or services to you. |
| • MFS doesn't jointly market. | |
| Other important information |
| If you own an MFS product or receive an MFS service in the name of a third party such as a bank or broker-dealer, their privacy policy may apply to you instead of ours. |


Small Cap Equity Fund

Small Cap Equity Fund
| 1 | |
| 2 | |
| 5 | |
| 8 | |
| 10 | |
| 17 | |
| 19 | |
| 20 | |
| 21 | |
| 30 | |
| 41 | |
| 43 | |
| 47 | |
| 48 | |
| 48 | |
| 48 | |
| 48 | |
| 48 | |
| 49 |
| back cover |
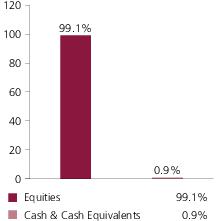
| Builders FirstSource, Inc. | 2.0% |
| Urban Outfitters, Inc. | 1.6% |
| Skechers USA, Inc., “A” | 1.6% |
| Grand Canyon Education, Inc. | 1.6% |
| Silicon Laboratories, Inc. | 1.5% |
| Prestige Consumer Healthcare, Inc. | 1.5% |
| Dycom Industries, Inc. | 1.5% |
| Portland General Electric Co. | 1.5% |
| International Game Technology PLC | 1.5% |
| Vertiv Holdings Co. | 1.5% |
| Health Care | 18.4% |
| Industrials | 18.0% |
| Financials | 14.1% |
| Consumer Discretionary | 12.4% |
| Information Technology | 11.3% |
| Real Estate | 7.4% |
| Energy | 5.6% |
| Materials | 4.9% |
| Consumer Staples | 2.5% |
| Communication Services | 2.4% |
| Utilities | 2.1% |
| (g) | The Global Industry Classification Standard (GICS®) was developed by and/or is the exclusive property of MSCI, Inc. and S&P Global Market Intelligence Inc. (“S&P Global Market Intelligence”). GICS is a service mark of MSCI and S&P Global Market Intelligence and has been licensed for use by MFS. MFS has applied its own internal sector/industry classification methodology for equity securities and non-equity securities that are unclassified by GICS. |
| (b) | Security is not a benchmark constituent. |
| (h) | Security was not held in the portfolio at period end. |
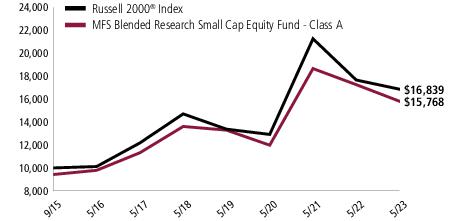
| Share Class | Class Inception Date | 1-yr | 5-yr | Life (t) |
| A | 9/15/15 | (8.65)% | 2.98% | 6.90% |
| B | 9/15/15 | (9.34)% | 2.22% | 6.09% |
| C | 9/15/15 | (9.35)% | 2.20% | 6.09% |
| I | 9/15/15 | (8.38)% | 3.23% | 7.16% |
| R1 | 9/15/15 | (9.35)% | 2.21% | 6.09% |
| R2 | 9/15/15 | (8.91)% | 2.72% | 6.62% |
| R3 | 9/15/15 | (8.70)% | 2.97% | 6.88% |
| R4 | 9/15/15 | (8.44)% | 3.23% | 7.15% |
| R6 | 9/15/15 | (8.36)% | 3.33% | 7.24% |
| Russell 2000® Index (f) | (4.68)% | 2.74% | 6.99% |
| A With Initial Sales Charge (5.75%) | (13.90)% | 1.77% | 6.08% |
| B With CDSC (Declining over six years from 4% to 0%) (v) | (12.81)% | 1.89% | 6.09% |
| C With CDSC (1% for 12 months) (v) | (10.22)% | 2.20% | 6.09% |
| (f) | Source: FactSet Research Systems Inc. |
| (t) | For the period from the class inception date through the stated period end. (See Notes to Performance Summary.) |
| (v) | Assuming redemption at the end of the applicable period. |
| (h) | Frank Russell Company (“Russell”) is the source and owner of the trademarks, service marks, and copyrights related to the Russell Indexes. Russell® is a trademark of Frank Russell Company. Neither Russell nor its licensors accept any liability for any errors or omissions in the Russell Indexes and/or Russell ratings or underlying data and no party may rely on any Russell Indexes and/or Russell ratings and/or underlying data contained in this document. No further distribution of Russell Data is permitted without Russell's express written consent. Russell does not promote, sponsor, or endorse the content of this document. |
December 1, 2022 through May 31, 2023
| Share Class | Annualized Expense Ratio | Beginning Account Value 12/01/22 | Ending Account Value 5/31/23 | Expenses Paid During Period (p) 12/01/22-5/31/23 | |
| A | Actual | 0.99% | $1,000.00 | $921.88 | $4.74 |
| Hypothetical (h) | 0.99% | $1,000.00 | $1,020.00 | $4.99 | |
| B | Actual | 1.74% | $1,000.00 | $918.62 | $8.32 |
| Hypothetical (h) | 1.74% | $1,000.00 | $1,016.26 | $8.75 | |
| C | Actual | 1.74% | $1,000.00 | $917.79 | $8.32 |
| Hypothetical (h) | 1.74% | $1,000.00 | $1,016.26 | $8.75 | |
| I | Actual | 0.74% | $1,000.00 | $923.23 | $3.55 |
| Hypothetical (h) | 0.74% | $1,000.00 | $1,021.24 | $3.73 | |
| R1 | Actual | 1.74% | $1,000.00 | $917.85 | $8.32 |
| Hypothetical (h) | 1.74% | $1,000.00 | $1,016.26 | $8.75 | |
| R2 | Actual | 1.24% | $1,000.00 | $919.98 | $5.94 |
| Hypothetical (h) | 1.24% | $1,000.00 | $1,018.75 | $6.24 | |
| R3 | Actual | 0.99% | $1,000.00 | $921.35 | $4.74 |
| Hypothetical (h) | 0.99% | $1,000.00 | $1,020.00 | $4.99 | |
| R4 | Actual | 0.74% | $1,000.00 | $922.64 | $3.55 |
| Hypothetical (h) | 0.74% | $1,000.00 | $1,021.24 | $3.73 | |
| R6 | Actual | 0.63% | $1,000.00 | $923.45 | $3.02 |
| Hypothetical (h) | 0.63% | $1,000.00 | $1,021.79 | $3.18 |
| (h) | 5% class return per year before expenses. |
| (p) | “Expenses Paid During Period” are equal to each class’s annualized expense ratio, as shown above, multiplied by the average account value over the period, multiplied by 182/365 (to reflect the one-half year period). Expenses paid do not include any applicable sales charges (loads). If these transaction costs had been included, your costs would have been higher. |
| Issuer | Shares/Par | Value ($) | ||
| Common Stocks – 99.1% | ||||
| Aerospace & Defense – 0.9% | ||||
| CACI International, Inc., “A” (a) | 9,245 | $2,766,289 | ||
| Apparel Manufacturers – 1.6% | ||||
| Skechers USA, Inc., “A” (a) | 92,785 | $4,766,365 | ||
| Automotive – 1.9% | ||||
| REV Group, Inc. | 153,976 | $1,561,317 | ||
| Titan International, Inc. (a) | 116,297 | 1,150,177 | ||
| Visteon Corp. (a) | 21,973 | 2,935,153 | ||
| $5,646,647 | ||||
| Biotechnology – 3.8% | ||||
| Adaptive Biotechnologies Corp. (a) | 193,581 | $1,347,324 | ||
| Alector, Inc. (a) | 18,325 | 136,338 | ||
| AlloVir, Inc. (a) | 146,093 | 550,771 | ||
| Arcus Biosciences, Inc. (a) | 48,525 | 996,703 | ||
| BioAtla, Inc. (a) | 183,804 | 578,983 | ||
| Deciphera Pharmaceuticals, Inc. (a) | 10,628 | 143,478 | ||
| Dynavax Technologies Corp. (a) | 87,462 | 999,691 | ||
| Exelixis, Inc. (a) | 43,051 | 830,023 | ||
| Fate Therapeutics, Inc. (a) | 27,627 | 139,516 | ||
| iTeos Therapeutics, Inc. (a) | 65,319 | 1,063,393 | ||
| Lyell Immunopharma, Inc. (a)(l) | 258,446 | 824,443 | ||
| Sana Biotechnology, Inc. (a)(l) | 206,136 | 1,240,939 | ||
| Sangamo Therapeutics, Inc. (a) | 165,525 | 185,388 | ||
| Varex Imaging Corp. (a) | 26,196 | 577,360 | ||
| Vir Biotechnology, Inc. (a) | 52,642 | 1,403,962 | ||
| $11,018,312 | ||||
| Broadcasting – 0.4% | ||||
| Entravision Communications Corp., “A” | 300,380 | $1,240,569 | ||
| Brokerage & Asset Managers – 0.5% | ||||
| A-Mark Precious Metals, Inc. | 30,359 | $1,028,260 | ||
| GCM Grosvenor, Inc., “A” | 42,988 | 296,617 | ||
| $1,324,877 | ||||
| Business Services – 4.1% | ||||
| BlueLinx Holdings, Inc. (a) | 23,767 | $1,954,123 | ||
| Boise Cascade Corp. | 9,642 | 692,488 | ||
| HireRight Holdings Corp. (a) | 77,426 | 792,068 | ||
| TaskUs, Inc., “A” (a) | 169,621 | 1,840,388 | ||
| Issuer | Shares/Par | Value ($) | ||
| Common Stocks – continued | ||||
| Business Services – continued | ||||
| TriNet Group, Inc. (a) | 32,800 | $2,914,936 | ||
| World Fuel Services Corp. | 71,203 | 1,628,413 | ||
| Yext, Inc. (a) | 249,540 | 2,293,272 | ||
| $12,115,688 | ||||
| Cable TV – 0.3% | ||||
| Cable One, Inc. | 1,223 | $748,268 | ||
| Chemicals – 1.7% | ||||
| Avient Corp. | 37,011 | $1,350,901 | ||
| Element Solutions, Inc. | 206,118 | 3,695,696 | ||
| $5,046,597 | ||||
| Computer Software – 2.6% | ||||
| 2U, Inc. (a) | 24,827 | $99,308 | ||
| Elastic N.V. (a) | 53,161 | 3,871,184 | ||
| Paycor HCM, Inc. (a) | 38,716 | 851,365 | ||
| Paylocity Holding Corp. (a) | 16,289 | 2,813,925 | ||
| $7,635,782 | ||||
| Computer Software - Systems – 3.9% | ||||
| Box, Inc., “A” (a) | 151,031 | $4,254,543 | ||
| Rapid7, Inc. (a) | 70,000 | 3,340,400 | ||
| Rimini Street, Inc. (a) | 251,229 | 1,155,654 | ||
| Squarespace, Inc., “A” (a) | 58,178 | 1,709,852 | ||
| Verint Systems, Inc. (a) | 23,072 | 827,823 | ||
| $11,288,272 | ||||
| Construction – 1.6% | ||||
| AZEK Co., Inc. (a) | 67,036 | $1,558,587 | ||
| GMS, Inc. (a) | 47,972 | 3,038,067 | ||
| Taylor Morrison Home Corp. (a) | 4,367 | 185,292 | ||
| $4,781,946 | ||||
| Consumer Products – 1.7% | ||||
| Herbalife Ltd. (a) | 50,184 | $594,179 | ||
| Prestige Consumer Healthcare, Inc. (a) | 76,050 | 4,352,341 | ||
| $4,946,520 | ||||
| Consumer Services – 1.6% | ||||
| Grand Canyon Education, Inc. (a) | 43,307 | $4,536,841 | ||
| Electrical Equipment – 1.5% | ||||
| Vertiv Holdings Co. | 220,589 | $4,257,368 | ||
| Issuer | Shares/Par | Value ($) | ||
| Common Stocks – continued | ||||
| Electronics – 5.3% | ||||
| Advanced Energy Industries, Inc. | 40,966 | $4,020,813 | ||
| Alpha and Omega Semiconductor Ltd. (a) | 47,485 | 1,314,860 | ||
| Photronics, Inc. (a) | 73,342 | 1,557,051 | ||
| Plexus Corp. (a) | 39,178 | 3,552,661 | ||
| Sanmina Corp. (a) | 11,078 | 587,577 | ||
| Silicon Laboratories, Inc. (a) | 31,493 | 4,430,120 | ||
| $15,463,082 | ||||
| Energy - Independent – 2.2% | ||||
| CONSOL Energy, Inc. | 31,367 | $1,692,563 | ||
| CVR Energy, Inc. | 55,137 | 1,290,757 | ||
| Magnolia Oil & Gas Corp., “A” | 92,535 | 1,788,702 | ||
| Par Pacific Holdings, Inc. (a) | 74,651 | 1,591,559 | ||
| $6,363,581 | ||||
| Energy - Integrated – 0.2% | ||||
| National Gas Fuel Co. | 13,369 | $680,616 | ||
| Engineering - Construction – 2.3% | ||||
| APi Group, Inc. (a) | 108,504 | $2,452,190 | ||
| Dycom Industries, Inc. (a) | 42,686 | 4,329,641 | ||
| $6,781,831 | ||||
| Food & Beverages – 2.3% | ||||
| Cal-Maine Foods, Inc. | 48,574 | $2,309,693 | ||
| Duckhorn Portfolio, Inc. (a) | 41,393 | 539,351 | ||
| Hostess Brands, Inc. (a) | 151,977 | 3,781,188 | ||
| $6,630,232 | ||||
| Gaming & Lodging – 2.4% | ||||
| International Game Technology PLC | 173,963 | $4,267,312 | ||
| Norwegian Cruise Line Holdings Ltd. (a) | 42,841 | 636,189 | ||
| Penn Entertainment, Inc. (a) | 17,537 | 439,127 | ||
| Target Hospitality Corp. (a)(l) | 115,316 | 1,629,415 | ||
| $6,972,043 | ||||
| Insurance – 3.2% | ||||
| Hanover Insurance Group, Inc. | 21,527 | $2,399,400 | ||
| Jackson Financial, Inc. | 52,459 | 1,453,114 | ||
| Reinsurance Group of America, Inc. | 13,462 | 1,884,680 | ||
| Voya Financial, Inc. | 53,560 | 3,631,368 | ||
| $9,368,562 | ||||
| Issuer | Shares/Par | Value ($) | ||
| Common Stocks – continued | ||||
| Internet – 1.3% | ||||
| Yelp, Inc. (a) | 60,851 | $2,038,509 | ||
| ZipRecruiter, Inc., “A” (a) | 111,749 | 1,728,757 | ||
| $3,767,266 | ||||
| Leisure & Toys – 3.0% | ||||
| Brunswick Corp. | 40,259 | $3,039,554 | ||
| Funko, Inc., “A” (a) | 165,984 | 2,025,005 | ||
| Malibu Boats, Inc., “A” (a) | 29,731 | 1,559,391 | ||
| MasterCraft Boat Holdings, Inc. (a) | 15,222 | 403,383 | ||
| Polaris, Inc. | 16,710 | 1,799,834 | ||
| $8,827,167 | ||||
| Machinery & Tools – 3.6% | ||||
| Flowserve Corp. | 38,311 | $1,247,023 | ||
| ITT, Inc. | 4,083 | 310,961 | ||
| Olympic Steel, Inc. | 33,612 | 1,405,654 | ||
| Regal Rexnord Corp. | 27,743 | 3,603,538 | ||
| Timken Co. | 52,021 | 3,722,103 | ||
| Titan Machinery, Inc. (a) | 11,495 | 290,249 | ||
| $10,579,528 | ||||
| Major Banks – 0.6% | ||||
| Comerica, Inc. | 51,091 | $1,844,385 | ||
| Medical & Health Technology & Services – 3.3% | ||||
| Cross Country Healthcare, Inc. (a) | 33,397 | $851,624 | ||
| Encompass Health Corp. | 56,518 | 3,505,246 | ||
| Health Catalyst, Inc. (a) | 39,391 | 443,543 | ||
| HealthEquity, Inc. (a) | 63,787 | 3,495,528 | ||
| Medpace Holdings, Inc. (a) | 5,917 | 1,224,641 | ||
| ModivCare, Inc. (a) | 1,530 | 68,743 | ||
| $9,589,325 | ||||
| Medical Equipment – 5.3% | ||||
| AngioDynamics, Inc. (a) | 48,602 | $459,775 | ||
| Avanos Medical, Inc. (a) | 54,935 | 1,345,908 | ||
| Bioventus, Inc., “A” (a) | 114,556 | 309,874 | ||
| Envista Holdings Corp. (a) | 109,362 | 3,487,554 | ||
| Inogen, Inc. (a) | 34,723 | 365,633 | ||
| Maravai Lifesciences Holdings, Inc., “A” (a) | 212,817 | 2,732,570 | ||
| Organogenesis Holdings, Inc. (a) | 225,013 | 816,797 | ||
| Orthofix Medical, Inc. (a) | 80,903 | 1,512,077 | ||
| Quidel Corp. (a) | 47,742 | 4,064,754 | ||
| Issuer | Shares/Par | Value ($) | ||
| Common Stocks – continued | ||||
| Medical Equipment – continued | ||||
| Sotera Health Co. (a) | 20,052 | $282,533 | ||
| $15,377,475 | ||||
| Metals & Mining – 1.6% | ||||
| Ryerson Holding Corp. | 62,841 | $2,135,965 | ||
| United States Steel Corp. | 118,304 | 2,474,920 | ||
| $4,610,885 | ||||
| Natural Gas - Pipeline – 0.5% | ||||
| Equitrans Midstream Corp. | 163,062 | $1,390,919 | ||
| Oil Services – 1.6% | ||||
| Cactus, Inc., “A” | 41,759 | $1,318,749 | ||
| ChampionX Corp. | 134,827 | 3,405,730 | ||
| $4,724,479 | ||||
| Other Banks & Diversified Financials – 9.8% | ||||
| Assured Guaranty Ltd. | 13,927 | $720,722 | ||
| Atlanticus Holdings Corp. (a) | 6,180 | 216,053 | ||
| Cathay General Bancorp, Inc. | 132,628 | 3,878,043 | ||
| Columbia Banking System, Inc. | 173,949 | 3,484,198 | ||
| East West Bancorp, Inc. | 34,368 | 1,644,509 | ||
| Enova International, Inc. (a) | 6,996 | 325,454 | ||
| First Hawaiian, Inc. | 78,001 | 1,286,236 | ||
| Heritage Commerce Corp. | 40,188 | 292,569 | ||
| Navient Corp. | 101,786 | 1,542,058 | ||
| OFG Bancorp | 62,985 | 1,528,016 | ||
| Preferred Bank | 19,861 | 915,989 | ||
| SLM Corp. | 270,996 | 4,135,399 | ||
| Texas Capital Bancshares, Inc. (a) | 68,419 | 3,236,219 | ||
| UMB Financial Corp. | 5,476 | 310,161 | ||
| United Community Bank, Inc. | 20,315 | 459,322 | ||
| Wintrust Financial Corp. | 46,390 | 2,949,012 | ||
| Zions Bancorporation NA | 62,811 | 1,714,112 | ||
| $28,638,072 | ||||
| Pharmaceuticals – 4.6% | ||||
| Alkermes PLC (a) | 18,801 | $543,913 | ||
| Arcturus Therapeutics Holdings Inc. (a) | 24,076 | 658,238 | ||
| Catalyst Pharmaceuticals, Inc. (a) | 66,422 | 767,174 | ||
| Coherus BioSciences, Inc. (a) | 84,713 | 346,476 | ||
| Eagle Pharmaceuticals, Inc. (a) | 26,178 | 543,194 | ||
| Emergent BioSolutions, Inc. (a) | 21,614 | 184,367 | ||
| FibroGen, Inc. (a) | 18,734 | 323,162 | ||
| Issuer | Shares/Par | Value ($) | ||
| Common Stocks – continued | ||||
| Pharmaceuticals – continued | ||||
| Intercept Pharmaceuticals, Inc. (a) | 58,489 | $616,474 | ||
| Ionis Pharmaceuticals, Inc. (a) | 21,329 | 872,356 | ||
| Ironwood Pharmaceuticals, Inc. (a) | 72,247 | 786,047 | ||
| Kiniksa Pharmaceuticals, “A” (a) | 65,151 | 902,993 | ||
| Kymera Therapeutics, Inc. (a) | 32,811 | 965,956 | ||
| Macrogenics, Inc. (a) | 117,453 | 548,506 | ||
| Neurocrine Biosciences, Inc. (a) | 7,405 | 662,970 | ||
| Nurix Therapeutics, Inc. (a) | 16,728 | 169,287 | ||
| Organon & Co. | 75,685 | 1,467,532 | ||
| Phibro Animal Health Corp., “A” | 41,130 | 547,029 | ||
| REGENXBIO, Inc. (a) | 18,710 | 322,373 | ||
| United Therapeutics Corp. (a) | 6,484 | 1,359,954 | ||
| Vanda Pharmaceuticals, Inc. (a) | 117,675 | 700,166 | ||
| $13,288,167 | ||||
| Railroad & Shipping – 0.7% | ||||
| Teekay Tankers LTD., “A” | 57,716 | $2,085,279 | ||
| Real Estate – 7.4% | ||||
| Broadstone Net Lease, Inc., REIT | 135,486 | $2,124,421 | ||
| DiamondRock Hospitality Co., REIT | 16,888 | 132,571 | ||
| Empire State Realty Trust, REIT, “A” | 538,537 | 3,322,773 | ||
| National Storage Affiliates Trust, REIT | 71,977 | 2,635,078 | ||
| Phillips Edison & Co., REIT | 135,636 | 3,934,800 | ||
| Piedmont Office Realty Trust, Inc., REIT | 231,400 | 1,441,622 | ||
| Spirit Realty Capital, Inc., REIT | 94,672 | 3,697,888 | ||
| STAG Industrial, Inc., REIT | 75,597 | 2,630,776 | ||
| Tanger Factory Outlet Centers, Inc., REIT | 88,289 | 1,798,447 | ||
| $21,718,376 | ||||
| Restaurants – 1.1% | ||||
| Texas Roadhouse, Inc. | 26,445 | $2,853,415 | ||
| Wendy's Co. | 13,284 | 292,381 | ||
| $3,145,796 | ||||
| Specialty Chemicals – 1.1% | ||||
| Chemours Co. | 116,396 | $3,083,330 | ||
| Specialty Stores – 3.6% | ||||
| Builders FirstSource, Inc. (a) | 49,855 | $5,780,687 | ||
| Urban Outfitters, Inc. (a) | 155,429 | 4,790,322 | ||
| $10,571,009 | ||||
| Telephone Services – 0.5% | ||||
| EchoStar Corp., “A” (a) | 84,978 | $1,340,103 | ||
| Issuer | Shares/Par | Value ($) | ||
| Common Stocks – continued | ||||
| Tobacco – 0.0% | ||||
| Vector Group Ltd. | 13,353 | $156,364 | ||
| Trucking – 1.6% | ||||
| Landstar System, Inc. | 8,779 | $1,539,661 | ||
| Saia, Inc. (a) | 11,138 | 3,164,974 | ||
| $4,704,635 | ||||
| Utilities - Electric Power – 1.9% | ||||
| IDACORP, Inc. | 10,453 | $1,087,844 | ||
| Portland General Electric Co. | 88,780 | 4,326,249 | ||
| $5,414,093 | ||||
| Total Common Stocks (Identified Cost, $282,971,129) | $289,236,941 | |||
| Investment Companies (h) – 0.7% | ||||
| Money Market Funds – 0.7% | ||||
| MFS Institutional Money Market Portfolio, 4.88% (v) (Identified Cost, $2,041,391) | 2,041,392 | $2,041,188 | ||
| Collateral for Securities Loaned – 0.4% | ||||
| State Street Navigator Securities Lending Government Money Market Portfolio, 5.11% (j) (Identified Cost, $1,199,113) | 1,199,113 | $1,199,113 | ||
| Other Assets, Less Liabilities – (0.2)% | (686,740) | |||
| Net Assets – 100.0% | $291,790,502 | |||
| (a) | Non-income producing security. | |||
| (h) | An affiliated issuer, which may be considered one in which the fund owns 5% or more of the outstanding voting securities, or a company which is under common control. At period end, the aggregate values of the fund's investments in affiliated issuers and in unaffiliated issuers were $2,041,188 and $290,436,054, respectively. | |||
| (j) | The rate quoted is the annualized seven-day yield of the fund at period end. | |||
| (l) | A portion of this security is on loan. See Note 2 for additional information. | |||
| (v) | Affiliated issuer that is available only to investment companies managed by MFS. The rate quoted for the MFS Institutional Money Market Portfolio is the annualized seven-day yield of the fund at period end. |
| The following abbreviations are used in this report and are defined: | |
| REIT | Real Estate Investment Trust |
| Assets | |
| Investments in unaffiliated issuers, at value, including $1,658,206 of securities on loan (identified cost, $284,170,242) | $290,436,054 |
| Investments in affiliated issuers, at value (identified cost, $2,041,391) | 2,041,188 |
| Receivables for | |
| Fund shares sold | 278,056 |
| Interest and dividends | 526,932 |
| Receivable from investment adviser | 22,419 |
| Other assets | 1,411 |
| Total assets | $293,306,060 |
| Liabilities | |
| Payables for | |
| Fund shares reacquired | $175,348 |
| Collateral for securities loaned, at value (c) | 1,199,113 |
| Payable to affiliates | |
| Administrative services fee | 289 |
| Shareholder servicing costs | 59,413 |
| Distribution and service fees | 1,322 |
| Payable for independent Trustees' compensation | 66 |
| Accrued expenses and other liabilities | 80,007 |
| Total liabilities | $1,515,558 |
| Net assets | $291,790,502 |
| Net assets consist of | |
| Paid-in capital | $294,769,672 |
| Total distributable earnings (loss) | (2,979,170) |
| Net assets | $291,790,502 |
| Shares of beneficial interest outstanding | 23,071,964 |
| (c) | Non-cash collateral is not included. |
| Net assets | Shares outstanding | Net asset value per share (a) | |
| Class A | $33,667,198 | 2,681,322 | $12.56 |
| Class B | 451,203 | 37,582 | 12.01 |
| Class C | 5,318,627 | 443,466 | 11.99 |
| Class I | 102,893,234 | 8,117,483 | 12.68 |
| Class R1 | 3,410,150 | 284,091 | 12.00 |
| Class R2 | 13,528,853 | 1,085,737 | 12.46 |
| Class R3 | 661,161 | 52,548 | 12.58 |
| Class R4 | 18,321,513 | 1,443,399 | 12.69 |
| Class R6 | 113,538,563 | 8,926,336 | 12.72 |
| (a) | Maximum offering price per share was equal to the net asset value per share for all share classes, except for Class A, for which the maximum offering price per share was $13.33 [100 / 94.25 x $12.56]. On sales of $50,000 or more, the maximum offering price of Class A shares is reduced. A contingent deferred sales charge may be imposed on redemptions of Class A, Class B, and Class C shares. Redemption price per share was equal to the net asset value per share for Classes I, R1, R2, R3, R4, and R6. |
| Net investment income (loss) | |
| Income | |
| Dividends | $4,744,228 |
| Dividends from affiliated issuers | 104,175 |
| Other | 45,060 |
| Income on securities loaned | 10,032 |
| Foreign taxes withheld | (7,617) |
| Total investment income | $4,895,878 |
| Expenses | |
| Management fee | $2,033,100 |
| Distribution and service fees | 265,842 |
| Shareholder servicing costs | 259,715 |
| Administrative services fee | 58,033 |
| Independent Trustees' compensation | 7,206 |
| Custodian fee | 18,654 |
| Shareholder communications | 27,373 |
| Audit and tax fees | 62,771 |
| Legal fees | 1,493 |
| Miscellaneous | 165,323 |
| Total expenses | $2,899,510 |
| Reduction of expenses by investment adviser and distributor | (450,391) |
| Net expenses | $2,449,119 |
| Net investment income (loss) | $2,446,759 |
| Realized and unrealized gain (loss) | |
| Realized gain (loss) (identified cost basis) | |
| Unaffiliated issuers | $(7,897,680) |
| Affiliated issuers | 363 |
| Net realized gain (loss) | $(7,897,317) |
| Change in unrealized appreciation or depreciation | |
| Unaffiliated issuers | $(20,902,806) |
| Affiliated issuers | (203) |
| Net unrealized gain (loss) | $(20,903,009) |
| Net realized and unrealized gain (loss) | $(28,800,326) |
| Change in net assets from operations | $(26,353,567) |
| Year ended | ||
| 5/31/23 | 5/31/22 | |
| Change in net assets | ||
| From operations | ||
| Net investment income (loss) | $2,446,759 | $1,513,260 |
| Net realized gain (loss) | (7,897,317) | 41,868,598 |
| Net unrealized gain (loss) | (20,903,009) | (69,290,970) |
| Change in net assets from operations | $(26,353,567) | $(25,909,112) |
| Total distributions to shareholders | $(12,571,489) | $(42,864,222) |
| Change in net assets from fund share transactions | $(7,144,953) | $48,713,888 |
| Total change in net assets | $(46,070,009) | $(20,059,446) |
| Net assets | ||
| At beginning of period | 337,860,511 | 357,919,957 |
| At end of period | $291,790,502 | $337,860,511 |
| Class A | Year ended | ||||
| 5/31/23 | 5/31/22 | 5/31/21 | 5/31/20 | 5/31/19 | |
| Net asset value, beginning of period | $14.31 | $17.57 | $11.33 | $12.77 | $13.83 |
| Income (loss) from investment operations | |||||
| Net investment income (loss) (d) | $0.08 | $0.03 | $0.04 | $0.06 | $0.06 |
| Net realized and unrealized gain (loss) | (1.29) | (1.18) | 6.26 | (1.28) | (0.44) |
| Total from investment operations | $(1.21) | $(1.15) | $6.30 | $(1.22) | $(0.38) |
| Less distributions declared to shareholders | |||||
| From net investment income | $— | $— | $(0.06) | $(0.05) | $(0.04) |
| From net realized gain | (0.54) | (2.11) | — | (0.17) | (0.64) |
| Total distributions declared to shareholders | $(0.54) | $(2.11) | $(0.06) | $(0.22) | $(0.68) |
| Net asset value, end of period (x) | $12.56 | $14.31 | $17.57 | $11.33 | $12.77 |
| Total return (%) (r)(s)(t)(x) | (8.65) | (7.52) | 55.75 | (9.87) | (2.28) |
| Ratios (%) (to average net assets) and Supplemental data: | |||||
| Expenses before expense reductions | 1.13 | 1.13 | 1.12 | 1.16 | 1.22 |
| Expenses after expense reductions | 0.99 | 0.99 | 0.99 | 0.99 | 0.99 |
| Net investment income (loss) | 0.57 | 0.16 | 0.26 | 0.48 | 0.41 |
| Portfolio turnover | 56 | 72 | 80 | 75 | 64 |
| Net assets at end of period (000 omitted) | $33,667 | $40,921 | $73,141 | $57,133 | $60,929 |
| Class B | Year ended | ||||
| 5/31/23 | 5/31/22 | 5/31/21 | 5/31/20 | 5/31/19 | |
| Net asset value, beginning of period | $13.81 | $17.15 | $11.10 | $12.56 | $13.67 |
| Income (loss) from investment operations | |||||
| Net investment income (loss) (d) | $(0.02) | $(0.08) | $(0.07) | $(0.03) | $(0.05) |
| Net realized and unrealized gain (loss) | (1.24) | (1.15) | 6.12 | (1.26) | (0.42) |
| Total from investment operations | $(1.26) | $(1.23) | $6.05 | $(1.29) | $(0.47) |
| Less distributions declared to shareholders | |||||
| From net investment income | $— | $— | $— | $— | $— |
| From net realized gain | (0.54) | (2.11) | — | (0.17) | (0.64) |
| Total distributions declared to shareholders | $(0.54) | $(2.11) | $— | $(0.17) | $(0.64) |
| Net asset value, end of period (x) | $12.01 | $13.81 | $17.15 | $11.10 | $12.56 |
| Total return (%) (r)(s)(t)(x) | (9.34) | (8.21) | 54.50 | (10.53) | (3.00) |
| Ratios (%) (to average net assets) and Supplemental data: | |||||
| Expenses before expense reductions | 1.89 | 1.88 | 1.86 | 1.91 | 1.97 |
| Expenses after expense reductions | 1.74 | 1.74 | 1.74 | 1.74 | 1.74 |
| Net investment income (loss) | (0.19) | (0.50) | (0.52) | (0.27) | (0.36) |
| Portfolio turnover | 56 | 72 | 80 | 75 | 64 |
| Net assets at end of period (000 omitted) | $451 | $664 | $615 | $387 | $500 |
| Class C | Year ended | ||||
| 5/31/23 | 5/31/22 | 5/31/21 | 5/31/20 | 5/31/19 | |
| Net asset value, beginning of period | $13.79 | $17.14 | $11.09 | $12.55 | $13.66 |
| Income (loss) from investment operations | |||||
| Net investment income (loss) (d) | $(0.02) | $(0.09) | $(0.07) | $(0.03) | $(0.03) |
| Net realized and unrealized gain (loss) | (1.24) | (1.15) | 6.12 | (1.26) | (0.44) |
| Total from investment operations | $(1.26) | $(1.24) | $6.05 | $(1.29) | $(0.47) |
| Less distributions declared to shareholders | |||||
| From net investment income | $— | $— | $— | $(0.00)(w) | $(0.00)(w) |
| From net realized gain | (0.54) | (2.11) | — | (0.17) | (0.64) |
| Total distributions declared to shareholders | $(0.54) | $(2.11) | $— | $(0.17) | $(0.64) |
| Net asset value, end of period (x) | $11.99 | $13.79 | $17.14 | $11.09 | $12.55 |
| Total return (%) (r)(s)(t)(x) | (9.35) | (8.27) | 54.55 | (10.53) | (2.97) |
| Ratios (%) (to average net assets) and Supplemental data: | |||||
| Expenses before expense reductions | 1.89 | 1.88 | 1.87 | 1.91 | 1.97 |
| Expenses after expense reductions | 1.74 | 1.74 | 1.74 | 1.74 | 1.74 |
| Net investment income (loss) | (0.18) | (0.53) | (0.50) | (0.26) | (0.21) |
| Portfolio turnover | 56 | 72 | 80 | 75 | 64 |
| Net assets at end of period (000 omitted) | $5,319 | $6,593 | $7,503 | $5,133 | $3,234 |
| Class I | Year ended | ||||
| 5/31/23 | 5/31/22 | 5/31/21 | 5/31/20 | 5/31/19 | |
| Net asset value, beginning of period | $14.40 | $17.67 | $11.39 | $12.83 | $13.90 |
| Income (loss) from investment operations | |||||
| Net investment income (loss) (d) | $0.11 | $0.09 | $0.07 | $0.09 | $0.09 |
| Net realized and unrealized gain (loss) | (1.29) | (1.22) | 6.31 | (1.27) | (0.45) |
| Total from investment operations | $(1.18) | $(1.13) | $6.38 | $(1.18) | $(0.36) |
| Less distributions declared to shareholders | |||||
| From net investment income | $— | $(0.03) | $(0.10) | $(0.09) | $(0.07) |
| From net realized gain | (0.54) | (2.11) | — | (0.17) | (0.64) |
| Total distributions declared to shareholders | $(0.54) | $(2.14) | $(0.10) | $(0.26) | $(0.71) |
| Net asset value, end of period (x) | $12.68 | $14.40 | $17.67 | $11.39 | $12.83 |
| Total return (%) (r)(s)(t)(x) | (8.38) | (7.39) | 56.17 | (9.58) | (2.06) |
| Ratios (%) (to average net assets) and Supplemental data: | |||||
| Expenses before expense reductions | 0.88 | 0.88 | 0.87 | 0.91 | 0.97 |
| Expenses after expense reductions | 0.74 | 0.74 | 0.74 | 0.74 | 0.74 |
| Net investment income (loss) | 0.82 | 0.52 | 0.46 | 0.74 | 0.69 |
| Portfolio turnover | 56 | 72 | 80 | 75 | 64 |
| Net assets at end of period (000 omitted) | $102,893 | $115,533 | $80,950 | $53,562 | $39,397 |
| Class R1 | Year ended | ||||
| 5/31/23 | 5/31/22 | 5/31/21 | 5/31/20 | 5/31/19 | |
| Net asset value, beginning of period | $13.80 | $17.15 | $11.09 | $12.56 | $13.67 |
| Income (loss) from investment operations | |||||
| Net investment income (loss) (d) | $(0.02) | $(0.08) | $(0.07) | $(0.03) | $0.07 |
| Net realized and unrealized gain (loss) | (1.24) | (1.16) | 6.13 | (1.27) | (0.54)(g) |
| Total from investment operations | $(1.26) | $(1.24) | $6.06 | $(1.30) | $(0.47) |
| Less distributions declared to shareholders | |||||
| From net investment income | $— | $— | $— | $(0.00)(w) | $— |
| From net realized gain | (0.54) | (2.11) | — | (0.17) | (0.64) |
| Total distributions declared to shareholders | $(0.54) | $(2.11) | $— | $(0.17) | $(0.64) |
| Net asset value, end of period (x) | $12.00 | $13.80 | $17.15 | $11.09 | $12.56 |
| Total return (%) (r)(s)(t)(x) | (9.35) | (8.26) | 54.64 | (10.59) | (3.00) |
| Ratios (%) (to average net assets) and Supplemental data: | |||||
| Expenses before expense reductions | 1.88 | 1.88 | 1.86 | 1.91 | 1.97 |
| Expenses after expense reductions | 1.74 | 1.74 | 1.74 | 1.74 | 1.74 |
| Net investment income (loss) | (0.17) | (0.50) | (0.52) | (0.27) | 0.54 |
| Portfolio turnover | 56 | 72 | 80 | 75 | 64 |
| Net assets at end of period (000 omitted) | $3,410 | $3,853 | $4,996 | $2,897 | $3,339 |
| Class R2 | Year ended | ||||
| 5/31/23 | 5/31/22 | 5/31/21 | 5/31/20 | 5/31/19 | |
| Net asset value, beginning of period | $14.24 | $17.54 | $11.32 | $12.78 | $13.84 |
| Income (loss) from investment operations | |||||
| Net investment income (loss) (d) | $0.04 | $(0.00)(w) | $(0.00)(w) | $0.03 | $0.16 |
| Net realized and unrealized gain (loss) | (1.28) | (1.19) | 6.26 | (1.27) | (0.58)(g) |
| Total from investment operations | $(1.24) | $(1.19) | $6.26 | $(1.24) | $(0.42) |
| Less distributions declared to shareholders | |||||
| From net investment income | $— | $— | $(0.04) | $(0.05) | $(0.00)(w) |
| From net realized gain | (0.54) | (2.11) | — | (0.17) | (0.64) |
| Total distributions declared to shareholders | $(0.54) | $(2.11) | $(0.04) | $(0.22) | $(0.64) |
| Net asset value, end of period (x) | $12.46 | $14.24 | $17.54 | $11.32 | $12.78 |
| Total return (%) (r)(s)(t)(x) | (8.91) | (7.77) | 55.37 | (10.07) | (2.57) |
| Ratios (%) (to average net assets) and Supplemental data: | |||||
| Expenses before expense reductions | 1.38 | 1.38 | 1.36 | 1.41 | 1.47 |
| Expenses after expense reductions | 1.24 | 1.24 | 1.24 | 1.24 | 1.24 |
| Net investment income (loss) | 0.33 | (0.01) | (0.03) | 0.23 | 1.22 |
| Portfolio turnover | 56 | 72 | 80 | 75 | 64 |
| Net assets at end of period (000 omitted) | $13,529 | $14,633 | $16,870 | $9,315 | $9,647 |
| Class R3 | Year ended | ||||
| 5/31/23 | 5/31/22 | 5/31/21 | 5/31/20 | 5/31/19 | |
| Net asset value, beginning of period | $14.34 | $17.61 | $11.35 | $12.83 | $13.88 |
| Income (loss) from investment operations | |||||
| Net investment income (loss) (d) | $0.08 | $0.04 | $0.03 | $0.06 | $0.05 |
| Net realized and unrealized gain (loss) | (1.30) | (1.20) | 6.29 | (1.28) | (0.42) |
| Total from investment operations | $(1.22) | $(1.16) | $6.32 | $(1.22) | $(0.37) |
| Less distributions declared to shareholders | |||||
| From net investment income | $— | $— | $(0.06) | $(0.09) | $(0.04) |
| From net realized gain | (0.54) | (2.11) | — | (0.17) | (0.64) |
| Total distributions declared to shareholders | $(0.54) | $(2.11) | $(0.06) | $(0.26) | $(0.68) |
| Net asset value, end of period (x) | $12.58 | $14.34 | $17.61 | $11.35 | $12.83 |
| Total return (%) (r)(s)(t)(x) | (8.70) | (7.55) | 55.83 | (9.92) | (2.23) |
| Ratios (%) (to average net assets) and Supplemental data: | |||||
| Expenses before expense reductions | 1.13 | 1.13 | 1.12 | 1.16 | 1.21 |
| Expenses after expense reductions | 0.99 | 0.99 | 0.99 | 0.99 | 0.99 |
| Net investment income (loss) | 0.60 | 0.21 | 0.23 | 0.52 | 0.38 |
| Portfolio turnover | 56 | 72 | 80 | 75 | 64 |
| Net assets at end of period (000 omitted) | $661 | $450 | $667 | $537 | $70 |
| Class R4 | Year ended | ||||
| 5/31/23 | 5/31/22 | 5/31/21 | 5/31/20 | 5/31/19 | |
| Net asset value, beginning of period | $14.42 | $17.68 | $11.40 | $12.84 | $13.91 |
| Income (loss) from investment operations | |||||
| Net investment income (loss) (d) | $0.11 | $0.08 | $0.07 | $0.10 | $0.09 |
| Net realized and unrealized gain (loss) | (1.30) | (1.21) | 6.30 | (1.28) | (0.45) |
| Total from investment operations | $(1.19) | $(1.13) | $6.37 | $(1.18) | $(0.36) |
| Less distributions declared to shareholders | |||||
| From net investment income | $— | $(0.02) | $(0.09) | $(0.09) | $(0.07) |
| From net realized gain | (0.54) | (2.11) | — | (0.17) | (0.64) |
| Total distributions declared to shareholders | $(0.54) | $(2.13) | $(0.09) | $(0.26) | $(0.71) |
| Net asset value, end of period (x) | $12.69 | $14.42 | $17.68 | $11.40 | $12.84 |
| Total return (%) (r)(s)(t)(x) | (8.44) | (7.34) | 56.09 | (9.60) | (2.09) |
| Ratios (%) (to average net assets) and Supplemental data: | |||||
| Expenses before expense reductions | 0.88 | 0.88 | 0.87 | 0.95 | 0.96 |
| Expenses after expense reductions | 0.74 | 0.74 | 0.74 | 0.74 | 0.74 |
| Net investment income (loss) | 0.83 | 0.48 | 0.53 | 0.96 | 0.63 |
| Portfolio turnover | 56 | 72 | 80 | 75 | 64 |
| Net assets at end of period (000 omitted) | $18,322 | $20,000 | $23,281 | $19,044 | $71 |
| Class R6 | Year ended | ||||
| 5/31/23 | 5/31/22 | 5/31/21 | 5/31/20 | 5/31/19 | |
| Net asset value, beginning of period | $14.44 | $17.70 | $11.40 | $12.85 | $13.91 |
| Income (loss) from investment operations | |||||
| Net investment income (loss) (d) | $0.13 | $0.10 | $0.09 | $0.10 | $0.10 |
| Net realized and unrealized gain (loss) | (1.31) | (1.21) | 6.32 | (1.28) | (0.44) |
| Total from investment operations | $(1.18) | $(1.11) | $6.41 | $(1.18) | $(0.34) |
| Less distributions declared to shareholders | |||||
| From net investment income | $— | $(0.04) | $(0.11) | $(0.10) | $(0.08) |
| From net realized gain | (0.54) | (2.11) | — | (0.17) | (0.64) |
| Total distributions declared to shareholders | $(0.54) | $(2.15) | $(0.11) | $(0.27) | $(0.72) |
| Net asset value, end of period (x) | $12.72 | $14.44 | $17.70 | $11.40 | $12.85 |
| Total return (%) (r)(s)(t)(x) | (8.36) | (7.23) | 56.40 | (9.59) | (1.93) |
| Ratios (%) (to average net assets) and Supplemental data: | |||||
| Expenses before expense reductions | 0.77 | 0.77 | 0.77 | 0.82 | 0.88 |
| Expenses after expense reductions | 0.63 | 0.63 | 0.65 | 0.65 | 0.66 |
| Net investment income (loss) | 0.94 | 0.60 | 0.60 | 0.83 | 0.72 |
| Portfolio turnover | 56 | 72 | 80 | 75 | 64 |
| Net assets at end of period (000 omitted) | $113,539 | $135,216 | $136,883 | $102,332 | $53,947 |
| (d) | Per share data is based on average shares outstanding. |
| (g) | The per share amount varies from the net realized and unrealized gain/loss for the period because of the timing of sales of fund shares and the per share amount of realized and unrealized gains and losses at such time. |
| (r) | Certain expenses have been reduced without which performance would have been lower. |
| (s) | From time to time the fund may receive proceeds from litigation settlements, without which performance would be lower. |
| (t) | Total returns do not include any applicable sales charges. |
| (w) | Per share amount was less than $0.01. |
| (x) | The net asset values and total returns have been calculated on net assets which include adjustments made in accordance with U.S. generally accepted accounting principles required at period end for financial reporting purposes. |
| Financial Instruments | Level 1 | Level 2 | Level 3 | Total |
| Equity Securities | $289,236,941 | $— | $— | $289,236,941 |
| Mutual Funds | 3,240,301 | — | — | 3,240,301 |
| Total | $292,477,242 | $— | $— | $292,477,242 |
| Year ended 5/31/23 | Year ended 5/31/22 | |
| Ordinary income (including any short-term capital gains) | $1,828 | $13,674,761 |
| Long-term capital gains | 12,569,661 | 29,189,461 |
| Total distributions | $12,571,489 | $42,864,222 |
| As of 5/31/23 | |
| Cost of investments | $292,149,101 |
| Gross appreciation | 41,115,911 |
| Gross depreciation | (40,787,770) |
| Net unrealized appreciation (depreciation) | $328,141 |
| Undistributed ordinary income | 2,444,931 |
| Capital loss carryforwards | (5,752,242) |
| Total distributable earnings (loss) | $(2,979,170) |
| Short-Term | $(5,752,242) |
| Year ended 5/31/23 | Year ended 5/31/22 | ||
| Class A | $1,450,388 | $4,830,087 | |
| Class B | 20,378 | 96,826 | |
| Class C | 266,208 | 874,950 | |
| Class I | 4,507,223 | 14,641,868 | |
| Class R1 | 148,981 | 638,480 | |
| Class R2 | 561,718 | 2,046,590 | |
| Class R3 | 24,681 | 69,834 | |
| Class R4 | 731,137 | 2,676,974 | |
| Class R6 | 4,860,775 | 15,393,649 | |
| Class 529A | — | 1,419,650 | |
| Class 529B | — | 33,079 | |
| Class 529C | — | 142,235 | |
| Total | $12,571,489 | $42,864,222 |
| Up to $1 billion | 0.65% |
| In excess of $1 billion and up to $2.5 billion | 0.60% |
| In excess of $2.5 billion | 0.575% |
| Classes | ||||||||
| A | B | C | I | R1 | R2 | R3 | R4 | R6 |
| 0.99% | 1.74% | 1.74% | 0.74% | 1.74% | 1.24% | 0.99% | 0.74% | 0.70% |
| Classes | ||||||||
| A | B | C | I | R1 | R2 | R3 | R4 | R6 |
| 0.99% | 1.74% | 1.74% | 0.74% | 1.74% | 1.24% | 0.99% | 0.74% | 0.67% |
| Distribution Fee Rate (d) | Service Fee Rate (d) | Total Distribution Plan (d) | Annual Effective Rate (e) | Distribution and Service Fee | |
| Class A | — | 0.25% | 0.25% | 0.25% | $ 92,544 |
| Class B | 0.75% | 0.25% | 1.00% | 1.00% | 5,269 |
| Class C | 0.75% | 0.25% | 1.00% | 1.00% | 60,412 |
| Class R1 | 0.75% | 0.25% | 1.00% | 1.00% | 35,638 |
| Class R2 | 0.25% | 0.25% | 0.50% | 0.50% | 70,430 |
| Class R3 | — | 0.25% | 0.25% | 0.25% | 1,549 |
| Total Distribution and Service Fees | $265,842 |
| (d) | In accordance with the distribution plan for certain classes, the fund pays distribution and/or service fees equal to these annual percentage rates of each class’s average daily net assets. The distribution and service fee rates disclosed by class represent the current rates in effect at the end of the reporting period. Any rate changes, if applicable, are detailed below. |
| (e) | The annual effective rates represent actual fees incurred under the distribution plan for the year ended May 31, 2023 based on each class's average daily net assets. MFD has voluntarily agreed to rebate a portion of each class's 0.25% service fee attributable to accounts for which there is no financial intermediary specified on the account except for accounts attributable to MFS or its affiliates' seed money. For the year ended May 31, 2023, this rebate amounted to $1 for Class A shares and is included in the reduction of total expenses in the Statement of Operations. |
| Amount | |
| Class A | $9,469 |
| Class B | 437 |
| Class C | 277 |
| Year ended 5/31/23 | Year ended 5/31/22 | ||||
| Shares | Amount | Shares | Amount | ||
| Shares sold | |||||
| Class A | 539,263 | $7,207,694 | 1,256,363 | $20,990,656 | |
| Class B | 3,676 | 45,871 | 34,990 | 576,506 | |
| Class C | 121,772 | 1,562,058 | 138,797 | 2,200,234 | |
| Class I | 2,835,460 | 37,473,460 | 4,313,598 | 73,991,621 | |
| Class R1 | 49,910 | 640,868 | 55,221 | 895,793 | |
| Class R2 | 217,015 | 2,879,978 | 313,139 | 5,308,871 | |
| Class R3 | 22,630 | 315,199 | 5,174 | 90,920 | |
| Class R4 | 226,570 | 3,125,911 | 125,161 | 2,069,619 | |
| Class R6 | 2,231,058 | 29,493,265 | 2,970,062 | 45,165,924 | |
| Class 529A | — | — | 173,089 | 2,819,477 | |
| Class 529B | — | — | 287 | 5,000 | |
| Class 529C | — | — | 5,218 | 83,524 | |
| 6,247,354 | $82,744,304 | 9,391,099 | $154,198,145 | ||
| Shares issued to shareholders in reinvestment of distributions | |||||
| Class A | 109,688 | $1,448,976 | 310,316 | $4,822,317 | |
| Class B | 1,608 | 20,378 | 6,434 | 96,826 | |
| Class C | 21,028 | 266,208 | 58,214 | 874,950 | |
| Class I | 338,336 | 4,506,629 | 936,438 | 14,636,522 | |
| Class R1 | 11,759 | 148,981 | 42,452 | 638,480 | |
| Class R2 | 42,814 | 561,718 | 132,209 | 2,046,590 | |
| Class R3 | 1,866 | 24,681 | 4,485 | 69,834 | |
| Class R4 | 54,849 | 731,137 | 171,053 | 2,676,974 | |
| Class R6 | 363,432 | 4,855,451 | 983,361 | 15,389,599 | |
| Class 529A | — | — | 90,441 | 1,406,356 | |
| Class 529B | — | — | 2,176 | 33,079 | |
| Class 529C | — | — | 9,419 | 141,759 | |
| 945,380 | $12,564,159 | 2,746,998 | $42,833,286 | ||
| Year ended 5/31/23 | Year ended 5/31/22 | ||||
| Shares | Amount | Shares | Amount | ||
| Shares reacquired | |||||
| Class A | (827,549) | $(11,022,953) | (2,868,509) | $(50,253,172) | |
| Class B | (15,756) | (204,248) | (29,249) | (451,937) | |
| Class C | (177,310) | (2,213,616) | (156,734) | (2,435,474) | |
| Class I | (3,077,212) | (41,398,089) | (1,811,319) | (29,563,854) | |
| Class R1 | (56,656) | (716,705) | (109,895) | (1,717,307) | |
| Class R2 | (201,765) | (2,684,716) | (379,309) | (6,276,757) | |
| Class R3 | (3,300) | (42,307) | (16,173) | (281,779) | |
| Class R4 | (224,640) | (2,970,932) | (226,318) | (3,809,944) | |
| Class R6 | (3,034,693) | (41,199,850) | (2,322,334) | (39,218,688) | |
| Class 529A | — | — | (911,535) | (12,586,970) | |
| Class 529B | — | — | (19,698) | (306,317) | |
| Class 529C | — | — | (91,832) | (1,415,344) | |
| (7,618,881) | $(102,453,416) | (8,942,905) | $(148,317,543) | ||
| Net change | |||||
| Class A | (178,598) | $(2,366,283) | (1,301,830) | $(24,440,199) | |
| Class B | (10,472) | (137,999) | 12,175 | 221,395 | |
| Class C | (34,510) | (385,350) | 40,277 | 639,710 | |
| Class I | 96,584 | 582,000 | 3,438,717 | 59,064,289 | |
| Class R1 | 5,013 | 73,144 | (12,222) | (183,034) | |
| Class R2 | 58,064 | 756,980 | 66,039 | 1,078,704 | |
| Class R3 | 21,196 | 297,573 | (6,514) | (121,025) | |
| Class R4 | 56,779 | 886,116 | 69,896 | 936,649 | |
| Class R6 | (440,203) | (6,851,134) | 1,631,089 | 21,336,835 | |
| Class 529A | — | — | (648,005) | (8,361,137) | |
| Class 529B | — | — | (17,235) | (268,238) | |
| Class 529C | — | — | (77,195) | (1,190,061) | |
| (426,147) | $(7,144,953) | 3,195,192 | $48,713,888 | ||
| Affiliated Issuers | Beginning Value | Purchases | Sales Proceeds | Realized Gain (Loss) | Change in Unrealized Appreciation or Depreciation | Ending Value |
| MFS Institutional Money Market Portfolio | $2,378,593 | $66,319,311 | $66,656,876 | $363 | $(203) | $2,041,188 |
| Affiliated Issuers | Dividend Income | Capital Gain Distributions |
| MFS Institutional Money Market Portfolio | $104,175 | $— |
July 14, 2023
| Name, Age | Position(s) Held with Fund | Trustee/Officer Since(h) | Number of MFS Funds overseen by the Trustee | Principal Occupations During the Past Five Years | Other Directorships During the Past Five Years (j) | |||||
| INTERESTED TRUSTEE | ||||||||||
| Michael W. Roberge (k) (age 56) | Trustee | January 2021 | 136 | Massachusetts Financial Services Company, Chairman (since January 2021); Chief Executive Officer (since January 2017); Director; Chairman of the Board (since January 2022); President (until December 2018); Chief Investment Officer (until December 2018) | N/A | |||||
| INDEPENDENT TRUSTEES | ||||||||||
| John P. Kavanaugh (age 68) | Trustee and Chair of Trustees | January 2009 | 136 | Private investor | N/A | |||||
| Steven E. Buller (age 71) | Trustee | February 2014 | 136 | Private investor | N/A | |||||
| John A. Caroselli (age 69) | Trustee | March 2017 | 136 | Private investor; JC Global Advisors, LLC (management consulting), President (since 2015) | N/A | |||||
| Maureen R. Goldfarb (age 68) | Trustee | January 2009 | 136 | Private investor | N/A | |||||
| Peter D. Jones (age 67) | Trustee | January 2019 | 136 | Private investor | N/A | |||||
| James W. Kilman, Jr. (age 62) | Trustee | January 2019 | 136 | Burford Capital Limited (finance and investment management), Senior Advisor (since May 3, 2021), Chief Financial Officer (2019 - May 2, 2021); KielStrand Capital LLC (family office), Chief Executive Officer (since 2016) | Alpha-En Corporation, Director (2016-2019) |
| Name, Age | Position(s) Held with Fund | Trustee/Officer Since(h) | Number of MFS Funds overseen by the Trustee | Principal Occupations During the Past Five Years | Other Directorships During the Past Five Years (j) | |||||
| Clarence Otis, Jr. (age 67) | Trustee | March 2017 | 136 | Private investor | VF Corporation, Director; Verizon Communications, Inc., Director; The Travelers Companies, Director | |||||
| Maryanne L. Roepke (age 67) | Trustee | May 2014 | 136 | Private investor | N/A | |||||
| Laurie J. Thomsen (age 65) | Trustee | March 2005 | 136 | Private investor | The Travelers Companies, Director; Dycom Industries, Inc., Director |
| Name, Age | Position(s) Held with Fund | Trustee/Officer Since(h) | Number of MFS Funds for which the Person is an Officer | Principal Occupations During the Past Five Years | ||||
| OFFICERS | ||||||||
| Christopher R. Bohane (k) (age 49) | Assistant Secretary and Assistant Clerk | July 2005 | 136 | Massachusetts Financial Services Company, Senior Vice President and Senior Managing Counsel | ||||
| Kino Clark (k) (age 55) | Assistant Treasurer | January 2012 | 136 | Massachusetts Financial Services Company, Vice President | ||||
| John W. Clark, Jr. (k) (age 56) | Assistant Treasurer | April 2017 | 136 | Massachusetts Financial Services Company, Vice President | ||||
| David L. DiLorenzo (k) (age 54) | President | July 2005 | 136 | Massachusetts Financial Services Company, Senior Vice President | ||||
| Heidi W. Hardin (k) (age 55) | Secretary and Clerk | April 2017 | 136 | Massachusetts Financial Services Company, Executive Vice President and General Counsel | ||||
| Brian E. Langenfeld (k) (age 50) | Assistant Secretary and Assistant Clerk | June 2006 | 136 | Massachusetts Financial Services Company, Vice President and Managing Counsel |
| Name, Age | Position(s) Held with Fund | Trustee/Officer Since(h) | Number of MFS Funds for which the Person is an Officer | Principal Occupations During the Past Five Years | ||||
| Rosa E. Licea-Mailloux (k) (age 46) | Chief Compliance Officer | March 2022 | 136 | Massachusetts Financial Services Company, Vice President (since 2018); Director of Corporate Compliance (2018-2021), Senior Director Compliance (2021-2022), Senior Managing Director of North American Compliance & Chief Compliance Officer (since March 2022); Natixis Investment Managers (investment management), Funds Chief Compliance Officer, Deputy General Counsel & Senior Vice President (until 2018) | ||||
| Amanda S. Mooradian (k) (age 44) | Assistant Secretary and Assistant Clerk | September 2018 | 136 | Massachusetts Financial Services Company, Assistant Vice President and Senior Counsel | ||||
| Susan A. Pereira (k) (age 52) | Assistant Secretary and Assistant Clerk | July 2005 | 136 | Massachusetts Financial Services Company, Vice President and Managing Counsel | ||||
| Kasey L. Phillips (k) (age 52) | Assistant Treasurer | September 2012 | 136 | Massachusetts Financial Services Company, Vice President | ||||
| Matthew A. Stowe (k) (age 48) | Assistant Secretary and Assistant Clerk | October 2014 | 136 | Massachusetts Financial Services Company, Vice President and Senior Managing Counsel | ||||
| William B. Wilson (k) (age 40) | Assistant Secretary and Assistant Clerk | October 2022 | 136 | Massachusetts Financial Services Company, Assistant Vice President and Senior Counsel | ||||
| James O. Yost (k) (age 63) | Treasurer | September 1990 | 136 | Massachusetts Financial Services Company, Senior Vice President |
| (h) | Date first appointed to serve as Trustee/Officer of an MFS Fund. Each Trustee has served continuously since appointment unless indicated otherwise. From January 2012 through December 2016, Messrs. DiLorenzo and Yost served as Treasurer and Deputy Treasurer of the Funds, respectively. |
| (j) | Directorships or trusteeships of companies required to report to the Securities and Exchange Commission (i.e., “public companies”). |
| (k) | “Interested person” of the Trust within the meaning of the Investment Company Act of 1940 (referred to as the 1940 Act), which is the principal federal law governing investment companies like the fund, as a result of a position with MFS. The address of MFS is 111 Huntington Avenue, Boston, Massachusetts 02199-7618. |
| Investment Adviser | Custodian |
| Massachusetts Financial Services Company 111 Huntington Avenue Boston, MA 02199-7618 | State Street Bank and Trust Company 1 Congress Street, Suite 1 Boston, MA 02114-2016 |
| Distributor | Independent Registered Public Accounting Firm |
| MFS Fund Distributors, Inc. 111 Huntington Avenue Boston, MA 02199-7618 | Deloitte & Touche LLP 200 Berkeley Street Boston, MA 02116 |
| Portfolio Manager(s) | |
| Jim Fallon Matt Krummell Jonathan Sage Jed Stocks |
| FACTS | WHAT DOES MFS DO WITH YOUR PERSONAL INFORMATION? |
| Why? | Financial companies choose how they share your personal information. Federal law gives consumers the right to limit some but not all sharing. Federal law also requires us to tell you how we collect, share, and protect your personal information. Please read this notice carefully to understand what we do. |
| What? | The types of personal information we collect and share depend on the product or service you have with us. This information can include: |
| • Social Security number and account balances | |
| • Account transactions and transaction history | |
| • Checking account information and wire transfer instructions | |
| When you are no longer our customer, we continue to share your information as described in this notice. |
| How? | All financial companies need to share customers' personal information to run their everyday business. In the section below, we list the reasons financial companies can share their customers' personal information; the reasons MFS chooses to share; and whether you can limit this sharing. |
| Reasons we can share your personal information | Does MFS share? | Can you limit this sharing? |
| For our everyday business purposes – such as to process your transactions, maintain your account(s), respond to court orders and legal investigations, or report to credit bureaus | Yes | No |
| For our marketing purposes – to offer our products and services to you | No | We don't share |
| For joint marketing with other financial companies | No | We don't share |
| For our affiliates' everyday business purposes – information about your transactions and experiences | No | We don't share |
| For our affiliates' everyday business purposes – information about your creditworthiness | No | We don't share |
| For nonaffiliates to market to you | No | We don't share |
| Questions? | Call 800-225-2606 or go to mfs.com. |

| Who we are | |
| Who is providing this notice? | MFS Funds, MFS Investment Management, MFS Institutional Advisors, Inc., and MFS Heritage Trust Company. |
| What we do | |
| How does MFS protect my personal information? | To protect your personal information from unauthorized access and use, we use security measures that comply with federal law. These measures include procedural, electronic, and physical safeguards for the protection of the personal information we collect about you. |
| How does MFS collect my personal information? | We collect your personal information, for example, when you |
| • open an account or provide account information | |
| • direct us to buy securities or direct us to sell your securities | |
| • make a wire transfer | |
| We also collect your personal information from others, such as credit bureaus, affiliates, or other companies. | |
| Why can't I limit all sharing? | Federal law gives you the right to limit only |
| • sharing for affiliates' everyday business purposes – information about your creditworthiness | |
| • affiliates from using your information to market to you | |
| • sharing for nonaffiliates to market to you | |
| State laws and individual companies may give you additional rights to limit sharing. | |
| Definitions | |
| Affiliates | Companies related by common ownership or control. They can be financial and nonfinancial companies. |
| • MFS does not share personal information with affiliates, except for everyday business purposes as described on page one of this notice. | |
| Nonaffiliates | Companies not related by common ownership or control. They can be financial and nonfinancial companies. |
| • MFS does not share with nonaffiliates so they can market to you. | |
| Joint marketing | A formal agreement between nonaffiliated financial companies that together market financial products or services to you. |
| • MFS doesn't jointly market. | |
| Other important information |
| If you own an MFS product or receive an MFS service in the name of a third party such as a bank or broker-dealer, their privacy policy may apply to you instead of ours. |


Value Equity Fund

Value Equity Fund
| 1 | |
| 2 | |
| 5 | |
| 8 | |
| 10 | |
| 16 | |
| 18 | |
| 19 | |
| 20 | |
| 29 | |
| 39 | |
| 41 | |
| 45 | |
| 46 | |
| 46 | |
| 46 | |
| 46 | |
| 46 | |
| 48 |
| back cover |
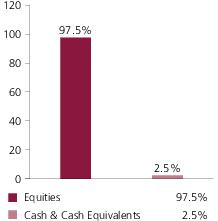
| JPMorgan Chase & Co. | 3.1% |
| Alphabet, Inc., “A” | 2.7% |
| Merck & Co., Inc. | 2.4% |
| Johnson & Johnson | 2.1% |
| Wells Fargo & Co. | 1.8% |
| McKesson Corp. | 1.7% |
| Goldman Sachs Group, Inc. | 1.6% |
| Berkshire Hathaway, Inc., “B” | 1.6% |
| Cigna Group | 1.5% |
| Mondelez International, Inc. | 1.5% |
| Financials | 20.1% |
| Health Care | 16.9% |
| Industrials | 10.2% |
| Communication Services | 9.3% |
| Information Technology | 8.1% |
| Consumer Staples | 6.9% |
| Energy | 6.6% |
| Consumer Discretionary | 5.8% |
| Real Estate | 5.1% |
| Utilities | 5.0% |
| Materials | 3.5% |
| (g) | The Global Industry Classification Standard (GICS®) was developed by and/or is the exclusive property of MSCI, Inc. and S&P Global Market Intelligence Inc. (“S&P Global Market Intelligence”). GICS is a service mark of MSCI and S&P Global Market Intelligence and has been licensed for use by MFS. MFS has applied its own internal sector/industry classification methodology for equity securities and non-equity securities that are unclassified by GICS. |
| (b) | Security is not a benchmark constituent. |
| (h) | Security was not held in the portfolio at period end. |
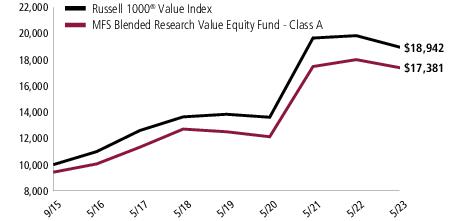
| Share Class | Class Inception Date | 1-yr | 5-yr | Life (t) |
| A | 9/15/15 | (3.51)% | 6.45% | 8.26% |
| B | 9/15/15 | (4.29)% | 5.66% | 7.45% |
| C | 9/15/15 | (4.20)% | 5.68% | 7.46% |
| I | 9/15/15 | (3.24)% | 6.71% | 8.53% |
| R1 | 9/15/15 | (3.49)% | 5.98% | 7.67% |
| R2 | 9/15/15 | (3.79)% | 6.19% | 8.00% |
| R3 | 9/15/15 | (3.48)% | 6.45% | 8.27% |
| R4 | 9/15/15 | (3.29)% | 6.73% | 8.54% |
| R6 | 9/15/15 | (3.15)% | 6.83% | 8.63% |
| Russell 1000® Value Index (f) | (4.55)% | 6.78% | 8.63% |
| A With Initial Sales Charge (5.75%) | (9.06)% | 5.20% | 7.43% |
| B With CDSC (Declining over six years from 4% to 0%) (v) | (7.85)% | 5.33% | 7.45% |
| C With CDSC (1% for 12 months) (v) | (5.09)% | 5.68% | 7.46% |
| (f) | Source: FactSet Research Systems Inc. |
| (t) | For the period from the class inception date through the stated period end. (See Notes to Performance Summary.) |
| (v) | Assuming redemption at the end of the applicable period. |
| (h) | Frank Russell Company (“Russell”) is the source and owner of the trademarks, service marks, and copyrights related to the Russell Indexes. Russell® is a trademark of Frank Russell Company. Neither Russell nor its licensors accept any liability for any errors or omissions in the Russell Indexes and/or Russell ratings or underlying data and no party may rely on any Russell Indexes and/or Russell ratings and/or underlying data contained in this document. No further distribution of Russell Data is permitted without Russell's express written consent. Russell does not promote, sponsor, or endorse the content of this document. |
December 1, 2022 through May 31, 2023
| Share Class | Annualized Expense Ratio | Beginning Account Value 12/01/22 | Ending Account Value 5/31/23 | Expenses Paid During Period (p) 12/01/22-5/31/23 | |
| A | Actual | 0.74% | $1,000.00 | $938.07 | $3.58 |
| Hypothetical (h) | 0.74% | $1,000.00 | $1,021.24 | $3.73 | |
| B | Actual | 1.49% | $1,000.00 | $934.44 | $7.19 |
| Hypothetical (h) | 1.49% | $1,000.00 | $1,017.50 | $7.49 | |
| C | Actual | 1.49% | $1,000.00 | $935.20 | $7.19 |
| Hypothetical (h) | 1.49% | $1,000.00 | $1,017.50 | $7.49 | |
| I | Actual | 0.49% | $1,000.00 | $939.31 | $2.37 |
| Hypothetical (h) | 0.49% | $1,000.00 | $1,022.49 | $2.47 | |
| R1 | Actual | 0.74% | $1,000.00 | $938.50 | $3.58 |
| Hypothetical (h) | 0.74% | $1,000.00 | $1,021.24 | $3.73 | |
| R2 | Actual | 0.99% | $1,000.00 | $936.97 | $4.78 |
| Hypothetical (h) | 0.99% | $1,000.00 | $1,020.00 | $4.99 | |
| R3 | Actual | 0.74% | $1,000.00 | $938.10 | $3.58 |
| Hypothetical (h) | 0.74% | $1,000.00 | $1,021.24 | $3.73 | |
| R4 | Actual | 0.49% | $1,000.00 | $939.43 | $2.37 |
| Hypothetical (h) | 0.49% | $1,000.00 | $1,022.49 | $2.47 | |
| R6 | Actual | 0.42% | $1,000.00 | $940.23 | $2.03 |
| Hypothetical (h) | 0.42% | $1,000.00 | $1,022.84 | $2.12 |
| (h) | 5% class return per year before expenses. |
| (p) | “Expenses Paid During Period” are equal to each class’s annualized expense ratio, as shown above, multiplied by the average account value over the period, multiplied by 182/365 (to reflect the one-half year period). Expenses paid do not include any applicable sales charges (loads). If these transaction costs had been included, your costs would have been higher. |
| Issuer | Shares/Par | Value ($) | ||
| Common Stocks – 97.5% | ||||
| Aerospace & Defense – 3.1% | ||||
| CACI International, Inc., “A” (a) | 1,425 | $426,388 | ||
| General Dynamics Corp. | 15,460 | 3,156,623 | ||
| Honeywell International, Inc. | 15,840 | 3,034,944 | ||
| Raytheon Technologies Corp. | 9,484 | 873,856 | ||
| $7,491,811 | ||||
| Airlines – 0.6% | ||||
| Copa Holdings S.A., “A” | 5,824 | $611,870 | ||
| United Airlines Holdings, Inc. (a) | 16,788 | 796,842 | ||
| $1,408,712 | ||||
| Automotive – 1.0% | ||||
| Aptiv PLC (a) | 10,530 | $927,483 | ||
| General Motors Co. | 45,608 | 1,478,155 | ||
| $2,405,638 | ||||
| Biotechnology – 2.0% | ||||
| Biogen, Inc. (a) | 9,876 | $2,927,345 | ||
| Gilead Sciences, Inc. | 23,997 | 1,846,329 | ||
| $4,773,674 | ||||
| Broadcasting – 2.2% | ||||
| Netflix, Inc. (a) | 2,838 | $1,121,663 | ||
| Omnicom Group, Inc. | 10,791 | 951,658 | ||
| Walt Disney Co. (a) | 37,016 | 3,255,927 | ||
| $5,329,248 | ||||
| Brokerage & Asset Managers – 0.9% | ||||
| Citigroup, Inc. | 14,489 | $642,152 | ||
| LPL Financial Holdings, Inc. | 2,246 | 437,476 | ||
| Raymond James Financial, Inc. | 11,579 | 1,046,163 | ||
| $2,125,791 | ||||
| Business Services – 2.7% | ||||
| Accenture PLC, “A” | 4,501 | $1,376,946 | ||
| Amdocs Ltd. | 13,485 | 1,269,882 | ||
| Fiserv, Inc. (a) | 7,529 | 844,679 | ||
| GoDaddy, Inc. (a) | 13,887 | 1,019,028 | ||
| PayPal Holdings, Inc. (a) | 31,473 | 1,951,011 | ||
| $6,461,546 | ||||
| Issuer | Shares/Par | Value ($) | ||
| Common Stocks – continued | ||||
| Cable TV – 2.1% | ||||
| Charter Communications, Inc., “A” (a) | 6,120 | $1,996,038 | ||
| Comcast Corp., “A” | 77,176 | 3,036,876 | ||
| $5,032,914 | ||||
| Computer Software – 2.1% | ||||
| Microsoft Corp. | 8,180 | $2,686,230 | ||
| Salesforce, Inc. (a) | 10,777 | 2,407,367 | ||
| $5,093,597 | ||||
| Consumer Products – 1.2% | ||||
| Colgate-Palmolive Co. | 37,277 | $2,772,663 | ||
| Consumer Services – 1.6% | ||||
| Booking Holdings, Inc. (a) | 1,212 | $3,040,629 | ||
| Expedia Group, Inc. (a) | 8,710 | 833,634 | ||
| $3,874,263 | ||||
| Electrical Equipment – 1.5% | ||||
| Acuity Brands, Inc. | 3,940 | $593,718 | ||
| Amphenol Corp., “A” | 31,993 | 2,413,872 | ||
| Johnson Controls International PLC | 9,321 | 556,464 | ||
| $3,564,054 | ||||
| Electronics – 3.4% | ||||
| Applied Materials, Inc. | 20,705 | $2,759,977 | ||
| Corning, Inc. | 21,640 | 666,728 | ||
| Intel Corp. | 32,942 | 1,035,697 | ||
| Lam Research Corp. | 2,152 | 1,327,138 | ||
| NXP Semiconductors N.V. | 5,922 | 1,060,630 | ||
| Texas Instruments, Inc. | 8,000 | 1,391,040 | ||
| $8,241,210 | ||||
| Energy - Independent – 4.8% | ||||
| ConocoPhillips | 15,124 | $1,501,813 | ||
| EOG Resources, Inc. | 23,358 | 2,506,080 | ||
| Marathon Petroleum Corp. | 12,660 | 1,328,161 | ||
| Phillips 66 | 34,935 | 3,200,395 | ||
| Valero Energy Corp. | 26,542 | 2,841,056 | ||
| $11,377,505 | ||||
| Energy - Integrated – 1.4% | ||||
| Chevron Corp. | 6,030 | $908,238 | ||
| Exxon Mobil Corp. | 23,376 | 2,388,560 | ||
| $3,296,798 | ||||
| Issuer | Shares/Par | Value ($) | ||
| Common Stocks – continued | ||||
| Food & Beverages – 2.9% | ||||
| Archer Daniels Midland Co. | 35,465 | $2,505,602 | ||
| General Mills, Inc. | 9,702 | 816,520 | ||
| Mondelez International, Inc. | 47,982 | 3,522,359 | ||
| $6,844,481 | ||||
| Food & Drug Stores – 0.4% | ||||
| Albertsons Cos., Inc., “A” | 51,226 | $1,042,961 | ||
| Gaming & Lodging – 0.7% | ||||
| Hyatt Hotels Corp. | 15,176 | $1,631,117 | ||
| Health Maintenance Organizations – 1.5% | ||||
| Cigna Group | 14,535 | $3,596,104 | ||
| Insurance – 7.0% | ||||
| Ameriprise Financial, Inc. | 6,652 | $1,985,423 | ||
| Berkshire Hathaway, Inc., “B” (a) | 11,780 | 3,782,322 | ||
| Chubb Ltd. | 18,654 | 3,465,913 | ||
| Equitable Holdings, Inc. | 105,739 | 2,594,835 | ||
| Everest Re Group Ltd. | 5,391 | 1,833,048 | ||
| Hartford Financial Services Group, Inc. | 11,204 | 767,698 | ||
| MetLife, Inc. | 43,891 | 2,174,799 | ||
| $16,604,038 | ||||
| Internet – 3.4% | ||||
| Alphabet, Inc., “A” (a) | 51,942 | $6,382,114 | ||
| Meta Platforms, Inc., “A” (a) | 6,528 | 1,728,092 | ||
| $8,110,206 | ||||
| Leisure & Toys – 1.1% | ||||
| Brunswick Corp. | 20,511 | $1,548,580 | ||
| Electronic Arts, Inc. | 3,972 | 508,416 | ||
| Polaris, Inc. | 4,445 | 478,771 | ||
| $2,535,767 | ||||
| Machinery & Tools – 2.3% | ||||
| Eaton Corp. PLC | 14,125 | $2,484,588 | ||
| Timken Co. | 29,139 | 2,084,895 | ||
| Wabtec Corp. | 9,504 | 880,356 | ||
| $5,449,839 | ||||
| Major Banks – 9.4% | ||||
| Bank of America Corp. | 94,233 | $2,618,735 | ||
| Goldman Sachs Group, Inc. | 11,991 | 3,883,885 | ||
| JPMorgan Chase & Co. | 54,261 | 7,363,760 | ||
| Issuer | Shares/Par | Value ($) | ||
| Common Stocks – continued | ||||
| Major Banks – continued | ||||
| Morgan Stanley | 9,145 | $747,695 | ||
| PNC Financial Services Group, Inc. | 15,200 | 1,760,616 | ||
| Regions Financial Corp. | 53,255 | 919,714 | ||
| State Street Corp. | 11,679 | 794,406 | ||
| Wells Fargo & Co. | 110,256 | 4,389,291 | ||
| $22,478,102 | ||||
| Medical & Health Technology & Services – 1.9% | ||||
| CVS Health Corp. | 9,835 | $669,075 | ||
| McKesson Corp. | 10,138 | 3,962,336 | ||
| $4,631,411 | ||||
| Medical Equipment – 4.1% | ||||
| Abbott Laboratories | 10,561 | $1,077,222 | ||
| Agilent Technologies, Inc. | 15,032 | 1,738,751 | ||
| Becton, Dickinson and Co. | 11,300 | 2,731,888 | ||
| Boston Scientific Corp. (a) | 21,038 | 1,083,036 | ||
| Medtronic PLC | 29,981 | 2,481,228 | ||
| Thermo Fisher Scientific, Inc. | 1,291 | 656,422 | ||
| $9,768,547 | ||||
| Metals & Mining – 1.0% | ||||
| United States Steel Corp. | 115,958 | $2,425,841 | ||
| Natural Gas - Distribution – 0.8% | ||||
| UGI Corp. | 64,834 | $1,813,407 | ||
| Network & Telecom – 1.4% | ||||
| Equinix, Inc., REIT | 4,490 | $3,347,520 | ||
| Oil Services – 0.4% | ||||
| NOV, Inc. | 69,631 | $979,708 | ||
| Other Banks & Diversified Financials – 1.7% | ||||
| American Express Co. | 9,999 | $1,585,442 | ||
| SLM Corp. | 155,377 | 2,371,053 | ||
| $3,956,495 | ||||
| Pharmaceuticals – 7.3% | ||||
| Johnson & Johnson | 32,395 | $5,023,169 | ||
| Merck & Co., Inc. | 50,983 | 5,629,033 | ||
| Pfizer, Inc. | 88,566 | 3,367,279 | ||
| Vertex Pharmaceuticals, Inc. (a) | 10,795 | 3,492,938 | ||
| $17,512,419 | ||||
| Issuer | Shares/Par | Value ($) | ||
| Common Stocks – continued | ||||
| Pollution Control – 0.3% | ||||
| Republic Services, Inc. | 4,320 | $611,842 | ||
| Railroad & Shipping – 1.2% | ||||
| CSX Corp. | 96,663 | $2,964,654 | ||
| Real Estate – 3.7% | ||||
| Life Storage, Inc., REIT | 7,225 | $920,393 | ||
| Prologis, Inc., REIT | 19,002 | 2,366,699 | ||
| Simon Property Group, Inc., REIT | 14,342 | 1,508,061 | ||
| Spirit Realty Capital, Inc., REIT | 55,898 | 2,183,376 | ||
| VICI Properties, Inc., REIT | 26,952 | 833,626 | ||
| W.P. Carey, Inc., REIT | 14,759 | 1,023,684 | ||
| $8,835,839 | ||||
| Restaurants – 0.4% | ||||
| Starbucks Corp. | 10,015 | $977,865 | ||
| Specialty Chemicals – 2.9% | ||||
| Chemours Co. | 100,858 | $2,671,728 | ||
| Corteva, Inc. | 10,287 | 550,252 | ||
| Linde PLC | 7,409 | 2,620,267 | ||
| Univar Solutions, Inc. (a) | 31,428 | 1,119,465 | ||
| $6,961,712 | ||||
| Specialty Stores – 4.1% | ||||
| Builders FirstSource, Inc. (a) | 26,534 | $3,076,617 | ||
| Home Depot, Inc. | 1,995 | 565,483 | ||
| O'Reilly Automotive, Inc. (a) | 2,753 | 2,486,812 | ||
| Target Corp. | 2,529 | 331,122 | ||
| Walmart Stores, Inc. | 22,301 | 3,275,348 | ||
| $9,735,382 | ||||
| Telecommunications - Wireless – 1.4% | ||||
| T-Mobile US, Inc. (a) | 23,790 | $3,265,178 | ||
| Tobacco – 0.9% | ||||
| Altria Group, Inc. | 49,601 | $2,203,276 | ||
| Trucking – 0.5% | ||||
| United Parcel Service, Inc., “B” | 7,092 | $1,184,364 | ||
| Utilities - Electric Power – 4.2% | ||||
| American Electric Power Co., Inc. | 12,371 | $1,028,278 | ||
| Edison International | 28,257 | 1,907,913 | ||
| Exelon Corp. | 68,713 | 2,724,470 | ||
| PG&E Corp. (a) | 147,561 | 2,499,683 | ||
| Issuer | Shares/Par | Value ($) | ||
| Common Stocks – continued | ||||
| Utilities - Electric Power – continued | ||||
| Vistra Corp. | 82,681 | $1,981,864 | ||
| $10,142,208 | ||||
| Total Common Stocks (Identified Cost, $198,592,514) | $232,859,707 | |||
| Investment Companies (h) – 2.0% | ||||
| Money Market Funds – 2.0% | ||||
| MFS Institutional Money Market Portfolio, 4.88% (v) (Identified Cost, $4,734,337) | 4,734,220 | $4,733,746 | ||
| Other Assets, Less Liabilities – 0.5% | 1,119,752 | |||
| Net Assets – 100.0% | $238,713,205 | |||
| (a) | Non-income producing security. | |||
| (h) | An affiliated issuer, which may be considered one in which the fund owns 5% or more of the outstanding voting securities, or a company which is under common control. At period end, the aggregate values of the fund's investments in affiliated issuers and in unaffiliated issuers were $4,733,746 and $232,859,707, respectively. | |||
| (v) | Affiliated issuer that is available only to investment companies managed by MFS. The rate quoted for the MFS Institutional Money Market Portfolio is the annualized seven-day yield of the fund at period end. |
| The following abbreviations are used in this report and are defined: | |
| REIT | Real Estate Investment Trust |
| Assets | |
| Investments in unaffiliated issuers, at value (identified cost, $198,592,514) | $232,859,707 |
| Investments in affiliated issuers, at value (identified cost, $4,734,337) | 4,733,746 |
| Receivables for | |
| Fund shares sold | 771,161 |
| Dividends | 484,530 |
| Receivable from investment adviser | 21,004 |
| Other assets | 1,146 |
| Total assets | $238,871,294 |
| Liabilities | |
| Payables for | |
| Fund shares reacquired | $63,680 |
| Payable to affiliates | |
| Administrative services fee | 245 |
| Shareholder servicing costs | 19,382 |
| Distribution and service fees | 402 |
| Payable for independent Trustees' compensation | 12 |
| Accrued expenses and other liabilities | 74,368 |
| Total liabilities | $158,089 |
| Net assets | $238,713,205 |
| Net assets consist of | |
| Paid-in capital | $202,186,213 |
| Total distributable earnings (loss) | 36,526,992 |
| Net assets | $238,713,205 |
| Shares of beneficial interest outstanding | 17,838,167 |
| Net assets | Shares outstanding | Net asset value per share (a) | |
| Class A | $22,379,824 | 1,663,554 | $13.45 |
| Class B | 559,887 | 42,368 | 13.21 |
| Class C | 966,219 | 73,277 | 13.19 |
| Class I | 52,655,425 | 3,944,387 | 13.35 |
| Class R1 | 88,399 | 6,668 | 13.26 |
| Class R2 | 105,349 | 7,919 | 13.30 |
| Class R3 | 291,739 | 21,902 | 13.32 |
| Class R4 | 94,062 | 7,036 | 13.37 |
| Class R6 | 161,572,301 | 12,071,056 | 13.39 |
| (a) | Maximum offering price per share was equal to the net asset value per share for all share classes, except for Class A, for which the maximum offering price per share was $14.27 [100 / 94.25 x $13.45]. On sales of $50,000 or more, the maximum offering price of Class A shares is reduced. A contingent deferred sales charge may be imposed on redemptions of Class A, Class B, and Class C shares. Redemption price per share was equal to the net asset value per share for Classes I, R1, R2, R3, R4, and R6. |
| Net investment income (loss) | |
| Income | |
| Dividends | $4,918,652 |
| Dividends from affiliated issuers | 107,684 |
| Other | 7,463 |
| Foreign taxes withheld | (2,857) |
| Total investment income | $5,030,942 |
| Expenses | |
| Management fee | $928,797 |
| Distribution and service fees | 71,794 |
| Shareholder servicing costs | 71,801 |
| Administrative services fee | 45,542 |
| Independent Trustees' compensation | 5,896 |
| Custodian fee | 14,020 |
| Shareholder communications | 9,771 |
| Audit and tax fees | 63,670 |
| Legal fees | 1,155 |
| Registration fees | 123,673 |
| Miscellaneous | 32,913 |
| Total expenses | $1,369,032 |
| Reduction of expenses by investment adviser and distributor | (266,842) |
| Net expenses | $1,102,190 |
| Net investment income (loss) | $3,928,752 |
| Realized and unrealized gain (loss) | |
| Realized gain (loss) (identified cost basis) | |
| Unaffiliated issuers | $6,639,892 |
| Affiliated issuers | (1,533) |
| Net realized gain (loss) | $6,638,359 |
| Change in unrealized appreciation or depreciation | |
| Unaffiliated issuers | $(18,022,412) |
| Affiliated issuers | (591) |
| Net unrealized gain (loss) | $(18,023,003) |
| Net realized and unrealized gain (loss) | $(11,384,644) |
| Change in net assets from operations | $(7,455,892) |
| Year ended | ||
| 5/31/23 | 5/31/22 | |
| Change in net assets | ||
| From operations | ||
| Net investment income (loss) | $3,928,752 | $3,818,870 |
| Net realized gain (loss) | 6,638,359 | 31,722,729 |
| Net unrealized gain (loss) | (18,023,003) | (27,171,160) |
| Change in net assets from operations | $(7,455,892) | $8,370,439 |
| Total distributions to shareholders | $(18,668,408) | $(28,729,192) |
| Change in net assets from fund share transactions | $25,745,135 | $(2,957,326) |
| Total change in net assets | $(379,165) | $(23,316,079) |
| Net assets | ||
| At beginning of period | 239,092,370 | 262,408,449 |
| At end of period | $238,713,205 | $239,092,370 |
| Class A | Year ended | ||||
| 5/31/23 | 5/31/22 | 5/31/21 | 5/31/20 | 5/31/19 | |
| Net asset value, beginning of period | $15.05 | $16.28 | $11.48 | $12.07 | $12.84 |
| Income (loss) from investment operations | |||||
| Net investment income (loss) (d) | $0.20 | $0.19 | $0.20 | $0.24 | $0.23 |
| Net realized and unrealized gain (loss) | (0.68) | 0.29 | 4.82 | (0.57) | (0.47) |
| Total from investment operations | $(0.48) | $0.48 | $5.02 | $(0.33) | $(0.24) |
| Less distributions declared to shareholders | |||||
| From net investment income | $(0.15) | $(0.01) | $(0.22) | $(0.26) | $(0.22) |
| From net realized gain | (0.97) | (1.70) | — | — | (0.31) |
| Total distributions declared to shareholders | $(1.12) | $(1.71) | $(0.22) | $(0.26) | $(0.53) |
| Net asset value, end of period (x) | $13.45 | $15.05 | $16.28 | $11.48 | $12.07 |
| Total return (%) (r)(s)(t)(x) | (3.51) | 3.02 | 44.17 | (3.04) | (1.62) |
| Ratios (%) (to average net assets) and Supplemental data: | |||||
| Expenses before expense reductions | 0.86 | 0.86 | 0.86 | 0.91 | 0.90 |
| Expenses after expense reductions | 0.74 | 0.74 | 0.74 | 0.74 | 0.74 |
| Net investment income (loss) | 1.41 | 1.17 | 1.48 | 1.96 | 1.83 |
| Portfolio turnover | 51 | 49 | 57 | 45 | 43 |
| Net assets at end of period (000 omitted) | $22,380 | $17,572 | $68,612 | $52,735 | $51,642 |
| Class B | Year ended | ||||
| 5/31/23 | 5/31/22 | 5/31/21 | 5/31/20 | 5/31/19 | |
| Net asset value, beginning of period | $14.85 | $16.28 | $11.46 | $12.07 | $12.81 |
| Income (loss) from investment operations | |||||
| Net investment income (loss) (d) | $0.09 | $0.09 | $0.10 | $0.15 | $0.14 |
| Net realized and unrealized gain (loss) | (0.68) | 0.28 | 4.82 | (0.59) | (0.45) |
| Total from investment operations | $(0.59) | $0.37 | $4.92 | $(0.44) | $(0.31) |
| Less distributions declared to shareholders | |||||
| From net investment income | $(0.08) | $(0.10) | $(0.10) | $(0.17) | $(0.12) |
| From net realized gain | (0.97) | (1.70) | — | — | (0.31) |
| Total distributions declared to shareholders | $(1.05) | $(1.80) | $(0.10) | $(0.17) | $(0.43) |
| Net asset value, end of period (x) | $13.21 | $14.85 | $16.28 | $11.46 | $12.07 |
| Total return (%) (r)(s)(t)(x) | (4.29) | 2.32 | 43.10 | (3.87) | (2.26) |
| Ratios (%) (to average net assets) and Supplemental data: | |||||
| Expenses before expense reductions | 1.61 | 1.60 | 1.61 | 1.65 | 1.64 |
| Expenses after expense reductions | 1.49 | 1.49 | 1.49 | 1.49 | 1.49 |
| Net investment income (loss) | 0.67 | 0.56 | 0.73 | 1.20 | 1.08 |
| Portfolio turnover | 51 | 49 | 57 | 45 | 43 |
| Net assets at end of period (000 omitted) | $560 | $439 | $140 | $132 | $163 |
| Class C | Year ended | ||||
| 5/31/23 | 5/31/22 | 5/31/21 | 5/31/20 | 5/31/19 | |
| Net asset value, beginning of period | $14.78 | $16.22 | $11.45 | $12.05 | $12.76 |
| Income (loss) from investment operations | |||||
| Net investment income (loss) (d) | $0.09 | $0.08 | $0.10 | $0.15 | $0.14 |
| Net realized and unrealized gain (loss) | (0.67) | 0.28 | 4.81 | (0.58) | (0.46) |
| Total from investment operations | $(0.58) | $0.36 | $4.91 | $(0.43) | $(0.32) |
| Less distributions declared to shareholders | |||||
| From net investment income | $(0.04) | $(0.10) | $(0.14) | $(0.17) | $(0.08) |
| From net realized gain | (0.97) | (1.70) | — | — | (0.31) |
| Total distributions declared to shareholders | $(1.01) | $(1.80) | $(0.14) | $(0.17) | $(0.39) |
| Net asset value, end of period (x) | $13.19 | $14.78 | $16.22 | $11.45 | $12.05 |
| Total return (%) (r)(s)(t)(x) | (4.20) | 2.29 | 43.08 | (3.76) | (2.32) |
| Ratios (%) (to average net assets) and Supplemental data: | |||||
| Expenses before expense reductions | 1.61 | 1.61 | 1.61 | 1.66 | 1.65 |
| Expenses after expense reductions | 1.49 | 1.49 | 1.49 | 1.49 | 1.49 |
| Net investment income (loss) | 0.67 | 0.53 | 0.72 | 1.20 | 1.07 |
| Portfolio turnover | 51 | 49 | 57 | 45 | 43 |
| Net assets at end of period (000 omitted) | $966 | $974 | $873 | $456 | $470 |
| Class I | Year ended | ||||
| 5/31/23 | 5/31/22 | 5/31/21 | 5/31/20 | 5/31/19 | |
| Net asset value, beginning of period | $14.93 | $16.37 | $11.54 | $12.13 | $12.91 |
| Income (loss) from investment operations | |||||
| Net investment income (loss) (d) | $0.23 | $0.25 | $0.24 | $0.28 | $0.27 |
| Net realized and unrealized gain (loss) | (0.67) | 0.27 | 4.84 | (0.58) | (0.48) |
| Total from investment operations | $(0.44) | $0.52 | $5.08 | $(0.30) | $(0.21) |
| Less distributions declared to shareholders | |||||
| From net investment income | $(0.17) | $(0.26) | $(0.25) | $(0.29) | $(0.26) |
| From net realized gain | (0.97) | (1.70) | — | — | (0.31) |
| Total distributions declared to shareholders | $(1.14) | $(1.96) | $(0.25) | $(0.29) | $(0.57) |
| Net asset value, end of period (x) | $13.35 | $14.93 | $16.37 | $11.54 | $12.13 |
| Total return (%) (r)(s)(t)(x) | (3.24) | 3.25 | 44.51 | (2.84) | (1.37) |
| Ratios (%) (to average net assets) and Supplemental data: | |||||
| Expenses before expense reductions | 0.61 | 0.61 | 0.61 | 0.65 | 0.65 |
| Expenses after expense reductions | 0.49 | 0.49 | 0.49 | 0.49 | 0.49 |
| Net investment income (loss) | 1.67 | 1.61 | 1.70 | 2.18 | 2.14 |
| Portfolio turnover | 51 | 49 | 57 | 45 | 43 |
| Net assets at end of period (000 omitted) | $52,655 | $56,857 | $1,517 | $488 | $923 |
| Class R1 | Year ended | ||||
| 5/31/23 | 5/31/22 | 5/31/21 | 5/31/20 | 5/31/19 | |
| Net asset value, beginning of period | $14.84 | $16.22 | $11.45 | $12.05 | $12.81 |
| Income (loss) from investment operations | |||||
| Net investment income (loss) (d) | $0.20 | $0.20 | $0.10 | $0.15 | $0.14 |
| Net realized and unrealized gain (loss) | (0.67) | 0.28 | 4.80 | (0.58) | (0.47) |
| Total from investment operations | $(0.47) | $0.48 | $4.90 | $(0.43) | $(0.33) |
| Less distributions declared to shareholders | |||||
| From net investment income | $(0.14) | $(0.16) | $(0.13) | $(0.17) | $(0.12) |
| From net realized gain | (0.97) | (1.70) | — | — | (0.31) |
| Total distributions declared to shareholders | $(1.11) | $(1.86) | $(0.13) | $(0.17) | $(0.43) |
| Net asset value, end of period (x) | $13.26 | $14.84 | $16.22 | $11.45 | $12.05 |
| Total return (%) (r)(s)(t)(x) | (3.49) | 3.04 | 43.07 | (3.79) | (2.35) |
| Ratios (%) (to average net assets) and Supplemental data: | |||||
| Expenses before expense reductions | 0.86 | 0.86 | 1.61 | 1.65 | 1.64 |
| Expenses after expense reductions | 0.74 | 0.74 | 1.49 | 1.49 | 1.49 |
| Net investment income (loss) | 1.42 | 1.27 | 0.72 | 1.21 | 1.09 |
| Portfolio turnover | 51 | 49 | 57 | 45 | 43 |
| Net assets at end of period (000 omitted) | $88 | $92 | $89 | $62 | $65 |
| Class R2 | Year ended | ||||
| 5/31/23 | 5/31/22 | 5/31/21 | 5/31/20 | 5/31/19 | |
| Net asset value, beginning of period | $14.89 | $16.31 | $11.50 | $12.10 | $12.87 |
| Income (loss) from investment operations | |||||
| Net investment income (loss) (d) | $0.16 | $0.16 | $0.17 | $0.21 | $0.20 |
| Net realized and unrealized gain (loss) | (0.68) | 0.29 | 4.83 | (0.57) | (0.47) |
| Total from investment operations | $(0.52) | $0.45 | $5.00 | $(0.36) | $(0.27) |
| Less distributions declared to shareholders | |||||
| From net investment income | $(0.10) | $(0.17) | $(0.19) | $(0.24) | $(0.19) |
| From net realized gain | (0.97) | (1.70) | — | — | (0.31) |
| Total distributions declared to shareholders | $(1.07) | $(1.87) | $(0.19) | $(0.24) | $(0.50) |
| Net asset value, end of period (x) | $13.30 | $14.89 | $16.31 | $11.50 | $12.10 |
| Total return (%) (r)(s)(t)(x) | (3.79) | 2.81 | 43.83 | (3.31) | (1.85) |
| Ratios (%) (to average net assets) and Supplemental data: | |||||
| Expenses before expense reductions | 1.11 | 1.11 | 1.11 | 1.16 | 1.14 |
| Expenses after expense reductions | 0.99 | 0.99 | 0.99 | 0.99 | 0.99 |
| Net investment income (loss) | 1.17 | 1.03 | 1.23 | 1.71 | 1.59 |
| Portfolio turnover | 51 | 49 | 57 | 45 | 43 |
| Net assets at end of period (000 omitted) | $105 | $111 | $104 | $77 | $78 |
| Class R3 | Year ended | ||||
| 5/31/23 | 5/31/22 | 5/31/21 | 5/31/20 | 5/31/19 | |
| Net asset value, beginning of period | $14.90 | $16.36 | $11.53 | $12.13 | $12.90 |
| Income (loss) from investment operations | |||||
| Net investment income (loss) (d) | $0.20 | $0.21 | $0.20 | $0.25 | $0.23 |
| Net realized and unrealized gain (loss) | (0.67) | 0.27 | 4.85 | (0.58) | (0.47) |
| Total from investment operations | $(0.47) | $0.48 | $5.05 | $(0.33) | $(0.24) |
| Less distributions declared to shareholders | |||||
| From net investment income | $(0.14) | $(0.24) | $(0.22) | $(0.27) | $(0.22) |
| From net realized gain | (0.97) | (1.70) | — | — | (0.31) |
| Total distributions declared to shareholders | $(1.11) | $(1.94) | $(0.22) | $(0.27) | $(0.53) |
| Net asset value, end of period (x) | $13.32 | $14.90 | $16.36 | $11.53 | $12.13 |
| Total return (%) (r)(s)(t)(x) | (3.48) | 3.02 | 44.17 | (3.09) | (1.64) |
| Ratios (%) (to average net assets) and Supplemental data: | |||||
| Expenses before expense reductions | 0.86 | 0.86 | 0.86 | 0.90 | 0.90 |
| Expenses after expense reductions | 0.74 | 0.74 | 0.74 | 0.74 | 0.74 |
| Net investment income (loss) | 1.43 | 1.33 | 1.48 | 1.93 | 1.77 |
| Portfolio turnover | 51 | 49 | 57 | 45 | 43 |
| Net assets at end of period (000 omitted) | $292 | $312 | $103 | $71 | $122 |
| Class R4 | Year ended | ||||
| 5/31/23 | 5/31/22 | 5/31/21 | 5/31/20 | 5/31/19 | |
| Net asset value, beginning of period | $14.96 | $16.37 | $11.54 | $12.14 | $12.91 |
| Income (loss) from investment operations | |||||
| Net investment income (loss) (d) | $0.23 | $0.24 | $0.23 | $0.28 | $0.27 |
| Net realized and unrealized gain (loss) | (0.68) | 0.30 | 4.85 | (0.58) | (0.48) |
| Total from investment operations | $(0.45) | $0.54 | $5.08 | $(0.30) | $(0.21) |
| Less distributions declared to shareholders | |||||
| From net investment income | $(0.17) | $(0.25) | $(0.25) | $(0.30) | $(0.25) |
| From net realized gain | (0.97) | (1.70) | — | — | (0.31) |
| Total distributions declared to shareholders | $(1.14) | $(1.95) | $(0.25) | $(0.30) | $(0.56) |
| Net asset value, end of period (x) | $13.37 | $14.96 | $16.37 | $11.54 | $12.14 |
| Total return (%) (r)(s)(t)(x) | (3.29) | 3.38 | 44.52 | (2.86) | (1.33) |
| Ratios (%) (to average net assets) and Supplemental data: | |||||
| Expenses before expense reductions | 0.61 | 0.61 | 0.61 | 0.66 | 0.64 |
| Expenses after expense reductions | 0.49 | 0.49 | 0.49 | 0.49 | 0.49 |
| Net investment income (loss) | 1.67 | 1.53 | 1.73 | 2.21 | 2.09 |
| Portfolio turnover | 51 | 49 | 57 | 45 | 43 |
| Net assets at end of period (000 omitted) | $94 | $97 | $94 | $65 | $67 |
| Class R6 | Year ended | ||||
| 5/31/23 | 5/31/22 | 5/31/21 | 5/31/20 | 5/31/19 | |
| Net asset value, beginning of period | $14.97 | $16.39 | $11.56 | $12.15 | $12.92 |
| Income (loss) from investment operations | |||||
| Net investment income (loss) (d) | $0.25 | $0.25 | $0.25 | $0.29 | $0.28 |
| Net realized and unrealized gain (loss) | (0.68) | 0.29 | 4.85 | (0.57) | (0.47) |
| Total from investment operations | $(0.43) | $0.54 | $5.10 | $(0.28) | $(0.19) |
| Less distributions declared to shareholders | |||||
| From net investment income | $(0.18) | $(0.26) | $(0.27) | $(0.31) | $(0.27) |
| From net realized gain | (0.97) | (1.70) | — | — | (0.31) |
| Total distributions declared to shareholders | $(1.15) | $(1.96) | $(0.27) | $(0.31) | $(0.58) |
| Net asset value, end of period (x) | $13.39 | $14.97 | $16.39 | $11.56 | $12.15 |
| Total return (%) (r)(s)(t)(x) | (3.15) | 3.41 | 44.57 | (2.69) | (1.23) |
| Ratios (%) (to average net assets) and Supplemental data: | |||||
| Expenses before expense reductions | 0.53 | 0.52 | 0.52 | 0.56 | 0.55 |
| Expenses after expense reductions | 0.42 | 0.40 | 0.40 | 0.39 | 0.39 |
| Net investment income (loss) | 1.75 | 1.61 | 1.83 | 2.32 | 2.18 |
| Portfolio turnover | 51 | 49 | 57 | 45 | 43 |
| Net assets at end of period (000 omitted) | $161,572 | $162,638 | $190,875 | $140,463 | $121,952 |
| (d) | Per share data is based on average shares outstanding. |
| (r) | Certain expenses have been reduced without which performance would have been lower. |
| (s) | From time to time the fund may receive proceeds from litigation settlements, without which performance would be lower. |
| (t) | Total returns do not include any applicable sales charges. |
| (x) | The net asset values and total returns have been calculated on net assets which include adjustments made in accordance with U.S. generally accepted accounting principles required at period end for financial reporting purposes. |
| Financial Instruments | Level 1 | Level 2 | Level 3 | Total |
| Equity Securities | $232,859,707 | $— | $— | $232,859,707 |
| Mutual Funds | 4,733,746 | — | — | 4,733,746 |
| Total | $237,593,453 | $— | $— | $237,593,453 |
| Year ended 5/31/23 | Year ended 5/31/22 | |
| Ordinary income (including any short-term capital gains) | $2,885,952 | $10,329,068 |
| Long-term capital gains | 15,782,456 | 18,400,124 |
| Total distributions | $18,668,408 | $28,729,192 |
| As of 5/31/23 | |
| Cost of investments | $205,077,223 |
| Gross appreciation | 42,526,909 |
| Gross depreciation | (10,010,679) |
| Net unrealized appreciation (depreciation) | $32,516,230 |
| Undistributed ordinary income | 1,225,143 |
| Undistributed long-term capital gain | 2,785,619 |
| Total distributable earnings (loss) | $36,526,992 |
| Year ended 5/31/23 | Year ended 5/31/22 | ||
| Class A | $1,702,275 | $1,156,935 | |
| Class B | 51,663 | 16,608 | |
| Class C | 74,390 | 95,418 | |
| Class I | 4,077,217 | 7,070,348 | |
| Class R1 | 6,830 | 10,209 | |
| Class R2 | 8,091 | 11,959 | |
| Class R3 | 22,761 | 45,837 | |
| Class R4 | 7,428 | 11,200 | |
| Class R6 | 12,717,753 | 20,310,678 | |
| Total | $18,668,408 | $28,729,192 |
| Up to $1 billion | 0.40% |
| In excess of $1 billion and up to $2.5 billion | 0.375% |
| In excess of $2.5 billion | 0.35% |
| Classes | ||||||||
| A | B | C | I | R1 | R2 | R3 | R4 | R6 |
| 0.74% | 1.49% | 1.49% | 0.49% | 1.49% | 0.99% | 0.74% | 0.49% | 0.45% |
| Distribution Fee Rate (d) | Service Fee Rate (d) | Total Distribution Plan (d) | Annual Effective Rate (e) | Distribution and Service Fee | |
| Class A | — | 0.25% | 0.25% | 0.25% | $ 53,570 |
| Class B | 0.75% | 0.25% | 1.00% | 1.00% | 6,388 |
| Class C | 0.75% | 0.25% | 1.00% | 1.00% | 10,334 |
| Class R1 | 0.75% | 0.25% | 1.00% | 0.25% | 222 |
| Class R2 | 0.25% | 0.25% | 0.50% | 0.50% | 542 |
| Class R3 | — | 0.25% | 0.25% | 0.25% | 738 |
| Total Distribution and Service Fees | $71,794 |
| (d) | In accordance with the distribution plan for certain classes, the fund pays distribution and/or service fees equal to these annual percentage rates of each class’s average daily net assets. The distribution and service fee rates disclosed by class represent the current rates in effect at the end of the reporting period. Any rate changes, if applicable, are detailed below. |
| (e) | The annual effective rates represent actual fees incurred under the distribution plan for the year ended May 31, 2023 based on each class's average daily net assets. MFD has voluntarily agreed to rebate a portion of each class's 0.25% service fee attributable to accounts for which there is no financial intermediary specified on the account except for accounts attributable to MFS or its affiliates' seed money. For the year ended May 31, 2023, this rebate amounted to $4 for Class A shares and is included in the reduction of total expenses in the Statement of Operations. For the year ended May 31, 2023, the 0.75% distribution fee was not imposed for Class R1 shares due to the sales charge limitations contained in Financial Industry Regulatory Authority (“FINRA”) Rule 2341. |
| Amount | |
| Class A | $616 |
| Class B | 46 |
| Class C | 179 |
| Year ended 5/31/23 | Year ended 5/31/22 | ||||
| Shares | Amount | Shares | Amount | ||
| Shares sold | |||||
| Class A | 770,879 | $10,811,714 | 808,927 | $12,548,262 | |
| Class B | 21,626 | 303,132 | 20,726 | 309,690 | |
| Class C | 26,304 | 361,743 | 23,721 | 360,431 | |
| Class I | 878,349 | 12,025,859 | 4,029,472 | 66,121,385 | |
| Class R2 | 157 | 2,202 | 367 | 5,664 | |
| Class R3 | 2,051 | 28,718 | 18,330 | 313,928 | |
| Class R6 | 2,685,051 | 37,204,139 | 779,380 | 12,264,658 | |
| 4,384,417 | $60,737,507 | 5,680,923 | $91,924,018 | ||
| Shares issued to shareholders in reinvestment of distributions | |||||
| Class A | 119,667 | $1,677,732 | 75,079 | $1,123,177 | |
| Class B | 3,738 | 51,663 | 1,121 | 16,608 | |
| Class C | 5,394 | 74,390 | 6,472 | 95,418 | |
| Class I | 293,325 | 4,077,217 | 476,760 | 7,070,348 | |
| Class R1 | 494 | 6,830 | 693 | 10,209 | |
| Class R2 | 583 | 8,091 | 809 | 11,959 | |
| Class R3 | 1,640 | 22,761 | 3,094 | 45,837 | |
| Class R4 | 534 | 7,428 | 754 | 11,193 | |
| Class R6 | 912,976 | 12,717,753 | 1,366,802 | 20,310,678 | |
| 1,338,351 | $18,643,865 | 1,931,584 | $28,695,427 | ||
| Shares reacquired | |||||
| Class A | (394,392) | $(5,494,184) | (3,932,274) | $(64,548,934) | |
| Class B | (12,540) | (168,987) | (905) | (13,815) | |
| Class C | (24,340) | (332,301) | (18,089) | (280,448) | |
| Class I | (1,034,400) | (14,545,941) | (791,836) | (12,255,820) | |
| Class R2 | (299) | (4,100) | (106) | (1,738) | |
| Class R3 | (2,706) | (37,862) | (6,831) | (102,978) | |
| Class R6 | (2,389,612) | (33,052,862) | (2,928,911) | (46,373,038) | |
| (3,858,289) | $(53,636,237) | (7,678,952) | $(123,576,771) | ||
| Year ended 5/31/23 | Year ended 5/31/22 | ||||
| Shares | Amount | Shares | Amount | ||
| Net change | |||||
| Class A | 496,154 | $6,995,262 | (3,048,268) | $(50,877,495) | |
| Class B | 12,824 | 185,808 | 20,942 | 312,483 | |
| Class C | 7,358 | 103,832 | 12,104 | 175,401 | |
| Class I | 137,274 | 1,557,135 | 3,714,396 | 60,935,913 | |
| Class R1 | 494 | 6,830 | 693 | 10,209 | |
| Class R2 | 441 | 6,193 | 1,070 | 15,885 | |
| Class R3 | 985 | 13,617 | 14,593 | 256,787 | |
| Class R4 | 534 | 7,428 | 754 | 11,193 | |
| Class R6 | 1,208,415 | 16,869,030 | (782,729) | (13,797,702) | |
| 1,864,479 | $25,745,135 | (66,445) | $(2,957,326) | ||
respectively, of the value of outstanding voting shares of the fund. In addition, the MFS Lifetime 2065 Fund was the owner of record of less than 1% of the value of outstanding voting shares of the fund.
| Affiliated Issuers | Beginning Value | Purchases | Sales Proceeds | Realized Gain (Loss) | Change in Unrealized Appreciation or Depreciation | Ending Value |
| MFS Institutional Money Market Portfolio | $2,413,907 | $51,047,662 | $48,725,699 | $(1,533) | $(591) | $4,733,746 |
| Affiliated Issuers | Dividend Income | Capital Gain Distributions |
| MFS Institutional Money Market Portfolio | $107,684 | $— |
MFS Blended Research Value Equity Fund:
July 14, 2023
| Name, Age | Position(s) Held with Fund | Trustee/Officer Since(h) | Number of MFS Funds overseen by the Trustee | Principal Occupations During the Past Five Years | Other Directorships During the Past Five Years (j) | |||||
| INTERESTED TRUSTEE | ||||||||||
| Michael W. Roberge (k) (age 56) | Trustee | January 2021 | 136 | Massachusetts Financial Services Company, Chairman (since January 2021); Chief Executive Officer (since January 2017); Director; Chairman of the Board (since January 2022); President (until December 2018); Chief Investment Officer (until December 2018) | N/A | |||||
| INDEPENDENT TRUSTEES | ||||||||||
| John P. Kavanaugh (age 68) | Trustee and Chair of Trustees | January 2009 | 136 | Private investor | N/A | |||||
| Steven E. Buller (age 71) | Trustee | February 2014 | 136 | Private investor | N/A | |||||
| John A. Caroselli (age 69) | Trustee | March 2017 | 136 | Private investor; JC Global Advisors, LLC (management consulting), President (since 2015) | N/A | |||||
| Maureen R. Goldfarb (age 68) | Trustee | January 2009 | 136 | Private investor | N/A | |||||
| Peter D. Jones (age 67) | Trustee | January 2019 | 136 | Private investor | N/A | |||||
| James W. Kilman, Jr. (age 62) | Trustee | January 2019 | 136 | Burford Capital Limited (finance and investment management), Senior Advisor (since May 3, 2021), Chief Financial Officer (2019 - May 2, 2021); KielStrand Capital LLC (family office), Chief Executive Officer (since 2016) | Alpha-En Corporation, Director (2016-2019) |
| Name, Age | Position(s) Held with Fund | Trustee/Officer Since(h) | Number of MFS Funds overseen by the Trustee | Principal Occupations During the Past Five Years | Other Directorships During the Past Five Years (j) | |||||
| Clarence Otis, Jr. (age 67) | Trustee | March 2017 | 136 | Private investor | VF Corporation, Director; Verizon Communications, Inc., Director; The Travelers Companies, Director | |||||
| Maryanne L. Roepke (age 67) | Trustee | May 2014 | 136 | Private investor | N/A | |||||
| Laurie J. Thomsen (age 65) | Trustee | March 2005 | 136 | Private investor | The Travelers Companies, Director; Dycom Industries, Inc., Director |
| Name, Age | Position(s) Held with Fund | Trustee/Officer Since(h) | Number of MFS Funds for which the Person is an Officer | Principal Occupations During the Past Five Years | ||||
| OFFICERS | ||||||||
| Christopher R. Bohane (k) (age 49) | Assistant Secretary and Assistant Clerk | July 2005 | 136 | Massachusetts Financial Services Company, Senior Vice President and Senior Managing Counsel | ||||
| Kino Clark (k) (age 55) | Assistant Treasurer | January 2012 | 136 | Massachusetts Financial Services Company, Vice President | ||||
| John W. Clark, Jr. (k) (age 56) | Assistant Treasurer | April 2017 | 136 | Massachusetts Financial Services Company, Vice President | ||||
| David L. DiLorenzo (k) (age 54) | President | July 2005 | 136 | Massachusetts Financial Services Company, Senior Vice President | ||||
| Heidi W. Hardin (k) (age 55) | Secretary and Clerk | April 2017 | 136 | Massachusetts Financial Services Company, Executive Vice President and General Counsel | ||||
| Brian E. Langenfeld (k) (age 50) | Assistant Secretary and Assistant Clerk | June 2006 | 136 | Massachusetts Financial Services Company, Vice President and Managing Counsel |
| Name, Age | Position(s) Held with Fund | Trustee/Officer Since(h) | Number of MFS Funds for which the Person is an Officer | Principal Occupations During the Past Five Years | ||||
| Rosa E. Licea-Mailloux (k) (age 46) | Chief Compliance Officer | March 2022 | 136 | Massachusetts Financial Services Company, Vice President (since 2018); Director of Corporate Compliance (2018-2021), Senior Director Compliance (2021-2022), Senior Managing Director of North American Compliance & Chief Compliance Officer (since March 2022); Natixis Investment Managers (investment management), Funds Chief Compliance Officer, Deputy General Counsel & Senior Vice President (until 2018) | ||||
| Amanda S. Mooradian (k) (age 44) | Assistant Secretary and Assistant Clerk | September 2018 | 136 | Massachusetts Financial Services Company, Assistant Vice President and Senior Counsel | ||||
| Susan A. Pereira (k) (age 52) | Assistant Secretary and Assistant Clerk | July 2005 | 136 | Massachusetts Financial Services Company, Vice President and Managing Counsel | ||||
| Kasey L. Phillips (k) (age 52) | Assistant Treasurer | September 2012 | 136 | Massachusetts Financial Services Company, Vice President | ||||
| Matthew A. Stowe (k) (age 48) | Assistant Secretary and Assistant Clerk | October 2014 | 136 | Massachusetts Financial Services Company, Vice President and Senior Managing Counsel | ||||
| William B. Wilson (k) (age 40) | Assistant Secretary and Assistant Clerk | October 2022 | 136 | Massachusetts Financial Services Company, Assistant Vice President and Senior Counsel | ||||
| James O. Yost (k) (age 63) | Treasurer | September 1990 | 136 | Massachusetts Financial Services Company, Senior Vice President |
| (h) | Date first appointed to serve as Trustee/Officer of an MFS Fund. Each Trustee has served continuously since appointment unless indicated otherwise. From January 2012 through December 2016, Messrs. DiLorenzo and Yost served as Treasurer and Deputy Treasurer of the Funds, respectively. |
| (j) | Directorships or trusteeships of companies required to report to the Securities and Exchange Commission (i.e., “public companies”). |
| (k) | “Interested person” of the Trust within the meaning of the Investment Company Act of 1940 (referred to as the 1940 Act), which is the principal federal law governing investment companies like the fund, as a result of a position with MFS. The address of MFS is 111 Huntington Avenue, Boston, Massachusetts 02199-7618. |
| Investment Adviser | Custodian |
| Massachusetts Financial Services Company 111 Huntington Avenue Boston, MA 02199-7618 | State Street Bank and Trust Company 1 Congress Street, Suite 1 Boston, MA 02114-2016 |
| Distributor | Independent Registered Public Accounting Firm |
| MFS Fund Distributors, Inc. 111 Huntington Avenue Boston, MA 02199-7618 | Deloitte & Touche LLP 200 Berkeley Street Boston, MA 02116 |
| Portfolio Manager(s) | |
| Jim Fallon Matt Krummell Jonathan Sage Jed Stocks |
| FACTS | WHAT DOES MFS DO WITH YOUR PERSONAL INFORMATION? |
| Why? | Financial companies choose how they share your personal information. Federal law gives consumers the right to limit some but not all sharing. Federal law also requires us to tell you how we collect, share, and protect your personal information. Please read this notice carefully to understand what we do. |
| What? | The types of personal information we collect and share depend on the product or service you have with us. This information can include: |
| • Social Security number and account balances | |
| • Account transactions and transaction history | |
| • Checking account information and wire transfer instructions | |
| When you are no longer our customer, we continue to share your information as described in this notice. |
| How? | All financial companies need to share customers' personal information to run their everyday business. In the section below, we list the reasons financial companies can share their customers' personal information; the reasons MFS chooses to share; and whether you can limit this sharing. |
| Reasons we can share your personal information | Does MFS share? | Can you limit this sharing? |
| For our everyday business purposes – such as to process your transactions, maintain your account(s), respond to court orders and legal investigations, or report to credit bureaus | Yes | No |
| For our marketing purposes – to offer our products and services to you | No | We don't share |
| For joint marketing with other financial companies | No | We don't share |
| For our affiliates' everyday business purposes – information about your transactions and experiences | No | We don't share |
| For our affiliates' everyday business purposes – information about your creditworthiness | No | We don't share |
| For nonaffiliates to market to you | No | We don't share |
| Questions? | Call 800-225-2606 or go to mfs.com. |

| Who we are | |
| Who is providing this notice? | MFS Funds, MFS Investment Management, MFS Institutional Advisors, Inc., and MFS Heritage Trust Company. |
| What we do | |
| How does MFS protect my personal information? | To protect your personal information from unauthorized access and use, we use security measures that comply with federal law. These measures include procedural, electronic, and physical safeguards for the protection of the personal information we collect about you. |
| How does MFS collect my personal information? | We collect your personal information, for example, when you |
| • open an account or provide account information | |
| • direct us to buy securities or direct us to sell your securities | |
| • make a wire transfer | |
| We also collect your personal information from others, such as credit bureaus, affiliates, or other companies. | |
| Why can't I limit all sharing? | Federal law gives you the right to limit only |
| • sharing for affiliates' everyday business purposes – information about your creditworthiness | |
| • affiliates from using your information to market to you | |
| • sharing for nonaffiliates to market to you | |
| State laws and individual companies may give you additional rights to limit sharing. | |
| Definitions | |
| Affiliates | Companies related by common ownership or control. They can be financial and nonfinancial companies. |
| • MFS does not share personal information with affiliates, except for everyday business purposes as described on page one of this notice. | |
| Nonaffiliates | Companies not related by common ownership or control. They can be financial and nonfinancial companies. |
| • MFS does not share with nonaffiliates so they can market to you. | |
| Joint marketing | A formal agreement between nonaffiliated financial companies that together market financial products or services to you. |
| • MFS doesn't jointly market. | |
| Other important information |
| If you own an MFS product or receive an MFS service in the name of a third party such as a bank or broker-dealer, their privacy policy may apply to you instead of ours. |


Mid Cap Equity Fund

Mid Cap Equity Fund
| 1 | |
| 2 | |
| 5 | |
| 8 | |
| 10 | |
| 17 | |
| 19 | |
| 20 | |
| 21 | |
| 30 | |
| 41 | |
| 43 | |
| 47 | |
| 48 | |
| 48 | |
| 48 | |
| 48 | |
| 48 | |
| 50 |
| back cover |

| Cadence Design Systems, Inc. | 2.1% |
| Gartner, Inc. | 1.9% |
| Ameriprise Financial, Inc. | 1.8% |
| Builders FirstSource, Inc. | 1.8% |
| McKesson Corp. | 1.7% |
| PG&E Corp. | 1.6% |
| Hartford Financial Services Group, Inc. | 1.6% |
| Biogen, Inc. | 1.5% |
| Ingersoll Rand, Inc. | 1.5% |
| Simon Property Group, Inc., REIT | 1.5% |
| Industrials | 16.2% |
| Information Technology | 15.9% |
| Financials | 14.4% |
| Consumer Discretionary | 12.8% |
| Health Care | 11.3% |
| Real Estate | 6.9% |
| Utilities | 6.0% |
| Materials | 4.9% |
| Energy | 3.9% |
| Communication Services | 3.3% |
| Consumer Staples | 2.9% |
| (g) | The Global Industry Classification Standard (GICS®) was developed by and/or is the exclusive property of MSCI, Inc. and S&P Global Market Intelligence Inc. (“S&P Global Market Intelligence”). GICS is a service mark of MSCI and S&P Global Market Intelligence and has been licensed for use by MFS. MFS has applied its own internal sector/industry classification methodology for equity securities and non-equity securities that are unclassified by GICS. |
| (b) | Security is not a benchmark constituent. |
| (h) | Security was not held in the portfolio at period end. |

| Share Class | Class Inception Date | 1-yr | 5-yr | Life (t) |
| A | 8/19/16 | (4.30)% | 6.50% | 8.29% |
| B | 8/19/16 | (5.01)% | 5.70% | 7.47% |
| C | 8/19/16 | (4.98)% | 5.69% | 7.48% |
| I | 8/19/16 | (4.07)% | 6.75% | 8.55% |
| R1 | 8/19/16 | (5.00)% | 5.71% | 7.48% |
| R2 | 8/19/16 | (4.52)% | 6.23% | 8.01% |
| R3 | 8/19/16 | (4.33)% | 6.51% | 8.29% |
| R4 | 8/19/16 | (4.08)% | 6.75% | 8.55% |
| R6 | 8/19/16 | (3.97)% | 6.87% | 8.64% |
| Russell Midcap® Index (f) | (4.51)% | 6.88% | 8.39% |
| A With Initial Sales Charge (5.75%) | (9.80)% | 5.24% | 7.35% |
| B With CDSC (Declining over six years from 4% to 0%) (v) | (8.66)% | 5.40% | 7.47% |
| C With CDSC (1% for 12 months) (v) | (5.89)% | 5.69% | 7.48% |
| (f) | Source: FactSet Research Systems Inc. |
| (t) | For the period from the class inception date through the stated period end. (See Notes to Performance Summary.) |
| (v) | Assuming redemption at the end of the applicable period. |
| (h) | Frank Russell Company (“Russell”) is the source and owner of the trademarks, service marks, and copyrights related to the Russell Indexes. Russell® is a trademark of Frank Russell Company. Neither Russell nor its licensors accept any liability for any errors or omissions in the Russell Indexes and/or Russell ratings or underlying data and no party may rely on any Russell Indexes and/or Russell ratings and/or underlying data contained in this document. No further distribution of Russell Data is permitted without Russell's express written consent. Russell does not promote, sponsor, or endorse the content of this document. |
December 1, 2022 through May 31, 2023
| Share Class | Annualized Expense Ratio | Beginning Account Value 12/01/22 | Ending Account Value 5/31/23 | Expenses Paid During Period (p) 12/01/22-5/31/23 | |
| A | Actual | 0.84% | $1,000.00 | $953.18 | $4.09 |
| Hypothetical (h) | 0.84% | $1,000.00 | $1,020.74 | $4.23 | |
| B | Actual | 1.59% | $1,000.00 | $949.13 | $7.73 |
| Hypothetical (h) | 1.59% | $1,000.00 | $1,017.00 | $8.00 | |
| C | Actual | 1.59% | $1,000.00 | $949.43 | $7.73 |
| Hypothetical (h) | 1.59% | $1,000.00 | $1,017.00 | $8.00 | |
| I | Actual | 0.59% | $1,000.00 | $953.92 | $2.87 |
| Hypothetical (h) | 0.59% | $1,000.00 | $1,021.99 | $2.97 | |
| R1 | Actual | 1.59% | $1,000.00 | $949.25 | $7.73 |
| Hypothetical (h) | 1.59% | $1,000.00 | $1,017.00 | $8.00 | |
| R2 | Actual | 1.09% | $1,000.00 | $951.66 | $5.30 |
| Hypothetical (h) | 1.09% | $1,000.00 | $1,019.50 | $5.49 | |
| R3 | Actual | 0.84% | $1,000.00 | $952.83 | $4.09 |
| Hypothetical (h) | 0.84% | $1,000.00 | $1,020.74 | $4.23 | |
| R4 | Actual | 0.59% | $1,000.00 | $953.82 | $2.87 |
| Hypothetical (h) | 0.59% | $1,000.00 | $1,021.99 | $2.97 | |
| R6 | Actual | 0.49% | $1,000.00 | $954.10 | $2.39 |
| Hypothetical (h) | 0.49% | $1,000.00 | $1,022.49 | $2.47 |
| (h) | 5% class return per year before expenses. |
| (p) | “Expenses Paid During Period” are equal to each class’s annualized expense ratio, as shown above, multiplied by the average account value over the period, multiplied by 182/365 (to reflect the one-half year period). Expenses paid do not include any applicable sales charges (loads). If these transaction costs had been included, your costs would have been higher. |
| Issuer | Shares/Par | Value ($) | ||
| Common Stocks – 98.5% | ||||
| Aerospace & Defense – 1.9% | ||||
| CACI International, Inc., “A” (a) | 12,962 | $3,878,490 | ||
| Textron, Inc. | 88,723 | 5,489,292 | ||
| $9,367,782 | ||||
| Airlines – 0.8% | ||||
| United Airlines Holdings, Inc. (a) | 81,286 | $3,858,240 | ||
| Automotive – 1.5% | ||||
| Aptiv PLC (a) | 21,934 | $1,931,947 | ||
| Lear Corp. | 7,333 | 899,466 | ||
| LKQ Corp. | 37,249 | 1,964,885 | ||
| Visteon Corp. (a) | 18,158 | 2,425,545 | ||
| $7,221,843 | ||||
| Biotechnology – 2.2% | ||||
| Biogen, Inc. (a) | 25,244 | $7,482,574 | ||
| Exelixis, Inc. (a) | 159,047 | 3,066,426 | ||
| $10,549,000 | ||||
| Broadcasting – 1.6% | ||||
| Fox Corp. | 34,732 | $1,014,522 | ||
| Omnicom Group, Inc. | 78,261 | 6,901,837 | ||
| $7,916,359 | ||||
| Brokerage & Asset Managers – 1.3% | ||||
| Raymond James Financial, Inc. | 67,925 | $6,137,024 | ||
| Business Services – 4.8% | ||||
| Amdocs Ltd. | 36,088 | $3,398,407 | ||
| CoStar Group, Inc. (a) | 7,407 | 588,116 | ||
| Dropbox, Inc. (a) | 223,767 | 5,151,116 | ||
| GoDaddy, Inc. (a) | 70,184 | 5,150,102 | ||
| TriNet Group, Inc. (a) | 53,378 | 4,743,703 | ||
| WEX, Inc. (a) | 24,772 | 4,108,436 | ||
| $23,139,880 | ||||
| Chemicals – 0.7% | ||||
| Avient Corp. | 92,502 | $3,376,323 | ||
| Issuer | Shares/Par | Value ($) | ||
| Common Stocks – continued | ||||
| Computer Software – 4.1% | ||||
| Atlassian Corp. (a) | 10,254 | $1,853,821 | ||
| Cadence Design Systems, Inc. (a) | 43,468 | 10,037,196 | ||
| CrowdStrike Holdings, Inc. (a) | 35,666 | 5,711,197 | ||
| Dun & Bradstreet Holdings, Inc. | 36,336 | 363,360 | ||
| Paylocity Holding Corp. (a) | 12,646 | 2,184,596 | ||
| $20,150,170 | ||||
| Computer Software - Systems – 2.2% | ||||
| Box, Inc., “A” (a) | 133,315 | $3,755,484 | ||
| Dell Technologies, Inc. | 58,442 | 2,618,786 | ||
| Western Digital Corp. (a) | 19,503 | 755,351 | ||
| Zebra Technologies Corp., “A” (a) | 13,004 | 3,414,460 | ||
| $10,544,081 | ||||
| Construction – 1.7% | ||||
| Beacon Roofing Supply, Inc. (a) | 58,166 | $3,719,134 | ||
| Eagle Materials, Inc. | 12,553 | 2,045,260 | ||
| GMS, Inc. (a) | 8,655 | 548,121 | ||
| Masco Corp. | 4,118 | 198,982 | ||
| Toll Brothers, Inc. | 28,809 | 1,950,370 | ||
| $8,461,867 | ||||
| Consumer Services – 1.5% | ||||
| Expedia Group, Inc. (a) | 63,513 | $6,078,829 | ||
| TripAdvisor, Inc. (a) | 72,850 | 1,133,546 | ||
| $7,212,375 | ||||
| Electrical Equipment – 2.0% | ||||
| AMETEK, Inc. | 21,017 | $3,048,936 | ||
| Amphenol Corp., “A” | 12,746 | 961,686 | ||
| nVent Electric PLC | 66,505 | 2,884,987 | ||
| Sensata Technologies Holding PLC | 37,799 | 1,569,414 | ||
| Vertiv Holdings Co. | 53,102 | 1,024,869 | ||
| $9,489,892 | ||||
| Electronics – 4.6% | ||||
| Advanced Energy Industries, Inc. | 2,859 | $280,611 | ||
| Amkor Technology, Inc. | 132,016 | 3,271,356 | ||
| Cirrus Logic, Inc. (a) | 26,708 | 2,074,677 | ||
| Corning, Inc. | 194,343 | 5,987,708 | ||
| Lam Research Corp. | 8,089 | 4,988,486 | ||
| Monolithic Power Systems, Inc. | 3,281 | 1,607,395 | ||
| Silicon Laboratories, Inc. (a) | 28,434 | 3,999,811 | ||
| $22,210,044 | ||||
| Issuer | Shares/Par | Value ($) | ||
| Common Stocks – continued | ||||
| Energy - Independent – 2.6% | ||||
| Phillips 66 | 75,071 | $6,877,254 | ||
| Valero Energy Corp. | 54,692 | 5,854,232 | ||
| $12,731,486 | ||||
| Energy - Renewables – 0.8% | ||||
| AES Corp. | 111,928 | $2,209,459 | ||
| Enphase Energy, Inc. (a) | 8,403 | 1,461,113 | ||
| $3,670,572 | ||||
| Engineering - Construction – 0.2% | ||||
| EMCOR Group, Inc. | 6,691 | $1,102,944 | ||
| Food & Beverages – 2.8% | ||||
| Archer Daniels Midland Co. | 80,266 | $5,670,793 | ||
| Cal-Maine Foods, Inc. | 21,751 | 1,034,260 | ||
| Coca-Cola Consolidated, Inc. | 1,432 | 947,612 | ||
| Hostess Brands, Inc. (a) | 30,105 | 749,012 | ||
| Post Holdings, Inc. (a) | 56,417 | 4,793,188 | ||
| Tyson Foods, Inc., “A” | 12,414 | 628,645 | ||
| $13,823,510 | ||||
| Gaming & Lodging – 2.4% | ||||
| Hyatt Hotels Corp. | 8,853 | $951,520 | ||
| International Game Technology PLC | 228,018 | 5,593,282 | ||
| Las Vegas Sands Corp. (a) | 54,687 | 3,014,894 | ||
| Marriott International, Inc., “A” | 4,381 | 735,088 | ||
| Penn Entertainment, Inc. (a) | 57,863 | 1,448,890 | ||
| $11,743,674 | ||||
| General Merchandise – 0.6% | ||||
| Dillard's, Inc., “A” | 10,381 | $2,857,993 | ||
| Insurance – 7.5% | ||||
| Ameriprise Financial, Inc. | 29,399 | $8,774,719 | ||
| Equitable Holdings, Inc. | 227,351 | 5,579,193 | ||
| Everest Re Group Ltd. | 19,189 | 6,524,644 | ||
| Hartford Financial Services Group, Inc. | 109,813 | 7,524,387 | ||
| Reinsurance Group of America, Inc. | 10,791 | 1,510,740 | ||
| Voya Financial, Inc. | 93,417 | 6,333,673 | ||
| $36,247,356 | ||||
| Internet – 1.9% | ||||
| Gartner, Inc. (a) | 26,873 | $9,213,677 | ||
| Issuer | Shares/Par | Value ($) | ||
| Common Stocks – continued | ||||
| Leisure & Toys – 3.3% | ||||
| Brunswick Corp. | 68,419 | $5,165,634 | ||
| Electronic Arts, Inc. | 32,983 | 4,221,824 | ||
| Polaris, Inc. | 41,849 | 4,507,556 | ||
| Roblox Corp., “A” (a) | 48,007 | 2,009,573 | ||
| $15,904,587 | ||||
| Machinery & Tools – 5.9% | ||||
| AGCO Corp. | 18,854 | $2,079,219 | ||
| Ingersoll Rand, Inc. | 127,656 | 7,232,989 | ||
| Kennametal, Inc. | 42,121 | 1,049,655 | ||
| Mueller Industries, Inc. | 9,912 | 736,065 | ||
| RB Global, Inc. | 110,953 | 5,778,432 | ||
| Terex Corp. | 29,683 | 1,376,401 | ||
| Timken Co. | 89,551 | 6,407,374 | ||
| Wabtec Corp. | 40,831 | 3,782,176 | ||
| $28,442,311 | ||||
| Major Banks – 1.2% | ||||
| Regions Financial Corp. | 37,371 | $645,397 | ||
| State Street Corp. | 77,030 | 5,239,581 | ||
| $5,884,978 | ||||
| Medical & Health Technology & Services – 5.3% | ||||
| Cardinal Health, Inc. | 36,002 | $2,962,964 | ||
| IQVIA Holdings, Inc. (a) | 20,558 | 4,048,076 | ||
| McKesson Corp. | 21,336 | 8,338,962 | ||
| Medpace Holdings, Inc. (a) | 27,974 | 5,789,779 | ||
| Syneos Health, Inc. (a) | 49,114 | 2,043,142 | ||
| Veeva Systems, Inc. (a) | 14,218 | 2,355,923 | ||
| $25,538,846 | ||||
| Medical Equipment – 2.9% | ||||
| Agilent Technologies, Inc. | 2,632 | $304,444 | ||
| Align Technology, Inc. (a) | 20,064 | 5,671,290 | ||
| Hologic, Inc. (a) | 84,281 | 6,648,928 | ||
| Maravai Lifesciences Holdings, Inc., “A” (a) | 129,044 | 1,656,925 | ||
| $14,281,587 | ||||
| Metals & Mining – 1.7% | ||||
| Reliance Steel & Aluminum Co. | 13,166 | $3,089,797 | ||
| United States Steel Corp. | 247,200 | 5,171,424 | ||
| $8,261,221 | ||||
| Issuer | Shares/Par | Value ($) | ||
| Common Stocks – continued | ||||
| Natural Gas - Distribution – 0.9% | ||||
| UGI Corp. | 164,030 | $4,587,919 | ||
| Natural Gas - Pipeline – 0.5% | ||||
| Cheniere Energy, Inc. | 18,896 | $2,641,094 | ||
| Network & Telecom – 0.3% | ||||
| Motorola Solutions, Inc. | 4,865 | $1,371,541 | ||
| Oil Services – 0.8% | ||||
| NOV, Inc. | 269,985 | $3,798,689 | ||
| Other Banks & Diversified Financials – 3.6% | ||||
| Columbia Banking System, Inc. | 71,205 | $1,426,236 | ||
| East West Bancorp, Inc. | 116,211 | 5,560,697 | ||
| SLM Corp. | 414,850 | 6,330,611 | ||
| Synchrony Financial | 24,576 | 760,873 | ||
| Zions Bancorporation NA (l) | 124,187 | 3,389,063 | ||
| $17,467,480 | ||||
| Pharmaceuticals – 0.9% | ||||
| Organon & Co. | 223,535 | $4,334,344 | ||
| Pollution Control – 0.8% | ||||
| Republic Services, Inc. | 27,116 | $3,840,439 | ||
| Real Estate – 6.5% | ||||
| EPR Properties, REIT | 12,376 | $516,203 | ||
| Extra Space Storage, Inc., REIT | 3,239 | 467,291 | ||
| Host Hotels & Resorts, Inc., REIT | 184,294 | 3,059,280 | ||
| Life Storage, Inc., REIT | 41,450 | 5,280,316 | ||
| National Storage Affiliates Trust, REIT | 67,812 | 2,482,597 | ||
| NNN REIT, Inc. | 123,172 | 5,239,737 | ||
| Phillips Edison & Co., REIT | 90,293 | 2,619,400 | ||
| Simon Property Group, Inc., REIT | 68,040 | 7,154,406 | ||
| Spirit Realty Capital, Inc., REIT | 17,885 | 698,588 | ||
| VICI Properties, Inc., REIT | 126,398 | 3,909,490 | ||
| $31,427,308 | ||||
| Restaurants – 1.4% | ||||
| Texas Roadhouse, Inc. | 61,547 | $6,640,921 | ||
| Specialty Chemicals – 2.0% | ||||
| Chemours Co. | 213,718 | $5,661,390 | ||
| Corteva, Inc. | 79,987 | 4,278,504 | ||
| $9,939,894 | ||||
| Issuer | Shares/Par | Value ($) | ||
| Common Stocks – continued | ||||
| Specialty Stores – 5.1% | ||||
| AutoZone, Inc. (a) | 2,283 | $5,449,156 | ||
| Builders FirstSource, Inc. (a) | 74,062 | 8,587,489 | ||
| Etsy, Inc. (a) | 7,508 | 608,523 | ||
| O'Reilly Automotive, Inc. (a) | 7,473 | 6,750,435 | ||
| Ulta Beauty, Inc. (a) | 8,061 | 3,303,640 | ||
| $24,699,243 | ||||
| Telecommunications - Wireless – 0.5% | ||||
| SBA Communications Corp., REIT | 10,506 | $2,330,021 | ||
| Telephone Services – 0.1% | ||||
| Altice USA, Inc., “A” (a) | 275,092 | $704,236 | ||
| Trucking – 0.5% | ||||
| Saia, Inc. (a) | 8,275 | $2,351,424 | ||
| Utilities - Electric Power – 4.6% | ||||
| CenterPoint Energy, Inc. | 11,104 | $313,244 | ||
| DTE Energy Co. | 6,646 | 715,110 | ||
| Edison International | 103,982 | 7,020,865 | ||
| PG&E Corp. (a) | 456,316 | 7,729,993 | ||
| Vistra Corp. | 270,018 | 6,472,331 | ||
| $22,251,543 | ||||
| Total Common Stocks (Identified Cost, $448,383,630) | $477,725,718 | |||
| Investment Companies (h) – 1.1% | ||||
| Money Market Funds – 1.1% | ||||
| MFS Institutional Money Market Portfolio, 4.88% (v) (Identified Cost, $5,415,960) | 5,415,960 | $5,415,418 | ||
| Collateral for Securities Loaned – 0.4% | ||||
| JPMorgan U.S. Government Money Market Fund - Class IM Shares, 5.06% (j) (Identified Cost, $1,831,744) | 1,831,744 | $1,831,744 | ||
| Other Assets, Less Liabilities – (0.0)% | (29,444) | |||
| Net Assets – 100.0% | $484,943,436 | |||
| (a) | Non-income producing security. | |||
| (h) | An affiliated issuer, which may be considered one in which the fund owns 5% or more of the outstanding voting securities, or a company which is under common control. At period end, the aggregate values of the fund's investments in affiliated issuers and in unaffiliated issuers were $5,415,418 and $479,557,462, respectively. | |||
| (j) | The rate quoted is the annualized seven-day yield of the fund at period end. | |||
| (l) | A portion of this security is on loan. See Note 2 for additional information. |
| (v) | Affiliated issuer that is available only to investment companies managed by MFS. The rate quoted for the MFS Institutional Money Market Portfolio is the annualized seven-day yield of the fund at period end. |
| The following abbreviations are used in this report and are defined: | |
| REIT | Real Estate Investment Trust |
| Assets | |
| Investments in unaffiliated issuers, at value, including $1,694,518 of securities on loan (identified cost, $450,215,374) | $479,557,462 |
| Investments in affiliated issuers, at value (identified cost, $5,415,960) | 5,415,418 |
| Receivables for | |
| Fund shares sold | 1,245,865 |
| Interest and dividends | 799,106 |
| Receivable from investment adviser | 46,659 |
| Other assets | 1,492 |
| Total assets | $487,066,002 |
| Liabilities | |
| Payables for | |
| Fund shares reacquired | $151,461 |
| Collateral for securities loaned, at value | 1,831,744 |
| Payable to affiliates | |
| Administrative services fee | 441 |
| Shareholder servicing costs | 50,842 |
| Distribution and service fees | 726 |
| Payable for independent Trustees' compensation | 13 |
| Accrued expenses and other liabilities | 87,339 |
| Total liabilities | $2,122,566 |
| Net assets | $484,943,436 |
| Net assets consist of | |
| Paid-in capital | $460,306,485 |
| Total distributable earnings (loss) | 24,636,951 |
| Net assets | $484,943,436 |
| Shares of beneficial interest outstanding | 43,025,609 |
| Net assets | Shares outstanding | Net asset value per share (a) | |
| Class A | $32,605,080 | 2,883,696 | $11.31 |
| Class B | 197,460 | 17,754 | 11.12 |
| Class C | 4,180,475 | 377,058 | 11.09 |
| Class I | 119,155,205 | 10,592,161 | 11.25 |
| Class R1 | 132,062 | 11,870 | 11.13 |
| Class R2 | 415,627 | 37,111 | 11.20 |
| Class R3 | 1,050,614 | 93,559 | 11.23 |
| Class R4 | 854,409 | 75,808 | 11.27 |
| Class R6 | 326,352,504 | 28,936,592 | 11.28 |
| (a) | Maximum offering price per share was equal to the net asset value per share for all share classes, except for Class A, for which the maximum offering price per share was $12.00 [100 / 94.25 x $11.31]. On sales of $50,000 or more, the maximum offering price of Class A shares is reduced. A contingent deferred sales charge may be imposed on redemptions of Class A, Class B, and Class C shares. Redemption price per share was equal to the net asset value per share for Classes I, R1, R2, R3, R4, and R6. |
| Net investment income (loss) | |
| Income | |
| Dividends | $8,086,858 |
| Dividends from affiliated issuers | 153,575 |
| Other | 37,571 |
| Income on securities loaned | 2,514 |
| Foreign taxes withheld | (4,494) |
| Total investment income | $8,276,024 |
| Expenses | |
| Management fee | $2,300,643 |
| Distribution and service fees | 111,565 |
| Shareholder servicing costs | 173,791 |
| Administrative services fee | 80,551 |
| Independent Trustees' compensation | 9,456 |
| Custodian fee | 34,607 |
| Shareholder communications | 19,116 |
| Audit and tax fees | 62,730 |
| Legal fees | 2,187 |
| Miscellaneous | 164,768 |
| Total expenses | $2,959,414 |
| Fees paid indirectly | (40) |
| Reduction of expenses by investment adviser | (442,401) |
| Net expenses | $2,516,973 |
| Net investment income (loss) | $5,759,051 |
| Realized and unrealized gain (loss) | |
| Realized gain (loss) (identified cost basis) | |
| Unaffiliated issuers | $(3,816,506) |
| Affiliated issuers | (2,109) |
| Net realized gain (loss) | $(3,818,615) |
| Change in unrealized appreciation or depreciation | |
| Unaffiliated issuers | $(19,276,903) |
| Affiliated issuers | (542) |
| Translation of assets and liabilities in foreign currencies | (7) |
| Net unrealized gain (loss) | $(19,277,452) |
| Net realized and unrealized gain (loss) | $(23,096,067) |
| Change in net assets from operations | $(17,337,016) |
| Year ended | ||
| 5/31/23 | 5/31/22 | |
| Change in net assets | ||
| From operations | ||
| Net investment income (loss) | $5,759,051 | $4,066,017 |
| Net realized gain (loss) | (3,818,615) | 58,379,846 |
| Net unrealized gain (loss) | (19,277,452) | (61,160,411) |
| Change in net assets from operations | $(17,337,016) | $1,285,452 |
| Total distributions to shareholders | $(23,206,375) | $(78,786,915) |
| Change in net assets from fund share transactions | $65,820,929 | $86,053,579 |
| Total change in net assets | $25,277,538 | $8,552,116 |
| Net assets | ||
| At beginning of period | 459,665,898 | 451,113,782 |
| At end of period | $484,943,436 | $459,665,898 |
| Class A | Year ended | ||||
| 5/31/23 | 5/31/22 | 5/31/21 | 5/31/20 | 5/31/19 | |
| Net asset value, beginning of period | $12.38 | $15.36 | $10.70 | $11.14 | $12.07 |
| Income (loss) from investment operations | |||||
| Net investment income (loss) (d) | $0.11 | $0.07 | $0.08 | $0.10 | $0.11 |
| Net realized and unrealized gain (loss) | (0.62) | (0.05)(g) | 4.68 | 0.02 | (0.27) |
| Total from investment operations | $(0.51) | $0.02 | $4.76 | $0.12 | $(0.16) |
| Less distributions declared to shareholders | |||||
| From net investment income | $(0.11) | $— | $(0.10) | $(0.10) | $(0.09) |
| From net realized gain | (0.45) | (3.00) | (0.00)(w) | (0.46) | (0.68) |
| Total distributions declared to shareholders | $(0.56) | $(3.00) | $(0.10) | $(0.56) | $(0.77) |
| Net asset value, end of period (x) | $11.31 | $12.38 | $15.36 | $10.70 | $11.14 |
| Total return (%) (r)(s)(t)(x) | (4.30) | (1.00) | 44.61 | 0.51 | (0.52) |
| Ratios (%) (to average net assets) and Supplemental data: | |||||
| Expenses before expense reductions (f) | 0.94 | 0.94 | 0.92 | 0.96 | 0.97 |
| Expenses after expense reductions (f) | 0.84 | 0.84 | 0.84 | 0.84 | 0.84 |
| Net investment income (loss) | 0.96 | 0.45 | 0.58 | 0.89 | 0.96 |
| Portfolio turnover | 67 | 89 | 103 | 81 | 80 |
| Net assets at end of period (000 omitted) | $32,605 | $19,061 | $133,584 | $74,843 | $74,051 |
| Class B | Year ended | ||||
| 5/31/23 | 5/31/22 | 5/31/21 | 5/31/20 | 5/31/19 | |
| Net asset value, beginning of period | $12.17 | $15.26 | $10.64 | $11.08 | $12.03 |
| Income (loss) from investment operations | |||||
| Net investment income (loss) (d) | $0.02 | $(0.01) | $(0.02) | $0.02 | $0.02 |
| Net realized and unrealized gain (loss) | (0.61) | (0.08) | 4.65 | 0.01 | (0.26) |
| Total from investment operations | $(0.59) | $(0.09) | $4.63 | $0.03 | $(0.24) |
| Less distributions declared to shareholders | |||||
| From net investment income | $(0.01) | $(0.00)(w) | $(0.01) | $(0.01) | $(0.03) |
| From net realized gain | (0.45) | (3.00) | (0.00)(w) | (0.46) | (0.68) |
| Total distributions declared to shareholders | $(0.46) | $(3.00) | $(0.01) | $(0.47) | $(0.71) |
| Net asset value, end of period (x) | $11.12 | $12.17 | $15.26 | $10.64 | $11.08 |
| Total return (%) (r)(s)(t)(x) | (5.01) | (1.78) | 43.56 | (0.23) | (1.27) |
| Ratios (%) (to average net assets) and Supplemental data: | |||||
| Expenses before expense reductions (f) | 1.69 | 1.70 | 1.67 | 1.71 | 1.72 |
| Expenses after expense reductions (f) | 1.59 | 1.59 | 1.59 | 1.59 | 1.59 |
| Net investment income (loss) | 0.20 | (0.05) | (0.16) | 0.15 | 0.21 |
| Portfolio turnover | 67 | 89 | 103 | 81 | 80 |
| Net assets at end of period (000 omitted) | $197 | $236 | $126 | $92 | $99 |
| Class C | Year ended | ||||
| 5/31/23 | 5/31/22 | 5/31/21 | 5/31/20 | 5/31/19 | |
| Net asset value, beginning of period | $12.16 | $15.25 | $10.64 | $11.10 | $12.03 |
| Income (loss) from investment operations | |||||
| Net investment income (loss) (d) | $0.03 | $0.01 | $(0.02) | $0.02 | $0.02 |
| Net realized and unrealized gain (loss) | (0.62) | (0.09) | 4.64 | 0.01 | (0.25) |
| Total from investment operations | $(0.59) | $(0.08) | $4.62 | $0.03 | $(0.23) |
| Less distributions declared to shareholders | |||||
| From net investment income | $(0.03) | $(0.01) | $(0.01) | $(0.03) | $(0.02) |
| From net realized gain | (0.45) | (3.00) | (0.00)(w) | (0.46) | (0.68) |
| Total distributions declared to shareholders | $(0.48) | $(3.01) | $(0.01) | $(0.49) | $(0.70) |
| Net asset value, end of period (x) | $11.09 | $12.16 | $15.25 | $10.64 | $11.10 |
| Total return (%) (r)(s)(t)(x) | (4.98) | (1.74) | 43.49 | (0.28) | (1.27) |
| Ratios (%) (to average net assets) and Supplemental data: | |||||
| Expenses before expense reductions (f) | 1.69 | 1.70 | 1.66 | 1.71 | 1.72 |
| Expenses after expense reductions (f) | 1.59 | 1.59 | 1.59 | 1.59 | 1.59 |
| Net investment income (loss) | 0.23 | 0.11 | (0.16) | 0.16 | 0.21 |
| Portfolio turnover | 67 | 89 | 103 | 81 | 80 |
| Net assets at end of period (000 omitted) | $4,180 | $3,161 | $350 | $138 | $109 |
| Class I | Year ended | ||||
| 5/31/23 | 5/31/22 | 5/31/21 | 5/31/20 | 5/31/19 | |
| Net asset value, beginning of period | $12.31 | $15.38 | $10.71 | $11.16 | $12.11 |
| Income (loss) from investment operations | |||||
| Net investment income (loss) (d) | $0.14 | $0.15 | $0.11 | $0.13 | $0.14 |
| Net realized and unrealized gain (loss) | (0.62) | (0.08) | 4.68 | 0.02 | (0.28) |
| Total from investment operations | $(0.48) | $0.07 | $4.79 | $0.15 | $(0.14) |
| Less distributions declared to shareholders | |||||
| From net investment income | $(0.13) | $(0.14) | $(0.12) | $(0.14) | $(0.13) |
| From net realized gain | (0.45) | (3.00) | (0.00)(w) | (0.46) | (0.68) |
| Total distributions declared to shareholders | $(0.58) | $(3.14) | $(0.12) | $(0.60) | $(0.81) |
| Net asset value, end of period (x) | $11.25 | $12.31 | $15.38 | $10.71 | $11.16 |
| Total return (%) (r)(s)(t)(x) | (4.07) | (0.73) | 44.98 | 0.71 | (0.30) |
| Ratios (%) (to average net assets) and Supplemental data: | |||||
| Expenses before expense reductions (f) | 0.69 | 0.71 | 0.67 | 0.71 | 0.71 |
| Expenses after expense reductions (f) | 0.59 | 0.59 | 0.59 | 0.59 | 0.59 |
| Net investment income (loss) | 1.22 | 1.07 | 0.84 | 1.18 | 1.26 |
| Portfolio turnover | 67 | 89 | 103 | 81 | 80 |
| Net assets at end of period (000 omitted) | $119,155 | $108,560 | $5,410 | $4,368 | $2,336 |
| Class R1 | Year ended | ||||
| 5/31/23 | 5/31/22 | 5/31/21 | 5/31/20 | 5/31/19 | |
| Net asset value, beginning of period | $12.18 | $15.26 | $10.65 | $11.09 | $12.03 |
| Income (loss) from investment operations | |||||
| Net investment income (loss) (d) | $0.02 | $(0.01) | $(0.02) | $0.02 | $0.02 |
| Net realized and unrealized gain (loss) | (0.61) | (0.07) | 4.64 | 0.02 | (0.26) |
| Total from investment operations | $(0.59) | $(0.08) | $4.62 | $0.04 | $(0.24) |
| Less distributions declared to shareholders | |||||
| From net investment income | $(0.01) | $— | $(0.01) | $(0.02) | $(0.02) |
| From net realized gain | (0.45) | (3.00) | (0.00)(w) | (0.46) | (0.68) |
| Total distributions declared to shareholders | $(0.46) | $(3.00) | $(0.01) | $(0.48) | $(0.70) |
| Net asset value, end of period (x) | $11.13 | $12.18 | $15.26 | $10.65 | $11.09 |
| Total return (%) (r)(s)(t)(x) | (5.00) | (1.72) | 43.45 | (0.16) | (1.31) |
| Ratios (%) (to average net assets) and Supplemental data: | |||||
| Expenses before expense reductions (f) | 1.69 | 1.70 | 1.67 | 1.71 | 1.72 |
| Expenses after expense reductions (f) | 1.59 | 1.59 | 1.59 | 1.59 | 1.59 |
| Net investment income (loss) | 0.20 | (0.08) | (0.16) | 0.15 | 0.22 |
| Portfolio turnover | 67 | 89 | 103 | 81 | 80 |
| Net assets at end of period (000 omitted) | $132 | $136 | $142 | $98 | $97 |
| Class R2 | Year ended | ||||
| 5/31/23 | 5/31/22 | 5/31/21 | 5/31/20 | 5/31/19 | |
| Net asset value, beginning of period | $12.26 | $15.33 | $10.70 | $11.15 | $12.07 |
| Income (loss) from investment operations | |||||
| Net investment income (loss) (d) | $0.08 | $0.06 | $0.04 | $0.07 | $0.08 |
| Net realized and unrealized gain (loss) | (0.62) | (0.07) | 4.68 | 0.02 | (0.25) |
| Total from investment operations | $(0.54) | $(0.01) | $4.72 | $0.09 | $(0.17) |
| Less distributions declared to shareholders | |||||
| From net investment income | $(0.07) | $(0.06) | $(0.09) | $(0.08) | $(0.07) |
| From net realized gain | (0.45) | (3.00) | (0.00)(w) | (0.46) | (0.68) |
| Total distributions declared to shareholders | $(0.52) | $(3.06) | $(0.09) | $(0.54) | $(0.75) |
| Net asset value, end of period (x) | $11.20 | $12.26 | $15.33 | $10.70 | $11.15 |
| Total return (%) (r)(s)(t)(x) | (4.52) | (1.27) | 44.24 | 0.21 | (0.71) |
| Ratios (%) (to average net assets) and Supplemental data: | |||||
| Expenses before expense reductions (f) | 1.19 | 1.20 | 1.17 | 1.21 | 1.22 |
| Expenses after expense reductions (f) | 1.09 | 1.09 | 1.09 | 1.09 | 1.09 |
| Net investment income (loss) | 0.73 | 0.42 | 0.30 | 0.65 | 0.70 |
| Portfolio turnover | 67 | 89 | 103 | 81 | 80 |
| Net assets at end of period (000 omitted) | $416 | $292 | $253 | $62 | $62 |
| Class R3 | Year ended | ||||
| 5/31/23 | 5/31/22 | 5/31/21 | 5/31/20 | 5/31/19 | |
| Net asset value, beginning of period | $12.30 | $15.36 | $10.71 | $11.16 | $12.09 |
| Income (loss) from investment operations | |||||
| Net investment income (loss) (d) | $0.11 | $0.10 | $0.08 | $0.07 | $0.11 |
| Net realized and unrealized gain (loss) | (0.62) | (0.07) | 4.68 | 0.05 | (0.26) |
| Total from investment operations | $(0.51) | $0.03 | $4.76 | $0.12 | $(0.15) |
| Less distributions declared to shareholders | |||||
| From net investment income | $(0.11) | $(0.09) | $(0.11) | $(0.11) | $(0.10) |
| From net realized gain | (0.45) | (3.00) | (0.00)(w) | (0.46) | (0.68) |
| Total distributions declared to shareholders | $(0.56) | $(3.09) | $(0.11) | $(0.57) | $(0.78) |
| Net asset value, end of period (x) | $11.23 | $12.30 | $15.36 | $10.71 | $11.16 |
| Total return (%) (r)(s)(t)(x) | (4.33) | (0.94) | 44.60 | 0.51 | (0.50) |
| Ratios (%) (to average net assets) and Supplemental data: | |||||
| Expenses before expense reductions (f) | 0.94 | 0.95 | 0.92 | 1.00 | 0.97 |
| Expenses after expense reductions (f) | 0.84 | 0.82 | 0.82 | 0.84 | 0.84 |
| Net investment income (loss) | 0.92 | 0.74 | 0.62 | 0.72 | 0.95 |
| Portfolio turnover | 67 | 89 | 103 | 81 | 80 |
| Net assets at end of period (000 omitted) | $1,051 | $1,947 | $1,422 | $1,015 | $62 |
| Class R4 | Year ended | ||||
| 5/31/23 | 5/31/22 | 5/31/21 | 5/31/20 | 5/31/19 | |
| Net asset value, beginning of period | $12.33 | $15.39 | $10.72 | $11.17 | $12.11 |
| Income (loss) from investment operations | |||||
| Net investment income (loss) (d) | $0.14 | $0.13 | $0.11 | $0.13 | $0.14 |
| Net realized and unrealized gain (loss) | (0.62) | (0.06) | 4.69 | 0.02 | (0.27) |
| Total from investment operations | $(0.48) | $0.07 | $4.80 | $0.15 | $(0.13) |
| Less distributions declared to shareholders | |||||
| From net investment income | $(0.13) | $(0.13) | $(0.13) | $(0.14) | $(0.13) |
| From net realized gain | (0.45) | (3.00) | (0.00)(w) | (0.46) | (0.68) |
| Total distributions declared to shareholders | $(0.58) | $(3.13) | $(0.13) | $(0.60) | $(0.81) |
| Net asset value, end of period (x) | $11.27 | $12.33 | $15.39 | $10.72 | $11.17 |
| Total return (%) (r)(s)(t)(x) | (4.08) | (0.71) | 44.95 | 0.73 | (0.30) |
| Ratios (%) (to average net assets) and Supplemental data: | |||||
| Expenses before expense reductions (f) | 0.69 | 0.70 | 0.67 | 0.71 | 0.72 |
| Expenses after expense reductions (f) | 0.59 | 0.59 | 0.59 | 0.59 | 0.59 |
| Net investment income (loss) | 1.20 | 0.92 | 0.84 | 1.18 | 1.21 |
| Portfolio turnover | 67 | 89 | 103 | 81 | 80 |
| Net assets at end of period (000 omitted) | $854 | $934 | $953 | $685 | $63 |
| Class R6 | Year ended | ||||
| 5/31/23 | 5/31/22 | 5/31/21 | 5/31/20 | 5/31/19 | |
| Net asset value, beginning of period | $12.34 | $15.40 | $10.73 | $11.17 | $12.11 |
| Income (loss) from investment operations | |||||
| Net investment income (loss) (d) | $0.15 | $0.15 | $0.12 | $0.14 | $0.15 |
| Net realized and unrealized gain (loss) | (0.62) | (0.07) | 4.69 | 0.02 | (0.27) |
| Total from investment operations | $(0.47) | $0.08 | $4.81 | $0.16 | $(0.12) |
| Less distributions declared to shareholders | |||||
| From net investment income | $(0.14) | $(0.14) | $(0.14) | $(0.14) | $(0.14) |
| From net realized gain | (0.45) | (3.00) | (0.00)(w) | (0.46) | (0.68) |
| Total distributions declared to shareholders | $(0.59) | $(3.14) | $(0.14) | $(0.60) | $(0.82) |
| Net asset value, end of period (x) | $11.28 | $12.34 | $15.40 | $10.73 | $11.17 |
| Total return (%) (r)(s)(t)(x) | (3.97) | (0.60) | 45.02 | 0.87 | (0.17) |
| Ratios (%) (to average net assets) and Supplemental data: | |||||
| Expenses before expense reductions (f) | 0.59 | 0.59 | 0.58 | 0.61 | 0.61 |
| Expenses after expense reductions (f) | 0.49 | 0.48 | 0.51 | 0.49 | 0.48 |
| Net investment income (loss) | 1.30 | 1.04 | 0.94 | 1.25 | 1.32 |
| Portfolio turnover | 67 | 89 | 103 | 81 | 80 |
| Net assets at end of period (000 omitted) | $326,353 | $325,339 | $308,874 | $233,687 | $199,437 |
| (d) | Per share data is based on average shares outstanding. |
| (f) | Ratios do not reflect reductions from fees paid indirectly, if applicable. See Note 2 in the Notes to Financial Statements for additional information. |
| (g) | The per share amount varies from the net realized and unrealized gain/loss for the period because of the timing of sales of fund shares and the per share amount of realized and unrealized gains and losses at such time. |
| (r) | Certain expenses have been reduced without which performance would have been lower. |
| (s) | From time to time the fund may receive proceeds from litigation settlements, without which performance would be lower. |
| (t) | Total returns do not include any applicable sales charges. |
| (w) | Per share amount was less than $0.01. |
| (x) | The net asset values and total returns have been calculated on net assets which include adjustments made in accordance with U.S. generally accepted accounting principles required at period end for financial reporting purposes. |
| Financial Instruments | Level 1 | Level 2 | Level 3 | Total |
| Equity Securities | $477,725,718 | $— | $— | $477,725,718 |
| Mutual Funds | 7,247,162 | — | — | 7,247,162 |
| Total | $484,972,880 | $— | $— | $484,972,880 |
| Year ended 5/31/23 | Year ended 5/31/22 | |
| Ordinary income (including any short-term capital gains) | $5,303,209 | $27,978,081 |
| Long-term capital gains | 17,903,166 | 50,808,834 |
| Total distributions | $23,206,375 | $78,786,915 |
| As of 5/31/23 | |
| Cost of investments | $459,819,790 |
| Gross appreciation | 61,267,434 |
| Gross depreciation | (36,114,344) |
| Net unrealized appreciation (depreciation) | $25,153,090 |
| Undistributed ordinary income | 1,830,759 |
| Capital loss carryforwards | (2,346,898) |
| Total distributable earnings (loss) | $24,636,951 |
| Short-Term | $(2,346,898) |
| Year ended 5/31/23 | Year ended 5/31/22 | ||
| Class A | $1,235,139 | $3,214,828 | |
| Class B | 7,902 | 32,697 | |
| Class C | 144,472 | 81,663 | |
| Class I | 5,651,819 | 17,109,421 | |
| Class R1 | 5,152 | 27,402 | |
| Class R2 | 14,910 | 52,067 | |
| Class R3 | 105,798 | 282,530 | |
| Class R4 | 41,214 | 194,232 | |
| Class R6 | 15,999,969 | 57,792,075 | |
| Total | $23,206,375 | $78,786,915 |
| Up to $1 billion | 0.50% |
| In excess of $1 billion and up to $2.5 billion | 0.475% |
| In excess of $2.5 billion | 0.45% |
| Classes | ||||||||
| A | B | C | I | R1 | R2 | R3 | R4 | R6 |
| 0.84% | 1.59% | 1.59% | 0.59% | 1.59% | 1.09% | 0.84% | 0.59% | 0.55% |
| Classes | ||||||||
| A | B | C | I | R1 | R2 | R3 | R4 | R6 |
| 0.84% | 1.59% | 1.59% | 0.59% | 1.59% | 1.09% | 0.84% | 0.59% | 0.52% |
| Distribution Fee Rate (d) | Service Fee Rate (d) | Total Distribution Plan (d) | Annual Effective Rate (e) | Distribution and Service Fee | |
| Class A | — | 0.25% | 0.25% | 0.25% | $ 65,075 |
| Class B | 0.75% | 0.25% | 1.00% | 1.00% | 2,092 |
| Class C | 0.75% | 0.25% | 1.00% | 1.00% | 36,082 |
| Class R1 | 0.75% | 0.25% | 1.00% | 1.00% | 1,328 |
| Class R2 | 0.25% | 0.25% | 0.50% | 0.50% | 1,753 |
| Class R3 | — | 0.25% | 0.25% | 0.25% | 5,235 |
| Total Distribution and Service Fees | $111,565 |
| (d) | In accordance with the distribution plan for certain classes, the fund pays distribution and/or service fees equal to these annual percentage rates of each class’s average daily net assets. The distribution and service fee rates disclosed by class represent the current rates in effect at the end of the reporting period. Any rate changes, if applicable, are detailed below. |
| (e) | The annual effective rates represent actual fees incurred under the distribution plan for the year ended May 31, 2023 based on each class's average daily net assets. MFD has voluntarily |
for the year ended May 31, 2023.
| Amount | |
| Class A | $— |
| Class B | — |
| Class C | 460 |
| Year ended 5/31/23 | Year ended 5/31/22 | ||||
| Shares | Amount | Shares | Amount | ||
| Shares sold | |||||
| Class A | 1,661,070 | $19,482,914 | 1,577,326 | $23,567,383 | |
| Class B | 1,091 | 12,707 | 11,501 | 154,841 | |
| Class C | 283,746 | 3,222,767 | 239,049 | 3,062,382 | |
| Class I | 5,075,173 | 58,313,200 | 8,351,378 | 123,939,516 | |
| Class R1 | 285 | 3,227 | 136 | 1,787 | |
| Class R2 | 15,850 | 180,553 | 3,852 | 49,347 | |
| Class R3 | 116,587 | 1,356,266 | 74,920 | 957,641 | |
| Class R4 | 10,067 | 117,521 | 9,169 | 131,044 | |
| Class R6 | 7,056,171 | 81,272,395 | 6,125,597 | 76,232,995 | |
| 14,220,040 | $163,961,550 | 16,392,928 | $228,096,936 | ||
| Shares issued to shareholders in reinvestment of distributions | |||||
| Class A | 106,014 | $1,234,006 | 244,745 | $3,213,505 | |
| Class B | 688 | 7,902 | 2,525 | 32,697 | |
| Class C | 12,618 | 144,472 | 6,311 | 81,663 | |
| Class I | 488,489 | 5,651,819 | 1,312,072 | 17,109,421 | |
| Class R1 | 448 | 5,152 | 2,115 | 27,402 | |
| Class R2 | 1,292 | 14,910 | 3,999 | 52,067 | |
| Class R3 | 9,152 | 105,798 | 21,666 | 282,530 | |
| Class R4 | 3,556 | 41,214 | 14,872 | 194,232 | |
| Class R6 | 1,380,498 | 15,999,969 | 4,425,121 | 57,792,075 | |
| 2,002,755 | $23,205,242 | 6,033,426 | $78,785,592 | ||
| Year ended 5/31/23 | Year ended 5/31/22 | ||||
| Shares | Amount | Shares | Amount | ||
| Shares reacquired | |||||
| Class A | (423,597) | $(4,907,791) | (8,980,754) | $(141,584,500) | |
| Class B | (3,431) | (39,365) | (2,848) | (36,663) | |
| Class C | (179,237) | (2,047,693) | (8,359) | (119,910) | |
| Class I | (3,792,105) | (43,969,005) | (1,194,563) | (16,605,615) | |
| Class R1 | (3) | (30) | (397) | (5,584) | |
| Class R2 | (3,852) | (47,228) | (542) | (6,864) | |
| Class R3 | (190,559) | (2,201,902) | (30,800) | (411,638) | |
| Class R4 | (13,612) | (159,467) | (10,157) | (142,015) | |
| Class R6 | (5,873,607) | (67,973,382) | (4,229,260) | (61,916,160) | |
| (10,480,003) | $(121,345,863) | (14,457,680) | $(220,828,949) | ||
| Net change | |||||
| Class A | 1,343,487 | $15,809,129 | (7,158,683) | $(114,803,612) | |
| Class B | (1,652) | (18,756) | 11,178 | 150,875 | |
| Class C | 117,127 | 1,319,546 | 237,001 | 3,024,135 | |
| Class I | 1,771,557 | 19,996,014 | 8,468,887 | 124,443,322 | |
| Class R1 | 730 | 8,349 | 1,854 | 23,605 | |
| Class R2 | 13,290 | 148,235 | 7,309 | 94,550 | |
| Class R3 | (64,820) | (739,838) | 65,786 | 828,533 | |
| Class R4 | 11 | (732) | 13,884 | 183,261 | |
| Class R6 | 2,563,062 | 29,298,982 | 6,321,458 | 72,108,910 | |
| 5,742,792 | $65,820,929 | 7,968,674 | $86,053,579 | ||
respectively, of the value of outstanding voting shares of the fund. In addition, the MFS Lifetime 2065 Fund was the owner of record of less than 1% of the value of outstanding voting shares of the fund.
| Affiliated Issuers | Beginning Value | Purchases | Sales Proceeds | Realized Gain (Loss) | Change in Unrealized Appreciation or Depreciation | Ending Value |
| MFS Institutional Money Market Portfolio | $5,037,629 | $136,926,887 | $136,546,447 | $(2,109) | $(542) | $5,415,418 |
| Affiliated Issuers | Dividend Income | Capital Gain Distributions |
| MFS Institutional Money Market Portfolio | $153,575 | $— |
July 14, 2023
| Name, Age | Position(s) Held with Fund | Trustee/Officer Since(h) | Number of MFS Funds overseen by the Trustee | Principal Occupations During the Past Five Years | Other Directorships During the Past Five Years (j) | |||||
| INTERESTED TRUSTEE | ||||||||||
| Michael W. Roberge (k) (age 56) | Trustee | January 2021 | 136 | Massachusetts Financial Services Company, Chairman (since January 2021); Chief Executive Officer (since January 2017); Director; Chairman of the Board (since January 2022); President (until December 2018); Chief Investment Officer (until December 2018) | N/A | |||||
| INDEPENDENT TRUSTEES | ||||||||||
| John P. Kavanaugh (age 68) | Trustee and Chair of Trustees | January 2009 | 136 | Private investor | N/A | |||||
| Steven E. Buller (age 71) | Trustee | February 2014 | 136 | Private investor | N/A | |||||
| John A. Caroselli (age 69) | Trustee | March 2017 | 136 | Private investor; JC Global Advisors, LLC (management consulting), President (since 2015) | N/A | |||||
| Maureen R. Goldfarb (age 68) | Trustee | January 2009 | 136 | Private investor | N/A | |||||
| Peter D. Jones (age 67) | Trustee | January 2019 | 136 | Private investor | N/A | |||||
| James W. Kilman, Jr. (age 62) | Trustee | January 2019 | 136 | Burford Capital Limited (finance and investment management), Senior Advisor (since May 3, 2021), Chief Financial Officer (2019 - May 2, 2021); KielStrand Capital LLC (family office), Chief Executive Officer (since 2016) | Alpha-En Corporation, Director (2016-2019) |
| Name, Age | Position(s) Held with Fund | Trustee/Officer Since(h) | Number of MFS Funds overseen by the Trustee | Principal Occupations During the Past Five Years | Other Directorships During the Past Five Years (j) | |||||
| Clarence Otis, Jr. (age 67) | Trustee | March 2017 | 136 | Private investor | VF Corporation, Director; Verizon Communications, Inc., Director; The Travelers Companies, Director | |||||
| Maryanne L. Roepke (age 67) | Trustee | May 2014 | 136 | Private investor | N/A | |||||
| Laurie J. Thomsen (age 65) | Trustee | March 2005 | 136 | Private investor | The Travelers Companies, Director; Dycom Industries, Inc., Director |
| Name, Age | Position(s) Held with Fund | Trustee/Officer Since(h) | Number of MFS Funds for which the Person is an Officer | Principal Occupations During the Past Five Years | ||||
| OFFICERS | ||||||||
| Christopher R. Bohane (k) (age 49) | Assistant Secretary and Assistant Clerk | July 2005 | 136 | Massachusetts Financial Services Company, Senior Vice President and Senior Managing Counsel | ||||
| Kino Clark (k) (age 55) | Assistant Treasurer | January 2012 | 136 | Massachusetts Financial Services Company, Vice President | ||||
| John W. Clark, Jr. (k) (age 56) | Assistant Treasurer | April 2017 | 136 | Massachusetts Financial Services Company, Vice President | ||||
| David L. DiLorenzo (k) (age 54) | President | July 2005 | 136 | Massachusetts Financial Services Company, Senior Vice President | ||||
| Heidi W. Hardin (k) (age 55) | Secretary and Clerk | April 2017 | 136 | Massachusetts Financial Services Company, Executive Vice President and General Counsel | ||||
| Brian E. Langenfeld (k) (age 50) | Assistant Secretary and Assistant Clerk | June 2006 | 136 | Massachusetts Financial Services Company, Vice President and Managing Counsel |
| Name, Age | Position(s) Held with Fund | Trustee/Officer Since(h) | Number of MFS Funds for which the Person is an Officer | Principal Occupations During the Past Five Years | ||||
| Rosa E. Licea-Mailloux (k) (age 46) | Chief Compliance Officer | March 2022 | 136 | Massachusetts Financial Services Company, Vice President (since 2018); Director of Corporate Compliance (2018-2021), Senior Director Compliance (2021-2022), Senior Managing Director of North American Compliance & Chief Compliance Officer (since March 2022); Natixis Investment Managers (investment management), Funds Chief Compliance Officer, Deputy General Counsel & Senior Vice President (until 2018) | ||||
| Amanda S. Mooradian (k) (age 44) | Assistant Secretary and Assistant Clerk | September 2018 | 136 | Massachusetts Financial Services Company, Assistant Vice President and Senior Counsel | ||||
| Susan A. Pereira (k) (age 52) | Assistant Secretary and Assistant Clerk | July 2005 | 136 | Massachusetts Financial Services Company, Vice President and Managing Counsel | ||||
| Kasey L. Phillips (k) (age 52) | Assistant Treasurer | September 2012 | 136 | Massachusetts Financial Services Company, Vice President | ||||
| Matthew A. Stowe (k) (age 48) | Assistant Secretary and Assistant Clerk | October 2014 | 136 | Massachusetts Financial Services Company, Vice President and Senior Managing Counsel | ||||
| William B. Wilson (k) (age 40) | Assistant Secretary and Assistant Clerk | October 2022 | 136 | Massachusetts Financial Services Company, Assistant Vice President and Senior Counsel | ||||
| James O. Yost (k) (age 63) | Treasurer | September 1990 | 136 | Massachusetts Financial Services Company, Senior Vice President |
| (h) | Date first appointed to serve as Trustee/Officer of an MFS Fund. Each Trustee has served continuously since appointment unless indicated otherwise. From January 2012 through December 2016, Messrs. DiLorenzo and Yost served as Treasurer and Deputy Treasurer of the Funds, respectively. |
| (j) | Directorships or trusteeships of companies required to report to the Securities and Exchange Commission (i.e., “public companies”). |
| (k) | “Interested person” of the Trust within the meaning of the Investment Company Act of 1940 (referred to as the 1940 Act), which is the principal federal law governing investment companies like the fund, as a result of a position with MFS. The address of MFS is 111 Huntington Avenue, Boston, Massachusetts 02199-7618. |
| Investment Adviser | Custodian |
| Massachusetts Financial Services Company 111 Huntington Avenue Boston, MA 02199-7618 | JPMorgan Chase Bank, NA 4 Metrotech Center New York, NY 11245 |
| Distributor | Independent Registered Public Accounting Firm |
| MFS Fund Distributors, Inc. 111 Huntington Avenue Boston, MA 02199-7618 | Deloitte & Touche LLP 200 Berkeley Street Boston, MA 02116 |
| Portfolio Manager(s) | |
| Jim Fallon Matt Krummell Jonathan Sage Jed Stocks |
| FACTS | WHAT DOES MFS DO WITH YOUR PERSONAL INFORMATION? |
| Why? | Financial companies choose how they share your personal information. Federal law gives consumers the right to limit some but not all sharing. Federal law also requires us to tell you how we collect, share, and protect your personal information. Please read this notice carefully to understand what we do. |
| What? | The types of personal information we collect and share depend on the product or service you have with us. This information can include: |
| • Social Security number and account balances | |
| • Account transactions and transaction history | |
| • Checking account information and wire transfer instructions | |
| When you are no longer our customer, we continue to share your information as described in this notice. |
| How? | All financial companies need to share customers' personal information to run their everyday business. In the section below, we list the reasons financial companies can share their customers' personal information; the reasons MFS chooses to share; and whether you can limit this sharing. |
| Reasons we can share your personal information | Does MFS share? | Can you limit this sharing? |
| For our everyday business purposes – such as to process your transactions, maintain your account(s), respond to court orders and legal investigations, or report to credit bureaus | Yes | No |
| For our marketing purposes – to offer our products and services to you | No | We don't share |
| For joint marketing with other financial companies | No | We don't share |
| For our affiliates' everyday business purposes – information about your transactions and experiences | No | We don't share |
| For our affiliates' everyday business purposes – information about your creditworthiness | No | We don't share |
| For nonaffiliates to market to you | No | We don't share |
| Questions? | Call 800-225-2606 or go to mfs.com. |

| Who we are | |
| Who is providing this notice? | MFS Funds, MFS Investment Management, MFS Institutional Advisors, Inc., and MFS Heritage Trust Company. |
| What we do | |
| How does MFS protect my personal information? | To protect your personal information from unauthorized access and use, we use security measures that comply with federal law. These measures include procedural, electronic, and physical safeguards for the protection of the personal information we collect about you. |
| How does MFS collect my personal information? | We collect your personal information, for example, when you |
| • open an account or provide account information | |
| • direct us to buy securities or direct us to sell your securities | |
| • make a wire transfer | |
| We also collect your personal information from others, such as credit bureaus, affiliates, or other companies. | |
| Why can't I limit all sharing? | Federal law gives you the right to limit only |
| • sharing for affiliates' everyday business purposes – information about your creditworthiness | |
| • affiliates from using your information to market to you | |
| • sharing for nonaffiliates to market to you | |
| State laws and individual companies may give you additional rights to limit sharing. | |
| Definitions | |
| Affiliates | Companies related by common ownership or control. They can be financial and nonfinancial companies. |
| • MFS does not share personal information with affiliates, except for everyday business purposes as described on page one of this notice. | |
| Nonaffiliates | Companies not related by common ownership or control. They can be financial and nonfinancial companies. |
| • MFS does not share with nonaffiliates so they can market to you. | |
| Joint marketing | A formal agreement between nonaffiliated financial companies that together market financial products or services to you. |
| • MFS doesn't jointly market. | |
| Other important information |
| If you own an MFS product or receive an MFS service in the name of a third party such as a bank or broker-dealer, their privacy policy may apply to you instead of ours. |


| 1 | |
| 3 | |
| 6 | |
| 9 | |
| 11 | |
| 16 | |
| 18 | |
| 19 | |
| 20 | |
| 25 | |
| 35 | |
| 37 | |
| 41 | |
| 42 | |
| 42 | |
| 42 | |
| 42 | |
| 42 | |
| 43 |
| back cover |

| BNP Paribas | 2.9% |
| NatWest Group PLC | 2.7% |
| Mitsubishi UFJ Financial Group, Inc. | 2.7% |
| Roche Holding AG | 2.6% |
| Eni S.p.A. | 2.6% |
| UBS AG | 2.4% |
| Schneider Electric SE | 2.4% |
| Willis Towers Watson PLC | 2.1% |
| Henkel AG & Co. KGaA , | 2.0% |
| Glencore PLC | 2.0% |
| Financials | 25.3% |
| Industrials | 16.3% |
| Consumer Staples | 11.8% |
| Information Technology | 8.9% |
| Health Care | 7.3% |
| Energy | 6.6% |
| Consumer Discretionary | 6.5% |
| Materials | 5.9% |
| Utilities | 5.3% |
| Communication Services | 3.8% |
| United Kingdom | 24.2% |
| Japan | 14.8% |
| France | 12.7% |
| Switzerland | 8.7% |
| United States | 8.6% |
| Germany | 7.0% |
| Canada | 5.9% |
| Ireland | 3.7% |
| Spain | 3.3% |
| Other Countries | 11.1% |
| Euro | 32.6% |
| British Pound Sterling | 23.5% |
| Japanese Yen | 14.8% |
| Swiss Franc | 8.7% |
| United States Dollar | 8.6% |
| Canadian Dollar | 5.9% |
| South Korean Won | 1.4% |
| Australian Dollar | 1.3% |
| Taiwan Dollar | 0.9% |
| Other Currencies | 2.3% |
| (g) | The Global Industry Classification Standard (GICS®) was developed by and/or is the exclusive property of MSCI, Inc. and S&P Global Market Intelligence Inc. (“S&P Global Market Intelligence”). GICS is a service mark of MSCI and S&P Global Market Intelligence and has been licensed for use by MFS. MFS has applied its own internal sector/industry classification methodology for equity securities and non-equity securities that are unclassified by GICS. |
| (i) | For purposes of this presentation, the components include the value of securities, and reflect the impact of the equivalent exposure of derivative positions, if any. These amounts may be negative from time to time. Equivalent exposure is a calculated amount that translates the derivative position into a reasonable approximation of the amount of the underlying asset that the portfolio would have to hold at a given point in time to have the same price sensitivity that results from the portfolio’s ownership of the derivative contract. When dealing with derivatives, equivalent exposure is a more representative measure of the potential impact of a position on portfolio performance than value. The bond component will include any accrued interest amounts. |
| (x) | Represents the portfolio’s exposure to issuer countries as a percentage of a portfolio’s net assets. For purposes of this presentation, United States includes Cash & Cash Equivalents. |
| (y) | Represents the portfolio’s exposure to a particular currency as a percentage of a portfolio's net assets. For purposes of this presentation, United States Dollar includes Cash & Cash Equivalents. |
| (b) | Security is not a benchmark constituent. |
| (h) | Security was not held in the portfolio at period end. |
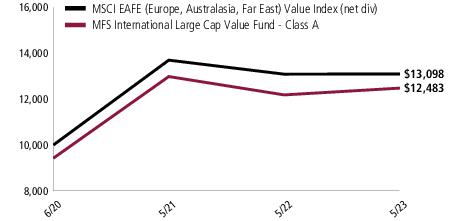
| Share Class | Class Inception Date | 1-yr | Life (t) |
| A | 6/30/20 | 2.45% | 10.10% |
| C | 6/30/20 | 1.70% | 9.25% |
| I | 6/30/20 | 2.88% | 10.43% |
| R1 | 6/30/20 | 1.76% | 9.26% |
| R2 | 6/30/20 | 2.26% | 9.78% |
| R3 | 6/30/20 | 2.51% | 10.11% |
| R4 | 6/30/20 | 2.76% | 10.45% |
| R6 | 6/30/20 | 2.76% | 10.43% |
| MSCI EAFE Value Index (net div) (f) | 0.08% | 9.68% |
| A With Initial Sales Charge (5.75%) | (3.44)% | 7.89% |
| C With CDSC (1% for 12 months) (v) | 0.71% | 9.25% |
| (f) | Source: FactSet Research Systems Inc. |
| (t) | For the period from the class inception date through the stated period end. (See Notes to Performance Summary.) |
| (v) | Assuming redemption at the end of the applicable period. |
| (e) | Morgan Stanley Capital International (“MSCI”) makes no express or implied warranties or representations and shall have no liability whatsoever with respect to any MSCI data contained herein. The MSCI data may not be further redistributed or used as a basis for other indices or any securities or financial products. This report is not approved, reviewed, or produced by MSCI. |
December 1, 2022 through May 31, 2023
| Share Class | Annualized Expense Ratio | Beginning Account Value 12/01/22 | Ending Account Value 5/31/23 | Expenses Paid During Period (p) 12/01/22-5/31/23 | |
| A | Actual | 0.96% | $1,000.00 | $1,038.74 | $4.88 |
| Hypothetical (h) | 0.96% | $1,000.00 | $1,020.14 | $4.84 | |
| C | Actual | 1.71% | $1,000.00 | $1,035.50 | $8.68 |
| Hypothetical (h) | 1.71% | $1,000.00 | $1,016.40 | $8.60 | |
| I | Actual | 0.71% | $1,000.00 | $1,040.48 | $3.61 |
| Hypothetical (h) | 0.71% | $1,000.00 | $1,021.39 | $3.58 | |
| R1 | Actual | 1.71% | $1,000.00 | $1,035.14 | $8.68 |
| Hypothetical (h) | 1.71% | $1,000.00 | $1,016.40 | $8.60 | |
| R2 | Actual | 1.21% | $1,000.00 | $1,037.60 | $6.15 |
| Hypothetical (h) | 1.21% | $1,000.00 | $1,018.90 | $6.09 | |
| R3 | Actual | 0.96% | $1,000.00 | $1,039.29 | $4.88 |
| Hypothetical (h) | 0.96% | $1,000.00 | $1,020.14 | $4.84 | |
| R4 | Actual | 0.71% | $1,000.00 | $1,040.96 | $3.61 |
| Hypothetical (h) | 0.71% | $1,000.00 | $1,021.39 | $3.58 | |
| R6 | Actual | 0.64% | $1,000.00 | $1,040.98 | $3.26 |
| Hypothetical (h) | 0.64% | $1,000.00 | $1,021.74 | $3.23 |
| (h) | 5% class return per year before expenses. |
| (p) | “Expenses Paid During Period” are equal to each class’s annualized expense ratio, as shown above, multiplied by the average account value over the period, multiplied by 182/365 (to reflect the one-half year period). Expenses paid do not include any applicable sales charges (loads). If these transaction costs had been included, your costs would have been higher. |
| Issuer | Shares/Par | Value ($) | ||
| Common Stocks – 95.7% | ||||
| Aerospace & Defense – 1.3% | ||||
| BAE Systems PLC | 3,272,428 | $37,784,579 | ||
| Dassault Aviation S.A. | 239,252 | 40,457,509 | ||
| $78,242,088 | ||||
| Airlines – 1.5% | ||||
| Ryanair Holdings PLC, ADR (a) | 814,733 | $85,612,144 | ||
| Alcoholic Beverages – 2.1% | ||||
| Diageo PLC | 1,842,423 | $76,709,294 | ||
| Kirin Holdings Co. Ltd. | 1,794,500 | 26,783,870 | ||
| Pernod Ricard S.A. | 83,701 | 18,081,483 | ||
| $121,574,647 | ||||
| Apparel Manufacturers – 1.9% | ||||
| Burberry Group PLC | 1,128,107 | $30,227,269 | ||
| Compagnie Financiere Richemont S.A. | 418,033 | 66,348,252 | ||
| Gildan Activewear, Inc. | 411,395 | 11,219,037 | ||
| $107,794,558 | ||||
| Automotive – 2.5% | ||||
| Aptiv PLC (a) | 330,456 | $29,106,565 | ||
| Compagnie Generale des Etablissements Michelin | 1,525,748 | 43,315,961 | ||
| Continental AG | 433,215 | 28,839,596 | ||
| Koito Manufacturing Co. Ltd. | 2,258,900 | 42,510,933 | ||
| $143,773,055 | ||||
| Broadcasting – 0.8% | ||||
| WPP Group PLC | 4,157,100 | $44,151,915 | ||
| Brokerage & Asset Managers – 2.6% | ||||
| Barclays PLC | 23,455,903 | $44,157,941 | ||
| Deutsche Boerse AG | 399,988 | 69,048,868 | ||
| IG Group Holdings PLC | 4,843,069 | 40,484,880 | ||
| $153,691,689 | ||||
| Business Services – 3.4% | ||||
| CGI, Inc. (a) | 381,877 | $39,552,049 | ||
| Experian PLC | 456,701 | 16,088,966 | ||
| Nomura Research Institute Ltd. | 1,739,400 | 43,820,521 | ||
| RS Group PLC | 4,203,095 | 41,649,753 | ||
| Issuer | Shares/Par | Value ($) | ||
| Common Stocks – continued | ||||
| Business Services – continued | ||||
| Secom Co. Ltd. | 825,500 | $54,130,759 | ||
| $195,242,048 | ||||
| Chemicals – 0.3% | ||||
| Nutrien Ltd. | 294,602 | $15,521,131 | ||
| Computer Software - Systems – 6.6% | ||||
| Amadeus IT Group S.A. (a) | 1,083,790 | $77,501,184 | ||
| Capgemini | 523,719 | 91,135,967 | ||
| Fujitsu Ltd. | 482,300 | 61,341,152 | ||
| Hitachi Ltd. | 1,291,400 | 74,578,176 | ||
| Samsung Electronics Co. Ltd. | 1,465,716 | 78,848,840 | ||
| $383,405,319 | ||||
| Construction – 0.6% | ||||
| Techtronic Industries Co. Ltd. | 3,943,500 | $36,587,332 | ||
| Consumer Products – 2.0% | ||||
| Haleon PLC | 7,891,301 | $31,235,733 | ||
| Reckitt Benckiser Group PLC | 1,107,267 | 86,031,454 | ||
| $117,267,187 | ||||
| Electrical Equipment – 3.2% | ||||
| Legrand S.A. | 487,947 | $46,137,777 | ||
| Schneider Electric SE | 801,498 | 138,223,400 | ||
| $184,361,177 | ||||
| Electronics – 3.1% | ||||
| Kyocera Corp. | 1,203,200 | $68,448,327 | ||
| NXP Semiconductors N.V. | 324,914 | 58,192,098 | ||
| Taiwan Semiconductor Manufacturing Co. Ltd., ADR | 516,753 | 50,946,678 | ||
| $177,587,103 | ||||
| Energy - Independent – 1.3% | ||||
| Woodside Energy Group Ltd. | 3,528,271 | $78,717,261 | ||
| Energy - Integrated – 5.3% | ||||
| Eni S.p.A. | 11,288,734 | $150,228,271 | ||
| Galp Energia SGPS S.A., “B” | 2,726,158 | 28,836,848 | ||
| Petroleo Brasileiro S.A., ADR | 2,775,119 | 28,528,223 | ||
| Suncor Energy, Inc. (l) | 2,406,486 | 67,417,063 | ||
| TotalEnergies SE | 563,228 | 31,955,986 | ||
| $306,966,391 | ||||
| Issuer | Shares/Par | Value ($) | ||
| Common Stocks – continued | ||||
| Food & Beverages – 1.4% | ||||
| Danone S.A. | 1,077,971 | $63,765,139 | ||
| Nestle S.A. | 150,618 | 17,844,284 | ||
| $81,609,423 | ||||
| Food & Drug Stores – 1.5% | ||||
| Tesco PLC | 26,957,031 | $87,454,582 | ||
| General Merchandise – 0.9% | ||||
| B&M European Value Retail S.A. | 8,059,153 | $51,108,385 | ||
| Insurance – 4.6% | ||||
| Chubb Ltd. | 131,981 | $24,522,070 | ||
| Manulife Financial Corp. | 2,755,152 | 51,043,884 | ||
| St. James's Place PLC | 5,040,676 | 69,914,391 | ||
| Willis Towers Watson PLC | 549,177 | 120,187,386 | ||
| $265,667,731 | ||||
| Leisure & Toys – 0.3% | ||||
| Nintendo Co. Ltd. | 483,600 | $20,603,981 | ||
| Machinery & Tools – 4.1% | ||||
| Aalberts Industries N.V. (l) | 728,466 | $30,756,964 | ||
| Daikin Industries Ltd. | 375,900 | 71,659,099 | ||
| Kubota Corp. | 1,155,500 | 15,981,687 | ||
| SMC Corp. | 114,200 | 61,540,542 | ||
| Toyota Industries Corp. | 545,000 | 33,719,002 | ||
| Weir Group PLC | 1,257,204 | 26,500,267 | ||
| $240,157,561 | ||||
| Major Banks – 16.1% | ||||
| ABN AMRO Group N.V., GDR | 2,425,989 | $35,279,665 | ||
| Bank of Ireland Group PLC | 10,009,599 | 94,089,296 | ||
| BNP Paribas | 2,898,713 | 167,346,438 | ||
| DBS Group Holdings Ltd. | 1,856,300 | 41,592,760 | ||
| Lloyds Banking Group PLC | 49,970,323 | 27,456,330 | ||
| Mitsubishi UFJ Financial Group, Inc. | 23,482,700 | 157,169,336 | ||
| NatWest Group PLC | 49,199,405 | 158,879,354 | ||
| Resona Holdings, Inc. | 6,140,600 | 27,920,833 | ||
| Toronto-Dominion Bank | 1,452,781 | 82,233,291 | ||
| UBS AG | 7,481,440 | 141,619,572 | ||
| $933,586,875 | ||||
| Medical & Health Technology & Services – 0.6% | ||||
| ICON PLC (a) | 165,689 | $35,296,728 | ||
| Issuer | Shares/Par | Value ($) | ||
| Common Stocks – continued | ||||
| Metals & Mining – 3.5% | ||||
| Glencore PLC | 22,368,494 | $114,487,148 | ||
| Rio Tinto PLC | 1,469,213 | 87,397,148 | ||
| $201,884,296 | ||||
| Network & Telecom – 0.4% | ||||
| LM Ericsson Telephone Co., “B” | 4,729,149 | $24,456,758 | ||
| Other Banks & Diversified Financials – 2.0% | ||||
| AIB Group PLC | 8,275,690 | $33,897,431 | ||
| Julius Baer Group Ltd. | 1,341,797 | 81,973,742 | ||
| $115,871,173 | ||||
| Pharmaceuticals – 6.7% | ||||
| Bayer AG | 1,631,514 | $90,928,266 | ||
| Novartis AG | 510,265 | 48,833,047 | ||
| Roche Holding AG | 479,278 | 151,663,925 | ||
| Sanofi | 967,159 | 98,086,588 | ||
| $389,511,826 | ||||
| Printing & Publishing – 1.7% | ||||
| RELX PLC | 1,252,428 | $39,104,020 | ||
| Wolters Kluwer N.V. | 530,153 | 60,521,482 | ||
| $99,625,502 | ||||
| Railroad & Shipping – 0.6% | ||||
| Canadian Pacific Kansas City Ltd. | 453,632 | $34,566,257 | ||
| Specialty Chemicals – 2.2% | ||||
| Linde PLC | 214,900 | $76,001,534 | ||
| Nitto Denko Corp. | 699,000 | 49,819,271 | ||
| $125,820,805 | ||||
| Telecommunications - Wireless – 2.0% | ||||
| KDDI Corp. | 1,594,200 | $49,098,957 | ||
| Vodafone Group PLC | 68,666,692 | 65,233,674 | ||
| $114,332,631 | ||||
| Telephone Services – 0.7% | ||||
| Quebecor, Inc., “B” | 1,837,127 | $43,806,852 | ||
| Tobacco – 2.7% | ||||
| British American Tobacco PLC | 1,336,245 | $42,461,460 | ||
| Imperial Brands PLC | 4,306,645 | 90,805,405 | ||
| Philip Morris International, Inc. | 283,251 | 25,495,423 | ||
| $158,762,288 | ||||
| Issuer | Shares/Par | Value ($) | ||
| Common Stocks – continued | ||||
| Utilities - Electric Power – 5.2% | ||||
| E.ON SE | 8,129,477 | $98,279,353 | ||
| Iberdrola S.A. | 9,352,626 | 113,966,050 | ||
| National Grid PLC | 6,722,186 | 92,484,420 | ||
| $304,729,823 | ||||
| Total Common Stocks (Identified Cost, $4,988,445,385) | $5,559,348,522 | |||
| Preferred Stocks – 2.0% | ||||
| Consumer Products – 2.0% | ||||
| Henkel AG & Co. KGaA (Identified Cost, $137,823,321) | 1,473,772 | $117,423,972 | ||
| Investment Companies (h) – 1.4% | ||||
| Money Market Funds – 1.4% | ||||
| MFS Institutional Money Market Portfolio, 4.88% (v) (Identified Cost, $80,478,076) | 80,478,621 | $80,470,573 | ||
| Collateral for Securities Loaned – 0.7% | ||||
| JPMorgan U.S. Government Money Market Fund - Class IM Shares, 5.06% (j) (Identified Cost, $42,558,599) | 42,558,599 | $42,558,599 | ||
| Other Assets, Less Liabilities – 0.2% | 9,471,738 | |||
| Net Assets – 100.0% | $5,809,273,404 | |||
| (a) | Non-income producing security. | |||
| (h) | An affiliated issuer, which may be considered one in which the fund owns 5% or more of the outstanding voting securities, or a company which is under common control. At period end, the aggregate values of the fund's investments in affiliated issuers and in unaffiliated issuers were $80,470,573 and $5,719,331,093, respectively. | |||
| (j) | The rate quoted is the annualized seven-day yield of the fund at period end. | |||
| (l) | A portion of this security is on loan. See Note 2 for additional information. | |||
| (v) | Affiliated issuer that is available only to investment companies managed by MFS. The rate quoted for the MFS Institutional Money Market Portfolio is the annualized seven-day yield of the fund at period end. |
| The following abbreviations are used in this report and are defined: | |
| ADR | American Depositary Receipt |
| GDR | Global Depositary Receipt |
| Assets | |
| Investments in unaffiliated issuers, at value, including $39,739,116 of securities on loan (identified cost, $5,168,827,305) | $5,719,331,093 |
| Investments in affiliated issuers, at value (identified cost, $80,478,076) | 80,470,573 |
| Cash | 2,277,399 |
| Foreign currency, at value (identified cost, $295,696) | 295,696 |
| Receivables for | |
| Fund shares sold | 6,713,931 |
| Interest and dividends | 43,626,339 |
| Other assets | 9,208 |
| Total assets | $5,852,724,239 |
| Liabilities | |
| Payables for | |
| Investments purchased | $295,641 |
| Fund shares reacquired | 36,214 |
| Collateral for securities loaned, at value | 42,558,599 |
| Payable to affiliates | |
| Investment adviser | 130,898 |
| Administrative services fee | 3,390 |
| Shareholder servicing costs | 2,267 |
| Distribution and service fees | 140 |
| Payable for independent Trustees' compensation | 13 |
| Accrued expenses and other liabilities | 423,673 |
| Total liabilities | $43,450,835 |
| Net assets | $5,809,273,404 |
| Net assets consist of | |
| Paid-in capital | $5,151,647,431 |
| Total distributable earnings (loss) | 657,625,973 |
| Net assets | $5,809,273,404 |
| Shares of beneficial interest outstanding | 467,598,786 |
| Net assets | Shares outstanding | Net asset value per share (a) | |
| Class A | $5,864,356 | 473,588 | $12.38 |
| Class C | 904,631 | 73,586 | 12.29 |
| Class I | 11,177,506 | 897,637 | 12.45 |
| Class R1 | 86,478 | 7,003 | 12.35 |
| Class R2 | 88,310 | 7,121 | 12.40 |
| Class R3 | 88,752 | 7,147 | 12.42 |
| Class R4 | 89,520 | 7,196 | 12.44 |
| Class R6 | 5,790,973,851 | 466,125,508 | 12.42 |
| (a) | Maximum offering price per share was equal to the net asset value per share for all share classes, except for Class A, for which the maximum offering price per share was $13.14 [100 / 94.25 x $12.38]. On sales of $50,000 or more, the maximum offering price of Class A shares is reduced. A contingent deferred sales charge may be imposed on redemptions of Class A and Class C shares. Redemption price per share was equal to the net asset value per share for Classes I, R1, R2, R3, R4, and R6. |
| Net investment income (loss) | |
| Income | |
| Dividends | $218,276,130 |
| Dividends from affiliated issuers | 2,342,754 |
| Income on securities loaned | 166,711 |
| Other | 3,582 |
| Foreign taxes withheld | (14,889,153) |
| Total investment income | $205,900,024 |
| Expenses | |
| Management fee | $39,342,802 |
| Distribution and service fees | 21,101 |
| Shareholder servicing costs | 19,822 |
| Administrative services fee | 664,229 |
| Independent Trustees' compensation | 88,521 |
| Custodian fee | 695,237 |
| Shareholder communications | 9,629 |
| Audit and tax fees | 64,248 |
| Legal fees | 26,323 |
| Miscellaneous | 218,963 |
| Total expenses | $41,150,875 |
| Fees paid indirectly | (10,769) |
| Reduction of expenses by investment adviser and distributor | (6,171,201) |
| Net expenses | $34,968,905 |
| Net investment income (loss) | $170,931,119 |
| Realized and unrealized gain (loss) | |
| Realized gain (loss) (identified cost basis) | |
| Unaffiliated issuers | $(14,173,944) |
| Affiliated issuers | (138) |
| Foreign currency | (2,083,675) |
| Net realized gain (loss) | $(16,257,757) |
| Change in unrealized appreciation or depreciation | |
| Unaffiliated issuers | $(19,831,550) |
| Affiliated issuers | (7,503) |
| Translation of assets and liabilities in foreign currencies | 468,424 |
| Net unrealized gain (loss) | $(19,370,629) |
| Net realized and unrealized gain (loss) | $(35,628,386) |
| Change in net assets from operations | $135,302,733 |
| Year ended | ||
| 5/31/23 | 5/31/22 | |
| Change in net assets | ||
| From operations | ||
| Net investment income (loss) | $170,931,119 | $155,423,700 |
| Net realized gain (loss) | (16,257,757) | 78,863,875 |
| Net unrealized gain (loss) | (19,370,629) | (582,365,618) |
| Change in net assets from operations | $135,302,733 | $(348,078,043) |
| Total distributions to shareholders | $(154,660,884) | $(252,705,889) |
| Change in net assets from fund share transactions | $77,790,963 | $546,188,105 |
| Total change in net assets | $58,432,812 | $(54,595,827) |
| Net assets | ||
| At beginning of period | 5,750,840,592 | 5,805,436,419 |
| At end of period | $5,809,273,404 | $5,750,840,592 |
| Class A | Year ended | ||
| 5/31/23 | 5/31/22 | 5/31/21(c) | |
| Net asset value, beginning of period | $12.41 | $13.66 | $10.00 |
| Income (loss) from investment operations | |||
| Net investment income (loss) (d) | $0.38 | $0.35 | $0.29 |
| Net realized and unrealized gain (loss) | (0.09) | (1.11) | 3.42 |
| Total from investment operations | $0.29 | $(0.76) | $3.71 |
| Less distributions declared to shareholders | |||
| From net investment income | $(0.20) | $(0.27) | $(0.05) |
| From net realized gain | (0.12) | (0.22) | (0.00)(w) |
| Total distributions declared to shareholders | $(0.32) | $(0.49) | $(0.05) |
| Net asset value, end of period (x) | $12.38 | $12.41 | $13.66 |
| Total return (%) (r)(s)(t)(x) | 2.45 | (5.74) | 37.16(n) |
| Ratios (%) (to average net assets) and Supplemental data: | |||
| Expenses before expense reductions (f) | 1.07 | 1.04 | 1.04(a) |
| Expenses after expense reductions (f) | 0.96 | 0.96 | 0.93(a) |
| Net investment income (loss) | 3.13 | 2.72 | 2.61(a) |
| Portfolio turnover | 26 | 24 | 18(n) |
| Net assets at end of period (000 omitted) | $5,864 | $2,956 | $1,187 |
| Class C | Year ended | ||
| 5/31/23 | 5/31/22 | 5/31/21(c) | |
| Net asset value, beginning of period | $12.33 | $13.61 | $10.00 |
| Income (loss) from investment operations | |||
| Net investment income (loss) (d) | $0.22 | $0.22 | $0.16 |
| Net realized and unrealized gain (loss) | (0.02) | (1.08) | 3.45 |
| Total from investment operations | $0.20 | $(0.86) | $3.61 |
| Less distributions declared to shareholders | |||
| From net investment income | $(0.12) | $(0.20) | $— |
| From net realized gain | (0.12) | (0.22) | (0.00)(w) |
| Total distributions declared to shareholders | $(0.24) | $(0.42) | $(0.00)(w) |
| Net asset value, end of period (x) | $12.29 | $12.33 | $13.61 |
| Total return (%) (r)(s)(t)(x) | 1.70 | (6.46) | 36.11(n) |
| Ratios (%) (to average net assets) and Supplemental data: | |||
| Expenses before expense reductions (f) | 1.83 | 1.78 | 1.81(a) |
| Expenses after expense reductions (f) | 1.71 | 1.71 | 1.68(a) |
| Net investment income (loss) | 1.89 | 1.69 | 1.49(a) |
| Portfolio turnover | 26 | 24 | 18(n) |
| Net assets at end of period (000 omitted) | $905 | $1,111 | $636 |
| Class I | Year ended | ||
| 5/31/23 | 5/31/22 | 5/31/21(c) | |
| Net asset value, beginning of period | $12.43 | $13.69 | $10.00 |
| Income (loss) from investment operations | |||
| Net investment income (loss) (d) | $0.39 | $0.41 | $0.31 |
| Net realized and unrealized gain (loss) | (0.05) | (1.16) | 3.44 |
| Total from investment operations | $0.34 | $(0.75) | $3.75 |
| Less distributions declared to shareholders | |||
| From net investment income | $(0.20) | $(0.29) | $(0.06) |
| From net realized gain | (0.12) | (0.22) | (0.00)(w) |
| Total distributions declared to shareholders | $(0.32) | $(0.51) | $(0.06) |
| Net asset value, end of period (x) | $12.45 | $12.43 | $13.69 |
| Total return (%) (r)(s)(t)(x) | 2.88 | (5.60) | 37.58(n) |
| Ratios (%) (to average net assets) and Supplemental data: | |||
| Expenses before expense reductions (f) | 0.82 | 0.79 | 0.79(a) |
| Expenses after expense reductions (f) | 0.71 | 0.71 | 0.68(a) |
| Net investment income (loss) | 3.28 | 3.15 | 2.82(a) |
| Portfolio turnover | 26 | 24 | 18(n) |
| Net assets at end of period (000 omitted) | $11,178 | $18,972 | $2,775 |
| Class R1 | Year ended | ||
| 5/31/23 | 5/31/22 | 5/31/21(c) | |
| Net asset value, beginning of period | $12.36 | $13.61 | $10.00 |
| Income (loss) from investment operations | |||
| Net investment income (loss) (d) | $0.24 | $0.19 | $0.09 |
| Net realized and unrealized gain (loss) | (0.04) | (1.06) | 3.52 |
| Total from investment operations | $0.20 | $(0.87) | $3.61 |
| Less distributions declared to shareholders | |||
| From net investment income | $(0.09) | $(0.16) | $— |
| From net realized gain | (0.12) | (0.22) | (0.00)(w) |
| Total distributions declared to shareholders | $(0.21) | $(0.38) | $(0.00)(w) |
| Net asset value, end of period (x) | $12.35 | $12.36 | $13.61 |
| Total return (%) (r)(s)(t)(x) | 1.76 | (6.49) | 36.11(n) |
| Ratios (%) (to average net assets) and Supplemental data: | |||
| Expenses before expense reductions (f) | 1.83 | 1.78 | 1.83(a) |
| Expenses after expense reductions (f) | 1.71 | 1.71 | 1.68(a) |
| Net investment income (loss) | 2.04 | 1.43 | 0.85(a) |
| Portfolio turnover | 26 | 24 | 18(n) |
| Net assets at end of period (000 omitted) | $86 | $85 | $91 |
| Class R2 | Year ended | ||
| 5/31/23 | 5/31/22 | 5/31/21(c) | |
| Net asset value, beginning of period | $12.41 | $13.66 | $10.00 |
| Income (loss) from investment operations | |||
| Net investment income (loss) (d) | $0.30 | $0.25 | $0.14 |
| Net realized and unrealized gain (loss) | (0.04) | (1.05) | 3.52 |
| Total from investment operations | $0.26 | $(0.80) | $3.66 |
| Less distributions declared to shareholders | |||
| From net investment income | $(0.15) | $(0.23) | $(0.00)(w) |
| From net realized gain | (0.12) | (0.22) | (0.00)(w) |
| Total distributions declared to shareholders | $(0.27) | $(0.45) | $(0.00)(w) |
| Net asset value, end of period (x) | $12.40 | $12.41 | $13.66 |
| Total return (%) (r)(s)(t)(x) | 2.26 | (6.01) | 36.63(n) |
| Ratios (%) (to average net assets) and Supplemental data: | |||
| Expenses before expense reductions (f) | 1.33 | 1.28 | 1.33(a) |
| Expenses after expense reductions (f) | 1.21 | 1.21 | 1.18(a) |
| Net investment income (loss) | 2.55 | 1.94 | 1.36(a) |
| Portfolio turnover | 26 | 24 | 18(n) |
| Net assets at end of period (000 omitted) | $88 | $86 | $92 |
| Class R3 | Year ended | ||
| 5/31/23 | 5/31/22 | 5/31/21(c) | |
| Net asset value, beginning of period | $12.43 | $13.68 | $10.00 |
| Income (loss) from investment operations | |||
| Net investment income (loss) (d) | $0.33 | $0.29 | $0.17 |
| Net realized and unrealized gain (loss) | (0.04) | (1.06) | 3.54 |
| Total from investment operations | $0.29 | $(0.77) | $3.71 |
| Less distributions declared to shareholders | |||
| From net investment income | $(0.18) | $(0.26) | $(0.03) |
| From net realized gain | (0.12) | (0.22) | (0.00)(w) |
| Total distributions declared to shareholders | $(0.30) | $(0.48) | $(0.03) |
| Net asset value, end of period (x) | $12.42 | $12.43 | $13.68 |
| Total return (%) (r)(s)(t)(x) | 2.51 | (5.77) | 37.15(n) |
| Ratios (%) (to average net assets) and Supplemental data: | |||
| Expenses before expense reductions (f) | 1.08 | 1.03 | 1.08(a) |
| Expenses after expense reductions (f) | 0.96 | 0.96 | 0.93(a) |
| Net investment income (loss) | 2.80 | 2.19 | 1.61(a) |
| Portfolio turnover | 26 | 24 | 18(n) |
| Net assets at end of period (000 omitted) | $89 | $87 | $92 |
| Class R4 | Year ended | ||
| 5/31/23 | 5/31/22 | 5/31/21(c) | |
| Net asset value, beginning of period | $12.45 | $13.70 | $10.00 |
| Income (loss) from investment operations | |||
| Net investment income (loss) (d) | $0.36 | $0.32 | $0.19 |
| Net realized and unrealized gain (loss) | (0.04) | (1.06) | 3.57 |
| Total from investment operations | $0.32 | $(0.74) | $3.76 |
| Less distributions declared to shareholders | |||
| From net investment income | $(0.21) | $(0.29) | $(0.06) |
| From net realized gain | (0.12) | (0.22) | (0.00)(w) |
| Total distributions declared to shareholders | $(0.33) | $(0.51) | $(0.06) |
| Net asset value, end of period (x) | $12.44 | $12.45 | $13.70 |
| Total return (%) (r)(s)(t)(x) | 2.76 | (5.53) | 37.67(n) |
| Ratios (%) (to average net assets) and Supplemental data: | |||
| Expenses before expense reductions (f) | 0.83 | 0.78 | 0.83(a) |
| Expenses after expense reductions (f) | 0.71 | 0.71 | 0.68(a) |
| Net investment income (loss) | 3.05 | 2.44 | 1.86(a) |
| Portfolio turnover | 26 | 24 | 18(n) |
| Net assets at end of period (000 omitted) | $90 | $87 | $92 |
| Class R6 | Year ended | ||
| 5/31/23 | 5/31/22 | 5/31/21(c) | |
| Net asset value, beginning of period | $12.44 | $13.68 | $10.00 |
| Income (loss) from investment operations | |||
| Net investment income (loss) (d) | $0.37 | $0.32 | $0.30 |
| Net realized and unrealized gain (loss) | (0.05) | (1.04) | 3.44 |
| Total from investment operations | $0.32 | $(0.72) | $3.74 |
| Less distributions declared to shareholders | |||
| From net investment income | $(0.22) | $(0.30) | $(0.06) |
| From net realized gain | (0.12) | (0.22) | (0.00)(w) |
| Total distributions declared to shareholders | $(0.34) | $(0.52) | $(0.06) |
| Net asset value, end of period (x) | $12.42 | $12.44 | $13.68 |
| Total return (%) (r)(s)(t)(x) | 2.76 | (5.45) | 37.49(n) |
| Ratios (%) (to average net assets) and Supplemental data: | |||
| Expenses before expense reductions (f) | 0.75 | 0.74 | 0.78(a) |
| Expenses after expense reductions (f) | 0.64 | 0.66 | 0.67(a) |
| Net investment income (loss) | 3.12 | 2.45 | 2.74(a) |
| Portfolio turnover | 26 | 24 | 18(n) |
| Net assets at end of period (000 omitted) | $5,790,974 | $5,727,457 | $5,800,471 |
| (a) | Annualized. |
| (c) | For the period from the commencement of the fund’s investment operations, June 30, 2020, through the stated period end. |
| (d) | Per share data is based on average shares outstanding. |
| (f) | Ratios do not reflect reductions from fees paid indirectly, if applicable. See Note 2 in the Notes to Financial Statements for additional information. |
| (n) | Not annualized. |
| (r) | Certain expenses have been reduced without which performance would have been lower. |
| (s) | From time to time the fund may receive proceeds from litigation settlements, without which performance would be lower. |
| (t) | Total returns do not include any applicable sales charges. |
| (w) | Per share amount was less than $0.01. |
| (x) | The net asset values and total returns have been calculated on net assets which include adjustments made in accordance with U.S. generally accepted accounting principles required at period end for financial reporting purposes. |
| Financial Instruments | Level 1 | Level 2 | Level 3 | Total |
| Equity Securities | $5,676,772,494 | $— | $— | $5,676,772,494 |
| Mutual Funds | 123,029,172 | — | — | 123,029,172 |
| Total | $5,799,801,666 | $— | $— | $5,799,801,666 |
| Year ended 5/31/23 | Year ended 5/31/22 | |
| Ordinary income (including any short-term capital gains) | $100,001,304 | $224,222,247 |
| Long-term capital gains | 54,659,580 | 28,483,642 |
| Total distributions | $154,660,884 | $252,705,889 |
| As of 5/31/23 | |
| Cost of investments | $5,289,003,612 |
| Gross appreciation | 798,523,529 |
| Gross depreciation | (287,725,475) |
| Net unrealized appreciation (depreciation) | $510,798,054 |
| Undistributed ordinary income | 143,088,972 |
| Undistributed long-term capital gain | 6,008,717 |
| Other temporary differences | (2,269,770) |
| Total distributable earnings (loss) | $657,625,973 |
| Year ended 5/31/23 | Year ended 5/31/22 | ||
| Class A | $92,354 | $44,809 | |
| Class C | 21,579 | 20,642 | |
| Class I | 110,874 | 262,931 | |
| Class R1 | 1,489 | 2,590 | |
| Class R2 | 1,915 | 3,035 | |
| Class R3 | 2,129 | 3,262 | |
| Class R4 | 2,348 | 3,491 | |
| Class R6 | 154,428,196 | 252,365,129 | |
| Total | $154,660,884 | $252,705,889 |
| Up to $2.5 billion | 0.75% |
| In excess of $2.5 billion and up to $5 billion | 0.70% |
| In excess of $5 billion and up to $10 billion | 0.65% |
| In excess of $10 billion and up to $20 billion | 0.62% |
| In excess of $20 billion | 0.60% |
| Classes | |||||||
| A | C | I | R1 | R2 | R3 | R4 | R6 |
| 0.96% | 1.71% | 0.71% | 1.71% | 1.21% | 0.96% | 0.71% | 0.67% |
| Distribution Fee Rate (d) | Service Fee Rate (d) | Total Distribution Plan (d) | Annual Effective Rate (e) | Distribution and Service Fee | |
| Class A | — | 0.25% | 0.25% | 0.25% | $ 9,669 |
| Class C | 0.75% | 0.25% | 1.00% | 1.00% | 9,985 |
| Class R1 | 0.75% | 0.25% | 1.00% | 1.00% | 820 |
| Class R2 | 0.25% | 0.25% | 0.50% | 0.50% | 417 |
| Class R3 | — | 0.25% | 0.25% | 0.25% | 210 |
| Total Distribution and Service Fees | $21,101 |
| (d) | In accordance with the distribution plan for certain classes, the fund pays distribution and/or service fees equal to these annual percentage rates of each class’s average daily net assets. The distribution and service fee rates disclosed by class represent the current rates in effect at the end of the reporting period. Any rate changes, if applicable, are detailed below. |
| (e) | The annual effective rates represent actual fees incurred under the distribution plan for the year ended May 31, 2023 based on each class's average daily net assets. MFD has voluntarily agreed to rebate a portion of each class's 0.25% service fee attributable to accounts for which there is no financial intermediary specified on the account except for accounts attributable to MFS or its affiliates' seed money. For the year ended May 31, 2023, this rebate amounted to $97 for Class A shares and is included in the reduction of total expenses in the Statement of Operations. |
| Year ended 5/31/23 | Year ended 5/31/22 | ||||
| Shares | Amount | Shares | Amount | ||
| Shares sold | |||||
| Class A | 334,913 | $4,028,645 | 193,779 | $2,446,410 | |
| Class C | 11,481 | 132,184 | 49,421 | 593,169 | |
| Class I | 912,006 | 11,194,080 | 2,181,127 | 28,793,466 | |
| Class R2 | 27 | 324 | — | — | |
| Class R6 | 33,233,068 | 392,833,612 | 70,081,025 | 936,904,478 | |
| 34,491,495 | $408,188,845 | 72,505,352 | $968,737,523 | ||
| Shares issued to shareholders in reinvestment of distributions | |||||
| Class A | 7,853 | $92,354 | 3,428 | $44,809 | |
| Class C | 1,841 | 21,579 | 1,583 | 20,642 | |
| Class I | 9,380 | 110,873 | 20,102 | 262,931 | |
| Class R1 | 127 | 1,489 | 198 | 2,590 | |
| Class R2 | 161 | 1,904 | 232 | 3,035 | |
| Class R3 | 181 | 2,129 | 249 | 3,262 | |
| Class R4 | 199 | 2,348 | 267 | 3,491 | |
| Class R6 | 13,088,616 | 154,314,784 | 19,293,970 | 252,365,129 | |
| 13,108,358 | $154,547,460 | 19,320,029 | $252,705,889 | ||
| Shares reacquired | |||||
| Class A | (107,426) | $(1,269,186) | (45,874) | $(591,474) | |
| Class C | (29,818) | (361,861) | (7,648) | (92,261) | |
| Class I | (1,549,510) | (17,310,055) | (878,234) | (11,620,858) | |
| Class R6 | (40,735,170) | (466,004,240) | (52,799,127) | (662,950,714) | |
| (42,421,924) | $(484,945,342) | (53,730,883) | $(675,255,307) | ||
| Net change | |||||
| Class A | 235,340 | $2,851,813 | 151,333 | $1,899,745 | |
| Class C | (16,496) | (208,098) | 43,356 | 521,550 | |
| Class I | (628,124) | (6,005,102) | 1,322,995 | 17,435,539 | |
| Class R1 | 127 | 1,489 | 198 | 2,590 | |
| Class R2 | 188 | 2,228 | 232 | 3,035 | |
| Class R3 | 181 | 2,129 | 249 | 3,262 | |
| Class R4 | 199 | 2,348 | 267 | 3,491 | |
| Class R6 | 5,586,514 | 81,144,156 | 36,575,868 | 526,318,893 | |
| 5,177,929 | $77,790,963 | 38,094,498 | $546,188,105 | ||
| Affiliated Issuers | Beginning Value | Purchases | Sales Proceeds | Realized Gain (Loss) | Change in Unrealized Appreciation or Depreciation | Ending Value |
| MFS Institutional Money Market Portfolio | $17,441,567 | $1,084,912,146 | $1,021,875,499 | $(138) | $(7,503) | $80,470,573 |
| Affiliated Issuers | Dividend Income | Capital Gain Distributions |
| MFS Institutional Money Market Portfolio | $2,342,754 | $— |
Board of Trustees of MFS Series Trust X:

July 14, 2023
| Name, Age | Position(s) Held with Fund | Trustee/Officer Since(h) | Number of MFS Funds overseen by the Trustee | Principal Occupations During the Past Five Years | Other Directorships During the Past Five Years (j) | |||||
| INTERESTED TRUSTEE | ||||||||||
| Michael W. Roberge (k) (age 56) | Trustee | January 2021 | 136 | Massachusetts Financial Services Company, Chairman (since January 2021); Chief Executive Officer (since January 2017); Director; Chairman of the Board (since January 2022); President (until December 2018); Chief Investment Officer (until December 2018) | N/A | |||||
| INDEPENDENT TRUSTEES | ||||||||||
| John P. Kavanaugh (age 68) | Trustee and Chair of Trustees | January 2009 | 136 | Private investor | N/A | |||||
| Steven E. Buller (age 71) | Trustee | February 2014 | 136 | Private investor | N/A | |||||
| John A. Caroselli (age 69) | Trustee | March 2017 | 136 | Private investor; JC Global Advisors, LLC (management consulting), President (since 2015) | N/A | |||||
| Maureen R. Goldfarb (age 68) | Trustee | January 2009 | 136 | Private investor | N/A | |||||
| Peter D. Jones (age 67) | Trustee | January 2019 | 136 | Private investor | N/A | |||||
| James W. Kilman, Jr. (age 62) | Trustee | January 2019 | 136 | Burford Capital Limited (finance and investment management), Senior Advisor (since May 3, 2021), Chief Financial Officer (2019 - May 2, 2021); KielStrand Capital LLC (family office), Chief Executive Officer (since 2016) | Alpha-En Corporation, Director (2016-2019) |
| Name, Age | Position(s) Held with Fund | Trustee/Officer Since(h) | Number of MFS Funds overseen by the Trustee | Principal Occupations During the Past Five Years | Other Directorships During the Past Five Years (j) | |||||
| Clarence Otis, Jr. (age 67) | Trustee | March 2017 | 136 | Private investor | VF Corporation, Director; Verizon Communications, Inc., Director; The Travelers Companies, Director | |||||
| Maryanne L. Roepke (age 67) | Trustee | May 2014 | 136 | Private investor | N/A | |||||
| Laurie J. Thomsen (age 65) | Trustee | March 2005 | 136 | Private investor | The Travelers Companies, Director; Dycom Industries, Inc., Director |
| Name, Age | Position(s) Held with Fund | Trustee/Officer Since(h) | Number of MFS Funds for which the Person is an Officer | Principal Occupations During the Past Five Years | ||||
| OFFICERS | ||||||||
| Christopher R. Bohane (k) (age 49) | Assistant Secretary and Assistant Clerk | July 2005 | 136 | Massachusetts Financial Services Company, Senior Vice President and Senior Managing Counsel | ||||
| Kino Clark (k) (age 55) | Assistant Treasurer | January 2012 | 136 | Massachusetts Financial Services Company, Vice President | ||||
| John W. Clark, Jr. (k) (age 56) | Assistant Treasurer | April 2017 | 136 | Massachusetts Financial Services Company, Vice President | ||||
| David L. DiLorenzo (k) (age 54) | President | July 2005 | 136 | Massachusetts Financial Services Company, Senior Vice President | ||||
| Heidi W. Hardin (k) (age 55) | Secretary and Clerk | April 2017 | 136 | Massachusetts Financial Services Company, Executive Vice President and General Counsel | ||||
| Brian E. Langenfeld (k) (age 50) | Assistant Secretary and Assistant Clerk | June 2006 | 136 | Massachusetts Financial Services Company, Vice President and Managing Counsel |
| Name, Age | Position(s) Held with Fund | Trustee/Officer Since(h) | Number of MFS Funds for which the Person is an Officer | Principal Occupations During the Past Five Years | ||||
| Rosa E. Licea-Mailloux (k) (age 46) | Chief Compliance Officer | March 2022 | 136 | Massachusetts Financial Services Company, Vice President (since 2018); Director of Corporate Compliance (2018-2021), Senior Director Compliance (2021-2022), Senior Managing Director of North American Compliance & Chief Compliance Officer (since March 2022); Natixis Investment Managers (investment management), Funds Chief Compliance Officer, Deputy General Counsel & Senior Vice President (until 2018) | ||||
| Amanda S. Mooradian (k) (age 44) | Assistant Secretary and Assistant Clerk | September 2018 | 136 | Massachusetts Financial Services Company, Assistant Vice President and Senior Counsel | ||||
| Susan A. Pereira (k) (age 52) | Assistant Secretary and Assistant Clerk | July 2005 | 136 | Massachusetts Financial Services Company, Vice President and Managing Counsel | ||||
| Kasey L. Phillips (k) (age 52) | Assistant Treasurer | September 2012 | 136 | Massachusetts Financial Services Company, Vice President | ||||
| Matthew A. Stowe (k) (age 48) | Assistant Secretary and Assistant Clerk | October 2014 | 136 | Massachusetts Financial Services Company, Vice President and Senior Managing Counsel | ||||
| William B. Wilson (k) (age 40) | Assistant Secretary and Assistant Clerk | October 2022 | 136 | Massachusetts Financial Services Company, Assistant Vice President and Senior Counsel | ||||
| James O. Yost (k) (age 63) | Treasurer | September 1990 | 136 | Massachusetts Financial Services Company, Senior Vice President |
| (h) | Date first appointed to serve as Trustee/Officer of an MFS Fund. Each Trustee has served continuously since appointment unless indicated otherwise. From January 2012 through December 2016, Messrs. DiLorenzo and Yost served as Treasurer and Deputy Treasurer of the Funds, respectively. |
| (j) | Directorships or trusteeships of companies required to report to the Securities and Exchange Commission (i.e., “public companies”). |
| (k) | “Interested person” of the Trust within the meaning of the Investment Company Act of 1940 (referred to as the 1940 Act), which is the principal federal law governing investment companies like the fund, as a result of a position with MFS. The address of MFS is 111 Huntington Avenue, Boston, Massachusetts 02199-7618. |
| Investment Adviser | Custodian |
| Massachusetts Financial Services Company 111 Huntington Avenue Boston, MA 02199-7618 | JPMorgan Chase Bank, NA 4 Metrotech Center New York, NY 11245 |
| Distributor | Independent Registered Public Accounting Firm |
| MFS Fund Distributors, Inc. 111 Huntington Avenue Boston, MA 02199-7618 | Ernst & Young LLP 200 Clarendon Street Boston, MA 02116 |
| Portfolio Manager(s) | |
| Steven Gorham David Shindler |
| FACTS | WHAT DOES MFS DO WITH YOUR PERSONAL INFORMATION? |
| Why? | Financial companies choose how they share your personal information. Federal law gives consumers the right to limit some but not all sharing. Federal law also requires us to tell you how we collect, share, and protect your personal information. Please read this notice carefully to understand what we do. |
| What? | The types of personal information we collect and share depend on the product or service you have with us. This information can include: |
| • Social Security number and account balances | |
| • Account transactions and transaction history | |
| • Checking account information and wire transfer instructions | |
| When you are no longer our customer, we continue to share your information as described in this notice. |
| How? | All financial companies need to share customers' personal information to run their everyday business. In the section below, we list the reasons financial companies can share their customers' personal information; the reasons MFS chooses to share; and whether you can limit this sharing. |
| Reasons we can share your personal information | Does MFS share? | Can you limit this sharing? |
| For our everyday business purposes – such as to process your transactions, maintain your account(s), respond to court orders and legal investigations, or report to credit bureaus | Yes | No |
| For our marketing purposes – to offer our products and services to you | No | We don't share |
| For joint marketing with other financial companies | No | We don't share |
| For our affiliates' everyday business purposes – information about your transactions and experiences | No | We don't share |
| For our affiliates' everyday business purposes – information about your creditworthiness | No | We don't share |
| For nonaffiliates to market to you | No | We don't share |
| Questions? | Call 800-225-2606 or go to mfs.com. |

| Who we are | |
| Who is providing this notice? | MFS Funds, MFS Investment Management, MFS Institutional Advisors, Inc., and MFS Heritage Trust Company. |
| What we do | |
| How does MFS protect my personal information? | To protect your personal information from unauthorized access and use, we use security measures that comply with federal law. These measures include procedural, electronic, and physical safeguards for the protection of the personal information we collect about you. |
| How does MFS collect my personal information? | We collect your personal information, for example, when you |
| • open an account or provide account information | |
| • direct us to buy securities or direct us to sell your securities | |
| • make a wire transfer | |
| We also collect your personal information from others, such as credit bureaus, affiliates, or other companies. | |
| Why can't I limit all sharing? | Federal law gives you the right to limit only |
| • sharing for affiliates' everyday business purposes – information about your creditworthiness | |
| • affiliates from using your information to market to you | |
| • sharing for nonaffiliates to market to you | |
| State laws and individual companies may give you additional rights to limit sharing. | |
| Definitions | |
| Affiliates | Companies related by common ownership or control. They can be financial and nonfinancial companies. |
| • MFS does not share personal information with affiliates, except for everyday business purposes as described on page one of this notice. | |
| Nonaffiliates | Companies not related by common ownership or control. They can be financial and nonfinancial companies. |
| • MFS does not share with nonaffiliates so they can market to you. | |
| Joint marketing | A formal agreement between nonaffiliated financial companies that together market financial products or services to you. |
| • MFS doesn't jointly market. | |
| Other important information |
| If you own an MFS product or receive an MFS service in the name of a third party such as a bank or broker-dealer, their privacy policy may apply to you instead of ours. |

Item 1(b):
Not applicable.
ITEM 2. CODE OF ETHICS.
The Registrant has adopted a Code of Ethics (the "Code") pursuant to Section 406 of the Sarbanes-Oxley Act and as defined in Form N-CSR that applies to the Registrant's principal executive officer and principal financial and accounting officer. During the period covered by this report, the Registrant has not amended any provision in the Code that relates to an element of the Code's definition enumerated in paragraph
(b)of Item 2 of this Form N-CSR. During the period covered by this report, the Registrant did not grant a waiver, including an implicit waiver, from any provision of the Code.
A copy of the Code is attached hereto as EX-99.COE.
ITEM 3. AUDIT COMMITTEE FINANCIAL EXPERT.
Messrs. Steven E. Buller, James Kilman, and Clarence Otis, Jr. and Ms. Maryanne L. Roepke, members of the Audit Committee, have been determined by the Board of Trustees in their reasonable business judgment to meet the definition of "audit committee financial expert" as such term is defined in Form N-CSR. In addition, Messrs. Buller, Kilman, and Otis and Ms. Roepke are "independent" members of the Audit Committee (as such term has been defined by the Securities and Exchange Commission in regulations implementing Section 407 of the Sarbanes-Oxley Act of 2002). The Securities and Exchange Commission has stated that the designation of a person as an audit committee financial expert pursuant to this Item 3 on the Form N-CSR does not impose on such a person any duties, obligations or liability that are greater than the duties, obligations or liability imposed on such person as a member of the Audit Committee and the Board of Trustees in the absence of such designation or identification.
ITEM 4. PRINCIPAL ACCOUNTANT FEES AND SERVICES.
Items 4(a) through 4(d) and 4(g):
The Board of Trustees has appointed Deloitte & Touche LLP ("Deloitte") to serve as independent accountants to certain series of the Registrant and Ernst & Young LLP ("E&Y") to serve in the same capacity to certain other series of the Registrant (each a "Fund" and collectively the "Funds"). The tables below set forth the audit fees billed to each Fund as well as fees for non-audit services provided to each Fund and/or to each Fund's investment adviser, Massachusetts Financial Services Company ("MFS"), and to various entities either controlling, controlled by, or under common control with MFS that provide ongoing services to the Funds ("MFS Related Entities").
For the fiscal years ended May 31, 2023 and 2022, audit fees billed to each Fund by Deloitte and E&Y were as follows:
Fees billed by Deloitte: |
| Audit Fees | |
2023 |
| 20225 | |
|
| ||
MFS Blended Research Growth Equity Fund | 54,730 |
| 50,643 |
MFS Blended Research Mid Cap Equity Fund | 53,671 |
| 49,664 |
MFS Blended Research Small Cap Equity Fund | 54,950 |
| 50,846 |
MFS Blended Research Value Equity Fund | 54,730 |
| 50,643 |
MFS International Diversification Fund | 34,886 |
| 32,303 |
Total | 252,967 |
| 234,099 |
|
|
| |
Fees billed by E&Y: |
| Audit Fees | |
2023 |
| 20225 | |
|
| ||
MFS Aggressive Growth Allocation Fund | 33,927 |
| 31,416 |
MFS Conservative Allocation Fund | 33,927 |
| 31,416 |
MFS Emerging Markets Equity Fund | 64,325 |
| 59,511 |
MFS Growth Allocation Fund | 33,927 |
| 31,416 |
MFS International Growth Fund | 64,463 |
| 59,638 |
MFS International Intrinsic Value Fund | 64,463 |
| 59,638 |
MFS International Large Cap Value Fund | 55,800 |
| 42,050 |
MFS Managed Wealth Fund | 41,941 |
| 38,823 |
MFS Moderate Allocation Fund | 33,927 |
| 31,416 |
Total | 426,700 |
| 385,324 |
For the fiscal years ended May 31, 2023 and 2022, fees billed by Deloitte and E&Y for audit-related, tax and other services provided to each Fund and for audit-related, tax and other services provided to MFS and MFS Related Entities were as follows:
| Audit-Related | Tax Fees2 | All Other Fees3 | ||||
Fees billed by Deloitte: |
| Fees1 |
|
|
|
| |
| 2023 |
| 2022 | 2023 | 2022 | 2023 | 2022 |
To MFS Blended Research | 0 |
| 0 | 0 | 400 | 0 | 0 |
Growth Equity Fund |
|
|
|
|
|
|
|
To MFS Blended Research | 0 |
| 0 | 0 | 400 | 0 | 0 |
Mid Cap Equity Fund |
|
|
|
|
|
|
|
To MFS Blended Research | 0 |
| 0 | 0 | 400 | 0 | 0 |
Small Cap Equity Fund |
|
|
|
|
|
|
|
To MFS Blended Research | 0 |
| 0 | 0 | 400 | 0 | 0 |
Value Equity Fund |
|
|
|
|
|
|
|
To MFS International | 0 |
| 0 | 0 | 400 | 0 | 0 |
Diversification Fund |
|
|
|
|
|
|
|
Total fees billed by Deloitte | 0 |
| 0 | 0 | 2,000 | 0 | 0 |
To above Funds: |
|
|
|
|
|
|
|
| Audit-Related |
| Tax Fees2 |
| All Other Fees3 | |||||||||
Fees billed by Deloitte: |
| Fees1 |
|
|
|
|
|
|
|
|
|
| ||
| 2023 |
| 2022 |
| 2023 | 2022 |
| 2023 |
|
| 2022 | |||
To MFS and MFS Related |
|
|
|
|
|
|
|
|
|
|
|
|
|
|
Entities of MFS Blended | 0 |
| 0 |
| 0 | 0 |
| 3,790 |
|
| 3,790 | |||
Research Growth Equity Fund* |
|
|
|
|
|
|
|
|
|
|
|
|
|
|
To MFS and MFS Related |
|
|
|
|
|
|
|
|
|
|
|
|
|
|
Entities of MFS Blended | 0 |
| 0 |
| 0 | 0 |
| 3,790 |
|
| 3,790 | |||
Research Mid Cap Equity |
|
|
|
|
|
|
|
|
|
|
|
|
|
|
Fund * |
|
|
|
|
|
|
|
|
|
|
|
|
|
|
To MFS and MFS Related |
|
|
|
|
|
|
|
|
|
|
|
|
|
|
Entities of MFS Blended | 0 |
| 0 |
| 0 | 0 |
| 3,790 |
|
| 3,790 | |||
Research Small Cap Equity |
|
|
|
|
|
|
|
|
|
|
|
|
|
|
Fund * |
|
|
|
|
|
|
|
|
|
|
|
|
|
|
To MFS and MFS Related |
|
|
|
|
|
|
|
|
|
|
|
|
|
|
Entities of MFS Blended | 0 |
| 0 |
| 0 | 0 |
| 3,790 |
|
| 3,790 | |||
Research Value Equity Fund* |
|
|
|
|
|
|
|
|
|
|
|
|
|
|
To MFS and MFS Related |
|
|
|
|
|
|
|
|
|
|
|
|
|
|
Entities of MFS International | 0 |
| 0 |
| 0 | 0 |
| 3,790 |
|
| 3,790 | |||
Diversification Fund* |
|
|
|
|
|
|
|
|
|
|
|
|
|
|
|
|
|
|
|
|
|
|
|
|
| ||||
Fees billed by Deloitte: |
|
|
|
| Aggregate fees for non-audit services |
| ||||||||
|
|
|
| 2023 |
|
|
| 2022 |
|
| ||||
|
|
|
|
|
|
|
|
|
| |||||
To MFS Blended Research Growth Equity |
|
|
| 3,790 |
|
|
| 4,190 |
| |||||
Fund, MFS and MFS Related Entities# |
|
|
|
|
|
|
|
|
|
|
|
|
| |
To MFS Blended Research Mid Cap Equity |
| 3,790 |
|
|
| 4,190 |
| |||||||
Fund, MFS and MFS Related Entities# |
|
|
|
|
|
|
|
|
|
|
|
|
| |
To MFS Blended Research Small Cap Equity |
| 3,790 |
|
|
| 4,190 |
| |||||||
Fund, MFS and MFS Related Entities# |
|
|
|
|
|
|
|
|
|
|
|
|
| |
To MFS Blended Research Value Equity |
|
|
| 3,790 |
|
|
| 4,190 |
| |||||
Fund, MFS and MFS Related Entities# |
|
|
|
|
|
|
|
|
|
|
|
|
| |
To MFS International Diversification |
|
|
| 3,790 |
|
|
| 4,190 |
| |||||
Fund, MFS and MFS Related Entities# |
|
|
|
|
|
|
|
|
|
|
|
|
| |
|
|
|
|
|
|
|
| |||||||
| Audit-Related |
| Tax Fees2 |
| All Other Fees4 | |||||||||
Fees billed by E&Y: |
| Fees1 |
|
|
|
|
|
|
|
|
|
| ||
| 2023 |
| 2022 |
| 2023 |
| 2022 |
| 2023 |
|
| 2022 | ||
To MFS Aggressive Growth | 0 |
| 0 |
| 0 |
| 0 |
|
| 0 |
|
| 933 | |
Allocation Fund |
|
|
|
|
|
|
|
|
|
|
|
|
|
|
To MFS Conservative | 0 |
| 0 |
| 0 |
| 0 |
|
| 0 |
|
| 1,246 | |
Allocation Fund |
|
|
|
|
|
|
|
|
|
|
|
|
|
|
To MFS Emerging Markets | 0 |
| 0 |
| 636 |
| 666 |
| 0 |
|
| 1,780 | ||
Equity Fund |
|
|
|
|
|
|
|
|
|
|
|
|
|
|
To MFS Growth Allocation | 0 |
| 0 |
| 0 |
| 0 |
|
| 0 |
|
| 1,681 | |
Fund |
|
|
|
|
|
|
|
|
|
|
|
|
|
|
To MFS International Growth | 0 |
| 0 |
| 636 |
| 666 |
| 0 |
|
| 3,093 | ||
Fund |
|
|
|
|
|
|
|
|
|
|
|
|
|
|
To MFS International Intrinsic | 0 |
| 0 |
| 636 |
| 666 |
| 0 |
|
| 6,247 | ||
Value Fund |
|
|
|
|
|
|
|
|
|
|
|
|
|
|
To MFS International Large | 0 |
| 0 |
| 636 |
| 666 |
| 0 |
|
| 1,531 | ||
Cap Value Fund |
|
|
|
|
|
|
|
|
|
|
|
|
|
|
To MFS Managed Wealth | 0 |
| 0 |
| 259 |
| 255 |
| 0 |
|
| 483 | ||
Fund |
|
|
|
|
|
|
|
|
|
|
|
|
|
|
To MFS Moderate Allocation | 0 |
| 0 |
| 0 |
| 0 |
|
| 0 |
|
| 1,788 | |
Fund |
|
|
|
|
|
|
|
|
|
|
|
|
|
|
Total fees billed by E&Y | 0 |
| 0 |
| 2,803 |
| 2,919 |
| 0 |
|
| 18,782 | ||
To above Funds: |
|
|
|
|
|
|
|
|
|
|
|
|
|
|
Fees billed by E&Y: | Audit-Related Fees1 | Tax Fees2 | All Other Fees4 | ||||
2023 | 2022 | 2023 | 2022 | 2023 | 2022 | ||
| |||||||
To MFS and MFS Related Entities of |
|
|
|
|
|
| |
MFS Aggressive Growth Allocation | 0 | 1,275,053 | 0 | 0 | 3,165 | 108,250 | |
Fund* |
|
|
|
|
|
| |
To MFS and MFS Related Entities of |
|
|
|
|
|
| |
MFS Conservative Allocation Fund* | 0 | 1,275,053 | 0 | 0 | 3,165 | 108,250 | |
To MFS and MFS Related Entities of |
|
|
|
|
|
| |
MFS Emerging Markets Equity Fund* | 0 | 1,275,053 | 0 | 0 | 3,165 | 108,250 | |
To MFS and MFS Related Entities of |
|
|
|
|
|
| |
MFS Growth Allocation Fund* | 0 | 1,275,053 | 0 | 0 | 3,165 | 108,250 | |
To MFS and MFS Related Entities of |
|
|
|
|
|
| |
MFS International Growth Fund* | 0 | 1,275,053 | 0 | 0 | 3,165 | 108,250 | |
To MFS and MFS Related Entities of |
|
|
|
|
|
| |
MFS International Intrinsic Value Fund* | 0 | 1,275,053 | 0 | 0 | 3,165 | 108,250 | |
To MFS and MFS Related Entities of |
|
|
|
|
|
| |
MFS International Large Cap Value | 0 | 1,275,053 | 0 | 0 | 3,165 | 108,250 | |
Fund* |
|
|
|
|
|
| |
To MFS and MFS Related Entities of |
|
|
|
|
|
| |
MFS Managed Wealth Fund* | 0 | 1,275,053 | 0 | 0 | 3,165 | 108,250 | |
To MFS and MFS Related Entities of |
|
|
|
|
|
| |
MFS Moderate Allocation Fund* | 0 | 1,275,053 | 0 | 0 | 3,165 | 108,250 | |
Fees billed by E&Y: | Aggregate fees for non-audit services | ||
2023 | 2022 | ||
| |||
To MFS Aggressive Growth Allocation Fund, MFS |
|
| |
and MFS Related Entities# | 227,915 | 1,638,866 | |
To MFS Conservative Allocation Fund, MFS and |
|
| |
MFS Related Entities# | 227,915 | 1,639,179 | |
To MFS Emerging Markets Equity Fund, MFS and |
|
| |
MFS Related Entities# | 228,551 | 1,640,379 | |
To MFS Growth Allocation Fund, MFS and MFS |
|
| |
Related Entities# | 227,915 | 1,639,614 | |
To MFS International Growth Fund, MFS and MFS |
|
| |
Related Entities# | 228,551 | 1,641,692 | |
To MFS International Intrinsic Value Fund, MFS |
|
| |
and MFS Related Entities# | 228,551 | 1,644,846 | |
To MFS International Large Cap Value Fund, MFS |
|
| |
and MFS Related Entities# | 228,551 | 1,640,130 | |
To MFS Managed Wealth Fund, MFS and MFS |
|
| |
Related Entities# | 228,174 | 1,638,671 | |
To MFS Moderate Allocation Fund, MFS and MFS |
|
| |
Related Entities# | 227,915 | 1,639,721 | |
*This amount reflects the fees billed to MFS and MFS Related Entities for non-audit services relating directly to the operations and financial reporting of the Funds (portions of which services also related to the operations and financial reporting of other funds within the MFS Funds complex).
# This amount reflects the aggregate fees billed by Deloitte or E&Y for non-audit services rendered to the Funds and for non-audit services rendered to MFS and the MFS Related Entities.
1 The fees included under "Audit-Related Fees" are fees related to assurance and related services that are reasonably related to the performance of the audit or review of financial statements, but not reported under ''Audit Fees,'' including accounting consultations, agreed-upon procedure reports, attestation reports, comfort letters and internal control reviews.
2 The fees included under "Tax Fees" are fees associated with tax compliance, tax advice and tax planning, including services relating to the filing or amendment of federal, state or local income tax returns, regulated investment company qualification reviews and tax distribution and analysis.
3 The fees included under "All Other Fees" are fees for products and services provided by Deloitte other than those reported under "Audit Fees," "Audit-Related Fees" and "Tax Fees".
4The fees included under "All Other Fees" are fees for products and services provided by E&Y other than those reported under "Audit Fees," "Audit-Related Fees" and "Tax Fees," including fees for services related to review of internal controls and review of Rule 38a-
1compliance program.
5Certain fees reported in 2022 have been restated in this filing from those reported in the Registrant's filing for the reporting period ended April 30, 2022.
Item 4(e)(1):
Set forth below are the policies and procedures established by the Audit Committee of the Board of Trustees relating to the pre- approval of audit and non-audit related services:
To the extent required by applicable law, pre-approval by the Audit Committee of the Board is needed for all audit and permissible non-audit services rendered to the Fund and all permissible non-audit services rendered to MFS or MFS Related Entities if the services relate directly to the operations and financial reporting of the Registrant. Pre-approval is currently on an engagement-by-engagement basis. In the event pre-approval of such services is necessary between regular meetings of the Audit Committee and it is not practical to wait to seek pre-approval at the next regular meeting of the Audit Committee, pre-approval of such services may be referred to the Chair of the Audit Committee for approval; provided that the Chair may not pre-approve any individual engagement for such services exceeding $50,000 or multiple engagements for such services in the aggregate exceeding $100,000 in each period between regular meetings of the Audit Committee. Any engagement pre-approved by the Chair between regular meetings of the Audit Committee shall be presented for ratification by the entire Audit Committee at its next regularly scheduled meeting.
Item 4(e)(2):
None, or 0%, of the services relating to the Audit-Related Fees, Tax Fees and All Other Fees paid by the Fund and MFS and MFS Related Entities relating directly to the operations and financial reporting of the Registrant disclosed above were approved by the audit committee pursuant to paragraphs (c)(7)(i)(C) of Rule 2-01 of Regulation S-X (which permits audit committee approval after the start of the engagement with respect to services other than audit, review or attest services, if certain conditions are satisfied).
Item 4(f):
Not applicable.
Item 4(h):
The Registrant's Audit Committee has considered whether the provision by a Registrant's independent registered public accounting firm of non-audit services to MFS and MFS Related Entities that were not pre-approved by the Committee (because such services did not relate directly to the operations and financial reporting of the Registrant) was compatible with maintaining the independence of the independent registered public accounting firm as the Registrant's principal auditors.
ITEM 5. AUDIT COMMITTEE OF LISTED REGISTRANTS.
Not applicable to the Registrant.
ITEM 6. INVESTMENTS
A schedule of investments for each series covered by this Form N-CSR is included as part of the report to shareholders of such series under Item 1(a) of this Form N-CSR.
ITEM 7. DISCLOSURE OF PROXY VOTING POLICIES AND PROCEDURES FOR CLOSED-END MANAGEMENT INVESTMENT COMPANIES.
Not applicable to the Registrant.
ITEM 8. PORTFOLIO MANAGERS OF CLOSED-END MANAGEMENT INVESTMENT COMPANIES.
Not applicable to the Registrant.
ITEM 9. PURCHASES OF EQUITY SECURITIES BY CLOSED-END MANAGEMENT INVESTMENT COMPANY AND AFFILIATED PURCHASERS.
Not applicable to the Registrant.
ITEM 10. SUBMISSION OF MATTERS TO A VOTE OF SECURITY HOLDERS.
There were no material changes to the procedures by which shareholders may send recommendations to the Board for nominees to the Registrant's Board since the Registrant last provided disclosure as to such procedures in response to the requirements of Item 407 (c)(2)(iv) of Regulation S-K or this Item.
ITEM 11. CONTROLS AND PROCEDURES.
(a)Based upon their evaluation of the effectiveness of the registrant's disclosure controls and procedures (as defined in Rule 30a-3(c) under the Investment Company Act of 1940 (the "Act")) as conducted within 90 days of the filing date of this report on Form N-CSR, the Registrant's principal financial officer and principal executive officer have concluded that those disclosure controls and procedures provide reasonable assurance that the material information required to be disclosed by the Registrant on this report is recorded, processed, summarized and reported within the time periods specified in the Securities and Exchange Commission's rules and forms.
(b)There were no changes in the Registrant's internal controls over financial reporting (as defined in Rule 30a-3(d) under the Act) that occurred during the period covered by the report that have materially affected, or are reasonably likely to materially affect, the Registrant's internal control over financial reporting.
ITEM 12. DISCLOSURE OF SECURITIES LENDING ACTIVITIES FOR CLOSED-END MANAGEMENT INVESTMENT COMPANIES.
Not applicable to the Registrant.
ITEM 13. EXHIBITS.
(a)(1) Any code of ethics, or amendment thereto, that is the subject of the disclosure required by Item 2, to the extent that the registrant intends to satisfy the Item 2 requirements through filing of an exhibit: Attached hereto as EX-99.COE.
(2)A separate certification for each principal executive officer and principal financial officer of the registrant as required by Rule 30a-2(a) under the Act (17 CFR 270.30a-2): Attached hereto as EX-99.302CERT.
(3)Any written solicitation to purchase securities under Rule 23c-1 under the Act (17 CFR 270.23c-1) sent or given during the period covered by the report by or on behalf of the registrant to 10 or more persons. Not applicable.
(4)Change in the registrant's independent public accountant. Not applicable.
(b)If the report is filed under Section 13(a) or 15(d) of the Exchange Act, provide the certifications required by Rule 30a-2(b) under the Act (17 CFR 270.30a-2(b)), Rule 13a-14(b) or Rule 15d-14(b) under the Exchange Act (17 CFR 240.13a-14(b) or 240.15d-14(b)) and Section 1350 of Chapter 63 of Title 18 of the United States Code (18 U.S.C. 1350) as an exhibit. A certification furnished pursuant to this paragraph will not be deemed "filed" for the purposes of Section 18 of the Exchange Act (15 U.S.C. 78r), or otherwise subject to the liability of that section. Such certification will not be deemed to be incorporated by reference into any filing under the Securities Act of 1933 or the Exchange Act, except to the extent that the registrant specifically incorporates it by reference. Attached hereto as EX-99.906CERT.
Notice
A copy of the Amended and Restated Declaration of Trust, as amended, of the Registrant is on file with the Secretary of State of The Commonwealth of Massachusetts and notice is hereby given that this instrument is executed on behalf of the Registrant by an officer of the Registrant as an officer and not individually and the obligations of or arising out of this instrument are not binding upon any of the Trustees or shareholders individually, but are binding only upon the assets and property of the respective constituent series of the Registrant.
SIGNATURES
Pursuant to the requirements of the Securities Exchange Act of 1934 and the Investment Company Act of 1940, the registrant has duly caused this report to be signed on its behalf by the undersigned, thereunto duly authorized.
(Registrant) MFS SERIES TRUST X
By (Signature and Title)*
/S/ DAVID L. DILORENZO
David L. DiLorenzo, President
Date: July 14, 2023
Pursuant to the requirements of the Securities Exchange Act of 1934 and the Investment Company Act of 1940, this report has been signed below by the following persons on behalf of the registrant and in the capacities and on the dates indicated.
By (Signature and Title)*
/S/ DAVID L. DILORENZO
David L. DiLorenzo, President (Principal Executive Officer)
Date: July 14, 2023
By (Signature and Title)*
/S/ JAMES O. YOST
James O. Yost, Treasurer (Principal Financial Officer and Accounting Officer) Date: July 14, 2023
* Print name and title of each signing officer under his or her signature.