UNITED STATES
SECURITIES AND EXCHANGE COMMISSION
Washington, D.C. 20549
FORM N-CSR
CERTIFIED SHAREHOLDER REPORT OF REGISTERED MANAGEMENT
INVESTMENT COMPANIES
Investment Company Act file number 811-04494
| | | | | | |
| | | The Gabelli Asset Fund | | |
| | (Exact name of registrant as specified in charter) | | |
| | | | | | |
| | | One Corporate Center Rye, New York 10580-1422 | | |
| | (Address of principal executive offices) (Zip code) | | |
| | | | | | |
| | | Bruce N. Alpert Gabelli Funds, LLC One Corporate Center Rye, New York 10580-1422 | | |
| | (Name and address of agent for service) | | |
Registrant’s telephone number, including area code: 1-800-422-3554
Date of fiscal year end: December 31
Date of reporting period: December 31, 2017
Form N-CSR is to be used by management investment companies to file reports with the Commission not later than 10 days after the transmission to stockholders of any report that is required to be transmitted to stockholders under Rule 30e-1 under the Investment Company Act of 1940 (17 CFR 270.30e-1). The Commission may use the information provided on Form N-CSR in its regulatory, disclosure review, inspection, and policymaking roles.
A registrant is required to disclose the information specified by Form N-CSR, and the Commission will make this information public. A registrant is not required to respond to the collection of information contained in Form N-CSR unless the Form displays a currently valid Office of Management and Budget (“OMB”) control number. Please direct comments concerning the accuracy of the information collection burden estimate and any suggestions for reducing the burden to Secretary, Securities and Exchange Commission, 450 Fifth Street, NW, Washington, DC 20549-0609. The OMB has reviewed this collection of information under the clearance requirements of 44 U.S.C. § 3507.
Item 1. Reports to Stockholders.
The Report to Shareholders is attached herewith.
The Gabelli Asset Fund
Annual Report — December 31, 2017
(Y)our Portfolio Management Team
| | | | | | |
 | |  | |  | |  |
Mario J. Gabelli, CFA Chief Investment Officer | | Christopher J. Marangi Co-Chief Investment Officer BA, Williams College MBA, Columbia Business School | | Kevin V. Dreyer Co-Chief Investment Officer BSE, University of Pennsylvania MBA, Columbia Business School | | Jeffrey J. Jonas, CFA Portfolio Manager BS, Boston College |
To Our Shareholders,
For the year ended December 31, 2017, the net asset value (“NAV”) per class AAA Share of The Gabelli Asset Fund increased 20.2% compared with an increase of 21.8% for the Standard & Poor’s (“S&P”) 500 Index. Other classes of shares are available. See page 3 for performance information for all classes of shares.
Enclosed are the financial statements, including the schedule of investments, as of December 31, 2017.
Performance Discussion (Unaudited)
The Fund’s investment objective is to provide growth of capital. The Fund’s secondary goal is to provide current income.
The Fund’s investment strategy is to invest in common and preferred stocks. In making stock selections, the Fund strives to earn a 10% real rate of return. The Fund may also invest in foreign securities. The Fund focuses on companies which appear underpriced relative to their private market value (“PMV”). PMV is the value the Fund’s investment adviser, Gabelli Funds, LLC, believes informed investors would be willing to pay for a company. Under normal market conditions, the Fund invests at least 80% of its assets in stocks that are listed on a recognized securities exchange or similar market. The portfolio managers will invest in companies that, in the public market, are selling at a significant discount to the portfolio managers’ assessment of their PMV. The portfolio managers consider factors such as price, earnings expectations, earnings and price histories, balance sheet characteristics, and perceived management skills. The portfolio managers also consider changes in economic and political outlooks as well as individual corporate developments.
After a sluggish start to the year, the U.S. economy grew at a faster than anticipated 3.1% and 3.3% in the second and third quarters, respectively. At 4.1%, unemployment stands at a ten year low while consumer wealth of nearly $97 trillion is at an all time high. Housing starts of 1.3 million units continue their steady increase, but remain below the prior peak of 2.2 million units. The U.S. is in its ninth year of economic expansion, making this the third longest expansion at 101 months, trailing only 1961-1969 and 1991-2001 (those expansions were 106 and 120 months, respectively). Perhaps as important, the global economy is in synchronized expansion. For all of 2017, the Eurozone is set to grow 2.2%, its fastest since 2007 while Japan has accelerated to 1.5%; China is likely to post growth of 6.7%. The stock market rose in the latter half of the year, following President Trump’s agenda on tax reform, deregulation, and fiscal stimulus. The Federal Reserve raised the Federal Funds rate for the fifth time since October of 2014, now ranging from 1.25%-1.50%.
Selected holdings that contributed positively to performance in 2017 were: Berkshire Hathaway Inc. (1.6% of net assets as of December 31, 2017) that is leveraged to American growth and benefitted from its infrastructure businesses; Republic Services Inc. (1.5%) whose share buybacks drove the company’s earnings up at a faster rate on a per share basis; and The Bank of New York Mellon Corp. (1.3%) which executed on cost cutting and debt reduction initiatives.
Some of our weaker performing stocks during the year were: Telephone and Data Systems (1.0%) whose results were heavily affected by those at U.S. Cellular (0.2%) of which Telephone and Data Systems holds a heavy majority; Flowserve Corp, (0.8%) whose results were impacted by natural disasters, working capital reserves, and bookings headwinds from ongoing delays in customer investment decisions; and Edgewell Personal Care Co. (0.8%) which had pricing pressure on its core shaving brand Schick with competitors advertising a broad range of price cuts.
Thank you for your investment in The Gabelli Asset Fund.
We appreciate you confidence and trust.
Comparative Results
| | | | | | | | | | | | | | | | | | | | | | | | | |
| Average Annual Returns through December 31, 2017 (a) (Unaudited) | | Since |
| | | 1 Year | | 5 Year | | 10 Year | | 15 Year | | Inception
(3/3/86) |
Class AAA (GABAX) | | | | 20.16 | % | | | | 11.87 | % | | | | 7.40 | % | | | | 10.42 | % | | | | 11.99 | % |
S&P 500 Index | | | | 21.83 | | | | | 15.79 | | | | | 8.50 | | | | | 9.92 | | | | | 10.55 | (b) |
Dow Jones Industrial Average | | | | 28.07 | | | | | 16.31 | | | | | 9.24 | | | | | 10.24 | | | | | 11.62 | (b) |
Nasdaq Composite Index | | | | 29.80 | | | | | 19.50 | | | | | 11.35 | | | | | 12.81 | | | | | 9.60 | (b) |
Class A (GATAX) | | | | 20.18 | | | | | 11.87 | | | | | 7.40 | | | | | 10.41 | | | | | 11.99 | |
With sales charge (c) | | | | 13.27 | | | | | 10.56 | | | | | 6.77 | | | | | 9.98 | | | | | 11.77 | |
Class C (GATCX) | | | | 19.27 | | | | | 11.04 | | | | | 6.61 | | | | | 9.65 | | | | | 11.62 | |
With contingent deferred sales charge (d) | | | | 18.27 | | | | | 11.04 | | | | | 6.61 | | | | | 9.65 | | | | | 11.62 | |
Class I (GABIX) | | | | 20.48 | | | | | 12.15 | | | | | 7.67 | | | | | 10.60 | | | | | 12.08 | |
Class T (GALTX) | | | | 20.21 | | | | | 11.88 | | | | | 7.41 | | | | | 10.42 | | | | | 11.99 | |
With sales charge (e) | | | | 17.20 | | | | | 11.32 | | | | | 7.13 | | | | | 10.23 | | | | | 11.75 | |
In the current prospectuses dated April 28, 2017, the expense ratios for Class AAA, A, C, I, and T Shares are 1.36%, 1.36%, 2.11%, 1.11%, and 1.36%, respectively. See page 16 for the expense ratios for the year ended December 31, 2017. Class AAA and Class I Shares do not have a sales charge. The maximum sales charge for Class A Shares, Class C Shares, and Class T Shares is 5.75%, 1.00%, and 2.50%, respectively.
| | (a) | Returns represent past performance and do not guarantee future results. Total returns and average annual returns reflect changes in share price, reinvestment of distributions, and are net of expenses. Investment returns and the principal value of an investment will fluctuate. When shares are redeemed, they may be worth more or less than their original cost. Current performance may be lower or higher than the performance data presented. Visit www.gabelli.com for performance information as of the most recent month end. Returns would have been lower had Gabelli Funds, LLC (the “Adviser”) not reimbursed certain expenses of the Fund for periods prior to December 31, 1988. The Fund imposes a 2% redemption fee on shares sold or exchanged within seven days of purchase. Investors should carefully consider the investment objectives, risks, charges, and expenses of the Fund before investing. The prospectuses contain information about these and other matters and should be read carefully before investing. To obtain a prospectus, please visit our website at www.gabelli.com. The S&P 500 Index is a market capitalization weighted index of 500 large capitalization stocks commonly used to represent the U.S. equity market. The Dow Jones Industrial Average and the Nasdaq Composite Index are unmanaged indicators of stock market performance. Dividends are considered reinvested, except for the Nasdaq Composite Index. You cannot invest directly in an index. The Class AAA Share NAVs are used to calculate performance for the periods prior to the issuance of Class A Shares and Class C Shares on December 31, 2003, Class I Shares on January 11, 2008, and Class T Shares on July 5, 2017. The actual performance of the Class A Shares, Class C Shares, and Class T Shares would have been lower due to the additional fees and expenses associated with these classes of shares. The actual performance of the Class I Shares would have been higher due to lower expenses related to this class of shares. | |
| | (b) | S&P 500 Index, Dow Jones Industrial Average, and Nasdaq Composite Index since inception performance results are as of February 28, 1986. | |
| | (c) | Performance results include the effect of the maximum 5.75% sales charge at the beginning of the period. | |
| | (d) | Assuming payment of the 1% maximum contingent deferred sales charge imposed on redemptions made within one year of purchase. | |
| | (e) | Performance results include the effect of the maximum 2.50% sales charge at the beginning of the period. | |
3
COMPARISON OF CHANGE IN VALUE OF A $10,000 INVESTMENT IN
THE GABELLI ASSET FUND (CLASS AAA SHARES) AND S&P 500 INDEX (Unaudited)
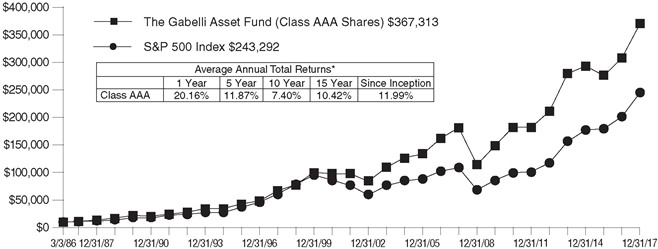
| * | Past performance is not predictive of future results. The performance tables and graph do not reflect the deduction of taxes that a shareholder would pay on Fund distributions or the redemption of Fund shares. |
4
| | | | |
The Gabelli Asset Fund | | | | |
Disclosure of Fund Expenses (Unaudited) | | | | |
For the Six Month Period from July 1, 2017 through December 31, 2017 | | | Expense Table | |
We believe it is important for you to understand the impact of fees and expenses regarding your investment. All mutual funds have operating expenses. As a shareholder of a fund, you incur ongoing costs, which include costs for portfolio management, administrative services, and shareholder reports (like this one), among others. Operating expenses, which are deducted from a fund’s gross income, directly reduce the investment return of a fund. When a fund’s expenses are expressed as a percentage of its average net assets, this figure is known as the expense ratio. The following examples are intended to help you understand the ongoing costs (in dollars) of investing in your Fund and to compare these costs with those of other mutual funds. The examples are based on an investment of $1,000 made at the beginning of the period shown and held for the entire period.
The Expense Table below illustrates your Fund’s costs in two ways:
Actual Fund Return: This section provides information about actual account values and actual expenses. You may use this section to help you to estimate the actual expenses that you paid over the period after any fee waivers and expense reimbursements. The “Ending Account Value” shown is derived from the Fund’s actual return during the past six months, and the “Expenses Paid During Period” shows the dollar amount that would have been paid by an investor who started with $1,000 in the Fund. You may use this information, together with the amount you invested, to estimate the expenses that you paid over the period.
To do so, simply divide your account value by $1,000 (for example, an $8,600 account value divided by $1,000 = 8.6), then multiply the result by the number given for your Fund under the heading “Expenses Paid During Period” to estimate the expenses you paid during this period.
Hypothetical 5% Return: This section provides information about hypothetical account values and hypothetical expenses based on the Fund’s actual expense ratio. It assumes a hypothetical annualized return of 5% before expenses during the period shown. In this case – because the hypothetical return used is not
the Fund’s actual return – the results do not apply to your investment and you cannot use the hypothetical account value and expense to estimate the actual ending account balance or expenses you paid for the period. This example is useful in making comparisons of the ongoing costs of investing in the Fund and other funds. To do so, compare this 5% hypothetical example with the 5% hypothetical examples that appear in shareholder reports of other funds.
Please note that the expenses shown in the table are meant to highlight your ongoing costs only and do not reflect any transactional costs such as sales charges (loads), redemption fees, or exchange fees, if any, which are described in the Prospectus. If these costs were applied to your account, your costs would be higher. Therefore, the 5% hypothetical return is useful in comparing ongoing costs only, and will not help you determine the relative total costs of owning different funds. The “Annualized Expense Ratio” represents the actual expenses for the last six months and may be different from the expense ratio in the Financial Highlights which is for the year ended December 31, 2017.
| | | | | | | | | | | | | | | | | | |
| | | | | Beginning | | | Ending | | | Annualized | | | Expenses | |
| | | | | Account Value | | | Account Value | | | Expense | | | Paid During | |
| | | | | 07/01/17 | | | 12/31/17 | | | Ratio | | | Period* | |
The Gabelli Asset Fund | |
Actual Fund Return | |
Class AAA | | | | | $1,000.00 | | | | $1,098.80 | | | | 1.34 | % | | $ | 7.09 | |
Class A | | | | | $1,000.00 | | | | $1,098.80 | | | | 1.34 | % | | $ | 7.09 | |
Class C | | | | | $1,000.00 | | | | $1,094.70 | | | | 2.09 | % | | $ | 11.03 | |
Class I | | | | | $1,000.00 | | | | $1,100.20 | | | | 1.09 | % | | $ | 5.77 | |
Class T** | | | | | $1,000.00 | | | | $1,095.60 | | | | 1.35 | % | | $ | 6.98 | |
Hypothetical 5% Return | | | | | | | | | | | | | |
Class AAA | | | | | $1,000.00 | | | | $1,018.45 | | | | 1.34 | % | | $ | 6.82 | |
Class A | | | | | $1,000.00 | | | | $1,018.45 | | | | 1.34 | % | | $ | 6.82 | |
Class C | | | | | $1,000.00 | | | | $1,014.67 | | | | 2.09 | % | | $ | 10.61 | |
Class I | | | | | $1,000.00 | | | | $1,019.71 | | | | 1.09 | % | | $ | 5.55 | |
Class T | | | | | $1,000.00 | | | | $1,018.40 | | | | 1.35 | % | | $ | 6.87 | |
| * | Expenses are equal to the Fund’s annualized expense ratio for the last six months multiplied by the average account value over the period, multiplied by the number of days in the most recent fiscal half year (184 days), then divided by 365. |
| ** | Class T Shares use a beginning account value date of 07/05/17, and Class T Share expenses are equal to the Fund’s annualized expense ratio for the period since inception multiplied by the number of days since inception (180 days), then divided by 365. |
5
Summary of Portfolio Holdings (Unaudited)
The following table presents portfolio holdings as a percent of net assets as of December 31, 2017:
The Gabelli Asset Fund
| | | | |
Food and Beverage | | | 15.2 | % |
Financial Services | | | 11.1 | % |
Equipment and Supplies | | | 7.4 | % |
Entertainment | | | 5.7 | % |
Diversified Industrial | | | 5.3 | % |
Health Care | | | 4.9 | % |
Cable and Satellite | | | 4.5 | % |
Consumer Products | | | 4.2 | % |
Machinery | | | 4.2 | % |
Energy and Utilities | | | 3.4 | % |
Automotive: Parts and Accessories | | | 3.3 | % |
Business Services | | | 2.8 | % |
Environmental Services | | | 2.8 | % |
Electronics | | | 2.5 | % |
Broadcasting | | | 2.3 | % |
Retail | | | 2.1 | % |
Telecommunications | | | 2.1 | % |
Consumer Services | | | 1.9 | % |
Metals and Mining | | | 1.9 | % |
Specialty Chemicals | | | 1.8 | % |
Hotels and Gaming | | | 1.6 | % |
| | | | |
Aerospace | | | 1.5 | % |
Computer Software and Services | | | 1.5 | % |
Building and Construction | | | 1.2 | % |
Publishing | | | 1.2 | % |
Automotive | | | 1.0 | % |
Aviation: Parts and Services | | | 0.9 | % |
Wireless Communications | | | 0.8 | % |
Transportation | | | 0.7 | % |
Communications Equipment | | | 0.5 | % |
Closed-End Funds | | | 0.4 | % |
Agriculture | | | 0.4 | % |
Real Estate Investment Trusts | | | 0.4 | % |
Real Estate | | | 0.3 | % |
Manufactured Housing and Recreational Vehicles | | | 0.2 | % |
Computer Hardware | | | 0.0 | %* |
Airlines | | | 0.0 | %* |
Other Assets and Liabilities (Net) | | | (2.0 | )% |
| | | | |
| | | 100.0 | % |
| | | | |
| * | Amount represents less than 0.05%. |
The Fund files a complete schedule of portfolio holdings with the Securities and Exchange Commission (the “SEC”) for the first and third quarters of each fiscal year on Form N-Q. Shareholders may obtain this information at www.gabelli.com or by calling the Fund at 800-GABELLI (800-422-3554).The Fund’s Form N-Q is available on the SEC’s website at www.sec.gov and may also be reviewed and copied at the SEC’s Public Reference Room in Washington, DC. Information on the operation of the Public Reference Room may be obtained by calling 800-SEC-0330.
Proxy Voting
The Fund files Form N-PX with its complete proxy voting record for the twelve months ended June 30, no later than August 31 of each year. A description of the Fund’s proxy voting policies, procedures, and how the Fund voted proxies relating to portfolio securities is available without charge, upon request, by (i) calling 800-GABELLI (800-422-3554); (ii) writing to The Gabelli Funds at One Corporate Center, Rye, NY 10580-1422; or (iii) visiting the SEC’s website at www.sec.gov.
6
The Gabelli Asset Fund
Schedule of Investments — December 31, 2017
| | | | | | | | | | | | |
| | | | | | | | | Market | |
| Shares | | | | | Cost | | | Value | |
| | | | COMMON STOCKS — 101.6% | |
| | | | Aerospace — 1.5% | | | | | | | | |
| | 505,000 | | | Aerojet Rocketdyne Holdings Inc.† | | $ | 1,502,612 | | | $ | 15,756,000 | |
| | 5,000 | | | Lockheed Martin Corp. | | | 147,750 | | | | 1,605,250 | |
| | 6,000 | | | Northrop Grumman Corp. | | | 268,238 | | | | 1,841,460 | |
| | 1,716,100 | | | Rolls-Royce Holdings plc | | | 12,698,707 | | | | 19,624,885 | |
| | 85,840,600 | | | Rolls-Royce Holdings plc,
Cl. C†(a) | | | 113,743 | | | | 115,897 | |
| | 2,500 | | | The Boeing Co. | | | 162,911 | | | | 737,275 | |
| | | | | | | | | | | | |
| | | | | | | 14,893,961 | | | | 39,680,767 | |
| | | | | | | | | | | | |
| | | |
| | | | Agriculture — 0.4% | | | | | | | | |
| | 220,000 | | | Archer-Daniels-Midland Co. | | | 2,515,131 | | | | 8,817,600 | |
| | 2,000 | | | Monsanto Co. | | | 17,790 | | | | 233,560 | |
| | 6,500 | | | Potash Corp. of Saskatchewan Inc. | | | 29,744 | | | | 134,225 | |
| | 25,000 | | | The Mosaic Co. | | | 438,682 | | | | 641,500 | |
| | | | | | | | | | | | |
| | | | | | | 3,001,347 | | | | 9,826,885 | |
| | | | | | | | | | | | |
| | | |
| | | | Airlines — 0.0% | | | | | | | | |
| | 100,000 | | | American Airlines Group Inc., Escrow† | | | 1,464 | | | | 155,000 | |
| | | | | | | | | | | | |
| | | |
| | | | Automotive — 1.0% | | | | | | | | |
| | 5,000 | | | Ferrari NV | | | 201,374 | | | | 524,200 | |
| | 25,000 | | | General Motors Co. | | | 792,150 | | | | 1,024,750 | |
| | 397,000 | | | Navistar International Corp.† | | | 7,041,148 | | | | 17,023,360 | |
| | 91,500 | | | PACCAR Inc. | | | 468,321 | | | | 6,503,820 | |
| | 3,000 | | | Volkswagen AG | | | 119,556 | | | | 607,242 | |
| | | | | | | | | | | | |
| | | | | | | 8,622,549 | | | | 25,683,372 | |
| | | | | | | | | | | | |
| |
| | | | Automotive: Parts and Accessories — 3.3% | |
| | 140,000 | | | BorgWarner Inc. | | | 593,225 | | | | 7,152,600 | |
| | 90,000 | | | Brembo SpA | | | 173,237 | | | | 1,368,185 | |
| | 385,000 | | | Dana Inc. | | | 3,732,936 | | | | 12,323,850 | |
| | 435,000 | | | Genuine Parts Co. | | | 10,473,704 | | | | 41,329,350 | |
| | 70,000 | | | Modine Manufacturing Co.† | | | 630,668 | | | | 1,414,000 | |
| | 46,000 | | | O’Reilly Automotive Inc.† | | | 1,619,857 | | | | 11,064,840 | |
| | 30,000 | | | Standard Motor Products Inc. | | | 246,597 | | | | 1,347,300 | |
| | 70,000 | | | Superior Industries
International Inc. | | | 1,092,338 | | | | 1,039,500 | |
| | 85,000 | | | Tenneco Inc. | | | 2,519,000 | | | | 4,975,900 | |
| | 45,000 | | | Visteon Corp.† | | | 2,450,885 | | | | 5,631,300 | |
| | | | | | | | | | | | |
| | | | | | | 23,532,447 | | | | 87,646,825 | |
| | | | | | | | | | | | |
| |
| | | | Aviation: Parts and Services — 0.9% | |
| | 5,000 | | | Arconic Inc. | | | 65,322 | | | | 136,250 | |
| | 1,790,000 | | | BBA Aviation plc | | | 4,076,238 | | | | 8,451,422 | |
| | 53,500 | | | Curtiss-Wright Corp. | | | 163,845 | | | | 6,518,975 | |
| | 112,000 | | | Kaman Corp. | | | 1,635,409 | | | | 6,590,080 | |
| | 40,000 | | | KLX Inc.† | | | 1,574,270 | | | | 2,730,000 | |
| | | | | | | | | | | | |
| | | | | | | 7,515,084 | | | | 24,426,727 | |
| | | | | | | | | | | | |
| | | | | | | | | | | | |
| | | | | | | | | | | Market | |
| | Shares | | | | | | Cost | | | | Value | |
| |
| | | | Broadcasting — 2.3% | |
| | 291,600 | | | CBS Corp., Cl. A, Voting | | $ | 3,268,125 | | | $ | 17,303,544 | |
| | 18,000 | | | Cogeco Inc. | | | 342,646 | | | | 1,296,086 | |
| | 26,666 | | | Corus Entertainment Inc.,New
York, Cl. B | | | 43,320 | | | | 245,621 | |
| | 13,334 | | | Corus Entertainment Inc.,
Toronto, Cl. B | | | 21,662 | | | | 124,111 | |
| | 30,000 | | | ITV plc | | | 100,497 | | | | 67,035 | |
| | 35,250 | | | Liberty Broadband Corp.,
Cl. A† | | | 62,878 | | | | 2,998,013 | |
| | 103,682 | | | Liberty Broadband Corp.,
Cl. C† | | | 1,122,460 | | | | 8,829,559 | |
| | 33,000 | | | Liberty Media Corp.-
Liberty Formula One, Cl. A† | | | 15,739 | | | | 1,079,760 | |
| | 69,000 | | | Liberty Media Corp.-
Liberty Formula One, Cl. C† | | | 148,334 | | | | 2,357,040 | |
| | 55,000 | | | Liberty Media Corp.-
Liberty SiriusXM, Cl. A† | | | 22,830 | | | | 2,181,300 | |
| | 190,000 | | | Liberty Media Corp.-
Liberty SiriusXM, Cl. C† | | | 89,258 | | | | 7,535,400 | |
| | 330,000 | | | MSG Networks Inc., Cl. A† | | | 210,020 | | | | 6,682,500 | |
| | 10,000 | | | Naspers Ltd., Cl. N | | | 393,199 | | | | 2,789,250 | |
| | 95,000 | | | Pandora Media Inc.† | | | 917,554 | | | | 457,900 | |
| | 125,000 | | | Sky plc† | | | 1,589,574 | | | | 1,707,936 | |
| | 350,000 | | | Television Broadcasts Ltd. | | | 1,605,882 | | | | 1,258,824 | |
| | 40,000 | | | Tokyo Broadcasting System
Holdings Inc. | | | 560,409 | | | | 998,979 | |
| | 56,000 | | | Tribune Media Co., Cl. A | | | 2,098,400 | | | | 2,378,320 | |
| | | | | | | | | | | | |
| | | | | | | 12,612,787 | | | | 60,291,178 | |
| | | | | | | | | | | | |
| |
| | | | Building and Construction — 1.2% | |
| | 55,000 | | | Armstrong Flooring Inc.† | | | 978,889 | | | | 930,600 | |
| | 39,000 | | | Assa Abloy AB, Cl. B | | | 667,259 | | | | 810,133 | |
| | 145,000 | | | Fortune Brands Home &
Security Inc. | | | 1,923,822 | | | | 9,923,800 | |
| | 95,000 | | | Herc Holdings Inc.† | | | 3,472,847 | | | | 5,947,950 | |
| | 387,000 | | | Johnson Controls
International plc | | | 10,788,022 | | | | 14,748,570 | |
| | 14,500 | | | Layne Christensen Co.† | | | 148,784 | | | | 181,975 | |
| | | | | | | | | | | | |
| | | | | | | 17,979,623 | | | | 32,543,028 | |
| | | | | | | | | | | | |
| |
| | | | Business Services — 2.8% | |
| | 15,000 | | | Blucora Inc.† | | | 77,327 | | | | 331,500 | |
| | 225,000 | | | Clear Channel Outdoor
Holdings Inc., Cl. A | | | 888,132 | | | | 1,035,000 | |
| | 31,500 | | | Ecolab Inc. | | | 249,541 | | | | 4,226,670 | |
| | 140,000 | | | Fly Leasing Ltd., ADR† | | | 1,860,448 | | | | 1,807,400 | |
| | 206,000 | | | Gerber Scientific Inc.,
Escrow†(a) | | | 0 | | | | 0 | |
| | 165,000 | | | Live Nation Entertainment
Inc.† | | | 1,663,426 | | | | 7,024,050 | |
| | 142,900 | | | Macquarie Infrastructure
Corp. | | | 6,290,736 | | | | 9,174,180 | |
See accompanying notes to financial statements.
7
The Gabelli Asset Fund
Schedule of Investments (Continued) — December 31, 2017
| | | | | | | | | | |
| | | | | | | | Market | |
| Shares | | | | Cost | | | Value | |
| | COMMON STOCKS (Continued) | |
| | Business Services (Continued) | |
| 170,000 | | Mastercard Inc., Cl. A | | $ | 663,000 | | | $ | 25,731,200 | |
| 2,000 | | MSC Industrial Direct Co. Inc.,
Cl. A | | | 143,139 | | | | 193,320 | |
| 3,458 | | Novus Holdings Ltd. | | | 1,557 | | | | 1,649 | |
| 52,000 | | The Brink’s Co. | | | 1,227,229 | | | | 4,092,400 | |
| 717,000 | | The Interpublic Group of
Companies Inc. | | | 6,000,300 | | | | 14,454,720 | |
| 24,000 | | Vectrus Inc.† | | | 116,767 | | | | 740,400 | |
| 63,000 | | Visa Inc., Cl. A | | | 828,654 | | | | 7,183,260 | |
| | | | | | | | | | |
| | | | | 20,010,256 | | | | 75,995,749 | |
| | | | | | | | | | |
| | | |
| | Cable and Satellite — 4.5% | | | | | | | | |
| 143,000 | | AMC Networks Inc., Cl. A† | | | 69,252 | | | | 7,733,440 | |
| 200 | | Cable One Inc. | | | 50,326 | | | | 140,670 | |
| 10,000 | | Charter Communications Inc.,
Cl. A† | | | 1,078,622 | | | | 3,359,600 | |
| 456,000 | | Comcast Corp., Cl. A | | | 3,982,432 | | | | 18,262,800 | |
| 325,200 | | DISH Network Corp., Cl. A† | | | 7,505,839 | | | | 15,528,300 | |
| 91,000 | | EchoStar Corp., Cl. A† | | | 2,635,324 | | | | 5,450,900 | |
| 147,900 | | Liberty Global plc, Cl. A† | | | 525,759 | | | | 5,300,736 | |
| 407,000 | | Liberty Global plc, Cl. C† | | | 4,477,015 | | | | 13,772,880 | |
| 20,857 | | Liberty Global plc LiLAC,
Cl. A† | | | 77,222 | | | | 420,269 | |
| 46,740 | | Liberty Global plc LiLAC,
Cl. C† | | | 365,906 | | | | 929,659 | |
| 580,000 | | Rogers Communications Inc.,
New York, Cl. B | | | 2,952,981 | | | | 29,539,400 | |
| 50,000 | | Rogers Communications Inc.,
Toronto, Cl. B | | | 229,821 | | | | 2,547,733 | |
| 135,000 | | Scripps Networks Interactive
Inc., Cl. A | | | 4,168,682 | | | | 11,526,300 | |
| 118,000 | | Shaw Communications Inc.,
New York, Cl. B | | | 228,530 | | | | 2,693,940 | |
| 120,000 | | Shaw Communications Inc.,
Toronto, Cl. B | | | 164,952 | | | | 2,738,902 | |
| | | | | | | | | | |
| | | | | 28,512,663 | | | | 119,945,529 | |
| | | | | | | | | | |
| |
| | | Communications Equipment — 0.5% | |
| 180,000 | | Corning Inc. | | | 861,906 | | | | 5,758,200 | |
| 50,000 | | Harris Corp. | | | 3,976,644 | | | | 7,082,500 | |
| | | | | | | | | | |
| | | | | 4,838,550 | | | | 12,840,700 | |
| | | | | | | | | | |
| | | |
| | Computer Hardware — 0.0% | | | | | | | | |
| 7,000 | | Apple Inc. | | | 661,508 | | | | 1,184,610 | |
| | | | | | | | | | |
| |
| | Computer Software and Services — 1.5% | |
| 5,700 | | Alphabet Inc., Cl. C† | | | 3,123,555 | | | | 5,964,480 | |
| 6,400 | | CommerceHub Inc., Cl. A† | | | 10,400 | | | | 140,736 | |
| 20,400 | | CommerceHub Inc., Cl. C† | | | 57,662 | | | | 420,036 | |
| 67,000 | | Diebold Nixdorf Inc. | | | 1,771,565 | | | | 1,095,450 | |
| 55,000 | | Donnelley Financial Solutions
Inc.† | | | 1,168,854 | | | | 1,071,950 | |
| | | | | | | | | | | | |
| | | | | | | | | Market | |
| Shares | | | | | Cost | | | Value | |
| | | |
| 25,000 | | | DST Systems Inc. | | | $ | 848,111 | | | $ | 1,551,750 | |
| 160,000 | | | eBay Inc.† | | | | 3,271,276 | | | | 6,038,400 | |
| 50,000 | |
| Fidelity National Information
Services Inc. |
| | | 941,346 | | | | 4,704,500 | |
| 350,000 | |
| Hewlett Packard Enterprise
Co. |
| | | 3,602,326 | | | | 5,026,000 | |
| 65,000 | | | Internap Corp.† | | | | 1,016,720 | | | | 1,021,150 | |
| 20,000 | |
| Micro Focus International plc,
ADR† |
| | | 367,785 | | | | 671,800 | |
| 5,000 | | | Microsoft Corp. | | | | 158,896 | | | | 427,700 | |
| 7,992 | | | NetScout Systems Inc.† | | | | 29,395 | | | | 243,356 | |
| 55,000 | | | Rockwell Automation Inc. | | | | 1,567,537 | | | | 10,799,250 | |
| | | | | | | | | | | | |
| | | | | | | 17,935,428 | | | | 39,176,558 | |
| | | | | | | | | | | | |
| | |
| | | Consumer Products — 4.2% | | | | | |
| 30,000 | | | Brunswick Corp. | | | | 735,843 | | | | 1,656,600 | |
| 11,000 | | | Christian Dior SE | | | | 307,335 | | | | 4,019,546 | |
| 68,000 | | | Church & Dwight Co. Inc. | | | | 105,140 | | | | 3,411,560 | |
| 339,000 | | | Edgewell Personal Care Co.† | | | | 13,972,579 | | | | 20,133,210 | |
| 246,000 | | | Energizer Holdings Inc. | | | | 3,494,769 | | | | 11,803,080 | |
| 10,000 | | | Essity AB, Cl. A† | | | | 134,075 | | | | 282,454 | |
| 50,000 | | | Essity AB, Cl. B† | | | | 696,771 | | | | 1,420,195 | |
| 3,400 | | | Givaudan SA | | | | 1,182,809 | | | | 7,857,561 | |
| 30,000 | | | Harley-Davidson Inc. | | | | 75,562 | | | | 1,526,400 | |
| 2,000 | | | Hermes International | | | | 694,184 | | | | 1,070,863 | |
| 5,500 | |
| National Presto Industries
Inc. |
| | | 159,792 | | | | 546,975 | |
| 44,000 | | | Reckitt Benckiser Group plc | | | | 1,351,751 | | | | 4,110,334 | |
| 100,000 | | | Sally Beauty Holdings Inc.† | | | | 800,712 | | | | 1,876,000 | |
| 10,000 | | | Svenska Cellulosa AB, Cl. A | | | | 35,640 | | | | 115,810 | |
| 42,000 | | | Svenska Cellulosa AB, Cl. B | | | | 117,839 | | | | 432,897 | |
| 941,400 | | | Swedish Match AB | | | | 9,714,281 | | | | 37,090,914 | |
| 4,000 | |
| The Estee Lauder Companies
Inc., Cl. A |
| | | 180,995 | | | | 508,960 | |
| 112,000 | | | The Procter & Gamble Co. | | | | 3,707,935 | | | | 10,290,560 | |
| 30,000 | | | Unilever plc, ADR | | | | 947,306 | | | | 1,660,200 | |
| 35,000 | | | Wolverine World Wide Inc. | | | | 162,769 | | | | 1,115,800 | |
| | | | | | | | | | | | |
| | | | | | | 38,578,087 | | | | 110,929,919 | |
| | | | | | | | | | | | |
| | |
| | | Consumer Services — 1.9% | | | | |
| 5,000 | | | Allegion plc | | | | 50,325 | | | | 397,800 | |
| 94,000 | | | IAC/InterActiveCorp.† | | | | 981,587 | | | | 11,494,320 | |
| 20,000 | |
| Liberty Expedia Holdings Inc.,
Cl. A† |
| | | 89,074 | | | | 886,600 | |
| 435,600 | |
| Liberty Interactive Corp. QVC
Group,
Cl. A† |
| | | 2,597,883 | | | | 10,637,352 | |
| 18,000 | |
| Liberty TripAdvisor Holdings
Inc., Cl. A† |
| | | 75,083 | | | | 169,650 | |
| 85,000 | | | Liberty Ventures, Cl. A† | | | | 1,844,396 | | | | 4,610,400 | |
| 510,000 | | | Rollins Inc. | | | | 1,107,711 | | | | 23,730,300 | |
| | | | | | | | | | | | |
| | | | | | | 6,746,059 | | | | 51,926,422 | |
| | | | | | | | | | | | |
| | | | | | | | | | |
See accompanying notes to financial statements.
8
The Gabelli Asset Fund
Schedule of Investments (Continued) — December 31, 2017
| | | | | | | | | | | | |
| | Shares | | | | | | Cost | | | | Market Value | |
| | | | COMMON STOCKS (Continued) | | | | | | | | |
| | | | Diversified Industrial — 5.3% | | | | | | | | |
| | 500 | | | Acuity Brands Inc. | | $ | 5,901 | | | $ | 88,000 | |
| | 5,000 | | | Anixter International Inc.† | | | 45,044 | | | | 380,000 | |
| | 332,700 | | | Crane Co. | | | 5,252,447 | | | | 29,683,494 | |
| | 98,000 | | | Eaton Corp. plc | | | 4,394,256 | | | | 7,742,980 | |
| | 136,000 | | | Greif Inc., Cl. A | | | 3,098,343 | | | | 8,238,880 | |
| | 270,000 | | | Honeywell International Inc. | | | 7,617,349 | | | | 41,407,200 | |
| | 35,000 | | | HRG Group Inc.† | | | 501,007 | | | | 593,250 | |
| | 24,000 | | | Ingersoll-Rand plc | | | 355,983 | | | | 2,140,560 | |
| | 250,000 | | | ITT Inc. | | | 2,196,124 | | | | 13,342,500 | |
| | 30,000 | | | Jardine Matheson Holdings Ltd. | | | 1,557,901 | | | | 1,822,500 | |
| | 124,000 | | | Jardine Strategic Holdings Ltd. | | | 2,937,194 | | | | 4,907,920 | |
| | 250,000 | | | Myers Industries Inc. | | | 1,600,550 | | | | 4,875,000 | |
| | 30,000 | | | Pentair plc | | | 1,039,405 | | | | 2,118,600 | |
| | 11,500 | | | Sulzer AG | | | 1,058,641 | | | | 1,394,941 | |
| | 185,000 | | | Textron Inc. | | | 2,513,177 | | | | 10,469,150 | |
| | 330,000 | | | Toray Industries Inc. | | | 2,377,515 | | | | 3,111,826 | |
| | 230,000 | | | Trinity Industries Inc. | | | 1,242,169 | | | | 8,615,800 | |
| | 4,000 | | | Waters Corp.† | | | 299,744 | | | | 772,760 | |
| | | | | | | | | | | | |
| | | | | | | 38,092,750 | | | | 141,705,361 | |
| | | | | | | | | | | | |
| | | |
| | | | Electronics — 2.5% | | | | | | | | |
| | 120,000 | | | Cypress Semiconductor Corp. | | | 1,046,699 | | | | 1,828,800 | |
| | 1,800 | | | Fortive Corp. | | | 7,618 | | | | 130,230 | |
| | 8,000 | | | Kyocera Corp., ADR | | | 111,725 | | | | 524,080 | |
| | 1,500 | | | Mettler-Toledo International Inc.† | | | 212,220 | | | | 929,280 | |
| | 2,200 | | | Samsung Electronics Co. Ltd., GDR | | | 401,884 | | | | 2,635,600 | |
| | 910,000 | | | Sony Corp., ADR | | | 18,049,226 | | | | 40,904,500 | |
| | 40,000 | | | TE Connectivity Ltd. | | | 1,041,037 | | | | 3,801,600 | |
| | 110,000 | | | Texas Instruments Inc. | | | 2,632,733 | | | | 11,488,400 | |
| | 25,000 | | | Thermo Fisher Scientific Inc. | | | 3,077,409 | | | | 4,747,000 | |
| | | | | | | | | | | | |
| | | | | | | 26,580,551 | | | | 66,989,490 | |
| | | | | | | | | | | | |
| | | |
| | | | Energy and Utilities — 3.4% | | | | | | | | |
| | 10,000 | | | Anadarko Petroleum Corp. | | | 588,355 | | | | 536,400 | |
| | 115,000 | | | BP plc, ADR | | | 2,904,294 | | | | 4,833,450 | |
| | 105,500 | | | Chevron Corp. | | | 3,455,393 | | | | 13,207,545 | |
| | 154,000 | | | ConocoPhillips | | | 3,175,028 | | | | 8,453,060 | |
| | 113,000 | | | Devon Energy Corp. | | | 1,571,968 | | | | 4,678,200 | |
| | 4,000 | | | Edison International | | | 68,000 | | | | 252,960 | |
| | 204,000 | | | El Paso Electric Co. | | | 2,524,129 | | | | 11,291,400 | |
| | 34,500 | | | Enbridge Inc. | | | 793,780 | | | | 1,349,295 | |
| | 90,000 | | | EOG Resources Inc. | | | 206,089 | | | | 9,711,900 | |
| | 60,000 | | | Exxon Mobil Corp. | | | 872,888 | | | | 5,018,400 | |
| | 130,000 | | | GenOn Energy Inc., Escrow†(a) | | | 0 | | | | 0 | |
| | 167,000 | | | Halliburton Co. | | | 5,447,125 | | | | 8,161,290 | |
| | 65,000 | | | Kinder Morgan Inc. | | | 1,263,191 | | | | 1,174,550 | |
| | | | | | | | | | | | |
| Shares | | | | | Cost | | | Market Value | |
| | 13,000 | | | Marathon Petroleum Corp. | | $ | 625,725 | | | $ | 857,740 | |
| | 243,000 | | | National Fuel Gas Co. | | | 11,907,393 | | | | 13,343,130 | |
| | 56,400 | | | Oceaneering International Inc. | | | 1,485,871 | | | | 1,192,296 | |
| | 5,000 | | | Phillips 66 | | | 189,129 | | | | 505,750 | |
| | 53,000 | | | Southwest Gas Holdings Inc. | | | . 914,983 | | | | 4,265,440 | |
| | 95,000 | | | The AES Corp. | | | 263,150 | | | | 1,028,850 | |
| | 8,000 | | | Wartsila OYJ Abp | | | 406,645 | | | | 504,895 | |
| | 200,000 | | | Weatherford International plc† | | | 660,540 | | | | 834,000 | |
| | | | | | | | | | | | |
| | | | | | | 39,323,676 | | | | 91,200,551 | |
| | | | | | | | | | | | |
| | | |
| | | | Entertainment — 5.7% | | | | | | | | |
| | 195,500 | | | Discovery Communications Inc., Cl. A�� | | | 1,037,519 | | | | 4,375,290 | |
| | 515,000 | | | Discovery Communications Inc., Cl. C† | | | 2,243,552 | | | | 10,902,550 | |
| | 670,000 | | | Grupo Televisa SAB, ADR | | | 6,871,075 | | | | 12,508,900 | |
| | 19,000 | | | Liberty Media Corp.- Liberty Braves, Cl. A† | | | 97,219 | | | | 418,950 | |
| | 113,271 | | | Liberty Media Corp.- Liberty Braves, Cl. C† | | | 1,432,371 | | | | 2,516,882 | |
| | 60,120 | | | Lions Gate Entertainment Corp., Cl. B† | | | 1,569,132 | | | | 1,908,209 | |
| | 136,833 | | | The Madison Square Garden Co, Cl. A† | | | 1,162,705 | | | | 28,851,238 | |
| | 10,000 | | | Time Warner Inc. | | | 173,599 | | | | 914,700 | |
| | 2,015,000 | | | Twenty-First Century Fox Inc., Cl. A | | | 12,845,915 | | | | 69,577,950 | |
| | 35,000 | | | Twenty-First Century Fox Inc., Cl. B | | | 573,688 | | | | 1,194,200 | |
| | 421,500 | | | Viacom Inc., Cl. A | | | 12,206,958 | | | | 14,710,350 | |
| | 65,000 | | | Viacom Inc., Cl. B | | | 2,178,063 | | | | 2,002,650 | |
| | 50,000 | | | Vivendi SA | | | 1,170,712 | | | | 1,345,028 | |
| | | | | | | | | | | | |
| | | | | | | 43,562,508 | | | | 151,226,897 | |
| | | | | | | | | | | | |
| | |
| | | | Environmental Services — 2.8% | | | | | |
| | 590,000 | | | Republic Services Inc. | | | 7,191,475 | | | | 39,889,900 | |
| | 37,000 | | | Stericycle Inc.† | | | 2,627,309 | | | | 2,515,630 | |
| | 87,000 | | | Waste Connections Inc. | | | 3,055,362 | | | | 6,171,780 | |
| | 310,000 | | | Waste Management Inc. | | | 5,176,262 | | | | 26,753,000 | |
| | | | | | | | | | | | |
| | | | | | | 18,050,408 | | | | 75,330,310 | |
| | | | | | | | | | | | |
| | |
| | | | Equipment and Supplies — 7.4% | | | | | |
| | 733,000 | | | AMETEK Inc. | | | 1,139,519 | | | | 53,120,510 | |
| | 12,000 | | | Amphenol Corp., Cl. A | | | 23,162 | | | | 1,053,600 | |
| | 10,000 | | | AZZ Inc. | | | 370,300 | | | | 511,000 | |
| | 91,000 | | | CIRCOR International Inc. | | | 853,326 | | | | 4,429,880 | |
| | 110,000 | | | Crown Holdings Inc.† | | | 495,913 | | | | 6,187,500 | |
| | 159,000 | | | CTS Corp. | | | 917,800 | | | | 4,094,250 | |
| | 4,670 | | | Danaher Corp. | | | 31,340 | | | | 433,469 | |
| | 536,900 | | | Donaldson Co. Inc. | | | 969,929 | | | | 26,281,255 | |
| | 540,000 | | | Flowserve Corp. | | | 2,395,654 | | | | 22,750,200 | |
| | 159,000 | | | Graco Inc. | | | 2,667,022 | | | | 7,189,980 | |
See accompanying notes to financial statements.
9
The Gabelli Asset Fund
Schedule of Investments (Continued) — December 31, 2017
| | | | | | | | | | | | |
| | Shares | | | | | | Cost | | |
| Market
Value |
|
| | | | COMMON STOCKS (Continued) | | | | | |
| | | | Equipment and Supplies (Continued) | |
| | 222,400 | | | IDEX Corp. | | $ | 814,917 | | | $ | 29,350,128 | |
| | 50,000 | | | Interpump Group SpA | | | 196,504 | | | | 1,572,999 | |
| | 16,000 | | | Lawson Products Inc.† | | | 267,152 | | | | 396,000 | |
| | 130,000 | | | Mueller Industries Inc. | | | 3,471,364 | | | | 4,605,900 | |
| | 180,000 | | | Sealed Air Corp. | | | 3,933,222 | | | | 8,874,000 | |
| | 23,250 | | | The Manitowoc Co. Inc.† | | | 52,334 | | | | 914,655 | |
| | 50,000 | | | The Timken Co. | | | 1,857,522 | | | | 2,457,500 | |
| | 20,000 | | | The Toro Co. | | | 345,464 | | | | 1,304,600 | |
| | 75,000 | | | The Weir Group plc | | | 315,592 | | | | 2,149,772 | |
| | 22,500 | | | Valmont Industries Inc. | | | 180,803 | | | | 3,731,625 | |
| | 221,000 | | | Watts Water Technologies Inc., Cl. A | | | 2,509,516 | | | | 16,784,950 | |
| | | | | | | | | | | | |
| | | | | | | 23,808,355 | | | | 198,193,773 | |
| | | | | | | | | | | | |
| |
| | | | Financial Services — 11.1% | |
| | 13,200 | | | Alleghany Corp.† | | | 2,069,636 | | | | 7,868,388 | |
| | 70,000 | | | AllianceBernstein Holding LP | | | 807,518 | | | | 1,753,500 | |
| | 365,000 | | | American Express Co. | | | 9,375,690 | | | | 36,248,150 | |
| | 3,400 | | | Ameriprise Financial Inc. | | | 108,683 | | | | 576,198 | |
| | 32,000 | | | Argo Group International Holdings Ltd. | | | 833,710 | | | | 1,972,800 | |
| | 60,000 | | | Bank of America Corp. | | | 565,016 | | | | 1,771,200 | |
| | 143 | | | Berkshire Hathaway Inc., Cl. A† | | | 432,611 | | | | 42,556,801 | |
| | 5,500 | | | BKF Capital Group Inc.† | | | 142,350 | | | | 92,125 | |
| | 65,000 | | | Citigroup Inc. | | | 2,290,500 | | | | 4,836,650 | |
| | 100,000 | | | GAM Holding AG | | | 1,269,259 | | | | 1,616,296 | |
| | 176,000 | | | H&R Block Inc. | | | 2,893,545 | | | | 4,614,720 | |
| | 50,000 | | | Interactive Brokers Group Inc., Cl. A | | | 821,025 | | | | 2,960,500 | |
| | 199,300 | | | JPMorgan Chase & Co. | | | 7,731,109 | | | | 21,313,142 | |
| | 84,500 | | | Kinnevik AB, Cl. A | | | 1,743,248 | | | | 2,947,111 | |
| | 105,000 | | | Kinnevik AB, Cl. B | | | 2,774,036 | | | | 3,549,451 | |
| | 186,500 | | | KKR & Co. LP | | | 2,700,578 | | | | 3,927,690 | |
| | 184,000 | | | Legg Mason Inc. | | | 3,860,138 | | | | 7,724,320 | |
| | 3,300 | | | LendingTree Inc.† | | | 26,163 | | | | 1,123,485 | |
| | 35,000 | | | Leucadia National Corp. | | | 324,217 | | | | 927,150 | |
| | 40,000 | | | Loews Corp. | | | 1,577,090 | | | | 2,001,200 | |
| | 39,000 | | | M&T Bank Corp. | | | 2,750,938 | | | | 6,668,610 | |
| | 108,000 | | | Marsh & McLennan Companies Inc. | | | 3,082,858 | | | | 8,790,120 | |
| | 133,000 | | | PayPal Holdings Inc.† | | | 4,316,861 | | | | 9,791,460 | |
| | 28,500 | | | Popular Inc. | | | 548,132 | | | | 1,011,465 | |
| | 134,200 | | | State Street Corp. | | | 3,337,808 | | | | 13,099,262 | |
| | 20,000 | | | SunTrust Banks Inc. | | | 424,879 | | | | 1,291,800 | |
| | 48,500 | | | T. Rowe Price Group Inc. | | | 829,332 | | | | 5,089,105 | |
| | 671,900 | | | The Bank of New York Mellon Corp. | | | 19,273,559 | | | | 36,188,534 | |
| | 55,000 | | | The Blackstone Group LP | | | 640,470 | | | | 1,761,100 | |
| | 13,500 | | | The Goldman Sachs Group Inc. | | | 1,573,808 | | | | 3,439,260 | |
| | | | | | | | | | | | |
| | Shares | | | | | | Cost | | |
| Market
Value |
|
| | 95,000 | | | The Hartford Financial Services Group Inc. | | $ | 2,991,847 | | | $ | 5,346,600 | |
| | 134,000 | | | The PNC Financial Services Group Inc. | | | 7,679,889 | | | | 19,334,860 | |
| | 10,000 | | | Value Line Inc. | | | 137,382 | | | | 193,500 | |
| | 10,000 | | | W. R. Berkley Corp. | | | 361,815 | | | | 716,500 | |
| | 138,000 | | | Waddell & Reed Financial Inc., Cl. A | | | 2,713,147 | | | | 3,082,920 | |
| | 495,000 | | | Wells Fargo & Co. | | | 14,675,883 | | | | 30,031,650 | |
| | | | | | | | | | | | |
| | | | | | | 107,684,730 | | | | 296,217,623 | |
| | | | | | | | | | | | |
| | |
| | | | Food and Beverage — 15.2% | | | | | |
| | 919,900 | | | Brown-Forman Corp., Cl. A | | | 5,240,951 | | | | 61,854,076 | |
| | 124,000 | | | Brown-Forman Corp., Cl. B | | | 889,305 | | | | 8,515,080 | |
| | 46,000 | | | Campbell Soup Co. | | | 1,336,867 | | | | 2,213,060 | |
| | 800,000 | | | China Mengniu Dairy Co. Ltd. | | | 1,191,136 | | | | 2,380,693 | |
| | 35,000 | | | Chr. Hansen Holding A/S | | | 1,502,296 | | | | 3,282,995 | |
| | 25,000 | | | Coca-Cola European Partners plc | | | 489,113 | | | | 996,250 | |
| | 16,500 | | | Coca-Cola HBC AG | | | 231,193 | | | | 539,114 | |
| | 355,000 | | | Conagra Brands Inc. | | | 8,856,255 | | | | 13,372,850 | |
| | 30,000 | | | Constellation Brands Inc., Cl. A | | | 713,936 | | | | 6,857,100 | |
| | 40,000 | | | Crimson Wine Group Ltd.† | | | 315,347 | | | | 426,800 | |
| | 225,000 | | | Danone SA | | | 10,381,351 | | | | 18,884,083 | |
| | 846,200 | | | Davide Campari-Milano SpA | | | 2,709,854 | | | | 6,543,673 | |
| | 280,000 | | | Diageo plc, ADR | | | 10,134,633 | | | | 40,888,400 | |
| | 64,000 | | | Dr Pepper Snapple Group Inc. | | | 1,227,565 | | | | 6,211,840 | |
| | 80,000 | | | Farmer Brothers Co.† | | | 983,002 | | | | 2,572,000 | |
| | 310,000 | | | Flowers Foods Inc. | | | 544,307 | | | | 5,986,100 | |
| | 40,000 | | | Fomento Economico Mexicano SAB de CV, ADR | | | 1,367,763 | | | | 3,756,000 | |
| | 445,000 | | | General Mills Inc. | | | 8,126,686 | | | | 26,384,050 | |
| | 1,900,000 | | | Grupo Bimbo SAB de CV, Cl. A | | | 789,305 | | | | 4,210,197 | |
| | 10,000 | | | Heineken Holding NV | | | 407,450 | | | | 989,753 | |
| | 86,500 | | | Heineken NV | | | 3,933,214 | | | | 9,022,179 | |
| | 20,000 | | | Heineken NV, ADR | | | 481,150 | | | | 1,042,400 | |
| | 2,000 | | | Ingredion Inc. | | | 24,050 | | | | 279,600 | |
| | 160,000 | | | ITO EN Ltd. | | | 3,457,147 | | | | 6,304,859 | |
| | 11,000 | | | John Bean Technologies Corp. | | | 172,494 | | | | 1,218,800 | |
| | 78,000 | | | Kellogg Co. | | | 3,698,832 | | | | 5,302,440 | |
| | 74,300 | | | Kerry Group plc, Cl. A | | | 971,930 | | | | 8,340,742 | |
| | 440,000 | | | Kikkoman Corp. | | | 5,028,091 | | | | 17,806,967 | |
| | 135,000 | | | Lamb Weston Holdings Inc. | | | 3,022,124 | | | | 7,620,750 | |
| | 19,800 | | | LVMH Moet Hennessy Louis Vuitton SE | | | 701,482 | | | | 5,829,958 | |
| | 147,000 | | | Maple Leaf Foods Inc. | | | 2,674,189 | | | | 4,188,974 | |
| | 25,000 | | | MEIJI Holdings Co. Ltd. | | | 551,956 | | | | 2,127,801 | |
| | 434,000 | | | Mondelēz International Inc., Cl. A | | | 10,085,269 | | | | 18,575,200 | |
See accompanying notes to financial statements.
10
The Gabelli Asset Fund
Schedule of Investments (Continued) — December 31, 2017
| | | | | | | | | | | | |
| Shares | | | | | Cost | | | Market
Value | |
| | | | COMMON STOCKS (Continued) | | | | | | | | |
| | | | Food and Beverage (Continued) | | | | | | | | |
| | 49,000 | | | Morinaga Milk Industry Co. Ltd. | | $ | 909,693 | | | $ | 2,217,883 | |
| | 400 | | | National Beverage Corp. | | | 29,275 | | | | 38,976 | |
| | 63,000 | | | Nestlé SA | | | 3,951,991 | | | | 5,417,825 | |
| | 150,000 | | | Nissin Foods Holdings Co. Ltd. | | | 5,104,026 | | | | 10,956,290 | |
| | 225,000 | | | Parmalat SpA | | | 631,083 | | | | 836,893 | |
| | 86,000 | | | PepsiCo Inc. | | | 2,938,606 | | | | 10,313,120 | |
| | 67,000 | | | Pernod Ricard SA | | | 5,953,420 | | | | 10,607,422 | |
| | 131,000 | | | Post Holdings Inc.† | | | 3,344,120 | | | | 10,379,130 | |
| | 93,000 | | | Remy Cointreau SA | | | 5,655,846 | | | | 12,888,150 | |
| | 110,000 | | | Snyder’s-Lance Inc. | | | 2,651,052 | | | | 5,508,800 | |
| | 17,000 | | | Suntory Beverage & Food Ltd . | | | 541,830 | | | | 755,891 | |
| | 13,000 | | | The Kraft Heinz Co. | | | 819,116 | | | | 1,010,880 | |
| | 60,000 | | | The Coca-Cola Co. | | | 1,319,146 | | | | 2,752,800 | |
| | 30,000 | | | The Hain Celestial Group Inc.† | | | 231,652 | | | | 1,271,700 | |
| | 21,000 | | | The J.M. Smucker Co. | | | 729,807 | | | | 2,609,040 | |
| | 400,000 | | | Tingyi (Cayman Islands) Holding Corp. | | | 947,408 | | | | 778,205 | |
| | 147,559 | | | Tootsie Roll Industries Inc. | | | 1,331,152 | | | | 5,371,148 | |
| | 5,000 | | | Tyson Foods Inc., Cl. A | | | 39,954 | | | | 405,350 | |
| | 85,000 | | | United Natural Foods Inc.† | | | 3,211,304 | | | | 4,187,950 | |
| | 162,300 | | | Yakult Honsha Co. Ltd. | | | 3,942,727 | | | | 12,243,621 | |
| | | | | | | | | | | | |
| | | | | | | 136,523,451 | | | | 405,075,858 | |
| | | | | | | | | | | | |
| | | |
| | | | Health Care — 4.9% | | | | | | | | |
| | 15,000 | | | Abbott Laboratories | | | 819,444 | | | | 856,050 | |
| | 35,000 | | | Akorn Inc.† | | | 746,679 | | | | 1,128,050 | |
| | 8,000 | | | Alexion Pharmaceuticals Inc.† | | | 904,522 | | | | 956,720 | |
| | 30,500 | | | Allergan plc | | | 4,525,694 | | | | 4,989,190 | |
| | 47,000 | | | AmerisourceBergen Corp. | | | 3,252,723 | | | | 4,315,540 | |
| | 30,500 | | | Amgen Inc. | | | 141,229 | | | | 5,303,950 | |
| | 15,000 | | | AngioDynamics Inc.† | | | 148,953 | | | | 249,450 | |
| | 55,372 | | | Baxter International Inc. | | | 1,563,995 | | | | 3,579,246 | |
| | 7,500 | | | Becton, Dickinson and Co. | | | 754,832 | | | | 1,605,450 | |
| | 11,000 | | | Biogen Inc.† | | | 70,260 | | | | 3,504,270 | |
| | 4,600 | | | Bio-Rad Laboratories Inc., | | | | | | | | |
| | | | Cl. A† | | | 449,240 | | | | 1,097,882 | |
| | 350,000 | | | BioScrip Inc.† | | | 700,000 | | | | 1,018,500 | |
| | 5,000 | | | Bioverativ Inc.† | | | 5,527 | | | | 269,600 | |
| | 68,000 | | | Boston Scientific Corp.† | | | 468,300 | | | | 1,685,720 | |
| | 125,000 | | | Bristol-Myers Squibb Co. | | | 3,218,850 | | | | 7,660,000 | |
| | 70,000 | | | Cardiovascular Systems Inc.† | | | 2,067,316 | | | | 1,658,300 | |
| | 53,200 | | | Chemed Corp. | | | 2,681,110 | | | | 12,928,664 | |
| | 10,000 | | | Cigna Corp. | | | 511,183 | | | | 2,030,900 | |
| | 26,000 | | | CONMED Corp. | | | 523,478 | | | | 1,325,220 | |
| | 45,000 | | | DaVita Inc.† | | | 2,661,123 | | | | 3,251,250 | |
| | 28,000 | | | Eli Lilly & Co. | | | 985,188 | | | | 2,364,880 | |
| | 55,000 | | | Endo International plc† | | | 850,777 | | | | 426,250 | |
| | 40,000 | | | Envision Healthcare Corp.† | | | 2,276,302 | | | | 1,382,400 | |
| | | | | | | | | | | | |
| Shares | | | | | Cost | | | Market Value | |
| | 90,000 | | | Evolent Health Inc., Cl. A† | | $ | 1,556,160 | | | $ | 1,107,000 | |
| | 42,000 | | | Exactech Inc.† | | | 635,561 | | | | 2,076,900 | |
| | 10,000 | | | Express Scripts Holding Co.† | | | 636,597 | | | | 746,400 | |
| | 20,000 | | | Gerresheimer AG | | | 1,276,756 | | | | 1,658,668 | |
| | 50,000 | | | HCA Healthcare Inc.† | | | 3,233,450 | | | | 4,392,000 | |
| | 61,400 | | | Henry Schein Inc.† | | | 1,201,616 | | | | 4,290,632 | |
| | 40,000 | | | Indivior plc† | | | 25,984 | | | | 220,452 | |
| | 15,000 | | | Integer Holdings Corp.† | | | 696,516 | | | | 679,500 | |
| | 69,500 | | | Johnson & Johnson | | | 4,353,938 | | | | 9,710,540 | |
| | 70,000 | | | Kindred Healthcare Inc. | | | 763,987 | | | | 679,000 | |
| | 8,000 | | | Laboratory Corp. of America Holdings† | | | 1,216,795 | | | | 1,276,080 | |
| | 15,000 | | | McKesson Corp. | | | 1,345,822 | | | | 2,339,250 | |
| | 25,000 | | | Medtronic plc | | | 1,881,416 | | | | 2,018,750 | |
| | 124,500 | | | Merck & Co. Inc. | | | 3,499,931 | | | | 7,005,615 | |
| | 30,000 | | | Mylan NV† | | | 1,736,680 | | | | 1,269,300 | |
| | 30,432 | | | Orthofix International NV† | | | 1,015,782 | | | | 1,664,630 | |
| | 30,000 | | | Owens & Minor Inc. | | | 902,440 | | | | 566,400 | |
| | 50,000 | | | Patterson Cos., Inc. | | | 1,641,748 | | | | 1,806,500 | |
| | 44,000 | | | Quidel Corp.† | | | 603,237 | | | | 1,907,400 | |
| | 400 | | | Regeneron Pharmaceuticals Inc.† | | | 43,670 | | | | 150,384 | |
| | 75,000 | | | Roche Holding AG, ADR | | | 1,477,507 | | | | 2,368,500 | |
| | 13,000 | | | Shire plc, ADR | | | 2,033,769 | | | | 2,016,560 | |
| | 14,500 | | | Stryker Corp. | | | 718,606 | | | | 2,245,180 | |
| | 4,000 | | | The Cooper Companies Inc. | | | 941,320 | | | | 871,520 | |
| | 10,000 | | | UnitedHealth Group Inc. | | | 580,641 | | | | 2,204,600 | |
| | 20,000 | | | Valeant Pharmaceuticals International Inc.† | | | 289,886 | | | | 415,600 | |
| | 135,000 | | | William Demant Holding A/S† | | | 1,265,291 | | | | 3,774,961 | |
| | 94,000 | | | Wright Medical Group NV† | | | 1,935,460 | | | | 2,086,800 | |
| | 40,000 | | | Zimmer Biomet Holdings Inc. | | | 3,775,284 | | | | 4,826,800 | |
| | 9,000 | | | Zoetis Inc. | | | 396,508 | | | | 648,360 | |
| | | | | | | | | | | | |
| | | | | | | 72,009,083 | | | | 130,611,764 | |
| | | | | | | | | | | | |
| | | |
| | | | Hotels and Gaming — 1.6% | | | | | | | | |
| | 14,000 | | | Accor SA | | | 433,947 | | | | 722,308 | |
| | 56,000 | | | Belmond Ltd., Cl. A† | | | 486,228 | | | | 686,000 | |
| | 6,700 | | | Churchill Downs Inc. | | | 233,125 | | | | 1,559,090 | |
| | 350,000 | | | Genting Singapore plc | | | 367,220 | | | | 342,817 | |
| | 36,000 | | | Hyatt Hotels Corp., Cl. A† | | | 1,348,724 | | | | 2,647,440 | |
| | 88,000 | | | ILG Inc. | | | 559,440 | | | | 2,506,240 | |
| | 50,000 | | | Las Vegas Sands Corp. | | | 146,017 | | | | 3,474,500 | |
| | 4,700,000 | | | Mandarin Oriental International Ltd. | | | 8,149,597 | | | | 9,494,000 | |
| | 387,000 | | | MGM Resorts International | | | 3,971,351 | | | | 12,921,930 | |
| | 2,000,000 | | | The Hongkong & Shanghai Hotels Ltd. | | | 2,722,562 | | | | 2,969,467 | |
| | 52,000 | | | Universal Entertainment Corp . | | | 323,568 | | | | 1,915,243 | |
| | 8,400 | | | Wyndham Worldwide Corp. | | | 204,783 | | | | 973,308 | |
| | 14,000 | | | Wynn Resorts Ltd. | | | 1,103,588 | | | | 2,360,260 | |
| | | | | | | | | | | | |
| | | | | | | 20,050,150 | | | | 42,572,603 | |
| | | | | | | | | | | | |
See accompanying notes to financial statements.
11
The Gabelli Asset Fund
Schedule of Investments (Continued) — December 31, 2017
| | | | | | | | | | | | |
| | | | | | | | | Market | |
| Shares | | | | | Cost | | | Value | |
| | | | COMMON STOCKS (Continued) | | | | | | | | |
| | | | Machinery — 4.2% | | | | | | | | |
| | 121,000 | | | Caterpillar Inc. | | $ | 796,494 | | | $ | 19,067,180 | |
| | 1,382,000 | | | CNH Industrial NV | | | 10,790,272 | | | | 18,518,800 | |
| | 218,600 | | | CNH Industrial NV, Borsa
ltaliana | | | 2,006,098 | | | | 2,929,739 | |
| | 226,000 | | | Deere & Co. | | | 1,592,016 | | | | 35,371,260 | |
| | 50,000 | | | Mueller Water Products Inc.,
Cl. A | | | 414,557 | | | | 626,500 | |
| | 93,000 | | | Welbilt Inc.† | | | 175,205 | | | | 2,186,430 | |
| | 472,000 | | | Xylem Inc. | | | 4,099,802 | | | | 32,190,400 | |
| | | | | | | | | | | | |
| | | | | | | 19,874,444 | | | | 110,890,309 | |
| | | | | | | | | | | | |
| |
| | | | Manufactured Housing and Recreational Vehicles — 0.2% | |
| | 31,500 | | | Cavco Industries Inc.† | | | 596,101 | | | | 4,806,900 | |
| | 20,000 | | | Nobility Homes Inc. | | | 192,816 | | | | 392,500 | |
| | 32,500 | | | Skyline Corp.† | | | 177,923 | | | | 417,625 | |
| | | | | | | | | | | | |
| | | | | | 966,840 | | | 5,617,025 | |
| | | | | | | | | | | | |
| | | |
| | | | Metals and Mining — 1.9% | | | | | | | | |
| | 56,000 | | | Agnico Eagle Mines Ltd. | | | 1,821,420 | | | | 2,586,080 | |
| | 234,000 | | | Barrick Gold Corp. | | | 3,615,288 | | | | 3,385,980 | |
| | 30,000 | | | Cleveland-Cliffs Inc.† | | | 199,316 | | | | 216,300 | |
| | 90,000 | | | Franco-Nevada Corp. | | | 3,113,147 | | | | 7,195,500 | |
| | 156,000 | | | Freeport-McMoRan Inc.† | | | 1,823,564 | | | | 2,957,760 | |
| | 60,000 | | | Kinross Gold Corp.† | | | 376,124 | | | | 259,200 | |
| | 24,000 | | | New Hope Corp. Ltd. | | | 32,183 | | | | 46,815 | |
| | 522,000 | | | Newmont Mining Corp. | | | 10,759,240 | | | | 19,585,440 | |
| | 124,000 | | | Royal Gold Inc. | | | 5,388,241 | | | | 10,182,880 | |
| | 52,609 | | | TimkenSteel Corp.† | | | 633,484 | | | | 799,131 | |
| | 180,000 | | | Turquoise Hill Resources Ltd.† | | | 617,436 | | | | 617,400 | |
| | 84,000 | | | Wheaton Precious Metals Corp. | | | 1,589,928 | | | | 1,858,920 | |
| | | | | | | | | | | | |
| | | | | | | 29,969,371 | | | | 49,691,4.06 | |
| | | | | | | | | | | | |
| | | |
| | | | Publishing — 1.2% | | | | | | | | |
| | 500 | | | Graham Holdings Co., Cl. B | | | 212,689 | | | | 279,175 | |
| | 52,000 | | | Meredith Corp. | | | 1,083,832 | | | | 3,434,600 | |
| | 128,000 | | | News Corp., Cl. A | | | 638,332 | | | | 2,074,880 | |
| | 85,000 | | | News Corp., Cl. B | | | 1,148,540 | | | | 1,411,000 | |
| | 122,000 | | | S&P Global Inc. | | | 962,609 | | | | 20,666,800 | |
| | 215,000 | | | The E.W. Scripps Co., Cl. A† | | | 2,665,801 | | | | 3,360,450 | |
| | 10,000 | | | The New York Times Co., Cl. A | | | 89,319 | | | | 185,000 | |
| | | | | | | | | | | | |
| | | | | | | 6,801,122 | | | | 31,411,905 | |
| | | | | | | | | | | | |
| |
| | | | Real Estate — 0.3% | |
| | 16,500 | | | Brookfield Asset Management Inc., Cl. A | | | 291,551 | | | | 718,410 | |
| | 104,000 | | | Griffin Industrial Realty Inc. | | | 1,510,666 | | | | 3,816,800 | |
| | 240,500 | | | The St. Joe Co.† | | | 1,857,594 | | | | 4,341,025 | |
| | | | | | | | | | | | |
| | | | | | | 3,659,811 | | | | 8,876,235 | |
| | | | | | | | | | | | |
| | | | | | | | | | | | |
| | | | | | | | | Market | |
| Shares | | | | | Cost | | | Value | |
| | | | Real Estate Investment Trusts — 0.4% | |
| | 14,422 | | | Host Hotels & Resorts Inc. | | $ | 290,636 | | | $ | 286,277 | |
| | 85,000 | | | Ryman Hospitality Properties Inc. | | | 3,702,677 | | | | 5,866,700 | |
| | 100,000 | | | Weyerhaeuser Co. | | | 2,070,571 | | | | 3,526,000 | |
| | | | | | | | | | | | |
| | | | | | | 6,063,884 | | | | 9,678,977 | |
| | | | | | | | | | | | |
| | | |
| | | | Retail — 2.1% | | | | | | | | |
| | 50,000 | | | Aaron’s Inc. | | | 120,635 | | | | 1,992,500 | |
| | 134,000 | | | AutoNation Inc.† | | | 1,932,601 | | | | 6,878,220 | |
| | 59,500 | | | Costco Wholesale Corp. | | | 3,014,119 | | | | 11,074,140 | |
| | 170,000 | | | CVS Health Corp. | | | 5,524,650 | | | | 12,325,000 | |
| | 40,000 | | | HSN Inc. | | | 1,108,605 | | | | 1,614,000 | |
| | 400,000 | | | Lianhua Supermarket
Holdings Ltd., Cl. H† | | | 369,337 | | | | 145,401 | |
| | 140,000 | | | Macy’s Inc. | | | 1,804,921 | | | | 3,526,600 | |
| | 50,000 | | | Murphy USA Inc.† | | | 2,116,202 | | | | 4,018,000 | |
| | 15,100 | | | Penske Automotive Group Inc. | | | 584,946 | | | | 722,535 | |
| | 10,000 | | | Rush Enterprises Inc., Cl. B† | | | 227,459 | | | | 482,100 | |
| | 45,000 | | | The Cheesecake Factory Inc. | | | 1,330,530 | | | | 2,168,100 | |
| | 27,000 | | | The Home Depot Inc. | | | 838,109 | | | | 5,117,310 | |
| | 127,000 | | | The Kroger Co. | | | 385,941 | | | | 3,486,150 | |
| | 35,000 | | | Walgreens Boots Alliance Inc. | | | 2,017,756 | | | | 2,541,700 | |
| | | | | | | | | | | | |
| | | | | | | 21,375,811 | | | | 56,091,756 | |
| | | | | | | | | | | | |
| |
| | | | Specialty Chemicals — 1.8% | |
| | 20,000 | | | Ashland Global Holdings Inc. | | | 747,123 | | | | 1,424,000 | |
| | 27,000 | | | DowDuPont Inc. | | | 1,934,519 | | | | 1,922,940 | |
| | 500,000 | | | Ferro Corp.† | | | 3,400,844 | | | | 11,795,000 | |
| | 138,000 | | | H.B. Fuller Co. | | | 3,878,767 | | | | 7,434,060 | |
| | 100,000 | | | International Flavors & Fragrances Inc. | | | 4,523,390 | | | | 15,261,000 | |
| | 360,000 | | | OMNOVA Solutions Inc.† | | | 985,718 | | | | 3,600,000 | |
| | 9,000 | | | Praxair Inc. | | | 919,375 | | | | 1,392,120 | |
| | 63,000 | | | Sensient Technologies Corp. | | | 1,057,023 | | | | 4,608,450 | |
| | 45,000 | | | SGL Carbon SE† | | | 656,508 | | | | 614,981 | |
| | 51,000 | | | Valvoline Inc. | | | 674,661 | | | | 1,278,060 | |
| | | | | | | | | | | | |
| | | | | | | 18,777,928 | | | | 49,330,611 | |
| | | | | | | | | | | | |
| |
| | | | Telecommunications — 2.1% | |
| | 87,144 | | | CenturyLink Inc. | | | 1,332,239 | | | | 1,453,562 | |
| | 212,000 | | | Cincinnati Bell Inc.† | | | 3,512,173 | | | | 4,420,200 | |
| | 160,000 | | | Deutsche Telekom AG, ADR | | | 2,418,914 | | | | 2,825,760 | |
| | 30,000 | | | Hellenic Telecommunications Organization SA | | | 435,110 | | | | 413,947 | |
| | 25,000 | | | Hellenic Telecommunications Organization SA, ADR | | | 111,368 | | | | 170,375 | |
| | 71,607 | | | Loral Space & Communications Inc.† | | | 2,758,186 | | | | 3,154,288 | |
| | 6,000 | | | Orange SA, ADR | | | 63,335 | | | | 104,400 | |
| | 400,000 | | | Sprint Corp.† | | | 2,181,132 | | | | 2,356,000 | |
| | 2,815,600 | | | Telecom Italia SpA† | | | 1,527,200 | | | | 2,434,056 | |
See accompanying notes to financial statements.
12
The Gabelli Asset Fund
Schedule of Investments (Continued) — December 31, 2017
| | | | | | | | | | | | |
Shares | | | | | Cost | | | Market Value | |
| | | | COMMON STOCKS (Continued) | |
| | | | Telecommunications (Continued) | |
| | 175,000 | | | Telecom Italia SpA, ADR† | | $ | 1,222,253 | | | $ | 1,510,250 | |
| | 39,981 | | | Telefonica Brasil SA, ADR | | | 373,700 | | | | 592,918 | |
| | 245,000 | | | Telefonica SA, ADR | | | 2,812,942 | | | | 2,371,600 | |
| | 977,510 | | | Telephone & Data Systems Inc. | | | 19,611,787 | | | | 27,174,778 | |
| | 230,000 | | | Telesites SAB de CV† | | | 154,371 | | | | 174,525 | |
| | 145,000 | | | VEON Ltd., ADR | | | 603,407 | | | | 556,800 | |
| | 100,000 | | | Verizon Communications Inc. | | | 3,158,369 | | | | 5,293,000 | |
| | | | | | | | | | | | |
| | | | | | | 42,276,486 | | | | 55,006,459 | |
| | | | | | | | | | | | |
| |
| | | | Transportation — 0.7% | |
| | 284,000 | | | GATX Corp. | | | 7,354,103 | | | | 17,653,440 | |
| | 4,000 | | | Kansas City Southern | | | 7,317 | | | | 420,880 | |
| | | | | | | | | | | | |
| | | | | | | 7,361,420 | | | | 18,074,320 | |
| | | | | | | | | | | | |
| |
| | | | Wireless Communications — 0.8% | |
| | 40,000 | | | Altice USA Inc., Cl. A† | | | 1,156,925 | | | | 849,200 | |
| | 115,000 | | | America Movil SAB de CV,
Cl. L, ADR | | | 351,470 | | | | 1,972,250 | |
| | 14,000 | | | Millicom International Cellular SA | | | 885,695 | | | | 943,740 | |
| | 53,000 | | | Millicom International Cellular SA, SDR | | | 3,285,419 | | | | 3,579,379 | |
| | 208,000 | | | NTT DoCoMo Inc. | | | 2,956,445 | | | | 4,912,252 | |
| | 20,000 | | | Tim Participacoes SA, ADR | | | 148,920 | | | | 386,200 | |
| | 50,000 | | | T-Mobile US Inc.† | | | 1,496,458 | | | | 3,175,500 | |
| | 137,000 | | | United States Cellular Corp.† | | | 6,469,656 | | | | 5,155,310 | |
| | | | | | | | | | | | |
| | | | | | | 16,750,988 | | | | 20,973,831 | |
| | | | | | | | | | | | |
| | | |
| | | | TOTAL COMMON STOCKS | | | 905,005,580 | | | | 2,707,020,333 | |
| | | | | | | | | | | | |
| |
| | | | CLOSED-END FUNDS — 0.4% | |
| | 122,000 | | | Altaba Inc.† | | | 1,877,757 | | | | 8,521,700 | |
| | 11,417 | | | Royce Global Value Trust Inc. | | | 99,328 | | | | 123,418 | |
| | 79,500 | | | Royce Value Trust Inc. | | | 972,272 | | | | 1,285,515 | |
| | | | | | | | | | | | |
| | | | | | | 2,949,357 | | | | 9,930,633 | |
| | | | | | | | | | | | |
| | | | TOTAL CLOSED-END FUNDS | | | 2,949,357 | | | | 9,930,633 | |
| | | | | | | | | | | | |
| | | | | | | | | | | | |
Shares | | | | | Cost | | | Market Value | |
| | | | PREFERRED STOCKS — 0.0% | |
| | | | Health Care — 0.0% | |
| | 31,580 | | | The Phoenix Companies Inc., 7.450%, 01/15/32 | | $ | 674,937 | | | $ | 577,014 | |
| | | | | | | | | | | | |
| |
| | | | RIGHTS — 0.0% | |
| | | | Health Care — 0.0% | |
| | 20,000 | | | American Medical Alert Corp., †(a) | | | 0 | | | | 200 | |
| | | | | | | | | | | | |
| |
| | | | WARRANTS — 0.0% | |
| | | | Hotels and Gaming — 0.0% | |
| | 200,000 | | | The Indian Hotels Co. Ltd., expire 05/14/18†(b) | | | 329,280 | | | | 369,000 | |
| | | | | | | | | | | | |
| | | |
| | | | TOTAL
INVESTMENTS — 102.0% | | $ | 908,959,154 | | | | 2,717,897,180 | |
| | | | | | | | | | | | |
| | |
| | | | Other Assets and Liabilities (Net) — (2.0)% | | | | (52,667,782 | ) |
| | | | | | | | | | | | |
| | | | NET ASSETS — 100.0% | | | | | | $ | 2,665,229,398 | |
| | | | | | | | | | | | |
| (a) | Security is valued using significant unobservable inputs and is classified as Level 3 in the fair value hierarchy. |
| (b) | Security exempt from registration under Rule 144A of the Securities Act of 1933, as amended. This security may be resold in transactions exempt from registration, normally to qualified institutional buyers. At December 31, 2017, the market value of the Rule 144A security amounted to $369,000 or 0.01% of net assets. |
| † | Non-income producing security. |
| ADR | American Depositary Receipt |
| GDR | Global Depositary Receipt |
| SDR | Swedish Depositary Receipt |
See accompanying notes to financial statements.
13
The Gabelli Asset Fund
Statement of Assets and Liabilities
December 31, 2017
| | | | | |
Assets: | | | | | |
Investments, at value (cost $908,959,154) | | | $ | 2,717,897,180 | |
Foreign currency, at value (cost $149) | | | | 149 | |
Cash | | | | 9,036 | |
Receivable for Fund shares sold | | | | 282,221 | |
Dividends and interest receivable | | | | 2,878,161 | |
Prepaid expenses | | | | 70,739 | |
| | | | | |
Total Assets | | | | 2,721,137,486 | |
| | | | | |
Liabilities: | | | | | |
Payable for Fund shares redeemed | | | | 20,770,428 | |
Payable for investment advisory fees | | | | 2,291,480 | |
Payable for distribution fees | | | | 484,695 | |
Payable for accounting fees | | | | 3,750 | |
Line of credit payable | | | | 31,850,000 | |
Other accrued expenses | | | | 507,735 | |
| | | | | |
Total Liabilities | | | | 55,908,088 | |
| | | | | |
Net Assets | | | | | |
(applicable to 45,315,338 shares outstanding) | | | $ | 2,665,229,398 | |
| | | | | |
Net Assets Consist of: | | | | | |
Paid-in capital | | | $ | 868,330,318 | |
Distributions in excess of net investment income | | | | (758,546 | ) |
Distributions in excess of net realized gain on investments and foreign currency transactions | | | | (11,283,320 | ) |
Net unrealized appreciation on investments | | | | 1,808,938,026 | |
Net unrealized appreciation on foreign currency translations | | | | 2,920 | |
| | | | | |
Net Assets | | | $ | 2,665,229,398 | |
| | | | | |
| | | | | |
Shares of Beneficial Interest, each at $0.01 par value; unlimited number of shares authorized: | |
Class AAA: | | | | | |
Net Asset Value, offering, and redemption price per share ($1,973,845,419 ÷ 33,470,009 shares outstanding) | | | | $58.97 | |
| | | | | |
Class A: | | | | | |
Net Asset Value and redemption price per share ($39,597,818 ÷ 678,467 shares outstanding) | | | | $58.36 | |
| | | | | |
Maximum offering price per share (NAV ÷ 0.9425, based on maximum sales charge of 5.75% of the offering price) | | | | $61.92 | |
| | | | | |
Class C: | | | | | |
Net Asset Value and offering price per share ($63,821,413 ÷ 1,175,770 shares outstanding) | | | | $54.28 | (a) |
| | | | | |
Class I: | | | | | |
Net Asset Value, offering, and redemption price per share ($587,963,652 ÷ 9,991,073 shares outstanding) | | | | $58.85 | |
| | | | | |
Class T: | | | | | |
Net Asset Value and redemption price per share ($1,095.58 ÷ 18.598 shares outstanding) | | | | $58.91 | |
| | | | | |
Maximum offering price per share (NAV ÷ 0.975, based on maximum sales charge of 2.50% of the offering price) | | | | $60.42 | |
| | | | | |
| (a) | Redemption price varies based on the length of time held. |
Statement of Operations
For the Year Ended December 31, 2017
| | | | |
Investment Income: | | | | |
Dividends (net of foreign withholding taxes of $991,824) | | $ | 39,538,229 | |
Interest | | | 21,859 | |
Other income* | | | 558 | |
| | | | |
Total Income | | | 39,560,646 | |
| | | | |
Expenses: | | | | |
Investment advisory fees | | | 26,321,442 | |
Distribution fees - Class AAA | | | 4,924,015 | |
Distribution fees - Class A | | | 112,284 | |
Distribution fees - Class C | | | 684,189 | |
Distribution fees - Class T | | | 1 | |
Shareholder services fees | | | 1,519,058 | |
Custodian fees | | | 275,346 | |
Shareholder communications expenses | | | 219,102 | |
Trustees’ fees | | | 189,000 | |
Interest expense. | | | 109,279 | |
Registration expenses. | | | 94,505 | |
Accounting fees | | | 45,000 | |
Legal and audit fees | | | 36,315 | |
Miscellaneous expenses. | | | 156,067 | |
| | | | |
Total Expenses | | | 34,685,603 | |
| | | | |
Less:
Expenses paid indirectly by broker (See Note 6) | | | (18,218 | ) |
| | | | |
Net Expenses | | | 34,667,385 | |
| | | | |
Net Investment Income | | | 4,893,261 | |
| | | | |
Net Realized and Unrealized Gain/(Loss) on | | | | |
Investments and Foreign Currency: | | | | |
Net realized gain on investments | | | 232,190,493 | |
Net realized loss on foreign currency transactions | | | (19,972 | ) |
| | | | |
Net realized gain on investments and foreign currency transactions | | | 232,170,521 | |
| | | | |
Net change in unrealized appreciation/depreciation: | | | | |
on investments | | | 248,685,226 | |
on foreign currency translations | | | 23,091 | |
| | | | |
Net change in unrealized appreciation/depreciation on investments and foreign currency translations | | | 248,708,317 | |
| | | | |
Net Realized and Unrealized Gain/(Loss) on Investments and Foreign Currency | | | 480,878,838 | |
| | | | |
Net Increase in Net Assets Resulting from Operations | | $ | 485,772,099 | |
| | | | |
| * | The Fund received a reimbursement of custody expenses paid in prior years. |
See accompanying notes to financial statements.
14
The Gabelli Asset Fund
Statement of Changes in Net Assets
| | | | | | | | | | |
| | | Year Ended
December 31, 2017 | | Year Ended
December 31, 2016 |
Operations: | | | | | | | | | | |
Net investment income | | | $ | 4,893,261 | | | | $ | 16,355,833 | |
Net realized gain on investments and foreign currency transactions | | | | 232,170,521 | | | | | 313,443,085 | |
Net change in unrealized appreciation/depreciation on investments and foreign currency translations | | | | 248,708,317 | | | | | (38,555,406 | ) |
| | | | | | | | | | |
Net Increase in Net Assets Resulting from Operations | | | | 485,772,099 | | | | | 291,243,512 | |
| | | | | | | | | | |
Distributions to Shareholders: | | | | | | | | | | |
Net investment income | | | | | | | | | | |
Class AAA | | | | (2,821,975 | ) | | | | (13,748,396 | ) |
Class A | | | | (44,974 | ) | | | | (403,693 | ) |
Class I | | | | (2,373,743 | ) | | | | (4,748,880 | ) |
Class T | | | | (3 | ) | | | | — | |
| | | | | | | | | | |
| | | (5,240,695) | | (18,900,969) |
| | | | | | | | | | |
Net realized gain | | | | | | | | | | |
Class AAA | | | | (156,792,213 | ) | | | | (219,648,286 | ) |
Class A | | | | (3,184,510 | ) | | | | (6,536,093 | ) |
Class C | | | | (5,476,594 | ) | | | | (8,707,818 | ) |
Class I | | | | (48,070,682 | ) | | | | (55,276,193 | ) |
Class T | | | | (86 | ) | | | | — | |
| | | | | | | | | | |
| | | (213,524,085) | | (290,168,390) |
| | | | | | | | | | |
Total Distributions to Shareholders | | | | (218,764,780 | ) | | | | (309,069,359 | ) |
| | | | | | | | | | |
| | |
Shares of Beneficial Interest Transactions: | | | | | | | | | | |
Class AAA | | | | (195,754,410 | ) | | | | (182,386,677 | ) |
Class A | | | | (22,503,465 | ) | | | | (17,284,229 | ) |
Class C | | | | (15,644,906 | ) | | | | (23,178,641 | ) |
Class I | | | | 41,907,833 | | | | | 19,015,459 | |
Class T | | | | 1,089 | | | | | — | |
| | | | | | | | | | |
Net Decrease in Net Assets from Shares of Beneficial Interest Transactions | | | | (191,993,859 | ) | | | | (203,834,088 | ) |
| | | | | | | | | | |
Redemption Fees | | | | 644 | | | | | 4,144 | |
| | | | | | | | | | |
Net Increase/(Decrease) in Net Assets | | | | 75,014,104 | | | | | (221,655,791 | ) |
Net Assets: | | | | | | | | | | |
Beginning of year | | | | 2,590,215,294 | | | | | 2,811,871,085 | |
| | | | | | | | | | |
End of year (including undistributed net investment income of $0 and $0, respectively) | | | | $2,665,229,398 | | | | | $2,590,215,294 | |
| | | | | | | | | | |
See accompanying notes to financial statements.
15
The Gabelli Asset Fund
Financial Highlights
Selected data for a share of beneficial interest outstanding throughout each period:
| | | | | | | | | | | | | | | | | | | | | | | | | | | | | | | | | | | | | | | | | | | | | | | | | | | | | | | | | | | | | | | | | | | | | | |
| | | | | | | Income (Loss) | | | | | | | | | | | | | | | | | | Ratios to Average Net Assets/ | | |
| | | | | from Investment Operations | | Distributions | | | | | | | | Supplemental Data |
Year Ended
December 31 | | Net Asset Value, Beginning of Period | | Net
Investment
Income (Loss)(a) | | Net Realized and Unrealized
Gain (Loss) on Investments | | Total from
Investment Operations | | Net
Investment Income | | Net
Realized
Gain on Investments | | Total Distributions | | Redemption Fees (a)(b) | | Net Asset
Value,
End of Period | | Total Return† | | Net Assets
End of Period (in 000’s) | | Net
Investment
Income (Loss) | | Operating Expenses | | Portfolio
Turnover Rate |
Class AAA | | | | | | | | | | | | | | | | | | | | | | | | | | | | | | | | | | | | | | | | | | | | | | | | | | | | | | | | | | | | | | | | | | | | | | |
2017 | | | $ | 53.33 | | | | $ | 0.09 | | | | $ | 10.67 | | | | $ | 10.76 | | | | $ | (0.09 | ) | | | $ | (5.03 | ) | | | $ | (5.12 | ) | | | $ | 0.00 | | | | $ | 58.97 | | | | | 20.2 | % | | | $ | 1,973,845 | | | | | 0.15 | % | | | | 1.35 | %(c) | | | | 2 | % |
2016 | | | | 54.10 | | | | | 0.33 | | | | | 5.96 | | | | | 6.29 | | | | | (0.42 | ) | | | | (6.64 | ) | | | | (7.06 | ) | | | | 0.00 | | | | | 53.33 | | | | | 11.6 | | | | | 1,966,374 | | | | | 0.59 | | | | | 1.36 | (c) | | | | 3 | |
2015 | | | | 65.39 | | | | | 0.20 | | | | | (3.93 | ) | | | | (3.73 | ) | | | | (0.21 | ) | | | | (7.35 | ) | | | | (7.56 | ) | | | | 0.00 | | | | | 54.10 | | | | | (5.9 | ) | | | | 2,160,274 | | | | | 0.31 | | | | | 1.35 | (c) | | | | 3 | |
2014 | | | | 65.31 | | | | | 0.19 | | | | | 3.04 | | | | | 3.23 | | | | | (0.17 | ) | | | | (2.98 | ) | | | | (3.15 | ) | | | | 0.00 | | | | | 65.39 | | | | | 4.9 | | | | | 3,011,541 | | | | | 0.28 | | | | | 1.35 | | | | | 5 | |
2013 | | | | 51.87 | | | | | 0.21 | | | | | 16.42 | | | | | 16.63 | | | | | (0.20 | ) | | | | (2.99 | ) | | | | (3.19 | ) | | | | 0.00 | | | | | 65.31 | | | | | 32.4 | | | | | 3,178,406 | | | | | 0.35 | | | | | 1.35 | | | | | 7 | |
Class A | | | | | | | | | | | | | | | | | | | | | | | | | | | | | | | | | | | | | | | | | | | | | | | | | | | | | | | | | | | | | | | | | | | | | | |
2017 | | | $ | 52.80 | | | | $ | 0.09 | | | | $ | 10.57 | | | | $ | 10.66 | | | | $ | (0.07 | ) | | | $ | (5.03 | ) | | | $ | (5.10 | ) | | | $ | 0.00 | | | | $ | 58.36 | | | | | 20.2 | % | | | $ | 39,598 | | | | | 0.15 | % | | | | 1.35 | %(c) | | | | 2 | % |
2016 | | | | 53.62 | | | | | 0.33 | | | | | 5.90 | | | | | 6.23 | | | | | (0.41 | ) | | | | (6.64 | ) | | | | (7.05 | ) | | | | 0.00 | | | | | 52.80 | | | | | 11.6 | | | | | 56,913 | | | | | 0.59 | | | | | 1.36 | (c) | | | | 3 | |
2015 | | | | 64.88 | | | | | 0.20 | | | | | (3.91 | ) | | | | (3.71 | ) | | | | (0.20 | ) | | | | (7.35 | ) | | | | (7.55 | ) | | | | 0.00 | | | | | 53.62 | | | | | (5.9 | ) | | | | 74,447 | | | | | 0.31 | | | | | 1.35 | (c) | | | | 3 | |
2014 | | | | 64.82 | | | | | 0.19 | | | | | 3.02 | | | | | 3.21 | | | | | (0.17 | ) | | | | (2.98 | ) | | | | (3.15 | ) | | | | 0.00 | | | | | 64.88 | | | | | 4.9 | | | | | 110,428 | | | | | 0.28 | | | | | 1.35 | | | | | 5 | |
2013 | | | | 51.52 | | | | | 0.20 | | | | | 16.32 | | | | | 16.52 | | | | | (0.23 | ) | | | | (2.99 | ) | | | | (3.22 | ) | | | | 0.00 | | | | | 64.82 | | | | | 32.4 | | | | | 112,707 | | | | | 0.33 | | | | | 1.35 | | | | | 7 | |
Class C | | | | | | | | | | | | | | | | | | | | | | | | | | | | | | | | | | | | | | | | | | | | | | | | | | | | | | | | | | | | | | | | | | | | | | |
2017 | | | $ | 49.72 | | | | $ | (0.32 | ) | | | $ | 9.91 | | | | $ | 9.59 | | | | | — | | | | $ | (5.03 | ) | | | $ | (5.03 | ) | | | $ | 0.00 | | | | $ | 54.28 | | | | | 19.3 | % | | | $ | 63,821 | | | | | (0.59 | )% | | | | 2.10 | %(c) | | | | 2 | % |
2016 | | | | 50.87 | | | | | (0.08 | ) | | | | 5.57 | | | | | 5.49 | | | | | — | | | | | (6.64 | ) | | | | (6.64 | ) | | | | 0.00 | | | | | 49.72 | | | | | 10.8 | | | | | 72,850 | | | | | (0.16 | ) | | | | 2.11 | (c) | | | | 3 | |
2015 | | | | 62.21 | | | | | (0.27 | ) | | | | (3.72 | ) | | | | (3.99 | ) | | | | — | | | | | (7.35 | ) | | | | (7.35 | ) | | | | 0.00 | | | | | 50.87 | | | | | (6.6 | ) | | | | 96,670 | | | | | (0.44 | ) | | | | 2.10 | (c) | | | | 3 | |
2014 | | | | 62.58 | | | | | (0.30 | ) | | | | 2.91 | | | | | 2.61 | | | | | — | | | | | (2.98 | ) | | | | (2.98 | ) | | | | 0.00 | | | | | 62.21 | | | | | 4.1 | | | | | 125,548 | | | | | (0.47 | ) | | | | 2.10 | | | | | 5 | |
2013 | | | | 50.01 | | | | | (0.24 | ) | | | | 15.80 | | | | | 15.56 | | | | | — | | | | | (2.99 | ) | | | | (2.99 | ) | | | | 0.00 | | | | | 62.58 | | | | | 31.4 | | | | | 104,620 | | | | | (0.41 | ) | | | | 2.10 | | | | | 7 | |
Class I | | | | | | | | | | | | | | | | | | | | | | | | | | | | | | | | | | | | | | | | | | | | | | | | | | | | | | | | | | | | | | | | | | | | | | |
2017 | | | $ | 53.22 | | | | $ | 0.23 | | | | $ | 10.68 | | | | $ | 10.91 | | | | $ | (0.25 | ) | | | $ | (5.03 | ) | | | $ | (5.28 | ) | | | $ | 0.00 | | | | $ | 58.85 | | | | | 20.5 | % | | | $ | 587,964 | | | | | 0.40 | % | | | | 1.10 | %(c) | | | | 2 | % |
2016 | | | | 54.01 | | | | | 0.47 | | | | | 5.95 | | | | | 6.42 | | | | | (0.57 | ) | | | | (6.64 | ) | | | | (7.21 | ) | | | | 0.00 | | | | | 53.22 | | | | | 11.8 | | | | | 494,078 | | | | | 0.84 | | | | | 1.11 | (c) | | | | 3 | |
2015 | | | | 65.33 | | | | | 0.37 | | | | | (3.94 | ) | | | | (3.57 | ) | | | | (0.40 | ) | | | | (7.35 | ) | | | | (7.75 | ) | | | | 0.00 | | | | | 54.01 | | | | | (5.6 | ) | | | | 480,480 | | | | | 0.57 | | | | | 1.10 | (c) | | | | 3 | |
2014 | | | | 65.25 | | | | | 0.35 | | | | | 3.06 | | | | | 3.41 | | | | | (0.35 | ) | | | | (2.98 | ) | | | | (3.33 | ) | | | | 0.00 | | | | | 65.33 | | | | | 5.2 | | | | | 374,638 | | | | | 0.52 | | | | | 1.10 | | | | | 5 | |
2013 | | | | 51.82 | | | | | 0.36 | | | | | 16.42 | | | | | 16.78 | | | | | (0.36 | ) | | | | (2.99 | ) | | | | (3.35 | ) | | | | 0.00 | | | | | 65.25 | | | | | 32.7 | | | | | 280,250 | | | | | 0.60 | | | | | 1.10 | | | | | 7 | |
Class T(d) | | | | | | | | | | | | | | | | | | | | | | | | | | | | | | | | | | | | | | | | | | | | | | | | | | | | | | | | | | | | | | | | | | | | | | |
2017 | | | $ | 58.51 | | | | $ | (0.05 | ) | | | $ | 5.65 | | | | $ | 5.60 | | | | $ | (0.17 | ) | | | $ | (5.03 | ) | | | $ | (5.20 | ) | | | $ | 0.00 | | | | $ | 58.91 | | | | | 9.6 | % | | | $ | 1 | | | | | (0.15 | )%(e) | | | | 1.35 | %(e) | | | | 2 | % |
| † | Total return represents aggregate total return of a hypothetical $1,000 investment at the beginning of the period and sold at the end of the period including reinvestment of distributions and does not reflect applicable sales charges. Total return for a period of less than one year is not annualized. |
| (a) | Per share amounts have been calculated using the average shares outstanding method. |
| (b) | Amount represents less than $0.005 per share. |
| (c) | The Fund received credits from a designated broker who agreed to pay certain Fund operating expenses. For the years ended December 31, 2017, 2016, and 2015, there was no impact on the expense ratios. |
| (d) | Class T Shares were initially offered on July 5, 2017. |
See accompanying notes to financial statements.
16
The Gabelli Asset Fund
Notes to Financial Statements
1. Organization. The Gabelli Asset Fund was organized on November 25, 1985 as a Massachusetts business trust. On July 5, 2017, the Fund began to offer for sale Class T Shares. The Fund is a diversified open-end management investment company registered under the Investment Company Act of 1940, as amended (the “1940 Act”). The Fund’s primary objective is growth of capital. The Fund commenced investment operations on March 3, 1986.
2. Significant Accounting Policies. As an investment company, the Fund follows the investment company accounting and reporting guidance, which is part of U.S. generally accepted accounting principles (“GAAP”) that may require the use of management estimates and assumptions in the preparation of its financial statements. Actual results could differ from those estimates. The following is a summary of significant accounting policies followed by the Fund in the preparation of its financial statements.
Security Valuation. Portfolio securities listed or traded on a nationally recognized securities exchange or traded in the U.S. over-the-counter market for which market quotations are readily available are valued at the last quoted sale price or a market’s official closing price as of the close of business on the day the securities are being valued. If there were no sales that day, the security is valued at the average of the closing bid and asked prices or, if there were no asked prices quoted on that day, then the security is valued at the closing bid price on that day. If no bid or asked prices are quoted on such day, the security is valued at the most recently available price or, if the Board of Trustees (the “Board”) so determines, by such other method as the Board shall determine in good faith to reflect its fair market value. Portfolio securities traded on more than one national securities exchange or market are valued according to the broadest and most representative market, as determined by Gabelli Funds, LLC (the “Adviser”).
Portfolio securities primarily traded on a foreign market are generally valued at the preceding closing values of such securities on the relevant market, but may be fair valued pursuant to procedures established by the Board if market conditions change significantly after the close of the foreign market, but prior to the close of business on the day the securities are being valued. Debt obligations for which market quotations are readily available are valued at the average of the latest bid and asked prices. If there were no asked prices quoted on such day, the security is valued using the closing bid price, unless the Board determines such amount does not reflect the securities’ fair value, in which case these securities will be fair valued as determined by the Board. Certain securities are valued principally using dealer quotations. Futures contracts are valued at the closing settlement price of the exchange or board of trade on which the applicable contract is traded. OTC futures and options on futures for which market quotations are readily available will be valued by quotations received from a pricing service or, if no quotations are available from a pricing service, by quotations obtained from one or more dealers in the instrument in question by the Adviser.
Securities and assets for which market quotations are not readily available are fair valued as determined by the Board. Fair valuation methodologies and procedures may include, but are not limited to: analysis and review of available financial and non-financial information about the company; comparisons with the valuation and changes in valuation of similar securities, including a comparison of foreign securities with the equivalent U.S. dollar value American Depositary Receipt securities at the close of the U.S. exchange; and evaluation of any other information that could be indicative of the value of the security.
17
The Gabelli Asset Fund
Notes to Financial Statements (Continued)
The inputs and valuation techniques used to measure fair value of the Fund’s investments are summarized into three levels as described in the hierarchy below:
|
● Level 1 — quoted prices in active markets for identical securities; |
● Level 2 — other significant observable inputs (including quoted prices for similar securities, interest rates, prepayment speeds, credit risk, etc.); and |
● Level 3 — significant unobservable inputs (including the Board’s determinations as to the fair value of investments). |
A financial instrument’s level within the fair value hierarchy is based on the lowest level of any input both individually and in the aggregate that is significant to the fair value measurement. The inputs or methodology used for valuing securities are not necessarily an indication of the risk associated with investing in those securities. The summary of the Fund’s investments in securities by inputs used to value the Fund’s investments as of December 31, 2017 is as follows:
| | | | | | | | | | | | | | | | | | | | |
| | | Valuation Inputs | | |
| | | Level 1
Quoted Prices | | Level 2 Other Significant
Observable Inputs | | Level 3 Significant
Unobservable Inputs | | Total Market Value
at 12/31/17 |
INVESTMENTS IN SECURITIES: | | | | | | | | | | | | | | | | | | | | |
ASSETS (Market Value): | | | | | | | | | | | | | | | | | | | | |
Common Stocks: | | | | | | | | | | | | | | | | | | | | |
Aerospace | | | $ | 39,564,870 | | | | | — | | | | $ | 115,897 | | | | $ | 39,680,767 | |
Airlines | | | | — | | | | $ | 155,000 | | | | | — | | | | | 155,000 | |
Business Services | | | | 75,995,749 | | | | | — | | | | | 0 | | | | | 75,995,749 | |
Energy and Utilities | | | | 91,200,551 | | | | | — | | | | | 0 | | | | | 91,200,551 | |
Financial Services | | | | 296,125,498 | | | | | 92,125 | | | | | — | | | | | 296,217,623 | |
Manufactured Housing and Recreational Vehicles | | | | 5,224,525 | | | | | 392,500 | | | | | — | | | | | 5,617,025 | |
Other Industries (a) | | | | 2,198,153,618 | | | | | — | | | | | — | | | | | 2,198,153,618 | |
Total Common Stocks | | | | 2,706,264,811 | | | | | 639,625 | | | | | 115,897 | | | | | 2,707,020,333 | |
Closed End Funds (a) | | | | 9,930,633 | | | | | — | | | | | — | | | | | 9,930,633 | |
Preferred Stocks (a) | | | | — | | | | | 577,014 | | | | | — | | | | | 577,014 | |
Rights (a) | | | | — | | | | | — | | | | | 200 | | | | | 200 | |
Warrants (a) | | | | 369,000 | | | | | — | | | | | — | | | | | 369,000 | |
TOTAL INVESTMENTS IN SECURITIES – ASSETS | | | $ | 2,716,564,444 | | | | $ | 1,216,639 | | | | $ | 116,097 | | | | $ | 2,717,897,180 | |
| (a) | Please refer to the Schedule of Investments for the industry classifications of these portfolio holdings. |
The Fund did not have material transfers among Level 1, Level 2, and Level 3 during the year ended December 31, 2017. The Fund’s policy is to recognize transfers among Levels as of the beginning of the reporting period.
Additional Information to Evaluate Qualitative Information.
General. The Fund uses recognized industry pricing services – approved by the Board and unaffiliated with the Adviser – to value most of its securities, and uses broker quotes provided by market makers of securities not valued by these and other recognized pricing sources. Several different pricing feeds are received to value domestic equity securities, international equity securities, preferred equity securities, and fixed income securities. The data within these feeds are ultimately sourced from major stock exchanges and trading systems where these securities trade. The prices supplied by external sources are checked by obtaining quotations or actual
18
The Gabelli Asset Fund
Notes to Financial Statements (Continued)
transaction prices from market participants. If a price obtained from the pricing source is deemed unreliable, prices will be sought from another pricing service or from a broker/dealer that trades that security or similar securities.
Fair Valuation. Fair valued securities may be common or preferred equities, warrants, options, rights, or fixed income obligations. Where appropriate, Level 3 securities are those for which market quotations are not available, such as securities not traded for several days, or for which current bids are not available, or which are restricted as to transfer. Among the factors to be considered to fair value a security are recent prices of comparable securities that are publicly traded, reliable prices of securities not publicly traded, the use of valuation models, current analyst reports, valuing the income or cash flow of the issuer, or cost if the preceding factors do not apply. A significant change in the unobservable inputs could result in a lower or higher value in Level 3 securities. The circumstances of Level 3 securities are frequently monitored to determine if fair valuation measures continue to apply.
The Adviser reports quarterly to the Board the results of the application of fair valuation policies and procedures. These include backtesting the prices realized in subsequent trades of these fair valued securities to fair values previously recognized.
Foreign Currency Translations. The books and records of the Fund are maintained in U.S. dollars. Foreign currencies, investments, and other assets and liabilities are translated into U.S. dollars at current exchange rates. Purchases and sales of investment securities, income, and expenses are translated at the exchange rate prevailing on the respective dates of such transactions. Unrealized gains and losses that result from changes in foreign exchange rates and/or changes in market prices of securities have been included in unrealized appreciation/depreciation on investments and foreign currency translations. Net realized foreign currency gains and losses resulting from changes in exchange rates include foreign currency gains and losses between trade date and settlement date on investment securities transactions, foreign currency transactions, and the difference between the amounts of interest and dividends recorded on the books of the Fund and the amounts actually received. The portion of foreign currency gains and losses related to fluctuation in exchange rates between the initial purchase trade date and subsequent sale trade date is included in realized gain/(loss) on investments.
Foreign Securities. The Fund may directly purchase securities of foreign issuers. Investing in securities of foreign issuers involves special risks not typically associated with investing in securities of U.S. issuers. The risks include possible revaluation of currencies, the inability to repatriate funds, less complete financial information about companies, and possible future adverse political and economic developments. Moreover, securities of many foreign issuers and their markets may be less liquid and their prices more volatile than securities of comparable U.S. issuers.
Foreign Taxes. The Fund may be subject to foreign taxes on income, gains on investments, or currency repatriation, a portion of which may be recoverable. The Fund will accrue such taxes and recoveries as applicable, based upon its current interpretation of tax rules and regulations that exist in the markets in which it invests.
Restricted Securities. The Fund may invest up to 10% of its net assets in securities for which the markets are restricted. Restricted securities include securities whose disposition is subject to substantial legal or contractual restrictions. The sale of restricted securities often requires more time and results in higher brokerage charges or dealer discounts and other selling expenses than does the sale of securities eligible for trading on national
19
The Gabelli Asset Fund
Notes to Financial Statements (Continued)
securities exchanges or in the over-the-counter markets. Restricted securities may sell at a price lower than similar securities that are not subject to restrictions on resale. Securities freely saleable among qualified institutional investors under special rules adopted by the SEC may be treated as liquid if they satisfy liquidity standards established by the Board. The continued liquidity of such securities is not as well assured as that of publicly traded securities, and accordingly the Board will monitor their liquidity. For the restricted securities the Fund held at December 31, 2017, refer to the Schedule of Investments.
Securities Transactions and Investment Income. Securities transactions are accounted for on the trade date with realized gain/(loss) on investments determined by using the identified cost method. Interest income (including amortization of premium and accretion of discount) is recorded on an accrual basis. Premiums and discounts on debt securities are amortized using the effective yield to maturity method. Dividend income is recorded on the ex-dividend date, except for certain dividends from foreign securities that are recorded as soon after the ex-dividend date as the Fund becomes aware of such dividends.
Determination of Net Asset Value and Calculation of Expenses. Certain administrative expenses are common to, and allocated among, various affiliated funds. Such allocations are made on the basis of each fund’s average net assets or other criteria directly affecting the expenses as determined by the Adviser pursuant to procedures established by the Board.
In calculating the NAV per share of each class, investment income, realized and unrealized gains and losses, redemption fees, and expenses other than class specific expenses are allocated daily to each class of shares based upon the proportion of net assets of each class at the beginning of each day. Distribution expenses are borne solely by the class incurring the expense.
Distributions to Shareholders. Distributions to shareholders are recorded on the ex-dividend date. Distributions to shareholders are based on income and capital gains as determined in accordance with federal income tax regulations, which may differ from income and capital gains as determined under GAAP. These differences are primarily due to differing treatments of income and gains on various investment securities and foreign currency transactions held by the Fund, timing differences, and differing characterizations of distributions made by the Fund. Distributions from net investment income for federal income tax purposes include net realized gains on foreign currency transactions. These book/tax differences are either temporary or permanent in nature. To the extent these differences are permanent, adjustments are made to the appropriate capital accounts in the period when the differences arise. Permanent differences were primarily due to utilization of tax equalization and prior year long term capital gain reversal on real estate investment trusts. These reclassifications have no impact on the NAV of the Fund. For the year ended December 31, 2017, reclassifications were made to increase distributions in excess of net investment income by $400,306 and increase distributions in excess of net realized gain on investments and foreign currency transactions by $16,930,773, with an offsetting adjustment to paid-in capital.
20
The Gabelli Asset Fund
Notes to Financial Statements (Continued)
The tax character of distributions paid during the years December 31, 2017 and 2016 was as follows:
| | | | | | | | | | |
| | | Year Ended
December 31, 2017 | | Year Ended
December 31, 2016 |
Distributions paid from:* | | | | | | | | | | |
Ordinary income (inclusive of short term capital gains) | | | | $ 5,513,510 | | | | | $ 20,874,585 | |
Net long term capital gains | | | | 232,578,711 | | | | | 305,510,473 | |
| | | | | | | | | | |
Total distributions paid | | | | $238,092,221 | | | | | $326,385,058 | |
| | | | | | | | | | |
| * | Total distributions paid differs from the Statement of Changes in Net Assets due to the utilization of equalization. |
Provision For Income Taxes. The Fund intends to continue to qualify as a regulated investment company under Subchapter M of the Internal Revenue Code of 1986, as amended (the “Code”). It is the policy of the Fund to comply with the requirements of the Code applicable to regulated investment companies and to distribute substantially all of its net investment company taxable income and net capital gains. Therefore, no provision for federal income taxes is required.
As of December 31, 2017, the components of accumulated earnings/losses on a tax basis were as follows:
| | | | |
Net unrealized appreciation on investments and foreign currency translations | | $ | 1,796,899,080 | |
At December 31, 2017, the differences between book basis and tax basis net unrealized appreciation were primarily due to mark-to-market adjustments on investments considered passive foreign investment companies, deferral of losses from wash sales for tax purposes, and basis adjustments on investments in partnerships.
The following summarizes the tax cost of investments and the related net unrealized appreciation at December 31, 2017:
| | | | | | | | | | | | | | | | |
| | | Cost | | | Gross
Unrealized
Appreciation | | | Gross
Unrealized
Depreciation | | | Net Unrealized
Appreciation | |
Investments | | $ | 921,001,020 | | | $ | 1,828,127,928 | | | $ | (31,231,768 | ) | | $ | 1,796,896,160 | |
The Fund is required to evaluate tax positions taken or expected to be taken in the course of preparing the Fund’s tax returns to determine whether the tax positions are “more-likely-than-not” of being sustained by the applicable tax authority. Income tax and related interest and penalties would be recognized by the Fund as tax expense in the Statement of Operations if the tax positions were deemed not to meet the more-likely-than-not threshold. For the year ended December 31, 2017, the Fund did not incur any income tax, interest, or penalties. As of December 31, 2017, the Adviser has reviewed all open tax years and concluded that there was no impact to the Fund’s net assets or results of operations. The Fund’s federal and state tax returns for the prior three fiscal years remain open, subject to examination. On an ongoing basis, the Adviser will monitor the Fund’s tax positions to determine if adjustments to this conclusion are necessary.
3. Investment Advisory Agreement and Other Transactions. The Fund has entered into an investment advisory agreement (the “Advisory Agreement”) with the Adviser which provides that the Fund will pay the Adviser a fee, computed daily and paid monthly, at the annual rate of 1.00% of the value of its average daily net assets. In accordance with the Advisory Agreement, the Adviser provides a continuous investment program for the Fund’s portfolio, oversees the administration of all aspects of the Fund’s business and affairs, and pays the compensation of all Officers and Trustees of the Fund who are affiliated persons of the Adviser.
21
The Gabelli Asset Fund
Notes to Financial Statements (Continued)
The Fund pays each Trustee who is not considered an affiliated person an annual retainer of $18,000 plus $2,000 for each Board meeting attended. Each Trustee is reimbursed by the Fund for any out of pocket expenses incurred in attending meetings. All Board committee members receive $500 per meeting attended and the Chairman of the Audit Committee and the Lead Trustee each receives an annual fee of $2,000. The Chairman of the Proxy Voting Committee and Nominating Committee each receives $1,000 annually. A Trustee may receive a single meeting fee, allocated among the participating funds, for participation in certain meetings held on behalf of multiple funds. Trustees who are directors or employees of the Adviser or an affiliated company receive no compensation or expense reimbursement from the Fund.
4. Distribution Plan. The Fund’s Board has adopted a distribution plan (the “Plan”) for each class of shares, except Class I Shares, pursuant to Rule 12b-1 under the 1940 Act. Under the Class AAA, Class A, Class C, and Class T Share Plans, payments are authorized to G.distributors, LLC (the “Distributor”), an affiliate of the Adviser, at annual rates of 0.25%, 0.25%, 1.00%, and 0.25%, respectively, of the average daily net assets of those classes, the annual limitations under each Plan. Such payments are accrued daily and paid monthly.
5. Portfolio Securities. Purchases and sales of securities during the year ended December 31, 2017, other than short term securities and U.S. Government Obligations, aggregated $54,995,855 and $445,539,668, respectively.
6. Transactions with Affiliates and Other Arrangements. During the year ended December 31, 2017, the Fund paid $177,064 in brokerage commissions on security trades to G.research, LLC, an affiliate of the Adviser. Additionally, the Distributor retained a total of $10,584 from investors representing commissions (sales charges and underwriting fees) on sales and redemptions of Fund shares.
During the year ended December 31, 2017, the Fund engaged in sales transactions with funds that have a common investment adviser. These sales transactions complied with Rule 17a-7 under the Act and amount to $3,286.
During the year ended December 31, 2017, the Fund received credits from a designated broker who agreed to pay certain Fund operating expenses. The amount of such expenses paid through this directed broker arrangement during this period was $18,218.
The cost of calculating the Fund’s NAV per share is a Fund expense pursuant to the Advisory Agreement. During the year ended December 31, 2017, the Fund paid or accrued $45,000 to the Adviser in connection with the cost of computing the Fund’s NAV.
7. Line of Credit. The Fund participates in an unsecured line of credit, which expires on March 8, 2018 and may be renewed annually, of up to $75,000,000 under which it may borrow up to 10% of its net assets from the custodian for temporary borrowing purposes. Borrowings under this arrangement bear interest at a floating rate equal to the higher of the overnight Federal Funds rate plus 125 basis points or the 30 day LIBOR plus 125 basis points in effect on that day. This amount, if any, would be included in “Interest expense” in the Statement of Operations. At December 31, 2017, there was $31,850,000 outstanding under the line of credit.
The average daily amount of borrowings outstanding under the line of credit during the year ended December 31, 2017 was $4,936,981 with a weighted average interest rate of 2.37%. The maximum amount borrowed at any time during the year ended December 31, 2017 was $47,641,000.
22
The Gabelli Asset Fund
Notes to Financial Statements (Continued)
8. Shares of Beneficial Interest. The Fund offers five classes of shares – Class AAA Shares, Class A Shares, Class C Shares, Class I Shares, and Class T Shares. Class AAA and Class I Shares are offered without a sales charge. Class A Shares and Class T Shares are subject to a maximum front-end sales charge of 5.75% and 2.50%, respectively. Class C Shares are subject to a 1.00% contingent deferred sales charge for one year after purchase.
The Fund imposes a redemption fee of 2.00% on all classes of shares that are redeemed or exchanged on or before the seventh day after the date of a purchase. The redemption fee is deducted from the proceeds otherwise payable to the redeeming shareholders and is retained by the Fund as an increase in paid-in capital. The redemption fees retained by the Fund during the years ended December 31, 2017 and 2016, if any, can be found in the Statement of Changes in Net Assets under Redemption Fees.
Transactions in shares of beneficial interest were as follows:
| | | | | | | | | | | | | | | | |
| | | Year Ended
December 31, 2017 | | | Year Ended
December 31, 2016 | |
| | | Shares | | | Amount | | | Shares | | | Amount | |
Class AAA | | | | | | | | | | | | | | | | |
Shares sold | | | 457,799 | | | $ | 26,337,153 | | | | 727,117 | | | $ | 40,706,434 | |
Shares issued upon reinvestment of distributions | | | 2,559,280 | | | | 151,256,170 | | | | 4,134,942 | | | | 221,094,414 | |
Shares redeemed | | | (6,421,901 | ) | | | (373,347,733 | ) | | | (7,920,727 | ) | | | (444,187,525 | ) |
| | | | | | | | | | | | | | | | |
Net decrease | | | (3,404,822 | ) | | $ | (195,754,410 | ) | | | (3,058,668 | ) | | $ | (182,386,677 | ) |
| | | | | | | | | | | | | | | | |
Class A | | | | | | | | | | | | | | | | |
Shares sold | | | 61,828 | | | $ | 3,551,182 | | | | 127,239 | | | $ | 7,060,121 | |
Shares issued upon reinvestment of distributions | | | 50,505 | | | | 2,954,019 | | | | 111,933 | | | | 5,925,759 | |
Shares redeemed | | | (511,739 | ) | | | (29,008,666 | ) | | | (549,681 | ) | | | (30,270,109 | ) |
| | | | | | | | | | | | | | | | |
Net decrease | | | (399,406 | ) | | $ | (22,503,465 | ) | | | (310,509 | ) | | $ | (17,284,229 | ) |
| | | | | | | | | | | | | | | | |
Class C | | | | | | | | | | | | | | | | |
Shares sold | | | 88,247 | | | $ | 4,743,068 | | | | 110,681 | | | $ | 5,730,572 | |
Shares issued upon reinvestment of distributions | | | 88,624 | | | | 4,822,031 | | | | 143,563 | | | | 7,156,612 | |
Shares redeemed | | | (466,453 | ) | | | (25,210,005 | ) | | | (689,239 | ) | | | (36,065,825 | ) |
| | | | | | | | | | | | | | | | |
Net decrease | | | (289,582 | ) | | $ | (15,644,906 | ) | | | (434,995 | ) | | $ | (23,178,641 | ) |
| | | | | | | | | | | | | | | | |
Class I | | | | | | | | | | | | | | | | |
Shares sold | | | 2,005,140 | | | $ | 116,932,196 | | | | 1,715,387 | | | $ | 97,316,436 | |
Shares issued upon reinvestment of distributions | | | 782,917 | | | | 46,176,445 | | | | 1,031,108 | | | | 55,017,188 | |
Shares redeemed | | | (2,080,694 | ) | | | (121,200,808 | ) | | | (2,359,482 | ) | | | (133,318,165 | ) |
| | | | | | | | | | | | | | | | |
Net increase | | | 707,363 | | | $ | 41,907,833 | | | | 387,013 | | | $ | 19,015,459 | |
| | | | | | | | | | | | | | | | |
Class T(a) | | | | | | | | | | | | | | | | |
Shares sold | | | 17 | | | $ | 1,000 | | | | — | | | | — | |
Shares issued upon reinvestment of distributions | | | 2 | | | | 89 | | | | — | | | | — | |
| | | | | | | | | | | | | | | | |
Net increase | | | 19 | | | $ | 1,089 | | | | — | | | | — | |
| | | | | | | | | | | | | | | | |
| (a) | Class T Shares were initially offered on July 5, 2017. |
9. Indemnifications. The Fund enters into contracts that contain a variety of indemnifications. The Fund’s maximum exposure under these arrangements is unknown. However, the Fund has not had prior claims or losses pursuant to these contracts. Management has reviewed the Fund’s existing contracts and expects the risk of loss to be remote.
23
The Gabelli Asset Fund
Notes to Financial Statements (Continued)
10. Subsequent Events. Management has evaluated the impact on the Fund of all subsequent events occurring through the date the financial statements were issued and has determined that there were no subsequent events requiring recognition or disclosure in the financial statements.
24
The Gabelli Asset Fund
Report of Independent Registered Public Accounting Firm
To the Board of Trustees and Shareholders of
The Gabelli Asset Fund:
Opinion on the Financial Statements
We have audited the accompanying statement of assets and liabilities, including the schedule of investments, of The Gabelli Asset Fund (the “Fund”) as of December 31, 2017, the related statement of operations for the year ended December 31, 2017, the statement of changes in net assets for each of the two years in the period ended December 31, 2017, including the related notes, and the financial highlights for each of the periods indicated therein (collectively referred to as the “financial statements”). In our opinion, the financial statements present fairly, in all material respects, the financial position of the Fund as of December 31, 2017, the results of its operations for the year then ended, the changes in its net assets for each of the two years in the period ended December 31, 2017 and the financial highlights for each of the periods indicated therein in conformity with accounting principles generally accepted in the United States of America.
Basis for Opinion
These financial statements are the responsibility of the Fund’s management. Our responsibility is to express an opinion on the Fund’s financial statements based on our audits. We are a public accounting firm registered with the Public Company Accounting Oversight Board (United States) (“PCAOB”) and are required to be independent with respect to the Fund in accordance with the U.S. federal securities laws and the applicable rules and regulations of the Securities and Exchange Commission and the PCAOB.
We conducted our audits of these financial statements in accordance with the standards of the PCAOB. Those standards require that we plan and perform the audit to obtain reasonable assurance about whether the financial statements are free of material misstatement, whether due to error or fraud.
Our audits included performing procedures to assess the risks of material misstatement of the financial statements, whether due to error or fraud, and performing procedures that respond to those risks. Such procedures included examining, on a test basis, evidence regarding the amounts and disclosures in the financial statements. Our audits also included evaluating the accounting principles used and significant estimates made by management, as well as evaluating the overall presentation of the financial statements. Our procedures included confirmation of securities owned as of December 31, 2017 by correspondence with the custodian and transfer agent. We believe that our audits provide a reasonable basis for our opinion.
PricewaterhouseCoopers LLP
New York, New York
February 27, 2018
We have served as the auditor of one or more investment companies in Gabelli/GAMCO Fund Complex since 1986.
25
The Gabelli Asset Fund
Additional Fund Information (Unaudited)
The business and affairs of the Fund are managed under the direction of the Fund’s Board of Trustees. Information pertaining to the Trustees and officers of the Fund is set forth below. The Fund’s Statement of Additional Information includes additional information about the Fund’s Trustees and is available without charge, upon request, by calling 800-GABELLI (800-422-3554) or by writing to The Gabelli Asset Fund at One Corporate Center, Rye, NY 10580-1422.
| | | | | | | | | | |
Name, Position(s) Address1 and Age | | Term of Office and Length of Time Served2 | | Number of Funds in Fund Complex Overseen by Trustee | | | Principal Occupation(s) During Past Five Years | | Other Directorships Held by Trustee4 |
| | | | |
INTERESTED TRUSTEES3 : | | | | | | | | | | |
| | | | |
Mario J. Gabelli, CFA Trustee and Chief Investment Officer Age: 75 | | Since 1986 | | | 32 | | | Chairman, Chief Executive Officer, and Chief Investment Officer– Value Portfolios of GAMCO Investors, Inc. and Chief Investment Officer– Value Portfolios of Gabelli Funds, LLC and GAMCO Asset Management Inc.; Director/ Trustee or Chief Investment Officer of other registered investment companies within the Gabelli/GAMCO Fund Complex; Chief Executive Officer of GGCP, Inc.; Executive Chairman of Associated Capital Group, Inc. | | Director of Morgan Group Holdings, Inc. (holding company); Chairman of the Board and Chief Executive Officer of LICT Corp. (multimedia and communication services company); Director of CIBL, Inc. (broadcasting and wireless communications); Director of ICTC Group Inc. (communications) |
| | | | |
John D. Gabelli Trustee Age: 73 | | Since 1999 | | | 10 | | | Senior Vice President of G.research, LLC | | — |
| | | | |
INDEPENDENT TRUSTEES5 : | | | | | | | | | | |
| | | | |
Anthony J. Colavita Trustee Age: 82 | | Since 1989 | | | 28 | | | President of the law firm of Anthony J. Colavita, P.C. | | — |
| | | | |
James P. Conn Trustee Age: 79 | | Since 1992 | | | 27 | | | Former Managing Director and Chief Investment Officer of Financial Security Assurance Holdings Ltd. (1992-1998) | | — |
| | | | |
Kuni Nakamura Trustee Age: 49 | | Since 2009 | | | 33 | | | President of Advanced Polymer, Inc. (chemical manufacturing company); President of KEN Enterprises, Inc. (real estate) | | — |
| | | | |
Anthony R. Pustorino Trustee Age: 92 | | Since 1986 | | | 10 | | | Certified Public Accountant; Professor Emeritus, Pace University | | Director of The LGL Group, Inc. (diversified manufacturing) (2004-2011) |
| | | | |
Werner J. Roeder Trustee Age: 77 | | Since 2001 | | | 23 | | | Retired physician; Former Vice President of Medical Affairs (Medical Director) of New York Presbyterian/Lawrence Hospital (1999-2014) | | — |
| | | | |
Anthonie C. van Ekris Trustee Age: 83 | | 1986-1989 1992-present | | | 22 | | | Chairman and Chief Executive Officer of BALMAC International, Inc. (global import/ export company) | | — |
| | | | |
Salvatore J. Zizza Trustee Age: 72 | | 1986-1996 2000-present | | | 30 | | | President of Zizza & Associates Corp. (private holding company); Chairman of Harbor Diversified, Inc. (pharmaceuticals); Chairman of BAM (semiconductor and aerospace manufacturing); Chairman of Bergen Cove Realty Inc.; Chairman of Metropolitan Paper Recycling Inc. (recycling) (2005-2014) | | Director and Vice Chairman of Trans-Lux Corporation (business services); Director and Chairman of Harbor Diversified Inc. (pharmaceuticals) |
26
The Gabelli Asset Fund
Additional Fund Information (Continued) (Unaudited)
| | | | | | |
Name, Position(s) Address1 and Age | | Term of Office and Length of Time Served2 | | | | Principal Occupation(s) During Past Five Years |
| | | |
| OFFICERS: | | | | | | |
| | | |
Bruce N. Alpert President Age: 66 | | Since 2006 | | | | Executive Vice President and Chief Operating Officer of Gabelli Funds, LLC since 1988; Officer of registered investment companies within the Gabelli/GAMCO Fund Complex; Senior Vice President of GAMCO Investors, Inc. since 2008 |
| | | |
John C. Ball Treasurer Age: 41 | | Since 2017 | | | | Treasurer of all the registered investment companies within the Gabelli/GAMCO Fund Complex since 2017; Vice President and Assistant Treasurer of AMG Funds, 2014-2017; Vice President of State Street Corporation, 2007-2014 |
| | | |
Agnes Mullady Vice President Age: 59 | | Since 2006 | | | | Officer of all of the registered investment companies within the Gabelli/GAMCO Fund Complex since 2006; President and Chief Operating Officer of the Fund Division of Gabelli Funds, LLC since 2015; Chief Executive Officer of G.distributors, LLC since 2010; Senior Vice President of GAMCO Investors, Inc. since 2009; Vice President of Gabelli Funds, LLC since 2007; Executive Vice President of Associated Capital Group, Inc. since 2016 |
| | | |
Andrea R. Mango Secretary Age: 45 | | Since 2013 | | | | Vice President of GAMCO Investors, Inc. since 2016; Counsel of Gabelli Funds, LLC since 2013; Secretary of all registered investment companies within the Gabelli/GAMCO Fund Complex since 2013; Vice President of all closed-end funds within the Gabelli/GAMCO Fund Complex since 2014; Corporate Vice President within the Corporate Compliance Department of New York Life Insurance Company, 2011-2013 |
| | | |
Richard J. Walz Chief Compliance Officer Age: 58 | | Since 2013 | | | | Chief Compliance Officer of all of the registered investment companies within the Gabelli/ GAMCO Fund Complex since 2013; Chief Compliance Officer of AEGON USA Investment Management, 2011-2013 |
| 1 | Address: One Corporate Center, Rye, NY 10580-1422, unless otherwise noted. |
| 2 | Each Trustee will hold office for an indefinite term until the earliest of (i) the next meeting of shareholders, if any, called for the purpose of considering the election or re-election of such Trustee and until the election and qualification of his or her successor, if any, elected at such meeting, or (ii) the date a Trustee resigns or retires, or a Trustee is removed by the Board of Trustees or shareholders, in accordance with the Fund’s By-Laws and Declaration of Trust. Each officer will hold office for an indefinite term until the date he or she resigns or retires or until his or her successor is elected and qualified. |
| 3 | “Interested person” of the Fund as defined in the 1940 Act. Messrs. Mario J. Gabelli and John D. Gabelli, who are brothers, are each considered an “interested person” because of their affiliation with Gabelli Funds, LLC which acts as the Fund’s investment adviser. |
| 4 | This column includes only directorships of companies required to report to the SEC under the Securities Exchange Act of 1934, as amended, i.e., public companies, or other investment companies registered under the 1940 Act. |
| 5 | Trustees who are not interested persons are considered “Independent” Trustees. |
27
THE GABELLI ASSET FUND
2017 TAX NOTICE TO SHAREHOLDERS (Unaudited)
For the year ended December 31, 2017, the Fund paid to shareholders ordinary income distributions (comprised of net investment income) totaling $0.091, $0.071, $0.249, and $0.173 per share for Class AAA, Class A, Class I and Class T Shares, respectively, and long term capital gains totaling $232,578,711, or the maximum allowable. The distribution of long term capital gains has been designated as a capital gain dividend by the Fund’s Board of Trustees. For the year ended December 31, 2017, 100% of the ordinary income distribution qualifies for the dividends received deduction available to corporations. The Fund designates 100% of the ordinary income distribution as qualified dividend income pursuant to the Jobs and Growth Tax Relief Reconciliation Act of 2003. The Fund designates 0.02% of the ordinary income distribution as qualified interest income pursuant to the Tax Relief, Unemployment Reauthorization, and Job Creation Act of 2010. The Fund designates 0.00% of the ordinary income distribution as qualified short term gain pursuant to the American Jobs Creation Act of 2004.
U.S. Government Income:
The percentage of the ordinary income distribution paid by the Fund during the year ended December 31, 2017 which was derived from U.S. Treasury securities was 0.00%. Such income is exempt from state and local tax in all states. However, many states, including New York and California, allow a tax exemption for a portion of the income earned only if a mutual fund has invested at least 50% of its assets at the end of each quarter of the Fund’s fiscal year in U.S. Government securities. The Gabelli Asset Fund did not meet this strict requirement in 2017. The percentage of U.S. Government securities held as of December 31, 2017 was 0.00%. Due to the diversity in state and local tax law, it is recommended that you consult your personal tax adviser as to the applicability of the information provided to your specific situation.
All designations are based on financial information available as of the date of this annual report and, accordingly, are subject to change. For each item, it is the intention of the Fund to designate the maximum amount permitted under the Internal Revenue Code and the regulations thereunder.
| | |
Gabelli/GAMCO Funds and Your Personal Privacy |
Who are we? |
The Gabelli/GAMCO Funds are investment companies registered with the Securities and Exchange Commission under the Investment Company Act of 1940. We are managed by Gabelli Funds, LLC and GAMCO Asset Management Inc., which are affiliated with GAMCO Investors, Inc. that is a publicly held company with subsidiaries and affiliates that provide investment advisory services for a variety of clients. |
| |
What kind of non-public information do we collect about you if you become a fund shareholder? |
| |
If you apply to open an account directly with us, you will be giving us some non-public information about yourself. The non-public information we collect about you is: |
| |
● Information you give us on your application form. This could include your name, address, telephone number, social security number, bank account number, and other information. |
| |
● Information about your transactions with us, any transactions with our affiliates, and transactions with the entities we hire to provide services to you. This would include information about the shares that you buy or redeem. If we hire someone else to provide services — like a transfer agent — we will also have information about the transactions that you conduct through them. |
| |
What information do we disclose and to whom do we disclose it? |
| |
We do not disclose any non-public personal information about our customers or former customers to anyone other than our affiliates, our service providers who need to know such information, and as otherwise permitted by law. If you want to find out what the law permits, you can read the privacy rules adopted by the Securities and Exchange Commission. They are in volume 17 of the Code of Federal Regulations, Part 248. The Commission often posts information about its regulations on its website, www.sec.gov. |
| |
What do we do to protect your personal information? |
| |
We restrict access to non-public personal information about you to the people who need to know that information in order to provide services to you or the fund and to ensure that we are complying with the laws governing the securities business. We maintain physical, electronic, and procedural safeguards to keep your personal information confidential. |
This page was intentionally left blank.
THE GABELLI ASSET FUND
One Corporate Center
Rye, NY 10580-1422
Portfolio Management Team Biographies
Mario J. Gabelli, CFA, is Chairman, Chief Executive Officer, and Chief Investment Officer - Value Portfolios of GAMCO Investors, Inc. that he founded in 1977, and Chief Investment Officer - Value Portfolios of Gabelli Funds, LLC and GAMCO Asset Management Inc. He is also Executive Chairman of Associated Capital Group, Inc. Mr. Gabelli is a summa cum laude graduate of Fordham University and holds an MBA degree from Columbia Business School and Honorary Doctorates from Fordham University and Roger Williams University.
Christopher J. Marangi joined Gabelli in 2003 as a research analyst. Currently he is a Managing Director and Co-Chief Investment Officer for GAMCO Investors, Inc.’s Value team. In addition, he serves as a portfolio manager of Gabelli Funds, LLC and manages several funds within the Gabelli/GAMCO Fund Complex. Mr. Marangi graduated magna cum laude and Phi Beta Kappa with a BA in Political Economy from Williams College and holds an MBA degree with honors from Columbia Business School.
Kevin V. Dreyer joined Gabelli in 2005 as a research analyst covering companies within the consumer sector. Currently he is a Managing Director and Co-Chief Investment Officer for GAMCO Investors, Inc.’s Value team. In addition, he serves as a portfolio manager of Gabelli Funds, LLC and manages several funds within the Gabelli/GAMCO Fund Complex. Mr. Dreyer received a BSE from the University of Pennsylvania and an MBA degree from Columbia Business School.
Jeffrey J. Jonas, CFA, joined Gabelli in 2003 as a research analyst focusing on companies across the healthcare industry. In 2006, he began serving as a portfolio manager of Gabelli Funds, LLC and manages several funds within the Gabelli/GAMCO Fund Complex. Mr. Jonas was a Presidential Scholar at Boston College, where he received a BS in Finance and Management Information Systems.
|
We have separated the portfolio managers’ commentary from the financial statements and investment portfolio due to corporate governance regulations stipulated by the Sarbanes-Oxley Act of 2002. We have done this to ensure that the content of the portfolio managers’ commentary is unrestricted. Both the commentary and the financial statements, including the portfolio of investments, will be available on our website at www.gabelli.com. |
| | |
|
| THE GABELLI ASSET FUND |
| One Corporate Center | | |
Rye, New York 10580-1422 t 800-GABELLI (800-422-3554) f 914-921-5118 e info@gabelli.com |
GABELLI.COM | | |
|
Net Asset Value per share available daily by calling 800-GABELLI after 7:00 P.M. |
BOARD OF TRUSTEES | | |
| Mario J. Gabelli, CFA | | Anthonie C. van Ekris |
| Chairman and Chief | | Chairman, |
| Executive Officer, | | BALMAC International, Inc. |
| GAMCO Investors, Inc. | | |
| Executive Chairman, | | Salvatore J. Zizza |
| Associated Capital Group Inc. | | Chairman, |
| | Zizza & Associates Corp. |
| Anthony J. Colavita | | |
| President, | | OFFICERS |
| Anthony J. Colavita, P.C. | | Bruce N. Alpert |
| | President |
| James P. Conn | | |
Former Chief Investment Officer | | John C. Ball Treasurer |
| Financial Security Assurance | | |
| Holdings Ltd. | | Agnes Mullady |
| | Vice President |
| |
| John D. Gabelli | | Andrea R. Mango |
| Senior Vice President, | | Secretary |
| G.research, LLC | | |
| | Richard J. Walz |
| Kuni Nakamura | | Chief Compliance Officer |
President, Advanced Polymer, Inc. | | DISTRIBUTOR |
Anthony R. Pustorino Certified Public Accountant, Professor Emeritus Pace University | | G.distributors, LLC CUSTODIAN State Street Bank and Trust Company TRANSFER AGENT AND |
| Werner J. Roeder | |
| Former Medical Director, | |
| Lawrence Hospital | | DIVIDEND DISBURSING AGENT DST Asset Manager Solutions Inc. LEGAL COUNSEL Skadden, Arps, Slate, Meagher & Flom LLP |
| |
| |
This report is submitted for the general information of the shareholders of The Gabelli Asset Fund. It is not authorized for distribution to prospective investors unless preceded or accompanied by an effective prospectus. |
| |
| | |
| GAB405Q417AR | | |
Item 2. Code of Ethics.
| | (a) | The registrant, as of the end of the period covered by this report, has adopted a code of ethics that applies to the registrant’s principal executive officer, principal financial officer, principal accounting officer or controller, or persons performing similar functions, regardless of whether these individuals are employed by the registrant or a third party. |
| | (c) | There have been no amendments, during the period covered by this report, to a provision of the code of ethics that applies to the registrant’s principal executive officer, principal financial officer, principal accounting officer or controller, or persons performing similar functions, regardless of whether these individuals are employed by the registrant or a third party, and that relates to any element of the code of ethics description. |
| | (d) | The registrant has not granted any waivers, including an implicit waiver, from a provision of the code of ethics that applies to the registrant’s principal executive officer, principal financial officer, principal accounting officer or controller, or persons performing similar functions, regardless of whether these individuals are employed by the registrant or a third party, that relates to one or more of the items set forth in paragraph (b) of this item’s instructions. |
Item 3. Audit Committee Financial Expert.
As of the end of the period covered by the report, the registrant’s Board of Trustees has determined that Anthony R. Pustorino is qualified to serve as an audit committee financial expert serving on its audit committee and that he is “independent,” as defined by Item 3 of Form N-CSR.
Item 4. Principal Accountant Fees and Services.
Audit Fees
| | (a) | The aggregate fees billed for each of the last two fiscal years for professional services rendered by the principal accountant for the audit of the registrant’s annual financial statements or services that are normally provided by the accountant in connection with statutory and regulatory filings or engagements for those fiscal years are $40,440 for 2016 and $40,440 for 2017. |
Audit-Related Fees
| | (b) | The aggregate fees billed in each of the last two fiscal years for assurance and related services by the principal accountant that are reasonably related to the performance of the audit of the registrant’s financial statements and are not reported under paragraph (a) of this Item are $0 for 2016 and $0 for 2017. |
Tax Fees
| | (c) | The aggregate fees billed in each of the last two fiscal years for professional services rendered by the principal accountant for tax compliance, tax advice, and tax planning are $4,096 for 2016 and $4,100 for 2017. Tax fees represent tax compliance services provided in connection with the review of the Registrant’s tax returns. |
All Other Fees
| | (d) | The aggregate fees billed in each of the last two fiscal years for products and services provided by the principal accountant, other than the services reported in paragraphs (a) through (c) of this Item are $0 for 2016 and $0 for 2017. |
| | (e)(1) | Disclose the audit committee’s pre-approval policies and procedures described in paragraph (c)(7) of Rule 2-01 of Regulation S-X. |
Pre-Approval Policies and Procedures. The Audit Committee (“Committee”) of the registrant is responsible for pre-approving (i) all audit and permissible non-audit services to be provided by the independent registered public accounting firm to the registrant and (ii) all permissible non-audit services to be provided by the independent registered public accounting firm to the Adviser, Gabelli Funds, LLC, and any affiliate of Gabelli Funds, LLC (“Gabelli”) that provides services to the registrant (a “Covered Services Provider”) if the independent registered public accounting firm’s engagement related directly to the operations and financial reporting of the registrant. The Committee may delegate its responsibility to pre-approve any such audit and permissible non-audit services to the Chairperson of the Committee, and the Chairperson must report to the Committee, at its next regularly scheduled meeting after the Chairperson’s pre-approval of such services, his or her decision(s). The Committee may also establish detailed pre-approval policies and procedures for pre-approval of such services in accordance with applicable laws, including the delegation of some or all of the Committee’s pre-approval responsibilities to the other persons (other than Gabelli or the registrant’s officers). Pre-approval by the Committee of any permissible non-audit services is not required so long as: (i) the permissible non-audit services were not recognized by the registrant at the time of the engagement to be non-audit services; and (ii) such services are promptly brought to the attention of the Committee and approved by the Committee or Chairperson prior to the completion of the audit.
| | (e)(2) | The percentage of services described in each of paragraphs (b) through (d) of this Item that were approved by the audit committee pursuant to paragraph (c)(7)(i)(C) of Rule 2-01 of Regulation S-X are as follows: |
(b) N/A
(c) 100%
(d) N/A
| | (f) | The percentage of hours expended on the principal accountant’s engagement to audit the registrant’s financial statements for the most recent fiscal year that were attributed to work performed by persons other than the principal accountant’s full-time, permanent employees was less than fifty percent. |
| | (g) | The aggregate non-audit fees billed by the registrant’s accountant for services rendered to the registrant, and rendered to the registrant’s investment adviser (not including any sub-adviser whose role is primarily portfolio management and is subcontracted with or overseen by another investment adviser), and any entity controlling, controlled by, or under common control with the adviser that provides ongoing services to the registrant for each of the last two fiscal years of the registrant was $0 for 2016 and $0 for 2017. |
| | (h) | The registrant’s audit committee of the board of directors has considered whether the provision of non-audit services that were rendered to the registrant’s investment adviser (not including any sub-adviser whose role is primarily portfolio management and is subcontracted with or overseen by another investment adviser), and any entity controlling, controlled by, or under common control with the investment adviser that provides ongoing services to the registrant that were not pre-approved pursuant to paragraph (c)(7)(ii) of Rule 2-01 of Regulation S-X is compatible with maintaining the principal accountant’s independence. |
Item 5. Audit Committee of Listed Registrants.
Not applicable.
Item 6. Investments.
| (a) | Schedule of Investments in securities of unaffiliated issuers as of the close of the reporting period is included as part of the report to shareholders filed under Item 1 of this form. |
(b) Not applicable.
| Item 7. | Disclosure of Proxy Voting Policies and Procedures for Closed-End Management Investment Companies. |
Not applicable.
Item 8. Portfolio Managers of Closed-End Management Investment Companies.
Not applicable.
| Item 9. | Purchases of Equity Securities by Closed-End Management Investment Company and Affiliated Purchasers. |
Not applicable.
Item 10. Submission of Matters to a Vote of Security Holders.
There have been no material changes to the procedures by which the shareholders may recommend nominees to the registrant’s Board of Trustees, where those changes were implemented after the registrant last provided disclosure in response to the requirements of Item 407(c)(2)(iv) of Regulation S-K (17 CFR 229.407) (as required by Item 22(b)(15) of Schedule 14A (17 CFR 240.14a-101)), or this Item.
Item 11. Controls and Procedures.
| | (a) | The registrant’s principal executive and principal financial officers, or persons performing similar functions, have concluded that the registrant’s disclosure controls and procedures (as defined in Rule 30a-3(c) under the Investment Company Act of 1940, as amended (the “1940 Act”) (17 CFR 270.30a-3(c))) are effective, as of a date within 90 days of the filing date of the report that includes the disclosure required by this paragraph, based on their evaluation of these controls and procedures required by Rule 30a-3(b) under the 1940 Act (17 CFR 270.30a-3(b)) and Rules 13a-15(b) or 15d-15(b) under the Securities Exchange Act of 1934, as amended (17 CFR 240.13a-15(b) or 240.15d-15(b)). |
| | (b) | There were no changes in the registrant’s internal control over financial reporting (as defined in Rule 30a-3(d) under the 1940 Act (17 CFR 270.30a-3(d))) that occurred during the registrant’s last fiscal quarter that has materially affected, or is reasonably likely to materially affect, the registrant’s internal control over financial reporting. |
Item 12. Disclosure of Securities Lending Activities for Closed-End Management Investment Companies.
Not applicable.
Item 13. Exhibits.
| | (a)(1) | Code of ethics, or any amendment thereto, that is the subject of disclosure required by Item 2 is attached hereto. |
| | (a)(2) | Certifications pursuant to Rule 30a-2(a) under the 1940 Act and Section 302 of the Sarbanes-Oxley Act of 2002 are attached hereto. |
| | (b) | Certifications pursuant to Rule 30a-2(b) under the 1940 Act and Section 906 of the Sarbanes-Oxley Act of 2002 are attached hereto. |
SIGNATURES
Pursuant to the requirements of the Securities Exchange Act of 1934 and the Investment Company Act of 1940, the registrant has duly caused this report to be signed on its behalf by the undersigned, thereunto duly authorized.
| | |
| |
(Registrant) | | The Gabelli Asset Fund |
| | |
By (Signature and Title)* | | /s/ Bruce N. Alpert |
| | Bruce N. Alpert, Principal Executive Officer |
Pursuant to the requirements of the Securities Exchange Act of 1934 and the Investment Company Act of 1940, this report has been signed below by the following persons on behalf of the registrant and in the capacities and on the dates indicated.
| | |
By (Signature and Title)* | | /s/ Bruce N. Alpert |
| | Bruce N. Alpert, Principal Executive Officer |
| | |
By (Signature and Title)* | | /s/ John C. Ball |
| | John C. Ball, Principal Financial Officer and Treasurer |
* Print the name and title of each signing officer under his or her signature.