UNITED STATES
SECURITIES AND EXCHANGE COMMISSION
Washington, D.C. 20549
FORM 10-K
(Mark one)
| x | Annual Report Pursuant to Section 13 or 15(d) of the Securities Exchange Act of 1934 |
For the fiscal year ended December 31, 2005 | |
| or | |
| ___ | Transition report pursuant to Section 13 or 15(d) of the Securities Exchange Act of 1934. For the transition period from __________________ to _______________________ |
Commission File No. 1-9035
Pope Resources, A Delaware Limited Partnership
(Exact name of registrant as specified in its charter)
Delaware | 91-1313292 |
| (State of Organization) | (IRS Employer I.D. No.) |
19245 Tenth Avenue NE , Poulsbo, WA 98370
(Address of principal executive offices, Zip Code)
Registrant's telephone number, including area code: (360) 697-6626
Securities registered pursuant to Section 12(b) of the Act:
Title of each class | Name of each exchange on which registered |
Depositary Receipts (Units) | NASDAQ National Market System |
Indicate by check mark if the registrant is a well-known seasoned issuer, as defined in Rule 405 of the Securities Act. Yes ____ No x
Indicate by check mark if the registrant is not required to file reports pursuant to Section 13 or 15(d) of the Act. Yes____ No x
Indicate by check mark whether the registrant (1) has filed all reports required to be filed by Section 13 or 15(d) of the Securities Exchange Act of 1934 during the preceding 12 months, and (2) has been subject to such filing requirements for the past 90 days. Yes x No _____
Indicate by check mark if disclosure of delinquent filers pursuant to Item 405 of Regulation S-K is not contained herein, and will not be contained, to the best of registrant's knowledge, in definitive proxy or information statements incorporated by reference in Part III of this Form 10-K or any amendment to this Form 10-K. x
Indicate by check mark whether the registrant is a large accelerated filer, an accelerated filer, or a non-accelerated filer. See definition of “accelerated filer and larger accelerated filer” in Rule 12b-2 in Rule 12b-2 of the Exchange Act.
Large Accelerated ________ Filer Accelerated Filer x Non-Accelerated Filer _______
Indicate by check mark whether the registrant is a shell company (as defined by rule 12b-2 of the Act).
Yes______ No x
At June 30, 2005, the aggregate market value of the non-voting equity units of the registrant held by non-affiliates was approximately $136,344,000.
The number of the registrant’s limited partnership units outstanding as of February 9, 2006 was 4,646,371
Documents incorporated by reference: None
Pope Resources, A Delaware Limited Partnership
Form 10-K
For the Fiscal Year Ended December 31, 2005
Index
| Page | |||
| 3 | |||
| 14 | |||
| 15 | |||
| 16 | |||
| 17 | |||
| 17 | |||
| 17 | |||
| 18 | |||
| 21 | |||
| 47 | |||
Item 8. | 48 | ||
| 70 | |||
| 70 | |||
| 71 | |||
| 72 | |||
| 74 | |||
| 82 | |||
| 84 | |||
| 85 | |||
| 85 | |||
| 90 |
2
OVERVIEW
Pope Resources, A Delaware Limited Partnership (the "Partnership"), was organized in October 1985 as a result of a spin-off by Pope & Talbot, Inc. (“P&T”), Pope & Talbot Development, Inc. and other P&T affiliates, of certain of their timberland and real estate development assets.
The Partnership currently operates in three primary business segments: (1) Fee Timber, (2) Timberland Management & Consulting, and (3) Real Estate. Fee Timber operations consist of the growing and harvesting of timber from the Partnership’s tree farms. Timberland Management & Consulting, through the Partnership’s wholly owned indirect subsidiary, Olympic Resource Management LLC (“ORMLLC”), provides timberland management and forestry consulting services to third-party owners of timberlands as well as working to acquire timberland properties on behalf of ORM Timber Fund I, LP, which has committed capital of $61.8 million, including $12.4 million from the Partnership. Real Estate operations consist of efforts to enhance the value of the Partnership’s land investments by obtaining the entitlements and, in some cases, building the infrastructure necessary to make further development possible. Further segment financial information is presented in Note 9 to the Partnership’s Consolidated Financial Statements included in this report. General information can also be found at www.orm.com. The information contained on or connected to our web site is not incorporated by reference into this Annual Report on Form 10-K and should not be considered part of this or any other report filed with the SEC.
DESCRIPTION OF BUSINESS SEGMENTS
Fee Timber
Operations. The Partnership’s Fee Timber segment consists of operations surrounding management of the Partnership’s core assets: the Hood Canal tree farm, which consists of 71,000 acres located in the Hood Canal area of Washington which the Partnership has held since its formation, and the 44,000-acre Columbia tree farm located in southwestern Washington State. The Partnership views its two tree farms as core holdings and manages them as a single operating unit. Operations on the tree farms consist of the growing of timber and the subsequent harvesting and marketing of timber and timber products to both domestic and Pacific Rim markets. The Partnership’s Fee Timber segment produced 78%, 85%, and 85% of the Partnership's consolidated revenue in 2005, 2004, and 2003, respectively.
Inventory. Inventory information discussed below is for both the Hood Canal and Columbia tree farms, including the timberland acquisitions completed in 2004.
We define “merchantable timber inventory” to mean timber inventory in productive timber stands that are 35 years of age and older, which represents management’s estimate of when merchantable value would be assigned to the timber in a timberland sale. As of January 1, 2006, the tree farms’ total merchantable inventory volume was estimated to be 427 million board feet (MMBF). The Partnership’s estimated merchantable timber inventory volume as of January 1, 2005 was 486 MMBF. The decline in merchantable inventory on January 1, 2006 versus January 1, 2005 was expected and is primarily a function of the uneven age class distribution of the Partnership’s stands and also results from harvesting merchantable timber in 2005 that we acquired during 2004.
While merchantable timber inventory is defined as timber in stands that are 35 years of age and older, the Partnership’s stands are not normally at their economic rotation age until after 40 years. Economic rotation age, which varies by geographic site and species, represents the estimated optimal age to harvest a specific stand of timber. The Partnership, for purposes of calculating the rate used for depletion expense in the financial statements, uses 40 years as the age of timber stands whose volume and cost basis is included in the depletion pool.
3
The Partnership’s merchantable inventory as of January 1, 2006 and 2005 is spread between age classes as follows:
Age Class | 1/1/2006 Volume (in MMBF) | 1/1/2005 Volume (in MMBF) | |||||
| 35 to 39 | 66 | 67 | |||||
| 40 to 44 | 74 | 66 | |||||
| 45 to 49 | 26 | 33 | |||||
| 50 to 54 | 20 | 30 | |||||
| 55 to 59 | 68 | 81 | |||||
| 60 to 64 | 84 | 97 | |||||
| 65+ | 89 | 112 | |||||
| 427 | 486 | ||||||
Timber inventory volume is estimated using the Partnership's standing timber inventory system, which utilizes annual statistical sampling of the timber (a process called “cruising”) with adjustments made for estimated growth and depletion of areas harvested. The accuracy of this process is monitored by taking the actual volume harvested from stands and comparing it to the corresponding volume for those stands in the Partnership’s standing inventory system. This comparison often indicates specific units where the actual cut was different from the inventory. The difference in an aggregate sense for any given year, however, between the volume reflected in the inventory for that year’s harvest units and the amount of harvest volume actually removed from those stands is usually within a couple percent of the volume harvested. Inventory volumes take into account the applicable state and federal regulatory limits on timber harvests as applied to our properties, including the Forests and Fish Law that supplements Washington State’s forest practice regulations to provide for expanded riparian management zones and similar buffers, wildlife leave trees, and other harvest restrictions. The Partnership annually cruises 20% of its productive timberland acres with stand ages of at least 20 years.
The dominant timber species on the Partnership’s tree farms is Douglas-fir. Douglas-fir is noted for its structural characteristics that make it generally preferable to other softwoods and hardwoods for the production of construction grade lumber and plywood. In addition to Douglas-fir, inventory species on the Partnership’s tree farms include western hemlock, western red cedar, and red alder. The Partnership’s total merchantable timber inventory as of January 1, 2006 is distributed among species as follows:
| Species | Volume (in MMBF) | Percent of total | ||
| Douglas-fir | 320 | 75 | ||
| Western hemlock | 50 | 12 | ||
| Western red cedar | 14 | 3 | ||
| Other conifer | 13 | 3 | ||
| Red alder | 26 | 6 | ||
| Other hardwood | 4 | 1 | ||
| Total | 427 | 100% |
4
The Hood Canal tree farm has significant acreage with mature timber and even more acreage with relatively immature trees, which results in what we call a “bimodal” age class pattern that management believes is common among western U.S. timberland ownerships. This bimodal pattern can be dealt with in three primary ways: (1) delay harvests of mature acres to backfill what would otherwise be smaller harvest years until the immature trees become merchantable; (2) harvest the mature acres at a rate that more closely approximates rotation age and allow later harvest cash flows to decline for some period while the younger blocks of acreage mature; or (3) acquire timberland properties with age-class characteristics that fill in the trough in the bimodal pattern. The Partnership opted for this last alternative with the acquisition of the Columbia tree farm in March 2001. Management believes it not only made a sound value investment on its own merits in acquiring the Columbia tree farm, but also made significant progress toward smoothing the age-class distribution of the Partnership’s timberland holdings.
The Partnership’s tree farms as of January 1, 2006 total nearly 115,000 acres. Of this total, approximately 98,000 acres are designated productive acres. Productive acres represent land that is suitable for growing and harvesting timber and excludes acreage that is unavailable for harvest because it is in protected wetlands or riparian management zones (stream set-asides). Productive acres also reflect deductions for roads and other land characteristics that inhibit suitability for growing or harvesting timber. As of January 1, 2006, total productive acres are spread by timber age class as follows:
Age Class | 1/1/2006 Acres | % | |||
| Clear-cut | 2,690 | 2.8 | |||
| 0 to 4 | 8,002 | 8.2 | |||
| 5 to 9 | 13,776 | 14.1 | |||
| 10 to 14 | 4,082 | 4.2 | |||
| 15 to 19 | 14,793 | 15.1 | |||
| 20 to 24 | 15,805 | 16.2 | |||
| 25 to 29 | 11,439 | 11.7 | |||
| 30 to 34 | 5,134 | 5.3 | |||
| 35 to 39 | 5,014 | 5.1 | |||
| 40 to 44 | 4,330 | 4.4 | |||
| 45 to 49 | 1,640 | 1.7 | |||
| 50 to 54 | 1,006 | 1.0 | |||
| 55 to 59 | 2,961 | 3.0 | |||
| 60 to 64 | 3,577 | 3.6 | |||
| 65+ | 3,513 | 3.6 | |||
| 97,762 | 100 | % |
The Partnership's annual harvest level is derived from a long-term harvest plan that factors in economic rotation ages of all stands, existing timber inventory levels, growth and yield assumptions, and regulatory constraints associated with the Washington State Forest Practices Act. From this information, management develops annual and long-term harvest plans predicated on their assessment of existing and anticipated economic conditions with the objective of maximizing long-term values. This plan is updated periodically to take into account changes in timber inventory, including species mix, site index (classification of soil productivity), volume, size, and age of the timber. The long-term harvest plan is calculated using a non-declining even-flow harvest constraint, meaning that future harvest levels will always be as high, or higher than current levels excluding 2004, 2005, and 2006 harvests from the 2004 timberland acquisitions.
5
Projected annual harvest levels over the next 30 years in million board feet (MMBF) is as follows:
| Period | Harvest | |
| 2006 | 58,050 | |
| 2007 to 2034 | 52,500 |
As stated above, future harvest volumes are modeled to be non-declining in volume over time. An exception to this harvest-modeling rule was made for the approximately 4,700 acres of timberland acquired in 2004, which included a large percentage of merchantable timber. As a result of these transactions, the annual harvest was increased to 60.3 MMBF in 2004 and 74.2 MMBF in 2005 and our harvest level in 2006 is expected to be 58.1 MMBF before declining to 52.5 MMBF in 2007. The elevated harvest level in 2004, 2005, and 2006 is expected to recoup a significant portion of the aggregate price paid for these 4,700-acre acquisitions. Depletion costs related to a portion of harvest taken from the 2004 timberland acquisitions has been and will be calculated using a stand-alone cost pool.
Marketing and Markets. The Partnership markets timber using the manufactured log method, where it engages independent logging contractors to harvest the standing timber and manufacture it into logs that the Partnership then sells on the open market. The Partnership or its subsidiaries retain title to the logs until delivery takes place, which normally occurs at a customer log yard. We sell our logs both domestically and internationally through log exporting intermediaries. Our principal international market is the Pacific Rim. Logs going to this destination are generally sold to U.S.-based brokers who in turn sell direct to offshore customers. Japan is by far the largest buyer of logs in the Pacific Rim market, though Korea and China represent significant export markets from time to time.
Customers. The Partnership sells its logs domestically to lumber mills (and other processors of wood fiber) located throughout western Washington and northwest Oregon. The Partnership’s logs are also sold to export intermediaries located at the ports of Tacoma, Olympia, and Longview, Washington. Whether destined for domestic or export markets, the cost of transporting logs limits the destinations to which the Partnership can profitably deliver and sell its logs.
The Fee Timber segment had two major customers in 2005, Weyerhaeuser Company and Simpson Timber Company, which represented 13% and 12%, respectively of segment revenue. Similarly, in 2004 the Fee Timber segment had two major customers, Simpson Timber Company and Weyerhaeuser Company, which represented 18% and 14%, respectively, of segment revenue. Mill competition for available log supply is an important factor in the harvest and sale of logs. For a number of years beginning in the mid-1990’s, we observed in our operating areas a trend toward lumber mill ownership consolidation and mill closure. This trend eased in 2004 and 2005 with the actual and announced openings of several new mills in the Puget Sound region. Further consolidation of mill ownership in the Puget Sound area could cause a decline in prices realized for the Partnership’s logs. The Partnership delivered logs to over 45 separate customers during 2005.
Competition. Many of our competitors are comparable in size or larger. Log sellers compete on the basis of quality, pricing, and the ability to satisfy volume demands for various types and grades of logs to particular markets. Management believes that the location, type, and grade of the Partnership’s timber will enable it to compete effectively in these markets. However, our products are subject to increasing competition from a variety of non-wood and engineered wood products as well as competition from foreign-produced logs.
6
Forestry and Stewardship Practices. The Partnership's timberland operations incorporate management activities that include reforestation, control of competing brush in young stands, thinning of the timber to achieve optimal spacing after stands are established, and fertilization. During 2005, the Partnership planted 950,000 seedlings on 2,290 acres of the Partnership’s tree farms. This compares to the years 2004 and 2003 in which the Partnership planted 1,136,000 and 677,000 seedlings on 2,700 and 1,700 acres, respectively. Seedlings are generally planted from December to April depending on weather and soil conditions. The number of acres and seedlings planted will vary from year to year based upon harvest level, the timing of harvest, and seedling mortality rates on stands planted in prior years. Management's policy is to stay current on its reforestation program, returning all timberlands to productive status as soon as economically feasible following harvest.
Sustainable Forestry Initiative (SFI). Management obtained its SFI certification from the American Forest & Paper Association (AF&PA) in 2003. That certification is awarded following a third-party audit of the Partnership’s forestry and stewardship practices against those objectives and principles promulgated by the AF&PA. Management views this certification as an important indication of our commitment to treat the assets we own and manage with respect. We believe this commitment is an important business practice that contributes to our reputation and the long-term value of the Partnership’s assets.
In order to maintain this certification, management must document its timberland management policies that address the SFI objectives. The SFI objectives are divided into six categories: Land Management; Procurement, Forestry Research, Science and Technology; Training and Education; Regulatory Compliance; Public and Landowner Involvement in the Practice of Sustainable Forestry; and finally Review and Continual Improvement.
Management performs an annual self-assessment of its compliance with these objectives, and every three years hires a third-party auditor to ensure that our policies address the SFI objectives and that management is following those policies. The next third-party audit of the Partnership’s policies is scheduled for 2006. Certification under SFI is currently a requirement for us to sell to a number of our customers in the Partnership’s geographic market. We believe this certification allows us to obtain the best price for our logs while protecting the core assets of the Partnership, the Hood Canal and Columbia tree farm
Fire Management. Management has taken a number of steps to mitigate risk of loss from fire, which is nonetheless possible on any timberland property. First, management maintains a well-developed road system that allows access and quick response to fires that do occur. Second, management maintains a fire plan and program that provides for increased monitoring activities and requires all operators to maintain adequate fire suppression equipment during the summer fire season.
Timberland Management & Consulting
Background. In March 1997, our unitholders authorized management to expand its timberland business into the Investor Portfolio Management Business (IPMB). The IPMB has two complementary business strategies: timberland management and portfolio development. In 1997, the Partnership formed two wholly owned subsidiaries, ORM, Inc. and ORMLLC, to facilitate the IPMB activities.
Operations. To date, the Timberland Management & Consulting segment’s key operation has been to provide various aspects of timberland management services to third-party timberland owners.
Timberland Management. Timberland management provides timberland management, acquisition, and disposition services to timberland owners. These services generally take the form of a long-term contract where ORMLLC personnel provide management expertise. Following an 18-month bankruptcy process, a court-approved liquidation plan transferred the ownership of 522,000 acres formerly owned by Crown Pacific LP to Cascade Timberlands LLC (“Cascade”). On January 1, 2005 ORMLLC began managing those timberlands for Cascade. In 2005, Cascade was the Timberland Management & Consulting segment’s major customer, accounting for 92% of segment revenue. In addition, during 2005 ORMLLC provided disposition services to Cascade.
7
Portfolio Development. Portfolio development’s goal is to build and manage diversified timberland portfolios for third-party investors. The closing in mid-2005 of ORM Timber Fund I, LP is a significant step toward this objective. We have raised committed equity capital of $61.8 million, part of which includes the Partnership’s own $12.4 million co-investment commitment. Now that the Fund is closed, we are actively searching for suitable timber properties for the Fund to acquire. The Partnership and the other limited partners in the Fund are required to contribute committed capital as properties are purchased by the Fund. If ORM Timber Fund I, LP is successful in placing committed capital through its timberland acquisition efforts, ORMLLC will attempt to raise additional third-party equity capital and establish a series of timber funds.
Forestry Consulting. In addition to its timberland management activities, ORMLLC also earns revenue by providing forestry-consulting services to third-party owners and managers of timberland assets in Washington, Oregon, and California.
Marketing. ORMLLC pursues third-party timberland management opportunities in the U.S. West through direct marketing to timberland owners. Marketing and business development efforts include regular contact with forest products industry representatives, non-industry owners, and others who provide key financial services to the timberland sector. ORMLLC has developed brochures and other marketing materials that describe the services provided through the Timberland Management & Consulting segment. ORMLLC’s acquisition and disposition activities keep management informed of changes in timberland ownership that can represent opportunities for us to market our management and consulting services.
Customers. Timberland management revenue in 2005 includes one client that represented 92% of segment revenue.
Competition. ORMLLC and its subsidiaries compete against both larger and smaller companies providing similar services. There are approximately 15 established timberland investment management organizations competing against us in the timberland portfolio development business. The companies in this group have access to established sources of capital and, in some cases, increased economies of scale that can put ORMLLC at a disadvantage. Smaller regional companies compete effectively on price for limited scope consulting and land management projects.
Real Estate
Background. The Partnership's real estate activities are closely associated with the management of its timberlands. Management continually evaluates our timberlands in terms of best economic use, whether this means continuing to grow and harvest timber or seeking a rezone of the property for sale or development. After logging our timberlands, management has four primary options for what to do next with the land: reforest it; sell it as undeveloped property; improve it to various levels of development for sale as improved property; or to hold it as development property for later development or sale.
Operations. Real Estate operations include work considered by management necessary to maximize the value of the Partnership’s nearly 3,000-acre portfolio of property that management feels has a higher-and-better-use than growing trees, and leasing residential and commercial properties in the Port Gamble town site. The former objective is generally obtained by securing the entitlements and/or physical improvements necessary to make development possible.
8
Development Properties
Other Land Investments. Management recognizes the significant value represented by the Partnership’s real estate holdings and is focused on adding to that value. The means and methods of adding value to our real estate portfolio vary considerably depending on the specific location and current zoning of each parcel. This range extends from land that has commercial activity zoning where unit values are measured by the square foot to large lots of recently cutover timberland where value is measured in per acre terms. In general, value-adding activities include securing favorable zoning and obtaining final plat approvals to allow for the highest and best use of the properties.
An important new activity aimed at a particular portion of the value-spectrum is the development of our “Rural Lifestyles” program through which rural residential lots are marketed both to those individuals intent on owning rural residential lots and to developers interested in building homes in rural locations. In addition, we are working on master planned communities in Gig Harbor, Bremerton, and Kingston, Washington. Due to each respective property’s size, development complexity, and regulatory environment, the projects are long-term in nature and require extensive time and capital investments to maximize returns. Note that we use the term master planned community to refer to residential or mixed-use developments of more than 500 lots with multiple neighborhoods and recorded covenants, codes, and restrictions.
With the passage of the Growth Management Act (GMA) in the early 1990’s, the Partnership worked to place as many of its properties as possible within designated Urban Growth Areas to increase long-term values. The value realized from these efforts is close to being realized as we begin to develop the Gig Harbor and Bremerton properties. Once management has maximized the land value through its entitlement efforts, management evaluates disposition alternatives including development, sale, or joint ventures with other developers.
Gig Harbor. Gig Harbor, a suburb of Tacoma, Washington, is the site of a 327-acre mixed-use development. In 2003, management obtained an amendment to the City of Gig Harbor’s comprehensive plan that converted 35-acres of the property from business-park to commercial zoning. As such, the development plan for the 327-acre project breaks down roughly as follows: 217 acres for residential; 75 acres for business park; and 35 acres for commercial use. In 2006, the Partnership expects to complete the sale of approximately 17 acres of commercial land to Costco Wholesale Corporation and 3 additional acres on the Costco site to Northwest Capital Investors (NCI) (all acreages quoted are subject to final site plan approval by the City). We also expect to sell 11 acres of business park land to the YMCA. Closing these planned sales is subject to obtaining certain entitlements and completing infrastructure improvements. The Partnership is evaluating disposition alternatives for the residual 5 acres of commercially zoned property on the Costco site as well as 10 acres of adjacent commercial lands. The Partnership is required, as a precondition to closing, to construct and install certain infrastructure improvements, including road, sewer, and/or water, in order to facilitate development of the property and comply with obligations set forth when the property was annexed into Gig Harbor.
Infrastructure installation expenditures for the Gig Harbor site were incurred in 2005 and will continue for several years with estimated total capital expenditures of $11.3 million.
Bremerton. The City of Bremerton approved our request for a planned development on the 264-acre West Hills mixed-use property within the city limits of Bremerton in 1999. As currently conceived, the planned development will include 64 acres of industrial and 200 acres of residential uses. In 2005, the Partnership entered into a Purchase and Sale Agreement with a developer to sell 200 acres with residential zoning for $12.0 million. As a condition of the sale, the Partnership will construct infrastructure to serve the property in 2006 at an estimated cost of approximately $2.5 million. This transaction is expected to close in 2006. Completion of this work will also allow management to more actively market the 64 acres of the property zoned for industrial use.
9
Rural Residential. Management has launched the Rural Lifestyles program to sell rural residential lots after harvest is completed or with properties that have marginal timber value or are encumbered by extended logging moratoriums. These properties are typically non-contiguous smaller lots ranging in size between 5 and 100 acres with zoning ranging from one dwelling unit per 5 acres to one per 40 acres. Development and disposition strategies vary depending on the property’s unique characteristics. Development efforts and costs expended to ready these properties for sale include working to obtain development entitlements that will increase the property’s value as residential property as well as making improvements to existing logging roads; constructing new roads; extending dry utilities; and sometimes constructing entry barriers to establish gated communities.
Management intends to build on the success of these disposition efforts and offer a steady supply of rural residential lots to the market that will result in an ongoing revenue stream for the Real Estate segment. We anticipate selling on average 250 acres each year from this category over the next several years.
Kingston. The Partnership has a 356-acre residential development project in Kingston called Arborwood. In 2005, management successfully championed the inclusion of the property inside the Kingston Urban Growth Area and increased the property’s potential development density (and value). This adjustment to the Urban Growth Area boundary was appealed and the State’s Growth Management Hearings Board has six months to review the County’s decision. Management believes the appeal will ultimately be denied and Arborwood’s designation within the Urban Growth Area will be upheld. Assuming the results of the appeal process are favorable to us, management expects to master plan the property and formulate a disposition strategy late in 2006. The Partnership owns an additional 366 acres bordering Arborwood for which Kitsap County has an option expiring in 2008 to purchase for use as a county park. This optioned property can be subdivided into 5-acre lots if the County does not exercise its option.
Commercial Properties
Port Gamble. Port Gamble was designated a “Rural Historic Town” under Washington State’s Growth Management Act (GMA) in 1999. This designation allows for substantial new commercial, industrial, and residential development using historic land use patterns, densities, and architectural character. Efforts in 2005 centered on continuing to introduce and nurture visitor-focused commercial activities. Management has continued to promote the town as a venue for festivals, weddings and events. Other 2005 efforts included repair and maintenance activities to make the town more appealing to visitors, residents, and commercial tenants.
A negotiated settlement with P&T in 2002 resulted in the Partnership taking over a former millsite as well as providing for the initiation of environmental cleanup activities, the responsibility for which is being shared between P&T and the Partnership. That agreement represents a significant step toward defining Port Gamble’s future. In January 2005, P&T and Pope Resources received Washington State’s highest award from the Washington State Department of Ecology for their work cleaning up the environmental contamination at Port Gamble. See “Management’s Discussion and Analysis of Financial Condition and Results of Operations - Results of Operations - Real Estate - Environmental Remediation Costs.”
10
Marketing. Marketing activities in the Real Estate segment during 2005 consisted of marketing residential and commercial space available for lease. Additionally, the Partnership continues to list various rural residential properties for sale as they become available to developers and end users.
Customers. Customers for Port Gamble townsite rental space consist of both individual and commercial tenants. Management typically markets its land to private individuals, residential contractors, and developers of commercial property.
Competition. Our Real Estate activities consist primarily of adding value to current land holdings. Once those properties are ready for development, management will in most instances seek to market the property for sale, but in some instances may consider a strategy that would involve another developer with building expertise as a joint venture partner. Other bulk parcel owners in the Puget Sound area have similar strategies.
Transportation. Land values for our Real Estate portfolio are strongly influenced by transportation limitations between the Kitsap Peninsula and the Seattle-Tacoma corridor. Transportation options between Seattle-Tacoma and Kitsap County include driving on the Tacoma Narrows Bridge or taking one of several car ferries. The Washington State Department of Transportation has been working for several years to add a new span to the Tacoma Narrows Bridge connecting Tacoma and Gig Harbor. The project, expected to be completed in 2007, will be financed through the imposition of tolls.
Ferry transportation in our market area currently utilizes vessels that carry both automobiles and passengers from each of the communities of Kingston, Bremerton, and Bainbridge Island, respectively, to and from Seattle. In 2004 and extending into 2005, two private companies began offering passenger-only ferry service from the peninsula to Seattle. Kitsap Ferry Company continues to operate passenger-only ferry service from Bremerton to Seattle. Aqua Express, however, after offering passenger-only ferry service from Kingston to Seattle during much of 2005, ultimately cancelled the service because of insufficient demand and high fuel costs. Efforts are currently underway in the Washington State legislature to provide public financing for passenger-only ferry service to the Kitsap Peninsula.
Employees.
As of January 1, 2006, the Partnership employed 52 full-time, year-round salaried employees and up to 29 part-time and seasonal personnel, who are distributed among the segments as follows:
Segment | Full-Time | Part-Time/ Seasonal | Total | |||
| Fee Timber | 13 | 4 | 17 | |||
| Timberland Management & Consulting | 17 | 22 | 39 | |||
| Real Estate | 12 | 2 | 14 | |||
General and Administrative | 10 | 1 | 11 | |||
Totals | 52 | 29 | 81 | |||
None of our employees are subject to a collective bargaining agreement and the Partnership has no knowledge that any steps toward unionization are in progress. Management considers the Partnership’s relations with its employees to be good.
11
Government Regulation
In the operation and management of its tree farms, the Partnership is subject to Federal and Washington State land use and environmental laws. Management's objective is to be in compliance with such laws and regulations at all times. We anticipate that increasingly strict requirements relating to the environment, threatened and endangered species, natural resources, forestry operations, and health and safety matters, as well as increasing social concern over environmental issues, may result in additional restrictions on the timber operations of the Partnership. This will in turn result in increased costs, additional capital expenditures, and reduced operating flexibility. Management believes that the Partnership’s operating practices, assets and properties are in material compliance with all applicable Federal, state and local laws, regulations and ordinances applicable to its business. However, there can be no assurance that future legislative, governmental, or judicial decisions will not adversely affect the Partnership’s operations.
Regulatory Structure. Growing and harvesting timber are subject to numerous laws and government policies to protect the environment, non-timber resources such as wildlife and water, and other social values. Changes in those laws and policies can significantly affect local or regional timber harvest levels and market values of timber-based raw materials. Real estate development activities are also subject to numerous state and local regulations such as the Washington State Growth Management Act. In addition, the Partnership is subject to Federal, state, and local pollution controls (with regard to air, water and land); solid and hazardous waste management, disposal and remediation laws; and regulations in each segment and all geographic regions in which it has operations.
Endangered Species and Habitats. A number of fish and wildlife species that inhabit geographic areas near or within Partnership timberlands have been listed as threatened or endangered under the Federal Endangered Species Act (ESA) or similar state laws in the United States. Federal ESA listings include the northern spotted owl, marbled murrelet, a number of salmon species, bull trout and steelhead trout in the Pacific Northwest. Listings of additional species or populations may result from pending or future citizen petitions or be initiated by Federal or state agencies. Federal and state requirements to protect habitat for threatened and endangered species have resulted in restrictions on timber harvest on some timberlands, including some timberlands of the Partnership. Additional listings of fish and wildlife species as endangered, threatened, or sensitive under the ESA and similar state laws as well as regulatory actions taken by Federal or state agencies to protect habitat for these species may, in the future, result in the following: an increase in operating costs; additional restrictions on timber harvests; forest management practices or real estate development; and potential impact on timber supply and prices.
Forestry Management Practices. Forest practice acts in some U.S. states increasingly affect present or future harvest and forest management activities. For example, in some states, these rules have one or more of the following impacts: limit the size of clear-cut harvest units; require some timber to be left unharvested to protect water quality and fish and wildlife habitat; regulate construction and maintenance of forest roads; require reforestation following timber harvest; and contain procedures for state agencies to review and approve proposed forest practice activities. Federal, state, and local regulations protecting wetlands could affect future harvest and forest management practices on some of the Partnership’s timberlands.
Each state in which the Partnership owns or manages timberlands has developed “best management practices” to reduce the effects of forest practices on water quality and aquatic habitats. Additional, more stringent regulations may be adopted in order to achieve the following: enhance water quality standards under the Federal Clean Water Act; protect fish and wildlife habitats; or advance other public policy objectives.
12
In the State of Washington, the Forest and Fish Report became the basis for revised Forest Practices Rules and Regulations that were adopted in 1999 and finalized in 2001. The Washington Forest Protection Association produced the Forest and Fish Report through the collaborative efforts of Washington State’s private landowners; Federal, state and county governments; and Native American tribes. The goals of these revised rules are to:
| · | Provide compliance with the Endangered Species Act (ESA) for aquatic and riparian dependent species on private forest lands; |
| · | Restore and maintain riparian habitat on private land to support a harvestable supply of fish; |
| · | Meet the requirements of the Clean Water Act for water quality on private forest lands; and |
| · | Keep the timber industry economically viable in the State. |
The proposed Water Quality Standards that the Washington State Department of Ecology adopted in 2003 have undergone Department of Ecology and public scrutiny. As such, these rules should be sufficient to comply with the Anti-Degradation Implementation Plan as described in the Clean Water Act.
The regulatory and non-regulatory forest management programs described above have increased operating costs and resulted in changes in the value of timber and logs from the Partnership’s timberlands. These kinds of programs also can make it more difficult to respond to rapid changes in markets, extreme weather or other unexpected circumstances. One additional effect may be further reductions in usage of (and some substitution of other products for) lumber and plywood. Management does not believe that these kinds of programs have had a significant effect on the Partnership’s total timber harvest, although they may have such an effect in the future. Further, management does not expect the Partnership to be disproportionately affected by these programs as compared with typical timberland owners. Likewise, management does not expect that these programs will significantly disrupt its planned operations over large areas or for extended periods.
Water Quality. The U.S. Environmental Protection Agency also promulgated regulations in 2000 requiring states to develop total maximum daily load (“TMDL”) allocations for pollutants in water bodies that have been determined to be “water quality impaired.” The TMDL requirements set limits on pollutants that may be discharged to a body of water or set additional requirements, such as best management practices for nonpoint sources, including timberland operations, to reduce the amounts of pollutants in water quality impaired bodies of water. These requirements have impacted tree farming principally through rules requiring tree farms to minimize silt caused by roads, harvest blocks and other management activities from coming in contact with water quality impaired bodies of water. TMDL targets will be established for specific water bodies in the states where the Partnership operates and these targets will be set so as to achieve water quality standards within 10 years, when practicable. It is not possible at this time to either estimate the capital expenditures that may be required for the Partnership to stay below the targets until a specific TMDL is promulgated or to determine whether these expenditures will have a material impact on the Partnership’s financial condition or results of operations.
13
Washington State Growth Management Act (GMA). Land holdings throughout Washington State are affected by the GMA, which requires counties to submit comprehensive plans that identify the future direction of growth and stipulate where population densities are to be concentrated. The purposes of the GMA include: (1) direction of population growth to population centers (Urban Growth Areas), (2) reduction of “suburban sprawl”, and (3) protection of historical sites. The Partnership works with local governments within the framework of the GMA to develop its real estate holdings to their highest and best use.
A number of known risks, some of which are discussed below, as well as various unknown risks and uncertainties, may cause our revenue to fall short of management’s expectations. Although certain statements in this report are forward looking in nature, these known and unknown risks make it impossible for management to predict with any degree of certainty either quantitative factors such as cash flow, results of operations or financial condition, or qualitative factors such as management’s plans, objectives, or responses to various events or occurrences. Readers therefore should recognize that statements other than those of historical fact are not guarantees or assurances of future performance, but are “forward looking statements” within the meaning of Federal Securities Law. Some of our forward looking statements can be identified by the use of predictive terms such as “expect”, “anticipate”, “will”, “might”, “may”, “plans”, and words of similar meaning or construction. The following section discusses some of the known risks that may cause our actual financial results to fall materially short of management’s expectations, or that may cause management to deviate from its expressed intentions or predictions. Readers should also recognize that this list is not exhaustive, and in addition to those factors listed below, a wide range of risks faced by most or all participants in the timber industry or in international trade, as well as various unexpected events or conditions, may adversely impact our business.
Competition Generally. We compete against much larger companies in each of our business segments. We compete with these companies for management and line personnel, as well as for purchases of relatively scarce capital assets such as land and standing timber and for sales of our products. These larger competitors may have access to larger amounts of capital and significantly greater economies of scale, and they may be better able to absorb the risks of our line of business. Moreover, the timber industry has experienced significant consolidation in recent years and, as that consolidation occurs, our relative market share decreases and the relative financial capacity of our competitors increases. While management believes the Partnership is at a competitive advantage over some of these companies because of our lack of vertical integration into forest products manufacturing, our advantageous tax structure, and management’s attempts to diversify our asset base, we cannot assure readers that competition will not have a material and adverse effect on our results of operations or our financial condition.
Fee Timber Competition and Demand Issues. Fee Timber revenue is generated primarily through the sale of softwood logs to both domestic mills and third-party intermediaries that resell to the export market. The domestic market for logs in the Puget Sound region of Washington State has been impacted by imported lumber from Canada and decreased demand for lumber as engineered wood products have gained market acceptance in the U.S. These factors have had the effect of concentrating mill ownership with larger mill operators and decreasing the number of mills operating in the Puget Sound region. During 2005 this trend appears to have been broken as several new mills were opened. However if mill ownership began to consolidate once again, a resulting decrease in local demand for logs may decrease our profitability. Over the last few years the Partnership has seen the price of logs erode in the Japanese market as competing logs and lumber from regions outside of the U.S. and engineered wood products have gradually gained market acceptance. These export markets for Pacific Northwest logs are significantly affected by fluctuations in U.S. and Japanese economies, as well as by the foreign currency exchange rate between the Japanese yen and the U.S. dollar.
14
Our ability to grow and harvest timber can be significantly impacted by legislation, regulations or court rulings that restrict or stop forest practices. Restrictions on logging, planting, road building, fertilizing, managing competing vegetation and other activities can significantly increase the cost or reduce available inventory thereby reducing income.
Timberland Management & Consulting. The Timberland Management & Consulting segment is currently operating with one major timberland management client. Management is working to expand our fee-for-service business by the launch of our timber fund, also a component of our Timberland Management & Consulting segment. Unlike other components of our business, which relate solely or primarily to real estate and timber operations, this line of business carries risks relating to the offer and sale of securities, and to the management of investment operations, including potential liability to investors if we are determined to have made material misstatements or omissions to those investors, potential accusations that we have breached fiduciary duties to other limited partners, and similar types of investor action. Moreover, litigation of shareholder-related matters can be expensive and time consuming and, if brought, would likely distract management from their focus on ordinary operating activities.
Real Estate. The value of our real estate investments is subject to changes in the economic and regulatory environment, as well as various land use regulations and development risks, including the ability to obtain the necessary permits and zoning variances that would allow us to maximize our revenue from our real estate investments. Our real estate investments are long-term in nature, which raises the risk that unforeseen changes in the economy or laws surrounding development activities may have an adverse affect on our investments. Moreover, these investments often are highly illiquid and thus may not generate cash flow if and when needed to support our other operations.
Tax Status. The Partnership is a Master Limited Partnership (MLP) and is therefore not subject to income taxes. If that changed due to a change in tax law (or interpretation of current tax law) such that the Partnership became subject to income taxes, operating results would be adversely affected.
The Partnership has a taxable subsidiary corporation. The estimation of income tax expense and preparation of income tax returns requires complex calculations and judgments. We believe the estimates and calculations used in this process are proper and reasonable but if a Federal or state taxing authority disagreed with the positions we have taken a material change in provision for income taxes, net income, or cash flows could result.
None
15
Item 2. PROPERTIES
The following table reconciles acreage owned as of December 31, 2004 to acreage owned as of December 31, 2005. Properties are typically transferred from Fee Timber to the Real Estate segment when they become more valuable as development property than timber property. At that point the Real Estate segment is responsible for managing the properties with the goal of maximizing the properties value upon disposition.
Description | Owned Acre Totals | ||||||
2004 | Transfers | Sales | Misc. (5) | 2005 | |||
| Office Building | G&A | Poulsbo headquarters | 4 | - | - | - | 4 |
Total Acres used for office space | 4 | - | - | - | 4 | ||
| Timberland Property | Fee Timber | Hood Canal tree farm (2) | 71,330 | (717) | - | (66) | 70,547 |
| Timberland Property | Fee Timber | Columbia tree farm | 44,065 | (71) | - | (3) | 43,991 |
Total Fee Timber Acres | 115,395 | (788) | - | (69) | 114,538 | ||
| Land held for sale | Real Estate | Poulsbo | - | 8 | - | - | 8 |
| Land held for sale | Real Estate | Tank | 10 | - | (10) | - | - |
| Land held for sale | Real Estate | Staircase | 41 | 78 | (119) | - | - |
| Land held for sale | Real Estate | Three Fingers Pond | 330 | 60 | (390) | - | - |
| Land held for sale | Real Estate | West Hills Residential (3) | 200 | - | - | - | 200 |
| Land held for sale | Real Estate | Gig Harbor-current portion (4) | - | 24 | - | 7 | 31 |
| Land held for sale | Real Estate | Oak Bay | 82 | 207 | (88) | - | 201 |
| Land held for sale | Real Estate | Teal Vista | - | 39 | - | - | 39 |
| Land held for sale | Real Estate | Point No Point | - | 20 | - | - | 20 |
| Land held for sale | Real Estate | Tahuya South | 30 | 19 | (39) | - | 10 |
| Land held for sale | Real Estate | Cowlitz | - | 10 | - | - | 10 |
| Land held for sale | Real Estate | Lost Highway | - | 40 | - | - | 40 |
| Land held for development | Real Estate | Port Gamble townsite | 130 | - | - | - | 130 |
| Land held for development | Real Estate | Quilcene | - | 114 | (114) | - | - |
| Land held for development | Real Estate | Clallam 80 | - | 83 | (83) | - | - |
| Land held for development | Real Estate | Nisqually | - | 71 | (71) | - | - |
| Land held for development | Real Estate | Kingston | 1 | - | - | - | 1 |
| Land held for development | Real Estate | Arborwood | 360 | - | - | (4) | 356 |
| Land held for development | Real Estate | Heritage Park Option (1) | 360 | - | - | 6 | 366 |
| Land held for development | Real Estate | West Hills Industrial (3) | 63 | - | - | 1 | 64 |
| Land held for development | Real Estate | Gig Harbor (4) | 320 | (24) | - | - | 296 |
| Land held for development | Real Estate | Homestead | 23 | 15 | - | - | 38 |
| Land held for development | Real Estate | Point No Point | 191 | (59) | - | - | 132 |
| Land held for development | Real Estate | Tala Point | - | 230 | - | - | 230 |
| Land held for development | Real Estate | Shine/Teal | 342 | (76) | - | - | 266 |
| Land held for development | Real Estate | Other | 506 | (71) | - | - | 435 |
Total Real Estate Acres | 2,989 | 788 | (914) | 10 | 2,873 | ||
Grand total acres | 118,388 | - | (914) | (59) | 117,415 | ||
| (1) | Kitsap County has an option to acquire this property that expires in July 2008. |
| (2) | This property is used as collateral for the Partnership’s $33.2 million timberland mortgage. |
| (3) | This property is used as collateral for $191,000 of Local Improvement District debt. |
| (4) | This property is used as collateral for $490,000 of Local Improvement District debt. |
| (5) | Misc. represents miscellaneous changes resulting from surveys, boundary line adjustments, and acreage quit claimed to others without compensation. |
The following table provides dwelling unit (DU) per acre zoning for the Partnership’s owned timberland and development properties as of December 31, 2005 and land sold during 2005:
| Pope Resources Lands | Current Land Inventory (acres) | 2005 Land Sales | |||||||||||||||||
| Zoning Designation | Real Estate | Fee Timber | Totals | Acres | $/Acre | Total Sales | |||||||||||||
| Urban zoning | 1,086 | 181 | 1,267 | ||||||||||||||||
| 1 DU per 5 acres | 655 | 906 | 1,561 | 126 | $ | 7,194 | 906,500 | ||||||||||||
| 1 DU per 10 acres | 283 | 450 | 733 | ||||||||||||||||
| 1 DU per 20 acres | 571 | 33,067 | 33,638 | 688 | $ | 4,271 | 2,938,529 | ||||||||||||
| 1 DU per 40 acres | 2,168 | 2,168 | 100 | $ | 1,187 | 118,716 | |||||||||||||
| 1 DU per 80 acres | 278 | 39,357 | 39,635 | ||||||||||||||||
| Forest Resource Lands | 38,409 | 38,409 | |||||||||||||||||
Total | 2,873 | 114,538 | 117,411 | 914 | $ | 4,337 | $ | 3,963,745 | |||||||||||
16
Item 3. LEGAL PROCEEDINGS
None.
Item 4. SUBMISSION OF MATTERS TO A VOTE OF SECURITY HOLDERS
No matters were submitted to a vote of the Partnership's unit holders during the fourth quarter of 2005.
MARKET FOR REGISTRANT’S UNITS, RELATED SECURITY HOLDER MATTERS, AND ISSUER PURCHASES OF EQUITY SECURITIES |
Market Information
Certain information respecting trades in the Partnership’s equity securities is quoted on the Nasdaq National Market System. The Partnership's units trade under the ticker symbol "POPEZ". The following table sets forth the 2005 and 2004 quarterly ranges of low and high prices, respectively, for the Partnership's units:
| 2005 | 2004 | ||||||||||||
| High | Low | High | Low | ||||||||||
| First Quarter | $ | 56.85 | $ | 19.35 | $ | 24.00 | $ | 15.00 | |||||
| Second Quarter | $ | 37.68 | $ | 31.10 | $ | 20.74 | $ | 17.14 | |||||
| Third Quarter | $ | 37.00 | $ | 31.30 | $ | 24.00 | $ | 18.02 | |||||
| Fourth Quarter | $ | 32.22 | $ | 27.85 | $ | 25.25 | $ | 19.27 | |||||
Unitholders
As of February 7, 2006, there were 262 holders of record for 4,646,371 outstanding units.
17
Distributions
All cash distributions are at the discretion of the Partnership's managing general partner, Pope MGP, Inc. (the “Managing General Partner”). During 2005, the Partnership made two quarterly distributions of fifteen cents per unit and two quarterly distributions of twenty-five cents per unit, with the four distributions totaling $3.7 million. During 2004, the Partnership made two quarterly distributions of seven cents per unit and two quarterly distributions of fifteen cents per unit, with the four distributions totaling $2.0 million. Management intends to continue to pay quarterly distributions in 2006 of twenty-five cents per unit so long as the Managing General Partner, in its discretion, determines this amount to be appropriate. Management will periodically examine distribution levels to ensure it meets the long-term objective of maximizing Partnership value.
Issuance of Unregistered Securities
The Partnership did not conduct any unregistered offering of its securities in 2005.
Repurchase of Equity Securities
The Partnership did not repurchase any of its equity securities in 2005.
Item 6. SELECTED FINANCIAL DATA
Actual Results. The financial information set forth below for each of the indicated years is derived from the Partnership's audited consolidated financial statements. This information should be read in conjunction with the consolidated financial statements and related notes included with this report and those previously filed with the Securities and Exchange Commission (SEC).
The table below includes non-GAAP financial measures including earnings before interest, taxes, depletion, depreciation, and amortization (EBITDDA) and free cash flow. Management believes both of these measures are useful to investors when evaluating the Partnership’s financial performance. EBITDDA is an important measure of operating profitability, particularly when comparing results between different timber-owning companies because there are varying methods of calculating depletion expense under GAAP that may yield net and operating income results that are difficult or impossible to compare. With different issuers employing various depletion methodologies, disclosure of EBITDDA can make it easier for the reader to make meaningful comparisons between the operating results and cash-generating capabilities of different timber companies.
The measure of free cash flow provides users of financial statements a benchmark for the amount of cash available for distributions and investments after making debt payments and recurring capital expenditures. Since this measure starts with net income, not cash flow from operations, it does not include the increases or decreases resulting from changes in working capital that are included in operating cash flow presented on the Statement of Cash Flows. The Partnership has used the method detailed below for calculating free cash flow. Management recognizes that there are varying methods of calculating free cash flow and has provided the calculation below to aid investors that are attempting to reconcile between those different methods.
18
| (Dollars in thousands, except per unit data) | Year December 31, | |||||||||||||||
| Statement of operations data | 2005 | 2004 | 2003 | 2002 | 2001 | |||||||||||
| Revenue: | ||||||||||||||||
Fee Timber (1) | $ | 44,424 | $ | 33,571 | $ | 22,916 | $ | 23,298 | $ | 24,999 | ||||||
| Timberland Management & Consulting | 7,764 | 1,601 | 2,386 | 7,295 | 9,703 | |||||||||||
Real Estate (2) | 4,818 | 4,476 | 1,734 | 1,599 | 13,143 | |||||||||||
| Total revenue | 57,006 | 39,648 | 27,036 | 32,192 | 47,845 | |||||||||||
| Operating income/(loss): | ||||||||||||||||
Fee Timber (1) | 16,320 | 15,126 | 9,669 | 10,199 | 9,190 | |||||||||||
| Timberland Management & Consulting (3) | 3,540 | (598 | ) | 272 | 919 | 1,685 | ||||||||||
Real Estate (2) (4) (5) | 1,270 | 1,586 | (476 | ) | (1,667 | ) | (2,709 | ) | ||||||||
| General and Administrative | (3,651 | ) | (2,986 | ) | (2,842 | ) | (3,864 | ) | (5,110 | ) | ||||||
| Total operating income/(loss) | 17,479 | 13,128 | 6,623 | 5,587 | 3,056 | |||||||||||
EBITDDA (6): | ||||||||||||||||
| Net income/(loss) (1) (2) (3) (4) (5) | 13,684 | 10,176 | 3,528 | 3,334 | (432 | ) | ||||||||||
| Plus: | ||||||||||||||||
| Net interest and income tax | 3,474 | 2,952 | 3,048 | 2,106 | 3,317 | |||||||||||
| Depreciation, Depletion, and amortization (7) | 11,252 | 5,752 | 3,546 | 3,864 | 7,698 | |||||||||||
EBITDDA | 28,410 | 18,880 | 10,122 | 9,304 | 10,583 | |||||||||||
Free cash flow (6): | ||||||||||||||||
| Net income (loss) | 13,684 | 10,176 | 3,528 | 3,334 | (432 | ) | ||||||||||
| Plus: | ||||||||||||||||
| Depreciation, Depletion, and amortization (7) | 11,252 | 5,752 | 3,546 | 3,864 | 7,698 | |||||||||||
| Cost of land sold | 434 | 209 | 200 | 189 | 777 | |||||||||||
| Less: | ||||||||||||||||
| Principal payments | 1,883 | 1,979 | 1,662 | 1,110 | 3,460 | |||||||||||
| Recurring capital expenditures (1) | 6,756 | 3,260 | 2,017 | 2,158 | 1,995 | |||||||||||
Free cash flow | 16,731 | 10,898 | 3,595 | 4,119 | 2,588 | |||||||||||
| Cash flow from operations | 28,909 | 17,854 | 8,641 | 9,005 | 11,237 | |||||||||||
| Earnings/(loss) per unit - diluted | 2.88 | 2.22 | 0.78 | 0.74 | (0.10 | ) | ||||||||||
| Distribution per unit | 0.80 | 0.44 | 0.24 | 0.10 | - | |||||||||||
Balance sheet data | ||||||||||||||||
| Total assets | 106,358 | 94,868 | 86,308 | 86,788 | 84,187 | |||||||||||
| Long-term debt | 32,281 | 34,164 | 36,114 | 37,665 | 38,592 | |||||||||||
| Partners’ capital | 66,405 | 54,533 | 46,036 | 43,598 | 40,673 | |||||||||||
| Debt to total capitalization | 34 | % | 40 | % | 45 | % | 47 | % | 49 | % | ||||||
Other data | ||||||||||||||||
| Acres owned/managed (thousands) | 556 | 121 | 114 | 270 | 617 | |||||||||||
| Fee timber harvested (MMBF) | 74.2 | 60.3 | 45.0 | 45.1 | 36.3 | |||||||||||
| (1) | The Partnership acquired 4,700 acres of timberland in 2004 and the Columbia tree farm in March 2001. The cost of these acquisitions was not included in the calculation of free cash flow. |
| (2) | The Partnership sold its assets and operations in Port Ludlow, Washington in August 2001. Real Estate results for 2001include asset impairment charges of $1.3 million resulting from the sale of assets in Port Ludlow. |
| (3) | Timberland Management & Consulting operating income in 2002 includes $583,000 of restructuring charges following the loss of the Hancock Timber Resource Group (HTRG) timberland management contract and closure of timberland consulting offices in Canada. |
| (4) | Real Estate operating income in 2004 includes a $466,000 environmental remediation charge related to the Port Gamble townsite. |
| (5) | Real Estate operating income in 2002 includes the following charges: $730,000 environmental remediation charge related to the Port Gamble townsite and a $165,000 charge for warranty liabilities for homes sold in Port Ludlow, Washington. |
| (6) | Management considers earnings (net income or loss) before net interest expense, income taxes, depreciation, depletion and amortization (EBITDDA) and free cash flow to be relevant and meaningful indicators of liquidity and earnings performance commonly used by investors, financial analysts and others in evaluating companies in its industry and, as such, has provided this information in addition to the generally accepted accounting principle-based presentation of net income or loss. |
| (7) | Depreciation, depletion, and amortization in 2005 includes $6.3 million of depletion expense resulting from the separate depletion pool used to account for the harvest of timber from the Quilcene timberland acquisition. |
20
Item 7. MANAGEMENT'S DISCUSSION AND ANALYSIS OF FINANCIAL CONDITION AND RESULTS OF OPERATIONS
This report contains a number of projections and statements about our expected financial condition, operating results, and business plans and objectives. These statements reflect our management's estimates based on our current goals, in light of management's expectations about future developments. Statements about expectations and future performance are “forward looking statements” which describe our goals, objectives and anticipated performance. These statements are inherently uncertain, and some or all of these statements may not come to pass. Accordingly, you should not interpret these statements as promises that we will perform at a given level or that we will take any or all of the actions we currently expect to take. Our future actions, as well as our actual performance, will vary from our current expectations, and under various circumstances these variations may be material and adverse. Some of the factors that may cause our actual operating results and financial condition to fall short of our expectations are set forth in the part of this report entitled "Risks and Uncertainties" below. Other issues that may have an adverse and material impact on our business, operating results and financial condition include environmental and land use regulations that limit our ability to harvest timber and develop property and economic conditions that affect consumer demand for our products and the prices we receive for them, and other risks and uncertainties which are discussed in our other filings with the Securities and Exchange Commission. The forward-looking statements in this report reflect our estimates as of the date of the report, and we cannot undertake to update these statements as our business operations and environment change.
This discussion should be read in conjunction with the Partnership's audited consolidated financial statements included with this report.
EXECUTIVE OVERVIEW
Pope Resources, A Delaware Limited Partnership (“we” or the "Partnership"), was organized in October 1985 as a result of a spin-off by Pope & Talbot, Inc. (“P&T”). Pope Resources is engaged in three primary businesses. The first, and by far most significant segment in terms of owned assets and operations is the Fee Timber segment. Operations in this segment consist of growing timber to be harvested as logs for sale to domestic and export manufacturers. The second most significant business in terms of total assets owned is the development and sale of real estate. Real Estate activities primarily take the form of securing permits, entitlements, and, in some cases, installing infrastructure for raw land development and then realizing that land’s value by the selling of larger parcels to buyers who will take the land further up the value chain, either to home buyers or to operators and lessors or commercial property. Since these land projects span multiple years, the Real Estate segment may incur losses for multiple years while a project is developed until that project is sold resulting in operating income. Our third business is providing timberland-related services to third parties. These services may take the form of large-scale timberland management, forestry consulting, or acquisition or disposition services.
As of December 31, 2005, we owned nearly 115,000 acres of timberland in western Washington State plus nearly 3,000 acres of real estate held for sale or development. Our third-party services have historically been conducted in Washington, Oregon, and California.
Macroeconomic factors that have a significant bearing on our business include housing starts in the U.S. (and to a lesser degree in Japan); interest rates; and currency exchange rates - particularly those between the U.S. and Canada, Japan, and Europe. The first two of these factors reflect or influence the health of the U.S. housing market. Currency exchange rates influence the competitiveness of our primary product compared to logs that might be imported from Canada, Europe, or the Southern Hemisphere. Our export logs are sold to domestic intermediaries who then export the logs. A favorable US$/yen exchange rate can help these intermediaries compete in the Japanese market with logs that originate from Canada, Europe, or the Southern Hemisphere thus increasing the price that we are able to realize from the sale of this export-quality log volume.
21
As an owner and manager of timberland, we focus keenly on three “product” markets: lumber, logs, and timberland. Each of these markets has unique and distinct market factors so that they do not move up or down in lockstep with each other. Generally, the lumber market is the most volatile as it responds quickly (even daily) to changes in housing-driven demand and to changes in lumber inventories. Log markets will in turn be affected by what is happening in the lumber spot markets, but pricing shifts typically adjust monthly rather than daily. Log price volatility is also moderated because logs are used to produce products besides just lumber (especially pulp). The market for timberland tends to be less volatile with pricing that lags both lumber and log markets. This is a function of the longer time horizons utilized by timberland investors where the short-swing fluctuations of log or lumber prices become stabilized in acquisition modeling. We watch the lumber market because activity there can presage log price changes. We are in the log market constantly as we negotiate delivery prices to our customers. The timberland market is important as we are constantly evaluating our own portfolio and its underlying value as well as the opportunities to adjust that portfolio through either the acquisition or disposition of such land.
Management’s major opportunity and challenge is to grow our revenue base profitably. We have added almost 44,000 acres to our timberland and Real Estate portfolios over the last five years. Our real estate challenges center around how and when to “harvest” a parcel of land and capture the optimum value increment by selling the property.
Regarding our third-party timberland services, we entered into a management contract with Cascade Timberlands LLC (“Cascade”) in January 2005 to manage that company’s 522,000 acres of timberland in Washington and Oregon. Additionally, now that we have obtained commitments for the $61.8 million ORM Timber Fund I, LP we are seeking to add to our timberland ownership, albeit indirectly, through our 20% co-investment in the fund. Successful acquisitions by the fund will also result in additional management fees for the Timberland Management & Consulting segment.
Our consolidated revenue in 2005, 2004, and 2003, on a percentage basis by segment, are as follows:
Segment | 2005 | 2004 | 2003 |
| Fee Timber | 78% | 85% | 85% |
| Timberland Management & Consulting | 14% | 4% | 9% |
| Real Estate | 8% | 11% | 6% |
Further segment financial information is presented in Note 9 to the Partnership's Consolidated Financial Statements included with this report.
Outlook
Management plans to decrease harvest volume from 74.2 MMBF in 2005 to 58.1 MMBF in 2006. The 2006 harvest level anticipates another 7 MMBF of harvest from our 2004 acquisitions with the balance in line with our estimated sustainable harvest level of 52.5 MMBF. We also expect that log prices will soften modestly in 2006 from 2005 to reflect some cooling in U.S. housing markets. In contrast with the resultant decline in Fee Timber revenue due to softer log prices and lower harvests anticipated in 2006, our Real Estate segment expects to close several land sales in 2006 that will boost results compared to prior periods. In particular, we expect to close property sales in both our Gig Harbor and Bremerton development projects in 2006. Successful closings for these planned sales are contingent upon obtaining entitlements and completing infrastructure improvements. Management fees generated by the Timberland Management & Consulting segment are expected to decline as our primary timberland management client disposes of its timberland. We do anticipate, however, that disposition fees earned by this segment will largely offset the decline in management fees in 2006.
22
RESULTS OF OPERATIONS
The following table reconciles net income for the years ended December 31, 2005 to 2004 and 2004 to 2003. In addition to the table’s numeric analysis, the explanatory text that follows describes many of these changes by business segment.
YEAR TO YEAR COMPARISONS | |||||||
(Amounts in $000's except per unit data) | |||||||
2005 vs. 2004 | 2004 vs. 2003 | ||||||
Total | Total | ||||||
| Net income: | |||||||
| Year ended December 31, 2005 | $ | 13,684 | |||||
| Year ended December 31, 2004 | $ | 10,176 | $ | 10,176 | |||
| Year ended December 31, 2003 | 3,528 | ||||||
| Variance | $ | 3,508 | $ | 6,648 | |||
| Detail of earnings variance: | |||||||
| Fee Timber | |||||||
| Log price realizations (A) | $ | 3,490 | $ | 2,972 | |||
| Log volumes (B) | 7,368 | 5,165 | |||||
| Production costs | (3,653 | ) | (43 | ) | |||
| Depletion | (5,506 | ) | (2,206 | ) | |||
| Other Fee Timber | (505 | ) | (431 | ) | |||
| Timberland Management & Consulting | |||||||
| Management fee changes | 3,715 | 547 | |||||
| Disposition fees | 1,396 | - | |||||
| Other Timberland Mgmnt & Consulting | (973 | ) | (1,417 | ) | |||
| Real Estate | |||||||
| Development property sales | 10 | 2,631 | |||||
| Environmental remediation | 268 | (466 | ) | ||||
| Other Real Estate | (594 | ) | (103 | ) | |||
| General & administrative costs | (665 | ) | (144 | ) | |||
| Interest expense | 173 | 37 | |||||
| Other (taxes, minority int., interest inc.) | (1,016 | ) | 106 | ||||
| Total change in earnings | $ | 3,508 | $ | 6,648 | |||
| (A) | Price variance allocated based on changes in price using the current period volume. | ||||||
| (B) | Volume variance allocated based on change in sales volume and the average log sales price for the prior period less variance in log production costs. | ||||||
23
Fee Timber
Revenue and Operating Income
Fee Timber revenue is earned primarily from the harvest and sale of logs from the Partnership’s 115,000 acres of fee timberland located in western Washington and, to a lesser extent from the lease of cellular communication towers and the sale of gravel. Revenue from the sale of timberland tracts will also appear periodically in results for this segment. Our Fee Timber revenue is driven primarily by the volume of timber harvested, which we ordinarily express in terms of millions of board feet, or “MMBF”, and by the average prices realized on log sales, which we express in dollars per thousand board feet, or “MBF”.
Revenue and operating income for the Fee Timber segment for each year in the three-year period ended December 31, 2005, are as follows (all amounts in millions):
Year ended | Timber revenue | Mineral, cell tower, and other revenue | Total segment revenue | Operating income |
| December 31, 2005 | $42.7 | $1.7 | $44.4 | $16.3 |
| December 31, 2004 | $31.9 | $1.7 | $33.6 | $15.1 |
| December 31, 2003 | $21.4 | $1.5 | $22.9 | $ 9.7 |
Fiscal Year 2005 compared to 2004. Harvest volume was up 23% during 2005 from 2004. This increase was due to a higher planned harvest in 2005 following two timberland acquisitions in 2004 (one acquired in Q1 and the other in Q4) where each had a sizeable component of merchantable timber that allowed us to convert that volume to cash over a short-term period so as to recoup as much of the acquisition cost as practicable. In addition, average log prices were up $47 per MBF, representing a 9% increase over 2004’s log prices. Taken together, these higher volumes and stronger prices resulted in the $10.8 million, or 32%, increase in revenue for 2005 versus 2004. Operating income in 2005 for the Fee Timber segment increased $1.2 million, or 8% from 2004. Notably, the increase in harvest volume did not result in a proportionate increase in operating income due primarily to a $58 per MBF, or $5.5 million, increase in depletion expense when comparing 2004 and 2005.
The increase in depletion expense results from the use of a separate depletion pool for the timberland acquired in the fourth quarter of 2004. The harvest volume from this acquisition has a separate depletion pool because the property has characteristics that are different from the pooled property; specifically the timber on this property at the time of acquisition was almost completely merchantable. As a result of accounting for harvests from this particular acreage using the separate depletion pool and its correspondingly high per MBF depletion charge, the incremental harvest from this acquisition generated significant cash flow but had much less impact on operating income. The cash generated through 2005 and into 2006 related to the timber harvested from the fourth quarter 2004 acquisition will serve to offset a large portion of its purchase price.
Fiscal Year 2004 compared to 2003. Fee Timber revenue increased $10.7 million, or 47%, to $33.6 million in 2004 from $22.9 million in 2003. Harvest volume increased to 60 MMBF from 45 MMBF for 2003. This boost in harvest volume combined with a $53 per MBF increase in average price realized resulted in the increase in revenue. Operating income increased $5.4 million, or 56%, to $15.1 million from $9.7 million in 2003. The increase in operating income is due to the increase in revenue, partially offset by the increase in cost of sales and operating expenses.
24
Log Volume
Log volume sold for each year in the three-year period ended December 31, 2005, is as follows:
Volume (in MMBF) | 2005 | % Total | 2004 | % Total | 2003 | % Total | |||||||||||||
Sawlogs | |||||||||||||||||||
| Douglas-fir | 43.7 | 59% | 35.7 | 59% | 29.7 | 66% | |||||||||||||
| Whitewood | 11.0 | 15% | 10.6 | 18% | 5.5 | 12% | |||||||||||||
| Cedar | 4.5 | 6% | 1.4 | 2% | 1.0 | 3% | |||||||||||||
| Hardwoods | 5.1 | 7% | 2.9 | 5% | 1.9 | 4% | |||||||||||||
Pulp | |||||||||||||||||||
| All Species | 9.9 | 13% | 9.7 | 16% | 6.8 | 15% | |||||||||||||
Total | 74.2 | 100% | 60.3 | 100% | 44.9 | 100% | |||||||||||||
Log volume increased 23% in 2005 from 2004. This increase is due to a timberland acquisition in late 2004 that enabled us to increase our annual harvest in 2005. The portion of total harvest attributable to cedar and hardwood sawlogs increased in 2005 due to the fourth quarter 2004 timberland acquisition. This property contained a relatively high volume of cedar and red alder sawlogs. Pulp log volume as a percentage of total volume decreased to 13% from 16% as a result of the harvest of fewer low-quality timber stands in 2005 compared to 2004.
Log volume in 2004 was 34% higher than 2003 due to a January 2004 timberland acquisition that allowed us to increase our 2004 annual harvest. The relatively high portion of 2004 harvest attributable to pulp logs is due to several “clean up” harvest units that were completed in 2004 in order to replant the acres and improve the quality of the timber growing on those units.
Harvest volume in 2006 is expected to decline to 58.1 MMBF, which is more in line with our estimated sustainable harvest level of 52.5 MMBF.
Log Prices
The following discussion of log prices and volumes is presented in a different format than we have used in the past. A change has been made to present this information in a way that better reflects the drivers of log prices in our current operating environment. We are placing less emphasis on the export market in the discussion below, in part because management believes the domestic market is currently the primary driver of log demand. We continue to sell logs to log brokers that will then export those logs to Japan, Korea, and China, but this portion of the market has declined over the last ten years.
We have categorized our sawlog volume by species, which we believe is a significant driver of price realized as indicated by the table below. The average log price realized by species for each year in the three-year period ended December 31, 2005, is as follows:
25
Price $/MBF | 2005 | % Change | 2004 | % Change | 2003 | |||||||||||
Sawlogs | ||||||||||||||||
| Douglas-fir | $644 | 4% | $619 | 15% | $ 536 | |||||||||||
| Whitewood | $472 | 12% | $423 | 25% | $ 339 | |||||||||||
| Cedar | $942 | -6% | $999 | -7% | $1,075 | |||||||||||
| Hardwoods | $605 | 3% | $587 | 5% | $ 559 | |||||||||||
Pulp | ||||||||||||||||
| All Species | $213 | -5% | $224 | 2% | $ 219 | |||||||||||
Douglas-fir: Douglas-fir is noted for its structural characteristics that make it generally preferable to other softwoods and hardwoods for the production of construction grade lumber and plywood. The price realized on Douglas-fir logs has increased 4% in 2005 from 2004. The increase in price realized in 2005 is attributed to a combination of strong housing starts in the U.S. and additional lumber mills opening in the Puget Sound area of Washington. From 2004 to 2003 the price realized on Douglas-fir sawlogs increased by 15%. This increase was due to a combination of strong housing starts in the U.S. and a decline in log volume imported from British Columbia in 2004. The decline in British Columbia import volume was due to hot dry weather and a labor strike in that Canadian province, which resulted in a decline in log volume available for export into the U.S. It is worth noting that log imports from Canada increased again in 2005 but demand for logs was strong enough that this supply increase did not cause a decline in price.
Whitewood: “Whitewood” is a term used to describe several softwood species, but for us primarily refers to western hemlock. Though generally considered to be of a lower quality than Douglas-fir, these logs are also used for manufacturing construction grade lumber and plywood. The average price realized on whitewood increased 12% in 2005 from 2004, and 25% in 2004 from 2003. Whitewood prices have increased more dramatically than Douglas-fir as the market has become more accepting of utilizing whitewood as a less expensive substitute for Douglas-fir. The new lumber mills referenced above in the discussion of Douglas-fir prices are also a factor in whitewood pricing as these mills are buying both log species.
Cedar: Cedar prices have declined from 2003 to 2004 and again from 2004 to 2005. This decline is attributed to a decrease in mills located in the Puget Sound area of Washington that manufacture cedar products. Cedar has become less available in the Pacific Northwest, and as a result cedar mills have been closing which reduces demand and price for cedar logs.
Hardwood: “Hardwood” can refer to many different species, but on our tree farms primarily represents red alder. The price realized from the sale of red alder sawlogs has increased steadily over the last couple years as new red alder mills have opened to take advantage of the relatively high availability of low cost red alder logs in the Pacific Northwest. These mills manufacture lumber for use in furniture construction.
Pulp: Pulp is a lower quality log of any species that is manufactured into wood chips. These chips are used to manufacture many products including oriented strand board, paper, and cardboard. The price realized from the sale of pulp logs is primarily driven by local pulp log inventories. The decline in the realized price for pulp logs in 2005 compared to 2004 is due to an increase in pulp log supplies which are generally a byproduct resulting from logging activities. The increase in log prices generally from 2004 to 2005 resulted in an increase in logging activities that has in turn resulted in an increase in pulp logs available for sale to local pulp mills.
26
Customers
2005 | 2004 | 2003 | ||||||
Destination | Volume* | Price | Volume* | Price | Volume* | Price | ||
| Lumber Mills | 59.0 | $632 | 40.8 | $574 | 34.3 | 514 | ||
| Export Brokers | 5.3 | 629 | 9.8 | 638 | 3.8 | 604 | ||
| Pulp | 9.9 | 213 | 9.7 | 224 | 6.8 | 219 | ||
Total | 74.2 | $576 | 60.3 | $529 | 44.9 | 476 | ||
* Volume in MMBF
Lumber mills represented 80% of our harvest volume sold in 2005 and price realizations were 10% higher than the price realized in 2004. The increase in price realized is due to the strong housing market experienced in 2005. Export brokers represent those log buyers that purchase our logs and then resell them primarily to the export market. Usually these brokers buy high-quality Douglas-fir logs, but in 2005 they were also buying some western hemlock logs for export to Korea. As a result of this sort mix, the average price realized from sales to these brokers declined slightly in 2005 despite a relatively strong export market for logs. Volume sold to pulp log customers represented 13% of total volume sold, a decline from both 2004 and 2003.
In 2004, 16% of total log volume was sold to export brokers. This relatively high proportion of log volume sold to export brokers reflected the high quality of a particular timber stand harvested in 2004.
Harvest Volumes and Seasonality
The Partnership’s nearly 115,000 acres of timberland consist of both the 71,000-acre Hood Canal tree farm and the 44,000-acre Columbia tree farm. The Hood Canal tree farm is located in the Hood Canal region of Washington State. Most of this tree farm acreage is at a relatively low elevation where harvest activities are possible year-round. As a result of this competitive advantage, we are often able to harvest and sell a greater portion of our annual harvest in the first half of the year when the log supply in the marketplace tends to be lower.
The percentage of annual harvest volume harvested by quarter for each year in the three-year period ended December 31, 2005 is as follows:
Year ended | Q1 | Q2 | Q3 | Q4 | ||||
| December 31, 2005 | 31% | 30% | 28% | 11% | ||||
| December 31, 2004 | 34% | 29% | 22% | 15% | ||||
| December 31, 2003 | 29% | 28% | 27% | 16% |
Cost of Sales
Cost of sales for the Fee Timber segment consists of harvest costs and depletion expense. Harvest costs represent the direct cost incurred to convert trees into logs and deliver those logs to their point of sale and associated state excise taxes owed on the harvest of logs. Depletion expense represents the cost of acquiring or growing the timber harvested. This cost is calculated using a depletion rate that is derived as follows:
| Depletion rate = | Accumulated cost of timber and capitalized road expenditures |
| Estimated volume of 40 year old merchantable timber available for harvest |
The depletion rate is then applied to volume harvested to calculate depletion expense.
Fee Timber cost of sales, expressed on a per MBF basis for each year in the three-year period ended December 31, 2005, is as follows:
Year ended | Depletion | Harvest, haul and other | Total cost of sales |
| December 31, 2005 | $142 | $179 | $321 |
| December 31, 2004 | $ 84 | $159 | $243 |
| December 31, 2003 | $ 64 | $160 | $224 |
As described above, a depletion rate is calculated based upon the historical cost of the timber and related capitalized road expenditures. That calculated rate is then applied to all volume harvested. We are using two separate depletion rates in 2005, one for volume harvested from those timberlands we acquired in the fourth quarter of 2004 (the “Quilcene Timberlands”), and one for volume harvested from all other owned timberlands. Since the Quilcene Timberlands were recently acquired, the cost of the timber is high relative to the cost basis of our existing timber. The increase in 2005’s overall depletion rate and in depletion expense over that experienced in 2004 stemmed from harvest activity on the Quilcene Timberlands for which we created a separate depletion pool. We created this separate depletion pool because the property had different characteristics than our other pooled property; specifically the timber on this property was almost completely merchantable. We harvested a total of approximately 74 MMBF in 2005, with 17 MMBF attributable to this separate depletion pool created for the Quilcene Timberlands. The depletion expense resulting from Quilcene Timberlands log harvests approximated the net stumpage value (delivered log price less harvesting and transportation cost) realized on the sale of this particular timber. As such, the incremental harvest from this acquired property resulted in a negligible net income impact even as it generated significant operating cash flow and EBITDDA.
Depletion expense is generated from the harvest and sale of timber and some minor amount of depletion results from Real Estate sales when land is sold with standing timber. Depletion expense resulting from timber harvest for each year in the three-year period ended December 31, 2005 was made up of the following:
28
Year ended December 31, 2005 | ||||||||||
Pooled | Separate | Total | ||||||||
| Volume harvested (MBF) | 57,194 | 17,051 | 74,245 | |||||||
| Rate/MBF | $ | 73 | $ | 374 | $ | 142 | ||||
| Depletion expense | $ | 4,192 | $ | 6,385 | $ | 10,577 | ||||
Year ended December 31, 2004 | ||||||||||
Pooled | Separate | Total | ||||||||
| Volume harvested (MBF) | 57,987 | 2,329 | 60,316 | |||||||
| Rate/MBF | $ | 72 | $ | 377 | $ | 84 | ||||
| Depletion expense | $ | 4,192 | $ | 879 | $ | 5,071 | ||||
Year ended December 31, 2003 | ||||||||||
Pooled | Separate | Total | ||||||||
| Volume harvested (MBF) | 45,005 | - | 45,005 | |||||||
| Rate/MBF | $ | 64 | - | $ | 64 | |||||
| Depletion expense | $ | 2,881 | - | $ | 2,881 | |||||
Harvest costs vary based upon the physical site characteristics of acreage harvested. Harvest units that are difficult to access, or that are located on steep hillsides requiring cable harvest systems are more expensive to harvest. Haul costs vary based upon the distance between the harvest site and the customer’s location. Per MBF costs to harvest and haul timber have increased in 2005 relative to 2004 due to a combination of these factors: increased fuel costs; longer-than-average hauls for log transport to customer locations; and the 2005 harvest schedule includes a higher-than-usual proportion of harvest units characterized by steep slopes that are more expensive to harvest. Per MBF costs to harvest and haul timber did not change significantly between 2004 and 2003 despite a small increase in 2004 due to the fuel cost surcharges. This cost component increase is not transparently reflected in 2004’s average harvest, haul and other costs due to the mitigating factor that the 2004 mix of stands harvested were generally easier to access and, thus, less expensive to harvest than the 2003 units.
Fee Timber cost of sales for each year in the three-year period ended December 31, 2005 is as follows (all amounts in $millions):
Year ended | Depletion | Harvest, haul and other | Total cost of sales | |||||||
| December 31, 2005 | $10.6 | $13.2 | $23.8 | |||||||
| December 31, 2004 | $ 5.1 | $ 9.6 | $14.7 | |||||||
| December 31, 2003 | $ 2.9 | $ 7.3 | $10.2 | |||||||
Fee Timber cost of sales increased $9.1 million in 2005 from 2004 and $4.5 million in 2004 from 2003. The increase in 2005 and 2004 is due to combination of increased harvest volume and an increase in depletion rate due to a separate depletion pool used for timber harvested from 2004 acquisitions. The impact of this additional depletion was particularly pronounced in 2005 due to the aforementioned harvest from the Quilcene Timberlands.
29
Operating Expenses
Fee Timber operating expenses for each of the three years ended December 31, 2005, 2004, and 2003 were $4.3 million, $3.8 million, and $3.1 million, respectively. Operating costs increased in 2005 relative to 2004 due primarily to an increase in road maintenance expenditures. Operating costs increased in 2004 relative to 2003 due to an increase in road maintenance and silviculture costs. The increase in road costs in 2005 result primarily from the increase in harvest volume, but also reflect increased costs resulting from the Road Maintenance and Abandonment Plan rules in Washington State. Washington State has enacted new water quality rules, which have resulted in changes to the rules surrounding road maintenance and construction. As a result, culverts that do not comply with the new rules need to be replaced, which has caused an increase in road maintenance costs over the last couple years and is expected to continue into 2007, at which point these expenditures should level out to reflect that necessary remediation has been completed. Silviculture costs represent the cost of projects that are undertaken for the purpose of increasing the quantity or quality of our timber inventory. Examples include eradication of competing vegetation and work performed to improve the seed stock available for us to grow seedlings for future reforestation.
Timberland Management & Consulting
Revenue and Operating Income
The Timberland Management & Consulting segment earns revenue by providing timberland management and forestry consulting services to timberland owners and managers. An additional aspect of that segment’s activities is the development of timberland property portfolios on behalf of third-party clients. Management is currently pursuing timberland acquisitions for ORM Timber Fund I, LP.
On January 1, 2005 the Timberland Management & Consulting segment began managing 522,000 acres of timberland for Cascade Timberlands LLC. This new project included management, consulting, and disposition services during 2005. Revenue and operating income for the Timberland Management & Consulting segment for each year in the three-year period ended December 31, 2005, are as follows (all amounts in $millions):
| Year ended | Revenue | Operating income (loss) | |||||
| December 31, 2005 | $ | 7.8 | $ | 3.5 | |||
| December 31, 2004 | $ | 1.6 | ($0.6 | ) | |||
| December 31, 2003 | $ | 2.4 | $ | 0.3 | |||
Fiscal Year 2005 compared to 2004. Revenue and operating income for 2005 were $6.2 million and $4.1 million higher, respectively, than those amounts for 2004. The increase in revenue and operating income is primarily due to timberland management, property disposition, and consulting services provided to Cascade for its timberland located in Washington and Oregon. Olympic Resource Management LLC (“ORMLLC”), a subsidiary of the Partnership, began providing timberland management and other timberland consulting services to this client in January 2005. Revenue generated in 2004 consisted of fees earned while providing advisory services to the parties that eventually became the owners of Cascade and fees generated through providing miscellaneous consulting and management services to a variety of timberland owners.
30
On August 1, 2005 the Partnership announced that management had obtained capital commitments of $61.8 million, of which Pope Resources has committed $12.4 million, for the launch of a private equity timber fund, ORM Timber Fund I, LP. ORMLLC is the general partner for the fund and Pope Resources is a limited partner. We are now actively searching for timber properties for the fund to acquire. The Timberland Management & Consulting segment is expected to earn fees from managing the fund once properties have been acquired with the committed capital.
Fiscal Year 2004 compared to 2003. Revenue decreased $785,000, or 33%, to $1.6 million in 2004 from $2.4 million in 2003. Operating income declined $870,000 to a loss of $598,000 in 2004 from income of $272,000 in 2003. The decrease in revenue and operating income was primarily a result of completing a timberland management and disposition project in December 2003. Operations in 2004 were focused on signing up new timberland management clients.
Operating Expenses
Timberland Management & Consulting operating expenses for 2005 were $2.0 million higher than in 2004. The increase in operating expenses is primarily attributable to the opening of two new field office locations in Sedro-Woolley, Washington and Bend, Oregon and the additional staffing necessary to provide services under the timberland management agreement with Cascade. Organization and start-up expenses for the aforementioned private equity timber fund were $559,000 during 2005. These expenses are included in Timberland Management & Consulting operating expenses.
Timberland Management & Consulting operating expenses for 2004 and 2003 were $2.2 million, and $2.1 million, respectively. Notwithstanding that we entered 2004 without a major client for this segment, we decided to maintain our investment in people and operating infrastructure given prospects for new business. Accordingly, operating expenses remained basically flat between 2004 and 2003.
Investor Portfolio Management Business (IPMB)
IPMB operations include timberland management and portfolio development. An example of portfolio development is ORM Timber Fund I, LP. When the fund acquires timberland properties, both timberland management and asset management fees will be earned from administering the fund. These activities are, as well as the development and marketing costs associated with the fund, part of the IPMB.
Limitation on Expenditures: The 1997 amendment to Pope Resources’ Limited Partnership Agreement authorizing the IPMB strategy limits our cumulative net expenditures incurred on connection with the IPMB to $5,000,000, including debt guarantees. As of December 31, 2005 cumulative expenditures incurred in pursuit of IPMB opportunities, including guarantees, were less than cumulative revenue generated. Therefore, cumulative net expenditures as of December 31, 2005 against the $5,000,000 limit are zero.
Allocation of Income: In addition, the 1997 amendment to Pope Resources’ Limited Partnership Agreement further specifies that income from the IPMB will be split using a sliding scale allocation method beginning at 80% to the Partnership’s wholly-owned subsidiary, ORM, Inc., and 20% to Pope MGP, Inc., the managing general partner of the Partnership. The sliding scale allocation method will evenly divide IPMB income between ORM, Inc. and Pope MGP, Inc. once such income reaches $7,000,000 in any given fiscal year.
31
Real Estate
Revenue and Operating Income
The Partnership’s Real Estate segment consists primarily of revenue from the sale of land together with residential and commercial property rents. The Partnership’s real estate holdings are located in Pierce, Kitsap, and Jefferson Counties in Washington State.
Results from Real Estate operations are expected to vary significantly from year to year as we make multi-year investments in entitlements and infrastructure prior to selling entitled or developed land. Revenue and operating income for the Real Estate segment for each year in the three-year period ended December 31, 2005, are as follows (all amounts in $millions):
Year ended | Revenue | Operating income (loss) |
| December 31, 2005 | $4.8 | $1.3 ^ |
| December 31, 2004 | $4.5 | $1.6 * |
| December 31, 2003 | $1.7 | $(0.5) |
^ Includes $198,000 of environmental remediation charges related to Port Gamble
* Includes $466,000 of environmental remediation charges related to Port Gamble
Revenue in the Real Estate segment is generated through the sale of raw land, rural residential lots, and the rental of homes and commercial properties at the Port Gamble townsite. Raw land sales generally consist of larger acreage sales rather than single lot sales and are normally completed with very little capital investment prior to sale. Rural Lifestyles lot sales generally require some capital improvements such as zoning, road building, or utility access improvements prior to completing the sale.
Real Estate segment revenue for each of the years ended December 31, 2005, 2004 and 2003 consist of the following:
Description | Revenue | Gross Margin | Acres Sold | Revenue/Acre | Gross Margin/ Acre | |||||||||||
| Raw land | $ | 890,000 | $ | 848,133 | 390 | $ | 2,282 | $ | 2,175 | |||||||
| Rural Lifestyles | 2,967,000 | 2,275,865 | 524 | 5,662 | 4,343 | |||||||||||
| Rentals | 914,000 | NA | NA | NA | NA | |||||||||||
| Other | 47,000 | 34,286 | NA | NA | NA | |||||||||||
2005 Total | $ | 4,818,000 | $ | 3,158,284 | 914 | $ | 4,220 | $ | 3,418 | |||||||
| Raw land | $ | 3,605,000 | $ | 3,083,438 | 708 | $ | 5,092 | $ | 4,355 | |||||||
| Rentals | 846,000 | NA | NA | NA | NA | |||||||||||
| Other | 25,000 | 22,902 | NA | NA | NA | |||||||||||
2004 Total | $ | 4,476,000 | $ | 3,106,340 | 708 | $ | 5,092 | $ | 4,355 | |||||||
| Raw Land | $ | 622,000 | $ | 438,000 | 232 | $ | 2,681 | $ | 1,888 | |||||||
| Rentals | 797,000 | NA | NA | NA | NA | |||||||||||
| Other | 315,000 | 109,000 | NA | NA | NA | |||||||||||
2003 Total | $ | 1,734,000 | $ | 547,000 | 232 | $ | 2,681 | $ | 1,888 | |||||||
32
At our development property in Gig Harbor, Washington, Costco Wholesale Corporation, Northwest Capital Investors (“NCI”), and a subsidiary of the Partnership, Olympic Property Group (“OPG”) submitted detailed applications with the City of Gig Harbor for a 25-acre retail shopping center in OPG’s Harbor Hill project. The applications submitted to the City of Gig Harbor are for site plan review and a binding site plan for a proposed Costco store and over five acres of additional multi-tenant retail space. OPG is currently constructing a road, water tank and other infrastructure improvements in anticipation of our first closing on this property during the first half of 2006. In addition to the sale transactions discussed above we expect to close during 2006 on the sale of 11 acres to the YMCA. This 11-acre sale is from the business park portion of the Gig Harbor property, which represents 75 acres of the total project. We are currently projecting to close on approximately 31 acres of the Gig Harbor project during 2006.
The Partnership’s Rural Lifestyles lot program produces lots from 5 to 100 acres in size, based on underlying zoning densities. This type of program entails an entitlement effort typically consisting of simple lot segregations and boundary line adjustments. Development activities include minor road building, surveying, and the extension of utilities. We anticipate selling approximately 250 acres annually in the Rural Lifestyles lot program. We exceeded this target in 2005 due to a very strong market interest in rural lots.
A 264-acre planned development in the City of Bremerton, Washington (“Bremerton West Hills”) includes 64 acres of industrial and 200 acres of residential uses. We actively marketed the residential portion of this property in 2005 and this resulted in a number of bids. We are currently under contract to sell this property for $12.0 million and anticipate a closing by the end of 2006. Prior to this closing we are building a road that we are obligated to build under the purchase and sale agreement for the residential portion of the property. This road and related infrastructure will cost $2.5 million to construct and is expected not only to add value to the residential portion we are selling in 2006, but to the industrial portion of the property as well that we plan to begin marketing for sale during 2006.
Fiscal Year 2005 compared to 2004. Revenue increased $342,000, or 8%, to $4.8 million in 2005 from $4.5 million in 2004 while operating income for this segment decreased to $1.3 million in 2005 from $1.6 million in 2004. The increase in revenue is principally due to an increase in Rural Lifestyles acreage sold in 2005 relative to 2004. Land sale revenue in 2005 consists of 17 separate transactions totaling 914 acres with $3.0 million representing 524 acres coming from 14 Rural Lifestyles lot sales. One of the primary drivers in the price per acre realized from these sales is whether the property is sold with legal access. For example, in 2005 Rural Lifestyles acreage sales included 263 acres sold without first obtaining legal access. These sales grossed an average of $1,683 per acre, while the remaining 261 acres that were sold with legal access grossed an average of $9,672 per acre. The decline in operating income for 2005 from 2004 is due to the mix of properties sold in 2005 versus 2004. Raw land revenue in 2004 included a $1.9 million sale to Kitsap County of 426 acres that the County plans to develop into a park. This property required very little entitlement or other improvements prior to the sale, which generated a relatively high gross margin from the sale.
Raw land revenue realized in 2005 represented a sale of relatively less attractive development property to the Washington State Department of Fish and Wildlife for $890,000 or $2,282 per acre. Additionally, operating expenses for the Real Estate segment have increased as several projects that we have been working on entitling for a number of years have progressed to the point of development or close to that stage. These projects include the Gig Harbor project where we expect to begin generating revenue in 2006, the Bremerton property where the 200-acre residential portion is currently under contract and expected to sell in 2006, the Kingston Arborwood project for which we plan to bring forward plans during the coming year, and finally the Rural Lifestyles land program.
33
Fiscal Year 2004 compared to 2003. Revenue increased $2.8 million, or 165%, to $4.5 million in 2004 from $1.7 million in 2003. Operating income for this segment also improved from a loss of $476,000 in 2003 to operating income of $1.6 million in 2004. The increase in both revenue and operating income was due to an increase in acres sold and amounts realized per acre for land sales in 2004 relative to 2003. In 2004, we generated land sale revenue of $3.6 million that translated to operating income from land sales of $3.1 million. This compared favorably with 2003 land sale revenue of $622,000 and operating income from land sales of $438,000. The majority of land sale revenue in 2004 came from two transactions. The first transaction was a $1.9 million sale to Kitsap County of 426 acres that the County plans to develop into a park. This sale has the added benefit of enhancing the value of the Partnership’s other development properties neighboring the planned park. The second transaction was for $1.6 million and closed in December 2004. This transaction represented 210 acres that had a preliminary plat for 89 lots filed with the County, thus increasing the value of the property to developers.
Cost of Sales
Real Estate cost of sales for each of the three years ended December 31, 2005, 2004, and 2003 were $749,000, $497,000, and $390,000, respectively. Cost of sales during 2005 resulted from the aforementioned raw land and Rural Lifestyles lot sales. The increase in cost of sales in 2005 and 2004 is due to the increase in acres sold. Cost of sales in 2005 was further increased by the relatively higher level of entitlement and other improvements made to property sold in 2005 when compared to land sold in 2004.
Operating Expenses
Real Estate operating expenses for each of the three years ended December 31, 2005, 2004, and 2003 were $2.8 million, $2.4 million, and $1.8 million, respectively. Real Estate operating expenses in 2005 include an environmental remediation charge of $198,000 while operating expenses for 2004 include environmental remediation charges of $466,000. Operating expenses less environmental remediation charges, the latter discussed in more detail below, increased $633,000 in 2005 compared to 2004. Higher operating expenses in the Real Estate segment are due to an increase in personnel and project costs at the Gig Harbor, Bremerton, and Arborwood projects as well as increased market activity for developable land. This trend is expected to continue in 2006. The increase in operating costs in 2004 relative to 2003 is due to the environmental remediation charge of $466,000 combined with a small increase in repairs and maintenance costs at the Port Gamble townsite.
Environmental Remediation
The Partnership has accrued liabilities for environmental cleanup of $158,000 and $474,000 as of December 31, 2005 and 2004, respectively, for estimated environmental remediation charges in and around the townsite of Port Gamble. Port Gamble is a historic town that was owned by Pope & Talbot, Inc. (P&T) for decades until 1985 when the townsite and other assets were spun off to the Partnership. P&T continued to operate the townsite through 1995 and lease the millsite at Port Gamble until January 2002 when a settlement agreement was signed between the Partnership and P&T. This settlement agreement set forth how the two companies would apportion the costs and responsibility for environmental remediation in Port Gamble. The “millsite” is referred to as such because a lumber mill operated on that portion of the property for over one hundred years through 1995 before it was dismantled by the end of 1996.
The environmental liability at December 31, 2005 includes $152,000 that the Partnership expects to expend in the next 12 months and $6,000 thereafter. Current activities at the site include monitoring to determine if prior clean up activities were effective. Activity in the environmental remediation liability is detailed as follows:
35
Year ended December 31, | Balances at the Beginning of the Year | Additions to Accrual | Expenditures for Remediation | Balances at the End of the Year | |||||||||
| 2003 | $ | 629,000 | $ | - | $ | 337,000 | $ | 292,000 | |||||
| 2004 | 292,000 | 466,000 | 284,000 | 474,000 | |||||||||
| 2005 | 474,000 | 198,000 | 514,000 | 158,000 | |||||||||
As of December 31, 2005 the majority of the clean up work apportioned to the Partnership under the aforementioned settlement agreement was complete. Most of the ongoing expenditures now represent the cost of groundwater monitoring at those specific sites where contaminants were excavated and removed. Test results from this monitoring program since completion of the clean up efforts have been mixed. The consultants engaged by management to assist with the clean up project have informed us that if the test results do not improve, the cost of the clean up project could increase from our current estimated cost range of $158,000 to $208,000.
General and Administrative (G&A)
Fiscal Year 2005 compared to 2004. G&A costs increased $665,000, or 22%, to $3.7 million from $3.0 million in 2004. The increase in general and administrative expenses experienced in 2005 is due to an increase in compensation cost following strong financial performance in 2004 and 2005, as well as costs associated with new audit requirements under the Sarbanes Oxley Act. G&A costs represented 6% of revenue in 2005 as compared to 8% of revenue in 2004.
Fiscal Year 2004 compared to 2003. G&A costs increased $144,000, or 5%, to $3.0 million from $2.8 million in 2003. The modest increase in G&A costs is due to an increase in the accrual for Supplemental Employee Retirement Plan (SERP) liabilities of $80,000 combined with an increase in compensation cost. The beneficiary of the SERP is a retired CEO. G&A costs represented 8% of revenue for the year ended December 31, 2004 as compared to 11% of revenue for the comparable period in 2003.
Interest Income and Expense
Interest income for 2005 increased $302,000 to $402,000 compared to $100,000 in 2004 and $283,000 in 2003. The increase in interest income is due to higher cash and short-term investments balances. In January 2004 our then-available cash balance was used to complete a timberland acquisition such that relatively little interest income accrued over the balance of 2004. Our combined cash and short-term investments balance in 2005 has grown from $757,000 at December 31, 2004 to $18.4 million at December 31, 2005. We have invested cash in excess of immediate operating cash requirements in Auction Rate Securities. The maturities on these securities are long-term while the interest rate earned resets every 28 days.
Interest expense for 2005 was $2.9 million as compared to $3.1 million in 2004 and 2003. The Partnership’s debt consists primarily of mortgage debt with a fixed interest rate and amortization schedule. The terms of the timberland mortgages include a “make whole” premium paid to the lender for unscheduled principal payments. The decrease in interest expense is the result of our annual $1.5 million principal payment on these timberland mortgages made at the end of each year’s first quarter.
35
Income Taxes
Pope Resources is a limited partnership and is, therefore, not subject to income tax at the entity level. Instead, taxable income/loss flows through and is reported to unitholders each year on a Form K-1 for inclusion in each unitholder’s tax return. Pope Resources does, however, have corporate subsidiaries that are subject to income tax and this is why a line item for such tax appears on the statements of operations for the Partnership even though the Partnership itself pays no income tax. The corporate tax-paying entities are utilized for the Partnership’s third-party service fee businesses.
Fiscal Year 2005 compared to 2004. The Partnership has recorded a provision for income taxes of $1.0 million in 2005, as compared to no tax expense for the corresponding period of 2004. The increase in tax expense is due to improved results in our Timberland Management & Consulting segment.
Fiscal Year 2004 compared to 2003. Tax expense in 2004 was zero compared with $242,000 in 2003, and these amounts reflected the divergent level of third-party management business activity that ORMLLC engaged in each of these two years.
Minority Interest
Minority interest represents that share of income earned from the Investor Portfolio Management Business (IPMB) allocated to Pope MGP, Inc., the Managing General Partner of the Partnership. The 1997 amendment to the Limited Partnership Agreement authorizing the Partnership to pursue the IPMB further specifies that income from the IPMB will be split using a sliding scale allocation method beginning at 80% to the Partnership’s wholly-owned subsidiary, ORM, Inc., and 20% to Pope MGP, Inc. The sliding scale allocation method evenly divides IPMB income between ORM, Inc. and Pope MGP, Inc. once such income reaches $7,000,000 in a given fiscal year. The share of IPMB allocated to Pope MGP is further split between Pope MGP and a management incentive plan referred to as the Long-term Incentive Plan. This latter portion of Pope MGP’s share of the IPMB is $242,000 in 2005 and is included in Timberland Management & Consulting operating expenses.
Current activities of the IPMB are contained in the Timberland Management & Consulting segment, which includes timberland consulting, management and disposition services, and expenses associated with the launch of a private equity timber fund.
Fiscal Year 2005 compared to 2004. The charge or expense that is the allocation of income to a minority interest increased from zero in 2004 to $321,000 in 2005. The increase in minority interest allocation is due to improved Timberland Management & Consulting results related to our work on behalf of Cascade.
Fiscal Year 2004 compared to 2003. The charge or expense that is the allocation of income to a minority interest decreased $47,000 in 2004 to zero from $47,000 in 2003. The decline in minority interest is due to completion of our timberland disposition project in 2003 such that there was no income from activities in 2004.
36
Analysis of Operating Income
The following table sets forth expenses as a percentage of revenue for each year in the three-year period ended December 31, 2005, are as follows:
2005 | 2004 | 2003 | ||||||||
| Revenue | 100 | % | 100 | % | 100 | % | ||||
| Cost of sales | (43 | ) | (38 | ) | (39 | ) | ||||
| Operating expenses | (20 | ) | (21 | ) | (26 | ) | ||||
| General and administrative expenses | (6 | ) | (8 | ) | (11 | ) | ||||
| Operating income | 31 | % | 33 | % | 24 | % | ||||
Cost of sales includes the cost of purchasing and producing tangible goods for sale. In addition to depletion associated with timber production levels, cost of sales for the Partnership will fluctuate due to the mix of revenue between the sale of tangible goods and revenue generated from providing services. Cost of sales as a percentage of revenue increased 5 percentage points in 2005 compared to 2004. This increase is primarily attributable to the increase in depletion expense resulting from timber harvested from the Partnership’s separate depletion pool, which carries a higher depletion rate, offset somewhat by the increase in revenue generated by the Timberland Management & Consulting segment which does not have related cost of sales. Cost of sales as a percentage of revenue decreased 1 percentage point in 2004 from 2003. This decrease is due to a large Real Estate sale in 2004. This land was formerly timberland and sold to Kitsap County for use as a park. This property had a very low cost basis thus serving to decrease cost of sales as a percentage of revenue.
Operating expenses consist of salary and other costs directly attributable to revenue-generating activity. As a percentage of revenue, operating expenses decreased 1 percentage point in 2005 compared to 2004. This decrease is due to an increase in revenue in 2005 from all segments, but primarily from Fee Timber. Operating expenses in 2005 for the Timberland Management & Consulting segment increased over 2004 levels, but not enough to offset the revenue increase across all segments. Operating expense as a percentage of revenue declined 5 percentage points in 2004 from 2003. Operating expense as a percentage of revenue declined in 2004 despite completing a timberland management and disposition project in 2003 that left this segment without a major timberland management client for the first time since 1997. During 2004 the Timberland Management & Consulting segment continued to generate operating expenses while management pursued timberland management opportunities. The increase, however, in Fee Timber and Real Estate revenue in 2004 over 2003 made up for the decline in revenue generated by the Timberland Management & Consulting segment over those two periods.
General and administrative expenses as a percentage of revenue declined 2 percentage points in 2005 from 2004 due to the Partnership’s significant increase in revenue. Similarly, general and administrative expense as a percentage of revenue decreased 3 percentage points in 2004 from 2003 due to an increase in revenue. On a raw dollar basis, general and administrative expenses for 2005 increased $665,000 from 2004 and in 2004 increased $144,000 from 2003.
37
Supplemental Segment Information
The following table provides quarterly comparative operating information for our segments:
| SEGMENT INFORMATION | |||||||||||||
| (all amounts in $000's) | |||||||||||||
| Three months ended Dec. 31, | Twelve months ended Dec. 31, | ||||||||||||
| Revenue: | 2005 | 2004 | 2005 | 2004 | |||||||||
| Fee Timber | $ | 5,194 | $ | 5,576 | $ | 44,424 | $ | 33,571 | |||||
| Timberland Management & Consulting (TM&C) | 2,641 | 602 | 7,764 | 1,601 | |||||||||
| Real Estate | 1,072 | 1,799 | 4,818 | 4,476 | |||||||||
| Total | $ | 8,907 | $ | 7,977 | $ | 57,006 | $ | 39,648 | |||||
| EBITDDA (1): | |||||||||||||
| Fee Timber | 2,544 | 2,960 | 27,034 | 20,319 | |||||||||
| TM&C | 1,508 | (10 | ) | 3,644 | (510 | ) | |||||||
| Real Estate | (10 | ) | 904 | 1,449 | 1,719 | ||||||||
| General & administrative and minority interest | (1,115 | ) | (801 | ) | (3,717 | ) | (2,648 | ) | |||||
| Total | $ | 2,927 | $ | 3,053 | $ | 28,410 | $ | 18,880 | |||||
| Depreciation, depletion and amortization: | |||||||||||||
| Fee Timber | 950 | 1,395 | 10,714 | 5,193 | |||||||||
| TM&C | 23 | 22 | 97 | 88 | |||||||||
| Real Estate | 43 | 19 | 178 | 133 | |||||||||
| General & administrative | 65 | 69 | 263 | 338 | |||||||||
| Total | $ | 1,081 | $ | 1,505 | $ | 11,252 | $ | 5,752 | |||||
| Operating income/(loss): | |||||||||||||
| Fee Timber | 1,594 | 1,565 | 16,320 | 15,126 | |||||||||
| TM&C | 1,485 | (32 | ) | 3,540 | (598 | ) | |||||||
| Real Estate | (53 | ) | 885 | 1,270 | 1,586 | ||||||||
| General & administrative | (1,134 | ) | (870 | ) | (3,651 | ) | (2,986 | ) | |||||
| Total | $ | 1,892 | $ | 1,548 | $ | 17,479 | $ | 13,128 | |||||
| Reconciliation of net income to EBITDDA: | |||||||||||||
| Net income | 872 | 820 | 13,684 | 10,176 | |||||||||
| Depreciation depletion and amortization | 1,081 | 1,505 | 11,252 | 5,752 | |||||||||
| Net interest expense | 539 | 728 | 2,477 | 2,952 | |||||||||
| Income tax provision | 435 | - | 997 | - | |||||||||
| EBITDDA | $ | 2,927 | $ | 3,053 | $ | 28,410 | $ | 18,880 | |||||
| (1) EBITDDA represents earnings before interest, taxes, depletion, depreciation, and amortization. | |||||||||||||
38
| RECONCILIATION BETWEEN CASH FLOW FROM OPERATIONS AND EBITDDA | |||||||||||||
| (all amounts in $000's) | |||||||||||||
| Three months ended Dec. 31, | Twelve months ended Dec. 31, | ||||||||||||
| 2005 | 2004 | 2005 | 2004 | ||||||||||
| Cash from operations | $ | 6,656 | $ | 3,595 | $ | 28,909 | $ | 17,854 | |||||
| Added back: | |||||||||||||
| Interest, net | 539 | 728 | 2,477 | 2,952 | |||||||||
| Deferred profit | - | - | 614 | - | |||||||||
| Income tax expense | 435 | - | 997 | - | |||||||||
| Other | - | 1 | - | - | |||||||||
| Less: | |||||||||||||
| Change in working capital | (4,456 | ) | (827 | ) | (4,075 | ) | (902 | ) | |||||
| Unit compensation | (76 | ) | - | (76 | ) | - | |||||||
| Deferred profit | (81 | ) | (275 | ) | - | (815 | ) | ||||||
| Cost of land sold | (90 | ) | (169 | ) | (434 | ) | (209 | ) | |||||
| Other | - | - | (2 | ) | - | ||||||||
| EBITDDA | $ | 2,927 | $ | 3,053 | $ | 28,410 | $ | 18,880 | |||||
Log sale volumes (thousand board feet): | |||||||||||||
| Export conifer | 952 | 1,153 | 5,732 | 8,885 | |||||||||
| Domestic conifer | 5,373 | 5,414 | 53,442 | 38,869 | |||||||||
| Pulp conifer | 1,338 | 1,422 | 9,928 | 9,648 | |||||||||
| Hardwoods | 677 | 1,111 | 5,143 | 2,914 | |||||||||
| Total | 8,340 | 9,100 | 74,245 | 60,316 | |||||||||
Average price realizations ( per thousand board feet): | |||||||||||||
| Export conifer | $ | 641 | $ | 676 | $ | 660 | $ | 658 | |||||
| Domestic conifer | 620 | 590 | 631 | 571 | |||||||||
| Pulp conifer | 223 | 209 | 213 | 224 | |||||||||
| Hardwoods | 561 | 617 | 605 | 588 | |||||||||
| Overall | 554 | 544 | 576 | 529 | |||||||||
39
LIQUIDITY AND CAPITAL RESOURCES
Cash Flows
We ordinarily finance our business activities using funds from operations and, where appropriate in management’s assessment, bank lines of credit. We generate operating cash flow through the sale of timber products, by providing timberland management, disposition, and consulting services, and by selling land for development. Significant recurring uses of cash include the following: replanting and fertilizing trees; maintaining an adequate road system on our tree farms; investing in our development properties; funding annual debt payments on timber mortgages and local improvement district debt; funding quarterly cash distributions; and funding general and administrative expenses.
Funds generated internally from operations and externally through financing are expected to provide the required resources for the Partnership's future capital expenditures. The Partnership’s debt-to-total-capitalization ratio as measured by the book value of equity was 34% at December 31, 2005 versus 40% at December 31, 2004. Management considers capital resources to be adequate for its current plans and does not have specific plans that would trigger a significant change in its debt-to-total-capitalization ratio over the next 12 months. The Partnership’s debt consists primarily of a timberland mortgage with a fixed amortization schedule and loan terms that include a prepayment penalty. In view of a cash and short-term investment balance of approximately $18.4 million at December 31, 2005, we elected not to renew a $10.0 million line of credit, which expired on October 31, 2005. We will continue to monitor and forecast our expected cash requirements and re-establish a line of credit if need for the additional liquidity should arise.
On August 1, 2005 we announced the closing of ORM Timber Fund I, LP (the “Fund”) with committed equity of $61.8 million, of which Pope Resources has committed to invest $12.4 million. Now that the Fund is fully subscribed we are actively searching for suitable timber properties for the Fund to acquire. Pope Resources and the other limited partners in the Fund are required to contribute committed capital as properties are purchased by the Fund.
The Partnership made two significant timberland acquisitions in 2004 by investing a total of $21.2 million. The first transaction was for 3,300 acres of timberland acquired from Plum Creek Timber Company, Inc. in January 2004. This property is being managed as part of the Columbia tree farm inasmuch as these acquired acres are intermingled with that larger holding. The second acquisition totaled 1,346 acres and closed during fourth quarter 2004 and was an opportunity to acquire timberland tracts adjacent to the Partnership’s existing Hood Canal tree farm. We have termed these the Quilcene Timberlands and these properties were forested with ready-to-harvest, merchantable timber. These acquisitions were funded primarily by cash reserves supplemented by draws on a bank line of credit. The January acquisition had an impact on 2004 and 2005 harvest levels (and cash flows). The Quilcene Timberlands acquisition had a small impact on 2004 harvest levels and a major impact on 2005 harvest levels and cash flows. Harvest-related cash flows resulting from these acquisitions have served to offset a large portion of each of the respective purchase prices, as indicated by the Partnership’s $18.4 million cash and short term investment balance at December 31, 2005.
The annual harvest target for 2006 is expected to be approximately 58 MMBF as compared to 74 MMBF in 2005, as we complete harvest activities on 2004 timberland acquisitions. For 2007 and beyond, absent new acquisitions or major dispositions, we expect an annual harvest level of approximately 53 MMBF. The planned decrease in harvest volume in 2006 relative to 2005 will result in a decline in Fee Timber revenue and cash flow. We expect this decline to be offset on a consolidated basis as a result of planned Real Estate sales, particularly on the Gig Harbor and Bremerton West Hills projects.
During the year ended December 31, 2005, overall cash and cash equivalents increased $2.6 million and we invested an additional $15.0 million in short term investments versus a decrease in cash and cash equivalents of $9.6 million experienced during the prior year.
40
Operating cash flows. The table below provides the components of operating cash flows for each of the three years 2005, 2004, and 2003. Cash received from customers and paid to suppliers and employees results from the harvest and sale of forest products from our tree farms, timberland management, disposition, and consulting services provided to timberland owners, and finally, the sale and management of our development properties.
Operating cash activities (in thousands): | 12/31/2005 | 12/31/2004 | 12/31/2003 | |||||||
| Cash received from customers | $ | 56,730 | $ | 40,513 | $ | 29,582 | ||||
| Cash paid to suppliers and employees | (25,232 | ) | (19,693 | ) | (17,961 | ) | ||||
| Interest received | 377 | 105 | 306 | |||||||
| Interest paid | (2,892 | ) | (3,058 | ) | (3,117 | ) | ||||
| Income taxes paid | (74 | ) | (13 | ) | (169 | ) | ||||
| Total | $ | 28,909 | $ | 17,854 | $ | 8,641 | ||||
Cash generated by operating activities increased to $28.9 million in 2005 from $17.9 million in 2004. The increase in cash generated by operating activities primarily resulted from the Fee Timber segment increase in timber volume harvested from 60 MMBF in 2004 to 74 MMBF in 2005 combined with a $47 per MBF, a 9%, increase in realized prices on log volume sold in 2005 compared to 2004. Additionally, the Timberland Management & Consulting segment’s $4.2 million increase in EBITDDA also contributed to the increase in operating cash flows in 2005. Cash provided by the Fee Timber segment is expected to decline in 2006 due to a decrease in harvest level, but this is expected to be offset by an increase in Real Estate sales from the Gig Harbor project and a portion of the Bremerton West Hills property.
In 2004, cash provided by operations increased $9.2 million to $17.9 million from $8.6 million in 2003. The majority of this increase was produced by the Fee Timber segment due to an increase in timber volume harvested from 45 MMBF in 2003 to 60 MMBF in 2004 combined with a $53 per MBF, or 11%, increase in 2004 realized prices on log volume sold compared to 2004. The Real Estate segment also contributed to improved operating cash flow with an increase in cash provided by land sales of $2.1 million.
Cash used in investing activities. The table below represents the components of cash used in investing activities for the three years 2005, 2004, and 2003. Recurring investing activities consist primarily of tree planting, road building and investment in our development properties to build infrastructure and acquire the entitlements necessary to make further development of the properties possible. In 2004 we invested $21.2 million to purchase timberlands with $20.8 million of that total directed at two separate transactions that added nearly 4,700 acres to our timberland holdings.
Investing activities (in thousands): | 12/31/2005 | 12/31/2004 | 12/31/2003 | |||||||
| Land, buildings and equipment | $ | (784 | ) | $ | (701 | ) | $ | (624 | ) | |
| Development properties | (4,960 | ) | (957 | ) | (613 | ) | ||||
| Timber and roads | (1,012 | ) | (1,075 | ) | (780 | ) | ||||
| Timberland & Real Estate Acquisitions | - | (21,767 | ) | - | ||||||
| Purchase of short-term investments | (15,000 | ) | - | - | ||||||
| Proceeds from the sale of fixed assets | 6 | - | 17 | |||||||
| Cash used in investing activities | $ | (21,750 | ) | $ | (24,500 | ) | $ | (2,000 | ) | |
Cash used in investing activities decreased to $21.8 million in 2005 from $24.5 million in 2004. Investing activities in 2005 consisted primarily of the purchase of $15.0 million of auction rate securities and $6.8 million of capital expenditures. Cash used to purchase short-term investments represents the acquisition of auction rate securities. These securities are being used as a vehicle for investing cash balances in excess of cash required for immediate operating needs. We incurred capital expenditures in 2005 for the following items: $3.7 million of development costs at the Gig Harbor site; $1.3 million of development costs on the Partnership’s other development properties; $1.0 million of reforestation and road building costs on the owned timberlands; $440,000 of miscellaneous items at the Port Gamble townsite and $344,000 of other miscellaneous expenditures. The small decline in timber and road investing activities in 2005 versus 2004 is due to delaying fertilization until 2006. We plan to fertilize the acres that were planned for 2005 along with 2006 acres at an estimated cost of $400,000. By fertilizing more acres at one time we reduce the average cost per acre of the fertilization. Investing activities at the Gig Harbor and Bremerton West Hill projects are expected to increase significantly in 2006 as we continue construction of infrastructure at both properties.
41
Cash used in investing activities increased $22.5 million in 2004 over 2003. The increase is primarily due to the acquisition of 4,700 acres of timberland in 2004. The timberlands acquired in these transactions were forested with a large component of merchantable timber that enabled the Partnership to increase its annual harvest in 2004 to 60 MMBF from 45 MMBF in 2003. These timberland acquisitions and related increased harvest activities also resulted in an increase in investments in timber and roads (higher replanting and road building expenditures). Investments in development properties increased in 2004 to $1.0 million from $613,000 in 2003. This increase correlates to our heightened intensity of activity on our 327-acre property at Gig Harbor, Washington given the expectation of land sales at this parcel beginning in 2006. The $1.0 million spent on development property additions includes $411,000 for a land acquisition bordering the Gig Harbor site and $116,000 for a parcel bordering the Port Gamble townsite. These acquisitions represent strategic opportunities to acquire acres bordering our existing properties where management expects such acquisitions will add value to the Partnership’s holdings.
Cash used in financing activities. The table below represents the components of cash used in financing activities for the three years 2005, 2004, and 2003. Our financing activities primarily reflect payments made on timber mortgages and other debt, unitholder distributions, and payments to the Managing General Partner, Pope MGP, for its minority interest allocation of IPMB income. These payments and outflows are partially offset by cash received from the exercise of unit options issued to employees and directors.
Financing activities (in thousands): | 12/31/2005 | 12/31/2004 | 12/31/2003 | |||||||
| Mortgage/LID payments | $ | (1,883 | ) | $ | (1,979 | ) | $ | (1,662 | ) | |
| Net (paydown) draw on line of credit | (758 | ) | 758 | - | ||||||
| Cash distribution to unitholders | (3,701 | ) | (1,989 | ) | (1,084 | ) | ||||
| Cash received from unit option exercises | 1,813 | 310 | - | |||||||
| Minority interest distribution | (26 | ) | (58 | ) | (161 | ) | ||||
| Cash used by financing activities | $ | (4,555 | ) | $ | (2,958 | ) | $ | (2,907 | ) | |
Cash used in financing activities increased to $4.6 million for 2005 from $3.0 million for the corresponding period in 2004. Cash used for financing activities in 2005 consisted of $1.9 million of payments on long-term debt, $758,000 of paydowns of the line of credit, four unitholder distributions totaling $3.7 million and $26,000 in minority interest distributions. These cash outflows were partially offset by $1.8 million received from the exercise of unit options. The increase in cash used for financing activities in 2005 compared to 2004 is due primarily to an increase in our quarterly distributions. In the third quarter of 2005 we increased our quarterly distribution rate from $0.15 to $0.25 per unit as a result of the increase in cash generated from operations in 2005.
Cash used in financing activities increased $51,000 in 2004 compared to 2003. This increase is due to an unscheduled paydown of our timber mortgage of $347,000, an increase in cash payments on Local Improvement District (LID) debt, and an increase in our quarterly distributions. The unscheduled mortgage payment was made following the sale of 426 acres to Kitsap County. These acres were included as collateral under the timber mortgage and the partial deed release required some incremental debt repayment. In addition, the Partnership began making payments on a $623,000 LID in 2004 that represents the Partnership’s share of new road costs at the Gig Harbor property that has had a positive impact on the value of that property. In the third quarter of 2004 we increased our quarterly distribution rate from $0.07 to $0.15 per unit.
Expected future changes to cash flows
Operating activities. As discussed above, we plan to decrease the Partnership’s annual harvest volume from 74 MMBF in 2005 to 58 MMBF in 2006. This decrease is due to completion in 2005 of the bulk of incremental merchantable timber harvest from the two timberland acquisitions in 2004. The decreased harvest level will translate to lower cash flow from Fee Timber operations in 2006. However, planned land sales at our project in Gig Harbor and a portion of the Bremerton property are expected to offset the decline in operating cash flow from the Fee Timber segment. Assuming we do not acquire any additional timberland in 2006, the annual harvest in 2007 is expected to return to our sustainable harvest level of 53 MMBF. As we wind down our Cascade management and disposition services role, fees generated from disposition services are expected to offset the decline in management fees in 2006.
42
Investing activities. We have secured a committed equity balance of $61.8 million for ORM Timber Fund I LP, of which Pope Resources has committed to invest $12.4 million. Now that the Fund is closed we are actively searching for suitable timber properties for the Fund to acquire. Pope Resources and the other limited partners in the Fund are required to contribute committed capital as properties are purchased by the Fund. In addition to the Fund, capital infrastructure expenditures on our projects at Gig Harbor and Bremerton are expected to total $6.3 million and $2.5 million, respectively, in 2006. The majority of Gig Harbor capital expenditures in 2006 are expected to reflect completion of a water tank and a new access road on the property. Capital expenditures on the Bremerton property in 2006 will primarily relate to a storm water retention facility together with a road and sewer extension.
Financing activities. The capital required for Gig Harbor and Bremerton is expected to be funded through our current cash and short-term investment balances as well as operations. We anticipate that cash generated from property sales will quickly result in positive cash flow that will offset this short-term capital requirement. Management is currently projecting that cash on hand, short-term investments, and cash generated from operating activities will be sufficient to bridge the front-loading of this capital need. This point of view reflects management’s rationale for not renewing our bank line of credit, which has been utilized by the Partnership at various times in its history.
Our debt-to-total-capitalization ratio as of December 31, 2005, as measured by the book and market value of our equity, was 34% and 24%, respectively. Should a financing need arise, management is comfortable that there is room to take on some debt with the ratios at these levels, since our loan covenant which limits debt-to-total-capitalization to 50% is measured against the lower of these two calculations. The Hood Canal tree farm secures the Partnership’s current timberland mortgages while the Columbia tree farm is not currently used as collateral for any debt obligations. The Partnership’s strong financial position has to date enabled fairly easy access to credit at reasonable terms when needed.
Seasonality
Fee Timber. The Partnership owns nearly 115,000 acres of timberland in Washington State. Our timber acreage is concentrated in two non-contiguous tree farms: the 71,000-acre Hood Canal tree farm located in Kitsap, Jefferson, and Mason Counties on the eastern side of Washington’s Olympic Peninsula, and the 44,000-acre Columbia tree farm located in Cowlitz, Clark, Lewis, Skamania, and Pierce counties on the western side of Washington’s Cascade mountain range.
The Hood Canal tree farm is concentrated at low elevations, which permits us to harvest trees year-round. Generally, we concentrate our harvests from this tree farm in the winter and spring when supply, and thus competition, is typically lower and, accordingly, when we can expect to receive higher prices. With the acquisition of the Columbia tree farm in 2001, management expected a decrease in the seasonality of Fee Timber operations as the Columbia tree farm is at higher elevations where harvest activities are generally possible only in the late spring and summer months. In practice, over the last two years our harvest has tended to be more front-loaded, as log prices have been relatively strong in the first half of the year and winter weather has been relatively benign, enabling management to front-load the harvest plan. In future periods, management expects quarterly harvest volume to be affected by both local market conditions for logs and weather conditions.
Timberland Management & Consulting. Timberland Management & Consulting operations are not significantly seasonal.
43
Real Estate. While Real Estate results are not expected to be seasonal, the nature of the activities in this segment will likely result in periodic large transactions that will have significant positive impacts on both revenue and operating income of the Partnership in periods in which these transactions close, and relatively limited revenue and income in other periods. While the “lumpiness” of these results is not primarily a function of seasonal weather patterns, we do expect to see some seasonal fluctuations in this segment because of the general effects of weather on Pacific Northwest development activities.
Contractual Obligations, Commercial Commitments and Contingencies
Our commitments at December 31, 2005 consist of operating leases, and purchase obligations entered into in the normal course of business.
Payments Due By Period/ Commitment Expiration Period | ||||||||||||||||
Obligation or Commitment (in ‘000s) | Total | Less than 1 year | 1-3 years | 4-5 years | After 5 years | |||||||||||
| Total debt | $ | 33,883 | $ | 1,602 | $ | 2,712 | $ | 2,712 | $ | 26,857 | ||||||
| Operating leases | 55 | 37 | 17 | 1 | - | |||||||||||
| Unconditional purchase obligations | 6,800 | 6,800 | ||||||||||||||
| Other long term obligations | 370 | 175 | 52 | 46 | 97 | |||||||||||
| Total contractual obligations | $ | 41,108 | $ | 8,614 | $ | 2,781 | $ | 2,759 | $ | 26,954 | ||||||
We have debt totaling $33.9 million with the contractual maturities described in Note 2 of the Partnership’s Consolidated Financial Statements included with this report. Our $10.0 million revolving line of credit expired on October 31, 2005 and was not renewed. The Partnership has committed to invest 20% of the total equity capital in ORM Timber Fund I, LP once a timberland acquisition is closed by the fund. Committed capital for this fund is $61.8 million so the Partnership’s commitment, accordingly, is $12.4 million. The Partnership and other limited partners will make this investment once timberland properties have been acquired.
Unconditional purchase obligations represent contracted infrastructure construction at the Gig Harbor property. Other long-term obligations include the Partnership’s $158,000 contingent liability for environmental remediation in and around the Port Gamble townsite and $212,000 liability for a supplemental employment retirement plan.
The Partnership may from time to time be a defendant in lawsuits arising in the ordinary course of business. Management believes that loss to the Partnership, if any, will not have a material adverse effect to the Partnership’s consolidated financial condition or results of operations.
Off-Balance Sheet Arrangements
The Partnership is not a party to off-balance sheet arrangements and does not hold any variable interests in unconsolidated entities.
Capital Expenditures and Commitments
Projected capital expenditures in 2006 are $13.8 million excluding the planned investment in ORM Timber Fund I, LP. Projected capital expenditures are currently expected to include $6.3 million for the Gig Harbor site and $2.5 million for the Bremerton site. The Partnership also expects to make over half of its planned investment in the Timber Fund of $12.4 million in 2006. These expenditures could be increased or decreased as a consequence of future economic conditions. Projected capital expenditures at the Gig Harbor and Bremerton site are subject to permitting timetables and progress towards closing on specific land sale transactions.
44
Government Regulation
Compliance with laws, regulations, and demands usually involves capital expenditures as well as operating costs. We cannot easily quantify future amounts of capital expenditures required to comply with laws, regulations, and demands, or the effects on operating costs, because in some instances compliance standards have not been developed or have not become final or definitive. Accordingly, at this time we have not included herein a quantification of future capital requirements to comply with any new regulations being developed by the United States or Canadian regulatory agencies.
Additionally, many federal and state environmental regulations, as well as local zoning and land use ordinances, place limits upon various aspects of our operations. These limits include restrictions on our harvest methods and volumes, remediation requirements that may increase our post-harvest reclamation costs, ESA limitations on our ability to harvest in certain areas, zoning and development restrictions that impact our real estate segment, and a wide range of other existing and pending statutes and regulations. Various initiatives are presented from time to time that seek further restrictions on timber and real estate development businesses, and although management currently is not aware of any material noncompliance with applicable law, we cannot assure readers that we ultimately will be successful in complying with all such regulations or that additional regulations will not ultimately have a material adverse impact upon our business.
ACCOUNTING MATTERS
Accounting Standards Not Yet Implemented
In December 2004, the FASB released its revised standard, SFAS No. 123R (SFAS 123R), Share-Based Payment. SFAS 123R requires that a public entity measure the cost of equity-based service awards based on the grant-date fair value of the award. That cost will be recognized over the period during which an employee is required to provide service in exchange for the award or the vesting period. A public entity will initially measure the cost of liability based service awards based on its current fair value and the fair value of that award will be remeasured subsequently at each reporting date through the settlement date. Changes in fair value during the requisite service period will be recognized as compensation cost over that period. Adoption of SFAS 123R is required for fiscal years beginning after June 15, 2005. The Partnership is evaluating SFAS 123R and believes it will likely result in recognition of additional non-cash equity-based compensation expense and accordingly would decrease net income in amounts, which likely will be considered material.
The Partnership has obtained commitments of $61.8 million for ORM Timber Fund I, LP (the Fund), which includes Pope Resources’ commitment to invest $12.4 million of that capital. These capital commitments are not actually paid until a timberland acquisition is completed. The Fund is now seeking suitable timberland investments. In accordance with EITF 04-5, Determining When General Partners are Required to Consolidate Limited Partners we presently expect the Fund to be consolidated into the Partnership’s financial statements since an indirect subsidiary of the Partnership (Olympic Resource Management LLC) will act as manager and general partner of the Fund. The limited partners’ interest in the Fund, excluding Pope Resources, is expected to be presented as minority interest in the Partnership’s consolidated balance sheet and, furthermore, the profit or loss allocated to the limited partners is expected to be presented as minority interest in the Partnership’s consolidated statement of operations.
Critical Accounting Policies and Estimates
Management believes its most critical accounting policies and estimates relate to management’s calculation of timber depletion and liabilities for matters such as environmental remediation, and potential asset impairments. In relation to liabilities, potential impairments and other estimated charges, it is management’s policy to conduct ongoing reviews of significant accounting policies and assumptions used in the preparation of the financial results of the Partnership. The assumptions used are tested against available and relevant information and reviewed with subject-matter experts for consistency and reliability. During the preparation of financial results, tests are conducted to ascertain that the net book carrying values of assets are not in excess of estimated future cash flows. These tests use current market information, if available, or other generally accepted valuation methods, such as future cash flows. When the use of estimates is necessary, an exact answer is unlikely, and therefore, the range of likely outcomes is used in the preparation of the financial statements. Tests are also applied in order to be reasonably assured that liabilities are properly reflected on the records of the Partnership and that the notes to the financial statements are prepared in a fashion that informs readers of possible outcomes and risks associated with the conduct of business.
45
Purchased timberland cost allocation. When the Partnership acquires timberlands, a purchase price allocation is performed that allocates cost between the categories of merchantable timber, premerchantable timber, and land based upon the relative fair values pertaining to each of the categories. When timberland is acquired the land is evaluated for current value. To the extent the land has value under current market conditions as something other than timberland, we assign a value greater than that typically associated with timberland.
Depletion. Depletion represents the cost of timber harvested and the amortized cost of the permanent road system and is charged to operations by applying a depletion rate to volume harvested during the period. The depletion rate is calculated on January 1st of each year by dividing the Partnership’s cost of merchantable timber and the cost of the permanent road system by the volume of merchantable timber. For purposes of the depletion calculation, merchantable timber is defined as timber that is equal to or greater than 40 years of age. To calculate the depletion rate the Partnership uses a combined pool when the characteristics of the acquired timber are not significantly different from the Partnership’s existing timberlands. Prior to the fourth quarter of 2004, all of the Partnership’s timberlands were aggregated into one depletion cost pool. The Partnership acquired approximately 1,400 acres of timberland in the last quarter of 2004 that was accounted for in two separate depletion pools. These acquisitions were almost entirely merchantable timber, which made the inventory characteristics of these acquisitions sufficiently different from our existing timber pool to indicate separate depletion pools were warranted under our accounting policy. Harvest activities for one of these separate depletion pools was completed in 2004, the other was harvested in 2004 and 2005 and the remainder is expected to be harvested in 2006. We expect to harvest approximately 7 MMBF from one of these separate pools in 2006 resulting in depletion cost of $2.8 million. The depletion cost on this harvest is expected to approximate the net stumpage realized on the sale, which will result in relatively little net income impact from the harvest but will generate operating cash flow. As a result of this additional depletion in 2006 we expect the overall weighted average depletion rate in 2006 will be approximately $107/MBF which represents a decline from $142/MBF in 2005 as the Partnership plans to harvest less timber in 2006 from the separate depletion pool. The depletion rate on the Partnership’s pooled timber in 2006 is expected to be $69 per MBF.
Timber inventory volumes take into account the applicable state and Federal regulatory limits on timber harvests as applied to the Partnership’s properties, including the Forests and Fish law that supplements Washington State’s forest practice regulations to provide for expanded riparian management zones, wildlife leave trees, and other harvest restrictions. Timber inventory volume is accounted for by the Partnership's standing timber inventory system, which utilizes annual statistical sampling of the timber (cruising) together with adjustments made for estimated annual growth and the depletion of areas harvested.
The standing inventory system is subject to two processes each year to monitor accuracy. The first is the annual cruise process and the second is a comparison of (a) volume actually extracted by harvest to (b) inventory in the standing inventory system at the time of the harvest. A “cruise”, which utilizes statistical sampling techniques, represents a physical measurement of timber on a specific set of acres. The cruise process is completed when the physical measurement totals are compared to the volume captured in the standing inventory system. Only productive acres with timber that is at least 20 years old are selected as subject to a cruise. The Partnership cruised 16% of its productive acres with 20-year-old or greater timber in 2005 and 20% in 2004 and 2003 and plans to cruise 20% of productive acres in 2006. Specific acres are first selected for cruising with a bias towards those acres that have gone the longest without a cruise and, second, with a bias towards those acres that have been growing the longest. As the cruise is being performed, only those trees with a breast height diameter (approximately 4.5 feet from the ground) of at least 6 inches are measured for inclusion in the inventory.
46
A 5% change in estimated timber inventory volume would have changed 2005 depletion expense by $211,000.
Environmental remediation. The environmental remediation liability represents estimated payments to be made to monitor (and remedy if necessary) certain areas in and around the townsite and millsite of Port Gamble, Washington. Port Gamble is a historic town that was owned and operated by P&T, a related party, until 1985 when the townsite and other assets were spun off to the Partnership. P&T continued to operate the townsite until 1996 and leased the millsite at Port Gamble through January 2002, at which point P&T signed an agreement with the Partnership dividing the responsibility for environmental remediation of Port Gamble between the two parties.
The environmental remediation liability on the Partnership’s books is based upon an estimate of the Partnership’s portion of the clean-up costs under this agreement with P&T. While the majority of the Partnership’s portion of the clean up efforts is complete, there remains the possibility that the remaining remediation or monitoring activities may exceed estimates, resulting in an additional environmental remediation charge. Management will continue to monitor the remaining liability against estimates to complete to determine if an adjustment to the environmental remediation liability is necessary to accurately represent management’s estimate of remaining cost to complete the project.
Land held for development. Land held for development represents the Partnership’s cost basis in land that has been identified as having greater value as development than timber property. Our Real Estate segment works with these properties to establish entitlements with city and county officials that allow for further development. These entitlement costs are evaluated for capitalization based upon the expected value derived from the efforts. For example, costs incurred to change Urban Growth Area boundaries are expensed as incurred due to the difficulty of successfully changing these boundaries but the cost of applying for a preliminary plat is generally capitalized as these efforts have a high likelihood of success and thus increase the value of the property. Those properties that are either under contract or where the Partnership is planning to sell within the next 12 months are classified as a current asset under Land Held for Sale.
Item 7A. QUANTITATIVE AND QUALITATIVE DISCLOSURES ABOUT MARKET RISK
Interest Rate Risk
At December 31, 2005, the Partnership had $33.9 million of fixed-rate debt outstanding with a fair value of approximately $36.1 million based on the current interest rates for similar financial instruments. A change in the interest rate on fixed-rate debt will affect the fair value of the debt, whereas a change in the interest rate on variable-rate debt will affect interest expense and cash flows. A hypothetical 1% change in prevailing interest rates would change the fair value of the Partnership's fixed-rate long-term debt obligations by $1.9 million.
47
Item 8. FINANCIAL STATEMENTS AND SUPPLEMENTARY DATA
POPE RESOURCES
A DELAWARE LIMITED PARTNERSHIP
YEARS ENDED DECEMBER 31, 2005, 2004, AND 2003
48
POPE RESOURCES, A DELAWARE LIMITED PARTNERSHIP
YEARS ENDED DECEMBER 31, 2005, 2004, AND 2003
Page | ||||
| Reports of Independent Registered Public Accounting Firm | 50-51 | |||
| Financial statements: | ||||
| Consolidated balance sheets | 52 | |||
| Consolidated statements of operations | 53 | |||
| Consolidated statements of partners’ capital and comprehensive income | 54 | |||
| Consolidated statements of cash | 55 | |||
| Notes to consolidated financial statements | 56-69 | |||
49
Report of Independent Registered Public Accounting Firm
The Board of Directors and Unitholders
Pope Resources, A Delaware Limited Partnership:
We have audited the accompanying consolidated balance sheets of Pope Resources, A Delaware Limited Partnership, and subsidiaries (collectively, the Partnership) as of December 31, 2005 and 2004, and the related consolidated statements of operations, partners’ capital and comprehensive income, and cash flows for each of the years in the three-year period ended December 31, 2005. In connection with our audits of the consolidated financial statements, we also have audited the financial statement schedule listed in the index at Item 15. These consolidated financial statements and financial statement schedule are the responsibility of the Partnership’s management. Our responsibility is to express an opinion on these consolidated financial statements and financial statement schedule based on our audits.
We conducted our audits in accordance with the standards of the Public Company Accounting Oversight Board (United States). Those standards require that we plan and perform the audit to obtain reasonable assurance about whether the financial statements are free of material misstatement. An audit includes examining, on a test basis, evidence supporting the amounts and disclosures in the financial statements. An audit also includes assessing the accounting principles used and significant estimates made by management, as well as evaluating the overall the financial statement presentation. We believe that our audits provide a reasonable basis for our opinion.
In our opinion, the consolidated financial statements referred to above present fairly, in all material respects, the financial position of Pope Resources, A Delaware Limited Partnership, and subsidiaries as of December 31, 2005 and 2004, and the results of their operations and their cash flows for each of the years in the three-year period ended December 31, 2005, in conformity with U.S. generally accepted accounting principles. Also in our opinion, the related financial statement schedule, when considered in relation to the basic consolidated financial statements taken as a whole, presents fairly, in all material respects, the information set forth therein.
We also have audited, in accordance with the standards of the Public Company Accounting Oversight Board (United States), the effectiveness of the Partnership’s internal control over financial reporting as of December 31, 2005, based on criteria established in Internal Control-Integrated Framework issued by the Committee of Sponsoring Organizations of the Treadway Commission (COSO) and our report dated March 8, 2006 expressed an unqualified opinion on management’s assessment of, and the effective operation of, internal control over financial reporting.
/s/KPMG LLP
Seattle, Washington
March 8, 2006
50
Report of Independent Registered Public Accounting Firm
The Board of Directors and Unitholders
Pope Resources, A Delaware Limited Partnership:
We have audited management's assessment, included in the accompanying Management's Report on Internal Control over Financial Reporting appearing under Item 9A, that Pope Resources, A Delaware Limited Partnership maintained effective internal control over financial reporting as of December 31, 2005, based on criteria established in Internal Control—Integrated Framework issued by the Committee of Sponsoring Organizations of the Treadway Commission (COSO). The Partnership’s management is responsible for maintaining effective internal control over financial reporting and for its assessment of the effectiveness of internal control over financial reporting. Our responsibility is to express an opinion on management's assessment and an opinion on the effectiveness of the Partnership’s internal control over financial reporting based on our audit.
We conducted our audit in accordance with the standards of the Public Company Accounting Oversight Board (United States). Those standards require that we plan and perform the audit to obtain reasonable assurance about whether effective internal control over financial reporting was maintained in all material respects. Our audit included obtaining an understanding of internal control over financial reporting, evaluating management's assessment, testing and evaluating the design and operating effectiveness of internal control, and performing such other procedures as we considered necessary in the circumstances. We believe that our audit provides a reasonable basis for our opinion.
A company's internal control over financial reporting is a process designed to provide reasonable assurance regarding the reliability of financial reporting and the preparation of financial statements for external purposes in accordance with generally accepted accounting principles. A company's internal control over financial reporting includes those policies and procedures that (1) pertain to the maintenance of records that, in reasonable detail, accurately and fairly reflect the transactions and dispositions of the assets of the company; (2) provide reasonable assurance that transactions are recorded as necessary to permit preparation of financial statements in accordance with generally accepted accounting principles, and that receipts and expenditures of the company are being made only in accordance with authorizations of management and directors of the company; and (3) provide reasonable assurance regarding prevention or timely detection of unauthorized acquisition, use, or disposition of the company’s assets that could have a material effect on the financial statements.
Because of its inherent limitations, internal control over financial reporting may not prevent or detect misstatements. Also, projections of any evaluation of effectiveness to future periods are subject to the risk that controls may become inadequate because of changes in conditions, or that the degree of compliance with the policies or procedures may deteriorate.
In our opinion, management's assessment that Pope Resources, A Delaware Limited Partnership maintained effective internal control over financial reporting as of December 31, 2005, is fairly stated, in all material respects, based on Internal Control—Integrated Framework issued by the Committee of Sponsoring Organizations of the Treadway Commission (COSO). Also, in our opinion, Pope Resources, A Delaware Limited Partnership maintained, in all material respects, effective internal control over financial reporting as of December 31, 2005, based on Internal Control—Integrated Framework issued by the Committee of Sponsoring Organizations of the Treadway Commission (COSO).
We also have audited, in accordance with the standards of the Public Company Accounting Oversight Board (United States), the consolidated balance sheets of Pope Resources, A Delaware Limited Partnership and subsidiaries as of December 31, 2005 and 2004, and the related consolidated statements of operations, partners’ capital and comprehensive income, and cash flows for each of the years in the three-year period ended December 31, 2005, and our report dated March 8, 2006 expressed an unqualified opinion on those consolidated financial statements.
/s/KPMG LLP
Seattle, Washington
March 8, 2006
51
POPE RESOURCES, A DELAWARE LIMITED PARTNERSHIP
CONSOLIDATED BALANCE SHEETS
DECEMBER 31, 2005 AND 2004
ASSETS | |||||||
2005 | 2004 | ||||||
Current assets: | |||||||
| Cash and cash equivalents | $ | 3,361 | $ | 757 | |||
| Short-term investments | 15,000 | - | |||||
| Accounts receivable | 1,049 | 1,120 | |||||
| Land held for sale | 4,371 | 152 | |||||
| Current portion of contracts receivable | 14 | 606 | |||||
| Prepaid expenses and other | 336 | 195 | |||||
| Total current assets | 24,131 | 2,830 | |||||
Properties and equipment, at cost: | |||||||
| Land held for development | 9,661 | 9,074 | |||||
| Land | 15,542 | 13,958 | |||||
| Roads and timber, net of accumulated depletion | |||||||
| of $37,030 and $26,418 | 53,019 | 64,485 | |||||
| Buildings and equipment, net of accumulated | |||||||
| depreciation of $6,488 and $6,034 | 3,340 | 3,166 | |||||
| Total properties and equipment, at cost | 81,562 | 90,683 | |||||
Other assets: | |||||||
| Contracts receivable, net of current portion | 483 | 158 | |||||
| Other | 182 | 1,197 | |||||
| Total other assets | 665 | 1,355 | |||||
| Total assets | $ | 106,358 | $ | 94,868 | |||
LIABILITIES AND PARTNERS' CAPITAL | |||||||
Current Liabilities: | |||||||
| Accounts payable | $ | 1,147 | $ | 597 | |||
| Accrued liabilities | 3,865 | 1,492 | |||||
| Environmental remediation | 152 | 468 | |||||
| Current portion of long-term debt | 1,602 | 1,602 | |||||
| Minority interest | 325 | 30 | |||||
| Operating line of credit | - | 758 | |||||
| Deposit | 59 | 70 | |||||
| Deferred profit | 304 | 918 | |||||
| Total current liabilities | 7,454 | 5,935 | |||||
| Long-term debt | 32,281 | 34,164 | |||||
| Other long-term liabilities | 218 | 236 | |||||
| Commitments and contingencies | |||||||
| Partners' capital (units outstanding: 4,646 and 4,539) | 66,405 | 54,533 | |||||
| Total liabilities and partners' capital | $ | 106,358 | $ | 94,868 | |||
See accompanying notes to consolidated financial statements.
52
POPE RESOURCES, A DELAWARE LIMITED PARTNERSHIP
CONSOLIDATED STATEMENTS OF OPERATIONS
YEARS ENDED DECEMBER 31, 2005, 2004, AND 2003
(IN THOUSANDS, EXCEPT PER UNIT INFORMATION)
2005 | 2004 | 2003 | ||||||||
Revenue: | ||||||||||
| Fee Timber | $ | 44,424 | $ | 33,571 | $ | 22,916 | ||||
| Timberland Management & Consulting | 7,764 | 1,601 | 2,386 | |||||||
| Real Estate | 4,818 | 4,476 | 1,734 | |||||||
| Total revenues | 57,006 | 39,648 | 27,036 | |||||||
Costs and expenses: | ||||||||||
| Cost of sales: | ||||||||||
| Fee Timber | (23,847 | ) | (14,687 | ) | (10,150 | ) | ||||
| Real Estate | (748 | ) | (497 | ) | (390 | ) | ||||
| Total cost of sales | (24,595 | ) | (15,184 | ) | (10,540 | ) | ||||
| Operating expenses: | ||||||||||
| Fee Timber | (4,257 | ) | (3,758 | ) | (3,097 | ) | ||||
| Timberland Management & Consulting (TM&C) | (4,224 | ) | (2,199 | ) | (2,114 | ) | ||||
| Real Estate | (2,602 | ) | (1,927 | ) | (1,820 | ) | ||||
| Real Estate environmental remediation | (198 | ) | (466 | ) | - | |||||
| General & Administrative (G&A) | (3,651 | ) | (2,986 | ) | (2,842 | ) | ||||
| Total operating expenses | (14,932 | ) | (11,336 | ) | (9,873 | ) | ||||
Operating income (loss): | ||||||||||
| Fee Timber | 16,320 | 15,126 | 9,669 | |||||||
| Timberland Management & Consulting | 3,540 | (598 | ) | 272 | ||||||
| Real Estate | 1,270 | 1,586 | (476 | ) | ||||||
| Unallocated G&A | (3,651 | ) | (2,986 | ) | (2,842 | ) | ||||
Total operating income | 17,479 | 13,128 | 6,623 | |||||||
| Other income (expense): | ||||||||||
| Interest expense | (2,879 | ) | (3,052 | ) | (3,089 | ) | ||||
| Interest income | 402 | 100 | 283 | |||||||
| Total other expense | (2,477 | ) | (2,952 | ) | (2,806 | ) | ||||
| Income before income taxes and | ||||||||||
| Minority interest | 15,002 | 10,176 | 3,817 | |||||||
| Income tax expense | (997 | ) | - | (242 | ) | |||||
| Income before minority interest | 14,005 | 10,176 | 3,575 | |||||||
| Minority interest | (321 | ) | - | (47 | ) | |||||
Net income | $ | 13,684 | $ | 10,176 | $ | 3,528 | ||||
Earnings per unit: | ||||||||||
| Basic | $ | 2.97 | $ | 2.25 | $ | 0.78 | ||||
| Diluted | $ | 2.88 | $ | 2.22 | $ | 0.78 | ||||
See accompanying notes to consolidated financial statements.
53
POPE RESOURCES, A DELAWARE LIMITED PARTNERSHIP
CONSOLIDATED STATEMENTS OF PARTNERS’ CAPITAL
AND COMPREHENSIVE INCOME
YEARS ENDED DECEMBER 31, 2005, 2004, AND 2003
(IN THOUSANDS)
| General | Limited | |||||||||
| Partners | Partners | Total | ||||||||
| December 31, 2002 | $ | 849 | $ | 42,749 | $ | 43,598 | ||||
| Net income | 47 | 3,481 | 3,528 | |||||||
| Translation loss | - | (6 | ) | (6 | ) | |||||
| Comprehensive income | 47 | 3,475 | 3,522 | |||||||
| Distributions | (14 | ) | (1,070 | ) | (1,084 | ) | ||||
| December 31, 2003 | 882 | 45,154 | 46,036 | |||||||
| Net income and comprehensive income | 135 | 10,041 | 10,176 | |||||||
| Distributions | (26 | ) | (1,963 | ) | (1,989 | ) | ||||
| Proceeds from option exercises | - | 310 | 310 | |||||||
| December 31, 2004 | 991 | 53,542 | 54,533 | |||||||
Net income and comprehensive income | 178 | 13,506 | 13,684 | |||||||
Distributions | (48 | ) | (3,653 | ) | (3,701 | ) | ||||
Equity based compensation | - | 76 | 76 | |||||||
Proceeds from option exercises | - | 1,813 | 1,813 | |||||||
December 31, 2005 | $ | 1,121 | $ | 65,284 | $ | 66,405 | ||||
Weighted average units outstanding : | 12/31/2005 | 12/31/2004 | 12/31/2003 | |||||||
| Basic | 4,605 | 4,522 | 4,518 | |||||||
| Diluted | 4,753 | 4,594 | 4,522 |
See accompanying notes to consolidated financial statements.
54
POPE RESOURCES, A DELAWARE LIMITED PARTNERSHIP
CONSOLIDATED STATEMENTS OF CASH FLOWS
YEARS ENDED DECEMBER 31, 2005, 2004, AND 2003
(IN THOUSANDS)
| Cash flows from operating activities: | 2005 | 2004 | 2003 | |||||||
| Cash received from customers | $ | 56,730 | $ | 40,513 | $ | 29,582 | ||||
| Cash paid to suppliers and employees | (25,232 | ) | (19,693 | ) | (17,961 | ) | ||||
| Interest received | 377 | 105 | 306 | |||||||
| Interest paid | (2,892 | ) | (3,058 | ) | (3,117 | ) | ||||
| Income taxes paid | (74 | ) | (13 | ) | (169 | ) | ||||
| Net cash provided by operating activities | 28,909 | 17,854 | 8,641 | |||||||
Cash flows from investing activities: | ||||||||||
| Capital expenditures | (6,756 | ) | (3,260 | ) | (2,017 | ) | ||||
| Proceeds from sale of fixed assets | 6 | - | 17 | |||||||
| Purchase of short-term investments | (15,000 | ) | - | - | ||||||
| Timberland acquisition | - | (21,240 | ) | - | ||||||
| Net cash used in investing activities | (21,750 | ) | (24,500 | ) | (2,000 | ) | ||||
Cash flows from financing activities: | ||||||||||
| Cash distributions to unitholders | (3,701 | ) | (1,989 | ) | (1,084 | ) | ||||
| Net draw (repayment) on line of credit | (758 | ) | 758 | - | ||||||
| Repayment of long-term debt | (1,883 | ) | (1,979 | ) | (1,662 | ) | ||||
| Proceeds from option exercises | 1,813 | 310 | - | |||||||
| Minority interest distribution | (26 | ) | (58 | ) | (161 | ) | ||||
| Net cash used in financing activities | (4,555 | ) | (2,958 | ) | (2,907 | ) | ||||
| Net increase (decrease) in cash and cash equivalents | 2,604 | (9,604 | ) | 3,734 | ||||||
Cash and cash equivalents: | ||||||||||
| Beginning of year | 757 | 10,361 | 6,627 | |||||||
| End of year | $ | 3,361 | $ | 757 | $ | 10,361 | ||||
Reconciliation of net income to net cash | ||||||||||
provided by operating activities: | ||||||||||
| Net income | $ | 13,684 | $ | 10,176 | $ | 3,528 | ||||
| Cost of land sold | 434 | 209 | 200 | |||||||
| Cost of art sold | - | - | 175 | |||||||
| Minority interest | 321 | - | 47 | |||||||
| Depreciation and amortization | 640 | 660 | 658 | |||||||
| Depletion | 10,612 | 5,092 | 2,888 | |||||||
| Deferred tax expense | 890 | - | 242 | |||||||
| Unit based compensation | 76 | - | - | |||||||
Increase (decrease) in cash from changes in | ||||||||||
operating accounts: | ||||||||||
| Accounts receivable | 71 | (255 | ) | 903 | ||||||
| Work in progress | - | - | 40 | |||||||
| Contracts receivable | 267 | 304 | 1,676 | |||||||
| Other current assets | (141 | ) | 336 | (384 | ) | |||||
| Accounts payable and accrued liabilities | 2,923 | 228 | (424 | ) | ||||||
| Restructuring | - | - | (466 | ) | ||||||
| Environmental remediation | (316 | ) | 182 | (337 | ) | |||||
| Deposits | 81 | 38 | (1 | ) | ||||||
| Deferred profit | (614 | ) | 815 | (32 | ) | |||||
| Other long-term liabilities | (18 | ) | 80 | (50 | ) | |||||
| Other, net | (1 | ) | (11 | ) | (22 | ) | ||||
| Net cash provided by operating activities | $ | 28,909 | $ | 17,854 | $ | 8,641 | ||||
See accompanying notes to consolidated financial statements.
55
POPE RESOURCES, A DELAWARE LIMITED PARTNERSHIP
NOTES TO CONSOLIDATED FINANCIAL STATEMENTS
YEARS ENDED DECEMBER 31, 2005, 2004 AND 2003
1. SUMMARY OF SIGNIFICANT ACCOUNTING POLICIES
Nature of operations:
Pope Resources, A Delaware Limited Partnership (the "Partnership") is a publicly traded limited partnership engaged principally in managing timber resources on its own properties as well as those owned by others. Pope Resources’ active subsidiaries include ORM, Inc., which is responsible for managing Pope Resources’ timber properties; Olympic Resource Management LLC, which provides timberland management and consulting activities and is responsible for developing the timber fund business; Olympic Property Group I, LLC, which manages the Port Gamble town and millsites and land that is classified as development property; and OPG Properties LLC, which owns land that is held as development property.
The managing general partner is Pope MGP, Inc. The Partnership operates in three business segments: Fee Timber, Timberland Management & Consulting, and Real Estate. Fee Timber represents the growing and harvesting of trees from owned properties. Timberland Management & Consulting represents management, acquisition, disposition, and consulting services provided to third party owners of timberlands. Real Estate consists of obtaining entitlements for properties that have been identified as having value as developed residential or commercial property and operating the Partnership’s existing commercial and residential properties in Kitsap County, Washington.
Principles of consolidation:
The consolidated financial statements include the accounts of the Partnership and its subsidiaries. Intercompany balances and transactions have been eliminated in consolidation.
Minority interest:
Minority interest represents Pope MGP, Inc.’s interest in the Investor Portfolio Management Business (IPMB) (see Note 8) and has been classified as a current liability since the minority interest’s share in income is generally distributed on an annual basis.
Use of estimates in financial statements:
The preparation of financial statements in conformity with accounting principles generally accepted in the United States of America requires management to make estimates and assumptions that affect the reported amounts of assets and liabilities and disclosure of contingent assets and liabilities at the date of the financial statements and the reported amounts of revenue and expense during the reporting period. Actual results could differ from those estimates.
Cost of sales:
For statement of operations presentation, cost of sales consists of the Partnership’s cost basis in timber, other inventory sold, and direct costs incurred to make those assets saleable. Those direct costs include the expenditures associated with the harvesting and transporting of timber and closing costs incurred in land and lot sale transactions.
Concentration of credit risk:
Financial instruments that potentially subject the Partnership to concen-trations of credit risk consist principally of accounts and contracts receivable. The Partnership limits its credit exposure by consider-ing the credit-worthiness of potential customers. The Partnership does not maintain an allowance for doubtful accounts, as losses from accounts receivable have historically been minimal.
56
Contracts receivable:
The Partnership sells land parcels under contracts requiring a minimum cash down payment of 20% and having financing terms of up to 15 years at interest rates between 6% and 10% per annum. The Partnership reduces credit risk on contracts through down payment requirements and utilizing the underlying land as collateral.
At December 31, 2005, minimum principal payments on contracts receivable for the next five years and thereafter are due as follows:
| 2006 | $ | 14,000 | ||
| 2007 | 97,000 | |||
| 2008 | 65,000 | |||
| 2009 | 11,000 | |||
| 2010 | 155,000 | |||
| Thereafter | 155,000 |
Income taxes:
Income taxes are accounted for under the asset and liability method. Deferred tax assets and liabilities are recognized for the future tax consequences attributable to differences between the financial statement carrying amounts of existing assets and liabilities and their respective tax basis. Operating loss and tax credit carryforwards are also factored into the calculation of deferred tax assets and liabilities. Deferred tax assets and liabilities are measured using enacted tax rates that are expected to apply to taxable income in the years in which those temporary differences are expected to be recovered or settled. The effect on deferred tax assets and liabilities of a change in tax rates is recognized in income in the period that includes the enactment date.
Property, equipment, and roads:
Depreciation is provided using the straight-line method over the estimated useful lives of the assets, which range from 5 to 39 years. The Partnership capitalizes the cost of building permanent roads on the tree farms and expenses temporary roads and road maintenance. Capitalized roads are depleted as timber is harvested. The road depletion rate is calculated by dividing the cost of capitalized roads at the beginning of the year by merchantable timber inventory. The resulting rate is applied to timber harvested during the year to determine road depletion expense.
When facts and circumstances indicate the carrying value of properties may be impaired, an evaluation of recoverability is performed by comparing the carrying value of the property to the projected future undiscounted cash flows. Upon indication that the carrying value of such assets may not be recoverable, the Partnership would recognize an impairment loss, determined on the basis of fair market value, and charge this amount against current operations.
Buildings and equipment consist of the following as of December 31, 2005 and 2004:
| Description | 12/31/2005 | 12/31/2004 | |||||
| Buildings | $ | 6,303,000 | $ | 5,833,000 | |||
| Equipment | 2,948,000 | 2,792,000 | |||||
| Furniture and fixtures | 577,000 | 575,000 | |||||
| Total | 9,828,000 | 9,200,000 | |||||
| Accumulated depreciation | (6,488,000 | ) | (6,034,000 | ) | |||
| Net buildings and equipment | $ | 3,340,000 | $ | 3,166,000 | |||
Timber:
The depletion rate is calculated by dividing estimated 40-year old merchantable timber inventory into the cost basis of merchantable inventory as of the beginning of the year. To calculate the depletion rate the Partnership uses a combined pool when the characteristics of the acquired timber are not significantly different from the Partnership’s existing timberlands. The Partnership acquired approximately 1,400 acres of timberland in the last quarter of 2004 that was accounted for as a separate depletion pool. This acquisition was almost entirely merchantable timber, which made the inventory characteristics of the acquisition sufficiently different from our existing timber pool to indicate a separate depletion pool was warranted under our accounting policy. The cost of replanting acres harvested is initially capitalized as a part of pre-merchantable timber. Then, after 40 years such costs are reclassified from pre-merchantable to merchantable timber and are then incorporated into the cost basis for purposes of calculating the depletion rate. A depletion rate is calculated for each depletion pool and that rate is applied to timber volume harvested from that depletion pool.
Land held for development or sale:
Land held for development represents the Partnership’s cost basis in land that has been identified as having greater value as development than timber property. Our Real Estate department works with these properties to establish entitlements with city and county officials that allow for further development. These entitlement costs are evaluated for capitalization based upon the expected value derived from the efforts. For example, costs incurred to change Urban Growth Area boundaries are expensed as incurred due to the difficulty of successfully changing these boundaries but the cost of applying for a preliminary plat is generally capitalized as these efforts have a high likelihood of success and thus increase the value of the property. Those properties that are either under contract or where the Partnership is planning to sell within the next 12 months are classified as a current asset under Land Held for Sale.
Deferred profit:
Deferred profit represents the unearned portion of revenue collected. The balance at December 31, 2005 includes $106,000 collected on one real estate transaction where a portion of the revenue was deferred. The remainder of the balance represents the unearned portion of the amounts received on annual cell tower leases and $50,000 of a non-refundable deposit to be credited towards the Gig Harbor sale of land to Costco. The balance at December 31, 2004 includes $803,000 collected on an interim services agreement that was credited against revenue earned on a long-term management agreement in 2005. The remainder of the balance in 2004 represents the unearned portion of amounts received on annual cell tower leases.
Revenue recognition:
Revenue on timber sales is recorded when title and risk of loss passes to the buyer. Revenue on real estate sales is recorded on the date the sale closes, upon receipt of adequate down payment, and receipt of the buyer’s obligation to make continuing payments towards purchase of the property. The Partnership does not currently sell real estate with less than a 20% down payment. Management fees and consulting service revenue is recognized as the related services are provided. Accounts receivable includes earned but unbilled services of $9,000 and $29,000 at December 31, 2005 and 2004, respectively.
58
Timberland sales:
The Partnership considers the sale of tracts of timberland to be part of its normal operations and therefore recognizes revenue from the sale and cost of sales for the Partnership’s basis in the property sold. Cash generated from these sales are included in cash flow from operations on the Partnership’s statements of cash flows.
Stock based compensation:
The Partnership accounts for unit-based compensation in accordance with APB Opinion No. 25, Accounting for Stock Issued to Employees. Accordingly, compensation expense for unit options is measured as the excess, if any, of the fair value of the Partnership’s units at the date of grant over the amount an employee must pay to acquire the unit. Unit options granted have an exercise price not less than the fair value of the Partnership’s unit price on the date of the grant. Had compensation expense for unit option grants been recognized based on the fair value at the grant date consistent with the Black-Scholes method described in Statement of Financial Accounting Standards (SFAS) No. 123, Accounting for Stock-Based Compensation, the Partnership’s net income for the years ended December 31 would have been adjusted to the pro forma amounts indicated below:
Year Ended December 31, | ||||||||||
(In thousands except per unit data) | 2005 | 2004 | 2003 | |||||||
| Net income as reported | $ | 13,684 | $ | 10,176 | $ | 3,528 | ||||
| Add back employee units based | ||||||||||
| compensation expense recognized | 76 | - | - | |||||||
| Subtract proforma compensation | ||||||||||
| expense under SFAS No. 123 | (218 | ) | (222 | ) | (285 | ) | ||||
| Proforma net income | ||||||||||
| under SFAS No. 123 | $ | 13,542 | $ | 9,954 | $ | 3,243 | ||||
| Earnings per unit as reported: | ||||||||||
| Basic | $ | 2.97 | $ | 2.25 | $ | 0.78 | ||||
| Diluted | $ | 2.88 | $ | 2.22 | $ | 0.78 | ||||
| Proforma: | ||||||||||
| Basic | $ | 2.94 | $ | 2.20 | $ | 0.72 | ||||
| Diluted | $ | 2.85 | $ | 2.17 | $ | 0.72 | ||||
Unit options used in the calculation of proforma SFAS 123 compensation expense for 2005, 2004, and 2003 were 276,912, 215,605, and 60,835, respectively. The fair value of options was calculated using the Black-Scholes option-pricing model, with the following assumptions:
| Year Ended December 31, | ||||||||||
| 2005 | 2004 | 2003 | ||||||||
| Expected life | 5 years | 5 years | 5 years | |||||||
| Risk free interest rate | 4.00% - 4.56% | 3.97% - 4.75% | 3.70% - 4.46% | |||||||
| Dividend yield | 1.2% - 2.3% | 1.2% - 1.8% | 1.6% - 2.1% | |||||||
| Volatility | 25.0% - 31.7% | 20.7% - 25.4% | 19.4% - 20.4% | |||||||
| Weighted average value | $8.59 | $4.46 | $2.14 | |||||||
59
Comprehensive income:
Comprehensive income consists of net income and foreign currency translation adjustments. The Consolidated Statements of Partners’ Capital and Comprehensive Income contain the disclosure and calculation of comprehensive income.
Income per partnership unit:
Basic income per partnership unit is computed using the weighted average number of units outstanding during each year. Diluted income per unit is calculated using the weighted average units outstanding during the year, plus the dilutive impact of unit options outstanding. Unit options are excluded from the computation if their effect is anti-dilutive.
| Year Ended December 31, | ||||||||||
| 2005 | 2004 | 2003 | ||||||||
| Weighted average units outstanding (in thousands): | ||||||||||
| Basic | 4,605 | 4,522 | 4,518 | |||||||
| Dilutive effect of unit options | 148 | 72 | 4 | |||||||
| Diluted | 4,753 | 4,594 | 4,522 | |||||||
As of each year-end date in the table above, a certain number of unit options outstanding were not included in the calculation of earnings per partnership unit as they were anti-dilutive. These unit option totals were 1,100, 148,086, and 316,251 in 2005, 2004, and 2003, respectively.
Statements of cash flows:
The Partnership considers all highly liquid debt instruments with maturity of three months or less when purchased to be cash equivalents.
Supplemental disclosure of non-cash investing activities:
During 2003, the Partnership incurred local improvement district debt of $168,000, which also represents capitalized improvements to the properties.
Reclassifications:
Certain reclassifications have been made to the prior years' financial statements to conform to the current year's presentation.
Accounting Standards Not Yet Implemented
In December 2004, the FASB released its revised standard, SFAS No. 123R (SFAS 123R”), Share-Based Payment. SFAS 123R requires that a public entity measure the cost of equity based service awards based on the grant-date fair value of the award. That cost will be recognized over the period during which an employee is required to provide service in exchange for the award or the vesting period. A public entity will initially measure the cost of liability based service awards based on its current fair value and the fair value of that award will be remeasured subsequently at each reporting date through the settlement date. Changes in fair value during the requisite service period will be recognized as compensation cost over that period. Adoption of SFAS 123R is required for fiscal years beginning after June 15, 2005. The Company is evaluating SFAS 123R and believes it will likely result in recognition of additional non-cash unit-based compensation expense and accordingly would decrease net income in amounts, which likely will be considered material.
The Partnership has obtained commitments of $61.8 million for ORM Timber Fund I, LP (the Fund), which includes Pope Resources’ commitment to invest $12.4 million of that capital. The Fund is now seeking suitable timberland investments. In accordance with EITF 04-5, Determining When General Partners are Required to Consolidate Limited Partners the Fund is presently expected to be consolidated into the Partnership’s financial statements since an indirect subsidiary of the Partnership (Olympic Resource Management LLC) will act as manager and general partner of the Fund. The limited partners’ interest in the Fund, excluding Pope Resources, is expected to be presented as minority interest in the Partnership’s consolidated balance sheet and, furthermore, the profit or loss allocated to the limited partners is expected to be presented as minority interest in the Partnership’s consolidated statement of operations.
60
| 2. | LONG-TERM DEBT |
| Long-term debt at December 31 consists of (in thousands): | 2005 | 2004 | |||||
| Mortgage note payable to an insurance company, with interest at 9.65%, collateralized by timberlands, with monthly interest payments and annual principal payments maturing April 2011 | $ | 10,638 | $ | 11,179 | |||
| Mortgage note payable to an insurance company, with interest at 7.63%, collateralized by timberlands, with monthly interest payments and annual principal payments maturing April 2011 | 22,555 | 23,800 | |||||
| Local improvement district assessments, with interest ranging from 5.03% to 6.5%, due through 2013 | 690 | 787 | |||||
33,883 | 35,766 | ||||||
| Less current portion | (1,602 | ) | (1,602 | ) | |||
| Total long-term debt | $ | 32,281 | $ | 34,164 | |||
The Partnership had a $10 million revolving term loan facility, which was not renewed upon expiration in October 2005. The balance outstanding on the facility as of December 31, 2004 was $758,000. Interest on the facility was charged at a rate reflecting a spread over LIBOR, which was 5.25% as of December 31, 2004.
The Partnership’s debt agreements contain covenants which require the Partnership to maintain a required debt service coverage ratio and a debt to market capitalization ratio. As of December 31, 2005, the Partnership was in compliance with its debt covenants.
At December 31, 2005, principal payments on long-term debt for the next five years and thereafter are due as follows (in thousands):
| 2006 | $ | 1,602 | ||
| 2007 | 1,356 | |||
| 2008 | 1,356 | |||
| 2009 | 1,356 | |||
| 2010 | 1,356 | |||
| Thereafter | 26,857 |
| 3. | FAIR VALUE OF FINANCIAL INSTRUMENTS |
The Partnership's financial instruments include cash and cash equivalents, short term investments, accounts receivable, contracts receivable, accounts payable, and accrued liabilities, for which the carrying amount of each approximates fair value based on current market interest rates or their short-term nature. The fair value of fixed rate debt having a carrying value of $33.9 million and $35.8 million has been estimated based on current interest rates for similar financial instruments to be approximately $36.1 million and $39.7 million as of December 31, 2005 and 2004, respectively.
61
| 4. | INCOME TAXES |
The Partnership is not subject to income taxes. Instead, partners are taxed on their share of the Partnership's taxable income, whether or not cash distributions are paid. However, the Partnership is subject to income taxes through operations in several of its taxable subsidiaries. The following tables provide information on the impact of income taxes in those taxable subsidiaries. Consolidated Partnership earnings are reconciled to earnings before income taxes in taxable subsidiaries for the years ended December 31 as follows:
| Year Ended December 31, | ||||||||||
| (000’s) | 2005 | 2004 | 2003 | |||||||
| Consolidated Partnership income before income taxes (less minority interest) | $ | 14,681 | $ | 10,176 | $ | 3,770 | ||||
| Less: Income earned in entities that pass-through pre-tax earnings to the partners | 12,006 | 10,335 | 3,348 | |||||||
| Income (loss) subject to income taxes | 2,675 | (159 | ) | 422 | ||||||
| Total income (loss) subject to income taxes | $ | 2,675 | ($159 | ) | $ | 422 | ||||
The provision for income taxes relating to taxable subsidiaries of the Partnership consists of the following income tax expense for the years ended December 31:
| Year Ended December 31, | ||||||||||
| (000’s) | 2005 | 2004 | 2003 | |||||||
| Current | $ | (107 | ) | $ | - | $ | - | |||
| Deferred | (890 | ) | - | (242 | ) | |||||
| Total | $ | (997 | ) | $ | - | ($242 | ) | |||
A reconciliation between the federal statutory tax rate and the Partnership’s effective tax rate is as follows for the years ended December 31:
| 2005 | 2004 | 2003 | ||||||||
| Statutory tax on income | 34 | % | 34 | % | 34 | % | ||||
| Income (loss) earned in entities that pass-through pre-tax earnings to the partners | (27 | %) | (34 | %) | (28 | %) | ||||
| Effective income tax rate | 7 | % | - | % | 6 | % | ||||
The net deferred income tax assets include the following components as of December 31:
62
| (000’s) | 2005 | 2004 | |||||
| Current (included in prepaid expenses and other) | $ | 108 | $ | 16 | |||
| Non current (included in other assets) | 8 | 990 | |||||
| Total | $ | 116 | $ | 1,006 | |||
The deferred tax assets are comprised of the following:
| (000’s) | 2005 | 2004 | |||||
| Net operating loss carryforward | $ | - | $ | 671 | |||
| Employee-related accruals | 32 | 16 | |||||
| Depreciation | 8 | 44 | |||||
| Other | 76 | 275 | |||||
$ | 116 | $ | 1,006 |
The Partnership’s taxable subsidiaries had carryforward operating losses generated in the U.S. from liquidation of the Canadian subsidiary. This net operating loss was fully utilized in 2005.
| 5. | UNIT INCENTIVE PLAN |
The Partnership’s 2005 Unit Incentive Plan (New Plan) authorized the granting of nonqualified equity compensation to employees, officers, and directors of the Partnership. A total of 1,105,815 units have been reserved for issuance under the New Plan of which there are 1,085,815 units authorized but unissued as of December 31, 2005. The Partnership has issued 20,000 restricted units under the New Plan in 2005. These units vest over four years with 50% vesting after three years and the remaining 50% vesting after the fourth year from date of grant provided the grantee is still an employee as of the vesting date. The grantee may not transfer restricted units until the holder fulfills the vesting requirements, which last for four years.
Unit options were granted under the Partnership’s 1997 Unit Option Plan (Old Plan) and were granted at prices not less than the fair value of the limited partnership units on the date of the grant. Upon authorization of the New Plan the Old Plan was terminated and no units are reserved for issuance under Old Plan. Previously issued options under the Old Plan generally become exercisable annually over a four or five year period and have a maximum term of ten years. Unit options vested were 200,482, 233,441 and 199,965 at December 31, 2005, 2004, and 2003, respectively. Vested unit options had weighted average exercise prices of $16.57, $15.65, and $18.71 at December 31, 2005, 2004, and 2003, respectively. Unit options outstanding were as follows:
63
Number of units (in thousands) | Weighted average price per unit | ||||||
| Balance, December 31, 2002 | 323.8 | $ | 17.28 | ||||
| Granted | 40.4 | 10.07 | |||||
| Exercised | - | - | |||||
| Expired | (9.5 | ) | (14.94 | ) | |||
| Balance, December 31, 2003 | 354.7 | $ | 16.52 | ||||
| Granted | 29.5 | 17.90 | |||||
| Exercised | (20.5 | ) | (15.12 | ) | |||
| Balance, December 31, 2004 | 363.7 | 16.71 | |||||
| Granted | 2.1 | 32.51 | |||||
| Exercised | (87.8 | ) | (20.66 | ) | |||
| Balance, December 31, 2005 | 278.0 | 15.58 | |||||
The following table summarizes information about unit options outstanding at December 31, 2005:
| Price range | Options outstanding | Weighted average exercise price options outstanding | Options exercisable | Weighted average exercise price options exercisable | Weighted average remaining contractual life (yrs) | |||||||||||
| $9 - $14 | 174,904 | $ | 12.22 | 113,499 | $ | 12.21 | 6.5 | |||||||||
| $15 - $19 | 32,535 | $ | 17.55 | 16,410 | $ | 17.69 | 7.3 | |||||||||
| $20 - $24 | 56,477 | $ | 22.18 | 56,477 | $ | 22.18 | 4.7 | |||||||||
| $25 - $29 | 12,434 | $ | 27.18 | 12,434 | $ | 27.18 | 2.9 | |||||||||
| $30 - $34 | 735 | $ | 31.29 | 735 | $ | 31.29 | 9.7 | |||||||||
| $35 - $38 | 927 | $ | 36.09 | 927 | $ | 36.09 | 9.5 | |||||||||
| Total | 278,012 | $ | 15.58 | 200,482 | $ | 16.57 | 5.9 | |||||||||
| 6. | EMPLOYEE BENEFITS |
As of December 31, 2005, all employees of the Partnership and its subsidiaries are eligible to receive benefits under a defined contribution plan. During 2005, 2004 and 2003 the Partnership matched 50% of the employees’ contributions up to 8% of compensation. The Partnership’s contributions to the plan amounted to $116,000, $90,000, and $82,000, for the years ended December 31, 2005, 2004, and 2003, respectively.
| 7. | COMMITMENTS AND CONTINGENCIES |
Environmental remediation:
The Partnership has an accrual for estimated environmental remediation costs of $158,000 and $474,000 as of December 31, 2005 and 2004, respectively. The accrual represents estimated payments to be made to remedy and monitor certain areas in and around the townsite and millsite of Port Gamble. Port Gamble is a historic town that was owned and operated by Pope & Talbot, Inc. (P&T), a related party, until 1985 when the townsite, millsite and other assets were spun off to the Partnership. P&T continued to operate the millsite until 1996 and leased the millsite and townsite at Port Gamble through January 2002, at which point P&T signed an agreement with the Partnership dividing the responsibility for environmental remediation of Port Gamble between the two parties.
Based on information provided by consultants and P&T, the Partnership estimates that the cost range for cleaning up the Port Gamble townsite, millsite and surrounding area to applicable State standards is between $158,000 and $208,000. This cost range includes an assumption that monitoring results currently being conducted result in an indication that clean up activities completed to date were adequate. In the event that current monitoring activities indicate that additional site clean up is required, the estimate of environmental remediation costs will increase above the current accrual. The environmental remediation liability at December 31, 2005 is based upon an estimate of the Partnership’s portion of the clean up and monitoring costs that remain to be completed under this agreement.
64
Capital improvements:
The Partnership is committed to build infrastructure including water, sewer, and roads at the Gig Harbor and Bremerton properties subject to the purchaser acquiring the land. The current estimated cost of those improvements at Gig Harbor is $6.3 million. Infrastructure costs at the Bremerton property are expected to be $3.0 million. The timing of these expenditures is dependent upon the timing of completion of each land sale.
Investment in Timber Fund:
The Partnership has committed to invest 20%, or $12.4 million of equity capital in ORM Timber Fund I, LP. The Partnership successfully obtained commitments for the $61.8 million private equity fund in the third quarter of 2005. The Partnership will make this investment coincident to the timing of Fund closings for timberland acquisitions.
Performance bonds:
In the ordinary course of business, and as part of the entitlement and development process, the Partnership is required to provide performance bonds to ensure completion of certain public facilities. The Partnership had performance bonds of $1,930,000 and $68,000 outstanding at December 31, 2005 and 2004, respectively.
Operating leases:
The Partnership has non-cancelable operating leases for automobiles, office space, and computer equipment. The lease terms are from 12 to 48 months. Rent expense under the operating leases totaled $111,000, $95,000, and $57,000 for the years ended December 31, 2005, 2004, and 2003, respectively.
At December 31, 2005, future minimum rental payments required by year under non-cancelable operating leases are as follows:
| Year | Amount | |||
| 2006 | $ | 37,000 | ||
| 2007 | 14,000 | |||
| 2008 | 3,000 | |||
| 2009 | 1,000 |
Supplemental Employee Retirement Plan:
The Partnership has a supplemental employee retirement plan for a retired key employee. The plan provides for a retirement income of 70% of his base salary at retirement after taking into account both 401(k) and Social Security benefits with a fixed payment set at $25,013 annually. The Partnership accrued $80,000 in 2004 and an additional $7,000 in 2005 for this benefit based on an approximation of the cost of purchasing a life annuity paying the aforementioned benefit amount. The balance of the projected liability as of December 31, 2005 and 2004 was $212,000 and $230,000, respectively.
Contingencies:
The Partnership may from time to time be a defendant in various lawsuits arising in the ordinary course of business. Management believes Partnership losses related to such lawsuits, if any, will not have a material adverse effect to the Partnership’s consolidated financial condition or results of operations or cash flows.
65
| 8. | RELATED PARTY TRANSACTIONS AND MINORITY INTEREST |
Pope MGP, Inc. is the managing general partner of the Partnership and receives an annual management fee of $150,000.
The minority interest represents Pope MGP, Inc.’s profit-sharing interest in the IPMB. The 1997 amendment to the Limited Partnership Agreement authorizing management to pursue the IPMB specifies that annual net income from the IPMB will be split using a sliding scale allocation method, commencing with 80% to ORM, Inc., a subsidiary of Pope Resources, and 20% to Pope MGP, Inc. The sliding scale allocation method will allocate income evenly between ORM, Inc. and Pope MGP, Inc. once net income from the IPMB reaches $7.0 million in a fiscal year. The share of IPMB allocated to Pope MGP is further split between Pope MGP and a management incentive plan referred to as the Long-term Incentive Plan. This portion of Pope MGP’s share of the IPMB is $242,000 in 2005 and is included in Timberland Management & Consulting operating expenses. The aforementioned amendment authorizing pursuit of the IPMB limits cumulative net expenditures to $5.0 million. As of December 31, 2005, cumulative revenue from the IPMB exceeds cumulative IPMB expenditures.
In October 2003, the Partnership sold an art collection to a director and shareholder of Pope MGP, Inc. The proceeds from the sale were $315,000 in cash and this amount is included in Real Estate segment revenue. The sale price was based upon an independent appraisal of the collection. Prior to the sale, P&T leased the art collection from the Partnership through October 2003. Lease payments received in 2003 were $12,239.
| 9. | SEGMENT AND MAJOR CUSTOMER INFORMATION |
The Partnership's operations are classified into three segments: Fee Timber, Timberland Management & Consulting, and Real Estate. The Fee Timber segment consists of the harvest and sale of timber from the Partnership’s nearly 115,000 acres of fee timberland in Washington State.
The Timberland Management & Consulting segment began providing management, disposition, and technical forestry services to a client owning 522,000 acres of timberland on January 1, 2005. During 2004 Timberland Management & Consulting was not serving a significant timberland management client. In 2003 Olympic Resource Management LLC successfully completed a timberland management and disposition project for a significant client representing 76% of segment revenue.
The Real Estate segment’s operations consist of management of development properties, and the rental of residential and commercial properties in Port Gamble and Kingston, Washington. Real Estate is working with nearly 3,000 acres of early stage development properties as of December 31, 2005. All of the Partnership’s real estate activities are in Washington State.
For the year ended December 31, 2005, the Partnership had three major customers that represented 13%, 10% and 10% of consolidated revenue, respectively. For the year ended December 31, 2004, the Partnership had two major customers that represented 15% and 12% of consolidated revenue, respectively. For the year ended December 31, 2003, there was one major customer representing 30% of consolidated revenue. No other customer represents 10% or greater of consolidated revenue during 2005, 2004, or 2003.
Identifiable assets are those used exclusively in the operations of each industry segment or those allocated when used jointly. The Partnership does not allocate cash, accounts receivable, certain prepaid expenses, or the cost basis of the Partnership's administrative office for purposes of evaluating segment performance. Intersegment transactions are valued at prices that approximate the price that would be charged to a major third-party customer. Details of the Partnership's operations by business segment for the years ended December 31 were as follows (in thousands):
66
2005 | 2004 | 2003 | ||||||||
| Revenue: | ||||||||||
| Fee Timber | $ | 44,427 | $ | 33,629 | $ | 22,988 | ||||
| Elimination of intersegment amounts | (3 | ) | (58 | ) | (72 | ) | ||||
| Fee Timber (External) | $ | 44,424 | $ | 33,571 | $ | 22,916 | ||||
| Timberland Management & Consulting | $ | 7,786 | $ | 2,018 | $ | 2,860 | ||||
| Elimination of intersegment amounts | (22 | ) | (417 | ) | (474 | ) | ||||
| Timberland Management & Consulting (External) | $ | 7,764 | $ | 1,601 | $ | 2,386 | ||||
Real Estate | $ | 4,854 | $ | 4,512 | $ | 1,833 | ||||
| Elimination of intersegment amounts | (36 | ) | (36 | ) | (99 | ) | ||||
| Real Estate (External) | $ | 4,818 | $ | 4,476 | $ | 1,734 | ||||
| Total revenue | $ | 57,067 | $ | 40,159 | $ | 27,681 | ||||
| Elimination of intersegment amounts | (61 | ) | (511 | ) | (645 | ) | ||||
| Total revenue (External) | $ | 57,006 | $ | 39,648 | $ | 27,036 | ||||
Operating income/(loss): | ||||||||||
| Fee Timber | $ | 16,290 | $ | 14,784 | $ | 9,171 | ||||
| Elimination of intersegment amounts | 30 | 342 | 498 | |||||||
| Fee Timber (External) | $ | 16,320 | $ | 15,126 | $ | 9,669 | ||||
| Timberland Management & Consulting | $ | 3,538 | $ | (284 | ) | $ | 686 | |||
| Elimination of intersegment amounts | 2 | (314 | ) | (414 | ) | |||||
| Timberland Management & Consulting (External) | $ | 3,540 | $ | (598 | ) | $ | 272 | |||
67
2005 | 2004 | 2003 | ||||||||
Real Estate | $ | 1,302 | $ | 1,614 | ($386 | ) | ||||
| Elimination of intersegment amounts | (32 | ) | (28 | ) | (90 | ) | ||||
| Real Estate (External) | $ | 1,270 | $ | 1,586 | ($476 | ) | ||||
| Unallocated General and Administrative | $ | (3,651 | ) | ($2,986 | ) | ($2,848 | ) | |||
| Elimination of intersegment amounts | - | - | 6 | |||||||
| Unallocated General and Admin (External) | $ | (3,651 | ) | ($2,986 | ) | ($2,842 | ) | |||
Operating income | $ | 17,479 | $ | 13,128 | $ | 6,623 | ||||
| Elimination of intersegment amounts | - | - | - | |||||||
| Operating income (External) | $ | 17,479 | $ | 13,128 | $ | 6,623 | ||||
Depreciation, amortization, and depletion: | ||||||||||
| Fee Timber | $ | 10,714 | $ | 5,193 | $ | 3,007 | ||||
| Timberland Management & Consulting | 97 | 88 | 69 | |||||||
| Real Estate | 178 | 133 | 85 | |||||||
| Unallocated General and Administrative | 263 | 338 | 385 | |||||||
| Total | $ | 11,252 | $ | 5,752 | $ | 3,546 | ||||
Identifiable assets: | ||||||||||
| Fee Timber | $ | 74,596 | $ | 82,159 | $ | 63,118 | ||||
| Timberland Management & Consulting | 174 | 169 | 187 | |||||||
| Real Estate | 10,144 | 6,084 | 5,894 | |||||||
| Unallocated General and Administrative | 21,444 | 6,456 | 17,109 | |||||||
| Total | $ | 106,358 | $ | 94,868 | $ | 86,308 | ||||
Capital and land expenditures: | ||||||||||
| Fee Timber | $ | 1,159 | $ | 22,358 | $ | 809 | ||||
| Timberland Management & Consulting | 133 | 73 | 50 | |||||||
| Real Estate | 5,400 | 2,006 | 1,117 | |||||||
| Unallocated General and Administrative | 64 | 63 | 41 | |||||||
| Total | $ | 6,756 | $ | 24,500 | $ | 2,017 | ||||
68
Revenue by product line for the years ended December 31, 2005, 2004, and 2003 are as follows (in thousands):
2005 | 2004 | 2003 | ||||||||
| Sales of forest products: | ||||||||||
| Domestic | $ | 38,972 | $ | 27,727 | $ | 20,489 | ||||
| Export, indirect | 3,784 | 5,844 | 2,427 | |||||||
| Sales of homes, lots, and undeveloped acreage | 3,898 | 3,630 | 613 | |||||||
| Fees for service | 10,352 | 2,447 | 3,507 | |||||||
| Total Revenue | $ | 57,006 | $ | 39,648 | $ | 27,036 | ||||
| 10. | QUARTERLY FINANCIAL INFORMATION (UNAUDITED) |
| (in thousands except per unit amounts) | Revenue | Income from Operations | Net Income | Earnings per Partnership unit basic | Earnings per Partnership unit diluted | |||||||||||
2005 | ||||||||||||||||
First quarter | $ | 16,656 | $ | 5,671 | $ | 4,606 | $ | 1.01 | $ | .97 | ||||||
Second quarter (1) | 16,131 | 5,095 | 4,069 | .89 | .86 | |||||||||||
Third quarter | 15,312 | 4,821 | 4,137 | .90 | .87 | |||||||||||
Fourth quarter (2) | 8,907 | 1,892 | 872 | .17 | .18 | |||||||||||
2004 | ||||||||||||||||
| First quarter | $ | 11,732 | $ | 4,748 | $ | 3,998 | $ | .88 | $ | .87 | ||||||
| Second quarter (3) | 11,888 | 4,773 | 3,997 | .88 | .87 | |||||||||||
| Third quarter (4) | 8,051 | 2,059 | 1,361 | .31 | .30 | |||||||||||
| Fourth quarter | 7,977 | 1,548 | 820 | .18 | .18 | |||||||||||
| (1) | Includes $108,000 (or $0.02 per diluted unit) increase in the environmental remediation liability in Port Gamble. |
| (2) | Includes $90,000 (or $0.02 per diluted unit) increase in the environmental remediation liability in Port Gamble. |
| (3) | Includes $295,000 (or $0.06 per diluted unit) increase in the environmental remediation liability in Port Gamble. |
| (4) | Includes $171,000 (or $0.04 per diluted unit) increase in the environmental remediation liability in Port Gamble. |
69
Item 9. CHANGES IN AND DISAGREEMENTS WITH ACCOUNTANTS
ON ACCOUNTING AND FINANCIAL DISCLOSURE
None
Item 9A. CONTROLS AND PROCEDURES.
Conclusion Regarding the Effectiveness of Disclosure Controls and Procedures
The Partnership’s management maintains an adequate system of internal controls to promote the timely identification and reporting of material, relevant information. Those controls include requiring executive management and all managers in accounting roles to sign a Code of Ethics (See Exhibit 99.4 to this report). Additionally the Partnership’s senior management team meets regularly to discuss significant transactions and events affecting the Partnership’s operations. The Partnership’s executive officers lead these meetings and consider whether topics discussed represent information that should be disclosed under generally accepted accounting principles and the rules of the SEC. The Board of Directors of the Partnership’s managing general partner includes an Audit Committee that is comprised solely of independent directors who meet the financial literacy requirements imposed by the Securities Exchange Act and the Nasdaq Stock Market. One member of our Audit Committee is a “financial expert” within the meaning of applicable Nasdaq rules. The Audit Committee reviews quarterly earnings releases and all reports on Form 10-Q and 10-K prior to their filing. The Audit Committee is responsible for hiring the Partnership’s external auditors and meets with those auditors at least four times each year.
The Partnership’s executive officers are responsible for establishing and maintaining disclosure controls and procedures. They have designed such controls to ensure that others make known to them all material information within the organization. Management regularly evaluates ways to improve internal controls. As of the end of the period covered by the annual report on Form 10-K our executive officers completed an evaluation of the disclosure controls and procedures and have determined them to be functioning effectively.
Management’s Report on Internal Control Over Financial Reporting
Our management is responsible for establishing and maintaining adequate internal control over financial reporting for the Partnership. Internal control over financial reporting, as such term is defined in Rules 13a-15(f) and 15d-15(f) under the Exchange Act, is a process designed by, or under the supervision of, the Partnership’s chief executive officer and chief financial officer, or persons performing similar functions, and effected by the Partnership’s board of directors, management and other personnel, to provide reasonable assurance regarding the reliability of financial reporting and the preparation of financial statements for external purposes in accordance with generally accepted accounting principles. The Partnership’s management, with the participation of the Partnership’s chief executive officer and chief financial officer, has established and maintained policies and procedures designed to maintain the adequacy of the Partnership’s internal control over financial reporting, and includes those policies and procedures that:
| 1) | Pertain to the maintenance of records that in reasonable detail accurately and fairly reflect the transactions and dispositions of the assets of the Partnership; |
| 2) | Provide reasonable assurance that transactions are recorded as necessary to permit preparation of financial statements in accordance with generally accepted accounting principles, and that receipts and expenditures of the Partnership are being made only in accordance with authorizations of management of the Partnership; and |
| 3) | Provide reasonable assurance regarding prevention or timely detection of unauthorized acquisition, use or disposition of the Partnership’s assets that could have a material effect on the financial statements. |
70
Management has evaluated the effectiveness of the Partnership’s internal control over financial reporting as of December 31, 2005 based on the control criteria established in a report entitled Internal Control—Integrated Framework, issued by the Committee of Sponsoring Organizations of the Treadway Commission. Based on our assessment and those criteria, the Partnership’s management has concluded that the Partnership’s internal control over financial reporting is effective as of December 31, 2005.
Because of its inherent limitations, internal control over financial reporting may not prevent or detect all errors or misstatements and all fraud. Therefore, even those systems determined to be effective can provide only reasonable, not absolute, assurance that the objectives of the policies and procedures are met. Also, projections of any evaluation of effectiveness to future periods are subject to the risk that controls may become inadequate because of changes in conditions, or that the degree of compliance with the policies or procedures may deteriorate.
The registered independent public accounting firm of KPMG LLP, as auditors of the Partnership’s consolidated financial statements, has issued an attestation report on management’s assessment of the Partnership’s internal control over financial reporting. This report appears on page 51 of this annual report on Form 10-K
Changes in Internal Controls
There were no changes in the Partnership’s internal controls over financial reporting that occurred during the most recent fiscal quarter that have materially affected, or are reasonably likely to materially affect, the Partnership’s internal control over financial reporting.
Item 9B. OTHER INFORMATION.
None
71
Item 10. DIRECTORS AND EXECUTIVE OFFICERS OF THE REGISTRANT
General Partner
The Partnership has no directors. Instead, the Board of Directors of its managing general partner, Pope MGP, Inc. (the “Managing General Partner”), serves in that capacity. The Managing General Partner’s address is the same as the address of the principal offices of the Partnership. Pope MGP, Inc. receives $150,000 per year for acting as managing general partner of the Partnership.
The following table identifies the officers and directors of the General Partner as of February 14, 2006. Officers of the Managing General Partner hold identical offices with the Partnership.
Name | Age | Position and Background |
David L. Nunes (2) | 44 | President and Chief Executive Officer, and Director, from January 2002 to present. President and Chief Operating Officer from September 2000 to January 2002. Senior Vice President Acquisitions & Portfolio Development from November 1998 to August 2000. Vice President Portfolio Development from December 1997 to October 1998. Director of Portfolio Development from April 1997 to December 1997 of Pope MGP, Inc. and the Partnership. Held numerous positions with the Weyerhaeuser Company from 1988 to 1997, the last of which was Strategic Planning Director. |
| Thomas M. Ringo | 52 | Vice President and CFO from December 2000 to present. Senior Vice President Finance and Client Relations from June 1996 to December 2000. Vice President Finance from November 1991 to June 1996. Treasurer from March 1989 through October 1991 of Pope MGP, Inc. and the Partnership. Tax Manager of Westin Hotel Company, 1985 to March 1989. Tax Consultant for Price Waterhouse, 1981 to 1985. |
Douglas E. Norberg (1), (3), (4) , (5) | 65 | Director; Vice Chairman, Wright Runstad & Company, since 2000; President, Wright Runstad & Company, 1975 until 2000. Wright Runstad & Company is in the business of real estate investing, development, and management. |
Peter T. Pope (1), (4) | 71 | Director; Director, Pope & Talbot, Inc. 1971 to present; Chairman of the Board and CEO of Pope & Talbot, Inc., 1971 to 1999. Mr. Pope retired as CEO of Pope & Talbot, Inc. in 1999. Mr. Pope is also a director and President of Pope EGP, Inc. |
J. Thurston Roach (1), (3), (4) | 64 | Director; private investor; Director, Deltic Timber Corporation, December 2000 to present; Director The Liberty Corporation May 1994 to January 2006; President and CEO HaloSource Corporation, October 2000 to November 2001; Director HaloSource Corporation, October 2000 to February 2002; Senior Vice President and CFO, Owens Corning, January 1999 to April 2000; Senior Vice President and President of Owens Corning’s North American Building Materials Systems Business, February 1998 to December 1998; Vice Chairman, Simpson Investment Company, July 1997 to February 1998; President, Simpson Timber Company, January 1996 to June 1997; Senior Vice President and Chief Financial Officer and Secretary, Simpson Investment Company, August 1984 to December 1995. |
John E. Conlin (2), (3), (4) | 47 | Director; Co-Founder of Education Partners from 2004 to present; Director, ACME Communications, 2005 to present; Director, Cannell Capital Management 2002 to present; Director, Montgomery & Company, 2003 to present; CEO, Robertson Stephens, Inc, from 2001 to 2003; COO Robertson Stephens, Inc, from 1999 to 2000; Managing Director, Credit Suisse from 1983 to 1999. |
| ___________________________ | ||
| 1) Class A Director | ||
| 2) Class B Director | ||
| 3) Member of the Audit Committee | ||
| 4) Member of the Human Resources Committee | ||
| 5) Designated financial expert for the Board of Directors Audit Committee | ||
72
Board of Directors of the Managing General Partner
Board Composition. The Managing General Partner’s Articles of Incorporation provide that directors are divided into two classes, each class serving a period of two years. The Managing General Partner’s shareholders elect approximately one-half of the members of the Board of Directors annually. The terms of the Class A directors expire on December 31, 2006, and the terms of the Class B directors expires on December 31, 2007. The directors’ election to the Managing General Partner’s Board of Directors is subject to a voting agreement between the Managing General Partner’s two shareholders, Mr. Peter T. Pope and Ms. Emily T. Andrews. Mr. Pope serves as his own appointee, and J. Thurston Roach serves as Ms. Andrews’ appointee to the Board of Directors. The Managing General Partner’s Board of Directors met 5 times in 2005 with all of the meetings in person to discuss Partnership matters. The composition of our Board of Directors is established by the Limited Partnership Agreement and accordingly, as permitted by NASD Rules 4360(c) and 4350(c)(4), board nominations are not made or approved by a separate nominating committee or by a majority of the independent directors.
Audit Committee. The Audit Committee of the Managing General Partner’s Board of Directors is comprised of three outside directors who comply with the Securities Exchange Act and the Nasdaq’s qualification requirements for Audit Committee members. The Audit Committee met to discuss the Partnership eight times during 2005. The Audit Committee’s Chairman is J. Thurston Roach and its designated financial expert is Douglas E. Norberg. See report of the Audit Committee on financial statements below.
Human Resources Committee. The Human Resources Committee is responsible for (1) establishing compensation programs for executive officers and senior management of the Partnership designed to attract, motivate, and retain key executives responsible for the success of the Partnership as a whole; (2) administering and maintaining such programs in a manner that will benefit the long-term interests of the Partnership and its unit holders; and (3) determining the salary, bonus, unit option and other compensation of the Partnership's executive officers and senior management. The Human Resources Committee met three times during 2005. Mr. Peter T. Pope is the Chairman of the Human Resources Committee. See report of the Human Resources Committee on executive compensation below.
Beneficial Ownership and Section 16(a) Reporting Compliance
The Partnership is a reporting company pursuant to Section 12 of the Securities Exchange Act of 1934 (“Exchange Act”). Under Section 16(a) of the Exchange Act, and the rules promulgated hereunder, directors, officers, greater than 10% shareholders, and certain other key personnel (the “Reporting Persons”) are required to report their ownership and any change in ownership of Partnership units to the Securities and Exchange Commission. The Partnership believes that the Reporting Persons have complied with all Section 16(a) filing requirements applicable to them. In making the foregoing statement, the Partnership has relied solely upon oral or written representations of the Reporting Persons, and copies of the reports that the Reporting Persons have filed with the SEC.
Item 11. EXECUTIVE COMPENSATION
The following table sets forth certain information concerning the cash compensation paid to two of the most highly compensated executives of the Partnership (the “Named Executives”) in fiscal year 2005, 2004 and 2003. The titles used in this Item 11 correspond to these persons’ titles during 2005.
74
Summary Compensation Table
Annual Compensation | Long-term Compensation | ||||||||||||||||||
Name and Principal Position | Year | Salary ($) | Bonus ($)(1) | Other Annual Compensation ($)(4) | All Other Compensation ($)(2) | LTIP Payments ($)(3) | |||||||||||||
David L. Nunes President and CEO | 2005 2004 2003 | 280,096 255,337 234,792 | 285,000 205,500 169,127 | 150,480 | 9,250 6,127 6,000 | 40,859 2,608 5,961 | |||||||||||||
Thomas M. Ringo VP and CFO | 2005 2004 2003 | 182,058 166,875 153,125 | 148,000 104,250 103,289 | 83,600 | 10,250 7,750 7,000 | 25,537 1,630 4,471 | |||||||||||||
| (1) | Amounts represent bonuses or commissions earned in the year shown but paid after year-end. |
| (2) | Amounts represent contributions to the Partnerships 401(k) plan and distributions received on restricted Partnership units. This amount excludes the value of restricted unit grants made to each of the named executive officers. These restricted unit grants are described in more detail below. |
| (3) | The LTIP payments are made from Pope MGP’s share of the IPMB. Amounts shown above are earned in the year specified and paid in the subsequent year. See “Long-Term Incentive Plans - Awards in Last Fiscal Year”. |
| (4) | Amounts represent the value of restricted units received during 2005. These units are subject to a trading restriction until the units vest. Units vest over four years with 50% vesting after three years and the remaining 50% vesting on the fourth anniversary of the grant date. |
74
Compensation Pursuant To Unit Options
During 2005 there were no unit options issued to named executive officers of the Partnership.
Compensation Pursuant To Restricted Units
During 2005, David L. Nunes was granted 4,500 Partnership units and Thomas M. Ringo was granted 2,500 Partnership units. Mr. Nunes and Mr. Ringo are restricted from transferring these units until the lapse of vesting restrictions arising under the 2005 Unit Incentive Plan. The terms of these awards provide that each grant is 50% vested after three years and 100% vested after four years.
Aggregated Option Exercises
The following table provides information on option exercises in fiscal 2005 by the named executive officers and the intrinsic value of exercisable and unexercisable unit options at December 31, 2005.
Number of securities underlying unexercised options at year-end(#) | Value of unexercised in-the- money options at year-end (4) | |||||||||||||||||||||
| Name | Units Acquired on Exercise | Value Realized($) | Exercisable | Unexercisable | Exercisable | Unexercisable | ||||||||||||||||
| David L. Nunes | (1) | 14,500 | 182,077 | 34,250 | 18,000 | 529,705 | 333,180 | |||||||||||||||
| President and CEO | ||||||||||||||||||||||
| Thomas M. Ringo | (2) | 20,775 | 227,435 | 11,600 | 9,000 | 214,716 | 166,590 | |||||||||||||||
| VP and CFO | ||||||||||||||||||||||
| (1) | Mr. Nunes held 4,000 Partnership units from his option exercises in 2005. He owns or has options that are exercisable within 60 days totaling 34,250 Partnership units as of February 2006. |
| (2) | Mr. Ringo held 4,400 Partnership units from his option exercised in 2005. He owns or has options that are exercisable within 60 days totaling 11,600 Partnership units as of February 2006. |
Long-Term Incentive Plans-Awards in Last Fiscal Year
During 2006 the following awards were made from the Long-Term Incentive Plan based upon 2005 operating results for the IPMB:
Name and Principal Position | Award ($) (1)1) | Performance Period | |||||
David L. Nunes President and CEO | 40,859 | 1/1/2005 to 12/31/2005 | |||||
Thomas M. Ringo VP and CFO | 25,537 | 1/1/2005 to 12/31/2005 | |||||
| (1) | Awards from the LTIP are made based upon performance of the Investor Portfolio Management Business (IPMB) during 2005 and are contingent upon the officer’s employment with the Partnership on the last day of the award year. LTIP payments are made from Pope MGP’s share of the IPMB. | |
Compensation of General Partner’s Directors
Compensation of the outside directors of Pope MGP, Inc. consists of a monthly retainer of $1,500 plus a $1,000 per day fee for each board meeting attended and $500 for participation in a board meeting via telephone. The Chairman of the Audit Committee receives an additional annual retainer amount of $3,000 that is paid in a monthly pro rata fashion. Both the Chairman of the Audit and Human Resources Committees receive an additional $500 per committee meeting fee. During 2005, outside directors had the option of receiving their $1,500 monthly board retainer in unit options. The number of options granted is based upon the fair value of the options on the date of grant. All option grants so made to outside directors in 2005 were made pursuant to the Partnership’s 1997 Unit Option Plan for their service as directors of Pope MGP, Inc. In August 2005, four outside directors received 750 restricted units each from the Pope Resources 2005 Unit Incentive Plan. The restricted units vest over four years and cannot be traded until the units are vested.
75
For the year ended December 31, 2005, one outside director received 2,096 options with strike prices ranging from $25.50 to $37.73 in lieu of a cash retainer. As of December 31, 2005, three outside directors were receiving their retainers in cash.
For the year ended December 31, 2004, two outside directors each received 3,726 options with strike prices ranging from $15.35 to $23.56 in lieu of a cash retainer. As of December 2004, two outside directors were receiving their retainers in cash.
For the year ended December 31, 2003, two outside directors each received 8,115 and one received 2,125 options with strike prices ranging from $9.50 to $14.30 in lieu of a cash retainer. As of December 2003, two outside directors were receiving their retainers in cash. One director received a 6,000-option grant with an exercise price of $10.00 vesting over five years.
Unit Incentive Plan
In 2005 the Board of Directors of Pope MGP, Inc. adopted the Pope Resources 2005 Unit Incentive Plan (New Plan) and terminated future awards under the Partnership’s 1997 Unit Option Plan. The 1,105,815 units authorized but not issued under the Partnership’s 1997 Unit Option Plan were authorized for issuance under the New Plan. After adopting the New Plan, 20,000 units were granted to employees and directors of the Partnership subject to a trading restriction until the units are vested. The units ordinarily vest over a four-year period with 50% vesting after three years and the remaining 50% vesting after the fourth year. As of December 31, 2005 there were 1,085,815 authorized but not issued units in the New Plan. The units issued or issuable under the New Plan have been registered on a Form S-8 registration statement.
The Partnership’s 1997 Unit Option Plan authorized the granting of nonqualified unit options to employees, officers, and directors of the Partnership. A total of 1,500,000 units were reserved for issuance under the plan. Unit options are granted at prices not less than the fair value of the limited partnership units on the date of the grant, and currently range from $9.30 to $37.73 per unit. The options generally become exercisable annually over a four-year period and have a maximum term of ten years. Unit options issued and outstanding at December 31, 2005 and 2004 were 278,012 and 363,691, respectively, and unit options vested at December 31, 2005 and 2004 were 200,482 and 233,441, respectively. During 2005, 87,775 options were exercised and options totaling 116,901 units have been exercised since the Plan was authorized. The units issued under the Unit Option Plan were registered on a Form S-8 registration statement.
The Partnership accounts for unit-based compensation in accordance with APB Opinion No. 25, Accounting for Stock Issued to Employees. Accordingly, compensation cost for unit options is measured as the excess, if any, of the fair value of the Partnership’s units at the date of grant over the amount an employee must pay to acquire the unit.
Employee Benefit Plans
As of December 31, 2005 all employees of the Partnership and its subsidiaries are eligible to receive benefits under a defined contribution plan. During 2005 and 2004 the Partnership matched 50% of the employees’ contribution up to 8% of compensation. Partnership contributions to the plan amounted to $116,000, $90,000, and $82,000, for each of the years ended December 31, 2005, 2004, and 2003, respectively. Employees become fully vested over a six-year period in the Partnership's contribution.
76
Supplemental Retirement Plan. The Partnership has a supplemental retirement plan for George H. Folquet, retired CEO. The plan provides for a retirement income of 70% of his base salary at retirement after taking into account both 401(k) and Social Security benefits and makes an annual fixed-amount payment of $25,013. The Partnership accrued $7,000 and $80,000 in 2005 and 2004, respectively, for this benefit based on an approximation of the cost of purchasing a life annuity paying the aforementioned benefit amount. The balance of the liability as of December 31, 2005 and 2004 was $212,000 and $230,000, respectively.
Report of the Human Resources Committee on Executive Compensation
The Human Resources Committee of the General Partner’s Board of Directors (the “HR Committee”) has furnished the following report on the Partnership’s executive compensation for fiscal year 2005. The HR Committee’s report is intended to describe in general terms the process the HR Committee undertakes and the matters it considers in determining the appropriate compensation for the Partnership's executive officers, Mr. Nunes and Mr. Ringo.
Responsibilities and Composition of the Committee
The HR Committee is responsible for (1) establishing compensation programs for executive officers of the Partnership designed to attract, motivate, and retain key executives responsible for the success of the Partnership as a whole; (2) administering and maintaining such programs in a manner that will benefit the long-term interests of the Partnership and its unit holders; and (3) determining the salary, bonus, unit option, and other compensation of the Partnership's executive officers.
The HR Committee is currently composed of Douglas E. Norberg, Peter T. Pope, J. Thurston Roach, and John Conlin. Mr. Pope serves as HR Committee Chair. None of the members are officers or employees of the Partnership or the General Partner.
Compensation Philosophy
The Partnership's strategic plan is to focus on growing its fee timber and timberland management businesses. The Partnership's growth strategy consists of the following elements:
| · | Add to owned timberland asset base; |
| · | Build third-party service business by providing cost-effective timberland management and forestry consulting services; |
| · | Launch a series of timberland investment funds that will indirectly add to the Partnership’s owned timberland asset base and will also provide timberland management opportunities; |
| · | Focus real estate activities on where we can add the most value; and |
| · | Support operations with appropriate, efficient levels of overhead. |
The achievement of these goals is intended to create long-term value for the Partnership’s unitholders.
The HR Committee believes that compensation of the Partnership’s Chief Executive Officer, other executive officers and key personnel should be based to a substantial extent on achievement of the goals and strategies that the Partnership has established and enunciated.
When establishing salaries, bonus levels, unit option, and restricted unit awards for the two executive officers, the HR Committee considers (1) the Partnership's performance during the past year and recent quarters in meeting its financial and other performance goals; (2) the individual's performance during the past year and recent quarters; and (3) the salaries of executive officers in similar positions with companies of comparable size, maturity and pursuing similar objectives, and other companies within the timber industry. With respect to the VP and CFO, the Committee takes into consideration the recommendations of the Chief Executive Officer. The method for determining compensation varies from case to case based on a discretionary and subjective determination of what is appropriate at the time.
77
Compensation Programs and Practices
The Partnership's compensation program for executives consists of four key elements: (1) base salary; (2) a performance-based annual bonus; (3) periodic grants of restricted units or unit options; and (4) IPMB award payments (referred to above as long-term incentive plan).
The HR Committee believes that this four-part approach best serves the interests of the Partnership and its unitholders. It enables the Partnership to meet the requirements of the highly competitive environment in which it operates, while ensuring that executive officers are compensated in a way that advances both the short- and long-term interests of unitholders. The variable, annual bonus permits individual performance to be recognized and is based, in significant part, on an evaluation of the contribution made by the executive to the Partnership's overall performance. Unit options relate a significant portion of long-term remuneration directly to unit price appreciation. This type of compensation is intended to align the interests of option holders and of the Partnership's unitholders, and further serve to promote an executive's continued service to the organization. IPMB awards encourage business growth in the Partnership’s third-party timberland management and forestry consulting businesses.
Base salary. Base salaries for the Partnership's executive officers are developed and approved by the HR Committee with periodic consultation provided by Towers Perrin, a nationally recognized compensation-consulting firm. Base salary amounts for executive officers take into account such factors as competitive industry salaries, an executive's scope of responsibilities, and individual performance and contribution to the organization. The HR Committee obtains executive compensation data through Towers Perrin who has developed salary surveys that reflect a peer group of other timber companies, including companies of different sizes. This data is integral to the HR Committee’s deliberations and conclusions regarding appropriate levels of executive compensation. To the extent it deems appropriate, the HR Committee also considers general economic conditions within the area and within the industry. It is the HR Committee and not management that consults with and engages Towers Perrin.
Annual bonus. Executive officers have an annual incentive (bonus) opportunity with awards based on the overall performance of the Partnership and on specific individual performance targets. The performance targets may be based on one or more of the following criteria: successfully pursuing the Partnership’s growth strategies, maintaining sound asset quality, improving productivity, and increasing earnings and return on equity.
The size of the bonus pool is based upon an assessment of the Partnership's performance as compared to both budgeted and prior fiscal year performance and the extent to which the Partnership achieved its overall goals. Once the bonus pool is determined, the Chief Executive Officer makes individual bonus recommendations to the HR Committee, within the limits of the pool, for eligible employees based upon an evaluation of their individual performance and contribution to the Partnership's overall performance.
Unit-based compensation. The HR Committee adopted the Pope Resources 2005 Unit Incentive Plan during 2005 in order to include restricted unit grants as an element of unit based compensation. The HR Committee believes restricted units better align management’s interests with that of unit holders. The HR Committee follows a compensation philosophy that includes unit-based compensation as a long-term incentive program for management. The Partnership's use of unit-based compensation focuses on the following guiding principles: (1) unit-based compensation has been and will continue to be an important element of employee pay, (2) the grant of restricted units will be based on performance measures within the employee's control, (3) owning units is an important ingredient in forming the partnership between employees and the organization, and (4) ownership of significant amounts of the Partnership's units by executives and senior officers of the Partnership will facilitate aligning management's goals with the goals of unitholders. The HR Committee anticipates that it will continue to emphasize unit-based compensation in the future.
78
IPMB award. The IPMB awards are paid from Pope MGP’s share of earnings from the IPMB. Awards are paid in a lump sum following the year in which the award was earned.
Chief Executive Officer Compensation
Mr. Nunes has been serving as Chief Executive Officer and President since January of 2002. In evaluating the compensation of Mr. Nunes for services rendered in 2005, the HR Committee considered both quantitative and qualitative factors.
In looking at quantitative factors, the HR Committee reviewed the Partnership's 2005 financial results and compared them with the Partnership's 2005 budget and actual financial results for 2004. Specifically, the HR Committee considered the following:
| · | Securing $49 million of committed outside capital for ORM Timber Fund I LP |
| · | Successfully managing a 522,000 acre timberland management client |
| · | Successfully managing a large scale disposition program for a timberland management client |
| · | Value added to the Partnership’s portfolio of Real Estate assets |
In addition to these quantitative accomplishments, the HR Committee also considered certain qualitative accomplishments by Mr. Nunes in 2005. Specifically, the HR Committee considered the following:
| · | Assessment and implementation of a plan for high-yield forestry applications on owned timberlands |
| · | Continued Sustainable Forestry Initiative (SFI) certification |
| · | Retention and motivation of quality employees. |
Policy With Respect to $1 Million Deduction Limit
It is not anticipated that the limitations on deductibility, under Internal Revenue Code Section 162(m), of compensation to any one executive that exceeds $1,000,000 in a single year will apply to the Partnership or its subsidiaries in the foreseeable future. In the event that such limitations would apply, the Committee will analyze the circumstances presented and act in a manner that, in its judgment, is in the best interests of the Partnership. This may or may not involve actions to preserve deductibility.
Conclusion
The HR Committee adopted the Pope Resources 2005 Unit Incentive Plan (New Plan) and terminated the Partnership’s 1997 Unit Option Plan. The purpose of this change was to allow the HR Committee to award restricted units to employees and directors which the Committee believes provides a better alignment of interests with current unit holders than unit option grants.
The HR Committee believes that for 2005 the compensation terms for Mr. Nunes, as well as for the other executive officers, were clearly related to the realization of the goals and strategies established by the Partnership. Further, based on our consideration of all factors, bonuses were paid in March 2006 based on 2005 performance.
Peter T. Pope, Chairman
John E. Conlin
Douglas E. Norberg
J. Thurston Roach
79
Audit Committee Report on Financial Statements
The Audit Committee of the General Partner’s Board of Directors has furnished the report set forth in the following section entitled “Responsibilities and Composition of the Audit Committee” on the Partnership’s year-end financial statements and audit for fiscal year 2005. The Audit Committee’s report is intended to identify the members of the Audit Committee and describe in general terms the responsibilities the Audit Committee assumes, the process it undertakes, and the matters it considers in reviewing the Partnership’s financial statements and monitoring the work of the Partnership’s external auditors.
Responsibilities and Composition of the Audit Committee
The Audit Committee is responsible for (1) hiring the Partnership’s external auditors and overseeing their performance of the audit functions assigned to them, (2) approving any non-audit services to be provided by the external auditors, and (3) approving all fees paid to the external auditor. Additionally, the Audit Committee reviews the Partnership’s quarterly and year-end financial statements with management and the external auditors. The Board of Directors has adopted an Audit Committee Charter included in Exhibit 10.4 to this Annual Report on form 10-K.
The Audit Committee is currently composed of J. Thurston Roach, John E. Conlin, and Douglas E. Norberg. Mr. Roach serves as Audit Committee Chair. All members of the Audit Committee are independent as defined under Nasdaq Rule 4200(a)(15), and all are financially literate. Mr. Norberg is designated as the “financial expert” as defined under Section 10A(m) of the Securities Exchange Act of 1934 and Nasdaq Rule 4350(d).
During the year, the Audit Committee reviewed with the Partnership’s management and with its independent public accountants the scope and results of the Partnership’s internal and external audit activities and the effectiveness of the Partnership’s internal control over financial reporting. The Audit Committee also reviewed current and emerging accounting and reporting requirements and practices affecting the Partnership. The Audit Committee discussed certain matters with the Partnership’s external auditors and received certain disclosures from the external auditors regarding their independence. All fees paid during the year to the Partnership’s external auditor were reviewed and pre-approved by the Audit Committee. The Audit Committee has also made available to employees of the Partnership and its subsidiaries a confidential method of communicating financial or accounting concerns to the Audit Committee and periodically reminds the employees of the availability of this communication system to report those concerns.
Conclusion
Based on this review, the Audit Committee recommends to the Partnership’s Board of Directors that the Partnership’s audited financial statements be included in the Partnership’s report on Form 10-K.
J. Thurston Roach, Chairman
John E. Conlin
Douglas E. Norberg
80
Performance Graph
The following graph shows a five-year comparison of cumulative total unitholder returns for the Partnership, the Standard and Poor’s Forest Products Index, and the Wilshire 4500 for the five years ended December 31, 2005. The total unitholder return assumes $100 invested at the beginning of the period in the Partnership’s units, the Standard and Poor’s Forest Products Index, and the Wilshire 4500. The graph assumes distributions are reinvested.
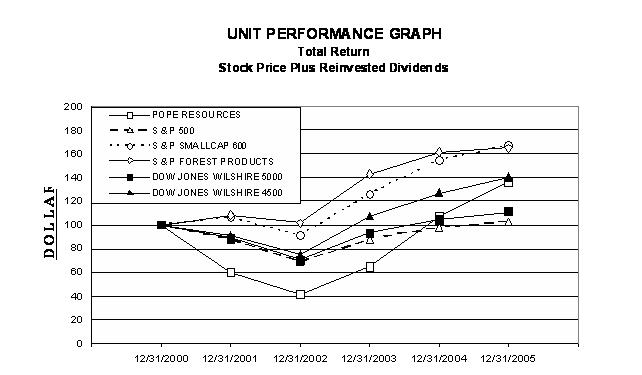

81
Item 12. SECURITY OWNERSHIP OF CERTAIN BENEFICIAL OWNERS AND MANAGEMENT AND RELATED SECURITY HOLDER MATTERS
Principal Unit Holders
As of December 31, 2005, the following persons were known or believed by the Partnership to be the beneficial owners of more than 5% of the outstanding Partnership units:
Name and Address of Beneficial Owner | Number of Units(1) | Percent of Class | |||||
Private Capital Management, Inc. 8889 Pelican Bay Blvd Suite 500 Naples, FL 34108-7512 | 1,332,287 (2) | 28.6 | |||||
Emily T. Andrews 600 Montgomery Street 35th Floor San Francisco, CA 94111 | 557,100 (3) | 12.0 | |||||
Peter T. Pope 1500 S.W. 1st Avenue Portland, OR 97201 | 339,192 (4) | 7.3 | |||||
| (1) | Each beneficial owner has sole voting and investment power unless otherwise indicated. Includes unit options exercisable within 60 days and restricted units that are both vested and unvested since beneficial owner receives distributions on all such restricted units. |
| (2) | Private Capital Management, Inc. is an investment adviser shown registered under the Investment Advisers Act of 1940. Units are held in various accounts managed by Private Capital Management, Inc. which shares dispositive powers as to those units. |
| (3) | Includes 1,090 units owned by her husband, Adolphus Andrews, Jr. as to which she disclaims beneficial ownership. Also includes a total of 60,000 units held by Pope MGP, Inc. and Pope EGP, Inc., as to which she shares voting and investment power. |
| (4) | Includes (a) 44,600 units held in trust for his children; (b) 60,000 units held by Pope MGP, Inc. and Pope EGP, Inc., as to which he shares investment and voting power; (c) currently exercisable options to purchase 32,167 units; (d) 1,500 unvested restricted units; and (e) 910 units owned by spouse. |
82
Management
As of March 9, 2006, the beneficial ownership of the Partnership units of (1) the general partners of the Partnership, (2) the directors of the Partnership's general partners, (3) the named executives, and (4) the Partnership's general partners, directors and officers as a group, was as follows. **
Name | Position and Offices | Number of Units(1) | Percent of Class | |
| David L. Nunes | Chief Executive Officer and President, Pope MGP, Inc. and the Partnership; Director, Pope MGP, Inc. | 68,253 | (2) | 1.4 |
Thomas M. Ringo | Vice President and CFO, Pope MGP, Inc. and the Partnership | 25,980 | (2) | * |
Peter T. Pope | Director, Pope MGP, Inc. and Pope EGP, Inc.; President, Pope EGP, Inc. | 339,192 | (3) | 7.3 |
J. Thurston Roach | Director, Pope MGP, Inc. | 5,100 | (4) | * |
Pope EGP, Inc. | Equity General Partner of the Partnership | 54,000 | 1.2 | |
Pope MGP, Inc. | Managing General Partner of the Partnership | 6,000 | * | |
Douglas E. Norberg | Director, Pope MGP, Inc. | 63,356 | (5) | 1.3 |
John E. Conlin | Director, Pope MGP, Inc. | 2,250 | * | |
All general partners, directors and officers of general partners, and officers of the Partnership as a group (6 individuals and 2 entities) | 501,581 | (6) (7) | 10.6 | |
____________
* Less than 1%
** The address of each of these parties is C/O Pope Resources, 19245 Tenth Avenue NE, Poulsbo, WA 98370.
| (1) | Each beneficial owner has sole voting and investment power unless otherwise indicated. Includes unit options that are exercisable within 60 days and restricted units that are both vested and unvested since beneficial owner receives distributions on all such restricted units. |
| (2) | Units shown for Mr. Nunes units include 25,003 owned units, 9,000 of unvested restricted units, and options to purchase 43,250 that are exercisable within 60 days. Units shown for Mr. Ringo units include 9,380 owned units, 5,000 unvested restricted units, and options to purchase 16,100 units that are exercisable within 60 days. |
| (3) | Includes (a) 44,600 units held in trust for his children; (b) 60,000 units held by Pope MGP, Inc. and Pope EGP, Inc., as to which he shares investment and voting power; (c) currently exercisable options to purchase 32,167 units; (d) 1,500 unvested restricted units; and (e) 910 units owned by his spouse. |
(4) | Includes currently exercisable options to purchase 3,600 units issued to Mr. Roach and 1,500 unvested restricted units. |
| (5) | Includes currently exercisable options to purchase 51,256 units issued to Mr. Norberg and 1,500 unvested restricted units. |
| (6) | For this computation, the 60,000 units held by Pope MGP, Inc. and Pope EGP, Inc. are excluded from units beneficially owned by Mr. Pope. Mr. Pope and Emily T. Andrews, own all of the outstanding stock of Pope MGP, Inc. and Pope EGP, Inc. Includes currently exercisable options to purchase 132,873 units and 19,250 unvested restricted units. |
83
Equity Compensation Plan Information
The following table presents certain information with respect to the Partnership’s equity compensation plans and awards thereunder on December 31, 2005.
| Plan category | Number of securities to be issued upon exercise of outstanding options, warrants and rights (a) | Weighted-average exercise price of outstanding options, warrants and rights (b) | Number of securities remaining available for future issuance under equity compensation plans (excluding securities reflected in column (a)) (c) | |||||||
Equity compensation plans approved by security holders | 278,012 | $ | 15.58 | 1,085,815 | ||||||
Equity compensation plans not approved by security holders | - | - | - | |||||||
| Total | 278,012 | $ | 15.58 | 1,085,815 | ||||||
Item 13. CERTAIN RELATIONSHIPS AND RELATED TRANSACTIONS
The Partnership Agreement provides that it is a complete defense to any challenge to an agreement or transaction between the Partnership and a general partner, or related person, due to a conflict of interest if, after full disclosure of the material facts as to the agreement or transaction and the interest of the general partner or related person, (1) the transaction is authorized, approved or ratified by a majority of the disinterested directors of the General Partner, or (2) the transaction is authorized by partners of record holding more than 50% of the units held by all partners.
General Partner Fee. Pope MGP, Inc. receives an annual fee of $150,000, and reimbursement of administrative costs for its services as managing general partner of the Partnership, as stipulated in the Partnership Agreement.
Minority Interest Payments. The minority interest represents Pope MGP, Inc.’s profit-sharing interest in the IPMB. Net income from the IPMB is paid 80% to ORM, Inc. and 20% to Pope MGP, Inc. until net income from the IPMB reaches $7.0 million in a fiscal year, at which time income will be allocated evenly between ORM, Inc. and Pope MGP, Inc.
P&T Lease Payments. Mr. Peter T. Pope, a director of Pope MGP, Inc., is also a director of P&T. P&T leased an art collection from the Partnership through October 2003. Lease payments received in 2003 were $12,239. The lease ended in October 2003 when the art collection was sold to Mr. Pope.
Art Collection Sale. In October 2003 the art collection that has been historically leased to P&T was sold to Mr. Pope for $315,000. The price was based upon an independent appraisal.
84
ORM Timber Fund I, LP. David L. Nunes and Thomas M. Ringo have committed to invest less than 1% of the committed capital in ORM Timber Fund I, LP. This investment will be made when ORM Timber Fund I, LP has acquired timber property.
Item 14. PRINCIPAL ACCOUNTANT FEES AND SERVICES
The following table summarizes fees related to the Partnership’s principal accountants, KPMG LLP, during 2005 and 2004.
| Description of services | 2005 | % | 2004 | % | |||||||||
| Audit | $ | 345,000 | 85% | $ | 106,500 | 54% | |||||||
| Audit related | 8,000 | 2% | 3,500 | 2% | |||||||||
| Tax: | |||||||||||||
| Tax return preparation | 18,500 | 5% | 24,500 | 12% | |||||||||
| General tax consultation | 8,800 | 2% | 18,000 | 9% | |||||||||
| Other * | 26,250 | 6% | 46,000 | 23% | |||||||||
| Total | $ | 406,550 | 100% | $ | 198,500 | 100% | |||||||
* Other services provided by KPMG in 2005 consisted of a separate audit of the Partnership’s subsidiary, Olympic Resource Management LLC. Other services provided in 2004 consisted of the audit of Olympic Resource Management LLC and a review of documentation prepared by management in anticipation of the Sarbanes Oxley Section 404 audit in 2005.
The Audit Committee pre-approved all payments to KPMG LLP for services provided in 2005 and 2004.
Prior to hiring KPMG to provide services to the Partnership, anticipated fees and a description of the services are presented to the Audit Committee. The Audit Committee then either agrees to hire KPMG to provide the services or directs management to find a different service provider.
Item 15. EXHIBITS, FINANCIAL STATEMENT SCHEDULE
Financial Statements | Page | |||
| Reports of Independent Registered Public Accounting Firm | 50-51 | |||
| Financial statements: | ||||
| Consolidated balance sheets | 52 | |||
| Consolidated statements of operations | 53 | |||
| Consolidated statements of partners’ capital and comprehensive income | 54 | |||
| Consolidated statements of cash | 55 | |||
| Notes to consolidated financial statements | 56-69 | |||
85
Financial Statement Schedules
Environmental Remediation | |||||||||||||
Balances at the Beginning of the Period | Additions to Accrual | Expenditures for Remediation | Balances at the End of the Period | ||||||||||
| Year Ended December 31, 2003 | $ | 629,000 | $ | - | $ | 337,000 | $ | 292,000 | |||||
| Year Ended December 31, 2004 | 292,000 | 466,000 | 284,000 | 474,000 | |||||||||
| Year Ended December 31, 2005 | 474,000 | 198,000 | 514,000 | 158,000 | |||||||||
Exhibits.
No. | Document | |
| 3.1 | Certificate of Limited Partnership. (1) | |
| 3.2 | Limited Partnership Agreement, dated as of November 7, 1985. (1) | |
| 3.3 | Amendment to Limited Partnership Agreement dated December 16, 1986. (2) | |
| 3.4 | Amendment to Limited Partnership Agreement dated March 14, 1997. (4) | |
| 3.5 | Certificate of Incorporation of Pope MGP, Inc. (1) | |
| 3.6 | Amendment to Certificate of Incorporation of Pope MGP, Inc. (3) | |
| 3.7 | Bylaws of Pope MGP, Inc. (1) | |
| 3.8 | Certificate of Incorporation of Pope EGP, Inc. (1) | |
| 3.9 | Amendment to Certificate of Incorporation of Pope EGP, Inc. (3) | |
| 3.10 | Bylaws of Pope EGP, Inc. (1) | |
| 4.1 | Specimen Depositary Receipt of Registrant. (1) | |
| 4.2 | Limited Partnership Agreement dated as of November 7, 1985, as amended December 16, 1986 and March 14, 1997 (see Exhibits 3.2, 3.3 and 3.4). | |
| 9.1 | Shareholders Agreement entered into by and among Pope MGP, Inc., Pope EGP, Inc., Peter T. Pope, Emily T. Andrews, P&T, present and future directors of Pope MGP, Inc. and the Partnership, dated as of November 7, 1985 included as Appendix C to the P&T Notice and Proxy Statement filed with the Securities and Exchange Commission on November 12, 1985, a copy of which was filed as Exhibit 28.1 to the Partnership’s registration on Form 10 identified in footnote (1) below. (1) | |
| 10.1 | Transfer and Indemnity Agreement between the Partnership and P&T dated as of December 5, 1985. (1) | |
| 10.2 | Environmental Remediation Agreement (11) | |
| 10.3 | 1997 Unit Option Plan Summary. (5) | |
| 10.4 | Audit Committee Charter. (14) | |
| 10.5 | Employment Agreement between the Partnership and Allen E. Symington dated August 31, 2000. (9) |
| 10.6 | Deed of Trust, Fixture Filing and Security Agreement with Assignment of Rents between Pioneer Resources I, LLC, Olympic Resource Management LLC, and Oregon Title Insurance Company, dated April 7, 2000. (6) |
86
No. | Document | |
| 10.7 | Timberland Deed of Trust and Security Agreement with Assignment of Rents between Pope Resources, Jefferson Title Company and John Hancock Mutual Life Insurance Company dated April 29, 1992. (10) | |
| 10.8 | Amendment to Timberland Deed of Trust and Security Agreement with Assignment of Rents between Pope Resources, Jefferson Title Company and John Hancock Mutual Life Insurance Company dated May 13, 1992. (10) | |
| 10.9 | Second Amendment to Timberland Deed of Trust and Security Agreement with Assignment of Rents between Pope Resources, Jefferson Title Company and John Hancock Mutual Life Insurance Company, dated May 25 1993. (10) | |
| 10.10 | Third Amendment to Timberland Deed of Trust and Security Agreement with Assignment of Rents between Pope Resources, Jefferson Title Company and John Hancock Mutual Life Insurance Company dated December 19, 1995. (10) | |
| 10.11 | Fourth Amendment to Timberland Deed of Trust and Security Agreement with Assignment of Rents between Pope Resources, Jefferson Title Company and John Hancock Mutual Life Insurance Company dated December 20, 1999. (10) | |
| 10.12 | Amended and Restated Timberland Deed of Trust and Security Agreement with Assignment of Rents and Fixture Filing between Pope Resources and John Hancock Life Insurance Company dated March 29, 2001. (10) | |
| 10.13 | Promissory Note from Pope Resources to John Hancock Mutual Life Insurance Company dated April 29, 1992. (10) | |
| 10.14 | Amendment to Promissory Note from Pope Resources to John Hancock Mutual Life Insurance Company dated May 25, 1993. (10) | |
| 10.15 | Second Amendment to Promissory Note from Pope Resources to John Hancock Mutual Life Insurance Company, dated December 19, 1995. (10) | |
| 10.16 | Third Amendment to Promissory Note from Pope Resources to John Hancock Mutual Life Insurance Company dated December 20, 1999. (10) | |
| 10.17 | Fourth Amendment to Promissory Note from Pope Resources to John Hancock Mutual Life Insurance Company dated March 29, 2001. (10) |
| 10.18 | Note Purchase Agreement between Pope Resources, John Hancock Life Insurance Company and John Hancock Variable Life Insurance Company, dated March 29, 2001. (10) | |
| 10.19 | Class A Fixed Rate Senior Secured Note from Pope Resources to John Hancock Life Insurance Company dated March 29, 2001, in the principal amount of $23,500,000. (10) | |
| 10.20 | Class A Fixed Rate Senior Secured Note from Pope Resources to John Hancock Life Insurance Company dated March 29, 2001 in the principal amount of $4,500,000. (10) | |
| 10.21 | Class A Fixed Rate Senior Secured Note from Pope Resources to John Hancock Variable Life Insurance Company dated March 29, 2001, in the principal amount of $2,000,000. (10) | |
| 10.22 | Timberland Deed of Trust and Security Agreement With Assignment of Rents and Fixture Filing between Pope Resources, Jefferson Title Company and John Hancock Life Insurance Company, dated March 29, 2001. (10) |
| 10.23 | Promissory Note from Port Ludlow Associates LLC to Pope Resources dated August 2001. (8) | |
| 10.24 | Third Amendment to Management Agreement between Pioneer Resources I, LLC and Olympic Resource Management LLC. (11) | |
| 10.25 | Amendment to Subordination and Release Agreement between Port Ludlow Associates LLC and Pope Resources dated April 25, 2002. (11) |
87
No. | Document | |
| 10.27 | Purchase and sale agreement with Costco Wholesale Corp dated December 22, 2003 (12) | |
| 10.28 | Employment agreement with Mr. Thomas M. Ringo dated December 10, 2003 (12) | |
| 10.29 | Change of control agreement with David L. Nunes (14) | |
| 10.30 | Change of control agreement Thomas M. Ringo (14) | |
| 10.31 | Option agreement with Kitsap County dated August 14, 2003 (13) | |
| 10.32 | Purchase and sales agreement for Quilcene Timberlands dated September 28, 2004 (13) | |
| 10.33 | Long term management agreement with Cascade Timberlands LLC dated December 31, 2004 (13) | |
| 10.34 | Purchase and sale agreement with Plum Creek Timberlands LP dated December 2003 (13) | |
| 10.35 | Amendment 1 to option agreement with Kitsap County dated May 24, 2004 (13) | |
| 10.36 | First amendment to Note purchase agreement with John Hancock Life Insurance Company (14) | |
| 10.37 | Second amendment to Note purchase agreement with John Hancock Life Insurance Company (14) | |
| 10.38 | Third amendment to Note purchase agreement with John Hancock Life Insurance Company (14) | |
| 10.39 | Fourth amendment to Note purchase agreement with John Hancock Life Insurance Company (14) | |
| 10.40 | Pope Resources 2005 Unit Incentive Plan (15) | |
| 23 | Consent of Registered Independent Public Accounting Firm (14) | |
| 31.1 | Certificate of Chief Executive Officer (14) | |
| 31.2 | Certificate of Chief Financial Officer (14) | |
| 32.1 | Certification of Chief Executive Officer pursuant to 18 U.S.C. Section 1350, as adopted pursuant to Section 906 of the Sarbanes-Oxley Act of 2002 (14) | |
| 32.2 | Certification of Chief Financial Officer pursuant to 18 U.S.C. Section 1350, as adopted pursuant to Section 906 of the Sarbanes-Oxley Act of 2002 (14) | |
| 99.1 | Press release of the Registrant dated December 23, 2003 disclosing the signing of a definitive purchase and sale agreement with Costco Wholesale Corporation to sell nearly 20 acres of the Partnership’s 320-acre project in North Gig Harbor Washington. (12) | |
| 99.2 | Press release of the Registrant dated December 23, 2003 signing of a definitive purchase and sale agreement with Plum Creek Timber Company to acquire approximately 3,200 acres of timberland in southwest Washington for $8.5 million. | |
| 99.3 | Press Release of the Registrant dated February 1, 2006, incorporated by reference to the Current Report on Form 8-K filed by the Registrant on February 1, 2006. | |
| 99.4 | Pope Resources Code of Ethics (14) |
88
(1) Incorporated by reference from the Partnership’s registration on Form 10 filed under File No. 1-9035 and declared effective on December 5, 1985.
(2) Incorporated by reference from the Partnership’s annual report on Form 10-K for the fiscal year ended December 31, 1987.
(3) Incorporated by reference from the Partnership’s annual report on Form 10-K for the fiscal year ended December 31, 1988.
(4) Incorporated by reference from the Partnership’s Proxy Statement filed on February 11, 1997.
(5) Incorporated by reference to the Company’s Form S-8 Registration Statement filed with the Commission on February 11, 1997.
(6) Incorporated by reference from the Partnership’s quarterly report on Form 10-Q for the quarter ended March 31, 2000.
Subject to a request for confidential treatment filed with the SEC on May 12, 2000.
(7) Incorporated by reference to the Company’s Current Report filed on Form 8-K filed with the Commission on March 19, 2001.
(8) Incorporated by reference to the Company’s Current Report filed on Form 8-K filed with the Commission on August 20, 2001.
(9) Incorporated by reference from the Partnership’s annual report on Form 10-K for the fiscal year ended December 31, 2000.
(10) Incorporated by reference to the Partnership’s annual report on Form 10-K for the fiscal year ended December 31, 2001.
(11) Incorporated by reference to the Partnership’s annual report on Form 10-K for the fiscal year ended December 31, 2002.
| (12) | Incorporated by reference to the Partnership’s annual report on Form 10-K for the fiscal year ended December 31, 2003. |
| (13) | Incorporated by reference to the Partnership’s annual report on Form 10-K for the fiscal year ended December 31, 2004. |
| (14) | Filed with this annual report on Form 10-K for the fiscal year ended December 31, 2005. |
| (15) | Filed with Form S-8 on September 9, 2005. |
89
Pursuant to the requirements of Section 13 or 15(d) of the Securities Exchange Act of 1934, the Partnership has duly caused this report to be signed on its behalf by the undersigned, thereunto duly authorized.
| POPE RESOURCES, A Delaware | ||
| Limited Partnership | ||
| By POPE MGP, INC. | ||
| Managing General Partner | ||
| Date: March 13, 2006 | By /s/ David L. Nunes | |
| David L. Nunes, | ||
| President and | ||
| Chief Executive Officer | ||
| Pursuant to the requirements of the Securities Exchange Act of 1934, this report has been signed below by the following persons on behalf of the Partnership and in the capacities and on the date indicated. | ||
| Date: March 13, 2006 | By /s/ David L. Nunes | |
| David L. Nunes, | ||
| President and Chief Executive Officer (principal executive officer), Partnership and Pope MGP, Inc.; Director, Pope MGP, Inc. | ||
| Date: March 13, 2006 | By /s/ Thomas M. Ringo | |
| Thomas M. Ringo | ||
| Vice President & CFO (principal financial and accounting officer), Partnership and Pope MGP, Inc. | ||
| Date: March 8, 2006 | By /s/ John E. Conlin | |
| John E. Conlin | ||
| Director, Pope MGP, Inc. | ||
| Date: March 8, 2006 | By /s/ Douglas E. Norberg | |
| Douglas E. Norberg | ||
| Director, Pope MGP, Inc. | ||
| Date: March 8, 2006 | By /s/ Peter T. Pope | |
| Peter T. Pope | ||
| Director, Pope MGP, Inc. | ||
| Date: March 8, 2006 | By /s/ J. Thurston Roach | |
| J. Thurston Roach | ||
| Director, Pope MGP, Inc. | ||
90