Exhibit 99.1
Central Fund of Canada Limited
2nd Quarter
INTERIM REPORT TO SHAREHOLDERS
for the six months ended April 30, 2007
The Role of Central Fund
To serve investors as “The Sound Monetary Fund”.
To hold gold and silver bullion on a secure basis for the
convenience of investors in the shares of Central Fund.
Investment Policies & Restrictions |
| The governing articles of Central Fund require that at least 75% of Central Fund’s non-cash assets be invested in gold and silver bullion. This cannot be changed without shareholder approval. |
|
|
|
|
| The stated investment policy of the Board of Directors requires Central Fund to maintain a minimum of 90% of its net assets in gold and silver bullion of which at least 85% must be in physical form. On April 30, 2007, 98% of Central Fund’s net assets were invested in gold and silver bullion. Of this bullion, 99.3% was in physical form and 0.7% was in certificate form. |
|
|
|
|
| Central Fund’s physical gold and silver bullion holdings may not be loaned, subjected to options or otherwise encumbered in any way. |
|
|
|
Safeguards |
| Central Fund’s bullion is stored on a fully segregated basis in the underground vaults of the Canadian Imperial Bank of Commerce, one of the largest banks in North America in terms of total assets. |
|
|
|
|
| The Bank may only release Central Fund’s physical bullion holdings upon receipt of an authorizing resolution of Central Fund’s Board of Directors. |
|
|
|
|
| Insurance is carried on the physical gold and silver bullion holdings, against destruction, disappearance or wrongful abstraction. |
|
|
|
|
| Bullion holdings and bank vault security are inspected twice annually by directors and/or officers of Central Fund. On every occasion, inspections are required to be performed in the presence of both Central Fund’s external auditors and bank personnel. |
|
|
|
|
| Central Fund is subject to the extensive regulations and reporting requirements of the United States Securities and Exchange Commission, two stock exchanges and most Canadian provincial securities regulatory authorities. |
|
|
|
Conveniences |
| Central Fund’s Class A shares are listed on the American Stock Exchange (CEF) and on the Toronto Stock Exchange (CEF.A in Canadian dollars and CEF.U in U.S. dollars). Making a gold and silver bullion investment through Central Fund is as easy as calling one’s stockbroker or investment dealer. |
|
|
|
|
| The stock exchange listings provide readily quoted, liquid markets for the Class A shares of Central Fund. The bid/ask spread is considerably less than the buying and selling prices of outright bullion purchases, especially for small transactions. |
|
|
|
|
| Unlike many other forms of bullion investment, there are no ownership costs paid directly by the investor. All expenses of handling, storage and insurance of bullion are paid by Central Fund. As well, there are no bullion assay charges to the shareholder upon the sale, redemption or liquidation of the Class A shares of Central Fund. |
1
Second Quarter Report
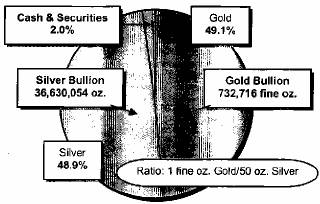
Central Fund is currently 98% invested in gold and silver bullion. At April 30, 2007 Central Fund’s gold holdings were 727,031 fine ounces of physical bullion and 5,685 fine ounces of gold bullion certificates for a total of 732,716 fine ounces. Silver holdings were 36,384,482 ounces of physical bullion and 245,572 ounces of silver bullion certificates for a total of 36,630,054 ounces. Insurance is carried on the physical bullion which is held in allocated safekeeping by a Canadian chartered bank in segregated vault storage. Central Fund continues to fulfill its mandate as “The Sound Monetary Fund”.
On behalf of the Board of Directors: |
|
|
|
| J.C. Stefan Spicer, |
|
| President |
June 6, 2007 |
|
|
Management’s Discussion and Analysis (MD&A)
The following discussion is based on the financial statements of Central Fund of Canada Limited (“Central Fund” or the “Company”) which are prepared in accordance with accounting principles generally accepted in Canada. These principles are substantially the same as United States’ generally accepted accounting principles.
This analysis should be read in conjunction with Central Fund’s financial statements prepared in accordance with Canadian GAAP included in its 2006 Annual Report and the accompanying MD&A.
Throughout this discussion, all currency amounts are in United States dollars.
Certain statements in this report may constitute forward-looking information within the meaning of securities laws. Forward-looking information may relate to our future outlook and anticipated events and may relate to matters that are not historical facts. In particular, statements regarding our objectives and strategies are forward-looking statements. These statements are based on certain factors and assumptions which we believe are reasonable as of the current date. While we believe these assumptions to be reasonable based on information currently available to us, they may prove to be incorrect. Forward-looking information is also subject to certain factors, including risks and uncertainties (described in “Risk Factors” of the Company’s 2006 annual MD&A), that could cause results to differ materially from what we currently expect. Therefore, future events and results may vary significantly from what we currently foresee.
Disclosure Controls and Procedures
Senior executive officers have ensured that there are disclosure controls and procedures that provide reasonable assurance that material information relating to the Corporation is disclosed on a timely basis. They believe these disclosure controls and procedures have been effective during the six months ended April 30, 2007.
Outstanding Shares
There were 113,294,532 Class A retractable shares and 40,000 Common shares issued and outstanding at April 30, 2007.
2
On December 8, 2006, the Company, through a public offering, issued 8,640,000 Class A shares for proceeds of $77,967,360 net of underwriting fees of $3,248,640. Costs relating to this public offering were approximately $600,000 and net proceeds were approximately $77,367,360.
The Company used the net proceeds from this public offering to purchase 52,690 fine ounces of gold at a cost of $33,932,360 and 2,634,540 ounces of silver at a cost of $36,817,696, both in physical bar form. The balance of $6,617,304 was retained by the Company in interest-bearing cash deposits for working capital purposes.
Administrator, Administration and Consulting Fees
Central Fund has no employees. It is party to an Administration and Consulting Agreement with The Central Group Alberta Ltd., which is related to the Company through four of its officers and directors. The Central Group Alberta Ltd., which acts as Administrator, has operating offices with employees, advisors and consultants who provide administration and consulting services to the Company. For such services, the Company pays an administration and consulting fee, payable monthly (see note 6 to the financial statements).
Results of Operations – Change in Net Assets
Net assets increased by $174,431,126 during the six months ending April 30, 2007 as a result of the December 8, 2006 public offering as well as increases in gold and silver prices.
The following table summarizes the quarterly financial information:
|
| Quarter ended (U.S.$) |
| ||||||||||
|
| Apr. 30, |
| Jan. 31, |
| Oct.31, |
| July 31, |
| ||||
|
| 2007 |
| 2007 |
| 2006 |
| 2006 |
| ||||
Unrealized appreciation (depreciation) of holdings (in millions) |
| $ | 24.6 |
| $ | 74.0 |
| $ | 2.0 |
| $ | (42.9 | ) |
Net income (loss) (in millions) |
| $ | 23.7 |
| $ | 73.2 |
| $ | 1.2 |
| $ | (43.2 | ) |
Earnings (loss) per Class A share |
| $ | 0.21 |
| $ | 0.67 |
| $ | 0.01 |
| $ | (0.45 | ) |
Total net assets (in millions) |
| $ | 1,010.8 |
| $ | 987.1 |
| $ | 836.3 |
| $ | 778.4 |
|
|
| Apr. 30, |
| Jan. 31, |
| Oct. 31, |
| July 31, |
| ||||
|
| 2006 |
| 2006 |
| 2005 |
| 2005 |
| ||||
Unrealized appreciation of holdings (in millions) |
| $ | 129.1 |
| $ | 127.2 |
| $ | 45.1 |
| $ | 1.0 |
|
Net income (in millions) |
| $ | 128.0 |
| $ | 126.2 |
| $ | 44.3 |
| $ | 0.3 |
|
Earnings per share |
| $ | 1.35 |
| $ | 1.34 |
| $ | 0.47 |
| $ | 0.00 |
|
Total net assets (in millions) |
| $ | 821.6 |
| $ | 667.2 |
| $ | 541.0 |
| $ | 497.6 |
|
Financial Results – Net Income
Central Fund’s earned income objective is secondary to its investment objective of holding almost all of its net assets in gold and silver bullion. Generally, Central Fund only seeks to maintain adequate cash reserves to enable it to pay expenses, taxes if applicable and Class A share dividends. Because the holdings of gold and silver bullion are not loaned to generate income, Central Fund’s realized income is a miniscule percentage of its net assets. However, CICA Accounting Guideline 18 (Investment Companies) requires Central Fund to record unrealized appreciation (depreciation) of holdings in income.
3
The net income (inclusive of unrealized appreciation of holdings) for the six months ended April 30, 2007 was $96,937,782, compared to $254,179,192 for the same period in 2006. Certain expenses, such as administration fees which are scaled, have varied in proportion to net asset levels, or, in the case of stock exchange fees, with market capitalization based on the number of Class A shares issued. Safekeeping fees and bullion insurance costs increased, reflecting the higher prices of gold and silver bullion. Administration fees increased to $1,254,330 from $934,573 for the six months based on the increased assets under administration.
Expenses (which exclude taxes) as a percentage of average month-end net assets for the six-month period ended April 30, 2007 were 0.22%, compared to 0.26% for the same six-month period in 2006. For the twelve months ended April 30, 2007, the expense ratio was 0.45% compared to 0.51% for the prior twelve-month period.
Liquidity and Capital Resources
All Central Fund’s assets are liquid. The Company’s objective is to hold cash reserves that generate some income primarily to be applied to pay operating expenses and Class A share dividends. The ability of Central Fund to have sufficient cash for operating expenses, and dividend payments, and to meet demands for redemption (if any), is primarily dependent upon its ability to realize cash flow from its cash equivalents. Should Central Fund not have sufficient cash to meet its needs, portions of Central Fund’s bullion holdings may be sold to fund dividend payments, provide working capital and pay for redemptions (if any) of Class A shares.
For the six months ended April 30, 2007, Central Fund’s cash reserves increased by $4,543,204 to $21,179,791. This increase was a result of the cash portion retained from the proceeds of the public offering completed in December 2006, offset by amounts used to pay expenses and the Class A share dividend. The Administrator and senior officers monitor Central Fund’s cash position with an emphasis on maintaining its mandate to hold maximum amounts of gold and silver bullion.
Forward–looking Observations
Changes in the market prices of gold and silver impact the net asset value per Class A share. Assuming as a constant exchange rate the rate which existed on April 30, 2007 of Cdn. $1.1067 for each U.S. dollar together with the holdings of gold and silver bullion which existed on that date, a 10% change in the price of gold would increase or decrease the net asset value per share by approximately $0.44 per share or Cdn. $0.49 per share. A 10% change in the price of silver would increase or decrease the net asset value per share by approximately $0.43 per share or Cdn. $0.48 per share. If both gold and silver prices were to change by 10% simultaneously in the same direction, the net asset value per share would increase or decrease by approximately $0.87 per share or Cdn. $0.97 per share.
Additional Information
This MD&A is dated June 6, 2007. Additional information relating to the Company, including its Annual Information Form, is available on the SEDAR website at www.sedar.com.
4
Statement of Net Assets
(expressed in U.S. dollars, unaudited)
|
| April 30 |
| October 31 |
| ||
|
| 2007 |
| 2006 |
| ||
Net assets: |
|
|
|
|
| ||
Gold bullion, at market, average cost $318,624,214 (2006: $284,691,854) (note 2) |
| $ | 496,048,973 |
| 410,565,912 |
| |
Silver bullion, at market, average cost $289,171,893 (2006: $252,354,197) (note 2) |
| 494,505,730 |
| 410,665,810 |
| ||
Cash |
| 1,079,791 |
| 2,136,587 |
| ||
Interest-bearing cash deposits (note 3) |
| 20,100,000 |
| 14,500,000 |
| ||
Prepaid insurance, interest receivable and other |
| 255,066 |
| 327,504 |
| ||
|
| 1,011,989,560 |
| 838,195,813 |
| ||
Accrued liabilities |
| (1,229,828 | ) | (820,662 | ) | ||
Dividends payable |
| — |
| (1,046,545 | ) | ||
Net assets representing shareholders’ equity |
| $ | 1,010,759,732 |
| 836,328,606 |
| |
|
|
|
|
|
| ||
Represented by: |
|
|
|
|
| ||
Capital stock (note 4) |
|
|
|
|
| ||
Class A shares issued: |
|
|
|
|
| ||
113,294,532 (2006: 104,654,532) |
| $ | 614,340,415 |
| 536,847,071 |
| |
Common shares issued: 40,000 |
| 19,458 |
| 19,458 |
| ||
|
| 614,359,873 |
| 536,866,529 |
| ||
Contributed surplus (note 5) |
| 13,669,932 |
| 15,294,173 |
| ||
Retained earnings inclusive of unrealized appreciation of holdings |
| 382,729,927 |
| 284,167,904 |
| ||
|
| $ | 1,010,759,732 |
| 836,328,606 |
| |
|
|
|
|
|
| ||
Net asset value per share: |
|
|
|
|
| ||
Class A shares |
| $ | 8.92 |
| 7.99 |
| |
Common shares |
| $ | 5.92 |
| 4.99 |
| |
|
|
|
|
|
| ||
Exchange rate: | U.S. $1.00 = Cdn. |
| $ | 1.1067 |
| 1.1227 |
|
|
|
|
|
|
| ||
Net asset value per share expressed in Canadian dollars: |
|
|
|
|
| ||
Class A shares |
| $ | 9.87 |
| 8.97 |
| |
Common shares |
| $ | 6.55 |
| 5.60 |
| |
See accompanying notes to financial statements.
On behalf of the Board: | ||
| ||
“Douglas E. Heagle” |
| “Philip M. Spicer” |
Director |
| Director |
5
Statement of Changes in Net Assets
(expressed in U.S. dollars, unaudited)
|
| Six months ended April 30 |
| Three months ended April 30 |
| ||||||
|
| 2007 |
| 2006 |
| 2007 |
| 2006 |
| ||
Net assets at beginning of period |
| $ | 836,328,606 |
| 541,001,443 |
| $ | 987,067,352 |
| 667,184,845 |
|
Add (deduct): |
|
|
|
|
|
|
|
|
| ||
Net income |
| 96,937,782 |
| 254,179,192 |
| 23,692,380 |
| 127,995,790 |
| ||
Net issuance of Class A shares |
| 77,493,344 |
| 26,448,981 |
| — |
| 26,448,981 |
| ||
Increase in net assets during the period |
| 174,431,126 |
| 280,628,173 |
| 23,692,380 |
| 154,444,771 |
| ||
Net assets at end of period |
| $ | 1,010,759,732 |
| 821,629,616 |
| $ | 1,010,759,732 |
| 821,629,616 |
|
Statement of Income
(expressed in U.S. dollars, unaudited)
|
| Six months ended April 30 |
| Three months ended April 30 |
| ||||||
|
| 2007 |
| 2006 |
| 2007 |
| 2006 |
| ||
Income: |
|
|
|
|
|
|
|
|
| ||
Interest |
| $ | 538,096 |
| 177,417 |
| $ | 279,728 |
| 88,412 |
|
Dividends |
| — |
| 260 |
| — |
| 130 |
| ||
Unrealized appreciation of holdings |
| 98,562,023 |
| 256,287,176 |
| 24,551,481 |
| 129,100,424 |
| ||
|
| 99,100,119 |
| 256,464,853 |
| 24,831,209 |
| 129,188,966 |
| ||
Expenses: |
|
|
|
|
|
|
|
|
| ||
Administration fees (note 6) |
| 1,254,330 |
| 934,573 |
| 641,809 |
| 500,402 |
| ||
Safekeeping, insurance & bank charges |
| 549,426 |
| 414,423 |
| 282,267 |
| 221,613 |
| ||
Shareholder information |
| 105,507 |
| 111,719 |
| 60,380 |
| 71,687 |
| ||
Accounting fees |
| 70,805 |
| 28,393 |
| 53,805 |
| 11,081 |
| ||
Directors’ fees and expenses |
| 62,217 |
| 52,270 |
| 26,787 |
| 23,964 |
| ||
Legal fees (note 6) |
| 45,775 |
| 66,237 |
| 24,071 |
| 18,088 |
| ||
Stock exchange fees (note 7) |
| 36,967 |
| 90,739 |
| 27,725 |
| 29,925 |
| ||
Registrar and transfer agent fees |
| 36,845 |
| 30,357 |
| 21,841 |
| 16,926 |
| ||
Miscellaneous |
| 595 |
| 984 |
| 274 |
| 434 |
| ||
Foreign currency exchange loss (gain) |
| (130 | ) | 6,944 |
| (130 | ) | (1,443 | ) | ||
Total expenses |
| 2,162,337 |
| 1,736,639 |
| 1,138,829 |
| 892,677 |
| ||
Income before taxes |
| 96,937,782 |
| 254,728,214 |
| 23,692,380 |
| 128,296,289 |
| ||
Taxes (note 8) |
| — |
| (549,022 | ) | — |
| (300,499 | ) | ||
Net income |
| $ | 96,937,782 |
| 254,179,192 |
| $ | 23,692,380 |
| 127,995,790 |
|
Net income per share: |
|
|
|
|
|
|
|
|
| ||
Class A shares |
| $ | 0.88 |
| 2.69 |
| $ | 0.21 |
| 1.35 |
|
Common shares |
| $ | 0.88 |
| 2.69 |
| $ | 0.21 |
| 1.35 |
|
See accompanying notes to the financial statements.
6
Statement of Retained Earnings
(expressed in U.S. dollars, unaudited)
|
| Six months ended April 30 |
| Three months ended April 30 |
| ||||||
|
| 2007 |
| 2006 |
| 2007 |
| 2006 |
| ||
Retained earnings: |
|
|
|
|
|
|
|
|
| ||
Balance at beginning of period |
| $ | 284,167,904 |
| 68,732,112 |
| $ | 358,178,446 |
| 195,918,864 |
|
Net income |
| 96,937,782 |
| 254,179,192 |
| 23,692,380 |
| 127,995,790 |
| ||
|
| 381,105,686 |
| 322,911,304 |
| 381,870,826 |
| 323,914,654 |
| ||
Transferred from contributed surplus (note 5) |
| 1,624,241 |
| 2,107,984 |
| 859,101 |
| 1,104,634 |
| ||
Balance at end of period |
| $ | 382,729,927 |
| 325,019,288 |
| $ | 382,729,927 |
| 325,019,288 |
|
See accompanying notes to the financial statements.
Notes to Financial Statements
For the six months ended April 30, 2007
(amounts expressed in U.S. dollars unless otherwise stated)
1. Summary of accounting policies:
The accounting policies used in the preparation of these unaudited interim financial statements conform with those presented in Central Fund’s October 31, 2006 audited annual financial statements. These interim financial statements do not include all of the disclosures included in the annual financial statements and accordingly should be read in conjunction with the annual financial statements.
2. Gold and Silver Bullion:
Details of gold and silver bullion holdings at April 30, 2007, are as follows:
Holdings |
| Gold |
|
|
| Silver |
|
100 & 400 fine oz bars |
| 727,031 |
| 1000 oz bars |
| 36,384,482 |
|
Certificates |
| 5,685 |
| Certificates |
| 245,572 |
|
Total fine ounces |
| 732,716 |
| Total ounces |
| 36,630,054 |
|
Market Value: |
| Per Fine Ounce |
| Per Ounce |
| ||
April 30, 2007 |
| U.S. $ | 677.00 |
| U.S. $ | 13.50 |
|
October 31, 2006 |
| U.S. $ | 603.75 |
| U.S. $ | 12.08 |
|
3. Short term cash deposits:
As at April 30, 2007, the Company held three U.S. dollar fixed deposits: $10,000,000 at a rate of 5.25% with a maturity date of May 30, 2007; $3,100,000 at a rate of 5.26% with a maturity date of May 31, 2007; and $7,000,000 at a rate of 5.22% with a maturity date of June 29, 2007.
4. Capital stock:
The authorized share capital consists of an unlimited number of Class A non-voting
7
shares without nominal or par value and 50,000 Common shares without nominal or par value.
There were 113,294,532 Class A shares, which are retractable, and 40,000 Common shares issued and outstanding at April 30, 2007.
On December 8, 2006, the Company, through a public offering, issued 8,640,000 Class A shares for proceeds of $77,967,360 net of underwriting fees of $3,248,640. Costs relating to this public offering were approximately $600,000 and net proceeds were approximately $77,367,360.
The Company used the net proceeds from this public offering to purchase 52,690 fine ounces of gold at a cost of $33,932,360 and 2,634,540 ounces of silver at a cost of $36,817,696, both in physical bar form. The balance of $6,617,304 was retained by the Company in interest-bearing cash deposits for working capital purposes.
On August 3, 2006, the Company, through a public offering, issued 7,150,000 Class A shares for proceeds of $58,344,000 net of underwriting fees of $2,431,000. Costs relating to this public offering were approximately $600,000 and net proceeds were approximately $57,744,000.
The Company used the net proceeds from this public offering to purchase 42,960 fine ounces of gold at a cost of $27,395,623 and 2,148,000 ounces of silver at a cost of $24,549,000, primarily in physical bar form. The balance of $5,799,377 was retained by the Company in interest-bearing cash deposits for working capital purposes.
On April 27, 2006, the Company, through a public offering, issued 3,208,212 Class A shares for proceeds of $26,948,981 net of underwriting fees of $1,122,874. Costs relating to this public offering were $374,016 and net proceeds were $26,574,965.
The Company used the net proceeds from this public offering to purchase 17,475 fine ounces of gold at a cost of $10,462,625 and 873,800 ounces of silver at a cost of $11,215,730, both in physical bar form. The balance of $4,896,611 was retained by the Company in interest-bearing cash deposits for working capital purposes.
5. Contributed Surplus and Retained Earnings:
Contributed surplus is used to eliminate any deficit that may arise from net losses before unrealized appreciation of holdings and on the payment of the Class A shares’ stated dividend per share. Accordingly, on April 30, 2007, $1,624,241 (2006: $2,107,984) was transferred from contributed surplus, representing the net loss before unrealized appreciation of holdings for the six months then ended. These quarterly adjustments do not affect the net asset value of the Company.
6. Related party transactions and fees:
Central Fund has no employees. It is party to an Administration and Consulting Agreement with The Central Group Alberta Ltd., which is related to the Company through four of its officers and directors. The Central Group Alberta Ltd., which acts as Administrator, has operating offices with employees, advisors and consultants who provide administration and consulting services to the Company. For such services, the Company pays an administration and consulting fee, payable monthly, at an annual rate for at least until October 31, 2015 of 0.30% on the first $400 million of total net assets; 0.20% on the next $600 million of total net assets; and 0.15% on total net assets exceeding one billion dollars.
8
Of the $1,229,828 (2006: $1,087,015) balance in accrued liabilities at April 30, 2007, $213,394 (2006: $182,151) relates to the April administration fee payable to the Administrator.
For the six months ended April 30, 2007, the Company incurred fees totaling $35,443 (2006: $65,385) to legal firms of which two of the Company’s directors are partners, and $1,254,330 (2006: $934,573) to the Administrator, the Central Group Alberta Ltd. The Board is of the opinion that these services were undertaken under the same terms and conditions as services with unrelated parties.
7. Stock exchange fees:
Stock exchange fees of $36,967 for the six months ended April 30, 2007 consist of Toronto Stock Exchange fees of $26,967 and American Stock Exchange fees of $10,000. These amounts represent approximately 4 months of the 12 month annual fee charged being $80,902 for the Toronto Stock Exchange and $30,000 for the American Stock Exchange. The amount of $90,739 for the same period in 2006 represents the total 2006 annual fees for the Toronto Stock Exchange and the American Stock Exchange.
8. Income taxes:
The Canadian Federal 2006 Budget eliminated the Federal large corporations capital tax retroactive to January 1, 2006.
9. Financial Highlights:
|
| Three months ended April 30 |
| ||||
|
| 2007 |
| 2006 |
| ||
Class A per share performance: |
|
|
|
|
| ||
Net asset value per share at beginning of period |
| $ | 8.71 |
| $ | 7.07 |
|
Net loss before unrealized appreciation of holdings |
| (0.01 | ) | (0.01 | ) | ||
Unrealized appreciation of holdings - gold |
| 0.17 |
| 0.50 |
| ||
Unrealized appreciation of holdings - silver |
| 0.05 |
| 0.86 |
| ||
Total increase |
| 0.21 |
| 1.35 |
| ||
Net asset value per share at end of period |
| $ | 8.92 |
| $ | 8.42 |
|
Total return (1) |
| 2.4 | % | 19.1 | % | ||
|
|
|
|
|
| ||
Percentages and supplemental data: |
|
|
|
|
| ||
Ratio as a percentage of average net assets: |
|
|
|
|
| ||
Expenses (1) |
| 0.11 | % | 0.12 | % | ||
Net loss before unrealized appreciation of holdings (1) |
| 0.08 | % | 0.15 | % | ||
(1)Ratios not annualized
10. Canadian and United States generally accepted accounting principles:
There are no differences between United States and Canadian generally accepted accounting principles which would require reconciliation in the financial statements of Central Fund.
9
Corporate Information
Directors
John S. Elder, Q.C. (C)
Douglas E. Heagle (A)(C)(I)(L)
Ian M.T. McAvity (E)(I)
Michael A. Parente CMA, CFP (A)(I)
Robert R. Sale (A)(C)(I)
Dale R. Spackman, Q.C. (E)
J.C. Stefan Spicer (E)
Philip M. Spicer (E)
Malcolm A. Taschereau (A)(C)(I)
Officers
Philip M. Spicer, Chairman
Dale R. Spackman, Q.C., Vice-Chairman
J.C. Stefan Spicer, President & CEO
John S. Elder, Q.C., Secretary
Catherine A. Spackman CMA, Treasurer
Teresa E. Poper, Assistant Treasurer
Advisors to the Administrator
Ian M.T. McAvity, Toronto, Ontario
– Market Analyst
Dr. Hans F. Sennholz, Grove City, PA
– Monetary Advisor
(A) | - | Member of Audit Committee |
(C) | - | Member of Corporate Governance Committee |
(E) | - | Member of Executive Committee |
(I) | - | May be regarded as an independent director under Canadian securities administrators’ guidelines. |
(L) | - | Lead Director |
Administrator
The Central Group Alberta Ltd.
Calgary, Alberta
Banker
Canadian Imperial Bank of Commerce
Legal Counsel
Fraser Milner Casgrain LLP,
Toronto, Ontario
Parlee McLaws LLP, Calgary, Alberta
Auditors
Ernst & Young LLP
Custodian
Canadian Imperial Bank of Commerce
Registrar and Transfer Agents
Mellon Investor Services LLC, New York
CIBC Mellon Trust Company, Calgary,
Montreal, Toronto and Vancouver
Share Ownership Certificates
Certificates of share ownership registered in shareholders’ names at their own addresses for delivery to them for their own safekeeping may be obtained upon the request of holders and payment of any applicable fees to the relevant Registrar and Transfer Agent of the Company.
Head Office | Shareholder and |
Hallmark Estates | Investor Inquiries |
Suite 805, 1323-15th Avenue S.W. | Administrator, P.O. Box 7319 |
Calgary, Alberta T3C 0X8 | Ancaster, Ontario L9G 3N6 |
Telephone (403) 228-5861 | Telephone (905) 648-7878 |
Fax (403) 228-2222 | Fax (905) 648-4196 |
|
|
Website: www.centralfund.com | |
E-mail: info@centralfund.com | |
Central Fund of Canada Limited
Portfolio
at
April 30, 2007
Class A Shares Stock Exchange Listings
|
| Electronic |
| Newspaper |
American Stock Exchange |
| CEF |
| CFCda |
The Toronto Stock Exchange |
| CEF.A |
| CFund A |
Net Asset Value Information
The net asset value per Class A share is calculated daily and is available at www.centralfund.com; or by calling the Administrator’s Investor Inquiries office at (905) 648-7878; or by sending an email to info@centralfund.com. The Thursday net asset value is published on a regular basis in several financial newspapers including the following:
In the United States (figures published in U.S. $):
· Barrons
· New York Times
· Wall Street Journal
In Canada (figures published in Canadian $):
· National Post: Financial Post Section
· The Globe and Mail: Report on Business