EXHIBIT 99.1
3rd Quarter
INTERIM REPORT TO SHAREHOLDERS
for the three and nine months ended July 31, 2009
The Role of Central Fund
To serve investors as "The Sound Monetary Fund".
To hold gold and silver bullion on a secure basis for the
convenience of investors in the shares of Central Fund.
| Investment Policies & Restrictions | The governing articles of Central Fund require that at least 75% of Central Fund’s non-cash assets be held in gold and silver bullion. This cannot be changed without shareholder approval. | |
| The stated investment policy of the Board of Directors requires Central Fund to maintain a minimum of 90% of its net assets in gold and silver bullion of which at least 85% must be in physical form. On July 31, 2009, 97% of Central Fund's net assets were held in gold and silver bullion. Of this bullion, 99.4% was in physical form and 0.6% was in certificate form. | ||
| Central Fund's physical gold and silver bullion holdings may not be loaned, subjected to options or otherwise encumbered in any way. | ||
| Safeguards | Central Fund’s bullion is stored on an allocated and fully segregated basis in the underground vaults of the Canadian Imperial Bank of Commerce (the “Bank”), one of the major Canadian banks, which insures its safekeeping. Additional insurance against destruction, disappearance or wrongful abstraction is carried by Central Fund on its physical gold and silver bullion holdings. | |
| The Bank may only release any portion of Central Fund’s physical bullion holdings upon receipt of an authorizing resolution of Central Fund's Board of Directors. | ||
| Bullion holdings and bank vault security are inspected twice annually by directors and/or officers of Central Fund. On every occasion, inspections are required to be performed in the presence of both Central Fund's external auditors and bank personnel. | ||
| Central Fund is subject to the extensive regulations and reporting requirements of the United States Securities and Exchange Commission, two stock exchanges and various Canadian provincial securities regulatory authorities. | ||
| Conveniences | Central Fund's Class A shares are listed on the NYSE Amex (CEF) and on the Toronto Stock Exchange (CEF.A in Canadian dollars and CEF.U in U.S. dollars). Making a gold and silver bullion investment through ownership of Central Fund Class A shares is as easy as calling one's stockbroker or investment dealer. | |
| The stock exchange listings provide liquid markets for the Class A shares of Central Fund. The bid/ask spread is considerably less than the buying and selling prices of outright bullion purchases, especially for small transactions. | ||
Unlike most other forms of gold and silver bullion investment, there are no ownership costs paid directly by the investor. All expenses of handling, storage and insurance of bullion are paid by Central Fund. As well, there are no bullion assay charges to a shareholder upon the sale, redemption or liquidation of the Class A shares of Central Fund. |
1
Third Quarter Report
Central Fund currently holds 97% of its net assets in gold and silver bullion. At July 31, 2009 Central Fund’s gold holdings were 1,165,188 fine ounces of physical bullion and 7,840 fine ounces of gold bullion certificates for a total of 1,173,028 fine ounces. Silver holdings were 58,393,242 ounces of physical bullion and 255,551 ounces of silver bullion certificates for a total of 58,648,793 ounces. Central Fund continues to fulfill its mandate as “The Sound Monetary Fund”.
On behalf of the Board of Directors:
J.C. Stefan Spicer,
President
August 17, 2009
Management’s Discussion and Analysis (MD&A)
The following discussion is based on the financial statements of Central Fund of Canada Limited (“Central Fund” or the “Company”) which are prepared in accordance with accounting principles generally accepted in Canada (“Canadian GAAP”) including the Canadian Institute of Chartered Accountants (“CICA”) Accounting Guideline 18. These principles are substantially the same as United States’ generally accepted accounting principles.
This analysis should be read in conjunction with Central Fund’s financial statements prepared in accordance with Canadian GAAP included in its 2008 Annual Report and the accompanying MD&A.
Throughout this discussion, all currency amounts are in United States dollars.
Certain statements in this report may constitute forward-looking information within the meaning of securities laws. Forward-looking information may relate to our future outlook and anticipated events and may relate to matters that are not historical facts. In particular, statements regarding our objectives and strategies are forward-looking statements. These statements are based on certain factors and assumptions which we believe are reasonable as of the current date. While we believe these assumptions to be reasonable based on information currently available to us, they may prove to be incorrect. Forward-looking information is also subject to certain factors, including risks and uncertainties (described in “Risk Factors” of the Company’s 2008 annual MD&A), that could cause results to differ materially from what we currently expect. Therefore, future events and results may vary significantly from what we currently foresee.
Disclosure Controls and Procedures
Senior Executive Officers have ensured that there are disclosure controls and procedures that provide reasonable assurance that material information relating to the Company is disclosed on a timely basis. They believe these disclosure controls and procedures have been effective during the nine months ended July 31, 2009.
2
Outstanding Shares
There were 184,967,713 Class A non-voting, fully participating shares and 40,000 Common shares issued and outstanding at July 31, 2009.
Administrator, Administrative and Consulting Fees
Central Fund has no employees. It is party to an Administrative and Consulting Agreement with The Central Group Alberta Ltd., which is related to the Company through four of its officers and directors. The Central Group Alberta Ltd., which acts as Administrator, has operating offices with employees, advisors and consultants who provide administrative and consulting services to the Company. For such services, the Company pays an administrative and consulting fee, payable monthly (see Note 6 to the financial statements).
Results of Operations – Change in Net Assets
Net assets increased by $755.4 million during the nine months ended July 31, 2009 as a result of the two public offerings completed on February 3, 2009 and April 16, 2009 as well as increases in gold and silver prices.
The following table summarizes the quarterly financial information:
| Quarter ended (U.S.$) | ||||||||||||||||
July 31, 2009 | Apr. 30, 2009 | Jan. 31, 2009 | Oct. 31, 2008 | |||||||||||||
Change in unrealized appreciation (depreciation) of holdings (in millions) | $ | 124.1 | $ | (29.9 | ) | $ | 339.9 | $ | (563.8 | ) | ||||||
| Net income (loss) (in millions) | $ | 122.6 | $ | (31.4 | ) | $ | 338.7 | $ | (564.9 | ) | ||||||
| Net income (loss) per Class A share | $ | 0.66 | $ | (0.20 | ) | $ | 2.23 | $ | (4.27 | ) | ||||||
| Total Net Assets (in millions) | $ | 1,959.4 | $ | 1,837.0 | $ | 1,542.8 | $ | 1,204.0 | ||||||||
July 31, 2008 | Apr. 30, 2008 | Jan. 31, 2008 | Oct. 31, 2007 | |||||||||||||
Change in unrealized appreciation (depreciation) of holdings (in millions) | $ | 69.4 | $ | (58.7 | ) | $ | 205.1 | $ | 152.2 | |||||||
| Net income (loss) (in millions) | $ | 68.2 | $ | (60.0 | ) | $ | 204.1 | $ | 151.4 | |||||||
| Net income (loss) per Class A share | $ | 0.53 | $ | (0.47 | ) | $ | 1.63 | $ | 1.33 | |||||||
| Total Net Assets (in millions) | $ | 1,647.6 | $ | 1,435.9 | $ | 1,441.7 | $ | 1,237.5 | ||||||||
Financial Results – Net Income
Central Fund’s earned income objective is secondary to its objective of holding almost all of its net assets in gold and silver bullion. Interest income was depressed by significant declines in short term interest rates over the past year. The Company’s objective is to hold cash reserves that generate some income primarily to be applied towards payment of expenses and Class A share dividends. Because gold and silver bullion are not loaned to generate income, Central Fund’s realized income (loss) is a nominal percentage of its net assets. However, the Canadian Institute of Chartered Accountants (“CICA”) Accounting Guideline 18, requires Central Fund to record unrealized appreciation (depreciation) of holdings in income.
3
The net income (inclusive of the change in unrealized appreciation of holdings) for the three months ended July 31, 2009 was $122.6 million compared to $68.2 million for the comparative period in 2008. For the nine months ended July 31, 2009, the net income (inclusive of the change in unrealized appreciation of holdings) was $429.9 million compared to $212.3 million for the same period in 2008. Virtually all of the income respectively was due to the change in unrealized appreciation of holdings. Certain expenses, such as administration fees which are scaled, have varied in proportion to net asset levels or, in the case of stock exchange fees, with market capitalization based on the number of Class A shares issued. Administration fees, which are calculated monthly based on net assets at each month end, increased during the three month period to $1,029,723 from $845,688 for the same period in 2008 and for the nine month period to $2,755,238 from $2,444,251 for the same period in 2008 as a direct result of the higher level of net assets under administration.
Expenses as a percentage of average month-end net assets for the three-month period ended July 31, 2009 were 0.08%, compared to 0.09% for the same three-month period in 2008. Expenses as a percentage of average month-end net assets for the nine-month period ended July 31, 2009 were 0.26%, compared to 0.29% for the same nine-month period in 2008. For the twelve months ended July 31, 2009, this expense ratio was 0.35% compared to 0.39% for the prior twelve-month period in 2008.
Liquidity and Capital Resources
All of Central Fund’s assets are liquid. The Company’s objective is to hold cash reserves that generate some income primarily to be applied to pay expenses and Class A share dividends. The ability of Central Fund to have sufficient cash for expenses and dividend payments, and to meet demands for redemption (if any), is primarily dependent upon its ability to realize cash flow from its cash equivalents. Should Central Fund not have sufficient cash to meet its needs, portions of Central Fund's bullion holdings may be sold to fund dividend payments, provide working capital and pay for redemptions (if any) of Class A shares.
For the nine months ended July 31, 2009, Central Fund’s cash reserves including short-term deposits increased by $13,356,458 to $60,325,770. This increase was a result of the relatively small cash portions retained from the proceeds of the two public offerings completed on February 3, 2009 and April 16, 2009. This was partially offset by amounts used to pay expenses and the year-end Class A share dividend. The Administrator and Senior Executive Officers monitor Central Fund’s cash position with an emphasis on maintaining its mandate to hold maximum amounts of gold and silver bullion.
On August 13, 2009, the Company, through a public offering, issued 11,040,000 Class A shares for proceeds of $126,120,960 net of underwriting fees of $5,255,040. Costs relating to this public offering were approximately $600,000 and net proceeds were approximately $125,520,960. The Company used the net proceeds from this public offering to purchase 69,342 fine ounces of gold at a cost of $67,404,584 and 3,467,086 ounces of silver at a cost of $52,595,695, both in physical bar form. The balance of $5,520,681 was retained by the Company in interest-bearing cash deposits for working capital purposes.
Additional Information
This MD&A is dated August 17, 2009. Additional information relating to the Company, including its Annual Information Form and 2008 Annual Report, is available on the SEDAR website at www.sedar.com.
4
Statement of Net Assets
(expressed in U.S. dollars, unaudited)
| July 31 | October 31 | |||||||
| 2009 | 2008 | |||||||
| Net assets: | ||||||||
Gold bullion, at market, average cost $707,225,090 (2008: $526,252,976) (Note 2) | $ | 1,101,473,626 | 709,313,709 | |||||
Silver bullion, at market, average cost $602,091,235 (2008: $475,723,982) (Note 2) | 799,383,050 | 450,336,352 | ||||||
| Cash | 1,023,350 | 1,470,435 | ||||||
| Short-term deposits (Note 3) | 59,302,420 | 45,498,877 | ||||||
| Prepaid insurance, interest receivable and other | 124,343 | 262,962 | ||||||
| 1,961,306,789 | 1,206,882,335 | |||||||
| Accrued liabilities (Note 6) | (1,859,998 | ) | (1,358,756 | ) | ||||
| Dividends payable | - | (1,524,677 | ) | |||||
| Net assets representing shareholders’ equity | $ | 1,959,446,791 | 1,203,998,902 | |||||
| Represented by: | ||||||||
Capital stock (Note 4) Class A shares issued: 184,967,713 (2008: 152,467,713) | $ | 1,367,183,782 | 1,041,656,871 | |||||
Common shares issued: 40,000 (2008: 40,000) | 19,458 | 19,458 | ||||||
| 1,367,203,240 | 1,041,676,329 | |||||||
| Contributed surplus (Note 5) | 541,981 | 4,693,182 | ||||||
| Retained earnings inclusive of unrealized appreciation of holdings | 591,701,570 | 157,629,391 | ||||||
| $ | 1,959,446,791 | 1,203,998,902 | ||||||
| Net asset value per share: | ||||||||
| Class A shares | $ | 10.59 | 7.90 | |||||
| Common shares | $ | 7.59 | 4.90 | |||||
Exchange rate: U.S. $1.00 = Cdn. | $ | 1.0790 | 1.2165 | |||||
| Net asset value per share expressed in Canadian dollars: | ||||||||
| Class A shares | $ | 11.43 | 9.61 | |||||
| Common shares | $ | 8.19 | 5.96 | |||||
See accompanying notes to the financial statements.
On behalf of the Board:
“Douglas E. Heagle” | “Philip M. Spicer” |
| Director | Director |
5
Statement of Income
(expressed in U.S. dollars, unaudited)
| Nine months ended July 31 | Three months ended July 31 | |||||||||||||||
| 2009 | 2008 | 2009 | 2008 | |||||||||||||
| Income: | ||||||||||||||||
| Interest | $ | 317,590 | 688,206 | $ | 50,216 | 183,323 | ||||||||||
| Change in unrealized appreciation of holdings | 434,072,179 | 215,828,975 | 124,125,245 | 69,423,469 | ||||||||||||
| 434,389,769 | 216,517,181 | 124,175,461 | 69,606,792 | |||||||||||||
| Expenses: | ||||||||||||||||
| Administration fees (Note 6) | 2,755,238 | 2,444,251 | 1,029,723 | 845,688 | ||||||||||||
Safekeeping, insurance and bank charges | 1,200,313 | 1,204,281 | 456,437 | 432,038 | ||||||||||||
| Shareholder information | 154,286 | 137,977 | 18,950 | 21,891 | ||||||||||||
| Directors’ fees and expenses | 97,520 | 101,093 | 32,315 | 34,547 | ||||||||||||
| Stock exchange fees | 96,508 | 97,209 | 31,822 | 32,591 | ||||||||||||
| Accounting fees | 61,418 | 61,462 | 21,923 | 10,066 | ||||||||||||
| Registrar and transfer agent fees | 55,343 | 60,511 | 17,822 | 22,581 | ||||||||||||
| Legal fees (Note 6) | 46,159 | 95,447 | 5,823 | 4,153 | ||||||||||||
| Miscellaneous | 934 | 909 | 294 | 275 | ||||||||||||
| Foreign currency exchange loss | 1,072 | 1,851 | 581 | 700 | ||||||||||||
| Total expenses | 4,468,791 | 4,204,991 | 1,615,690 | 1,404,530 | ||||||||||||
| Net income inclusive of the change in unrealized appreciation of holdings | $ | 429,920,978 | 212,312,190 | $ | 122,559,771 | 68,202,262 | ||||||||||
| Net income per share: | ||||||||||||||||
| Class A shares | $ | 2.56 | 1.69 | $ | 0.66 | 0.53 | ||||||||||
| Common shares | $ | 2.56 | 1.69 | $ | 0.66 | 0.53 | ||||||||||
See accompanying notes to the financial statements.
6
Statement of Changes in Net Assets
(expressed in U.S. dollars, unaudited)
| Nine months ended July 31 | Three months ended July 31 | |||||||||||||||
| 2009 | 2008 | 2009 | 2008 | |||||||||||||
| Net assets at beginning of period | $ | 1,203,998,902 | 1,237,519,123 | $ | 1,836,887,020 | 1,435,875,605 | ||||||||||
| Add: | ||||||||||||||||
| Net income inclusive of the change in unrealized appreciation of holdings | 429,920,978 | 212,312,190 | 122,559,771 | 68,202,262 | ||||||||||||
| Increase in Class A capital | 325,526,911 | 197,797,913 | - | 143,551,359 | ||||||||||||
| Increase in net assets during the period | 755,447,889 | 410,110,103 | 122,559,771 | 211,753,621 | ||||||||||||
| Net assets at end of period | $ | 1,959,446,791 | 1,647,629,226 | $ | 1,959,446,791 | 1,647,629,226 | ||||||||||
See accompanying notes to the financial statements.
Statement of Retained Earnings
(expressed in U.S. dollars, unaudited)
| Nine months ended July 31 | Three months ended July 31 | |||||||||||||||
| 2009 | 2008 | 2009 | 2008 | |||||||||||||
| Retained earnings: | ||||||||||||||||
| Balance at beginning of period | $ | 157,629,391 | 505,657,472 | $ | 467,576,325 | 652,062,978 | ||||||||||
| Net income inclusive of the change in unrealized appreciation of holdings | 429,920,978 | 212,312,190 | 122,559,771 | 68,202,262 | ||||||||||||
| 587,550,369 | 717,969,662 | 590,136,096 | 720,265,240 | |||||||||||||
| Transferred from contributed surplus (Note 5) | 4,151,201 | 3,516,785 | 1,565,474 | 1,221,207 | ||||||||||||
| Balance at end of period | $ | 591,701,570 | 721,486,447 | $ | 591,701,570 | 721,486,447 | ||||||||||
See accompanying notes to the financial statements.
7
Notes to Financial Statements
For the nine months ended July 31, 2009
(amounts expressed in U.S. dollars unless otherwise stated)
| 1. | Summary of significant accounting policies: |
| The significant accounting policies applied in the preparation of these unaudited interim financial statements conform with those presented in Central Fund of Canada Limited’s (“Central Fund” or the “Company”) October 31, 2008 audited annual financial statements. These interim financial statements do not include all of the disclosures included in the annual financial statements and, accordingly, should be read in conjunction with the annual financial statements. |
| 2. | Gold and Silver Bullion: |
Details of gold and silver bullion holdings at July 31, 2009, are as follows:
| Holdings | Gold | Silver | |||||||
| 100 & 400 fine oz bars | 1,165,188 | 1,000 oz bars | 58,393,242 | ||||||
| Certificates | 7,840 | Certificates | 255,551 | ||||||
| Total fine ounces | 1,173,028 | Total ounces | 58,648,793 | ||||||
| Market Value | Per Fine Ounce | Per Ounce | |||||||
| July 31, 2009 | U.S. $ | 939.00 | U.S. $ | 13.63 | |||||
| October 31, 2008 | U.S. $ | 730.75 | U.S. $ | 9.28 | |||||
| 3. | Short-term deposits: |
As at July 31, 2009, the Company held seven U.S. dollar fixed deposits with a Schedule I Canadian Bank for a total of $58,700,000 with rates ranging from 0.19% to 0.34% and maturity dates from August 6, 2009 to September 17, 2009. The Company also held one Canadian dollar flexible GIC deposit with a Schedule I Canadian Bank in the amount of $602,420 (Cdn. $650,000) at a rate of 1.40% with a maturity date of January 29, 2010.
| 4. | Capital stock: |
The authorized share capital consists of an unlimited number of Class A non-voting shares without nominal or par value and 50,000 Common shares without nominal or par value. There were 184,967,713 Class A non-voting, fully participating shares and 40,000 Common shares issued and outstanding at July 31, 2009.
On April 16, 2009, the Company, through a public offering, issued 20,000,000 Class A shares for proceeds of $201,600,000 net of underwriting fees of $8,400,000. Costs relating to this public offering were approximately $600,000 and net proceeds were approximately $201,000,000. The Company used the net proceeds from this public offering to purchase 123,700 fine ounces of gold at a cost of $109,909,145 and 6,188,000 ounces of silver at a cost of $78,088,690, both in physical bar form. The balance of $13,002,165 was retained by the Company in interest-bearing cash deposits for working capital purposes.
On February 3, 2009, the Company, through a public offering, issued 12,500,000 Class A shares for proceeds of $124,800,000 net of underwriting fees of $5,200,000. Costs relating to this public offering were approximately $500,000 and net proceeds were approximately $124,300,000. The Company used the net proceeds from this public offering to purchase 78,663 fine ounces of gold at a cost of $71,062,969 and 3,933,169 ounces of silver at a cost of $48,278,562, both in physical bar form. The balance of $4,958,469 was retained by the Company in interest-bearing cash deposits for working capital purposes.
8
On September 26, 2008, the Company, through a public offering, issued 11,900,000 Class A shares for proceeds of $123,379,200 net of underwriting fees of $5,140,800. Costs relating to this public offering were approximately $600,000 and net proceeds were approximately $122,779,200. The Company used the net proceeds from this public offering to purchase 72,683 fine ounces of gold at a cost of $65,229,358 and 3,634,168 ounces of silver at a cost of $49,161,208, both in physical bar form. The balance of $8,388,634 was retained by the Company in interest-bearing cash deposits for working capital purposes.
On July 22, 2008, the Company, through a public offering, issued 11,115,000 Class A shares for proceeds of $144,050,400 net of underwriting fees of $6,002,100. Costs relating to this public offering were $474,571 and net proceeds were $143,575,829. The Company used the net proceeds from this public offering to purchase 67,397 fine ounces of gold at a cost of $66,287,788 and 3,369,900 ounces of silver at a cost of $66,039,619, both in physical bar form. The balance of $11,248,422 was retained by the Company in interest-bearing cash deposits for working capital purposes.
On March 5, 2008, the Company, through a public offering, issued 4,318,181 Class A shares for proceeds of $54,719,990 net of underwriting fees of $2,280,000. Costs relating to this public offering were $398,518 and net proceeds were $54,321,472. The Company used the net proceeds from this public offering to purchase 25,416 fine ounces of gold at a cost of $24,319,300 and 1,270,800 ounces of silver at a cost of $24,501,024, both in physical bar form. The balance of $5,501,148 was retained by the Company in interest-bearing cash deposits for working capital purposes.
| 5. | Contributed surplus and retained earnings: |
Contributed surplus is used to eliminate any deficit that may arise from net losses before any change in unrealized appreciation (depreciation) of holdings and the payment of the Class A shares’ stated dividend per share. Accordingly, for the three months ended July 31, 2009, $1,565,474 (2008: $1,221,207) was transferred from contributed surplus to retained earnings and for the nine months ended July 31, 2009, $4,151,201 (2008: $3,516,785) was transferred from contributed surplus to retained earnings. These quarterly adjustments do not affect the net asset value of the Company. With the balance of contributed surplus being $541,981 at July 31, 2009, the account will be fully utilized and closed during the next quarter.
| 6. | Related party transactions and fees: |
Central Fund has no employees. It is party to an Administrative and Consulting Agreement with The Central Group Alberta Ltd., which is related to the Company through four of its officers and directors. The Central Group Alberta Ltd., which acts as Administrator, has operating offices with employees, advisors and consultants who provide administrative and consulting services to the Company. For such services, the Company pays an administrative and consulting fee, payable monthly, until at least October 31, 2015, at an annual rate of: 0.30% on the first $400 million of total net assets; 0.20% on the next $600 million of total net assets; and 0.15% on total net assets exceeding one billion dollars.
Included in accrued liabilities at July 31, 2009, is $335,887 (2008: $236,749) which relates to the July administration fee payable to the Administrator.
For the nine months ended July 31, 2009, the Company incurred fees totaling $46,159 (2008: $83,217) to legal firms of which one of the Company’s directors is counsel and of which one of the Company’s directors is a partner, and $2,755,238 (2008: $1,598,563) to the Administrator, the Central Group Alberta Ltd. The Board of Directors is of the opinion that these services were undertaken under the same terms and conditions as services with unrelated parties.
9
| 7. | Management of financial risks: |
| The Company has risk management policies and procedures in place to identify risks related to financial instruments. The objectives of these policies and procedures are to identify and mitigate risk. The Company’s compliance with these policies and procedures is monitored by the Senior Executive Officers, the Audit Committee and the Board of Directors of the Company. Market fluctuations are unpredictable and outside the control of the Company. New risk factors may emerge from time to time and it is not possible for the Company to predict all such risk factors. It is possible to predict the impact that changes in the market prices of gold and silver will have on the net asset values of Central Fund and its shares. Assuming as a constant exchange rate, the rate which existed on July 31, 2009 of Cdn. $1.0790 for each U.S. dollar together with the holdings of gold and silver bullion which existed on that date, a 10% change in the price of gold would increase or decrease the net asset value per share by approximately $0.60 per share or Cdn. $0.64 per share. A 10% change in the price of silver would increase or decrease the net asset value per share by approximately $0.43 per share or Cdn. $0.47 per share. If both gold and silver prices were to change by 10% simultaneously in the same direction, the net asset value per share would increase or decrease by approximately $1.03 per share or Cdn. $1.11 per share. |
| Currency risk is the risk that the value of a financial instrument will fluctuate due to changes in foreign exchange rates. The impact of a 5% strengthening or weakening of the Canadian dollar against the U.S. dollar applied to balances outstanding at July 31, 2009 would not have had any material impact on the net income for the period ended July 31, 2009, assuming that all other variables, in particular interest rates, remained constant. |
| Credit risk on financial instruments is the risk of loss occurring as a result of the default of an issuer on its obligation to Central Fund. Credit risk is monitored on an ongoing basis and is managed by the Company only dealing with issuers that are believed to be creditworthy. As at July 31, 2009, other than short-term deposits, Central Fund had no investment in fixed income securities. |
| Liquidity risk is the risk that the Company will not be able to generate adequate cash resources to fulfill its payment obligations. Central Fund traditionally has maintained sufficient cash reserves to enable it to pay expenses and dividends on its Class A shares. Furthermore, over 97% of its net assets are in the form of gold and silver bullion which is readily tradable in an active market and can be sold if necessary to fund those payments referred to above. |
| 8. | Financial highlights: |
Nine months ended July 31 | Three months ended July 31 | |||||||||||||||
| 2009 | 2008 | 2009 | 2008 | |||||||||||||
| Class A per share performance: | ||||||||||||||||
| Net asset value per share at beginning of period | $ | 7.90 | 9.89 | $ | 9.93 | 11.09 | ||||||||||
| Net loss before unrealized appreciation of holdings | (0.02 | ) | (0.03 | ) | (0.01 | ) | (0.01 | ) | ||||||||
| Unrealized appreciation of holdings - gold | 1.26 | 0.78 | 0.35 | 0.27 | ||||||||||||
| Unrealized appreciation of holdings - silver | 1.32 | 0.94 | 0.32 | 0.27 | ||||||||||||
Total increase (1) | 2.56 | 1.69 | 0.66 | 0.53 | ||||||||||||
| Net asset value per share at end of period | $ | 10.59 | 11.72 | $ | 10.59 | 11.72 | ||||||||||
Total return (2) | 34.1 | % | 18.5 | % | 6.6 | % | 5.7 | % | ||||||||
| Percentages and supplemental data: | ||||||||||||||||
| Ratio as a percentage of average net assets: | ||||||||||||||||
Expenses (2) | 0.26 | % | 0.29 | % | 0.08 | % | 0.09 | % | ||||||||
Net loss before unrealized appreciation of holdings (2) | 0.24 | % | 0.24 | % | 0.08 | % | 0.08 | % | ||||||||
Figures in table are based on the weighted average number of Class A shares during the period except for the net asset value which is based on the actual number of shares outstanding at the relevant time.
(1) This table is not meant to be a reconciliation of opening to ending NAV.
(2) Ratios not annualized.
10
9. Capital Management:
The capital of the Company is represented by the issued and outstanding Class A and Common shares and the net asset value attributable to participating shareholders. The Directors direct the Administrator to administer the capital of the Company in accordance with the Company’s stated objectives and restrictions, as stipulated in the Articles of Incorporation as amended, while maintaining sufficient cash to pay expenses of maintaining the Company and to meet demands for redemption (if any). The Company does not have any externally imposed capital requirements.
10. Canadian and United States generally accepted accounting principles:
There are no differences between Canadian and United States generally accepted accounting principles (“GAAP”) which would require a reconciliation in the financial statements of Central Fund.
11. Adoption of new accounting standards:
Commencing November 1, 2008, the Company adopted FASB No. 157, Fair Value Measurements (“FASB 157”), to increase consistency and comparability in fair value measurements and to expand their disclosures. The new standard includes a definition of fair value as well as a framework for measuring fair value. The Company’s policy and practice is at all times to utilize only broadly quoted market values (Level 1) when valuing its assets; therefore adoption of FASB 157 did not have any impact.
12. Future accounting changes:
In February 2008, Canada’s Accounting Standards Board confirmed that Canadian GAAP, as used by publicly accountable enterprises, will be replaced by International Financial Reporting Standards (“IFRS”) for fiscal years beginning on or after January 1, 2011. Public companies and trusts will be required to provide IFRS comparative information for the previous fiscal year. Accordingly, the conversion from Canadian GAAP to IFRS will be applicable to the Company’s reporting for the first quarter of the fiscal year to commence on November 1, 2011 and for which the current and comparative information will be prepared under IFRS. The Company is developing a changeover plan to meet the timetable published by the Canadian Institute of Chartered Accountants for changeover to IFRS. The plan will cover such key elements as the impact of IFRS on the Company’s accounting policies, including its proposed method of implementation of a change in policy, if any, and the nature and extent of any additional note disclosures in the financial statements of the Company.
13. Subsequent event:
On August 13, 2009, the Company, through a public offering, issued 11,040,000 Class A shares for proceeds of $126,120,960 net of underwriting fees of $5,255,040. Costs relating to this public offering were approximately $600,000 and net proceeds were approximately $125,520,960. The Company used the net proceeds from this public offering to purchase 69,342 fine ounces of gold at a cost of $67,404,584 and 3,467,086 ounces of silver at a cost of $52,595,695, both in physical bar form. The balance of $5,520,681 was retained by the Company in interest-bearing cash deposits for working capital purposes.
11
Corporate Information
Directors John S. Elder, Q.C. (C) Douglas E. Heagle (A)(C)(I)(L) Ian M.T. McAvity (C)(E)(I) Michael A. Parente CMA, CFP (A)(I) Robert R. Sale (A)(C)(I) Dale R. Spackman, Q.C. (E) J.C. Stefan Spicer (E) Philip M. Spicer (E) | Officers Philip M. Spicer, Chairman Dale R. Spackman, Q.C., Vice-Chairman J.C. Stefan Spicer, President & CEO John S. Elder, Q.C., Secretary Catherine A. Spackman CMA, Treasurer Teresa E. Poper CB, Assistant Treasurer Consultant Malcolm A. Taschereau | |
(A) (C) (E) (I) (L) | - Member of Audit Committee - Member of Corporate Governance Committee - Member of Executive Committee - May be regarded as an independent director under Canadian securities administrators’ guidelines. - Lead Director | |
| Upon the retirement of Mr. Malcolm A. Taschereau from the Board of Directors at the Annual Meeting on February 23, 2009, he consented to being retained by the Administrator to continue his excellent service as a Consultant for Central Fund. | ||
Administrator The Central Group Alberta Ltd. Calgary, Alberta | Auditors Ernst & Young LLP Canada | |
Banker Canadian Imperial Bank of Commerce | Custodian Canadian Imperial Bank of Commerce | |
Legal Counsel Dorsey & Whitney LLP, Toronto Fraser Milner Casgrain LLP, Toronto Parlee McLaws LLP, Calgary | Registrar and Transfer Agents CIBC Mellon Trust Company, Calgary, Montreal, Toronto and Vancouver Mellon Investor Services LLC, New York | |
Head Office Hallmark Estates Suite 805, 1323-15th Avenue S.W. Calgary, Alberta T3C 0X8 Telephone (403) 228-5861 Fax (403) 228-2222 | Shareholder and Investor Inquiries Administrator, P.O. Box 10050 Ancaster, Ontario L9K 1P2 Telephone (905) 648-7878 Fax (905) 648-4196 | |
Website: www.centralfund.com E-mail: info@centralfund.com | ||

Net Asset Summary at July 31, 2009 | 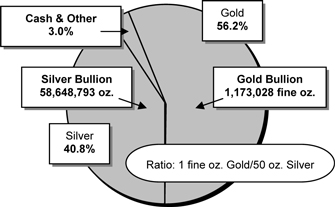 |
Class A Shares Stock Exchange Listings
Electronic Ticker Symbol | Newspaper Quote Symbol | ||
| NYSE Amex | CEF | CFCda | |
| The Toronto Stock Exchange | CEF.A in CDN $ | CFund A | |
| CEF.U in US $ |
Net Asset Value Information
The net asset value per Class A share is calculated daily and is available at www.centralfund.com; or by calling the Administrator’s Investor Inquiries Office at (905) 648-7878; or by sending an email to info@centralfund.com. The Thursday net asset value is published on a regular basis in several financial newspapers including the following:
In the United States (figures published in U.S. $):
n Barrons
n New York Times
n Wall Street Journal
In Canada (figures published in Canadian $):
n National Post: Financial Post Section
n The Globe and Mail: Report on Business