
The Role of Central Fund
To serve investors as "The Sound Monetary Fund".
To hold gold and silver bullion on a secure basis for the
convenience of investors in the shares of Central Fund.
Investment Policies & Restrictions | The investment policy set by the Board of Directors requires Central Fund to maintain a minimum of 90% of its net assets in gold and silver bullion of which at least 85% must be in physical form. On October 31, 2013, 99.2% of Central Fund's net assets were held in gold and silver bullion. Of this bullion, 99.6% was in physical form and 0.4% was in certificate form.
Central Fund's physical gold and silver bullion holdings may not be loaned, subjected to options or otherwise encumbered in any way.
|
| Safeguards | Central Fund’s bullion is stored on an allocated and fully segregated basis in underground vaults located in Canada which are controlled by the Canadian Imperial Bank of Commerce (the “Bank”), one of the major Canadian banks.
The Bank may only release any portion of Central Fund’s physical bullion holdings upon receipt of an authorizing resolution of Central Fund's Board of Directors.
Bullion holdings and Bank vault security are inspected twice annually by Directors and/or Officers of Central Fund. On every occasion, inspections are required to be performed in the presence of both Central Fund's external auditors and Bank personnel.
Central Fund is subject to extensive regulatory and reporting requirements of the United States Securities and Exchange Commission, two stock exchanges and various Canadian provincial securities regulatory authorities.
|
| Conveniences | Central Fund's Class A shares are listed on the NYSE MKT (CEF) and on the Toronto Stock Exchange (CEF.A in Canadian dollars and CEF.U in U.S. dollars). Making a gold and silver bullion investment through Central Fund is as easy as calling one's stockbroker or investment dealer.
The stock exchange listings provide liquid markets for the Class A shares of Central Fund. The bid/ask spread is usually considerably less than the buying and selling prices of outright bullion purchases, especially for small transactions.
Unlike most other forms of gold and silver bullion investment, there are no ownership costs such as handling, storage and insurance paid directly by the investor. As well, there are no bullion assay charges to a shareholder upon the sale or redemption of the Class A shares of Central Fund. |
| 1 |
Directors' 52nd Annual Report to Shareholders
Central Fund of Canada Limited is a low-cost, convenient facility for the investment ownership of gold and silver bullion. At October 31, 2013, 99.2% of Central Fund’s net assets consisted of unencumbered, allocated and segregated, passive, long-term holdings of gold and silver bullion.
Central Fund’s Class A shares, listed on the NYSE MKT and on the Toronto Stock Exchange, provide investors with a convenient precious metals investment alternative to direct investment in gold and silver bullion, with its high costs of buying and selling, including handling, recording, storage, insurance and assay charges at time of sale.
Central Fund’s shares are also a desirable alternative to bullion coins, the costs of which often include additional shipping and handling charges, and are subject to sales taxes in many North American jurisdictions.
Central Fund’s Class A shares serve as a stock exchange tradeable bullion proxy and qualify for investment through various “regulated capital accounts” such as IRAs, Keoghs, RRSPs, and insurance, mutual and pension funds, where direct holdings of physical bullion may be restricted or are too cumbersome to handle, maintain and secure. The role of Central Fund is more thoroughly described on page 1.
Net assets decreased by $1,461.8 million or 26.8% during the year. The decrease in net assets was primarily attributable to the change in unrealized appreciation of holdings during the year which resulted from decreased gold and silver prices at October 31, 2013 (see below). Expenses incurred during the year and the payment of the annual U.S. $0.01 Class A share dividend at year end also contributed, though nominally, to the decrease in net assets.
During fiscal 2013, the net asset value per Class A share, as reported in U.S. dollars, decreased by 26.8% from $21.40 to $15.66. Gold prices decreased by 23.0% and silver prices decreased by 31.2% during the fiscal year. The net asset value per Class A share, as reported in Cdn. dollars, while subject to the same factors described above, decreased by a lesser rate of 23.7%, from $21.39 to $16.33 primarily due to a 4.3% increase in the value of the U.S. dollar relative to the Canadian dollar.
Expenses as a percentage of the average of the month-end net assets during the 2013 fiscal year were 0.32% compared to 0.31% in fiscal 2012.
Securities regulatory authorities require that a detailed analysis of Central Fund's results be provided in a “Management's Discussion and Analysis of Financial Condition and Results of Operations”. Since Central Fund has an Administrator and is a passive holding company with no operations or employees, a document entitled “Management’s Discussion and Analysis” (“MD&A”), included herein on pages 17 to 24 inclusive, is provided by Central Fund’s Officers to meet regulatory requirements.
Gold and silver have a long demonstrated history as monetary instruments, officially and unofficially. Gold and silver derive intrinsic value from their unique characteristics of scarcity, consistency of quality, durability, resistance to corrosion, and convenience of use. They also provide a strong alternative to fiat currencies which have demonstrated ever decreasing purchasing power. An ounce of gold or silver is a physical asset, not a negotiable or renegotiable promise, which most closely fits the true definition of “money” as a recognized medium of exchange and a store of value.
Prudence and history suggest that a portion of everyone's savings should be invested and held in physical gold and silver, or their secure share equivalent, as insurance for one’s own ultimate financial and economic well-being.
| 2 |
Upon this philosophical foundation, Central Fund now enters its 53rd year since inception and its 31st year of stewardship since its conversion in 1983 to “The Sound Monetary Fund”. Central Fund holds only unencumbered, segregated, long-term, passive holdings of true money in the form of gold and silver bullion. Central Fund continues to fulfill its mandate of providing a sound, secure, low-cost, convenient, exchange-tradable monetary alternative for conservative investors in its role as "The Sound Monetary Fund".
| Respectfully submitted, | |
| on behalf of the Board of Directors | |
| “J.C. Stefan Spicer” | |
| December 9, 2013 | J.C. Stefan Spicer, President & CEO |
| 3 |
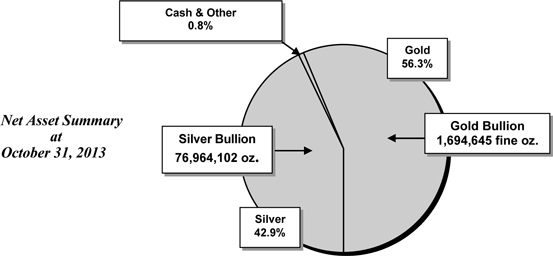
| Comparative Net Asset Summary | As at October 31, 2012 | |||||||||||||||||||||||
| 2013 | 2012 | 2011 | ||||||||||||||||||||||
| U.S.$ | Cdn.$ | U.S.$ | Cdn.$ | U.S.$ | Cdn.$ | |||||||||||||||||||
| Total net assets (in millions) | $ | 3,984.6 | 4,155.5 | 5,446.4 | 5,444.2 | 5,620.9 | 5,584.3 | |||||||||||||||||
| Net asset value per Class A share | $ | 15.66 | 16.33 | 21.40 | 21.39 | 22.09 | 21.95 | |||||||||||||||||
| Net assets: | ||||||||||||||||||||||||
| Gold bullion | 56.3 | % | 53.5 | % | 51.9 | % | ||||||||||||||||||
| Silver bullion | 42.9 | % | 45.6 | % | 46.9 | % | ||||||||||||||||||
| Cash & other | 0.8 | % | 0.9 | % | 1.2 | % | ||||||||||||||||||
| 100.0 | % | 100.0 | % | 100.0 | % | |||||||||||||||||||
| Gold – per fine ounce | U.S. $ | 1,324.00 | 1,719.00 | 1,722.00 | ||||||||||||||||||||
| Silver – per ounce | U.S. $ | 22.20 | 32.28 | 34.24 | ||||||||||||||||||||
| Exchange Rate $1.00 U.S. = Cdn. | $ | 1.0429 | 0.9996 | 0.9935 | ||||||||||||||||||||
| 4 |
Management's Responsibility for Financial Reporting and Effectiveness of Internal Control over Financial Reporting
RESPONSIBILITY FOR FINANCIAL REPORTING
The accompanying financial statements of Central Fund of Canada Limited (the “Company” or “Central Fund”) and all of the information in this Annual Report are the responsibility of the senior executive officers (the “Senior Officers”), and have been approved by the Board of Directors (the “Board”) and its Audit Committee.Any references to the term management in this annual report relate to the Senior Officers.
The financial statements have been prepared by the Senior Officers in accordance with Canadian generally accepted accounting principles. When alternative accounting methods exist, the Senior Officers have chosen those they deem to be most appropriate in the circumstances. Financial statements include certain amounts based on estimates and judgments. The Senior Officers have determined such amounts on a reasonable basis in order to ensure that the financial statements are presented fairly, in all material respects. The Senior Officers have prepared the financial information presented elsewhere in the Annual Report and have ensured that it is consistent with that in the financial statements.
Central Fund maintains systems of internal accounting and backup of records as well as high quality administrative and regulatory compliance controls for a reasonable cost. Hard copies of transactions and monthly statements are retained in the Company's files. Such systems are designed to provide reasonable assurance that the financial information is relevant, reliable, retrievable and accurate and that the Company's assets are appropriately accounted for and adequately safeguarded.
The Board is responsible for ensuring that the Senior Officers fulfil their responsibilities for financial reporting and is ultimately responsible for reviewing and approving the financial statements. The Board carries out this responsibility principally through the Audit Committee.
The Audit Committee appointed by the Board consists solely of non-related and independent directors. In accordance with its charter, the Committee meets at least annually with the Senior Officers and the external auditors to discuss: the independence of the external auditors; the scope of the annual audit; the audit plan; access granted to the Company’s records; co-operation of the Senior Officers in the audit and review function; the need for an internal audit function; the financial reporting process; related internal controls; the quality and adequacy of the Company’s or Administrator’s accounting and financial personnel; and other resources and financial risk management to satisfy itself that each party is properly discharging its responsibilities. The Committee also reviews the Annual Report, the Annual Information Form, the annual and quarterly financial statements, Management’s Discussion and Analysis and the external auditors' report. The Committee reports its findings to the Board for consideration when approving the financial statements for issuance to the shareholders. The Committee also reviews the external auditors’ remuneration and considers, for review by the Board and approval by the shareholders, the re-appointment and terms of engagement and, in appropriate circumstances, the replacement of the external auditors. It also pre-approves all audit and non-audit services proposed to be provided by the external auditors. The charter of the Committee is set out on Central Fund’s website.
The financial statements have been audited by Ernst & Young LLP, the external auditors, in accordance with Canadian generally accepted auditing standards and the standards of the Public Company Accounting Oversight Board (United States) on behalf of the shareholders. Ernst & Young LLP has full and free access to the Committee. Ernst & Young LLP has audited Central Fund of Canada Limited’s internal control over financial reporting based on criteria established in “Internal Control-Integrated Framework” issued by the Committee of Sponsoring Organizations of the Treadway Commission 1992 framework (the COSO criteria).
| 5 |
RESPONSIBILITY FOR INTERNAL CONTROL OVER FINANCIAL REPORTING
The Senior Officers are responsible for establishing and maintaining an adequate system of internal control over financial reporting. Internal control over financial reporting is a process designed to provide reasonable assurance regarding the reliability of financial reporting and the preparation of the financial statements for external purposes in accordance with generally accepted accounting principles.
The Senior Officers conducted an evaluation of the effectiveness of the system of internal control over financial reporting based on the framework in “Internal Control – Integrated Framework” issued by the Committee of Sponsoring Organizations of the Treadway Commission 1992 framework (the COSO criteria). Based on this evaluation, the Senior Officers concluded that the Company’s system of internal control over financial reporting was effective as at October 31, 2013.
| “J.C. Stefan Spicer” | |
| President | |
| December 9, 2013 | |
| “Catherine A. Spackman” | |
| Treasurer |
| 6 |
Statements of Net Assets
(expressed in U.S. dollars)
| As at October 31, | ||||||||
| 2013 | 2012 | |||||||
| Net assets: | ||||||||
| Gold bullion, at market (Note 2) | $ | 2,243,709,127 | 2,913,093,648 | |||||
| Silver bullion, at market (Note 2) | 1,708,603,089 | 2,484,401,248 | ||||||
| Cash and short-term deposits (Note 3) | 36,475,223 | 55,284,208 | ||||||
| Interest receivable and other | 324,457 | 103,931 | ||||||
| 3,989,111,896 | 5,452,883,035 | |||||||
| Dividends payable (Note 4) | (2,544,327 | ) | (2,544,327 | ) | ||||
| Accrued liabilities (Note 5) | (1,992,138 | ) | (3,917,068 | ) | ||||
| Net assets representing shareholders’ equity | $ | 3,984,575,431 | 5,446,421,640 | |||||
| Represented by: | ||||||||
| Capital stock (Note 4) | $ | 2,419,790,136 | 2,419,790,136 | |||||
| Retained earnings inclusive of unrealized appreciation of holdings | 1,564,785,295 | 3,026,631,504 | ||||||
| $ | 3,984,575,431 | 5,446,421,640 | ||||||
| Net asset value per share (Notes 1(c)(ii) and 8): | ||||||||
| Class A shares | $ | 15.66 | 21.40 | |||||
| Common shares | $ | 12.66 | 18.40 | |||||
| Exchange rate at year end: U.S. $1.00 = Cdn. | $ | 1.0429 | 0.9996 | |||||
| Net asset value per share expressed in Canadian dollars | ||||||||
| Class A shares | $ | 16.33 | 21.39 | |||||
| Common shares | $ | 13.20 | 18.40 | |||||
See accompanying notes to financial statements.
On behalf of the Board:
| “Bruce D. Heagle” | “Philip M. Spicer” |
| Director | Director |
| 7 |
Statements of Income (Loss)
(expressed in U.S. dollars)
| Years ended October 31, | ||||||||||||
| 2013 | 2012 | 2011 | ||||||||||
| Income (loss): | ||||||||||||
| Interest | $ | 114,300 | 159,806 | 198,290 | ||||||||
| Change in unrealized appreciation of holdings | (1,445,195,620 | ) | (155,934,640 | ) | 1,387,096,842 | |||||||
| Total income (loss) | (1,445,081,320 | ) | (155,774,834 | ) | 1,387,295,132 | |||||||
| Expenses: | ||||||||||||
| Administration fees (Note 5) | 8,045,576 | 9,287,471 | 9,217,784 | |||||||||
| Safekeeping, insurance and bank charges | 5,215,349 | 6,071,095 | 5,815,673 | |||||||||
| Shareholder information | 247,898 | 227,853 | 216,766 | |||||||||
| Directors’ fees and expenses | 220,042 | 213,221 | 167,106 | |||||||||
| Audit and related regulatory fees | 198,585 | 167,049 | 129,486 | |||||||||
| Stock exchange fees | 149,914 | 152,393 | 152,369 | |||||||||
| Registrar and transfer agent fees | 74,595 | 92,329 | 78,756 | |||||||||
| Legal fees (Note 5) | 68,404 | 111,150 | 118,428 | |||||||||
| Miscellaneous | 199 | 47 | 867 | |||||||||
| Total expenses | 14,220,562 | 16,322,608 | 15,897,235 | |||||||||
| Net income (loss) inclusive of the change in unrealized appreciation of holdings | $ | (1,459,301,882 | ) | (172,097,442 | ) | 1,371,397,897 | ||||||
| Basic and diluted net income (loss) per share (Note 1 (c)(i)): | ||||||||||||
| Class A shares | $ | (5.74 | ) | (0.68 | ) | 5.54 | ||||||
| Common shares | $ | (5.75 | ) | (0.69 | ) | 5.53 | ||||||
See accompanying notes to financial statements
Statements of Changes in Net Assets
(expressed in U.S. dollars)
| Years ended October 31, | ||||||||||||
| 2013 | 2012 | 2011 | ||||||||||
| Net assets at beginning of year | $ | 5,446,421,640 | 5,620,875,881 | 3,906,765,691 | ||||||||
| Add (deduct): | ||||||||||||
| Net income (loss) inclusive of the change in unrealized appreciation of holdings | (1,459,301,882 | ) | (172,097,442 | ) | 1,371,397,897 | |||||||
| Increase in Class A capital (Note 4) | 0 | 187,528 | 345,256,620 | |||||||||
| Dividends on Class A shares | (2,544,327 | ) | (2,544,327 | ) | (2,544,327 | ) | ||||||
| Increase (decrease) in net assets during the year | (1,461,846,209 | ) | (174,454,241 | ) | 1,714,110,190 | |||||||
| Net assets at end of year | $ | 3,984,575,431 | 5,446,421,640 | 5,620,875,881 | ||||||||
See accompanying notes to financial statements.
| 8 |
Statements of Shareholders’ Equity
(expressed in U.S. dollars)
| Years ended October 31, | ||||||||||||
| 2013 | 2012 | 2011 | ||||||||||
| Capital stock (Note 4): | ||||||||||||
| 254,432,713 Class A shares issued | $ | 2,419,770,678 | 2,419,770,678 | 2,419,583,150 | ||||||||
| 40,000 Common shares issued | 19,458 | 19,458 | 19,458 | |||||||||
| 2,419,790,136 | 2,419,790,136 | 2,419,602,608 | ||||||||||
| Retained earnings: | ||||||||||||
| Balance at beginning of year | 3,026,631,504 | 3,201,273,273 | 1,832,419,703 | |||||||||
| Net income (loss) inclusive of the change in unrealized appreciation of holdings | (1,459,301,882 | ) | (172,097,442 | ) | 1,371,397,897 | |||||||
| Dividends on Class A shares | (2,544,327 | ) | (2,544,327 | ) | (2,544,327 | ) | ||||||
| Balance at end of year | 1,564,785,295 | 3,026,631,504 | 3,201,273,273 | |||||||||
| Shareholders’ equity | $ | 3,984,575,431 | 5,446,421,640 | 5,620,875,881 | ||||||||
See accompanying notes to financial statements.
| Notes to Financial Statements |
| October 31, 2013, 2012 and 2011 |
| (amounts expressed in U.S. dollars unless otherwise stated) |
| 1. | Summary of significant accounting policies: |
| Central Fund of Canada Limited (“Central Fund” or the “Company”) was incorporated under the Business Corporations Act, 1961 (Ontario), and was continued under the Business Corporations Act (Alberta) on April 5, 1990. The Company is a specialized, passive holding company with almost all of its assets held in gold and silver bullion. |
| The Company's accounting policies, which conform with Canadian generally accepted accounting principles (“GAAP”), are summarized below: |
| (a) | Foreign currency exchange translation: |
| Canadian dollar cash deposits are translated at the rates of exchange prevailing at year end. Any difference between the year-end exchange rate and the exchange rate at the time such deposits were acquired is recorded in the Statements of Income (Loss) as a foreign currency exchange gain or loss. Expenses incurred in Canadian dollars are translated at the rates of exchange prevailing when the transaction occurs. |
| (b) | Valuation of gold and silver bullion holdings: |
| Bullion is valued at market value. Gold bullion is valued at the afternoon London fixing and silver bullion is valued at the daily London fixing. On days when the London bullion market is closed, gold and silver will be valued using the New York spot price on the day of valuation. On days when both the London bullion market and the New York market are closed, gold and silver will be valued using the previous day’s London fixings. |
| The change in unrealized appreciation (depreciation) of gold and silver bullion holdings represents the change in the difference between the market value and cost of gold and silver bullion holdings and is recorded in the Statements of Income (Loss) in accordance with the Canadian Institute of Chartered Accountants Accounting Guideline 18, Investment Companies (“AcG-18”). |
| 9 |
| Transactions are accounted for on the trade date. Realized gains and losses and unrealized appreciation and depreciation are calculated on the average cost basis. |
| (c) | Per share amounts: |
| (i) | Net income or loss per share: |
| The calculation of net income or loss per share is based on the weighted average number of Class A and Common shares outstanding during the year. The net income or loss per Common share is reduced or increased, as applicable, by U.S. $0.01 as the Class A shares are entitled to receive a U.S. $0.01 per share preferential non-cumulative annual dividend. The remaining net income or loss for the year is attributed equally to each Class A share and Common share, without preference or distinction. |
| (ii) | Net asset value per share: |
| The calculation of net asset value per share is based on the number of Class A and Common shares outstanding at the end of the year and gives effect to the Class A shares' entitlement to U.S. $3.00 per share on liquidation, before any remaining net assets are attributed equally to each Class A share and Common share then outstanding. |
| (d) | Future accounting policy: |
| On December 12, 2011, the Accounting Standards Board of Canada decided to further extend the deferral of International Financial Reporting Standards (“IFRS”) adoption for investment companies for an additional year. Investment companies will now be required to mandatorily adopt IFRS for interim and annual financial statements for fiscal periods beginning on or after January 1, 2014. |
| The Company is reviewing the key elements within IFRS that may result in a change in accounting policies that will impact its financial statements and accompanying note disclosures. The assessment plan being implemented by the Company includes a position paper which highlights the material standards that need to be addressed under IFRS and preparation of an opening balance sheet and financial statements that incorporate IFRS accounting standards and policies. The major areas of focus identified by the assessment include: first year implementation decisions; statement of cash flows; classification of redeemable Class A shares; income taxes; increased note disclosure; and accounting for changes in unrealized appreciation of holdings. The assessment is addressing the impact on the Company’s accounting system and internal controls required to report under IFRS beginning on the implementation date. The Company will continue with the assessment and implementation in preparation for its initial filing under IFRS expected for the fiscal year beginning November 1, 2014. |
| 10 |
| 2. | Gold and silver bullion: |
Details of gold and silver bullion holdings are as follows:
| October 31: | 2013 | 2012 | 2011 | |||||||||||
| Gold bullion: | ||||||||||||||
| Fine ounces | - 400 oz. bars | 1,673,329 | 1,673,329 | 1,673,329 | ||||||||||
| - 100 oz. bars | 12,889 | 12,889 | 12,889 | |||||||||||
| - bank certificates | 8,427 | 8,427 | 8,427 | |||||||||||
| Total fine ounces | 1,694,645 | 1,694,645 | 1,694,645 | |||||||||||
| Average Cost | - per fine ounce | $ | 799.66 | 799.66 | 799.66 | |||||||||
| Cost | $ | 1,355,145,634 | 1,355,145,634 | 1,355,145,634 | ||||||||||
| Market | - per fine ounce | $ | 1,324.00 | 1,719.00 | 1,722.00 | |||||||||
| Market value | $ | 2,243,709,127 | 2,913,093,648 | 2,918,177,581 | ||||||||||
| Silver bullion: | ||||||||||||||
| Ounces | - 1,000 oz. bars | 76,708,551 | 76,708,551 | 76,708,551 | ||||||||||
| - bank certificates | 255,551 | 255,551 | 255,551 | |||||||||||
| Total ounces | 76,964,102 | 76,964,102 | 76,964,102 | |||||||||||
| Average Cost | - per ounce | $ | 12.53 | 12.53 | 12.53 | |||||||||
| Cost | $ | 964,091,381 | 964,091,381 | 964,091,381 | ||||||||||
| Market | - per ounce | $ | 22.20 | 32.28 | 34.24 | |||||||||
| Market value | $ | 1,708,603,089 | 2,484,401,248 | 2,635,250,890 | ||||||||||
| 3. | Cash and short-term deposits: |
As at October 31, 2013, the Company held one Canadian dollar flexible GIC deposit with a Schedule 1 Canadian bank in the amount of $95,890 (Cdn. $100,000) bearing interest at a rate of 1.20% per annum with a maturity date of January 29, 2014. As at October 31, 2013, cash deposits of $36,379,333 were held in a Canadian bank at a variable interest rate of 0.25% per annum.
As at October 31, 2012, the Company held one Canadian dollar flexible GIC deposit with a Schedule 1 Canadian bank in the amount of $300,120 (Cdn. $300,000) bearing interest at a rate of 1.15% per annum with a maturity date of May 16, 2013. As at October 31, 2012, cash deposits of $54,984,088 were held in a Canadian bank at a variable interest rate of 0.25% per annum.
| 4. | Capital stock: |
| The authorized share capital consists of an unlimited number of Class A non-voting shares without nominal or par value and 50,000 Common shares without nominal or par value. There were 254,432,713 Class A shares and 40,000 Common shares issued and outstanding at October 31, 2013. |
| Since October 1989, holders of the Company's Class A shares have had the option to require the Company to redeem their Class A shares on the last day of each fiscal quarter of the Company (each a “Retraction Date”) for 80% of the Company's net asset value per Class A share on the Retraction Date (as calculated at the relevant date and in accordance with note 1(c)(ii)). Class A shareholders who wish to exercise this retraction right must submit their written redemption request at least 90 days prior to the desired Retraction Date. Since adoption of this redemption feature, no shareholders have submitted redemption requests. The Articles of the Company provide for the suspension of redemptions during specified unusual circumstances, such as suspensions of normal trading on certain stock exchanges or the London bullion market, or to comply with applicable laws or regulations. |
| 11 |
| The holders of the Class A shares are entitled to receive a preferential, non-cumulative annual dividend of U.S. $0.01 per share. Any further dividends declared are to be paid rateably on the Class A shares and Common shares then outstanding, without preference or distinction. The Company has adopted a policy that any annual dividends declared shall be paid to shareholders of record at the close of business each October 31, with payment of such dividends being made during November of the same year. |
| The Class A shares are entitled to U.S. $3.00 per share on liquidation, before any remaining net assets are attributed equally to each Class A share and Common share then outstanding. |
| On April 6, 2011, the Company, through a public offering, issued 16,150,000 Class A shares for proceeds of $345,739,200 net of underwriting fees of $14,405,800. Costs relating to this public offering were $412,472 (estimated at $600,000 at October 31, 2011 and adjusted to actual during fiscal 2012) and net proceeds were $345,326,728. The Company used the net proceeds from this public offering to purchase 190,410 fine ounces of gold at a cost of $272,304,500 and 1,755,000 ounces of silver at a cost of $66,213,500, all in physical bar form. The balance of $6,808,728 was retained by the Company in interest-bearing cash deposits for working capital purposes. |
The stated capital and recorded capital of the Company as at and for the years ended October 31, 2013, 2012 and 2011 are as follows:
| 2013 | 2012 | 2011 | ||||||||||
| Stated capital | ||||||||||||
| Class A shares 254,432,713 | $ | 2,434,715,140 | 2,434,715,140 | 2,434,715,140 | ||||||||
| Share issue costs | (14,944,462 | ) | (14,944,462 | ) | (15,131,990 | ) | ||||||
| Recorded capital - Class A shares | 2,419,770,678 | 2,419,770,678 | 2,419,583,150 | |||||||||
| - 40,000 Common shares | 19,458 | 19,458 | 19,458 | |||||||||
| Capital stock | $ | 2,419,790,136 | 2,419,790,136 | 2,419,602,608 | ||||||||
| Weighted average Class A and Common shares outstanding | 254,432,713 | 254,432,713 | 247,530,247 | |||||||||
| 5. | Related party transactions and fees: |
Central Fund has no employees. It is party to an Administrative and Consulting Agreement with The Central Group Alberta Ltd., which is related to the Company through four of its officers and directors. The Central Group Alberta Ltd., which acts as Administrator, has operating offices with employees, advisors and consultants who provide administrative and consulting services to the Company. For such services, the Company pays an administrative and consulting fee, payable monthly, until at least October 31, 2015, at an annual rate of: 0.30% on the first $400 million of total net assets; 0.20% on the next $600 million of total net assets; and 0.15% on total net assets exceeding one billion dollars.
Included in accrued liabilities at October 31, 2013, is $601,725 (2012: $793,593) which relates to the October administration fee payable to the Administrator.
For the year ended October 31, 2013, the Company incurred fees totaling $57,421 (2012: $96,369, 2011: $101,673) to legal firms of which one of the Company’s officers (and director) is a partner and one of the Company’s officers was Counsel or principal, and $8,045,576 (2012: $9,287,471, 2011: $9,217,784) to the Administrator, The Central Group Alberta Ltd. The Board of Directors is of the opinion that these services were undertaken under the same or better terms and conditions as services with unrelated parties.
| 6. | Income taxes: |
Although Central Fund is not a mutual fund as designated by securities regulators, the Company qualifies and intends to continue to qualify as a mutual fund corporation under theIncome Tax Act (Canada) for capital gains distributions and redemption purposes only. As a result, and after deduction of issue costs in computing taxable income, the Company does not anticipate that it will be subject to any material non-refundable income tax liability.
| 12 |
The Company has net capital losses of $1,765,000 available to offset future net capital gains realized for which no benefit has been recognized in these financial statements.
The Company is a long-term, passive holder of gold and silver bullion and believes that, as a mutual fund corporation for capital gains distributions and redemption purposes only, should realized gains upon a disposition of bullion holdings arise in the future, these gains should be treated as capital gains for tax purposes and should be distributable as capital gains to shareholders. Deferred income tax liabilities resulting from unrealized capital appreciation of holdings are offset by the refundable mechanisms available to the Company. The Canada Revenue Agency has, however, expressed its opinion that gains (or losses) of mutual fund trusts resulting from transactions in commodities should generally be treated for tax purposes as ordinary income rather than as capital gains, although the treatment in each particular case remains a question of fact to be determined having regard to all the circumstances.
| 7. | Management of financial risks: |
The Company has risk management policies and procedures in place to identify risks related to financial instruments and physical assets. The objectives of these policies and procedures are to identify and mitigate risk. The Company’s compliance with these policies and procedures is monitored by the Senior Executive Officers, the Audit Committee and the Board of Directors of the Company. Market fluctuations are unpredictable and outside the control of the Company. New risk factors may emerge from time to time and it is not possible for the Company to predict all such risk factors. The market price for the Class A shares may be above or below the net asset value per Class A share at any time due to market conditions.
Price risk
Price risk is the risk that the price of a security or physical asset may decline. It is possible to calculate the impact that changes in the market prices of gold and silver bullion will have on the Company’s net asset value per Class A share both in U.S. dollars and Cdn. dollars. Assuming as a constant exchange rate, the rate which existed on October 31, 2013 of Cdn. $1.0429 for each U.S. dollar together with the holdings of gold and silver bullion which existed on that date, a 10% change in the price of gold would increase or decrease the net asset value per Class A share by approximately $0.88 per share or Cdn. $0.92 per share. A 10% change in the price of silver would increase or decrease the net asset value per Class A share by approximately $0.67 per share or Cdn. $0.70 per Class A share. If both gold and silver prices were to change by 10% simultaneously in the same direction, the net asset value per Class A share would increase or decrease by approximately $1.55 per share or Cdn. $1.62 per share.
Currency risk
Currency risk is the risk that the value of an asset or liability will fluctuate due to changes in foreign currency exchange rates.
When expressed in U.S. dollars, Central Fund's net asset value per Class A share is largely unaffected by changes in the U.S./Cdn. dollar exchange rate due to the fact that nearly all of Central Fund's net assets are priced in U.S. dollars. For this same reason, an increase or decrease in the value of the U.S. dollar relative to the Cdn. dollar would change the net asset value per Class A share as expressed in Cdn. dollars in the same direction by approximately the same percentage change in the value of the U.S. dollar.
Due to the limited value of transactions initiated in Cdn. dollars throughout the year, a strengthening or weakening of the Cdn. dollar relative to the U.S. dollar applied to balances outstanding at October 31, 2013 would not have had any material impact on the net loss for the year ended October 31, 2013, assuming that all other variables, in particular interest rates, remained constant.
Credit risk
Credit risk on short-term deposits is the risk of loss occurring as a result of the default of an issuer on its obligation to Central Fund. Credit risk is monitored on an ongoing basis and is managed by the Company dealing only with issuers that are believed to be creditworthy.
Liquidity risk
Liquidity risk is the risk that the Company will not be able to generate adequate cash resources to fulfill its payment obligations. The Administrator regards all of Central Fund’s assets as liquid. Central Fund traditionally has maintained sufficient cash reserves to enable it to pay expenses and dividends on its Class A shares. Furthermore, 99.2% of its net assets are in the form of gold and silver bullion which are readily marketable.
| 13 |
| 8. | Financial highlights: |
| Years ended October 31, | ||||||||||||||||||||
| 2013 | 2012 | 2011 | 2010 | 2009 | ||||||||||||||||
| Class A per share performance: | ||||||||||||||||||||
| Net asset value per share at beginning of year | $ | 21.40 | $ | 22.09 | $ | 16.39 | $ | 12.15 | $ | 7.90 | ||||||||||
| Increase (decrease): | ||||||||||||||||||||
| Net loss before the change in unrealized appreciation of holdings | (0.06 | ) | (0.07 | ) | (0.06 | ) | (0.04 | ) | (0.03 | ) | ||||||||||
| Change in unrealized appreciation of holdings - gold | (2.63 | ) | (0.02 | ) | 2.50 | 1.89 | 1.91 | |||||||||||||
| - silver | (3.05 | ) | (0.59 | ) | 3.10 | 2.35 | 2.29 | |||||||||||||
| Total increase (decrease) (1) | (5.74 | ) | (0.68 | ) | 5.54 | 4.20 | 4.17 | |||||||||||||
| Net asset value per share at end of year | $ | 15.66 | $ | 21.40 | $ | 22.09 | $ | 16.39 | $ | 12.15 | ||||||||||
| Total return for year | (26.8 | )% | (3.1 | )% | 34.8 | % | 34.9 | % | 53.8 | % | ||||||||||
| Percentages and supplemental data: | ||||||||||||||||||||
| Ratio as a percentage of average net assets(2): | ||||||||||||||||||||
| Expenses | 0.32 | % | 0.31 | % | 0.30 | % | 0.31 | % | 0.33 | % | ||||||||||
| Net loss before the change in unrealized appreciation of holdings | 0.31 | % | 0.31 | % | 0.30 | % | 0.29 | % | 0.32 | % | ||||||||||
(1) This table is not meant to be a reconciliation of beginning to end of year net asset value per share.
(2) The ratios are based on the weighted average number of shares during the year.
| 9. | Capital stewardship: |
The capital of the Company is represented by the issued and outstanding Class A and Common shares and the retained earnings, which comprises the net asset value attributable to participating shareholders. The Board of Directors direct the Administrator to administer the capital of the Company in accordance with the Company’s stated objectives and restrictions, as stipulated in the Articles of Incorporation as amended, while maintaining sufficient cash to pay the expenses of maintaining the Company and to meet demands for redemption (if any). The Company does not have any externally imposed capital requirements.
| 10. | Canadian and United States generally accepted accounting principles: |
The accounting policies followed in these financial statements, which are in accordance with Canadian generally accepted accounting principles (“GAAP”), are consistent with those that would apply under U.S. GAAP except for the following classification difference in the Statements of Net Assets. This U.S. GAAP classification difference has no effect on the reported net asset value per Class A share.
Subject to the terms and conditions described in Note 4 to these financial statements, the Class A shares are redeemable at the option of the shareholder. This redemption feature is the basis for the U.S. GAAP classification difference. The likelihood or probability of such redemption is not considered, nor is the fact that the Class A shares participate fully and proportionately with the Common shares in changes in the value of the equity ownership of the Company. Since adoption of this redemption feature in 1989, no holders of Class A shares have tendered their shares to the Company for redemption.
Under Canadian GAAP, the Class A shares are considered to be permanent equity and are classified in shareholders’ equity in the Statements of Net Assets. Under U.S. GAAP, the redemption value of these shares is calculated in accordance with the provisions of the redemption feature and classified outside of shareholders’ equity as mezzanine equity for each reporting period, with changes in the redemption value from the beginning of each reporting period to the end of that reporting period being charged (or credited) to retained earnings.
| 14 |
INDEPENDENT AUDITORS’ REPORT OF REGISTERED PUBLIC ACCOUNTING FIRM
To the Shareholders of Central Fund of Canada Limited
We have audited the accompanying financial statements of Central Fund of Canada Limited (the “Company”), which comprise the Statements of Net Assets as at October 31, 2013 and 2012, and the Statements of Changes in Net Assets, Income (Loss) and Shareholders' Equity for each of the years in the three-year period ended October 31, 2013, and a summary of significant accounting policies and other explanatory information.
Management’s Responsibility for the Financial Statements
Management is responsible for the preparation and fair presentation of these financial statements in accordance with Canadian generally accepted accounting principles, and for such internal control as management determines is necessary to enable the preparation of financial statements that are free from material misstatement, whether due to fraud or error.
Auditors’ Responsibility
Our responsibility is to express an opinion on these financial statements based on our audits. We conducted our audits in accordance with Canadian generally accepted auditing standards and the standards of the Public Company Accounting Oversight Board (United States). Those standards require that we comply with ethical requirements and plan and perform the audit to obtain reasonable assurance about whether the financial statements are free from material misstatement.
An audit involves performing procedures to obtain audit evidence about the amounts and disclosures in the financial statements. The procedures selected depend on the auditors’ judgment, including the assessment of the risks of material misstatement of the financial statements, whether due to fraud or error. In making those risk assessments, the auditors consider internal control relevant to the entity's preparation and fair presentation of the financial statements in order to design audit procedures that are appropriate in the circumstances. An audit includes examining, on a test basis, evidence supporting the amounts and disclosures in the financial statements. An audit also includes evaluating the appropriateness of accounting policies used and the reasonableness of accounting estimates made by management, as well as evaluating the overall presentation of the financial statements.
We believe that the audit evidence we have obtained in our audits is sufficient and appropriate to provide a basis for our audit opinion.
Opinion
In our opinion, the financial statements present fairly, in all material respects, the financial position of the Company as at October 31, 2013 and 2012, and the results of its operations and the changes in its net assets for each of the years in the three-year period ended October 31, 2013 in accordance with Canadian generally accepted accounting principles.
Other Matter
We have also audited, in accordance with the standards of the Public Company Accounting Oversight Board (United States), the Company’s internal control over financial reporting as of October 31, 2013, based on the criteria established in “Internal Control — Integrated Framework” issued by the Committee of Sponsoring Organizations of the Treadway Commission 1992 framework (the COSO criteria) and our report dated December 9, 2013 expressed an unqualified opinion on the Company’s internal control over financial reporting.
| “Ernst & Young LLP” | |
| Toronto, Canada | |
| December 9, 2013 | Chartered Accountants |
| Licensed Public Accountants |
| 15 |
INDEPENDENT AUDITORS’ REPORT OF REGISTERED PUBLIC ACCOUNTING FIRM
To the Shareholders of Central Fund of Canada Limited
We have audited Central Fund of Canada Limited’s internal control over financial reporting as of October 31, 2013, based on criteria established in “Internal Control-Integrated Framework” issued by the Committee of Sponsoring Organizations of the Treadway Commission 1992 framework (the “COSO criteria”). Central Fund of Canada Limited’s management is responsible for maintaining effective internal control over financial reporting and for its assessment of the effectiveness of internal control over financial reporting included in this Annual Report. Our responsibility is to express an opinion on the company’s internal control over financial reporting based on our audit.
We conducted our audit in accordance with the standards of the Public Company Accounting Oversight Board (United States). Those standards require that we plan and perform the audit to obtain reasonable assurance about whether effective internal control over financial reporting was maintained in all material respects. Our audit included obtaining an understanding of internal control over financial reporting, assessing the risk that a material weakness exists, testing and evaluating the design and operating effectiveness of internal control based on the assessed risk, and performing such other procedures as we considered necessary in the circumstances. We believe that our audit provides a reasonable basis for our opinion.
A company’s internal control over financial reporting is a process designed to provide reasonable assurance regarding the reliability of financial reporting and the preparation of financial statements for external purposes in accordance with generally accepted accounting principles. A company’s internal control over financial reporting includes those policies and procedures that (1) pertain to the maintenance of records that, in reasonable detail, accurately and fairly reflect the transactions and dispositions of the assets of the company; (2) provide reasonable assurance that transactions are recorded as necessary to permit preparation of financial statements in accordance with generally accepted accounting principles, and that receipts and expenditures of the company are being made only in accordance with authorizations of senior officers and directors of the company; and (3) provide reasonable assurance regarding prevention or timely detection of unauthorized acquisition, use, or disposition of the company’s assets that could have a material effect on the financial statements.
Because of its inherent limitations, internal control over financial reporting may not prevent or detect misstatements. Also, projections of any evaluation of effectiveness to future periods are subject to the risk that controls may become inadequate because of changes in conditions, or that the degree of compliance with the policies or procedures may deteriorate.
In our opinion, Central Fund of Canada Limited maintained, in all material respects, effective internal control over financial reporting as of October 31, 2013, based on the COSO criteria.
We also have audited, in accordance with the standards of the Public Company Accounting Oversight Board (United States), the Statements of Net Assets of Central Fund of Canada Limited as of October 31, 2013 and 2012, and the related Statements of Income (Loss), Changes in Net Assets and Shareholders’ Equity for each of the years in the three-year period ended October 31, 2013 and our report dated December 9, 2013 expressed an unqualified opinion thereon.
| “Ernst & Young LLP” | |
| Toronto, Canada | Chartered Accountants |
| December 9, 2013 | Licensed Public Accountants |
| 16 |
Management's Discussion and Analysis (“MD&A”) of December 9, 2013
The following discussion is based on the financial statements of Central Fund of Canada Limited (“Central Fund” or the “Company”) which are prepared and reported in U.S. dollars in accordance with Canadian generally accepted accounting principles, otherwise known as Canadian GAAP, including the Canadian Institute of Chartered Accountants Accounting Guideline 18, Investment Companies (“AcG-18”). These principles are substantially the same as United States’ generally accepted accounting principles. Notes to the financial statements on pages 9 to 14 inclusive should be referred to as supplementary information to this discussion and analysis.
Administrator, Administrative and Consulting Fees
Central Fund has no employees. It is party to an Administrative and Consulting Agreement with The Central Group Alberta Ltd., which is related to the Company through four of its Officers and Directors. The Central Group Alberta Ltd., which acts as Administrator, has operating offices with employees, advisors and consultants who provide administrative and consulting services to the Company. For such services, the Company pays an administrative and consulting fee, payable monthly, until at least October 31, 2015, at an annual rate of: 0.30% on the first $400 million of total net assets; 0.20% on the next $600 million of total net assets; and 0.15% on total net assets exceeding one billion dollars.
Financial Results - Changes in Net Assets
Changes in net assets, as reported in U.S. dollars from period to period, are primarily the result of share offerings, the changing market prices of gold and silver, and the proportion of each held by the Company. The following table summarizes the changes in net assets in U.S. dollars, gold and silver prices, and the exchange rates between U.S. and Cdn. dollars on an annual basis for the past three fiscal years:
| Years ended October 31 | ||||||||||||
| 2013 | 2012 | 2011 | ||||||||||
| U.S.$ | U.S.$ | U.S.$ | ||||||||||
| Change in unrealized appreciation of holdings (in millions) | $ | (1,445.2 | ) | $ | (155.9 | ) | $ | 1,387.1 | ||||
| Net income (loss) for the year inclusive of the change in unrealized appreciation of holdings (in millions) | $ | (1,459.3 | ) | $ | (172.1 | ) | $ | 1,371.4 | ||||
| Net income (loss) per Class A share | $ | (5.74 | ) | $ | (0.68 | ) | $ | 5.54 | ||||
| Total net assets (in millions) | $ | 3,984.6 | $ | 5,446.4 | $ | 5,620.9 | ||||||
| Change in net assets from prior year (in millions) | $ | (1,461.8 | ) | $ | (174.5 | ) | $ | 1,714.1 | ||||
| % change from prior year | (26.8 | )% | (3.1 | )% | 43.9 | % | ||||||
| Change in net assets per Class A share from prior year | $ | (5.74 | ) | $ | (0.69 | ) | $ | 5.70 | ||||
| % change per Class A share from prior year | (26.8 | )% | (3.1 | )% | 34.8 | % | ||||||
| Gold price (U.S. $ per fine ounce) | $ | 1,324.00 | $ | 1,719.00 | $ | 1,722.00 | ||||||
| % change from prior year | (23.0 | )% | (0.2 | )% | 27.9 | % | ||||||
| Silver price (U.S. $ per ounce) | $ | 22.20 | $ | 32.28 | $ | 34.24 | ||||||
| % change from prior year | (31.2 | )% | (5.7 | )% | 42.9 | % | ||||||
| Exchange rate: $1.00 U.S. = Cdn. | $ | 1.0429 | $ | 0.9996 | $ | 0.9935 | ||||||
| % change from prior year | 4.3 | % | 0.6 | % | (2.5 | )% | ||||||
| 17 |
In fiscal 2013, net assets as reported in U.S. dollars decreased by $1,461.8 million or 26.8%. This decrease in net assets was primarily attributable to the change in unrealized appreciation of holdings during the year resulting from decreases in the prices of gold (23.0%) and silver (31.2%). Expenses incurred during the year and the payment of the annual U.S. $0.01 Class A share dividend at year end also contributed, though nominally, to the decrease in net assets.
Though subject to the same effects as described above, net assets reported in Canadian dollars decreased at a lesser rate of 23.7% due to the 4.3% increase in the U.S. dollar relative to the Canadian dollar.
The following table summarizes the changes in net assets in U.S. dollars, gold and silver prices, and the exchange rate between U.S. and Canadian dollars on a quarterly basis for the 2013 fiscal year:
| Quarter ended | ||||||||||||||||
| October 31 | July 31 | April 30 | January 31 | |||||||||||||
| 2013 | ||||||||||||||||
| Change in unrealized appreciation of holdings (in millions) | $ | 190.0 | $ | (606.6 | ) | $ | (917.4 | ) | $ | (111.2 | ) | |||||
| Net income (loss) inclusive of the change in unrealized appreciation of holdings (in millions) | $ | 186.8 | $ | (609.6 | ) | $ | (921.1 | ) | $ | (115.3 | ) | |||||
| Net income (loss) per Class A share inclusive of the change in unrealized appreciation of holdings | $ | 0.73 | $ | (2.40 | ) | $ | (3.62 | ) | $ | (0.45 | ) | |||||
| Total net assets (in millions) | $ | 3,984.6 | $ | 3,800.3 | $ | 4,409.9 | $ | 5,331.1 | ||||||||
| Changes in net assets from prior quarter (in millions) | $ | 184.3 | $ | (609.6 | ) | $ | (921.1 | ) | $ | (115.3 | ) | |||||
| % change from prior quarter | 4.8 | % | (13.8 | )% | (17.3 | )% | (2.1 | )% | ||||||||
| Change in net assets per Class A share from prior quarter | $ | 0.73 | $ | (2.40 | ) | $ | (3.62 | ) | $ | (0.45 | ) | |||||
| % change per Class A share from prior quarter | 4.9 | % | (13.8 | )% | (17.3 | )% | (2.1 | )% | ||||||||
| Gold price | $ | 1,324.00 | $ | 1,314.50 | $ | 1,469.00 | $ | 1,664.75 | ||||||||
| % change from prior quarter | 0.7 | % | (10.5 | )% | (11.8 | )% | (3.2 | )% | ||||||||
| Silver Price | $ | 22.20 | $ | 19.94 | $ | 24.42 | $ | 32.03 | ||||||||
| % change from prior quarter | 11.3 | % | (18.3 | )% | (23.8 | )% | (0.8 | )% | ||||||||
| Exchange rate: $1.00 U.S. = Cdn. | $ | 1.0429 | $ | 1.0287 | $ | 1.0072 | $ | 0.9921 | ||||||||
| % change from prior quarter | 1.4 | % | 2.1 | % | 1.5 | % | (0.8 | )% | ||||||||
In fiscal 2012, net assets as reported in U.S. dollars decreased by $174.5 million or 3.1%. This decrease in net assets was primarily attributable to the change in unrealized appreciation of holdings during the year resulting from decreases in the prices of gold (0.2%) and silver (5.7%). The decrease in net assets described above was also affected by expenses incurred during the year and by the one-cent year-end dividend paid on each of the Class A shares.
Though subject to the same effects as described above, net assets reported in Canadian dollars decreased at a lesser rate of 2.6% due to the 0.6% increase in the U.S. dollar relative to the Canadian dollar.
| 18 |
The following table summarizes the changes in net assets in U.S. dollars, gold and silver prices, and the exchange rate between U.S. and Canadian dollars on a quarterly basis for the 2012 fiscal year:
| Quarter ended | ||||||||||||||||
| October 31 | July 31 | April 30 | January 31 | |||||||||||||
| 2012 | ||||||||||||||||
| Change in unrealized appreciation of holdings (in millions) | $ | 478.4 | $ | (280.5 | ) | $ | (341.9 | ) | $ | (12.0 | ) | |||||
| Net income (loss) inclusive of the change in unrealized appreciation of holdings (in millions) | $ | 474.3 | $ | (284.2 | ) | $ | (346.1 | ) | $ | (16.0 | ) | |||||
| Net income (loss) per Class A share inclusive of the change in unrealized appreciation of holdings | $ | 1.86 | $ | (1.12 | ) | $ | (1.36 | ) | $ | (0.06 | ) | |||||
| Total net assets (in millions) | $ | 5,446.4 | $ | 4,974.5 | $ | 5,258.7 | $ | 5,604.9 | ||||||||
| Changes in net assets from prior quarter (in millions) | $ | 472.1 | $ | (284.4 | ) | $ | (346.1 | ) | $ | (16.0 | ) | |||||
| % change from prior quarter | 9.5 | % | (5.4 | )% | (6.2 | )% | (0.3 | )% | ||||||||
| Change in net assets per Class A share from prior quarter | $ | 1.85 | $ | (1.12 | ) | $ | (1.36 | ) | $ | (0.06 | ) | |||||
| % change per Class A share from prior quarter | 9.5 | % | (5.4 | )% | (6.2 | )% | (0.3 | )% | ||||||||
| Gold price | $ | 1,719.00 | $ | 1,622.00 | $ | 1,651.25 | $ | 1,744.00 | ||||||||
| % change from prior quarter | 6.0 | % | (1.8 | )% | (5.3 | )% | 1.3 | % | ||||||||
| Silver Price | $ | 32.28 | $ | 28.20 | $ | 31.20 | $ | 33.60 | ||||||||
| % change from prior quarter | 14.5 | % | (9.6 | )% | (7.1 | )% | (1.9 | )% | ||||||||
| Exchange rate: $1.00 U.S. = Cdn. | $ | 0.9996 | $ | 1.0014 | $ | 0.9884 | $ | 1.0052 | ||||||||
| % change from prior quarter | (0.2 | )% | 1.3 | % | (1.7 | )% | 1.2 | % | ||||||||
In fiscal 2011, net assets as reported in U.S. dollars increased by $1,714.1 million or 43.9%. The Company completed a public Class A share offering on April 6, 2011 as described in Note 4 to the financial statements. Treasury shares were issued in this offering at a premium over the net asset value per Class A share at the time of pricing, such that there was no dilution of the interests of existing Class A shareholders. The net proceeds from the share issue were $345.1 million, of which $272.3 million was used to purchase 190,410 fine ounces of gold bullion, and $66.2 million was used to purchase 1,755,000 ounces of silver bullion, all in physical bar form. The balance of the proceeds, $6.6 million, was retained in interest-bearing cash deposits for working capital purposes.
The balance of the increase in net assets of $1,369.0 million was primarily attributable to the change in unrealized appreciation of holdings during the year resulting from increases in the prices of gold (27.9%) and silver (42.9%).
The increase in net assets described above was nominally affected by expenses incurred during the year and the one-cent year-end dividend paid on each of the Class A shares.
Though subject to the same effects as described above, net assets reported in Canadian dollars increased at a lesser rate of 31.4% due to the 2.5% decrease in the U.S. dollar relative to the Canadian dollar.
| 19 |
The following table summarizes the changes in net assets in U.S. dollars, gold and silver prices, and the exchange rate between U.S. and Canadian dollars on a quarterly basis for the 2011 fiscal year:
| Quarter ended | ||||||||||||||||
| October 31 | July 31 | April 30 | January 31 | |||||||||||||
| 2011 | ||||||||||||||||
| Change in unrealized appreciation of holdings (in millions) | $ | (256.4 | ) | $ | (509.6 | ) | $ | 1,897.7 | $ | 255.3 | ||||||
| Net income (loss) for the quarter inclusive of the change in unrealized appreciation of holdings (in millions) | $ | (260.7 | ) | $ | (513.7 | ) | $ | 1,893.7 | $ | 252.1 | ||||||
| Net income (loss) per Class A share inclusive of the change in unrealized appreciation of holdings | $ | (1.02 | ) | $ | (2.02 | ) | $ | 7.80 | $ | 1.06 | ||||||
| Total net assets (in millions) | $ | 5,620.9 | $ | 5,884.1 | $ | 6,397.6 | $ | 4,158.8 | ||||||||
| Changes in net assets from prior quarter (in millions) | $ | (263.2 | ) | $ | (513.6 | ) | $ | 2,238.9 | $ | 252.1 | ||||||
| % change from prior quarter | (4.5 | )% | (8.0 | )% | 53.8 | % | 6.5 | % | ||||||||
| Change in net assets per Class A share from prior quarter | $ | (1.03 | ) | $ | (2.02 | ) | $ | 7.69 | $ | 1.06 | ||||||
| % change per Class A share from prior quarter | (4.5 | )% | (8.0 | )% | 44.1 | % | 6.5 | % | ||||||||
| Gold price | $ | 1,722.00 | $ | 1,628.50 | $ | 1,562.70 | $ | 1,327.00 | ||||||||
| % change from prior quarter | 5.7 | % | 4.2 | % | 17.8 | % | (1.5 | )% | ||||||||
| Silver Price | $ | 34.24 | $ | 39.63 | $ | 47.70 | $ | 27.75 | ||||||||
| % change from prior quarter | (13.6 | )% | (16.9 | )% | 71.9 | % | 15.8 | % | ||||||||
| Exchange rate: $1.00 U.S. = Cdn. | $ | 0.9935 | $ | 0.9538 | $ | 0.9486 | $ | 1.0022 | ||||||||
| % change from prior quarter | 4.2 | % | 0.5 | % | (5.3 | )% | (1.6 | )% | ||||||||
Financial Results - Net Income
Central Fund's earned income objective is secondary to its purpose of holding almost all of its net assets in gold and silver bullion. Generally, Central Fund seeks only to maintain adequate cash reserves to enable it to pay expenses and Class A share dividends. Because gold and silver bullion are not loaned to generate income, Central Fund's realized income is a nominal percentage of its net assets. However, AcG-18 requires Central Fund to record changes in unrealized appreciation (depreciation) of holdings in income which may lead to large variations in reported income or loss from year to year. Central Fund expects to generate cash flow from its holdings of cash equivalents, and will sell bullion only if necessary to replenish cash reserves.
Fiscal 2013 Compared to Fiscal 2012
Net loss (inclusive of the change in unrealized appreciation of holdings) of $1,459.3 million was reported for the 2013 fiscal year compared to $172.1 million for the 2012 fiscal year. Virtually all of the change in 2013 was a result of the change in unrealized appreciation of holdings during the year.
Expenses decreased by 12.9% over the prior year. Year-end net assets decreased from the prior year due to decreases in the prices of gold and silver. Administration fees, which are calculated monthly based on the total net assets at each month-end, decreased during the year due to lower average month-end net asset levels during the year. Auditor and regulatory fees in 2013 and 2012 include a new accounting support fee paid to the Public Accounting Oversight Board (PCAOB) and the Financial Accounting Standards Board (FASB).
Expenses as a percentage of the average month-end net assets (the “expense ratio”) for the 2013 fiscal year increased slightly to 0.32% compared to 0.31% in 2012, primarily due to the lower net asset levels during the year.
| 20 |
Fiscal 2012 Compared to Fiscal 2011
Net loss (inclusive of the change in unrealized appreciation of holdings) of $172.1 million was reported for the 2012 fiscal year compared to net income of $1,371.4 million for the 2011 fiscal year. Virtually all of the change in 2012 was a result of the change in unrealized appreciation of holdings during the year.
Expenses increased by 2.7% over the prior year. Year-end net assets decreased from the prior year due to decreases in the prices of gold and silver. Administration fees, which are calculated monthly based on the total net assets at each month-end, increased during the year despite the overall reduction in net assets due to a higher average month-end net asset level during the year. Safekeeping fees increased during the year for the same reasons. Auditors’ fees in 2012 included a new accounting support fee paid to the Public Accounting Oversight Board (PCAOB) and the Financial Accounting Standards Board (FASB).
Expenses as a percentage of average month-end net assets (the “expense ratio”) for the 2012 fiscal year increased slightly to 0.31% compared to 0.30% in 2011, primarily due to the lower net asset levels during the year,.
Outstanding Shares
There were 254,432,713 Class A retractable shares and 40,000 Common shares issued and outstanding at October 31, 2013.
Forward – Looking and Market Risk Observations
Central Fund is almost entirely invested in pure refined gold and silver bullion in international bar form. Therefore, the principal factors affecting the price of its shares are factors which affect the currency prices of gold and silver, which are beyond the Company’s control. However, the Company believes that such factors have a lesser impact on the shares of Central Fund than on the shares of gold producers, as gold producers have considerable inherent operational costs and other risks resulting in more volatile share prices of such producers. Central Fund’s net assets are denominated in U.S. dollars. As at October 31, 2013, the Company’s assets were made up of 56.3% gold bullion, 42.9% silver bullion, and 0.8% cash and interest-bearing deposits and other working capital amounts. The Company does not engage in any leasing, lending or hedging activities involving these assets, so the net asset value of the shares will depend on, and typically fluctuate with, the price fluctuations of such assets. Gold and silver bullion are traded internationally and their market prices may be affected by a variety of unpredictable, international, economic, monetary and political considerations. Macroeconomic considerations include: expectations for future rates of inflation; the strength or weakness of, and confidence in, the U.S. dollar, the currency in which the prices of gold and silver are generally quoted, and the relative value of other currencies; interest rates; and global or regional political or economic events, including banking crises. Political factors, including market interventions and international conflicts, may also affect gold and silver prices.
Price risk
Price risk is the risk that the price of a security or physical asset may decline. It is possible to determine the impact that changes in the market prices of gold and silver will have on the Company’s net asset value per Class A share both in U.S. dollars and Cdn. dollars. Assuming as a constant exchange rate the rate which existed on October 31, 2013, of Cdn. $1.0429 for each U.S. dollar together with the holdings of gold and silver bullion which existed on that date, a 10% change in the price of gold would increase or decrease the net asset value per Class A share by approximately $0.88 per share or Cdn. $0.92 per share. A 10% change in the price of silver would increase or decrease the net asset value per Class A share by approximately $0.67 per share or Cdn. $0.70 per share. If both gold and silver prices were to change by 10% simultaneously in the same direction, the net asset value per Class A share would increase or decrease by approximately $1.55 per share or Cdn. $1.62 per share.
Currency risk
Currency risk is the risk that the value of an asset or liability will fluctuate due to changes in foreign currency exchange rates.
When expressed in U.S. dollars, Central Fund's net asset value per Class A share is largely unaffected by changes in the U.S./Cdn. dollar exchange rate due to the fact that nearly all of Central Fund's net assets are priced in U.S. dollars. For this same reason, an increase or decrease in the value of the U.S. dollar relative to the Cdn. dollar would change the net asset value per Class A share as expressed in Cdn. dollars in the same direction by approximately the same percentage change in the value of the U.S. dollar.
| 21 |
Due to the limited dollar value of transactions initiated in Cdn. dollars throughout the year, a strengthening or weakening of the Cdn. dollar relative to the U.S. dollar applied to balances outstanding at October 31, 2013 would not have had any material impact on the net loss for the year ended October 31, 2013, assuming that all other variables, in particular interest rates, remained constant.
Credit risk
Credit risk on short-term deposits is the risk of loss occurring as a result of the default of an issuer on its obligation to Central Fund. Credit risk is monitored on an ongoing basis and is managed by the Company dealing only with issuers that are believed to be creditworthy.
Liquidity risk
Liquidity risk is the risk that the Company will not be able to generate adequate cash resources to fulfill its payment obligations. The Administrator regards all of Central Fund’s assets as liquid. Central Fund traditionally has maintained sufficient cash reserves to enable it to pay expenses and dividends on its Class A shares. Furthermore, 99.2% of its net assets are in the form of gold and silver bullion, which are readily marketable.
Liquidity and Capital Resources
All of Central Fund's assets are liquid. The Company’s liquidity objective is to hold cash and short-term deposits in a safe and conservative manner to generate some income primarily to be applied towards expenses and Class A share dividends. At October 31, 2013, Central Fund's cash and short-term deposits were $36.5 million. The comparable figure at October 31, 2012 was $55.3 million. The ability of Central Fund to have sufficient cash for expenses and dividend payments, and to meet demands for redemption (if any), is primarily dependent upon its ability to realize cash flow from its cash equivalents. Should Central Fund not have sufficient cash to meet its needs, portions of Central Fund's bullion holdings may be sold to fund dividend payments, provide working capital and pay for redemptions (if any) of Class A shares. Sales of bullion holdings could result in Central Fund realizing capital gains or losses. Central Fund qualifies as a Mutual Fund Corporation for share redemption purposes only but is not treated as a mutual fund as defined by securities regulators. As a Mutual Fund Corporation, any Canadian tax payable by Central Fund to the extent that it relates to taxable capital gains is fully refundable when the realized gains are distributed to shareholders. Should Central Fund not qualify as a Mutual Fund Corporation at any time in the future, Central Fund would have to pay non-refundable tax on such capital gains, if any. Payments for such distributions or tax would be a further use of Central Fund's cash resources. During the fiscal year ended October 31, 2013, Central Fund's cash reserves decreased by $18.8 million from those held at October 31, 2012. The primary sources and uses of cash were as follows:
Sources of Cash
The primary inflow of cash was $0.1 million of interest generated on short-term securities.
Uses of Cash
Central Fund paid total expenses of $16.4 million during the 2013 fiscal year, $3.9 million of which related to amounts which had been accrued at October 31, 2012 and which were reflected in the accounts of that year. Other cash outflows include $2.5 million paid in the 2013 fiscal year with respect to Central Fund's October 31, 2012 Class A share dividend.
Central Fund’s Board of Directors made the decision to build up cash reserves by retaining in cash and cash equivalents a portion of the proceeds from Class A share issues in recent years. These amounts are to be used to pay expenses and Class A share dividend payments, and to meet demands for redemption of shares (if any). The Board of Directors is mindful of the need to make these payments, while continuing to meet the Company’s stated objective of holding the maximum amount of net assets, as is deemed reasonable by the Board of Directors, in the form of gold and silver bullion. Although it could readily generate cash by liquidating a small portion of its bullion holdings, the Administrator and Senior Executive Officers monitor Central Fund’s cash position with an emphasis on maintaining its mandate to hold maximum amounts of gold and silver bullion at all times. However, were cash reserves to become too low, and in the absence of other sources of capital at the time, liquidation of a portion of the bullion holdings could be made which would result in gains or losses on such holdings.
| 22 |
Future Accounting Policy
On December 12, 2011, the Accounting Standards Board of Canada decided to further extend the deferral of International Financial Reporting Standards (“IFRS”) adoption for investment companies for an additional year. Investment companies will now be required to mandatorily adopt IFRS for interim and annual financial statements for fiscal periods beginning on or after January 1, 2014.
The Company is reviewing the key elements within IFRS that may result in a change in accounting policies that will impact its financial statements and accompanying note disclosures. The assessment plan being implemented by the Company includes a position paper which highlights the material standards that need to be addressed under IFRS and preparation of an opening balance sheet and financial statements that incorporate IFRS accounting standards and policies. The major areas of focus identified by the assessment include: first year implementation decisions; statement of cash flows; classification of redeemable Class A shares; income taxes; increased note disclosure; and accounting for changes in unrealized appreciation of holdings. The assessment is addressing the impact on the Company’s accounting system and internal controls required to report under IFRS beginning on the implementation date. The Company will continue with the assessment and implementation in preparation for its initial filing under IFRS expected for the fiscal year beginning November 1, 2014.
Disclosure Controls and Procedures
The Senior Executive Officers have established and implemented disclosure controls and procedures in order to provide reasonable assurance that material information relating to the Company is disclosed on a timely basis. They believe these disclosure controls and procedures have been effective during the year ended October 31, 2013.
Inflation
Because Central Fund's financial statements are prepared on a market price basis, the impact of inflation and the resulting currency price changes of gold and silver are reflected in these financial statements.
Non-Market Risk Factors
There are other risk factors affecting the Company as set out in the Annual Information Form of the Company dated December 9, 2013. Prospective investors should consider carefully these factors relating to the business and primary assets of Central Fund before deciding whether to purchase shares.
United States Federal Income Tax Considerations
Central Fund has been, and expects to continue to be a passive foreign investment company (“PFIC”) for United States federal income tax purposes. Under the PFIC rules, the United States federal income tax treatment of the Class A shares is very complex and, in certain cases, uncertain or potentially unfavorable to United States shareholders. Under current law, a non-corporate United States shareholder who has in effect a valid election to treat Central Fund as a qualified electing fund (“QEF”) should be eligible for the 20% maximum United States federal income tax rate on a sale or other taxable disposition of Central Fund’s shares, if such shares have been held for more than one year at the time of sale or other taxable disposition. Gain from the disposition of collectibles, such as gold or silver, however, is currently subject to a maximum United States federal income tax rate of 28%. The IRS has authority to issue Treasury regulations applying the 28% tax rate to gain from the sale by a non-corporate United States shareholder of an interest in a PFIC with respect to which a QEF election is in effect. Although no such Treasury regulations have been issued to date, there can be no assurance as to whether, when or with what effective date any such Treasury regulations may be issued, or whether any such Treasury regulations would subject long-term capital gains recognized by a United States shareholder (a “U.S. Holder”) that has made a QEF election on a disposition of Central Fund shares to the 28% rate. U.S. Holders should be aware that if they purchase Class A shares and make a QEF election, the IRS may issue regulations or other guidance, possibly on a retroactive basis, which would apply the higher 28% United States federal income tax rate to any long-term capital gain recognized on a sale of their Central Fund shares. In addition, a gain from the disposition of Class A shares may be subject to the 3.8% Medicare surtax. U.S. Holders should consult their tax advisors regarding the implications of making a QEF election with respect to Central Fund.
| 23 |
Under the QEF rules, in the event that Central Fund disposes of a portion of its gold or silver holdings, including dispositions in the course of varying its relative investment between gold and silver, United States shareholders who have made a QEF election may be required to report substantial amounts of income for United States federal income tax purposes (in the absence of any cash distributions received from Central Fund). Historically, Central Fund has declared and paid a cash distribution of U.S. $0.01 per share (prior to 1996, Cdn.$0.01 per share) on its outstanding Class A shares. In addition, it is the intention of Central Fund to distribute to holders of record of Class A shares and Common shares as of the last day of each taxable year (currently October 31) an aggregate amount of cash distributions (including the stated distributions on the Class A shares) such that the amount of cash distributions payable to an electing shareholder that holds Class A shares for the entire taxable year of Central Fund will be at least equal to the product of (i) Central Fund’s “ordinary earnings” and “net capital gains” for such taxable year allocable to such electing Shareholder and (ii) the highest marginal rate of United States federal income tax on ordinary income or long-term capital gain, as appropriate, applicable to individuals. Because such cash distributions may be subject to Canadian withholding tax and because the amount of such cash distributions will be determined without reference to possible United States state or local income tax liabilities or to the rate of United States federal income tax applicable to corporate United States shareholders, such cash distributions may not provide an electing Shareholder with sufficient cash to pay the United States federal income tax liability arising from the inclusion in income of the electing Shareholders’ pro rata share of Central Fund’s “ordinary earnings” and “net capital gains” under the QEF rules.
Each United States person that acquires Class A shares, whether from Central Fund or in the secondary market, is strongly urged to consult his, her or its own tax advisor.
NOTICE PURSUANT TO IRS CIRCULAR 230: NOTHING CONTAINED IN THIS RISK FACTOR CONCERNING ANY U.S. FEDERAL TAX ISSUE IS INTENDED OR WRITTEN TO BE USED, AND IT CANNOT BE USED, BY A U.S. SHAREHOLDER, FOR THE PURPOSE OF AVOIDING U.S. FEDERAL TAX PENALTIES UNDER THE U.S. INTERNAL REVENUE CODE. THIS RISK FACTOR WAS WRITTEN TO SUPPORT THE PROMOTION OR MARKETING OF THE TRANSACTIONS OR MATTERS ADDRESSED BY THIS DOCUMENT. EACH U.S. SHAREHOLDER SHOULD SEEK U.S. FEDERAL TAX ADVICE, BASED ON SUCH U.S. SHAREHOLDER’S PARTICULAR CIRCUMSTANCES, FROM AN INDEPENDENT TAX ADVISOR.
This MD&A is dated December 9, 2013.
| 24 |
Class A Shares Stock Exchange Listings
| Electronic | Newspaper | |||
| Ticker Symbol | Quote Symbol | |||
| NYSE MKT | CEF | CFCda | ||
| The Toronto Stock Exchange | CEF.A in CDN$ | CFund A | ||
| CEF.U in US$ | ||||
| Cusip Number 153501101 |
Net Asset Value Information
| The net asset value per Class A share is calculated daily and is available atwww.centralfund.com; or by calling the Administrator’s Investor Inquiries Office at (905) 648-7878; or, by sending an email to info@centralfund.com. |
Form 40-F
| Central Fund's Annual Report on Form 40-F is filed with the SEC and posted on EDGAR (Electronic Data Gathering, Analysis and Retrieval System) atwww.sec.gov/edgar.shtml. Copies are available, free of charge, by contacting Central Fund of Canada Limited or its Administrator. |
Postings on SEDAR(System for Electronic Document Analysis and Retrieval)
Annual & Quarterly Reports
Management’s Discussion and Analysis
Annual Information Forms
Prospectuses
Material Change Reports
Press Releases
Proxies and Executive’s Certifications
Board and Committee Charters
All of these filings may be found atwww.sedar.comandwww.centralfund.com.
| 25 |
Corporate Information
| Directors | Officers |
| Brian E. Felske (A)(C)(I) | Philip M. Spicer, Chairman |
| Bruce D. Heagle (A)(C)(I) | Dale R. Spackman, Q.C., Vice-Chairman |
| Ian M.T. McAvity (C)(I)(L) | J.C. Stefan Spicer, President & CEO |
| Michael A. Parente CMA, CFP (A)(I) | Catherine A. Spackman CMA, Treasurer & CFO |
| Dale R. Spackman, Q.C. | Teresa E. Poper CB, Assistant Treasurer |
| J.C. Stefan Spicer | John S. Elder, Q.C., Secretary |
| Philip M. Spicer | |
| Consultants | |
| Douglas E. Heagle, Retired Director | |
| Malcolm A. Taschereau, Retired Director |
| (A) | - Member of the Audit Committee |
| (C) | - Member of the Corporate Governance Committee |
| (I) | - May be regarded as an independent director under Canadian securities administrators’ guidelines. |
| (L) | - Lead Director |
| Administrator | Auditors |
| The Central Group Alberta Ltd. | Ernst & Young LLP |
| Calgary, Alberta | Canada |
| Banker | Custodian |
| Canadian Imperial Bank of Commerce | Canadian Imperial Bank of Commerce |
| Legal Counsel | Registrar and Transfer Agents |
| Dentons Canada LLP, Toronto | CST Trust Company, Canada |
| Dorsey & Whitney LLP, Seattle | American Stock Transfer & Trust Company LLC, New York |
| Parlee McLaws LLP, Calgary |
Share Ownership Certificates Certificates of share ownership registered in shareholders' names at their own addresses for delivery to them for their own safekeeping may be obtained upon the request of holders and payment of any applicable fees to the relevant Registrar and Transfer Agent of the Company. |
| Head Office | Shareholder and |
| Hallmark Estates | Investor Inquiries |
| Suite 805, 1323-15th Avenue S.W. | Administrator, P.O. Box 10050 |
| Calgary, Alberta T3C 0X8 | Ancaster, Ontario L9K 1P2 |
| Telephone (403) 228-5861 | Telephone (905) 648-7878 |
| Fax (403) 228-2222 | Fax (905) 648-4196 |
Website: www.centralfund.com
E-mail: info@centralfund.com
| 26 |