
Earnings Conference Call Fourth Quarter 2012 1 Exhibit 99.2
Cautionary Statement 2 Information Current as of February 22, 2013 Except as expressly noted, the information in this presentation is current as of February 22, 2013 — the date on which PGE filed its Annual Report on Form 10-K for the annual period ended December 31, 2012 — and should not be relied upon as being current as of any subsequent date. PGE undertakes no duty to update the presentation, except as may be required by law. Forward-Looking Statements Statements in this presentation that relate to future plans, objectives, expectations, performance, events and the like may constitute “forward-looking statements” within the meaning of the Private Securities Litigation Reform Act of 1995, Section 27A of the Securities Act of 1933, as amended, and Section 21E of the Securities Exchange Act of 1934, as amended. Forward-looking statements include statements regarding earnings guidance, statements regarding future load, hydro conditions and operating and maintenance costs; statements concerning implementation of the Company’s Integrated Resource Plan and related future capital expenditures, statements concerning future compliance with regulations limiting emissions from generation facilities and the costs to achieve such compliance; statements regarding the outcome of any legal or regulatory proceeding; as well as other statements containing words such as “anticipates,” “believes,” “intends,” “estimates,” “promises,” “expects,” “should,” “conditioned upon,” and similar expressions. Investors are cautioned that any such forward-looking statements are subject to risks and uncertainties, including the reductions in demand for electricity and the sale of excess energy during periods of low wholesale market prices; operational risks relating to the Company’s generation facilities, including hydro conditions, wind conditions, disruption of fuel supply, and unscheduled plant outages, which may result in unanticipated operating, maintenance and repair costs, as well as replacement power costs; the costs of compliance with environmental laws and regulations, including those that govern emissions from thermal power plants; changes in weather, hydroelectric and energy markets conditions, which could affect the availability and cost of purchased power and fuel; changes in capital market conditions, which could affect the availability and cost of capital and result in delay or cancellation of capital projects; failure to complete projects on schedule and within budget, or the abandonment of capital projects, which could result in the Company’s inability to recover project costs; the outcome of various legal and regulatory proceedings; and general economic and financial market conditions. As a result, actual results may differ materially from those projected in the forward-looking statements. All forward-looking statements included in this presentation are based on information available to the Company on the date hereof and such statements speak only as of the date hereof. The Company assumes no obligation to update any such forward-looking statement. Prospective investors should also review the risks and uncertainties listed in the Company’s most recent Annual Report on Form 10-K and the Company’s reports on Forms 8-K and 10-Q filed with the United States Securities and Exchange Commission, including Management’s Discussion and Analysis of Financial Condition and Results of Operations and the risks described therein from time to time.

Leadership Presenting Today 3 Maria Pope Senior Vice President, Finance, CFO & Treasurer Jim Piro President & CEO
On Today’s Call 4 Financial & Operating Performance Economic Outlook Strategic Initiatives Financial Update 2014 General Rate Case 2013 Outlook

2012 Earnings Results Q1 $0.92 Q1 $0.65 Q2 $0.29 Q2 $0.34 Q3 $0.36 Q3 $0.50 Q4 $0.38 Q4 $0.38 2011 EPS 2012 EPS $1.95 $1.87 5 NI in millions Q4 2011 Q4 2012 Full Year 2011 Full Year 2012 Net Income $29 $28 $147 $141 EPS $0.38 $0.38 $1.95 $1.87

Operational Excellence 6 2012 generating plant availability: 94% 1st quartile in system power quality and reliability metrics Continuous improvements and efficiency
Economic Outlook 7 2011A 2012A 2013F 1.5% 0.6% 0.5 – 1.0% Weather-Adjusted Load Growth Growth in Operating Area Business growth Intel and Nike announced plans for expansion High-tech and data centers Industrial sector load growth of about 2% in 2012 Residential growth Improved housing market 2nd in nation for in-migration
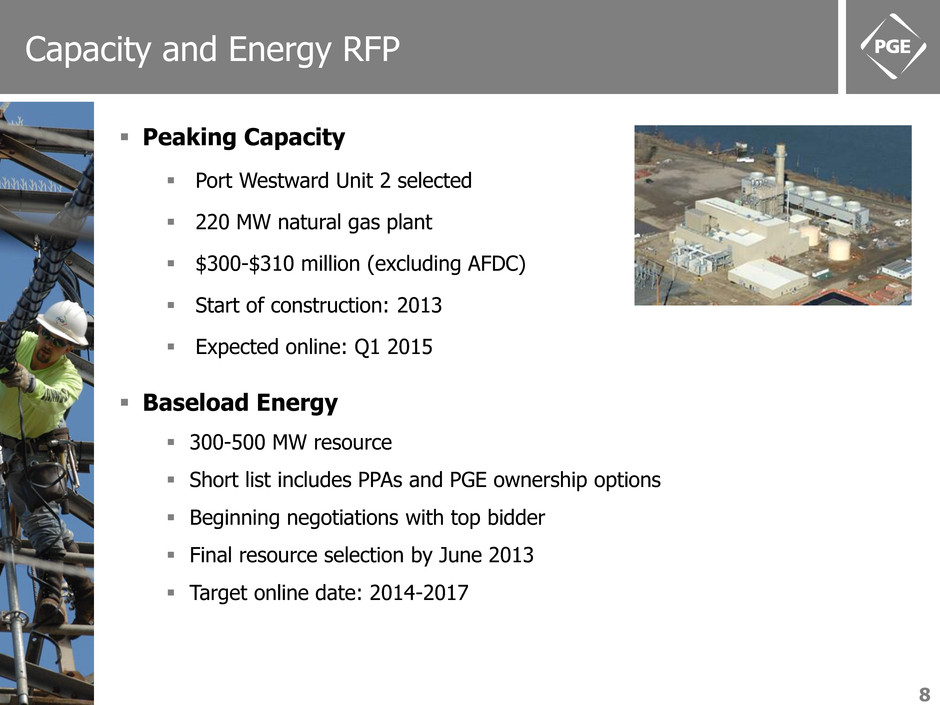
Capacity and Energy RFP 8 Peaking Capacity Port Westward Unit 2 selected 220 MW natural gas plant $300-$310 million (excluding AFDC) Start of construction: 2013 Expected online: Q1 2015 Baseload Energy 300-500 MW resource Short list includes PPAs and PGE ownership options Beginning negotiations with top bidder Final resource selection by June 2013 Target online date: 2014-2017
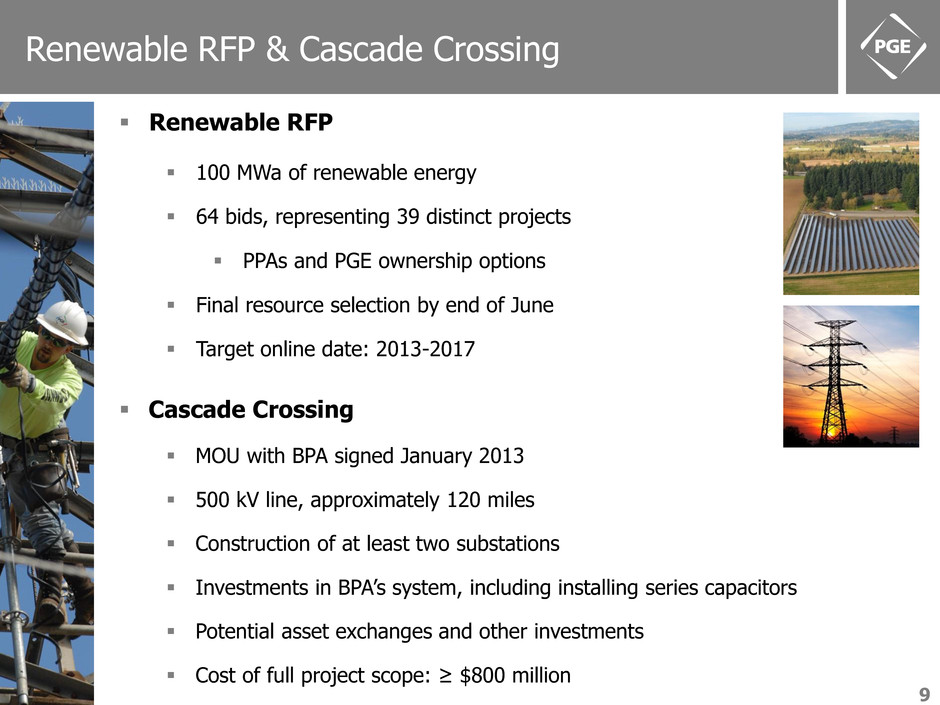
Renewable RFP & Cascade Crossing 9 Renewable RFP 100 MWa of renewable energy 64 bids, representing 39 distinct projects PPAs and PGE ownership options Final resource selection by end of June Target online date: 2013-2017 Cascade Crossing MOU with BPA signed January 2013 500 kV line, approximately 120 miles Construction of at least two substations Investments in BPA’s system, including installing series capacitors Potential asset exchanges and other investments Cost of full project scope: ≥ $800 million
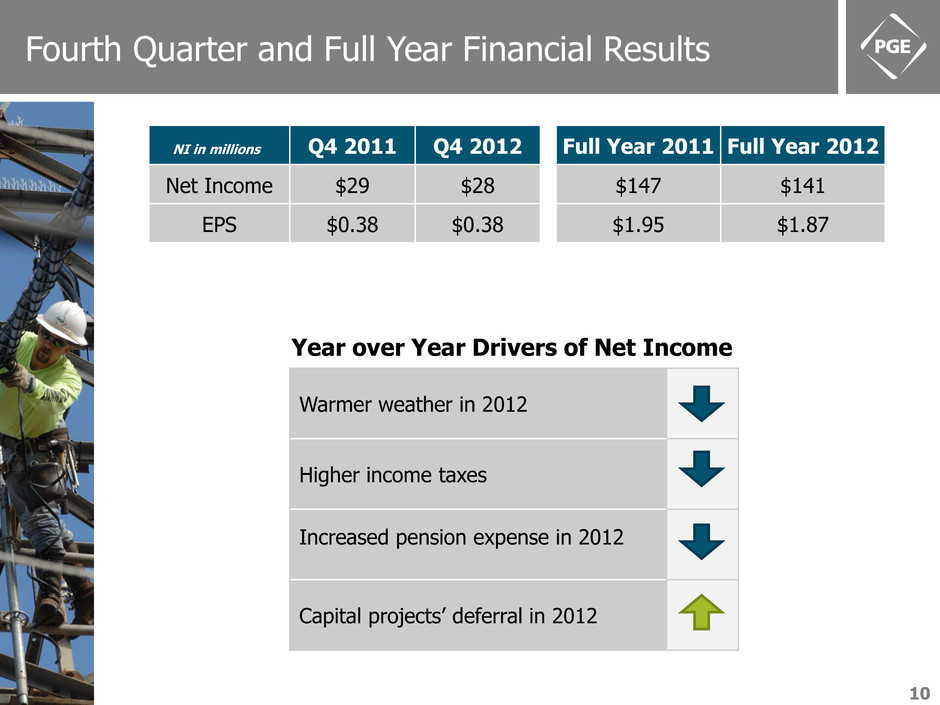
Fourth Quarter and Full Year Financial Results NI in millions Q4 2011 Q4 2012 Full Year 2011 Full Year 2012 Net Income $29 $28 $147 $141 EPS $0.38 $0.38 $1.95 $1.87 Year over Year Drivers of Net Income Warmer weather in 2012 Higher income taxes Increased pension expense in 2012 Capital projects’ deferral in 2012 10
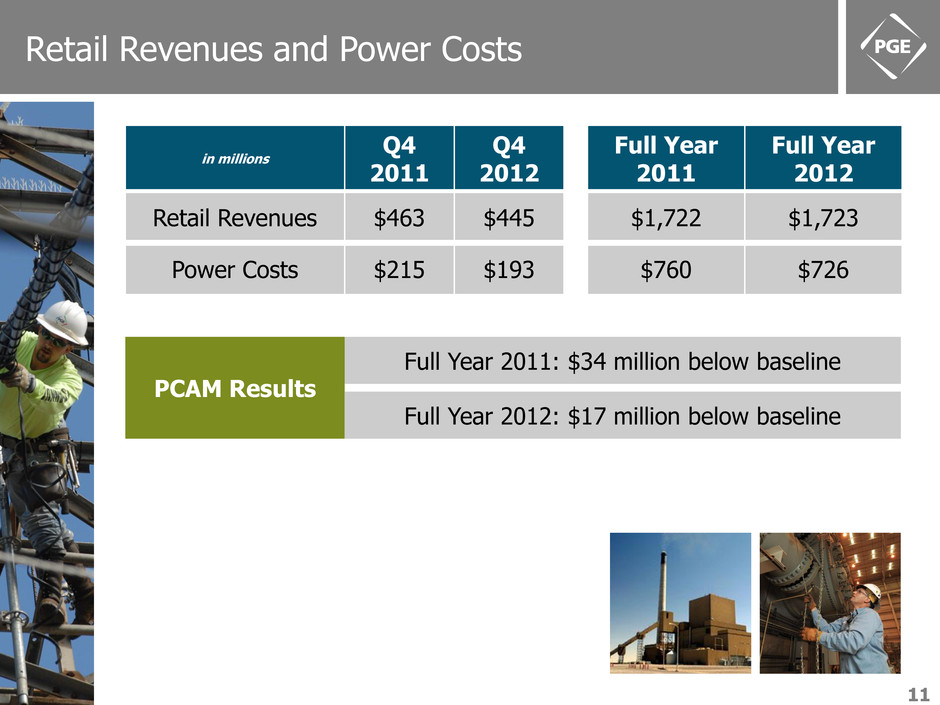
Retail Revenues and Power Costs 11 Full Year 2011: $34 million below baseline PCAM Results in millions Q4 2011 Q4 2012 Full Year 2011 Full Year 2012 Retail Revenues $463 $445 $1,722 $1,723 Power Costs $215 $193 $760 $726 Full Year 2012: $17 million below baseline
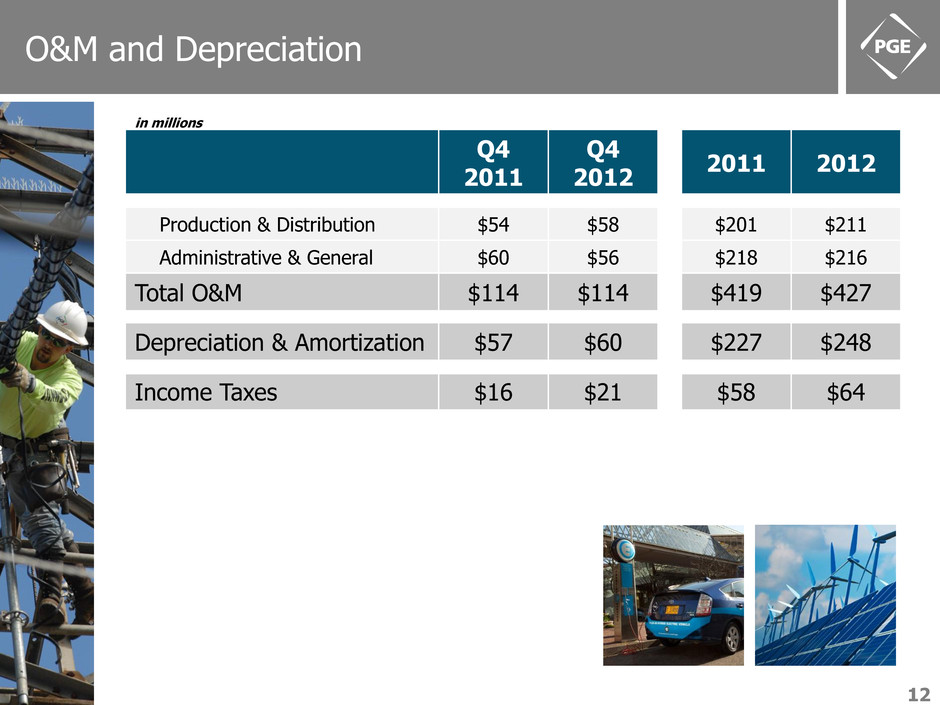
O&M and Depreciation 12 Q4 2011 Q4 2012 2011 2012 Production & Distribution $54 $58 $201 $211 Administrative & General $60 $56 $218 $216 Total O&M $114 $114 $419 $427 Depreciation & Amortization $57 $60 $227 $248 in millions Income Taxes $16 $21 $58 $64
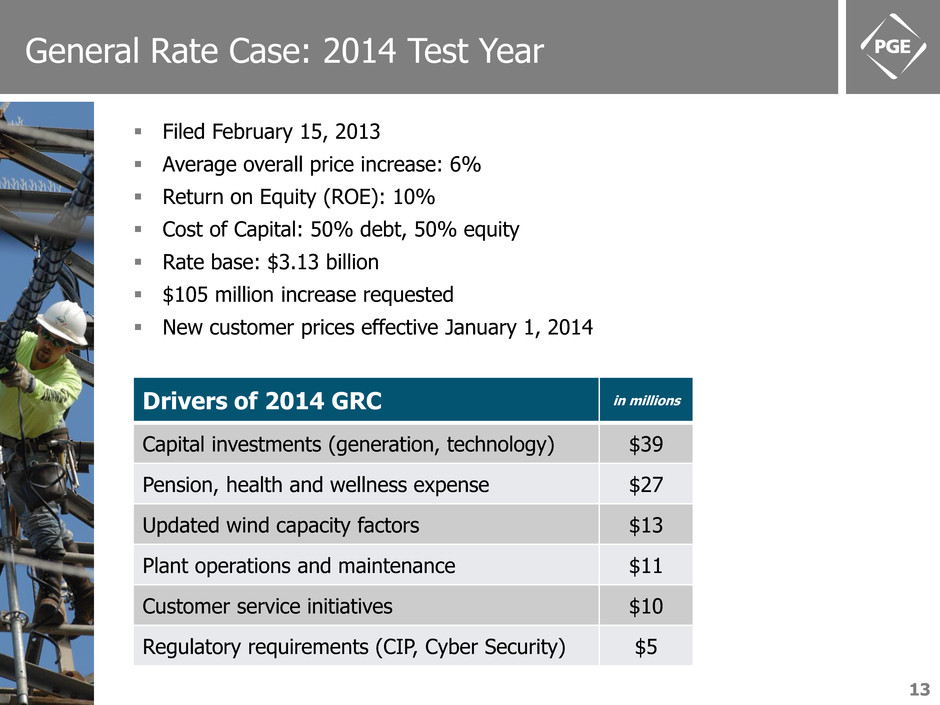
General Rate Case: 2014 Test Year Drivers of 2014 GRC in millions Capital investments (generation, technology) $39 Pension, health and wellness expense $27 Updated wind capacity factors $13 Plant operations and maintenance $11 Customer service initiatives $10 Regulatory requirements (CIP, Cyber Security) $5 Filed February 15, 2013 Average overall price increase: 6% Return on Equity (ROE): 10% Cost of Capital: 50% debt, 50% equity Rate base: $3.13 billion $105 million increase requested New customer prices effective January 1, 2014 13

2013 Earnings Guidance 14 2013 EPS Guidance: $1.85 to $2.00 per share Weather-adjusted load growth of 0.5 to 1% Wind generation based on updated forecasts D&A expense of $244 million O&M between $440-$460 million (quarterly run rate: $110-$115 million) Assumptions for FY 2013 Capital expenditures of $514 million $6 million in AFDC debt and equity for Port Westward Unit 2
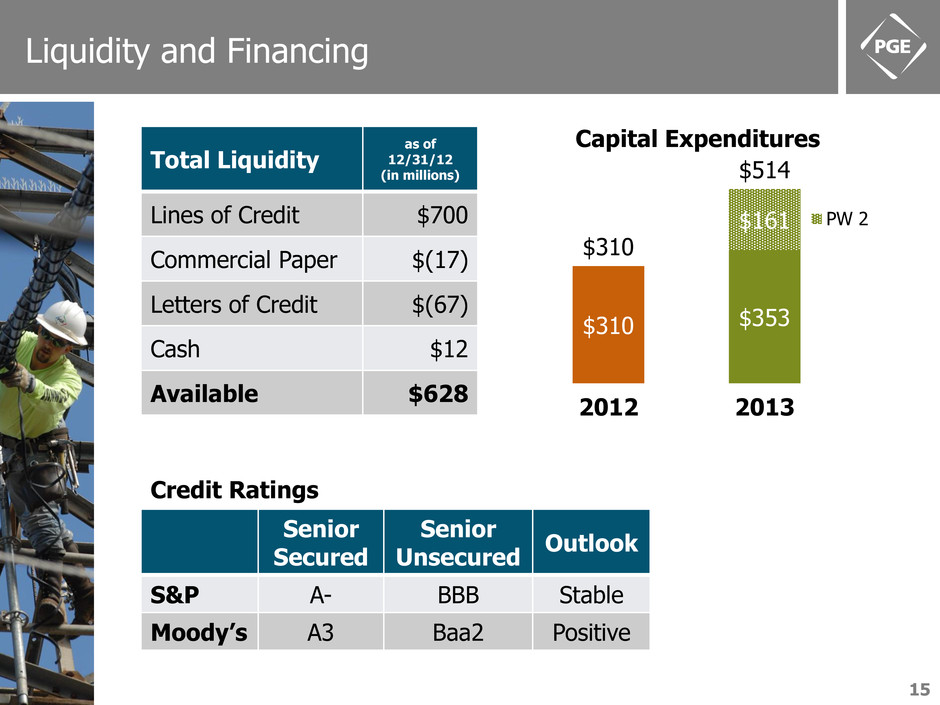
Liquidity and Financing Senior Secured Senior Unsecured Outlook S&P A- BBB Stable Moody’s A3 Baa2 Positive Credit Ratings Total Liquidity as of 12/31/12 (in millions) Lines of Credit $700 Commercial Paper $(17) Letters of Credit $(67) Cash $12 Available $628 15 Capital Expenditures $310 $353 $310 $161 $514 2012 2013 PW 2


