
1
RBC Capital Markets
Healthcare Conference
March 2, 2010
Exhibit 99.1
Exhibit 99.1
2
Table of Contents
Exhibit 99.1

3
Note Regarding Forward-Looking Statements
The information contained in this presentation includes certain estimates, projections and other forward-looking information
that reflect our current views with respect to future events and financial performance. These estimates, projections and other
forward-looking information are based on assumptions that HealthSouth believes, as of the date hereof, are reasonable.
Inevitably, there will be differences between such estimates and actual results, and those differences may be material.
There can be no assurance that any estimates, projections or forward-looking information will be realized. All such
estimates, projections and forward-looking information speak only as of the date hereof. HealthSouth undertakes no duty to
publicly update or revise the information contained herein.
estimates, projections and forward-looking information speak only as of the date hereof. HealthSouth undertakes no duty to
publicly update or revise the information contained herein.
This presentation also includes estimates and projections published by the Centers for Medicare and Medicaid Services
(“CMS”). We are not able to verify those estimates or projections or the detailed calculations thereof by CMS which are not
made public. Any changes or errors in those calculations, among other uncertainties such as those referred to below and
changes in CMS’s own rules and policies, could cause actual results to differ materially from CMS’s projections.
Furthermore, we do not believe that CMS numbers are consistent with financial reporting results. CMS data and projections
should not be used as an indication of financial performance.
You are cautioned not to place undue reliance on the estimates, projections and other forward-looking information in this
presentation as they are based on current expectations and general assumptions and are subject to various risks,
uncertainties and other factors, including those set forth in our Form 10-K for the year ended December 31, 2009, and in
other documents we previously filed with the SEC, many of which are beyond our control, that may cause actual results to
differ materially from the views, beliefs and estimates expressed herein.
Note Regarding Presentation of Non-GAAP Financial Measures
The following presentation includes certain “non-GAAP financial measures” as defined in Regulation G under the Securities
Exchange Act of 1934. The Appendix at the end of this presentation includes reconciliations of the non-GAAP financial
measures found in the following presentation to the most directly comparable financial measures calculated and presented in
accordance with Generally Accepted Accounting Principles in the United States. Our Form 8-K, dated March 1, 2010, to
which the following presentation slides are attached, provides further explanation and disclosure regarding our use of non-
GAAP financial measures and should be read in conjunction with these presentation slides.
Cautionary Statements
Exhibit 99.1

4
IRH
LTCH
93 Rehabilitation Hospitals
40 Outpatient Rehabilitation Satellites
6 Long-Term Acute Care Hospitals
25 Hospital-Based Home
Health Agencies
Health Agencies
Portfolio
Largest Provider of Inpatient Rehabilitative Healthcare Services in the U.S.
Sites under Construction
Exchange (Symbol): NYSE (HLS)
Employees: ~ 22,000
Corporate Office: Birmingham, AL
Exhibit 99.1

5
“The Basics”: Our Competitors
Competitors
• Freestanding IRFs
• Hospital IRF units
• Skilled nursing homes
Patients
Total Inpatient Rehabilitation Facilities (IRFs):1,181
Sources: FY 2010 CMS Rate Setting File and MedPAC March 2009 report; Internal HLS reports for HLS data;
Exhibit 99.1
6
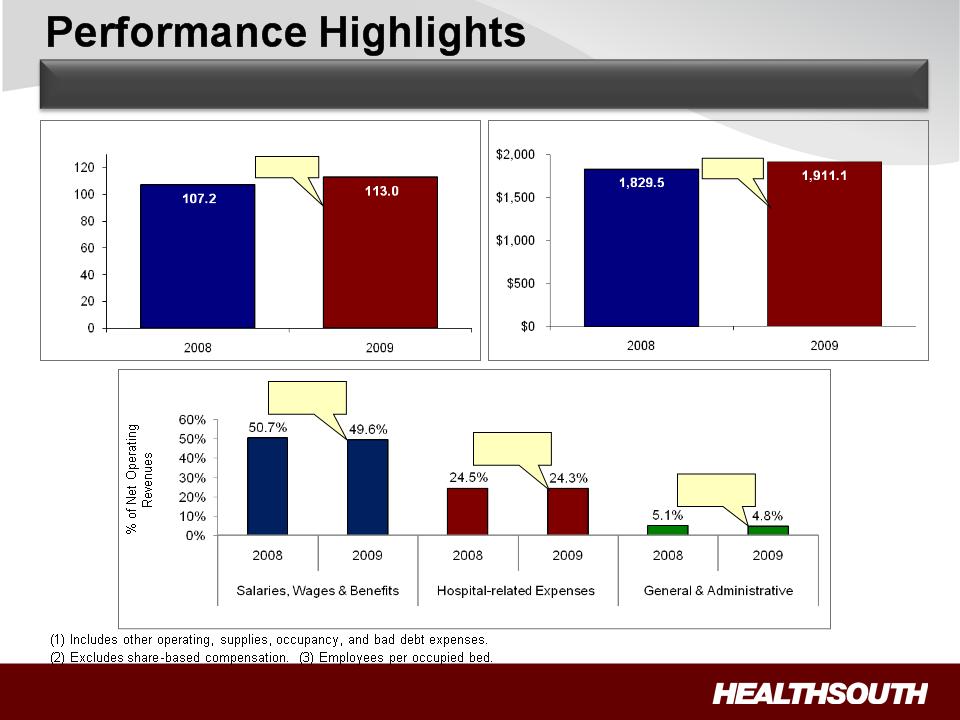
Discharges
Consolidated Net Operating Revenues
($ Millions)
+4.5%
+5.4%
Dollar Amounts $928.2 $948.8 $448.9 $464.5 $93.8 $91.1
EPOB (3) 3.62 3.53
30 bps
Improvement
Improvement
20 bps
Improvement
Improvement
110 bps
Improvement
Improvement
Expenses
(1)
(2)
Solid, Sustained Operating Results
(Thousands)
Exhibit 99.1
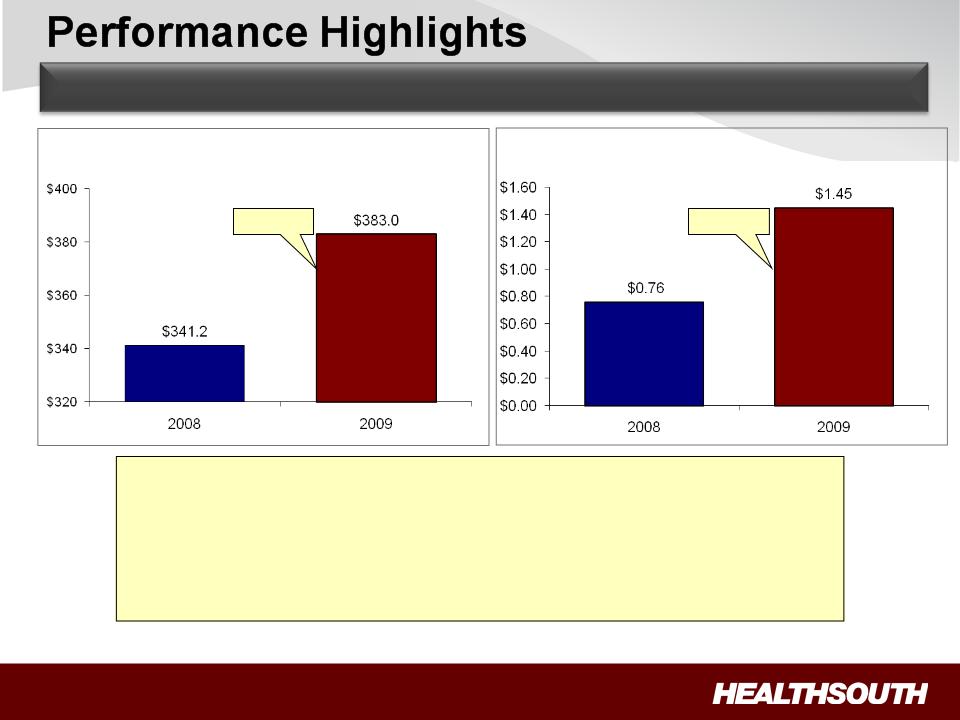
7
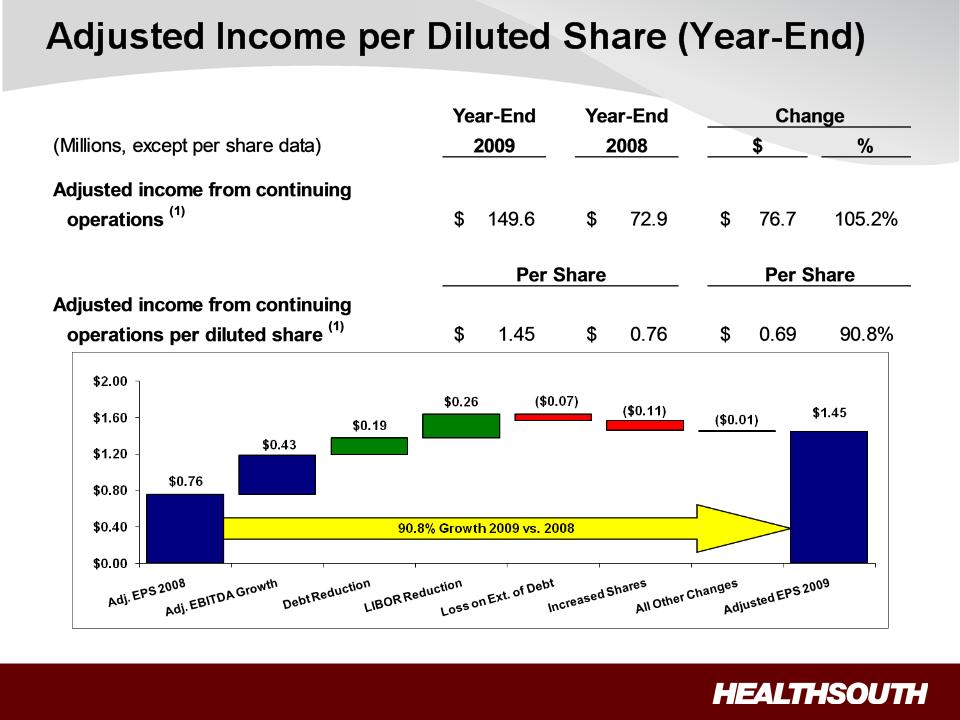
Adjusted Income from Continuing
Operations per Diluted Share (1)
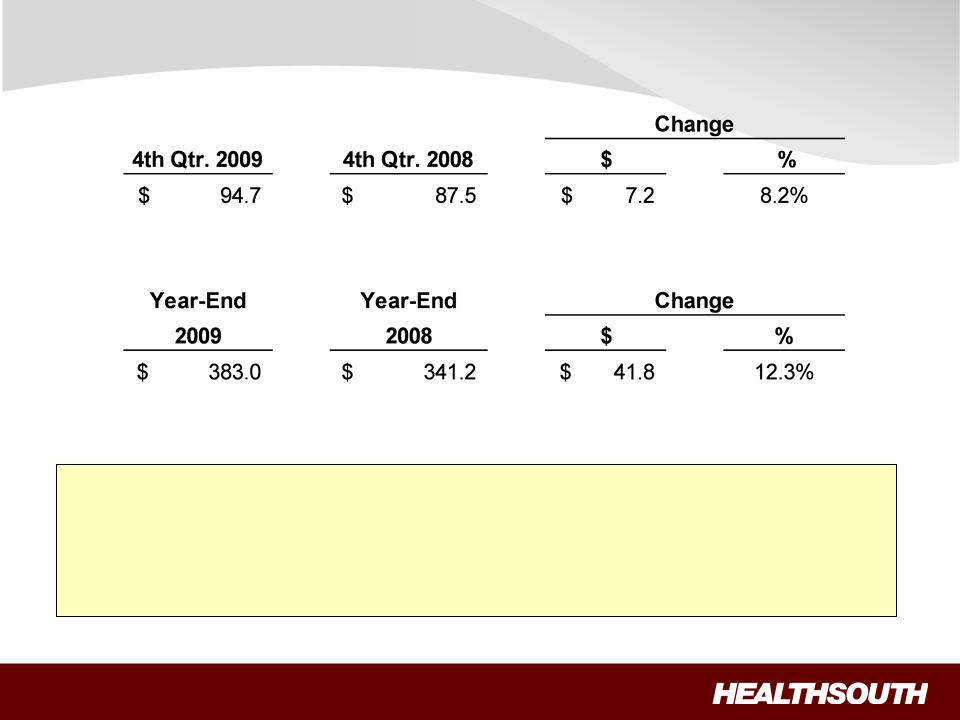
Adjusted Consolidated EBITDA
($ Millions)
+12.3%
90.8%
(1) Reconciliation to GAAP provided on slides 40 through 41.
Key Drivers:
üIncreased volumes
üImproved labor productivity
üDisciplined expense management
ü2.5% Medicare market basket increase effective October 1, 2009
Solid EBITDA and EPS Growth
Exhibit 99.1

8
(1) Based on four quarter trailing Adjusted Consolidated EBITDA of $383.0 million; see related debt schedule on slide 36, and reconciliation to
GAAP on slides 40 through 41.
GAAP on slides 40 through 41.
Debt to EBITDA 6.3x 6.3x 5.3x 4.3x (1)
Year-End 2011 Goal: 3.5x to 4.0x
Liquidity
Continued Debt Reduction and Deleveraging
Performance Highlights
Exhibit 99.1
9
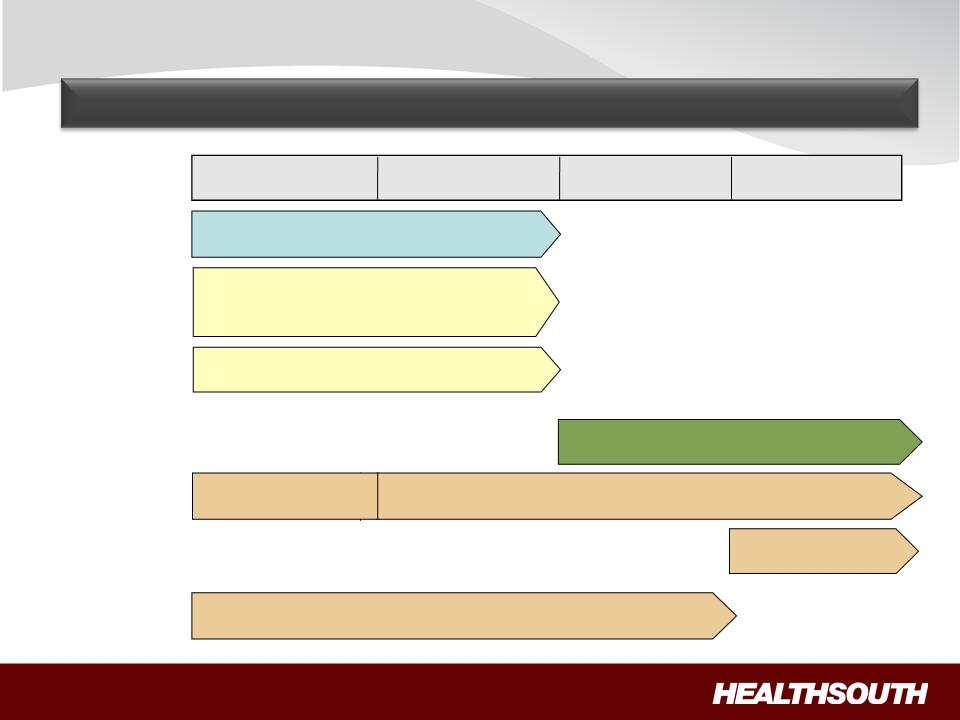
Business Outlook
3.5x to 4.0x Debt to EBITDA (by YE 2011)
(Exclusive of any E&Y settlement)
Organic growth through capacity
expansion and de novos
expansion and de novos
(~ $60 million in 2010)
IRF acquisitions/joint ventures
Deleveraging
Growth
Acquisitions of other,
complementary post-acute services
complementary post-acute services
Reform
1.Pricing
2.Bundling
Sector
Regulation
Regulation
Pilot/Demonstration
Projects
Projects
• LTCH: admission criteria; 25% Rule; MMSEA extension
• Home Health: outliers; reimbursement methodology
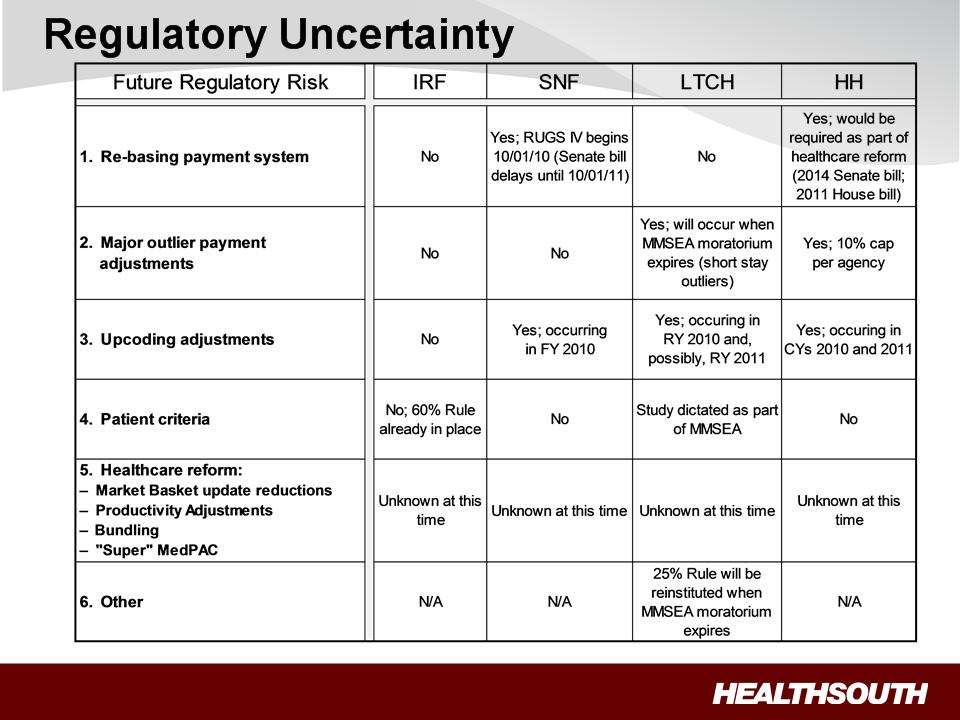
Deleveraging, Growth, Reform and Sector Regulation
No change Unknown at this time
2010 2011 2012 2013
Exhibit 99.1
10
Sources: Senate Reform Bill, CMS Regulatory published rules and MMSEA
Exhibit 99.1
11
2010 Guidance(1)
(1) Reconciliation to GAAP provided on slides 40 through 41.
(2) Adjusted income from continuing operations per diluted share.
Guidance Philosophy
Appropriately conservative at beginning of year; consistent
with past practices; does not include acquisitions.
with past practices; does not include acquisitions.
+4% to +6%
Considerations:
üContinued market share gains
üMedicare pricing
üIT “pilot” investment
Adjusted EPS(1)(2): $1.60 to $1.70
+10% to +17%
Considerations:
ü$5 million of additional stock-based compensation expenses
ü5 million more diluted shares (Securities Litigation Settlement)
üLIBOR remains unchanged
üTougher “comps”: $0.69 Adjusted EPS growth (+90.8%) 2009 over
2008
2008
Business
Model
+5% to +8%
+15% to +20%
ü Start-up costs at two new
hospitals
hospitals
ü TeamWorks investment
Exhibit 99.1

12
Summary
ü Industry Leader: Largest provider in attractive healthcare segment.
ü Strong Cash Flows: Directed toward debt reduction and growth.
ü Continued Deleveraging: Reduce leverage to between 3.5x and 4.0x
no later than YE 2011.
no later than YE 2011.
ü Solid Organic Growth: Volume growth + expense management.
ü Opportunistic, Disciplined Expansion: Capacity expansion and new
hospitals coming online over next three years.
hospitals coming online over next three years.
ü Well Positioned: High-quality + cost-effective provider; proven track
record of adapting to regulatory changes.
record of adapting to regulatory changes.
Value Proposition
Exhibit 99.1

13
Appendix
Exhibit 99.1
14
“The Basics”: Our Rehabilitation Hospitals
Major Services:
• Physicians: manage and treat medical needs of patients
• Rehabilitation Nursing: oversees treatment program of patient
• Physical Therapy: addresses physical function, mobility, safety
• Occupational Therapy: promotes independence and re-integration
• Speech-Language Therapy: treats communication & swallowing disorders
• Case Managers: coordinates care plan with physician, caregivers, family
• Post-discharge services: outpatient therapy and home health
Note: IRF hospitals are not CAPEX intensive:
ü No Emergency Rooms, ORs, Cath Labs, etc.
Exhibit 99.1
15
“The Basics”: Our Patients
94%
5%
1%
Referral Sources
Acute Care Hospitals
Physician Offices
Skilled Nursing Facilities
All patients are admitted by a physician:
Most Common Cases (2009)
1. Stroke 17.5%
2. Neurological 13.3%
3. Fracture of the lower extremity 11.7%
4. Debility 11.5%
5. Knee/Hip replacement 9.6%
6. Other orthopedic conditions 9.5%
7. Brain injury 7.4%
8. Cardiac conditions 4.7%
9. Spinal cord injury 3.6%
10. All other 11.2%
ü Physicians and acute hospital case managers are key decision-makers.
ü All IRF patients must meet medical necessity criteria.
ü All IRF patients must be medically stable and have potential to tolerate three hours
of therapy per day (minimum).
of therapy per day (minimum).
Exhibit 99.1
16
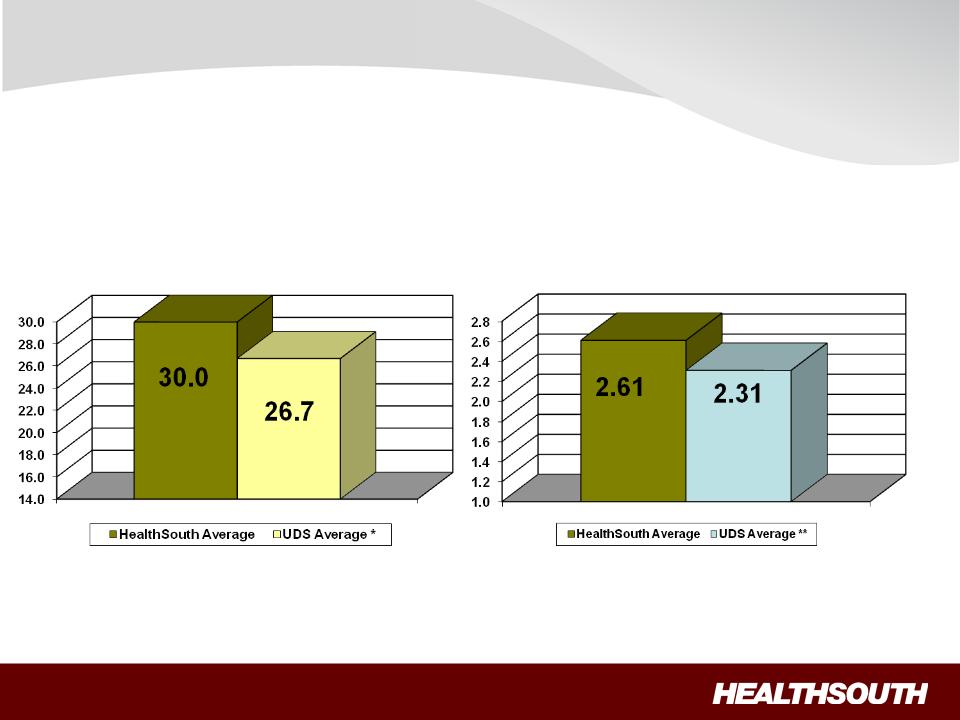
FIM Gain
LOS Efficiency
LOS Efficiency = Functional gain
divided by length of stay
divided by length of stay
Source: UDSmr Database - On Demand
Reports 2009 Year End Report
Reports 2009 Year End Report
FIM Gain = Change in Functional
Independent Measurement (based
Independent Measurement (based
on an 18 point assessment) from
Admission to Discharge
Admission to Discharge
** Average = Expected, Risk-adjusted LOS Efficiency
Operational Excellence = “High-Quality” Care
* Average = Expected, Risk-adjusted FIM Change Average
Exhibit 99.1
17
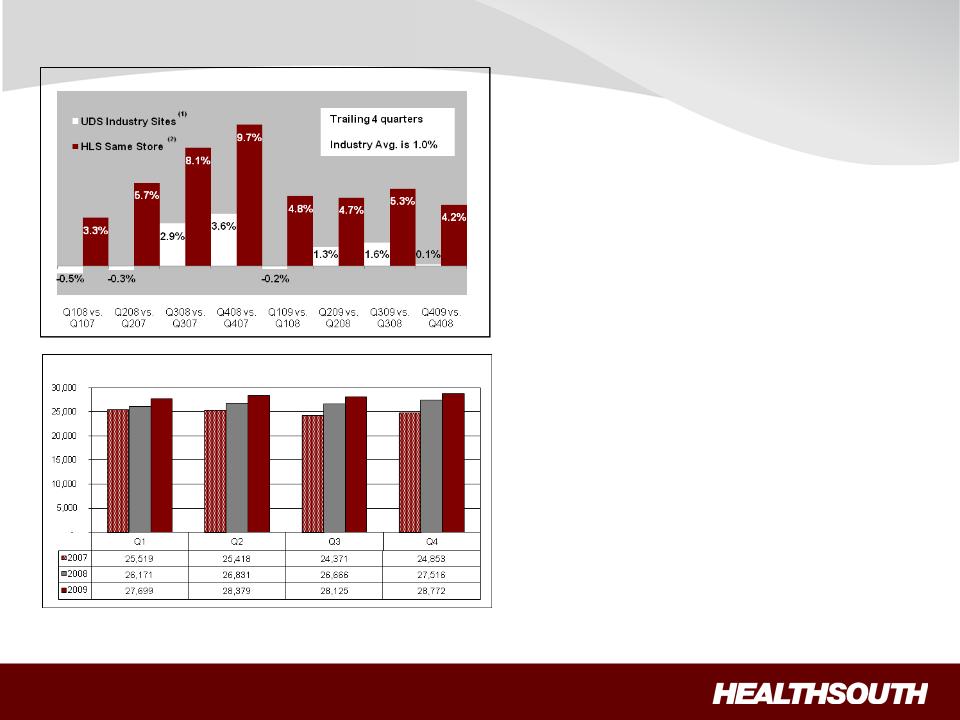
(1) Data provided by UDSMR, a data gathering and analysis organization for the rehabilitation industry; represents ~ 65-70% of industry, including 90 HealthSouth sites.
(2) Includes 90 consolidated HealthSouth inpatient rehab hospitals and six long-term acute-care hospitals.
Operational Excellence: Sustained Market Share Gains
HealthSouth vs. Industry
Quarterly Discharges
ü HealthSouth’s volume growth
has outpaced competitors’
has outpaced competitors’
ü TeamWorks = standardized
sales & marketing
sales & marketing
ü Capacity expansions will help
facilitate organic growth:
facilitate organic growth:
Ÿ ~ 100 new beds 2009
Ÿ ~ 100 new beds 2010
Exhibit 99.1
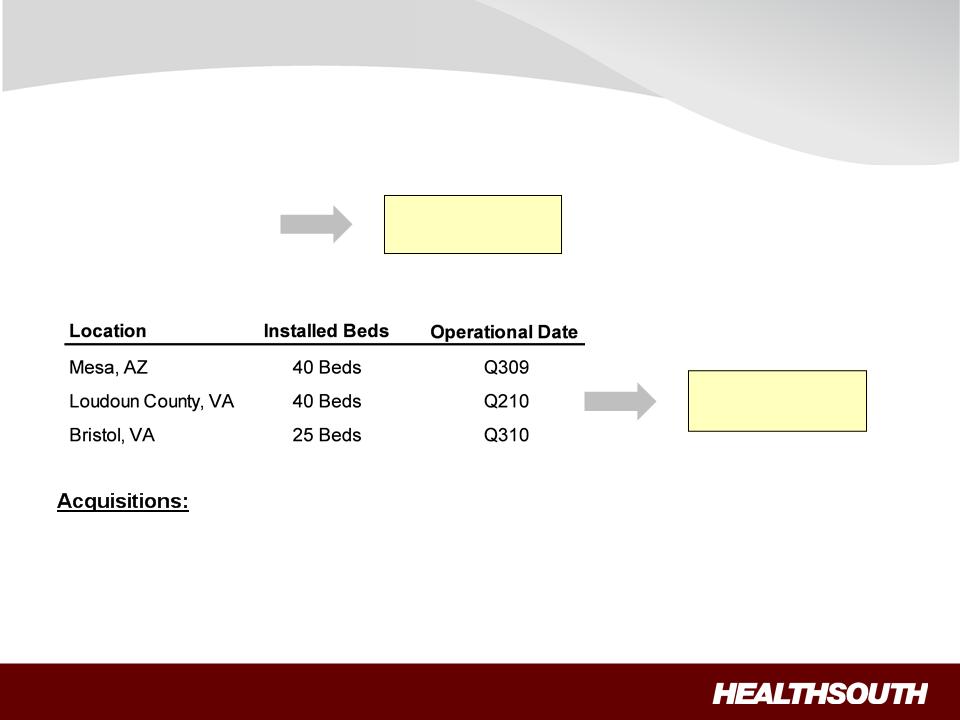
18
Capacity expansions:
• Approximately 100 beds to be added in 2010.
• Average investment per bed including renovation:
– $100K to $250K
De novos:
• Expanded joint venture with St. Vincent Health System in Little Rock, AR, through the
purchase of a 23-bed rehabilitation unit.
purchase of a 23-bed rehabilitation unit.
• Acquired the rehabilitation unit in Altoona, PA, through a newly formed joint venture and
relocated its operations to one of our hospitals.
relocated its operations to one of our hospitals.
Organic Growth
Cash pay-back:
6 - 7 years
Cash pay-back:
2 - 4 years
2 - 4 years
Exhibit 99.1

19
Operational Excellence = “Cost-Effective” Care
CMS Fiscal Year 2010 IRF Rate Setting File Analysis (1)
Freestanding (2) | Units (2) | Total | HealthSouth | ||
Hospitals (2) | |||||
Number of IRFs | 228 | 953 | 1,181 | 94 | |
Average # of Discharges per IRF | 649 | 237 | 316 | 822 | |
Outlier Payments as % of Total Payments | 1.32% | 4.08% | 3.00% | 0.43% | |
Average Estimated Total Payment per Discharge for FY 2010 | $16,452 | $16,741 | $16,626 | $15,996 | |
Average Estimated Cost per Discharge for FY 2010 | $14,021 | $17,207 | $15,945 | $12,633 |
Notes:
(1) All data provided was filtered and compiled from the Centers for Medicare and Medicaid Services (CMS) Fiscal Year 2010 IRF rate setting final
rule file found at http://www.cms.hhs.gov/InpatientRehabFacPPS/07_DataFiles.asp#TopOfPage. The data presented was developed entirely by
CMS and is based on its definitions which are different in form and substance from the criteria HealthSouth uses for external reporting purposes.
Because CMS does not provide its detailed methodology, HealthSouth is not able to reconstruct the CMS projections or the calculation.
(2) The CMS file contains data for each of the 1,181 inpatient rehabilitation facilities used to estimate the policy updates for the FY 2010 Final IRF-
PPS Rule. Most of the data represents historical information from the CMS fiscal year 2008 period and does not reflect the same HealthSouth
hospitals in operation today. The data presented was separated into three categories: Freestanding, Units, and HealthSouth. HealthSouth is a
subset of Freestanding and the Total.
Exhibit 99.1
20
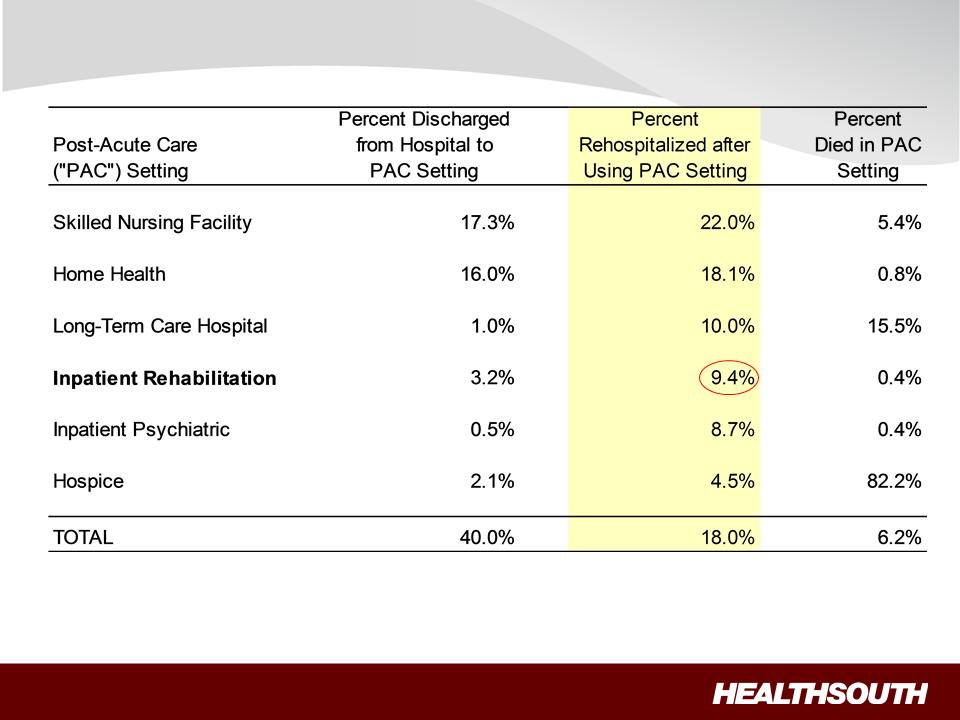
IRFs have Lower Readmission Rates
Note: Use of home health care and hospice is based on care that starts within three days of discharge. Other PAC care starts within one day of
discharge. Home health use includes episodes that overlap an inpatient stay.
discharge. Home health use includes episodes that overlap an inpatient stay.
Source: Medicare Payment Advisory Commission, “A Data Book: Healthcare spending and the Medicare program,” Chart 9-3 (June 2008)
Exhibit 99.1
21
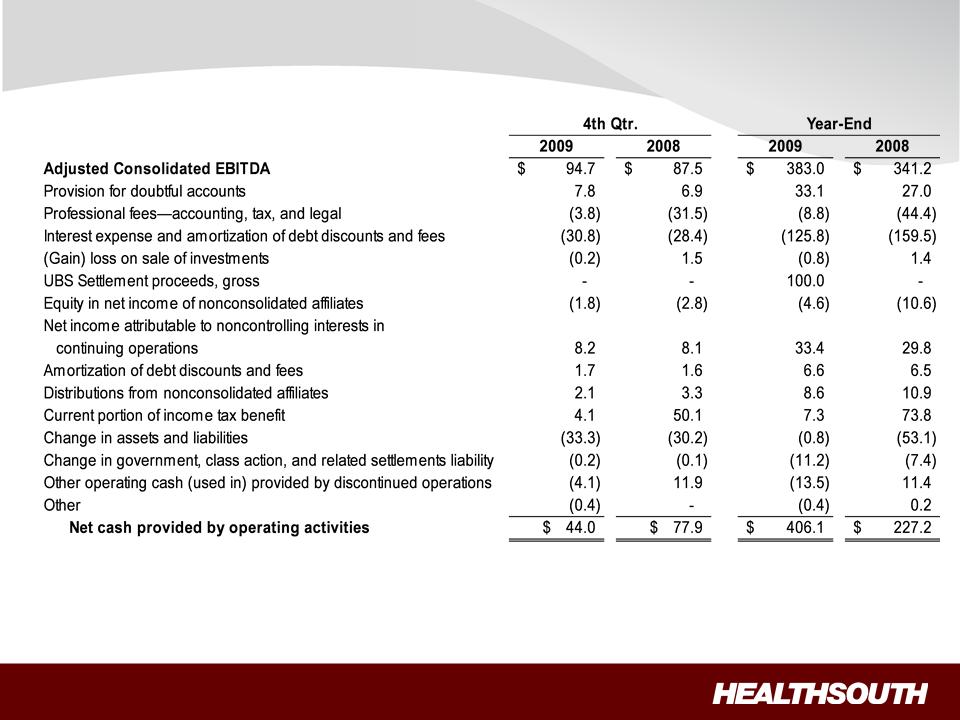
Free Cash Flow Reconciliation: Adjusted Consolidated EBITDA (1)
to Net Cash Provided by Operating Activities
to Net Cash Provided by Operating Activities
(1) Notes on page 41.
Exhibit 99.1
22
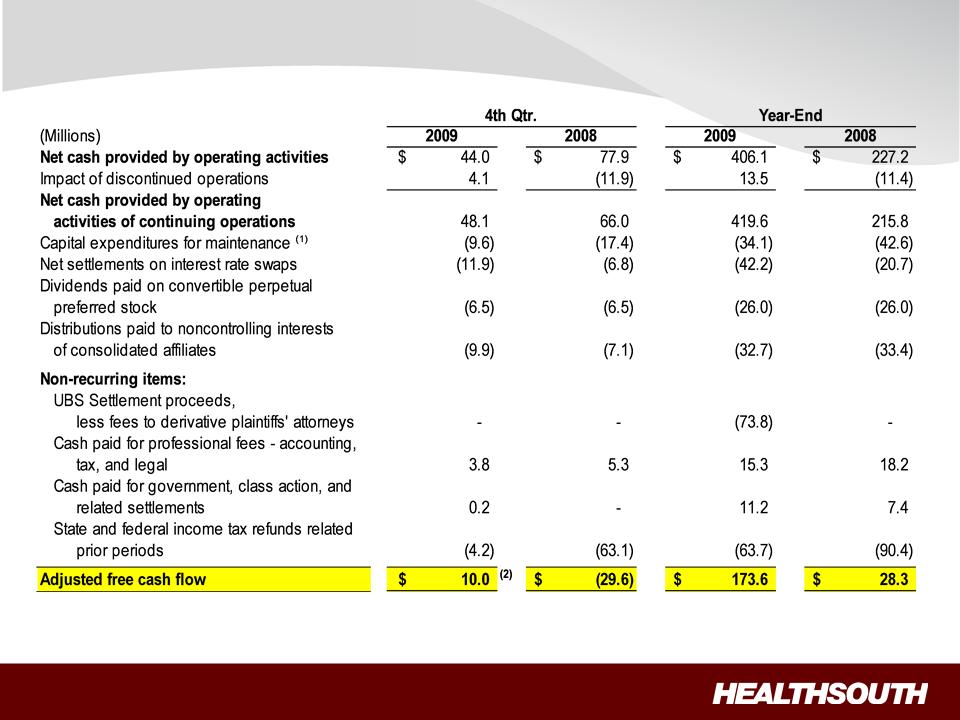
Free Cash Flow Reconciliation: Net Cash provided by Operating
Activities to Adjusted Free Cash Flow
Activities to Adjusted Free Cash Flow
(1) Includes capital expenditures for the hospital refresh program.
(2) Reflects seasonal use of cash related to interest and insurance payments.
Exhibit 99.1
23
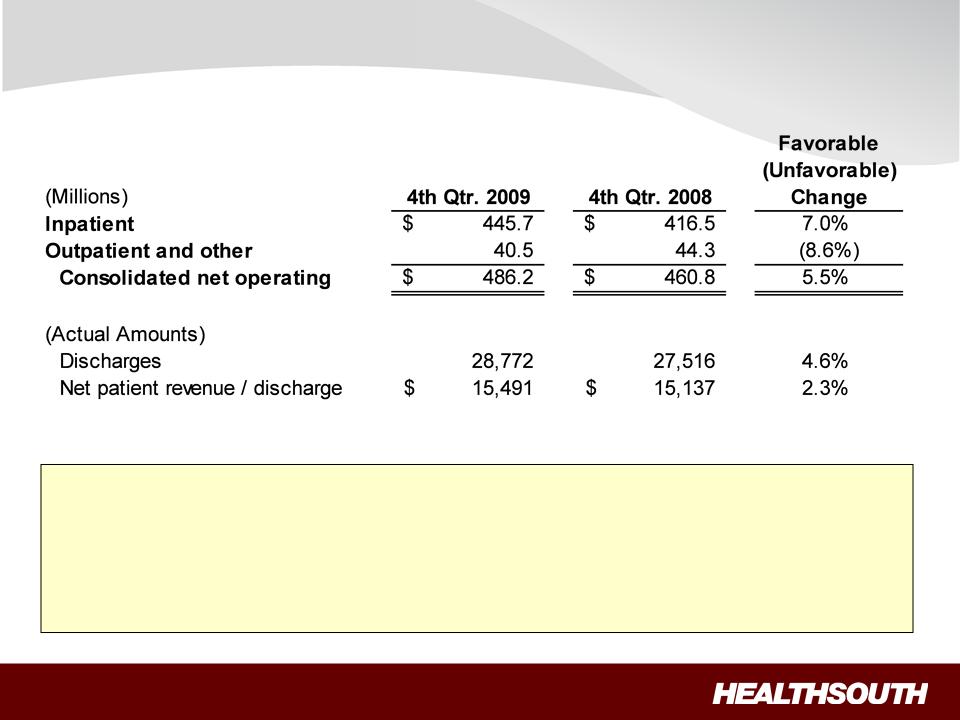
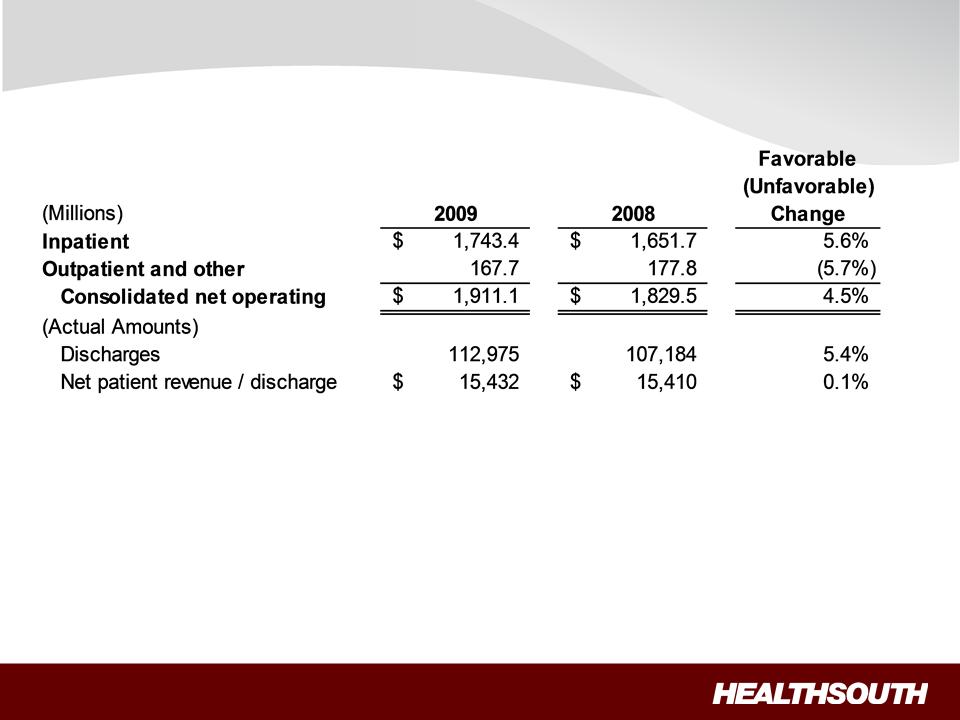
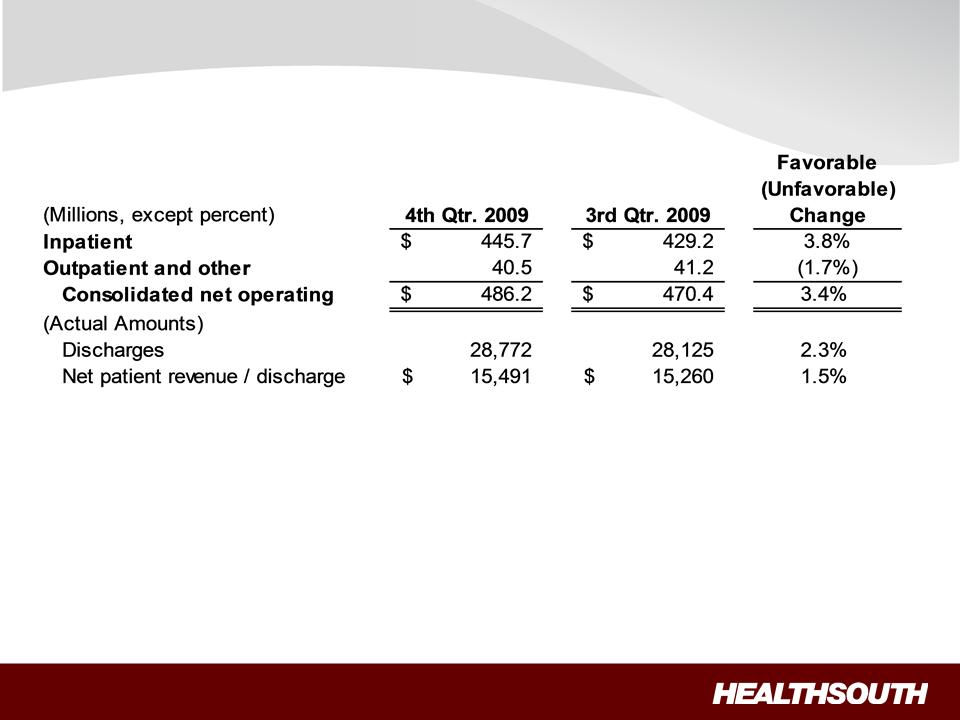
Revenues (Q4 2009 vs. Q4 2008)
• Inpatient revenue growth was driven by strong discharge volumes in Q4 2009 despite tough
comparisons in Q4 2008.
comparisons in Q4 2008.
– Volume growth was driven by the sustained sales and marketing effort.
– Same store discharge growth was 4.2%.
– Pricing reflects 2.5% Medicare market basket increase effective October 1, 2009.
• Outpatient revenue declined as a result of 10 fewer outpatient satellites quarter over quarter.
Exhibit 99.1
24
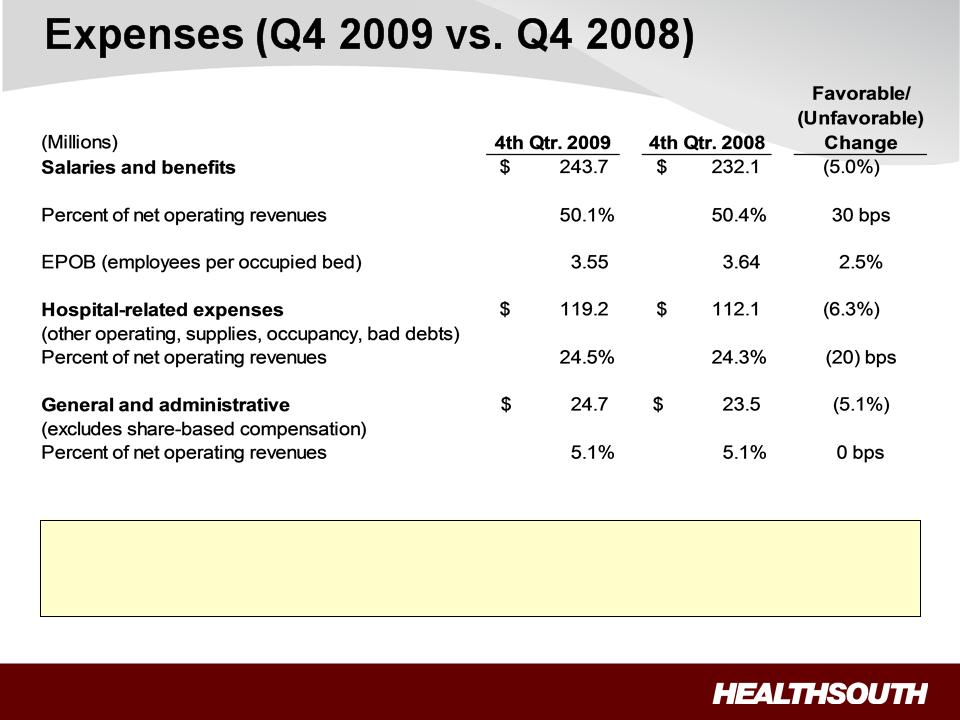
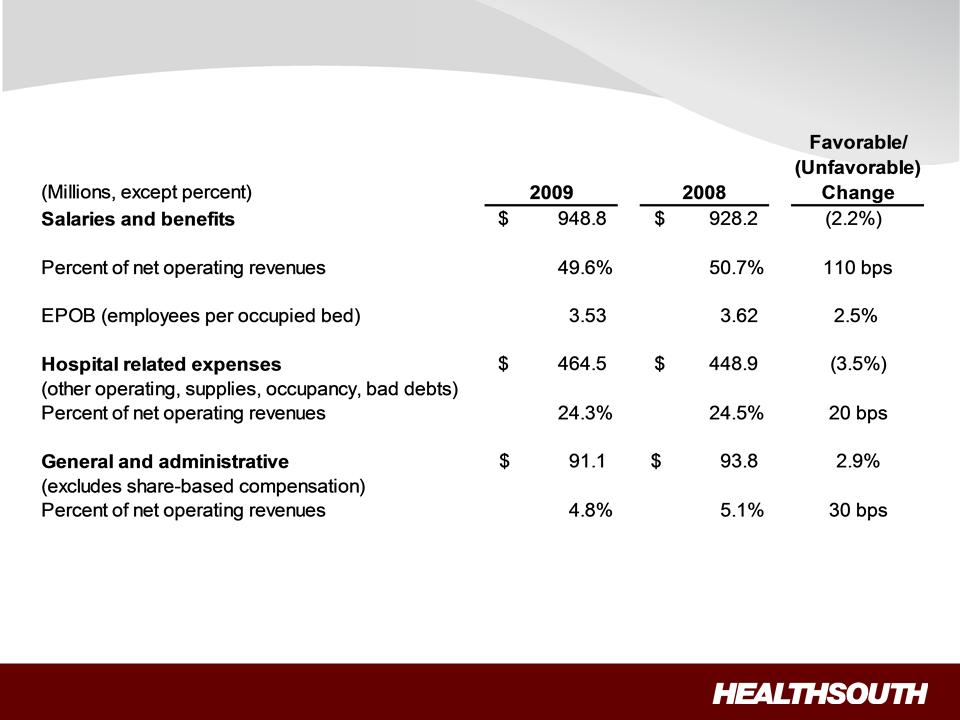
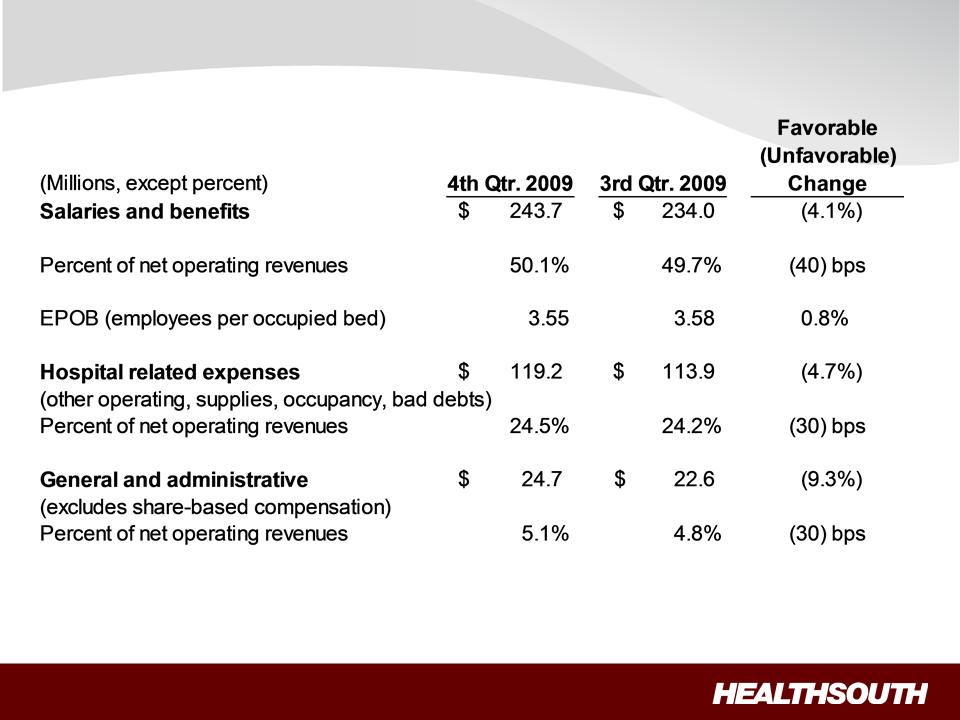
• Salaries and benefits increased as a result of an October 1, 2009, 2.3% merit increase.
– Continued improvement on labor productivity demonstrated by lower EPOB.
• Hospital-related expenses increased as a result of higher discharge volume.
Exhibit 99.1
25
Adjusted Consolidated EBITDA (1)
(Millions)
(Millions)
(1) Reconciliation to GAAP provided on slides 40 through 41.
• Improvements driven by:
– Increased volumes
– Improved labor productivity
– Disciplined expense management
– 2.5% Medicare market basket increase effective October 1, 2009
Exhibit 99.1
26
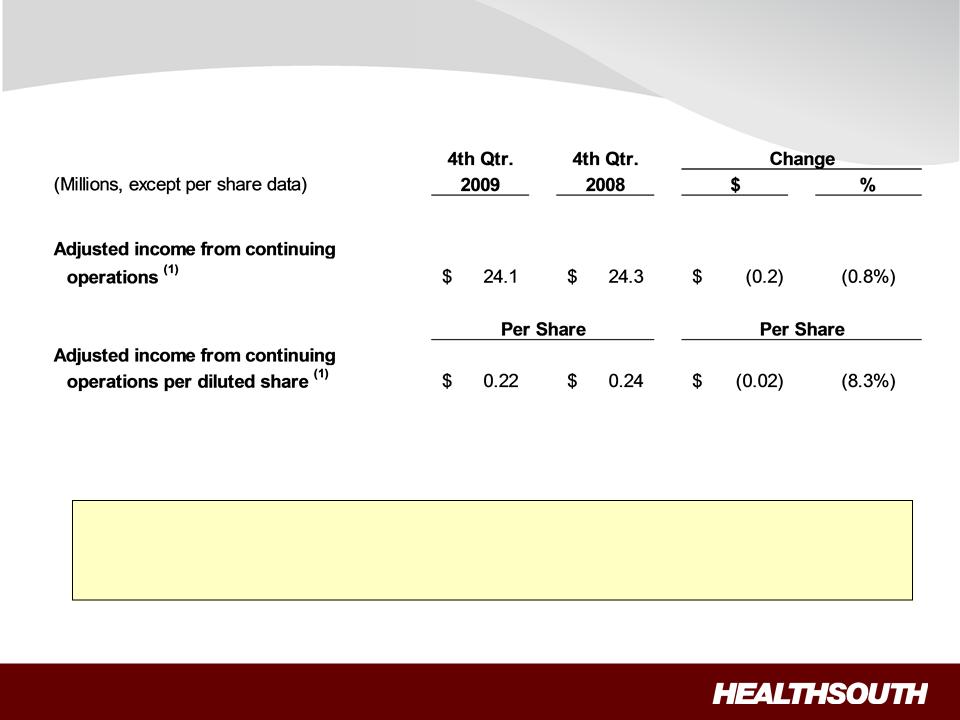
Adjusted Income per Diluted Share (4Q 2009)
(1) Reconciliation to GAAP provided on slides 40 through 41.
• The improvement in adjusted earnings per share, driven by higher Adjusted
Consolidated EBITDA and lower interest expense, was offset by a $15.6 million loss on
early extinguishment of debt.
Consolidated EBITDA and lower interest expense, was offset by a $15.6 million loss on
early extinguishment of debt.
– Interest expense was lower as a result of lower debt balances and a lower LIBOR rate.
Exhibit 99.1
27
(1) Reconciliation to GAAP provided on slides 40 through 41.
Exhibit 99.1
28
Revenues (Year-End)
Exhibit 99.1
29
Expenses (Year-End)
Exhibit 99.1
30
Revenues (Sequential)
Exhibit 99.1
31
Expenses (Sequential)
Exhibit 99.1
32
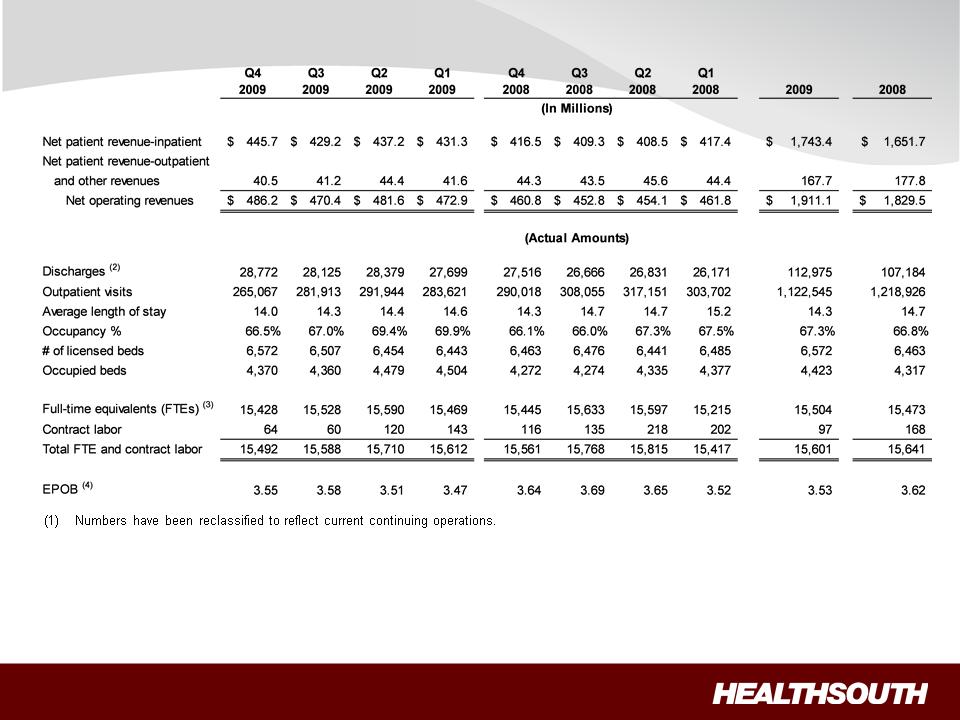
Operational and Labor Metrics (1)
(2) Represents discharges from HealthSouth’s 90 consolidated hospitals, which includes Mesa, Arizona starting in Q3 2009.
(3) Excludes approx. 400 full-time equivalents, who are considered part of corporate overhead with their salaries and benefits included in general
and administrative expenses in the Company’s condensed consolidated statements of operations. Full-time equivalents included in the above
table represent HealthSouth employees who participate in or support the operations of the Company’s hospitals.
and administrative expenses in the Company’s condensed consolidated statements of operations. Full-time equivalents included in the above
table represent HealthSouth employees who participate in or support the operations of the Company’s hospitals.
(4) Employees per occupied bed, or “EPOB,” is calculated by dividing the number of full-time equivalents, including an estimate of full-time
equivalents from the utilization of contract labor, by the number of occupied beds during each period. The number of occupied beds is determined
by multiplying the number of licensed beds by the Company’s occupancy percentage.
equivalents from the utilization of contract labor, by the number of occupied beds during each period. The number of occupied beds is determined
by multiplying the number of licensed beds by the Company’s occupancy percentage.
Exhibit 99.1
33
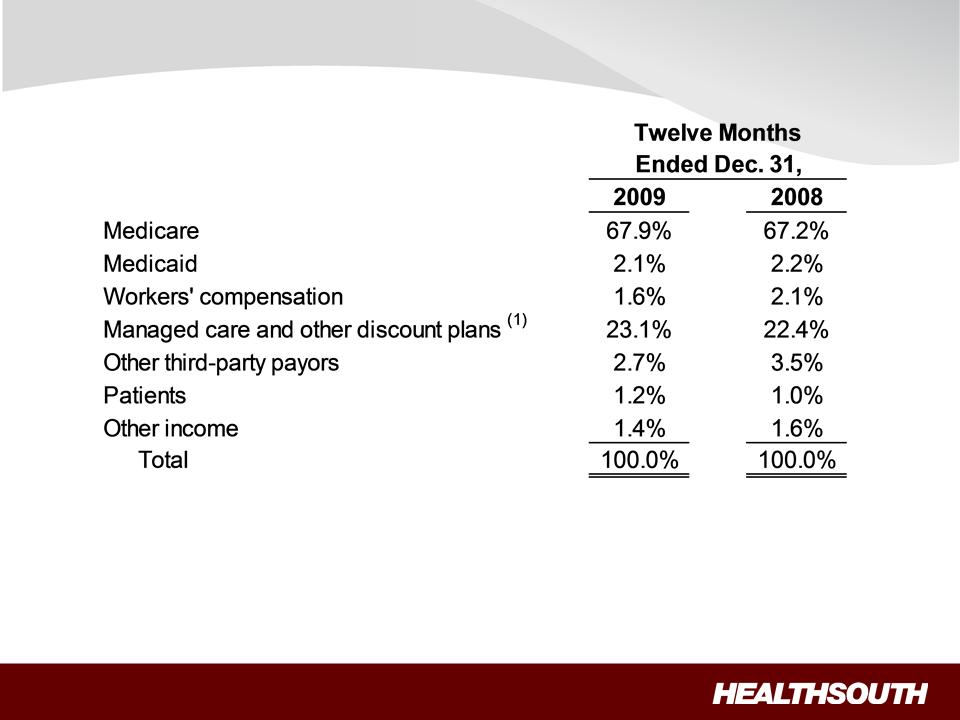
Payment Sources
(1) Managed Medicare revenues represent ~ 8% and 6% of total revenues for 2009 and 2008, respectively, and are included in “Managed care
and other discount plans.”
and other discount plans.”
Exhibit 99.1
34
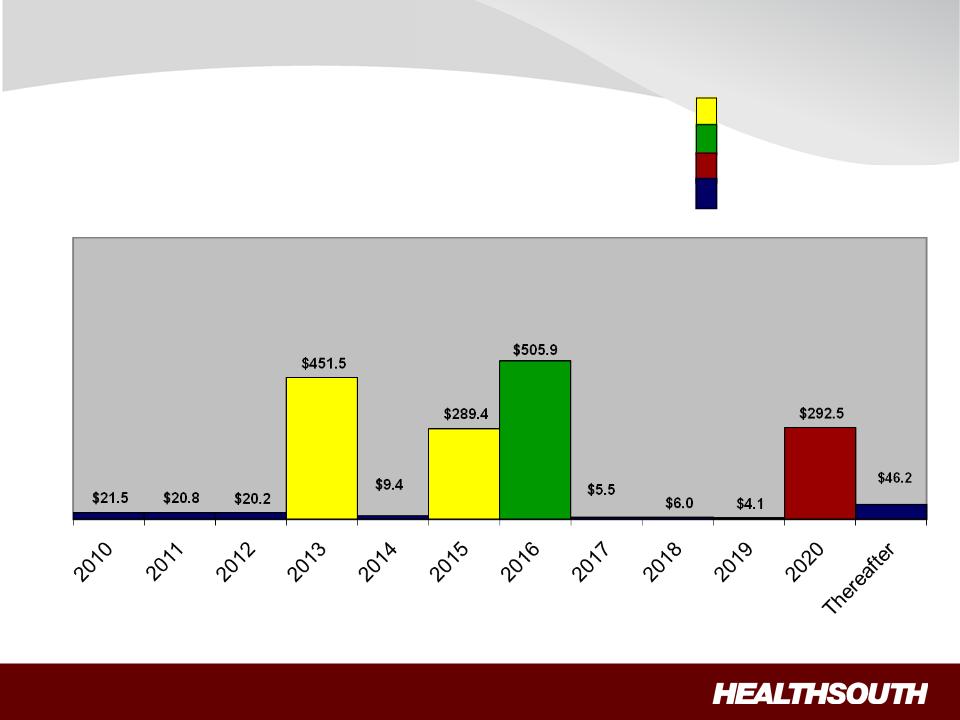
Debt Maturities: No Near-Term Financing Needs
(Millions)
= Term Loan maturities
= 10.75% Fixed
= 8.125% Fixed
= Capital leases and term
loan amortization
loan amortization
As of December 31, 2009
Exhibit 99.1
35
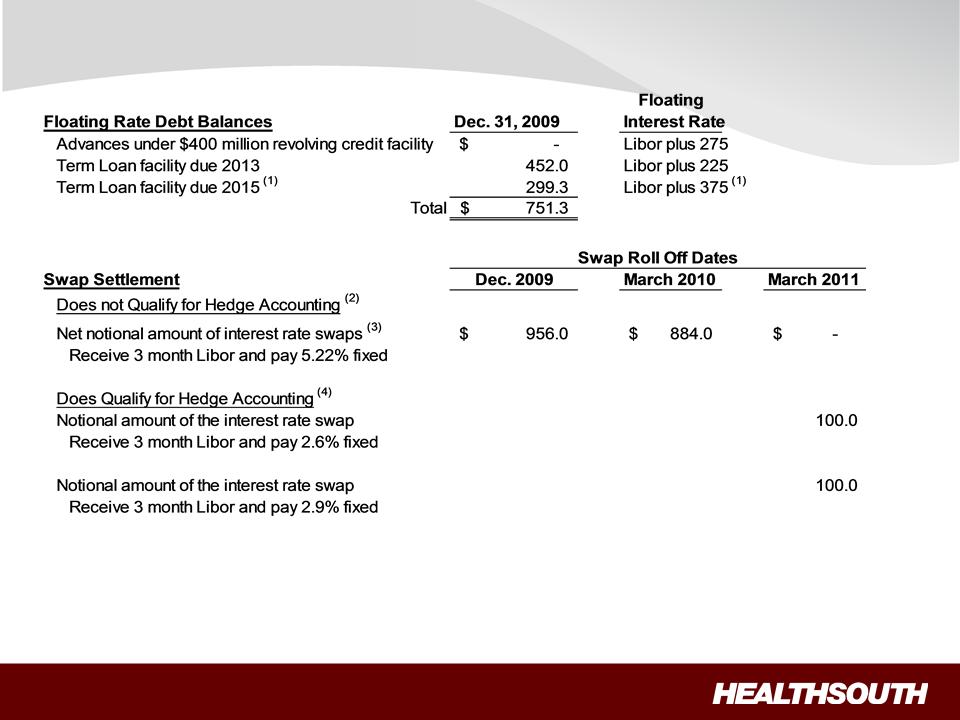
Interest Rate Swaps
(Millions)
(Millions)
(1) In October 2009, the credit agreement was amended. The maturity for $300 million of the term loan has been extended to 2015. The extended
portion of the term loan will bear an interest rate of Libor plus 375.
(2) Cash settlements flow through investing activities.
(3) In June 2009, we entered into a receive-fixed rate swap as a mirror offset to $100.0 million of the $1,056 million interest rate swap.
(4) Forward-starting interest rate swaps (designated as cash flow hedges). Cash settlements will flow through operating activities as part of interest
expense.
Exhibit 99.1
36
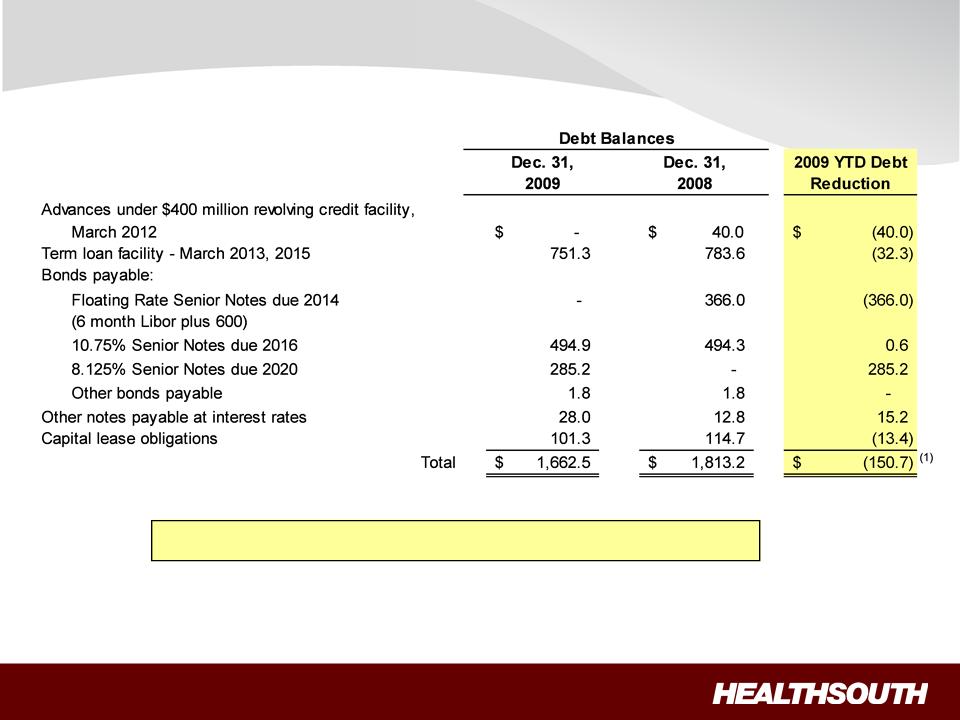
Debt Schedule
(Millions)
(Millions)
(1) The Company had $80.9 million in cash and cash equivalents as of December 31, 2009.
(2) Based on four quarter trailing Adjusted Consolidated EBITDA of $383.0 million and $341.2 million respectively. See reconciliation to GAAP
on slides 40 through 41.
on slides 40 through 41.
Debt to EBITDA(2) 4.3x 5.3x
Exhibit 99.1

37
Credit Ratings
Exhibit 99.1

38
Non-Operating Cash/Tax Position
Cash Refunds as of Dec. 31, 2009
• Federal tax recoveries virtually complete.
– Approx. $43 million received.
• State tax refunds in progress.
– Approx. $21 million received.
– Approx. $10 million net receivable on
the balance sheet.
Future Cash Tax Payments
• Expect to pay about $5-7 million per year of income
tax.
tax.
– State income tax.
– Alternative Minimum Tax (AMT).
• The Company does not expect to pay significant
federal income taxes for the next 10-12 years, due
to approximately $905 million in deferred tax assets
as of 12/31/09 outlined in the Form 10-K to be filed
with the SEC. The majority of the deferred tax asset
is related to net operating losses (NOLs).
federal income taxes for the next 10-12 years, due
to approximately $905 million in deferred tax assets
as of 12/31/09 outlined in the Form 10-K to be filed
with the SEC. The majority of the deferred tax asset
is related to net operating losses (NOLs).
– At this time, we do not believe the use
of NOLs will be limited before they
expire, however, no assurances can
be provided.
• HealthSouth is not currently subject to an annual
use limitation (AUL) under the Internal Revenue
Code section 382.
use limitation (AUL) under the Internal Revenue
Code section 382.
• If we experienced a “change of ownership” as
defined by the Internal Revenue Code section 382,
we would be subject to an AUL, which is equal to
the value of the company at the time of the “change
of ownership” multiplied by the long-term tax exempt
rate.
defined by the Internal Revenue Code section 382,
we would be subject to an AUL, which is equal to
the value of the company at the time of the “change
of ownership” multiplied by the long-term tax exempt
rate.
GAAP Considerations
• HealthSouth’s balance sheet currently
reflects a valuation allowance for the
potential value of NOLs and future
deductions. The valuation allowance is
approximately $893 million.
reflects a valuation allowance for the
potential value of NOLs and future
deductions. The valuation allowance is
approximately $893 million.
• GAAP tax rate will net to small amount for
foreseeable future as there will be a
reduction in the valuation allowance when
NOLs are utilized.
foreseeable future as there will be a
reduction in the valuation allowance when
NOLs are utilized.
Exhibit 99.1
39
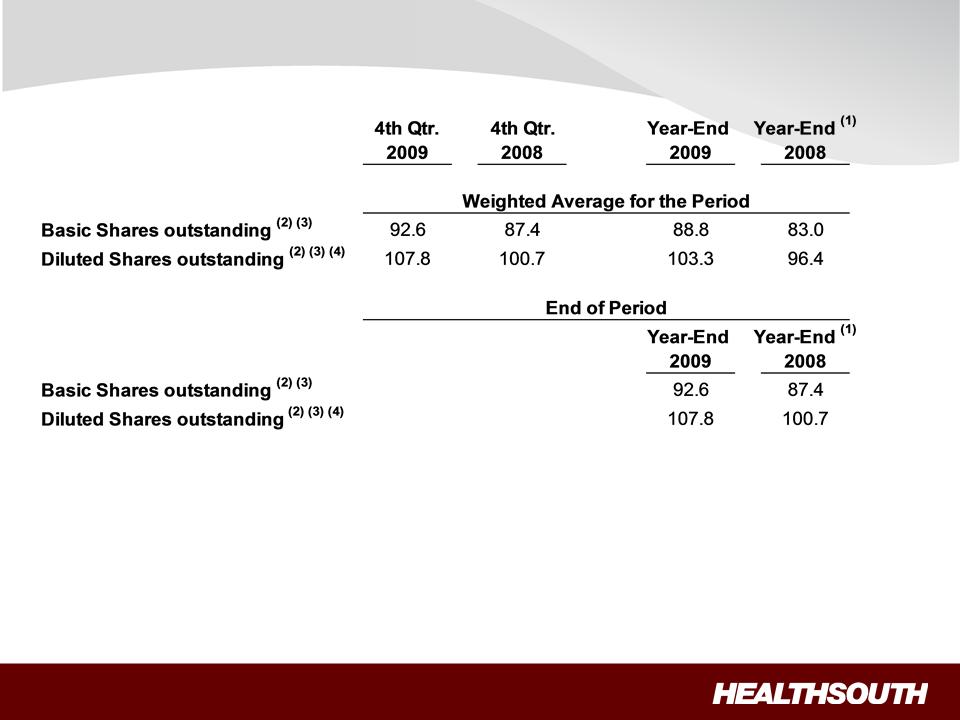
Outstanding Share Summary
(Millions)
(Millions)
Notes:
(1) Completed an equity offering for 8.8 million shares on June 27, 2008.
(2) Does not include 2.0 million warrants issued in connection with a January 2004 loan repaid to Credit Suisse First Boston. In connection with this
transaction, we issued warrants to the lender to purchase two million shares of our common stock. Each warrant has a term of ten years from the
date of issuance and an exercise price of $32.50 per share. The warrants were not assumed exercised for dilutive shares outstanding because
they were antidilutive in the periods presented.
(3) The agreement to settle our class action securities litigation received final court approval in January 2007. These shares of common stock and
warrants were issued on September 30, 2009. The 5.0 million of common shares are now included in the outstanding shares. The warrants at a
strike price of $41.40 were not assumed exercised for the dilutive shares outstanding because they are anti-dilutive in the periods presented.
warrants were issued on September 30, 2009. The 5.0 million of common shares are now included in the outstanding shares. The warrants at a
strike price of $41.40 were not assumed exercised for the dilutive shares outstanding because they are anti-dilutive in the periods presented.
(4) The difference between the basic and diluted shares outstanding is primarily related to our convertible perpetual preferred stock.
Exhibit 99.1
40
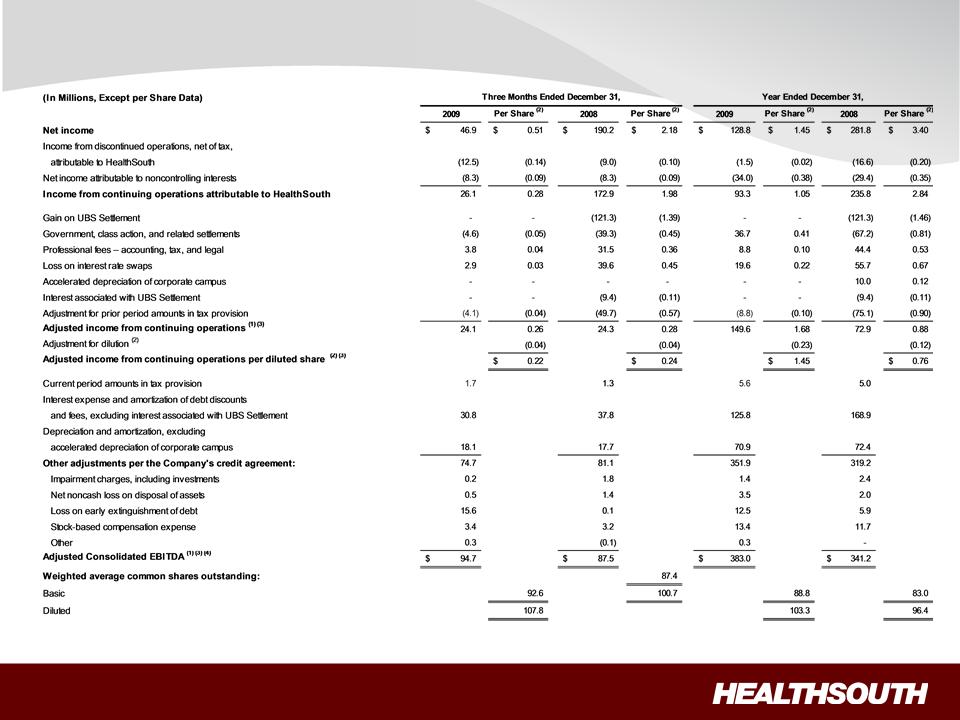
Three & Twelve Months Reconciliation of Net Income to Adjusted Income
from Continuing Operations and Adjusted Consolidated EBITDA (1) (3)
from Continuing Operations and Adjusted Consolidated EBITDA (1) (3)
(1) (2) (3) (4) - Notes on page 41.
Exhibit 99.1

41
Reconciliation Notes
1. Adjusted income from continuing operations and Adjusted Consolidated EBITDA are
non-GAAP financial measures. The Company’s leverage ratio (Total Consolidated Debt
to Adjusted Consolidated EBITDA for the trailing four quarters) is, likewise, a non-GAAP
financial measure. Management and some members of the investment community
utilize adjusted income from continuing operations as a financial measure and Adjusted
Consolidated EBITDA and leverage ratio as liquidity measures on an ongoing basis.
These measures are not recognized in accordance with GAAP and should not be
viewed as an alternative to GAAP measures of performance or liquidity. In evaluating
these adjusted measures, the reader should be aware that in the future HealthSouth
may incur expenses similar to the adjustments set forth above.
2. Per share amounts for each period presented are based on basic weighted average
common shares outstanding for all amounts except adjusted income from continuing
operations per diluted share, which is based on diluted weighted average shares
outstanding. The difference in shares between the basic and diluted shares outstanding
is primarily related to our convertible perpetual preferred stock.
3. Adjusted income from continuing operations per diluted share and Adjusted
Consolidated EBITDA are two components of our guidance.
Consolidated EBITDA are two components of our guidance.
4. The Company’s Credit Agreement allows certain other items to be added to arrive at
Adjusted Consolidated EBITDA, and there may be certain other deductions required.
Adjusted Consolidated EBITDA, and there may be certain other deductions required.