Third Quarter 2010 Earnings Call
Supplemental Slides
Exhibit 99.2
The information contained in this presentation includes certain estimates, projections and other
forward-looking information that reflect our current views with respect to future events and financial
performance. These estimates, projections and other forward-looking information are based on
assumptions that HealthSouth believes, as of the date hereof, are reasonable. Inevitably, there will
be differences between such estimates and actual results, and those differences may be material.
There can be no assurance that any estimates, projections or forward-looking information will be
realized.
realized.
All such estimates, projections and forward-looking information speak only as of the date hereof.
HealthSouth undertakes no duty to publicly update or revise the information contained herein.
You are cautioned not to place undue reliance on the estimates, projections and other forward-
looking information in this presentation as they are based on current expectations and general
assumptions and are subject to various risks, uncertainties and other factors, including those set
forth in the Form 10-K for the year ended December 31, 2009, our Form 10-Q for the quarters ended
March 31, 2010, June 30, 2010, and September 30, 2010, when filed, and in other documents we
previously filed with the SEC, many of which are beyond our control, that may cause actual results
to differ materially from the views, beliefs and estimates expressed herein.
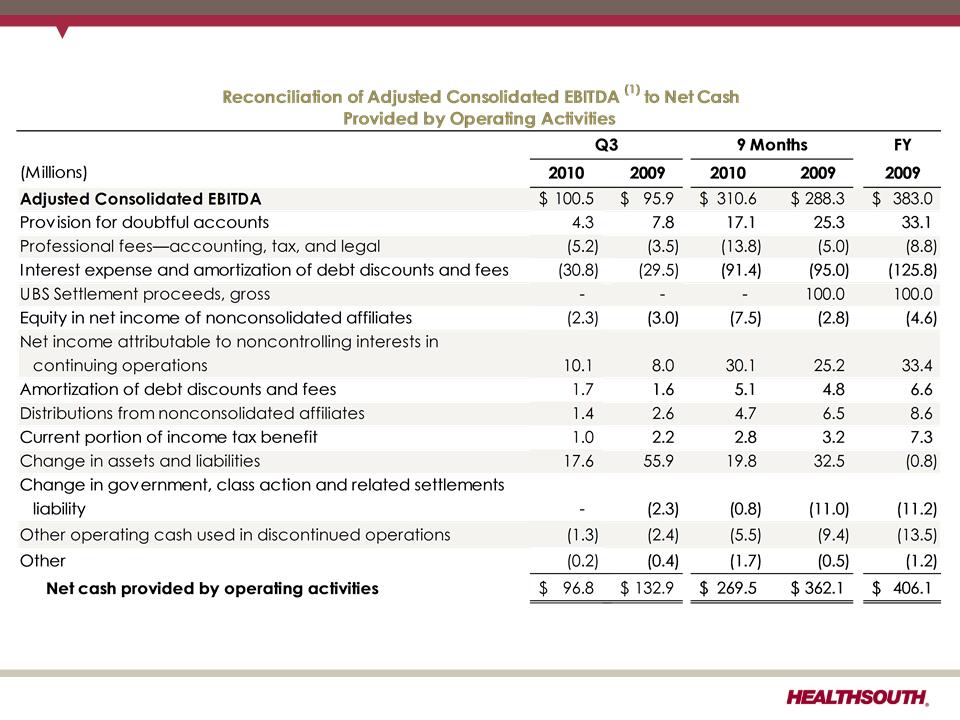
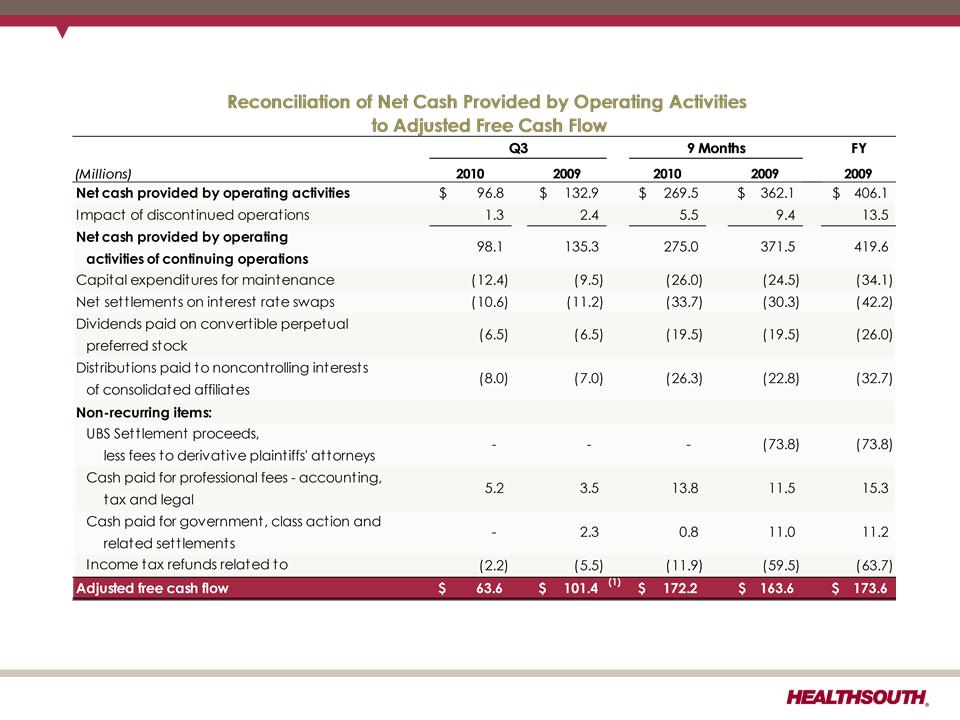
Note Regarding Presentation of Non\-GAAP Financial Measures
The following presentation includes certain “non-GAAP financial measures” as defined in
Regulation G under the Securities Exchange Act of 1934. Schedules are attached that reconcile
the non-GAAP financial measures included in the following presentation to the most directly
comparable financial measures calculated and presented in accordance with Generally
Accepted Accounting Principles in the United States. Our Form 8-K, dated October 28, 2010, to
which the following supplemental slides are attached as Exhibit 99.2, provides further explanation
and disclosure regarding our use of non-GAAP financial measures and should be read in
conjunction with these supplemental slides.
Forward-Looking Statements
2
Exhibit 99.2
3
Exhibit 99.2
Q3 2010 Summary (Q3 2010 vs. Q3 2009)
ü Revenue growth of 4.3% in line with expectations
― Inpatient revenue growth of 5.3% driven by price and volume
― Outpatient and other revenue declined 5.6% on 9 fewer outpatient clinics
― Discharge growth 2.5%; same-store discharge growth 0.4%
ü Disciplined expense management
― SWB as a percent of revenue increased 50 bps.
§ Higher licensed employee mix due to implementation of CMS
coverage requirements
§ Ramping up of new hospitals
§ Lower outpatient revenue
― Lower than expected bad debt expense offsetting increased self-insurance
costs and the TeamWorks investment
4
Exhibit 99.2
Q3 2010 Summary (Q3 2010 vs. Q3 2009) continued
5
ü Grew Adjusted Consolidated EBITDA by 4.8%
― Driven by higher revenue
― Offset by higher non-controlling interests expense
§ Driven by growth in revenues at JV hospitals
ü Continued strong free cash flow generation (1)
― YTD free cash flow generation increased from $163.6 million to $172.2 million.
ü Initiated the capital structure enhancements
― Launched the issuance of two new senior notes
― Initiated the syndication of a new credit facility/agreement with up to $500
million maturing in 2015
― Proceeds to be used along with cash on hand to refinance the existing
revolving credit facility and two term loans
(1) Reconciliation to GAAP provided on slides 33 and 34.
Exhibit 99.2
Q3 2010 Summary (Q3 2010 vs. Q3 2009) continued
ü Credit rating agency upgrades from both Moodys and S&P
ü Disciplined growth:
― Purchased Sugar Land Rehabilitation Hospital, a 50-bed inpatient rehabilitation
hospital located in Houston, TX, on September 20, 2010.
― Began accepting patients at the joint venture hospital in Bristol, VA.
― Purchased a 30-bed unit in Ft. Smith, AR. on September 30, 2010.
6
S&P | Moodys | |
Corporate Rating | B to B+ | B2 to B1 |
Revolver Rating | BB- to BB | Ba3 to Ba1 |
Senior Notes Rating | CCC+ to B+ | Caa1 to B2 |
Exhibit 99.2
HealthSouth Functional Outcomes Continue to Outpace Industry Average
HealthSouth Average
UDS Average*
FIM Gain
LOS Efficiency
* Average = Expected, Risk-adjusted
Source: UDSmr Database - On Demand Report: Q3 2010 Report
FIM Gain
Change in Functional
Independence
Measurement (based
Independence
Measurement (based
on an 18 point
assessment) from
admission to discharge.
assessment) from
admission to discharge.
LOS Efficiency
Functional gain divided
by length of stay.
by length of stay.
High-Quality Care
7
Exhibit 99.2
Revenues (Q3 2010 vs. Q3 2009)
• Inpatient revenue growth was driven by:
– 2.25% Medicare market basket update
– Discharge growth of 2.5% driven by new hospitals
– Same store discharge growth 0.4%
• Outpatient revenue declined primarily as a result of 9 fewer outpatient
rehabilitation satellite clinics quarter over quarter.
8
Exhibit 99.2
• SWB as a percent of revenue increased 50 bps.
– Higher licensed employee mix due to implementation of CMS coverage
requirements
requirements
– Ramp up phase at new hospitals
– Lower outpatient revenue
• Lower than expected bad debt expense offset the increase in self-insurance costs
and the TeamWorks investment.
9
Exhibit 99.2
Adjusted Consolidated
EBITDA Change
EBITDA Change
Q3 9 Months
+$4.6M +$22.3M
+4.8% +7.7%
Improvements driven by:
•Pricing
•Volume
•Disciplined expense
management
management
Improvements benefited
from:
from:
•Lower bad debt expense
Offset by:
•Ramp up of new hospitals
•Higher non-controlling
interests expense
interests expense
•Increased self-insurance
costs
costs
•TeamWorks investment
Adjusted Consolidated EBITDA (1)
(1) Reconciliation to GAAP provided on slides 33 through 34.
In arriving at Adjusted Consolidated EBITDA, the following were excluded from line items:
(2) Stock-based compensation expense of $3.4, $3.4, $11.2 and $9.9 million, respectively, reduced general and administrative expenses.
(3) Impairments related to investments of $0.0, million, $0.4 million, $0.0, and $1.3 million, respectively, increased other income.
(4) Noncontrolling interests related to discontinued operations of $0.0, $0.0, $0.0 and $0.5 million, respectively, reduced noncontrolling
interests.
interests.
10
Exhibit 99.2
Adjusted Income per Diluted Share (1)
(1) Reconciliation to GAAP provided on slides 33 through 34.
Adjusted EPS Change
Q3 9 Months
+$0.01 +$0.15
+2.4% +12.5%
Improvements driven by:
• Higher Adjusted
Consolidated EBITDA
Consolidated EBITDA
• Lower provision for
income tax
income tax
Offset by:
•5 million shares issued on
September 30, 2009, related
to the 2006 securities
litigation settlement
September 30, 2009, related
to the 2006 securities
litigation settlement
•Higher interest expense
11
Exhibit 99.2
Adjusted Free Cash Flow
12
(1) For additional information on non-recurring items, see slide 31.
• Continued strong cash flow generation
– Q3 2009 working capital benefited as a result of $19 million for interest payment
accrual timing and $28 million in receivables due to suspension of Medicare
denials and enhanced collections.
accrual timing and $28 million in receivables due to suspension of Medicare
denials and enhanced collections.
Exhibit 99.2
Debt to
EBITDA 6.3x 6.3x 5.3x 4.3x 4.1x (1)
($ Billions)
Year-End 2010 Goal: 3.75x to 4.00x
(1) Based on trailing, four-quarter Adjusted Consolidated EBITDA of $405.3 million; reconciliation to GAAP provided on slides 33 and 34.
(2) Cash settlements flow through investing activities for swaps that do not qualify for hedge accounting. Notional amount of $884 million
receives 3-month LIBOR and pays 5.22% fixed until expiration in March of 2011.
(3) Forward-starting interest rate swaps (designated as cash flow hedges) were terminated as part of the refinancing in October of 2010.
Debt Outstanding, Liquidity and Swaps
Debt Outstanding
Liquidity
13
Exhibit 99.2
(2) Assumes 3 month LIBOR of 0.39%.
Debt Maturity Profile (1)
14
•No near-term refinancing requirements
•Flexibility to repay or refinance the 10.75%
notes callable beginning in June 2011.
•More flexible covenants
Annualized Cash Effect of Refinancing | Cash |
Increased interest expense (2) | $18.0 |
Reduction in principal amortization requirements | ($7.5) |
Total increase in cash payments | $10.5 |
Exhibit 99.2
Debt Schedule and Interest Expense
(1) Based on trailing, four-quarter Adjusted Consolidated EBITDA of $405.3 million; reconciliation to GAAP provided on slides 33 through 34.
(2) Based on debt balances on September 30, 2010
(3) Assumes 3 month LIBOR of 0.39%.
15
Exhibit 99.2
2010 Guidance - Adjusted Consolidated EBITDA (1)
Original Guidance (February 23, 2010) $397M to $407M | Revised Guidance (August 2, 2010) $402M to $410M | Revised Guidance (October 29, 2010) $407M to $412M |
16
• Discharge volume
growth of 2.5% to
3.5%
growth of 2.5% to
3.5%
• Q4 2010 bad
debt ~ 1.5%
debt ~ 1.5%
• Net Medicare market
basket price increase
of 2.1%
basket price increase
of 2.1%
Assumptions:
(1) Reconciliation to GAAP provided on slides 33 through 34.
Exhibit 99.2
2010 Guidance - Adjusted Earnings per Share (1)
Original Guidance (February 23, 2010) $1.60 to $1.70 | Revised Guidance (August 2, 2010) $1.66 to $1.74 | Revised Guidance (October 29, 2010) $1.57 to $1.62 |
17
Impact of refinancing:
• $12.0 million or $0.11
per diluted share loss
on early
extinguishment
of debt
per diluted share loss
on early
extinguishment
of debt
• $3.4 million or $0.03 per
diluted share higher
interest expense
in Q4 2010
diluted share higher
interest expense
in Q4 2010
Assumptions:
(1) Reconciliation to GAAP provided on slides 33 through 34.
Exhibit 99.2
Business Outlook
Business Model
• 5 - 8% annual Adjusted Consolidated EBITDA growth (1)
• 15 - 20% annual Adjusted EPS growth (1) (2)
Strategy
(1) Reconciliation to GAAP provided on slides 33 and 34.
(2) Adjusted income from continuing operations per diluted share.
(3) Exclusive of any E&Y recovery.
2010
2011
2012
2013
Deleveraging (3)
Goal: < 4.0x
debt to EBITDA
debt to EBITDA
Goal: ~ 3.5x
debt to EBITDA
debt to EBITDA
Goal: ~ 3.0x
debt to EBITDA
debt to EBITDA
Growth
Organic growth (includes capacity expansions)
De novos (~ 2-3/year)
IRF acquisitions (~ 2-3/year)
Opportunistic, disciplined acquisitions
of complementary post-acute services
Operational
Enhancement
Enhancement
• TeamWorks = Care Management
• “CPR” (Comfort, Professionalism,
Respect) Initiative
Respect) Initiative
18
Exhibit 99.2
Appendix
19
Exhibit 99.2
Future Regulatory Risk | IRF | SNF | LTCH | HH | |
1. Re-basing payment system | No | Yes; RUGS IV and MDS 3.0 being implemented FY 2011/2012 | No | Yes; would be required as part of PPACA starting in 2014 | |
2. Major outlier payment adjustments | No | No | Yes; will occur when MMSEA relief expires (short stay outliers) | Yes; 10% cap per agency; 2.5% taken out of outlier pool (per PPACA) | |
3. Upcoding adjustments | No | Yes; occurring in FY 2010 | Yes; occurring in FY 2010 and proposed (2.5%) for FY 2011 | Yes; occurring in CYs 2010 (-2.75%), and proposed (-3.79%) for 2011 and 2012 | |
4. Patient criteria | No; 60% Rule already in place | No | Study dictated as part of MMSEA | PPACA requires a patient - physician “face-to-face” encounter; new therapy coverage proposed | |
5. Healthcare Reform | |||||
– Market basket update reductions | – Known | – Known | – Known | – Known | |
– Productivity adjustments | – Begins 2012 | – Begins 2012 | – Begins 2012 | – Begins 2015 | |
– Bundling | – Pilot to be established by 2013 | – Pilot to be established by 2013 | – Pilot to be established by 2013 | – Pilot to be established by 2013 | |
– Independent Payment Advisory Board | – FY 2019 | – FY 2015 | – FY 2019 | – CY 2015 | |
– New quality reporting requirements | – Begins 2014 | – N/A | – Begins 2014 | – N/A | |
– Value based purchasing | – Pilot begins 2016 | – Post 2012 | – Pilot begins 2016 | – Post 2012 | |
6. Other | N/A | Forecast error being implemented in FY 2011 | 25% Rule regulatory relief expires in 2012/2013; prohibition on new LTCHs through 2012 | Limits on transfer of ownership |
Regulatory Uncertainty
Sources: Healthcare Reform Bill (PPACA, HERA),CMS Regulatory published rules and MMSEA
20
Exhibit 99.2
Cost-Effective Care
CMS Fiscal Year 2011 IRF Rate Setting File Analysis (1)
Freestanding (2) | Units (2) | Total | HealthSouth | ||
Hospitals (2) | |||||
Number of IRFs | 230 | 941 | 1,171 | 91 | |
Average # of Discharges per IRF | 708 | 243 | 335 | 942 | |
Outlier Payments as % of Total Payments | 1.45% | 4.08% | 3.00% | 0.26% | |
Average Estimated Total Payment per Discharge for FY 2011 | $16,777 | $17,231 | $17,042 | $16,197 | |
Average Estimated Cost per Discharge for FY 2011 | $14,202 | $17,940 | $16,386 | $12,347 |
Notes:
(1) All data provided was filtered and compiled from the Centers for Medicare and Medicaid Services (CMS) Fiscal Year 2011 IRF rate setting Final Rule
file found at http://www.cms.hhs.gov/InpatientRehabFacPPS/07_DataFiles.asp#TopOfPage. The data presented was developed entirely by CMS
and is based on its definitions which are different in form and substance from the criteria HealthSouth uses for external reporting purposes. Because
CMS does not provide its detailed methodology, HealthSouth is not able to reconstruct the CMS projections or the calculation.
(2) The CMS file contains data for each of the 1,171 inpatient rehabilitation facilities used to estimate the policy updates for the FY 2011 IRF-PPS Final
Rule. Most of the data represents historical information from the CMS fiscal year 2009 period and does not reflect the same HealthSouth hospitals in
operation today. The data presented was separated into three categories: Freestanding, Units, and HealthSouth. HealthSouth is a subset of
Freestanding and the Total.
21
Exhibit 99.2
Readmission Rates
Note: Use of home health care and hospice is based on care that starts within three days of discharge. Other PAC care starts within one day of
discharge. Home health use includes episodes that overlap an inpatient stay.
Source: Medicare Payment Advisory Commission, “A Data Book: Healthcare spending and the Medicare program,” Chart 9-3 (June 2008)
22
Exhibit 99.2
Portfolio Growth
~ 100+ beds in 2010
Cash Payback Period
Year 1 Year 2 Year 3 Year 4 Year 5 Year 6 Year 7
Acquisitions
Bed Expansions (2)
De novos (1)
(1) Assumes average investment per bed: ~ $450K.
(2) Assumes average investment per bed: $100K to $250K.
23
Exhibit 99.2
(2) Includes 89 consolidated HealthSouth inpatient rehab hospitals and six long-term acute-care hospitals.
Discharge Growth - Trend
ü Capacity expansions will
help facilitate organic
growth:
help facilitate organic
growth:
• ~ 100+ beds will be
added in 2010
added in 2010
UDS Industry Sites (1)
HLS Same Store (2)
24
Exhibit 99.2
Revenues & Expenses (Sequential)
25
Exhibit 99.2
26
Exhibit 99.2
Payment Sources
(1) Managed Medicare revenues represent ~ 8%, 9%, 8%, 9% and 8% of total revenues for Q3 2010, Q3 2009, 9 months 2010, 9 months 2009
and 2009, respectively, and are included in “Managed care and other discount plans.”
27
Exhibit 99.2
(3) Excludes approximately 400 full-time equivalents, who are considered part of corporate overhead with their salaries and benefits
included in general and administrative expenses in the Company’s consolidated statements of operations. Full-time equivalents
included in the above table represent HealthSouth employees who participate in or support the operations of the Company’s
hospitals.
included in general and administrative expenses in the Company’s consolidated statements of operations. Full-time equivalents
included in the above table represent HealthSouth employees who participate in or support the operations of the Company’s
hospitals.
(4) Employees per occupied bed, or “EPOB,” is calculated by dividing the number of full-time equivalents, including an estimate of full-
time equivalents from the utilization of contract labor, by the number of occupied beds during each period. The number of occupied
beds is determined by multiplying the number of licensed beds by the Company’s occupancy percentage.
time equivalents from the utilization of contract labor, by the number of occupied beds during each period. The number of occupied
beds is determined by multiplying the number of licensed beds by the Company’s occupancy percentage.
28
Exhibit 99.2
Non-Operating Cash/Tax Position
Cash Refunds as of Sept 30, 2010
• Federal tax recoveries virtually
complete.
complete.
• State tax refunds in progress.
– Approximately $2.2 million received
in Q3 2010.
in Q3 2010.
– Approximately $7.0 million net
receivable on the balance sheet.
Future Cash Tax Payments
• Expect to pay about $5-6 million per year of
income tax.
income tax.
• The Company does not expect to pay
significant federal income taxes for up to 10
years due to approximately $905 million in
deferred tax assets as of 12/31/09 outlined in
the 2009 Form 10-K. The majority of the deferred
tax assets is related to NOLs.
significant federal income taxes for up to 10
years due to approximately $905 million in
deferred tax assets as of 12/31/09 outlined in
the 2009 Form 10-K. The majority of the deferred
tax assets is related to NOLs.
– At this time, we do not believe the use
of NOLs will be limited before they
expire, however, no assurances can
be provided.
• HealthSouth is not currently subject to an
annual use limitation (AUL) under Internal
Revenue Code section 382.
annual use limitation (AUL) under Internal
Revenue Code section 382.
• If we experienced a “change of ownership” as
defined by Internal Revenue Code section 382,
we would be subject to an AUL, which is equal
to the value of the company at the time of the
“change of ownership” multiplied by the long-
term tax exempt rate.
defined by Internal Revenue Code section 382,
we would be subject to an AUL, which is equal
to the value of the company at the time of the
“change of ownership” multiplied by the long-
term tax exempt rate.
GAAP Considerations
• HealthSouth’s balance sheet currently
reflects a valuation allowance for the
potential value of NOLs and future
deductions. The valuation allowance is
approximately $876 million.
reflects a valuation allowance for the
potential value of NOLs and future
deductions. The valuation allowance is
approximately $876 million.
• GAAP tax rate will net to a small
amount as we release the valuation
allowance when NOLs are utilized.
amount as we release the valuation
allowance when NOLs are utilized.
29
Exhibit 99.2
(1) Notes on page 34.
Net Cash Provided by Operating Activities
30
Exhibit 99.2
Adjusted Free Cash Flow
(1) Q3 2009 working capital benefited as a result of $19 million for working capital related to the interest payment accrual timing and $28
million in receivables due to suspension of Medicare denials and enhanced collections.
31
Exhibit 99.2
Outstanding Share Summary
(Millions)
(Millions)
Notes:
(1) Does not include 2.0 million warrants issued in connection with a January 2004 loan repaid to Credit Suisse First Boston. In connection
with this transaction, we issued warrants to the lender to purchase two million shares of our common stock. Each warrant has a term
of ten years from the date of issuance and an exercise price of $32.50 per share. The warrants were not assumed exercised for
dilutive shares outstanding because they were antidilutive in the periods presented.
(2) The agreement to settle our class action securities litigation received final court approval in January 2007. These shares of common
stock and warrants were issued on September 30, 2009. The 5.0 million of common shares are now included in the outstanding shares.
The warrants to purchase approx. 8.2 million shares of common stack at a strike price of $41.40 were not assumed exercised for the
dilutive shares outstanding because they are anti-dilutive in the periods presented.
(3) The difference between the basic and diluted shares outstanding is primarily related to our convertible perpetual preferred stock.
32
Exhibit 99.2
33
(1) (2) (3) (4) - Notes on page 34.
Exhibit 99.2
Reconciliation Notes
1. Adjusted income from continuing operations and Adjusted Consolidated EBITDA are
non-GAAP financial measures. The Company’s leverage ratio (total consolidated debt
to Adjusted Consolidated EBITDA for the trailing four quarters) is, likewise, a non-GAAP
financial measure. Management and some members of the investment community
utilize adjusted income from continuing operations as a financial measure and
Adjusted Consolidated EBITDA and the leverage ratio as liquidity measures on an
ongoing basis. These measures are not recognized in accordance with GAAP and
should not be viewed as an alternative to GAAP measures of performance or liquidity.
In evaluating these adjusted measures, the reader should be aware that in the future
HealthSouth may incur expenses similar to the adjustments set forth above.
2. Per share amounts for each period presented are based on basic weighted average
common shares outstanding for all amounts except adjusted income from continuing
operations per diluted share, which is based on diluted weighted average shares
outstanding. The difference in shares between the basic and diluted shares
outstanding is primarily related to our convertible perpetual preferred stock.
3. Adjusted income from continuing operations per diluted share and Adjusted
Consolidated EBITDA are two components of our guidance.
4. The Company’s credit agreement allows certain other items to be added to arrive at
Adjusted Consolidated EBITDA, and there may be certain other deductions required.
34
Exhibit 99.2