Third Quarter 2014 Earnings Call October 28, 2014 Supplemental Slides
2 The information contained in this presentation includes certain estimates, projections and other forward-looking information that reflect our current outlook, views and plans with respect to future events, including legislative and regulatory developments, strategy, capital expenditures, development activities, dividend strategies, repurchases of securities, effective tax rates, financial performance, and business model. These estimates, projections and other forward-looking information are based on assumptions that HealthSouth believes, as of the date hereof, are reasonable. Inevitably, there will be differences between such estimates and actual events or results, and those differences may be material. There can be no assurance that any estimates, projections or forward-looking information will be realized. All such estimates, projections and forward-looking information speak only as of the date hereof. HealthSouth undertakes no duty to publicly update or revise the information contained herein. You are cautioned not to place undue reliance on the estimates, projections and other forward-looking information in this presentation as they are based on current expectations and general assumptions and are subject to various risks, uncertainties and other factors, including those set forth in the Form 10-K for the year ended December 31, 2013, and the Form 10-Q for the quarters ended March 31, 2014, June 30, 2014, and September 30, 2014, when filed, and in other documents we previously filed with the SEC, many of which are beyond our control, that may cause actual events or results to differ materially from the views, beliefs and estimates expressed herein. Note Regarding Presentation of Non-GAAP Financial Measures The following presentation includes certain “non-GAAP financial measures” as defined in Regulation G under the Securities Exchange Act of 1934. Schedules are attached that reconcile the non-GAAP financial measures included in the following presentation to the most directly comparable financial measures calculated and presented in accordance with Generally Accepted Accounting Principles in the United States. Our Form 8-K, dated October 27, 2014, to which the following supplemental slides are attached as Exhibit 99.2, provides further explanation and disclosure regarding our use of non-GAAP financial measures and should be read in conjunction with these supplemental slides. Forward-Looking Statements
3 Table of Contents Q3 2014 Summary ........................................................................................................................................... 4-7 Development .................................................................................................................................................... 8 Quality .............................................................................................................................................................. 9 Revenues (Q3 2014 vs. Q3 2013) ................................................................................................................... 10 Expenses (Q3 2014 vs. Q3 2013) .................................................................................................................... 11 Adjusted EBITDA ............................................................................................................................................. 12 Earnings per Share .......................................................................................................................................... 13 Adjusted Free Cash Flow ................................................................................................................................. 14-15 2014 Guidance - Adjusted EBITDA .................................................................................................................. 16 2014 Guidance - EPS........................ .............................................................................................................. 17 Income Tax Considerations............................................................................................................................... 18 Adjusted Free Cash Flow Considerations ....................................................................................................... 19 Priorities for Reinvesting Free Cash Flow ........................................................................................................ 20 Appendix........................................................................................................................................................... 21 Business Outlook: 2014 to 2016 ...................................................................................................................... 22 Our New-Store/Same-Store Growth ................................................................................................................ 23 Debt Schedule and Maturity Profile ................................................................................................................. 24-25 Revenues & Expenses (Sequential) ................................................................................................................ 26 Revenues & Expenses (9 months) .................................................................................................................. 27 Payment Sources (Percent of Revenues) ........................................................................................................ 28 Operational and Labor Metrics ......................................................................................................................... 29-30 Outstanding Share Summary, Warrant Information and Conversion Price ...................................................... 31-32 Adjusted EBITDA History ................................................................................................................................. 33 Adjusted Free Cash Flow History...................................................................................................................... 34 Reconciliations to GAAP .................................................................................................................................. 35-39
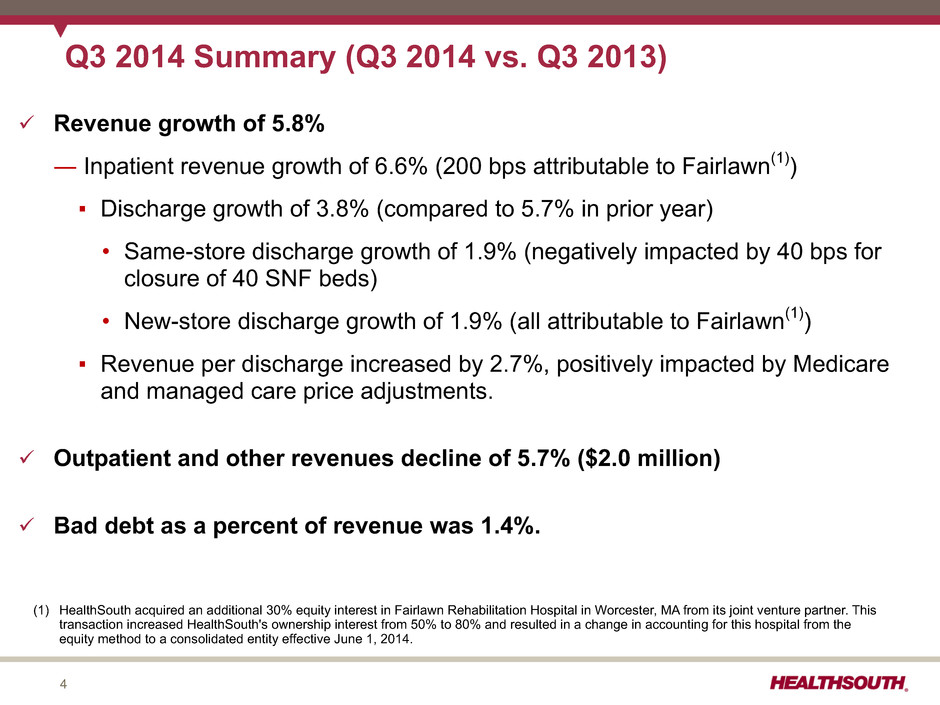
4 Q3 2014 Summary (Q3 2014 vs. Q3 2013) ü Revenue growth of 5.8% ― Inpatient revenue growth of 6.6% (200 bps attributable to Fairlawn(1)) ▪ Discharge growth of 3.8% (compared to 5.7% in prior year) • Same-store discharge growth of 1.9% (negatively impacted by 40 bps for closure of 40 SNF beds) • New-store discharge growth of 1.9% (all attributable to Fairlawn(1)) ▪ Revenue per discharge increased by 2.7%, positively impacted by Medicare and managed care price adjustments. ü Outpatient and other revenues decline of 5.7% ($2.0 million) ü Bad debt as a percent of revenue was 1.4%. (1) HealthSouth acquired an additional 30% equity interest in Fairlawn Rehabilitation Hospital in Worcester, MA from its joint venture partner. This transaction increased HealthSouth's ownership interest from 50% to 80% and resulted in a change in accounting for this hospital from the equity method to a consolidated entity effective June 1, 2014.
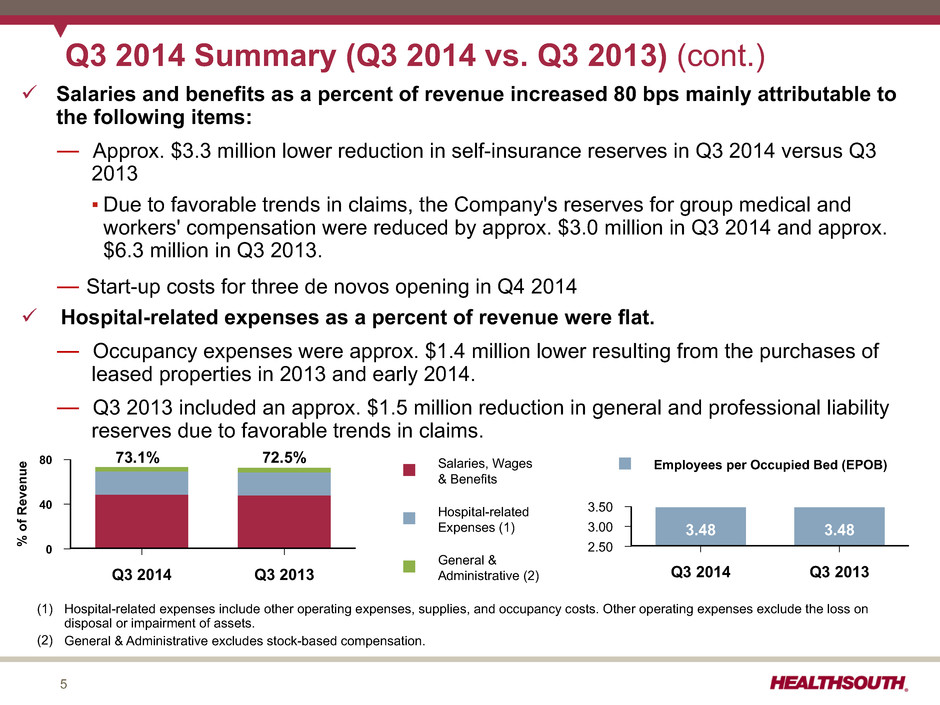
5 ü Salaries and benefits as a percent of revenue increased 80 bps mainly attributable to the following items: ― Approx. $3.3 million lower reduction in self-insurance reserves in Q3 2014 versus Q3 2013 ▪ Due to favorable trends in claims, the Company's reserves for group medical and workers' compensation were reduced by approx. $3.0 million in Q3 2014 and approx. $6.3 million in Q3 2013. ― Start-up costs for three de novos opening in Q4 2014 ü Hospital-related expenses as a percent of revenue were flat. ― Occupancy expenses were approx. $1.4 million lower resulting from the purchases of leased properties in 2013 and early 2014. ― Q3 2013 included an approx. $1.5 million reduction in general and professional liability reserves due to favorable trends in claims. Q3 2014 Summary (Q3 2014 vs. Q3 2013) (cont.) Employees per Occupied Bed (EPOB) 3.50 3.00 2.50 Q3 2014 Q3 2013 3.48 3.48 Salaries, Wages & Benefits Hospital-related Expenses (1) General & Administrative (2) 80 40 0% of R ev en ue Q3 2014 Q3 2013 73.1% 72.5% (1) Hospital-related expenses include other operating expenses, supplies, and occupancy costs. Other operating expenses exclude the loss on disposal or impairment of assets. (2) General & Administrative excludes stock-based compensation.
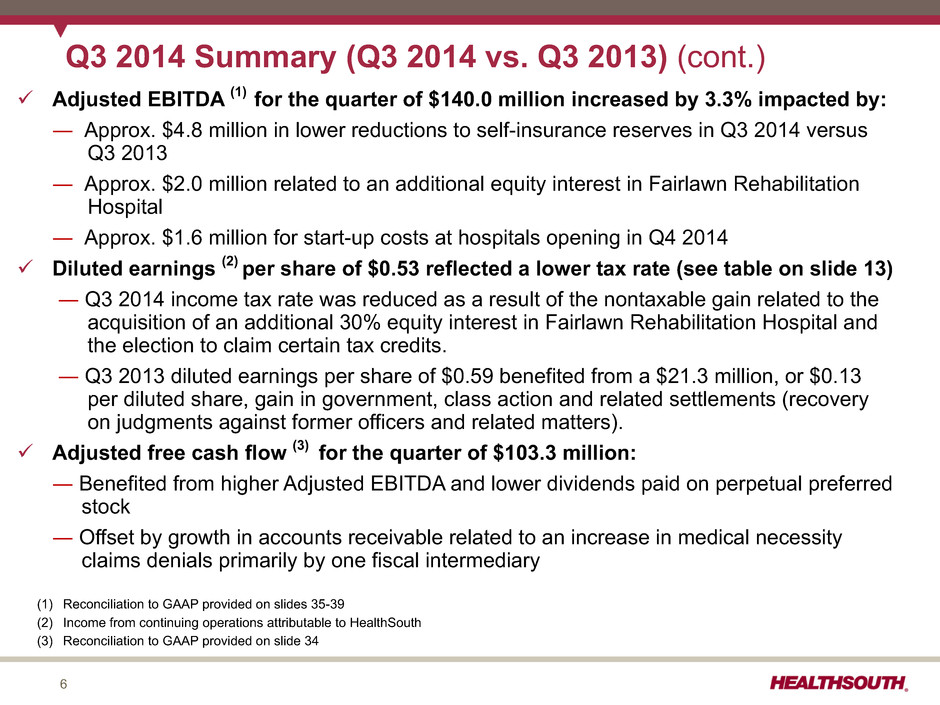
6 Q3 2014 Summary (Q3 2014 vs. Q3 2013) (cont.) ü Adjusted EBITDA (1) for the quarter of $140.0 million increased by 3.3% impacted by: ― Approx. $4.8 million in lower reductions to self-insurance reserves in Q3 2014 versus Q3 2013 ― Approx. $2.0 million related to an additional equity interest in Fairlawn Rehabilitation Hospital ― Approx. $1.6 million for start-up costs at hospitals opening in Q4 2014 ü Diluted earnings (2) per share of $0.53 reflected a lower tax rate (see table on slide 13) ― Q3 2014 income tax rate was reduced as a result of the nontaxable gain related to the acquisition of an additional 30% equity interest in Fairlawn Rehabilitation Hospital and the election to claim certain tax credits. ― Q3 2013 diluted earnings per share of $0.59 benefited from a $21.3 million, or $0.13 per diluted share, gain in government, class action and related settlements (recovery on judgments against former officers and related matters). ü Adjusted free cash flow (3) for the quarter of $103.3 million: ― Benefited from higher Adjusted EBITDA and lower dividends paid on perpetual preferred stock ― Offset by growth in accounts receivable related to an increase in medical necessity claims denials primarily by one fiscal intermediary (1) Reconciliation to GAAP provided on slides 35-39 (2) Income from continuing operations attributable to HealthSouth (3) Reconciliation to GAAP provided on slide 34
7 Q3 2014 Summary (cont.) ü Balance sheet enhancements: ― Amended credit facility to add a $150 million term loan commitment to our existing $600 million revolver and extend the maturity to 2019 ― Issued an additional $175 million of our existing 5.75% senior notes due 2024 ― Redeemed all $271 million of our 7.25% senior notes due 2018 (completed October 1, 2014) ― Provided notice (on October 24, 2014) to redeem 10% (~$25 million) of our 7.75% senior notes due 2022 to be completed December 1, 2014 ü Shareholder distributions: ― Paid quarterly cash dividend of $0.18 per share on July 15, 2014 ― Declared a $0.21 per share (16.7% increase) quarterly dividend paid on October 15, 2014
8 Development ü Continued construction of three de novos: ― Altamonte Springs, FL (50 beds); expect to open October 29, 2014 ― Newnan, GA (50 beds); expect to open December 2014 ― Middletown, DE (34 beds); expect to open December 2014 ü New development: ― Continued progress towards owning and operating two new joint venture hospitals: • A 26-bed inpatient rehabilitation hospital in Johnson City, TN with Mountain States Health Alliance; expect to be operational by year-end 2014. • A 50-bed inpatient rehabilitation hospital in Savannah, GA with Memorial University Medical Center; expect to be operational in first half 2015. ― Received decision from the Tennessee Court of Appeals upholding order approving our plans to build a 40-bed inpatient rehabilitation hospital in Franklin, TN; expect to be operational in Q4 2015 ― Continued the design and permitting process to construct a 50-bed inpatient rehabilitation hospital in Modesto, CA; expect to be operational in Q1 2016 ― Acquired land and began the design and permitting process on a 50-bed inpatient rehabilitation hospital in Murrieta, CA; expect to be operational in Q4 2017
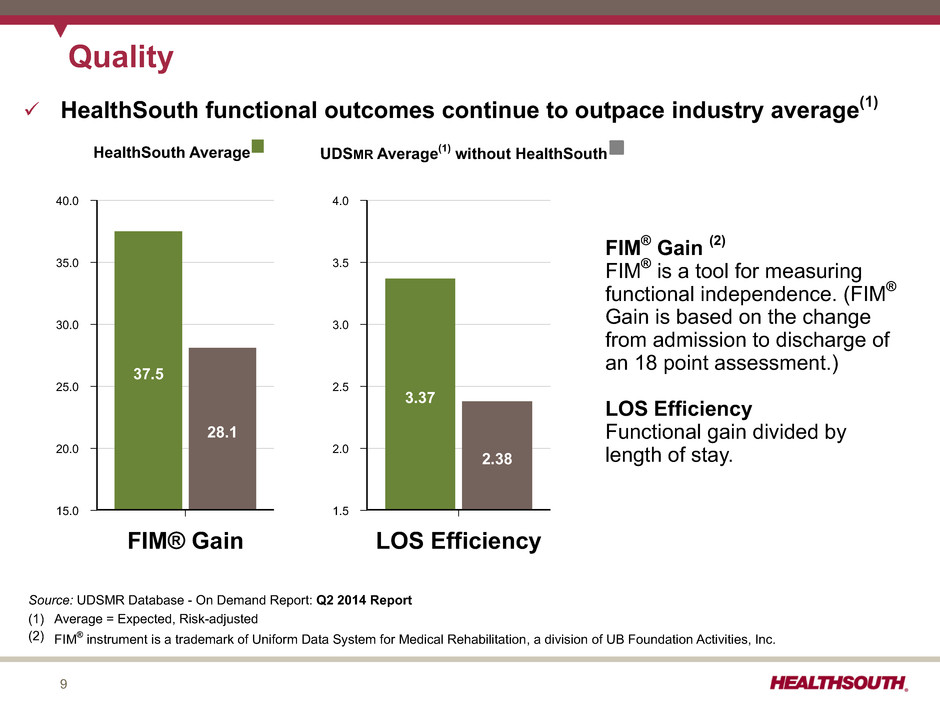
9 ü HealthSouth functional outcomes continue to outpace industry average(1) HealthSouth Average UDSMR Average(1) without HealthSouth FIM® Gain (2) FIM® is a tool for measuring functional independence. (FIM® Gain is based on the change from admission to discharge of an 18 point assessment.) LOS Efficiency Functional gain divided by length of stay. Quality 40.0 35.0 30.0 25.0 20.0 15.0 FIM® Gain 37.5 28.1 4.0 3.5 3.0 2.5 2.0 1.5 LOS Efficiency 3.37 2.38 Source: UDSMR Database - On Demand Report: Q2 2014 Report (1) Average = Expected, Risk-adjusted (2) FIM® instrument is a trademark of Uniform Data System for Medical Rehabilitation, a division of UB Foundation Activities, Inc.
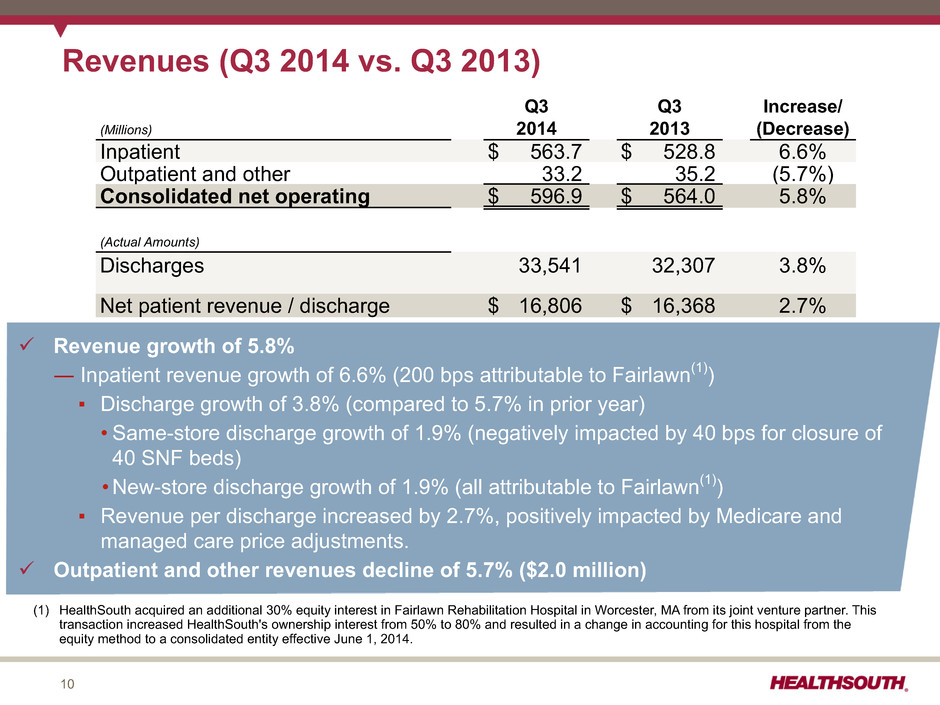
10 Revenues (Q3 2014 vs. Q3 2013) Q3 Q3 Increase/ (Millions) 2014 2013 (Decrease) Inpatient $ 563.7 $ 528.8 6.6% Outpatient and other 33.2 35.2 (5.7%) Consolidated net operating $ 596.9 $ 564.0 5.8% (Actual Amounts) Discharges 33,541 32,307 3.8% Net patient revenue / discharge $ 16,806 $ 16,368 2.7% ü Revenue growth of 5.8% ― Inpatient revenue growth of 6.6% (200 bps attributable to Fairlawn(1)) ▪ Discharge growth of 3.8% (compared to 5.7% in prior year) • Same-store discharge growth of 1.9% (negatively impacted by 40 bps for closure of 40 SNF beds) • New-store discharge growth of 1.9% (all attributable to Fairlawn(1)) ▪ Revenue per discharge increased by 2.7%, positively impacted by Medicare and managed care price adjustments. ü Outpatient and other revenues decline of 5.7% ($2.0 million) (1) HealthSouth acquired an additional 30% equity interest in Fairlawn Rehabilitation Hospital in Worcester, MA from its joint venture partner. This transaction increased HealthSouth's ownership interest from 50% to 80% and resulted in a change in accounting for this hospital from the equity method to a consolidated entity effective June 1, 2014.
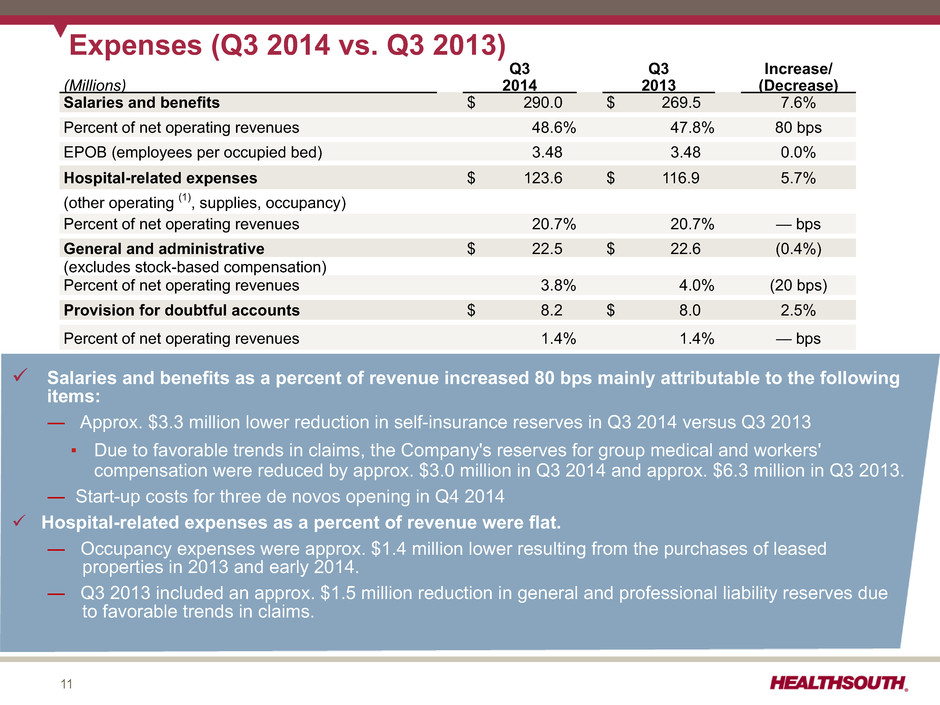
11 Expenses (Q3 2014 vs. Q3 2013) Q3 Q3 Increase/ (Millions) 2014 2013 (Decrease) Salaries and benefits $ 290.0 $ 269.5 7.6% Percent of net operating revenues 48.6% 47.8% 80 bps EPOB (employees per occupied bed) 3.48 3.48 0.0% Hospital-related expenses $ 123.6 $ 116.9 5.7% (other operating (1), supplies, occupancy) Percent of net operating revenues 20.7% 20.7% — bps General and administrative $ 22.5 $ 22.6 (0.4%) (excludes stock-based compensation) Percent of net operating revenues 3.8% 4.0% (20 bps) Provision for doubtful accounts $ 8.2 $ 8.0 2.5% Percent of net operating revenues 1.4% 1.4% — bps ü Salaries and benefits as a percent of revenue increased 80 bps mainly attributable to the following items: ― Approx. $3.3 million lower reduction in self-insurance reserves in Q3 2014 versus Q3 2013 ▪ Due to favorable trends in claims, the Company's reserves for group medical and workers' compensation were reduced by approx. $3.0 million in Q3 2014 and approx. $6.3 million in Q3 2013. ― Start-up costs for three de novos opening in Q4 2014 ü Hospital-related expenses as a percent of revenue were flat. ― Occupancy expenses were approx. $1.4 million lower resulting from the purchases of leased properties in 2013 and early 2014. ― Q3 2013 included an approx. $1.5 million reduction in general and professional liability reserves due to favorable trends in claims.
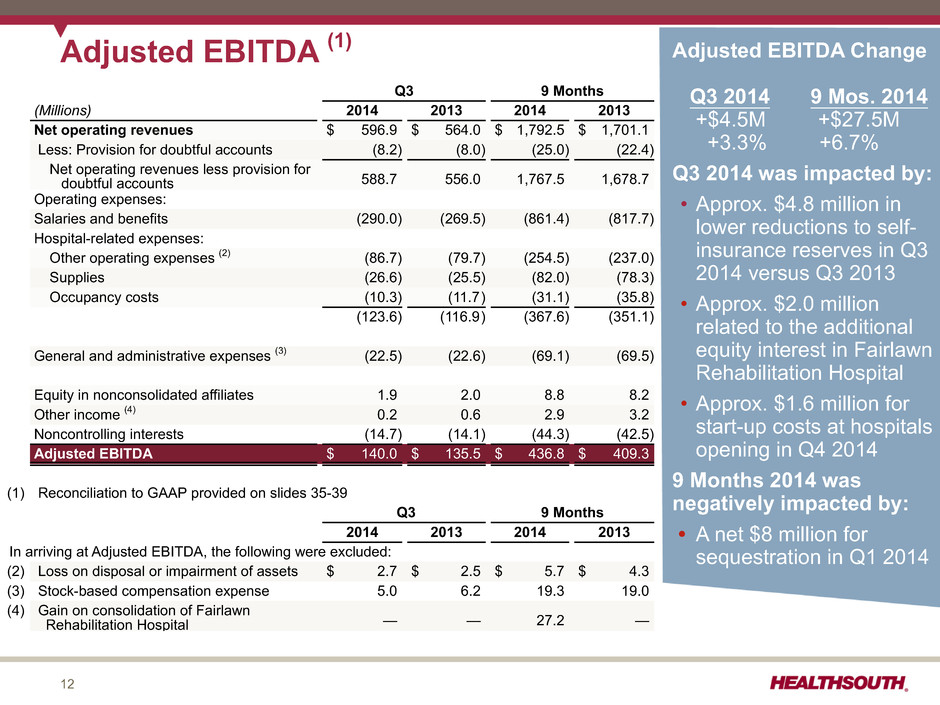
12 Adjusted EBITDA (1) Q3 9 Months (Millions) 2014 2013 2014 2013 Net operating revenues $ 596.9 $ 564.0 $ 1,792.5 $ 1,701.1 Less: Provision for doubtful accounts (8.2) (8.0) (25.0) (22.4) Net operating revenues less provision for doubtful accounts 588.7 556.0 1,767.5 1,678.7 Operating expenses: Salaries and benefits (290.0) (269.5) (861.4) (817.7) Hospital-related expenses: Other operating expenses (2) (86.7) (79.7) (254.5) (237.0) Supplies (26.6) (25.5) (82.0) (78.3) Occupancy costs (10.3) (11.7) (31.1) (35.8) (123.6) (116.9) (367.6) (351.1) General and administrative expenses (3) (22.5) (22.6) (69.1) (69.5) Equity in nonconsolidated affiliates 1.9 2.0 8.8 8.2 Other income (4) 0.2 0.6 2.9 3.2 Noncontrolling interests (14.7) (14.1) (44.3) (42.5) Adjusted EBITDA $ 140.0 $ 135.5 $ 436.8 $ 409.3 (1) Reconciliation to GAAP provided on slides 35-39 Q3 9 Months 2014 2013 2014 2013 In arriving at Adjusted EBITDA, the following were excluded: (2) Loss on disposal or impairment of assets $ 2.7 $ 2.5 $ 5.7 $ 4.3 (3) Stock-based compensation expense 5.0 6.2 19.3 19.0 (4) Gain on consolidation of Fairlawn Rehabilitation Hospital — — 27.2 — Adjusted EBITDA Change Q3 2014 9 Mos. 2014 +$4.5M +$27.5M +3.3% +6.7% Q3 2014 was impacted by: • Approx. $4.8 million in lower reductions to self- insurance reserves in Q3 2014 versus Q3 2013 • Approx. $2.0 million related to the additional equity interest in Fairlawn Rehabilitation Hospital • Approx. $1.6 million for start-up costs at hospitals opening in Q4 2014 9 Months 2014 was negatively impacted by: • A net $8 million for sequestration in Q1 2014
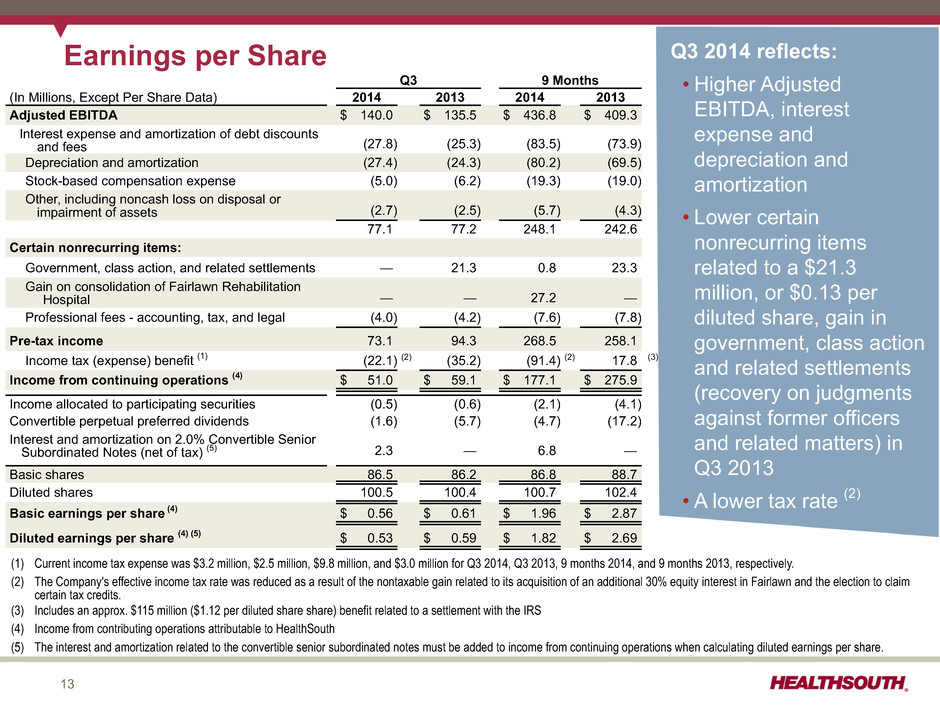
13 Earnings per Share Q3 9 Months (In Millions, Except Per Share Data) 2014 2013 2014 2013 Adjusted EBITDA $ 140.0 $ 135.5 $ 436.8 $ 409.3 Interest expense and amortization of debt discounts and fees (27.8) (25.3) (83.5) (73.9) Depreciation and amortization (27.4) (24.3) (80.2) (69.5) Stock-based compensation expense (5.0) (6.2) (19.3) (19.0) Other, including noncash loss on disposal or impairment of assets (2.7) (2.5) (5.7) (4.3) 77.1 77.2 248.1 242.6 Certain nonrecurring items: Government, class action, and related settlements — 21.3 0.8 23.3 Gain on consolidation of Fairlawn Rehabilitation Hospital — — 27.2 — Professional fees - accounting, tax, and legal (4.0) (4.2) (7.6) (7.8) Pre-tax income 73.1 94.3 268.5 258.1 Income tax (expense) benefit (1) (22.1) (2) (35.2) (91.4) (2) 17.8 (3) Income from continuing operations (4) $ 51.0 $ 59.1 $ 177.1 $ 275.9 Income allocated to participating securities (0.5) (0.6) (2.1) (4.1) Convertible perpetual preferred dividends (1.6) (5.7) (4.7) (17.2) Interest and amortization on 2.0% Convertible Senior Subordinated Notes (net of tax) (5) 2.3 — 6.8 — Basic shares 86.5 86.2 86.8 88.7 Diluted shares 100.5 100.4 100.7 102.4 Basic earnings per share (4) $ 0.56 $ 0.61 $ 1.96 $ 2.87 Diluted earnings per share (4) (5) $ 0.53 $ 0.59 $ 1.82 $ 2.69 Q3 2014 reflects: • Higher Adjusted EBITDA, interest expense and depreciation and amortization • Lower certain nonrecurring items related to a $21.3 million, or $0.13 per diluted share, gain in government, class action and related settlements (recovery on judgments against former officers and related matters) in Q3 2013 • A lower tax rate (2) (1) Current income tax expense was $3.2 million, $2.5 million, $9.8 million, and $3.0 million for Q3 2014, Q3 2013, 9 months 2014, and 9 months 2013, respectively. (2) The Company's effective income tax rate was reduced as a result of the nontaxable gain related to its acquisition of an additional 30% equity interest in Fairlawn and the election to claim certain tax credits. (3) Includes an approx. $115 million ($1.12 per diluted share share) benefit related to a settlement with the IRS (4) Income from contributing operations attributable to HealthSouth (5) The interest and amortization related to the convertible senior subordinated notes must be added to income from continuing operations when calculating diluted earnings per share.
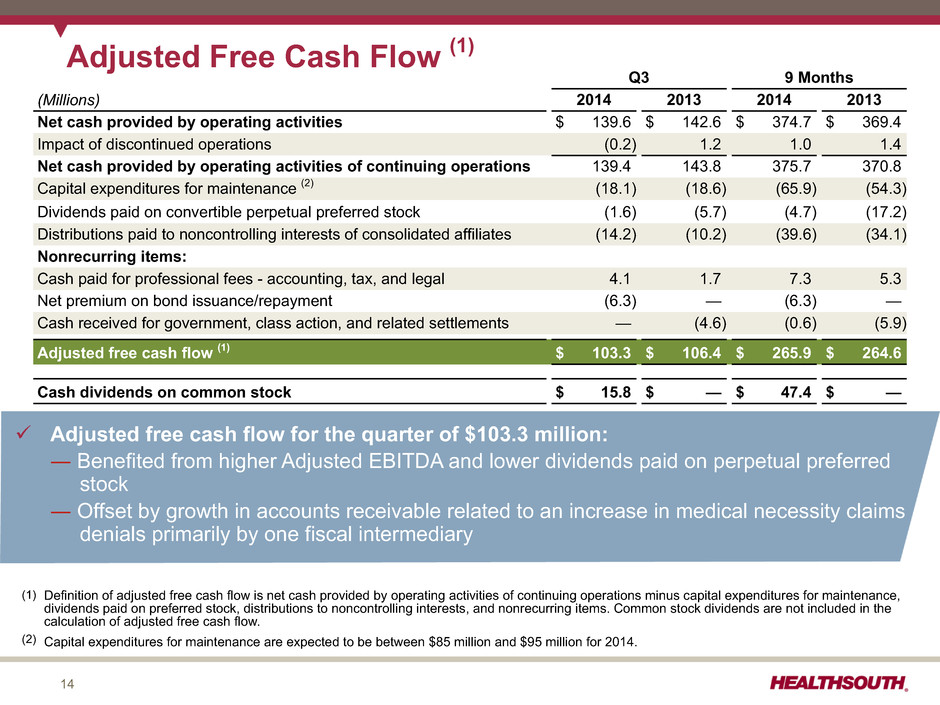
14 Adjusted Free Cash Flow (1) Q3 9 Months (Millions) 2014 2013 2014 2013 Net cash provided by operating activities $ 139.6 $ 142.6 $ 374.7 $ 369.4 Impact of discontinued operations (0.2) 1.2 1.0 1.4 Net cash provided by operating activities of continuing operations 139.4 143.8 375.7 370.8 Capital expenditures for maintenance (2) (18.1) (18.6) (65.9) (54.3) Dividends paid on convertible perpetual preferred stock (1.6) (5.7) (4.7) (17.2) Distributions paid to noncontrolling interests of consolidated affiliates (14.2) (10.2) (39.6) (34.1) Nonrecurring items: Cash paid for professional fees - accounting, tax, and legal 4.1 1.7 7.3 5.3 Net premium on bond issuance/repayment (6.3) — (6.3) — Cash received for government, class action, and related settlements — (4.6) (0.6) (5.9) Adjusted free cash flow (1) $ 103.3 $ 106.4 $ 265.9 $ 264.6 Cash dividends on common stock $ 15.8 $ — $ 47.4 $ — ü Adjusted free cash flow for the quarter of $103.3 million: ― Benefited from higher Adjusted EBITDA and lower dividends paid on perpetual preferred stock ― Offset by growth in accounts receivable related to an increase in medical necessity claims denials primarily by one fiscal intermediary (1) Definition of adjusted free cash flow is net cash provided by operating activities of continuing operations minus capital expenditures for maintenance, dividends paid on preferred stock, distributions to noncontrolling interests, and nonrecurring items. Common stock dividends are not included in the calculation of adjusted free cash flow. (2) Capital expenditures for maintenance are expected to be between $85 million and $95 million for 2014.
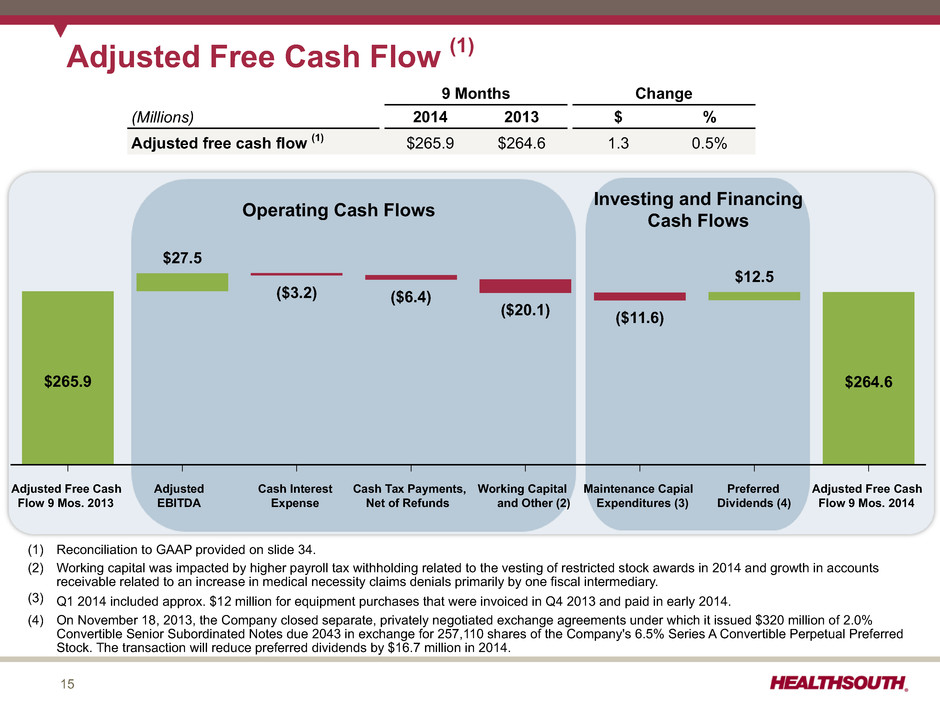
15 Adjusted Free Cash Flow (1) Operating Cash Flows Investing and Financing Cash Flows 9 Months Change (Millions) 2014 2013 $ % Adjusted free cash flow (1) $265.9 $264.6 1.3 0.5% Adjusted Free Cash Flow 9 Mos. 2013 Adjusted EBITDA Cash Interest Expense Cash Tax Payments, Net of Refunds Working Capital and Other (2) Maintenance Capial Expenditures (3) Preferred Dividends (4) Adjusted Free Cash Flow 9 Mos. 2014 $265.9 $27.5 ($3.2) ($6.4) ($20.1) ($11.6) $12.5 $264.6 (1) Reconciliation to GAAP provided on slide 34. (2) Working capital was impacted by higher payroll tax withholding related to the vesting of restricted stock awards in 2014 and growth in accounts receivable related to an increase in medical necessity claims denials primarily by one fiscal intermediary. (3) Q1 2014 included approx. $12 million for equipment purchases that were invoiced in Q4 2013 and paid in early 2014. (4) On November 18, 2013, the Company closed separate, privately negotiated exchange agreements under which it issued $320 million of 2.0% Convertible Senior Subordinated Notes due 2043 in exchange for 257,110 shares of the Company's 6.5% Series A Convertible Perpetual Preferred Stock. The transaction will reduce preferred dividends by $16.7 million in 2014. Operating Cash Flows gCash Flows
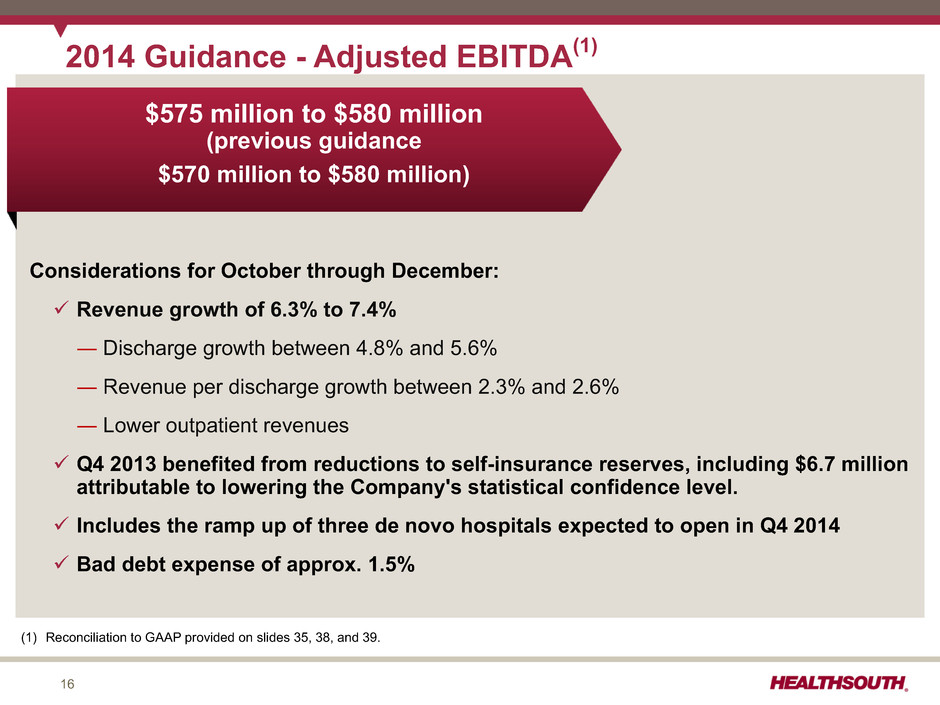
16 2014 Guidance - Adjusted EBITDA(1) Considerations for October through December: ü Revenue growth of 6.3% to 7.4% ― Discharge growth between 4.8% and 5.6% ― Revenue per discharge growth between 2.3% and 2.6% ― Lower outpatient revenues ü Q4 2013 benefited from reductions to self-insurance reserves, including $6.7 million attributable to lowering the Company's statistical confidence level. ü Includes the ramp up of three de novo hospitals expected to open in Q4 2014 ü Bad debt expense of approx. 1.5% (1) Reconciliation to GAAP provided on slides 35, 38, and 39. $575 million to $580 million (previous guidance $570 million to $580 million)
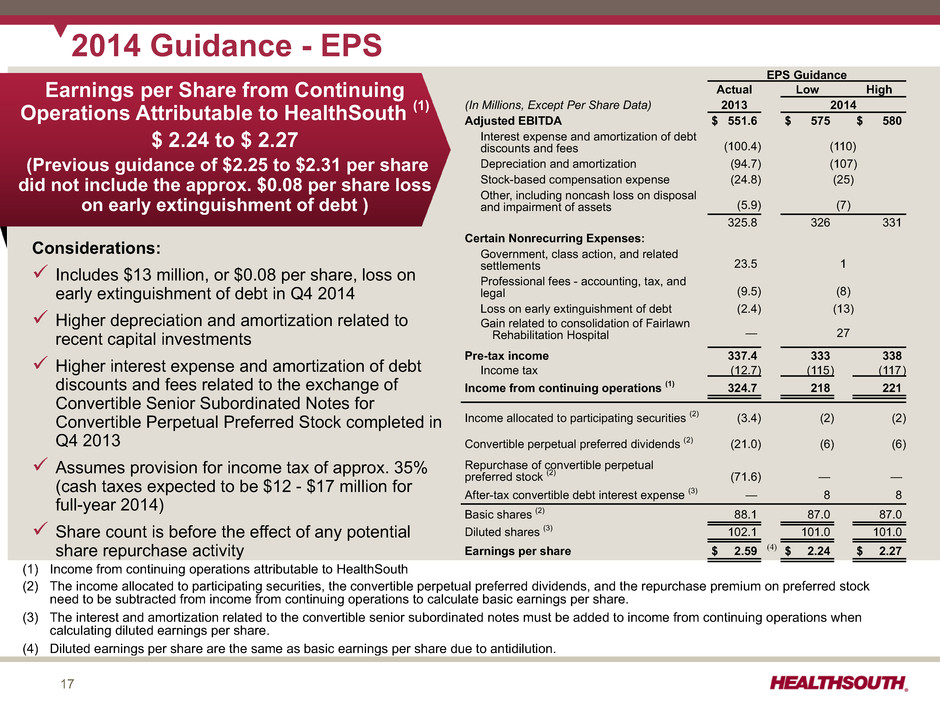
17 2014 Guidance - EPS Considerations: ü Includes $13 million, or $0.08 per share, loss on early extinguishment of debt in Q4 2014 ü Higher depreciation and amortization related to recent capital investments ü Higher interest expense and amortization of debt discounts and fees related to the exchange of Convertible Senior Subordinated Notes for Convertible Perpetual Preferred Stock completed in Q4 2013 ü Assumes provision for income tax of approx. 35% (cash taxes expected to be $12 - $17 million for full-year 2014) ü Share count is before the effect of any potential share repurchase activity EPS Guidance Actual Low High (In Millions, Except Per Share Data) 2013 2014 Adjusted EBITDA $ 551.6 $ 575 $ 580 Interest expense and amortization of debt discounts and fees (100.4) (110) Depreciation and amortization (94.7) (107) Stock-based compensation expense (24.8) (25) Other, including noncash loss on disposal and impairment of assets (5.9) (7) 325.8 326 331 Certain Nonrecurring Expenses: Government, class action, and related settlements 23.5 1 Professional fees - accounting, tax, and legal (9.5) (8) Loss on early extinguishment of debt (2.4) (13) Gain related to consolidation of Fairlawn Rehabilitation Hospital — 27 Pre-tax income 337.4 333 338 Income tax (12.7) (115) (117) Income from continuing operations (1) 324.7 218 221 Income allocated to participating securities (2) (3.4) (2) (2) Convertible perpetual preferred dividends (2) (21.0) (6) (6) Repurchase of convertible perpetual preferred stock (2) (71.6) — — After-tax convertible debt interest expense (3) — 8 8 Basic shares (2) 88.1 87.0 87.0 Diluted shares (3) 102.1 101.0 101.0 Earnings per share $ 2.59 (4) $ 2.24 $ 2.27 Earnings per Share from Continuing Operations Attributable to HealthSouth (1) $ 2.24 to $ 2.27 (Previous guidance of $2.25 to $2.31 per share did not include the approx. $0.08 per share loss on early extinguishment of debt ) (1) Income from continuing operations attributable to HealthSouth (2) The income allocated to participating securities, the convertible perpetual preferred dividends, and the repurchase premium on preferred stock need to be subtracted from income from continuing operations to calculate basic earnings per share. (3) The interest and amortization related to the convertible senior subordinated notes must be added to income from continuing operations when calculating diluted earnings per share. (4) Diluted earnings per share are the same as basic earnings per share due to antidilution.
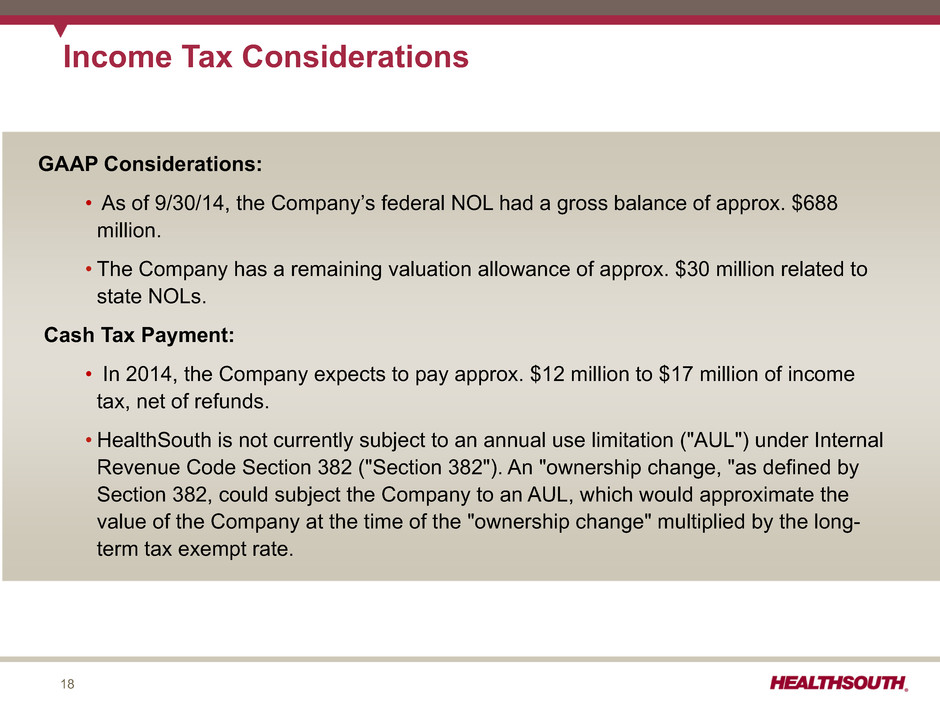
18 Income Tax Considerations GAAP Considerations: • As of 9/30/14, the Company’s federal NOL had a gross balance of approx. $688 million. • The Company has a remaining valuation allowance of approx. $30 million related to state NOLs. Cash Tax Payment: • In 2014, the Company expects to pay approx. $12 million to $17 million of income tax, net of refunds. • HealthSouth is not currently subject to an annual use limitation ("AUL") under Internal Revenue Code Section 382 ("Section 382"). An "ownership change, "as defined by Section 382, could subject the Company to an AUL, which would approximate the value of the Company at the time of the "ownership change" multiplied by the long- term tax exempt rate.

19 Adjusted Free Cash Flow (1) Considerations Certain Cash Flow Items (2) (millions) 2013 Actual 9 months 2014 Actual 2014 Assumptions • Cash interest expense (3) $95.4 $74.1 $97 • Cash payments for taxes, net of refunds $7.7 $14.8 $12 to $17 • Working Capital and Other $19.6 $11.4 $30 to $40 • Maintenance CAPEX (4) $74.8 $65.9 $85 to $95 • Dividends paid on preferred stock $23.0 $4.7 $6 Adjusted free cash flow for 2014 is expected to increase over 2013. Adjusted Free Cash Flow 2011 2012 2013 Trailing 4 Qtrs $243 $268 $331 $332 (1) Reconciliation to GAAP is provided on slide 34. (2) Definition of adjusted free cash flow is net cash provided by operating activities of continuing operations minus capital expenditures for maintenance, dividends paid on preferred stock, distributions to noncontrolling interests, and nonrecurring items. Common stock dividends (approx. $16 million paid in Q4 2013 and approx. $66 million paid in 2014) are not included in the calculation of adjusted free cash flow. (3) Net of amortization of debt discounts and fees (4) 2013 benefited by approx. $12 million for equipment purchases that were invoiced in Q4 2013 and paid in early 2014. (1) (millions)
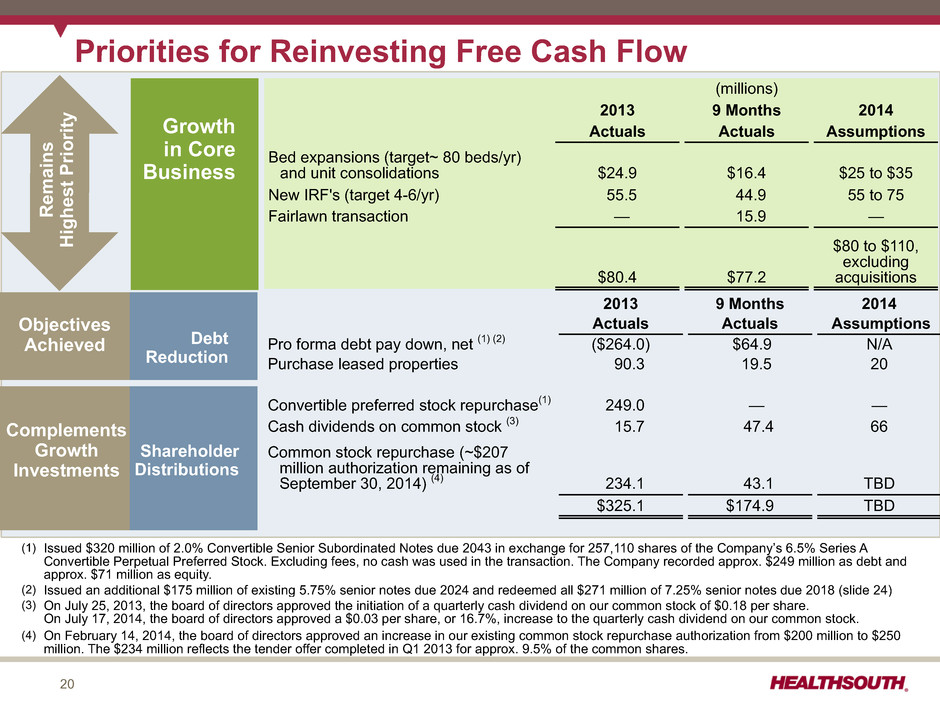
20 Priorities for Reinvesting Free Cash Flow Objectives Achieved «« Remain s Highest Priorit y (millions) 2013 9 Months 2014 Actuals Actuals Assumptions Bed expansions (target~ 80 beds/yr) and unit consolidations $24.9 $16.4 $25 to $35 New IRF's (target 4-6/yr) 55.5 44.9 55 to 75 Fairlawn transaction — 15.9 — $80.4 $77.2 $80 to $110, excluding acquisitions 2013 9 Months 2014 Actuals Actuals Assumptions Pro forma debt pay down, net (1) (2) ($264.0) $64.9 N/A Purchase leased properties 90.3 19.5 20 Convertible preferred stock repurchase(1) 249.0 — — Cash dividends on common stock (3) 15.7 47.4 66 Common stock repurchase (~$207 million authorization remaining as of September 30, 2014) (4) 234.1 43.1 TBD $325.1 $174.9 TBD (1) Issued $320 million of 2.0% Convertible Senior Subordinated Notes due 2043 in exchange for 257,110 shares of the Company’s 6.5% Series A Convertible Perpetual Preferred Stock. Excluding fees, no cash was used in the transaction. The Company recorded approx. $249 million as debt and approx. $71 million as equity. (2) Issued an additional $175 million of existing 5.75% senior notes due 2024 and redeemed all $271 million of 7.25% senior notes due 2018 (slide 24) (3) On July 25, 2013, the board of directors approved the initiation of a quarterly cash dividend on our common stock of $0.18 per share. On July 17, 2014, the board of directors approved a $0.03 per share, or 16.7%, increase to the quarterly cash dividend on our common stock. (4) On February 14, 2014, the board of directors approved an increase in our existing common stock repurchase authorization from $200 million to $250 million. The $234 million reflects the tender offer completed in Q1 2013 for approx. 9.5% of the common shares. Complements Growth Investments Shareholder Distributions Growth in Core Business Debt Reduction

Appendix
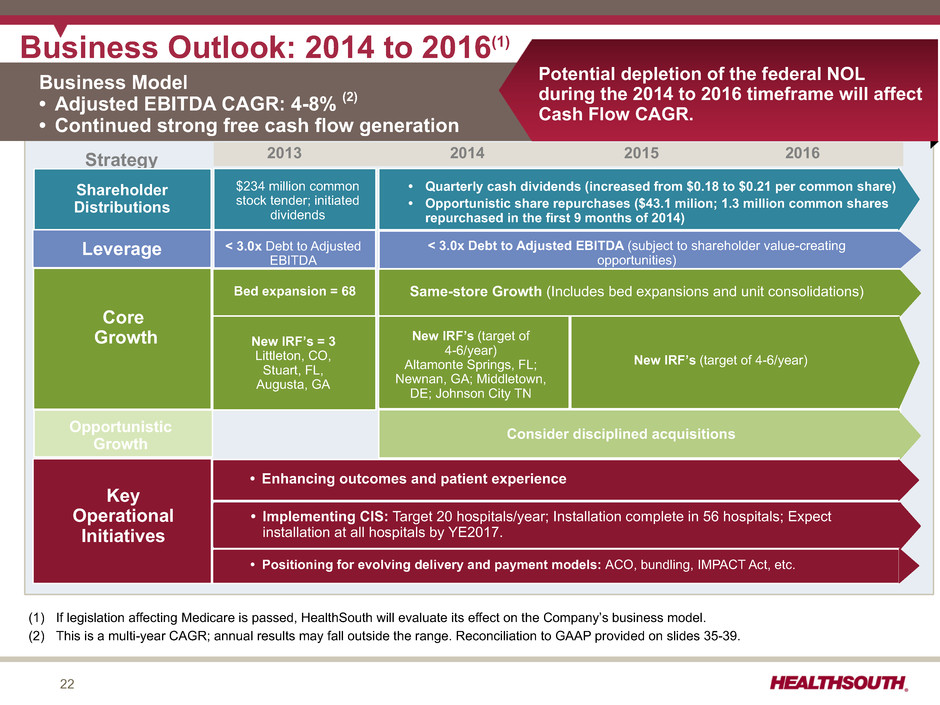
22 Strategy Key Operational Initiatives Potential depletion of the federal NOL during the 2014 to 2016 timeframe will affect Cash Flow CAGR. New IRF’s (target of 4-6/year) (1) If legislation affecting Medicare is passed, HealthSouth will evaluate its effect on the Company’s business model. (2) This is a multi-year CAGR; annual results may fall outside the range. Reconciliation to GAAP provided on slides 35-39. Shareholder Distributions $234 million common stock tender; initiated dividends Business Model • Adjusted EBITDA CAGR: 4-8% (2) • Continued strong free cash flow generation Business Outlook: 2014 to 2016(1) • Quarterly cash dividends (increased from $0.18 to $0.21 per common share) • Opportunistic share repurchases ($43.1 milion; 1.3 million common shares repurchased in the first 9 months of 2014) Leverage < 3.0x Debt to Adjusted EBITDA < 3.0x Debt to Adjusted EBITDA (subject to shareholder value-creating opportunities) Core Growth Bed expansion = 68 New IRF’s = 3 Littleton, CO, Stuart, FL, Augusta, GA New IRF’s (target of 4-6/year) Altamonte Springs, FL; Newnan, GA; Middletown, DE; Johnson City TN Opportunistic Growth Consider disciplined acquisitions • Enhancing outcomes and patient experience • Implementing CIS: Target 20 hospitals/year; Installation complete in 56 hospitals; Expect installation at all hospitals by YE2017. • Positioning for evolving delivery and payment models: ACO, bundling, IMPACT Act, etc. 2013 2014 2015 2016 Same-store Growth (Includes bed expansions and unit consolidations)
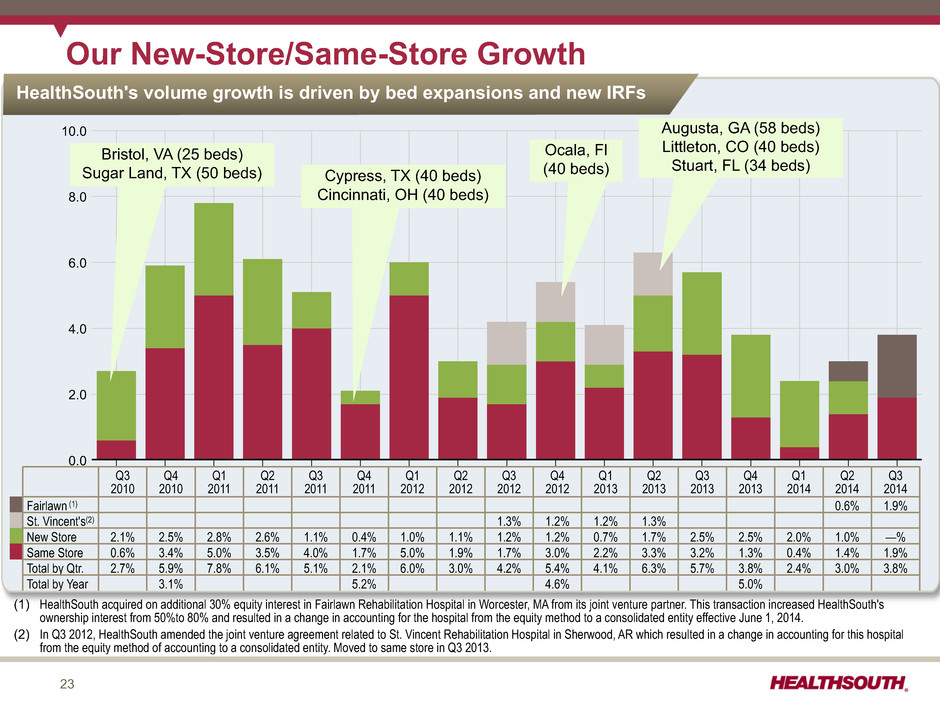
23 10.0 8.0 6.0 4.0 2.0 0.0 Q3 2010 Q4 2010 Q1 2011 Q2 2011 Q3 2011 Q4 2011 Q1 2012 Q2 2012 Q3 2012 Q4 2012 Q1 2013 Q2 2013 Q3 2013 Q4 2013 Q1 2014 Q2 2014 Q3 2014 Our New-Store/Same-Store Growth HealthSouth's volume growth is driven by bed expansions and new IRFs Q3 2010 Q4 2010 Q1 2011 Q2 2011 Q3 2011 Q4 2011 Q1 2012 Q2 2012 Q3 2012 Q4 2012 Q1 2013 Q2 2013 Q3 2013 Q4 2013 Q1 2014 Q2 2014 Q3 2014 Fairlawn (1) 0.6% 1.9% St. Vincent's(2) 1.3% 1.2% 1.2% 1.3% New Store 2.1% 2.5% 2.8% 2.6% 1.1% 0.4% 1.0% 1.1% 1.2% 1.2% 0.7% 1.7% 2.5% 2.5% 2.0% 1.0% —% Same Store 0.6% 3.4% 5.0% 3.5% 4.0% 1.7% 5.0% 1.9% 1.7% 3.0% 2.2% 3.3% 3.2% 1.3% 0.4% 1.4% 1.9% Total by Qtr. 2.7% 5.9% 7.8% 6.1% 5.1% 2.1% 6.0% 3.0% 4.2% 5.4% 4.1% 6.3% 5.7% 3.8% 2.4% 3.0% 3.8% Total by Year 3.1% 5.2% 4.6% 5.0% (1) HealthSouth acquired on additional 30% equity interest in Fairlawn Rehabilitation Hospital in Worcester, MA from its joint venture partner. This transaction increased HealthSouth's ownership interest from 50%to 80% and resulted in a change in accounting for the hospital from the equity method to a consolidated entity effective June 1, 2014. (2) In Q3 2012, HealthSouth amended the joint venture agreement related to St. Vincent Rehabilitation Hospital in Sherwood, AR which resulted in a change in accounting for this hospital from the equity method of accounting to a consolidated entity. Moved to same store in Q3 2013. Bristol, VA (25 beds) Sugar Land, TX (50 beds) Cypress, TX (40 beds) Cincinnati, OH (40 beds) Ocala, Fl (40 beds) Augusta, GA (58 beds) Littleton, CO (40 beds) Stuart, FL (34 beds)
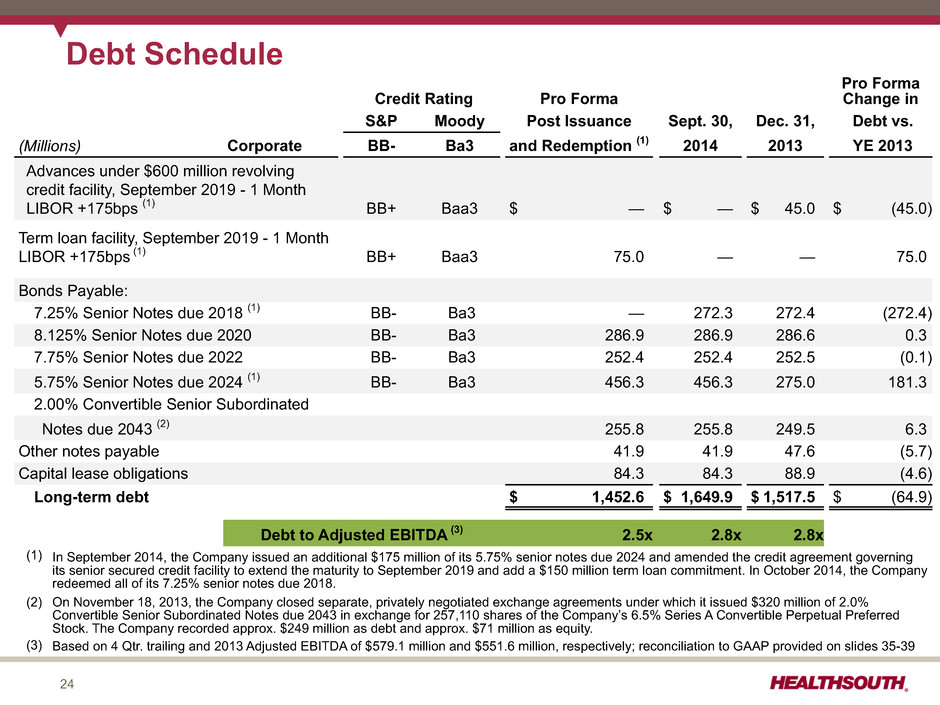
24 Debt Schedule Credit Rating Pro Forma Pro Forma Change in S&P Moody Post Issuance Sept. 30, Dec. 31, Debt vs. (Millions) Corporate BB- Ba3 and Redemption (1) 2014 2013 YE 2013 Advances under $600 million revolving credit facility, September 2019 - 1 Month LIBOR +175bps (1) BB+ Baa3 $ — $ — $ 45.0 $ (45.0) Term loan facility, September 2019 - 1 Month LIBOR +175bps (1) BB+ Baa3 75.0 — — 75.0 Bonds Payable: 7.25% Senior Notes due 2018 (1) BB- Ba3 — 272.3 272.4 (272.4) 8.125% Senior Notes due 2020 BB- Ba3 286.9 286.9 286.6 0.3 7.75% Senior Notes due 2022 BB- Ba3 252.4 252.4 252.5 (0.1) 5.75% Senior Notes due 2024 (1) BB- Ba3 456.3 456.3 275.0 181.3 2.00% Convertible Senior Subordinated Notes due 2043 (2) 255.8 255.8 249.5 6.3 Other notes payable 41.9 41.9 47.6 (5.7) Capital lease obligations 84.3 84.3 88.9 (4.6) Long-term debt $ 1,452.6 $ 1,649.9 $ 1,517.5 $ (64.9) Debt to Adjusted EBITDA (3) 2.5x 2.8x 2.8x (1) In September 2014, the Company issued an additional $175 million of its 5.75% senior notes due 2024 and amended the credit agreement governing its senior secured credit facility to extend the maturity to September 2019 and add a $150 million term loan commitment. In October 2014, the Company redeemed all of its 7.25% senior notes due 2018. (2) On November 18, 2013, the Company closed separate, privately negotiated exchange agreements under which it issued $320 million of 2.0% Convertible Senior Subordinated Notes due 2043 in exchange for 257,110 shares of the Company’s 6.5% Series A Convertible Perpetual Preferred Stock. The Company recorded approx. $249 million as debt and approx. $71 million as equity. (3) Based on 4 Qtr. trailing and 2013 Adjusted EBITDA of $579.1 million and $551.6 million, respectively; reconciliation to GAAP provided on slides 35-39
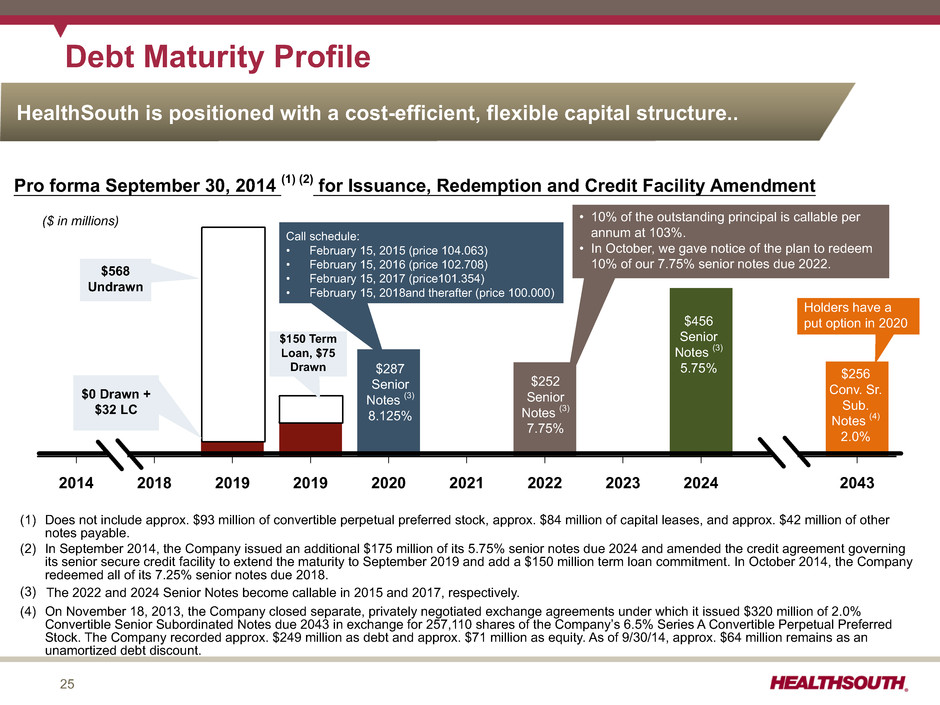
25 2014 2018 2019 2019 2020 2021 2022 2023 2024 2043 $287 Senior Notes (3) 8.125% $456 Senior Notes (3) 5.75% $256 Conv. Sr. Sub. Notes (4) 2.0% $252 Senior Notes (3) 7.75% $568 Undrawn $0 Drawn + $32 LC $150 Term Loan, $75 Drawn • 10% of the outstanding principal is callable per annum at 103%. • In October, we gave notice of the plan to redeem 10% of our 7.75% senior notes due 2022. Holders have a put option in 2020 Pro forma September 30, 2014 (1) (2) for Issuance, Redemption and Credit Facility Amendment Debt Maturity Profile (1) Does not include approx. $93 million of convertible perpetual preferred stock, approx. $84 million of capital leases, and approx. $42 million of other notes payable. (2) In September 2014, the Company issued an additional $175 million of its 5.75% senior notes due 2024 and amended the credit agreement governing its senior secure credit facility to extend the maturity to September 2019 and add a $150 million term loan commitment. In October 2014, the Company redeemed all of its 7.25% senior notes due 2018. (3) The 2022 and 2024 Senior Notes become callable in 2015 and 2017, respectively. (4) On November 18, 2013, the Company closed separate, privately negotiated exchange agreements under which it issued $320 million of 2.0% Convertible Senior Subordinated Notes due 2043 in exchange for 257,110 shares of the Company’s 6.5% Series A Convertible Perpetual Preferred Stock. The Company recorded approx. $249 million as debt and approx. $71 million as equity. As of 9/30/14, approx. $64 million remains as an unamortized debt discount. Call schedule: • February 15, 2015 (price 104.063) • February 15, 2016 (price 102.708) • February 15, 2017 (price101.354) • February 15, 2018and therafter (price 100.000) HealthSouth is positioned with a cost-efficient, flexible capital structure.. ($ in millions)
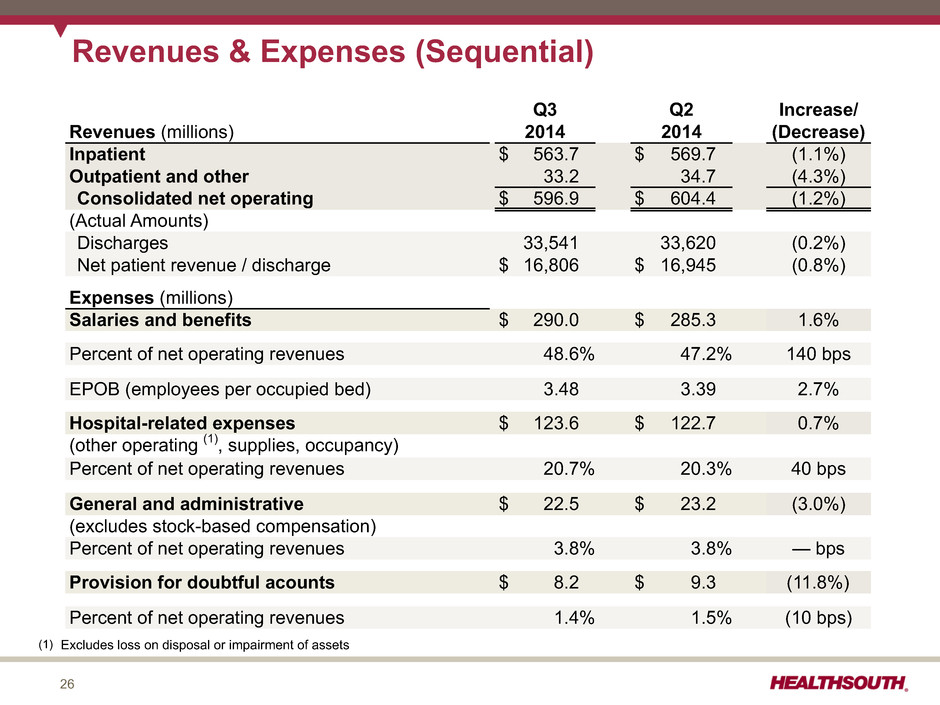
26 Revenues & Expenses (Sequential) Q3 Q2 Increase/ Revenues (millions) 2014 2014 (Decrease) Inpatient $ 563.7 $ 569.7 (1.1%) Outpatient and other 33.2 34.7 (4.3%) Consolidated net operating $ 596.9 $ 604.4 (1.2%) (Actual Amounts) Discharges 33,541 33,620 (0.2%) Net patient revenue / discharge $ 16,806 $ 16,945 (0.8%) Expenses (millions) Salaries and benefits $ 290.0 $ 285.3 1.6% Percent of net operating revenues 48.6% 47.2% 140 bps EPOB (employees per occupied bed) 3.48 3.39 2.7% Hospital-related expenses $ 123.6 $ 122.7 0.7% (other operating (1), supplies, occupancy) Percent of net operating revenues 20.7% 20.3% 40 bps General and administrative $ 22.5 $ 23.2 (3.0%) (excludes stock-based compensation) Percent of net operating revenues 3.8% 3.8% — bps Provision for doubtful acounts $ 8.2 $ 9.3 (11.8%) Percent of net operating revenues 1.4% 1.5% (10 bps) (1) Excludes loss on disposal or impairment of assets
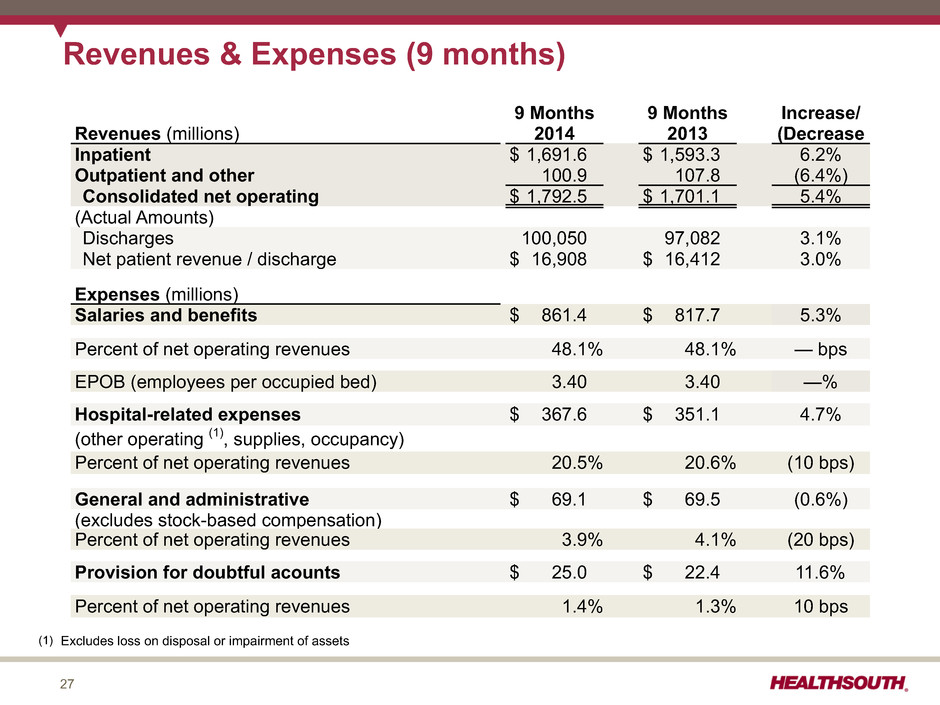
27 Revenues & Expenses (9 months) 9 Months 9 Months Increase/ Revenues (millions) 2014 2013 (Decrease Inpatient $ 1,691.6 $ 1,593.3 6.2% Outpatient and other 100.9 107.8 (6.4%) Consolidated net operating $ 1,792.5 $ 1,701.1 5.4% (Actual Amounts) Discharges 100,050 97,082 3.1% Net patient revenue / discharge $ 16,908 $ 16,412 3.0% Expenses (millions) Salaries and benefits $ 861.4 $ 817.7 5.3% Percent of net operating revenues 48.1% 48.1% — bps EPOB (employees per occupied bed) 3.40 3.40 —% Hospital-related expenses $ 367.6 $ 351.1 4.7% (other operating (1), supplies, occupancy) Percent of net operating revenues 20.5% 20.6% (10 bps) General and administrative $ 69.1 $ 69.5 (0.6%) (excludes stock-based compensation) Percent of net operating revenues 3.9% 4.1% (20 bps) Provision for doubtful acounts $ 25.0 $ 22.4 11.6% Percent of net operating revenues 1.4% 1.3% 10 bps (1) Excludes loss on disposal or impairment of assets
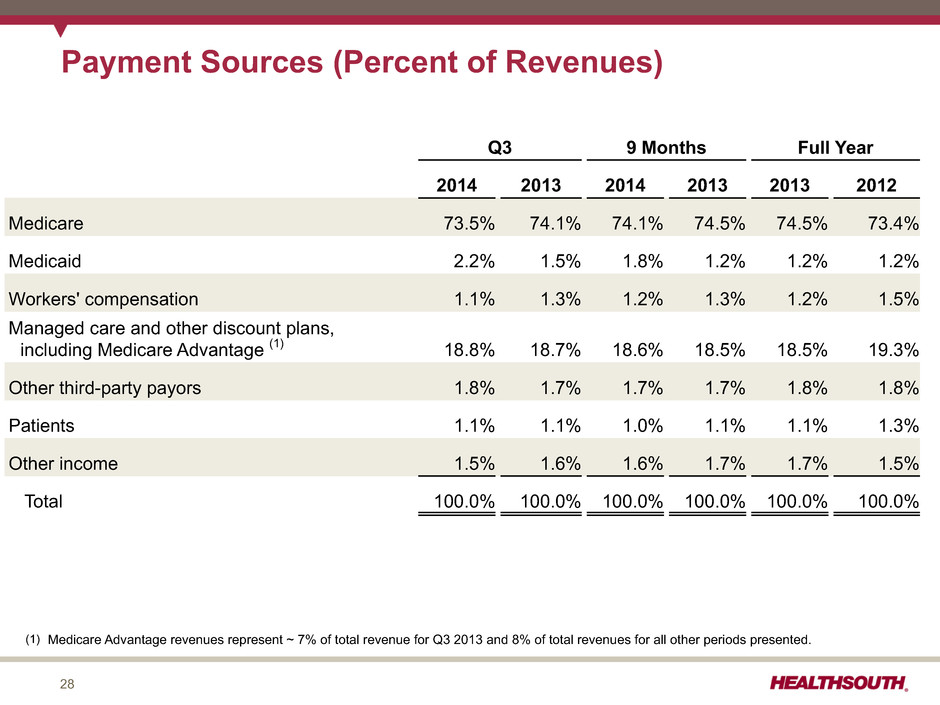
28 Payment Sources (Percent of Revenues) Q3 9 Months Full Year 2014 2013 2014 2013 2013 2012 Medicare 73.5% 74.1% 74.1% 74.5% 74.5% 73.4% Medicaid 2.2% 1.5% 1.8% 1.2% 1.2% 1.2% Workers' compensation 1.1% 1.3% 1.2% 1.3% 1.2% 1.5% Managed care and other discount plans, including Medicare Advantage (1) 18.8% 18.7% 18.6% 18.5% 18.5% 19.3% Other third-party payors 1.8% 1.7% 1.7% 1.7% 1.8% 1.8% Patients 1.1% 1.1% 1.0% 1.1% 1.1% 1.3% Other income 1.5% 1.6% 1.6% 1.7% 1.7% 1.5% Total 100.0% 100.0% 100.0% 100.0% 100.0% 100.0% (1) Medicare Advantage revenues represent ~ 7% of total revenue for Q3 2013 and 8% of total revenues for all other periods presented.
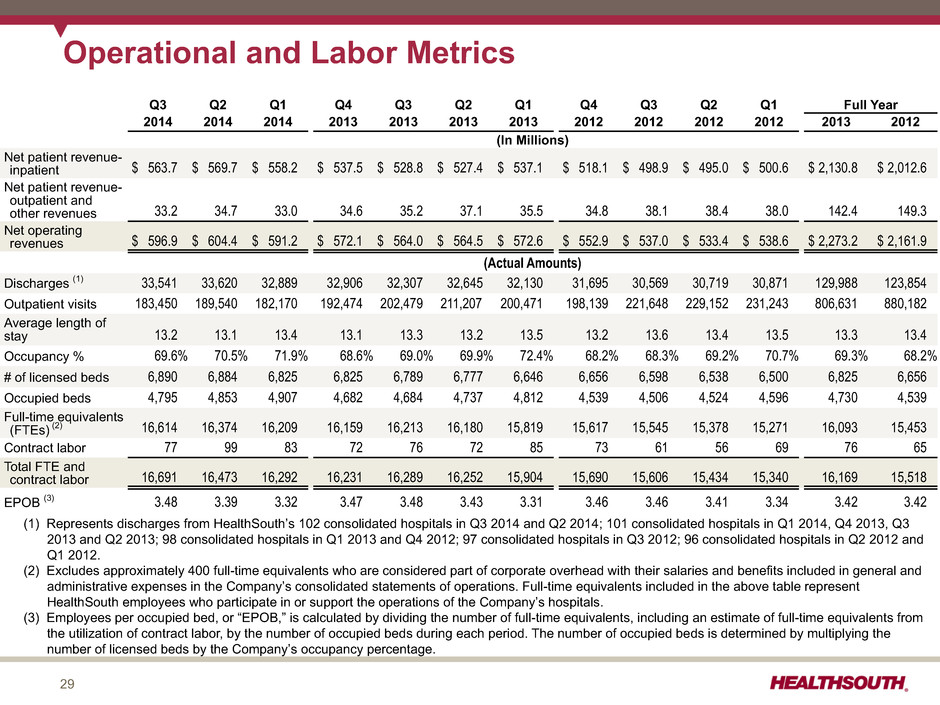
29 Operational and Labor Metrics Q3 Q2 Q1 Q4 Q3 Q2 Q1 Q4 Q3 Q2 Q1 Full Year 2014 2014 2014 2013 2013 2013 2013 2012 2012 2012 2012 2013 2012 (In Millions) Net patient revenue- inpatient $ 563.7 $ 569.7 $ 558.2 $ 537.5 $ 528.8 $ 527.4 $ 537.1 $ 518.1 $ 498.9 $ 495.0 $ 500.6 $ 2,130.8 $ 2,012.6 Net patient revenue- outpatient and other revenues 33.2 34.7 33.0 34.6 35.2 37.1 35.5 34.8 38.1 38.4 38.0 142.4 149.3 Net operating revenues $ 596.9 $ 604.4 $ 591.2 $ 572.1 $ 564.0 $ 564.5 $ 572.6 $ 552.9 $ 537.0 $ 533.4 $ 538.6 $ 2,273.2 $ 2,161.9 (Actual Amounts) Discharges (1) 33,541 33,620 32,889 32,906 32,307 32,645 32,130 31,695 30,569 30,719 30,871 129,988 123,854 Outpatient visits 183,450 189,540 182,170 192,474 202,479 211,207 200,471 198,139 221,648 229,152 231,243 806,631 880,182 Average length of stay 13.2 13.1 13.4 13.1 13.3 13.2 13.5 13.2 13.6 13.4 13.5 13.3 13.4 Occupancy % 69.6% 70.5% 71.9% 68.6% 69.0% 69.9% 72.4% 68.2% 68.3% 69.2% 70.7% 69.3% 68.2% # of licensed beds 6,890 6,884 6,825 6,825 6,789 6,777 6,646 6,656 6,598 6,538 6,500 6,825 6,656 Occupied beds 4,795 4,853 4,907 4,682 4,684 4,737 4,812 4,539 4,506 4,524 4,596 4,730 4,539 Full-time equivalents (FTEs) (2) 16,614 16,374 16,209 16,159 16,213 16,180 15,819 15,617 15,545 15,378 15,271 16,093 15,453 Contract labor 77 99 83 72 76 72 85 73 61 56 69 76 65 Total FTE and contract labor 16,691 16,473 16,292 16,231 16,289 16,252 15,904 15,690 15,606 15,434 15,340 16,169 15,518 EPOB (3) 3.48 3.39 3.32 3.47 3.48 3.43 3.31 3.46 3.46 3.41 3.34 3.42 3.42 (1) Represents discharges from HealthSouth’s 102 consolidated hospitals in Q3 2014 and Q2 2014; 101 consolidated hospitals in Q1 2014, Q4 2013, Q3 2013 and Q2 2013; 98 consolidated hospitals in Q1 2013 and Q4 2012; 97 consolidated hospitals in Q3 2012; 96 consolidated hospitals in Q2 2012 and Q1 2012. (2) Excludes approximately 400 full-time equivalents who are considered part of corporate overhead with their salaries and benefits included in general and administrative expenses in the Company’s consolidated statements of operations. Full-time equivalents included in the above table represent HealthSouth employees who participate in or support the operations of the Company’s hospitals. (3) Employees per occupied bed, or “EPOB,” is calculated by dividing the number of full-time equivalents, including an estimate of full-time equivalents from the utilization of contract labor, by the number of occupied beds during each period. The number of occupied beds is determined by multiplying the number of licensed beds by the Company’s occupancy percentage.
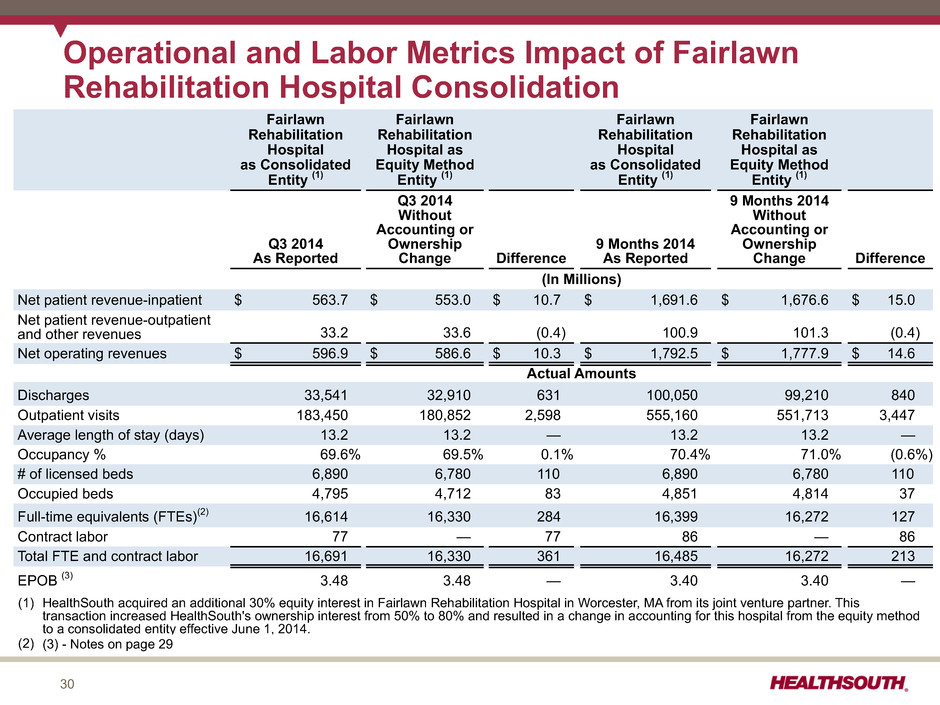
30 Fairlawn Rehabilitation Hospital as Consolidated Entity (1) Fairlawn Rehabilitation Hospital as Equity Method Entity (1) Fairlawn Rehabilitation Hospital as Consolidated Entity (1) Fairlawn Rehabilitation Hospital as Equity Method Entity (1) Q3 2014 As Reported Q3 2014 Without Accounting or Ownership Change Difference 9 Months 2014 As Reported 9 Months 2014 Without Accounting or Ownership Change Difference (In Millions) Net patient revenue-inpatient $ 563.7 $ 553.0 $ 10.7 $ 1,691.6 $ 1,676.6 $ 15.0 Net patient revenue-outpatient and other revenues 33.2 33.6 (0.4) 100.9 101.3 (0.4) Net operating revenues $ 596.9 $ 586.6 $ 10.3 $ 1,792.5 $ 1,777.9 $ 14.6 Actual Amounts Discharges 33,541 32,910 631 100,050 99,210 840 Outpatient visits 183,450 180,852 2,598 555,160 551,713 3,447 Average length of stay (days) 13.2 13.2 — 13.2 13.2 — Occupancy % 69.6% 69.5% 0.1% 70.4% 71.0% (0.6%) # of licensed beds 6,890 6,780 110 6,890 6,780 110 Occupied beds 4,795 4,712 83 4,851 4,814 37 Full-time equivalents (FTEs)(2) 16,614 16,330 284 16,399 16,272 127 Contract labor 77 — 77 86 — 86 Total FTE and contract labor 16,691 16,330 361 16,485 16,272 213 EPOB (3) 3.48 3.48 — 3.40 3.40 — Operational and Labor Metrics Impact of Fairlawn Rehabilitation Hospital Consolidation (1) HealthSouth acquired an additional 30% equity interest in Fairlawn Rehabilitation Hospital in Worcester, MA from its joint venture partner. This transaction increased HealthSouth's ownership interest from 50% to 80% and resulted in a change in accounting for this hospital from the equity method to a consolidated entity effective June 1, 2014. (2) (3) - Notes on page 29
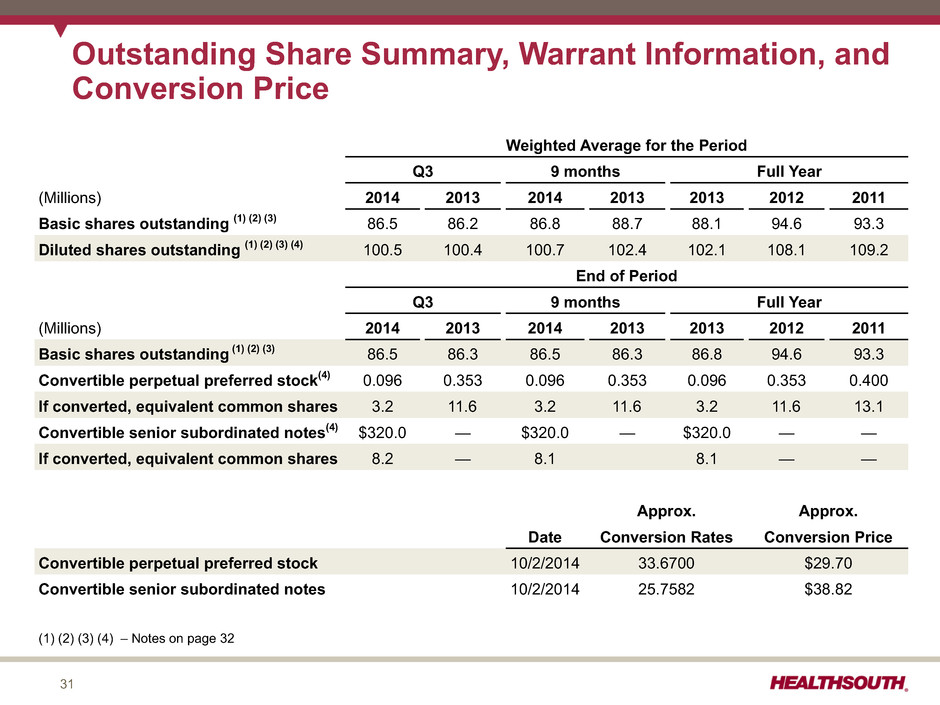
31 Outstanding Share Summary, Warrant Information, and Conversion Price Weighted Average for the Period Q3 9 months Full Year (Millions) 2014 2013 2014 2013 2013 2012 2011 Basic shares outstanding (1) (2) (3) 86.5 86.2 86.8 88.7 88.1 94.6 93.3 Diluted shares outstanding (1) (2) (3) (4) 100.5 100.4 100.7 102.4 102.1 108.1 109.2 End of Period Q3 9 months Full Year (Millions) 2014 2013 2014 2013 2013 2012 2011 Basic shares outstanding (1) (2) (3) 86.5 86.3 86.5 86.3 86.8 94.6 93.3 Convertible perpetual preferred stock(4) 0.096 0.353 0.096 0.353 0.096 0.353 0.400 If converted, equivalent common shares 3.2 11.6 3.2 11.6 3.2 11.6 13.1 Convertible senior subordinated notes(4) $320.0 — $320.0 — $320.0 — — If converted, equivalent common shares 8.2 — 8.1 8.1 — — Approx. Approx. Date Conversion Rates Conversion Price Convertible perpetual preferred stock 10/2/2014 33.6700 $29.70 Convertible senior subordinated notes 10/2/2014 25.7582 $38.82 (1) (2) (3) (4) – Notes on page 32
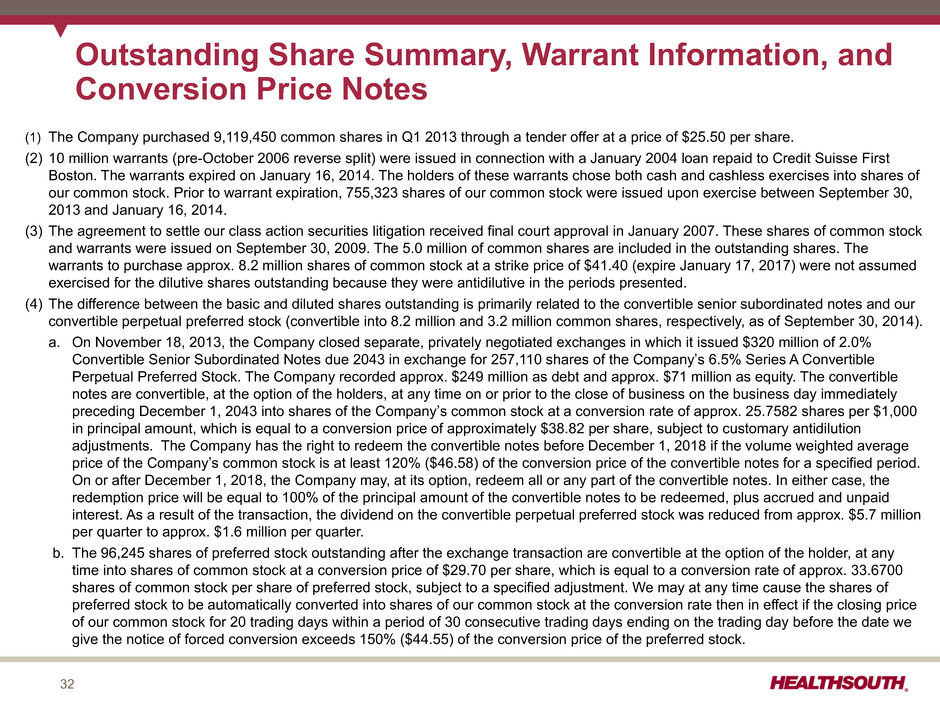
32 Outstanding Share Summary, Warrant Information, and Conversion Price Notes (1) The Company purchased 9,119,450 common shares in Q1 2013 through a tender offer at a price of $25.50 per share. (2) 10 million warrants (pre-October 2006 reverse split) were issued in connection with a January 2004 loan repaid to Credit Suisse First Boston. The warrants expired on January 16, 2014. The holders of these warrants chose both cash and cashless exercises into shares of our common stock. Prior to warrant expiration, 755,323 shares of our common stock were issued upon exercise between September 30, 2013 and January 16, 2014. (3) The agreement to settle our class action securities litigation received final court approval in January 2007. These shares of common stock and warrants were issued on September 30, 2009. The 5.0 million of common shares are included in the outstanding shares. The warrants to purchase approx. 8.2 million shares of common stock at a strike price of $41.40 (expire January 17, 2017) were not assumed exercised for the dilutive shares outstanding because they were antidilutive in the periods presented. (4) The difference between the basic and diluted shares outstanding is primarily related to the convertible senior subordinated notes and our convertible perpetual preferred stock (convertible into 8.2 million and 3.2 million common shares, respectively, as of September 30, 2014). a. On November 18, 2013, the Company closed separate, privately negotiated exchanges in which it issued $320 million of 2.0% Convertible Senior Subordinated Notes due 2043 in exchange for 257,110 shares of the Company’s 6.5% Series A Convertible Perpetual Preferred Stock. The Company recorded approx. $249 million as debt and approx. $71 million as equity. The convertible notes are convertible, at the option of the holders, at any time on or prior to the close of business on the business day immediately preceding December 1, 2043 into shares of the Company’s common stock at a conversion rate of approx. 25.7582 shares per $1,000 in principal amount, which is equal to a conversion price of approximately $38.82 per share, subject to customary antidilution adjustments. The Company has the right to redeem the convertible notes before December 1, 2018 if the volume weighted average price of the Company’s common stock is at least 120% ($46.58) of the conversion price of the convertible notes for a specified period. On or after December 1, 2018, the Company may, at its option, redeem all or any part of the convertible notes. In either case, the redemption price will be equal to 100% of the principal amount of the convertible notes to be redeemed, plus accrued and unpaid interest. As a result of the transaction, the dividend on the convertible perpetual preferred stock was reduced from approx. $5.7 million per quarter to approx. $1.6 million per quarter. b. The 96,245 shares of preferred stock outstanding after the exchange transaction are convertible at the option of the holder, at any time into shares of common stock at a conversion price of $29.70 per share, which is equal to a conversion rate of approx. 33.6700 shares of common stock per share of preferred stock, subject to a specified adjustment. We may at any time cause the shares of preferred stock to be automatically converted into shares of our common stock at the conversion rate then in effect if the closing price of our common stock for 20 trading days within a period of 30 consecutive trading days ending on the trading day before the date we give the notice of forced conversion exceeds 150% ($44.55) of the conversion price of the preferred stock.
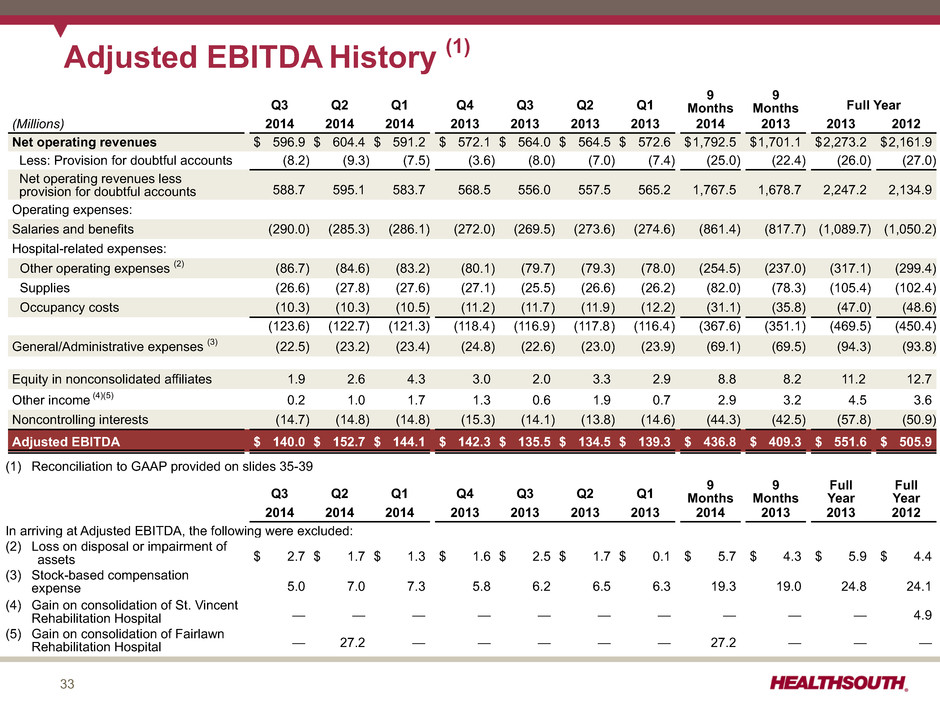
33 Adjusted EBITDA History (1) Q3 Q2 Q1 Q4 Q3 Q2 Q1 9 Months 9 Months Full Year (Millions) 2014 2014 2014 2013 2013 2013 2013 2014 2013 2013 2012 Net operating revenues $ 596.9 $ 604.4 $ 591.2 $ 572.1 $ 564.0 $ 564.5 $ 572.6 $1,792.5 $1,701.1 $2,273.2 $2,161.9 Less: Provision for doubtful accounts (8.2) (9.3) (7.5) (3.6) (8.0) (7.0) (7.4) (25.0) (22.4) (26.0) (27.0) Net operating revenues less provision for doubtful accounts 588.7 595.1 583.7 568.5 556.0 557.5 565.2 1,767.5 1,678.7 2,247.2 2,134.9 Operating expenses: Salaries and benefits (290.0) (285.3) (286.1) (272.0) (269.5) (273.6) (274.6) (861.4) (817.7) (1,089.7) (1,050.2) Hospital-related expenses: Other operating expenses (2) (86.7) (84.6) (83.2) (80.1) (79.7) (79.3) (78.0) (254.5) (237.0) (317.1) (299.4) Supplies (26.6) (27.8) (27.6) (27.1) (25.5) (26.6) (26.2) (82.0) (78.3) (105.4) (102.4) Occupancy costs (10.3) (10.3) (10.5) (11.2) (11.7) (11.9) (12.2) (31.1) (35.8) (47.0) (48.6) (123.6) (122.7) (121.3) (118.4) (116.9) (117.8) (116.4) (367.6) (351.1) (469.5) (450.4) General/Administrative expenses (3) (22.5) (23.2) (23.4) (24.8) (22.6) (23.0) (23.9) (69.1) (69.5) (94.3) (93.8) Equity in nonconsolidated affiliates 1.9 2.6 4.3 3.0 2.0 3.3 2.9 8.8 8.2 11.2 12.7 Other income (4)(5) 0.2 1.0 1.7 1.3 0.6 1.9 0.7 2.9 3.2 4.5 3.6 Noncontrolling interests (14.7) (14.8) (14.8) (15.3) (14.1) (13.8) (14.6) (44.3) (42.5) (57.8) (50.9) Adjusted EBITDA $ 140.0 $ 152.7 $ 144.1 $ 142.3 $ 135.5 $ 134.5 $ 139.3 $ 436.8 $ 409.3 $ 551.6 $ 505.9 (1) Reconciliation to GAAP provided on slides 35-39 Q3 Q2 Q1 Q4 Q3 Q2 Q1 9Months 9 Months Full Year Full Year 2014 2014 2014 2013 2013 2013 2013 2014 2013 2013 2012 In arriving at Adjusted EBITDA, the following were excluded: (2) Loss on disposal or impairment of assets $ 2.7 $ 1.7 $ 1.3 $ 1.6 $ 2.5 $ 1.7 $ 0.1 $ 5.7 $ 4.3 $ 5.9 $ 4.4 (3) Stock-based compensation expense 5.0 7.0 7.3 5.8 6.2 6.5 6.3 19.3 19.0 24.8 24.1 (4) Gain on consolidation of St. Vincent Rehabilitation Hospital — — — — — — — — — — 4.9 (5) Gain on consolidation of Fairlawn Rehabilitation Hospital — 27.2 — — — — — 27.2 — — —
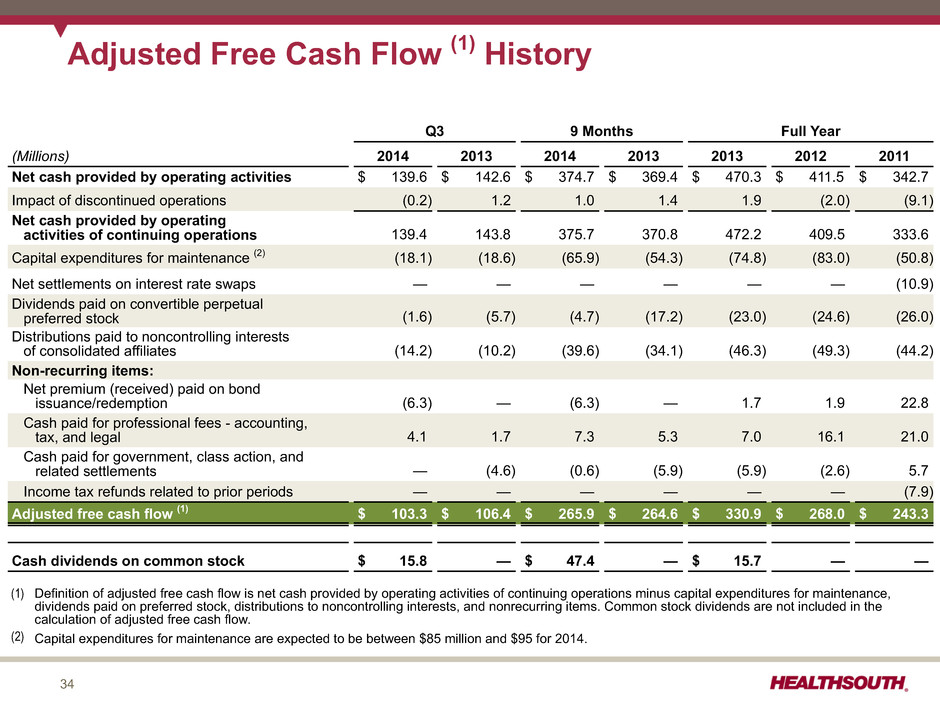
34 Adjusted Free Cash Flow (1) History Q3 9 Months Full Year (Millions) 2014 2013 2014 2013 2013 2012 2011 Net cash provided by operating activities $ 139.6 $ 142.6 $ 374.7 $ 369.4 $ 470.3 $ 411.5 $ 342.7 Impact of discontinued operations (0.2) 1.2 1.0 1.4 1.9 (2.0) (9.1) Net cash provided by operating activities of continuing operations 139.4 143.8 375.7 370.8 472.2 409.5 333.6 Capital expenditures for maintenance (2) (18.1) (18.6) (65.9) (54.3) (74.8) (83.0) (50.8) Net settlements on interest rate swaps — — — — — — (10.9) Dividends paid on convertible perpetual preferred stock (1.6) (5.7) (4.7) (17.2) (23.0) (24.6) (26.0) Distributions paid to noncontrolling interests of consolidated affiliates (14.2) (10.2) (39.6) (34.1) (46.3) (49.3) (44.2) Non-recurring items: Net premium (received) paid on bond issuance/redemption (6.3) — (6.3) — 1.7 1.9 22.8 Cash paid for professional fees - accounting, tax, and legal 4.1 1.7 7.3 5.3 7.0 16.1 21.0 Cash paid for government, class action, and related settlements — (4.6) (0.6) (5.9) (5.9) (2.6) 5.7 Income tax refunds related to prior periods — — — — — — (7.9) Adjusted free cash flow (1) $ 103.3 $ 106.4 $ 265.9 $ 264.6 $ 330.9 $ 268.0 $ 243.3 Cash dividends on common stock $ 15.8 — $ 47.4 — $ 15.7 — — (1) Definition of adjusted free cash flow is net cash provided by operating activities of continuing operations minus capital expenditures for maintenance, dividends paid on preferred stock, distributions to noncontrolling interests, and nonrecurring items. Common stock dividends are not included in the calculation of adjusted free cash flow. (2) Capital expenditures for maintenance are expected to be between $85 million and $95 for 2014.
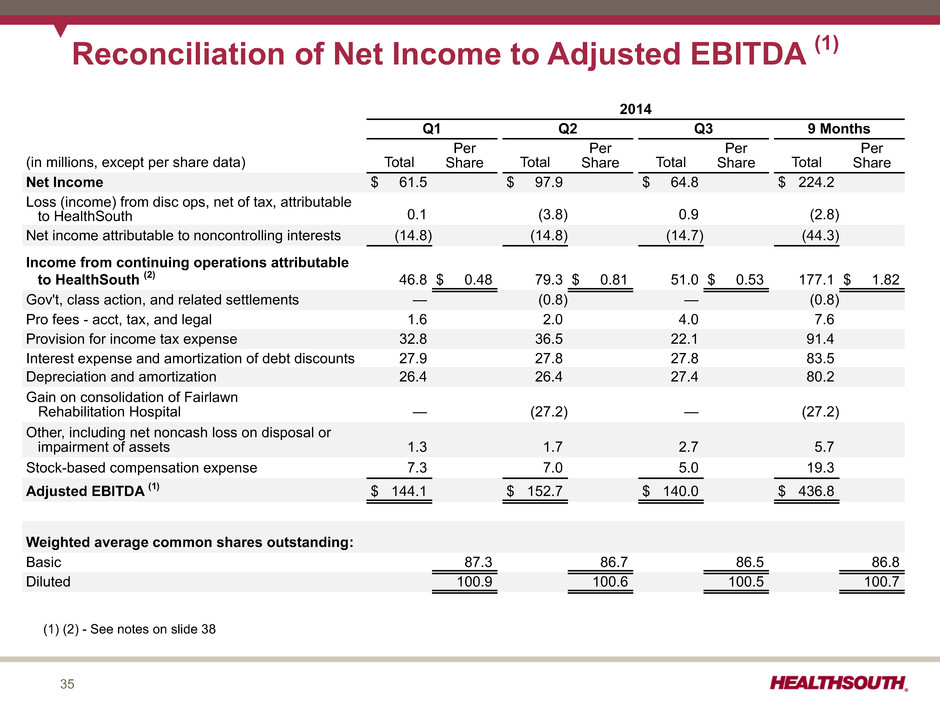
35 Reconciliation of Net Income to Adjusted EBITDA (1) 2014 Q1 Q2 Q3 9 Months (in millions, except per share data) Total Per Share Total Per Share Total Per Share Total Per Share Net Income $ 61.5 $ 97.9 $ 64.8 $ 224.2 Loss (income) from disc ops, net of tax, attributable to HealthSouth 0.1 (3.8) 0.9 (2.8) Net income attributable to noncontrolling interests (14.8) (14.8) (14.7) (44.3) Income from continuing operations attributable to HealthSouth (2) 46.8 $ 0.48 79.3 $ 0.81 51.0 $ 0.53 177.1 $ 1.82 Gov't, class action, and related settlements — (0.8) — (0.8) Pro fees - acct, tax, and legal 1.6 2.0 4.0 7.6 Provision for income tax expense 32.8 36.5 22.1 91.4 Interest expense and amortization of debt discounts 27.9 27.8 27.8 83.5 Depreciation and amortization 26.4 26.4 27.4 80.2 Gain on consolidation of Fairlawn Rehabilitation Hospital — (27.2) — (27.2) Other, including net noncash loss on disposal or impairment of assets 1.3 1.7 2.7 5.7 Stock-based compensation expense 7.3 7.0 5.0 19.3 Adjusted EBITDA (1) $ 144.1 $ 152.7 $ 140.0 $ 436.8 Weighted average common shares outstanding: Basic 87.3 86.7 86.5 86.8 Diluted 100.9 100.6 100.5 100.7 (1) (2) - See notes on slide 38
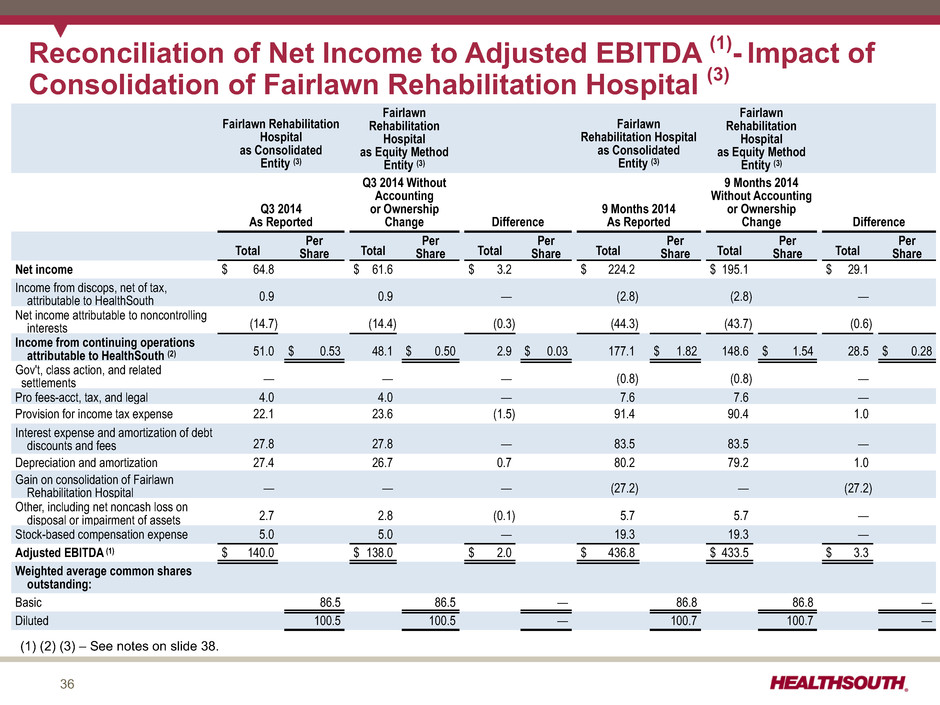
36 Fairlawn Rehabilitation Hospital as Consolidated Entity (3) Fairlawn Rehabilitation Hospital as Equity Method Entity (3) Fairlawn Rehabilitation Hospital as Consolidated Entity (3) Fairlawn Rehabilitation Hospital as Equity Method Entity (3) Q3 2014 As Reported Q3 2014 Without Accounting or Ownership Change Difference 9 Months 2014 As Reported 9 Months 2014 Without Accounting or Ownership Change Difference Total Per Share Total Per Share Total Per Share Total Per Share Total Per Share Total Per Share Net income $ 64.8 $ 61.6 $ 3.2 $ 224.2 $ 195.1 $ 29.1 Income from discops, net of tax, attributable to HealthSouth 0.9 0.9 — (2.8) (2.8) — Net income attributable to noncontrolling interests (14.7) (14.4) (0.3) (44.3) (43.7) (0.6) Income from continuing operations attributable to HealthSouth (2) 51.0 $ 0.53 48.1 $ 0.50 2.9 $ 0.03 177.1 $ 1.82 148.6 $ 1.54 28.5 $ 0.28 Gov't, class action, and related settlements — — — (0.8) (0.8) — Pro fees-acct, tax, and legal 4.0 4.0 — 7.6 7.6 — Provision for income tax expense 22.1 23.6 (1.5) 91.4 90.4 1.0 Interest expense and amortization of debt discounts and fees 27.8 27.8 — 83.5 83.5 — Depreciation and amortization 27.4 26.7 0.7 80.2 79.2 1.0 Gain on consolidation of Fairlawn Rehabilitation Hospital — — — (27.2) — (27.2) Other, including net noncash loss on disposal or impairment of assets 2.7 2.8 (0.1) 5.7 5.7 — Stock-based compensation expense 5.0 5.0 — 19.3 19.3 — Adjusted EBITDA (1) $ 140.0 $ 138.0 $ 2.0 $ 436.8 $ 433.5 $ 3.3 Weighted average common shares outstanding: Basic 86.5 86.5 — 86.8 86.8 — Diluted 100.5 100.5 — 100.7 100.7 — Reconciliation of Net Income to Adjusted EBITDA (1)- Impact of Consolidation of Fairlawn Rehabilitation Hospital (3) (1) (2) (3) – See notes on slide 38.
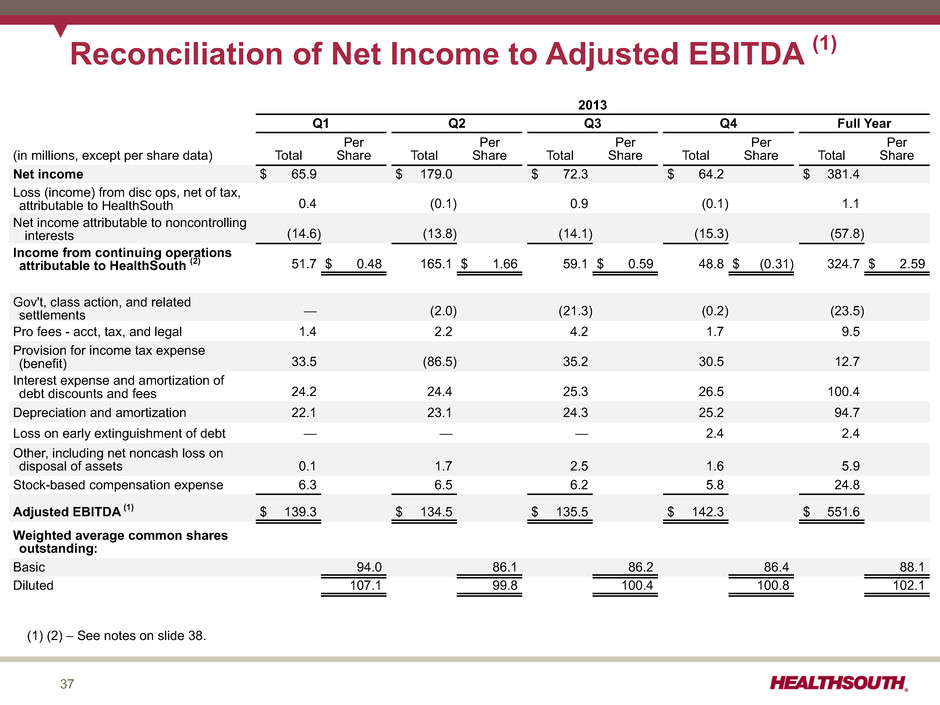
37 Reconciliation of Net Income to Adjusted EBITDA (1) 2013 Q1 Q2 Q3 Q4 Full Year (in millions, except per share data) Total Per Share Total Per Share Total Per Share Total Per Share Total Per Share Net income $ 65.9 $ 179.0 $ 72.3 $ 64.2 $ 381.4 Loss (income) from disc ops, net of tax, attributable to HealthSouth 0.4 (0.1) 0.9 (0.1) 1.1 Net income attributable to noncontrolling interests (14.6) (13.8) (14.1) (15.3) (57.8) Income from continuing operations attributable to HealthSouth (2) 51.7 $ 0.48 165.1 $ 1.66 59.1 $ 0.59 48.8 $ (0.31) 324.7 $ 2.59 Gov't, class action, and related settlements — (2.0) (21.3) (0.2) (23.5) Pro fees - acct, tax, and legal 1.4 2.2 4.2 1.7 9.5 Provision for income tax expense (benefit) 33.5 (86.5) 35.2 30.5 12.7 Interest expense and amortization of debt discounts and fees 24.2 24.4 25.3 26.5 100.4 Depreciation and amortization 22.1 23.1 24.3 25.2 94.7 Loss on early extinguishment of debt — — — 2.4 2.4 Other, including net noncash loss on disposal of assets 0.1 1.7 2.5 1.6 5.9 Stock-based compensation expense 6.3 6.5 6.2 5.8 24.8 Adjusted EBITDA (1) $ 139.3 $ 134.5 $ 135.5 $ 142.3 $ 551.6 Weighted average common shares outstanding: Basic 94.0 86.1 86.2 86.4 88.1 Diluted 107.1 99.8 100.4 100.8 102.1 (1) (2) – See notes on slide 38.
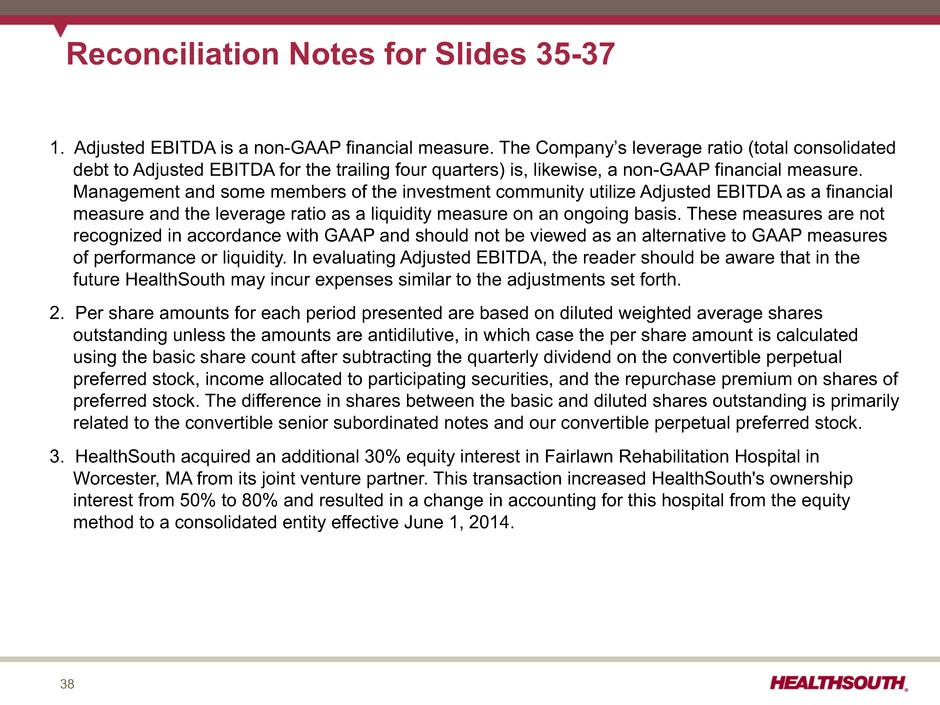
38 Reconciliation Notes for Slides 35-37 1. Adjusted EBITDA is a non-GAAP financial measure. The Company’s leverage ratio (total consolidated debt to Adjusted EBITDA for the trailing four quarters) is, likewise, a non-GAAP financial measure. Management and some members of the investment community utilize Adjusted EBITDA as a financial measure and the leverage ratio as a liquidity measure on an ongoing basis. These measures are not recognized in accordance with GAAP and should not be viewed as an alternative to GAAP measures of performance or liquidity. In evaluating Adjusted EBITDA, the reader should be aware that in the future HealthSouth may incur expenses similar to the adjustments set forth. 2. Per share amounts for each period presented are based on diluted weighted average shares outstanding unless the amounts are antidilutive, in which case the per share amount is calculated using the basic share count after subtracting the quarterly dividend on the convertible perpetual preferred stock, income allocated to participating securities, and the repurchase premium on shares of preferred stock. The difference in shares between the basic and diluted shares outstanding is primarily related to the convertible senior subordinated notes and our convertible perpetual preferred stock. 3. HealthSouth acquired an additional 30% equity interest in Fairlawn Rehabilitation Hospital in Worcester, MA from its joint venture partner. This transaction increased HealthSouth's ownership interest from 50% to 80% and resulted in a change in accounting for this hospital from the equity method to a consolidated entity effective June 1, 2014.
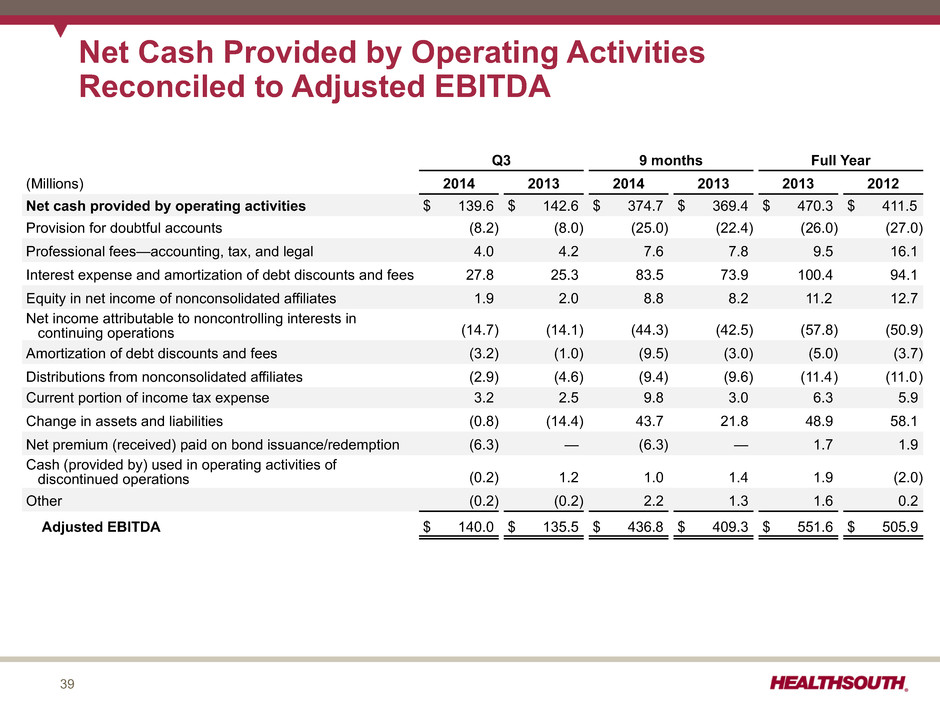
39 Net Cash Provided by Operating Activities Reconciled to Adjusted EBITDA Q3 9 months Full Year (Millions) 2014 2013 2014 2013 2013 2012 Net cash provided by operating activities $ 139.6 $ 142.6 $ 374.7 $ 369.4 $ 470.3 $ 411.5 Provision for doubtful accounts (8.2) (8.0) (25.0) (22.4) (26.0) (27.0) Professional fees—accounting, tax, and legal 4.0 4.2 7.6 7.8 9.5 16.1 Interest expense and amortization of debt discounts and fees 27.8 25.3 83.5 73.9 100.4 94.1 Equity in net income of nonconsolidated affiliates 1.9 2.0 8.8 8.2 11.2 12.7 Net income attributable to noncontrolling interests in continuing operations (14.7) (14.1) (44.3) (42.5) (57.8) (50.9) Amortization of debt discounts and fees (3.2) (1.0) (9.5) (3.0) (5.0) (3.7) Distributions from nonconsolidated affiliates (2.9) (4.6) (9.4) (9.6) (11.4) (11.0) Current portion of income tax expense 3.2 2.5 9.8 3.0 6.3 5.9 Change in assets and liabilities (0.8) (14.4) 43.7 21.8 48.9 58.1 Net premium (received) paid on bond issuance/redemption (6.3) — (6.3) — 1.7 1.9 Cash (provided by) used in operating activities of discontinued operations (0.2) 1.2 1.0 1.4 1.9 (2.0) Other (0.2) (0.2) 2.2 1.3 1.6 0.2 Adjusted EBITDA $ 140.0 $ 135.5 $ 436.8 $ 409.3 $ 551.6 $ 505.9


