

2 The information contained in this presentation includes certain estimates, projections and other forward- looking information that reflect our current outlook, views and plans with respect to future events, including legislative and regulatory developments, strategy, capital expenditures, development activities, dividend strategies, repurchases of securities, effective tax rates, financial performance, and business model. These estimates, projections and other forward-looking information are based on assumptions that HealthSouth believes, as of the date hereof, are reasonable. Inevitably, there will be differences between such estimates and actual events or results, and those differences may be material. There can be no assurance that any estimates, projections or forward-looking information will be realized. All such estimates, projections and forward-looking information speak only as of the date hereof. HealthSouth undertakes no duty to publicly update or revise the information contained herein. You are cautioned not to place undue reliance on the estimates, projections and other forward-looking information in this presentation as they are based on current expectations and general assumptions and are subject to various risks, uncertainties and other factors, including those set forth in the Form 10-K for the year ended December 31, 2014, the Form 10-Q for the quarters ended March 31, 2015, June 30, 2015, and September 30, 2015, and in other documents we previously filed with the SEC, many of which are beyond our control, that may cause actual events or results to differ materially from the views, beliefs and estimates expressed herein. Note Regarding Presentation of Non-GAAP Financial Measures The following presentation includes certain “non-GAAP financial measures” as defined in Regulation G under the Securities Exchange Act of 1934. Schedules are attached that reconcile the non-GAAP financial measures included in the following presentation to the most directly comparable financial measures calculated and presented in accordance with Generally Accepted Accounting Principles in the United States. Our Form 8-K, dated January 11, 2016 to which the following supplemental slides are attached as Exhibit 99.1, provides further explanation and disclosure regarding our use of non-GAAP financial measures and should be read in conjunction with these supplemental slides. Forward-Looking Statements

3 Inpatient Rehabilitation Portfolio - As of December 31, 2015 121 Inpatient Rehabilitation Hospitals • 33 operate as JV’s with Acute Care Hospitals 29 Number of States(plus Puerto Rico) ~ 27,100 Employees HealthSouth: A Leading Provider of Post-Acute Care Encompass Home Health and Hospice Portfolio – As of December 31, 2015 179 Adult Home Health Locations 7 Pediatric Home Health Locations 27 Hospice Locations 23 Number of States ~ 7,500 Employees IRF Marketshare 10% of IRFs 21% of Licensed Beds 28% of Medicare Patients Served Home Health and Hospice Marketshare 5th largest provider of Medicare-certified skilled home health services 59% of HealthSouth's IRFs are located within a 30-mile radius of an Encompass location. Note: One of the 121 IRFs and two of the 179 adult home health locations are nonconsolidated. These locations are accounted for using the equity method of accounting.

4 Adjusted EPS*(1) Track Record 2010 2011 2012 2013 2014 2015 Estimate $1,878 $2,027 $2,162 $2,273 $2,406 $3,150($ millions) 2010 2011 2012 2013 2014 2015 Guidance $410 $466 $506 $552 $578 $675 ’10-’14 CAGR = 9.0 %($ millions) ’10-’14 CAGR = 6.4 % Adjusted EBITDA* HealthSouth has not closed its books as of and for the year ended December 31, 2015. All 2015 amounts are estimates. CAGR = Compound annual growth rate; the average growth rate over a period of years. *Reconciliation to GAAP provided on pages 28-42; Refer to pages 44-45 for end notes. 2010 2011 2012 2013 2014 2015 Guidance $1.12 $1.20 $1.61 $1.94 $2.05 $2.20 ’10-’14 CAGR = 16.3 % Earnings per Share from Continuing Operations Attributable to HealthSouth Guidance on a GAAP Basis: $1.94 to $1.99 Guidance on an Adjusted Basis(1): $2.20 to $2.26 $3,170 $685 $2.26 2010 2011 2012 2013 2014 2015 Estimate $181 $243 $268 $331 $311 $335 Adjusted Free Cash Flow* ($ millions) $365 ’10-’14 CAGR = 14.5 % Revenue

5 Key Demographic Tailwind: Expanding Medicare Beneficiary Population Key Observations: • The growth rate of Medicare beneficiaries increased in 2011 from a 2% CAGR to an approx. 3% CAGR as “baby boomers” started turning 65. • In 15 years (2030), the Medicare population is projected to increase to 80 million beneficiaries from 54 million beneficiaries. Source: www.census.gov/population/projections/files/summary/NP2014-T9.xls; Center for Medicare & Medicaid Services, Medicare Trust Report July 2015 – page 20; MedPAC Payment Policy, March 2015 – pages 19 and 321; Congressional Budget Office’s, March 2015 Medicare Baseline Average Age of HealthSouth Patients IRF Home Health < 65 years 29% 15% 65 to 69 years 13% 12% 70 to 74 years 13% 13% 75 to 79 years 14% 14% 80 to 84 years 14% 16% 85 to 89 years 11% 16% > 90 years 6% 14%

6 CMS: Driving Change Toward Integrated Delivery Payment Models, Value-Based Purchasing Future Post-Acute Providers (Timing?) Inpatient Rehabilitation Facilities Home Health Skilled Nursing Facilities Hospice • Full range: low acuity è high acuity • 24/7 nursing coverage • Eliminates payment silos Home-Based Post-Acute Services • More care in the home (lowest cost setting) • Differentiator: Ability to care for high-acuity, poly-chronic patients >> 50% of Medicare fee-for-service payments via integrated delivery payment models >> 90% of Medicare fee-for-service payments tied to quality/value ü Integrated Delivery Payment Models ü Value-Based Payments Current Post-Acute Providers ü Medicare payments/regulations are site specific (e.g., 60% Rule, 3-Hour Rule, one-to-one therapy). ü Medicare payments/regulations will be outcome focused. ü Many existing regulations will become obsolete. Facility-Based Post Acute Services >> 30% of Medicare fee-for-service payments via integrated delivery payment models (e.g., bundled payments accountable care organizations (ACOs)) >> 85% of Medicare fee-for-service payments tied to quality/value (i.e., value-based purchasing, readmissions reduction programs) 2017 Long-Term Acute Care Hospitals 2016 Source: Health and Human Services Fact Sheet announcing new reimbursement goals - January 26, 2015 CMS Goals 2018 2019 CMS Goals
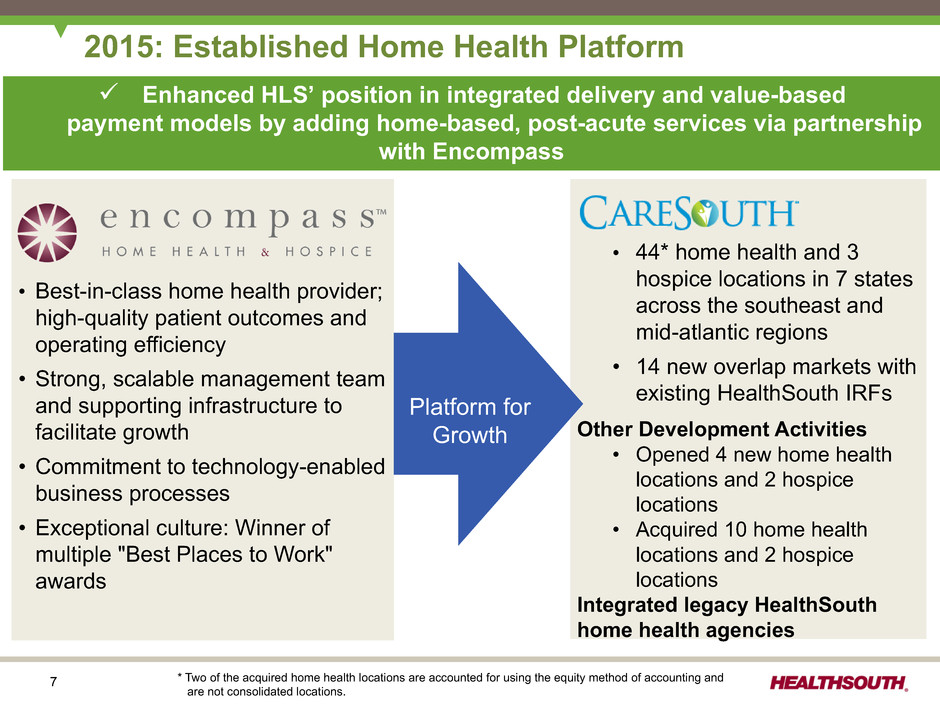
7 2015: Established Home Health Platform ü Enhanced HLS’ position in integrated delivery and value-based payment models by adding home-based, post-acute services via partnership with Encompass • Best-in-class home health provider; high-quality patient outcomes and operating efficiency • Strong, scalable management team and supporting infrastructure to facilitate growth • Commitment to technology-enabled business processes • Exceptional culture: Winner of multiple "Best Places to Work" awards • 44* home health and 3 hospice locations in 7 states across the southeast and mid-atlantic regions • 14 new overlap markets with existing HealthSouth IRFs Other Development Activities • Opened 4 new home health locations and 2 hospice locations • Acquired 10 home health locations and 2 hospice locations Integrated legacy HealthSouth home health agencies * Two of the acquired home health locations are accounted for using the equity method of accounting and are not consolidated locations. Platform for Growth

8 2015: Expanded Inpatient Rehabilitation Portfolio ü Entered new markets, primarily through joint ventures ü Enhanced geographic coverage in existing markets December 31, 2014 2015 # of hospitals 107 121 # of licensed beds 7,095 8,404 ACQUISITIONS • Cardinal Hill Rehabilitation Hospital in Lexington, KY • Reliant Hospital Partners - 11 hospitals; 902 beds - Increased geographic coverage in prominent Texas markets - Added new markets in Massachusetts and Ohio JOINT VENTURES • Memorial Health in Savannah, GA • West Tennessee Healthcare System in Jackson, TN • Mount Carmel Health System in Westerville, OH • St. John Health System in Broken Arrow, OK • CHI St. Vincent Hot Springs in Hot Springs, AR • St. Joseph Health System in Bryan, TX • Vanderbilt University in Franklin, TN (tentative) BED EXPANSIONS • Added 85 net beds to existing hospitals 13% increase 18% increase
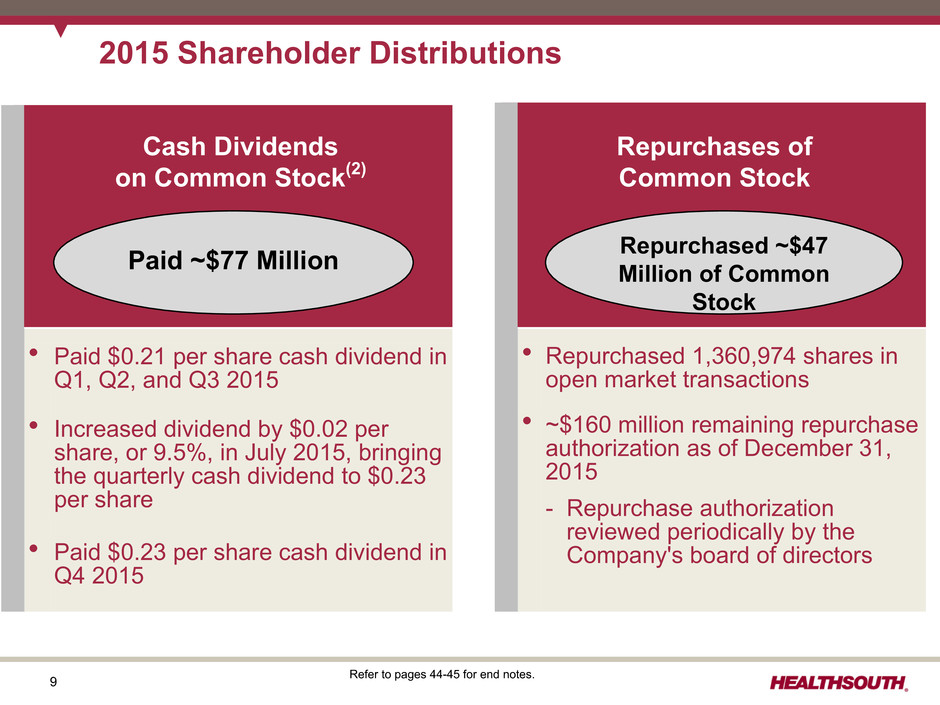
9 __ Cash Dividends on Common Stock(2) Earnings per Share from Continuing Operations Attributable to HealthSouth 2015 Shareholder Distributions l Paid $0.21 per share cash dividend in Q1, Q2, and Q3 2015 l Increased dividend by $0.02 per share, or 9.5%, in July 2015, bringing the quarterly cash dividend to $0.23 per share l Paid $0.23 per share cash dividend in Q4 2015 Repurchases of Common Stock l Repurchased 1,360,974 shares in open market transactions l ~$160 million remaining repurchase authorization as of December 31, 2015 - Repurchase authorization reviewed periodically by the Company's board of directors Paid ~$77 Million Repurchased ~$47Million of Common Stock Refer to pages 44-45 for end notes.
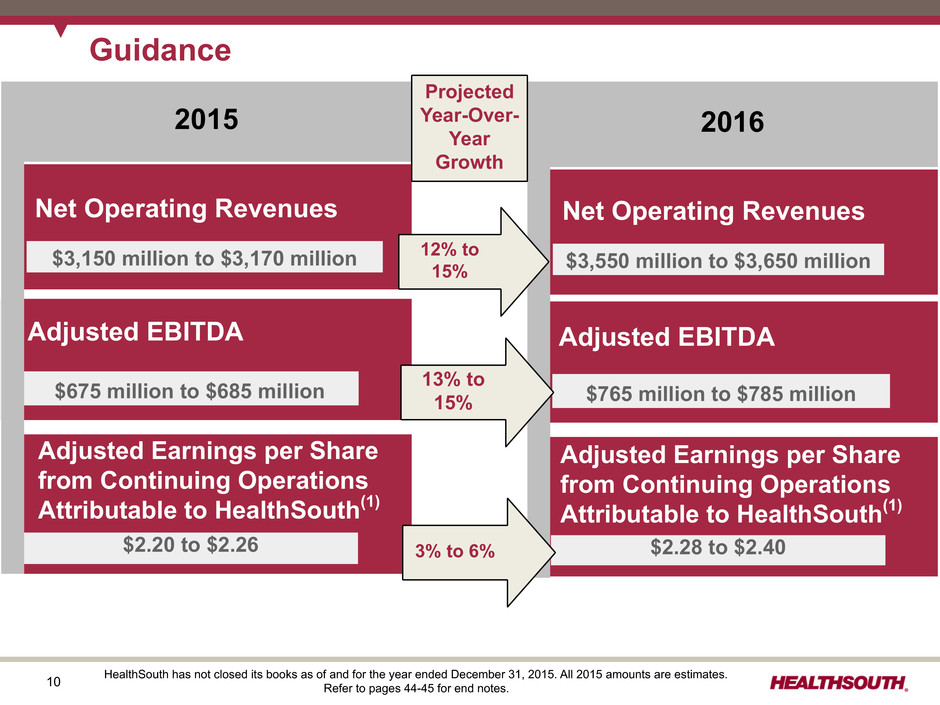
10 $675 million to $685 million $2.20 to $2.26 Adjusted EBITDA Adjusted Earnings per Share from Continuing Operations Attributable to HealthSouth(1) Guidance $3,150 million to $3,170 million Net Operating Revenues 2015 2016 Net Operating Revenues $3,550 million to $3,650 million Adjusted EBITDA $765 million to $785 million Adjusted Earnings per Share from Continuing Operations Attributable to HealthSouth(1) $2.28 to $2.40 12% to 15% Projected Year-Over- Year Growth 13% to 15% 3% to 6% HealthSouth has not closed its books as of and for the year ended December 31, 2015. All 2015 amounts are estimates. Refer to pages 44-45 for end notes.

11 2016 Guidance Considerations Inpatient Rehabilitation • Full-year contribution from Reliant ü Transitioning to HLS business model • Continued evolution of payor mix ü Managed care and Medicaid increases expected to moderate in 2016 • Estimated 1.6% increase in Medicare revenue per discharge • Moderating increase in group medical expense (5-10% increase) • Bad debt expense relatively level as percent of revenue Home Health and Hospice • Full-year contribution from CareSouth ü Transitioning to Encompass business model • 2015 openings and acquisitions • Increased discharge capture from HLS IRFs • Inclusive of $30-40 million of acquisitions in 2016

12 Adjusted Free Cash Flow*(3) and Tax Assumptions Certain Cash Flow Items (millions) 2016 Assumptions 2015 Estimates 2014 Actual • Cash interest expense (net of amortization of debt discounts and fees) $165 to $175 ~$130 $96.5 • Cash payments for taxes, net of refunds $20 to $40 ~$12 $16.4 • Working Capital and Other $60 to $80 $90 to $110 $55.0 • Maintenance CAPEX(4) $95 to $110 ~$85 $92.0 • Dividends paid on preferred stock(5) $0 $3 $6.3 • Adjusted Free Cash Flow $360 to $445 $335 to $365 $311 HealthSouth has not closed its books as of and for the year ended December 31, 2015. All 2015 amounts are estimates. *Reconciliation to GAAP provided on page 42; Refer to pages 44-45 for end notes. Working capital increase in 2015 driven primarily by growth in accounts receivable Q4 2015 increase in accounts receivable impacted by timing issues that are expected to reverse in 2016 • staffing issues at the Company's largest MAC that resulted in delayed payments in Q4 • transition of billing for Reliant and Cardinal Hill in Q4 2015 GAAP Tax Considerations: • gross federal NOL of ~$393 million as of 9/30/15

13 Priorities for 2016 • Integrate Reliant and CareSouth ("pause" on additional large acquisitions) • Achieve organic growth at existing hospitals and home health/hospice agencies • Acquire and construct new hospitals and acquire and open new home health/hospice agencies GROWTH 2016 2015 2014 Assumptions Estimates Actuals (In Millions) IRF bed expansions $20 to $30 ~$25 $23.6 New IRF's - De novos 70 to 90 ~50 53.7 - Acquisitions TBD ~786 20.2 New home health and hospice acquisitions 30 to 40 ~200 674.6 $120 to $160, excluding IRF acquisitions ~$1,061 $772.1 Growth in Core Business Highest Priorit y

14 IRF Growth Pipeline Typical Development Pipeline Factors: • CON process/timeline • Fair market valuation of contributed assets (joint ventures only) • Partnership complexities HLS Value Proposition CAPEX to build free-standing IRF, freeing up space for medical / surgical beds Increased acute care hospital flow-through by taking appropriate higher acuity patients faster than other post- acute settings Proprietary rehabilitation-specific clinical information system ("ACE-IT") integrated with acute care hospitals' clinical information systems to facilitate patient transfers, reduce readmissions, and enhance outcomes Proprietary real-time performance management systems (care management, labor productivity, quality reporting, therapy analysis and expense management) to improve profitability Proven track record of efficient management of regulatory process (CON, licensure, occupancy, etc.) Experienced transaction/integration team National leader in post-acute policy activities Disciplined Approach to Joint Ventures / De Novos / Acquisitions – Attractive demographics – Strong forecasted growth in the number of patients requiring rehab-level of care – Presence of other IRFs; SNFs – Bed need – Geographic proximity to other HLS IRFs and Encompass agencies – Willingness of seller; interest of joint venture partners – HLS confidence in ability to close No. of Projects Exploratory / CA Executed 40 - 50 Actively Working 10 - 12 Near-term Actionable 4 - 6 CA = confidentiality agreement

15 Home Health Growth Pipeline Development Pipeline Encompass Value Proposition Re-brand acquired businesses as Encompass (within one year) – Increases awareness of referral sources Transition to / fully utilize Homecare Homebase Implement Encompass operating / productivity / quality metrics Implement "Clinical Specialty Programs" – Proprietary clinical programs to provide consistent care for high-risk / high-acuity patients (e.g. cardiopulmonary; diabetes; total wound care) Implement "Care Transitions" program – Care Transition Coordinators work with hospitals to facilitate smooth transition of patients to in-home care – Serves high-acuity patients with high risk of readmission Disciplined Approach to Acquisitions – Attractive demographics – Proximity to HLS IRFs – Ability to enhance scale and density – Clean compliance record – Strong in-market reputation – Diverse referral sources (non-reliance on medical directorships) – Quality people who will succeed in Encompass organization Development Pipeline ü Highly fragmented $18 billion home health market – ~12,600 home health agencies – 95% have revenues < $5 million ü Top 5 public companies account for just ~18% of Medicare market Source: MedPAC - Report to Congress: Medicare Payment Policy - March 2015, page 218

16 Priorities for 2016 • Reduce financial leverage • Continue shareholder distributions CAPITAL STRUCTURE 2016 2015 2014 Assumptions Estimates Actuals (In Millions) Debt (borrowings) redemptions, net $TBD ~$(1,040) $(614.1) Leased property purchases 0 0 20.0 Cash dividends on common stock(2) 85 ~77 65.8 Common stock repurchases TBD ~47 43.1 $TBD ~$(916) $(485.2) Shareholder Distributions Debt Reduction Note: 2015 estimates for debt borrowings include ~$208 million related to the Reliant hospitals' capital lease obligations. See the debt schedule on page 27. Refer to pages 44-45 for end notes. 2022 senior notes are fully callable; completed $50 million redemption in November 2015; ~$176 million remaining as of December 31, 2015 Quarterly cash dividend currently set at $0.23 per common share ~$160 million authorization remaining as of December 31, 2015

17 Priorities for 2016 • Integrate Reliant and CareSouth ("pause" on additional large acquisitions) • Achieve organic growth at existing hospitals and home health/hospice agencies • Acquire and construct new hospitals and acquire and open new home health/hospice agencies • Reduce financial leverage • Continue shareholder distributions GROWTH OPERATIONAL INITIATIVES • - Begin developing coordinated care protocols • Participate in/assess alternative payment models (bundling/CJR; ACOs) CAPITAL STRUCTURE
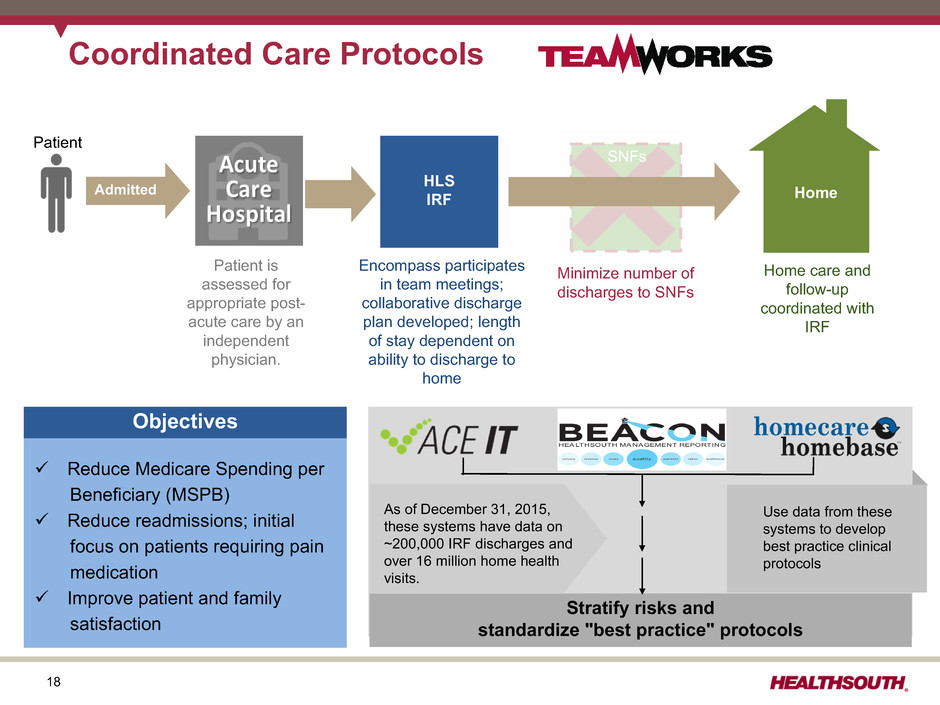
18 Coordinated Care Protocols Admitted HLSIRF Patient SNFs Home Objectives Stratify risks and standardize "best practice" protocols ü Reduce Medicare Spending per Beneficiary (MSPB) ü Reduce readmissions; initial focus on patients requiring pain medication ü Improve patient and family satisfaction As of December 31, 2015, these systems have data on ~200,000 IRF discharges and over 16 million home health visits. Use data from these systems to develop best practice clinical protocols Patient is assessed for appropriate post- acute care by an independent physician. Encompass participates in team meetings; collaborative discharge plan developed; length of stay dependent on ability to discharge to home Minimize number of discharges to SNFs Home care and follow-up coordinated with IRF

19 Bundling Participation - Inpatient Rehabilitation Model 2 HLS Referral Source Bundle Type % of HLS MedicareDischarges % of Total HLS Discharges 122 acute care hospitals participating in Model 2 / Phase 2 in 79 HLS IRF markets Bundles selected for Model 2 participation are chosen from a list of 48 BPCI-eligible bundles. 2.9% 2.1% Acute care hospitals in the 67 geographic areas included in the Comprehensive Care for Joint Replacement Model ("CJR") Lower extremity joint replacement (LEJR) 1.8% 1.3% HealthSouth IRF Participation in Model 3 BPCI Bundle / Number of IRFs Bundle Length % of HLS Medicare Discharges % of Total HLS Discharges Stroke (3 IRFs) 60 days 0.18% 0.13% Simple Pneumonia (1 IRF) 60 days 0.02% 0.02% Sepsis (1 IRF) 60 days 0.03% 0.02% Double-lower extremity joint replacement (2 IRFs) 60 days 0.03% 0.02% Upper extremity joint replacement (1 IRF) 60 days 0.01% 0.01% Note: Data on this page is based on 2014 discharges. ~40% of these patients have complicating comorbidities ~45% of these discharges are LEJR episodes
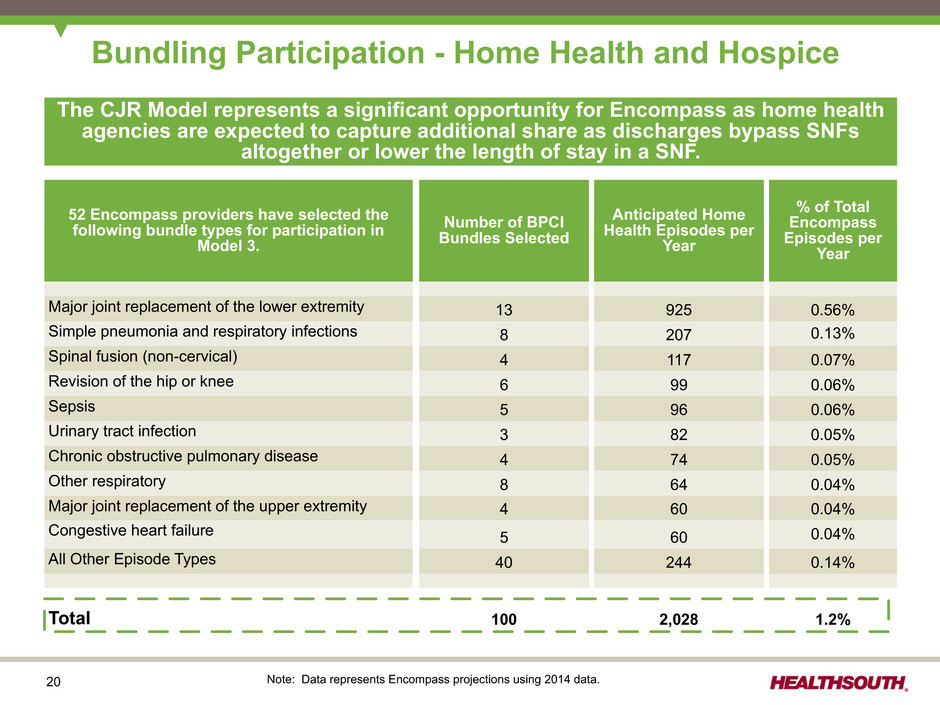
20 Bundling Participation - Home Health and Hospice The CJR Model represents a significant opportunity for Encompass as home health agencies are expected to capture additional share as discharges bypass SNFs altogether or lower the length of stay in a SNF. 52 Encompass providers have selected the following bundle types for participation in Model 3. Number of BPCI Bundles Selected Anticipated Home Health Episodes per Year % of Total Encompass Episodes per Year Major joint replacement of the lower extremity 13 925 0.56% Simple pneumonia and respiratory infections 8 207 0.13% Spinal fusion (non-cervical) 4 117 0.07% Revision of the hip or knee 6 99 0.06% Sepsis 5 96 0.06% Urinary tract infection 3 82 0.05% Chronic obstructive pulmonary disease 4 74 0.05% Other respiratory 8 64 0.04% Major joint replacement of the upper extremity 4 60 0.04% Congestive heart failure 5 60 0.04% All Other Episode Types 40 244 0.14% Total 100 2,028 1.2% Note: Data represents Encompass projections using 2014 data.
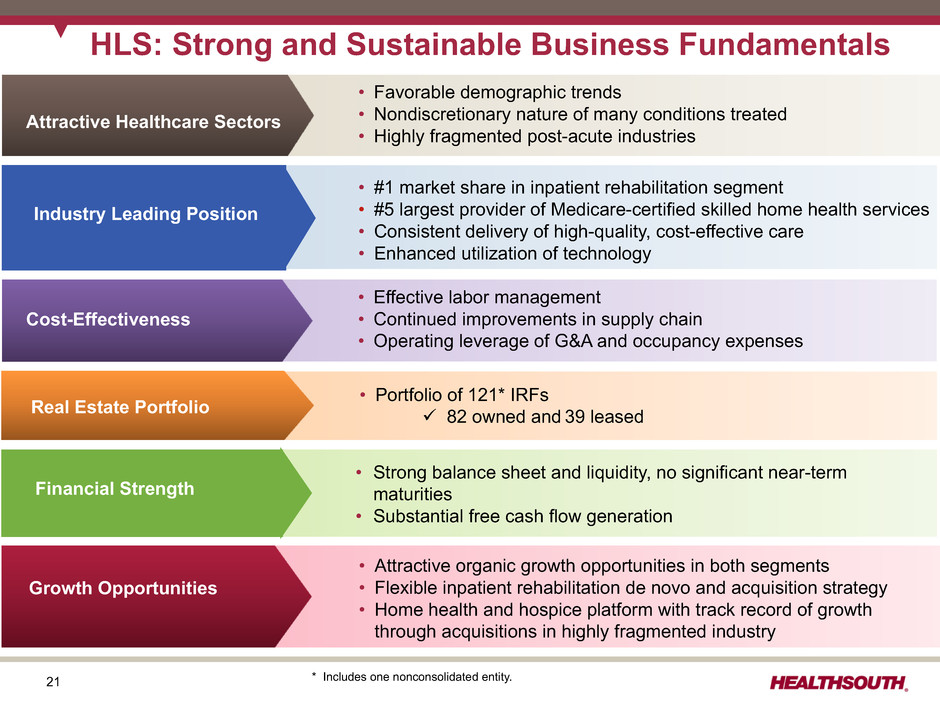
21 HLS: Strong and Sustainable Business Fundamentals • Effective labor management • Continued improvements in supply chain • Operating leverage of G&A and occupancy expenses Cost-Effectiveness • Strong balance sheet and liquidity, no significant near-term maturities • Substantial free cash flow generation • #1 market share in inpatient rehabilitation segment • #5 largest provider of Medicare-certified skilled home health services • Consistent delivery of high-quality, cost-effective care • Enhanced utilization of technology • Attractive organic growth opportunities in both segments • Flexible inpatient rehabilitation de novo and acquisition strategy • Home health and hospice platform with track record of growth through acquisitions in highly fragmented industry • Portfolio of 121* IRFs ü 82 owned and 39 leasedReal Estate Portfolio Attractive Healthcare Sectors Growth Opportunities Cost-Effectiveness • Favorable demographic trends • Nondiscretionary nature of many conditions treated • Highly fragmented post-acute industries Industry Leading Position Financial Strength * Includes one nonconsolidated entity.
22 Appendix
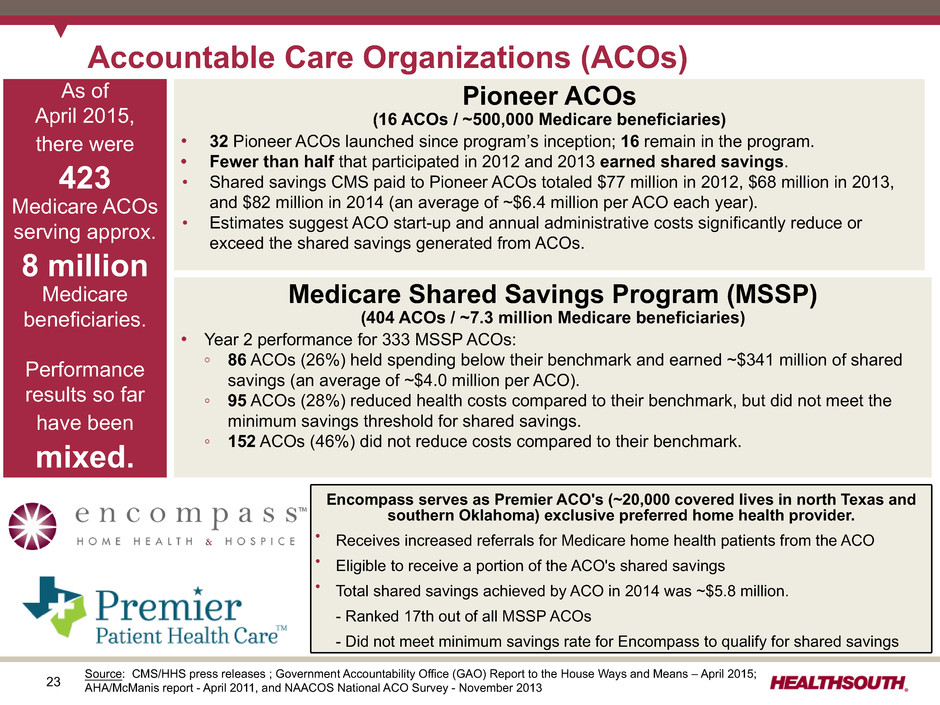
23 Accountable Care Organizations (ACOs) As of April 2015, there were 423 Medicare ACOs serving approx. 8 million Medicare beneficiaries. Performance results so far have been mixed. Pioneer ACOs (16 ACOs / ~500,000 Medicare beneficiaries) • 32 Pioneer ACOs launched since program’s inception; 16 remain in the program. • Fewer than half that participated in 2012 and 2013 earned shared savings. • Shared savings CMS paid to Pioneer ACOs totaled $77 million in 2012, $68 million in 2013, and $82 million in 2014 (an average of ~$6.4 million per ACO each year). • Estimates suggest ACO start-up and annual administrative costs significantly reduce or exceed the shared savings generated from ACOs. Medicare Shared Savings Program (MSSP) (404 ACOs / ~7.3 million Medicare beneficiaries) • Year 2 performance for 333 MSSP ACOs: ◦ 86 ACOs (26%) held spending below their benchmark and earned ~$341 million of shared savings (an average of ~$4.0 million per ACO). ◦ 95 ACOs (28%) reduced health costs compared to their benchmark, but did not meet the minimum savings threshold for shared savings. ◦ 152 ACOs (46%) did not reduce costs compared to their benchmark. Source: CMS/HHS press releases ; Government Accountability Office (GAO) Report to the House Ways and Means – April 2015; AHA/McManis report - April 2011, and NAACOS National ACO Survey - November 2013 Encompass serves as Premier ACO's (~20,000 covered lives in north Texas and southern Oklahoma) exclusive preferred home health provider. Ÿ Receives increased referrals for Medicare home health patients from the ACO Ÿ Eligible to receive a portion of the ACO's shared savings Ÿ Total shared savings achieved by ACO in 2014 was ~$5.8 million. - Ranked 17th out of all MSSP ACOs - Did not meet minimum savings rate for Encompass to qualify for shared savings
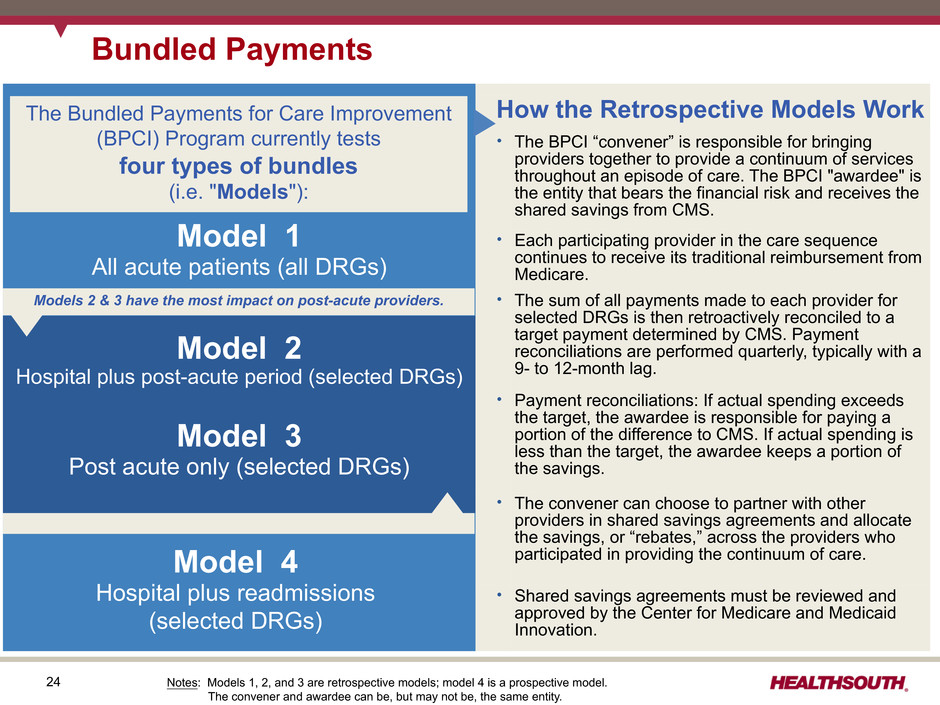
24 Bundled Payments How the Retrospective Models Work Ÿ The BPCI “convener” is responsible for bringing providers together to provide a continuum of services throughout an episode of care. The BPCI "awardee" is the entity that bears the financial risk and receives the shared savings from CMS. Ÿ Each participating provider in the care sequence continues to receive its traditional reimbursement from Medicare. Ÿ The sum of all payments made to each provider for selected DRGs is then retroactively reconciled to a target payment determined by CMS. Payment reconciliations are performed quarterly, typically with a 9- to 12-month lag. Ÿ Payment reconciliations: If actual spending exceeds the target, the awardee is responsible for paying a portion of the difference to CMS. If actual spending is less than the target, the awardee keeps a portion of the savings. Ÿ The convener can choose to partner with other providers in shared savings agreements and allocate the savings, or “rebates,” across the providers who participated in providing the continuum of care. Ÿ Shared savings agreements must be reviewed and approved by the Center for Medicare and Medicaid Innovation. Model 1 All acute patients (all DRGs) The Bundled Payments for Care Improvement (BPCI) Program currently tests four types of bundles (i.e. "Models"): Models 2 & 3 have the most impact on post-acute providers. Model 2 Hospital plus post-acute period (selected DRGs) Model 3 Post acute only (selected DRGs) Model 4 Hospital plus readmissions (selected DRGs) Notes: Models 1, 2, and 3 are retrospective models; model 4 is a prospective model. The convener and awardee can be, but may not be, the same entity.

25 CJR Payment Model In the 67 geographic areas included in the CJR rule, LEJR patients account for 1.8% of HealthSouth's total Medicare discharges and 1.3% of HealthSouth's overall discharges. Discharges from HealthSouth's IRFs In the CJR payment model, Medicare will continue to reimburse providers under its traditional payment methodologies. Comprehensive Care for Joint Replacement Model (April 1, 2016 - December 31, 2020) LEJR patients enter an acute care hospital for treatment. Patients are then discharged to a post-acute care provider or to home self-care. RETROSPECTIVE RECONCILIATION PERFORMED BY CMS HIGH QUALITY LOW COST POST-ACUTE CARE PROVIDERS SHARED SAVINGS Lower extremity joint replacement (“LEJR”) patients treated by HealthSouth’s IRFs are higher acuity and possess significant complicating comorbidities necessitating treatment in a hospital setting. In these cases, and in any risk-bearing bundling initiative, quality of outcomes and cost effectiveness are critical to achieving targeted financial results. Acute hospital accountable for quality of care through 90 days after discharge.

26 CJR Payment Model – HLS Opportunities Source: DHG Healthcare and Dobson l DaVanzo & Associates research using CMS Public Use Files 11-13 Discharge destination for all Medicare lower extremity joint replacements (% of 2011-2013 episodes) IRFs SNFs Home Health Other, includinghome self-care 9.6% 37.9% 15.0%37.5% HLS STR ATEG Y Many LEJR patients admitted to HealthSouth IRFs have complicating comorbid conditions, such as morbid obesity and diabetes, that necessitate rehabilitation in a hospital setting. RETAIN VOLUME INCREASE VOLUME Home health agencies are expected to capture additional share as discharges bypass SNFs altogether or lower the length of stay in a SNF.

27 Debt Schedule Pro Forma Sept. 30, 2015 Post Acquisitions of Reliant and CareSouth and $50M Redemption of 2022 Notes Pro Forma Change in Debt vs. YE 2014($millions) September 30, 2015 December 31, 2014 Advances under $600 million revolving credit facility, July 2020 - LIBOR +200bps(6)(7) $ 120.0 $ 25.0 $ 325.0 $ (205.0) Term loan facility, July 2020 - LIBOR +200bps(6)(7) 445.0 320.0 450.0 (5.0) Bonds Payable: 8.125% Senior Notes due 2020(8) — — 287.0 (287.0) 7.75% Senior Notes due 2022(9) 177.0 227.0 227.1 (50.1) 5.125% Senior Notes due 2023(8) 300.0 300.0 — 300.0 5.75% Senior Notes due 2024(6)(10) 1,215.2 1,215.2 456.2 759.0 5.75% Senior Notes due 2025(10) 350.0 350.0 — 350.0 2.0% Convertible Senior Subordinated Notes due 2043 264.7 264.7 258.0 6.7 Other notes payable 40.3 40.3 41.6 (1.3) Capital lease obligations 292.1 82.1 86.7 205.4 Long-term debt $ 3,204.3 $ 2,824.3 $ 2,131.6 $ 1,072.7 Debt to Adjusted EBITDA*(11) 5.1x 4.5x 3.7x Pro Forma Debt to Adjusted EBITDA*(11) 4.2x Pro forma 2015 leverage with trailing four quarters Encompass Adjusted EBITDA and full-year Adjusted EBITDA estimates for Reliant and CareSouth included would be ~4.2x. * Reconciliation to GAAP provided on pages 28-30; Refer to pages 44-45 for end notes.
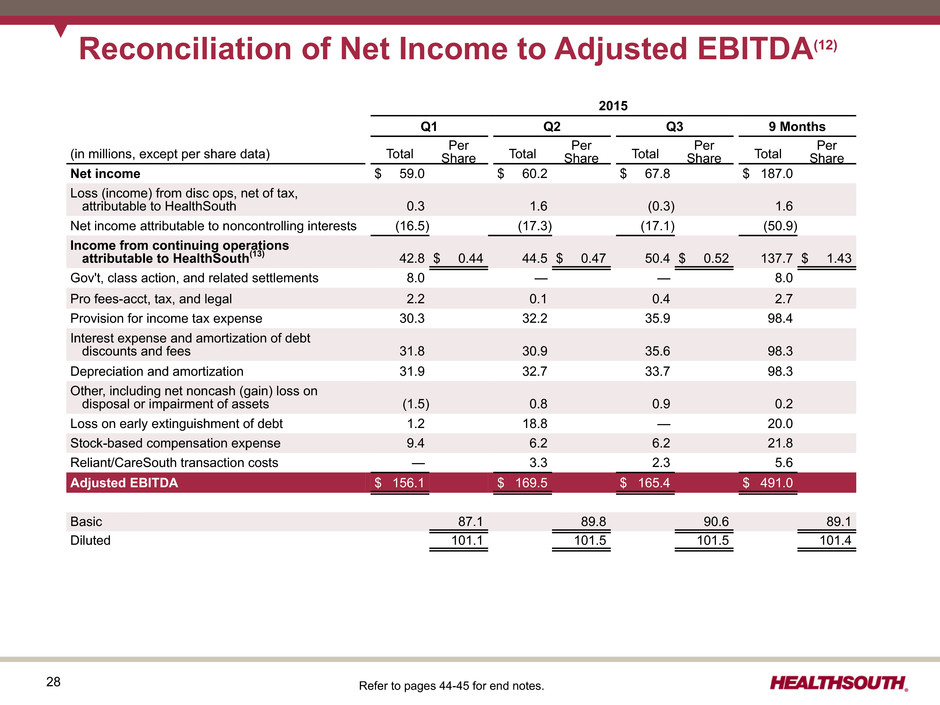
28 Reconciliation of Net Income to Adjusted EBITDA(12) 2015 Q1 Q2 Q3 9 Months (in millions, except per share data) Total PerShare Total Per Share Total Per Share Total Per Share Net income $ 59.0 $ 60.2 $ 67.8 $ 187.0 Loss (income) from disc ops, net of tax, attributable to HealthSouth 0.3 1.6 (0.3) 1.6 Net income attributable to noncontrolling interests (16.5) (17.3) (17.1) (50.9) Income from continuing operations attributable to HealthSouth(13) 42.8 $ 0.44 44.5 $ 0.47 50.4 $ 0.52 137.7 $ 1.43 Gov't, class action, and related settlements 8.0 — — 8.0 Pro fees-acct, tax, and legal 2.2 0.1 0.4 2.7 Provision for income tax expense 30.3 32.2 35.9 98.4 Interest expense and amortization of debt discounts and fees 31.8 30.9 35.6 98.3 Depreciation and amortization 31.9 32.7 33.7 98.3 Other, including net noncash (gain) loss on disposal or impairment of assets (1.5) 0.8 0.9 0.2 Loss on early extinguishment of debt 1.2 18.8 — 20.0 Stock-based compensation expense 9.4 6.2 6.2 21.8 Reliant/CareSouth transaction costs — 3.3 2.3 5.6 Adjusted EBITDA $ 156.1 $ 169.5 $ 165.4 $ 491.0 Weighted average common shares outstanding: Total Per Share 108.1 Basic 87.1 89.8 90.6 89.1 Diluted 101.1 101.5 101.5 101.4 Refer to pages 44-45 for end notes.

29 Reconciliation of Net Income to Adjusted EBITDA(12) 2014 2013 2012 2011 2010 (in millions, except per share data) Total PerShare Total Per Share Total Per Share Total Per Share Total Per Share Net income $ 281.7 $ 381.4 $ 235.9 $ 254.6 $ 939.8 (Income) loss from disc ops, net of tax, attributable to HealthSouth (5.5) 1.1 (4.5) (49.9) (9.2) Net income attributable to noncontrolling interests (59.7) (57.8) (50.9) (45.9) (40.8) Income from continuing operations attributable to HealthSouth(13) 216.5 $ 2.24 324.7 $ 2.59 180.5 $ 1.62 158.8 $ 1.39 889.8 $ 8.20 Gov't, class action, and related settlements (1.7) (23.5) (3.5) (12.3) 1.1 Pro fees-acct, tax, and legal 9.3 9.5 16.1 21.0 17.2 Loss on interest rate swaps — — — — 13.3 Provision for income tax expense (benefit) 110.7 12.7 108.6 37.1 (740.8) Interest expense and amortization of debt discounts and fees 109.2 100.4 94.1 119.4 125.6 Depreciation and amortization 107.7 94.7 82.5 78.8 73.1 Gain on consolidation of hospital (27.2) — (4.9) — — Other, including net noncash loss on disposal or impairment of assets 6.7 5.9 4.4 4.3 1.6 Loss on early extinguishment of debt 13.2 2.4 4.0 38.8 12.3 Stock-based compensation expense 23.9 24.8 24.1 20.3 16.4 Encompass transaction costs 9.3 — — — — Adjusted EBITDA $ 577.6 $ 551.6 $ 505.9 $ 466.2 $ 409.6 Weighted average common shares outstanding: Total Per Share 108.1 Basic 86.8 88.1 94.6 93.3 92.8 Diluted 100.7 102.1 108.1 109.2 108.5 Refer to pages 44-45 for end notes.
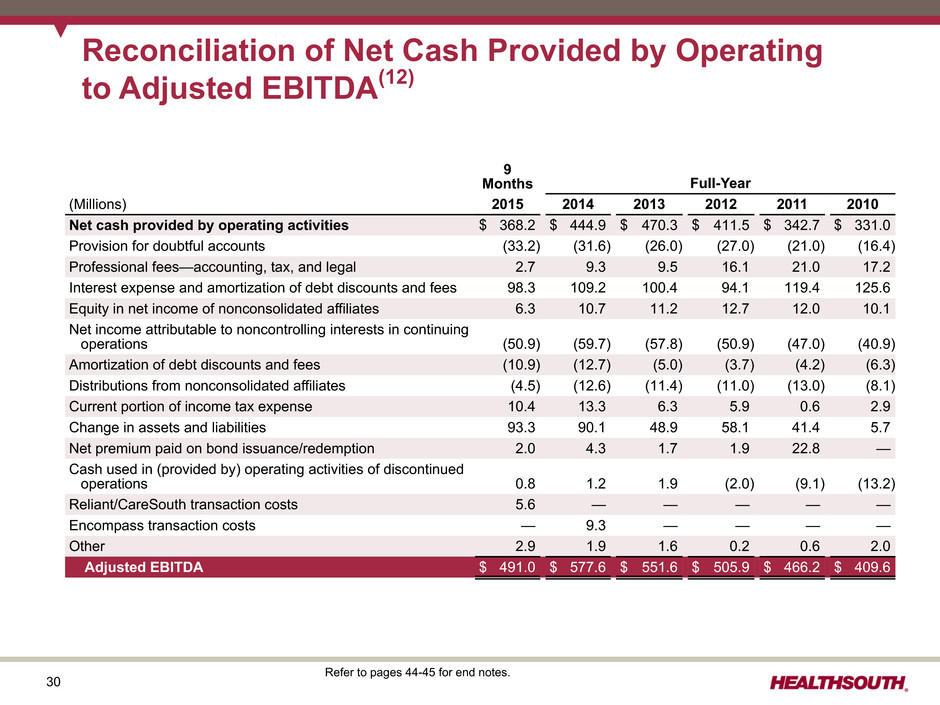
30 Reconciliation of Net Cash Provided by Operating to Adjusted EBITDA(12) 9 Months Full-Year (Millions) 2015 2014 2013 2012 2011 2010 Net cash provided by operating activities $ 368.2 $ 444.9 $ 470.3 $ 411.5 $ 342.7 $ 331.0 Provision for doubtful accounts (33.2) (31.6) (26.0) (27.0) (21.0) (16.4) Professional fees—accounting, tax, and legal 2.7 9.3 9.5 16.1 21.0 17.2 Interest expense and amortization of debt discounts and fees 98.3 109.2 100.4 94.1 119.4 125.6 Equity in net income of nonconsolidated affiliates 6.3 10.7 11.2 12.7 12.0 10.1 Net income attributable to noncontrolling interests in continuing operations (50.9) (59.7) (57.8) (50.9) (47.0) (40.9) Amortization of debt discounts and fees (10.9) (12.7) (5.0) (3.7) (4.2) (6.3) Distributions from nonconsolidated affiliates (4.5) (12.6) (11.4) (11.0) (13.0) (8.1) Current portion of income tax expense 10.4 13.3 6.3 5.9 0.6 2.9 Change in assets and liabilities 93.3 90.1 48.9 58.1 41.4 5.7 Net premium paid on bond issuance/redemption 2.0 4.3 1.7 1.9 22.8 — Cash used in (provided by) operating activities of discontinued operations 0.8 1.2 1.9 (2.0) (9.1) (13.2) Reliant/CareSouth transaction costs 5.6 — — — — — Encompass transaction costs — 9.3 — — — — Other 2.9 1.9 1.6 0.2 0.6 2.0 Adjusted EBITDA $ 491.0 $ 577.6 $ 551.6 $ 505.9 $ 466.2 $ 409.6 Refer to pages 44-45 for end notes.
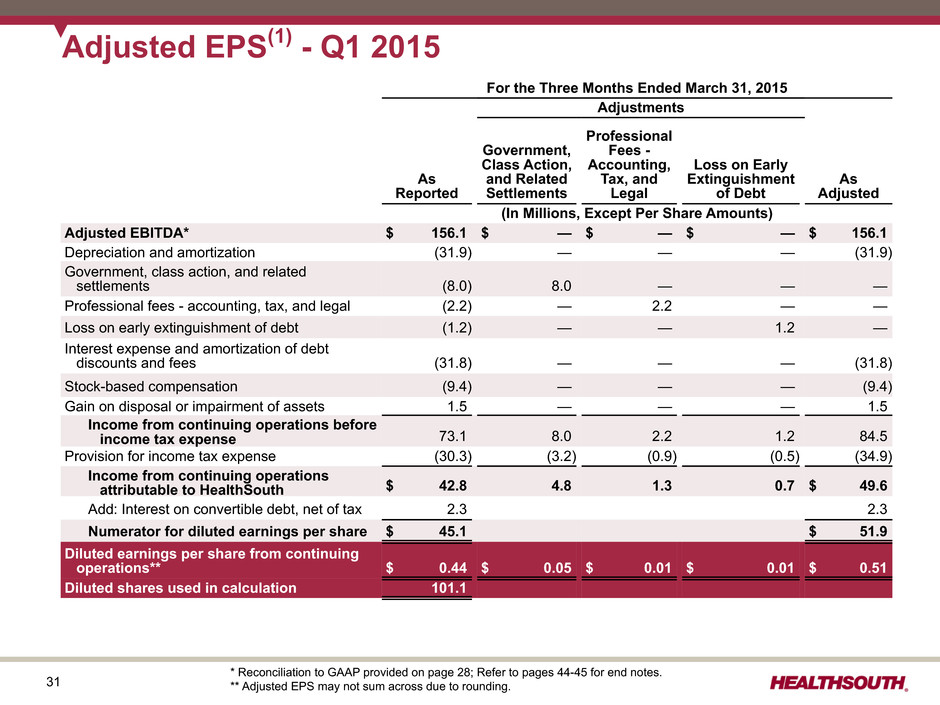
31 For the Three Months Ended March 31, 2015 Adjustments As Reported Government, Class Action, and Related Settlements Professional Fees - Accounting, Tax, and Legal Loss on Early Extinguishment of Debt As Adjusted (In Millions, Except Per Share Amounts) Adjusted EBITDA* $ 156.1 $ — $ — $ — $ 156.1 Depreciation and amortization (31.9) — — — (31.9) Government, class action, and related settlements (8.0) 8.0 — — — Professional fees - accounting, tax, and legal (2.2) — 2.2 — — Loss on early extinguishment of debt (1.2) — — 1.2 — Interest expense and amortization of debt discounts and fees (31.8) — — — (31.8) Stock-based compensation (9.4) — — — (9.4) Gain on disposal or impairment of assets 1.5 — — — 1.5 Income from continuing operations before income tax expense 73.1 8.0 2.2 1.2 84.5 Provision for income tax expense (30.3) (3.2) (0.9) (0.5) (34.9) Income from continuing operations attributable to HealthSouth $ 42.8 4.8 1.3 0.7 $ 49.6 Add: Interest on convertible debt, net of tax 2.3 2.3 Numerator for diluted earnings per share $ 45.1 $ 51.9 Diluted earnings per share from continuing operations** $ 0.44 $ 0.05 $ 0.01 $ 0.01 $ 0.51 Diluted shares used in calculation 101.1 Adjusted EPS(1) - Q1 2015 * Reconciliation to GAAP provided on page 28; Refer to pages 44-45 for end notes. ** Adjusted EPS may not sum across due to rounding.
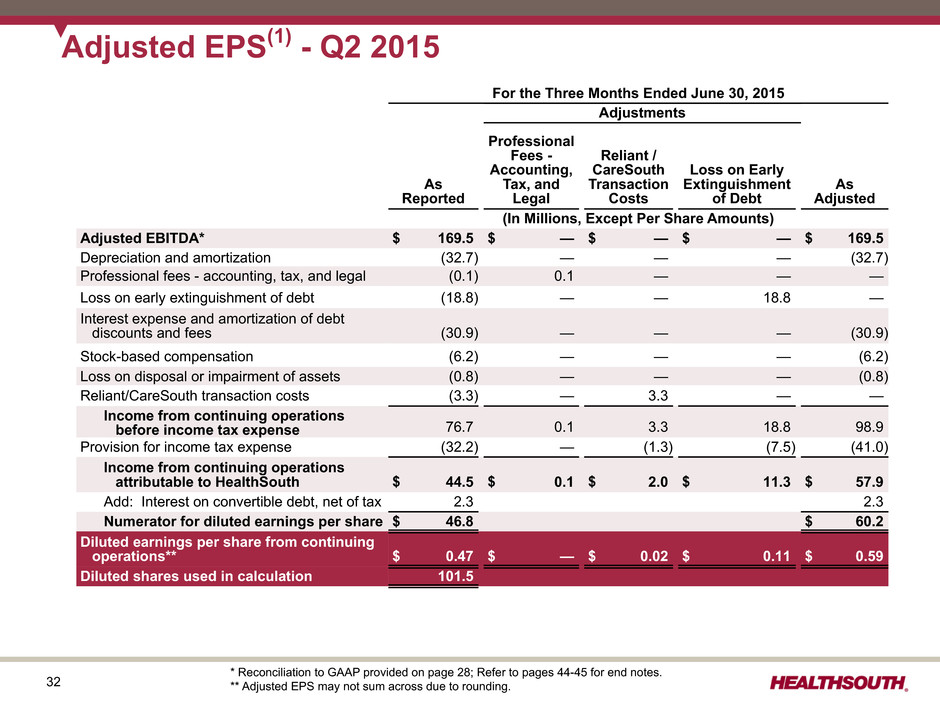
32 For the Three Months Ended June 30, 2015 Adjustments As Reported Professional Fees - Accounting, Tax, and Legal Reliant / CareSouth Transaction Costs Loss on Early Extinguishment of Debt As Adjusted (In Millions, Except Per Share Amounts) Adjusted EBITDA* $ 169.5 $ — $ — $ — $ 169.5 Depreciation and amortization (32.7) — — — (32.7) Professional fees - accounting, tax, and legal (0.1) 0.1 — — — Loss on early extinguishment of debt (18.8) — — 18.8 — Interest expense and amortization of debt discounts and fees (30.9) — — — (30.9) Stock-based compensation (6.2) — — — (6.2) Loss on disposal or impairment of assets (0.8) — — — (0.8) Reliant/CareSouth transaction costs (3.3) — 3.3 — — Income from continuing operations before income tax expense 76.7 0.1 3.3 18.8 98.9 Provision for income tax expense (32.2) — (1.3) (7.5) (41.0) Income from continuing operations attributable to HealthSouth $ 44.5 $ 0.1 $ 2.0 $ 11.3 $ 57.9 Add: Interest on convertible debt, net of tax 2.3 2.3 Numerator for diluted earnings per share $ 46.8 $ 60.2 Diluted earnings per share from continuing operations** $ 0.47 $ — $ 0.02 $ 0.11 $ 0.59 Diluted shares used in calculation 101.5 Adjusted EPS(1) - Q2 2015 * Reconciliation to GAAP provided on page 28; Refer to pages 44-45 for end notes. ** Adjusted EPS may not sum across due to rounding.
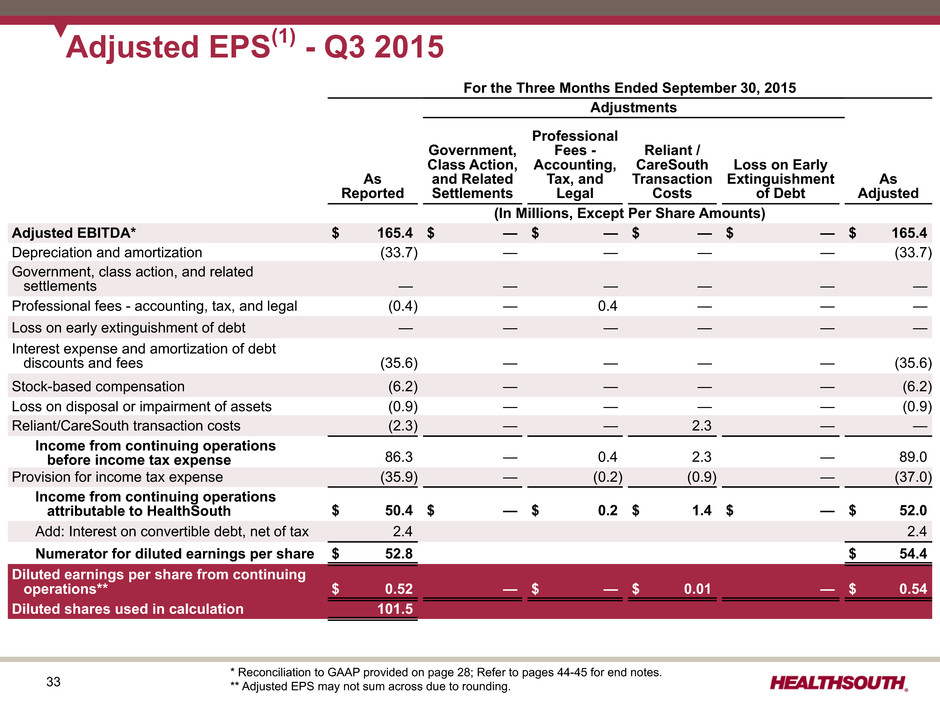
33 For the Three Months Ended September 30, 2015 Adjustments As Reported Government, Class Action, and Related Settlements Professional Fees - Accounting, Tax, and Legal Reliant / CareSouth Transaction Costs Loss on Early Extinguishment of Debt As Adjusted (In Millions, Except Per Share Amounts) Adjusted EBITDA* $ 165.4 $ — $ — $ — $ — $ 165.4 Depreciation and amortization (33.7) — — — — (33.7) Government, class action, and related settlements — — — — — — Professional fees - accounting, tax, and legal (0.4) — 0.4 — — — Loss on early extinguishment of debt — — — — — — Interest expense and amortization of debt discounts and fees (35.6) — — — — (35.6) Stock-based compensation (6.2) — — — — (6.2) Loss on disposal or impairment of assets (0.9) — — — — (0.9) Reliant/CareSouth transaction costs (2.3) — — 2.3 — — Income from continuing operations before income tax expense 86.3 — 0.4 2.3 — 89.0 Provision for income tax expense (35.9) — (0.2) (0.9) — (37.0) Income from continuing operations attributable to HealthSouth $ 50.4 $ — $ 0.2 $ 1.4 $ — $ 52.0 Add: Interest on convertible debt, net of tax 2.4 2.4 Numerator for diluted earnings per share $ 52.8 $ 54.4 Diluted earnings per share from continuing operations** $ 0.52 — $ — $ 0.01 — $ 0.54 Diluted shares used in calculation 101.5 Adjusted EPS(1) - Q3 2015 * Reconciliation to GAAP provided on page 28; Refer to pages 44-45 for end notes. ** Adjusted EPS may not sum across due to rounding.
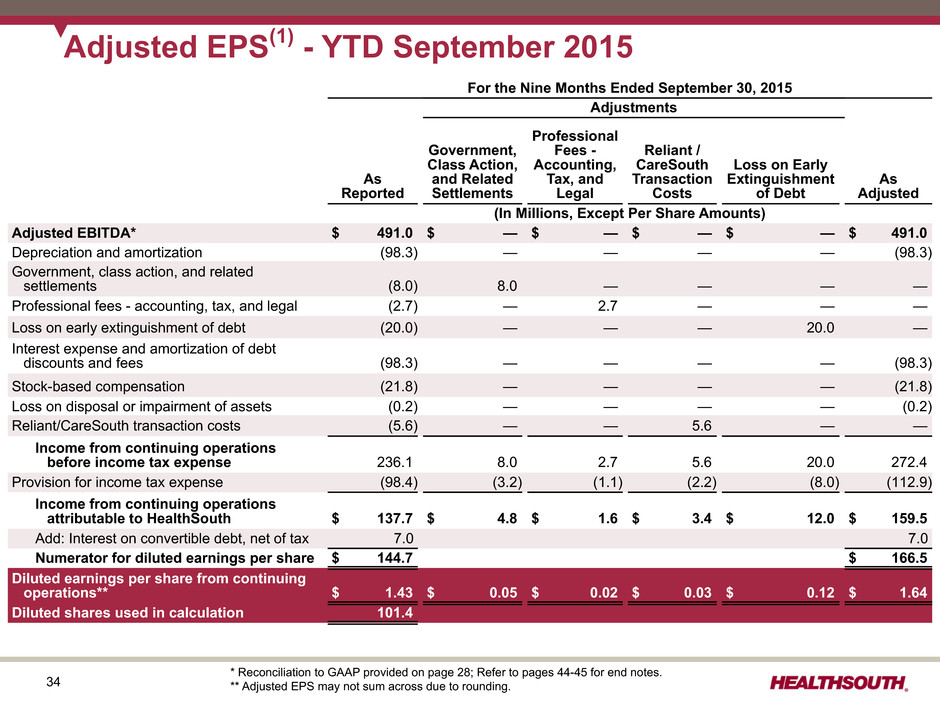
34 For the Nine Months Ended September 30, 2015 Adjustments As Reported Government, Class Action, and Related Settlements Professional Fees - Accounting, Tax, and Legal Reliant / CareSouth Transaction Costs Loss on Early Extinguishment of Debt As Adjusted (In Millions, Except Per Share Amounts) Adjusted EBITDA* $ 491.0 $ — $ — $ — $ — $ 491.0 Depreciation and amortization (98.3) — — — — (98.3) Government, class action, and related settlements (8.0) 8.0 — — — — Professional fees - accounting, tax, and legal (2.7) — 2.7 — — — Loss on early extinguishment of debt (20.0) — — — 20.0 — Interest expense and amortization of debt discounts and fees (98.3) — — — — (98.3) Stock-based compensation (21.8) — — — — (21.8) Loss on disposal or impairment of assets (0.2) — — — — (0.2) Reliant/CareSouth transaction costs (5.6) — — 5.6 — — Income from continuing operations before income tax expense 236.1 8.0 2.7 5.6 20.0 272.4 Provision for income tax expense (98.4) (3.2) (1.1) (2.2) (8.0) (112.9) Income from continuing operations attributable to HealthSouth $ 137.7 $ 4.8 $ 1.6 $ 3.4 $ 12.0 $ 159.5 Add: Interest on convertible debt, net of tax 7.0 7.0 Numerator for diluted earnings per share $ 144.7 $ 166.5 Diluted earnings per share from continuing operations** $ 1.43 $ 0.05 $ 0.02 $ 0.03 $ 0.12 $ 1.64 Diluted shares used in calculation 101.4 Adjusted EPS(1) - YTD September 2015 * Reconciliation to GAAP provided on page 28; Refer to pages 44-45 for end notes. ** Adjusted EPS may not sum across due to rounding.
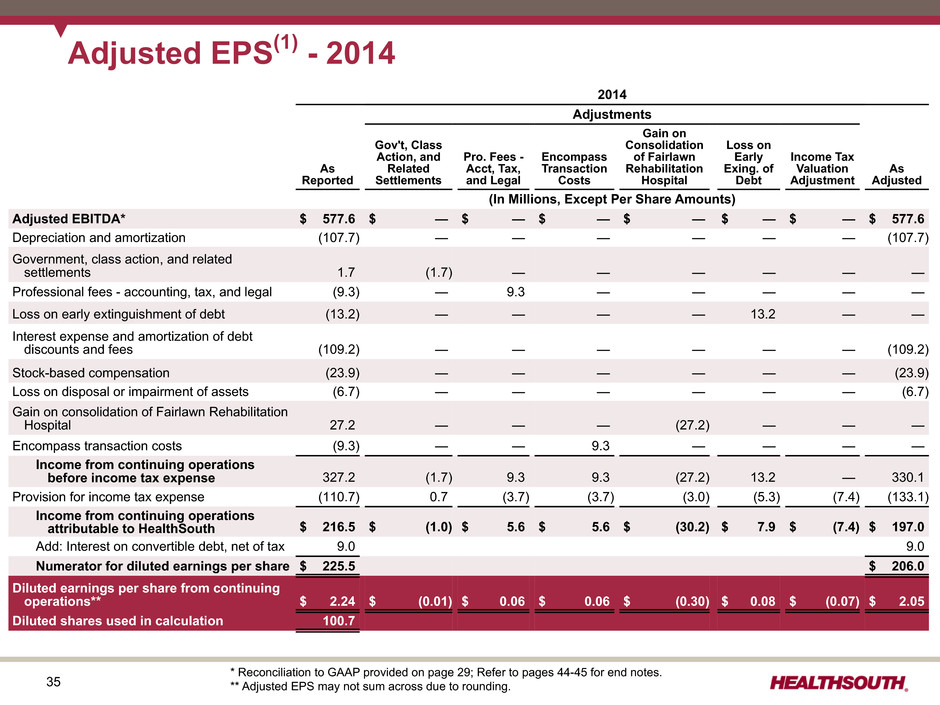
35 2014 Adjustments As Reported Gov't, Class Action, and Related Settlements Pro. Fees - Acct, Tax, and Legal Encompass Transaction Costs Gain on Consolidation of Fairlawn Rehabilitation Hospital Loss on Early Exing. of Debt Income Tax Valuation Adjustment As Adjusted (In Millions, Except Per Share Amounts) Adjusted EBITDA* $ 577.6 $ — $ — $ — $ — $ — $ — $ 577.6 Depreciation and amortization (107.7) — — — — — — (107.7) Government, class action, and related settlements 1.7 (1.7) — — — — — — Professional fees - accounting, tax, and legal (9.3) — 9.3 — — — — — Loss on early extinguishment of debt (13.2) — — — — 13.2 — — Interest expense and amortization of debt discounts and fees (109.2) — — — — — — (109.2) Stock-based compensation (23.9) — — — — — — (23.9) Loss on disposal or impairment of assets (6.7) — — — — — — (6.7) Gain on consolidation of Fairlawn Rehabilitation Hospital 27.2 — — — (27.2) — — — Encompass transaction costs (9.3) — — 9.3 — — — — Income from continuing operations before income tax expense 327.2 (1.7) 9.3 9.3 (27.2) 13.2 — 330.1 Provision for income tax expense (110.7) 0.7 (3.7) (3.7) (3.0) (5.3) (7.4) (133.1) Income from continuing operations attributable to HealthSouth $ 216.5 $ (1.0) $ 5.6 $ 5.6 $ (30.2) $ 7.9 $ (7.4) $ 197.0 Add: Interest on convertible debt, net of tax 9.0 9.0 Numerator for diluted earnings per share $ 225.5 $ 206.0 Diluted earnings per share from continuing operations** $ 2.24 $ (0.01) $ 0.06 $ 0.06 $ (0.30) $ 0.08 $ (0.07) $ 2.05 Diluted shares used in calculation 100.7 Adjusted EPS(1) - 2014 * Reconciliation to GAAP provided on page 29; Refer to pages 44-45 for end notes. ** Adjusted EPS may not sum across due to rounding.

36 2013 Adjustments As Reported Gov't, Class Action, and Related Settlements Pro. Fees - Acct., Tax, and Legal Loss on Early Exting. of Debt Income Tax Valuation Allowance Adjustment Settlement of Income Tax Claims Repurchase of Preferred Stock As Adjusted (In Millions, Except Per Share Amounts) Adjusted EBITDA* $ 551.6 $ — $ — $ — $ — $ — $ — $ 551.6 Depreciation and amortization (94.7) — — — — — — (94.7) Government, class action, and related settlements 23.5 (23.5) — — — — — — Professional fees - accounting, tax, and legal (9.5) — 9.5 — — — — — Loss on early extinguishment of debt (2.4) — — 2.4 — — — — Interest expense and amortization of debt discounts and fees (100.4) — — — — — — (100.4) Stock-based compensation (24.8) — — — — — — (24.8) Loss on disposal or impairment of assets (5.9) — — — — — — (5.9) Income from continuing operations before income tax expense 337.4 (23.5) 9.5 2.4 — — — 325.8 Provision for income tax expense (12.7) 9.4 (3.8) (1.0) (9.1) (113.4) — (130.6) Income from continuing operations attributable to HealthSouth $ 324.7 $ (14.1) $ 5.7 $ 1.4 $ (9.1) $ (113.4) $ — $ 195.2 Less: Income allocated to participating securities (3.4) (3.4) Less: Convertible perpetual preferred dividends (21.0) (21.0) Less: Repurchase of perpetual preferred stock (71.6) 71.6 — Numerator for basic earnings per share $ 228.7 $ 170.8 Basic earnings per share from continuing operations** $ 2.59 $ (0.16) $ 0.06 $ 0.02 $ (0.10) $ (1.29) $ 0.81 $ 1.94 Basic shares used in calculation 88.1 Adjusted EPS(1) - 2013 Basic and diluted earnings per share are the same due to antidilution. * Reconciliation to GAAP provided on page 29; Refer to pages 44-45 for end notes. ** Adjusted EPS may not sum across due to rounding.
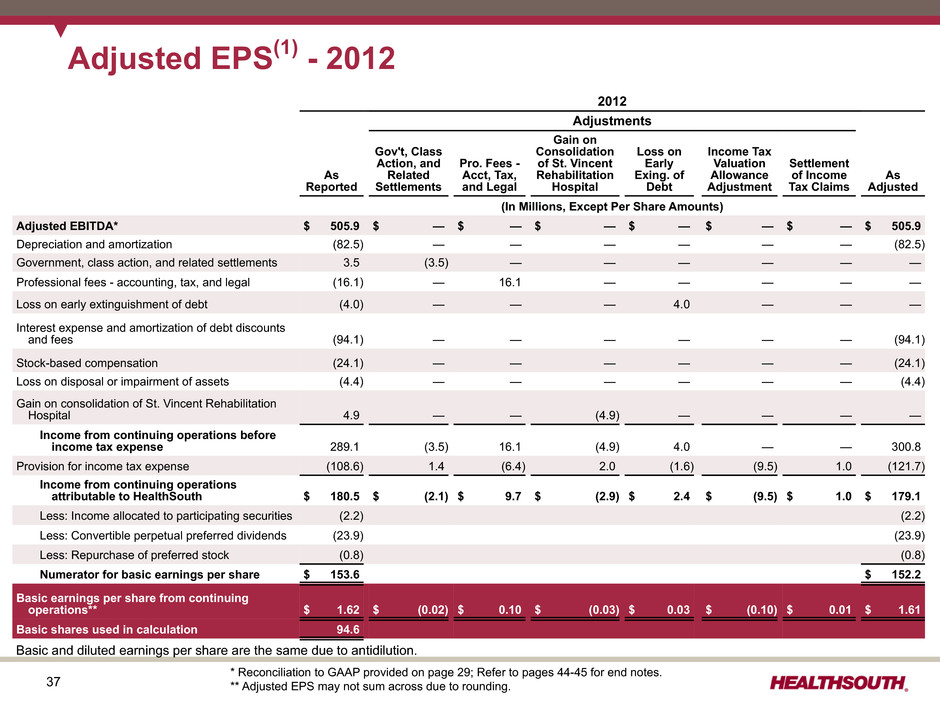
37 2012 Adjustments As Reported Gov't, Class Action, and Related Settlements Pro. Fees - Acct, Tax, and Legal Gain on Consolidation of St. Vincent Rehabilitation Hospital Loss on Early Exing. of Debt Income Tax Valuation Allowance Adjustment Settlement of Income Tax Claims As Adjusted (In Millions, Except Per Share Amounts) Adjusted EBITDA* $ 505.9 $ — $ — $ — $ — $ — $ — $ 505.9 Depreciation and amortization (82.5) — — — — — — (82.5) Government, class action, and related settlements 3.5 (3.5) — — — — — — Professional fees - accounting, tax, and legal (16.1) — 16.1 — — — — — Loss on early extinguishment of debt (4.0) — — — 4.0 — — — Interest expense and amortization of debt discounts and fees (94.1) — — — — — — (94.1) Stock-based compensation (24.1) — — — — — — (24.1) Loss on disposal or impairment of assets (4.4) — — — — — — (4.4) Gain on consolidation of St. Vincent Rehabilitation Hospital 4.9 — — (4.9) — — — — Income from continuing operations before income tax expense 289.1 (3.5) 16.1 (4.9) 4.0 — — 300.8 Provision for income tax expense (108.6) 1.4 (6.4) 2.0 (1.6) (9.5) 1.0 (121.7) Income from continuing operations attributable to HealthSouth $ 180.5 $ (2.1) $ 9.7 $ (2.9) $ 2.4 $ (9.5) $ 1.0 $ 179.1 Less: Income allocated to participating securities (2.2) (2.2) Less: Convertible perpetual preferred dividends (23.9) (23.9) Less: Repurchase of preferred stock (0.8) (0.8) Numerator for basic earnings per share $ 153.6 $ 152.2 Basic earnings per share from continuing operations** $ 1.62 $ (0.02) $ 0.10 $ (0.03) $ 0.03 $ (0.10) $ 0.01 $ 1.61 Basic shares used in calculation 94.6 Adjusted EPS(1) - 2012 Basic and diluted earnings per share are the same due to antidilution. * Reconciliation to GAAP provided on page 29; Refer to pages 44-45 for end notes. ** Adjusted EPS may not sum across due to rounding.

38 2011 Adjustments As Reported Gov't, Class Action, and Related Settlements Pro. Fees - Acct., Tax, and Legal Loss on Early Exting. of Debt Income Tax Valuation Allowance Adjustment Settlement of Income Tax Claims As Adjusted (In Millions, Except Per Share Amounts) Adjusted EBITDA* $ 466.2 $ — $ — $ — $ — $ — $ 466.2 Depreciation and amortization (78.8) — — — — — (78.8) Government, class action, and related settlements 12.3 (12.3) — — — — — Professional fees - accounting, tax, and legal (21.0) — 21.0 — — — — Loss on early extinguishment of debt (38.8) — — 38.8 — — — Interest expense and amortization of debt discounts and fees (119.4) — — — — — (119.4) Stock-based compensation (20.3) — — — — — (20.3) Loss on disposal or impairment of assets (4.3) — — — — — (4.3) Income from continuing operations before income tax expense 195.9 (12.3) 21.0 38.8 — — 243.4 Provision for income tax expense (37.1) 4.9 (8.4) (15.5) (28.2) (17.5) (101.8) Income from continuing operations attributable to HealthSouth $ 158.8 $ (7.4) $ 12.6 $ 23.3 $ (28.2) $ (17.5) $ 141.6 Less: Income allocated to participating securities (3.2) (3.2) Less: Convertible preferred stock dividends (26.0) (26.0) Numerator for basic earnings per share $ 129.6 $ 112.4 Basic earnings per share from continuing operations** $ 1.39 $ (0.08) $ 0.14 $ 0.25 $ (0.30) $ (0.19) $ 1.20 Basic shares used in calculation 93.3 Adjusted EPS(1) - 2011 Basic and diluted earnings per share are the same due to antidilution. * Reconciliation to GAAP provided on page 29; Refer to pages 44-45 for end notes. ** Adjusted EPS may not sum across due to rounding.

39 2010 Adjustments As Reported Gov't, Class Action, and Related Settlements Pro. Fees - Acct., Tax, and Legal Loss on Interest Rate Swaps Loss on Early Exting. of Debt Release of Income Tax Valuation Allowance Settlement of Income Tax Claims As Adjusted (In Millions, Except Per Share Amounts) Adjusted EBITDA* $ 409.6 $ — $ — $ — $ — $ — $ — $ 409.6 Depreciation and amortization (73.1) — — — — — — (73.1) Government, class action, and related settlements (1.1) 1.1 — — — — — — Professional fees - accounting, tax, and legal (17.2) — 17.2 — — — — — Loss on early extinguishment of debt (12.3) — — — 12.3 — — — Interest expense and amortization of debt discounts and fees (125.6) — — — — — — (125.6) Stock-based compensation (16.4) — — — — — — (16.4) Loss on disposal or impairment of assets (1.4) — — — — — — (1.4) Loss on interest rate swaps (13.3) — — 13.3 — — — — Other (0.2) — — — — — — (0.2) Income from continuing operations before income tax expense 149.0 1.1 17.2 13.3 12.3 — — 192.9 Provision for income tax benefit (expense) 740.8 (0.4) (6.9) (5.3) (4.9) (819.4) 25.1 (71.0) Income from continuing operations attributable to HealthSouth $ 889.8 $ 0.7 $ 10.3 $ 8.0 $ 7.4 $ (819.4) $ 25.1 $ 121.9 Add: Interest on convertible debt, net of tax — — Numerator for diluted earnings per share $ 889.8 $ 121.9 Diluted earnings per share from continuing operations** $ 8.20 $ 0.01 $ 0.09 $ 0.07 $ 0.07 $ (7.55) $ 0.23 $ 1.12 Diluted shares used in calculation 108.5 Adjusted EPS(1) - 2010 * Reconciliation to GAAP provided on page 29; Refer to pages 44-45 for end notes. ** Adjusted EPS may not sum across due to rounding.
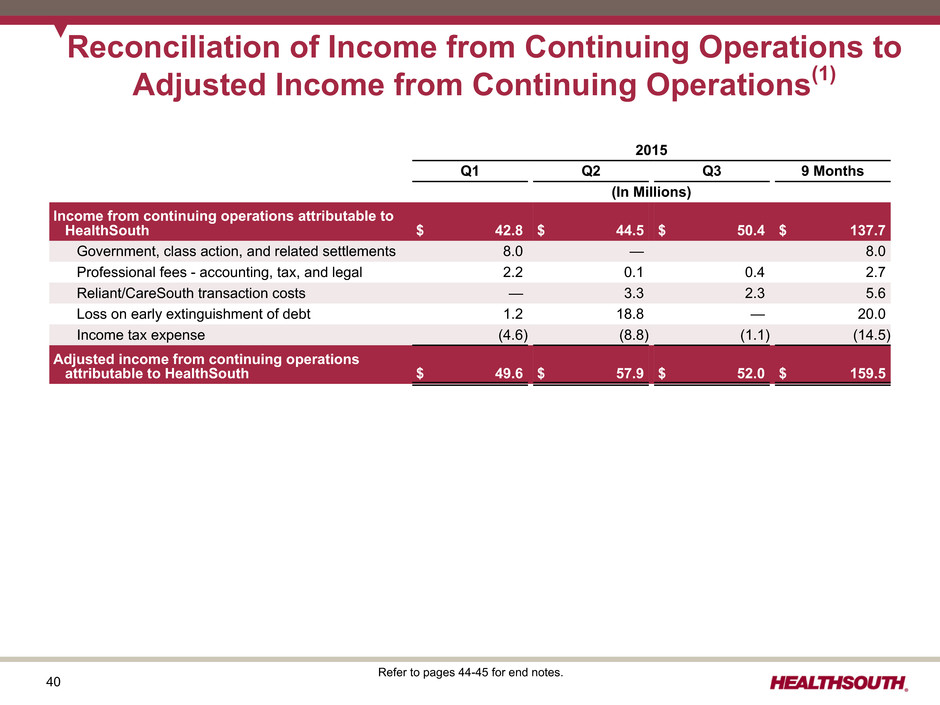
40 2015 Q1 Q2 Q3 9 Months (In Millions) Income from continuing operations attributable to HealthSouth $ 42.8 $ 44.5 $ 50.4 $ 137.7 Government, class action, and related settlements 8.0 — 8.0 Professional fees - accounting, tax, and legal 2.2 0.1 0.4 2.7 Reliant/CareSouth transaction costs — 3.3 2.3 5.6 Loss on early extinguishment of debt 1.2 18.8 — 20.0 Income tax expense (4.6) (8.8) (1.1) (14.5) Adjusted income from continuing operations attributable to HealthSouth $ 49.6 $ 57.9 $ 52.0 $ 159.5 Reconciliation of Income from Continuing Operations to Adjusted Income from Continuing Operations(1) Refer to pages 44-45 for end notes.

41 Year Ended December 31, 2014 2013 2012 2011 2010 (In Millions) Income from continuing operations attributable to HealthSouth $ 216.5 $ 324.7 $ 180.5 $ 158.8 $ 889.8 Government, class action, and related settlements (1.7) (23.5) (3.5) (12.3) 1.1 Professional fees - accounting, tax, and legal 9.3 9.5 16.1 21.0 17.2 Loss on interest rate swaps — — — — 13.3 Loss on early extinguishment of debt 13.2 2.4 4.0 38.8 12.3 Gain on consolidation of hospital (27.2) — (4.9) — — Encompass transaction costs 9.3 — — — — Income tax expense (22.4) (117.9) (13.1) (64.7) (811.8) Adjusted income from continuing operations attributable to HealthSouth $ 197.0 $ 195.2 $ 179.1 $ 141.6 $ 121.9 Reconciliation of Income from Continuing Operations to Adjusted Income from Continuing Operations(1) Refer to pages 44-45 for end notes.
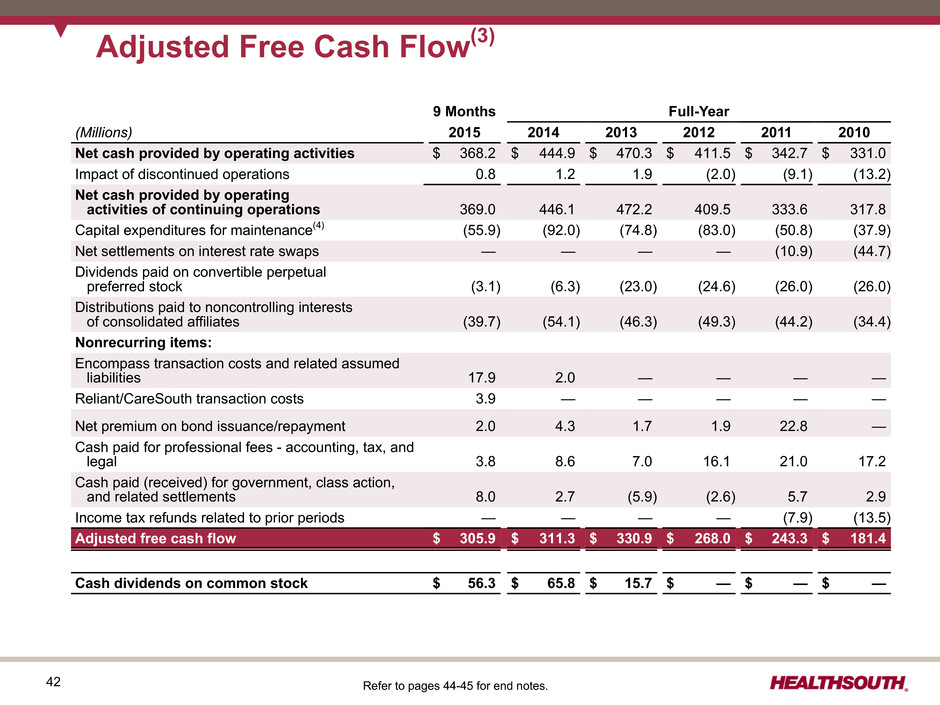
42 Adjusted Free Cash Flow(3) Refer to pages 44-45 for end notes. 9 Months Full-Year (Millions) 2015 2014 2013 2012 2011 2010 Net cash provided by operating activities $ 368.2 $ 444.9 $ 470.3 $ 411.5 $ 342.7 $ 331.0 Impact of discontinued operations 0.8 1.2 1.9 (2.0) (9.1) (13.2) Net cash provided by operating activities of continuing operations 369.0 446.1 472.2 409.5 333.6 317.8 Capital expenditures for maintenance(4) (55.9) (92.0) (74.8) (83.0) (50.8) (37.9) Net settlements on interest rate swaps — — — — (10.9) (44.7) Dividends paid on convertible perpetual preferred stock (3.1) (6.3) (23.0) (24.6) (26.0) (26.0) Distributions paid to noncontrolling interests of consolidated affiliates (39.7) (54.1) (46.3) (49.3) (44.2) (34.4) Nonrecurring items: Encompass transaction costs and related assumed liabilities 17.9 2.0 — — — — Reliant/CareSouth transaction costs 3.9 — — — — — Net premium on bond issuance/repayment 2.0 4.3 1.7 1.9 22.8 — Cash paid for professional fees - accounting, tax, and legal 3.8 8.6 7.0 16.1 21.0 17.2 Cash paid (received) for government, class action, and related settlements 8.0 2.7 (5.9) (2.6) 5.7 2.9 Income tax refunds related to prior periods — — — — (7.9) (13.5) Adjusted free cash flow $ 305.9 $ 311.3 $ 330.9 $ 268.0 $ 243.3 $ 181.4 Cash dividends on common stock $ 56.3 $ 65.8 $ 15.7 $ — $ — $ —

43 End Notes

44 (1) HealthSouth is providing adjusted earnings per share from continuing operations attributable to HealthSouth (“adjusted earnings per share”), which is a non-GAAP measure. The Company believes the presentation of adjusted earnings per share provides a better measure of its ongoing performance and provides better comparability to prior periods because it excludes the impact of government, class action, and related settlements, professional fees - accounting, tax, and legal, gains or losses related to hedging instruments, loss on early extinguishment of debt, adjustments to its income tax provision (such as valuation allowance adjustments and settlements of income tax claims), items related to corporate and facility restructurings, and certain other items. Adjusted earnings per share should not be considered as a measure of financial performance under generally accepted accounting principles in the United States as the items excluded from it are significant components in understanding and assessing financial performance. Because adjusted earnings per share is not a measurement determined in accordance with GAAP and is thus susceptible to varying calculations, it may not be comparable as presented to other similarly titled measures of other companies. (2) On July 16, 2015, the Company’s board of directors approved a $0.02 per share, or 9.5%, increase to the quarterly cash dividend on the Company’s common stock, bringing the quarterly cash dividend to $0.23 per common share. (3) The Company’s definition of adjusted free cash flow is net cash provided by operating activities of continuing operations minus capital expenditures for maintenance, dividends paid on preferred stock, distributions to noncontrolling interests, and nonrecurring items. Common stock dividends are not included in the calculation of adjusted free cash flow. (4) Capital expenditures for maintenance in 2013 benefited by approx. $12 million for equipment purchases that were invoiced in Q4 2013 and paid in early 2014. (5) In April 2015, HealthSouth forced conversion of all of its remaining convertible perpetual preferred stock. The 96,245 preferred shares outstanding were converted into 3,271,415 shares of the Company's common stock. (6) In December 2014, the Encompass acquisition was initially funded using a combination of draws under the revolving credit facility and expanded term loan facility. In January 2015, the Company issued an additional $400 million of its 5.75% senior notes due 2024 and used $250 million of the net proceeds to repay borrowings under its term loan facilities, with the remainder used to repay borrowings under its revolving credit facility. (7) HealthSouth drew from its term loan facilities and revolving credit facility to fund a portion of the Reliant and CareSouth acquisitions. (8) In March 2015, the Company issued $300 million of 5.125% senior notes due 2023 and called all of its 8.125% senior notes due 2020, which were funded in April 2015. (9) In November 2015, the Company completed the optional redemption of $50 million of the outstanding principal amount of its existing 7.75% senior notes due 2022. Pursuant to the terms of the notes, the redemption was made at a price of 103.875%. The redemption was funded using a draw under the Company’s revolving credit facility. (10) In August 2015, the Company issued an additional $350 million of its 5.75% senior notes due 2024. In September 2015, the Company issued $350 million of 5.75% notes due 2025. The proceeds from both offerings were used to fund a portion of the Reliant acquisition. (11) The leverage ratio is based on trailing four quarter Adjusted EBITDA of $631.8 million and 2014 Adjusted EBITDA of $577.6 million. Pro forma 2015 leverage with trailing four quarters Encompass Adjusted EBITDA and full-year Adjusted EBITDA estimates for Reliant and CareSouth included would be approx. 4.2x. End Notes

45 (12) Adjusted EBITDA is a non-GAAP financial measure. The Company’s leverage ratio (total consolidated debt to Adjusted EBITDA for the trailing four quarters) is, likewise, a non-GAAP measure. Management and some members of the investment community utilize Adjusted EBITDA as a financial measure and the leverage ratio as a liquidity measure on an ongoing basis. These measures are not recognized in accordance with GAAP and should not be viewed as an alternative to GAAP measures of performance or liquidity. In evaluating Adjusted EBITDA, the reader should be aware that in the future HealthSouth may incur expenses similar to the adjustments set forth. (13) Per share amounts for each period presented are based on diluted weighted average shares outstanding unless the amounts are antidilutive, in which case the per share amount is calculated using the basic share count after subtracting the quarterly dividend on the convertible perpetual preferred stock, income allocated to participating securities, and the repurchase premium on shares of preferred stock. The difference in shares between the basic and diluted shares outstanding is primarily related to the convertible senior subordinated notes and convertible perpetual preferred stock. End Notes, con't.


