
2017 J.P. MORGAN HEALTHCARE CONFERENCE San Francisco, CA│January 10, 2017 Mark Tarr, President and Chief Executive Officer
2 The information contained in this presentation includes certain estimates, projections and other forward-looking information that reflect HealthSouth's current outlook, views and plans with respect to future events, including legislative and regulatory developments, strategy, capital expenditures, acquisition and other development activities, cyber security, dividend strategies, repurchases of securities, effective tax rates, financial performance, financial assumptions, business model, and shareholder value-enhancing transactions. These estimates, projections and other forward-looking information are based on assumptions HealthSouth believes, as of the date hereof, are reasonable. Inevitably, there will be differences between such estimates and actual events or results, and those differences may be material. There can be no assurance that any estimates, projections or forward-looking information will be realized. All such estimates, projections and forward-looking information speak only as of the date hereof. HealthSouth undertakes no duty to publicly update or revise the information contained herein. You are cautioned not to place undue reliance on the estimates, projections and other forward-looking information in this presentation as they are based on current expectations and general assumptions and are subject to various risks, uncertainties and other factors, including those set forth in HealthSouth's Form 10-K for the year ended December 31, 2015, the Form 10-Q for the quarters ended March 31, 2016, June 30, 2016, and September 30, 2016, and in other documents HealthSouth previously filed with the SEC, many of which are beyond HealthSouth's control, that may cause actual events or results to differ materially from the views, beliefs and estimates expressed herein. Note Regarding Presentation of Non-GAAP Financial Measures The following presentation includes certain “non-GAAP financial measures” as defined in Regulation G under the Securities Exchange Act of 1934, including Adjusted EBITDA, leverage ratios, adjusted earnings per share, and adjusted free cash flow. Schedules are attached that reconcile the non-GAAP financial measures included in the following presentation to the most directly comparable financial measures calculated and presented in accordance with Generally Accepted Accounting Principles in the United States. HealthSouth's Form 8-K, dated January 9, 2017, to which the following presentation is attached as Exhibit 99.1, provides further explanation and disclosure regarding HealthSouth's use of non-GAAP financial measures and should be read in conjunction with this presentation. Forward-Looking Statements
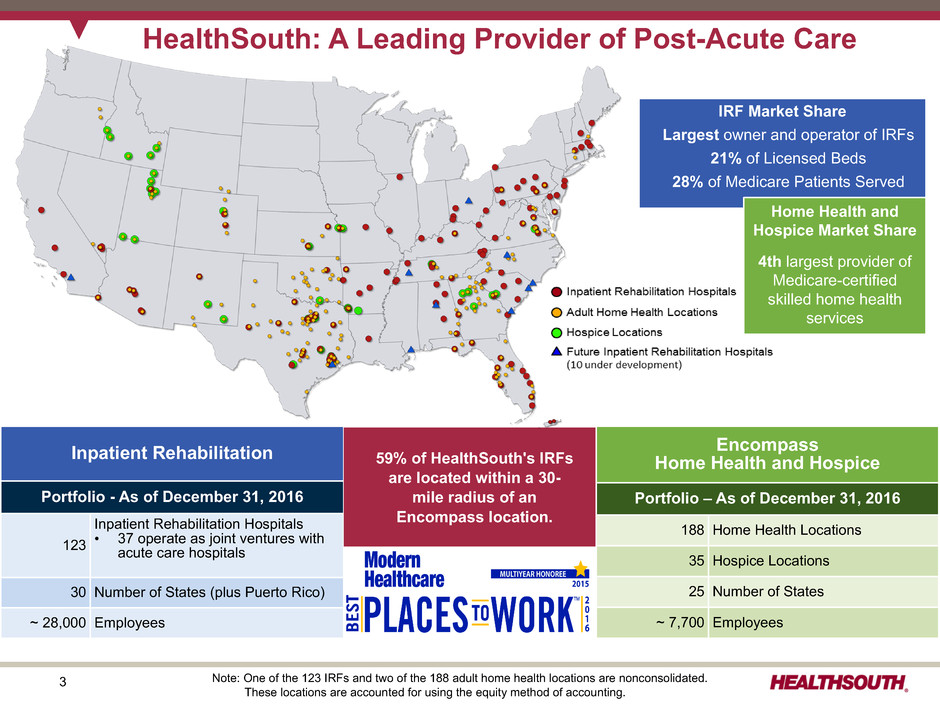
3 Inpatient Rehabilitation Portfolio - As of December 31, 2016 123 Inpatient Rehabilitation Hospitals • 37 operate as joint ventures with acute care hospitals 30 Number of States (plus Puerto Rico) ~ 28,000 Employees HealthSouth: A Leading Provider of Post-Acute Care 59% of HealthSouth's IRFs are located within a 30- mile radius of an Encompass location. IRF Market Share Largest owner and operator of IRFs 21% of Licensed Beds 28% of Medicare Patients Served Home Health and Hospice Market Share 4th largest provider of Medicare-certified skilled home health services Note: One of the 123 IRFs and two of the 188 adult home health locations are nonconsolidated. These locations are accounted for using the equity method of accounting. Encompass Home Health and Hospice Portfolio – As of December 31, 2016 188 Home Health Locations 35 Hospice Locations 25 Number of States ~ 7,700 Employees
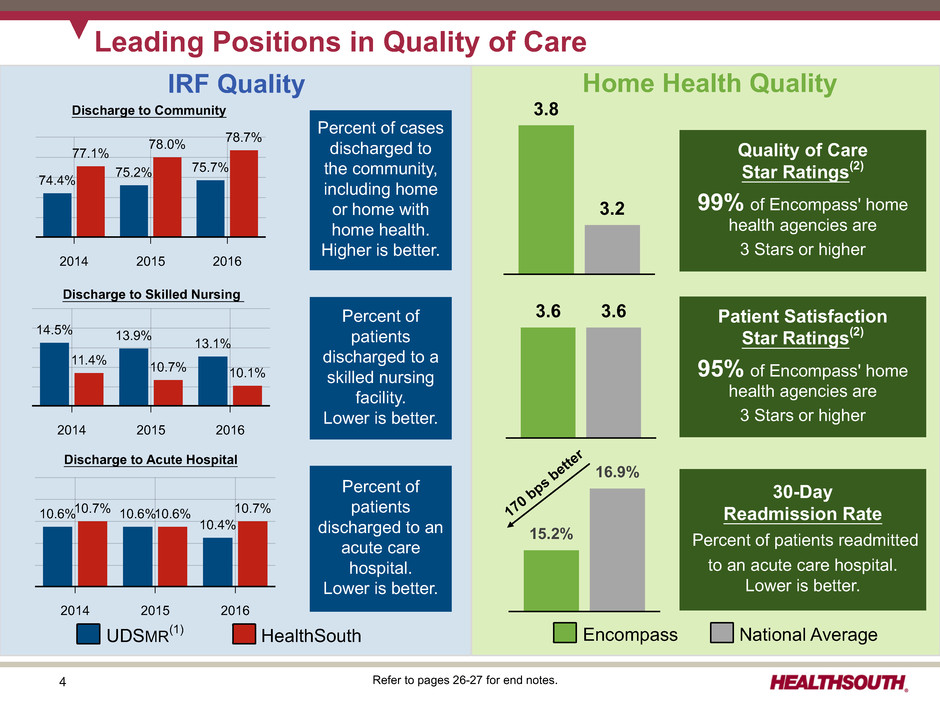
4 2014 2015 2016 10.6% 10.6% 10.4% 10.7% 10.6% 10.7% 2014 2015 2016 14.5% 13.9% 13.1% 11.4% 10.7% 10.1% 2014 2015 2016 74.4% 75.2% 75.7% 77.1% 78.0% 78.7% Home Health QualityIRF Quality Discharge to Community Discharge to Skilled Nursing Discharge to Acute Hospital Percent of cases discharged to the community, including home or home with home health. Higher is better. Percent of patients discharged to a skilled nursing facility. Lower is better. Percent of patients discharged to an acute care hospital. Lower is better. Refer to pages 26-27 for end notes. 3.8 3.2 Quality of Care Star Ratings(2) 99% of Encompass' home health agencies are 3 Stars or higher 3.6 3.6 Patient Satisfaction Star Ratings(2) 95% of Encompass' home health agencies are 3 Stars or higher Encompass National Average 15.2% 16.9% 30-Day Readmission Rate Percent of patients readmitted to an acute care hospital. Lower is better. 170 bps bette r UDSMR(1) HealthSouth Leading Positions in Quality of Care
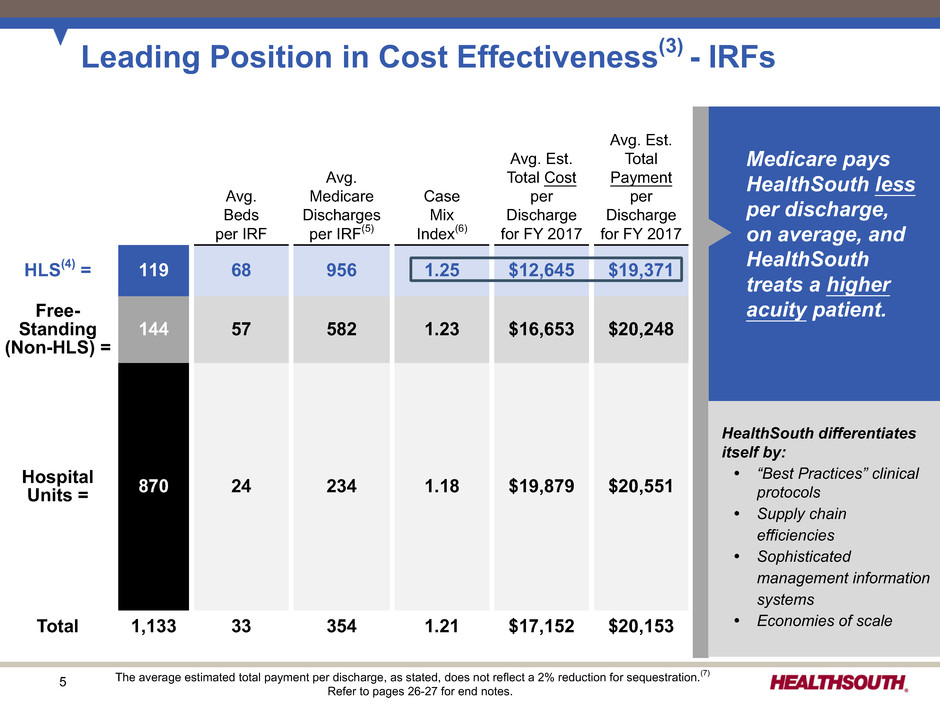
5 Leading Position in Cost Effectiveness(3) - IRFs Medicare pays HealthSouth less per discharge, on average, and HealthSouth treats a higher acuity patient. Avg. Beds per IRF Avg. Medicare Discharges per IRF(5) Case Mix Index(6) Avg. Est. Total Cost per Discharge for FY 2017 Avg. Est. Total Payment per Discharge for FY 2017 HLS(4) = 119 68 956 1.25 $12,645 $19,371 Free- Standing (Non-HLS) = 144 57 582 1.23 $16,653 $20,248 Hospital Units = 870 24 234 1.18 $19,879 $20,551 Total 1,133 33 354 1.21 $17,152 $20,153 The average estimated total payment per discharge, as stated, does not reflect a 2% reduction for sequestration.(7) Refer to pages 26-27 for end notes. HealthSouth differentiates itself by: Ÿ “Best Practices” clinical protocols Ÿ Supply chain efficiencies Ÿ Sophisticated management information systems Ÿ Economies of scale

6 2015 AverageRevenue Visits Effective Revenue Cost Episodes per Episode per Episode per Visit per Visit Encompass 137,568 $3,072 19 $162 $72 Public Peer Average 259,215 $2,732 17* $161 $84* Encompass Compared to Peer Average 12.4% 11.8% 0.6% (14.3)% Leading Position in Cost Effectiveness - Home Health Encompass' average revenue per episode is 12.4% higher due to higher acuity patient mix. Encompass' cost per visit is 14.3% lower due to market density & operational efficiency: Ÿ Caregiver optimization Ÿ Full utilization of Homecare Homebase (HCHB) Ÿ Employee culture of excellence Ÿ ~76% of visits conducted by full-time staff Ÿ Daily monitoring of productivity Public peer average represents 2015 data from publicly traded home health providers. * One publicly traded company (Kindred) does not report visit counts.
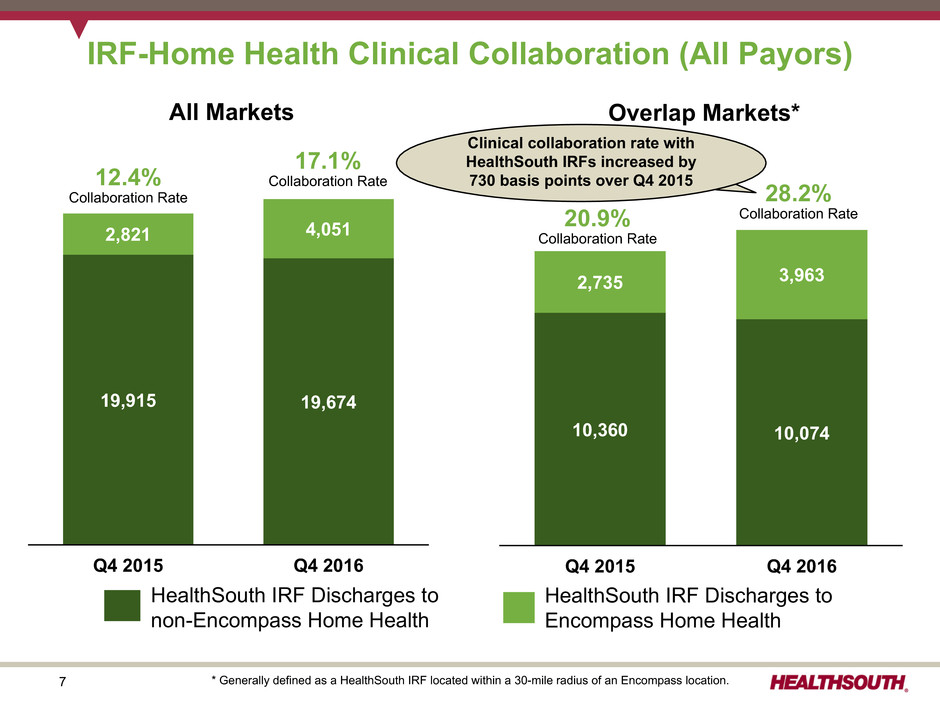
7 IRF-Home Health Clinical Collaboration (All Payors) * Generally defined as a HealthSouth IRF located within a 30-mile radius of an Encompass location. All Markets Q4 2015 Q4 2016 19,915 19,674 2,821 4,051 12.4% Collaboration Rate 17.1% Collaboration Rate Overlap Markets* Q4 2015 Q4 2016 10,360 10,074 2,735 3,963 20.9% Collaboration Rate 28.2% Collaboration Rate HealthSouth IRF Discharges to non-Encompass Home Health HealthSouth IRF Discharges to Encompass Home Health Clinical collaboration rate with HealthSouth IRFs increased by 730 basis points over Q4 2015
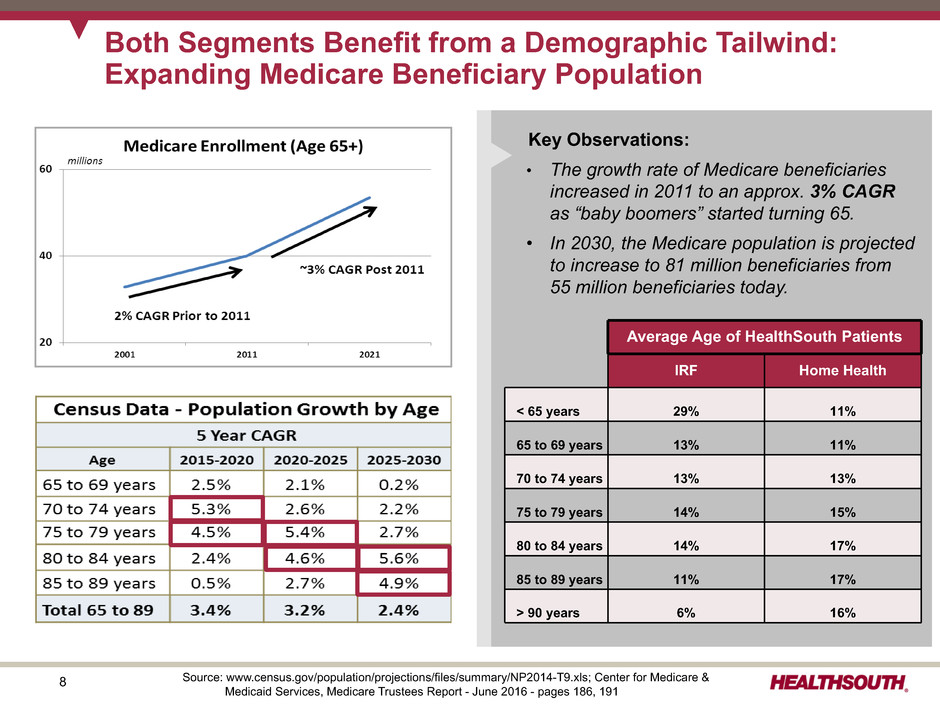
8 Both Segments Benefit from a Demographic Tailwind: Expanding Medicare Beneficiary Population Key Observations: • The growth rate of Medicare beneficiaries increased in 2011 to an approx. 3% CAGR as “baby boomers” started turning 65. • In 2030, the Medicare population is projected to increase to 81 million beneficiaries from 55 million beneficiaries today. Source: www.census.gov/population/projections/files/summary/NP2014-T9.xls; Center for Medicare & Medicaid Services, Medicare Trustees Report - June 2016 - pages 186, 191 Average Age of HealthSouth Patients IRF Home Health < 65 years 29% 11% 65 to 69 years 13% 11% 70 to 74 years 13% 13% 75 to 79 years 14% 15% 80 to 84 years 14% 17% 85 to 89 years 11% 17% > 90 years 6% 16%
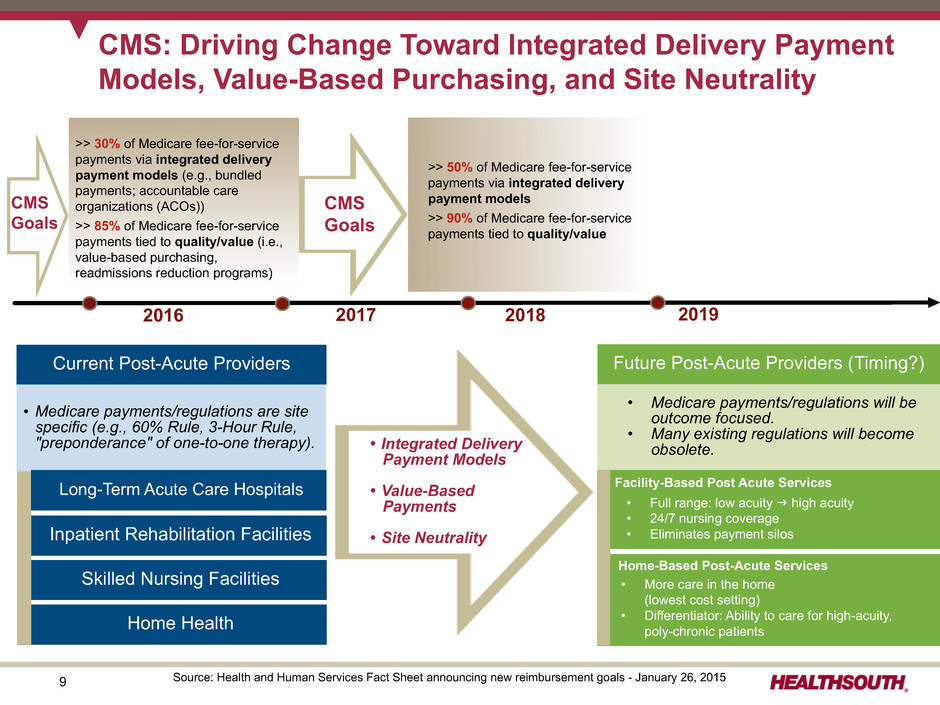
9 CMS: Driving Change Toward Integrated Delivery Payment Models, Value-Based Purchasing, and Site Neutrality Future Post-Acute Providers (Timing?) Inpatient Rehabilitation Facilities • Full range: low acuity g high acuity • 24/7 nursing coverage • Eliminates payment silos Home-Based Post-Acute Services • More care in the home (lowest cost setting) • Differentiator: Ability to care for high-acuity, poly-chronic patients >> 50% of Medicare fee-for-service payments via integrated delivery payment models >> 90% of Medicare fee-for-service payments tied to quality/value Ÿ Integrated Delivery Payment Models Ÿ Value-Based Payments • Site Neutrality Current Post-Acute Providers • Medicare payments/regulations will be outcome focused. • Many existing regulations will become obsolete. Facility-Based Post Acute Services >> 30% of Medicare fee-for-service payments via integrated delivery payment models (e.g., bundled payments; accountable care organizations (ACOs)) >> 85% of Medicare fee-for-service payments tied to quality/value (i.e., value-based purchasing, readmissions reduction programs) 20172016 Source: Health and Human Services Fact Sheet announcing new reimbursement goals - January 26, 2015 CMS Goals 2018 2019 CMS Goals Skilled Nursing Facilities Home Health • Medicare payments/regulations are site specific (e.g., 60% Rule, 3-Hour Rule, "preponderance" of one-to-one therapy). Long-Term Acute Care Hospitals
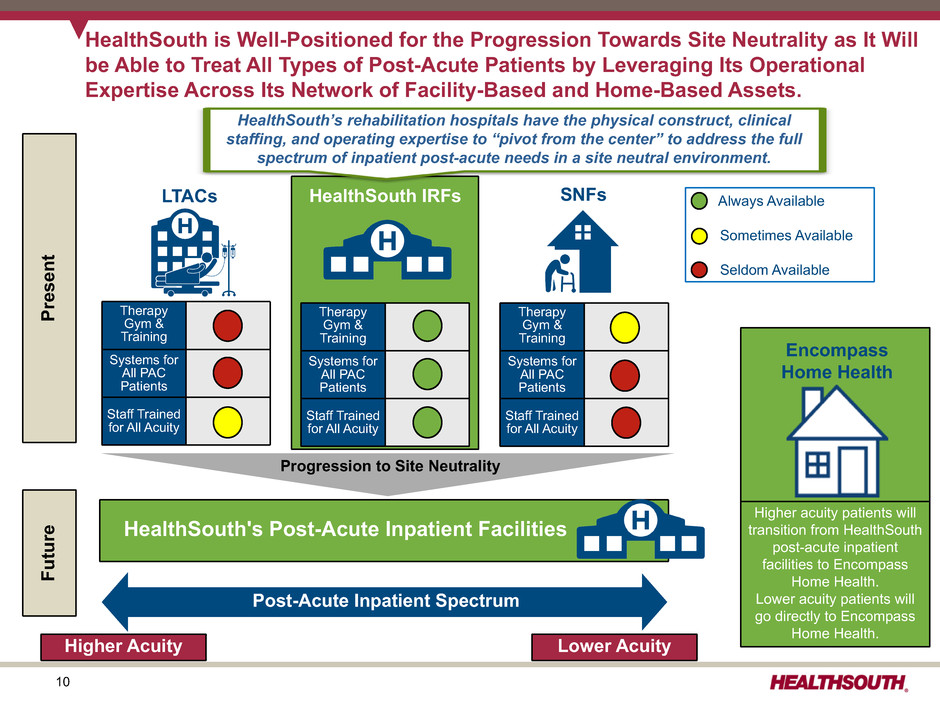
10 Always Available Sometimes Available Seldom Available Therapy Gym & Training Systems for All PAC Patients Staff Trained for All Acuity Therapy Gym & Training Systems for All PAC Patients Staff Trained for All Acuity Therapy Gym & Training Systems for All PAC Patients Staff Trained for All Acuity LTACs HealthSouth IRFs SNFs Encompass Home Health HealthSouth’s rehabilitation hospitals have the physical construct, clinical staffing, and operating expertise to “pivot from the center” to address the full spectrum of inpatient post-acute needs in a site neutral environment. HealthSouth is Well-Positioned for the Progression Towards Site Neutrality as It Will be Able to Treat All Types of Post-Acute Patients by Leveraging Its Operational Expertise Across Its Network of Facility-Based and Home-Based Assets. Higher acuity patients will transition from HealthSouth post-acute inpatient facilities to Encompass Home Health. Lower acuity patients will go directly to Encompass Home Health. Post-Acute Inpatient Spectrum Higher Acuity Lower Acuity Progression to Site Neutrality HealthSouth's Post-Acute Inpatient Facilities Presen t Futur e
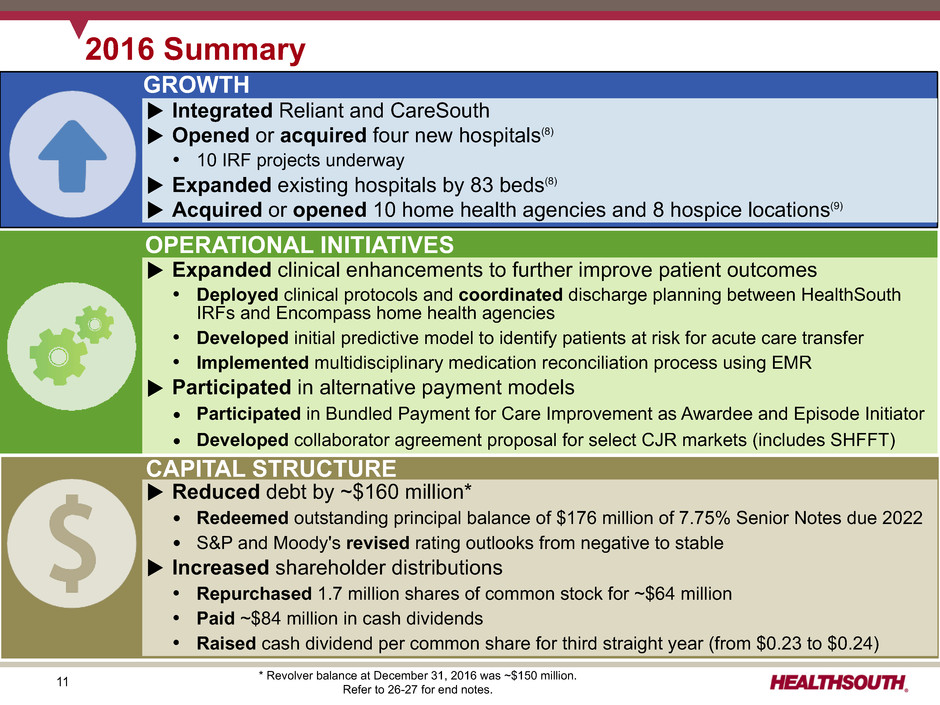
11 2016 Summary GROWTH CAPITAL STRUCTURE OPERATIONAL INITIATIVES u Integrated Reliant and CareSouth u Opened or acquired four new hospitals(8) Ÿ 10 IRF projects underway u Expanded existing hospitals by 83 beds(8) u Acquired or opened 10 home health agencies and 8 hospice locations(9) u Expanded clinical enhancements to further improve patient outcomes Ÿ Deployed clinical protocols and coordinated discharge planning between HealthSouth IRFs and Encompass home health agencies Ÿ Developed initial predictive model to identify patients at risk for acute care transfer Ÿ Implemented multidisciplinary medication reconciliation process using EMR u Participated in alternative payment models Ÿ Participated in Bundled Payment for Care Improvement as Awardee and Episode Initiator Ÿ Developed collaborator agreement proposal for select CJR markets (includes SHFFT) u Reduced debt by ~$160 million* Ÿ Redeemed outstanding principal balance of $176 million of 7.75% Senior Notes due 2022 Ÿ S&P and Moody's revised rating outlooks from negative to stable u Increased shareholder distributions Ÿ Repurchased 1.7 million shares of common stock for ~$64 million Ÿ Paid ~$84 million in cash dividends Ÿ Raised cash dividend per common share for third straight year (from $0.23 to $0.24) * Revolver balance at December 31, 2016 was ~$150 million. Refer to 26-27 for end notes.
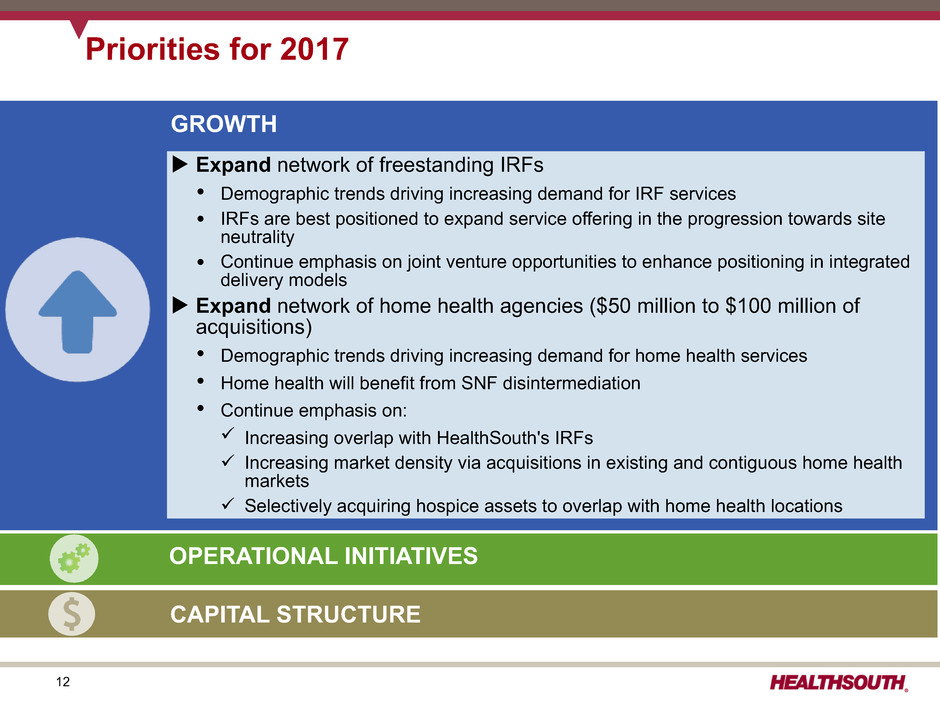
12 Priorities for 2017 GROWTH u Expand network of freestanding IRFs Ÿ Demographic trends driving increasing demand for IRF services Ÿ IRFs are best positioned to expand service offering in the progression towards site neutrality Ÿ Continue emphasis on joint venture opportunities to enhance positioning in integrated delivery models u Expand network of home health agencies ($50 million to $100 million of acquisitions) Ÿ Demographic trends driving increasing demand for home health services Ÿ Home health will benefit from SNF disintermediation Ÿ Continue emphasis on: ü Increasing overlap with HealthSouth's IRFs ü Increasing market density via acquisitions in existing and contiguous home health markets ü Selectively acquiring hospice assets to overlap with home health locations OPERATIONAL INITIATIVES CAPITAL STRUCTURE
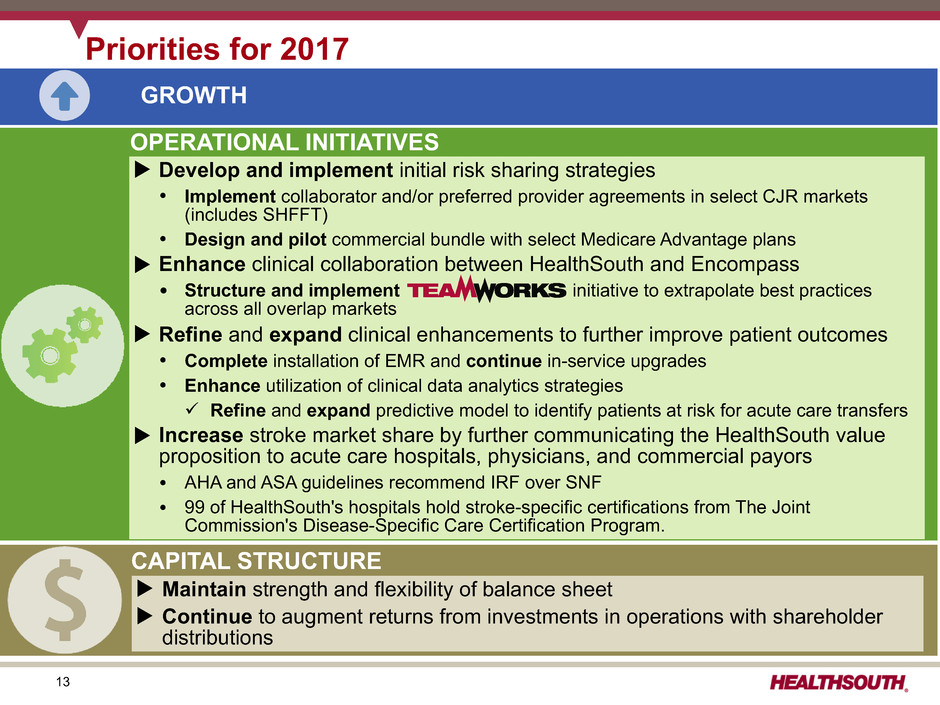
13 Priorities for 2017 GROWTH CAPITAL STRUCTURE OPERATIONAL INITIATIVES u Develop and implement initial risk sharing strategies Ÿ Implement collaborator and/or preferred provider agreements in select CJR markets (includes SHFFT) Ÿ Design and pilot commercial bundle with select Medicare Advantage plans u Enhance clinical collaboration between HealthSouth and Encompass Ÿ Structure and implement initiative to extrapolate best practices across all overlap markets u Refine and expand clinical enhancements to further improve patient outcomes Ÿ Complete installation of EMR and continue in-service upgrades Ÿ Enhance utilization of clinical data analytics strategies ü Refine and expand predictive model to identify patients at risk for acute care transfers u Increase stroke market share by further communicating the HealthSouth value proposition to acute care hospitals, physicians, and commercial payors Ÿ AHA and ASA guidelines recommend IRF over SNF Ÿ 99 of HealthSouth's hospitals hold stroke-specific certifications from The Joint Commission's Disease-Specific Care Certification Program. u Maintain strength and flexibility of balance sheet u Continue to augment returns from investments in operations with shareholder distributions
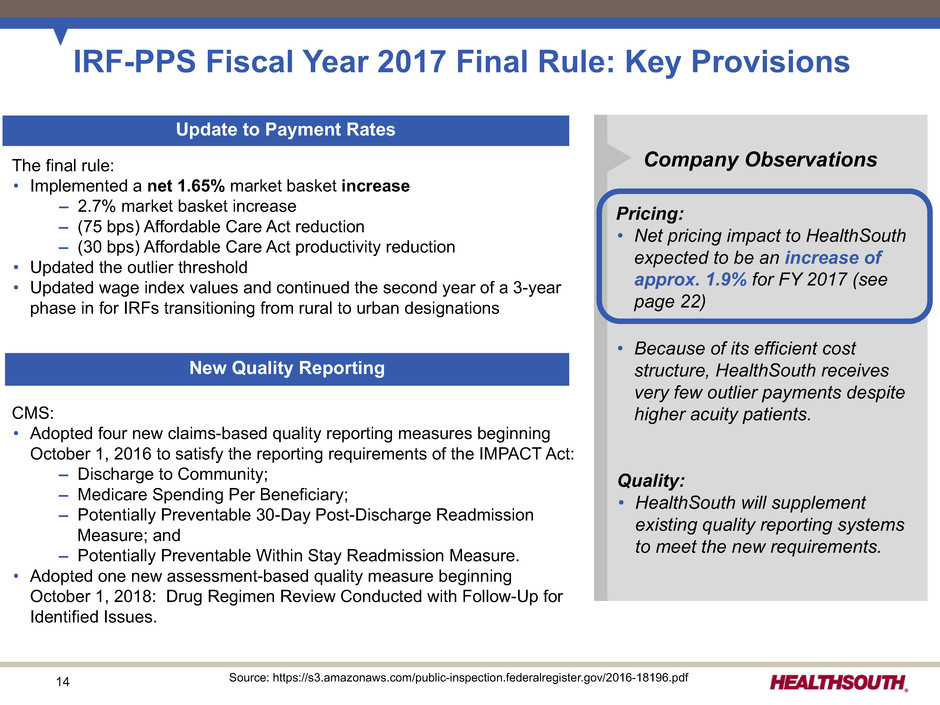
14 CMS: • Adopted four new claims-based quality reporting measures beginning October 1, 2016 to satisfy the reporting requirements of the IMPACT Act: – Discharge to Community; – Medicare Spending Per Beneficiary; – Potentially Preventable 30-Day Post-Discharge Readmission Measure; and – Potentially Preventable Within Stay Readmission Measure. • Adopted one new assessment-based quality measure beginning October 1, 2018: Drug Regimen Review Conducted with Follow-Up for Identified Issues. IRF-PPS Fiscal Year 2017 Final Rule: Key Provisions New Quality Reporting Update to Payment Rates Company Observations Pricing: • Net pricing impact to HealthSouth expected to be an increase of approx. 1.9% for FY 2017 (see page 22) • Because of its efficient cost structure, HealthSouth receives very few outlier payments despite higher acuity patients. Quality: • HealthSouth will supplement existing quality reporting systems to meet the new requirements. The final rule: • Implemented a net 1.65% market basket increase – 2.7% market basket increase – (75 bps) Affordable Care Act reduction – (30 bps) Affordable Care Act productivity reduction • Updated the outlier threshold • Updated wage index values and continued the second year of a 3-year phase in for IRFs transitioning from rural to urban designations Source: https://s3.amazonaws.com/public-inspection.federalregister.gov/2016-18196.pdf

15 Pricing: • Net pricing impact to Encompass expected to be a reduction of approx. 3.6% for CY 2017 (see page 22) • The final rule requires the recalibration of case-mix weights and the conversion of outlier payments to a cost-per-unit methodology to be budget neutral for the industry. However, these changes will have a disproportionate impact on Encompass based on its patient mix. Quality: • Encompass will supplement existing processes and systems to meet the new requirements. HH-PPS Calendar Year 2017 Final Rule: Key Provisions New Quality Reporting Update to Payment Rates Company ObservationsThe final rule: • Implemented a net 2.5% market basket increase – 2.8% market basket increase – (30 bps) Affordable Care Act productivity reduction • Implemented the final year of the four-year phase-in of the ACA mandated rebasing adjustment. The net rebasing reduction is approximately (2.3%). • Implemented the second year of a three-year nominal case-mix coding intensity reduction adjustment of (0.9%) • Updated the outlier fixed-dollar loss ratio from 0.45 to 0.55 • Recalibrated the case-mix weights to reflect current home health resource use and changes in utilization patterns • Converted outlier payments from a cost-per-visit to a cost-per-unit methodology, with “per-visit” rates converted into 15 minute “per-unit” rates CMS: • Adopted, for the CY 2018 payment determination, four measures to meet the requirements of the IMPACT Act: – Medicare Spending per Beneficiary (Claims Based); – Discharge to Community (Claims Based); – Potentially Preventable 30-Day Post-Discharge Readmission Measure (Claims Based); and – Drug Regimen Review Conducted with Follow-Up for Identified Issues (Patient Assessment Based) • Removed 28 quality measures, beginning with CY 2017, and 6 process measures, beginning with CY 2018, due to CMS determining these measures have been “topped-out” Source: https://s3.amazonaws.com/public-inspection.federalregister.gov/2016-26290.pdf
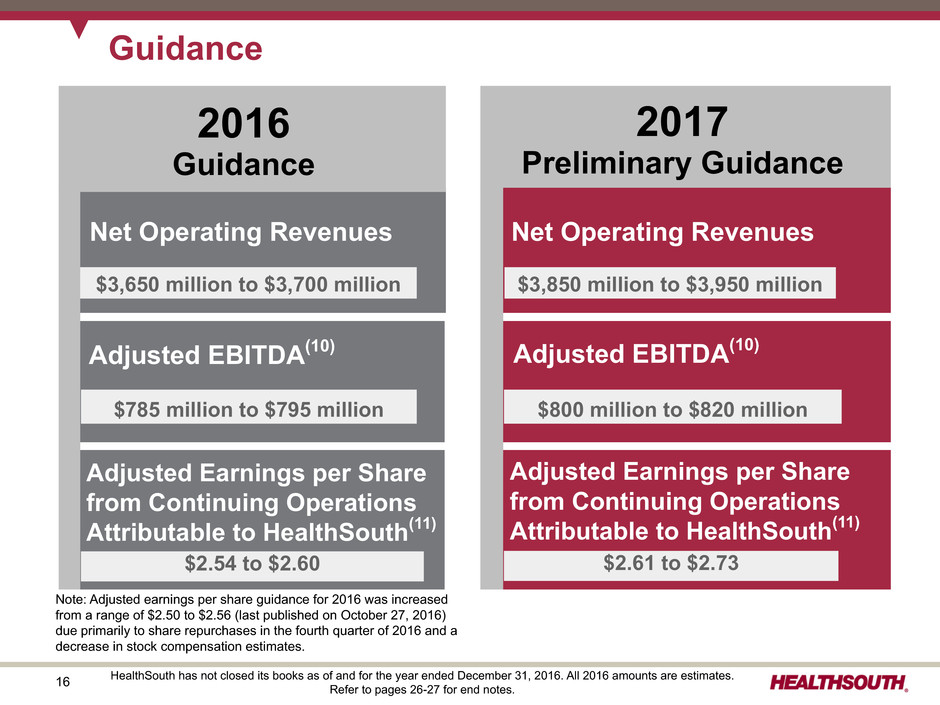
16 Guidance Adjusted EBITDA(10) Adjusted Earnings per Share from Continuing Operations Attributable to HealthSouth(11) Net Operating Revenues Net Operating Revenues $3,850 million to $3,950 million Adjusted EBITDA(10) $800 million to $820 million Adjusted Earnings per Share from Continuing Operations Attributable to HealthSouth(11) $2.61 to $2.73 $3,650 million to $3,700 million $785 million to $795 million $2.54 to $2.60 2017 Preliminary Guidance 2016 Guidance HealthSouth has not closed its books as of and for the year ended December 31, 2016. All 2016 amounts are estimates. Refer to pages 26-27 for end notes. Note: Adjusted earnings per share guidance for 2016 was increased from a range of $2.50 to $2.56 (last published on October 27, 2016) due primarily to share repurchases in the fourth quarter of 2016 and a decrease in stock compensation estimates.
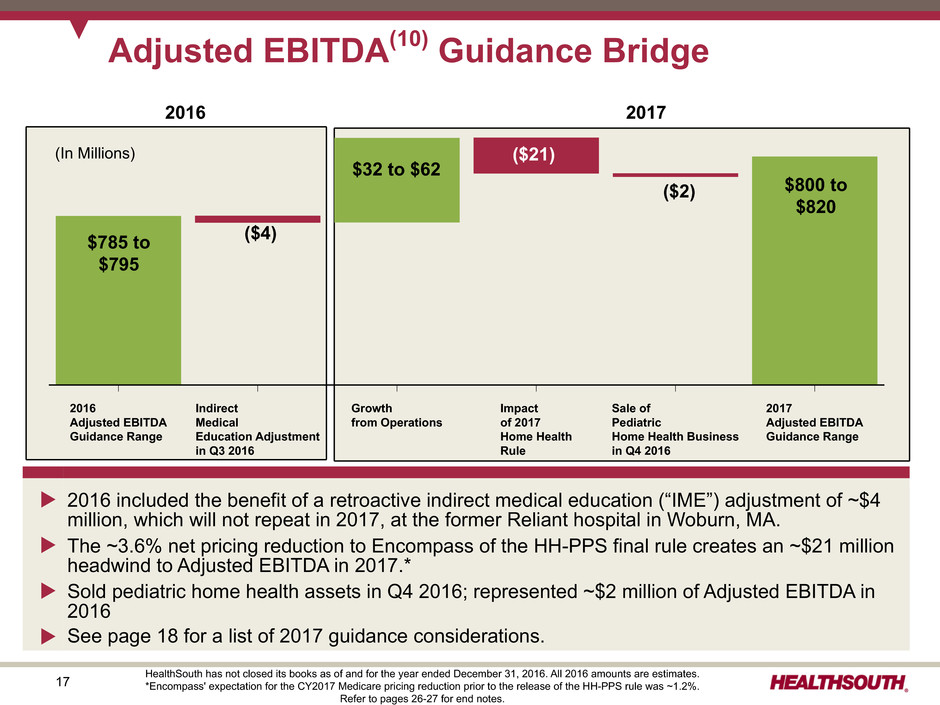
17 Refer to pages xxx-xxx for end notes. Adjusted EBITDA(10) Guidance Bridge Net Operating Revenues $3,xxx million to $3,xxx million Adjusted EBITDA(x) $8xx million to $8xx million Adjusted Earnings per Share from Continuing Operations Attributable to HealthSouth(x) $x.xx to $x.xx 2017 2016 Adjusted EBITDA Guidance Range Indirect Medical Education Adjustment in Q3 2016 Growth from Operations Impact of 2017 Home Health Rule Sale of Pediatric Home Health Business in Q4 2016 2017 Adjusted EBITDA Guidance Range u 2016 included the benefit of a retroactive indirect medical education (“IME”) adjustment of ~$4 million, which will not repeat in 2017, at the former Reliant hospital in Woburn, MA. u The ~3.6% net pricing reduction to Encompass of the HH-PPS final rule creates an ~$21 million headwind to Adjusted EBITDA in 2017.* u Sold pediatric home health assets in Q4 2016; represented ~$2 million of Adjusted EBITDA in 2016 u See page 18 for a list of 2017 guidance considerations. $785 to $795 $800 to $820 $32 to $62 ($4) ($2) ($21)(In Millions) HealthSouth has not closed its books as of and for the year ended December 31, 2016. All 2016 amounts are estimates. *Encompass' expectation for the CY2017 Medicare pricing reduction prior to the release of the HH-PPS rule was ~1.2%. Refer to pages 26-27 for end notes. 2016 2017
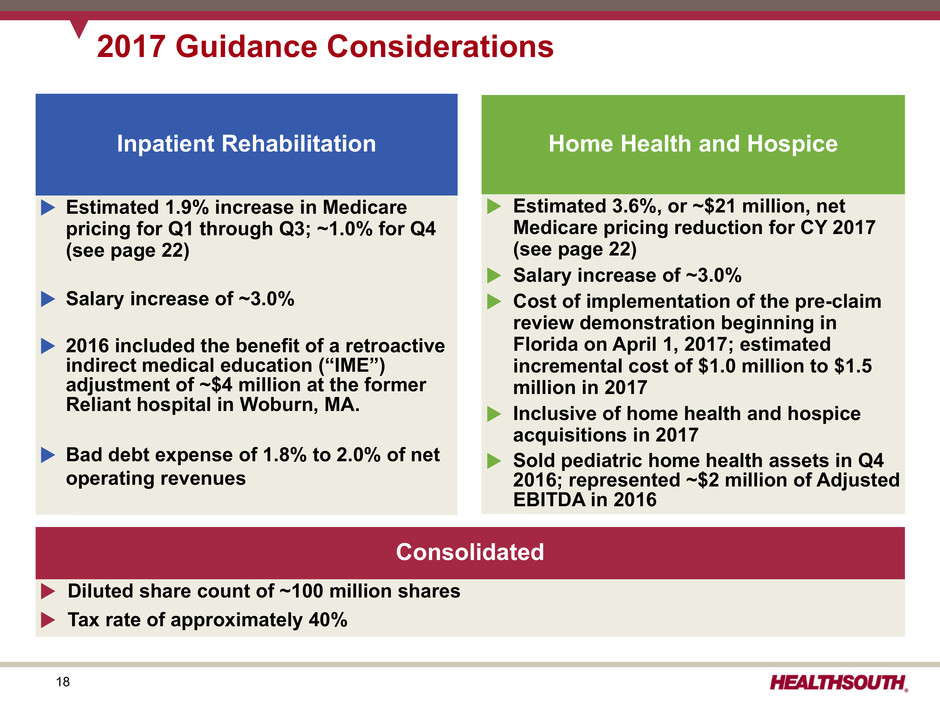
18 2017 Guidance Considerations Inpatient Rehabilitation u Estimated 1.9% increase in Medicare pricing for Q1 through Q3; ~1.0% for Q4 (see page 22) u Salary increase of ~3.0% u 2016 included the benefit of a retroactive indirect medical education (“IME”) adjustment of ~$4 million at the former Reliant hospital in Woburn, MA. u Bad debt expense of 1.8% to 2.0% of net operating revenues Home Health and Hospice u Estimated 3.6%, or ~$21 million, net Medicare pricing reduction for CY 2017 (see page 22) u Salary increase of ~3.0% u Cost of implementation of the pre-claim review demonstration beginning in Florida on April 1, 2017; estimated incremental cost of $1.0 million to $1.5 million in 2017 u Inclusive of home health and hospice acquisitions in 2017 u Sold pediatric home health assets in Q4 2016; represented ~$2 million of Adjusted EBITDA in 2016 Consolidated u Diluted share count of ~100 million shares u Tax rate of approximately 40%
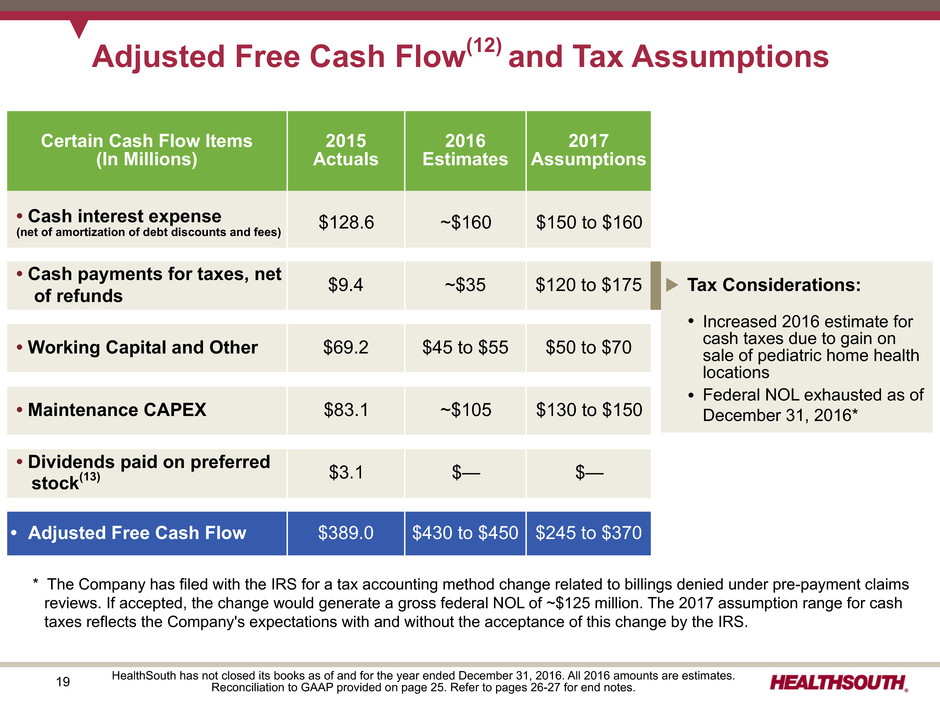
19 Adjusted Free Cash Flow(12) and Tax Assumptions HealthSouth has not closed its books as of and for the year ended December 31, 2016. All 2016 amounts are estimates. Reconciliation to GAAP provided on page 25. Refer to pages 26-27 for end notes. Certain Cash Flow Items (In Millions) 2015 Actuals 2016 Estimates 2017 Assumptions • Cash interest expense (net of amortization of debt discounts and fees) $128.6 ~$160 $150 to $160 • Cash payments for taxes, net of refunds $9.4 ~$35 $120 to $175 • Working Capital and Other $69.2 $45 to $55 $50 to $70 • Maintenance CAPEX $83.1 ~$105 $130 to $150 • Dividends paid on preferred stock(13) $3.1 $— $— • Adjusted Free Cash Flow $389.0 $430 to $450 $245 to $370 u Tax Considerations: Ÿ Increased 2016 estimate for cash taxes due to gain on sale of pediatric home health locations Ÿ Federal NOL exhausted as of December 31, 2016* * The Company has filed with the IRS for a tax accounting method change related to billings denied under pre-payment claims reviews. If accepted, the change would generate a gross federal NOL of ~$125 million. The 2017 assumption range for cash taxes reflects the Company's expectations with and without the acceptance of this change by the IRS.

20 HealthSouth has not closed its books as of and for the year ended December 31, 2016. All 2016 amounts are estimates.Refer to pages 26-27 for end notes. Free Cash Flow Priorities (In Millions) 2015 2016 2017 Actuals Estimates Assumptions IRF bed expansions $20.8 ~$20 $30 to $40 New IRF’s - De novos 47.8 ~75 85 to 105 - Acquisitions 786.2 — TBD - Replacement hospitals — ~10 10 to 20 New home health and hospice acquisitions 200.2 ~50 50 to 100 $1,055.0 ~$155 $175 to $265, excluding IRF acquisitions 2015 2016 2017 Actuals Estimates Assumptions Debt (borrowings) redemptions, net(14) $(1,060.3) ~$160 $TBD Cash dividends on common stock(15) 77.2 ~84 ~$87 Common stock repurchases 45.3 ~64 TBD $(937.8) ~$308 $TBD Shareholder Distributions Growth in Core Business Debt Reduction Highest Priorit y Redeemed remaining outstanding principal of $176 million of 2022 Notes in 2016 ~$96 million authorization remaining as of December 31, 2016 Quarterly cash dividend currently set at $0.24 per common share
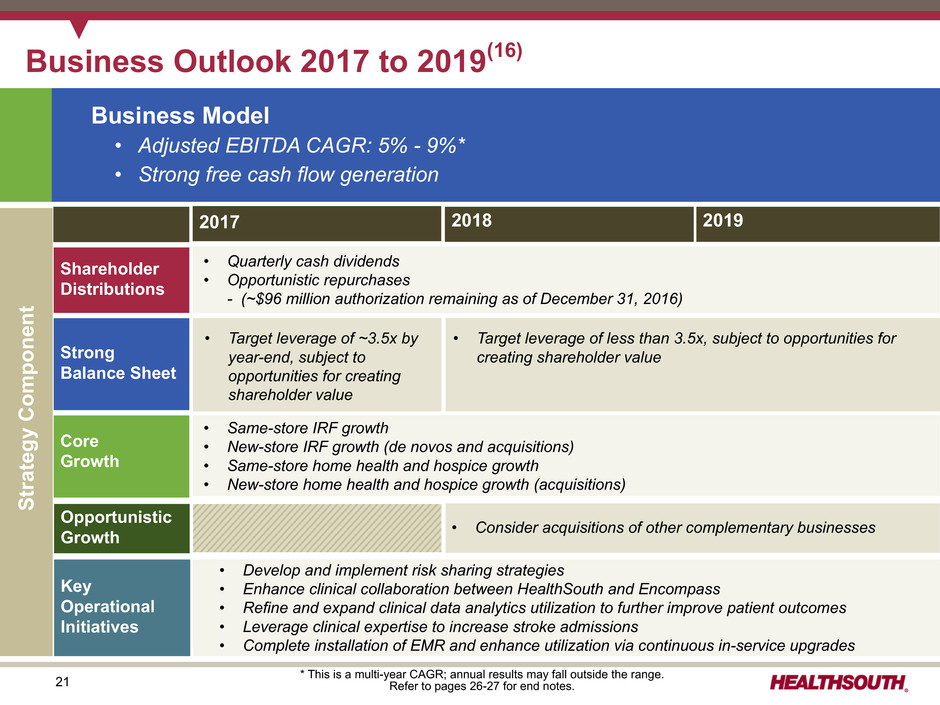
21 • Same-store IRF growth • New-store IRF growth (de novos and acquisitions) • Same-store home health and hospice growth • New-store home health and hospice growth (acquisitions) Core Growth Strong Balance Sheet Key Operational Initiatives Shareholder Distributions Opportunistic Growth Business Outlook 2017 to 2019(16) 2017 2018 2019 Business Model • Adjusted EBITDA CAGR: 5% - 9%* • Strong free cash flow generation • Quarterly cash dividends • Opportunistic repurchases - (~$96 million authorization remaining as of December 31, 2016) • Develop and implement risk sharing strategies • Enhance clinical collaboration between HealthSouth and Encompass • Refine and expand clinical data analytics utilization to further improve patient outcomes • Leverage clinical expertise to increase stroke admissions • Complete installation of EMR and enhance utilization via continuous in-service upgrades • Target leverage of ~3.5x by year-end, subject to opportunities for creating shareholder value Strategy Componen t * This is a multi-year CAGR; annual results may fall outside the range. Refer to pages 26-27 for end notes. • Consider acquisitions of other complementary businesses • Target leverage of less than 3.5x, subject to opportunities for creating shareholder value
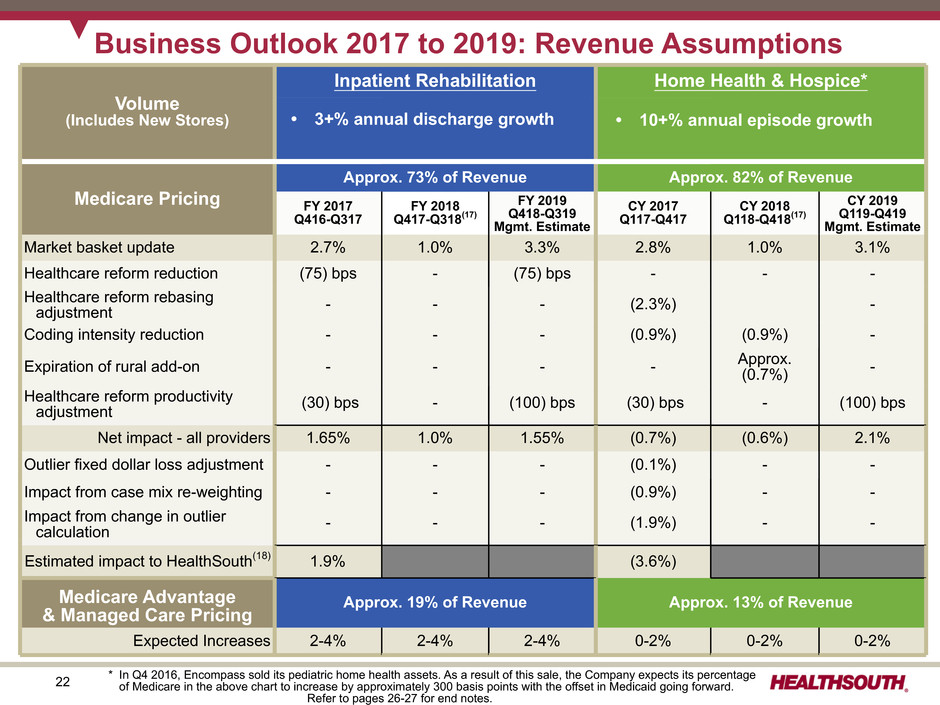
22 • 10% to15% annual episode growth • Includes $35-$40 million per annum in agency acquisitions Volume (Includes New Stores) Inpatient Rehabilitation Home Health & Hospice* Medicare Pricing Approx. 73% of Revenue Approx. 82% of Revenue FY 2017 Q416-Q317 FY 2018 Q417-Q318(17) FY 2019 Q418-Q319 Mgmt. Estimate CY 2017 Q117-Q417 CY 2018 Q118-Q418(17) CY 2019 Q119-Q419 Mgmt. Estimate Market basket update 2.7% 1.0% 3.3% 2.8% 1.0% 3.1% Healthcare reform reduction (75) bps - (75) bps - - - Healthcare reform rebasing adjustment - - - (2.3%) - Coding intensity reduction - - - (0.9%) (0.9%) - Expiration of rural add-on - - - - Approx.(0.7%) - Healthcare reform productivity adjustment (30) bps - (100) bps (30) bps - (100) bps Net impact - all providers 1.65% 1.0% 1.55% (0.7%) (0.6%) 2.1% Outlier fixed dollar loss adjustment - - - (0.1%) - - Impact from case mix re-weighting - - - (0.9%) - - Impact from change in outlier calculation - - - (1.9%) - - Estimated impact to HealthSouth(18) 1.9% (3.6%) Medicare Advantage & Managed Care Pricing Approx. 19% of Revenue Approx. 13% of Revenue Expected Increases 2-4% 2-4% 2-4% 0-2% 0-2% 0-2% Business Outlook 2017 to 2019: Revenue Assumptions • 3+% annual discharge growth • 10+% annual episode growth * In Q4 2016, Encompass sold its pediatric home health assets. As a result of this sale, the Company expects its percentage of Medicare in the above chart to increase by approximately 300 basis points with the offset in Medicaid going forward. Refer to pages 26-27 for end notes.

23 Inpatient Rehabilitation Home Health and Hospice Business Outlook 2017 to 2019: Labor and Other Expense Assumptions Salaries & Benefits ~70% Hospital Expenses ~30% Salaries and Benefits 2017 2018 2019 Salary increases 2.75-3.25% 2.75-3.25% 2.75-3.25% Benefit costs increases 5-10% 5-10% 5-10% Hospital Expenses • Other operating expenses and supply costs tracking with inflation Salaries & Benefits ~85% Other Expenses ~15% Home Health Expenses • Other operating expenses and supply costs tracking with inflation Percent of Salaries & Benefits Salaries ~ 90% Benefits ~10%
24 Appendix

25 Reconciliation of Net Cash Provided by Operating Activities to Adjusted Free Cash Flow(12) Full Year ($millions) 2015 Net cash provided by operating activities $ 484.8 Impact of discontinued operations 0.7 Net cash provided by operating activities of continuing operations 485.5 Capital expenditures for maintenance (83.1) Dividends paid on convertible perpetual preferred stock(13) (3.1) Distributions paid to noncontrolling interests of consolidated affiliates (54.4) Items non-indicative of ongoing operations: Cash paid for professional fees - accounting, tax, and legal 4.1 Transaction costs and related assumed liabilities 28.3 Net premium on bond issuance/repayment 4.0 Cash paid for government, class action, and related settlements 7.7 Adjusted free cash flow $ 389.0 Cash dividends on common stock $ 77.2 Refer to pages 26-27 for end notes.
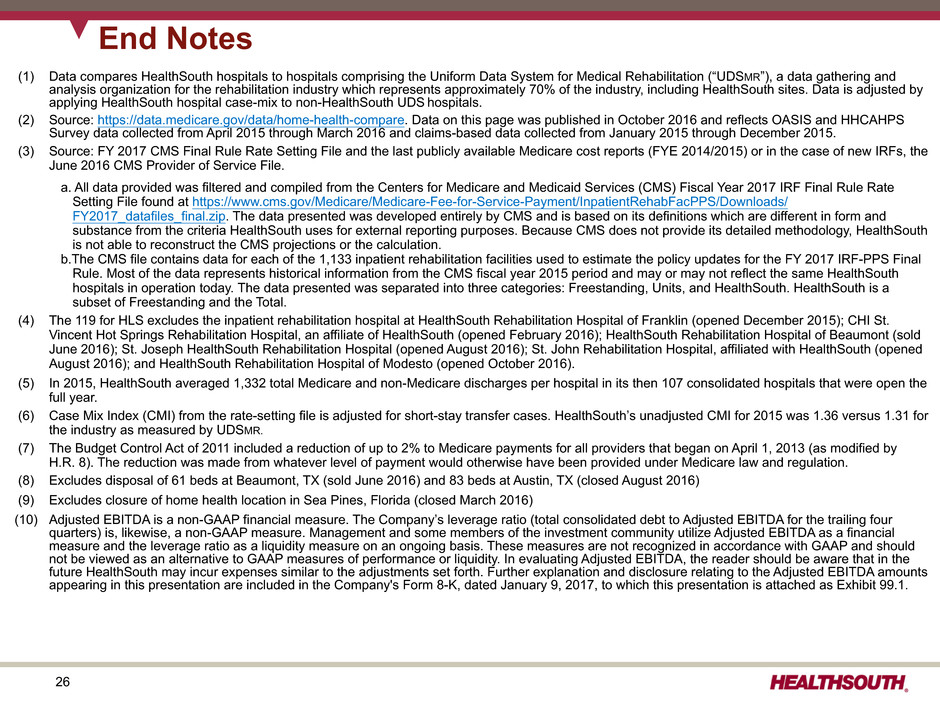
26 (1) Data compares HealthSouth hospitals to hospitals comprising the Uniform Data System for Medical Rehabilitation (“UDSMR”), a data gathering and analysis organization for the rehabilitation industry which represents approximately 70% of the industry, including HealthSouth sites. Data is adjusted by applying HealthSouth hospital case-mix to non-HealthSouth UDS hospitals. (2) Source: https://data.medicare.gov/data/home-health-compare. Data on this page was published in October 2016 and reflects OASIS and HHCAHPS Survey data collected from April 2015 through March 2016 and claims-based data collected from January 2015 through December 2015. (3) Source: FY 2017 CMS Final Rule Rate Setting File and the last publicly available Medicare cost reports (FYE 2014/2015) or in the case of new IRFs, the June 2016 CMS Provider of Service File. a. All data provided was filtered and compiled from the Centers for Medicare and Medicaid Services (CMS) Fiscal Year 2017 IRF Final Rule Rate Setting File found at https://www.cms.gov/Medicare/Medicare-Fee-for-Service-Payment/InpatientRehabFacPPS/Downloads/ FY2017_datafiles_final.zip. The data presented was developed entirely by CMS and is based on its definitions which are different in form and substance from the criteria HealthSouth uses for external reporting purposes. Because CMS does not provide its detailed methodology, HealthSouth is not able to reconstruct the CMS projections or the calculation. b.The CMS file contains data for each of the 1,133 inpatient rehabilitation facilities used to estimate the policy updates for the FY 2017 IRF-PPS Final Rule. Most of the data represents historical information from the CMS fiscal year 2015 period and may or may not reflect the same HealthSouth hospitals in operation today. The data presented was separated into three categories: Freestanding, Units, and HealthSouth. HealthSouth is a subset of Freestanding and the Total. (4) The 119 for HLS excludes the inpatient rehabilitation hospital at HealthSouth Rehabilitation Hospital of Franklin (opened December 2015); CHI St. Vincent Hot Springs Rehabilitation Hospital, an affiliate of HealthSouth (opened February 2016); HealthSouth Rehabilitation Hospital of Beaumont (sold June 2016); St. Joseph HealthSouth Rehabilitation Hospital (opened August 2016); St. John Rehabilitation Hospital, affiliated with HealthSouth (opened August 2016); and HealthSouth Rehabilitation Hospital of Modesto (opened October 2016). (5) In 2015, HealthSouth averaged 1,332 total Medicare and non-Medicare discharges per hospital in its then 107 consolidated hospitals that were open the full year. (6) Case Mix Index (CMI) from the rate-setting file is adjusted for short-stay transfer cases. HealthSouth’s unadjusted CMI for 2015 was 1.36 versus 1.31 for the industry as measured by UDSMR. (7) The Budget Control Act of 2011 included a reduction of up to 2% to Medicare payments for all providers that began on April 1, 2013 (as modified by H.R. 8). The reduction was made from whatever level of payment would otherwise have been provided under Medicare law and regulation. (8) Excludes disposal of 61 beds at Beaumont, TX (sold June 2016) and 83 beds at Austin, TX (closed August 2016) (9) Excludes closure of home health location in Sea Pines, Florida (closed March 2016) (10) Adjusted EBITDA is a non-GAAP financial measure. The Company’s leverage ratio (total consolidated debt to Adjusted EBITDA for the trailing four quarters) is, likewise, a non-GAAP measure. Management and some members of the investment community utilize Adjusted EBITDA as a financial measure and the leverage ratio as a liquidity measure on an ongoing basis. These measures are not recognized in accordance with GAAP and should not be viewed as an alternative to GAAP measures of performance or liquidity. In evaluating Adjusted EBITDA, the reader should be aware that in the future HealthSouth may incur expenses similar to the adjustments set forth. Further explanation and disclosure relating to the Adjusted EBITDA amounts appearing in this presentation are included in the Company's Form 8-K, dated January 9, 2017, to which this presentation is attached as Exhibit 99.1. End Notes
27 (11) HealthSouth provides adjusted earnings per share from continuing operations attributable to HealthSouth (“adjusted EPS”), which is a non-GAAP measure. The Company believes the presentation of adjusted EPS provides useful additional information to investors because it provides better comparability of ongoing performance to prior periods given that it excludes the impact of government, class action, and related settlements; professional fees - accounting, tax, and legal; mark-to-market adjustments for stock appreciation rights; gains or losses related to hedging instruments; loss on early extinguishment of debt; adjustments to its income tax provision (such as valuation allowance adjustments and settlements of income tax claims); items related to corporate and facility restructurings; and certain other items deemed to be non-indicative of ongoing operations. It is reasonable to expect that one or more of these excluded items will occur in future periods, but the amounts recognized can vary significantly from period to period and may not directly relate to the Company's ongoing operations. Accordingly, they can complicate comparisons of the Company's results of operations across periods and comparisons of the Company's results to those of other healthcare companies. Adjusted EPS should not be considered as a measure of financial performance under generally accepted accounting principles in the United States as the items excluded from it are significant components in understanding and assessing financial performance. Because adjusted earnings per share is not a measurement determined in accordance with GAAP and is thus susceptible to varying calculations, it may not be comparative to other similarly titled measures of other companies. (12) Definition of adjusted free cash flow, which is a non-GAAP measure, is net cash provided by operating activities of continuing operations minus capital expenditures for maintenance, dividends paid on preferred stock, distributions to noncontrolling interests, and certain other items deemed to be non-indicative of ongoing cash flows. Common stock dividends are not included in the calculation of adjusted free cash flow. (13) In March 2006, the Company completed the sale of 400,000 shares of its 6.5% Series A Convertible Perpetual Preferred Stock. In Q4 2013, the Company exchanged $320 million of newly issued 2.0% Convertible Senior Subordinated Notes due 2043 for 257,110 shares of its outstanding preferred stock. In April 2015, the Company exercised its rights to force conversion of all outstanding shares of its preferred stock. On the conversion date, each outstanding share of preferred stock was converted into 33.9905 shares of common stock, resulting in the issuance of 3,271,415 shares of common stock. (14) 2015 amounts for debt borrowings included ~$208 million related to the Reliant hospitals' capital lease obligations. (15) On July 16, 2015, the board of directors approved a $0.02 per share, or 9.5%, increase to the quarterly cash dividend on the Company’s common stock, bringing the quarterly cash dividend to $0.23 per common share. On July 21, 2016, the board of directors approved a $0.01 per share, or 4.3%, increase to the quarterly cash dividend on the Company’s common stock, bringing the quarterly cash dividend to $0.24 per common share. (16) If legislation affecting Medicare is passed, HealthSouth will evaluate its effect on its business model. (17) The Medicare Access and CHIP Reauthorization Act of 2015 mandated a market basket update of +1.0% in 2018 for post-acute providers including rehabilitation hospitals as well as home health and hospice agencies. (18) The Company estimates the expected impact of each rule utilizing, among other things, the acuity of its patients over the 8-month (home health segment) to 12-month (inpatient rehabilitation segment) period prior to each rule’s release and incorporates other adjustments included in each rule. These estimates are prior to the impact of sequestration. End Notes


