
2 The information contained in this presentation includes certain estimates, projections and other forward-looking information that reflect HealthSouth’s current outlook, views and plans with respect to future events, including legislative and regulatory developments, strategy, capital expenditures, acquisition and other development activities, cyber security, dividend strategies, repurchases of securities, effective tax rates, financial performance, financial assumptions, business model, balance sheet and cash flow plans, and shareholder value-enhancing transactions. These estimates, projections and other forward-looking information are based on assumptions HealthSouth believes, as of the date hereof, are reasonable. Inevitably, there will be differences between such estimates and actual events or results, and those differences may be material. There can be no assurance any estimates, projections or forward-looking information will be realized. All such estimates, projections and forward-looking information speak only as of the date hereof. HealthSouth undertakes no duty to publicly update or revise the information contained herein. You are cautioned not to place undue reliance on the estimates, projections and other forward-looking information in this presentation as they are based on current expectations and general assumptions and are subject to various risks, uncertainties and other factors, including those set forth in the Form 10-K for the year ended December 31, 2016, the form 10-Q for the quarter ended March 31, 2017, when filed, and in other documents HealthSouth previously filed with the SEC, many of which are beyond HealthSouth’s control, that may cause actual events or results to differ materially from the views, beliefs and estimates expressed herein. Note Regarding Presentation of Non-GAAP Financial Measures The following presentation includes certain “non-GAAP financial measures” as defined in Regulation G under the Securities Exchange Act of 1934, including Adjusted EBITDA, leverage ratios, adjusted earnings per share, and adjusted free cash flow. Schedules are attached that reconcile the non-GAAP financial measures included in the following presentation to the most directly comparable financial measures calculated and presented in accordance with Generally Accepted Accounting Principles in the United States. HealthSouth’s Form 8-K, dated April 27, 2017, to which the following supplemental information is attached as Exhibit 99.2, provides further explanation and disclosure regarding HealthSouth’s use of non-GAAP financial measures and should be read in conjunction with this supplemental information. Forward-Looking Statements

3 Table of Contents Q1 2017 Summary................................................................................................................................................. 4-5 IRF-Home Health Clinical Collaboration ................................................................................................................ 6 Inpatient Rehabilitation Segment ........................................................................................................................... 7-8 Home Health & Hospice Segment ......................................................................................................................... 9-10 Earnings per Share ................................................................................................................................................ 11-12 Adjusted Free Cash Flow....................................................................................................................................... 13 Guidance................................................................................................................................................................ 14-15 Adjusted Free Cash Flow and Tax Assumptions.................................................................................................... 16 Free Cash Flow Priorities....................................................................................................................................... 17 Appendix Map of Locations.................................................................................................................................................... 19 Pre-Payment Claims Denials - Inpatient Rehabilitation Segment.......................................................................... 20 Expansion Activity .................................................................................................................................................. 21 Business Outlook ................................................................................................................................................... 22-24 Debt Schedule and Maturity Profile ....................................................................................................................... 25-26 New-Store/Same-Store IRF Growth ...................................................................................................................... 27 Payment Sources (Percent of Revenues).............................................................................................................. 28 Inpatient Rehabilitation Operational and Labor Metrics ......................................................................................... 29 Home Health & Hospice Operational Metrics ........................................................................................................ 30 Share Information .................................................................................................................................................. 31 Segment Operating Results................................................................................................................................... 32-33 Reconciliations to GAAP........................................................................................................................................ 34-40 End Notes .............................................................................................................................................................. 41-43
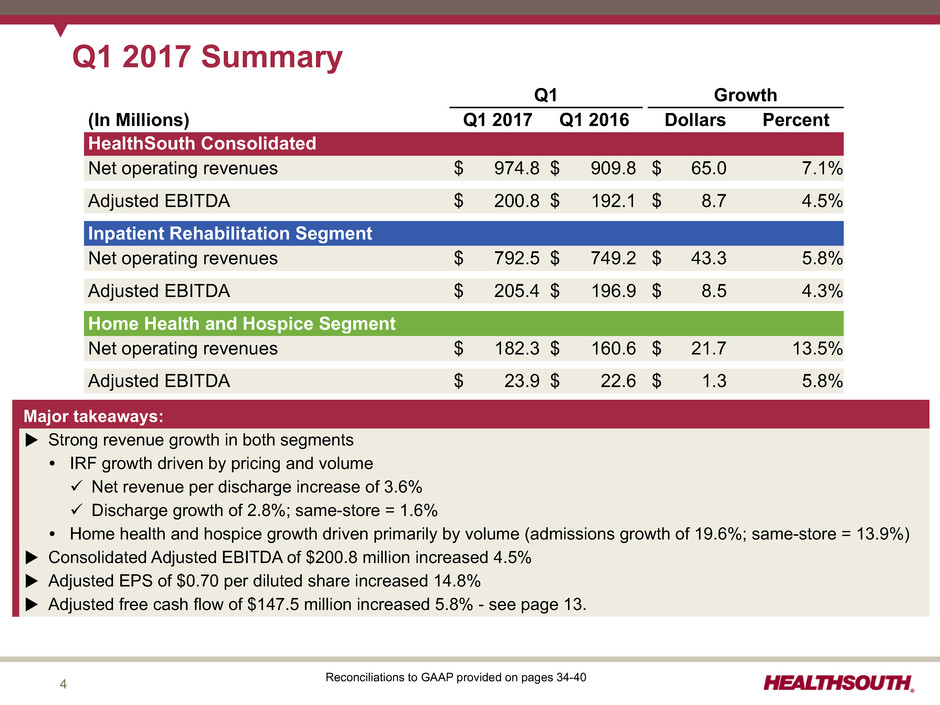
4 Q1 2017 Summary Q1 Growth (In Millions) Q1 2017 Q1 2016 Dollars Percent HealthSouth Consolidated Net operating revenues $ 974.8 $ 909.8 $ 65.0 7.1% Adjusted EBITDA $ 200.8 $ 192.1 $ 8.7 4.5% Inpatient Rehabilitation Segment Net operating revenues $ 792.5 $ 749.2 $ 43.3 5.8% Adjusted EBITDA $ 205.4 $ 196.9 $ 8.5 4.3% Home Health and Hospice Segment Net operating revenues $ 182.3 $ 160.6 $ 21.7 13.5% Adjusted EBITDA $ 23.9 $ 22.6 $ 1.3 5.8% Major takeaways: u Strong revenue growth in both segments Ÿ IRF growth driven by pricing and volume ü Net revenue per discharge increase of 3.6% ü Discharge growth of 2.8%; same-store = 1.6% Ÿ Home health and hospice growth driven primarily by volume (admissions growth of 19.6%; same-store = 13.9%) u Consolidated Adjusted EBITDA of $200.8 million increased 4.5% u Adjusted EPS of $0.70 per diluted share increased 14.8% u Adjusted free cash flow of $147.5 million increased 5.8% - see page 13. Reconciliations to GAAP provided on pages 34-40
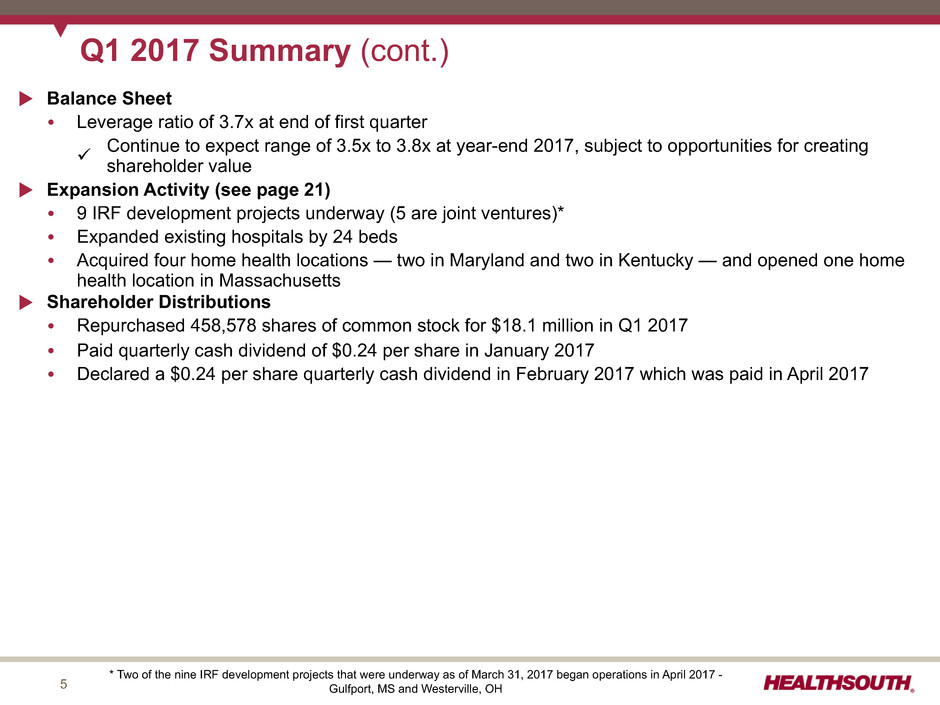
5 Q1 2017 Summary (cont.) u Balance Sheet Ÿ Leverage ratio of 3.7x at end of first quarter ü Continue to expect range of 3.5x to 3.8x at year-end 2017, subject to opportunities for creatingshareholder value u Expansion Activity (see page 21) Ÿ 9 IRF development projects underway (5 are joint ventures)* Ÿ Expanded existing hospitals by 24 beds Ÿ Acquired four home health locations — two in Maryland and two in Kentucky — and opened one home health location in Massachusetts u Shareholder Distributions Ÿ Repurchased 458,578 shares of common stock for $18.1 million in Q1 2017 Ÿ Paid quarterly cash dividend of $0.24 per share in January 2017 Ÿ Declared a $0.24 per share quarterly cash dividend in February 2017 which was paid in April 2017 * Two of the nine IRF development projects that were underway as of March 31, 2017 began operations in April 2017 - Gulfport, MS and Westerville, OH

6 IRF-Home Health Clinical Collaboration (All Payors) Q1 2016 Q1 2017 10,297 10,603 3,007 4,308 22.6% Collaboration Rate 28.9% Collaboration Rate HealthSouth IRF Discharges to Non- Encompass Home Health HealthSouth IRF Discharges to Encompass Home Health Clinical collaboration rate with HealthSouth IRFs increased by 630 basis points over Q1 2016 u Overlap markets are defined as a HealthSouth IRF located within a 30- mile radius of an Encompass location u As of March 31, 2017, 61% of HealthSouth’s IRFs were located within overlap markets. u The Company’s clinical collaboration rate goal for overlap markets is 35% to 40% within the next three years. Overlap Markets
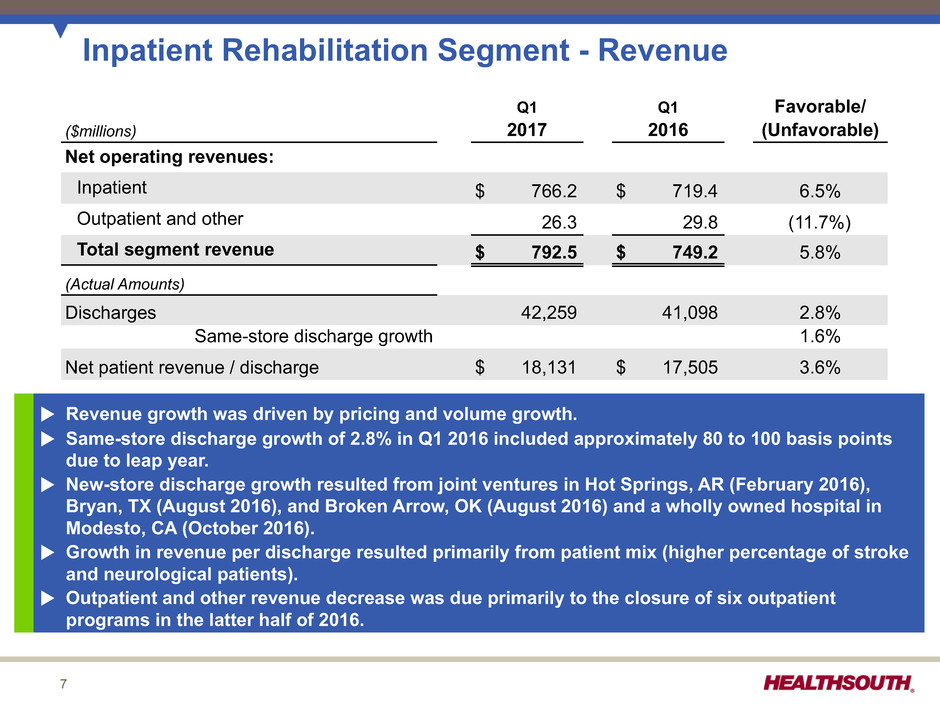
7 Inpatient Rehabilitation Segment - Revenue Q1 Q1 Favorable/ ($millions) 2017 2016 (Unfavorable) Net operating revenues: Inpatient $ 766.2 $ 719.4 6.5% Outpatient and other 26.3 29.8 (11.7%) Total segment revenue $ 792.5 $ 749.2 5.8% (Actual Amounts) Discharges 42,259 41,098 2.8% Same-store discharge growth 1.6% Net patient revenue / discharge $ 18,131 $ 17,505 3.6% u Revenue growth was driven by pricing and volume growth. u Same-store discharge growth of 2.8% in Q1 2016 included approximately 80 to 100 basis points due to leap year. u New-store discharge growth resulted from joint ventures in Hot Springs, AR (February 2016), Bryan, TX (August 2016), and Broken Arrow, OK (August 2016) and a wholly owned hospital in Modesto, CA (October 2016). u Growth in revenue per discharge resulted primarily from patient mix (higher percentage of stroke and neurological patients). u Outpatient and other revenue decrease was due primarily to the closure of six outpatient programs in the latter half of 2016.
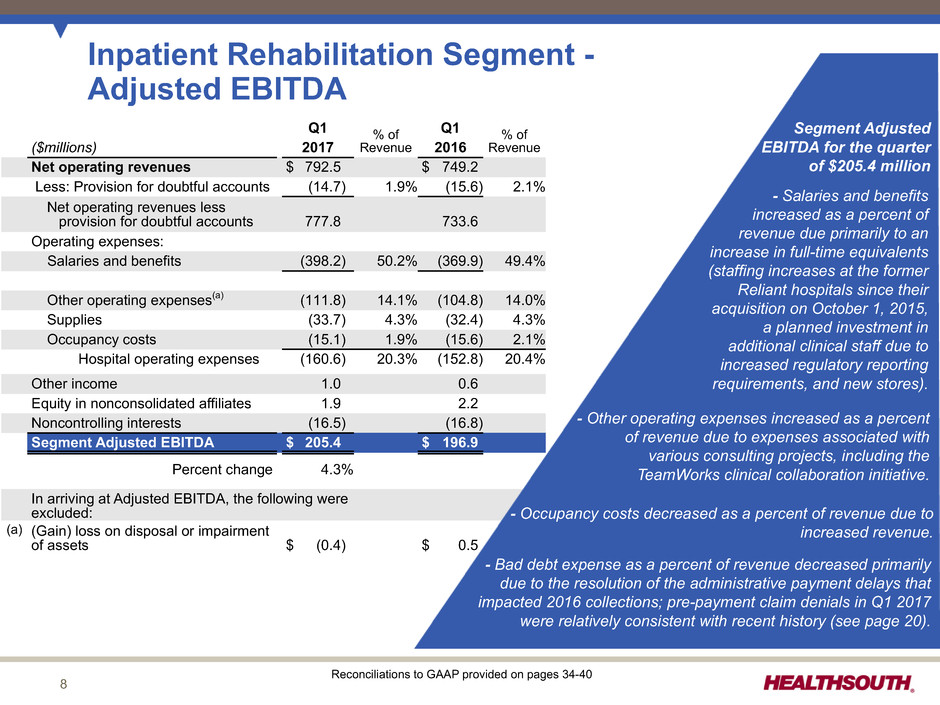
8 Inpatient Rehabilitation Segment - Adjusted EBITDA Q1 % of Revenue Q1 % of Revenue($millions) 2017 2016 Net operating revenues $ 792.5 $ 749.2 Less: Provision for doubtful accounts (14.7) 1.9% (15.6) 2.1% Net operating revenues less provision for doubtful accounts 777.8 733.6 Operating expenses: Salaries and benefits (398.2) 50.2% (369.9) 49.4% Other operating expenses(a) (111.8) 14.1% (104.8) 14.0% Supplies (33.7) 4.3% (32.4) 4.3% Occupancy costs (15.1) 1.9% (15.6) 2.1% Hospital operating expenses (160.6) 20.3% (152.8) 20.4% Other income 1.0 0.6 Equity in nonconsolidated affiliates 1.9 2.2 Noncontrolling interests (16.5) (16.8) Segment Adjusted EBITDA $ 205.4 $ 196.9 Percent change 4.3% In arriving at Adjusted EBITDA, the following were excluded: (a) (Gain) loss on disposal or impairment of assets $ (0.4) $ 0.5 Segment Adjusted EBITDA for the quarter of $205.4 million - Salaries and benefits increased as a percent of revenue due primarily to an increase in full-time equivalents (staffing increases at the former Reliant hospitals since their acquisition on October 1, 2015, a planned investment in additional clinical staff due to increased regulatory reporting requirements, and new stores). - Other operating expenses increased as a percent of revenue due to expenses associated with various consulting projects, including the TeamWorks clinical collaboration initiative. Reconciliations to GAAP provided on pages 34-40 - Occupancy costs decreased as a percent of revenue due to increased revenue. - Bad debt expense as a percent of revenue decreased primarily due to the resolution of the administrative payment delays that impacted 2016 collections; pre-payment claim denials in Q1 2017 were relatively consistent with recent history (see page 20).

9 Home Health and Hospice Segment - Revenue Q1 Q1 Favorable/ ($millions) 2017 2016 (Unfavorable) Net operating revenues: Home health revenue $ 165.3 $ 150.9 9.5 % Hospice revenue 17.0 9.7 75.3 % Total segment revenue $ 182.3 $ 160.6 13.5 % (Actual Amounts) Admissions 30,810 25,763 19.6 % Same-store admissions growth 13.9 % Episodes 49,260 43,844 12.4 % Same-store episode growth 8.4 % Revenue per episode $ 2,991 $ 3,035 (1.4)% u Revenue growth was driven by strong same-store and new-store volume growth. Ÿ Approximately 290 basis points of same-store admission growth resulted from clinical collaboration with HealthSouth’s IRFs. u Decrease in revenue per episode resulted from Medicare reimbursement rate cuts partially offset by changes in patient mix (including a higher percentage of therapy patients).
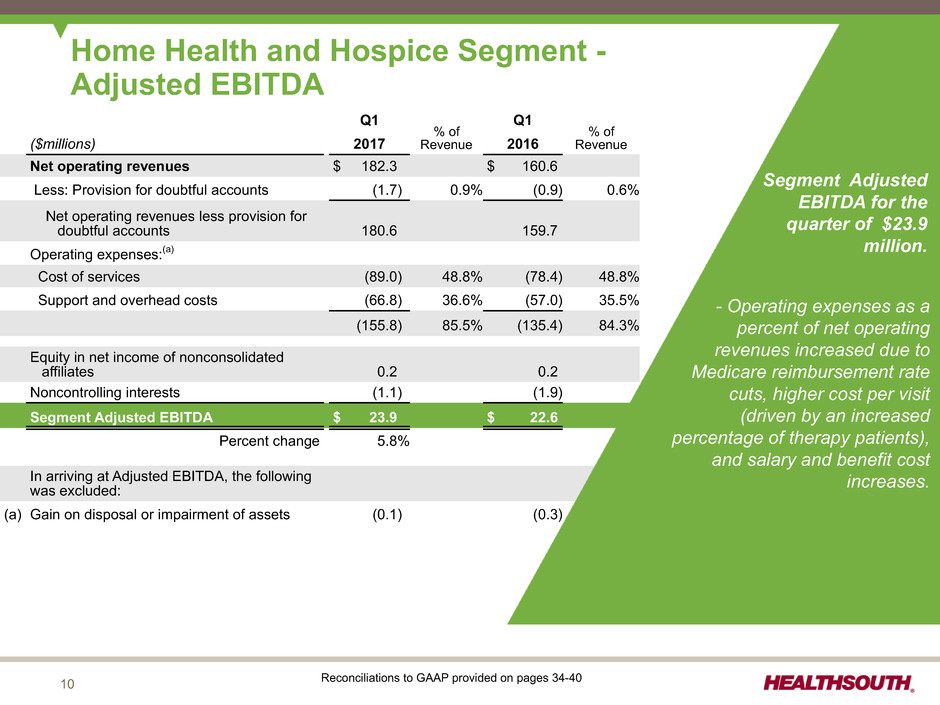
10 Q1 % of Revenue Q1 % of Revenue($millions) 2017 2016 Net operating revenues $ 182.3 $ 160.6 Less: Provision for doubtful accounts (1.7) 0.9% (0.9) 0.6% Net operating revenues less provision for doubtful accounts 180.6 159.7 Operating expenses:(a) Cost of services (89.0) 48.8% (78.4) 48.8% Support and overhead costs (66.8) 36.6% (57.0) 35.5% (155.8) 85.5% (135.4) 84.3% Equity in net income of nonconsolidated affiliates 0.2 0.2 Noncontrolling interests (1.1) (1.9) Segment Adjusted EBITDA $ 23.9 $ 22.6 Percent change 5.8% In arriving at Adjusted EBITDA, the following was excluded: (a) Gain on disposal or impairment of assets (0.1) (0.3) Home Health and Hospice Segment - Adjusted EBITDA Segment Adjusted EBITDA for the quarter of $23.9 million. - Operating expenses as a percent of net operating revenues increased due to Medicare reimbursement rate cuts, higher cost per visit (driven by an increased percentage of therapy patients), and salary and benefit cost increases. * Reconciliation to GAAP provided on pages 29-31 Reconciliations to GAAP provided on pages 34-40

11 Earnings per Share - As Reported Q1 (In Millions, Except Per Share Data) 2017 2016 Inpatient rehabilitation segment Adjusted EBITDA $ 205.4 $ 196.9 Home health and hospice segment Adjusted EBITDA 23.9 22.6 General and administrative expenses (28.5) (27.4) Consolidated Adjusted EBITDA 200.8 192.1 Interest expense and amortization of debt discounts and fees (41.3) (44.6) Depreciation and amortization (45.2) (42.4) Stock-based compensation expense (8.0) (4.5) Noncash gain (loss) on disposal or impairment of assets 0.5 (0.2) 106.8 100.4 Certain items non-indicative of ongoing operations: Loss on early extinguishment of debt — (2.4) Professional fees — accounting, tax, and legal — (0.2) Pre-tax income 106.8 97.8 Income tax expense(1) (39.7) (39.7) Income from continuing operations* $ 67.1 $ 58.1 Interest and amortization on 2.0% Convertible Senior Subordinated Notes (net of tax)(2) 2.5 2.4 Diluted shares (see page 31) 99.0 99.4 Diluted earnings per share*(2) $ 0.70 $ 0.61 u The increase in EPS for Q1 2017 resulted primarily from increased Adjusted EBITDA. Ÿ Interest expense was lower due to the redemptions of the 7.75% Senior Notes due 2022 in 2016. Ÿ Depreciation and amortization was higher due to acquisitions and capital investments. Ÿ Stock-based compensation expense was higher due to the mark-to-market adjustment for stock appreciation rights(3). Ÿ Lower effective income tax rate resulted from windfall tax benefits(4) from vesting of share-based compensation and certain federal and state income tax settlements. Ÿ Lower share count resulted from stock repurchases in 2016 and the first quarter of 2017. u EPS for Q1 2016 was impacted by the loss on early extinguishment of debt associated with the redemptions of the 7.75% Senior Notes due 2022. * Earnings per share are determined using income from continuing operations attributable to HealthSouth. Refer to pages 41-43 for end notes.

12 Q1 2017 2016 Earnings per share, as reported $ 0.70 $ 0.61 Adjustments, net of tax: Mark-to-market adjustment for stock appreciation rights(3) 0.02 (0.01) Income tax adjustments(4) and settlements (0.03) — Loss on early extinguishment of debt — 0.01 Adjusted earnings per share* $ 0.70 $ 0.61 Adjusted Earnings per Share(5) * Adjusted EPS may not sum due to rounding. See complete calculations of adjusted earnings per share on pages 39-40. Refer to pages 41-43 for end notes. Adjusted earnings per share removes from the GAAP earnings per share calculation the impact of items the Company believes are non-indicative of its ongoing operations.

13 Adjusted Free Cash Flow 3 Mos. 2016 (6) Adjusted EBITDA Working Capital and Other Cash Interest Expense Cash Tax Payments, Net of Refunds Maintenance Capital Expenditures Adjusted Free Cash Flow 3 Mos. 2017 $139.4 $8.7 ($0.4) $3.3 $1.0 ($4.5) $147.5 2017 Adjusted Free Cash Flow(6) Reconciliations to GAAP provided on pages 34-40 Refer to pages 41-43 for end notes. u Adjusted free cash flow in Q1 2017 grew 5.8% primarily as a result of increased Adjusted EBITDA. Ÿ Increased maintenance capital expenditures resulted from growth in the IRF segment, an enhanced hospital maintenance program, and refurbishments at larger hospitals. Ÿ Cash interest expense decreased due to the redemptions of the 7.75% Senior Notes due 2022 in 2016. Ÿ Working capital was relatively flat as improved collection of accounts receivable was offset by the timing of payroll-related liabilities.
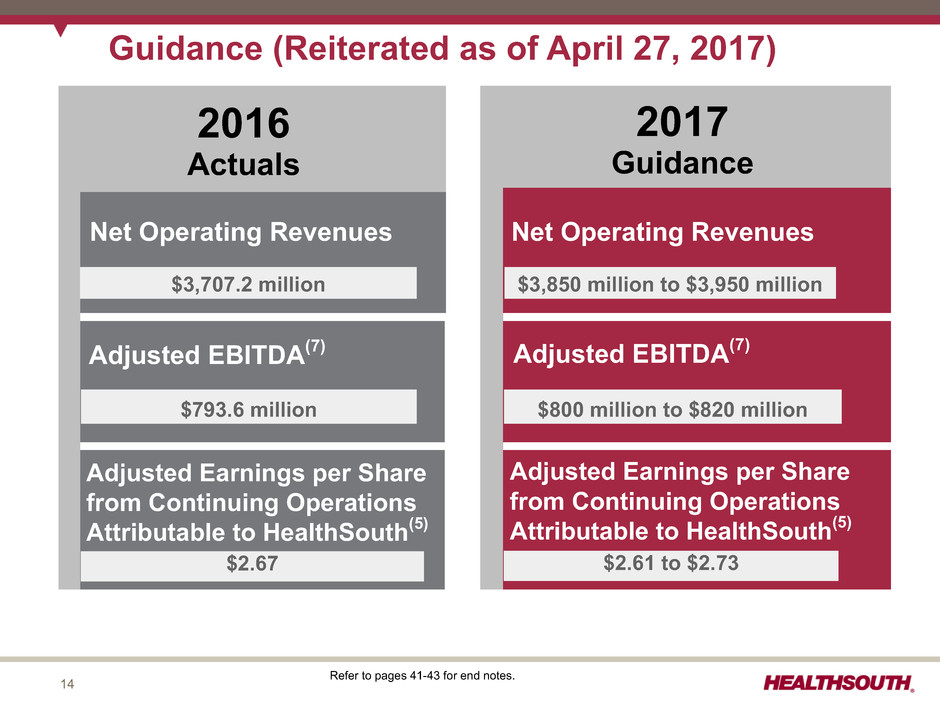
14 Refer to pages 41-43 for end notes. Guidance (Reiterated as of April 27, 2017) Adjusted EBITDA(7) Adjusted Earnings per Share from Continuing Operations Attributable to HealthSouth(5) Net Operating Revenues Net Operating Revenues $3,850 million to $3,950 million Adjusted EBITDA(7) $800 million to $820 million Adjusted Earnings per Share from Continuing Operations Attributable to HealthSouth(5) $2.61 to $2.73 $3,707.2 million $793.6 million $2.67 2017 Guidance 2016 Actuals
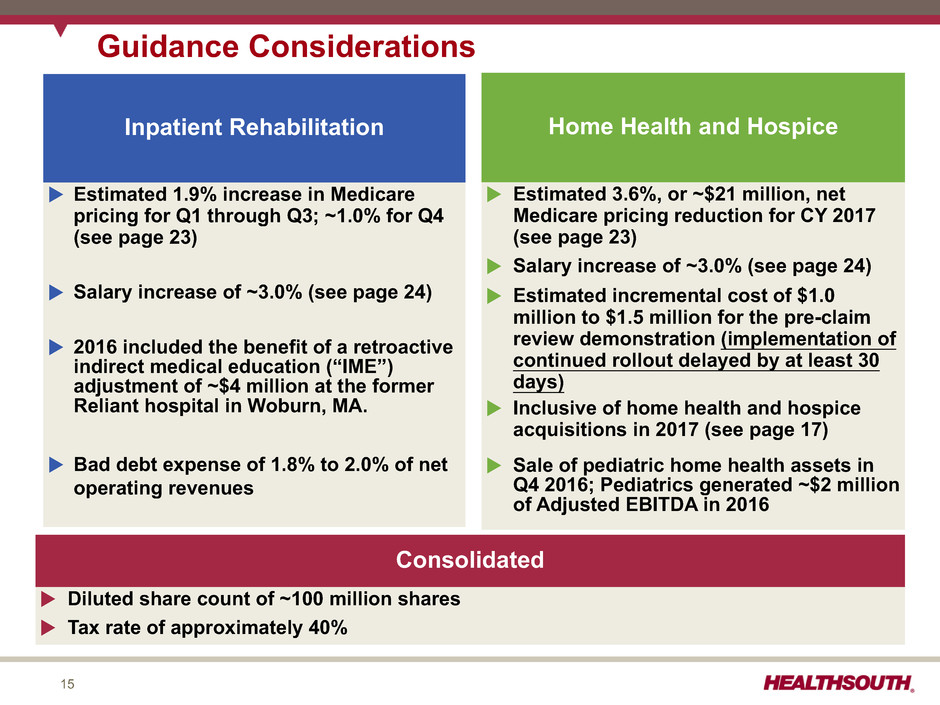
15 Guidance Considerations Inpatient Rehabilitation u Estimated 1.9% increase in Medicare pricing for Q1 through Q3; ~1.0% for Q4 (see page 23) u Salary increase of ~3.0% (see page 24) u 2016 included the benefit of a retroactive indirect medical education (“IME”) adjustment of ~$4 million at the former Reliant hospital in Woburn, MA. u Bad debt expense of 1.8% to 2.0% of net operating revenues Home Health and Hospice u Estimated 3.6%, or ~$21 million, net Medicare pricing reduction for CY 2017 (see page 23) u Salary increase of ~3.0% (see page 24) u Estimated incremental cost of $1.0 million to $1.5 million for the pre-claim review demonstration (implementation of continued rollout delayed by at least 30 days) u Inclusive of home health and hospice acquisitions in 2017 (see page 17) u Sale of pediatric home health assets in Q4 2016; Pediatrics generated ~$2 million of Adjusted EBITDA in 2016 Consolidated u Diluted share count of ~100 million shares u Tax rate of approximately 40%

16 Adjusted Free Cash Flow(6) and Tax Assumptions Certain Cash Flow Items (millions) 3 Months 2017 Actual 2017 Assumptions 2016 Actual • Cash interest expense (net of amortization of debt discounts and fees) $37.8 $150 to $160 $158.4 • Cash payments for taxes, net of refunds $(0.3) $95 to $115 $31.9 • Working Capital and Other $(6.4) $50 to $70 $24.6 • Maintenance CAPEX $22.2 $130 to $150 $104.2 • Adjusted Free Cash Flow $147.5 $305 to $395 $474.5 Reconciliations to GAAP provided on pages 34-40 Refer to pages 41-43 for end notes. u Increased maintenance capital expenditures due to growth in the Company, enhanced hospital maintenance program, and leasehold improvements and furnishings associated with the build-out of the Company’s new home office location (building will be leased) u Increased cash payments for taxes due to exhaustion of federal NOL in Q1 2017 Ÿ In March 2017, the IRS approved the Company’s request for a tax accounting method change related to billings denied under pre-payment claims reviews.(8) ü Replenished gross federal NOL by ~$130 million, which resulted in ~$54 million of additional tax benefits ü Decreased estimate for cash payments for taxes in 2017 from a range of $120 to $175 million to a range of $95 to $115 million (assumed to be paid ratably in Q2 through Q4)
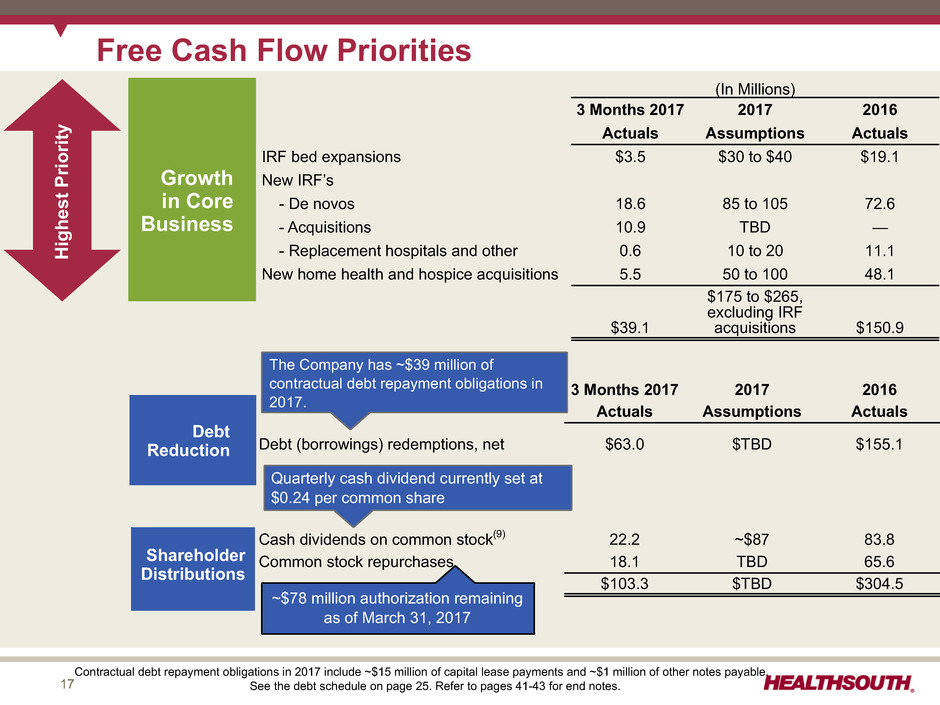
17 Contractual debt repayment obligations in 2017 include ~$15 million of capital lease payments and ~$1 million of other notes payable. See the debt schedule on page 25. Refer to pages 41-43 for end notes. Free Cash Flow Priorities (In Millions) 3 Months 2017 2017 2016 Actuals Assumptions Actuals IRF bed expansions $3.5 $30 to $40 $19.1 New IRF’s - De novos 18.6 85 to 105 72.6 - Acquisitions 10.9 TBD — - Replacement hospitals and other 0.6 10 to 20 11.1 New home health and hospice acquisitions 5.5 50 to 100 48.1 $39.1 $175 to $265, excluding IRF acquisitions $150.9 3 Months 2017 2017 2016 Actuals Assumptions Actuals Debt (borrowings) redemptions, net $63.0 $TBD $155.1 Cash dividends on common stock(9) 22.2 ~$87 83.8 Common stock repurchases 18.1 TBD 65.6 $103.3 $TBD $304.5 Shareholder Distributions Growth in Core Business Debt Reduction Highest Priorit y The Company has ~$39 million of contractual debt repayment obligations in 2017. ~$78 million authorization remaining as of March 31, 2017 Quarterly cash dividend currently set at $0.24 per common share
Appendix
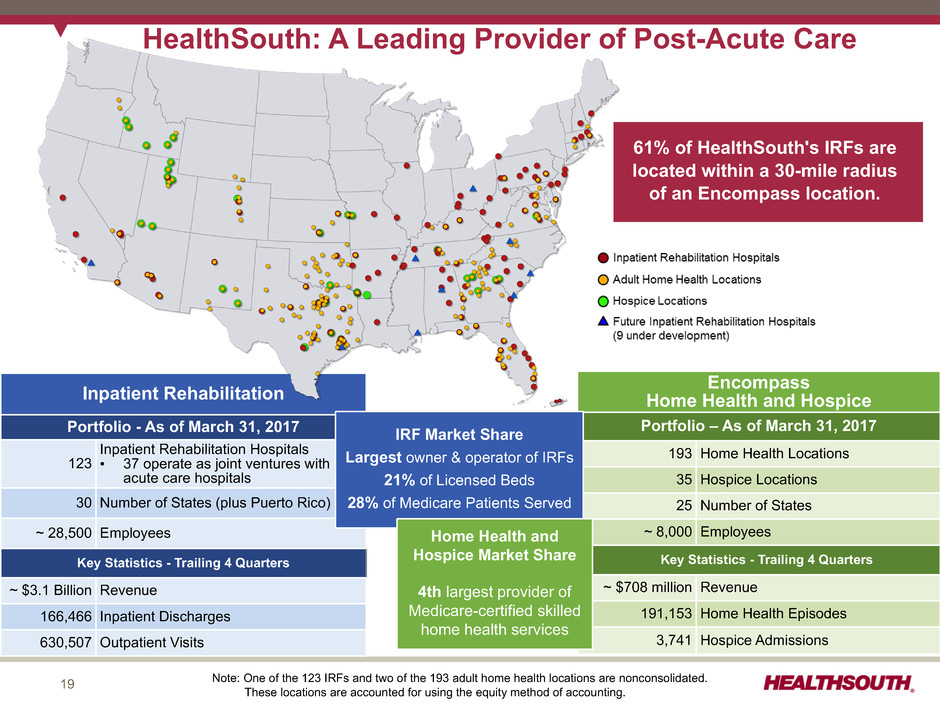
19 HealthSouth: A Leading Provider of Post-Acute Care 61% of HealthSouth's IRFs are located within a 30-mile radius of an Encompass location. Inpatient Rehabilitation Portfolio - As of March 31, 2017 123 Inpatient Rehabilitation Hospitals • 37 operate as joint ventures with acute care hospitals 30 Number of States (plus Puerto Rico) ~ 28,500 Employees Key Statistics - Trailing 4 Quarters ~ $3.1 Billion Revenue 166,466 Inpatient Discharges 630,507 Outpatient Visits Note: One of the 123 IRFs and two of the 193 adult home health locations are nonconsolidated. These locations are accounted for using the equity method of accounting. Encompass Home Health and Hospice Portfolio – As of March 31, 2017 193 Home Health Locations 35 Hospice Locations 25 Number of States ~ 8,000 Employees Key Statistics - Trailing 4 Quarters ~ $708 million Revenue 191,153 Home Health Episodes 3,741 Hospice Admissions IRF Market Share Largest owner & operator of IRFs 21% of Licensed Beds 28% of Medicare Patients Served Home Health and Hospice Market Share 4th largest provider of Medicare-certified skilled home health services

20 Pre-Payment Claims Denials - Inpatient Rehabilitation Segment Impact to Income Statement Period New Denials Collections of Previously Denied Claims Bad Debt Expense for New Denials Update of Reserve for Prior Denials (In Millions) Q1 2017 $19.0 $(5.9) $5.7 $— Q4 2016 17.8 (4.4) 5.4 0.5 Q3 2016 15.7 (8.5) 4.6 — Q2 2016 18.7 (4.9) 4.6 — Q1 2016 22.7 (8.4) 6.0 — Q4 2015 22.5 (4.1) 5.6 (1.3) Q3 2015 22.0 (4.1) 5.9 (1.1) Q2 2015 18.2 (3.8) 4.9 — Q1 2015 16.3 (3.0) 4.2 — Q4 2014 22.0 (6.6) 6.2 (3.2) Q3 2014 15.8 (0.5) 1.7 — Impact to Balance Sheet March 31, 2017 Dec. 31, 2016 Dec. 31, 2015 (In Millions) Pre-payment claims denials $ 171.4 $ 159.7 $ 114.8 Recorded reserves (51.9) (47.9) (31.2) Net accounts receivable from pre-payment claims denials $ 119.5 $ 111.8 $ 83.6 Background Ÿ For several years, under programs designated as “widespread probes,” certain Medicare Administrative Contractors (“MACs”) have conducted pre-payment claim reviews and denied payment for certain diagnosis codes. – Pre-payment claim denials increased for IRFs during 2014 and 2015 due to a widespread review of neurological billing codes and expansion of ongoing lower extremity code denials. Ÿ HealthSouth appeals most denials. On claims it takes to an administrative law judge (“ALJ”), HealthSouth historically has experienced an approximate 70% success rate. – MACs identify medical documentation issues as a leading basis for denials. – HealthSouth's investment in clinical information systems and its medical services department has further improved its documentation and reduced technical denials. – However, MACs and other HHS contractors continue to issue denials without regulatory basis. Ÿ By statute, ALJ decisions are due within 90 days of a request for hearing, but appeals are taking years. HHS has proposed rule changes to address the backlog of appeals, but their effect is uncertain. Ÿ Last year, a federal court ordered HHS to eliminate the backlog by the end of calendar year 2020. HHS has appealed the order. Ÿ All Medicare providers continue to experience delays. The backlog is growing because the ALJs receive one year's worth of appeals every four to six weeks, according to HHS. – Currently, ALJs are hearing HealthSouth appeals from claims denied up to seven years ago. HealthSouth reserves for pre-payment claim denials via the provision for doubtful accounts upon notice from a MAC that a claim is under review.

21 Expansion Activity Inpatient Rehabilitation Facilities # of New Beds 2017 2018 2019 De Novo: Pearland, TX 40 — — Shelby County, AL — 34 — Hilton Head, SC — 38 — Murrieta, CA — 50 — Joint Ventures: Gulfport, MS 33 — — Westerville, OH* 60 — — Jackson, TN 48 — — Murrells Inlet, SC — 29 — Winston-Salem, NC — 68 — Bed Expansions, net** 156 ~100 ~100 337 319 100 * ** Became operational in April 2017. Operating a unit in place (22 beds) while completing a de novo (40 beds) for a net increase of 18 beds in 2017. Net bed expansions in each year may change due to the timing of certain regulatory approvals and/or construction delays. Q1 2017 acquisition highlights: u Acquired 2 home health locations in Maryland u Acquired 2 home health locations in Kentucky u Opened 1 home health location in Massachusetts Q1 2017 expansion activity highlights: uExpanded existing hospitals by 24 beds 2 3 4 5 6 9 IRF DevelopmentProjects Underway 2 New States 8 9 Home Health and Hospice # of locations December 31, 2016 223 Acquisitions 4 Opening of new locations 1 March 31, 2017 228 1 7 9 Winston-Salem, NC Gulfport, MS*
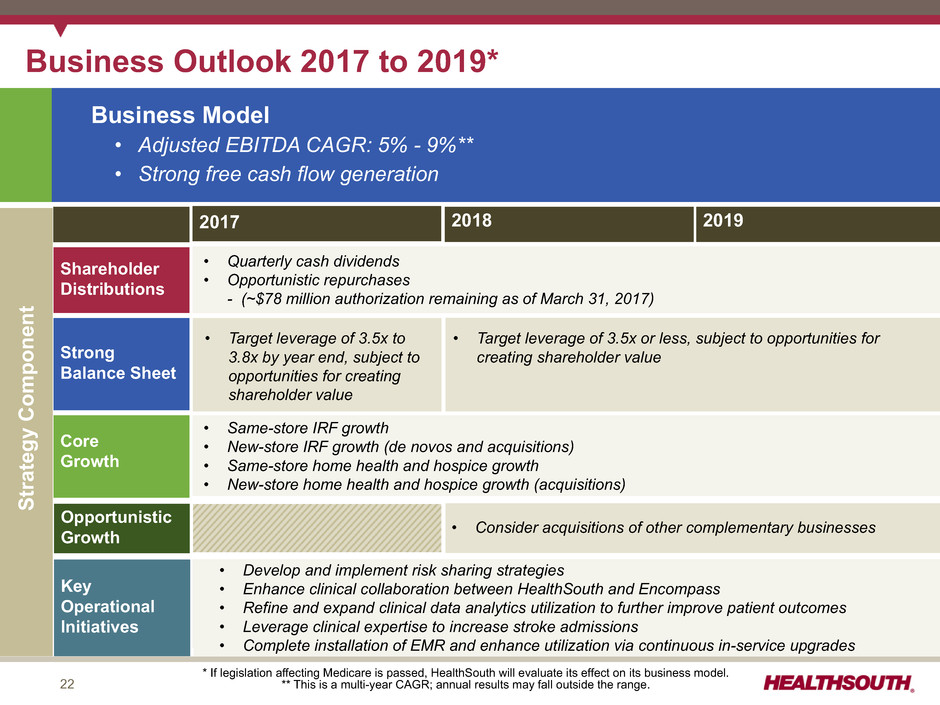
22 • Same-store IRF growth • New-store IRF growth (de novos and acquisitions) • Same-store home health and hospice growth • New-store home health and hospice growth (acquisitions) Core Growth Strong Balance Sheet Key Operational Initiatives Shareholder Distributions Opportunistic Growth Business Outlook 2017 to 2019* 2017 2018 2019 Business Model • Adjusted EBITDA CAGR: 5% - 9%** • Strong free cash flow generation • Quarterly cash dividends • Opportunistic repurchases - (~$78 million authorization remaining as of March 31, 2017) • Develop and implement risk sharing strategies • Enhance clinical collaboration between HealthSouth and Encompass • Refine and expand clinical data analytics utilization to further improve patient outcomes • Leverage clinical expertise to increase stroke admissions • Complete installation of EMR and enhance utilization via continuous in-service upgrades • Target leverage of 3.5x to 3.8x by year end, subject to opportunities for creating shareholder value Strategy Componen t • Consider acquisitions of other complementary businesses • Target leverage of 3.5x or less, subject to opportunities for creating shareholder value * If legislation affecting Medicare is passed, HealthSouth will evaluate its effect on its business model. ** This is a multi-year CAGR; annual results may fall outside the range.
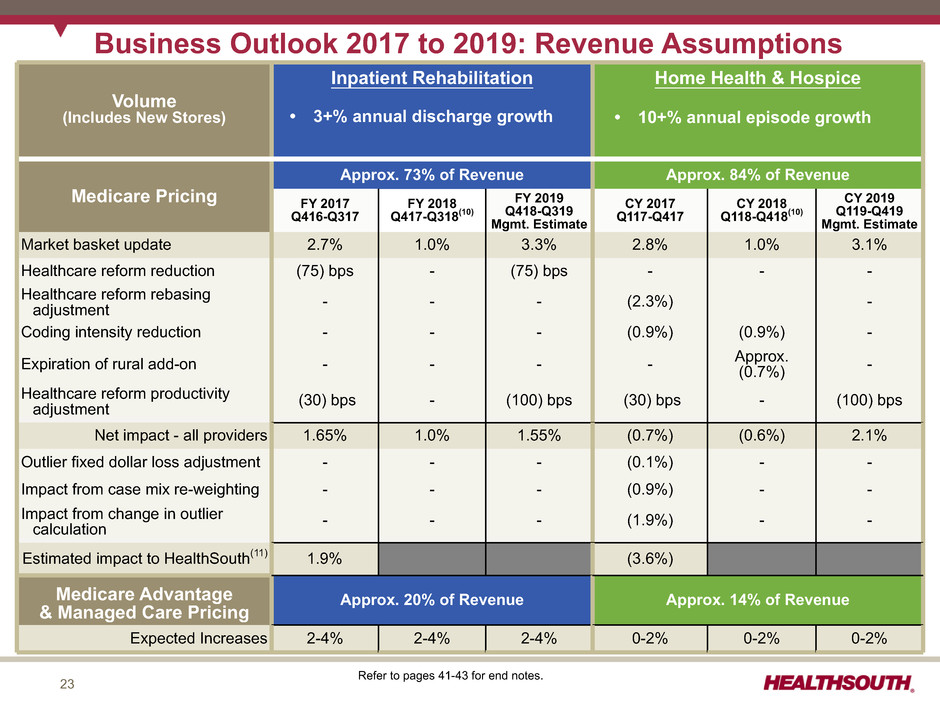
23 • 10% to15% annual episode growth • Includes $35-$40 million per annum in agency acquisitions Volume (Includes New Stores) Inpatient Rehabilitation Home Health & Hospice Medicare Pricing Approx. 73% of Revenue Approx. 84% of Revenue FY 2017 Q416-Q317 FY 2018 Q417-Q318(10) FY 2019 Q418-Q319 Mgmt. Estimate CY 2017 Q117-Q417 CY 2018 Q118-Q418(10) CY 2019 Q119-Q419 Mgmt. Estimate Market basket update 2.7% 1.0% 3.3% 2.8% 1.0% 3.1% Healthcare reform reduction (75) bps - (75) bps - - - Healthcare reform rebasing adjustment - - - (2.3%) - Coding intensity reduction - - - (0.9%) (0.9%) - Expiration of rural add-on - - - - Approx.(0.7%) - Healthcare reform productivity adjustment (30) bps - (100) bps (30) bps - (100) bps Net impact - all providers 1.65% 1.0% 1.55% (0.7%) (0.6%) 2.1% Outlier fixed dollar loss adjustment - - - (0.1%) - - Impact from case mix re-weighting - - - (0.9%) - - Impact from change in outlier calculation - - - (1.9%) - - Estimated impact to HealthSouth(11) 1.9% (3.6%) Medicare Advantage & Managed Care Pricing Approx. 20% of Revenue Approx. 14% of Revenue Expected Increases 2-4% 2-4% 2-4% 0-2% 0-2% 0-2% Business Outlook 2017 to 2019: Revenue Assumptions • 3+% annual discharge growth • 10+% annual episode growth Refer to pages 41-43 for end notes.
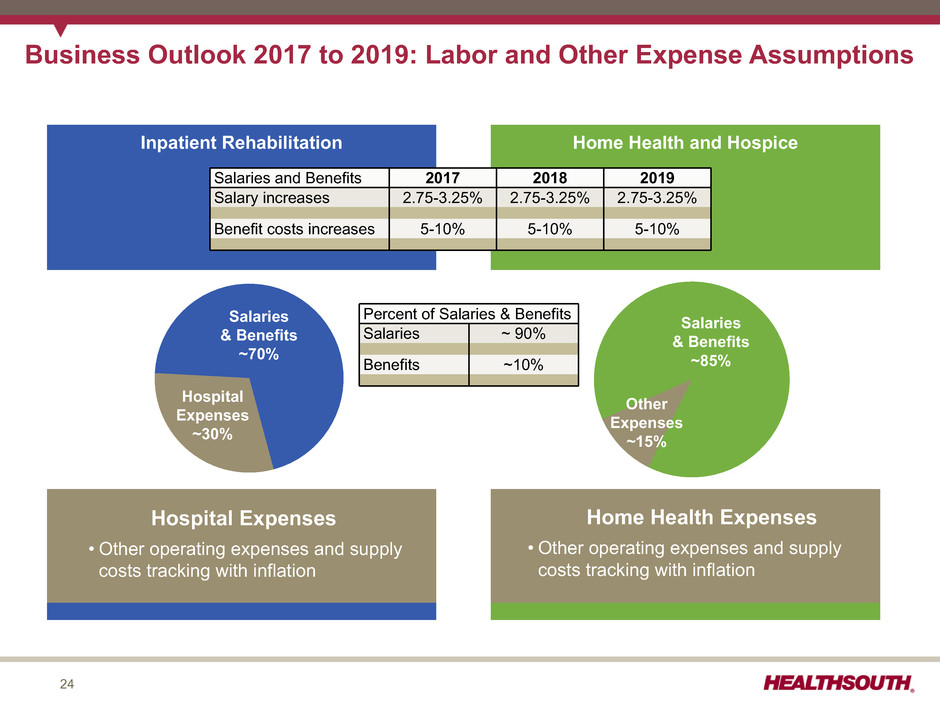
24 Inpatient Rehabilitation Home Health and Hospice Business Outlook 2017 to 2019: Labor and Other Expense Assumptions Salaries & Benefits ~70% Hospital Expenses ~30% Salaries and Benefits 2017 2018 2019 Salary increases 2.75-3.25% 2.75-3.25% 2.75-3.25% Benefit costs increases 5-10% 5-10% 5-10% Hospital Expenses • Other operating expenses and supply costs tracking with inflation Salaries & Benefits ~85% Other Expenses ~15% Home Health Expenses • Other operating expenses and supply costs tracking with inflation Percent of Salaries & Benefits Salaries ~ 90% Benefits ~10%
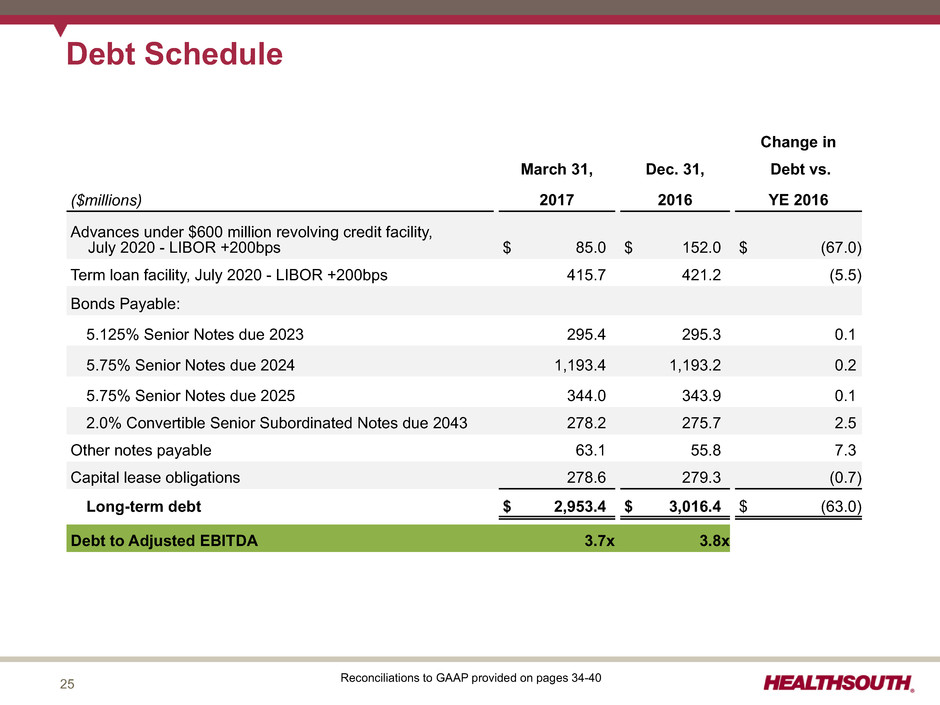
25 Debt Schedule Change in March 31, Dec. 31, Debt vs. ($millions) 2017 2016 YE 2016 Advances under $600 million revolving credit facility, July 2020 - LIBOR +200bps $ 85.0 $ 152.0 $ (67.0) Term loan facility, July 2020 - LIBOR +200bps 415.7 421.2 (5.5) Bonds Payable: 5.125% Senior Notes due 2023 295.4 295.3 0.1 5.75% Senior Notes due 2024 1,193.4 1,193.2 0.2 5.75% Senior Notes due 2025 344.0 343.9 0.1 2.0% Convertible Senior Subordinated Notes due 2043 278.2 275.7 2.5 Other notes payable 63.1 55.8 7.3 Capital lease obligations 278.6 279.3 (0.7) Long-term debt $ 2,953.4 $ 3,016.4 $ (63.0) Debt to Adjusted EBITDA 3.7x 3.8x Reconciliations to GAAP provided on pages 34-40

26 2016 2019 2020 2020 2021 2022 2023 2024 2025 2043 $350 Senior Notes 5.75% $1,200 Senior Notes 5.75% $320 Conv. Sr. Sub. Notes 2.0% $300 Senior Notes 5.125% $85 Drawn + $36 reserved for LC’s Holders have a put option in 2020 As of March 31, 2017* Debt Maturity Profile - Face Value ($ in millions) $479 Available Callable beginning November 2017 HealthSouth is positioned with a cost-efficient, flexible capital structure. Callable beginning March 2018 Revolver Revolver Capacity $416 Term Loans Callable beginning September 2020 * This chart does not include ~$279 million of capital lease obligations or ~$63 million of other notes payable. See the debt schedule on page 25. No significant debt maturities prior to 2020

27 25.0 20.0 15.0 10.0 5.0 0.0 Q2 2014 Q3 2014 Q4 2014 Q1 2015 Q2 2015 Q3 2015 Q4 2015 Q1 2016 Q2 2016 Q3 2016 Q4 2016 Q1 2017 New-Store/Same-Store IRF Growth Q2 2014 Q3 2014 Q4 2014 Q1 2015 Q2 2015 Q3 2015 Q4 2015 Q1 2016 Q2 2016 Q3 2016 Q4 2016 Q1 2017 Fairlawn(12) 0.6% 1.9% 1.9% 2.0% 1.1% New Store 1.0% —% 0.6% 1.8% 4.4% 5.7% 15.6% 14.2% 11.7% 10.7% 1.3% 1.2% Same Store* 1.4% 1.9% 2.2% 2.9% 2.8% 3.9% 3.0% 2.8% 1.9% 1.9% 0.1% 1.6% Total by Qtr. 3.0% 3.8% 4.7% 6.7% 8.3% 9.6% 18.6% 17.0% 13.6% 12.6% 1.4% 2.8% Total by Year 3.5% 10.9% 10.8% Same-Store Year* 1.3% 3.2% 1.7% Same-Store Year UDS(13) (0.2)% 1.3% (0.6)% Altamonte Springs, FL (50 beds) Johnson City, TN (26 beds) Newnan, GA (50 beds) Middletown, DE (34 beds) Reliant (857 beds) Franklin, TN (40 beds) Lexington, KY (158 beds) Savannah, GA (50 beds) Bryan, TX (49 beds) Broken Arrow, OK (22 beds) * Includes consolidated HealthSouth inpatient rehabilitation hospitals classified as same store during each period Refer to pages 41-43 for end notes. Modesto, CA (50 beds) Hot Springs, AR (27 beds)

28 Payment Sources (Percent of Revenues) Inpatient Rehabilitation Segment Home Health and Hospice Segment Consolidated Q1 Q1 Q1 Full Year 2017 2016 2017 2016 2017 2016 2016 Medicare 73.3% 73.8% 84.1% 83.5% 75.2% 75.4% 75.2% Medicare Advantage 8.5% 7.6% 10.3% 8.7% 8.8% 7.8% 7.9% Managed care 11.2% 11.0% 4.0% 2.7% 9.9% 9.5% 9.8% Medicaid 2.8% 3.0% 1.4% 4.9% 2.6% 3.4% 3.2% Other third-party payors 1.5% 1.6% —% —% 1.2% 1.4% 1.4% Workers’ compensation 0.9% 1.1% —% —% 0.8% 0.9% 0.8% Patients 0.6% 0.6% 0.1% 0.1% 0.5% 0.5% 0.5% Other income 1.2% 1.3% 0.1% 0.1% 1.0% 1.1% 1.2% Total 100.0% 100.0% 100.0% 100.0% 100.0% 100.0% 100.0%
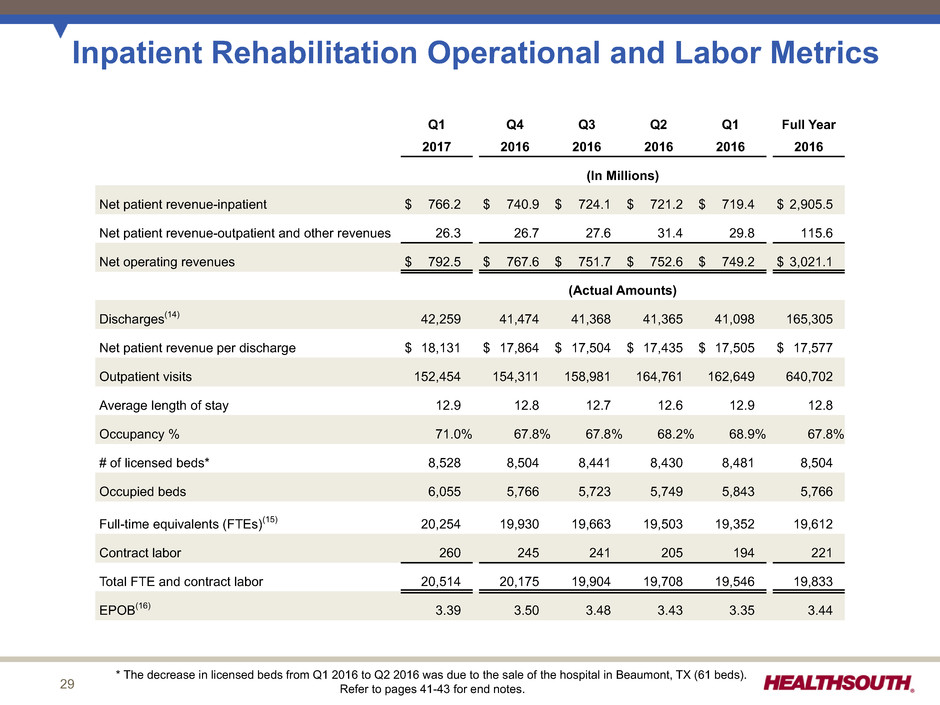
29 Inpatient Rehabilitation Operational and Labor Metrics Q1 Q4 Q3 Q2 Q1 Full Year 2017 2016 2016 2016 2016 2016 (In Millions) Net patient revenue-inpatient $ 766.2 $ 740.9 $ 724.1 $ 721.2 $ 719.4 $ 2,905.5 Net patient revenue-outpatient and other revenues 26.3 26.7 27.6 31.4 29.8 115.6 Net operating revenues $ 792.5 $ 767.6 $ 751.7 $ 752.6 $ 749.2 $ 3,021.1 (Actual Amounts) Discharges(14) 42,259 41,474 41,368 41,365 41,098 165,305 Net patient revenue per discharge $ 18,131 $ 17,864 $ 17,504 $ 17,435 $ 17,505 $ 17,577 Outpatient visits 152,454 154,311 158,981 164,761 162,649 640,702 Average length of stay 12.9 12.8 12.7 12.6 12.9 12.8 Occupancy % 71.0% 67.8% 67.8% 68.2% 68.9% 67.8% # of licensed beds* 8,528 8,504 8,441 8,430 8,481 8,504 Occupied beds 6,055 5,766 5,723 5,749 5,843 5,766 Full-time equivalents (FTEs)(15) 20,254 19,930 19,663 19,503 19,352 19,612 Contract labor 260 245 241 205 194 221 Total FTE and contract labor 20,514 20,175 19,904 19,708 19,546 19,833 EPOB(16) 3.39 3.50 3.48 3.43 3.35 3.44 * The decrease in licensed beds from Q1 2016 to Q2 2016 was due to the sale of the hospital in Beaumont, TX (61 beds). Refer to pages 41-43 for end notes.
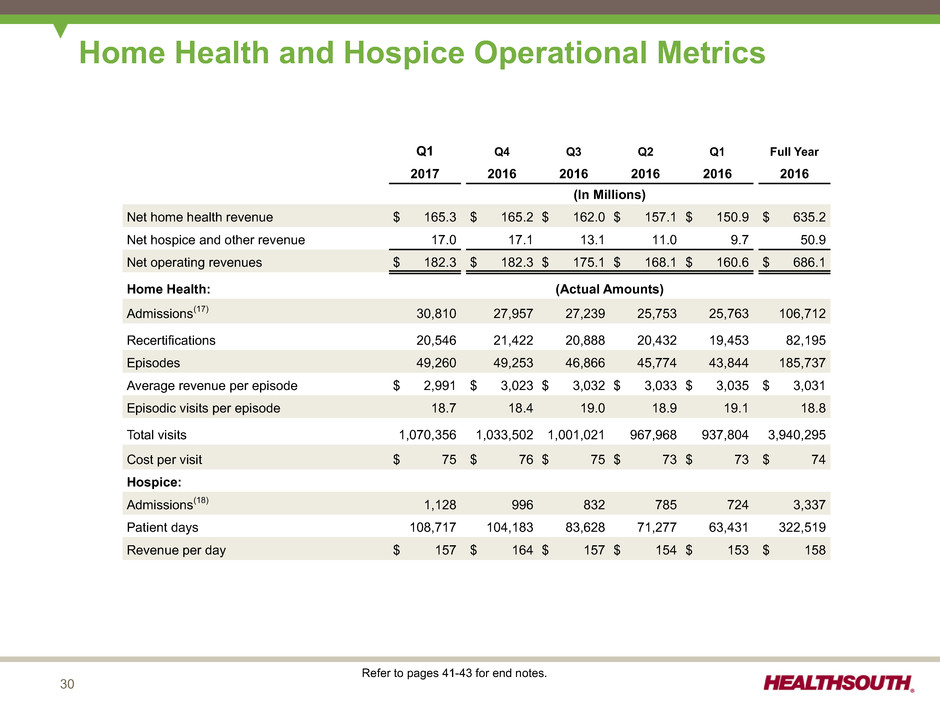
30 Home Health and Hospice Operational Metrics Q1 Q4 Q3 Q2 Q1 Full Year 2017 2016 2016 2016 2016 2016 (In Millions) Net home health revenue $ 165.3 $ 165.2 $ 162.0 $ 157.1 $ 150.9 $ 635.2 Net hospice and other revenue 17.0 17.1 13.1 11.0 9.7 50.9 Net operating revenues $ 182.3 $ 182.3 $ 175.1 $ 168.1 $ 160.6 $ 686.1 Home Health: (Actual Amounts) Admissions(17) 30,810 27,957 27,239 25,753 25,763 106,712 Recertifications 20,546 21,422 20,888 20,432 19,453 82,195 Episodes 49,260 49,253 46,866 45,774 43,844 185,737 Average revenue per episode $ 2,991 $ 3,023 $ 3,032 $ 3,033 $ 3,035 $ 3,031 Episodic visits per episode 18.7 18.4 19.0 18.9 19.1 18.8 Total visits 1,070,356 1,033,502 1,001,021 967,968 937,804 3,940,295 Cost per visit $ 75 $ 76 $ 75 $ 73 $ 73 $ 74 Hospice: Admissions(18) 1,128 996 832 785 724 3,337 Patient days 108,717 104,183 83,628 71,277 63,431 322,519 Revenue per day $ 157 $ 164 $ 157 $ 154 $ 153 $ 158 Refer to pages 41-43 for end notes.
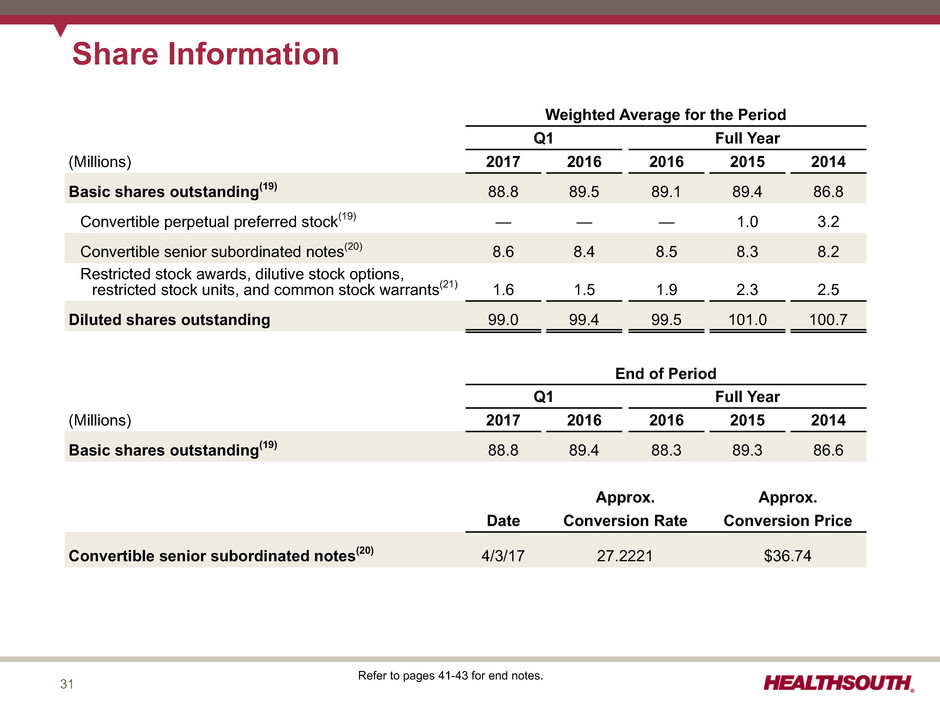
31 Share Information Weighted Average for the Period Q1 Full Year (Millions) 2017 2016 2016 2015 2014 Basic shares outstanding(19) 88.8 89.5 89.1 89.4 86.8 Convertible perpetual preferred stock(19) — — — 1.0 3.2 Convertible senior subordinated notes(20) 8.6 8.4 8.5 8.3 8.2 Restricted stock awards, dilutive stock options, restricted stock units, and common stock warrants(21) 1.6 1.5 1.9 2.3 2.5 Diluted shares outstanding 99.0 99.4 99.5 101.0 100.7 End of Period Q1 Full Year (Millions) 2017 2016 2016 2015 2014 Basic shares outstanding(19) 88.8 89.4 88.3 89.3 86.6 Approx. Approx. Date Conversion Rate Conversion Price Convertible senior subordinated notes(20) 4/3/17 27.2221 $36.74 Refer to pages 41-43 for end notes.

32 Segment Operating Results Q1 2017 Q1 2016 IRF Home Health and Hospice Reclasses HealthSouth Consolidated IRF Home Health and Hospice Reclasses HealthSouth Consolidated Net operating revenues $ 792.5 $ 182.3 $ — $ 974.8 $ 749.2 $ 160.6 $ — $ 909.8 Less: Provision for doubtful accounts (14.7) (1.7) — (16.4) (15.6) (0.9) — (16.5) 777.8 180.6 — 958.4 733.6 159.7 — 893.3 Operating Expenses: Inpatient Rehabilitation: Salaries and benefits (398.2) — (131.9) (530.1) (369.9) — (116.2) (486.1) Other operating expenses(a) (111.8) — (17.8) (129.6) (104.8) — (14.2) (119.0) Supplies (33.7) — (3.3) (37.0) (32.4) — (2.6) (35.0) Occupancy (15.1) — (2.8) (17.9) (15.6) — (2.4) (18.0) Home Health and Hospice: Cost of services sold (excluding depreciation and amortization) — (89.0) 89.0 — — (78.4) 78.4 — Support and overhead costs — (66.8) 66.8 — — (57.0) 57.0 — (558.8) (155.8) — (714.6) (522.7) (135.4) — (658.1) Other income 1.0 — — 1.0 0.6 — — 0.6 Equity in net income of nonconsolidated affiliates 1.9 0.2 — 2.1 2.2 0.2 — 2.4 Noncontrolling interest (16.5) (1.1) — (17.6) (16.8) (1.9) — (18.7) Segment Adjusted EBITDA $ 205.4 $ 23.9 $ — 229.3 $ 196.9 $ 22.6 $ — 219.5 General and administrative expenses(b) (28.5) (27.4) Adjusted EBITDA $ 200.8 $ 192.1 In arriving at Adjusted EBITDA, the following were excluded: (a) (Gain) loss on disposal or impairment of assets $ (0.4) $ (0.1) $ — $ (0.5) $ 0.5 $ (0.3) $ — $ 0.2 (b) Stock-based compensation — — — 8.0 — — — 4.5 Reconciliations to GAAP provided on pages 34-40

33 Segment Operating Results Year Ended December 31, 2016 IRF Home Health and Hospice Reclasses HealthSouth Consolidated Net operating revenues $ 3,021.1 $ 686.1 $ — $ 3,707.2 Less: Provision for doubtful accounts (57.0) (4.2) — (61.2) 2,964.1 681.9 — 3,646.0 Operating Expenses: Inpatient Rehabilitation: Salaries and benefits (1,493.4) — (492.5) (1,985.9) Other operating expenses(a) (431.5) — (59.9) (491.4) Supplies (128.8) — (11.2) (140.0) Occupancy (61.2) — (10.1) (71.3) Home Health and Hospice: Cost of services sold (excluding depreciation and amortization) — (336.5) 336.5 — Support and overhead costs — (237.2) 237.2 — (2,114.9) (573.7) — (2,688.6) Other income 2.9 — — 2.9 Equity in net income of nonconsolidated affiliates 9.1 0.7 — 9.8 Noncontrolling interest (64.0) (6.5) — (70.5) Segment Adjusted EBITDA $ 797.2 $ 102.4 $ — 899.6 General and administrative expenses(b) (106.0) Adjusted EBITDA $ 793.6 In arriving at Adjusted EBITDA, the following were excluded: (a) Loss (gain) on disposal or impairment of assets $ 4.3 $ (3.6) $ — $ 0.7 (b) Stock-based compensation expense — — — 27.4 Reconciliations to GAAP provided on pages 34-40
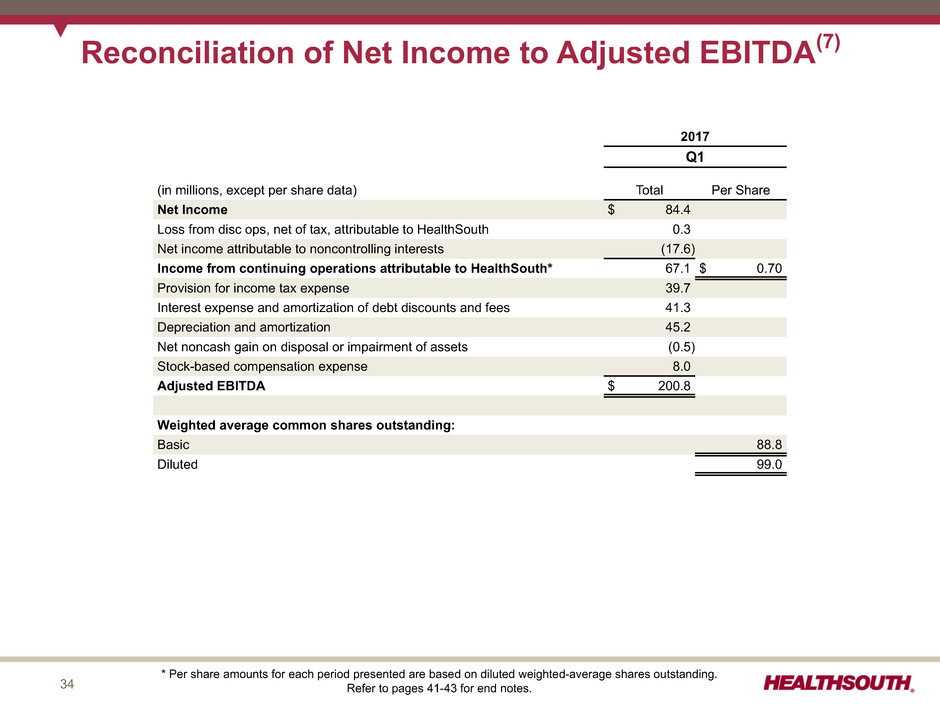
34 Reconciliation of Net Income to Adjusted EBITDA(7) 2017 Q1 (in millions, except per share data) Total Per Share Net Income $ 84.4 Loss from disc ops, net of tax, attributable to HealthSouth 0.3 Net income attributable to noncontrolling interests (17.6) Income from continuing operations attributable to HealthSouth* 67.1 $ 0.70 Provision for income tax expense 39.7 Interest expense and amortization of debt discounts and fees 41.3 Depreciation and amortization 45.2 Net noncash gain on disposal or impairment of assets (0.5) Stock-based compensation expense 8.0 Adjusted EBITDA $ 200.8 Weighted average common shares outstanding: Basic 88.8 Diluted 99.0 * Per share amounts for each period presented are based on diluted weighted-average shares outstanding. Refer to pages 41-43 for end notes.

35 Reconciliation of Net Income to Adjusted EBITDA(7) 2016 Q1 Q2 Q3 Q4 Full Year (in millions, except per share data) Total Per Share Total Per Share Total Per Share Total Per Share Total Per Share Net Income $ 76.7 $ 81.2 $ 78.1 $ 82.1 $ 318.1 Loss (income) from disc ops, net of tax, attributable to HealthSouth 0.1 0.1 0.1 (0.3) — Net income attributable to noncontrolling interests (18.7) (18.6) (16.4) (16.8) (70.5) Income from continuing operations attributable to HealthSouth* 58.1 $ 0.61 62.7 $ 0.65 61.8 $ 0.64 65.0 $ 0.68 247.6 $ 2.59 Pro fees — acct, tax, and legal 0.2 1.7 — — 1.9 Provision for income tax expense 39.7 42.4 42.1 39.7 163.9 Interest expense and amortization of debt discounts and fees 44.6 43.4 42.5 41.6 172.1 Depreciation and amortization 42.4 42.9 43.5 43.8 172.6 Loss on early extinguishment of debt 2.4 2.4 2.6 — 7.4 Net noncash gain (loss) on disposal or impairment of assets 0.2 0.2 1.6 (1.3) 0.7 Stock-based compensation expense 4.5 8.6 4.3 10.0 27.4 Adjusted EBITDA $ 192.1 $ 204.3 $ 198.4 $ 198.8 $ 793.6 Weighted average common shares outstanding: Basic 89.5 89.3 89.1 88.6 89.1 Diluted 99.4 99.4 99.4 99.2 99.5 * Per share amounts for each period presented are based on diluted weighted-average shares outstanding. Refer to pages 41-43 for end notes.

36 Net Cash Provided by Operating Activities Reconciled to Adjusted EBITDA Q1 Full Year (Millions) 2017 2016 2016 Net cash provided by operating activities $ 180.8 $ 169.6 $ 634.4 Provision for doubtful accounts (16.4) (16.5) (61.2) Professional fees — accounting, tax, and legal — 0.2 1.9 Interest expense and amortization of debt discounts and fees 41.3 44.6 172.1 Equity in net income of nonconsolidated affiliates 2.1 2.4 9.8 Net income attributable to noncontrolling interests in continuing operations (17.6) (18.7) (70.5) Amortization of debt-related items (3.5) (3.4) (13.8) Distributions from nonconsolidated affiliates (2.1) (1.7) (8.5) Current portion of income tax (benefit) expense (9.3) 5.0 31.0 Change in assets and liabilities 24.6 8.4 91.3 Net premium paid on bond transactions — 1.9 5.8 Cash used in operating activities of discontinued operations 0.4 0.2 0.7 Other 0.5 0.1 0.6 Adjusted EBITDA $ 200.8 $ 192.1 $ 793.6
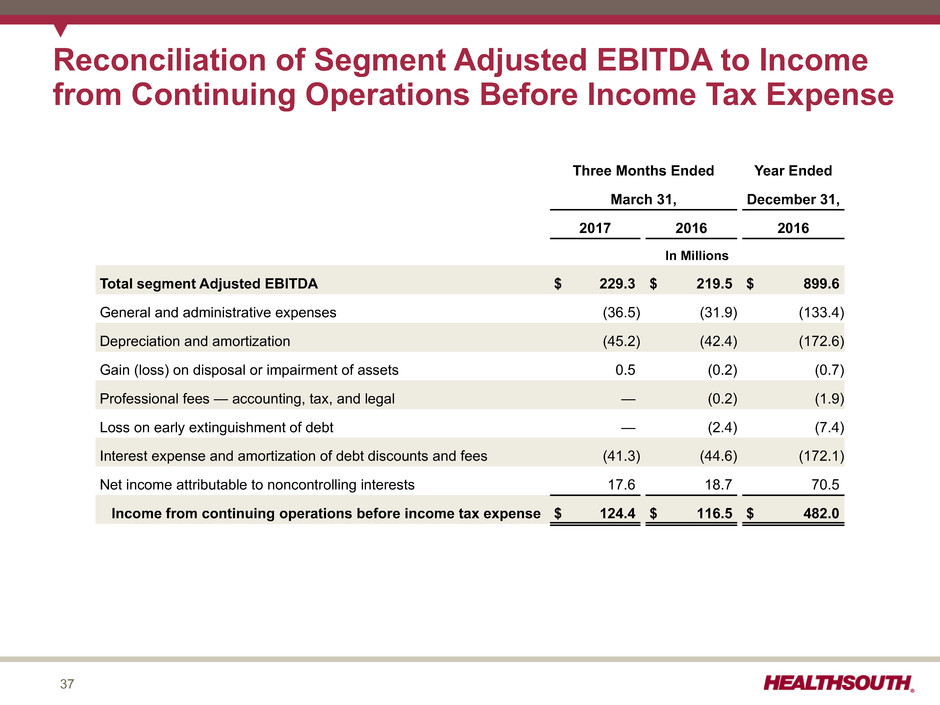
37 Reconciliation of Segment Adjusted EBITDA to Income from Continuing Operations Before Income Tax Expense Three Months Ended Year Ended March 31, December 31, 2017 2016 2016 In Millions Total segment Adjusted EBITDA $ 229.3 $ 219.5 $ 899.6 General and administrative expenses (36.5) (31.9) (133.4) Depreciation and amortization (45.2) (42.4) (172.6) Gain (loss) on disposal or impairment of assets 0.5 (0.2) (0.7) Professional fees — accounting, tax, and legal — (0.2) (1.9) Loss on early extinguishment of debt — (2.4) (7.4) Interest expense and amortization of debt discounts and fees (41.3) (44.6) (172.1) Net income attributable to noncontrolling interests 17.6 18.7 70.5 Income from continuing operations before income tax expense $ 124.4 $ 116.5 $ 482.0
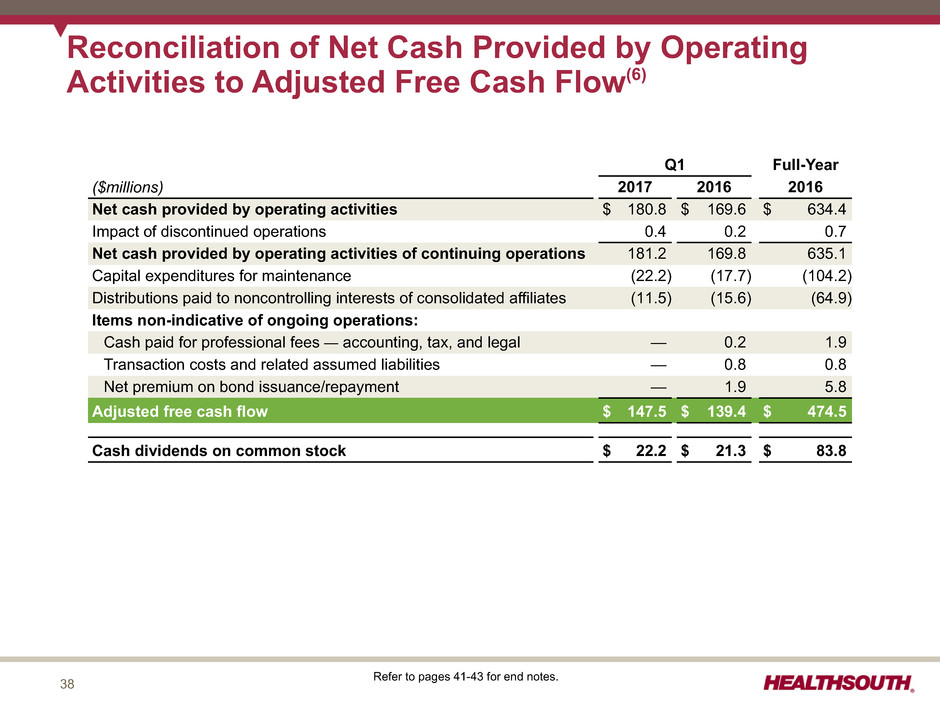
38 Reconciliation of Net Cash Provided by Operating Activities to Adjusted Free Cash Flow(6) Q1 Full-Year ($millions) 2017 2016 2016 Net cash provided by operating activities $ 180.8 $ 169.6 $ 634.4 Impact of discontinued operations 0.4 0.2 0.7 Net cash provided by operating activities of continuing operations 181.2 169.8 635.1 Capital expenditures for maintenance (22.2) (17.7) (104.2) Distributions paid to noncontrolling interests of consolidated affiliates (11.5) (15.6) (64.9) Items non-indicative of ongoing operations: Cash paid for professional fees — accounting, tax, and legal — 0.2 1.9 Transaction costs and related assumed liabilities — 0.8 0.8 Net premium on bond issuance/repayment — 1.9 5.8 Adjusted free cash flow $ 147.5 $ 139.4 $ 474.5 Cash dividends on common stock $ 22.2 $ 21.3 $ 83.8 Refer to pages 41-43 for end notes.
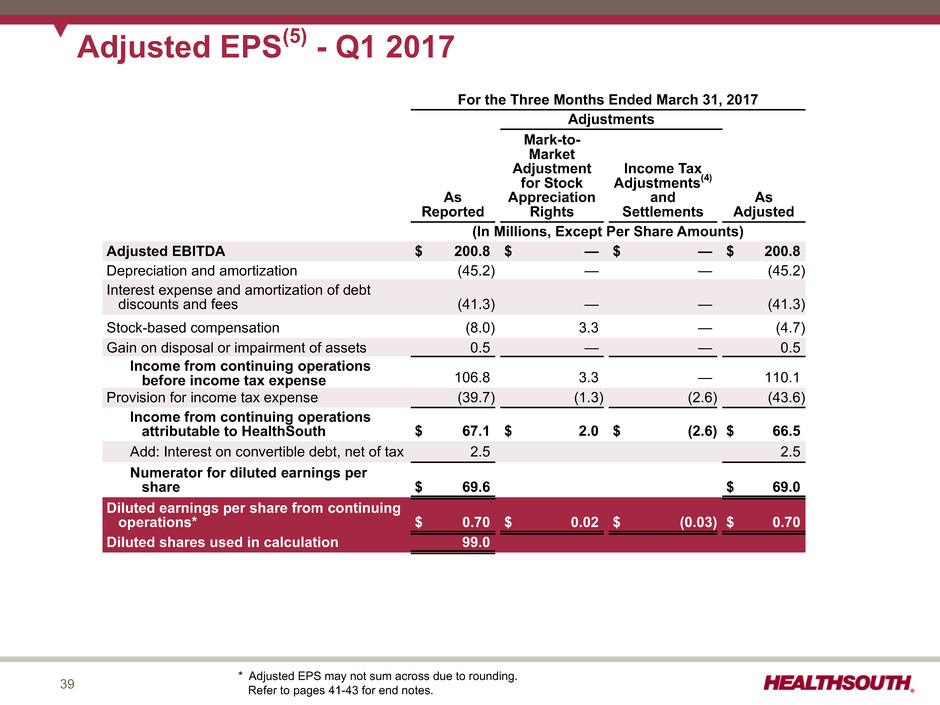
39 For the Three Months Ended March 31, 2017 Adjustments As Reported Mark-to- Market Adjustment for Stock Appreciation Rights Income Tax Adjustments(4) and Settlements As Adjusted (In Millions, Except Per Share Amounts) Adjusted EBITDA $ 200.8 $ — $ — $ 200.8 Depreciation and amortization (45.2) — — (45.2) Interest expense and amortization of debt discounts and fees (41.3) — — (41.3) Stock-based compensation (8.0) 3.3 — (4.7) Gain on disposal or impairment of assets 0.5 — — 0.5 Income from continuing operations before income tax expense 106.8 3.3 — 110.1 Provision for income tax expense (39.7) (1.3) (2.6) (43.6) Income from continuing operations attributable to HealthSouth $ 67.1 $ 2.0 $ (2.6) $ 66.5 Add: Interest on convertible debt, net of tax 2.5 2.5 Numerator for diluted earnings per share $ 69.6 $ 69.0 Diluted earnings per share from continuing operations* $ 0.70 $ 0.02 $ (0.03) $ 0.70 Diluted shares used in calculation 99.0 Adjusted EPS(5) - Q1 2017 * Adjusted EPS may not sum across due to rounding. Refer to pages 41-43 for end notes.
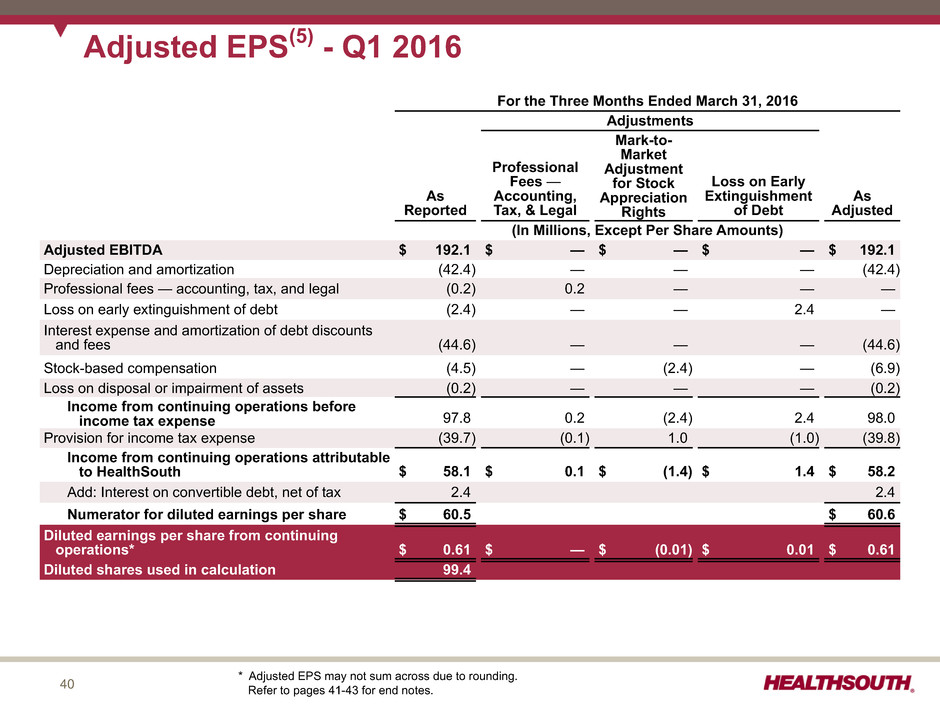
40 For the Three Months Ended March 31, 2016 Adjustments As Reported Professional Fees — Accounting, Tax, & Legal Mark-to- Market Adjustment for Stock Appreciation Rights Loss on Early Extinguishment of Debt As Adjusted (In Millions, Except Per Share Amounts) Adjusted EBITDA $ 192.1 $ — $ — $ — $ 192.1 Depreciation and amortization (42.4) — — — (42.4) Professional fees — accounting, tax, and legal (0.2) 0.2 — — — Loss on early extinguishment of debt (2.4) — — 2.4 — Interest expense and amortization of debt discounts and fees (44.6) — — — (44.6) Stock-based compensation (4.5) — (2.4) — (6.9) Loss on disposal or impairment of assets (0.2) — — — (0.2) Income from continuing operations before income tax expense 97.8 0.2 (2.4) 2.4 98.0 Provision for income tax expense (39.7) (0.1) 1.0 (1.0) (39.8) Income from continuing operations attributable to HealthSouth $ 58.1 $ 0.1 $ (1.4) $ 1.4 $ 58.2 Add: Interest on convertible debt, net of tax 2.4 2.4 Numerator for diluted earnings per share $ 60.5 $ 60.6 Diluted earnings per share from continuing operations* $ 0.61 $ — $ (0.01) $ 0.01 $ 0.61 Diluted shares used in calculation 99.4 Adjusted EPS(5) - Q1 2016 * Adjusted EPS may not sum across due to rounding. Refer to pages 41-43 for end notes.
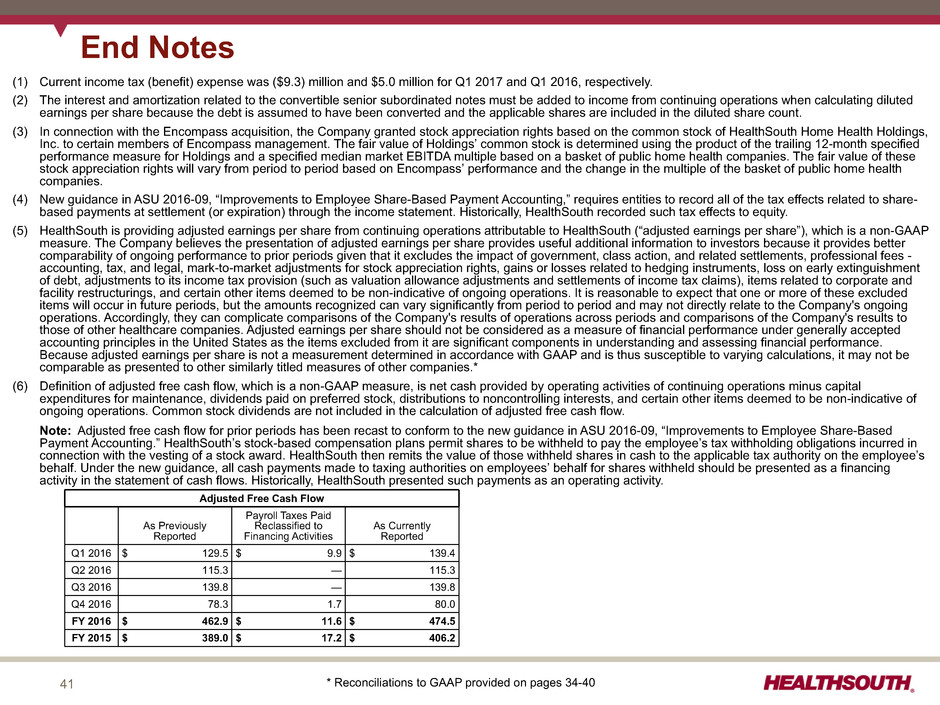
41 End Notes (1) Current income tax (benefit) expense was ($9.3) million and $5.0 million for Q1 2017 and Q1 2016, respectively. (2) The interest and amortization related to the convertible senior subordinated notes must be added to income from continuing operations when calculating diluted earnings per share because the debt is assumed to have been converted and the applicable shares are included in the diluted share count. (3) In connection with the Encompass acquisition, the Company granted stock appreciation rights based on the common stock of HealthSouth Home Health Holdings, Inc. to certain members of Encompass management. The fair value of Holdings’ common stock is determined using the product of the trailing 12-month specified performance measure for Holdings and a specified median market EBITDA multiple based on a basket of public home health companies. The fair value of these stock appreciation rights will vary from period to period based on Encompass’ performance and the change in the multiple of the basket of public home health companies. (4) New guidance in ASU 2016-09, “Improvements to Employee Share-Based Payment Accounting,” requires entities to record all of the tax effects related to share- based payments at settlement (or expiration) through the income statement. Historically, HealthSouth recorded such tax effects to equity. (5) HealthSouth is providing adjusted earnings per share from continuing operations attributable to HealthSouth (“adjusted earnings per share”), which is a non-GAAP measure. The Company believes the presentation of adjusted earnings per share provides useful additional information to investors because it provides better comparability of ongoing performance to prior periods given that it excludes the impact of government, class action, and related settlements, professional fees - accounting, tax, and legal, mark-to-market adjustments for stock appreciation rights, gains or losses related to hedging instruments, loss on early extinguishment of debt, adjustments to its income tax provision (such as valuation allowance adjustments and settlements of income tax claims), items related to corporate and facility restructurings, and certain other items deemed to be non-indicative of ongoing operations. It is reasonable to expect that one or more of these excluded items will occur in future periods, but the amounts recognized can vary significantly from period to period and may not directly relate to the Company's ongoing operations. Accordingly, they can complicate comparisons of the Company's results of operations across periods and comparisons of the Company's results to those of other healthcare companies. Adjusted earnings per share should not be considered as a measure of financial performance under generally accepted accounting principles in the United States as the items excluded from it are significant components in understanding and assessing financial performance. Because adjusted earnings per share is not a measurement determined in accordance with GAAP and is thus susceptible to varying calculations, it may not be comparable as presented to other similarly titled measures of other companies.* (6) Definition of adjusted free cash flow, which is a non-GAAP measure, is net cash provided by operating activities of continuing operations minus capital expenditures for maintenance, dividends paid on preferred stock, distributions to noncontrolling interests, and certain other items deemed to be non-indicative of ongoing operations. Common stock dividends are not included in the calculation of adjusted free cash flow. Note: Adjusted free cash flow for prior periods has been recast to conform to the new guidance in ASU 2016-09, “Improvements to Employee Share-Based Payment Accounting.” HealthSouth’s stock-based compensation plans permit shares to be withheld to pay the employee’s tax withholding obligations incurred in connection with the vesting of a stock award. HealthSouth then remits the value of those withheld shares in cash to the applicable tax authority on the employee’s behalf. Under the new guidance, all cash payments made to taxing authorities on employees’ behalf for shares withheld should be presented as a financing activity in the statement of cash flows. Historically, HealthSouth presented such payments as an operating activity. * Reconciliations to GAAP provided on pages 34-40 Adjusted Free Cash Flow As Previously Reported Payroll Taxes Paid Reclassified to Financing Activities As Currently Reported Q1 2016 $ 129.5 $ 9.9 $ 139.4 Q2 2016 115.3 — 115.3 Q3 2016 139.8 — 139.8 Q4 2016 78.3 1.7 80.0 FY 2016 $ 462.9 $ 11.6 $ 474.5 FY 2015 $ 389.0 $ 17.2 $ 406.2

42 End Notes, con’t. (7) Adjusted EBITDA is a non-GAAP financial measure. The Company’s leverage ratio (total consolidated debt to Adjusted EBITDA for the trailing four quarters) is, likewise, a non-GAAP measure. Management and some members of the investment community utilize Adjusted EBITDA as a financial measure and the leverage ratio as a liquidity measure on an ongoing basis. These measures are not recognized in accordance with GAAP and should not be viewed as an alternative to GAAP measures of performance or liquidity. In evaluating Adjusted EBITDA, the reader should be aware that in the future HealthSouth may incur expenses similar to the adjustments set forth. (8) In March 2017, the Internal Revenue Service approved HealthSouth’s request for a tax accounting method change related to billings denied under pre-payment claims reviews conducted by certain of its Medicare Administrative Contractors. This approval resulted in approximately $54 million of additional tax benefits to the Company through March 31, 2017. Approximately $39 million of this amount represents pre-payment claims denials received in years prior to and including the year ended December 31, 2015. These benefits are expected to reverse as pre-payment claims denials are settled or collected. (9) On July 16, 2015, the board of directors approved a $0.02 per share, or 9.5%, increase to the quarterly cash dividend on the Company’s common stock, bringing the quarterly cash dividend to $0.23 per common share. On July 21, 2016, the board of directors approved a $0.01 per share, or 4.3%, increase to the quarterly cash dividend on the Company’s common stock, bringing the quarterly cash dividend to $0.24 per common share. (10) The Medicare Access and CHIP Reauthorization Act of 2015 mandated a market basket update of +1.0% in 2018 for post-acute providers including rehabilitation hospitals as well as home health and hospice agencies. (11) The Company estimates the expected impact of each rule utilizing, among other things, the acuity of its patients over the 8-month (home health segment) to 12- month (inpatient rehabilitation segment) period prior to each rule’s release and incorporates other adjustments included in each rule. These estimates are prior to the impact of sequestration. (12) HealthSouth acquired an additional 30% equity interest in Fairlawn Rehabilitation Hospital in Worcester, MA from its joint venture partner. This transaction increased HealthSouth’s ownership interest from 50% to 80% and resulted in a change in accounting for this hospital from the equity method to a consolidated entity effective June 1, 2014. (13) Data provided by Uniform Data System for Medical Rehabilitation, a division of UB Foundation Activities, Inc., a data gathering and analysis organization for the rehabilitation industry; represents ~70% of industry, including HealthSouth sites (14) Represents discharges from 122 consolidated hospitals in Q1 2017 and Q4 2016; 121 consolidated hospitals in Q3 2016; 120 consolidated hospitals in Q2 2016; and 121 consolidated hospitals in Q1 2016 (15) Excludes approximately 430 full-time equivalents in Q1 2017 and approximately 420 full-time equivalents in the 2016 periods presented who are considered part of corporate overhead with their salaries and benefits included in general and administrative expenses in the Company’s consolidated statements of operations. Full- time equivalents included in the table represent HealthSouth employees who participate in or support the operations of the Company’s hospitals. (16) Employees per occupied bed, or “EPOB,” is calculated by dividing the number of full-time equivalents, including an estimate of full-time equivalents from the utilization of contract labor, by the number of occupied beds during each period. The number of occupied beds is determined by multiplying the number of licensed beds by the Company’s occupancy percentage. (17) Represents home health admissions from 191 consolidated locations in Q1 2017; 186 consolidated locations in Q4 2016; 188 consolidated locations in Q3 2016; 187 consolidated locations in Q2 2016; and 184 consolidated locations in Q1 2016 (18) Represents hospice admissions from 35 locations in Q1 2017 and Q4 2016; 33 locations in Q3 2016; 29 locations in Q2 2016; and 27 locations in Q1 2016 (19) In March 2006, the Company completed the sale of 400,000 shares of its 6.5% Series A Convertible Perpetual Preferred Stock. In Q4 2013, the Company exchanged $320 million of newly issued 2.0% Convertible Senior Subordinated Notes due 2043 for 257,110 shares of its outstanding preferred stock. In April 2015, the Company exercised its rights to force conversion of all outstanding shares of its preferred stock. On the conversion date, each outstanding share of preferred stock was converted into 33.9905 shares of common stock, resulting in the issuance of 3,271,415 shares of common stock.

43 End Notes, con’t. (20) In November 2013, the Company closed separate, privately negotiated exchanges in which it issued $320 million of 2.0% Convertible Senior Subordinated Notes due 2043 in exchange for 257,110 shares of its 6.5% Series A Convertible Perpetual Preferred Stock. The Company recorded ~$249 million as debt and ~$71 million as equity. The convertible notes are convertible, at the option of the holders, at any time on or prior to the close of business on the business day immediately preceding December 1, 2043 into shares of the Company’s common stock and is subject to customary antidilution adjustments. The Company has the right to redeem the convertible notes before December 1, 2018 if the volume weighted-average price of the Company’s common stock is at least 120% of the conversion price ($44.09) of the convertible notes for a specified period. On or after December 1, 2018, the Company may, at its option, redeem all or any part of the convertible notes. In either case, the redemption price will be equal to 100% of the principal amount of the convertible notes to be redeemed, plus accrued and unpaid interest. (21) The agreement to settle the Company’s class action securities litigation received final court approval in January 2007. The 5.0 million shares of common stock and warrants to purchase ~8.2 million shares of common stock at a strike price of $41.40 (expired January 17, 2017) related to this settlement were issued on September 30, 2009. The 5.0 million common shares are included in the basic outstanding shares. The warrants were not included in the diluted share count prior to 2015 because the strike price had historically been above the market price. In full-year 2016 and full-year 2014, zero shares related to the warrants were included in the diluted share count due to antidilution based on the stock price. In full-year 2015, 80,814 shares related to the warrants were included in the diluted share count using the treasury stock method.


