2018 J.P. Morgan Healthcare Conference Mark Tarr, President and Chief Executive Officer January 9, 2018
Encompass Health 2 The information contained in this presentation includes certain estimates, projections and other forward-looking information that reflect Encompass Health’s current outlook, views and plans with respect to future events, including legislative and regulatory developments, strategy, capital expenditures, acquisition and other development activities, cyber security, dividend strategies, repurchases of securities, effective tax rates, financial performance, financial assumptions, business model, balance sheet and cash flow plans, disintermediation, and shareholder value-enhancing transactions. These estimates, projections and other forward-looking information are based on assumptions the Company believes, as of the date hereof, are reasonable. Inevitably, there will be differences between such estimates and actual events or results, and those differences may be material. There can be no assurance any estimates, projections or forward-looking information will be realized. All such estimates, projections and forward-looking information speak only as of the date hereof. Encompass Health undertakes no duty to publicly update or revise the information contained herein. You are cautioned not to place undue reliance on the estimates, projections and other forward-looking information in this presentation as they are based on current expectations and general assumptions and are subject to various risks, uncertainties and other factors, including those set forth in the Form 10-K for the year ended December 31, 2016, Form 10-Q for the quarters ended March 31, 2017, June 30, 2017, and September 30, 2017, and in other documents Encompass Health previously filed with the SEC, many of which are beyond Encompass Health’s control, that may cause actual events or results to differ materially from the views, beliefs and estimates expressed herein. Note Regarding Presentation of Non-GAAP Financial Measures The following presentation includes certain “non-GAAP financial measures” as defined in Regulation G under the Securities Exchange Act of 1934, including Adjusted EBITDA, leverage ratios, adjusted earnings per share, and adjusted free cash flow. The Company’s Form 8-K, dated January 8, 2018, to which the following presentation is attached as Exhibit 99.1, provides further explanation and disclosure regarding Encompass Health’s use of non-GAAP financial measures and should be read in conjunction with this presentation. Schedules that reconcile the non-GAAP financial measures included in the following presentation to the most directly comparable financial measures calculated and presented in accordance with Generally Accepted Accounting Principles in the United States are included in that Form 8-K. Forward-Looking Statements
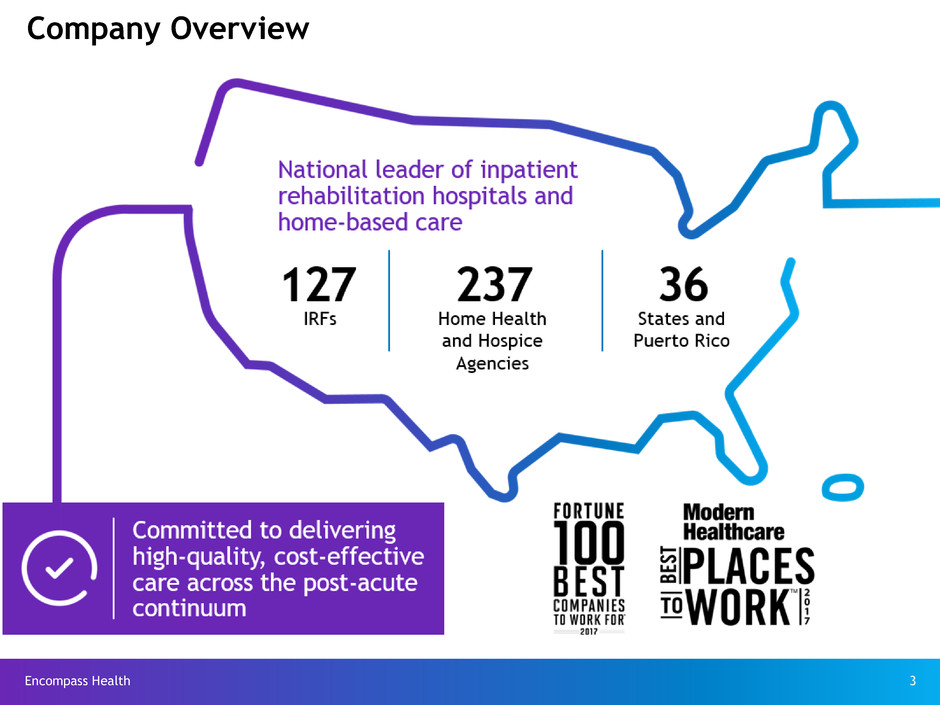
Encompass Health 3 Company Overview
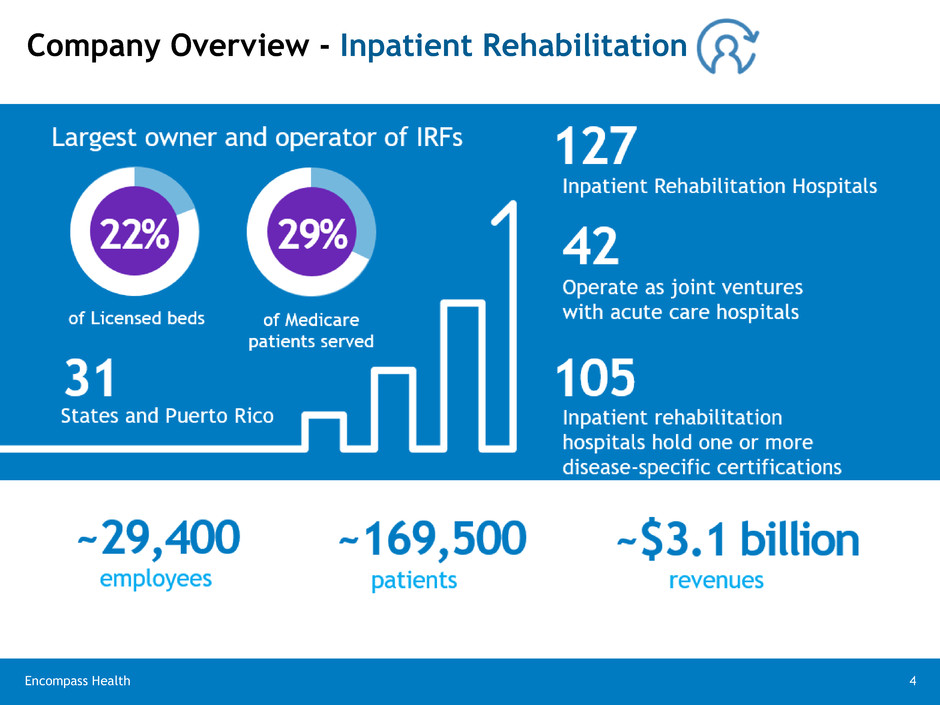
4Encompass Health Company Overview - Inpatient Rehabilitation

5Encompass Health Company Overview - Home Health and Hospice

Encompass Health 6 Market Overlap ~60% of the Company’s IRFs have an Encompass Health home health location within a 30-mile radius. Inpatient Rehabilitation and Home Health
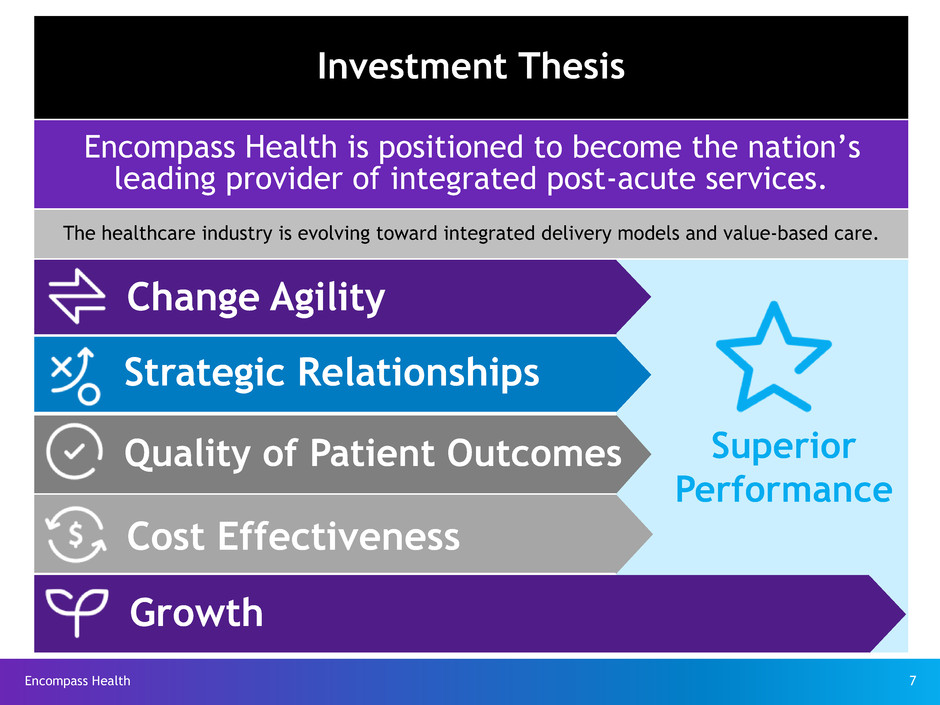
Encompass Health 7 Investment Thesis Encompass Health is positioned to become the nation’s leading provider of integrated post-acute services. The healthcare industry is evolving toward integrated delivery models and value-based care. Superior Performance Change Agility Strategic Relationships Quality of Patient Outcomes Cost Effectiveness Growth
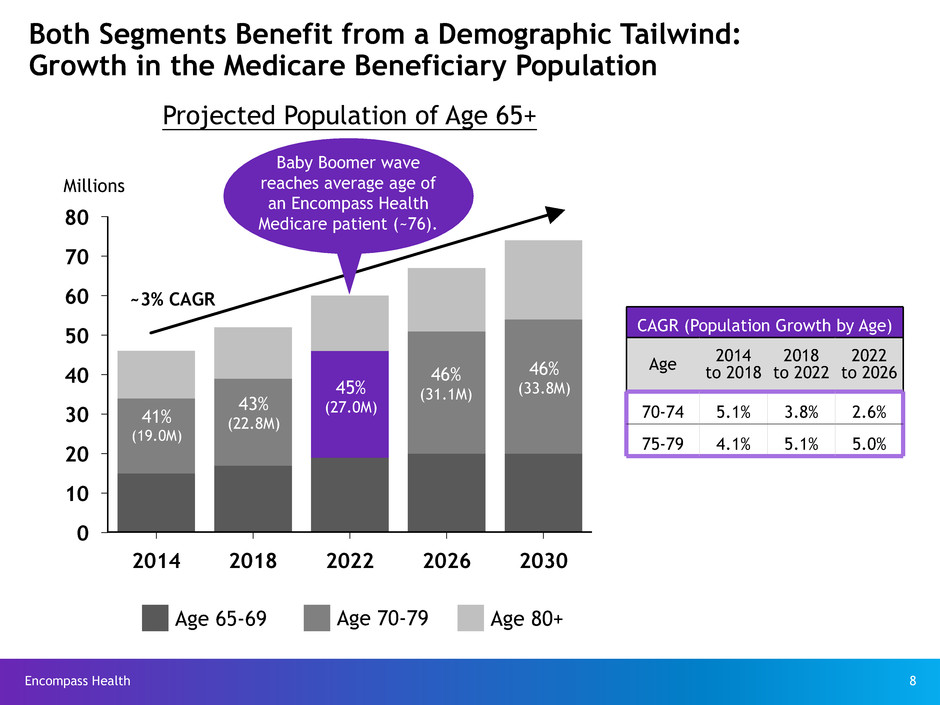
Encompass Health 8 80 70 60 50 40 30 20 10 0 2014 2018 2022 2026 2030 Both Segments Benefit from a Demographic Tailwind: Growth in the Medicare Beneficiary Population Projected Population of Age 65+ Age 80+Age 70-79Age 65-69 Millions 41% (19.0M) 43% (22.8M) 45% (27.0M) 46% (31.1M) 46% (33.8M) CAGR (Population Growth by Age) Age 2014to 2018 2018 to 2022 2022 to 2026 70-74 5.1% 3.8% 2.6% 75-79 4.1% 5.1% 5.0% ~3% CAGR Baby Boomer wave reaches average age of an Encompass Health Medicare patient (~76).
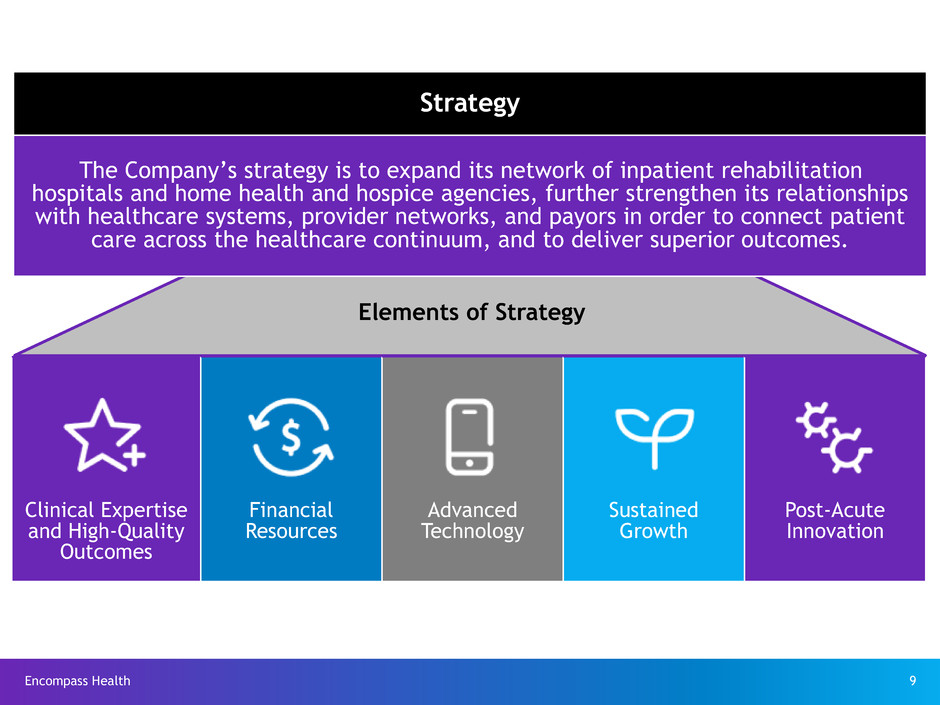
Encompass Health 9 Elements of Strategy Strategy The Company’s strategy is to expand its network of inpatient rehabilitation hospitals and home health and hospice agencies, further strengthen its relationships with healthcare systems, provider networks, and payors in order to connect patient care across the healthcare continuum, and to deliver superior outcomes. Clinical Expertise and High-Quality Outcomes Financial Resources Advanced Technology Sustained Growth Post-Acute Innovation
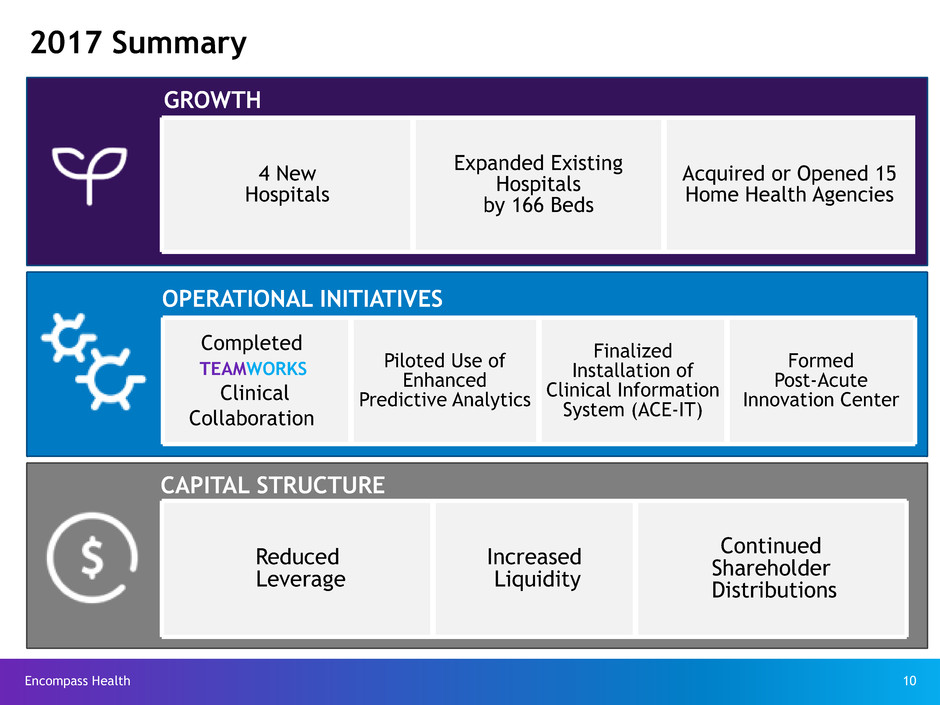
Encompass Health 10 2017 Summary GROWTH CAPITAL STRUCTURE OPERATIONAL INITIATIVES 4 New Hospitals Expanded Existing Hospitals by 166 Beds Acquired or Opened 15 Home Health Agencies Piloted Use of Enhanced Predictive Analytics Finalized Installation of Clinical Information System (ACE-IT) Formed Post-Acute Innovation Center Reduced Leverage Increased Liquidity Continued Shareholder Distributions Completed Clinical Collaboration TEAMWORKS
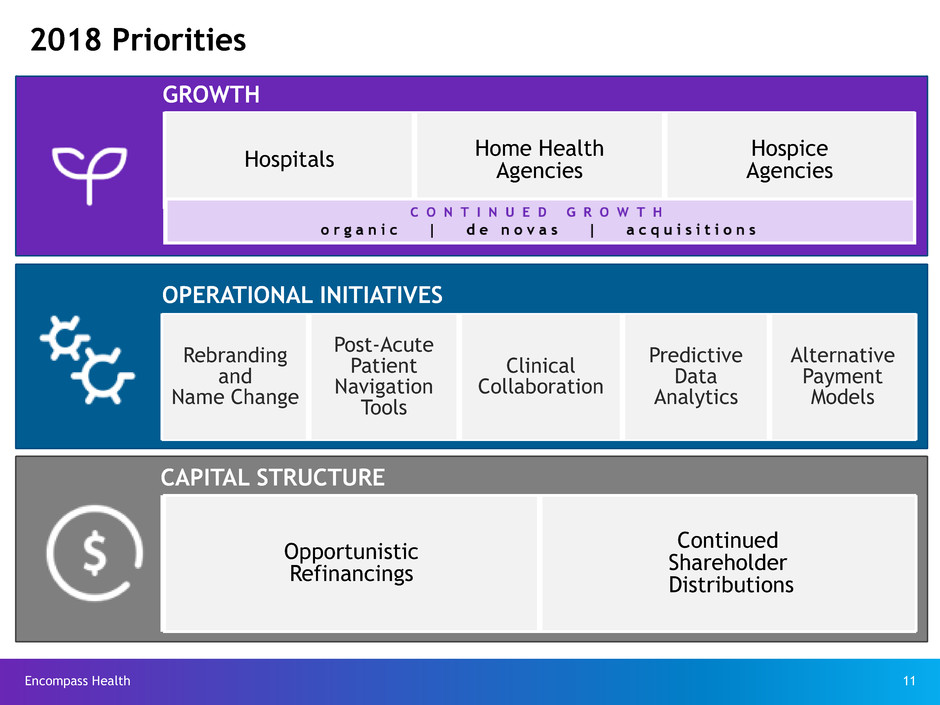
Encompass Health 11 2018 Priorities GROWTH CAPITAL STRUCTURE OPERATIONAL INITIATIVES Hospitals Home HealthAgencies Hospice Agencies Rebranding and Name Change Post-Acute Patient Navigation Tools Clinical Collaboration Predictive Data Analytics Alternative Payment Models Opportunistic Refinancings Continued Shareholder Distributions
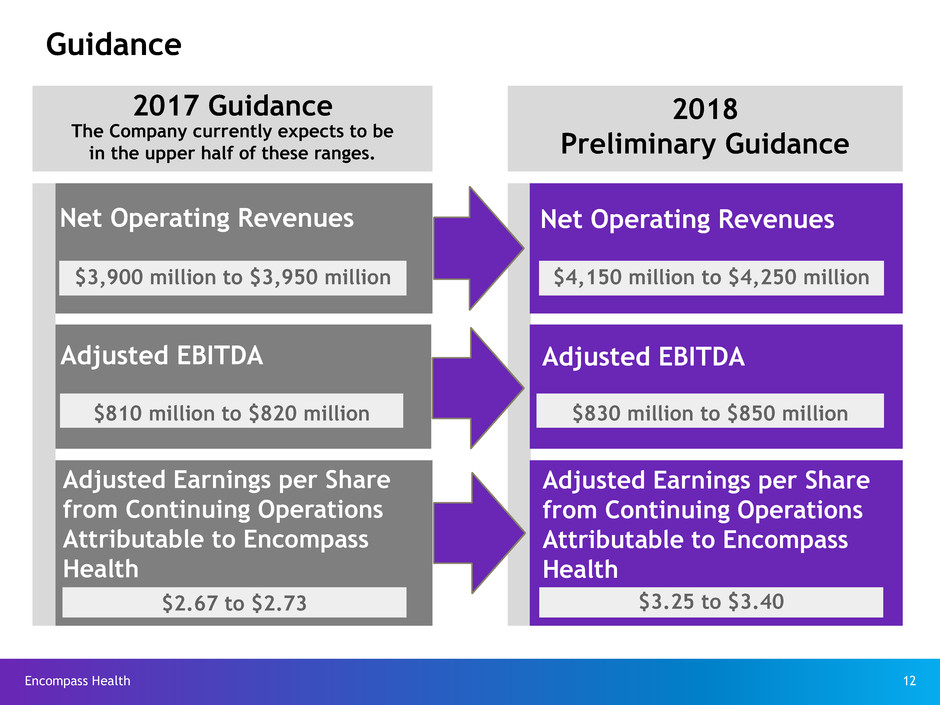
Encompass Health 12 Guidance Adjusted EBITDA Adjusted Earnings per Share from Continuing Operations Attributable to Encompass Health Net Operating Revenues 2017 Guidance The Company currently expects to be in the upper half of these ranges. 2018 Preliminary Guidance Net Operating Revenues Adjusted EBITDA $830 million to $850 million Adjusted Earnings per Share from Continuing Operations Attributable to Encompass Health $3.25 to $3.40 $3,900 million to $3,950 million $810 million to $820 million $2.67 to $2.73 $4,150 million to $4,250 million
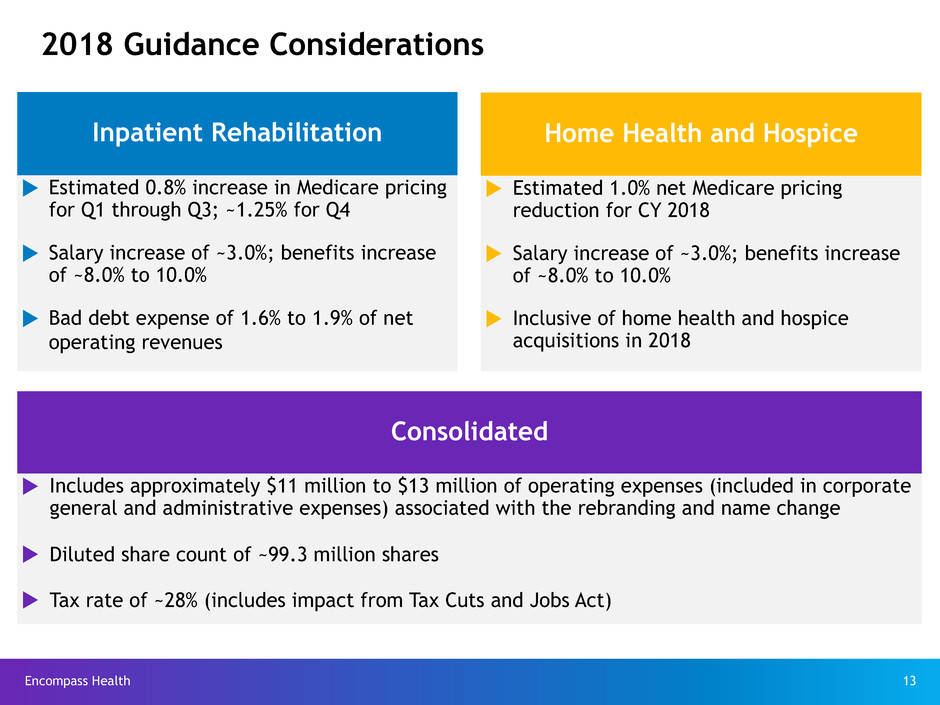
Encompass Health 13 2018 Guidance Considerations Inpatient Rehabilitation u Estimated 0.8% increase in Medicare pricing for Q1 through Q3; ~1.25% for Q4 u Salary increase of ~3.0%; benefits increase of ~8.0% to 10.0% u Bad debt expense of 1.6% to 1.9% of net operating revenues Home Health and Hospice u Estimated 1.0% net Medicare pricing reduction for CY 2018 u Salary increase of ~3.0%; benefits increase of ~8.0% to 10.0% u Inclusive of home health and hospice acquisitions in 2018 Consolidated u Includes approximately $11 million to $13 million of operating expenses (included in corporate general and administrative expenses) associated with the rebranding and name change u Diluted share count of ~99.3 million shares u Tax rate of ~28% (includes impact from Tax Cuts and Jobs Act)
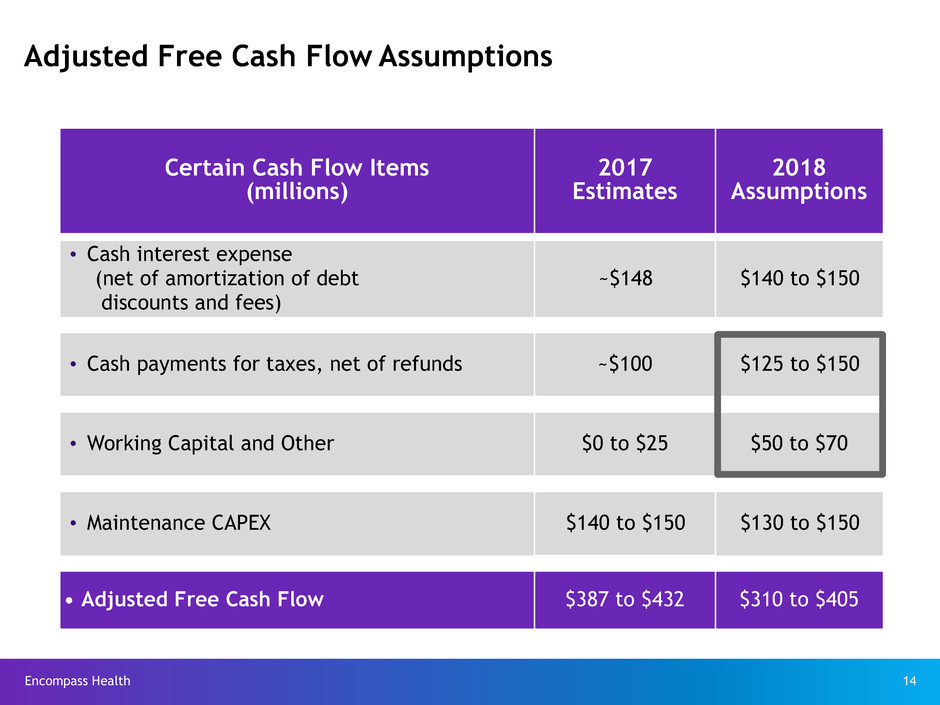
Encompass Health 14 Adjusted Free Cash Flow Assumptions Certain Cash Flow Items (millions) 2017 Estimates 2018 Assumptions • Cash interest expense (net of amortization of debt discounts and fees) ~$148 $140 to $150 • Cash payments for taxes, net of refunds ~$100 $125 to $150 • Working Capital and Other $0 to $25 $50 to $70 • Maintenance CAPEX $140 to $150 $130 to $150 • Adjusted Free Cash Flow $387 to $432 $310 to $405
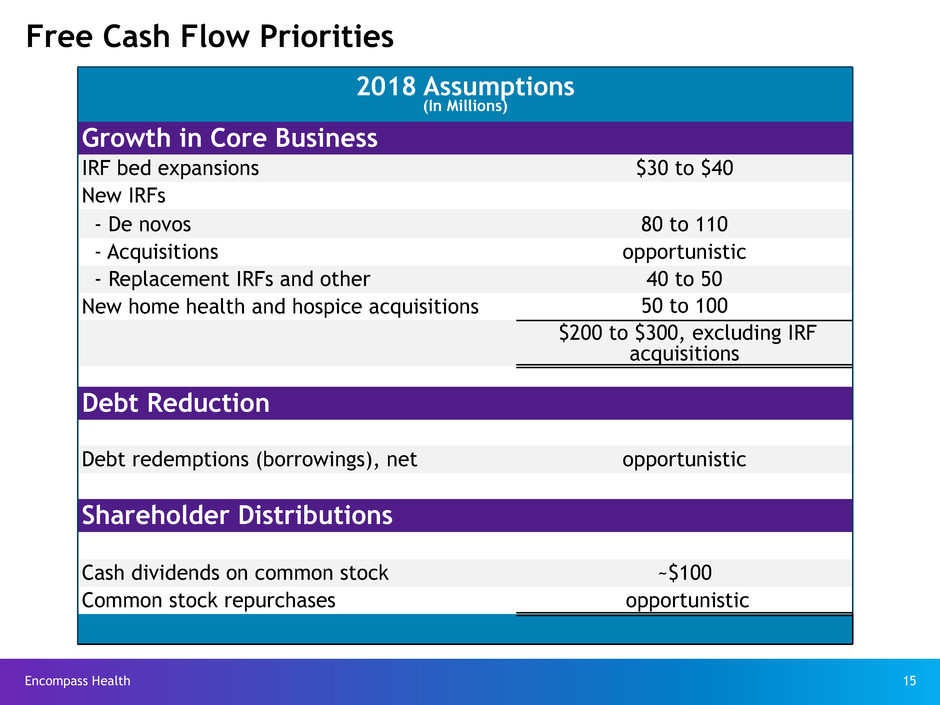
Encompass Health 15 Free Cash Flow Priorities 2018 Assumptions (In Millions) Growth in Core Business IRF bed expansions $30 to $40 New IRFs - De novos 80 to 110 - Acquisitions opportunistic - Replacement IRFs and other 40 to 50 New home health and hospice acquisitions 50 to 100 $200 to $300, excluding IRF acquisitions Debt Reduction Debt redemptions (borrowings), net opportunistic Shareholder Distributions Cash dividends on common stock ~$100 Common stock repurchases opportunistic 2018 Assumptions
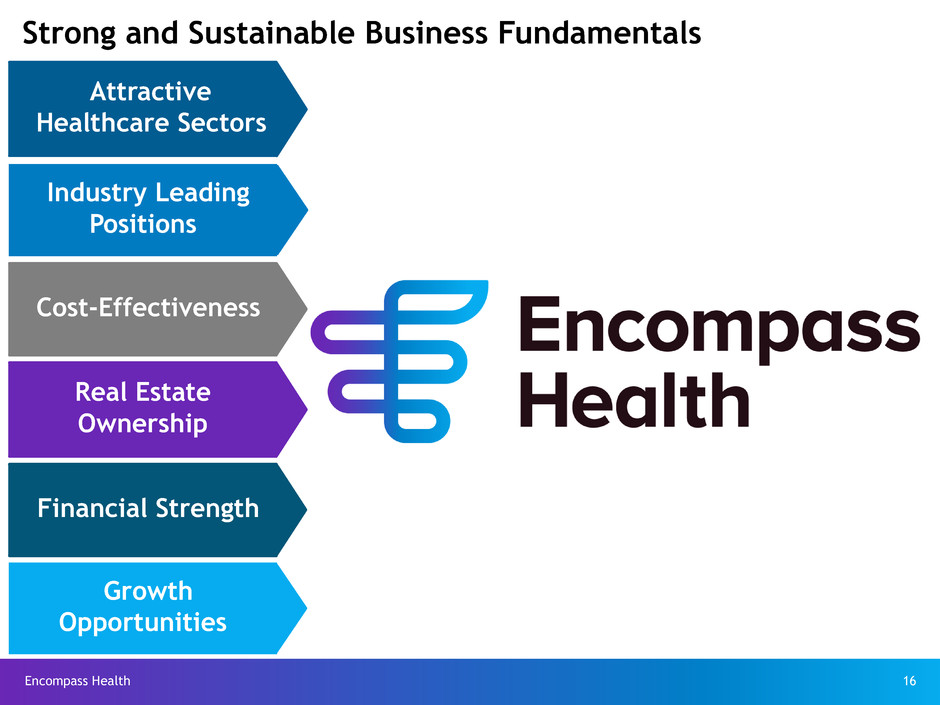
Encompass Health 16 Strong and Sustainable Business Fundamentals Real Estate Ownership Attractive Healthcare Sectors Growth Opportunities Cost-Effectiveness Financial Strength Industry Leading Positions
Committed to Delivering High-Quality, Cost-Effective Care Across the Post-Acute Continuum


