
2023 Investor Day Encompass Health
2 The information contained in this presentation includes certain estimates, projections and other forward-looking information that reflect Encompass Health’s current outlook, views and plans with respect to future events, including the business outlook and guidance, labor availability and costs, legislative and regulatory developments, strategy, capital expenditures, acquisition and other development activities, such as the de novo pipeline, costs, growth and timelines, operational initiatives, dividend strategies, leverage, repurchases of securities, effective tax rates, financial performance, financial assumptions, business model, balance sheet and cash flow plans, and addressable market size. These estimates, projections and other forward-looking information are based on assumptions the Company believes, as of the date hereof, are reasonable. Inevitably, there will be differences between such estimates and actual events or results, and those differences may be material. There can be no assurance any estimates, projections or forward-looking information will be realized. All such estimates, projections and forward-looking information speak only as of the date hereof. Encompass Health undertakes no duty to publicly update or revise the information contained herein. You are cautioned not to place undue reliance on the estimates, projections and other forward-looking information in this presentation as they are based on current expectations and general assumptions and are subject to various risks, uncertainties and other factors, including those set forth in the Form 10-K for the year ended December 31, 2022, the Form 10-Q for the quarter ended March 31, 2023, the Form 10-Q for the quarter ended June 30, 2023, and in other documents Encompass Health filed and to be filed with the SEC, many of which are beyond Encompass Health’s control, that may cause actual events or results to differ materially from the views, beliefs and estimates expressed herein. Note regarding presentation of non-GAAP financial measures The following presentation includes certain “non-GAAP financial measures” as defined in Regulation G under the Securities Exchange Act of 1934, including Adjusted EBITDA, leverage ratios, adjusted earnings per share, and adjusted free cash flow. Schedules are attached that reconcile the non-GAAP financial measures included in the following presentation to the most directly comparable financial measures calculated and presented in accordance with Generally Accepted Accounting Principles in the United States. The Q2 Earnings Release Form 8-K, which can be found at https://investor.encompasshealth.com, provides further explanation and disclosure regarding Encompass Health’s use of non-GAAP financial measures and should be read in conjunction with this supplemental information. Forward-looking statements

2023 Investor Day Encompass Health
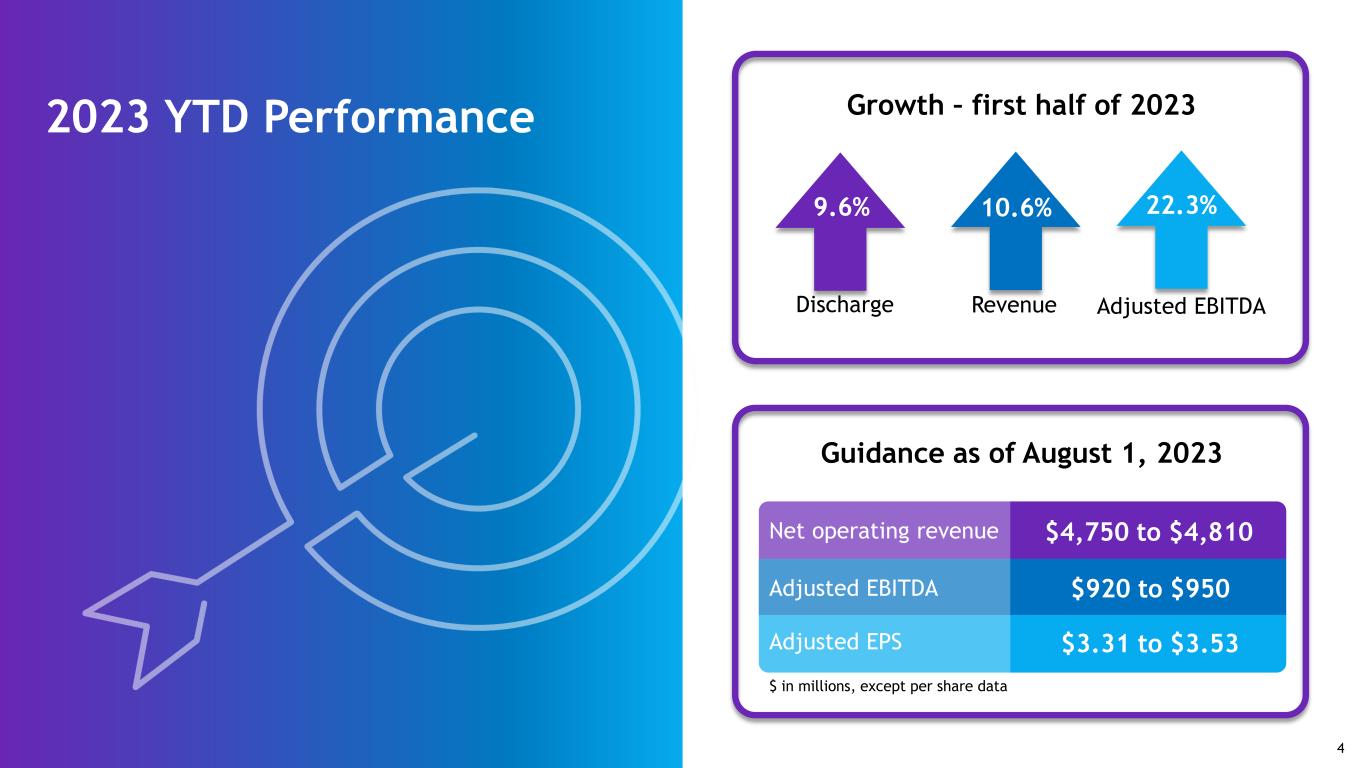
2023 YTD Performance Growth – first half of 2023 Discharge 9.6% Revenue 10.6% Adjusted EBITDA 22.3% Guidance as of August 1, 2023 Net operating revenue $4,750 to $4,810 Adjusted EBITDA $920 to $950 Adjusted EPS $3.31 to $3.53 $ in millions, except per share data 4

Investments since 2009 Clinical and information technology $250+ million • Large data sets • Predictive modeling • Industry leading clinical outcomes • High-quality care at a lower cost compared to peers De novo and bed expansions $1.8+ billion • Opened 51 de novo hospitals • Added more than 1,200 beds to existing hospitals 5

Culture of continuous improvement Managing shift to Medicare Advantage Enhanced recruiting and retention Strong culture of compliance 6

Growing demand for inpatient rehabilitation services 2010 2020 2030 65+ Population 39 million 73 million Number of IRFs added from 2010 to 2022 Conversion rate Industry inclusive of EHC 18 13% Acute care patients who are presumptively eligible for inpatient rehabilitation services and are admitted to an IRF Sources: U.S. Census Bureau, Current Population Survey, Annual Social and Economic Supplement, 2010 & 2020. U.S. Census Bureau, International Database: World Population Estimates and Projections, updated August 2023. Encompass Health 50 Sources: MedPAC March 2018 Report to Congress, page 277. CMS ‘Inpatient Rehabilitation Facility – General Information’ dataset. The conversion rate of inpatient rehabilitation eligible patients is based on patients who are discharged from acute-care hospitals with one or more of 13 specified medical conditions that CMS ties to IRF eligibility based on Medicare fee-for-service data, which is the only publicly available data on the subject. 55 million 7

The central tenets of our strategy remain to: Add capacity via de novos and bed expansions to address an underserved and growing demand for inpatient rehabilitation services Continue to provide high quality outcomes for medically complex patients and to do so in a cost-effective manner Generate strong returns for our shareholders 8

Speakers De novos Doug Coltharp EVP, Chief Financial Officer Melanie Lewis SVP, Chief Business Development Officer Tom Boyle SVP, Chief Design & Construction Officer

A Brief History & ROIC Discussion Doug Coltharp EVP, Chief Financial Officer
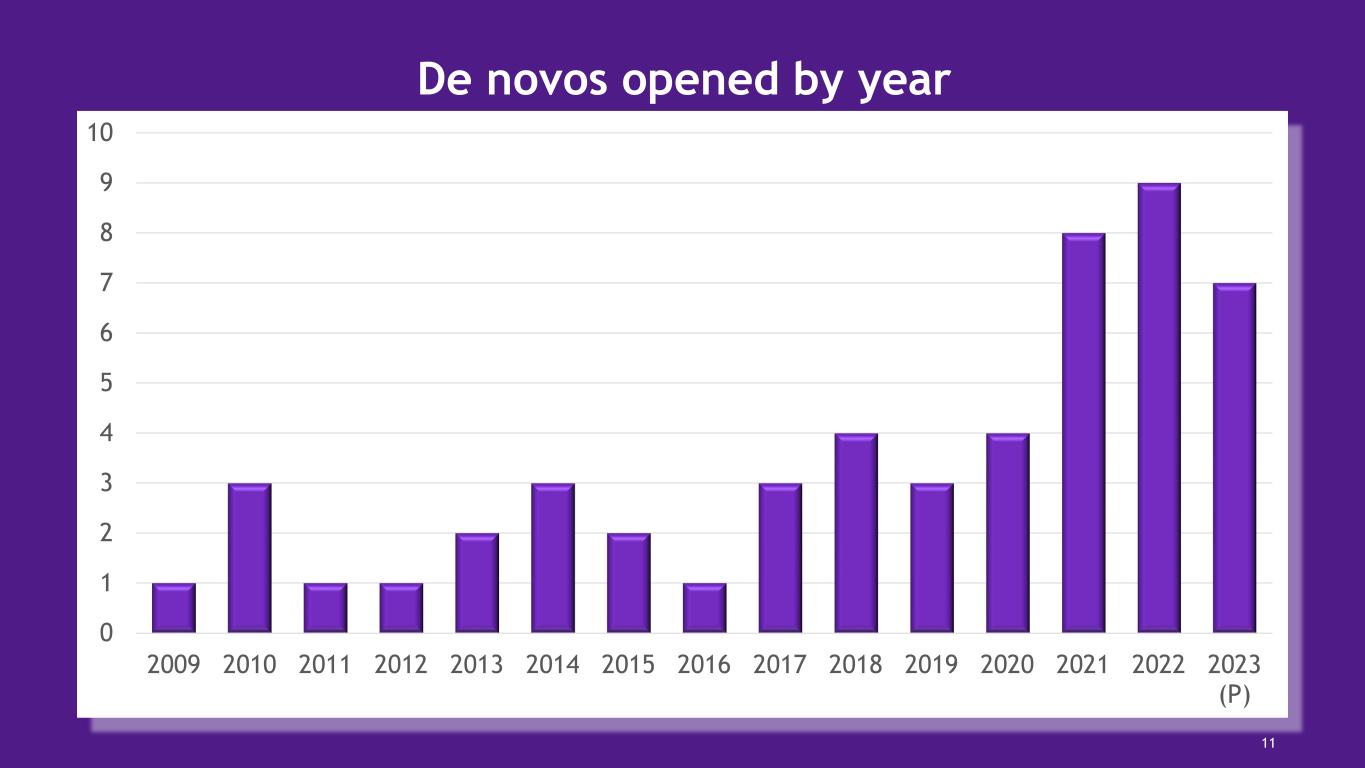
0 1 2 3 4 5 6 7 8 9 10 2009 2010 2011 2012 2013 2014 2015 2016 2017 2018 2019 2020 2021 2022 2023 (P) De novos opened by year 11
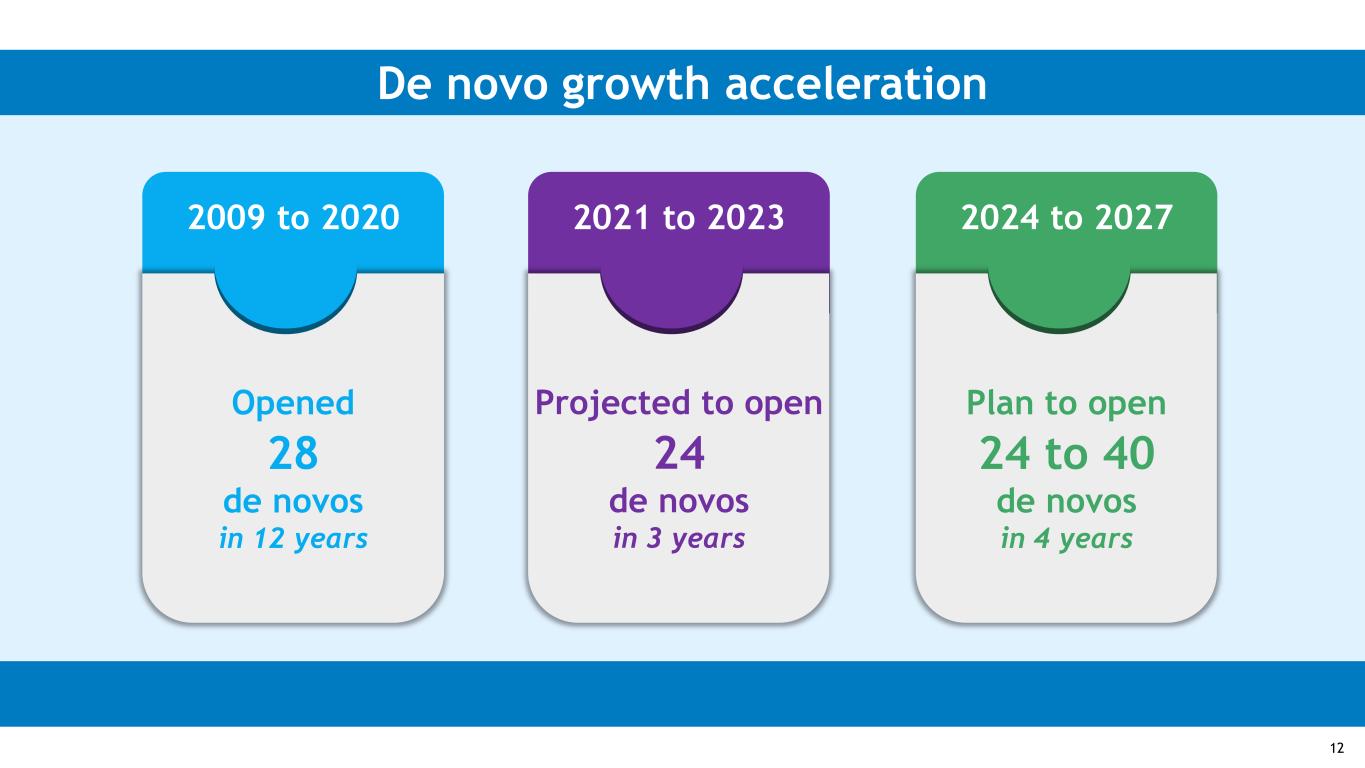
De novo growth acceleration 2009 to 2020 Opened 28 de novos in 12 years 2021 to 2023 Projected to open 24 de novos in 3 years 2024 to 2027 Plan to open 24 to 40 de novos in 4 years 12

Market Selection Melanie Lewis SVP, Chief Business Development Officer
Encompass Health uses a custom-built, data-driven, metrics-based model and ranking system incorporating metrics highly correlated to successful extant Encompass Health hospitals. 14

Potential for tax and/or economic incentives Factors to consider in identifying potentially attractive markets for incremental IRF capacity JV opportunities – current and future Operations familiarity with state/market Construction considerations: • Site Work • Cost • Timing CON requirements and process Market analytics: • Demographics • Acute care discharges • Competition • Growth potential • Proprietary metrics Other challenges to entry: • State moratorium • Availability of staff Real estate considerations: • Size • Typography • Zoning • Land cost 15

CMS claims CMS cost reports CMS enrollment Population & projections Market intel EHC hospitals •Multiple sources of data utilized •Data is combined to calculate meaningful metrics •Metric-based model and rank developed to score markets •Markets sortable based on metrics and model scoring Data Driven Market Analysis 16

Extant Encompass Health markets were analyzed via multiple regressions Attributes most highly correlated to success were identified Algorithm was developed and is applied to high-level CBSA metrics The most promising CBSAs are refined to more granular service area analyses The top ranked service areas are reviewed with Regional operating teams to incorporate local market knowledge Prioritized projects enter internal approval process Target Market Identification Process 17
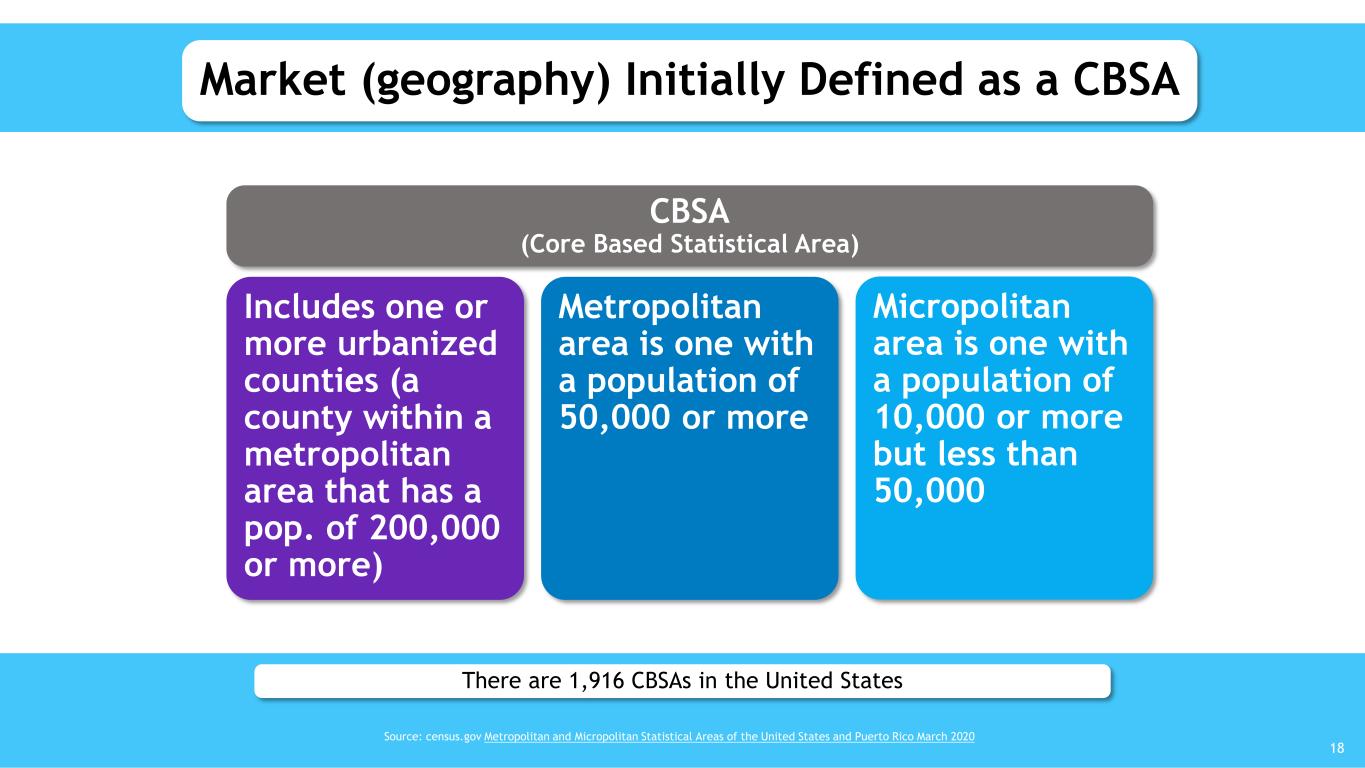
Market (geography) Initially Defined as a CBSA There are 1,916 CBSAs in the United States Source: census.gov Metropolitan and Micropolitan Statistical Areas of the United States and Puerto Rico March 2020 CBSA (Core Based Statistical Area) Includes one or more urbanized counties (a county within a metropolitan area that has a pop. of 200,000 or more) Metropolitan area is one with a population of 50,000 or more Micropolitan area is one with a population of 10,000 or more but less than 50,000 18
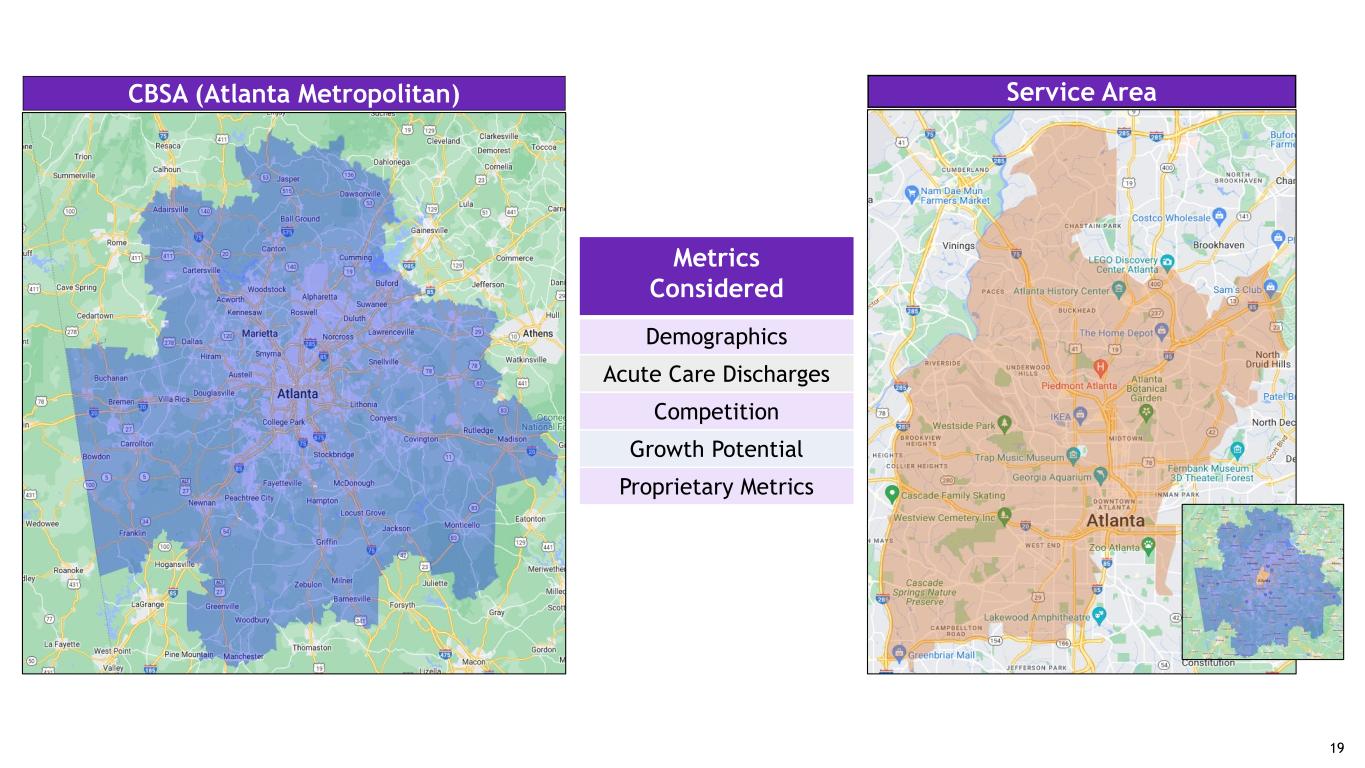
CBSA (Atlanta Metropolitan) Service Area Metrics Considered Demographics Acute Care Discharges Competition Growth Potential Proprietary Metrics 19

Design & Construction Strategy Tom Boyle SVP, Chief Design & Construction Officer

Design & Construction overview De novos Hospital bed addition projects Major renovations Infrastructure programs 6-10 6-10 4-8 Many ~50 projects/year 21

22 Designing & Constructing for patient care 22

Design & Construction Process 23 Operations Nursing Therapy Pharmacy ITG SCO Collaboration/ Innovation Design Construction Operate Feedback / Research & Development Design & Construction process 23

future bed expansion Encompass Health prototype layout 24
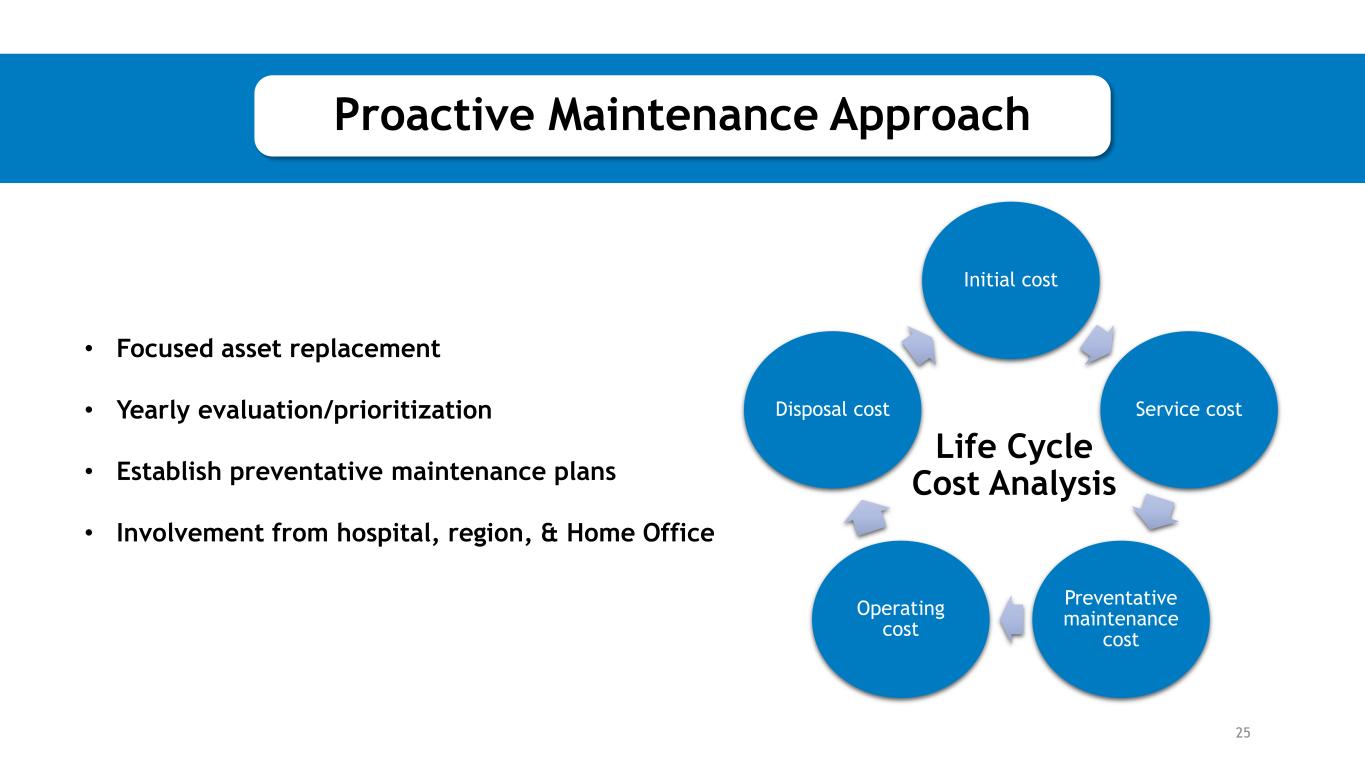
• Focused asset replacement • Yearly evaluation/prioritization • Establish preventative maintenance plans • Involvement from hospital, region, & Home Office 25 Initial cost Service cost Preventative maintenance cost Operating cost Disposal cost Life Cycle Cost Analysis Proactive Maintenance Approach
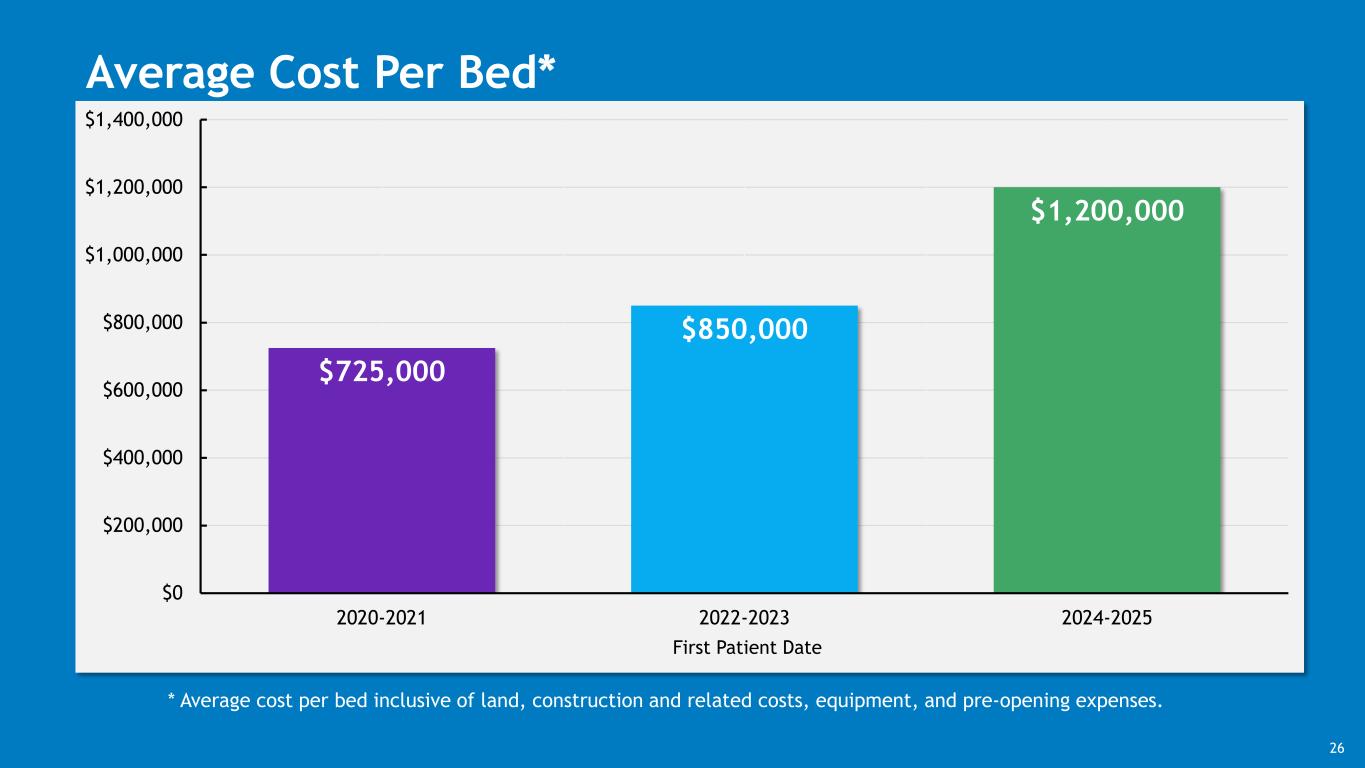
$725,000 $850,000 $1,200,000 $0 $200,000 $400,000 $600,000 $800,000 $1,000,000 $1,200,000 $1,400,000 2020-2021 2022-2023 2024-2025 First Patient Date Average Cost Per Bed* * Average cost per bed inclusive of land, construction and related costs, equipment, and pre-opening expenses. 26
27
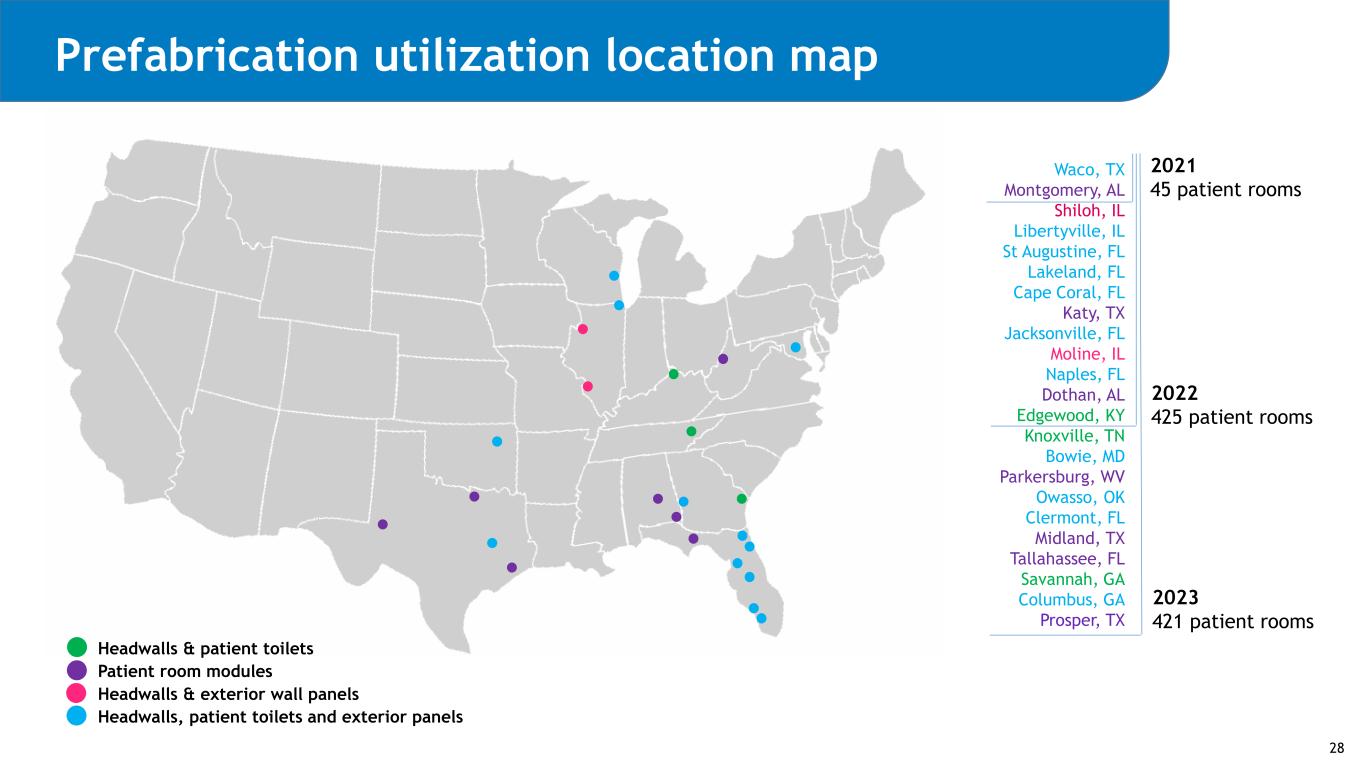
Prefabrication utilization location map Waco, TX Montgomery, AL Shiloh, IL Libertyville, IL St Augustine, FL Lakeland, FL Cape Coral, FL Katy, TX Jacksonville, FL Moline, IL Naples, FL Dothan, AL Edgewood, KY Knoxville, TN Bowie, MD Parkersburg, WV Owasso, OK Clermont, FL Midland, TX Tallahassee, FL Savannah, GA Columbus, GA Prosper, TX 2021 45 patient rooms 2022 425 patient rooms 2023 421 patient rooms Headwalls & patient toilets Patient room modules Headwalls & exterior wall panels Headwalls, patient toilets and exterior panels 28
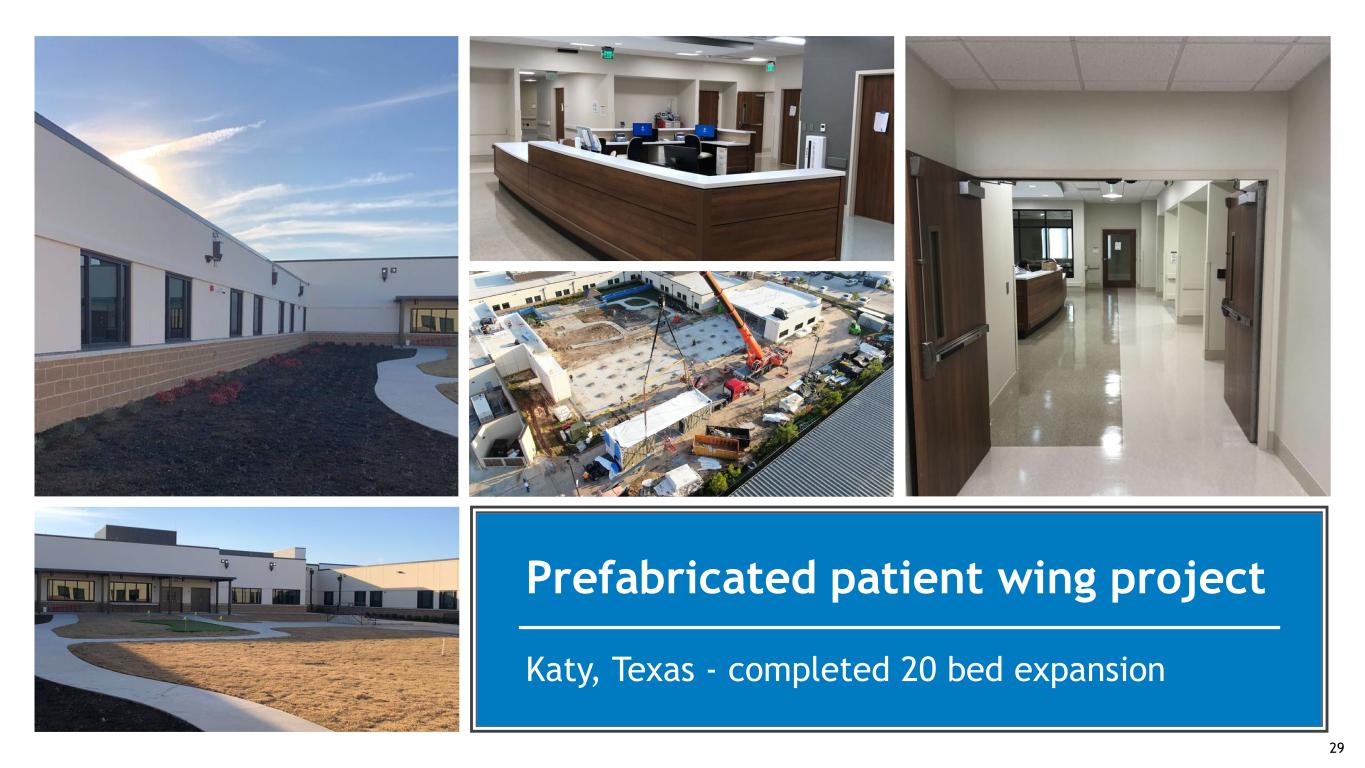
UBER Completed Project Katy, Texas - completed 20 bed expansion Prefabricated patient wing project 29

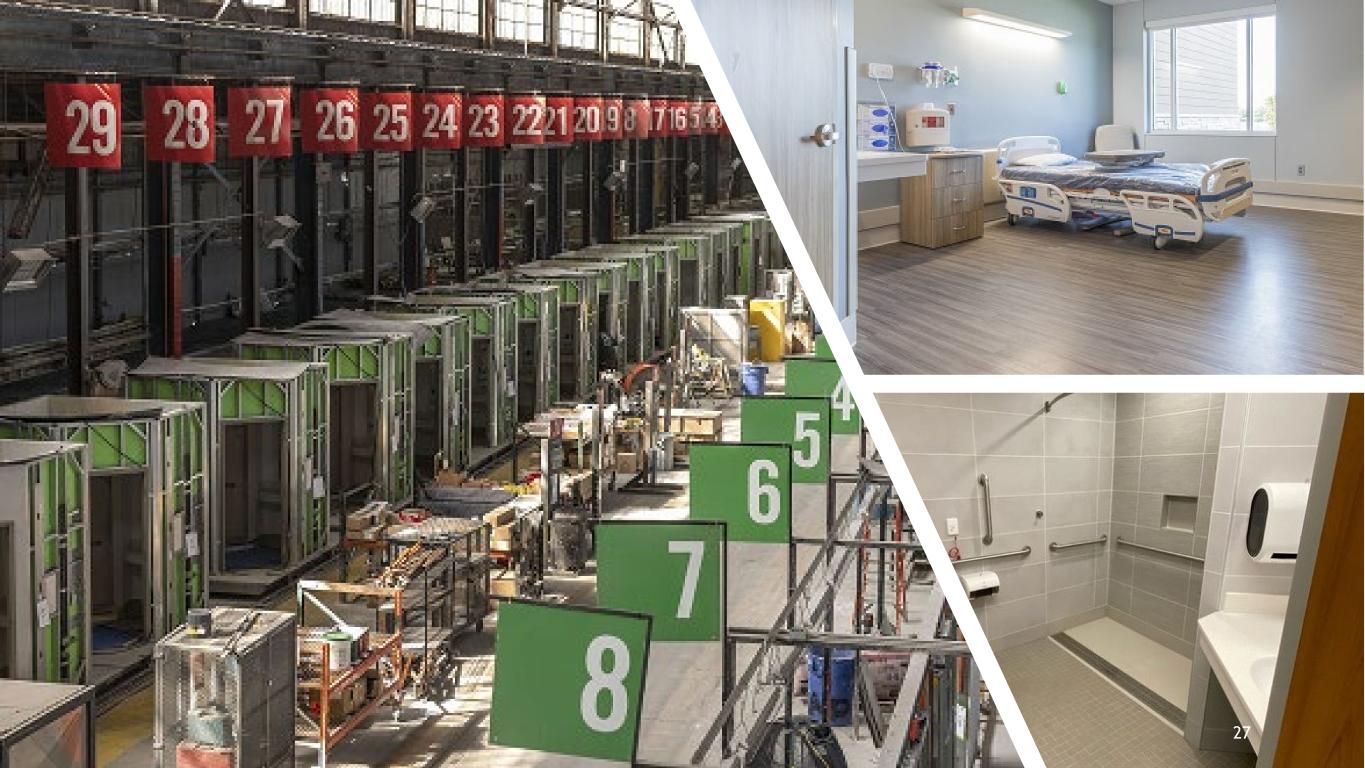
BLOX prefabrication process 30
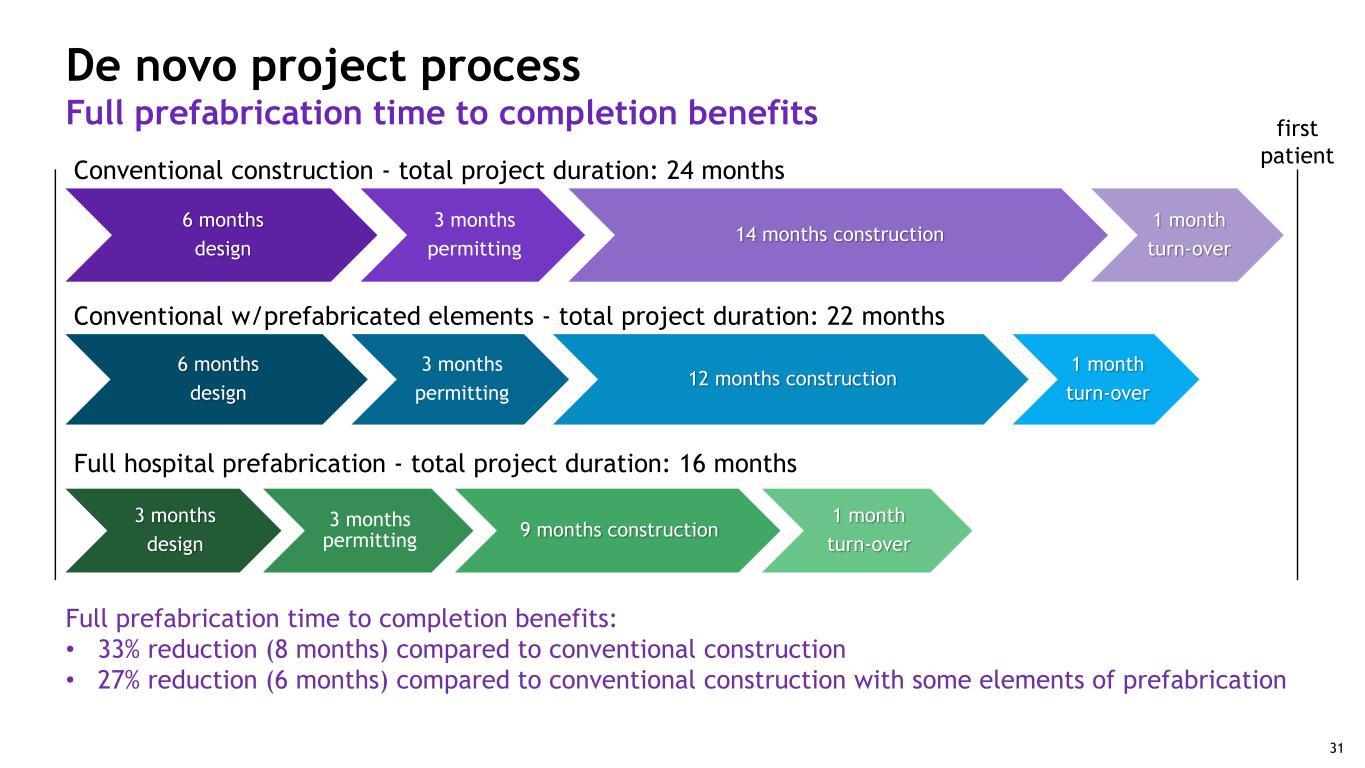
Full hospital prefabrication - total project duration: 16 months 6 months design 3 months permitting 12 months construction 1 month turn-over 3 months design 3 months permitting 9 months construction 1 month turn-over Conventional w/prefabricated elements - total project duration: 22 months first patient De novo project process Full prefabrication time to completion benefits 31Full prefabrication time to completion benefits: • 33% reduction (8 months) compared to conventional construction • 27% reduction (6 months) compared to conventional construction with some elements of prefabrication 6 months design 3 months permitting 14 months construction 1 month turn-over Conventional construction - total project duration: 24 months 31
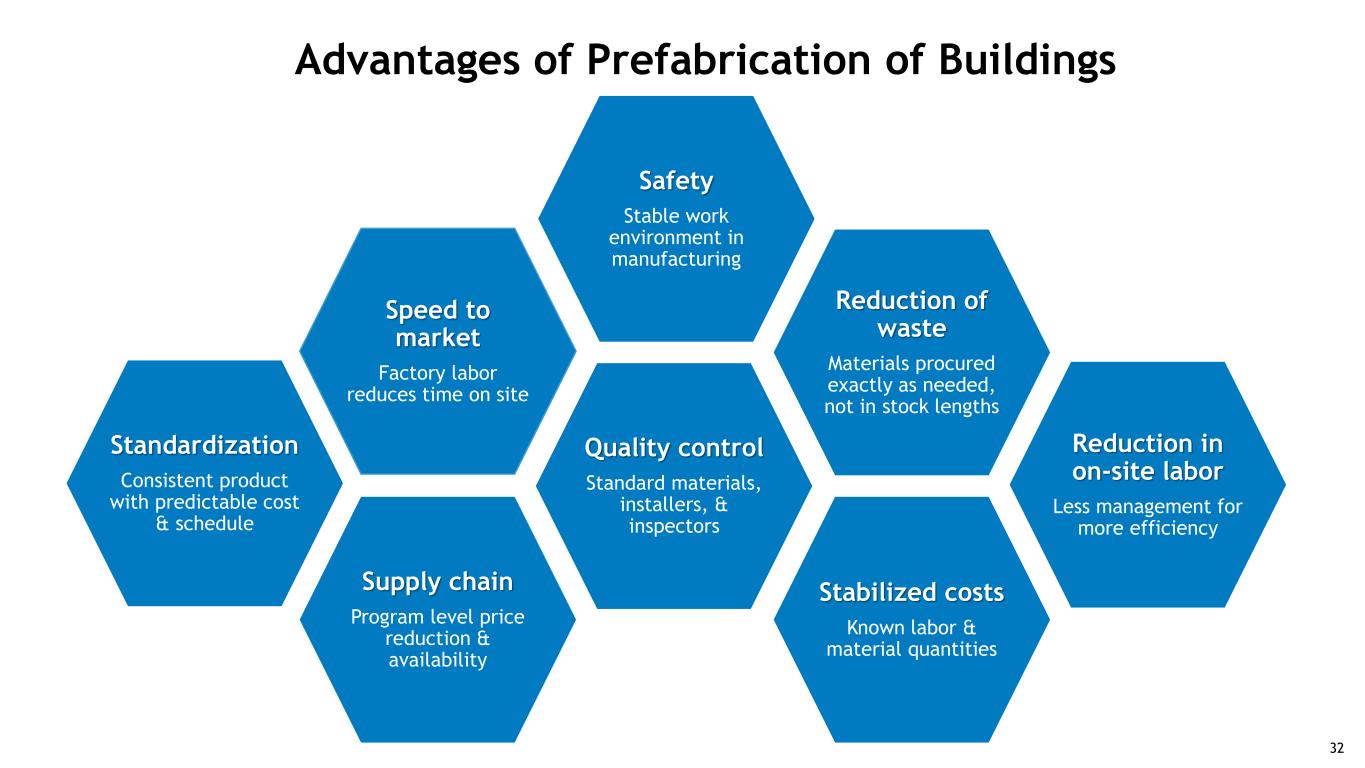
Speed to market Factory labor reduces time on site Standardization Consistent product with predictable cost & schedule Supply chain Program level price reduction & availability Reduction in on-site labor Less management for more efficiency Safety Stable work environment in manufacturing Quality control Standard materials, installers, & inspectors Reduction of waste Materials procured exactly as needed, not in stock lengths Stabilized costs Known labor & material quantities Advantages of Prefabrication of Buildings 32

Speakers Clinical Innovation Rusty Yeager Chief Information Officer Elissa Charbonneau, D.O., M.S. Chief Medical Officer Cheryl Miller, OTR/L, DrOT VP, Therapy Operations Mary Ellen Hatch, MSN, RN, CRRN, FARN VP, Nursing Operations
IT as a Strategic Enabler Rusty Yeager Chief Information Officer

35 35 Post-acute innovation Lead the nation in patient-focused, evidenced-based models that improve outcomes and efficiencies PAYROLL GROUP PIC •Clinical expertise •Large post-acute datasets •Business/technology partners •Proven capabilities in –Enterprise EMR technologies –Data integration –Data analytics/predictive analytics Our digital health strategy leverages: 35

An integrated electronic medical record Treatment plan Document imaging Pre-admission assessment & approval Referral hospitals Quality reporting Discharge planning and patient education Patient medical history Coordinate care and engage patients Registration and billing Clinical notes Ancillary services Point of care medication administration Patient outcomes and safety Operational efficiencies Cost effectiveness Change agility 36

Shifting from technology to strategy 37

Patient documentation Customer relationship management system Proprietary pre-admission patient assessment tool ACE IT and patient revenue system Independent physician approval Patient dischargePatient referral 38 Digital patient journey: patient referral to patient discharge
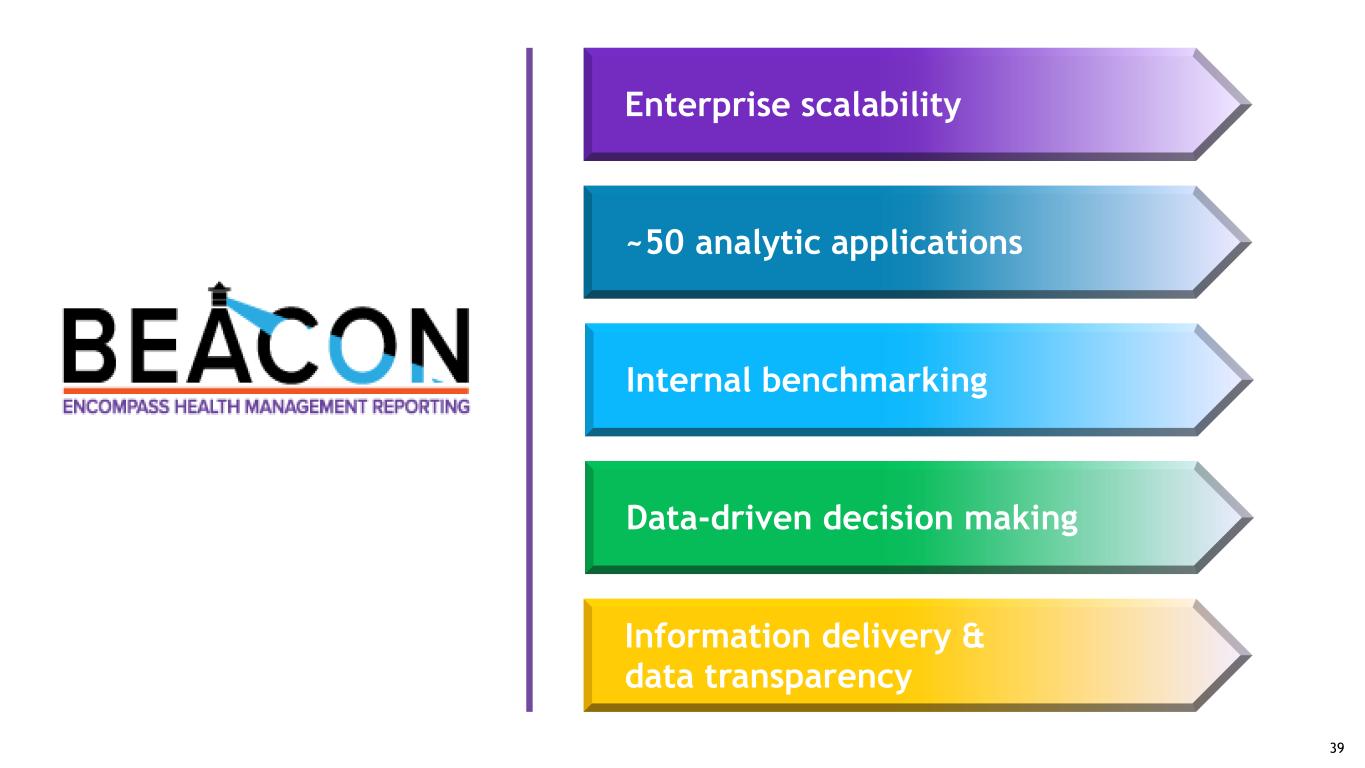
Enterprise scalability Information delivery & data transparency Internal benchmarking ~50 analytic applications Data-driven decision making 39
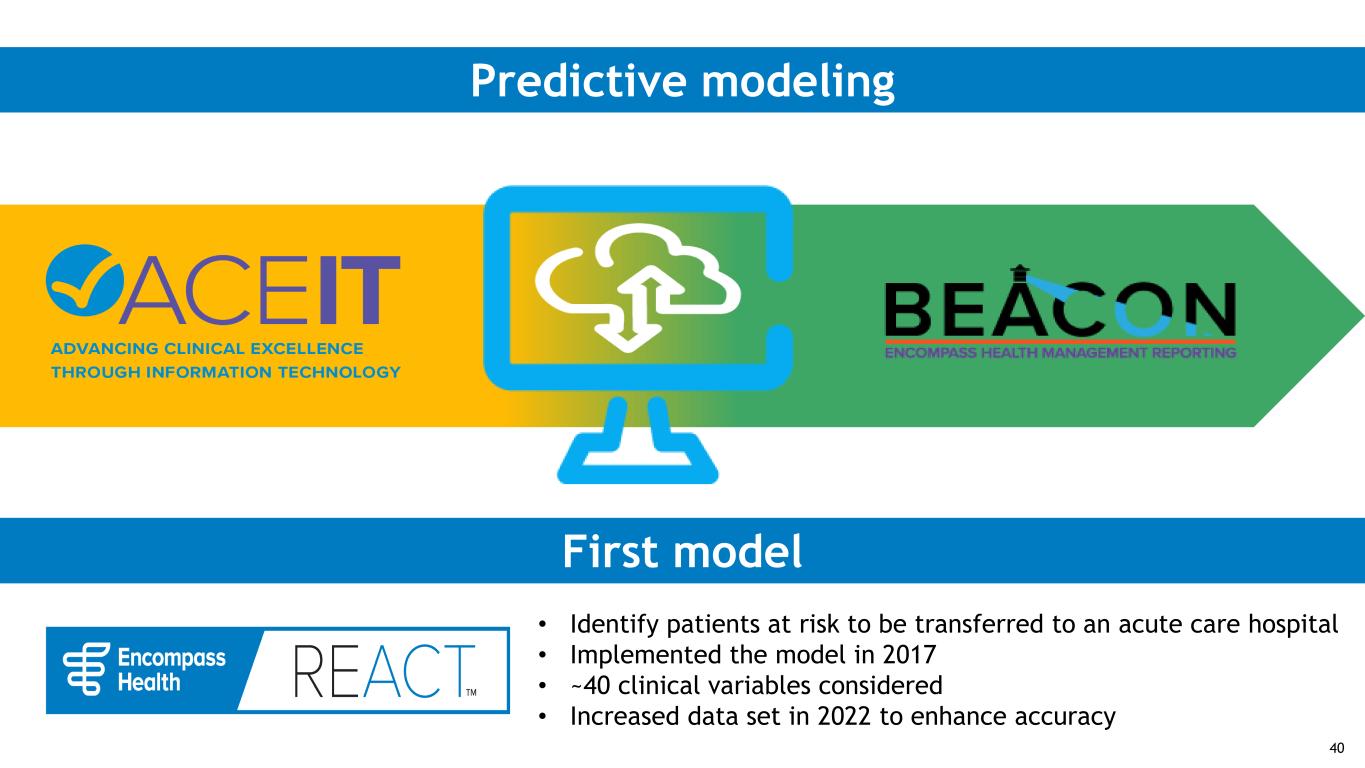
Predictive modeling First model • Identify patients at risk to be transferred to an acute care hospital • Implemented the model in 2017 • ~40 clinical variables considered • Increased data set in 2022 to enhance accuracy 40

Encompass Health’s proprietary technology is a competitive advantage 41
Clinical Integration of Technologies Elissa Charbonneau, D.O., M.S. Chief Medical Officer

Model + Core Practice Strategies = Results 10% 11% 12% • REACT implemented in 2017 • REACT 2.0 implemented in 2022 • Consistent reduction in acute care transfers 43 ACT Rate is the number of acute care discharges as a percent of total discharges. Acute Care Transfer (ACT) rate

Clinicians have the ability to see a patient’s risk score and the related predictors Complimentary tools and workflow strategies include the following: • Physician and nurse notifications • Automated workflow tasks created if patient escalates to very high risk • Trending view of risk score utilized in daily interdisciplinary workflow and communication process ACT risk model identifies risk of readmission during the inpatient rehab stay 44
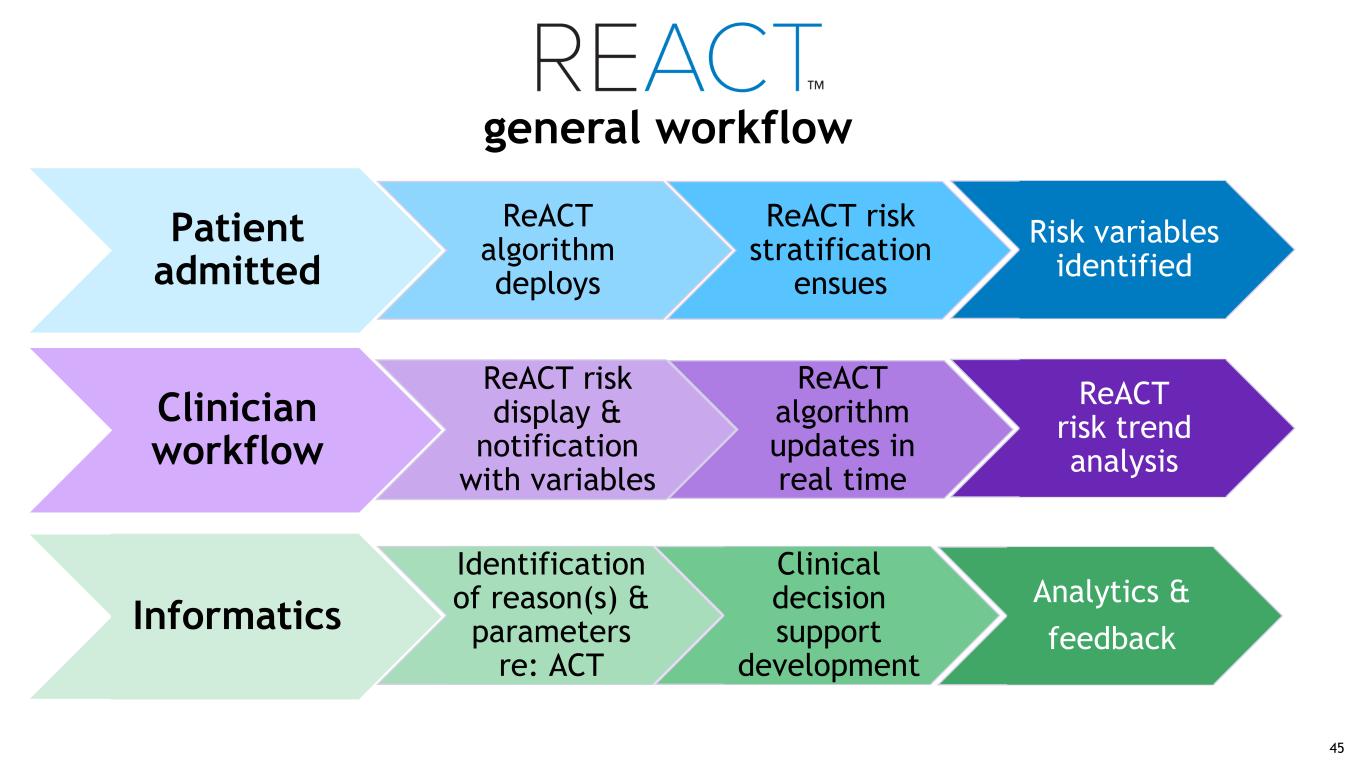
Patient admitted ReACT algorithm deploys ReACT risk stratification ensues Risk variables identified Clinician workflow ReACT risk display & notification with variables ReACT algorithm updates in real time ReACT risk trend analysis Informatics Identification of reason(s) & parameters re: ACT Clinical decision support development Analytics & feedback general workflow 45

Readmission Prevention Program Relies on datasets from 400,000+ patients Readmission risk model Monitors 40+ clinical elements Risk score updates daily Focus of our Case Managers Transition of care documentation Secured 4-day follow-up appointment Medication reconciliation ~24 hours before discharge 24 hour and 5-day follow-up calls Intervention strategies 46

• Upon admission – high risk • Risk model + initial assessments & evaluations guide how to establish unique plan for the patient Fall prevention model Identify risk • High precautions are automated upon admission • Suggested care plan will be initiated and individualized on all patients Establish care plan and customize precautions • Day 3 reminder for nursing & therapy • Weekly reminder with Team Conference • Documentation of re-evaluation of risk and precautions Collaborate & re-evaluate 47
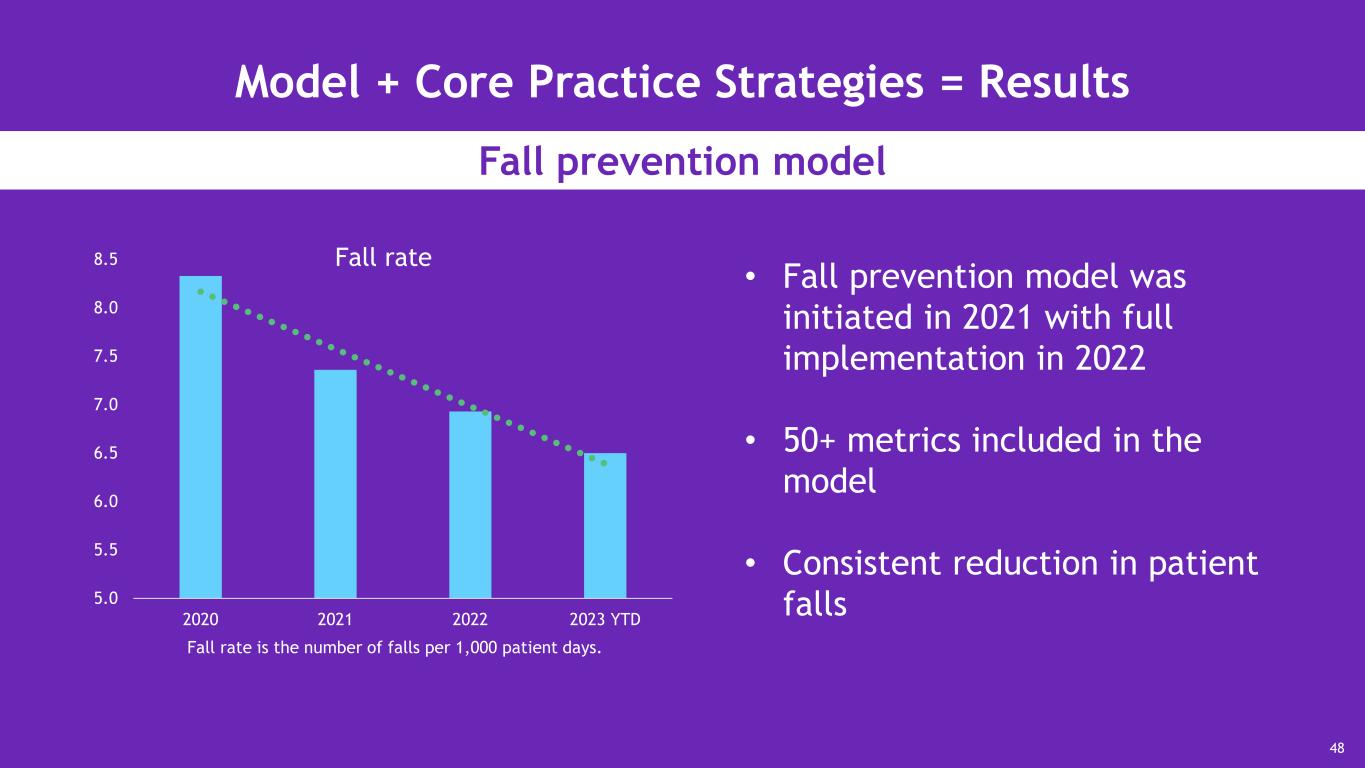
Model + Core Practice Strategies = Results Fall prevention model 5.0 5.5 6.0 6.5 7.0 7.5 8.0 8.5 2020 2021 2022 2023 YTD • Fall prevention model was initiated in 2021 with full implementation in 2022 • 50+ metrics included in the model • Consistent reduction in patient falls 48 Fall rate is the number of falls per 1,000 patient days. Fall rate

Therapy Technologies Cheryl Miller, OTR/L, DrOT Vice President, Therapy Operations

Implementation science: Encompass Health model to implement science into practice Clients, stakeholders, & subject matter experts (SMEs) input and opinions Review of existing data Review of existing science and evidence Clinical recommendation & practice guidelines 50
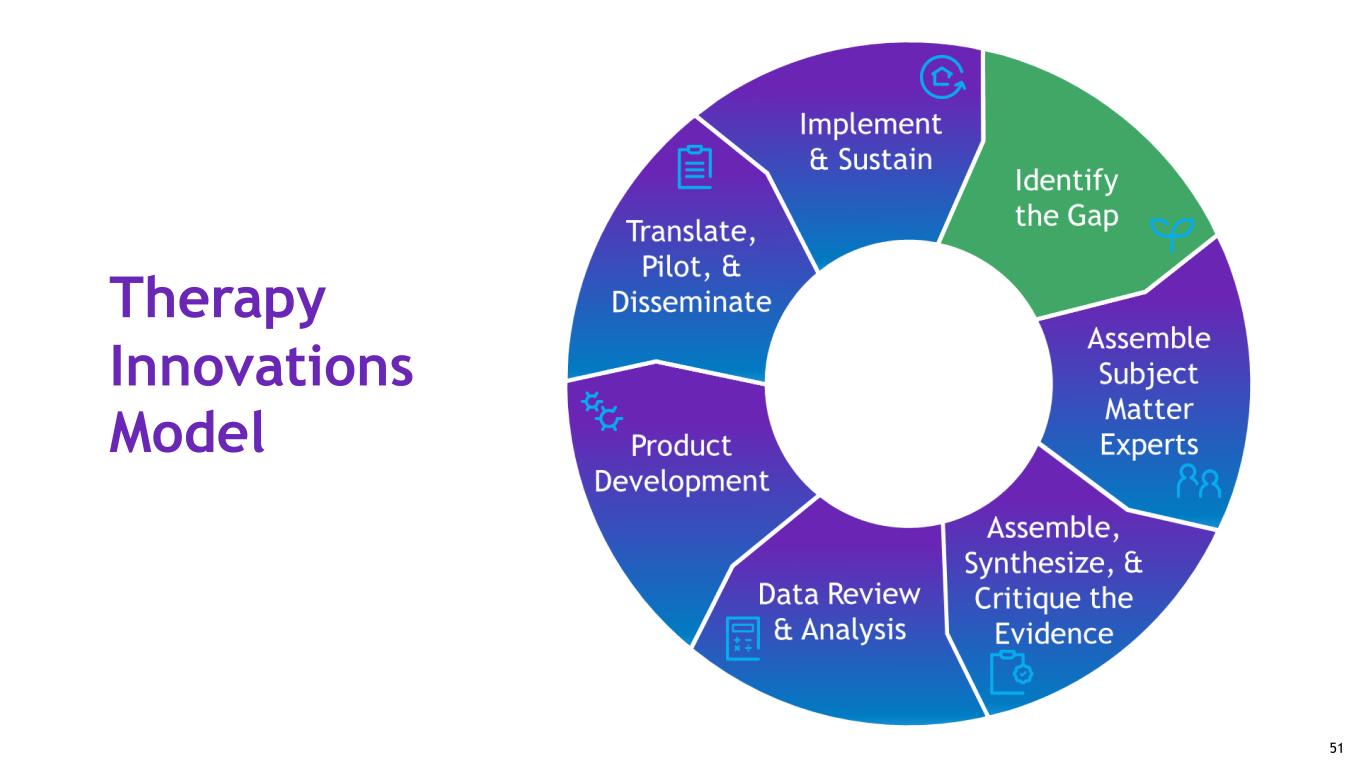
Therapy Innovations Model 51
Our mission is to assess and select innovative solutions to be adopted by Encompass Health. The committee uses standard criteria to implement therapy innovations that aligns with our values and promotes the use of safe, effective, state-of-art therapy technology. The Committee assesses: • Impact to patients • Clinician and physician opinions • Application to our population, ease of use, safety • Pricing and ROI 52

Body-weight support gait technologies Implemented technologies LiteGait® System Vector Ambu® aScope™ Synchrony 4.0 AmpCare ESP™ VitalStim® Dysphasia Cognitive therapy Bioness® Integrated Therapy System (BITS) Specialty therapy Barihab™ XKS Treatment and Assessment Platform Burt® 53
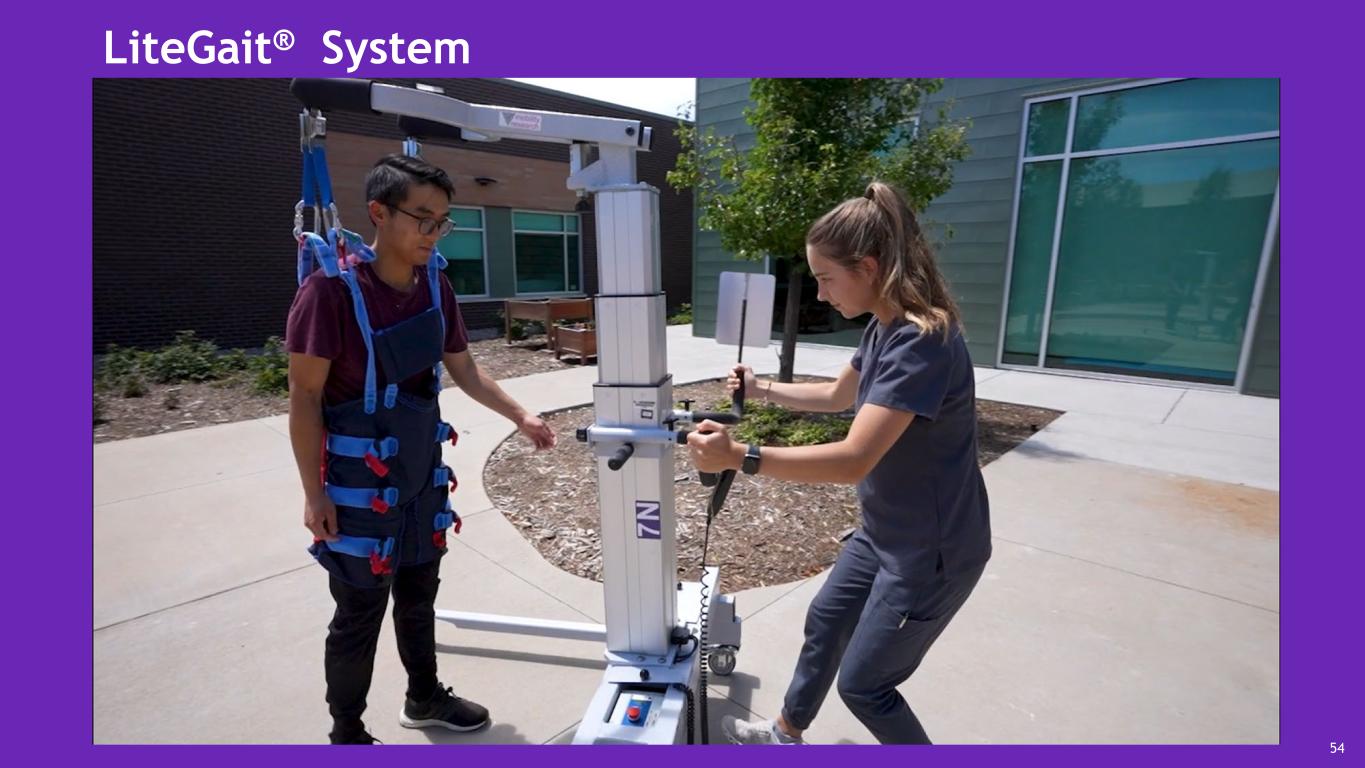
LiteGait® System 54
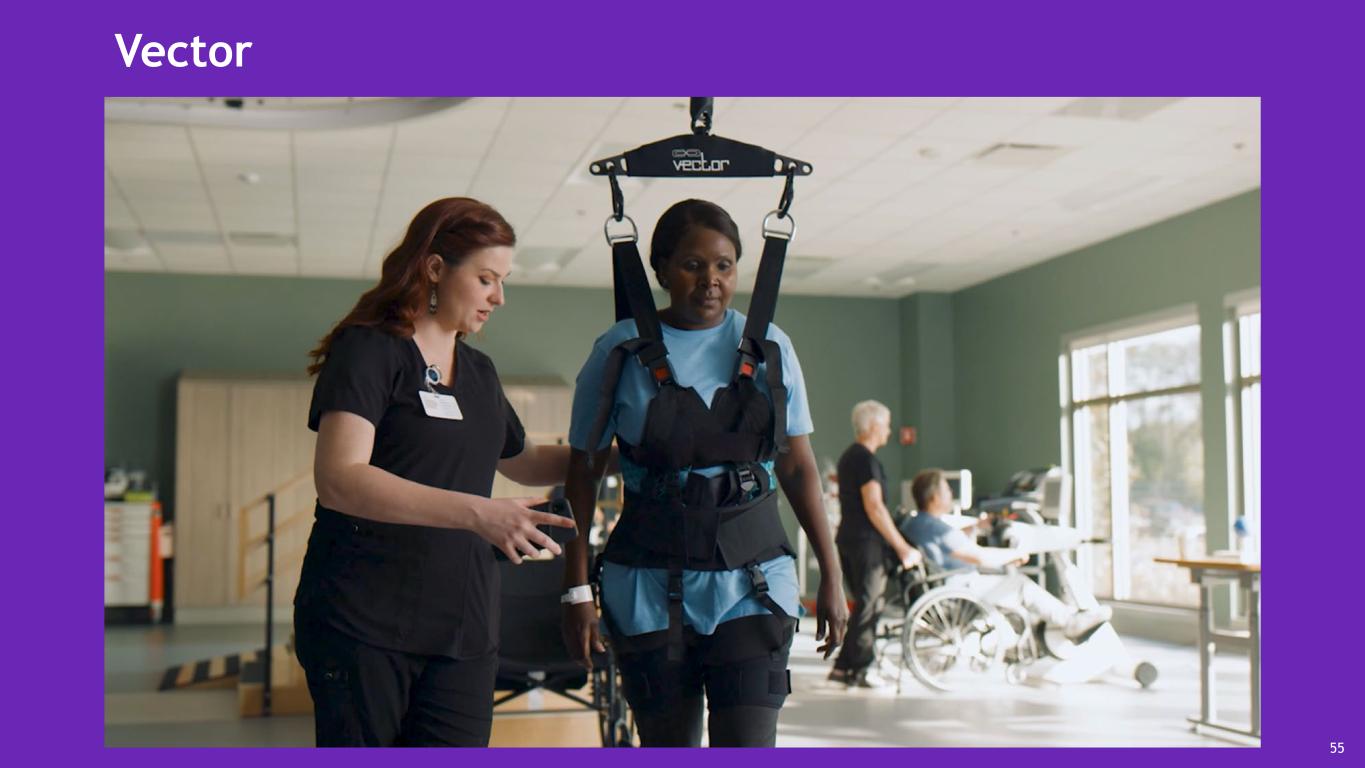
Vector 55

Dysphagia: risks and assessment Risks • Difficulty with eating and drinking • High risk of readmission due to food or liquids passing into lungs • Most common in elderly and rehabilitation patients • Potential severe medical complications Assessment Encompass Health offers instrumental assessments for each patient using the Ambu® aScope™, a flexible endoscope with a tiny camera and light used in the fiber optic evaluation of swallowing (FEES) 56

Dysphagia: oral motor intervention technologies Synchrony 4.0 Designed specifically for speech-language pathologists to help patients visualize swallow activity using virtual reality for better outcomes VitalStim® Technology that electrically stimulates swallow function. This is useful in retraining patients with dysphagia, a condition that causes difficulties when swallowing, especially when associated with brain injury AmpCare ESP™ A portable, non- invasive, dual-channel electrotherapy system which emits electrical current to stimulate nerves that correspond to inactive or atrophied swallowing muscles, which leads to improved swallow function 57

Cognitive therapy technologies Bioness® Integrated Therapy System (BITS) Interactive touchscreen to help individuals with traumatic injuries and movement disorders improve coordination, balance, recall, reaction time and cognitive abilities. 58

Bioness® Integrated Therapy System (BITS) 59
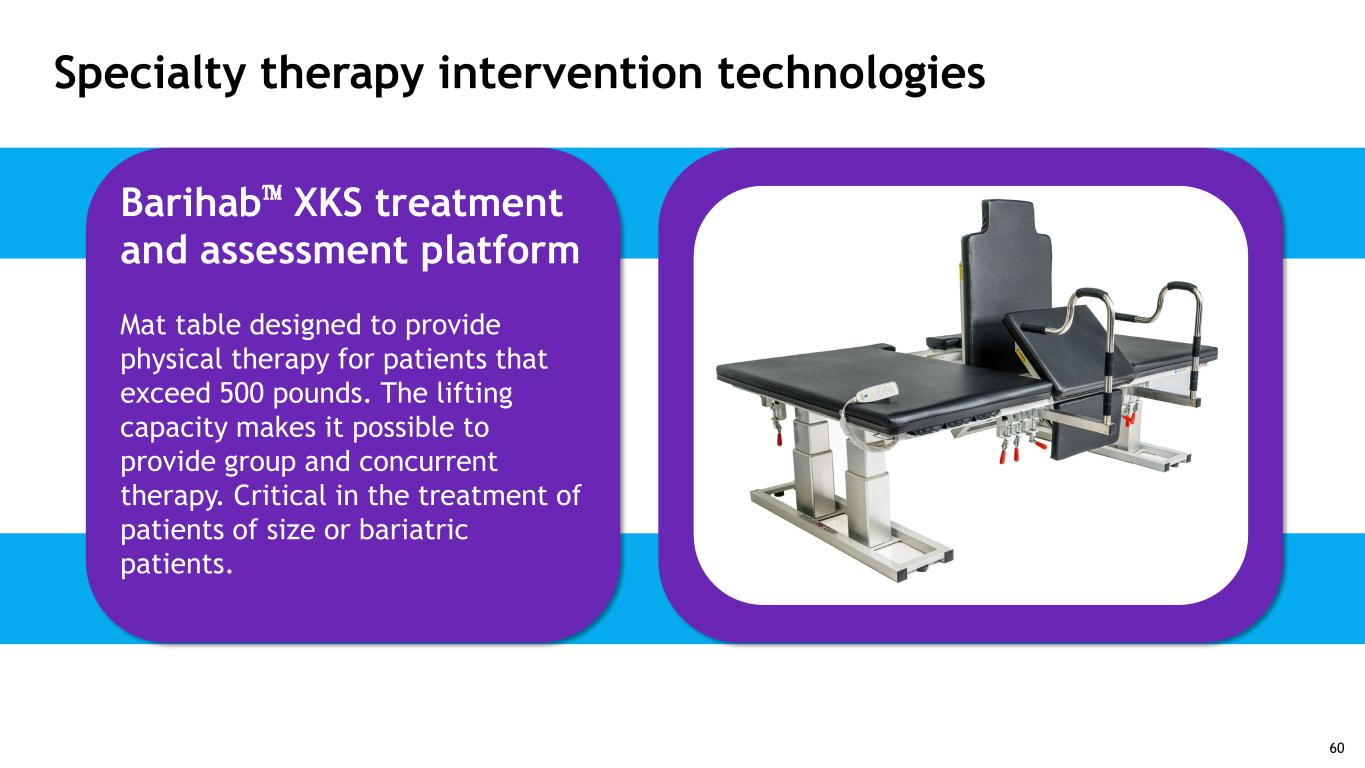
Specialty therapy intervention technologies Barihab™ XKS treatment and assessment platform Mat table designed to provide physical therapy for patients that exceed 500 pounds. The lifting capacity makes it possible to provide group and concurrent therapy. Critical in the treatment of patients of size or bariatric patients. 60

Burt® 61

In-house Dialysis Mary Ellen Hatch, MSN, RN, CRRN, FARN Vice President, Nursing Operations

Dialysis and Tablo Dialysis is a complex process that affects every system in the body • Also affects nutrition, medications, and social support. The dialyzer uses tiny hollow filters that look like microscopic straws called a semi-permeable membrane. As blood moves through these tubes, it encounters a solution called dialysate (an electrolyte solution), an acid solution, and a bicarbonate. 63

In-house dialysis infrastructure Dialysis team: • Nephrologist oversees the program • Dialysis experienced RN staff • Dialysis nursing staff involved with the patient’s overall care plan 64
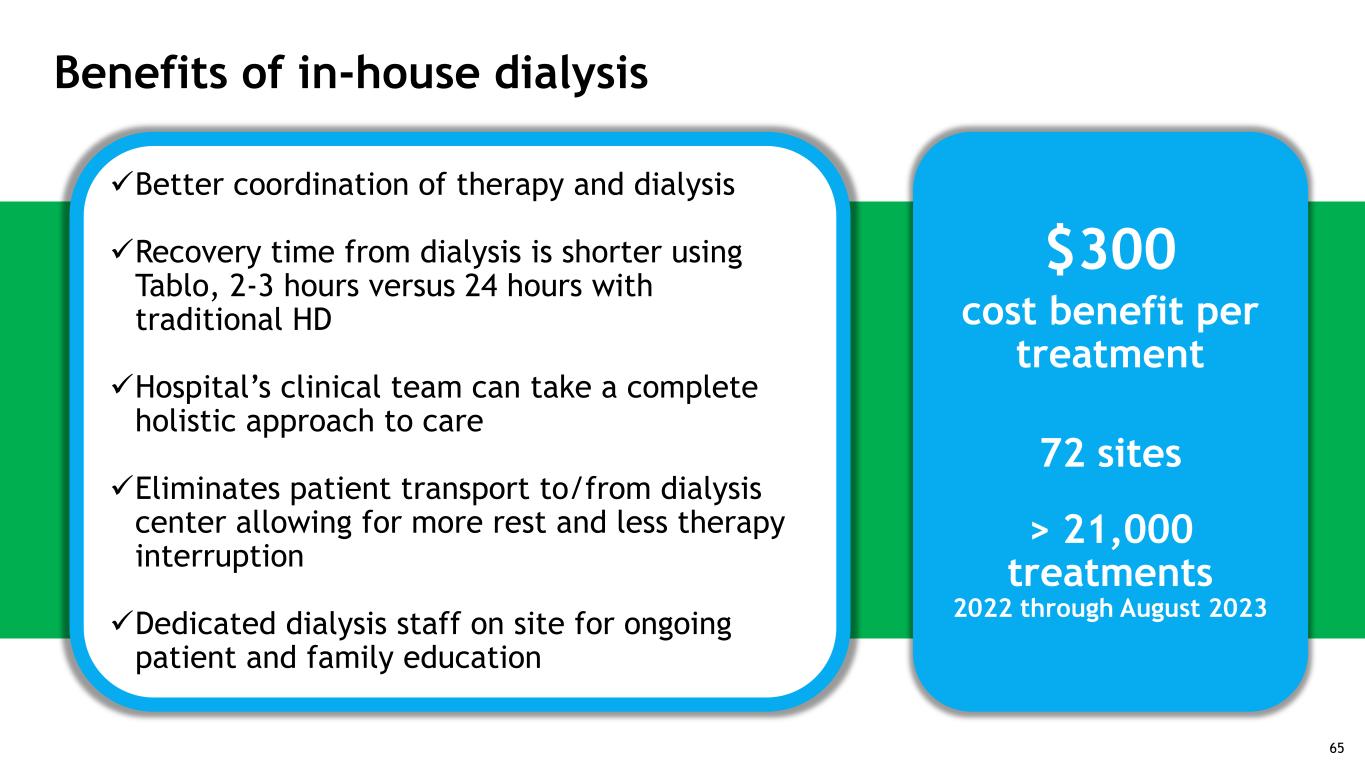
Benefits of in-house dialysis Better coordination of therapy and dialysis Recovery time from dialysis is shorter using Tablo, 2-3 hours versus 24 hours with traditional HD Hospital’s clinical team can take a complete holistic approach to care Eliminates patient transport to/from dialysis center allowing for more rest and less therapy interruption Dedicated dialysis staff on site for ongoing patient and family education $300 cost benefit per treatment 72 sites > 21,000 treatments 2022 through August 2023 65

Joint ventures
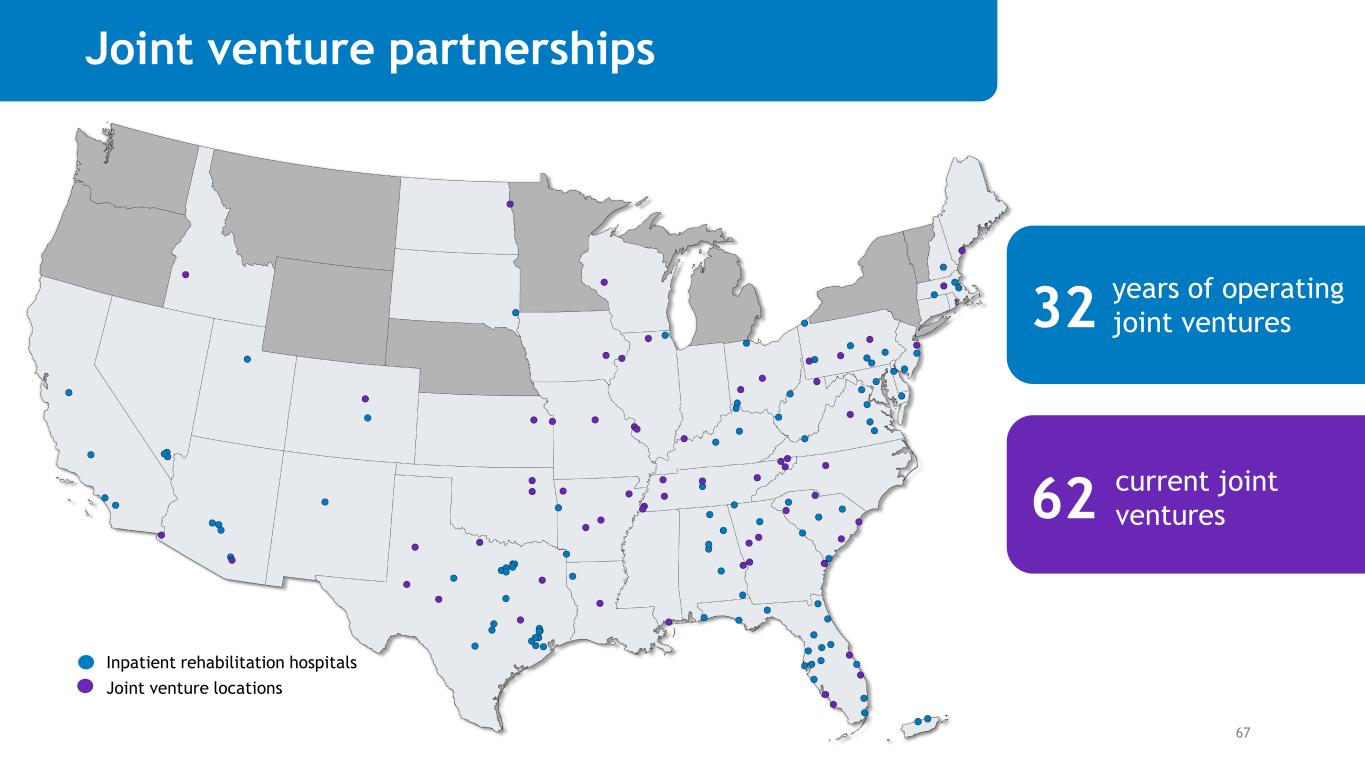
Joint venture partnerships 32 62 years of operating joint ventures current joint ventures 67 Inpatient rehabilitation hospitals Joint venture locations
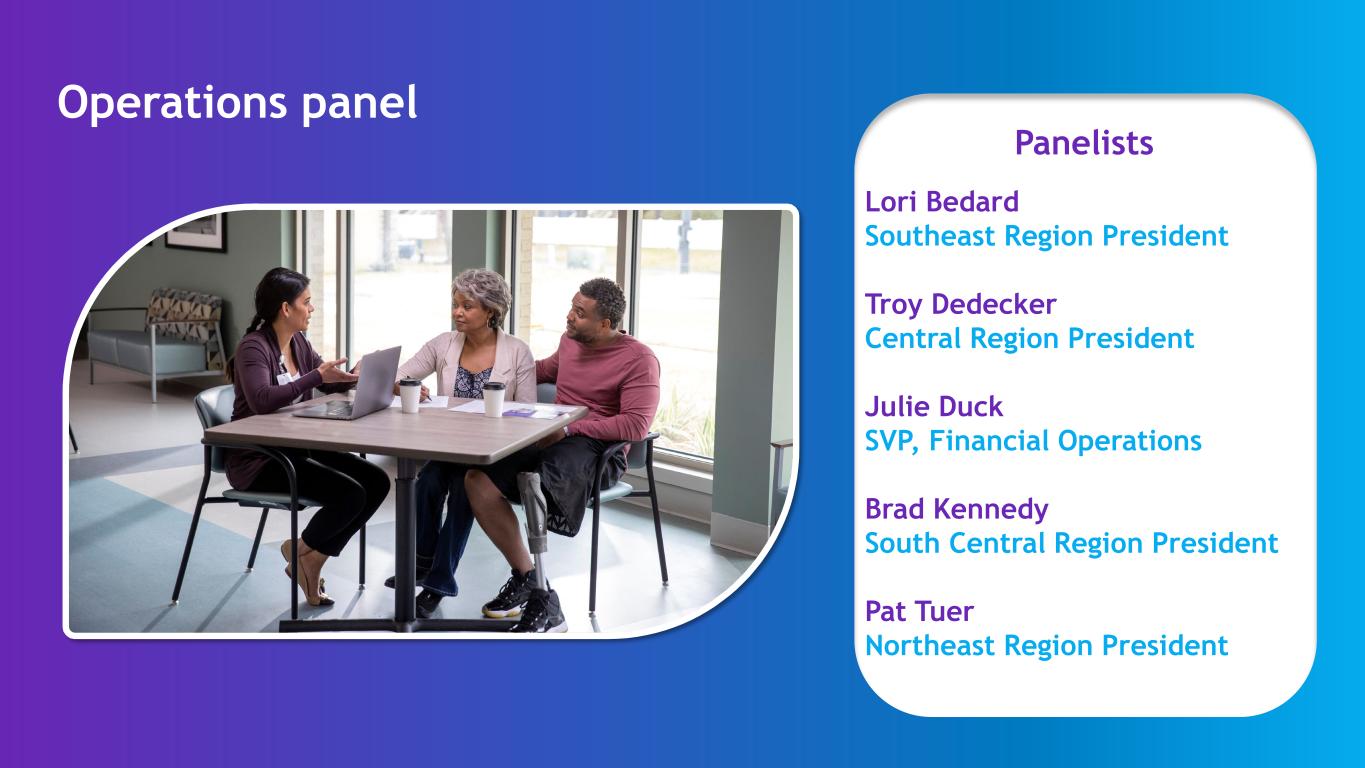
Operations panel Panelists Lori Bedard Southeast Region President Troy Dedecker Central Region President Julie Duck SVP, Financial Operations Brad Kennedy South Central Region President Pat Tuer Northeast Region President
Operations panel • Scale • Standardization • Best practices
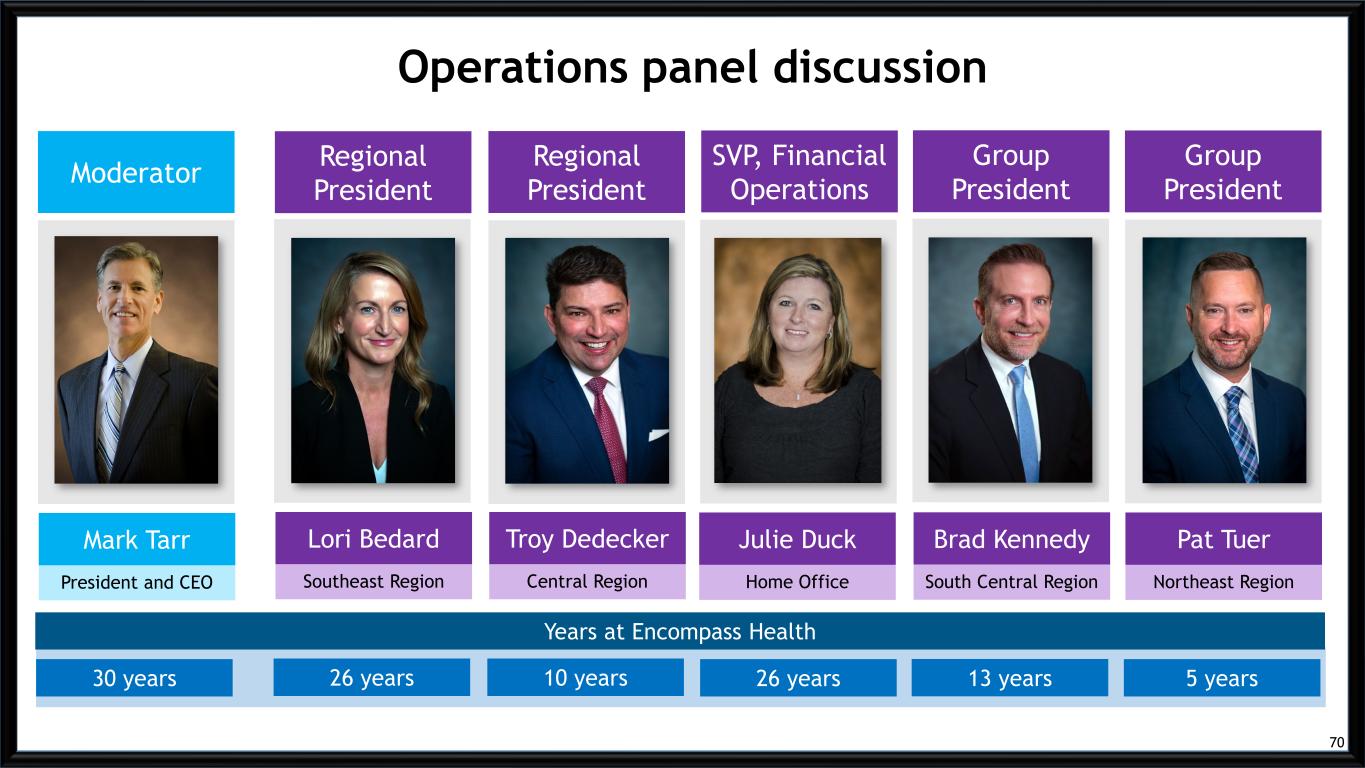
Operations panel discussion Moderator Regional President Regional President Group President Group President SVP, Financial Operations President and CEO Southeast Region Central Region South Central Region Northeast Region Home Office Years at Encompass Health 26 years 10 years 13 years 5 years26 years Mark Tarr Lori Bedard Troy Dedecker Brad Kennedy Pat TuerJulie Duck 30 years 70
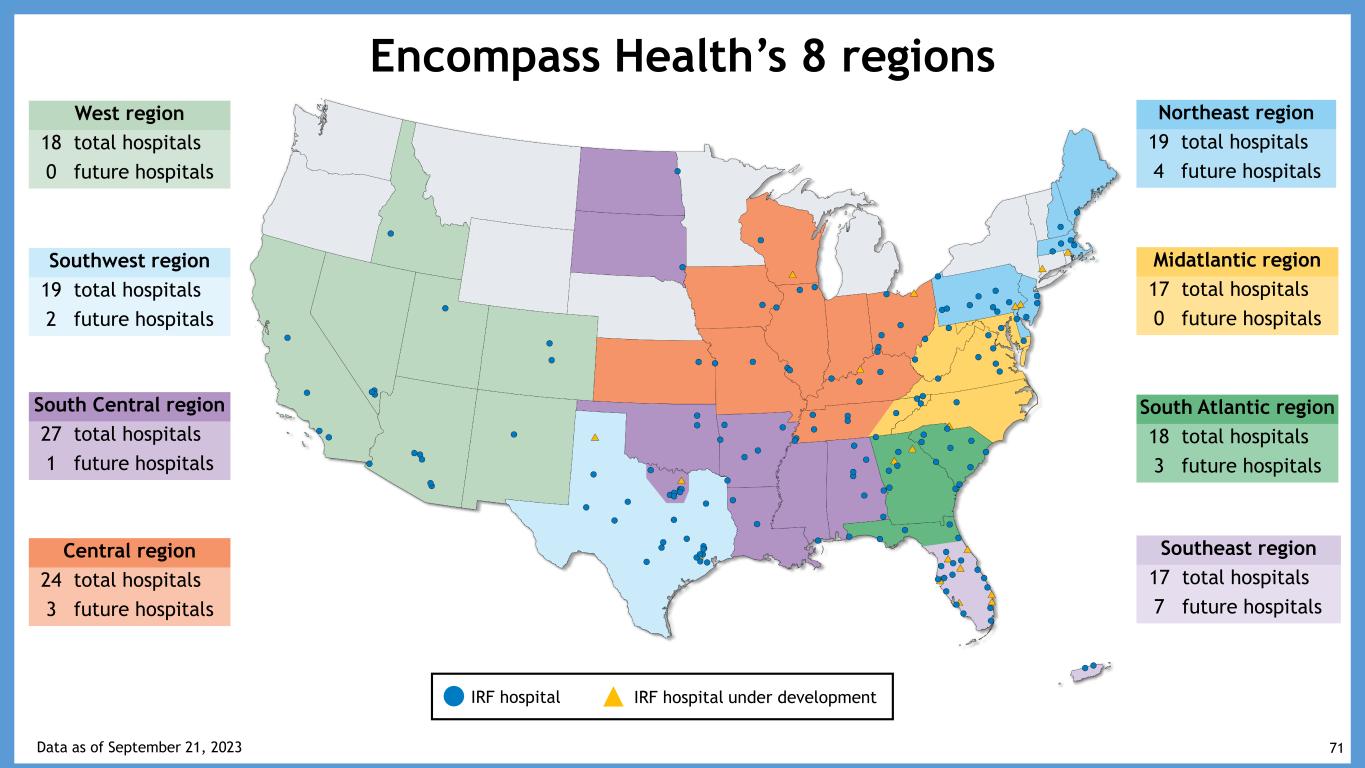
Encompass Health’s 8 regions Southwest region 19 total hospitals 2 future hospitals West region 18 total hospitals 0 future hospitals IRF hospital IRF hospital under development South Central region 27 total hospitals 1 future hospitals Southeast region 17 total hospitals 7 future hospitals South Atlantic region 18 total hospitals 3 future hospitals Central region 24 total hospitals 3 future hospitals Midatlantic region 17 total hospitals 0 future hospitals Northeast region 19 total hospitals 4 future hospitals Data as of September 21, 2023 71
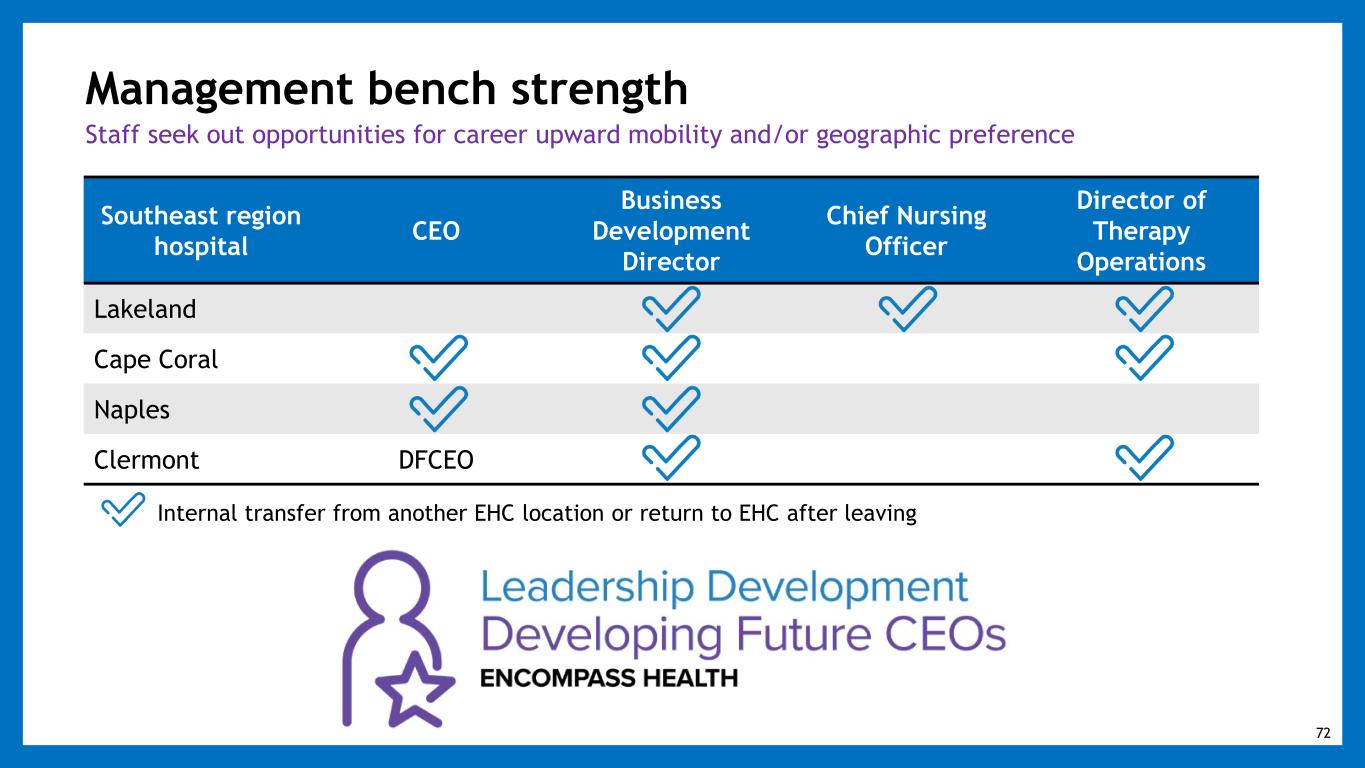
Southeast region hospital CEO Business Development Director Chief Nursing Officer Director of Therapy Operations Lakeland Cape Coral Naples Clermont DFCEO Management bench strength Staff seek out opportunities for career upward mobility and/or geographic preference Internal transfer from another EHC location or return to EHC after leaving 72

Overview of opening a new hospital A standardized approach with consistent tasks and timeframes helps to guide the project > 120 Days from hospital opening 31 Recruiting & HR 4 Design & construction 1 Licensure 19 ITG 4 Supply chain 4 Marketing services 3 Clinical/Operations 120 - 60 Days from hospital opening 60 - 0 Days from hospital opening 66 total tasks 14 Recruiting & HR 2 Design & construction 4 Licensure 10 ITG 9 Supply chain 69 Clinical/Operations 1 Managed care 52 Legal (contracts) 1 Marketing services 28 Training 1 Ethics & compliance 191 total tasks 37 Recruiting & HR 19 Design & construction 7 Licensure 2 ITG 7 Supply chain 187 Clinical/Operations 6 Managed care 13 Marketing services 3 Ethics & compliance 69 Training 350 total tasks 73
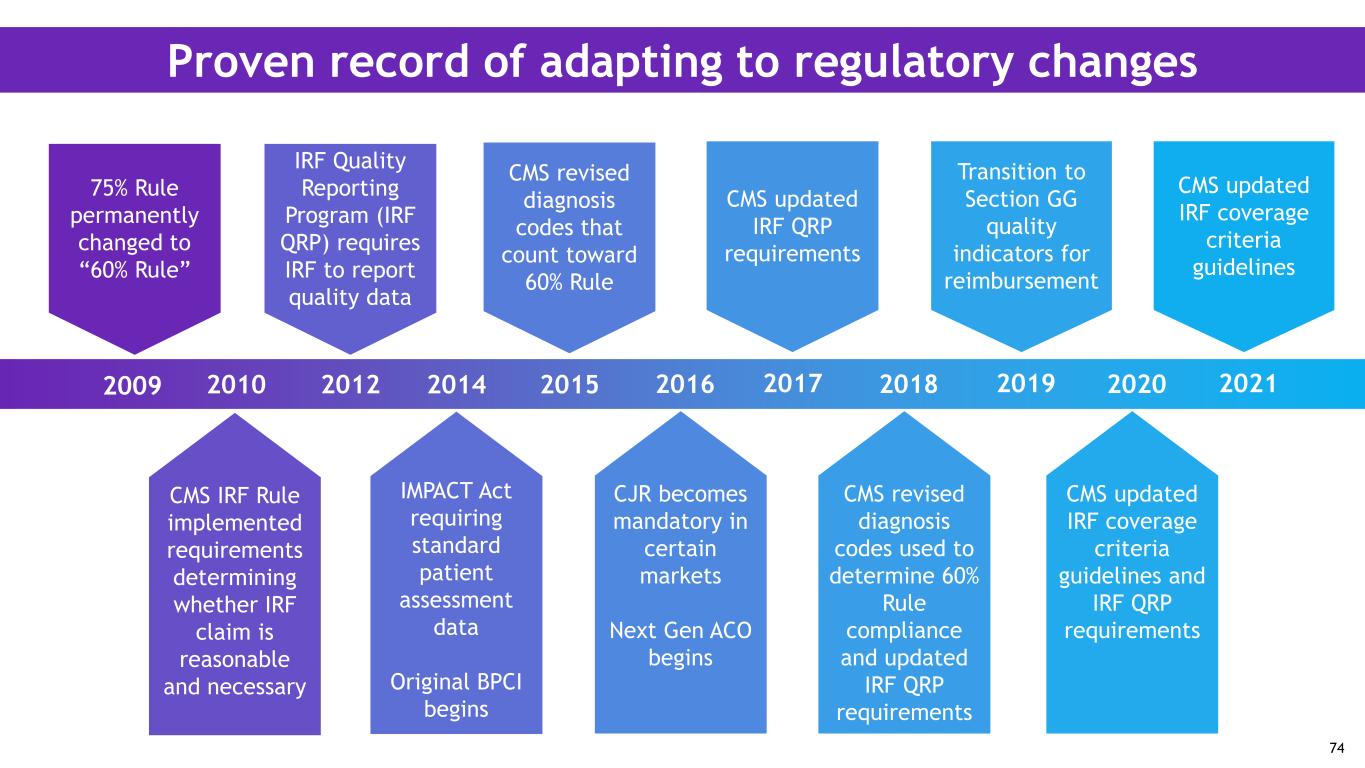
Proven record of adapting to regulatory changes 75% Rule permanently changed to “60% Rule” 2009 IRF Quality Reporting Program (IRF QRP) requires IRF to report quality data 2012 CMS IRF Rule implemented requirements determining whether IRF claim is reasonable and necessary 2010 2014 CJR becomes mandatory in certain markets Next Gen ACO begins 2016 IMPACT Act requiring standard patient assessment data Original BPCI begins CMS revised diagnosis codes that count toward 60% Rule 2015 CMS updated IRF QRP requirements 2017 Transition to Section GG quality indicators for reimbursement 2019 CMS revised diagnosis codes used to determine 60% Rule compliance and updated IRF QRP requirements 2018 CMS updated IRF coverage criteria guidelines and IRF QRP requirements 2020 CMS updated IRF coverage criteria guidelines 2021 74
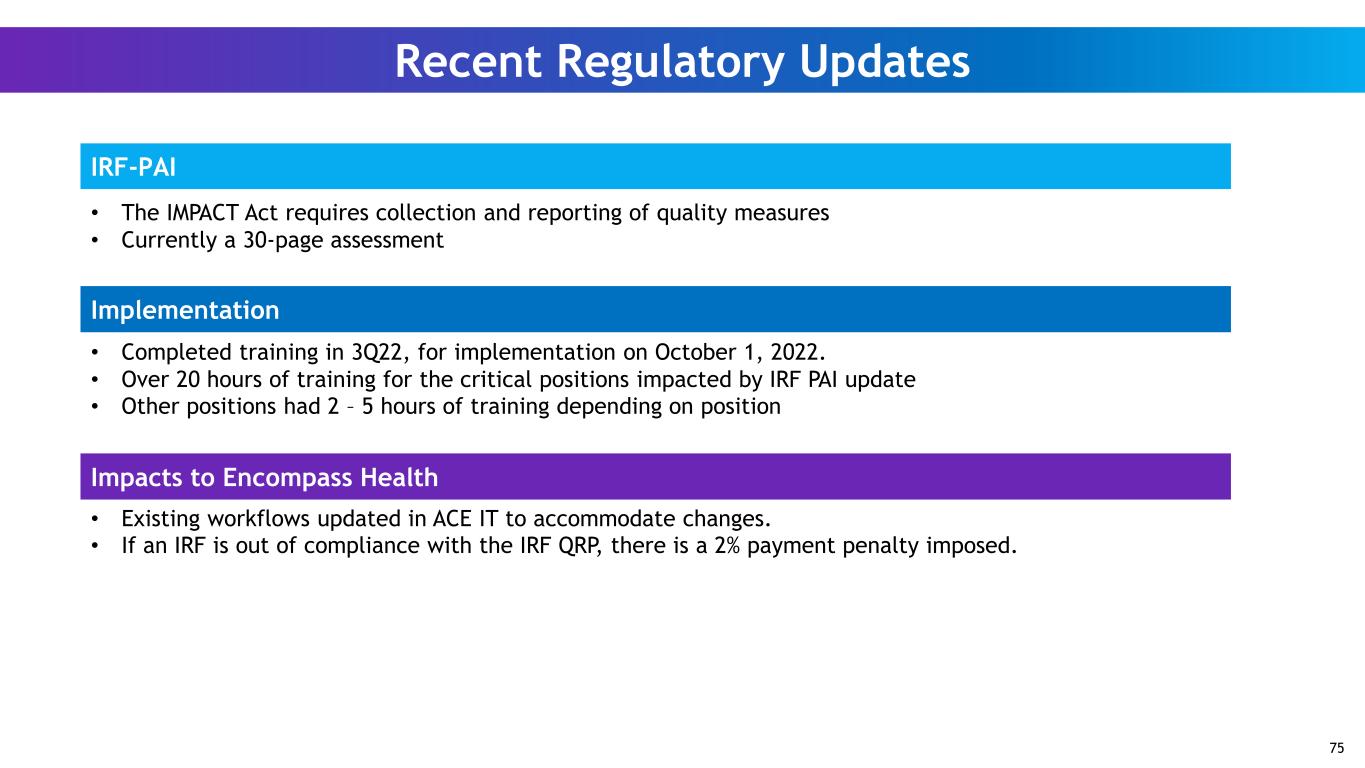
Recent Regulatory Updates IRF-PAI Implementation Impacts to Encompass Health • The IMPACT Act requires collection and reporting of quality measures • Currently a 30-page assessment • Completed training in 3Q22, for implementation on October 1, 2022. • Over 20 hours of training for the critical positions impacted by IRF PAI update • Other positions had 2 – 5 hours of training depending on position • Existing workflows updated in ACE IT to accommodate changes. • If an IRF is out of compliance with the IRF QRP, there is a 2% payment penalty imposed. 75
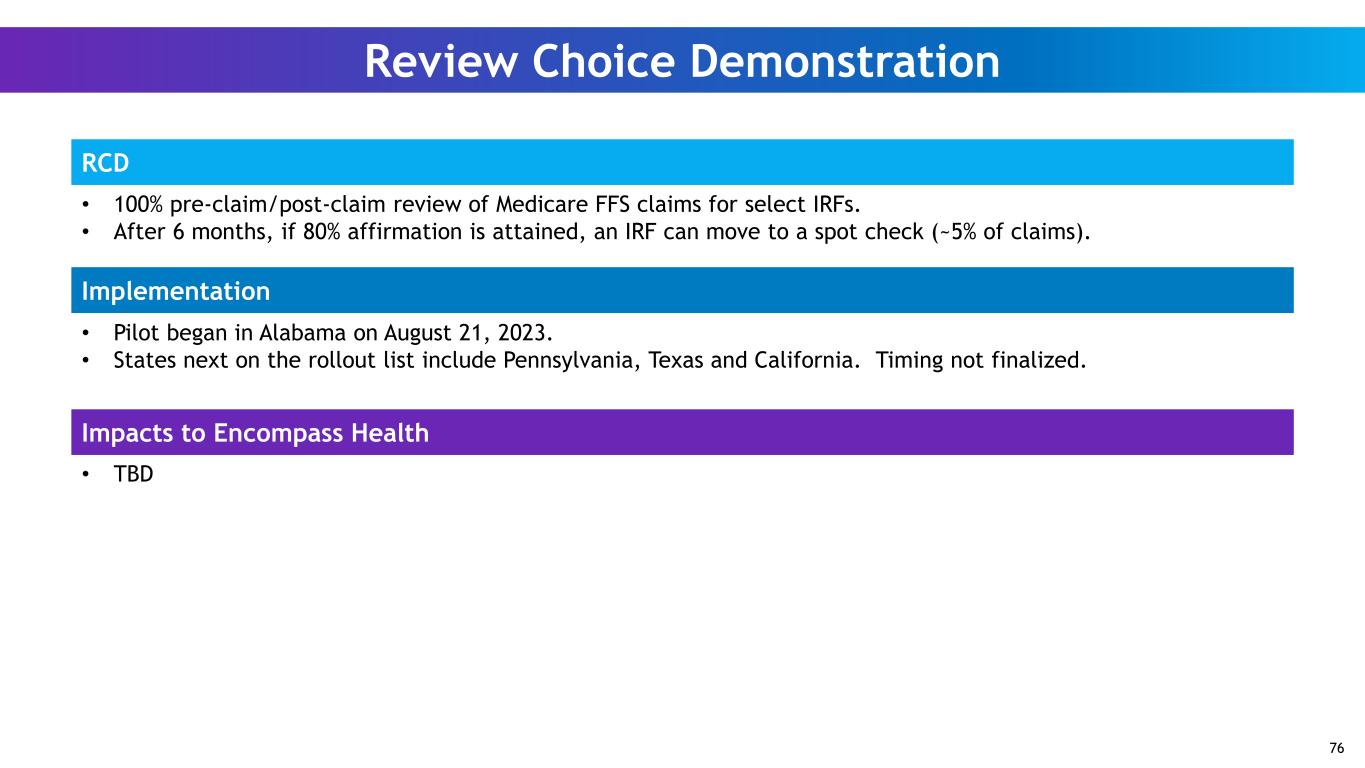
Review Choice Demonstration RCD Impacts to Encompass Health • 100% pre-claim/post-claim review of Medicare FFS claims for select IRFs. • After 6 months, if 80% affirmation is attained, an IRF can move to a spot check (~5% of claims). • Pilot began in Alabama on August 21, 2023. • States next on the rollout list include Pennsylvania, Texas and California. Timing not finalized. Implementation • TBD 76
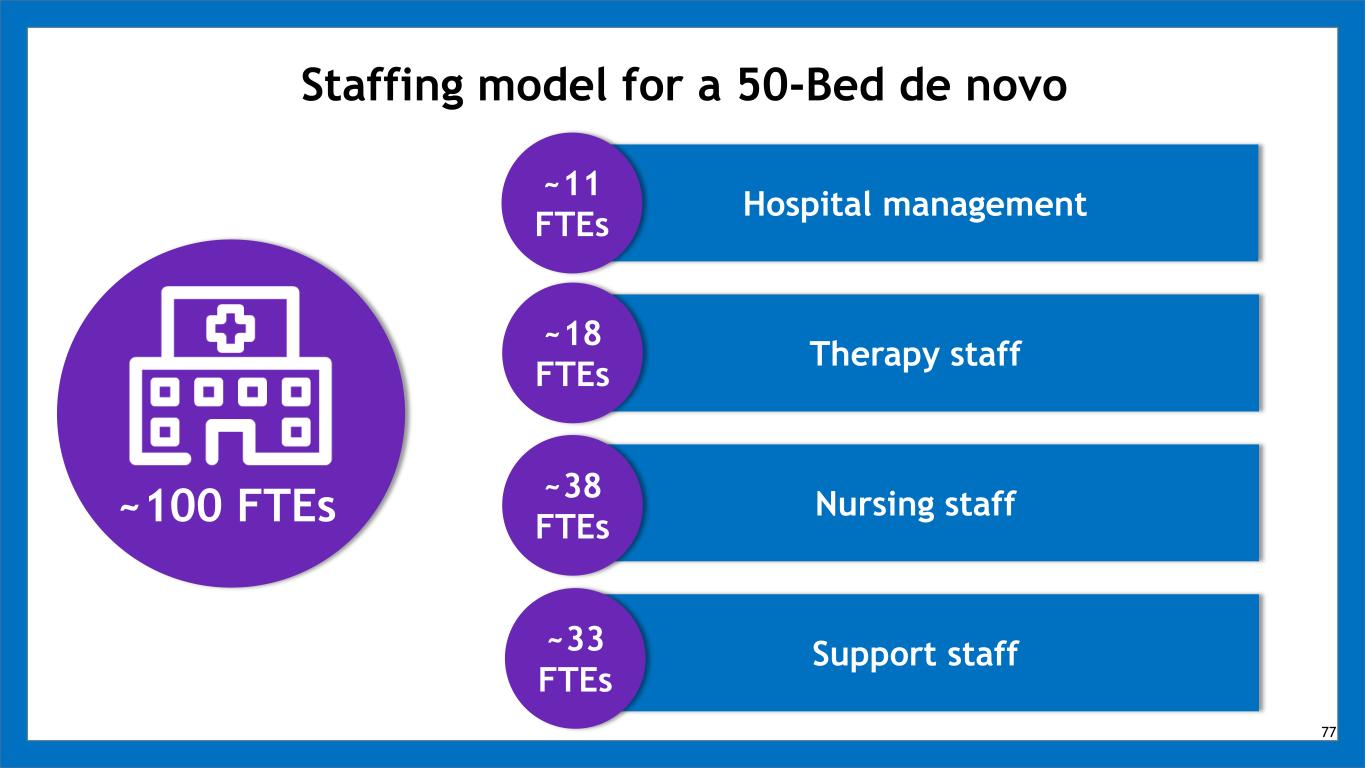
Staffing model for a 50-Bed de novo Hospital management Therapy staff Nursing staff Support staff ~11 FTEs ~18 FTEs ~38 FTEs ~33 FTEs ~100 FTEs 77

Speaker Investment case Doug Coltharp EVP, Chief Financial Officer

Sources: MedPAC, Medicare Payment Policy, March 2023; MedPAC Health Care Spending and the Medicare Program, July 2022. The conversion rate of IRF eligible patients is based on patients who are discharged from acute care hospitals with one or more of 13 specified medical conditions that CMS ties to IRF eligibility based on Medicare FFS data, which is the only publicly available data on this subject. Inpatient rehabilitation industry $8.5 B ~380,000 $17 B to $25 B Traditional Medicare All payors $14.5 B ~745,000 $29 B to $44 B Current market size Number of discharges Estimated addressable market size Conservative estimate based on low conversion rate of presumptively IRF-eligible patients 79

Percent of total Medicare FFS spending on inpatient rehabilitation Medicare spending on post-acute services Sources: MedPAC, Medicare Payment Policy, March 2023 – pages 203, 237 and 259 Centers for Medicare and Medicaid Services, Medicare Trustees’ Report 2022 - page 12. * Not all home health spending occurs as a post-acute service. Post-Acute setting 2002 Spending 2021 Spending Skilled nursing facilities $14.8 $28.5 Home health agencies* $9.6 $16.9 Inpatient rehabilitation hospitals $5.7 $8.5 Medicare spent ~ $54 billion on post-acute services in 2021 (IRF, SNF, HH) $ in billions Medicare spending on post-acute services 80
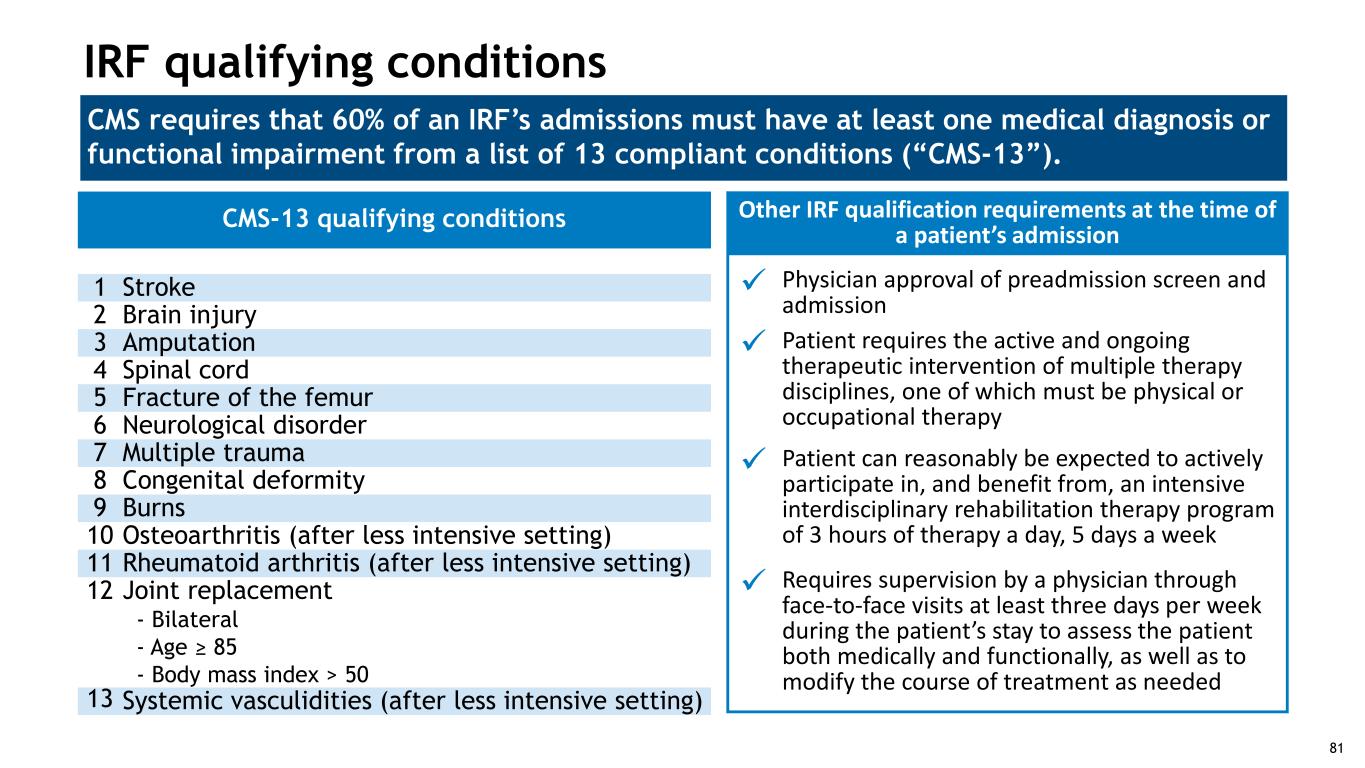
CMS requires that 60% of an IRF’s admissions must have at least one medical diagnosis or functional impairment from a list of 13 compliant conditions (“CMS-13”). IRF qualifying conditions CMS-13 qualifying conditions 1 Stroke 2 Brain injury 3 Amputation 4 Spinal cord 5 Fracture of the femur 6 Neurological disorder 7 Multiple trauma 8 Congenital deformity 9 Burns 10 Osteoarthritis (after less intensive setting) 11 Rheumatoid arthritis (after less intensive setting) 12 Joint replacement - Bilateral - Age ≥ 85 - Body mass index > 50 13 Systemic vasculidities (after less intensive setting) Other IRF qualification requirements at the time of a patient’s admission Physician approval of preadmission screen and admission Patient requires the active and ongoing therapeutic intervention of multiple therapy disciplines, one of which must be physical or occupational therapy Patient can reasonably be expected to actively participate in, and benefit from, an intensive interdisciplinary rehabilitation therapy program of 3 hours of therapy a day, 5 days a week Requires supervision by a physician through face-to-face visits at least three days per week during the patient’s stay to assess the patient both medically and functionally, as well as to modify the course of treatment as needed 81

Medicare levels of service required - IRF vs. SNF Industry averages IRF SNF Quality metrics FFS average length of stay 12.9 days 34.5 days Discharge to community rate 67.6% 43.5% CMS requirements for IRFs vs. SNFs IRF SNF Regulatory Facility must satisfy regulatory and policy requirements for hospitals, including Medicare hospital conditions of participation Yes No Patient care At a minimum, face-to-face rehabilitation physician visits must occur no fewer than 3 times per week during the course of the patient’s stay Yes No All patients must need and generally receive a minimum of three hours a day of intensive therapy, five days a week Yes No Nursing care is required 24 hours, 7 days a week by registered nurses Yes No A weekly team meeting, led by the physician and includes a rehabilitation nurse, a case manager, and a licensed therapist from each therapy discipline Yes No Admission requirements All patients must be admitted by a physician Yes No Stringent admission and coverage policies are required and carefully documented for each admission; further restricted in number and type of patients (e.g., 60% Rule) Yes No Source: MedPAC, Medicare Payment Policy, March 2023 - pages 214, 222, 266 and 267. 82

IRF industry supply has grown slightly since 2010: • 1,179 IRFs in 2010 • 1,197 IRFs in 2022 (1.5% increase) Number of IRFs – Industry IRF supply Number of IRFs - EHC vs. Non-EHC 83 0 200 400 600 800 1,000 1,200 1,400 2010 2011 2012 2013 2014 2015 2016 2017 2018 2019 2020 2021 2022 Total IRFs 1,000 1,025 1,050 1,075 1,100 0 40 80 120 160 N on -E HC IR FS EH C IR Fs Non-EHC IRFs EHC IRFs Encompass Health growth since 2010: • Opened 50 de novos • Added 1,143 beds to existing hospitals
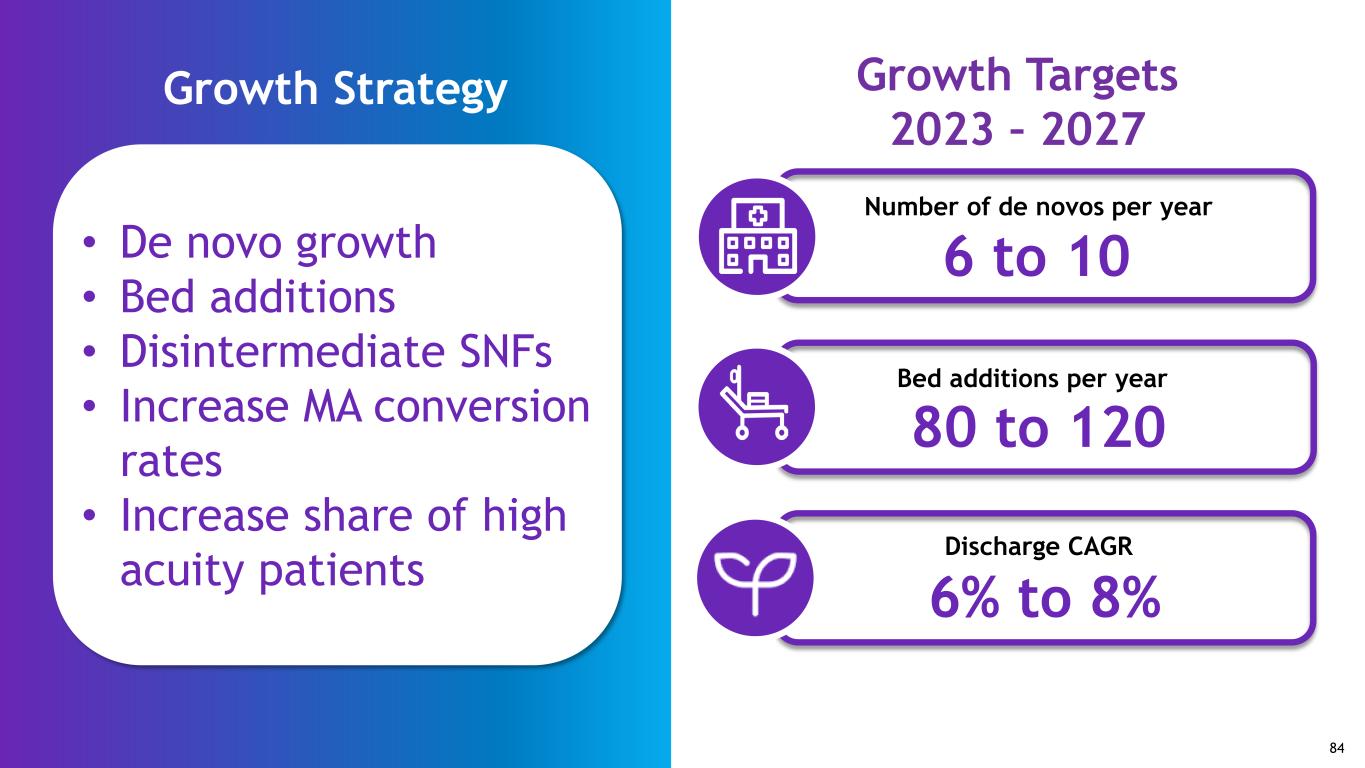
Growth Strategy Number of de novos per year 6 to 10 Bed additions per year 80 to 120 6% to 8% Discharge CAGR Growth Targets 2023 – 2027 • De novo growth • Bed additions • Disintermediate SNFs • Increase MA conversion rates • Increase share of high acuity patients 84
