Exhibit 99.1
June 21, 2022
Dear Encompass Health Corporation Stockholder:
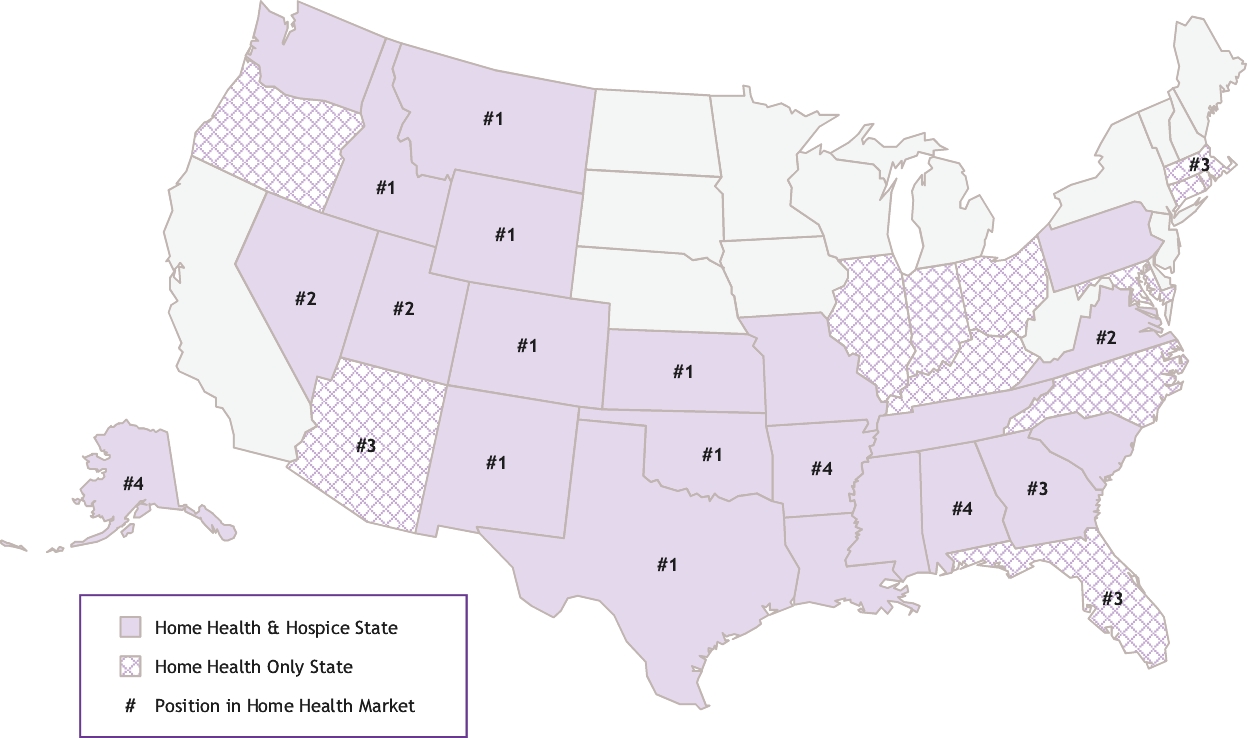
We previously announced plans to separate our home health and hospice business (the “Enhabit Business”) into an independent, publicly traded company, which we expect to list on the New York Stock Exchange under the trading symbol “EHAB” when the separation is complete. The separation will occur through a distribution by Encompass Health Corporation (“Encompass”) of all of the outstanding shares of Enhabit, Inc. (“Enhabit”), a wholly owned subsidiary that owns and operates the Enhabit Business. Encompass’s existing inpatient rehabilitation business will continue to be a publicly traded company after the distribution. The board of directors of Encompass approved the spin-off of Enhabit following an extensive review of strategic alternatives informed by shareholder engagement and assisted by several independent advisors. The separation is expected to provide a number of benefits to both businesses. These potential benefits include enhancing the strategic and operational flexibility of each company, enhancing the focus of each management team on its business strategy and operations, allowing each company to adopt a capital structure, acquisition strategy, and return of capital policy best suited to its financial profile and business needs, and providing each company with its own equity currency to facilitate acquisitions and to better incentivize management. In addition, once Enhabit is a stand-alone public company, potential investors will be able to invest directly in Enhabit’s common stock.
Upon completion of the distribution, each Encompass stockholder as of June 24, 2022, the record date for the distribution, will receive one share of Enhabit common stock for every two shares of Encompass common stock held as of the close of business on the record date. Enhabit common stock will be issued in book-entry form only, which means that no physical share certificates will be issued. No vote of Encompass stockholders is required for the distribution. You do not need to take any action to receive the shares of Enhabit to which you are entitled as an Encompass stockholder, and you do not need to pay any consideration or surrender or exchange your Encompass common stock, which will continue to trade on the New York Stock Exchange.
We encourage you to read the attached information statement, which describes the planned distribution of Enhabit common stock in detail and contains important business and financial information about Enhabit. The included financial statements of Enhabit are prepared from Encompass’s historical accounting records and contain certain allocations of Encompass’s costs.We encourage you to read them together with the pro forma financial information included in the attached information statement, which gives effect to the separation and reflects Enhabit’s anticipated post-separation capital structure, including the assignment of certain assets and assumption of certain liabilities not included in the historical financial statements.
The Encompass board of directors and management team are confident that the pending separation will create new opportunities for both companies to realize significant growth while maintaining our commitment to our patients, investors, employees and community. We look forward to the potential we expect will be unlocked by the spin-off—for Encompass, for Enhabit and for you, as a stockholder of both companies. On behalf of our board of directors, thank you for your continued support.
| | | Sincerely, | |
| | | ||
| | | Mark Tarr President and Chief Executive Officer Encompass Health Corporation |