|
Exhibit 99 |
|
 |
Exhibit 99.1
Business Update
December 2, 2004
Cautionary Statements Regarding Presentation
This presentation contains certain estimates and other forward-looking information which are based on assumptions that HealthSouth believes, as of the date hereof, are reasonable. Inevitably, there will be differences between such estimates and actual results, and those differences may be material to HealthSouth.
As the company currently is undertaking a reconstruction of its accounting records and a restatement of its results, the numbers presented herein as actual could change as a result of the reconstruction and restatement process.
There can be no assurance that any estimates or forward-looking information will be realized.
HealthSouth undertakes no duty to publicly update or revise the information contained herein.
- 2 -
Cautionary Statements Regarding Presentation
You are cautioned not to place undue reliance on the estimates and results in this presentation.
This presentation was prepared on a basis consistent with methodologies used in prior presentations:
No adjustments were made for retrospective or prospective changes for consolidation or equity method of accounting.
Restructuring Charges are presented in a non-GAAP manner.
Certain items included in the presentation as Restructuring Charges may be recurring.
There are no asset impairment charges (e.g. write-down of Goodwill) reflected in the results.
- 3 -
Considerations Involving Our Current Situation
The Securities and Exchange Commission (“SEC”) and the United States
Department of Justice (“DOJ”) are investigating HealthSouth’s financial reporting and related activities and significant litigation exists regarding these matters.
The Centers for Medicare and Medicaid Services (“CMS”) are investigating HealthSouth’s cost reports and other related activities.
HealthSouth remains in default of its existing senior bank credit facility.
HealthSouth, as well as certain of its past and present officers and directors, is also subject to a number of class action, derivative and individual lawsuits relating to, among other things, allegations of violation of federal securities laws.
Ernst & Young LLP was dismissed as the company’s independent accountants and withdrew their audit reports on all of the company’s previously filed financial statements, which should not be relied upon.
No financial statements currently are available for any prior period.
Our financial statements will be restated; estimated $3.8—$4.6 billion impact before consideration of taxes and depreciation.
- 4 -
Forward-Looking Statements
Certain matters discussed herein constitute forward-looking statements within the meaning of Section 27A of the Securities Act of 1933 and Section 21E of the Securities Exchange Act of 1934.
Such information is based on numerous assumptions and involve a number of risks and uncertainties, many of which are beyond HealthSouth’s control, including:
Completion of the investigations by the SEC, the DOJ and CMS.
Resolution of outstanding litigation, including certain class action litigation alleging violations under federal securities laws and certain qui tam actions.
Our ability to successfully refinance our existing public indebtedness as it becomes due.
Our ability to amend or refinance our senior bank credit facility, which is currently in default.
Changes, delays in or suspension of reimbursement by payors.
Regulatory changes, including the implementation of the recently-adopted 75% Rule.
Competitive pressures.
General conditions in the economy and capital markets.
You are cautioned not to place undue reliance on the forward-looking statements contained in this presentation.
- 5 -
Notes Regarding Presentation of Non-GAAP Financial Measures
The financial data contained herein includes non-GAAP financial measures, including “EBITDA”, to assist in assessing projected and actual operating performance and to facilitate quantification of planned business activities.
As used by HealthSouth, “EBITDA” is consistent with the definition of Adjusted Consolidated EBITDA in our Senior Subordinated Credit Agreement dated as of January 16, 2004. In summary, this definition allows for the company to add back charges to EBITDA classified as “Restructuring Charges” by the company until June 2005. These charges are generally not consistent with the definition of restructuring charges as defined by GAAP.
Costs which HealthSouth classifies as “Restructuring Charges” are: (i) professional fees associated with litigation, financial restructuring, government investigations, forensic accounting, creditor advisors, accounting reconstruction, audit and tax work associated with the restatement, and Sarbanes-Oxley implementation; (ii) recruiting fees; (iii) severance costs; (iv) lease buy-outs; and (v) non-ordinary course charges incurred after March 19, 2003 and related to the Company’s overall corporate restructuring.
Under the Senior Subordinated Credit Agreement professional fees associated with the class-action and shareholder derivative litigation can be added back to EBITDA after June 30, 2005.
- 6 -
Notes Regarding Presentation of Non-GAAP Financial Measures
Financial information relating to 2004 budget and 2004 actual results have been presented after consideration of accounting for consolidation of joint ventures and partnership interests on a basis consistent with prior years. Actual results may vary after our reconstruction and restatement efforts are completed and proper accounting determination is made with respect to the joint ventures.
EBITDA may be useful to stakeholders because it is commonly used as an analytical indicator within the healthcare industry to calculate facility performance, allocate resources and measure leverage capacity and debt service ability.
EBITDA should not be considered as a measure of financial performance under GAAP.
Because HealthSouth is currently unable to prepare a balance sheet for any completed period or a projected balance sheet, reconciliation for non-GAAP financial measures to a financial measure calculated in accordance with GAAP is not currently possible. In addition, once our reconstruction and restatement process is completed, it could cause changes in the results indicated.
- 7 -
Agenda
I. Operational Update
II. 75% Rule Impact
III. Liquidity and Bank Facility Update
IV. SEC Filing Update V. Financial Update VI. Legal Update VII. Management Focus VIII. Questions and Answers
Jay Grinney, Mike Snow Jay Grinney John Workman John Workman John Workman Greg Doody Jay Grinney
- 8 -
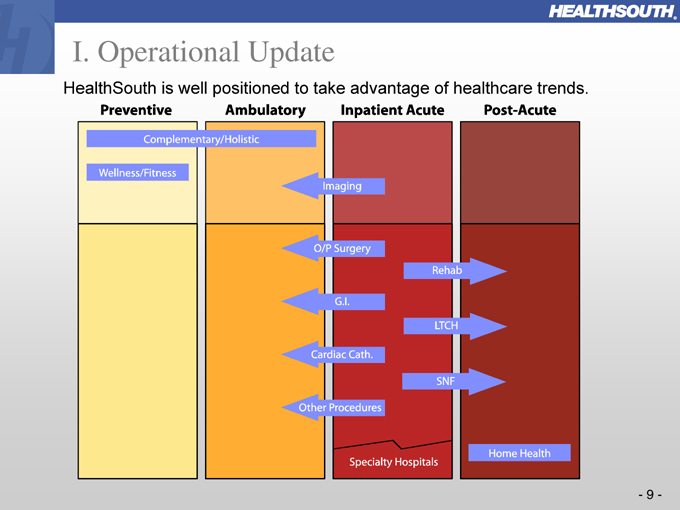
I. Operational Update
HealthSouth is well positioned to take advantage of healthcare trends.
Preventive
Ambulatory
Inpatient Acute
Post-Acute
Complementary/Holistic
Wellness/Fitness
Imaging
O/P Surgery
G.I.
Cardiac Cath.
Other Procedures
Rehab
LTCH
SNF
Specialty Hospitals
Home Health
- 9 -
I. Operational Update (cont’d)
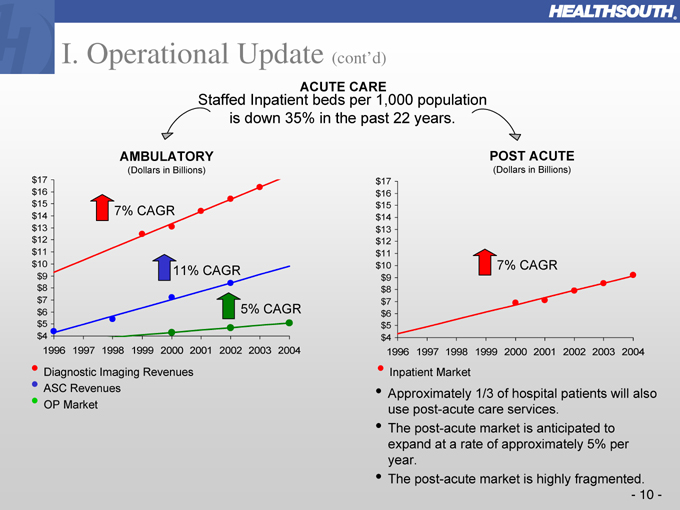
ACUTE CARE
Staffed Inpatient beds per 1,000 population is down 35% in the past 22 years.
AMBULATORY
(Dollars in Billions) $17 $16 $15 $14 $13 $12 $11 $10 $9 $8 $7 $6 $5 $4
1996 1997 1998 1999 2000 2001 2002 2003 2004
7% CAGR
11% CAGR
5% CAGR
Diagnostic Imaging Revenues ASC Revenues OP Market
POST ACUTE
(Dollars in Billions) $17 $16 $15 $14 $13 $12 $11 $10 $9 $8 $7 $6 $5 $4
7% CAGR
1996 1997 1998 1999 2000 2001 2002 2003 2004
Inpatient Market
Approximately 1/3 of hospital patients will also use post-acute care services.
The post-acute market is anticipated to expand at a rate of approximately 5% per year.
The post-acute market is highly fragmented.
- 10 -
I. Operational Update (cont’d)
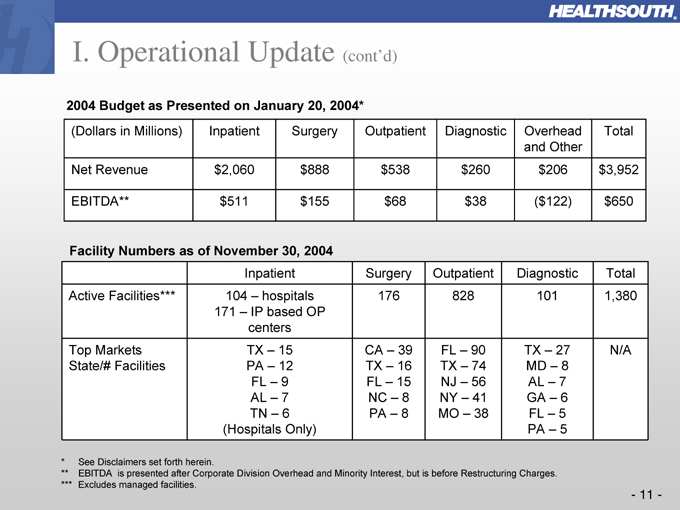
2004 Budget as Presented on January 20, 2004*
(Dollars in Millions)
Inpatient
Surgery
Outpatient
Diagnostic
Overhead and Other
Total
Net Revenue $2,060 $888 $538 $260 $206 $3,952
EBITDA** $511 $155 $68 $38
($122) $650
Facility Numbers as of November 30, 2004
Inpatient
Surgery
Outpatient
Diagnostic
Total
Active Facilities***
104 – hospitals 171 – IP based OP centers
176
828
101
1,380
Top Markets State/# Facilities
TX – 15 PA – 12 FL – 9 AL – 7 TN – 6 (Hospitals Only)
CA – 39 TX – 16 FL – 15 NC – 8 PA – 8
FL – 90 TX – 74 NJ – 56 NY – 41 MO – 38
TX – 27 MD – 8 AL – 7 GA – 6 FL – 5 PA – 5
N/A
* See Disclaimers set forth herein.
** EBITDA is presented after Corporate Division Overhead and Minority Interest, but is before Restructuring Charges.
*** Excludes managed facilities.
- 11 -
* EBITDA is presented after Corporate Division Overhead and Minority Interest, but is before Restructuring Charges.
I. Operational Update (cont’d)
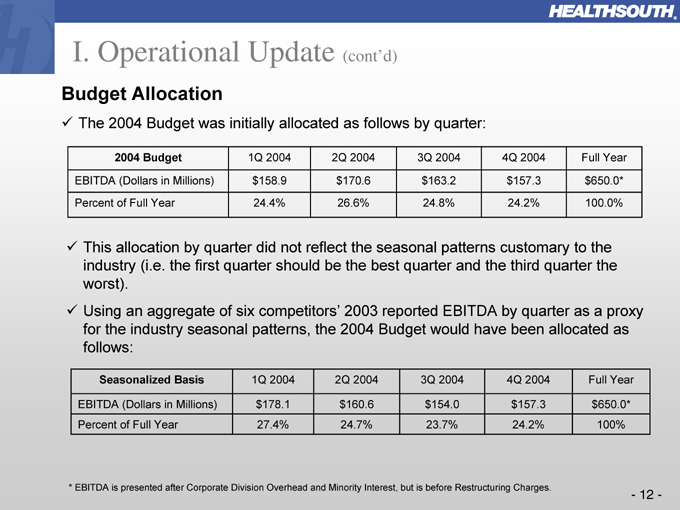
Budget Allocation
The 2004 Budget was initially allocated as follows by quarter:
2004 Budget
1Q 2004
2Q 2004
3Q 2004
4Q 2004
Full Year
EBITDA (Dollars in Millions) $158.9 $170.6 $163.2 $157.3 $650.0*
This allocation by quarter did not reflect the seasonal patterns customary to the industry (i.e. the first quarter should be the best quarter and the third quarter the worst).
Using an aggregate of six competitors’ 2003 reported EBITDA by quarter as a proxy for the industry seasonal patterns, the 2004 Budget would have been allocated as follows:
Seasonalized Basis
1Q 2004
2Q 2004
3Q 2004
4Q 2004
Full Year
EBITDA (Dollars in Millions) $178.1 $160.6 $154.0 $157.3 $650.0*
Percent of Full Year
27.4%
24.7%
23.7%
24.2%
100%
- 12 -
* EBITDA is presented after Corporate Division overhead and Minority Interest, but is before Restructuring Charges.
I. Operational Update (cont’d)
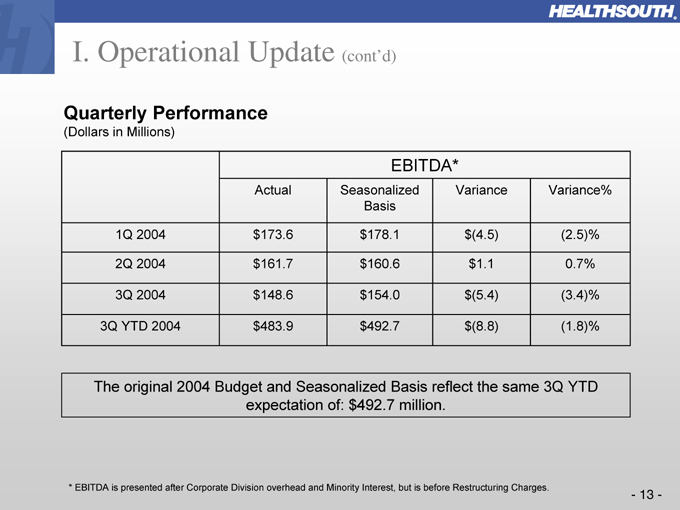
Quarterly Performance
(Dollars in Millions)
EBITDA*
Actual
Seasonalized Basis
Variance
Variance%
1Q 2004 $173.6 $178.1 $(4.5)
(2.5)%
2Q 2004 $161.7 $160.6 $1.1
0.7%
3Q 2004 $148.6 $154.0 $(5.4)
(3.4)%
3Q YTD 2004 $483.9 $492.7 $(8.8)
(1.8)%
The original 2004 Budget and Seasonalized Basis reflect the same 3Q YTD expectation of: $492.7 million.
- 13 -
* EBITDA is presented after Corporate Division overhead and Minority Interest, but is before Restructuring Charges.
(a) Seasonalized as per industry norm for 3Q 2004.
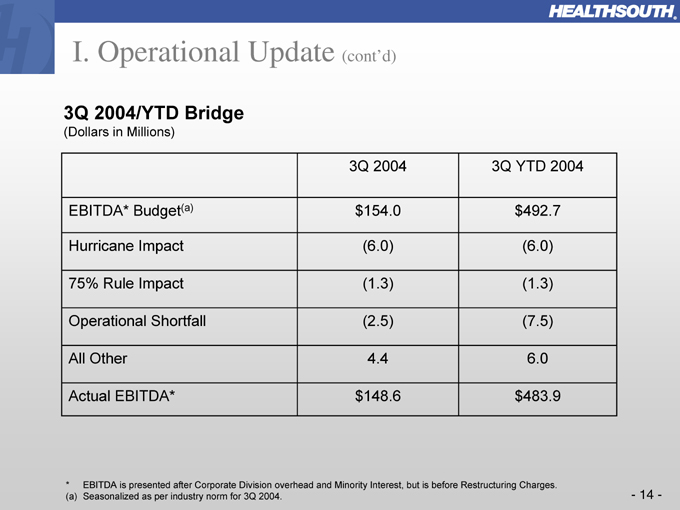
I. Operational Update (cont’d)
3Q 2004/YTD Bridge
(Dollars in Millions)
3Q 2004
3Q YTD 2004
EBITDA* Budget(a) $154.0 $492.7
Hurricane Impact
(6.0)
(6.0)
75% Rule Impact
(1.3)
(1.3)
Operational Shortfall
(2.5)
(7.5)
All Other
4.4
6.0
Actual EBITDA* $148.6 $483.9
- 14 -
* EBITDA is presented after Corporate Division Overhead and Minority Interest, but is before Restructuring Charges.
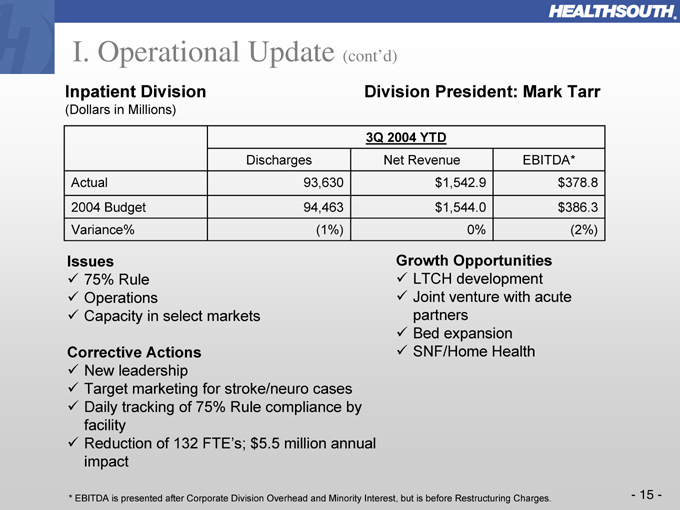
I. Operational Update (cont’d)
Inpatient Division
(Dollars in Millions)
Division President: Mark Tarr
3Q 2004 YTD
Discharges
Net Revenue
EBITDA*
Actual
2004 Budget
Variance%
93,630
94,463
(1%) $1,542.9 $1,544.0
0% $378.8 $386.3
(2%)
Issues
75% Rule Operations
Capacity in select markets
Corrective Actions
New leadership
Target marketing for stroke/neuro cases Daily tracking of 75% Rule compliance by facility Reduction of 132 FTE’s; $5.5 million annual impact
Growth Opportunities
LTCH development Joint venture with acute partners Bed expansion SNF/Home Health
- 15 -
Several start-ups in process Migration to single-specialty centers Joint ventures with acute hospital partners
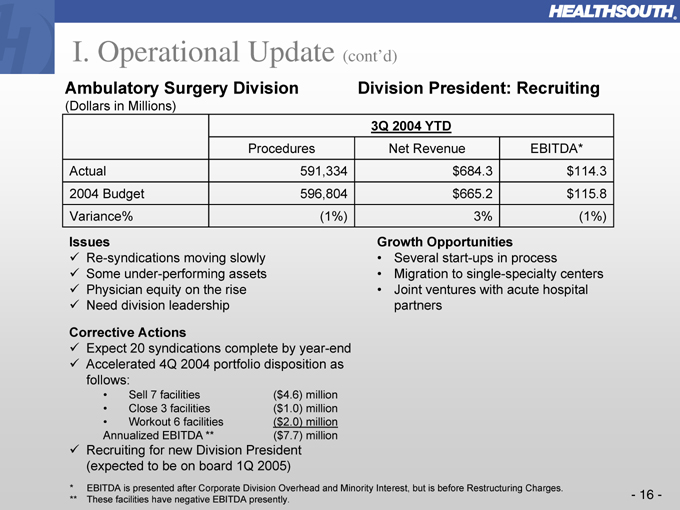
I. Operational Update (cont’d)
Ambulatory Surgery Division
(Dollars in Millions)
Division President: Recruiting
3Q 2004 YTD
Procedures
Net Revenue
EBITDA*
Actual
591,334 $684.3 $114.3
2004 Budget
596,804 $665.2 $115.8
Variance%
(1%)
3%
(1%)
Issues
Re-syndications moving slowly Some under-performing
assets Physician equity on the rise Need division leadership
Corrective Actions
Expect 20 syndications complete by year-end Accelerated 4Q 2004 portfolio disposition as follows:
Sell 7 facilities Close 3 facilities Workout 6 facilities
($4.6) million
($1.0) million
($2.0) million
($7.7) million
Annualized EBITDA **
Recruiting for new Division President (expected to be on board 1Q 2005)
* EBITDA is presented after Corporate Division Overhead and Minority Interest, but is before Restructuring Charges.
** These facilities have negative EBITDA presently.
Growth Opportunities
- 16 -
* EBITDA is presented after Corporate Division Overhead and Minority Interest, but is before Restructuring Charges.
** These facilities have negative EBITDA presently.
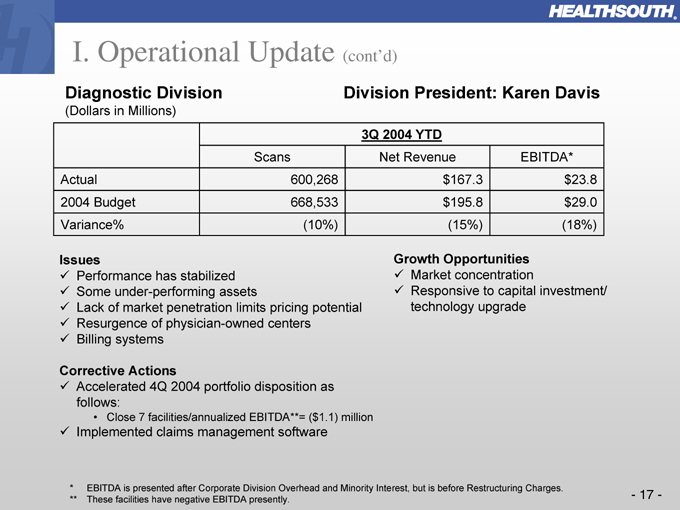
I. Operational Update (cont’d)
Diagnostic Division
(Dollars in Millions)
Division President: Karen Davis
3Q 2004 YTD
Scans
Net Revenue
EBITDA*
Actual
600,268 $167.3 $23.8
2004 Budget
668,533 $195.8 $29.0
Variance%
(10%)
(15%)
(18%)
Issues
Performance has stabilized Some under-performing assets
Lack of market penetration limits pricing potential Resurgence of physician-owned centers Billing systems
Corrective Actions
Accelerated 4Q 2004 portfolio disposition as follows:
Close 7 facilities/annualized EBITDA**= ($1.1) million
Implemented claims management software
Growth Opportunities
Market concentration
Responsive to capital investment/ technology upgrade
- 17 -
* EBITDA is presented after Corporate Division Overhead and Minority Interest, but is before Restructuring Charges.
** These facilities have negative EBITDA presently.
I. Operational Update (cont’d)
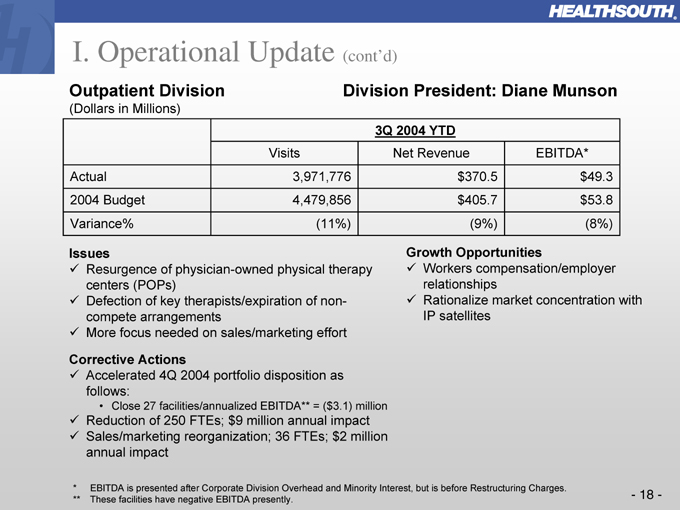
Outpatient Division
(Dollars in Millions)
Division President: Diane Munson
3Q 2004 YTD
Visits
Net Revenue
EBITDA*
Actual
3,971,776 $370.5 $49.3
2004 Budget
4,479,856 $405.7 $53.8
Variance%
(11%)
(9%)
(8%)
Issues
Resurgence of physician-owned physical therapy centers (POPs) Defection of key therapists/expiration of non-compete arrangements More focus needed on sales/marketing effort
Corrective Actions
Accelerated 4Q 2004 portfolio disposition as follows:
Close 27 facilities/annualized EBITDA** = ($3.1) million
Reduction of 250 FTEs; $9 million annual impact Sales/marketing reorganization; 36 FTEs; $2 million annual impact
Growth Opportunities
Workers compensation/employer relationships Rationalize market concentration with IP satellites
- 18 -
Agenda
I. Operational Update
II. 75% Rule Impact
III. Liquidity and Bank Facility Update IV. SEC Filing Update V. Financial Update VI. Legal Update VII. Management Focus VIII. Questions and Answers
Jay Grinney, Mike Snow Jay Grinney John Workman John Workman John Workman Greg Doody Jay Grinney
- 19 -
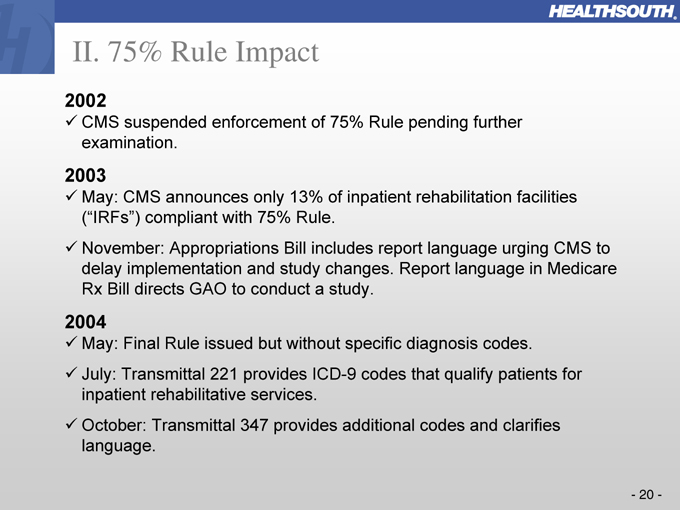
2002
CMS suspended enforcement of 75% Rule pending further examination.
2003
May: CMS announces only 13% of inpatient rehabilitation facilities (“IRFs”) compliant with 75% Rule.
November: Appropriations Bill includes report language urging CMS to delay implementation and study changes. Report language in Medicare Rx Bill directs GAO to conduct a study.
2004
May: Final Rule issued but without specific diagnosis codes.
July: Transmittal 221 provides ICD-9 codes that qualify patients for inpatient rehabilitative services.
October: Transmittal 347 provides additional codes and clarifies language.
II. 75% Rule Impact
- 20 -
HealthSouth: 8,200 patients will no longer meet qualifying standards in 2005.
II. 75% Rule Impact (cont’d)
Fewer Qualifying Patients…
Old “HCFA-10” Conditions
1. Stroke
2. Brain Injury
3. Amputation
4. Spinal Cord
5. Fracture of the Femur
6. Neurological Disorders
7. Multiple Trauma
8. Congenital Deformity
9. Burns 10. Polyarthritis
New CMS-13 Conditions
1. – 9. Same as “HCFA 10”
10. Osteoarthritis
After less intensive setting
11. Joint Replacement
Bilateral
Age ³ 85
Body Mass Index > 50
+
12. Rheumatoid Arthritis
After less intensive setting
13. Systemic Vasculidities
After less intensive setting
- 21 -
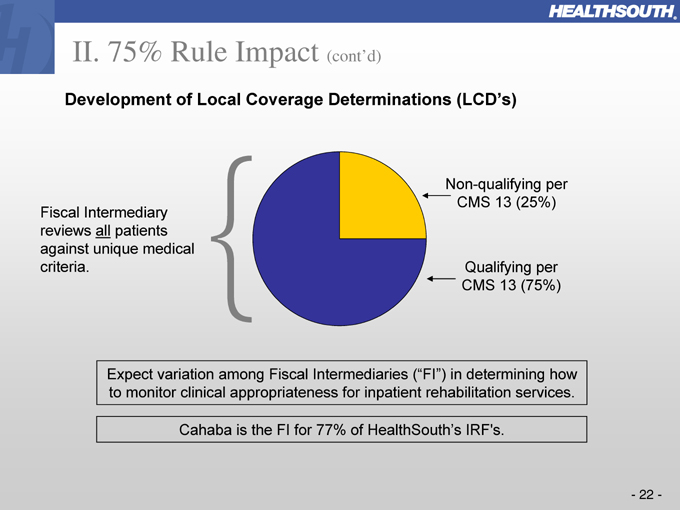
Cahaba is the FI for 77% of HealthSouth’s IRF’s.
II. 75% Rule Impact (cont’d)
Development of Local Coverage Determinations (LCD’s)
Fiscal Intermediary reviews all patients against unique medical criteria.
Non-qualifying per CMS 13 (25%)
Qualifying per CMS 13 (75%)
Expect variation among Fiscal Intermediaries (“FI”) in determining how to monitor clinical appropriateness for inpatient rehabilitation services.
- 22 -
II. 75% Rule Impact (cont’d)
Projected Financial Impact—Assumptions
Analysis performed on a facility-specific basis.
Based on discharges during the period July 2003 through June 2004.
Comorbid conditions included.
Polyneuropathy diagnoses included.
Engaged external consulting group to perform an independent analysis.
Facilities operating at capacity will experience minimal impact.
2004 Projected EBITDA Impact: ~ ($5.0) million
- 23 -
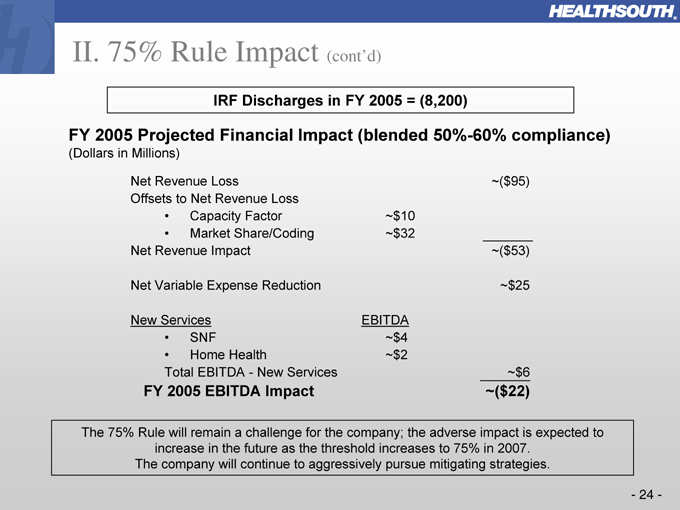
The 75% Rule will remain a challenge for the company; the adverse impact is expected to increase in the future as the threshold increases to 75% in 2007.
The company will continue to aggressively pursue mitigating strategies.
II. 75% Rule Impact (cont’d)
IRF Discharges in FY 2005 = (8,200)
FY 2005 Projected Financial Impact (blended 50%-60% compliance)
(Dollars in Millions)
Net Revenue Loss
Offsets to Net Revenue Loss
Capacity Factor
Market Share/Coding Net Revenue Impact
Net Variable Expense Reduction
New Services
SNF
Home Health
Total EBITDA—New Services
FY 2005 EBITDA Impact
~$10
~$32
EBITDA
~$4
~$2
~($95)
~($53)
~$25
~$6
~($22)
- 24 -
II. 75% Rule Impact (cont’d)
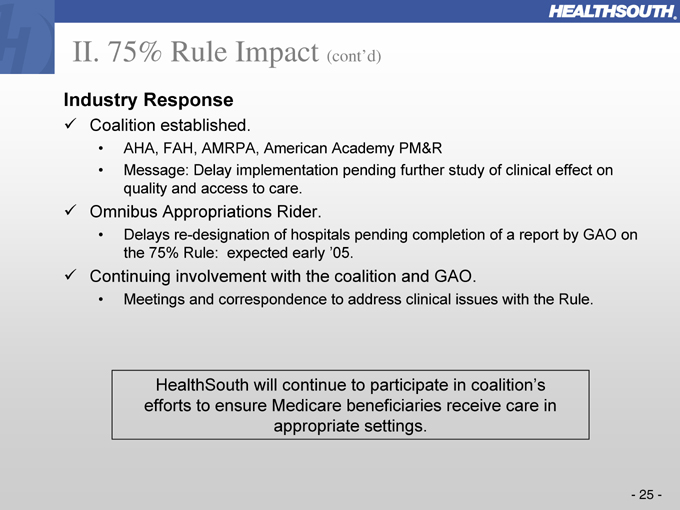
Industry Response
Coalition established.
AHA, FAH, AMRPA, American Academy PM&R
Message: Delay implementation pending further study of clinical effect on quality and access to care.
Omnibus Appropriations Rider.
Delays re-desingnation of hospitals pending completion of a report by GAO on the 75% Rule: expected early ’05.
Continuing involvement with the coalition and GAO.
Meetings and correspondence to address clinical issues with the Rule.
HealthSouth will continue to participate in coalition’s efforts to ensure Medicare beneficiaries receive care in appropriate settings.
- 25 -
Jay Grinney, Mike Snow Jay Grinney John Workman John Workman John Workman Greg Doody Jay Grinney
Agenda
I. Operational Update
II. 75% Rule Impact
III. Liquidity and Bank Facility Update IV. SEC Filing Update V. Financial Update VI. Legal Update VII. Management Focus VIII. Questions and Answers
- 26 -
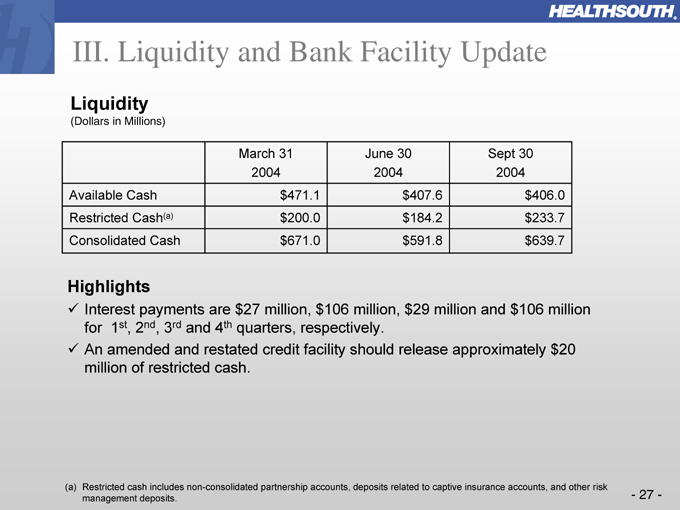
(a) Restricted cash includes non-consolidated partnership accounts, deposits related to captive insurance accounts, and other risk management deposits.
III. Liquidity and Bank Facility Update
Liquidity
(Dollars in Millions)
March 31 2004
June 30 2004
Sept 30 2004
Available Cash $471.1 $407.6 $406.0
Restricted Cash(a)
Consolidated Cash $200.0 $184.2 $233.7 $671.0 $591.8 $639.7
Highlights
Interest payments are $27 million, $106 million, $29 million and $106 million for 1st, 2nd, 3rd and 4th quarters, respectively.
An amended and restated credit facility should release approximately $20 million of restricted cash.
- 27 -
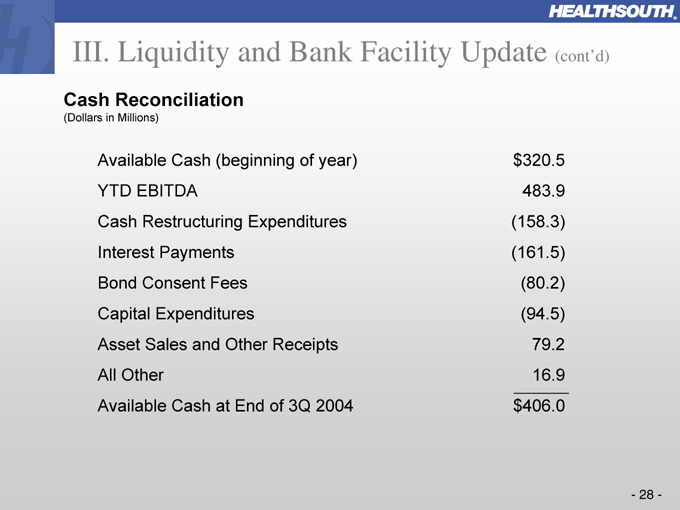
$320.5 483.9 (158.3) (161.5) (80.2) (94.5) 79.2 16.9 $406.0
III. Liquidity and Bank Facility Update (cont’d)
Cash Reconciliation
(Dollars in Millions)
Available Cash (beginning of year) YTD EBITDA
Cash Restructuring Expenditures Interest Payments Bond Consent Fees Capital Expenditures Asset Sales and Other Receipts All Other Available Cash at End of 3Q 2004
- 28 -
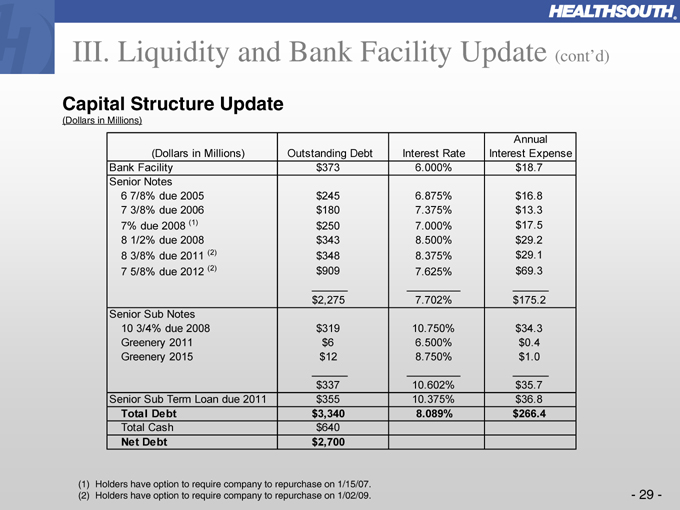
(1) Holders have option to require company to repurchase on 1/15/07. (2) Holders have option to require company to repurchase on 1/02/09.
III. Liquidity and Bank Facility Update (cont’d)
Capital Structure Update
(Dollars in Millions)
Annual
(Dollars in Millions) Outstanding Debt Interest Rate Interest Expense
Bank Facility $ 373 6.000% $ 18.7
Senior Notes
6 7/8% due 2005 $ 245 6.875% $ 16.8
7 3/8% due 2006 $ 180 7.375% $ 13.3
7% due 2008 (1) $ 250 7.000% $ 17.5
8 1/2% due 2008 $ 343 8.500% $ 29.2
8 3/8% due 2011 (2) $ 348 8.375% $ 29.1
7 5/8% due 2012 (2) $ 909 7.625% $ 69.3
$ 2,275 7.702% $ 175.2
Senior Sub Notes
10 3/4% due 2008 $ 319 10.750% $ 34.3
Greenery 2011 $ 6 6.500% $ 0.4
Greenery 2015 $ 12 8.750% $ 1.0
$ 337 10.602% $ 35.7
Senior Sub Term Loan due 2011 $ 355 10.375% $ 36.8
Total Debt $ 3,340 8.089% $ 266.4
Total Cash $ 640
Net Debt $ 2,700
- 29 -
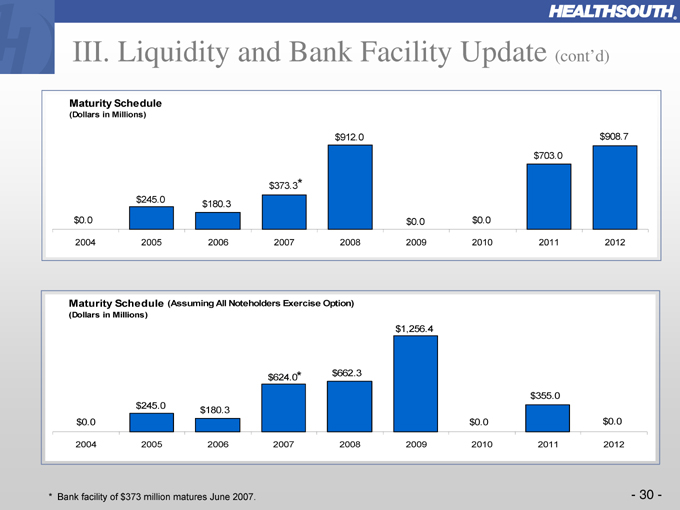
* Bank facility of $373 million matures June 2007.
III. Liquidity and Bank Facility Update (cont’d)
Maturity Schedule
(Dollars in Millions) $0.0 $245.0 $180.3 $373.3* $912.0 $0.0 $0.0 $703.0 $908.7
2004 2005 2006 2007 2008 2009 2010 2011 2012
Maturity Schedule (Assuming All Noteholders Exercise Option)
(Dollars in Millions) $0.0 $245.0 $180.3 $624.0* $662.3 $1,256.4 $0.0 $355.0 $0.0
2004 2005 2006 2007 2008 2009 2010 2011 2012
- 30 -
III. Liquidity and Bank Facility Update (cont’d)
Credit Agreement
We remain in default with our existing senior bank credit facility although we are current on principal and interest payments.
Commitment letter expected by end of the year for amended and restated credit agreement, subject to completion of due diligence.
Anticipate the new facility will provide $315 million in a term loan, new L/C facility (approximately $150 million) and new $250 million revolver facility.
Plan to syndicate in early 2005.
To be secured by stock in first tier subsidiaries and holding company assets (as appropriate).
- 31 -
Agenda
I. Operational Update
II. 75% Rule Impact
III. Liquidity and Bank Facility Update IV. SEC Filing Update V. Financial Update VI. Legal Update VII. Management Focus VIII. Questions and Answers
Jay Grinney, Mike Snow Jay Grinney John Workman John Workman John Workman Greg Doody Jay Grinney
- 32 -
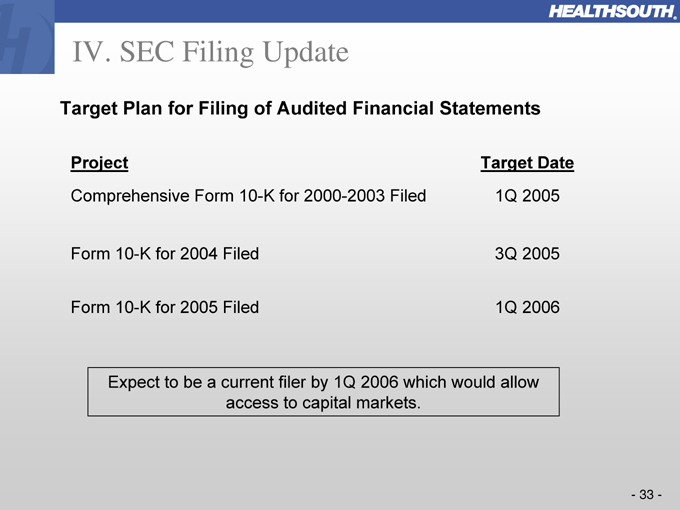
IV. SEC Filing Update
Target Plan for Filing of Audited Financial Statements
Project Target Date
Comprehensive Form 10-K for 2000-2003 Filed 1Q 2005 Form 10-K for 2004 Filed 3Q 2005 Form 10-K for 2005 Filed 1Q 2006
Expect to be a current filer by 1Q 2006 which would allow access to capital markets.
- 33 -
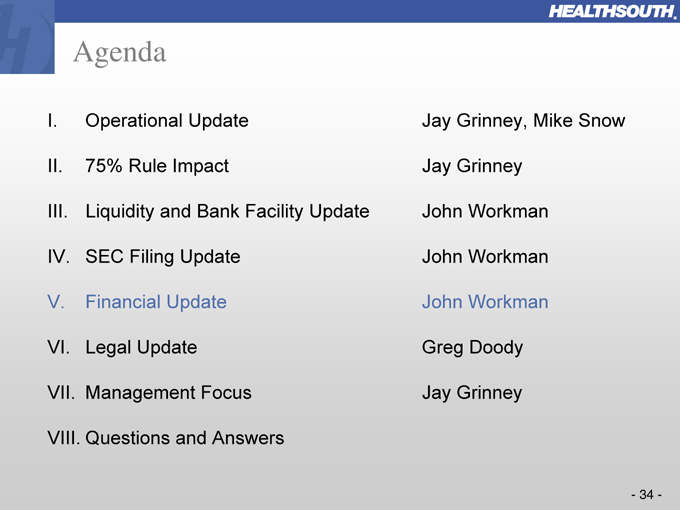
Agenda
I. Operational Update
II. 75% Rule Impact
III. Liquidity and Bank Facility Update IV. SEC Filing Update V. Financial Update VI. Legal Update VII. Management Focus VIII. Questions and Answers
Jay Grinney, Mike Snow Jay Grinney John Workman John Workman John Workman Greg Doody Jay Grinney
- 34 -
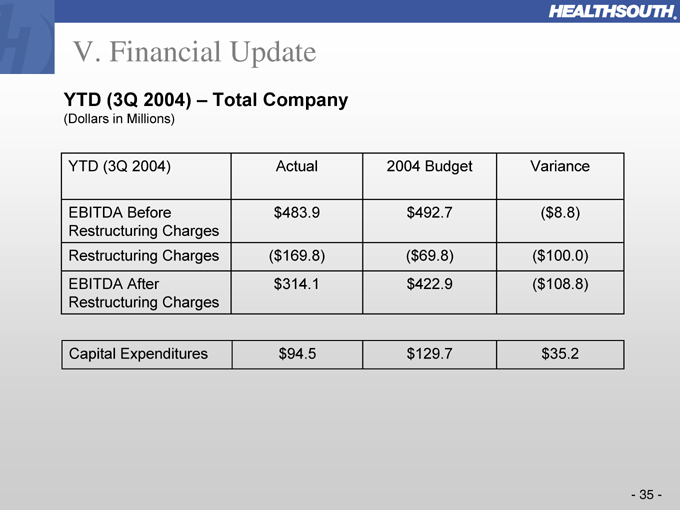
V. Financial Update
YTD (3Q 2004) – Total Company
(Dollars in Millions)
YTD (3Q 2004) Actual 2004 Budget Variance
EBITDA Before Restructuring Charges $483.9 $492.7 ( $8.8)
Restructuring Charges ($169.8) ($69.8) ($100.0)
EBITDA After Restructuring Charges $314.1 $422.9 ($108.8)
Capital Expenditures $94.5 $129.7 $35.2
- 35 -
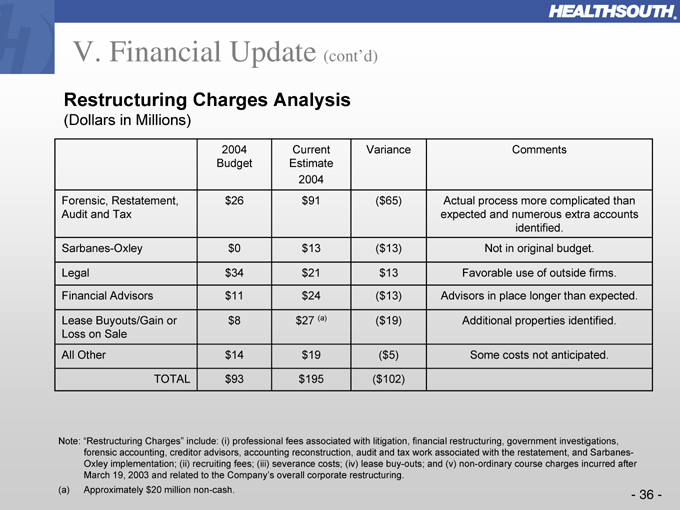
V. Financial Update (cont’d)
Restructuring Charges Analysis
(Dollars in Millions)
2004 Budget Current Estimate 2004 Variance Comments
Forensic, Restatement, Audit and Tax $26 $91 ($65) Actual process more complicated than expected and numerous extra accounts identified.
Sarbanes-Oxley $0 $13 ($13) Not in original budget.
Legal $34 $21 $13 Favorable use of outside firms.
Financial Advisors $11 $24 ($13) Advisors in place longer than expected.
Lease Buyouts/Gain or Loss on Sale $8 $27(a) ($19) Additional properties identified.
All Other $14 $19 ($5) Some costs not anticipated.
TOTAL $93 $195 ($102)
Note: “Restructuring Charges” include: (i) professional fees associated with litigation, financial restructuring, government investigations, forensic accounting, creditor advisors, accounting reconstruction, audit and tax work associated with the restatement, and Sarbanes-Oxley implementation; (ii) recruiting fees; (iii) severance costs; (iv) lease buy-outs; and (v) non-ordinary course charges incurred after March 19, 2003 and related to the Company’s overall corporate restructuring.
(a) Approximately $20 million non-cash.
- 36 -
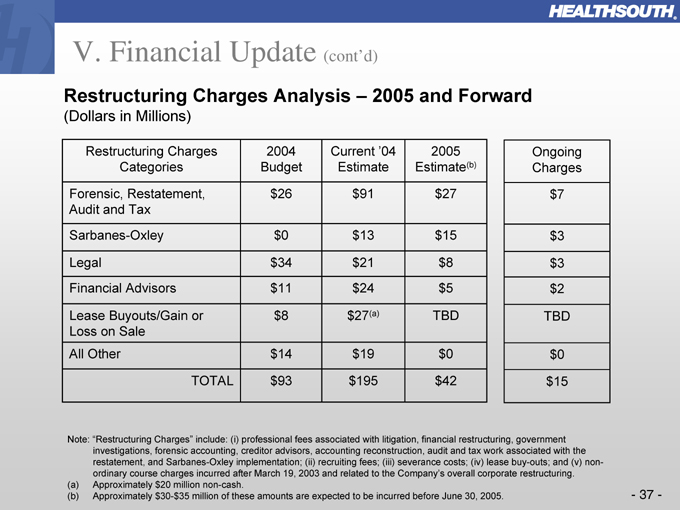
V. Financial Update (cont’d)
Restructuring Charges Analysis – 2005 and Forward
(Dollars in Millions)
Restructuring Charges Categories 2004 Budget Current ‘04 Estimate 2005 Estimate(b) Ongoing Charges
Forensic, Restatement, $26 $91 $27 $7
Audit and Tax
Sarbanes-Oxley $0 $13 $15 $3
Legal $34 $21 $8 $3
Financial Advisors $11 $24 $5 $2
Lease Buyouts/Gain or Loss on Sale $8 $27(a) TBD TBD
All Other $14 $19 $0 $0
TOTAL $93 $195 $42 $15
Note: “Restructuring Charges” include: (i) professional fees associated with litigation, financial restructuring, government investigations, forensic accounting, creditor advisors, accounting reconstruction, audit and tax work associated with the restatement, and Sarbanes-Oxley implementation; (ii) recruiting fees; (iii) severance costs; (iv) lease buy-outs; and (v) non-ordinary course charges incurred after March 19, 2003 and related to the Company’s overall corporate restructuring. (a) Approximately $20 million non-cash.
(b) Approximately $30-$35 million of these amounts are expected to be incurred before June 30, 2005.
- 37 -
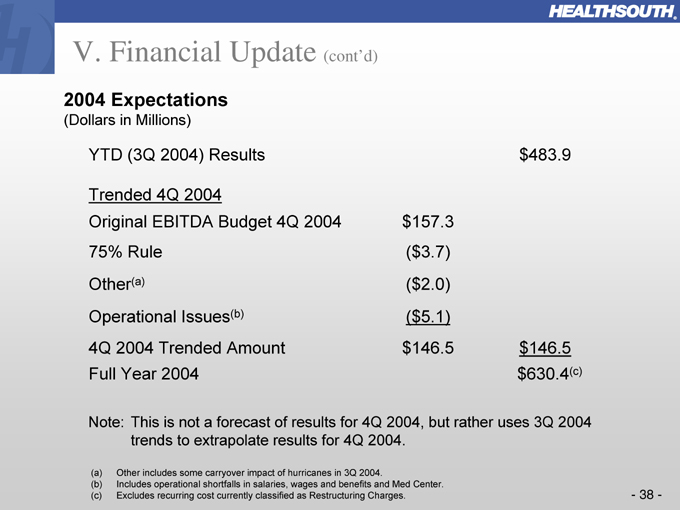
V. Financial Update (cont’d)
2004 Expectations
(Dollars in Millions)
YTD (3Q 2004) Results $483.9
Trended 4Q 2004
Original EBITDA Budget 4Q 2004 $157.3 75% Rule ($3.7) Other(a) ($2.0) Operational Issues(b) ($5.1)
4Q 2004 Trended Amount $146.5 $146.5 Full Year 2004 $630.4(c)
Note: This is not a forecast of results for 4Q 2004, but rather uses 3Q 2004 trends to extrapolate results for 4Q 2004.
(a) Other includes some carryover impact of hurricanes in 3Q 2004.
(b) Includes operational shortfalls in salaries, wages and benefits and Med Center. (c) Excludes recurring cost currently classified as Restructuring Charges.
- 38 -
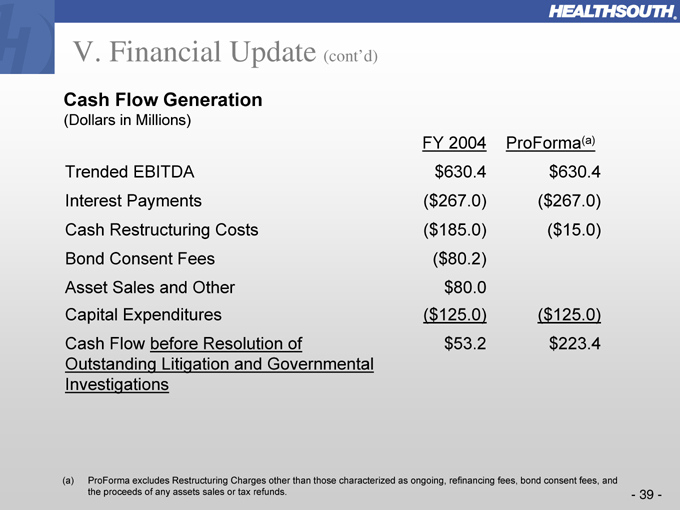
V. Financial Update (cont’d)
Cash Flow Generation
(Dollars in Millions)
FY 2004 ProForma(a)
Trended EBITDA $630.4 $630.4
Interest Payments ($267.0) ($267.0)
Cash Restructuring Costs ($185.0) ($15.0)
Bond Consent Fees ($80.2)
Asset Sales and Other $80.0
Capital Expenditures ($125.0) ($125.0)
Cash Flow before Resolution of Outstanding Litigation and Governmental Investigations $53.2 $223.4
(a) ProForma excludes Restructuring Charges other than those characterized as ongoing, refinancing fees, bond consent fees, and the proceeds of any assets sales or tax refunds.
- 39 -
Agenda
I. Operational Update
II. 75% Rule Impact
III. Liquidity and Bank Facility Update IV. SEC Filing Update V. Financial Update VI. Legal Update VII. Management Focus VIII. Questions and Answers
Jay Grinney, Mike Snow Jay Grinney John Workman John Workman John Workman Greg Doody Jay Grinney
- 40 -
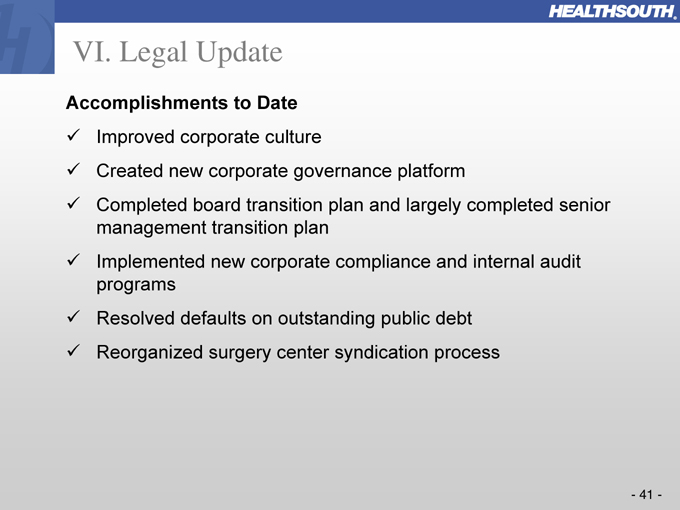
VI. Legal Update
Accomplishments to Date
Improved corporate culture
Created new corporate governance platform
Completed board transition plan and largely completed senior management transition plan Implemented new corporate compliance and internal audit programs Resolved defaults on outstanding public debt Reorganized surgery center syndication process
- 41 -
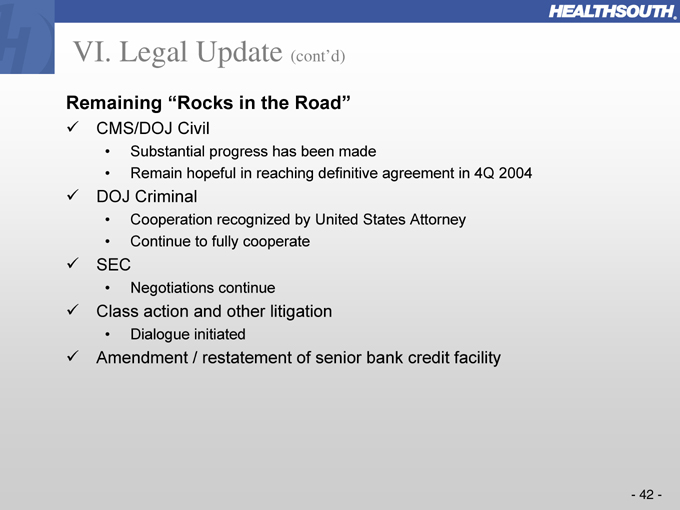
VI. Legal Update (cont’d)
Remaining “Rocks in the Road”
CMS/DOJ Civil
Substantial progress has been made
Remain hopeful in reaching definitive agreement in 4Q 2004
DOJ Criminal
Cooperation recognized by United States Attorney Continue to fully cooperate
SEC
Negotiations continue
Class action and other litigation
Dialogue initiated
Amendment / restatement of senior bank credit facility
- 42 -
Agenda
I. Operational Update
II. 75% Rule Impact
III. Liquidity and Bank Facility Update IV. SEC Filing Update V. Financial Update VI. Legal Update VII. Management Focus VIII. Questions and Answers
Jay Grinney, Mike Snow Jay Grinney John Workman John Workman John Workman Greg Doody Jay Grinney
- 43 -
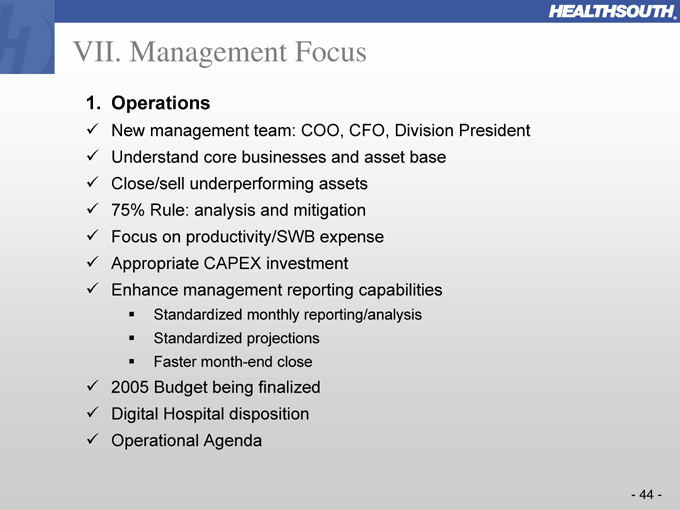
VII. Management Focus
1. Operations
New management team: COO, CFO, Division President Understand core businesses and asset base Close/sell underperforming assets 75% Rule: analysis and mitigation Focus on productivity/SWB expense Appropriate CAPEX investment Enhance management reporting capabilities
Standardized monthly reporting/analysis Standardized projections Faster month-end close
2005 Budget being finalized Digital Hospital disposition Operational Agenda
- 44 -
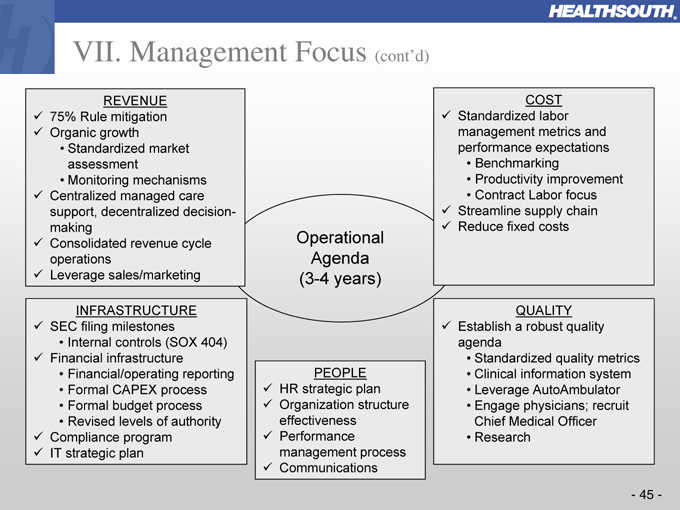
VII. Management Focus (cont’d)
REVENUE
75% Rule mitigation Organic growth
Standardized market assessment Monitoring mechanisms
Centralized managed care support, decentralized decision-making Consolidated revenue cycle operations Leverage sales/marketing
INFRASTRUCTURE
SEC filing milestones
Internal controls (SOX 404)
Financial infrastructure
Financial/operating reporting Formal CAPEX process Formal budget process Revised levels of authority
Compliance program IT strategic plan
Operational Agenda (3-4 years)
PEOPLE
HR strategic plan Organization structure effectiveness Performance management process Communications
COST
Standardized labor management metrics and performance expectations
Benchmarking
Productivity improvement Contract Labor focus
Streamline supply chain Reduce fixed costs
QUALITY
Establish a robust quality agenda
Standardized quality metrics Clinical information system Leverage
AutoAmbulator Engage physicians; recruit Chief Medical Officer Research
- 45 -
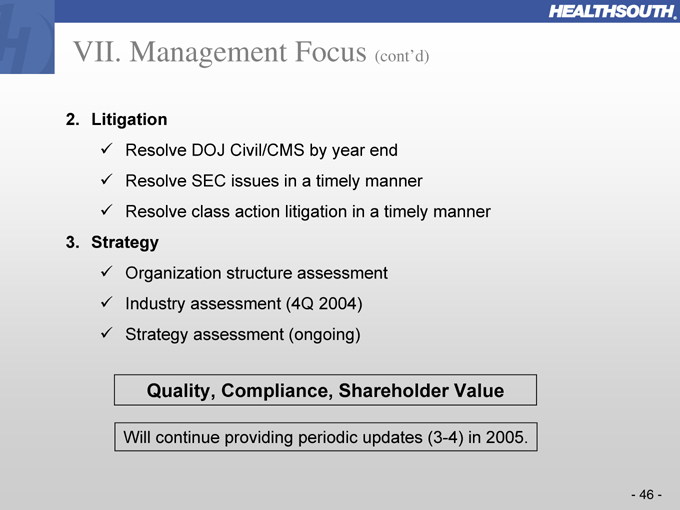
VII. Management Focus (cont’d)
2. Litigation
Resolve DOJ Civil/CMS by year end Resolve SEC issues in a timely manner
Resolve class action litigation in a timely manner
3. Strategy
Organization structure assessment Industry assessment (4Q 2004) Strategy assessment (ongoing)
Quality, Compliance, Shareholder Value
Will continue providing periodic updates (3-4) in 2005.
- 46 -
VII. Management Focus (cont’d)
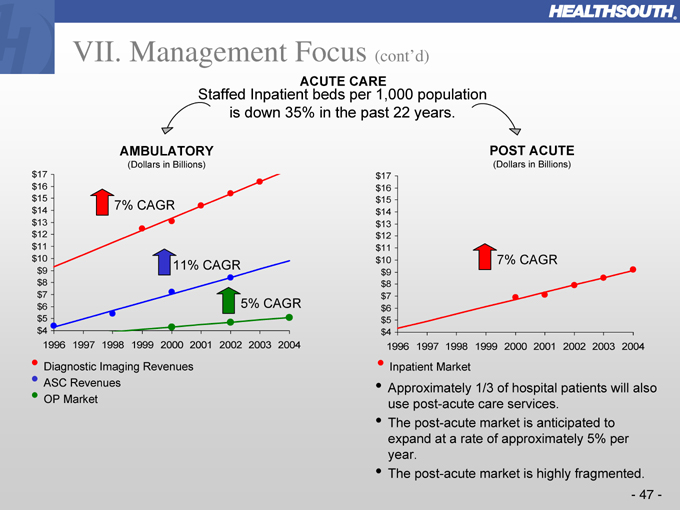
ACUTE CARE
Staffed Inpatient beds per 1,000 population is down 35% in the past 22 years.
AMBULATORY
(Dollars in Billions) $17 $16 $15 $14 $13 $12 $11 $10 $9 $8 $7 $6 $5 $4
7% CAGR
11% CAGR
5% CAGR
1996 1997 1998 1999 2000 2001 2002 2003 2004
Diagnostic Imaging Revenues ASC Revenues OP Market
POST ACUTE
(Dollars in Billions) $17 $16 $15 $14 $13 $12 $11 $10 $9 $8 $7 $6 $5 $4
7% CAGR
1996 1997 1998 1999 2000 2001 2002 2003 2004
Inpatient Market
Approximately 1/3 of hospital patients will also use post-acute care services.
The post-acute market is anticipated to expand at a rate of approximately 5% per year.
The post-acute market is highly fragmented.
- 47 -
VIII. Questions and Answers
Questions and Answers
- 48 -