Exhibit 99

Business Update
September 13, 2005
Forward-Looking Statements
The information contained in this presentation includes certain estimates and other forward-looking information that reflect our current views with respect to future events and financial performance
These estimates and other forward-looking information are based on assumptions that HealthSouth believes, as of the date hereof, are reasonable. Inevitably, there will be differences between such estimates and actual results, and those differences may be material to HealthSouth
There can be no assurance that any estimates or forward-looking information will be realized
All such estimates and forward-looking information speak only as of the date hereof. HealthSouth undertakes no duty to publicly update or revise the information contained herein
You are cautioned not to place undue reliance on the estimates and other forward-looking information in this presentation as they are based on current expectations and general assumptions and are subject to various risks, uncertainties and other factors, many of which are beyond our control, that may cause actual results to differ materially from the views, beliefs and estimates expressed herein
2
Forward-Looking Statements (cont.)
Some factors that may affect the accuracy of such forward-looking statements are as follows:
Regulatory changes, including the implementation of the 75% Rule and the recently-adopted rule updating the IRF-PPS for federal fiscal year 2006
Resolution of outstanding litigation, including certain class action litigation alleging violations under federal securities laws and certain qui tam actions
Our ability to successfully refinance our existing public indebtedness as it becomes due Changes, delays in or suspension of reimbursement by payors Completion of the investigations by the United States Department of Justice Competitive pressures General conditions in the economy and capital markets Completion of the reconstruction of our financial records
3
Cautionary Statements Regarding Presentation
Our recently filed comprehensive Form 10-K, which contains information relating to the years ended December 31, 2000 through December 31, 2003, is the first periodic filing we have made since the filing made for the period ended September 30, 2002. Certain of the financial information contained in the comprehensive Form 10-K represents a restatement of previously filed financial statements
No financial statements filed prior to the comprehensive Form 10-K should be relied upon
References may be made to information relating to periods up to and including December 31, 2003 and information relating to periods after December 31, 2003
Information relating to periods up to and including December 31, 2003 is taken from the financial statements contained in our comprehensive Form 10-K, which have been audited
Information relating to periods after December 31, 2003 is unaudited and remains subject to change based upon the ongoing efforts to reconstruct our accounting records relating to those periods. Actual results may differ materially from the results presented herein for those periods
4
Cautionary Statements Regarding Presentation (cont’d)
Amounts shown for periods after December 31, 2003 were prepared on a basis consistent with amounts shown for periods up to and including December 31, 2003, with the following exceptions. Amounts shown for periods after December 31, 2003:
Include “Restructuring Charges” unless otherwise noted, even though such charges may be of a recurring nature
Exclude the results of the discontinued operations
Do not include charges relating to the impairment of assets
May not reflect the appropriate accounting treatment for certain lease transactions. For example, certain lease transactions that have been re-classified as capital lease following the completion of our reconstruction process may not be reflected in the results presented for periods after December 31, 2003
May differ materially from the results presented herein for those periods following the completion of our reconstruction process
5
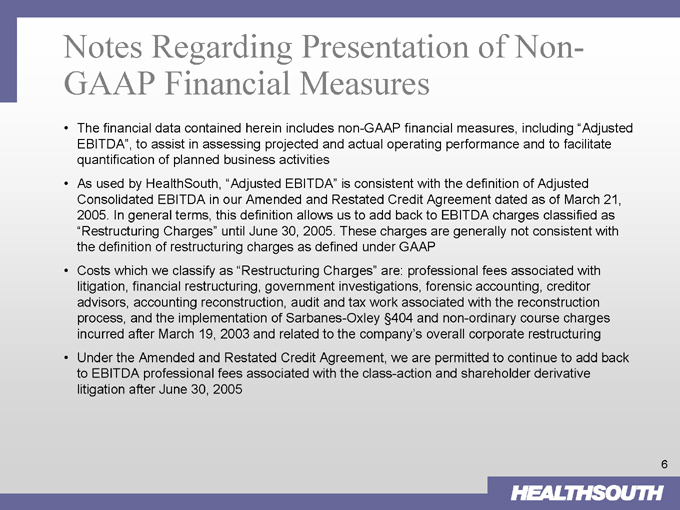
Notes Regarding Presentation of Non-GAAP Financial Measures
The financial data contained herein includes non-GAAP financial measures, including “Adjusted EBITDA”, to assist in assessing projected and actual operating performance and to facilitate quantification of planned business activities
As used by HealthSouth, “Adjusted EBITDA” is consistent with the definition of Adjusted Consolidated EBITDA in our Amended and Restated Credit Agreement dated as of March 21, 2005. In general terms, this definition allows us to add back to EBITDA charges classified as “Restructuring Charges” until June 30, 2005. These charges are generally not consistent with the definition of restructuring charges as defined under GAAP
Costs which we classify as “Restructuring Charges” are: professional fees associated with litigation, financial restructuring, government investigations, forensic accounting, creditor advisors, accounting reconstruction, audit and tax work associated with the reconstruction process, and the implementation of Sarbanes-Oxley §404 and non-ordinary course charges incurred after March 19, 2003 and related to the company’s overall corporate restructuring Under the Amended and Restated Credit Agreement, we are permitted to continue to add back to EBITDA professional fees associated with the class-action and shareholder derivative litigation after June 30, 2005
6

Notes Regarding Presentation of Non-GAAP Financial Measures (cont’d)
Adjusted EBITDA may be useful to stakeholders because it is commonly used as an analytical indicator within the healthcare industry to calculate facility performance, allocate resources and measure leverage capacity and debt service ability
Adjusted EBITDA should not be considered as a measure of financial performance under GAAP
Because HealthSouth currently does not have a balance sheet or other financial statements for any period after December 31, 2003, we are currently unable to reconcile non-GAAP financial measures for such periods to a financial measure calculated in accordance with GAAP. In addition, once our reconstruction process is completed for periods after December 31, 2003, changes could occur in the results indicated for such periods
7
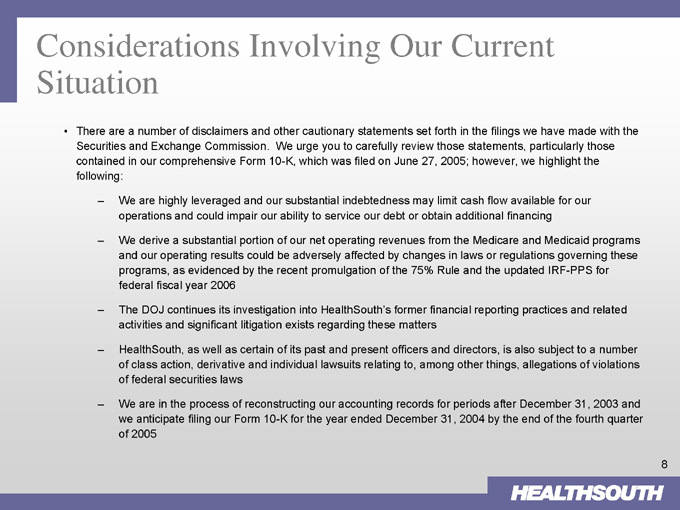
Considerations Involving Our Current Situation
There are a number of disclaimers and other cautionary statements set forth in the filings we have made with the Securities and Exchange Commission. We urge you to carefully review those statements, particularly those contained in our comprehensive Form 10-K, which was filed on June 27, 2005; however, we highlight the following:
We are highly leveraged and our substantial indebtedness may limit cash flow available for our operations and could impair our ability to service our debt or obtain additional financing
We derive a substantial portion of our net operating revenues from the Medicare and Medicaid programs and our operating results could be adversely affected by changes in laws or regulations governing these programs, as evidenced by the recent promulgation of the 75% Rule and the updated IRF-PPS for federal fiscal year 2006
The DOJ continues its investigation into HealthSouth’s former financial reporting practices and related activities and significant litigation exists regarding these matters
HealthSouth, as well as certain of its past and present officers and directors, is also subject to a number of class action, derivative and individual lawsuits relating to, among other things, allegations of violations of federal securities laws
We are in the process of reconstructing our accounting records for periods after December 31, 2003 and we anticipate filing our Form 10-K for the year ended December 31, 2004 by the end of the fourth quarter of 2005
8
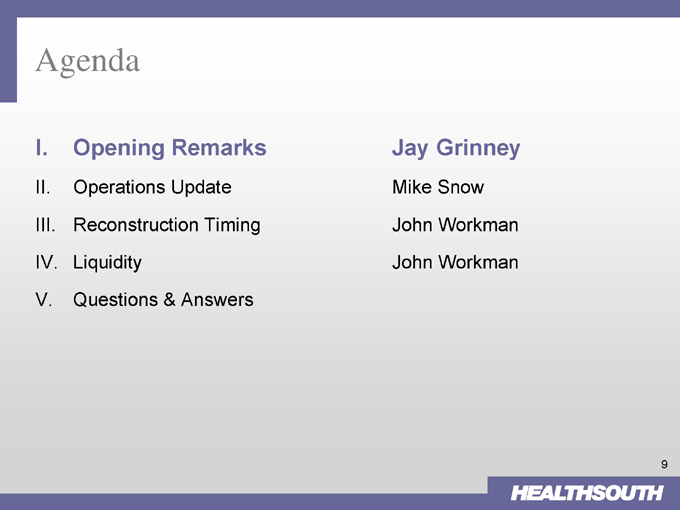
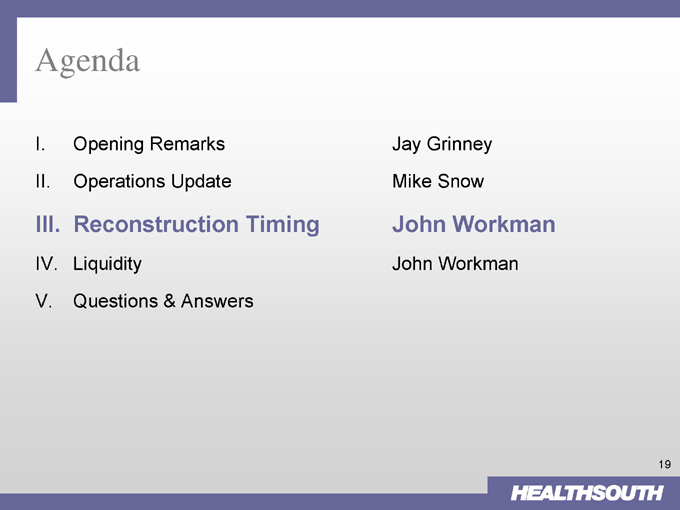
Agenda
I. Opening Remarks Jay Grinney
II. Operations Update Mike Snow
III. Reconstruction Timing John Workman
IV. Liquidity John Workman
V. Questions & Answers
9
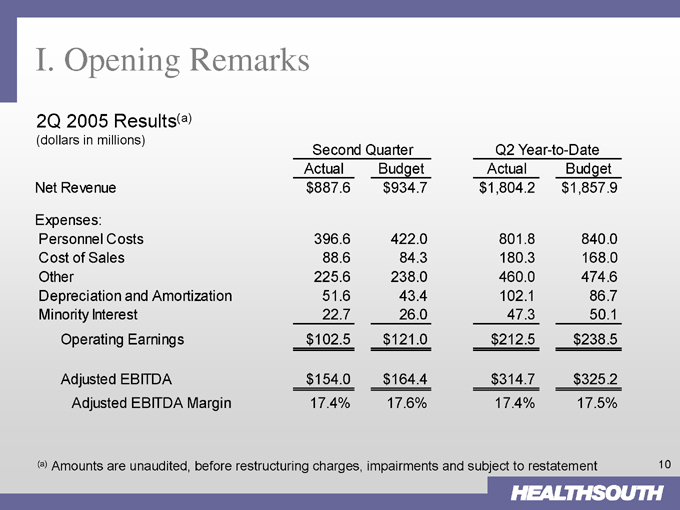
I. Opening Remarks
2Q 2005 Results(a) (dollars in millions)
Second Quarter Q2 Year-to-Date
Actual Budget Actual Budget
Net Revenue $887.6 $934.7 $1,804.2 $1,857.9
Expenses:
Personnel Costs 396.6 422.0 801.8 840.0
Cost of Sales 88.6 84.3 180.3 168.0
Other 225.6 238.0 460.0 474.6
Depreciation and Amortization 51.6 43.4 102.1 86.7
Minority Interest 22.7 26.0 47.3 50.1
Operating Earnings $102.5 $121.0 $212.5 $238.5
Adjusted EBITDA $154.0 $164.4 $314.7 $325.2
Adjusted EBITDA Margin 17.4% 17.6% 17.4% 17.5%
(a) Amounts are unaudited, before restructuring charges, impairments and subject to restatement
10
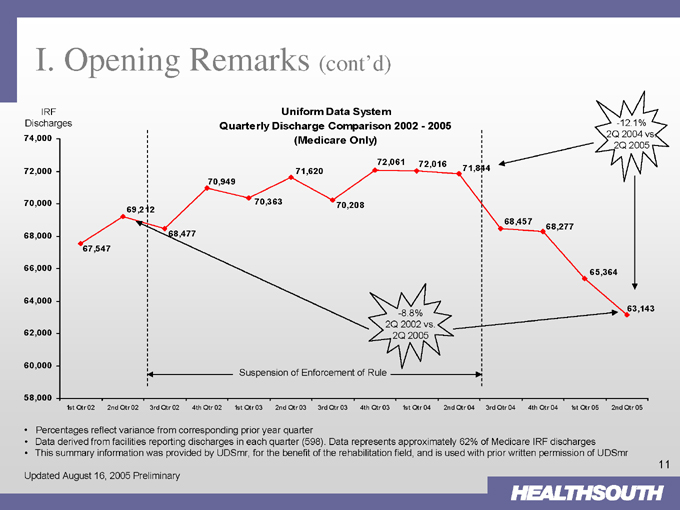
I. Opening Remarks (cont’d)
Uniform Data System
Quarterly Discharge Comparison 2002—2005 (Medicare Only)
IRF Discharges
74,000
72,000
70,000
68,000
66,000
64,000
62,000
60,000
58,000
67,547
69,212
68,477
70,949
70,363
71,620
70,208
72,061 72,016
71,844
68,457
68,277
65,364
63,143
-12.1% 2Q 2004 vs.
2Q 2005
-8.8% 2Q 2002 vs.
2Q 2005
Suspension of Enforcement of Rule
1st Qtr 02 2nd Qtr 02 3rd Qtr 02 4th Qtr 02 1st Qtr 03 2nd Qtr 03 3rd Qtr 03 4th Qtr 03 1st Qtr 04 2nd Qtr 04 3rd Qtr 04 4th Qtr 04 1st Qtr 05 2nd Qtr 05
Percentages reflect variance from corresponding prior year quarter
Data derived from facilities reporting discharges in each quarter (598). Data represents approximately 62% of Medicare IRF discharges This summary information was provided by UDSmr, for the benefit of the rehabilitation field, and is used with prior written permission of UDSmr
Updated August 16, 2005 Preliminary
11
Agenda
I. Opening Remarks Jay Grinney
II. Operations Update Mike Snow
III. Reconstruction Timing John Workman
IV. Liquidity John Workman
V. Questions & Answers
12
II. Operations Update – Inpatient
Division President: Mark Tarr
Financial Overview (in millions)
2Q 2005 2Q 2005
Actual (a) Budget
Net Revenue $489.4 $516.4
Personnel costs 234.6 245.4
Cost of sales 29.4 25.5
Other 90.9 103.0
Total operating expenses 354.9 373.8
Depreciation and amortization 13.9 11.2
Minority Interest 8.3 11.0
Operating Earnings
Before Corp. OH $112.3 $120.4
Memo:
Corporate OH (b) $18.6 $19.6
Operating Statistics
2Q05 2Q04 % Change
SS IP Discharges 28,325 30,998 (8.6%)
SS OP Visits 512,558 607,126 (15.6%)
IP Rev/ Discharge $14,924 $14,068 6.1%
Medicare Case Mix Index 1.32 1.25 4.9%
Highlights
Volume decline primarily due to 75% Rule
Some general acute weakness
All facilities have met or exceeded compliance threshold
Good cost controls, but volume reduction limiting ability to leverage fixed costs
PPS impact negative – see following slide
(a) 2005 amounts are before restructuring, impairment, corporate overhead and subject to restatement (b) Based upon results from 2Q05, corporate overhead is approximately 3.8% of revenue excluding D&A
13
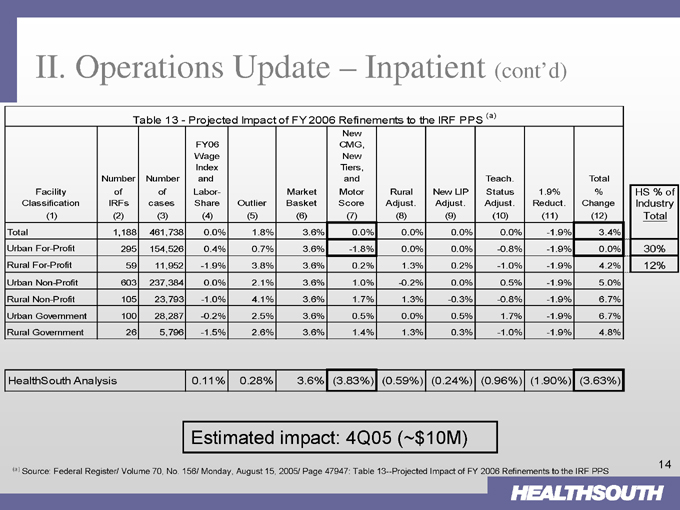
II. Operations Update – Inpatient (cont’d)
Table 13 - Projected Impact of FY 2006 Refinements to the IRF PPS (a)
Facility Classification (1) Number of IRFs (2) Number of cases (3) FY06 Wage Index and Labor- Share (4) Outlier (5) Market Basket (6) New CMG, New Tiers, and Motor Score (7) Rural Adjust. (8) New LIP Adjust. (9) Teach. Status Adjust. (10) 1.9% Reduct. (11) Total % Change (12)
Total 1,188 461,738 0.0% 1.8% 3.6% 0.0% 0.0% 0.0% 0.0% - 1.9% 3.4%
Urban For-Profit 295 154,526 0.4% 0.7% 3.6% - 1.8% 0.0% 0.0% -0.8% - 1.9% 0.0%
Rural For-Profit 59 11,952 -1.9% 3.8% 3.6% 0.2% 1.3% 0.2% -1.0% -1.9% 4.2%
Urban Non-Profit 603 237,384 0.0% 2.1% 3.6% 1.0% -0.2% 0.0% 0.5% -1.9% 5.0%
Rural Non-Profit 105 23,793 -1.0% 4.1% 3.6% 1.7% 1.3% -0.3% -0.8% -1.9% 6.7%
Urban Government 100 28,287 -0.2% 2.5% 3.6% 0.5% 0.0% 0.5% 1.7% -1.9% 6.7%
Rural Government 26 5,796 -1.5% 2.6% 3.6% 1.4% 1.3% 0.3% -1.0% -1.9% 4.8%
HS % of
Industry
Total
30%
12%
HealthSouth Analysis 0.11% 0.28% 3.6% (3.83%) (0.59%) (0.24%) (0.96%) (1.90%) (3.63%)
Estimated impact: 4Q05 (~$10M)
(a) Source: Federal Register/ Volume 70, No. 156/ Monday, August 15, 2005/ Page 47947: Table 13—Projected Impact of FY 2006 Refinements to the IRF PPS
14
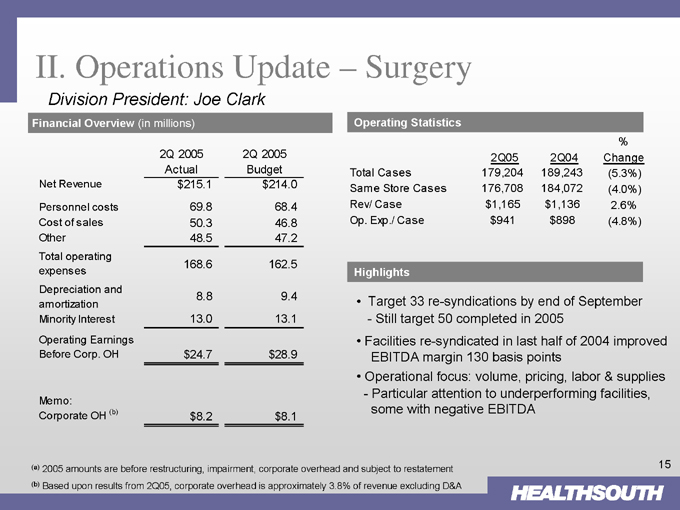
II. Operations Update – Surgery
Division President: Joe Clark
Financial Overview (in millions)
2Q 2005 2Q 2005
Actual Budget
Net Revenue $215.1 $214.0
Personnel costs 69.8 68.4
Cost of sales 50.3 46.8
Other 48.5 47.2
Total operating expenses 168.6 162.5
Depreciation and amortization 8.8 9.4
Minority Interest 13.0 13.1
Operating Earnings
Before Corp. OH $24.7 $28.9
Memo:
Corporate OH (b) $8.2 $8.1
Operating Statistics
2Q05 2Q04 % Change
Total Cases 179,204 189,243 (5.3%)
Same Store Cases 176,708 184,072 (4.0%)
Rev/ Case $1,165 $1,136 2.6%
Op. Exp./ Case $941 $898 (4.8%)
Highlights
Target 33 re-syndications by end of September
Still target 50 completed in 2005
Facilities re-syndicated in last half of 2004 improved EBITDA margin 130 basis points Operational focus: volume, pricing, labor & supplies
Particular attention to underperforming facilities, some with negative EBITDA
(a) 2005 amounts are before restructuring, impairment, corporate overhead and subject to restatement (b) Based upon results from 2Q05, corporate overhead is approximately 3.8% of revenue excluding D&A
15
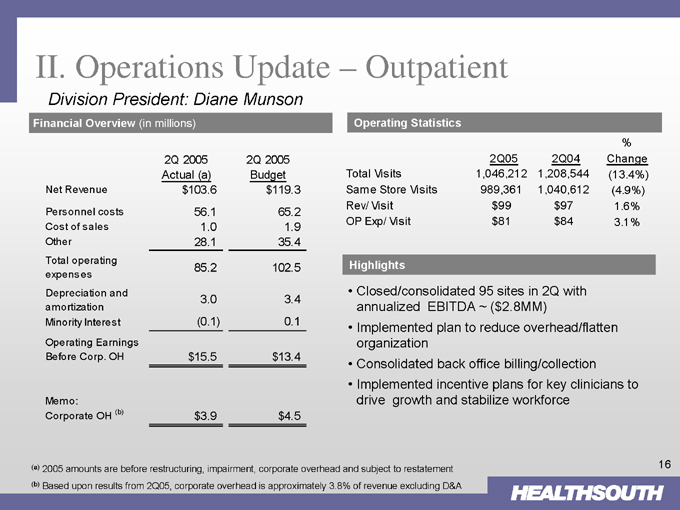
II. Operations Update – Outpatient
Division President: Diane Munson
Financial Overview (in millions)
2Q 2005 2Q 2005
Actual (a) Budget
Net Revenue $103.6 $119.3
Personnel costs 56.1 65.2
Cost of sales 1.0 1.9
Other 28.1 35.4
Total operating expenses 85.2 102.5
Depreciation and amortization 3.0 3.4
Minority Interest (0.1) 0.1
Operating Earnings
Before Corp. OH $15.5 $13.4
Memo:
Corporate OH (b) $3.9 $4.5
Operating Statistics
2Q05 2Q04 % Change
Total Visits 1,046,212 1,208,544 (13.4%)
Same Store Visits 989,361 1,040,612 (4.9%)
Rev/ Visit $99 $97 1.6%
OP Exp/ Visit $81 $84 3.1%
Highlights
Closed/consolidated 95 sites in 2Q with annualized EBITDA ~ ($2.8MM) Implemented plan to reduce overhead/flatten organization Consolidated back office billing/collection Implemented incentive plans for key clinicians to drive growth and stabilize workforce
(a) 2005 amounts are before restructuring, impairment, corporate overhead and subject to restatement (b) Based upon results from 2Q05, corporate overhead is approximately 3.8% of revenue excluding D&A
16
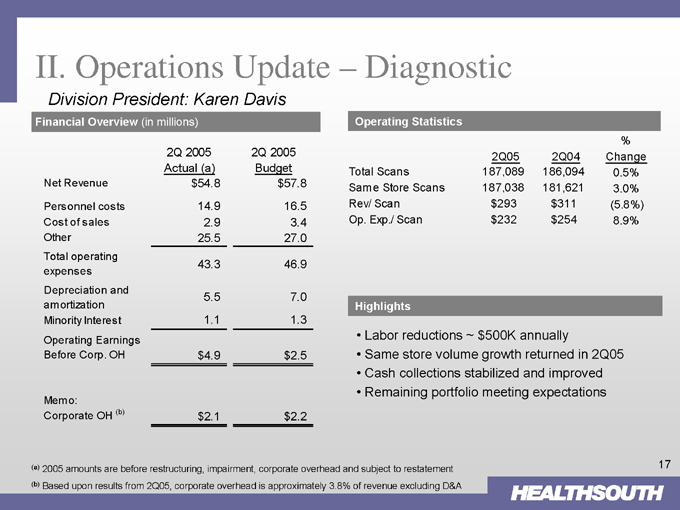
II. Operations Update – Diagnostic
Division President: Karen Davis
Financial Overview (in millions)
2Q 2005 Actual (a) 2Q 2005 Budget
Net Revenue $54.8 $57.8
Personnel costs 14.9 16.5
Cost of sales 2.9 3.4
Other 25.5 27.0
Total operating expenses 43.3 46.9
Depreciation and amortization 5.5 7.0
Minority Interest 1.1 1.3
Operating Earnings
Before Corp. OH $4.9 $2.5
Memo:
Corporate OH (b) $2.1 $2.2
Operating Statistics
2Q05 2Q04 % Change
Total Scans 187,089 186,094 0.5%
Same Store Scans 187,038 181,621 3.0%
Rev/ Scan $293 $311 (5.8%)
Op. Exp./ Scan $232 $254 8.9%
Highlights
Labor reductions ~ $500K annually
Same store volume growth returned in 2Q05 Cash collections stabilized and improved Remaining portfolio meeting expectations
(a) 2005 amounts are before restructuring, impairment, corporate overhead and subject to restatement (b) Based upon results from 2Q05, corporate overhead is approximately 3.8% of revenue excluding D&A
17
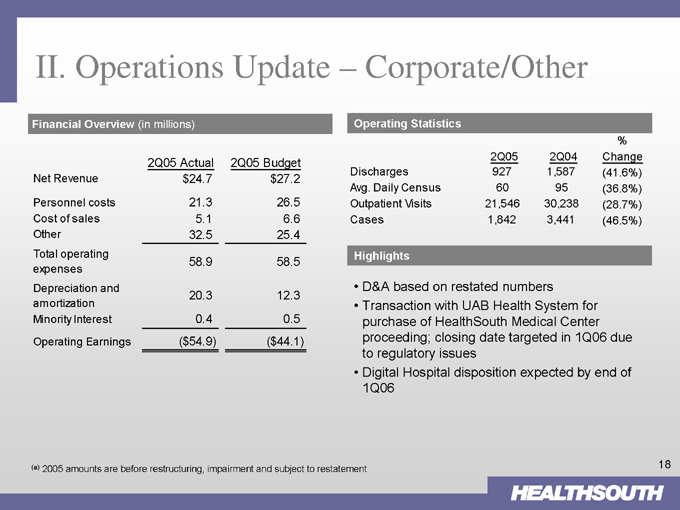
II. Operations Update – Corporate/Other
Financial Overview (in millions)
2Q05 Actual 2Q05 Budget
Net Revenue $24.7 $27.2
Personnel costs 21.3 26.5
Cost of sales 5.1 6.6
Other 32.5 25.4
Total operating expenses 58.9 58.5
Depreciation and amortization 20.3 12.3
Minority Interest 0.4 0.5
Operating Earnings ($54.9) ($44.1)
Operating Statistics
2Q05 2Q04 % Change
Discharges 927 1,587 (41.6%)
Avg. Daily Census 60 95 (36.8%)
Outpatient Visits 21,546 30,238 (28.7%)
Cases 1,842 3,441 (46.5%)
Highlights
D&A based on restated numbers Transaction with UAB Health System for purchase of HealthSouth Medical Center proceeding; closing date targeted in 1Q06 due to regulatory issues Digital Hospital disposition expected by end of 1Q06
(a) 2005 amounts are before restructuring, impairment and subject to restatement
18
Agenda
I. Opening Remarks Jay Grinney
II. Operations Update Mike Snow
III. Reconstruction Timing John Workman
IV. Liquidity John Workman
V. Questions & Answers
19
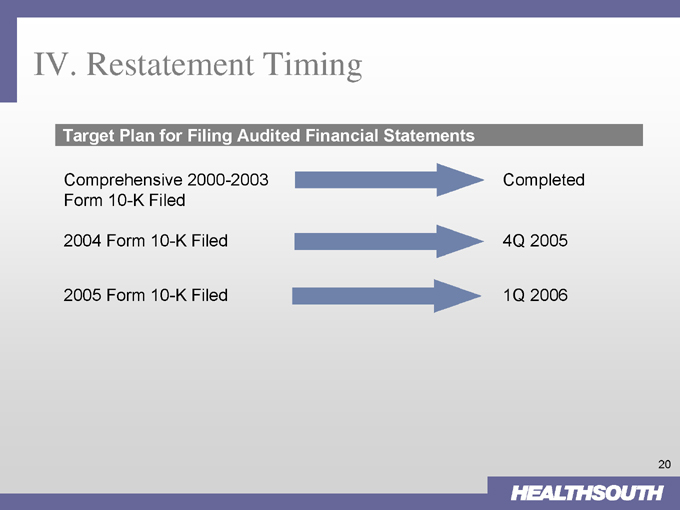
IV. Restatement Timing
Target Plan for Filing Audited Financial Statements
Comprehensive 2000-2003 Form 10-K Filed
Completed
2004 Form 10-K Filed
4Q 2005
2005 Form 10-K Filed
1Q 2006
20
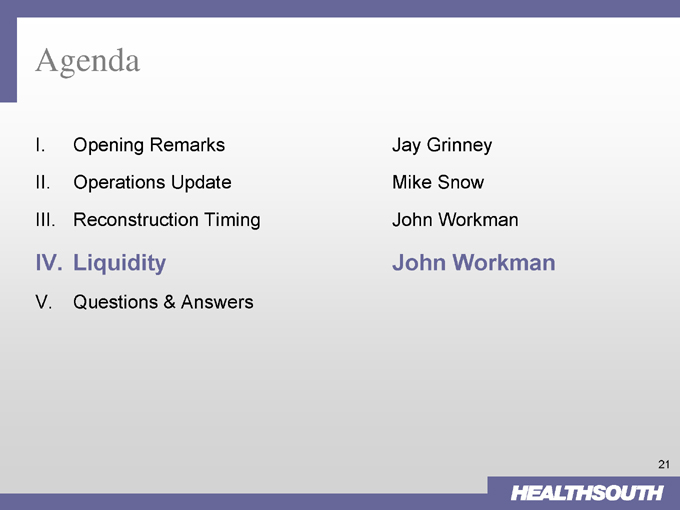
Agenda
I. Opening Remarks Jay Grinney
II. Operations Update Mike Snow
III. Reconstruction Timing John Workman
IV. Liquidity John Workman
V. Questions & Answers
21
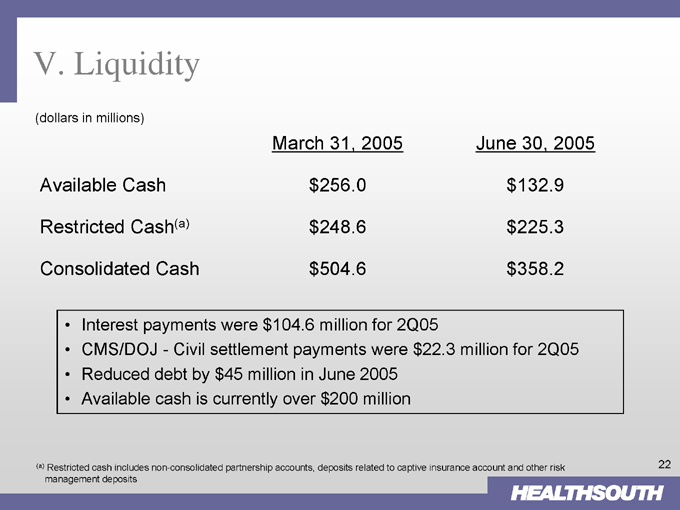
V. Liquidity
(dollars in millions)
March 31, 2005 June 30, 2005
Available Cash $256.0 $132.9
Restricted Cash(a) $248.6 $225.3
Consolidated Cash $504.6 $358.2
Interest payments were $104.6 million for 2Q05
CMS/DOJ—Civil settlement payments were $22.3 million for 2Q05 Reduced debt by $45 million in June 2005 Available cash is currently over $200 million
(a) Restricted cash includes non-consolidated partnership accounts, deposits related to captive insurance account and other risk management deposits
22

Agenda
I. Opening Remarks Jay Grinney
II. Operations Update Mike Snow
III. Reconstruction Timing John Workman
IV. Liquidity John Workman
V. Questions & Answers
23

Questions and Answers
24