Exhibit 99.2
| Item 7. | Management’s Discussion and Analysis of Financial Condition and Results of Operations |
The following Management’s Discussion and Analysis of Financial Condition and Results of Operations (“MD&A”) is designed to provide the reader with information that will assist in understanding our consolidated financial statements, the changes in certain key items in those financial statements from year to year, and the primary factors that accounted for those changes, as well as how certain accounting principles affect our consolidated financial statements. The discussion also provides information about the financial results of the various segments of our business to provide a better understanding of how those segments and their results affect the financial condition and results of operations of HealthSouth as a whole.
Forward Looking Information
This MD&A should be read in conjunction with our accompanying consolidated financial statements and related notes. See “Cautionary Statement Regarding Forward-Looking Statements” on page ii of this report for a description of important factors that could cause actual results to differ from expected results. See also Item 1A,Risk Factors.
Executive Overview
As described in detail in Item 1,Business, the past several years have been marked by profound turmoil and change. During this period, a significant portion of our time and attention has been devoted to matters primarily outside the ordinary course of business such as replacing our senior management team, cooperating with federal investigators, restructuring our finances, and reconstructing our accounting records. We have also devoted substantial resources to improving fundamental business systems including our corporate governance functions, financial controls, and operational infrastructure.
Despite these difficulties, our board of directors, senior management team, and employees worked diligently throughout 2005 and into 2006 and have made significant progress in addressing many of the more significant obstacles created by the March 2003 crisis, including the following:
| | • | | We have replaced our board of directors and senior management team and improved our corporate governance policies and practices. See Item 1,Business, “Our New Board of Directors and Senior Management Team.” |
| | • | | We have completed a substantive reconstruction of our accounting records and filed annual reports on Form 10-K for the fiscal years (including this filing) ended December 31, 2005, 2004, 2003, and 2002 (including a restatement of previously issued consolidated financial statements for the fiscal years ended December 31, 2001 and 2000). In December 2005, we held our first Annual Meeting of Stockholders since 2002. |
| | • | | We have prepaid substantially all of our existing indebtedness with proceeds from a series of recapitalization transactions and replaced it with approximately $3 billion of new long-term debt, which we believe will produce enhanced operational flexibility, reduced refinancing risk, and an improved credit profile. See Item 1,Business, “Recapitalization Transactions” and Note 8,Long-term Debt, to our accompanying consolidated financial statements. |
| | • | | We have reached a global, preliminary agreement in principle with the lead plaintiffs in the federal securities class actions and the derivative litigation, as well as with our insurance carriers, to settle claims filed against us, certain of our former directors and officers, and certain other parties. See Item 1,Business, “Securities Litigation Settlement.” |
| | • | | We have settled with the Department of Justice’s (the “DOJ”) civil division and other parties regarding their allegations that we submitted various fraudulent Medicare cost reports and committed certain other violations of federal health care program requirements. Although this settlement does not cover all similar claims that have been or could be brought against us, it settles the primary known claims that have been pending against us relating to our participation in federal health care programs. The DOJ and the Office of Inspector General (the “HHS-OIG”) of the United States Department of Health and Human Services (“HHS”) continue to review certain other matters, including self-disclosures made by us to the HHS-OIG. See Item 1,Business, “Medicare Program Settlement.” |
| | • | | We have settled with the United States Securities and Exchange Commission (the “SEC”) regarding its allegations that we violated and/or aided and abetted violations of the antifraud, reporting, books-and-records, and internal controls provisions of the federal securities laws. See Item 1,Business, “SEC Settlement.” |
| | • | | We continue to cooperate with federal law enforcement officials and other federal investigators, including the DOJ and the SEC, as they work to conclude their investigations, which are still ongoing. |
1
We have also made significant progress implementing our multi-year operational agenda, which strives to improve our business in five key areas: revenue, cost, quality, people, and infrastructure. In 2005, we made improvements in each of the five key areas listed in that agenda:
| | • | | Revenue—We helped advocate a slower phase-in of the 75% Rule and, we believe, outperformed the industry in mitigating the impact of the 75% Rule. We consolidated outpatient revenue centers and overhauled our outpatient sales and marketing function. We also piloted various new programs to enhance our marketing and have hired a new senior vice president to improve our managed care contracting function. |
| | • | | Cost—We substantially reduced unnecessary overhead expense and closed or sold under-performing facilities. We have also hired a new senior vice president to manage and streamline our supply chain. We will continue to work to reduce costs by reorganizing and flattening each operating division and implementing standardized labor management metrics and performance expectations. In addition, we are closely monitoring our business and will, when necessary, close or sell additional under-performing facilities. |
| | • | | Quality—We began an inpatient clinical information assessment, increased production of our AutoAmbulator, and participated in various clinical research projects. We are also working to enhance strong quality assurance programs within our facilities and divisions. We plan to supplement these programs by improving our company-wide quality agenda that will include standardized division-specific quality metrics and improved clinical information through the use of technology. |
| | • | | People—We completed our senior management team and hired a number of other management personnel. We also completed a human resources strategic plan and increased 401(k) contributions for our employees. Our goal is to build a culture of integrity, transparency, diversity, and excellence, while simplifying and flattening our organizational structure. |
| | • | | Infrastructure—We invested significant resources to evaluate and improve our financial, reporting, and compliance infrastructure, and will continue to invest heavily in our infrastructure throughout this turnaround period. Although our infrastructure needs further improvement in many areas, we are specifically focused on implementing required internal controls (e.g., compliance with Section 404 of the Sarbanes-Oxley Act of 2002 (“Sarbanes-Oxley”)), enhancing our financial infrastructure (e.g., improving financial and operational reporting and establishing a formal capital expenditure process and formal budget process), enhancing our management reporting capabilities (e.g., standardizing our monthly reporting and analysis, standardizing our financial projections, and implementing a faster month-end close), developing regulatory compliance programs, enhancing our information systems (e.g. upgrading our patient accounting systems), and implementing an information technology strategic plan. |
Our business, and the health care market in general, continued to evolve throughout 2005. On the positive side, health care sector growth continues to outpace the economy in response to an aging U.S. population and other factors. In addition, the delivery of health care services is migrating to outpatient and post-acute care environments, which suits our business model. On the other hand, we anticipate pricing pressure in the markets we serve, as well as increased competition. Most importantly, recent changes to the 75% Rule and the prospective payment system applicable to our inpatient rehabilitation facilities (“IRF-PPS”) have combined to create a very challenging operating environment for us.
On the whole, our core businesses remain sound. We continue to be the largest provider of ambulatory surgery and rehabilitative health care services in the United States, with (as of December 31, 2005) 1,070 facilities and approximately 37,000 full- and part-time employees. We believe that we are responding to challenges in the inpatient market as well as or better than our competitors, which may lead to potential consolidation opportunities in the future.
We continue to face operational challenges, but we believe our accomplishments in 2005 and the 2006 recapitalization transactions have positioned us to capitalize on our competencies and move forward with implementing our strategic growth plan.
Our Business
Our business is currently divided into four primary operating divisions—inpatient, surgery centers, outpatient, and diagnostic—and a fifth division that manages certain other revenue producing activities and corporate functions. These five divisions correspond to our five reporting segments discussed later in this Item and throughout this annual report.
Inpatient. Our inpatient division, which comprises the majority of ourNet operating revenues, provides treatment at (as of December 31, 2005) 93 freestanding inpatient rehabilitation facilities (“IRFs”), 10 long-term acute care hospitals (“LTCHs”), and 101 satellites of inpatient facilities providing primarily outpatient care. In addition to the facilities in which we have an ownership interest, our inpatient division operated 14 inpatient rehabilitation units, 11 outpatient facilities, and 2 gamma knife radiosurgery centers through management contracts as of December 31, 2005. This division continues to be the
2
market leader in inpatient rehabilitation services in terms of revenues, number of IRFs, and patients served. In 2004, operating earnings of this division remained stable due largely to treating higher acuity patients and stricter expense controls. In 2005, net operating revenues decreased due to the continued phase-in of the 75% Rule, but operating earnings increased slightly because of the division’s efforts to manage expenses in relation to declining patient volume. We expect this division to continue to show positive results; however, as discussed below, the 75% Rule and recent IRF-PPS changes are likely to have a materially negative impact on future results of operations.
Surgery Centers. Our surgery centers division, which is our second largest division in terms ofNet operating revenues, operates (as of December 31, 2005) 158 freestanding ambulatory surgery centers (“ASCs”) and 3 surgical hospitals. Our surgery centers segment’sNet operating revenues declined from 2003 to 2005. Since March 2003, the division has struggled due in large part to an inability to efficiently resyndicate (i.e., sell ownership interests in) its partnership portfolio and its inability to control supply costs. During 2005, resyndication activity improved, and we enhanced our portfolio of ASCs through the closure of underperforming facilities. We expect this division to benefit as outpatient procedures continue to migrate to the more efficient ASC environment. However, potential benefits from industry growth may be offset by physician partners who are demanding a higher ownership interest in our partnerships, thereby lowering our share of partnership earnings.
Outpatient. Our outpatient division currently provides outpatient therapy services (as of December 31, 2005) at 617 facilities. This division’s performance declined between 2003 and 2005 due primarily to poor operational processes and increased competition from physician-owned physical therapy sites. During 2005, we continued the rationalization of our outpatient facilities and formulated a sales and marketing team with the primary purpose to diversify our referral sources and minimize our exposure to physician-owned physical therapy sites. We believe these initiatives will begin to produce positive results for this division in 2006.
3
Diagnostic. Our diagnostic division operates (as of December 31, 2005) 85 diagnostic imaging centers. This division’s performance suffered from 2003 to 2005 due to poor margins for the diagnostic market in general and strong competition from physician-owned diagnostic service centers. We are beginning to see stabilization of bothNet operating revenues and operating earnings, which we believe is due in part to payor pressures to decrease perceived over-utilization of diagnostic services by physician-owned diagnostic service centers. We continue to focus on operational improvements to increase our margins. In 2006, we hired R. Gregory Brophy to serve as president of the diagnostic division. In addition, we have received inquiries from parties interested in acquiring our diagnostic division and have hired an investment bank to assist us in evaluating those opportunities. However, no final decision has been made with respect to the divestiture of our diagnostic division at this time.
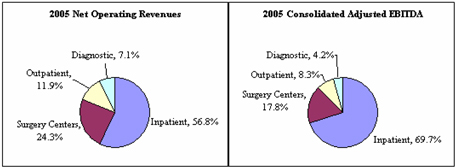
As shown by the following charts, our inpatient and surgery centers divisions made up more than 80% of 2005Net operating revenues and over 85% of 2005 Consolidated Adjusted EBITDA (as defined in this Item, “Consolidated Results of Operations,”) from our four primary operating divisions. For a reconciliation of loss from continuing operations to Consolidated Adjusted EBITDA, see this Item, “Consolidated Results of Operations—Consolidated Adjusted EBITDA.”
We believe that the aging of the U.S. population, changes in technology, and the continuing growth in health care spending will increase demand for the types of services we provide. First, many of the health conditions associated with aging—like stroke and heart attacks, neurological disorders, and diseases and injuries to the muscles, bones, and joints—will increase the demand for ambulatory surgery and rehabilitative services. Second, pressure from payors to provide efficient, high-quality health care services is forcing many procedures traditionally performed in acute care hospitals out of the acute care environment. We believe these market factors align with our strengths. We plan to prioritize investment of time and capital based on where realistic growth prospects are strongest, which we currently believe are our inpatient and surgery centers divisions.
Key Challenges
Although our business is continuing to generate substantial revenues, and market factors appear to favor our outpatient and post-acute care business model, we still have several immediate internal and external challenges to overcome before we can realize significant improvements in our business, including:
| | • | | Operational Improvements. We need to improve our operational efficiency, particularly in our surgery centers, outpatient, and diagnostic divisions. This includes streamlining our division management structure, continuing to consolidate or divest underperforming facilities, implementing standardized performance metrics and practices, and ensuring high quality care. We also will strive to reduce operational variation within each division. |
| | • | | Price Pressure. We are seeing downward pressure on prices in our markets, from both commercial and government payors. We anticipate continuing price pressure in all our divisions. For example, recent IRF-PPS changes are likely to have a materially negative impact on inpatient revenues. In addition, Medicare has frozen ASC pricing through 2009, and beginning in 2007, the Deficit Reduction Act of 2005 will cap ASC and imaging service payments at hospital outpatient department reimbursement levels. Other pricing changes may have a negative impact on our operating results. |
| | • | | Single-Payor Exposure. Medicare comprises approximately 48% of our consolidatedNet operating revenues and approximately 71% of our largest division’s revenues. Consequently, single-payor exposure presents a serious risk. In particular, as discussed in Item 1,Business, “Sources of Revenues,” changes to the 75% Rule and IRF-PPS have |
4
| | combined to create a very challenging operating environment for our inpatient division. The volume volatility created by the 75% Rule has had a significantly negative impact on our inpatient division’sNet operating revenues in 2005. Thus far, we have been able to partially mitigate the impact of the 75% Rule on our inpatient division’s operating earnings by implementing the mitigation strategies discussed in Item 1,Business, “Our Business—Operating Divisions.” However, the combination of volume volatility created by the 75% Rule and lower unit pricing resulting from IRF-PPS changes reduced our operating earnings in 2005 and will have a continuing negative impact on our operating earnings in 2006. In addition, because we receive a significant percentage of our revenues from our inpatient division, and because our inpatient division receives a significant percentage of its revenues from Medicare, our inability to achieve continued compliance with or continue to mitigate the negative effects of the 75% Rule could have a material adverse effect on our business, financial condition, results of operations, and cash flows. |
| | • | | Competition. Competition is increasing as physicians look for new revenue sources to offset declining incomes. In our outpatient and diagnostic divisions, physician practices are the natural owners of most patient volume. Any physician group that generates a substantial portion of facility volume for us may have reached sufficient critical mass to insource their referrals, and is therefore a potential competitor. In addition, the low barriers to entry in the outpatient physical therapy sector, and decreasing barriers to entry in the diagnostic sector, make competition from physician practices a particular problem in those markets. |
| | • | | Declining Ownership Share of Surgery Centers. Like most other ASCs, the majority of our centers are owned in partnership with surgeons and other physicians who perform procedures at the centers. As a result of increased competition in the ASC market and other factors, physicians are demanding increased equity participation in ASCs. Consequently, we expect to see our percentage ownership of centers within our ASC portfolio decline over time, thereby reducing our share of partnership earnings from our ASCs. |
| | • | | Leverage. Although we have completed a series of recapitalization transactions that have eliminated significant uncertainty regarding our capital structure and have improved our financial condition, we remain highly leveraged. Our high leverage increases our cost of capital, decreases our net income, and may prevent us from taking advantage of potential growth opportunities. |
| | • | | Settlement Costs. We have significant cash obligations we must meet in the near future as a result of recent settlements with various federal agencies. Specifically, we are required to pay the remaining balance of our $325 million settlement to the United States in quarterly installments ending in the fourth quarter of 2007 to satisfy our obligations under a settlement described in Item 1,Business, “Medicare Program Settlement.” Furthermore, we are required to pay the remaining balance of our $100 million settlement to the SEC in four installments ending in the fourth quarter of 2007, as described in Item 1,Business, “SEC Settlement.” Payments due under these settlement agreements are as follows as of December 31, 2005: |
| | | | | | | | | |
| | | Medicare
Program
Settlement | | SEC
Settlement | | Total |
| | | (In Thousands) |
2006 | | $ | 83,300 | | $ | 37,500 | | $ | 120,800 |
2007 | | | 86,666 | | | 50,000 | | | 136,666 |
| | | | | | | | | |
| | $ | 169,966 | | $ | 87,500 | | $ | 257,466 |
| | | | | | | | | |
| | • | | Continuing Investigations and Litigation. We face continuing government investigations, as well as numerous class action and individual lawsuits, all of which will consume considerable management attention and company resources and could result in substantial additional payments and fines. Although we have reached a global, preliminary agreement in principle with the lead plaintiffs in the federal securities class actions and the derivative litigation, as well as with our insurance carriers, to settle claims filed against us, certain of our former directors and officers, and certain other parties, there can be no assurance that a final settlement can be reached or that the proposed settlement will receive the required court approval. For additional information, see Item 1,Business, “Securities Litigation Settlement.” |
5
| | • | | Reconstruction, Restatement, and Sarbanes-Oxley Related Costs. We paid approximately $208 million in 2005 in connection with the restructuring of our financial reporting processes, internal control over financial reporting, and managerial operations, and the reconstruction and/or restatement of our consolidated financial statements for the years ended December 31, 2004, 2003, 2002, 2001, and 2000. We anticipate incurring additional related costs in the future, although we expect these costs to decline over time. |
Strategic Plan
Although management’s attention recently has been focused on a range of tactical issues critical to HealthSouth’s survival, our new senior management team has spent considerable time developing a comprehensive strategic plan for the next three to five years that is focused on HealthSouth’s future, not its past. The plan, which has been approved by our board of directors, is divided into the following three phases:
| | • | | Phase 1—Operational Focus. Because of our highly leveraged balance sheet, we must generate additional cash flow from operating activities by improving operational performance in all our operating divisions. In the first phase, we plan to focus on key operational initiatives such as mitigating the impact of the 75% Rule, realizing significant operating performance improvements in each division through standardization of labor and supply chain practices and reduction of fixed costs, completing additional surgery center resyndications, and improving our company-wide quality agenda. In addition, we plan to establish an appropriate internal control environment, strengthen regulatory compliance programs, pilot new post-acute care services, and establish our business development capabilities. Phase 1 has already begun. |
| | • | | Phase 2—Operational/Growth Focus. In this phase, we will continue establishing an appropriate internal control environment. We will also continue making operational improvements by developing ways to use our size to create supply chain efficiencies and to identify and disseminate operational best practices in patient care, sales, and payor contracting. Assuming we are successful in achieving our targeted operational improvements in Phase 1 and mitigating the impact of the 75% Rule, we anticipate we will generate sufficient additional cash flow from operating activities to enable us to take advantage of selected development opportunities in the post-acute and surgery markets. Specifically, we plan to explore consolidation opportunities as they arise and build new IRFs and surgery centers in target markets. During this phase, we also plan to grow promising new post-acute services that are complementary to our existing services. |
| | • | | Phase 3—Growth Focus. The third phase will be more outward looking. We plan to continue to acquire or build IRFs in target markets, develop new ASCs, grow new post-acute care businesses, and evaluate potential consolidation opportunities. |
We are into the first phase of our strategic plan, and we are already making significant strides. For example, as described in Item 1,Business, “Recapitalization Transactions,” we have recently completed several recapitalization transactions resulting in reduced refinancing risk, enhanced operational flexibility, and increased liquidity. We have also entered into key settlements with the government and various private parties, reconstructed our accounting records, filed annual reports on Form 10-K for 2002 – 2005, and held our first Annual Meeting of Stockholders since 2002. Operationally, we have replaced the presidents of each of our primary operating divisions, reorganized these divisions by eliminating unnecessary management layers, increased productivity, divested under-performing facilities, and worked to improve operational systems. We are also continuing to implement mitigation strategies for the 75% Rule in our inpatient facilities, enhance the resyndication process for our ASCs, and implement new information systems to improve cash collections in our diagnostic division.
We believe our strategic plan capitalizes on our strengths, market direction, and legitimate growth opportunities. We are implementing a realistic operational plan and creating the appropriate infrastructure—organization, policies, protocols, systems, and reports—to support it. Finally, we are setting priorities based on resources and with our long-range goals of quality, profitability, and shareholder value at the forefront of our minds.
6
Consolidated Results of Operations
HealthSouth is the largest provider of ambulatory surgery and rehabilitative health care services in the United States, with 1,067 facilities and approximately 37,000 full- and part-time employees. We provide these services through a national network of inpatient and outpatient rehabilitation facilities, outpatient surgery centers, diagnostic centers, and other health care facilities.
During 2005, 2004, and 2003, we derived consolidatedNet operating revenues from the following payor sources:
| | | | | | | | | |
| | | For the year ended
December 31, | |
| | | 2005 | | | 2004 | | | 2003 | |
Medicare | | 47.5 | % | | 47.4 | % | | 44.6 | % |
Medicaid | | 2.3 | % | | 2.4 | % | | 2.6 | % |
Workers’ compensation | | 7.4 | % | | 8.1 | % | | 9.5 | % |
Managed care and other discount plans | | 33.1 | % | | 31.8 | % | | 31.8 | % |
Other third-party payors | | 5.4 | % | | 5.1 | % | | 6.5 | % |
Patients | | 1.8 | % | | 3.0 | % | | 2.6 | % |
Other income | | 2.5 | % | | 2.2 | % | | 2.4 | % |
| | | | | | | | | |
Total | | 100.0 | % | | 100.0 | % | | 100.0 | % |
| | | | | | | | | |
We provide our patient care services through four primary operating divisions and certain other services through a fifth division. These five divisions correspond to our five reporting segments discussed in this Item, “Segment Results of Operations,” and throughout this annual report.
When reading our consolidated statements of operations, it is important to recognize the following items included within our results of operations:
| | • | | Restructuring charges. In our continuing efforts to streamline operations, we closed numerous underperforming facilities or consolidated similar facilities within the same market in 2005, 2004, and 2003. As a result of these facility closures or consolidations, we recorded certain restructuring charges approximating $8.2 million, $4.0 million, and $2.6 million in 2005, 2004, and 2003, respectively, for one-time termination benefits and contract termination costs under the guidance in Financial Accounting Standards Board (“FASB”) Statement No. 146,Accounting for Costs Associated with Exit or Disposal Activities. See Note 10,Restructuring Charges, to our accompanying consolidated financial statements for additional information. |
| | • | | Change in ownership of certain inpatient rehabilitation facilities. As discussed in more detail in this Item, “Segment Results of Operations—Inpatient,” a judgment was entered against us in 2005 that upheld the landlord’s termination of the lease at two of our inpatient rehabilitation facilities and placed us as the manager, rather than the owner, of these two facilities. Accordingly, our 2005 results of operations include only the $5.4 million management fee we earned for operating these facilities on behalf of the landlord during the year. In 2004 and 2003, the results of operations of these two facilities were included in our consolidated statements of operations on a gross basis. Our consolidatedNet operating revenues and consolidated operating earnings were negatively impacted by approximately $106.3 million and $3.6 million, respectively, in 2005 as a result of the change in classification of these two facilities. |
7
| | • | | Recovery of amounts due from Meadowbrook. In 2001, we sold four inpatient rehabilitation facilities to Meadowbrook Healthcare, Inc. (“Meadowbrook”), an entity formed by one of our former chief financial officers, Michael D. Martin, for a $9.7 million note receivable. Meadowbrook paid no cash in connection with the sale of these facilities. The transaction was closed effective January 1, 2002, but remained in escrow until July 2002. We recognized a loss on this sale of approximately $37.4 million during 2001. In addition, during 2001, we advanced approximately $1.0 million in working capital loans to Meadowbrook. During 2002, we made a net advance of approximately $37.0 million to Meadowbrook. We reserved these amounts in 2001 and 2002, respectively. |
In March 2005, we obtained a security interest in the real properties previously sold to Meadowbrook, evidenced by a mortgage that was recorded in June 2005. In July 2005, we received a payoff letter from Meadowbrook’s attorneys informing us that a payment of $37.9 million would be made by Meadowbrook to us. This repayment was effected by the purchase of Meadowbrook by Rehabcare Group, Inc. in August 2005. We received a cash payment of $37.9 million in August 2005 and recorded this bad debt recovery at that time.
See Note 20,Related Party Transactions, and Note 24,Contingencies and Other Commitments, to our accompanying consolidated financial statements for additional information regarding Meadowbrook.
| | • | | Impairments. During 2005, we recorded an impairment charge of approximately $45.2 million to reduce the carrying value of long-lived assets to their estimated fair market value. During 2004, we recorded an impairment charge of approximately $36.3 million to reduce the carrying value of property and equipment and an impairment charge of $1.0 million to reduce the carrying value of amortizable intangibles of certain operating facilities to their estimated fair market value. During 2003, we recorded a charge of approximately $335.6 million for the impairment of goodwill and an additional charge of approximately $132.7 million for the impairment of certain long-lived assets. These charges are discussed in more detail in this Item, “Segment Results of Operations,” Note 5,Property and Equipment, and Note 6,Goodwill and Other Intangible Assets, to our accompanying consolidated financial statements. |
| | • | | Government, class action, and related settlements expense. In 2005, ourNet loss includes a $215.0 million charge asGovernment, class action, and related settlements expense under a proposed settlement with the lead plaintiffs in the Stockholder Securities Action and the Bondholder Securities Action. In 2003, ourNet loss includes the cost related to our settlement with the SEC and certain additional settlements, as well as legal fees related to this litigation and certain other actions brought against us. For additional information, see Note 22,SEC Settlement, Note 23,Securities Litigation Settlement, and Note 24,Contingencies and Other Commitments, to our accompanying consolidated financial statements. |
| | • | | Professional fees—accounting, tax, and legal. As noted throughout this annual report, significant changes have occurred at HealthSouth since the events leading up to March 19, 2003. The steps taken to stabilize our business and operations, provide vital management assistance, and coordinate our legal strategy came at significant financial cost. During 2005, 2004, and 2003, professional fees associated with the reconstruction of our financial records and restatement of our previously issued 2001 and 2000 consolidated financial statements approximated $169.8 million, $206.2 million, and $70.6 million, respectively. |
| | • | | Loss (gain) on early extinguishment of debt. In each year, we recorded a loss or gain on early extinguishment of debt due to our termination of certain capital leases or various credit agreements, or the repurchase of various bonds. For more information regarding these transactions, please see Note 8,Long-term Debt, to our accompanying consolidated financial statements. |
| | • | | Cumulative effect of an accounting change,net of tax. We recorded the cumulative effect of an accounting change in 2003. Effective January, 1, 2003, we adopted the provisions of FASB Statement No. 143,Accounting for Asset Retirement Obligations, and recorded a related charge of approximately $2.5 million. |
| | • | | Reclassifications. Certain previously reported financial results have been reclassified to conform to the current year presentation. Such reclassifications primarily relate to facilities we closed or sold in 2005, as well as those in closed or sold in the first quarter of 2006, that qualify under FASB Statement No. 144,Accounting for the Impairment or Disposal of Long-Lived Assets, to be reported as discontinued operations. |
8
From 2003 through 2005, our consolidated results of operations were as follows:
| | | | | | | | | | | | | | | | | | |
| | | For the year ended December 31, | | | Percentage Change | |
| | | 2005 | | | 2004 | | | 2003 | | | 2005 vs. 2004 | | | 2004 vs. 2003 | |
| | | (In Thousands) | | | | | | | |
Net operating revenues | | $ | 3,206,739 | | | $ | 3,511,316 | | | $ | 3,656,152 | | | (8.7 | )% | | (4.0 | )% |
| | | | | | | | | | | | | | | | | | |
Operating expenses: | | | | | | | | | | | | | | | | | | |
Salaries and benefits | | | 1,429,337 | | | | 1,619,140 | | | | 1,594,613 | | | (11.7 | )% | | 1.5 | % |
Professional and medical director fees | | | 76,365 | | | | 78,114 | | | | 87,666 | | | (2.2 | )% | | (10.9 | )% |
Supplies | | | 305,577 | | | | 331,328 | | | | 317,202 | | | (7.8 | )% | | 4.5 | % |
Other operating expenses | | | 679,587 | | | | 610,766 | | | | 749,374 | | | 11.3 | % | | (18.5 | )% |
Provision for doubtful accounts | | | 98,374 | | | | 113,736 | | | | 128,235 | | | (13.5 | )% | | (11.3 | )% |
Depreciation and amortization | | | 167,098 | | | | 176,947 | | | | 185,473 | | | (5.6 | )% | | (4.6 | )% |
Recovery of amounts due from Meadowbrook | | | (37,902 | ) | | | — | | | | — | | | N/A | | | N/A | |
Loss (gain) on disposal of assets | | | 14,775 | | | | 9,462 | | | | (14,967 | ) | | 56.2 | % | | (163.2 | )% |
Impairment of goodwill, intangible assets, and long-lived assets | | | 45,203 | | | | 37,290 | | | | 468,345 | | | 21.2 | % | | (92.0 | )% |
Government, class action, and related settlements expense | | | 215,000 | | | | — | | | | 170,949 | | | N/A | | | (100.0 | )% |
Professional fees - accounting, tax, and legal | | | 169,804 | | | | 206,244 | | | | 70,558 | | | (17.7 | )% | | 192.3 | % |
| | | | | | | | | | | | | | | | | | |
Total operating expenses | | | 3,163,218 | | | | 3,183,027 | | | | 3,757,448 | | | (0.6 | )% | | (15.3 | )% |
Loss (gain) on early extinguishment of debt | | | 33 | | | | (45 | ) | | | (2,259 | ) | | (173.3 | )% | | (98.0 | )% |
Interest expense and amortization of debt discounts and fees | | | 338,466 | | | | 302,606 | | | | 265,305 | | | 11.9 | % | | 14.1 | % |
Interest income | | | (17,141 | ) | | | (13,090 | ) | | | (7,273 | ) | | 30.9 | % | | 80.0 | % |
(Gain) loss on sale of investments | | | (229 | ) | | | (3,601 | ) | | | 15,811 | | | (93.6 | )% | | (122.8 | )% |
Equity in net income of nonconsolidated affiliates | | | (29,432 | ) | | | (9,949 | ) | | | (15,769 | ) | | 195.8 | % | | (36.9 | )% |
Minority interests in earnings of consolidated affiliates | | | 96,735 | | | | 94,400 | | | | 98,203 | | | 2.5 | % | | (3.9 | )% |
| | | | | | | | | | | | | | | | | | |
Loss from continuing operations before income tax expense (benefit) and cumulative effect of accounting change | | | (344,911 | ) | | | (42,032 | ) | | | (455,314 | ) | | 720.6 | % | | (90.8 | )% |
Provision for income tax expense (benefit) | | | 39,792 | | | | 11,914 | | | | (28,382 | ) | | 234.0 | % | | (142.0 | )% |
| | | | | | | | | | | | | | | | | | |
Loss from continuing operations before cumulative effect of accounting change | | | (384,703 | ) | | | (53,946 | ) | | | (426,932 | ) | | 613.1 | % | | (87.4 | )% |
Loss from discontinued operations, net of income tax expense | | | (61,291 | ) | | | (120,524 | ) | | | (5,169 | ) | | (49.1 | )% | | 2,231.7 | % |
| | | | | | | | | | | | | | | | | | |
Loss before cumulative effect of accounting change | | | (445,994 | ) | | | (174,470 | ) | | | (432,101 | ) | | 155.6 | % | | (59.6 | )% |
Cumulative effect of accounting change, net of income tax expense | | | — | | | | — | | | | (2,456 | ) | | N/A | | | (100.0 | )% |
| | | | | | | | | | | | | | | | | | |
Net loss | | $ | (445,994 | ) | | $ | (174,470 | ) | | $ | (434,557 | ) | | 155.6 | % | | (59.9 | )% |
| | | | | | | | | | | | | | | | | | |
9
Operating Expenses as a % of Net Operating Revenues
| | | | | | | | | |
| | | For the year ended December 31, | |
| | | 2005 | | | 2004 | | | 2003 | |
Salaries and benefits | | 44.6 | % | | 46.1 | % | | 43.6 | % |
Professional and medical director fees | | 2.4 | % | | 2.2 | % | | 2.4 | % |
Supplies | | 9.5 | % | | 9.4 | % | | 8.7 | % |
Other operating expenses | | 21.2 | % | | 17.4 | % | | 20.5 | % |
Provision for doubtful accounts | | 3.1 | % | | 3.2 | % | | 3.5 | % |
Depreciation and amortization | | 5.2 | % | | 5.0 | % | | 5.1 | % |
Recovery of amounts due from Meadowbrook | | (1.2 | )% | | 0.0 | % | | 0.0 | % |
Loss (gain) on disposal of assets | | 0.5 | % | | 0.3 | % | | (0.4 | )% |
Impairment of goodwill, intangible assets, and long-lived assets | | 1.4 | % | | 1.1 | % | | 12.8 | % |
Government and class action settlements expense | | 6.7 | % | | 0.0 | % | | 4.7 | % |
Professional fees - accounting, tax, and legal | | 5.3 | % | | 5.9 | % | | 1.9 | % |
| | | | | | | | | |
Total operating expenses as a % of net operating revenues | | 98.6 | % | | 90.7 | % | | 102.8 | % |
| | | | | | | | | |
Net Operating Revenues
Our consolidatedNet operating revenues primarily include revenues derived from patient care services provided by one of our four primary operating segments. It also includes other revenues generated from management and administrative fees, trainer income, operation of the conference center located on our corporate campus, and other non-patient care services.
Volume decreases in each of our operating segments and the change in ownership of certain facilities within our inpatient segment were the primary factors that contributed to the decliningNet operating revenues in 2005. Our inpatient segment experienced volume decreases due to the continued phase-in of the 75% Rule. Although resyndication activity increased in 2005, volumes in our surgery centers segment continued to decline based on the timing of these resyndications. Competition from physician-owned similar sites continued to negatively impact volumes in our outpatient and diagnostic segments. The change in ownership of these two inpatient facilities contributed approximately $106.3 million to the decline inNet operating revenues. See this Item, “Segment Results of Operations—Inpatient.”
The decrease in our consolidatedNet operating revenues from 2003 to 2004 was due primarily to volume decreases within our surgery centers, outpatient, and diagnostic segments. The volume decline within our surgery centers segment was due to the limited resyndication activity which occurred in 2004. Volume decreases within both our outpatient and diagnostic segments were due to competition from physician-owned similar sites.
Salaries and Benefits
Salaries and benefits represents the most significant cost to us and includes all amounts paid to full- and part-time employees, including all related costs of benefits provided to employees. It also includes amounts paid for contract labor.
In 2005, our segments demonstrated their ability to manage employee-related costs during periods of declining volumes, withSalaries and benefits decreasing from 46.1% ofNet operating revenues in 2004 to 44.6% ofNet operating revenues in 2005. From 2004 to 2005,Salaries and benefits decreased by 11.7%, primarily in our inpatient, surgery centers, and outpatient segments. Approximately $66.1 million of the decrease is due to the change in classification of two inpatient facilities, as discussed later in this Item. In addition, our inpatient and surgery centers segments reduced their full-time equivalents as their volumes declined throughout the year, and our outpatient segment reduced its full-time equivalents through the closure of underperforming facilities that did not qualify for discontinued operations treatment.
10
Salaries and benefits grew as a percent ofNet operating revenues during 2004. This was due to rising costs associated with group medical and workers’ compensation across all of our segments, increased use of contract labor within our inpatient segment, and an inability to further adjust minimum staffing levels within our diagnostic segment. Due to staffing shortages for therapists and nurses, our inpatient segment was forced to increase its use of higher-priced contract labor to properly care for its patients during 2004. As discussed further in this Item, “Segment Results of Operations—Diagnostic,” our diagnostic segment reached minimum staffing levels and could not further adjust its staffing levels with the declining volumes experienced in 2004. All of the above contributed to the increase inSalaries and benefits as a percent ofNet operating revenues during the year.
Professional and Medical Director Fees
Professional and medical director fees include fees paid under contracts with radiologists, medical directors, and other clinical professionals at our centers for services provided. It also includes professional consulting fees associated with operational initiatives, such as strategic planning and revenue enhancement projects.
The change inProfessional and medical director fees from 2004 to 2005 was not material in the aggregate. However, it is important to note that these fees decreased in our diagnostic segment due to declining volumes, but increased in our corporate and other segment due to fees paid to consulting firms for corporate strategy and other projects. From 2003 to 2004, these fees decreased primarily in our diagnostic division due to declining volumes. For more information regarding these fees and their relation to volumes in our diagnostic segment, see this Item, “Segment Results of Operations—Diagnostic.”
Supplies
Supplies include costs associated with supplies used while providing patient care at our facilities. Examples include pharmaceuticals, implants, bandages, food, and other similar items. In each year, our inpatient and surgery centers segments comprise over 94% of ourSuppliesexpense.
From 2004 to 2005,Suppliesexpense decreased by 7.8% due primarily to the decline in volumes in our inpatient and surgery centers segments combined with the change in classification of two of our inpatient facilities, as discussed below.Supplies expense as a percent ofNet operating revenuesremained relatively flat year-over-year.
The increase inSuppliesexpense from 2003 to 2004 was due to an increase inSupplies expense in our inpatient segment due to increasing costs associated with supplies and the higher acuity of our patients in 2004. Higher acuity results in increased costs associated with supplies, especially in drug costs.
Other Operating Expenses
Other operating expenses include costs associated with managing and maintaining our operating facilities as well as the general and administrative costs related to the operation of our corporate office. These expenses include such items as repairs and maintenance, utilities, contract services, rent, professional fees, and insurance.
The increase inOther operating expenses from 2004 to 2005 primarily related to increased professional fees associated with projects related to our compliance with Sarbanes-Oxley, strategic consulting, and other similar services from accounting and consulting firms offset by an approximate $17.2 million decrease inOther operating expenses due to the change in classification of certain facilities discussed below within our inpatient segment.
The decrease inOther operating expenses from 2003 to 2004 primarily related to decreased operating expenses within our inpatient segment. Continuing a trend seen in 2003, our inpatient segment’s operating expenses decreased in 2004 as the segment continued to digest the change to the Prospective Payment System (“PPS”) and faced the challenge of mitigating the 75% Rule impact on itsNet operating revenues.
11
Provision for Doubtful Accounts
In 2005, ourProvision for doubtful accounts decreased by $15.4 million due to the decrease inNet operating revenues year-over-year in each of our operating segments and the continued implementation of new information systems to improve cash collections in our diagnostic segment.
OurProvision for doubtful accounts decreased from 3.5% ofNet operating revenues in 2003 to 3.2% ofNet operating revenues in 2004 as we made progress collecting aged receivables and implementing improved cash collections procedures within our diagnostic and surgery centers segments.
For more information, please see this Item, “Segment Results of Operations.”
Depreciation and Amortization
The decrease inDepreciation and amortization expense in each year is due to impairment charges and an increase in fully depreciated assets within our operating segments.
Loss (gain) on Disposal of Assets
The net loss on disposal of assets in 2005 resulted from numerous individually immaterial asset sales and disposals in our inpatient and outpatient segments. The net loss on disposal of assets in 2004 primarily resulted from facility closures in our outpatient and diagnostic segments. Continuing volume declines and competition in these segments forced us to close additional underperforming facilities in 2004. The net gain on disposal of assets in 2003 primarily resulted from the sale of our inpatient facility in Reno, Nevada.
Interest Expense and Amortization of Debt Discounts and Fees
Interest expense and amortization of debt discounts and fees increased by $35.9 million, or 11.9%, from 2004 to 2005 primarily due to the amortization of consent fees and bond issue costs associated with the 2004 consent solicitation and 2005 refinancings. During 2004, consent fees paid for all of our debt issues approximated $80.2 million, and we paid approximately $11.1 million in debt issuance costs. We amortize these fees to interest expense over the remaining term of the debt. In 2004, we amortized these costs for approximately six months, as compared to a full year of amortization in 2005. We also paid approximately $17.9 million in debt issuance costs in 2005. These costs are also amortized to interest expense over the life of the related debt. As a result of the above amortization charges, interest expense increased by approximately $17.2 million in 2005. An additional $11.2 million of interest expense was recorded in 2005 related to payments under our Medicare Program Settlement (see Note 21,Medicare Program Settlement, to our accompanying consolidated financial statements). The remaining $7.5 million of the increase in interest expense is primarily the result of higher average borrowing rates in 2005. In 2005, our average borrowing rate was 9.4% compared to an average rate of 8.5% in 2004.
The increase in interest expense from 2003 to 2004 was the result of higher average borrowing rates in 2004. In 2003, our average borrowing rate was 7.5% compared to an average rate of 8.5% in 2004. The average borrowing rate increased due to the repayment of our 3.25% convertible debentures with proceeds from a 10.375% senior subordinated term loan.
For more information regarding the above changes in debt, see Note 8,Long-term Debt, to our accompanying consolidated financial statements.
12
(Gain) loss on Sale of Investments
In each year presented in our consolidated statements of operations, the net gain or loss on sale of investments was primarily comprised of numerous individually insignificant transactions related to less than 100% owned entities, including investments in nonconsolidated affiliates. In 2004, the net gain on sale of investments was solely comprised of these types of transactions. In 2005 and 2003, the net gain or loss on sale of investments also includes the realized gains and losses recorded on the sale of marketable securities. For additional information regarding our marketable securities, please see Note 4,Cash and Marketable Securities, to our accompanying consolidated financial statements.
Equity in Net Income of Nonconsolidated Affiliates
The increase inEquity in Net Income of Nonconsolidated Affiliatesfrom 2004 to 2005 is primarily due to the reclassification of five surgery centers that became equity method investments rather than consolidated entities in 2005 as a result of changes in control of these entities. The decrease inEquity in Net Income of Nonconsolidated Affiliates from 2003 to 2004 is primarily due to higher year-over-year operating expenses at three of our nonconsolidated surgery centers.
Minority Interests in Earnings of Consolidated Affiliates
Minority interests in earnings of consolidated affiliates represent the share of net income or loss allocated to members or partners in our consolidated entities. For 2003 through 2005, the number and average external ownership interest in these consolidated entities were as follows:
| | | | | | | | | |
| | | As of and for the year ended
December 31, | |
| | | 2005 | | | 2004 | | | 2003 | |
Active consolidated affiliates | | 272 | | | 276 | | | 322 | |
Average external ownership interest | | 34.0 | % | | 32.1 | % | | 32.5 | % |
Of our active consolidated affiliates at December 31, 2005, approximately 79% of them are in our inpatient and surgery centers segments. Fluctuations inMinority interests in earnings of consolidated affiliates generally follow the same trends as our inpatient and surgery centers segments. However, resyndication activities in 2005 and the absorption of losses for certain partnerships in 2005 combined to increase these expenses from 2004 to 2005.
Loss from Continuing Operations Before Income Tax Expense (Benefit) and Cumulative Effect of Accounting Change
OurLoss from continuing operations before income tax expense (benefit) and cumulative effect of accounting change (“loss from continuing operations”) in 2005 includes $215.0 million associated with the settlement of our securities litigation and a $37.9 million recovery of bad debt associated with Meadowbrook. If these two items are excluded, our loss from continuing operations is $167.8 million, which represents a $125.8 million increase over our 2004 net loss from continuing operations. This increase is primarily due to a decrease inNet operating revenues as a result of declining volumes, higherOther operating expenses associated with professional service fees, and increased interest expense, as discussed above.
The decrease in our loss from continuing operations from 2003 to 2004 is primarily due to the 15.3% decrease in operating expenses year over year. Operating expenses decreased as a result of the $431.1 million decrease in impairment charges and a $170.9 million decrease inGovernment, class action, and related settlements expense offset by a $135.7 million increase inProfessional fees—accounting, tax, and legal. Increased interest expense during 2004 (as a result of higher average borrowing rates), as discussed above, also offset the decrease in operating expenses.
13
Provision for Income Tax Expense (Benefit)
We realized a $39.8 million income tax expense from continuing operations in 2005 as compared to an $11.9 million income tax expense from continuing operations in 2004. Deferred tax expense increased by approximately $23 million to reflect the change in the noncurrent deferred taxes associated with certain indefinite lived assets. Additionally, HealthSouth Corporation and its subsidiaries file separate income tax returns in a number of states, some of which result in current state tax liabilities. A current federal tax expense was also charged in 2005 and 2004 associated with ownership in corporate joint ventures.
We realized an $11.9 million income tax expense from continuing operations in 2004 compared to a $28.4 million income tax benefit from continuing operations in 2003. Deferred tax expense increased by approximately $20 million to reflect the change in the noncurrent deferred taxes associated with certain indefinite lived assets. Additionally, HealthSouth Corporation and its subsidiaries file separate income tax returns in a number of states, some of which result in current state income tax liabilities. A current federal tax expense was also charged in 2004 associated with ownership in corporate joint ventures.
Consolidated Adjusted EBITDA
Management continues to believe that an understanding of Consolidated Adjusted EBITDA is an important measure of operating performance, leverage capacity, our ability to service our debt, and our ability to make capital expenditures for our stakeholders.
We use Consolidated Adjusted EBITDA to assess our operating performance. We believe it is meaningful because it provides investors with a measure used by our internal decision makers for evaluating our business. Our internal decision makers believe Consolidated Adjusted EBITDA is a meaningful measure, because it represents a transparent view of our recurring operating performance and allows management to readily view operating trends, perform analytical comparisons, and perform benchmarking between segments. Additionally, our management believes the inclusion of professional fees associated with litigation, financial restructuring, government investigations, forensic accounting, creditor advisors, accounting reconstruction, audit and tax work associated with the reconstruction process, the implementation of Sarbanes-Oxley Section 404, and non-ordinary course charges incurred after March 19, 2003 and related to our overall corporate restructuring distort within EBITDA their ability to efficiently assess and view the core operating trends on a consolidated basis and within segments. Additionally, we use Consolidated Adjusted EBITDA as a significant criterion in our determination of performance-based cash bonuses and stock awards. We reconcile consolidated Adjusted EBITDA to loss from continuing operations.
We also use Consolidated Adjusted EBITDA on a consolidated basis as a liquidity measure. We believe this financial measure on a consolidated basis is important in analyzing our liquidity because it is also a component of certain material covenants contained within the documents governing our long-term indebtedness, as discussed in more detail in Note 8,Long-term Debt, to our accompanying consolidated financial statements. These covenants are material terms of these agreements because they govern several of our credit agreements, which in turn represent a substantial portion of our capitalization. Non-compliance with these financial covenants under our credit facilities—our interest coverage ratio and our leverage ratio—could result in the lenders requiring us to immediately repay all amounts borrowed. In addition, if we cannot satisfy these financial covenants, we would be prohibited under the documents governing our long-term indebtedness from engaging in certain activities, such as incurring additional indebtedness, making certain payments, and acquiring and disposing of assets. Consequently, Consolidated Adjusted EBITDA is critical to our assessment of our liquidity.
In general terms, the definition of Consolidated Adjusted EBITDA, per the documents governing our long-term indebtedness, allow us to add back to Consolidated Adjusted EBITDA charges classified as “Restructuring Charges.” Costs which we classify as “Restructuring Charges” include professional fees associated with certain litigation, financial restructuring, government investigations, forensic accounting, creditor advisors, accounting reconstruction, audit and tax work associated with the reconstruction process, compliance with Sarbanes-Oxley Section 404, and non-ordinary course charges incurred after March 19, 2003 related to our overall corporate restructuring.
14
However, Consolidated Adjusted EBITDA is not a measure of financial performance under generally accepted accounting principles in the United States of America, and the items excluded from Consolidated Adjusted EBITDA are significant components in understanding and assessing financial performance. Therefore, Consolidated Adjusted EBITDA should not be considered a substitute for net loss from continuing operations or cash flows from operating, investing, or financing activities. Because Consolidated Adjusted EBITDA is not a measurement determined in accordance with generally accepted accounting principles in the United States of America and is thus susceptible to varying calculations, Consolidated Adjusted EBITDA, as presented, may not be comparable to other similarly titled measures of other companies. Revenue and expenses are measured in accordance with the policies and procedures described in Note 1,Summary of Significant Accounting Policies, to our accompanying consolidated financial statements.
As noted earlier in this Item, certain previously reported financial results have been reclassified to conform to the current year presentation. Such reclassifications primarily relate to facilities we closed or sold in 2005 and the first quarter of 2006 that qualify under FASB Statement No. 144 to be reported as discontinued operations. These reclassifications may also impact previously reported Consolidated Adjusted EBITDA amounts. The facilities that were classified as discontinued operations in 2005 and the first quarter of 2006 had a positive impact of approximately $56 million and $21 million, respectively, on 2004 and 2003 Consolidated Adjusted EBITDA reported in our 2004 annual report.
From 2003 through 2005, our Consolidated Adjusted EBITDA was as follows:
Reconciliation of Loss from Continuing Operations to Consolidated Adjusted EBITDA
| | | | | | | | | | | | |
| | | For the year ended December 31, | |
| | | 2005 | | | 2004 | | | 2003 | |
| | | (In Thousands) | |
Loss from continuing operations | | $ | (384,703 | ) | | $ | (53,946 | ) | | $ | (429,388 | ) |
Provision for income tax expense (benefit) | | | 39,792 | | | | 11,914 | | | | (28,382 | ) |
Cumulative effect of accounting change, net of income tax expense | | | — | | | | — | | | | 2,456 | |
Depreciation and amortization | | | 167,098 | | | | 176,947 | | | | 185,473 | |
Loss (gain) on disposal of assets | | | 14,775 | | | | 9,462 | | | | (14,967 | ) |
Impairment charges | | | 45,203 | | | | 37,290 | | | | 468,345 | |
Loss (gain) on early extinguishment of debt | | | 33 | | | | (45 | ) | | | (2,259 | ) |
Interest expense and amortization of debt discounts and fees | | | 338,466 | | | | 302,606 | | | | 265,305 | |
Interest income | | | (17,141 | ) | | | (13,090 | ) | | | (7,273 | ) |
Gain on sale of marketable securities | | | (8 | ) | | | — | | | | (698 | ) |
| | | | | | | | | | | | |
Consolidated Adjusted EBITDA beforegovernment and class action settlementsexpense, professional fees - reconstruction and restatement, and other restructuringcharges | | | 203,515 | | | | 471,138 | | | | 438,612 | |
Government and class action settlements expense | | | 215,000 | | | | — | | | | 170,949 | |
Professional fees - accounting, tax, and legal | | | 169,804 | | | | 206,244 | | | | 70,558 | |
Sarbanes-Oxley related costs | | | 32,204 | | | | 17,534 | | | | — | |
Restructuring activities under FASB Statement No. 146 | | | 8,190 | | | | 3,973 | | | | 2,571 | |
| | | | | | | | | | | | |
Consolidated Adjusted EBITDA | | $ | 628,713 | | | $ | 698,889 | | | $ | 682,690 | |
| | | | | | | | | | | | |
15
Reconciliation of Consolidated Adjusted EBITDA to Net Cash Provided by Operating Activities
| | | | | | | | | | | | |
| | | For the year ended December 31, | |
| | | 2005 | | | 2004 | | | 2003 | |
| | | (In Thousands) | |
Consolidated Adjusted EBITDA | | $ | 628,713 | | | $ | 698,889 | | | $ | 682,690 | |
Professional fees - accounting, tax, and legal | | | (169,804 | ) | | | (206,244 | ) | | | (70,558 | ) |
Sarbanes-Oxley related costs | | | (32,204 | ) | | | (17,534 | ) | | | — | |
Interest expense and amortization of debt discounts and fees | | | (338,466 | ) | | | (302,606 | ) | | | (265,305 | ) |
Interest income | | | 17,141 | | | | 13,090 | | | | 7,273 | |
Provision for doubtful accounts | | | 98,374 | | | | 113,736 | | | | 128,235 | |
Amortization of debt issue costs, debt discounts, and fees | | | 39,023 | | | | 21,838 | | | | 7,831 | |
Amortization of restricted stock | | | 1,998 | | | | 614 | | | | (2,932 | ) |
Accretion of debt securities | | | (410 | ) | | | — | | | | — | |
(Gain) loss on sale of investments, excluding marketable securities | | | (221 | ) | | | (3,601 | ) | | | 16,509 | |
Equity in net income of nonconsolidated affiliates | | | (29,432 | ) | | | (9,949 | ) | | | (15,769 | ) |
Distributions from nonconsolidated affiliates | | | 22,457 | | | | 17,029 | | | | 8,561 | |
Minority interest in earnings of consolidated affiliates | | | 96,735 | | | | 94,400 | | | | 98,203 | |
Stock-based compensation | | | — | | | | (460 | ) | | | — | |
Current portion of income tax provision | | | (22,295 | ) | | | (17,253 | ) | | | 2,826 | |
Restructuring charges under FASB Statement No. 146 | | | (8,190 | ) | | | (3,973 | ) | | | (2,571 | ) |
Other operating cash used in discontinued operations | | | (47,538 | ) | | | (33,534 | ) | | | (35,650 | ) |
Cash payments related to government settlements | | | (165,434 | ) | | | (6,997 | ) | | | — | |
Change in assets and liabilities, net of acquisitions | | | (88,880 | ) | | | 34,151 | | | | 14,849 | |
| | | | | | | | | | | | |
Net Cash (Used In) Provided by Operating Activities | | $ | 1,567 | | | $ | 391,596 | | | $ | 574,192 | |
| | | | | | | | | | | | |
Our Consolidated Adjusted EBITDA approximated 19.6%, 19.9%, and 18.7% ofNet operating revenues in 2005, 2004, and 2003, respectively. Consolidated Adjusted EBITDA decreased from 2004 to 2005 due to the declining volumes experienced by each of our operating segments and increased operating expenses associated with professional service fees, as discussed above. Consolidated Adjusted EBITDA increased by 2.4% from 2003 to 2004. This increase was due primarily to our ability to control operating expenses as our segments experienced declining volumes. In 2004,Net operating revenues decreased by 4.0%, while operating expenses decreased by 15.3%.
Impact of Inflation
The health care industry is labor intensive. Wages and other expenses increase during periods of inflation and when labor shortages occur in the marketplace. In addition, suppliers pass along rising costs to us in the form of higher prices. Although we cannot predict our ability to cover future cost increases, we believe that through adherence to cost containment policies and labor and supply management, the effects of inflation on future operating results should be manageable.
However, we have little or no ability to pass on these increased costs associated with providing services to Medicare and Medicaid patients due to federal and state laws that establish fixed reimbursement rates. In addition, as a result of increasing regulatory and competitive pressures and a continuing industry-wide shift of patients to managed care plans, our ability to maintain margins through price increases to non-Medicare patients is limited.
16
Relationships and Transactions with Related Parties
HealthSouth and its prior management and board of directors engaged in numerous relationships and transactions with related parties. These transactions involved certain venture capital firms, investments, real property, and indebtedness of management. For more information on our historic relationships and transactions with related parties, please see Note 7,Investment in and Advances to Nonconsolidated Affiliates, Note 11,Shareholders’ Deficit, and Note 20,Related Party Transactions, to our accompanying consolidated financial statements.
As part of our restructuring process, we have eliminated our interests in and relationships with related parties. These types of transactions are not material to our ongoing operations, and therefore, will not be presented as a separate discussion within this Item. When these relationships or transactions were significant to our results of operations during the years ended December 31, 2005, 2004, or 2003, information regarding the relationship or transaction(s) have been included within this Item.
Segment Results of Operations
Our internal financial reporting and management structure is focused on the major types of services provided by HealthSouth. We currently provide various patient care services through four operating divisions and certain other services through a fifth division, which correspond to our five reporting business segments: (1) inpatient, (2) surgery centers, (3) outpatient, (4) diagnostic, and (5) corporate and other. For additional information regarding our business segments, including a detailed description of the services we provide and financial data for each segment, please see Item 1,Business, and Note 25,Segment Reporting,to our accompanying consolidated financial statements. Future changes to this organizational structure may result in changes to the reportable segments disclosed.
Inpatient
We are the nation’s largest provider of inpatient rehabilitation services. Our inpatient rehabilitation facilities provide comprehensive services to patients who require intensive institutional rehabilitation care. Patient care is provided by nursing and therapy staff as directed by a physician order. Internal case managers monitor each patient’s progress and provide documentation of patient status, achievement of goals, functional outcomes and efficiency.
Our inpatient segment operates IRFs, LTCHs, home health, and skilled nursing units and provides treatment on both an inpatient and outpatient basis. As of December 31, 2005, our inpatient segment operated 93 freestanding IRFs, 10 LTCHs, and 101 outpatient facilities near our IRFs or LTCHs. In addition to HealthSouth facilities, our inpatient segment manages 14 inpatient rehabilitation units, 11 outpatient facilities, and 2 gamma knife radiosurgery centers through management contracts. Our inpatient facilities are located in 28 states, with a concentration of facilities in Texas, Pennsylvania, Florida, Tennessee, and Alabama. We also have facilities in Puerto Rico and Australia.
17
For the years ended December 31, 2005, 2004, and 2003, our inpatient segment comprised approximately 56.5%, 57.5%, and 54.6%, respectively, of consolidatedNet operating revenues. For 2003 through 2005, this segment’s operating results were as follows:
| | | | | | | | | |
| | | For the year ended December 31, |
| | | 2005 | | 2004 | | 2003 |
| | | (In Thousands) |
Inpatient | | | | | | | | | |
Net operating revenues | | $ | 1,810,401 | | $ | 2,020,409 | | $ | 1,997,963 |
Operating expenses* | | | 1,417,394 | | | 1,583,496 | | | 1,561,460 |
| | | | | | | | | |
Operating earnings | | $ | 393,007 | | $ | 436,913 | | $ | 436,503 |
| | | | | | | | | |
Discharges | | | 107 | | | 121 | | | 119 |
Outpatient visits | | | 1,650 | | | 2,167 | | | 2,317 |
| | | (Not In Thousands) |
Full time equivalents | | | 16,795 | | | 19,859 | | | 19,430 |
Average length of stay | | | 15.9 days | | | 16.0 days | | | 16.3 days |
| * | Includes divisional overhead, but excludes corporate overhead allocation. See Note 25,Segment Reporting, to our accompanying consolidated financial statements. Includes the effect of minority interests in earnings of consolidated affiliates and equity in the net income of nonconsolidated affiliates. |
During 2005, 2004, and 2003, inpatient’sNet operating revenues were derived from the following payor sources:
| | | | | | | | | |
| | | For the year ended December 31, | |
| | | 2005 | | | 2004 | | | 2003 | |
Medicare | | 71.2 | % | | 70.6 | % | | 71.1 | % |
Medicaid | | 2.3 | % | | 2.6 | % | | 2.3 | % |
Workers’ compensation | | 2.8 | % | | 3.3 | % | | 3.8 | % |
Managed care and other discount plans | | 15.9 | % | | 15.0 | % | | 14.4 | % |
Other third-party payors | | 5.2 | % | | 6.6 | % | | 6.3 | % |
Patients | | 0.5 | % | | 0.1 | % | | 0.1 | % |
Other income | | 2.1 | % | | 1.8 | % | | 2.0 | % |
| | | | | | | | | |
Total | | 100.0 | % | | 100.0 | % | | 100.0 | % |
| | | | | | | | | |
Our inpatient segment’s payor mix is weighted heavily towards Medicare. Our IRFs receive Medicare reimbursements under PPS. Under IRF-PPS, our IRFs receive fixed payment amounts per discharge based on certain rehabilitation impairment categories established by the Department of Health and Human Services. With PPS, our facilities retain the difference, if any, between the fixed payment from Medicare and their operating costs. Thus, our facilities are rewarded for being high quality, low cost providers. For additional information regarding Medicare reimbursement, please see the “Sources of Revenue” section of Item 1,Business, of this annual report.
Due to the significance of Medicare payments to our inpatient facilities, the number of patient discharges is a key metric utilized by the segment to monitor and evaluate its performance. The number of outpatient visits is also tracked in order to measure the volume of outpatient activity within the segment. The segment’s primary operating expenses includeSalaries and benefits andSupplies.Salaries and benefits represents the most significant cost to the segment and includes all amounts paid to full- and part-time employees, including all related costs of benefits provided to employees. It also includes amounts paid for contract labor. Supply costs include all expenses associated with supplies used while providing patient care. These costs include pharmaceuticals, needles, bandages, food, and other similar items.
18
Significant Changes in Regulations Governing IRF Reimbursement
As discussed in Item 1,Business, “Sources of Revenues,” two recent changes in regulations governing IRF reimbursement have combined to create a very challenging operating environment for our inpatient division. The first change occurred on May 7, 2004, when CMS issued a final rule stipulating revised criteria for qualifying as an IRF under Medicare. This rule, known as the “75% Rule,” has created significant volume volatility in our inpatient division. The second change, which became effective on October 1, 2005, relates to reduced unit pricing applicable to IRFs.
The 75% Rule, as revised, generally provides that to be considered an IRF, and to receive reimbursement for services under the IRF-PPS methodology, 75% of a facility’s total patient population must require treatment for at least one of 13 designated medical conditions. As a practical matter, this means that to maintain our current level of revenue from our IRFs we will need to reduce the number of nonqualifying patients treated at our IRFs and replace them with qualifying patients, establish other sources of revenues at our IRFs, or both. The Deficit Reduction Act of 2005, signed by President Bush on February 8, 2006 as Public Law 109-171, extended the phase-in schedule for the 75% Rule by one year and delayed implementation of the 65% compliance threshold until July 1, 2007.
On August 15, 2005, CMS published a final rule, as amended by the subsequent correction notice published on September 30, 2005, that updates the IRF-PPS for the federal fiscal year 2006 (which covers discharges occurring on or after October 1, 2005 and on or before September 30, 2006). Although the final rule includes an overall market basket update of 3.6%, it makes several other adjustments that we estimate will result in a net reduction in reimbursement to us. For example, the final rule (1) reduces the standard payment rates by 1.9%, (2) implements changes to Case-Mix Groups, comorbidity tiers, and relative weights, (3) updates the formula for the low income patient payment adjustment, (4) adopts the new geographic labor market area definitions based on the definitions created by the Office of Management and Budget known as Core-Based Statistical Areas, (5) implements new and revised payment adjustments on a budget-neutral basis, (6) implements a new indirect medical education teaching adjustment, (7) increases the rural add-on to 21.3%, and (8) incorporates several other modifications to Medicare reimbursement for IRFs. Although CMS predicted that overall payments to IRFs nationwide would increase by 3.4%, we estimate that the revised IRF-PPS will reduce Medicare reimbursement to our IRFs by 3.5% to 4%, primarily owing to the changes to Case-Mix Groups, comorbidity tiers, and relative weights. We estimate this net impact on reimbursement will reduce our inpatient division’sNet operating revenues by approximately $10 million per quarter for the first three quarters of 2006 as compared to 2005. These estimates do not take into account potential changes in our case-mix resulting from our compliance with the 75% Rule, which could have the effect of increasing the acuity of our case-mix and therefore reducing the overall net impact of the IRF-PPS changes.
The volume volatility created by the 75% Rule had a significantly negative impact on our inpatient division’sNet operating revenues in 2005. Thus far, we have been able to partially mitigate the impact of the 75% Rule on our inpatient division’s operating earnings by implementing the mitigation strategies discussed in Item 1,Business, “Our Business—Operating Divisions.” However, the combination of volume volatility created by the 75% Rule and lower unit pricing resulting from IRF-PPS changes reduced our operating earnings in 2005 and will have a continuing negative impact on our operating earnings in 2006. In addition, because we receive a significant percentage of our revenues from our inpatient division, and because our inpatient division receives a significant percentage of its revenues from Medicare, our inability to achieve continued compliance with or continue to mitigate the negative effects of the 75% Rule could have a material adverse effect on our business, financial condition, results of operations, and cash flows.
19
On February 6, 2006, President Bush proposed a federal budget for fiscal year 2007. Among other things, the budget would eliminate Medicare payment increases for IRFs for the 2007 fiscal year. In 2008 and 2009, the budget proposes that IRFs and certain other providers receive a Medicare payment update of market basket minus 0.4%. These provisions are expected to reduce Medicare IRF spending by $1.59 billion in fiscal years 2007 through 2011. The President’s budget also calls for reductions in Medicare payments to IRFs for hip and knee replacements to decrease variances in payments based on site of care. Specifically, for services provided to hip and knee replacement patients, the proposal would pay IRFs the average amount paid to skilled nursing facilities (“SNFs”), plus one third of the difference between the average IRF payment amount and the average SNF payment rate. The President’s budget would reduce Medicare spending by more than $2.4 billion by adjusting payment for hip and knee replacements in post-acute care settings. If the budget proposal is enacted by Congress, it could have a material adverse effect on our business, financial condition, results of operations, and cash flows. Moreover, the proposed budget would phase out all Medicare bad debt reimbursement to providers between 2007 and 2011. To enhance the long-term financing of the Medicare program, the budget also proposes automatic reductions in provider updates if general revenues are projected to exceed 45% of total Medicare financing. While legislation is necessary to enact these changes, Congress could consider this and other legislation in the future that would reduce Medicare reimbursement for IRF services. The potential effect of the President’s budget on our inpatient division is not known at this time.
Change in Ownership of Certain Facilities
Since 2003, we have been involved in a legal dispute regarding the lease of Braintree Rehabilitation Hospital in Braintree, Massachusetts and New England Rehabilitation Hospital in Woburn, Massachusetts. In 2005, a judgment was entered against us that upheld the landlord’s termination of our lease of these two facilities and placed us as the manager, rather than the owner, of these two facilities. We have appealed this decision, but a hearing on our appeal has not yet been scheduled.
During the appeals process, we have been cooperating with the landlord and have retroactively paid the net cash proceeds of the facilities to the landlord since the date the lease was deemed to have been terminated. Our 2005 results of operations include only the $5.4 million management fee we earned for operating the facilities on behalf of the landlord during the year. In 2004 and 2003, the results of operations of these two facilities were included in our consolidated statements of operations on a gross basis. As a result, ourNet operating revenues and operating earnings were negatively impacted by approximately $106.3 million and $3.6 million, respectively, in 2005.
For additional information, see Note 24,Contingencies and Other Commitments, to our accompanying consolidated financial statements.
Net Operating Revenues
Our inpatient segment’sNet operating revenues declined by 10.4% from 2004 to 2005. The change in classification of our Braintree and Woburn facilities contributed to approximately $106.3 million, or 50.6%, of the decline. The remainder of the decrease inNet operating revenues is due to declining volumes. Excluding the impact of the change in classification, discharges were approximately 7.6% lower than 2004 due to the continued phase-in of the 75% Rule and the majority of our facilities moving to the 50% phase. Our inpatient segment also experienced a 10.7% decrease in outpatient volumes due to continued competition from physicians offering physical therapy within their own offices, as well as the decrease in our inpatient volumes. Due to this continued competition from physicians and resulting decrease in outpatient visits, we evaluated our outpatient satellite sites and closed 22 sites during 2005. Declining volumes were offset slightly by favorable pricing from Medicare during the first nine months of 2005 due to the Medicare market basket adjustment discussed below. However, the PPS Final Rule, as discussed above, negatively impacted our fourth quarter earnings by approximately $10.0 million. Human capital constraints in key clinical positions (therapists and nurses) at some of our hospitals also negatively impacted volumes as facilities managed volumes within these constraints.
20
Net operating revenues of our inpatient segment increased by 1.1% from 2003 to 2004. This increase is primarily due to the higher net revenue per discharge, or improvement in our reimbursement per case, as well as a 2.3% increase in discharges. The increase inNet operating revenues per discharge is due primarily to the 1.4% increase in the segment’s Case Mix Index (“CMI”). An increase in CMI indicates that our patients have a higher acuity. For Medicare, which was over 70% of inpatient’s 2004 net operating revenues, the result of an increase in CMI is an increased payment to the segment. In addition, a market basket adjustment of 3.1% was received from Medicare in October 2004. A market basket adjustment is made to Medicare rates by the Department of Health and Human Services to account for inflationary impacts on provider costs. The increased reimbursements were offset by a 6.5% decrease in outpatient visits due primarily to increased competition from physicians offering physical therapy within their own offices. Due to this increased competition and resulting decrease in outpatient visits, we evaluated our outpatient satellite sites and closed 23 sites during 2004.
Operating Expenses
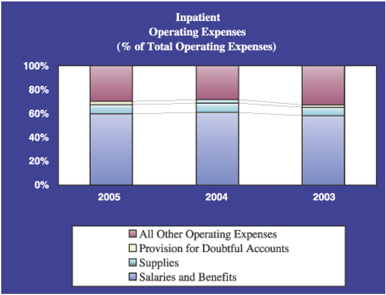
Salaries and Benefits
Salaries and benefits comprised over 58% of inpatient’s operating expenses in each year.
Salaries and benefits decreased by $116.8 million, or 12.1%, from 2004 to 2005 primarily as a result of the change in facility classification discussed above and fewer full-time equivalents due to the decline in volumes. The change in classification of our Braintree and Woburn facilities contributed approximately $66.1 million, or 56.6%, to the decrease. Full-time equivalents, excluding the employees of the Braintree and Woburn facilities, declined by 9.6% from 2004 to 2005 which more than offset the 4.8% increase in average salaries and benefits per full-time equivalent due to merit and market rate adjustments. In addition, costs associated with contract labor decreased by approximately 50% year over year. However, excluding the impact of the change in facility classification discussed above,Salaries and benefits as a percent ofNet operating revenues remained consistent from 2004 to 2005 approximating 47.8% and 47.7%, respectively. The segment’s ability to maintain this ratio while experiencing a 5.0% decline inNet operating revenues (excluding the impact of the change in facility classification) is evidence of our facilities’ ability to adjust staffing levels to accommodate changing volumes.
21
From 2003 to 2004,Salaries and benefits increased by $57.9 million, or 6.4%. Approximately 65% of the increase is due to costs associated with annual merit increases and increases in group medical expenses and workers’ compensation costs. The remainder of the increase inSalaries and benefits is due to an increase of 429 full-time equivalents due to the increased acuity of our patients, as discussed above. In addition, staffing shortages for both therapists and nurses resulted in the increased use of higher priced contract labor in order to provide appropriate care for our patients.
Supplies
From 2004 to 2005,Supplies expense decreased by $13.5 million, or 11.1%. Approximately $6.2 million of the decrease is due to the change in classification of our Braintree and Woburn facilities. The remainder is due to the decline in volumes during 2005.Supplies expense as a percent ofNet operating revenues remained flat at approximately 6.0% each year.
Suppliesexpense increased by $13.7 million, or 12.7% from 2003 to 2004. This increase is primarily due to increased costs of supplies and the higher acuity of our patients in 2004. Higher acuity correlates to a higher cost patient, especially in drug expenses.
Provision for Doubtful Accounts
Our inpatient segment’sProvision for doubtful accounts fluctuated between 1.5% ofNet operating revenues and 2.5% ofNet operating revenues from 2003 through 2005. During 2005, the segment’sProvision for doubtful accounts decreased by $4.1 million, or 9.0%, due to the decrease inNet operating revenues year over year. However, the provision for doubtful accounts as a percent ofNet operating revenues remained relatively flat, approximating 2.3% and 2.2% in 2005 and 2004, respectively.
From 2003 to 2004, theProvision for doubtful accounts increased from 1.6% to 2.2% ofNet operating revenues due to a focus more on other operational projects and less on collection activities.
All Other Operating Expenses
From 2004 to 2005, all other operating expenses decreased by 7.0% due to the change in facility classification and the reduction in volumes discussed above. The inpatient segment’s all other operating expenses in 2005 also include an approximate $1.8 million impairment charge related to long-lived assets. Approximately $0.5 million of this charge relates to assets at our Pendleton facility in New Orleans, Louisiana. This facility was abandoned due to the damage caused by Hurricane Katrina. The remainder of the impairment charge is the result of continued negative cash flows experienced by one of our facilities in Texas.
All other operating expenses decreased by 12.1% from 2003 to 2004. As the inpatient segment digested the change to PPS, faced the challenge of mitigating the 75% Rule impact onNet operating revenues, and realigned expenses going forward, a broad range of expenses were eliminated by the segment in this category during 2004.
Operating Earnings
Net operating earnings of our inpatient segment decreased by $43.9 million, or 10.0%, from 2004 to 2005. Approximately $3.6 million of this decrease is due to the change in classification of our Braintree and Woburn facilities. The remainder is due to the declining volumes experienced by the segment and the reimbursement challenges presented by the 75% Rule. Operating earnings increased by less than 1% from 2003 to 2004.
22
Surgery Centers
We operate one of the largest networks of ambulatory surgery centers (“ASCs”) in the United States. As of December 31, 2005, we provided these services through the operation of our network of 158 freestanding ASCs and 3 surgical hospitals in 35 states, with a concentration of centers in California, Texas, Florida, and North Carolina.
Our surgery centers provide the facilities and medical support staff necessary for physicians to perform non-emergency surgical procedures in more than a dozen specialties, such as orthopedic, GI, ophthalmology, plastic, and general surgery. For 2003 through 2005, this segment’s operating results were as follows:
| | | | | | | | | | |
| | | For the year ended December 31, | |
| | | 2005 | | 2004 | | 2003 | |
| | | (In Thousands) | |
Surgery Centers | | | | | | | | | | |
Net operating revenues | | $ | 773,403 | | $ | 817,661 | | $ | 871,303 | |
Operating expenses* | | | 690,905 | | | 724,078 | | | 913,941 | |
| | | | | | | | | | |
Operating earnings (loss) | | $ | 82,498 | | $ | 93,583 | | $ | (42,638 | ) |
| | | | | | | | | | |
Cases | | | 647 | | | 707 | | | 747 | |
| | | (Not In Thousands) | |
Full time equivalents | | | 4,483 | | | 4,662 | | | 4,830 | |
| * | Includes divisional overhead, but excludes corporate overhead allocation. See Note 25,Segment Reporting, to our accompanying consolidated financial statements. Includes the effect of minority interests in earnings of consolidated affiliates and equity in the net income of nonconsolidated affiliates. |
During the years ended December 31, 2005, 2004, and 2003, our surgery centers segment derived itsNet operating revenues from the following payor sources:
| | | | | | | | | |
| | | For the year ended December 31, | |
| | | 2005 | | | 2004 | | | 2003 | |
Medicare | | 17.8 | % | | 18.1 | % | | 14.3 | % |
Medicaid | | 2.7 | % | | 2.7 | % | | 2.3 | % |
Workers’ compensation | | 10.5 | % | | 10.7 | % | | 12.5 | % |
Managed care and other discount plans | | 59.2 | % | | 55.5 | % | | 55.1 | % |
Other third-party payors | | 3.7 | % | | 0.4 | % | | 4.9 | % |
Patients | | 4.8 | % | | 11.0 | % | | 9.3 | % |
Other income | | 1.3 | % | | 1.6 | % | | 1.6 | % |
| | | | | | | | | |
Total | | 100.0 | % | | 100.0 | % | | 100.0 | % |
| | | | | | | | | |
Our commercial revenues, which are included in “Other third-party payors” in the above chart, increased by approximately $25 million from 2004 to 2005. This increase is the result of an increase in out-of-network cases that yield higher net revenue per case. The number of plastic surgery cases performed by our centers decreased by approximately 7% from 2004 to 2005. As a result,Net operating revenues from cases where the patient has primary financial responsibility decreased from the prior year.
The number of cases performed by our centers is a key metric utilized by the segment to regularly evaluate its performance. The segment’s primary operating expenses includeSalaries and benefits andSupplies.Salaries and benefits represents the most significant cost to the segment and includes all amounts paid to full- and part-time employees, as well as all related costs of benefits provided to employees. Supply costs include all expenses associated with medical supplies used while providing patient care at our centers. Such costs include sterile disposables, pharmaceuticals, implants, and other similar items.
23
Like most other ASCs, the majority of our centers are owned in partnership with surgeons and other physicians who perform procedures at the centers. As existing physician partners retire or change geographic location, it is important that the surgery centers segment periodically provide other physicians with opportunities to purchase ownership interests in our ASCs in order to maintain or increase case volumes andNet operating revenues. Our ability to resyndicate our partnerships is a key success factor for our surgery centers segment.
Net Operating Revenues
As noted above, our ability to efficiently resyndicate our partnership portfolio is critical to the success of our surgery centers segment. Since 2003, our surgery centers segment has experienced a decline in the number of cases performed at our centers. Management attributes the majority of the decline in each year to our inability to resyndicate partnership interests in each center and the negative publicity HealthSouth received as a result of the events leading up to March 19, 2003. Because of our inability to report financial information during 2003 and 2004, there was no resyndication activity during 2003 and minimal activity during the latter half of 2004. Resyndication activity increased in 2005, but the majority of this activity also took place in the latter half of the year. We expect to begin seeing the results of this resyndication activity in 2006.
From 2004 to 2005,Net operating revenues decreased by $44.3 million, or 5.4%. Declining volumes contributed to an approximate $67.8 million decrease in Net operating revenues. Although the majority of this decrease is due to the limited resyndication activities discussed above, approximately $25.6 million of the decrease is due to the reclassification of five surgery centers that became equity method investments rather than consolidated entities in 2005 as a result of changes in control of these entities. TheNet operating revenues lost through volume declines were offset by a shift in case mix to ophthalmology cases which generate higher average net revenue per case. This shift in case mix increasedNet operating revenues by approximately $28.7 million. The remainder of the 2005 decrease inNet operating revenues of $5.2 million is primarily attributable to a decrease in rental income associated with subleases that were terminated during the year.
24
From 2003 to 2004, our surgery centers segment experienced a $53.6 million, or 6.2%, decrease inNet operating revenues. Approximately 85% of this decrease was due to declining volumes, as discussed above. The remainder of the decrease is due to a shift in case mix to procedures that carry lower average net revenue per case.
Operating Expenses
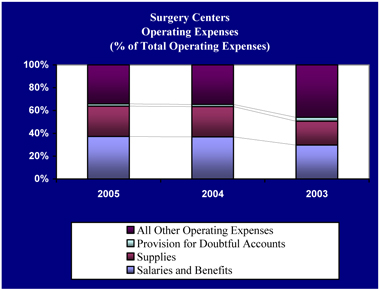
Salaries and Benefits
In each year,Salaries and benefits represents over 29% of our surgery centers segment’s operating expenses.
Salaries and benefits decreased by approximately $9.1 million, or 3.4%, from 2004 to 2005. This decrease is primarily attributable to a reduction of 179 full-time equivalents year over year due to the decline in the number of cases performed by our surgery centers and the segment’s focus to improve operational performance and productivity.Salaries and benefits as a percent ofNet operating revenues remained flat at approximately 33% from 2004 to 2005.
During 2004,Salaries and benefits decreased by $4.8 million, or 1.8%. Although full-time equivalents decreased by 168 year over year, increased costs associated with group medical insurance and workers’ compensation coverage offset these reductions.
Supplies
Supplies represents over 20% of our surgery centers segment’s operating expenses in each year, making it important for our ASCs to appropriately manage and monitor these costs.
Although total supplies cost decreased by $9.8 million, or 5.1%, from 2004 to 2005,Suppliesas a percent ofNet operating revenues remained flat at approximately 24%. The volume declines experienced by the segment in 2005 resulted in decreased supplies cost of approximately $16.3 million. However, this was offset by increased pricing associated with implants and prosthetics. The shift in case mix to more ophthalmology cases also contributed to an increase in the average supply cost per case in 2005.
From 2003 to 2004,Suppliesexpense remained relatively flat. Although the average supply cost per case increased by approximately 6.6% year over year, there was a decrease in supplies used during the year due to the decline in the number of cases in 2004.
25
Provision for Doubtful Accounts
From 2004 to 2005, our surgery centers segment’sProvision for doubtful accounts remained relatively flat at approximately 1.8% ofNet operating revenues and 1.9% ofNet operating revenues, respectively. From 2003 to 2004, this segment was able to decrease itsProvision for doubtful accounts from 3.6% ofNet operating revenues to 1.8% ofNet operating revenues. This decrease is due to the positive impact of segment-wide business office manager training, outsourced billing statements (which provided consistent delivery and appearance of statements), and utilization of an outside collection agency during 2004.
All Other Operating Expenses
From 2004 to 2005, all other operating expenses decreased by approximately 5.8%. As discussed earlier in this Item, we reclassified five facilities from consolidated entities to equity method investments due to changes in control of these entities. This reclassification favorably impacted bothMinority interest in earnings of consolidated affiliates andEquity in net income of nonconsolidated affiliates. In addition, all other operating expenses decreased due to the closure and/or sale of under-performing facilities in 2005 that did not qualify as discontinued operations.
All other operating expenses decreased by approximately 40.4% from 2003 to 2004 due primarily to a $173.6 million reduction in impairment charges year over year. Although impairment charges decreased significantly year over year, our surgery centers segment’s 2004 operating expenses include a $2.7 million charge for the impairment of long-lived assets. Due to facility closings and facilities experiencing negative cash flow from operations, we examined all of our facilities for impairment. The above impairment charge is the result of that review.
Our surgery centers segment’s operating expenses in 2003 include a $176.2 million goodwill impairment charge. We performed an impairment review as required by FASB Statement No. 142 as of October 1, 2003 and concluded that a potential goodwill impairment existed in our surgery centers segment. The amount of the impairment, which was determined by calculating the implied fair value of goodwill, primarily recognizes the decline in the expected future operating performance of our surgery centers.
Operating Earnings (Loss)
The decrease in this segment’s operating earnings from 2004 to 2005 was due to the volume declines discussed above. Operating earnings of our surgery centers segment increased by approximately $136.2 million from 2003 to 2004. Although the segment experienced a decline inNet operating revenues, the segment decreased itsProvision for doubtful accounts (as discussed above) and did not record a goodwill impairment charge in 2004, thus improving its operating results.
Outpatient
We are one of the largest operators of free standing outpatient rehabilitation facilities in the United States. As of December 31, 2005, we provided outpatient rehabilitative health care services through 617 facilities. We have locations in 40 states, with a concentration of centers in Florida, Texas, New Jersey, Missouri, and Connecticut.
Our outpatient rehabilitation facilities are staffed by physical therapists, occupational therapists, and other clinicians and support personnel, depending on the services provided at a particular location, and we are open at hours designed to accommodate the needs of the patient population being served and the local demand for services. Our outpatient centers offer a range of rehabilitative health care services, including physical therapy and occupational therapy, with a particular focus on orthopedic, sports-related, work-related, hand and spine injuries, and various neurological/neuromuscular conditions.
26
For 2003 through 2005, this segment’s operating results were as follows:
| | | | | | | | | | |
| | | For the year ended December 31, | |
| | | 2005 | | 2004 | | 2003 | |
| | | (In Thousands) | |
Outpatient | | | | | | | | | | |
Net operating revenues | | $ | 378,428 | | $ | 440,436 | | $ | 518,124 | |
Operating expenses* | | | 346,452 | | | 401,113 | | | 572,394 | |
| | | | | | | | | | |
Operating earnings (loss) | | $ | 31,976 | | $ | 39,323 | | $ | (54,270 | ) |
| | | | | | | | | | |
Visits | | | 3,802 | | | 4,439 | | | 5,377 | |
| | | (Not In Thousands) | |
Full time equivalents | | | 3,784 | | | 4,522 | | | 5,270 | |
| * | Includes divisional overhead, but excludes corporate overhead allocation. See Note 25,Segment Reporting, to our accompanying consolidated financial statements. Includes the effect of minority interests in earnings of consolidated affiliates and equity in the net income of nonconsolidated affiliates. |
For the years ended December 31, 2005, 2004, and 2003, outpatient’s net operating revenues were derived from the following payor sources:
| | | | | | | | | |
| | | For the year ended December 31, | |
| | | 2005 | | | 2004 | | | 2003 | |
Medicare | | 13.6 | % | | 12.6 | % | | 9.9 | % |
Medicaid | | 0.7 | % | | 0.6 | % | | 4.1 | % |
Workers’ compensation | | 22.0 | % | | 24.7 | % | | 27.3 | % |
Managed care and other discount plans | | 47.2 | % | | 49.6 | % | | 44.6 | % |
Other third-party payors | | 10.5 | % | | 6.6 | % | | 8.5 | % |
Patients | | 1.3 | % | | 1.2 | % | | 1.2 | % |
Other income | | 4.7 | % | | 4.7 | % | | 4.4 | % |
| | | | | | | | | |
Total | | 100.0 | % | | 100.0 | % | | 100.0 | % |
| | | | | | | | | |
The number of visits patients make to our centers is a key metric utilized by the segment to regularly evaluate its performance. Outpatient’sNet operating revenues include revenues from patient visits, as well as revenues generated from trainers and management contracts. Outpatient has contracts with schools, municipalities, and other parties around the country to provide physical therapists and/or athletic trainers for various events. Outpatient also receives management and administrative fees for facilities it manages, but does not own. Trainer income, management fees, and administrative fees comprise the majority of the segment’s other income.
The segment’s most significant operating expense isSalaries and benefits, which includes all amounts paid to full- and part-time employees at our centers, as well as all related costs of benefits provided to employees. Due to the nature of the services provided by our outpatient centers, supplies expense does not represent a significant portion of the segment’s operating expenses, unlike our other business segments.
Our outpatient segment participates in a slower growing, lower margin business than our other operating segments. Due to regulatory changes, physicians that once referred business to us are now treating patients at their own facilities. Due to the relatively low barriers to entry associated with an outpatient facility, our outpatient segment continues to face increased competition from physician-owned physical therapy sites. The segment is also facing an industry-wide shortage of physical therapists. To combat the shortage, our outpatient segment implemented key incentive plans to help recruit and retain therapists. These incentive plans have begun to reduce therapist turnover rates and have increased the segment’s overall clinical productivity.
27
Net Operating Revenues
From 2003 to 2005, patient visits to our outpatient facilities decreased by over 1.5 million visits. This decreased volume negatively impactedNet operating revenues by approximately $60.3 million in 2005 and approximately $86.4 million in 2004. Management attributes the volume decline in each year to increased competition from physician-owned physical therapy sites, expiration of noncompete agreements from prior acquisitions, and the nationwide physical therapist shortage. The volume impact of these factors resulted in the net closure of 108 facilities in 2005 and 70 facilities during 2004 that did not qualify for discontinued operations. These closures accounted for approximately $30.2 million and $16.3 million, respectively, of the total volume decrease in 2005 and 2004, respectively. The remainder of the decrease in each year represents the impact of the above factors on our facilities that remained open.
In 2004, our outpatient segment was able to achieve higher net patient revenue per visit, increasing this metric by approximately $2 per visit. The increased net patient revenue per visit yielded approximately $10.9 million in additionalNet operating revenuesduring 2004. The increase per visit was due to the segment’s examination and elimination of managed care contracts with low reimbursement rates, a price increase on some services, and an increase in manual therapy services. There was no significant impact toNet operating revenues as a result of pricing in 2005.
During 2005 and 2004, non-patient revenues decreased by $3.0 million, or 14.5%, and $2.2 million, or 9.5%, respectively, due to facility closures and contract terminations during the year.
Operating Expenses
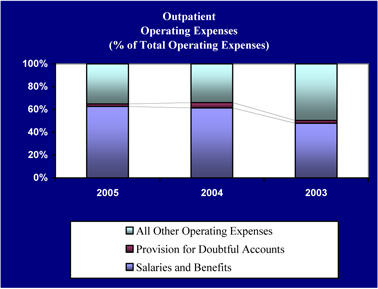
Salaries and Benefits
Salaries and benefits represent over 47% of outpatient’s operating expenses in each year.
28
In 2005 and 2004,Salaries and benefits decreased by $29.2 million, or 11.9%, and $27.9 million, or 10.2%, respectively. The majority of this decrease is due to the closure of facilities in 2005 and 2004, as described above, which resulted in a 738 and a 748 decrease in full-time equivalents, respectively. This decrease in full- time equivalents in each year decreasedSalaries and benefits by approximately $40.2 million and $38.9 million in 2005 and 2004, respectively. Decreased costs associated with fewer full-time equivalents were offset by increasing costs associated with employee benefits in both years.
Provision for Doubtful Accounts
TheProvision for doubtful accounts of our outpatient segment increased from 2.8% to 4.2% ofNet operating revenues from 2003 to 2004, respectively. In 2005, theProvision for doubtful accounts decreased to 1.9% ofNet operating revenues. These changes resulted from the segment’s reorganization of its billing and collecting function during 2004 and 2005.
All Other Operating Expenses
From 2004 to 2005, all other operating expenses decreased by approximately 10.6% due primarily to the closure of underperforming facilities and a $2.7 million decrease in impairment charges year over year. Triggering events related to facility closings and facilities experiencing negative cash flow from operations resulted in the segment recognizing a $0.8 million impairment charge to long-lived assets in 2005. We determined the fair value of the impaired long-lived assets at a facility primarily based on the assets’ estimated fair value using valuation techniques that included discounted future cash flows and third-party appraisals.
All other operating expenses decreased by approximately 52.0% from 2003 to 2004. This decrease primarily resulted from a $136.5 million decrease in impairment charges year over year. Triggering events related to facility closings and facilities experiencing negative cash flow from operations resulted in the segment recognizing an impairment charge of $2.4 million related to long-lived assets and $1.0 million related to intangible assets in 2004. We wrote these assets down to zero, or their estimated fair value, based on expected negative operating cash flows of these facilities in future years.
The segment’s 2003 operating expenses include approximately $140.0 million of impairment charges. As a result of the events leading up to March 19, 2003, we performed an impairment review, as required by FASB Statement No. 142, and concluded that a potential goodwill impairment existed in the outpatient segment. We calculated the implied fair value of the outpatient segment’s goodwill and determined that the outpatient segment’s goodwill was impaired by $135.9 million. Our outpatient segment also recorded a $4.1 million impairment charge related to long-lived assets in 2003.
Operating Earnings (Loss)
Operating earnings decreased from 2004 to 2005 due primarily to the declining volumes, as discussed above. In 2004, operating earnings increased by $93.6 million due primarily to a reduction in impairment charges. Our outpatient segment experienced an operating loss in 2003 due primarily to the $135.9 million goodwill impairment charge recorded by the segment.
Diagnostic
We are one of the largest operators of freestanding diagnostic imaging centers in the United States. As of December 31, 2005, we performed diagnostic services through the operation of our network of approximately 85 diagnostic centers in 27 states and the District of Columbia, with a concentration of centers in Texas, Georgia, Alabama, Florida, and the Washington D.C. area. In addition, the division operates five electro-shock wave lithotripter units.
29
Our diagnostic centers provide outpatient diagnostic imaging services, including MRI services, CT services, X-ray services, ultrasound services, mammography services, nuclear medicine services, and fluoroscopy. We do not provide all services at all sites, although approximately 71% of our diagnostic centers are multi-modality centers offering multiple types of service. Our outpatient diagnostic procedures are performed by experienced radiological technologists. After the diagnostic procedure is completed, the images are reviewed by radiologists who have contracted with us. These radiologists prepare an interpretation which is then delivered to the referring physician.
Due to the equipment utilized when performing diagnostic services for our patients, our diagnostic segment generally has high capital costs, including costs for maintaining its equipment.
For 2003 to 2005, our diagnostic segment’s operating results were as follows:
| | | | | | | | | | | | |
| | | For the year ended December 31, | |
| | | 2005 | | | 2004 | | | 2003 | |
| | | (In Thousands) | |
Diagnostic | | | | | | | | | | | | |
Net operating revenues | | $ | 226,506 | | | $ | 234,652 | | | $ | 262,014 | |
Operating expenses* | | | 228,740 | | | | 241,228 | | | | 297,337 | |
| | | | | | | | | | | | |
Operating loss | | $ | (2,234 | ) | | $ | (6,576 | ) | | $ | (35,323 | ) |
| | | | | | | | | | | | |
Scans | | | 710 | | | | 736 | | | | 822 | |
| | | (Not In Thousands) | |
Full time equivalents | | | 1,116 | | | | 1,223 | | | | 1,250 | |
| * | Includes divisional overhead, but excludes corporate overhead allocation. See Note 25,Segment Reporting, to our accompanying consolidated financial statements. Includes the effect of minority interests in earnings of consolidated affiliates and equity in the net income of nonconsolidated affiliates. |
For the years ended December 31, 2005, 2004, and 2003, diagnostic derived itsNet operating revenues from the following payor sources:
| | | | | | | | | |
| | | For the year ended December 31, | |
| | | 2005 | | | 2004 | | | 2003 | |
Medicare | | 19.5 | % | | 17.3 | % | | 16.5 | % |
Medicaid | | 3.4 | % | | 3.3 | % | | 2.7 | % |
Workers’ compensation | | 9.6 | % | | 9.2 | % | | 7.8 | % |
Managed care and other discount plans | | 60.1 | % | | 61.0 | % | | 63.5 | % |
Other third-party payors | | 4.4 | % | | 6.1 | % | | 7.2 | % |
Patients | | 2.2 | % | | 2.2 | % | | 1.4 | % |
Other income | | 0.8 | % | | 0.9 | % | | 0.9 | % |
| | | | | | | | | |
Total | | 100.0 | % | | 100.0 | % | | 100.0 | % |
| | | | | | | | | |
The number of scans performed is a key metric utilized by the segment to regularly evaluate its performance. The segment’s primary operating expenses includeSalaries and benefits,Professional and medical director fees, andSupplies.Salaries and benefits expense represents the most significant cost to the segment and includes all amounts paid to full- and part-time employees at our centers, as well as all related costs of benefits provided to employees.Professional and medical director fees primarily include fees paid under contracts with radiologists and other clinical professionals to read and interpret the scans performed at our centers. Payments under these contracts are normally tied to the number of scans read by each independent contractor, associated revenues with each scan, or cash collections. Supply costs include all expenses associated with supplies used while performing diagnostic services for our patients. These costs primarily consist of the film costs associated with each scan.
30
Our diagnostic segment has struggled over the past several years due to poor margins for the diagnostic market in general, strong competition from physician-owned diagnostic service centers, increased pricing pressure from payors, and the age of equipment in our installed base. We see competition only increasing as diagnostic equipment manufacturers continue to lower prices and offer special financing to encourage physicians to purchase equipment through their own practices, resulting in a decline in the number of procedures performed at our diagnostic centers.
Net Operating Revenues
The decrease inNet operating revenues in each year is due to volume decreases caused primarily by competition from physician-owned diagnostic centers and the closure of underperforming facilities that did not qualify for discontinued operations.
Operating Expenses
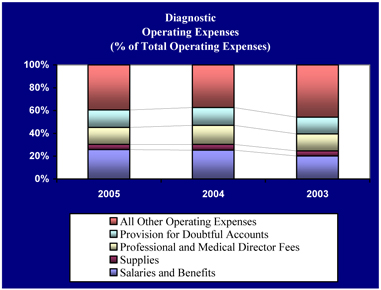
Salaries and Benefits
The declining volumes of our diagnostic segment over the past several years has led management to take an active role in increasing efficiencies by reducing the number of full-time equivalents. However, our diagnostic centers have relatively few full-time equivalents on a per facility basis, and there are certain staffing requirements that are mandated for any volume level given the nature of services we provide.
Salaries and benefits decreased by $2.1 million, or 3.4%, from 2004 to 2005. This decrease was primarily the result of eliminating full-time positions at certain business offices by outsourcing the segment’s collections processes to a third-party and the closure of underperforming facilities that did not qualify for discontinued operations in 2005. Due to these headcount reductions at the segment’s business offices and the closure of underperforming facilities,Salaries and benefits remained at approximately 26.0% ofNet operating revenues in 2005 in spite of the decline in revenues.
31
Salaries and benefits grew from 22.8% ofNet operating revenues in 2003 to 26.0% ofNet operating revenues in 2004. Although volumes declined in 2004, our diagnostic centers did not further adjust their staffing levels due to management’s conclusion that minimum staffing levels had been achieved for the operation of our centers. Therefore,Salaries and benefits grew as a percent ofNet operating revenues due to the decline inNet operating revenues in 2004 without a commensurate reduction in personnel costs.
Supplies
In 2005 and 2004,Supplies expense decreased by approximately 12.2% and 11.0%, respectively, due to the decrease in volumes during each year, more favorable supply pricing, and improved efficiency.
Professional and Medical Director Fees
From 2003 through 2005,Professional and medical director fees generally followed the same trend as ourNet operating revenues and cash collections.
Provision for Doubtful Accounts
In 2003, our diagnostic segment’sProvision for doubtful accounts was 16.7% ofNet operating revenues. This high percentage was primarily the result of a decline in operational efficiency within the segment as a result of (1) outsourcing the diagnostic segment’s collection activities to a third-party vendor (beginning March 2002), and (2) the conversion of 44 of the segment’s clinics to a new patient accounting system which failed to meet expectations. The contract with the third-party vendor was terminated in April 2003, and the 44 clinics were taken off the new patient accounting system during the summer of 2003.
During 2004, we made progress collecting aged receivables, which is reflected in the decrease in theProvision for doubtful accounts to 16.1% ofNet operating revenues. In 2005, we continued to implement new information systems to improve cash collections in our diagnostic segment, and we outsourced collection activities to a third-party. These new systems along with management’s focus on collections decreased the segment’sProvision for doubtful accounts to 15.5% ofNet operating revenues in 2005.
All Other Operating Expenses
From 2004 to 2005, all other operating expenses decreased by less than 1.0% as a result of the closure of underperforming facilities that did not qualify for discontinued operations treatment in 2005 offset by a $5.0 million impairment charge related to long-lived assets. Triggering events related to facility closings and facilities experiencing negative cash flow from operations resulted in the segment recognizing a $5.0 million impairment charge to long-lived assets in 2005. We determined the fair value of the impaired long-lived assets at a facility primarily based on the assets’ estimated fair value using valuation techniques that included discounted future cash flows and third-party appraisals.
During 2004, all other operating expenses decreased by 33.9% due primarily to a year over year reduction in impairment charges and the closure of underperforming facilities that did not qualify for discontinued operations treatment. In 2004, triggering events related to facility closings and facilities experiencing negative cash flow from operations resulted in the segment recognizing an impairment charge of $0.9 million related to long-lived assets. We wrote these assets down to zero, or their estimated fair value, based on expected negative operating cash flows of these facilities in future years.
During 2003, we performed an impairment review as required by FASB Statement No. 142 and concluded a potential goodwill impairment existed in our diagnostic segment. We calculated the implied fair value of the diagnostic segment’s goodwill and determined that an impairment charge of $23.5 million was appropriate. After this impairment charge, there is no goodwill remaining on our diagnostic segment. Our diagnostic segment also recorded a $0.5 million impairment charge related to long-lived assets in 2003.
32
Operating Loss
In 2005, our diagnostic segment decreased its operating loss by closing additional underperforming facilities and decreasing itsProvision for doubtful accounts, as discussed above.
In 2004, the segment’s operating loss decreased by approximately 81.4%. Although our diagnostic segment experienced a decline inNet operating revenues year over year, the segment decreased its total operating expenses due primarily to a year over year reduction in theProvision for doubtful accounts and impairment charges, as discussed above.
We continue to focus on operational improvements to increase our margins and respond to the increased competition in this industry.
Corporate and Other
Corporate and other includes revenue-producing functions that are managed directly from our corporate office and that do not fall within one of the four operating segments discussed above, including other patient care services and certain non-patient care services.
| | • | | Medical Centers. This category formerly included our acute care business which, for all practical purposes, we have now exited. Specifically, as described later in this Item under the heading “Results of Discontinued Operations,” we have signed an agreement to sell our acute care hospital located in Birmingham, Alabama. In addition, on January 4, 2006, we executed a letter of intent with an undisclosed party regarding the sale of the property and equipment which were to have comprised our Digital Hospital in Birmingham, Alabama. Any sale of the Digital Hospital will not involve conveyance of our interest in any certificate of need from our acute care hospital. The letter of intent expires, subject to certain conditions, on March 31, 2006 unless otherwise extended in accordance with the terms of the letter of intent. As of December 31, 2005, we had invested approximately $210 million in the Digital Hospital project. We have not signed a definitive agreement with respect to the Digital Hospital, and there can be no assurance any sale will take place. See Note 5,Property and Equipment, to our accompanying consolidated financial statements, for a discussion of the impairment charge we recognized in 2005 relating to the Digital Hospital. As of December 31, 2005, this category continues to include a physician practice located at the University of Miami Sports Center. During 2005, 2004, and 2003,Net operating revenues from this category comprised 5.8%, 2.8%, and 7.8%, respectively, of corporate and other’sNet operating revenues. |
| | • | | Other Patient Care Services. In some markets, we provide other limited patient care services. We evaluate market opportunities on a case-by-case basis in determining whether to provide additional services of these types. We may provide these services as a complement to our facility-based businesses or as stand-alone businesses. During 2005, 2004, and 2003,Net operating revenuesfrom other patient care services comprised 3.1%, 3.2%, and 4.9%, respectively, of corporate and other’sNet operating revenues. |
| | • | | Non-Patient Care Services. We also provide certain services that do not involve the provision of patient care, including the operation of the conference center located at our corporate campus, operation of medical office buildings, various corporate marketing activities, our clinical research activities, and other services that are generally intended to complement our patient care activities. During 2005, 2004, and 2003,Net operating revenues from non-patient care services comprised 91.1%, 94.0%, and 87.3% of corporate and other’sNet operating revenues. This category’sNet operating revenues include earned premiums of HCS, Ltd. (“HCS”). HCS handles medical malpractice, workers’ compensation, and other claims for us. HCS is a wholly owned subsidiary of HealthSouth Corporation, and, as such, these earned premiums eliminate in consolidation. |
| | • | | Corporate Functions. All our corporate departments and related overhead are contained within this segment. These departments, which include among others accounting, communications, compliance, human resources, information technology, internal audit, legal, payor strategies, reimbursement, tax, and treasury, provide support functions to our operating divisions. |
33
For 2003 through 2005, this segment’s operating results were as follows:
| | | | | | | | | | | | |
| | | For the year ended December 31, | |
| | | 2005 | | | 2004 | | | 2003 | |
| | | (In Thousands) | |
Corporate and Other | | | | | | | | | | | | |
Net operating revenues | | $ | 79,106 | | | $ | 85,473 | | | $ | 80,247 | |
Operating expenses* | | | 608,135 | | | | 404,878 | | | | 568,249 | |
| | | | | | | | | | | | |
Operating loss | | $ | (529,029 | ) | | $ | (319,405 | ) | | $ | (488,002 | ) |
| | | | | | | | | | | | |
| | | (Not In Thousands) | |
Full time equivalents | | | 927 | | | | 760 | | | | 717 | |
| * | Includes all corporate overhead. See Note 25,Segment Reporting, to our accompanying consolidated financial statements. Includes the effect of minority interests in earnings of consolidated affiliates and equity in net income of nonconsolidated affiliates. This line item also includes approximately $215 million and $171 million, respectively, in 2005 and 2003 related toGovernment, class action, and related settlements expense. |
Corporate and other’s primary operating expense isSalaries and benefits.Salaries and benefits represents the most significant cost to the segment and includes all amounts paid to full- and part-time employees at our corporate headquarters (excluding any divisional management allocated to each operating segment) in Birmingham, Alabama, as well as all related costs of benefits provided to these employees. All general and administrative costs related to the operation of our corporate office are included inOther operating expenses. The most significant general and administrative expenses relate to insurance including property and casualty, general liability, and directors and officers’ coverage.
Net Operating Revenues
Changes inNet operating revenues from year to year relate to changes in earned premiums of HCS, which eliminate in consolidation.
34
Operating Expenses
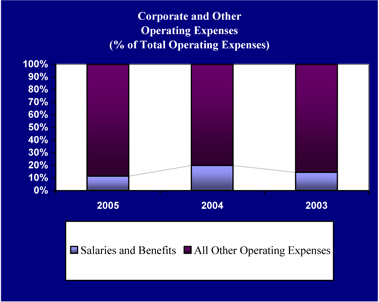
Salaries and Benefits
From 2004 to 2005,Salaries and benefits decreased by $10.6 million, or 13.2%, primarily due to lower claims and premiums expense associated with workers’ compensation.Salaries and benefits did not change materially from 2003 to 2004.
All Other Operating Expenses
All other operating expenses of the corporate and other segment include $24.4 million, $30.2 million, and $127.9 million of impairment charges related to the Digital Hospital in 2005, 2004, and 2003, respectively. In each year, the impairment charge represents the excess of costs incurred during the construction of the Digital Hospital over the estimated fair market value of the property, including the River Point facility, a 60,000 square foot office building, which shares the construction site and would be included with any sale of the Digital Hospital. The impairment of the Digital Hospital in 2003 was based on an appraisal that considered alternative uses for the property. The impairment of the Digital Hospital in 2004 and 2005 was determined using a weighted average fair value approach that considered the 2003 appraisal and other potential scenarios.
In addition to the $24.4 million impairment charge related to the Digital Hospital in 2005, the corporate and other segment recorded $9.0 million in other long-lived asset impairment charges. We determined the fair value of the impaired long-lived assets based on the assets’ estimated fair value using valuation techniques that included discounted future cash flows and third-party appraisals.
All other operating expenses increased by 65.9% from 2004 to 2005. The primary contributor to this increase is the $215.0 million settlement associated with our securities litigation, as discussed above in this Item, “Consolidated Results of Operations.” Excluding the amount recorded for the securities litigation settlement, all other operating expenses in the corporate and other segment would have decreased by less than 1.0% in 2005 due to the following:
| | • | | Meadowbrook recovery. As discussed earlier in this Item, we recorded a $37.9 million recovery related to Meadowbrook in 2005. |
35
| | • | | Professional fees—accounting, tax, and legal. These fees decreased by $36.4 million from 2004 to 2005, showing the decreased use of consultants as our new management team was in place. |
These decreases were offset by increased expenses associated with accounting, legal, and consulting professional fees. We incurred these fees in 2005 as a result of Sarbanes-Oxley costs and strategic agenda consulting.
From 2003 to 2004, all other operating expenses had a net decrease of approximately 33.3%. This decrease was primarily the result of the following:
| | • | | Software development costs. We began funding Source Medical for the HCAP software development in 2001. In 2004, we gave approximately $6.5 million less to Source Medical for software development. For additional information regarding Source Medical, see Note 7,Investment in and Advances to Nonconsolidated Affiliates, to our accompanying consolidated financial statements. |
| | • | | Impairment of Long-Lived Assets. During 2003, the corporate and other segment recorded long-lived asset impairments of $128.0 million, while in 2004, long-lived asset impairments approximated $30.2 million. Both charges related primarily to the Digital Hospital, as discussed above. |
| | • | | Government, Class Action, and Related Settlements. There were no government, class action, or related settlements recorded in 2004. |
The above decreases in 2004 were offset by a $135.7 million increase inProfessional fees—accounting, tax, and legal. As noted throughout this filing, significant changes have occurred at HealthSouth since the events leading up to March 19, 2003. The steps taken to stabilize our business and operations, provide vital management assistance, and coordinate our legal strategy came at significant financial cost. Much of the audit and reconstruction efforts occurred in 2004 causing these fees to increase from 2003.
Operating Loss
Our operating loss for the corporate and other segment increased from 2004 to 2005 due primarily to the securities litigation settlement. Our operating loss for the corporate and other segment decreased from 2003 to 2004 due to the decrease in all other operating expenses discussed above.
Results of Discontinued Operations
In our continuing effort to streamline operations, we identified 19 entities in our inpatient segment, 335 outpatient rehabilitation facilities, 25 surgery centers, 27 diagnostic centers, and 47 other facilities during 2005, 2004, and 2003 and the first quarter of 2006 that met the requirements of FASB Statement No. 144 to report as discontinued operations. For the facilities identified during these years that met the requirements of FASB Statement No. 144 to report as discontinued operations, we reclassified our consolidated balance sheet for the year ended December 31, 2004 and our consolidated statements of operations and consolidated statements of cash flows for the years ended December 31, 2004 and 2003 to show the results of those facilities as discontinued operations.
When determining if a closed facility qualifies for discontinued operations under FASB Statement No. 144, we consider the proximity of the facility to other HealthSouth facilities offering similar services as well as other facilities within the same regional cost center that remain open. If we believe HealthSouth will retain patients by transferring the services to another HealthSouth facility, we will not treat the closed facility as a discontinued operation. We do not account for facilities that were closed or sold as discontinued operations until we have exited the specific market.
36
The operating results of discontinued operations, by operating segment and in total, are as follows:
| | | | | | | | | | | | |
| | | For the year ended December 31, | |
| | | 2005 | | | 2004 | | | 2003 | |
| | | (In Thousands) | |
Inpatient: | | | | | | | | | | | | |
Net operating revenues | | $ | — | | | $ | 4,699 | | | $ | 26,114 | |
Costs and expenses | | | 637 | | | | 6,544 | | | | 18,148 | |
| | | | | | | | | | | | |
(Loss) income from discontinued operations | | | (637 | ) | | | (1,845 | ) | | | 7,966 | |
Gain (loss) on disposal of assets of discontinued operations | | | 362 | | | | (642 | ) | | | (464 | ) |
Income tax expense | | | — | | | | — | | | | — | |
| | | | | | | | | | | | |
(Loss) income from discontinued operations | | $ | (275 | ) | | $ | (2,487 | ) | | $ | 7,502 | |
| | | | | | | | | | | | |
Surgery Centers: | | | | | | | | | | | | |
Net operating revenues | | $ | 18,854 | | | $ | 44,181 | | | $ | 57,608 | |
Costs and expenses | | | 30,967 | | | | 56,846 | | | | 99,628 | |
Impairments | | | 112 | | | | 1,750 | | | | — | |
| | | | | | | | | | | | |
Loss from discontinued operations | | | (12,225 | ) | | | (14,415 | ) | | | (42,020 | ) |
Gain on disposal of assets of discontinued operations | | | 6,181 | | | | 1,134 | | | | 11,299 | |
Income tax expense | | | — | | | | — | | | | — | |
| | | | | | | | | | | | |
Loss from discontinued operations | | $ | (6,044 | ) | | $ | (13,281 | ) | | $ | (30,721 | ) |
| | | | | | | | | | | | |
Outpatient: | | | | | | | | | | | | |
Net operating revenues | | $ | 12,805 | | | $ | 49,323 | | | $ | 80,482 | |
Costs and expenses | | | 17,924 | | | | 53,486 | | | | 76,044 | |
Impairments | | | — | | | | 822 | | | | — | |
| | | | | | | | | | | | |
(Loss) income from discontinued operations | | | (5,119 | ) | | | (4,985 | ) | | | 4,438 | |
Gain (loss) on disposal of assets of discontinued operations | | | 164 | | | | (1,280 | ) | | | (1,758 | ) |
Income tax expense | | | — | | | | — | | | | — | |
| | | | | | | | | | | | |
(Loss) income from discontinued operations | | $ | (4,955 | ) | | $ | (6,265 | ) | | $ | 2,680 | |
| | | | | | | | | | | | |
Diagnostic: | | | | | | | | | | | | |
Net operating revenues | | $ | 2,191 | | | $ | 11,410 | | | $ | 21,009 | |
Costs and expenses | | | 4,733 | | | | 17,702 | | | | 25,435 | |
Impairments | | | — | | | | 133 | | | | — | |
| | | | | | | | | | | | |
Loss from discontinued operations | | | (2,542 | ) | | | (6,425 | ) | | | (4,426 | ) |
Gain on disposal of assets of discontinued operations | | | 289 | | | | 3,077 | | | | 1,289 | |
Income tax expense | | | — | | | | — | | | | — | |
| | | | | | | | | | | | |
Loss from discontinued operations | | $ | (2,253 | ) | | $ | (3,348 | ) | | $ | (3,137 | ) |
| | | | | | | | | | | | |
Corporate and Other: | | | | | | | | | | | | |
Net operating revenues | | $ | 76,802 | | | $ | 153,609 | | | $ | 228,218 | |
Costs and expenses | | | 118,131 | | | | 232,494 | | | | 238,150 | |
Impairments | | | 6,693 | | | | 16,577 | | | | — | |
| | | | | | | | | | | | |
Loss from discontinued operations | | | (48,022 | ) | | | (95,462 | ) | | | (9,932 | ) |
Gain on disposal of assets of discontinued operations | | | 258 | | | | 319 | | | | 28,439 | |
Income tax expense | | | — | | | | — | | | | — | |
| | | | | | | | | | | | |
(Loss) income from discontinued operations | | $ | (47,764 | ) | | $ | (95,143 | ) | | $ | 18,507 | |
| | | | | | | | | | | | |
Total: | | | | | | | | | | | | |
Net operating revenues | | $ | 110,652 | | | $ | 263,222 | | | $ | 413,431 | |
Costs and expenses | | | 172,392 | | | | 367,072 | | | | 457,405 | |
Impairments | | | 6,805 | | | | 19,282 | | | | — | |
| | | | | | | | | | | | |
Loss from discontinued operations | | | (68,545 | ) | | | (123,132 | ) | | | (43,974 | ) |
Gain on disposal of assets of discontinued operations | | | 7,254 | | | | 2,608 | | | | 38,805 | |
Income tax expense | | | — | | | | — | | | | — | |
| | | | | | | | | | | | |
Loss from discontinued operations | | $ | (61,291 | ) | | $ | (120,524 | ) | | $ | (5,169 | ) |
| | | | | | | | | | | | |
37
Inpatient. Our inpatient segment identified 19 facilities as discontinued operations. The decrease in net operating revenues and costs and expenses in each year is due to the timing of the closure of these facilities.
Surgery Centers. Twenty-five surgery centers were identified as discontinued operations. Both the decline in net operating revenues and the decline in costs and expenses in each year are due to the timing of the sale or closure of these facilities. As of December 31, 2005, we had three open surgery centers that qualified as discontinued operations. These three facilities were sold in February 2006.
The $11.3 million net gain on disposal of assets in 2003 is due primarily to a gain on disposal of the assets related to our former surgical hospital in Oklahoma.
Outpatient.Our outpatient segment identified 335 facilities as discontinued operations. The timing of the closure of these facilities drove the change in net operating revenues and costs and expenses in each year.
Diagnostic. Our diagnostic segment identified 27 facilities as discontinued operations. The timing of the closure of these facilities drove the change in net operating revenues and costs and expenses in each year.
Corporate and Other. Our corporate and other segment identified 47 facilities as discontinued operations.
On July 20, 2005, we executed an asset purchase agreement with The Board of Trustees of the University of Alabama (the “University of Alabama”) for the sale of the real property, furniture, fixtures, equipment and certain related assets associated with our only remaining operating acute care hospital, which has 219 licensed beds and is located in Birmingham, Alabama. Simultaneously with the execution of this purchase agreement with the University of Alabama, we executed an agreement with an affiliate of the University of Alabama whereby this entity currently provides certain management services to our acute care hospital in Birmingham. On December 31, 2005, we executed an amended and restated asset purchase agreement with the University of Alabama. This amended and restated agreement provides that the University of Alabama will purchase our Birmingham acute care hospital and associated real and personal property as well as our interest in the gamma knife partnership associated with this hospital. We anticipate closing this transaction by the end of the first quarter of 2006. We will transfer the hospital and associated real and personal property at that time, but will transfer our interest in the gamma knife partnership at a later date. The proposed transaction also requires that we acquire and convey title to the University of Alabama for certain professional office buildings that we are currently leasing. Both the certificate of need under which the hospital currently operates, and the licensed beds operated by us at the hospital, will be transferred as part of the sale of the hospital under the amended and restated agreement.
From 2003 to 2004, net operating revenues associated with discontinued operations within our corporate and other segment decreased by $74.6 million. Approximately $72.0 million of this decrease relates to Doctor’s Hospital in Miami, Florida, which was sold in late 2003. From 2004 to 2005, net operating revenues associated with discontinued operations within this segment decreased by $76.8 million. Approximately $20.0 million of this decrease was due to the closure of Metro West hospital in September 2004. An additional $35.0 million was due to the continued poor operating performance of the Birmingham Medical Center in 2005. The change in costs and expenses in each year follow these same trends.
The $16.6 million impairment charge in 2004 primarily relates to a $14.8 million impairment charge associated with the Birmingham Medical Center. Due to continuing negative cash flows from operations of this facility, we had the Birmingham Medical Center appraised as of December 31, 2004. The impairment charge represents the difference between the appraised value and the net book value of the long-lived assets associated with the Birmingham Medical Center.
The net gain on asset disposals in 2003 was primarily the result of our sale of Doctor’s Hospital in that year.
38
Liquidity and Capital Resources
Our principal sources of liquidity are cash on hand, cash from operations, and our revolving credit agreement.
Historic Sources and Uses of Cash
Historically, our primary sources of funding have been cash flows from operations, borrowings under long-term debt agreements, and sales of limited partnership interests. Funds were used to fund working capital requirements, capital expenditures, and business acquisitions. The following chart shows the cash flows provided by or used in operating, investing, and financing activities for 2005, 2004, and 2003, as well as the effect of exchange rates for those same years:
| | | | | | | | | | | | |
| | | For the year ended December 31, | |
| | | 2005 | | | 2004 | | | 2003 | |
| | | (In Thousands) | |
Net cash provided by operating activities* | | $ | 1,567 | | | $ | 391,596 | | | $ | 574,192 | |
Net cash used in investing activities | | | (104,298 | ) | | | (186,869 | ) | | | (76,873 | ) |
Net cash used in financing activities | | | (173,832 | ) | | | (224,469 | ) | | | (115,885 | ) |
Effect of exchange rate changes on cash and cash equivalents | | | (1,248 | ) | | | 1,251 | | | | (31 | ) |
| | | | | | | | | | | | |
(Decrease) increase in cash and cash equivalents | | $ | (277,811 | ) | | $ | (18,491 | ) | | $ | 381,403 | |
| | | | | | | | | | | | |
| * | Includes approximately $165.4 million and $7.0 million of cash payments, excluding interest, related to government, class action, and related settlements in 2005 and 2004, respectively. |
2005 Compared to 2004
Operating activities. Net cash provided by operating activities decreased from 2004 to 2005 as a result of lowerNet operating revenues in 2005, cash payments for government, class action, and related settlements, and a return to normal payment terms with many of our vendors. As discussed earlier in this Item, ourNet operating revenues decreased in 2005 due to declining volumes experienced by our operating segments. In addition, we paid approximately $155.0 million, excluding interest, to the United States related to our Medicare program settlement, and we paid $12.5 million to the SEC under a settlement agreement. These settlements are discussed in Item 1,Business, and Note 21,Medicare Program Settlement, and Note 22,SEC Settlement, to our accompanying consolidated financial statements. With our revolving line of credit frozen throughout 2004, we added approximately two weeks to most payment terms of our vendors as part of our cash management and conservation process. After we amended and restated our credit agreement in March 2005 (see below), we were able to return to more normal payment terms with our vendors. This decreased our net cash provided by operating activities year over year.
Investing activities. Net cash used in investing activities decreased from 2004 to 2005 primarily due to a reduction in capital expenditures. During 2005, we decreased capital expenditure budgets and postponed development projects to conserve cash and restructure our business.
Financing activities. Net cash used in financing activities decreased from 2004 to 2005 due primarily to $73.5 million less in debt issuance costs and consent fees paid in 2005 offset by $23.1 million more in net debt payments, including capital lease obligations. See Item 1,Business, and Note 8,Long-term Debt, to our accompanying consolidated financial statements.
2004 Compared to 2003
Operating activities. Net cash provided by operating activities decreased from 2003 to 2004 as a result of lowerNet operating revenues in 2004 and a reduction in income tax refunds received year over year. In 2004, we received net income tax refunds of approximately $8.1 million, as compared to 2003 when we received $110.3 million in net income tax refunds.
39
Investing activities. Net cash used in investing activities increased from 2003 to 2004 primarily due to a reduction in proceeds from asset disposals year over year, including those of facilities designated as discontinued operations.
Financing activities. Net cash used in financing activities increased from 2003 to 2004 primarily due to consent fees paid in connection with all of our debt issues covered by the consent solicitations discussed in Item 1,Business, and Note 8,Long-term Debt, to our accompanying consolidated financial statements.
Current Liquidity and Capital Resources
As of December 31, 2005, we had approximately $175.5 million inCash and cash equivalents. This amount excludes approximately $242.5 million in restricted cash, which is cash we cannot use because of various obligations we have under lending agreements, partnership agreements, and other arrangements, primarily related to our captive insurance company. We also had approximately $23.8 million of marketable securities classified as available-for-sale.
On March 10, 2006, we completed the last of a series of recapitalization transactions (the “Recapitalization Transactions”) enabling us to prepay substantially all of our prior indebtedness and replace it with approximately $3 billion of new long-term debt. Although we remain highly leveraged, we believe these Recapitalization Transactions have eliminated significant uncertainty regarding our capital structure and have improved our financial condition in several important ways:
| | • | | Reduced refinancing risk—The terms governing our prior indebtedness would have required us to refinance approximately $2.7 billion between 2006 and 2009, assuming all noteholders holding options to require us to repurchase their notes in 2007 and 2009 were to exercise those options. Under the terms governing our new indebtedness, we have minimal maturities until 2013 when our new term loans come due. The extension of our debt maturities has substantially reduced the risk and uncertainty associated with our near-term refinancing obligations under our prior debt. |
| | • | | Improved operational flexibility—We have negotiated new loan covenants with higher leverage ratios and lower interest coverage ratios. In addition, our new loan agreements increase our ability to enter into certain transactions (e.g. acquisitions and sale-leaseback transactions). |
| | • | | Increased liquidity—As a result of the Recapitalization Transactions, our revolving line of credit has increased by approximately $150 million. In addition, the increased flexibility provided by the covenants governing our new indebtedness will allow us greater access to our revolving credit facility than we had under our prior indebtedness. |
| | • | | Improved credit profile—By issuing $400 million in convertible perpetual preferred stock and using the net proceeds from that offering to repay a portion of our outstanding indebtedness and to pay fees and expenses related to such prepayment, we were able to reduce the amount we ultimately borrowed under the interim loan agreement. Accordingly, we have improved our capital structure. In addition, by increasing the ratio of our secured debt to unsecured debt, our capital structure is now closer to industry norms. Further, a substantial amount of our new indebtedness is prepayable without penalty, which will enable us to reduce debt and interest expense as operating and non-operating cash flows allow without the substantial cost associated with the prepayment of our prior public indebtedness. |
| | • | | Reduced interest rate exposure—By completing the Recapitalization Transactions we have taken advantage of current interest rates, which are relatively low compared to historical rates, and eliminated the need to refinance our debt over the next four years in what we perceive to be a rising interest-rate environment. In addition, we have entered into an interest rate swap to reduce our variable rate debt exposure. |
The Recapitalization Transactions included (1) entering into credit facilities that provide for extensions of credit of up to $2.55 billion of senior secured financing, (2) entering into an interim loan agreement that provides us with $1.0 billion of senior unsecured financing, (3) completing a $400 million offering of convertible perpetual preferred stock, (4) completing cash tender offers to purchase $2.03 billion of our previously outstanding senior notes and $319 million of our previously outstanding senior subordinated notes and consent solicitations with respect to proposed amendments to the indentures governing each outstanding series of notes, and (5) prepaying and terminating our Senior Subordinated Credit Agreement, our Amended and Restated Credit Agreement, and our Term Loan Agreement. In order to complete the Recapitalization Transactions, we also entered into amendments, waivers, and consents to our prior senior secured credit facility, $200 million senior unsecured term loan agreement, and $355 million senior subordinated credit agreement. Detailed descriptions of each of the above transactions are contained in Item 1,Business, “Recapitalization Transactions,” and Note 8,Long-term Debt, to our accompanying consolidated financial statements.
As a result of the Recapitalization Transactions, we recorded an approximate $361 million net loss on early extinguishment of debt in the first quarter of 2006.
40
We used a portion of the proceeds of the loans under the new senior secured credit facilities, the proceeds of the interim loans, and the proceeds of the $400 million offering of convertible perpetual preferred stock, along with cash on hand, to prepay substantially all of our prior indebtedness and to pay fees and expenses related to such prepayment and the Recapitalization Transactions. The remainder of the proceeds and availability under the senior secured credit facilities are expected to be used for general corporate purposes. In addition, the letters of credit issued under the revolving letter of credit subfacility and the synthetic letter of credit facility will be used in the ordinary course of business to secure workers’ compensation and other insurance coverages and for general corporate purposes. We anticipate refinancing the $1 billion interim loans in the second quarter or third quarter of 2006 through an issuance of high-yield debt securities.
The face value of our long-term debt (excluding notes payable to banks and others, noncompete agreements, and capital lease obligations) before and after the Recapitalization Transactions is summarized in the following table:
| | | | | | |
| | | As of
December 31, 2005 | | As of
March 10, 2006 |
| | | (In Thousands) |
Revolving credit facility | | $ | — | | $ | 50,000 |
Term loans | | | 513,425 | | | 3,050,000 |
Bonds payable | | | 2,720,907 | | | 80,101 |
| | | | | | |
| | $ | 3,234,332 | | $ | 3,180,101 |
| | | | | | |
41
The following charts show our scheduled payments on long-term debt (excluding notes payable to banks and others, noncompete agreements, and capital lease obligations) for the next five years and thereafter before and after the Recapitalization Transactions. The charts also exclude the convertible perpetual preferred stock.
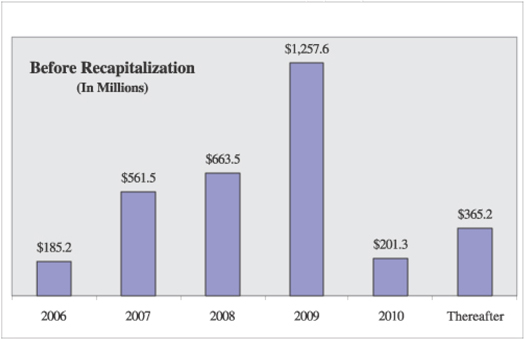
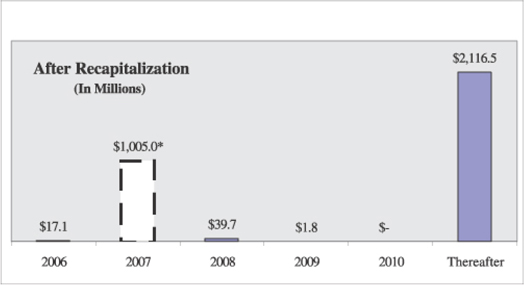
| * | Interim Loan Agreement maturity, which is subject to automatic extension |
42
As noted above, we have negotiated new debt covenants as part of the Recapitalization Transactions. These covenants include higher leverage ratios and lower interest coverage ratios. The following chart shows a comparison of these two restrictive covenants as of March 31, 2006 under our former Amended and Restated Credit Agreement and our new Credit Agreement:
| | | | |
| | | Required Ratios at March 31, 2006 |
| | | New Credit
Agreement | | Former
Amended and
Restated Credit
Agreement |
Minimum interest coverage ratio | | 1.65 to 1.00 | | 2.00 to 1.00 |
Maximum leverage ratio | | 7.25 to 1.00 | | 5.50 to 1.00 |
2005 Financial Restructuring
On March 21, 2005, we amended and restated our 2002 Credit Agreement as follows:
| | • | | The balance of $315 million outstanding under the 2002 Credit Agreement when it was frozen in March 2003 was converted to a term loan. The Term Loan bore interest, at our option, at a rate of (1) LIBOR, adjusted for statutory reserve requirements (“Adjusted LIBOR”), plus 2.50% or (2) 1.50% plus the higher of (a) the Federal Funds Rate plus 0.50% or (b) JPMorgan’s prime rate. |
| | • | | We obtained a $250 million revolving credit facility (the “Revolving Facility”). As of December 31, 2005, no money was drawn on the Revolving Facility. Until we filed our 2004 audited consolidated financial statements with the SEC, the Revolving Facility accrued interest at our option, at a rate of (1) Adjusted LIBOR plus 2.75% or (2) 1.75% plus the higher of (a) the Federal Funds Rate plus 0.50% or (b) JPMorgan’s prime rate. After we filed our audited consolidated financial statements with the SEC for the fiscal year ended December 31, 2004, the interest rates and commitment fees on the Revolving Facility were determined based upon our ratio of (1) consolidated total indebtedness minus the amount by which the unrestricted cash and cash equivalents on such date exceed $50 million to (2) our adjusted consolidated EBITDA for the period of four consecutive fiscal quarters ending on or most recently prior to such date (the “Net Leverage Ratio”). During such period, the Revolving Facility bore interest, at our option, (1) at a rate of Adjusted LIBOR plus a spread ranging from 1.75% to 2.75%, depending on the Net Leverage Ratio or (2) at a rate of a spread ranging from 0.75% to 1.75%, depending on the Net Leverage Ratio, plus the higher of (a) the Federal Funds Rate plus 0.50% or (b) JPMorgan’s prime rate. |
| | • | | We obtained a $150 million letter of credit facility (the “LC Facility”). As of December 31, 2005, approximately $123.8 million of this facility was utilized. A letter of credit participation fee was payable to the Lenders under the LC Facility with respect to a particular commitment under the LC Facility on the aggregate face amount of the commitment outstanding there under upon the later of the termination of the particular commitment under the LC Facility and the date on which the Lenders letters of credit exposure for such commitment cease, in an amount at any time equal to the LIBOR interest rate spread applicable at such time to loans outstanding under the Revolving Facility. In addition, we paid, for our own account, (1) a fronting fee of 0.25% per annum on the aggregate face amount of the letters of credit outstanding under the LC Facility upon the later of the termination of the commitments under the LC Facility and the date on which the Lenders’ letters of credit exposure for such commitment cease, and (2) customary issuance and administration fees relating to the letters of credit. |
Until we filed our 2004 audited consolidated financial statements with the SEC, we were subject to commitment fees of 0.75% per annum on the daily amount of the unutilized commitments under the Revolving Facility and the LC Facility. After that filing, the commitment fees ranged between 0.50% and 0.75%, depending on the Net Leverage Ratio.
43
The Amended and Restated Credit Facility cured all defaults under our 2002 Credit Agreement. Beginning June 30, 2005, it contained affirmative and negative covenants, including a minimum interest expense coverage ratio of 1.75 to 1.00 and a maximum leverage ratio of 5.75 to 1.00 as of December 31, 2005. The required ratios changed over time. The Amended and Restated Credit Facility also contained restrictive covenants related to our use of proceeds from asset sales and ability to pay dividends. For more information regarding the Amended and Restated Credit Facility, see Note 8,Long-term Debt, to our accompanying consolidated financial statements.
On June 15, 2005, we closed a $200 million senior unsecured term loan facility, the net proceeds of which, together with available cash, were used to repay our $245 million 6.875% senior notes due June 15, 2005, and to pay fees and expenses related to the term loan facility. This transaction allowed us to reduce our overall level of outstanding indebtedness.
The facility, which was launched in late May 2005, was increased from $150 million to $200 million based on strong investor demand.
The term loan facility bore interest, at our option, at a rate of (1) Adjusted LIBOR plus 5.0% or (2) 4.0% per year plus the higher of (a) JPMorgan’s prime rate and (b) the Federal Funds Rate plus 0.5%. The term loan facility would have matured on June 15, 2010.
The term loan facility contained affirmative and negative covenants and default and acceleration provisions. In addition, we were responsible for customary fees and expenses associated with the term loan facility.
Funding Commitments
After the above Recapitalization Transactions, we have scheduled payments of $34.0 million and $20.2 million in 2006 and 2007, respectively, related to long-term debt obligations (including notes payable to banks and others, noncompete agreements, and capital lease obligations; excluding the $1.0 billion interim loan agreement). For additional information about our long-term debt obligations, see Note 8,Long-term Debt, to our accompanying consolidated financial statements.
We also have funding commitments related to legal settlements. As a result of the Medicare Program Settlement discussed in Item 1,Business, we made principal payments of approximately $155 million to the United States during 2005. The remaining principal balance of $170 million will be paid in quarterly installments in 2006 and 2007. These amounts are exclusive of interest from November 4, 2004 at an annual rate of 4.125%. In addition to the Medicare Program Settlement, we reached an agreement with the SEC to resolve claims brought by the SEC against us in March 2003. As a result of the SEC Settlement, we made a $12.5 million payment to the SEC in October 2005. We will make payments of $37.5 million and $50.0 million in 2006 and 2007, respectively.
During 2005, we made capital expenditures of approximately $94 million, of which approximately $14 million related to the Digital Hospital. Total amounts budgeted for capital expenditures for 2006 approximate $147 million. These expenditures include IT initiatives, new business opportunities, and equipment upgrades and purchases. Approximately 50% of this budgeted amount is discretionary and could be revised, if necessary.
For a discussion of risk factors related to our business and our industry, please see Item 1A,Risk Factors.
Off-Balance Sheet Arrangements
In accordance with the definition under SEC rules, the following qualify as off–balance sheet arrangements:
| | • | | any obligation under certain guarantees or contracts; |
44
| | • | | a retained or contingent interest in assets transferred to an unconsolidated entity or similar entity or similar arrangement that serves as credit, liquidity or market risk support to that entity for such assets; |
| | • | | any obligation under certain derivative instruments; and |
| | • | | any obligation under a material variable interest held by the registrant in an unconsolidated entity that provides financing, liquidity, market risk or credit risk support to the registrant, or engages in leasing, hedging or research and development services with the registrant. |
The following discussion addresses each of the above items for our company.
On December 31, 2005, we were liable for guarantees of indebtedness owed by third parties in the amount of $30.8 million. We have recognized that amount as a liability as of December 31, 2005 because of existing defaults by the third parties under those guarantees.
We are also secondarily liable for certain lease obligations associated with sold facilities. As of December 31, 2005, we had entered into four sublease guarantee arrangements. The remaining terms of these subleases range from one year to nine years. If we were required to perform under all such guarantees, our maximum exposure approximates $11.6 million. We have not recorded a contingent liability for these guarantees, as we do not believe it is probable that we will be required to perform under these guarantees. In the event we are required to perform under these guarantees, we could potentially have recourse against the sublessee for recovery of any amounts paid. For additional information regarding these guarantees, see Note 5,Property and Equipment, to our accompanying consolidated financial statements.
As of December 31, 2005, we were not directly liable for the debt of any unconsolidated entity, and we do not have any retained or contingent interest in assets as defined above.
As of December 31, 2005, we do not hold any derivative financial instruments, as defined by FASB Statement No. 133,Accounting for Derivative Instruments and Hedging Activities, as amended. In March 2006, we entered into an interest rate swap related to our new Credit Agreement, as discussed in Note 8,Long-term Debt, to our accompanying consolidated financial statements.
As part of our ongoing business, we do not participate in transactions that generate relationships with unconsolidated entities or financial partnerships, such as entities often referred to as structured finance or special purpose entities (“SPEs”), which would have been established for the purpose of facilitating off-balance sheet arrangements or other contractually narrow or limited purposes. As of December 31, 2005 and 2004, we are not involved in any unconsolidated SPE transactions.
45
Contractual Obligations
Achieving optimal returns on cash often involves making long-term commitments. SEC regulations require that we present our contractual obligations, and we have done so in the table that follows. However, our future cash flow prospects cannot reasonably be assessed based on such obligations, as the most significant factor affecting our future cash flows is our ability to earn and collect cash from our patients and third-party payors. Future cash outflows, whether they are contractual obligations or not, will vary based on our future needs. While some such outflows are completely fixed (for example, commitments to repay principal and interest on fixed-rate borrowings), most will depend on future events (for example, a facility has a lease for property that includes a base rent amount and an additional amount as a percentage of net operating revenues). Further, normal operations involve significant expenditures that are not based on “commitments.” Examples of such expenditures include amounts paid for income taxes or for salaries and benefits.
Our consolidated contractual obligations as of December 31, 2005, are as follows:
| | | | | | | | | | | | | | | | |
| | | Total | | 2006 | | 2007 - 2008 | | 2009 - 2010 | | | 2011 and
Thereafter |
| | | (In Thousands) |
Long-term debt obligations: | | | | | | | | | | | | | | | | |
Long-term debt, excluding revolving credit facility and capital lease obligations(a)(b) | | $ | 3,212,741 | | $ | 13,747 | | $ | 36,213 | | $ | (2,721 | ) | | $ | 3,165,502 |
Revolving credit facility | | | — | | | — | | | — | | | — | | | | — |
Interest on long-term debt(b)(c) | | | 1,382,384 | | | 277,089 | | | 376,363 | | | 350,975 | | | | 377,957 |
Capital lease obligations(d) | | | 268,689 | | | 33,559 | | | 60,650 | | | 54,884 | | | | 119,596 |
Operating lease obligations(e)(f)(g) | | | 492,254 | | | 104,200 | | | 150,840 | | | 85,859 | | | | 151,355 |
Purchase obligations(g)(h) | | | 129,466 | | | 61,185 | | | 41,129 | | | 3,662 | | | | 23,490 |
Other long-term liabilities: | | | | | | | | | | | | | | | | |
Government settlements, including interest when applicable | | | 265,548 | | | 126,524 | | | 139,024 | | | — | | | | — |
Other liabilities(i) | | | 5,435 | | | 1,927 | | | 444 | | | 444 | | | | 2,620 |
| (a) | Included in long-term debt are amounts owed on our bonds payable, notes payable to banks and others, and noncompete agreements. These borrowings are further explained in Note 8,Long-term Debt, of the notes to our accompanying consolidated financial statements. In 2009 and 2010, amortization of debt discounts exceed long-term debt obligations. |
| (b) | Amounts included in this chart are based on our long-term indebtedness as of December 31, 2005. On March 10, 2006, we prepaid substantially all of our previously existing debt with proceeds from a series of recapitalization transactions and replaced it with approximately $3 billion of new long-term debt. Accordingly, these amounts have been adjusted to reflect the effect of the recapitalization transactions. See Note 8,Long-term Debt, of the notes to our accompanying consolidated financial statements. |
| (c) | Interest on our fixed rate debt is presented using the stated interest rate. Interest expense on our variable rate debt is estimated using the rate in effect as of December 31, 2005. Interest related to capital lease obligations is excluded from this line. Amounts exclude amortization of debt discount, amortization of loans fees, or fees for lines of credit that would be included in interest expense in our consolidated statements of operations. |
| (d) | Amounts include interest portion of future minimum capital lease payments. |
| (e) | We lease many of our facilities as well as other property and equipment under operating leases in the normal course of business. Some of our facility leases require percentage rentals on patient revenues above specified minimums and contain escalation clauses. The minimum lease payments do not include contingent rental expense. Some lease agreements provide us with the option to renew the lease or purchase the leased property. Our future operating lease obligations would change if we exercised these renewal options and if we entered into additional operating lease agreements. For more information, see Note 5,Property and Equipment, of the notes to our accompanying consolidated financial statements. |
46
| (f) | Lease obligations for facility closures are included in operating leases. |
| (g) | Future operating lease obligations and purchase obligations are not recognized in our consolidated balance sheet. |
| (h) | Purchase obligations include agreements to purchase goods or services that are enforceable and legally binding on HealthSouth and that specify all significant terms, including: fixed or minimum quantities to be purchased; fixed, minimum or variable price provisions; and the approximate timing of the transaction. Purchase obligations exclude agreements that are cancelable without penalty. Approximately $36.1 million of the amounts included in this line represent commitments on the Digital Hospital. Commitments related to the Digital Hospital are currently under negotiation with various parties and may be less than the amounts reflected in the chart above. |
| (i) | Because their future cash outflows are uncertain, the following non-current liabilities are excluded from the table above: medical malpractice and workers’ compensation risks, deferred income taxes, and our estimated liability for unsettled litigation. For more information, see Note 1,Summary of Significant Accounting Policies,“Self-Insured Risk,” Note 18,Income Taxes, and Note 24,Contingencies and Other Commitments, of the notes to our accompanying consolidated financial statements. |
Indemnifications
In the ordinary course of business, HealthSouth enters into contractual arrangements under which HealthSouth may agree to indemnify the third party to such arrangement from any losses incurred relating to the services they perform on behalf of HealthSouth or for losses arising from certain events as defined within the particular contract, which may include, for example, litigation or claims relating to past performance. Such indemnification obligations may not be subject to maximum loss clauses. Historically, payments made related to these indemnifications have not been material.
Critical Accounting Policies
Our discussion and analysis of our results of operations and liquidity and capital resources are based on our consolidated financial statements which have been prepared in accordance with generally accepted accounting principles (“GAAP”) in the United States. In connection with the preparation of our consolidated financial statements, we are required to make assumptions and estimates about future events, and apply judgment that affects the reported amounts of assets, liabilities, revenue, expenses, and the related disclosures. We base our assumptions, estimates and judgments on historical experience, current trends and other factors we believe to be relevant at the time we prepared our consolidated financial statements. On a regular basis, we review the accounting policies, assumptions, estimates and judgments to ensure that our consolidated financial statements are presented fairly and in accordance with GAAP. However, because future events and their effects cannot be determined with certainty, actual results could differ from our assumptions and estimates, and such differences could be material.
47
Our significant accounting policies are discussed in Note 1,Summary of Significant Accounting Policies, to our accompanying consolidated financial statements. We believe the following accounting policies are the most critical to aid in fully understanding and evaluating our reported financial results, as they require management’s most difficult, subjective or complex judgments, resulting from the need to make estimates about the effect of matters that are inherently uncertain. We have reviewed these critical accounting policies and related disclosures with the Audit Committee of our board of directors.
| | | | |
Description | | Judgments and Uncertainties | | Effect if Actual Results Differ
from Assumptions |
| Revenue recognition | | | | |
| | |
| We recognize net patient service revenues in the reporting period in which we perform the service based on our current billing rates (i.e., gross charges), less actual adjustments and estimated discounts for contractual allowances (principally for patients covered by Medicare, Medicaid and managed care and other health plans). | | We record gross service charges in our accounting records on an accrual basis using our established rates for the type of service provided to the patient. We recognize an estimated contractual allowance to reduce gross patient charges receivable to an amount we estimate we will actually realize for the service rendered based upon previously agreed to rates with a payor. Payors include federal and state agencies, including Medicare and Medicaid, managed care health plans, commercial insurance companies, employers, and patients. Management does not expect our contractual allowance, as a percentage of revenues, to decline from 2005 levels during 2006, based upon the revenues and trends at December 31, 2005. Laws and regulations governing the Medicare and Medicaid programs are complex and subject to interpretation. Management continually reviews the contractual estimation process to consider and incorporate updates to laws and regulations and the frequent changes in managed care contractual terms that result from contract renegotiations and renewals. | | If actual results are not consistent with our assumptions and judgments, we may be exposed to gains or losses that could be material. Due to complexities involved in determining amounts ultimately due under reimbursement arrangements with third-party payors, which are often subject to interpretation, we may receive reimbursement for health care services authorized and provided that is different from our estimates, and such difference could be material. |
48
| | | | |
Description | | Judgments and Uncertainties | | Effect if Actual Results Differ
from Assumptions |
| Allowance for doubtful accounts | | | | |
| | |
| We provide for an allowance against accounts receivable that could become uncollectible by establishing an allowance to reduce the carrying value of such receivables to their estimated net realizable value. | | The collection of outstanding receivables from Medicare, managed care payors, other third-party payors and patients is our primary source of cash and is critical to our operating performance. The primary collection risks relate to patient accounts for which the primary insurance carrier has paid the amounts covered by the applicable agreement, but patient responsibility amounts (deductibles and copayments) remain outstanding. The provision for doubtful accounts and the allowance for doubtful accounts relate primarily to amounts due directly from patients. We estimate this allowance based on the aging of our accounts receivable, our historical collection experience by facility and type of payor, and other relevant factors. Our practice is to write-down self-pay accounts receivable, including accounts related to the co-payments and deductibles due from patients with insurance, to their estimated net realizable value. Management does not expect the provision for doubtful accounts, as a percentage of revenues, to decline from 2005 levels during 2006, based upon the revenues and trends at December 31, 2005. | | If actual results are not consistent with our assumptions and judgments, we may be exposed to gains or losses that could be material. Adverse changes in general economic conditions, business office operations, payor mix, or trends in federal or state governmental and private employer health care coverage could affect our collection of accounts receivable, cash flows and results of operations. |
49
| | | | |
Description | | Judgments and Uncertainties | | Effect if Actual Results Differ
from Assumptions |
| Consolidation | | | | |
| | |
As of December 31, 2005, we had investments in approximately 317 partially owned subsidiaries, of which approximately 306 are general or limited partnerships, limited liability companies, or joint ventures in which HealthSouth or one of our subsidiaries is a general or limited partner, managing member, or venturer, as applicable. We generally have a leadership role in these facilities through a significant voting and economic interest and a contract to manage each facility’s operations, but the degree of control we have varies from facility to facility. We evaluate partially owned subsidiaries and joint-ventures held in partnership form in accordance with the provisions of American Institute of Certified Public Accountants (“AICPA”) Statement of Position (“SOP”) 78-9:Accounting for Investments in Real Estate Ventures, and Emerging Issues Task Force (“EITF”) Issue No. 98-6, “Investor’s Accounting for an Investment in a Limited Partnership When the Investor Is the Sole General Partner and the Limited Partners Have Certain Approval or Veto Rights,” to determine whether the rights held by other investors constitute “important rights” as defined therein. For general partners of all new limited partnerships formed and for existing limited partnerships for which the partnership agreements were modified on or subsequent to June 29, 2005, we evaluate partially owned subsidiaries and joint ventures held in partnership form using the guidance in EITF Issue No. 04-5, “Investor’s Accounting for an Investment in a Limited Partnership | | Our determination of the appropriate consolidation method to follow with respect to our investments in subsidiaries and affiliates is based on the amount of control we have, combined with our ownership level, in the underlying entity. Judgment is often required when determining the level of control or amount of influence we have over these entities. Our consolidated financial statements include our accounts, the accounts of our wholly owned subsidiaries, and other subsidiaries over which we have control. Our investments in subsidiaries in which we have the ability to exercise significant influence over operating and financial policies, but do not control (including subsidiaries where we have less than 20% ownership) are accounted for on the equity method. All of our other investments are accounted for on the cost method. | | Accounting for an investment as consolidated versus equity method generally has no impact on our net loss or shareholders’ deficit in any accounting period, but does impact individual statement of operations and balance sheet balances, as consolidation effectively grosses up our statement of operations and balance sheet. However, if control or influence aspects of an equity method investment were different, it could result in us being required to account for an investment by consolidation or using the cost method. Under the cost method, the investor does not record its share of income or losses of the investee until it receives dividends or distributions from the investee. Conversely, under either consolidation or equity method accounting, the investor effectively records its share of the underlying entity’s net income or loss based on its ownership percentage. At December 31, 2005, $1.9 million of our total investment in unconsolidated affiliates of $46.4 million relates to investments that are accounted for using the cost method and the remaining $44.5 million represents investments in unconsolidated affiliates accounted for using the equity method. |
50
| | | | |
Description | | Judgments and Uncertainties | | Effect if Actual Results Differ
from Assumptions |
When the Investor Is the Sole General Partner and the Limited Partners Have Certain Rights,” which includes a framework for evaluating whether a general partner or a group of general partners controls a limited partnership and therefore should consolidate it. The framework includes the presumption that general-partner control would be overcome only when the limited partners have certain rights. Such rights include kick-out rights and participating rights. For partially owned subsidiaries or joint ventures held in corporate form, we consider the guidance of FASB Statement No. 94,Consolidation of All Majority-Owned Subsidiaries, and EITF Issue No. 96-16: “Investor’s Accounting for an Investee When the Investor Has a Majority of the Voting Interest but the Minority Shareholder or Shareholders Have Certain Approval or Veto Rights,” and, in particular, whether rights held by other investors would be viewed as “participating rights” as defined therein. To the extent that any minority investor has important rights in a partnership or participating rights in a corporation that inhibit our ability to control, including substantive veto rights, we generally will not consolidate the entity. We also consider the guidance in FASB Interpretation No. 46 (Revised),Consolidation of Variable Interest Entities. As of December 31, 2005, we do not have any arrangements or relationships where FASB Interpretation No. 46(R) is applicable. | | | | |
51
| | | | |
Description | | Judgments and Uncertainties | | Effect if Actual Results Differ from Assumptions |
| Self-Insured Risk | | | | |
| | |
We are self-insured for certain losses related to professional and comprehensive general liability risks, workers’ compensation, and certain construction risks. Although we obtain third-party insurance coverage to limit our exposure to these claims, a substantial portion of our professional liability and workers’ compensation risks are insured through a wholly owned insurance subsidiary. Obligations covered by reinsurance contracts remain on the balance sheet as the subsidiary remains liable to the extent that reinsurers do not meet their obligations. Our reserves and provisions for professional liability and workers’ compensation risks are based upon actuarially determined estimates calculated by third-party actuaries. The actuaries consider a number of factors, including historical claims experience, exposure data, loss development, and geography. Periodically, management reviews its assumptions and the valuations provided by third-party actuaries to determine the adequacy of our self-insured liabilities. Changes to the estimated reserve amounts are included in current operating results. All reserves are undiscounted. | | Our self-insured liabilities contain uncertainties because management must make assumptions and apply judgment to estimate the ultimate cost to settle reported claims and claims incurred but not reported as of the balance sheet date. The reserves for professional liability risks cover approximately 2,000 individual claims as of December 31, 2005 and estimates for potential unreported claims. The time period required to resolve these claims can vary depending upon the jurisdiction and whether the claim is settled or litigated. The estimation of the timing of payments beyond a year can vary significantly. | | Due to the considerable variability that is inherent in such estimates, there can be no assurance that the ultimate liability will not exceed management’s estimates. If actual results are not consistent with our assumptions and judgments, we may be exposed to gains or losses that could be material. |
52
| | | | |
Description | | Judgments and Uncertainties | | Effect if Actual Results Differ from Assumptions |
| Long-lived assets | | | | |
| | |
Long-lived assets, such as property and equipment, are reviewed for impairment when events or changes in circumstances indicate that the carrying value of the assets contained in our financial statements may not be recoverable. When evaluating long-lived assets for potential impairment, we first compare the carrying value of the asset to the asset’s estimated future cash flows (undiscounted and without interest charges). If the estimated future cash flows are less than the carrying value of the asset, we calculate an impairment loss. The impairment loss calculation compares the carrying value of the asset to the asset’s estimated fair value, which may be based on estimated future cash flows (discounted and with interest charges). We recognize an impairment loss if the amount of the asset’s carrying value exceeds the asset’s estimated fair value. If we recognize an impairment loss, the adjusted carrying amount of the asset will be its new cost basis. For a depreciable long-lived asset, the new cost basis will be depreciated over the remaining useful life of that asset. Restoration of a previously recognized impairment loss is prohibited. | | Our impairment loss calculations require management to apply judgment in estimating future cash flows and asset fair values, including forecasting useful lives of the assets and selecting the discount rate that represents the risk inherent in future cash flows. | | Using the impairment review methodology described herein, we recorded long-lived asset impairment charges of $45.2 million during the year ended December 31, 2005. If actual results are not consistent with our assumptions and judgments used in estimating future cash flows and asset fair values, we may be exposed to additional impairment losses that could be material to our results of operations. |
53
| | | | |
Description | | Judgments and Uncertainties | | Effect if Actual Results Differ from Assumptions |
| Goodwill and Intangible Assets | | | | |
| | |
Goodwill represents the excess of the purchase price over the fair value of the net assets of acquired companies. We follow the guidance in FASB Statement No. 142,Goodwill and Intangible Assets, and test goodwill for impairment using a fair value approach, at thereporting unit level. We are required to test for impairment at least annually, absent some triggering event that would accelerate an impairment assessment. On an ongoing basis, absent any impairment indicators, we perform our goodwill impairment testing as of October 1st of each year. Our intangible assets consist of acquired certificates of need, licenses, noncompete agreements, and management agreements. We amortize these assets ranging from 5 to 30 years. As of December 31, 2005, we do not have any intangible assets with indefinite useful lives. We continue to review the carrying values of amortizable intangible assets whenever facts and circumstances change in a manner that indicates their carrying values may not be recoverable. | | We determine the fair value of our reporting units using valuation techniques that include discounted cash flow and market multiple analyses. These types of analyses require us to make assumptions and estimates regarding industry economic factors and the profitability of future business strategies. | | We performed our annual testing for goodwill impairment as of October 1, 2005, using the methodology described herein, and determined that no goodwill impairment existed in any of our segments. If actual results are not consistent with our assumptions and estimates, we may be exposed to additional goodwill impairment charges. The carrying value of goodwill as of December 31, 2005 was approximately $911.4 million. |
54
| | | | |
Description | | Judgments and Uncertainties | | Effect if Actual Results Differ from Assumptions |
| Income Taxes | | | | |
| | |
We account for income taxes using the asset and liability method. Under the asset and liability method, deferred tax assets and liabilities are recognized for the estimated future tax consequences attributable to differences between the financial statement carrying amounts of existing assets and liabilities and their respective tax bases. In addition, deferred tax assets are also recorded with respect to net operating losses and other tax attribute carryforwards. Deferred tax assets and liabilities are measured using enacted tax rates in effect for the year in which those temporary differences are expected to be recovered or settled. Valuation allowances are established when realization of the benefit of deferred tax assets is not deemed to be more likely than not. The effect on deferred tax assets and liabilities of a change in tax rates is recognized in income in the period that includes the enactment date. Contingent tax liabilities must be accounted for separately from deferred tax assets and liabilities. FASB Statement No. 5,Accounting for Contingencies, is the governing standard for contingent liabilities. It must be probable that a contingent tax benefit will be sustained before the contingent benefit is recognized for financial reporting purposes. | | The ultimate recovery of certain of our deferred tax assets is dependent on the amount and timing of taxable income that we will ultimately generate in the future and other factors. A high degree of judgment is required to determine the extent that valuation allowances should be provided against deferred tax assets. We have provided valuation allowances at December 31, 2005 aggregating $879 million against such assets based on our current assessment of future operating results and other factors. We believe that we have previously overpaid federal and state income taxes during the reconstruction period. The estimate of this overpayment amount is included inIncome tax refund receivable. In determining taxes receivable, we evaluated the potential exposures associated with various filing positions and our documentation requirements. We computed reserves for probable exposures. Such positions and substantiation matters may come under review during the audit and/or amended return process. We are currently under audit of our federal consolidated income tax returns for the years 1996 through 1998 and fully expect to have all open years included within this audit in the near future. We will prepare amended federal and state income tax returns for the years 1996 through 2004, making all appropriate restatement and other adjustments, in order to obtain refunds for overpaid income taxes. Upon filing amended federal and state income tax returns, the tax authorities will conduct a detailed review of the adjustments. The actual amount of the refunds will not be finally determined until all of the applicable taxing authorities have completed their review. | | Although management believes that the estimates and judgments discussed herein are reasonable, actual results could differ, and we may be exposed to gains or losses that could be material. As of December 31, 2005, theIncome tax refund receivable was approximately $241 million. This receivable is net of approximately $93 million in tentative refunds previously received by us through 2005 and includes our estimate of applicable interest and penalties. To the extent that either the federal or state taxing authorities disagree with our presentation of amended taxable income during the reconstruction period, this receivable may be overstated resulting in additional current tax expense and/or the requirement that some or all of the previous refunds be repaid. |
55
| | | | |
Description | | Judgments and Uncertainties | | Effect if Actual Results Differ from Assumptions |
| Assessment of Loss Contingencies | | | | |
| | |
| We have legal and other contingencies that could result in significant losses upon the ultimate resolution of such contingencies. | | We have provided for losses in situations where we have concluded that it is probable that a loss has been or will be incurred and the amount of the loss is reasonably estimable. A significant amount of judgment is involved in determining whether a loss is probable and reasonably estimable due to the uncertainty involved in determining the likelihood of future events and estimating the financial statement impact of such events. | | If further developments or resolution of a contingent matter are not consistent with our assumptions and judgments, we may need to recognize a significant charge in a future period related to an existing contingent matter. |
Recent Accounting Pronouncements
In December 2004, the FASB issued FASB Statement No. 123(Revised 2004),Share-Based Payment, which revises FASB Statement No. 123 and supersedes Accounting Principles Board (“APB”) Opinion No. 25,Accounting for Stock Issued to Employees, and its related implementation guidance. The revised Statement focuses primarily on accounting for transactions in which a company obtains employee services in share-based payment transactions. FASB Statement No. 123(R) eliminates the alternative of applying the intrinsic value measurement provisions of APB Opinion No. 25 to stock compensation awards issued to employees. Rather, the new standard requires a company to measure the cost of employee services received in exchange for an award of equity instruments based on the grant-date fair value of the award. A company will recognize the cost over the period during which an employee is required to provide services in exchange for the award, known as the requisite service period (usually the vesting period).
In March 2005, the Staff of the SEC issued Staff Accounting Bulletin (“SAB”) No. 107,Share-Based Payment.SAB No. 107 expresses the view of the SEC staff regarding the interaction between FASB Statement No. 123(R) and certain SEC rules and regulations and provides the SEC staff’s views regarding the valuation of share-based payment arrangements for public companies. The SEC staff believes the guidance in SAB No. 107 will assist public companies in their initial implementation of FASB Statement No. 123(R) and enhance the information received by investors and other users of financial statements, thereby assisting them in making investment and other decisions. SAB No. 107 also includes interpretive guidance related to share-based payment transactions with nonemployees, the transition from nonpublic to public entity status, valuation methods (including the determination of assumptions such as expected volatility and expected term), the accounting for certain redeemable financial instruments issued under share-based payment arrangements, the classification of compensation expense, non-GAAP financial measures, first-time adoption of FASB Statement No. 123(R) in an interim period, capitalization of compensation cost related to share-based payment arrangements, the accounting for income tax effects of share-based payment arrangements upon adoption of FASB Statement No. 123(R), the modification of employee share options prior to adoption of FASB Statement No. 123(R), and disclosures in Management’s Discussion and Analysis subsequent to adoption of FASB Statement No. 123(R). FASB Statement No. 123(R) is effective for annual periods beginning after June 15, 2005. Its expected impact on our results of operations is discussed below.
56
FASB Statement No. 123(R) requires the use of the Modified Prospective Application Method at the required effective date. Under this method, FASB Statement No. 123(R) is applied to new awards and to awards modified, repurchased, or cancelled after the effective date. Additionally, we will recognize compensation cost for the portion of awards for which the requisite service date has not been rendered (such as unvested options) that are outstanding as of the date of adoption as the remaining requisite services are rendered. We will base the compensation cost relating to unvested awards at the date of adoption on the grant-date fair value of those awards as calculated for pro forma disclosures under the original FASB Statement No. 123. In addition, a company may use the Modified Retrospective Application Method prior to the required effective date. A company may apply this method to all prior years for which the original FASB Statement No. 123 was effective or only to prior interim periods in the year of initial adoption. If a company uses the Modified Retrospective Application Method, it will adjust the financial statements for prior periods to give effect to the fair-value-based method of accounting for awards on a consistent basis with the pro forma disclosures required for those periods under the original FASB Statement No. 123.
We will adopt FASB Statement No. 123(R) on January 1, 2006 on a modified prospective basis, which will require recognition of compensation expense for all stock option or other equity-based awards that vest or become exercisable after the effective date. At December 31, 2005, unamortized compensation expense related to outstanding unvested options, as determined in accordance with FASB Statement No. 123(R), that we expect to record during 2006, 2007, and 2008 was approximately $9.1 million, $5.7 million, and $1.2 million, respectively, before provisions for income taxes and forfeitures. We will incur additional expense during fiscal 2006 related to new awards granted during 2006 that cannot yet be quantified. We are in the process of determining how the guidance regarding valuing share-based compensation as prescribed in FASB Statement No. 123(R) will be applied to valuing share-based awards granted after the effective date and the impact that the recognition of compensation expense related to such awards will have on our financial statements.
We do not believe any other recently issued, but not yet effective, accounting standards will have a material effect on HealthSouth’s consolidated financial position, results of operations, or cash flows.
For additional information regarding recent accounting pronouncements, please see Note 1,Summary of Significant Accounting Policies, to our accompanying consolidated financial statements.
Business Outlook
We were forced to devote a significant portion of our time and attention in 2005 to matters primarily outside the ordinary course of business, and those efforts have continued in 2006, although to a much lesser extent. At the same time, we expect to continue to experience volume volatility, payor pressure, and increased competition in our markets. Accordingly, we anticipate that our operating results will show a decline between 2005 and 2006 based on various factors.
| | • | | Inpatient. In 2006, our inpatient division will continue to experience declining volumes as we move all of our facilities to the 60% minimum qualifying patient mix threshold under the 75% Rule. The division will also be negatively impacted by unit price reductions resulting from IRF-PPS changes that became effective October 1, 2005. To combat these issues, we will continue to aggressively attempt to mitigate the impact of the 75% Rule by managing our expenses, focusing our marketing efforts on compliant cases, and developing new post-acute services and other services that are complementary to our IRFs. In addition, we will strive to standardize our labor and supply practices. Within the post-acute care environment, we believe the continued implementation of the 75% Rule will pose a challenge for our competitors. As a result, we believe some of our competitors may choose to exit this industry. We will monitor this situation and look for consolidation opportunities that we believe fit our long-range strategic plan. |
| | • | | Surgery Centers. In 2006, our focus within the surgery centers division will be on increasing volume growth and continuing the resyndication activity we began in 2005. We expect to see margin expansion through labor and supply cost management initiatives, including the standardization of non-physician preference items. We will also begin to explore growth opportunities through acquisition of existing centers and development of new centers, although we do not expect such growth opportunities to be a significant part of our 2006 results of operations for this division. |
57
| | • | | Outpatient. We expect our facility rationalization and marketing initiatives within our outpatient division will begin to improve results in 2006. However, as discussed in Item 1,Business, “Sources of Revenues,” we anticipate the annual per-beneficiary limitations on outpatient therapy services will have a negative impact on net operating revenues in this division. The extent of that impact will depend on both the administration of the medical necessity exception process by CMS and the response of possible deferral of therapy treatment by patients subject to the therapy caps. |
| | • | | Diagnostic. We expect new reimbursement rates for imaging services to negatively impact the financial performance of our diagnostic division in 2006. To mitigate the impact of these lower rates on our margins, we will focus our attention on the standardization of labor and supply costs across our facilities. We will also attempt to increase scan volumes by expanding our relationships with new referral sources and installing new equipment at select facilities. In addition, we will seek to improve operating efficiencies through the implementation of new claims software in 2006; however, given our anticipated implementation schedule, we do not expect to see the full benefit of this software conversion until 2007. |
| | • | | Corporate and Other. In 2006, we will strive to control costs associated with our corporate and other division, but this may prove difficult due to our continued investment in our infrastructure (both people and technology). We will continue to focus on the remediation of internal controls, including the implementation of our information technology strategic plan. We will continue to replace the work performed by external consultants during the reconstruction period with HealthSouth employees, and we will continue to add resources to provide the necessary level of support to our facilities and meet our operational needs. In addition, our recapitalization transactions completed in March 2006 will result in significant amounts being expensed in 2006 for consent fees and tender costs incurred in connection therewith and the write-off of financing fees attributable to prior financing transactions. See this Item, “Liquidity and Capital Resources,” for additional information. |
Although we will be unable to offset inflationary costs with price increases, we do expect to be able to partially offset such costs through operational improvements. As we have previously disclosed, however, we expect our 2006 Consolidated Adjusted EBITDA to decline substantially from 2005 for two primary reasons. First, our 2005 Consolidated Adjusted EBITDA includes a one-time payment of $37.9 million from Meadowbrook (included asAmounts due from Meadowbrook in our 2005 income statement data contained in Item 6,Selected Financial Data). Second, our 2005 Consolidated Adjusted EBITDA includes the impact of reduced unit pricing at our IRFs for one quarter only, since the recent IRF-PPS changes did not take effect until October 1, 2005, and our 2006 results will reflect the negative impact of IRF-PPS on our unit pricing for all quarters. As discussed in Item 1,Business, “Sources of Revenues,” we estimate that this pricing change will reduce our inpatient division’sNet operating revenues by approximately $30 million in 2006 as compared to 2005.
In addition to lower unit pricing in our inpatient division, the 75% Rule continues to create operational challenges for us. Based on recent industry data, we believe the impact of the 75% Rule on the inpatient rehabilitation industry will be significantly greater than CMS estimated when the rule was promulgated. However, Congress has approved a one-year extension of the phase-in period for the 75% Rule and delayed implementation of the 65% compliance threshold until July 1, 2007. In addition, we believe that we are doing better than the industry as a whole in mitigating the effects of the 75% Rule. We anticipate year-over-year growth in our inpatient division from 2006 to 2007 largely because of the suspension of the 75% Rule at the 60% threshold, and again once the 75% Rule is fully implemented and the division is re-based to maximize admission of higher acuity compliant cases. In addition, we believe continued phase-in of the 75% Rule will cause certain competitors to exit the market which will create consolidation opportunities for us.
While we expect our 2006 operating results will be consistent with the fact that HealthSouth is still in a turnaround period, we are optimistic about the long-term positioning of HealthSouth. We continue to offer high quality services in growing segments of the health care industry which should provide long-term growth opportunities. In addition, we are stabilizing operations in our three ambulatory divisions (surgery centers, outpatient, and diagnostic) by focusing on volume growth, expense control through benchmarking and supply chain management, and various revenue enhancement activities. We are also looking to grow in targeted areas as development and consolidation opportunities arise. We believe we will see the results of these initiatives in late 2006 and into subsequent years.
58
Whatever market conditions we face, we will continue to seek opportunities to improve operations, stabilize our finances, and develop new facilities and post-acute services, with the ultimate goal of providing sustainable growth and return for our stockholders.
59