
Business Update
December 13, 2005

Forward-Looking Statements
The information contained in this presentation includes certain estimates and other forward-
looking information that reflect our current views with respect to future events and financial
performance
These estimates and other forward-looking information are based on assumptions that
HealthSouth believes, as of the date hereof, are reasonable. Inevitably, there will be differences
between such estimates and actual results, and those differences may be material to
HealthSouth
There can be no assurance that any estimates or forward-looking information will be realized
All such estimates and forward-looking information speak only as of the date hereof.
HealthSouth undertakes no duty to publicly update or revise the information contained herein
You are cautioned not to place undue reliance on the estimates and other forward-looking
information in this presentation as they are based on current expectations and general
assumptions and are subject to various risks, uncertainties and other factors, many of which are
beyond our control, that may cause actual results to differ materially from the views, beliefs and
estimates expressed herein

Forward-Looking Statements (cont.)
Some factors that may affect the accuracy of such forward-looking statements are as follows:
Regulatory changes, including the implementation of the 75% Rule and the recently-
adopted rule updating the IRF-PPS for federal fiscal year 2006
Resolution of outstanding litigation, including certain class action litigation alleging
violations under federal securities laws and certain qui tam actions
Our ability to successfully refinance our existing public indebtedness as it becomes due
Changes, delays in or suspension of reimbursement by payors
Completion of the investigations by the United States Department of Justice
Competitive pressures
General conditions in the economy and capital markets
Completion of the reconstruction of our financial records

References may be made to information relating to periods up to and including
December 31, 2004 and information relating to periods after December 31, 2004
Information relating to periods up to and including December 31, 2004 is taken from
the financial statements contained in our 2004 Form 10-K, which have been audited
Information relating to periods after December 31, 2004 is unaudited and remains
subject to change based upon the ongoing efforts to reconstruct our accounting
records. Actual results may differ materially from the results presented herein for
those periods
Cautionary Statements Regarding
Presentation

Cautionary Statements Regarding
Presentation (cont’d)
Amounts shown for periods after December 31, 2004 were prepared on a basis
consistent with amounts shown for periods up to and including December 31, 2004,
with the following exceptions. Amounts shown for periods after December 31, 2004:
Exclude “Restructuring Charges” unless otherwise noted, even though such
charges may be of a recurring nature
Exclude the results of the discontinued operations
Do not include charges relating to the impairment of assets, if any
May differ materially from the results presented herein for those periods
following the completion of our reconstruction process

The financial data contained herein includes non-GAAP financial measures, including “Adjusted
EBITDA,” to assist in assessing projected and actual operating performance and to facilitate
quantification of planned business activities
As used by HealthSouth, “Adjusted EBITDA” is consistent with the definition of Adjusted
Consolidated EBITDA in our Amended and Restated Credit Agreement dated as of March 21,
2005. In general terms, this definition allows us to add back to EBITDA charges of the type
classified as “Restructuring Charges” on or prior to June 30, 2005. These charges are generally
not consistent with the definition of restructuring charges as defined under GAAP
Costs which we classify as “Restructuring Charges” are: professional fees associated with
litigation including the class action and shareholder derivative litigation, financial restructuring,
government investigations, forensic accounting, creditor advisors, accounting reconstruction,
audit and tax work associated with the reconstruction process, and the implementation of
Sarbanes-Oxley §404 and non-ordinary course charges incurred after March 19, 2003 and
related to the company’s overall corporate restructuring
Under the Amended and Restated Credit Agreement, we are permitted to continue to add back
to EBITDA professional fees associated with the class-action and shareholder derivative
litigation after June 30, 2005
Notes Regarding Presentation of Non-
GAAP Financial Measures

Adjusted EBITDA may be useful to stakeholders because it is commonly used as an analytical
indicator within the healthcare industry to measure leverage capacity and debt service ability.
While it may be useful to measure debt service capacity, it should not be considered as a
measure of financial performance under GAAP
Because HealthSouth currently does not have a balance sheet or other financial statements for
any period after December 31, 2004, we are currently unable to reconcile non-GAAP financial
measures for such periods to a financial measure calculated in accordance with GAAP. In
addition, once our reconstruction process is completed for periods after December 31, 2004,
changes could occur in the results indicated for such periods
Notes Regarding Presentation of Non-
GAAP Financial Measures (cont’d)

There are a number of disclaimers and other cautionary statements set forth in the filings we
have made with the Securities and Exchange Commission. We urge you to carefully review
those statements, particularly those contained in our 2004 Form 10-K, which was filed on
December 2, 2005; however, we highlight the following:
We are highly leveraged and our substantial indebtedness may limit cash flow available
for our operations and could impair our ability to service our debt or obtain additional
financing
We derive a substantial portion of our net operating revenues from the Medicare and
Medicaid programs and our operating results could be adversely affected by changes in
laws or regulations governing these programs, as evidenced by the recent promulgation
of the 75% Rule and the updated IRF-PPS for federal fiscal year 2006
HealthSouth, as well as certain of its past and present officers and directors, is also
subject to a number of class action, derivative and individual lawsuits relating to, among
other things, allegations of violations of federal securities laws
We are in the process of reconstructing our accounting records for periods after
December 31, 2004
Considerations Involving Our Current
Situation

Agenda
I.
Opening Remarks
Jay Grinney
II.
Operations Update
Mike Snow
III.
Filing Timeline
John Workman
IV.
2004 Form 10-K
John Workman
V.
Liquidity
John Workman
VI.
Closing Remarks
Jay Grinney
VII.
Questions & Answers

I. Opening Remarks
3Q 2005 Results(a)
(dollars in millions)
(a) Amounts are unaudited, before Restructuring Charges, impairments and subject to restatement
(b) HealthSouth collected $37.9 million in August 2005 of amounts deemed uncollectible in 2001 and 2002
(c) Budget revised to remove discontinued operations; primarily in Outpatient & Corp/Other
3Q 2005
3Q Year-to-Date
Actual
Budget
(c)
Actual
Budget
(c)
Net Revenue
$828.8
$915.4
$2,626.2
$2,748.5
Expenses:
Personnel Costs
378.3
422.9
1,176.8
1,251.9
Cost of Sales
76.3
87.7
256.1
262.3
Other
219.2
230.5
678.2
690.1
Recovery of Advances
(b)
(37.9)
-
(37.9)
-
Depreciation and Amortization
49.8
43.2
151.4
129.4
Minority Interest
19.5
23.5
66.9
73.6
Operating Earnings
$123.7
$107.6
$334.6
$341.3
Adjusted EBITDA
$173.5
$150.7
$486.1
$470.6
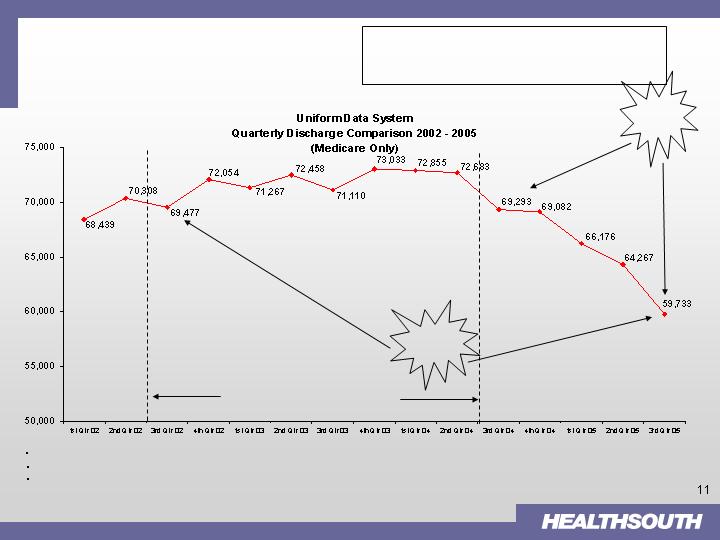
Percentages reflect variance from corresponding prior year quarter
Data derived from facilities reporting discharges in each quarter (603). Data represents approximately 64% of Medicare IRF discharges
This summary information was provided by UDSmr, for the benefit of the rehabilitation field, and is used with prior written permission of UDSmr
Updated November 29, 2005
IRF
Discharges
-14.0%
3Q 2002 vs.
3Q 2005
-13.8%
3Q 2004 vs.
3Q 2005
Suspension of Enforcement of 75% Rule
75% Rule Update
Moran Report: 52,000 Medicare beneficiaries
affected in 2005

Clinical Differences of Post-Acute Care Settings
75% Rule Update
Characteristic
IRF
SNF
1.
Attending physician visits
2-3 times/week
At least every 30 days
2.
Multi-disciplinary team approach;
Required
Not required
Coordinated Program of Care
3.
MD or DO designated as Rehabilitation
Required
Not required
Director
4.
RN oversight and availability
24 hours/day
At least 8 consecutive
hours/day
5.
Nursing hours per pt-day
5.0 – 7.5
2.5 – 4.0
6.
Nursing training, expertise
Rehabilitation
None
specialty expertise
7.
PT, OT, and/or Speech Therapy
3 hours/day
No minimum
level of service
(minimum)

Advocacy
Participating with coalition to implement meaningful 75% Rule reform
We support S.1932 which would maintain the Rule at the 50%
threshold until July 2007
During this time, research should be conducted to provide clinical data
from which policy decisions can be made
$2.5 million JOINTS study with National Rehabilitation Hospital and
the Institute for Clinical Outcomes Research
Compares outcomes for 2,800 IRF and SNF patients nationally
Additional research re: suitability of refining 75% Rule to include
other patient conditions
75% Rule Update

Agenda
I.
Opening Remarks
Jay Grinney
II.
Operations Update
Mike Snow
III.
Filing Timeline
John Workman
IV.
2004 Form 10-K
John Workman
V.
Liquidity
John Workman
VI.
Closing Remarks
Jay Grinney
VII.
Questions & Answers

Volume decline primarily due to 75% Rule
Some general acute weakness in certain markets
EBITDA impact of hurricanes ~ $1.4 million
28 bed LTCH in New Orleans remains closed
Total compliant cases up 5% vs. 3Q 2004
All facilities meeting compliance thresholds
11 facilities advanced to 60% in 3Q 2005
Lewin Group analysis corroborated HS pricing impact
(a) 2005 amounts are before restructuring, impairment, corporate overhead and subject to restatement
(b) Based upon results from 3Q 2005, corporate overhead is approximately 4.3% of revenue excluding D&A & one-time gain/loss
Operating Statistics
Financial Overview (in millions)
Highlights
Division President: Mark Tarr
3.1%
1.27
1.31
Medicare Case Mix Index
4.2%
$14,427
$15,036
IP Rev/ Discharge
(12.9%)
545,066
474,498
SS OP Visits
(9.6%)
30,013
27,144
SS IP Discharges
Change
3Q 2004
3Q 2005
%
II. Operations Update – Inpatient
3Q 2005
3Q 2005
Actual
(a)
Budget
Net Revenue
$471.2
$517.0
Personnel costs
224.2
249.5
Cost of sales
27.0
30.2
Other
90.1
99.1
Total operating
expenses
341.3
378.7
Depreciation and
amortization
15.0
11.2
Minority Interest
8.1
10.6
Operating Earnings
Before Corp. OH
$106.9
$116.5
Memo:
Corporate OH
(b)
$20.3
$19.2

II. Operations Update – Surgery
Division President: Joe Clark
Highlights
Financial Overview (in millions)
Operating Statistics
EBITDA impact of hurricanes ~ $0.8 million
33 re-syndications completed through 3Q 2005
Expect to achieve 2005 target for re-syndications
Re-syndication backlog substantially eliminated
Portfolio dispositions substantially complete by
12/31/05
Operational focus: volume, pricing labor and
supplies
(a) 2005 amounts are before restructuring, impairment, corporate overhead and subject to restatement
(b) Based upon results from 3Q 2005, corporate overhead is approximately 4.3% of revenue excluding D&A & one-time gain/loss
(3.8%)
$927
$962
Op. Exp./Case
5.3%
$1,144
$1,205
Rev/Case
(2.1%)
158,416
155,107
SS Cases
(7.9%)
178,366
164,356
Total Cases
Change
3Q 2004
3Q 2005
%
3Q 2005
3Q 2005
Actual
(a)
Budget
Net Revenue
$198.0
$207.8
Personnel costs
67.7
69.1
Cost of sales
44.3
46.4
Other
46.2
47.2
Total operating
expenses
158.2
162.8
Depreciation and
amortization
8.7
9.4
Minority Interest
10.3
10.9
Operating Earnings
Before Corp. OH
$20.9
$24.7
Memo:
Corporate OH
(b)
$8.5
$7.7

(a) 2005 amounts are before restructuring, impairment, corporate overhead and subject to restatement
(b) Based upon results from 3Q 2005, corporate overhead is approximately 4.3% of revenue excluding D&A & one-time gain/loss
(c) Budget revised to remove discontinued operations
5.2%
$91
$86
OP Exp/ Visit
2.3%
$98
$100
Rev/ Visit
(5.3%)
978,877
926,509
SS Visits
(15.4%)
1,115,432
943,506
Total Visits
Change
3Q 2004
3Q 2005
%
II. Operations Update – Outpatient
Division President: Diane Munson
Highlights
Financial Overview (in millions)
Operating Statistics
EBITDA impact of hurricanes ~ $0.4 million
Closed/consolidated 10 sites in 3Q 2004
Portfolio dispositions substantially complete by 12/31/05
Further consolidated back office billing/collection
Developed sales program and organization to focus
on growth opportunities
3Q 2005
3Q 2005
Actual
(a)
Budget
(c)
Net Revenue
$94.6
$107.4
Personnel costs
53.5
61.2
Cost of sales
0.8
1.2
Other
26.8
31.7
Total operating
expenses
81.1
94.1
Depreciation and
amortization
3.0
3.4
Minority Interest
(0.0)
0.1
Operating Earnings
Before Corp. OH
$10.5
$9.9
Memo:
Corporate OH
(b)
$4.1
$4.0

II. Operations Update – Diagnostic
Division President: Karen Davis
Highlights
Financial Overview (in millions)
Operating Statistics
(a) 2005 amounts are before restructuring, impairment, corporate overhead and subject to restatement
(b) Based upon results from 3Q 2005, corporate overhead is approximately 4.3% of revenue excluding D&A & one-time gain/loss
(1.6%)
$244
$248
Op. Exp./Scan
(4.3%)
$302
$289
Rev/Scan
(3.2%)
180,338
174,521
SS Scans
(5.1%)
184,129
174,650
Total Scans
Change
3Q 2004
3Q 2005
%
Hurricane impact ~ $0.7 million
Same store volume growth (1.3%) normalized for
impact of hurricanes
Centralization of collections causing increased
exposure in start-up phase
3Q 2005
3Q 2005
Actual
(a)
Budget
Net Revenue
$50.4
$56.1
Personnel costs
14.6
16.3
Cost of sales
2.6
3.0
Other
26.0
26.4
Total operating
expenses
43.2
45.7
Depreciation and
amortization
5.4
6.9
Minority Interest
0.9
1.4
Operating Earnings
Before Corp. OH
$0.9
$2.1
Memo:
Corporate OH
(b)
$2.2
$2.1

II. Operations Update – Corporate/Other
Financial Overview (in millions)
Highlights
D&A based on restated numbers
Transaction with UAB Health System for
purchase of HealthSouth Medical Center
proceeding; closing date has been delayed due
to regulatory issues
Digital Hospital disposition expected in 2006;
timing unclear due to regulatory issues
HealthSouth collected $37.9 million in August
2005 of amounts deemed uncollectible in 2001
and 2002
(a) Amounts are unaudited, before Restructuring Charges, impairments and subject to restatement
(b) HealthSouth collected $37.9 million in August 2005 of amounts deemed uncollectible in 2001 and 2002
(c) Budget revised to remove discontinued operations
3Q 2005
3Q 2005
Actual
(a)
Budget
(c)
Net Revenue
$14.6
$27.1
Personnel costs
18.2
26.8
Cost of sales
1.6
6.9
Other
30.2
26.2
Recovery of Advances
(b)
(37.9)
-
Total operating
expenses
12.1
59.9
Depreciation and
amortization
17.8
12.4
Minority Interest
0.3
0.5
Operating Earnings
($15.5)
($45.6)

Agenda
I.
Opening Remarks
Jay Grinney
II.
Operations Update
Mike Snow
III.
Filing Timeline
John Workman
IV.
2004 Form 10-K
John Workman
V.
Liquidity
John Workman
VI.
Closing Remarks
Jay Grinney
VII.
Questions & Answers

1Q 2006
2Q 2006
1Q 2007
2005 Form 10-K Filed
Access to 144A Debt Mkts
Access to Public Mkts
Completed
2004 Form 10-K Filed
Completed
Comprehensive 2000-2003 Form
10-K Filed
III. Filing Timeline

Agenda
I.
Opening Remarks
Jay Grinney
II.
Operations Update
Mike Snow
III.
Filing Timeline
John Workman
IV.
2004 Form 10-K
John Workman
V.
Liquidity
John Workman
VI.
Closing Remarks
Jay Grinney
VII.
Questions & Answers

IV. 2004 Form 10-K
Operating Earnings
(dollars in millions)
Overall improvement from Surgery, Outpatient, Diagnostic, and
Corporate / Other; Inpatient remained flat
2004
2003
2002
Inpatient
$437
$437
$341
Surgery
$89
($54)
$109
Outpatient
$37
($51)
$16
Diagnostic
($10)
($36)
($28)
Corporate / Other
($406)
($513)
($598)
--------
--------
--------
$147
($217)
($160)

IV. 2004 Form 10-K (cont’d)
Consolidated Adjusted EBITDA
(dollars in millions)
Previously Reported in April Business Update
on "Consolidated" Basis
$631.9
As Reported in 2004 Form 10-K
Consolidated Adjusted EBITDA (p. 74)
$621.1
Out-of-Period Adjustments (p. 66)
$13.7
Amount Attributable to 2004
$634.8
Restructuring Costs
(dollars in millions)
Amount Estimated in December
$195.0
Business Update
Amount per 2004 Form 10-K
$206.0

IV. 2004 Form 10-K (cont’d)
Selected Balance Sheet Highlights
(dollars in millions)
2004
2003
Total Cash
$639
$615
Accounts Receivable
$452
$499
Property and Equipment
$1,405
$1,447
Income Tax Receivable
$264
$295
Goodwill, Intangibles
$976
$984
All Other
$347
$370
Total Assets
$4,083
$4,210
Payables
$171
$152
Accruals, Refunds
$316
$301
Due Government, Class Action
$419
$426
Insurance Reserves
$181
$165
Long-term Debt
$3,511
$3,521
All Other
$594
$609
Shareholders' Deficit
($1,109)
($964)
Total Liabilities
$4,083
$4,210

IV. 2004 Form 10-K (cont’d)
Selected Cash Flow Highlights
(dollars in millions)
From Operations
2004
2003
Form 10-K
$414
$557
Prof. Restructuring Fees
$206
$71
Before Prof. Restructuring Fees
$620
$628
Investing Activities
($206)
($60)
Financing Activities
($225)
($117)

Agenda
I.
Opening Remarks
Jay Grinney
II.
Operations Update
Mike Snow
III.
Filing Timeline
John Workman
IV.
2004 Form 10-K
John Workman
V.
Liquidity
John Workman
VI.
Closing Remarks
Jay Grinney
VII.
Questions & Answers

V. Liquidity
Interest payments were $34.1 million for 3Q 2005
CMS/DOJ - Civil settlement payments were $22.3 million for 3Q 2005
(a) Restricted cash includes non-consolidated partnership accounts, deposits related to captive insurance account and other risk
management deposits
$445.3
$358.2
Consolidated Cash
$248.3
$225.3
Restricted Cash(a)
$197.0
$132.9
Available Cash
September 30, 2005
June 30, 2005
(dollars in millions)

Agenda
I.
Opening Remarks
Jay Grinney
II.
Operations Update
Mike Snow
III.
Filing Timeline
John Workman
IV.
2004 Form 10-K
John Workman
V.
Liquidity
John Workman
VI.
Closing Remarks
Jay Grinney
VII.
Questions & Answers
Mitigate 75% Rule
Drive operational improvement in all BUs
(pricing, labor, supplies)
Bring O/P divisions to peer group
Reduce variability within all divisions
Focus on quality
Ramp-up business development
capabilities (IRF, ASC)
Pilot Home Health; refine LTCH
Establish appropriate internal control
environment
Evaluate Diagnostic Division inquiries
Expand into other post-acute
segments
LTCH
Home Health
Acquire or build IRFs in target markets
Develop new ASCs
Continue to drive operational
improvement
Re-evaluate expansion / market
opportunities in Outpatient and
Diagnostics
Establish appropriate internal control
environment
Expand into other post-acute
segments
Potential M&A
Acquire or build IRFs in target
markets
Develop new ASCs
Continue to drive operational
improvement
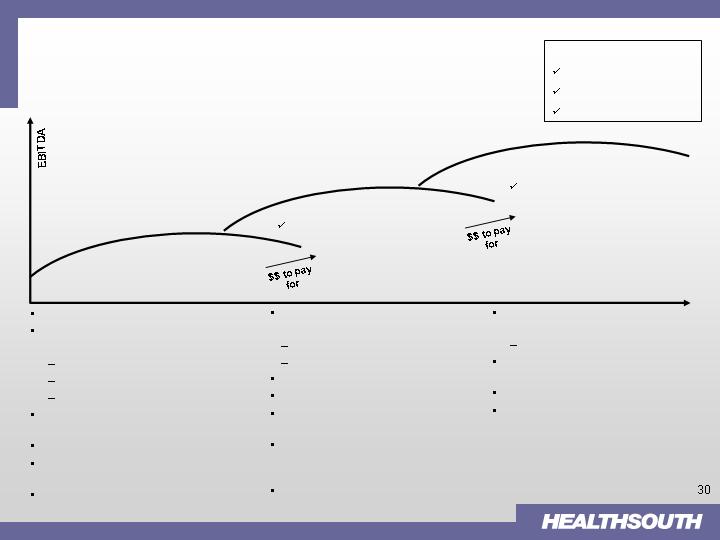
Phase 1:
0 to 24 months
Phase 2:
12 to 36 months
Phase 3
24 to 48 months
Operational focus
Operational and development focus
Pay down debt
Operational, development,
and new business focus
Pay down debt
Time
Strategic Horizons
Metrics
Volume growth (SS)
Margin expansion
Debt reduction
Strategic Plan – Summary

Agenda
I.
Opening Remarks
Jay Grinney
II.
Operations Update
Mike Snow
III.
Filing Timeline
John Workman
IV.
2004 Form 10-K
John Workman
V.
Liquidity
John Workman
VI.
Closing Remarks
Jay Grinney
VII.
Questions & Answers

Business Update