
Unlocking Value
Deutsche Bank
2006 High Yield Conference
October 4, 2006
Scottsdale, AZ

Forward-Looking Statements
The information contained in this presentation includes certain estimates, projections and other
forward-looking information that reflect our current views with respect to future events and
financial performance. These estimates, projections and other forward-looking information are
based on assumptions that HealthSouth believes, as of the date hereof, are reasonable. Inevitably,
there will be differences between such estimates and actual results, and those differences may be
material.
There can be no assurance that any estimates, projections or forward-looking information will be
realized.
All such estimates, projections and forward-looking information speak only as of the date hereof.
HealthSouth undertakes no duty to publicly update or revise the information contained herein.
You are cautioned not to place undue reliance on the estimates, projections and other forward-
looking information in this presentation as they are based on current expectations and general
assumptions and are subject to various risks, uncertainties and other factors, including those set
forth in our Form 10-Q for the periods ended March 30, 2006 & June 30, 2006, the Form 10-K for
the fiscal year ended December 31, 2005 and in other documents that we previously filed with the
SEC, many of which are beyond our control, that may cause actual results to differ materially from
the views, beliefs and estimates expressed herein.
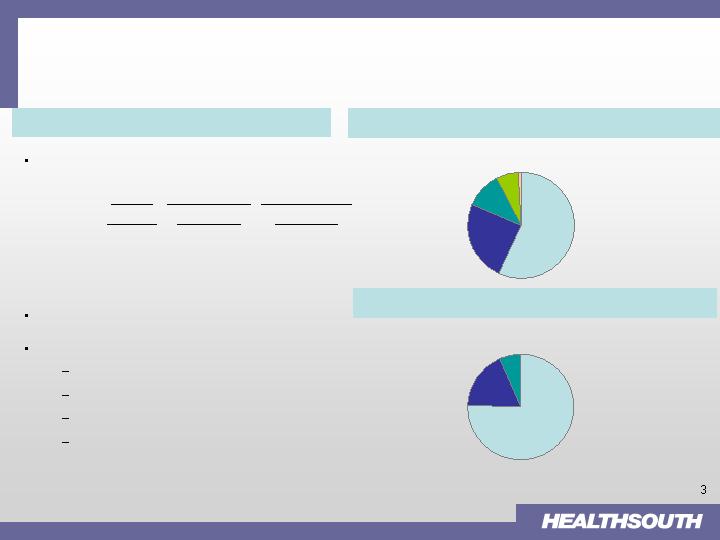
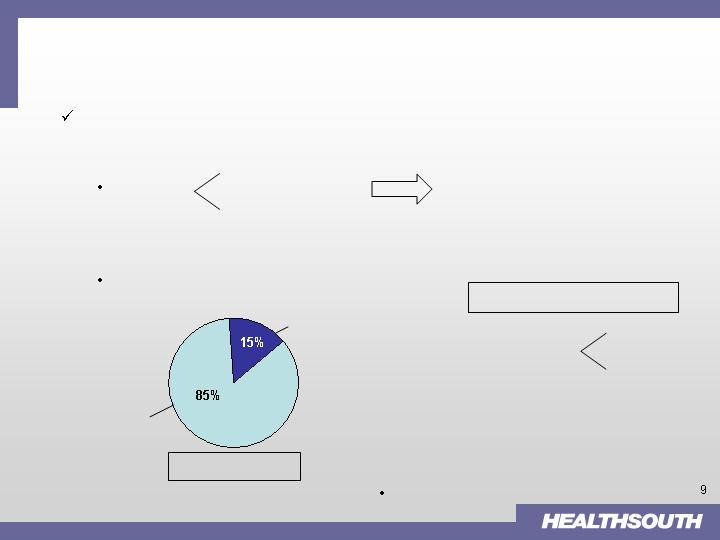
Diversified Healthcare Services Provider
The Company is a leader in each of its four major
operating divisions
Approximately 1,042 facilities in 45 states
YTD Performance (06/30/06)
Net Operating Revenues: $1.6 billion
Operating Earnings of $76.2 million
Adjusted Consolidated EBITDA: $272.3 million
Adjusted Consolidated EBITDA margin: 17.3%
Diagnostic
(6.2%)
Outpatient
6.9%
Surgery
19.2%
Inpatient
80.1%
National Provider of Healthcare Services
Diversified Business Portfolio (b) (c) : % of Net Operating Revenues
Other
0.9%
Inpatient
57.0%
Surgery
24.4%
Outpatient
11.1%
Diagnostic
6.6%
(a) Based on facility counts as of June 30, 2006.
(b) Percentages do not include Intersegment Revenues; operating earnings include
operating divisions only
(c) Six months ended June 30, 2006.
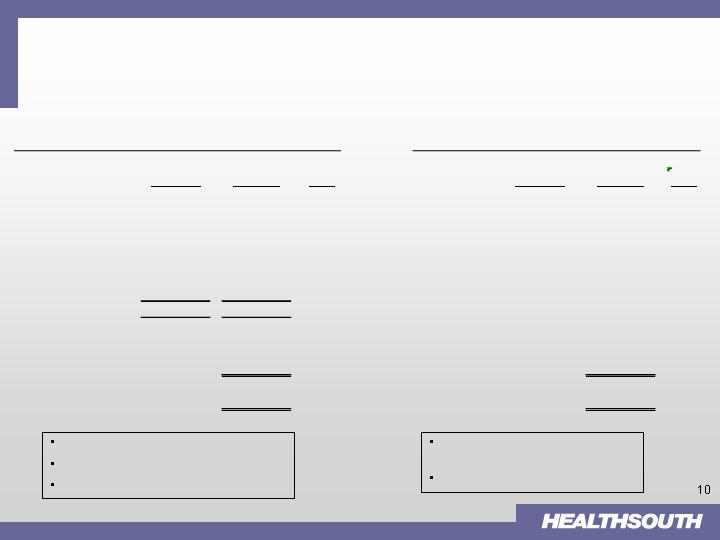
% of Operating Earnings (b) (c)
Market
YTD Net Rev.
YTD Op. Earn.
Share
(a)
(06/30/06)
(06/30/06)
Inpatient
#1
$899.9 M
$194.4 M
ASC
#1
$384.2 M
$46.6 M
Outpatient
#2
$175.2 M
$16.8 M
Diagnostic
#2
$104.1 M
($15.1 M)
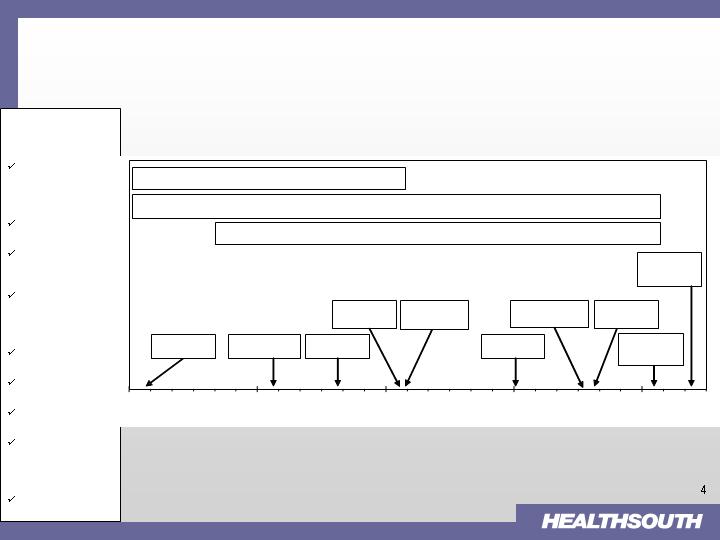
$2.7 billion fraud committed by previous management… 1,000,000 man-
hours and $1.0 billion incurred to reconstruct financial statements, settle
litigation and other matters related to “sins of the past”
Company’s Prior
History
Q3-02
SEC securities
trading investigation
Q1-03
DOJ criminal
investigation
SEC files lawsuit vs.
HealthSouth and prior
Management
Former Management
removed
Q2-03
DOJ civil
investigation
Line-of-Credit frozen;
default claimed
Payment blockage
by lenders
Bondholders deliver
notice of default
May-04
New Management
Team Begins
Accomplishments
June-04
December-04
June-05
December-05
June-06
New Board of Directors Recruited
Reached Medicare
Settlement
New Management Recruited
Completed $1B
Senior Notes
Offering
Announced
Strategic
Repositioning
Filed 2000 - 2003
Form 10K
Reached SEC
Settlement
Cured Bank
Defaults
Cured Bond
Defaults
Filed 2005
Form-10K
Filed 2004
Form 10-K
Refinanced Balance
Sheet $2.55B
Identified and Mitigated Massive Internal Control Weaknesses
Repositioning: Post-Acute; Focus: IRF
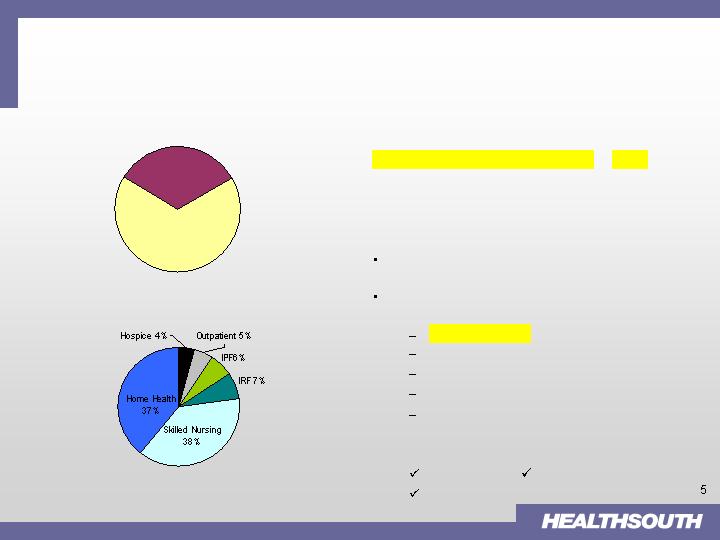
The Post-Acute Market is Sizeable and Remains Highly Fragmented
No Post Acute Care
67%
Post-Acute Usage After Hospital Discharge
Post-Acute Market (2004)
2004 Market Size: $126 B
Source: 2005 CMS, MedPAC and Wall Street research
Post Acute Care
33%
Post-Acute Growth Opportunity
Segment Projected Growth
Inpatient Rehab Facilities (IRF) 4-6%
Home Health 5-9%
Hospice 12-15%
Long Term Acute Care (LTCH) 10-15%
Skilled Nursing 4-6%
Approximately 1/3 of all hospital patients
require Post-Acute Care.
Top 3-5 players in each sector hold the
following market share:
<25% in IRFs
<10% in Home Health
<20% in Hospice
<20% in Skilled Nursing
~50% in LTCH
Non-core segments
Surgery Diagnostic
Outpatient
Notes:
1. Source: Annual Reports; Verispan data; management analysis
2. Typically a 15 – 30 bed wing / unit of an acute-care hospital
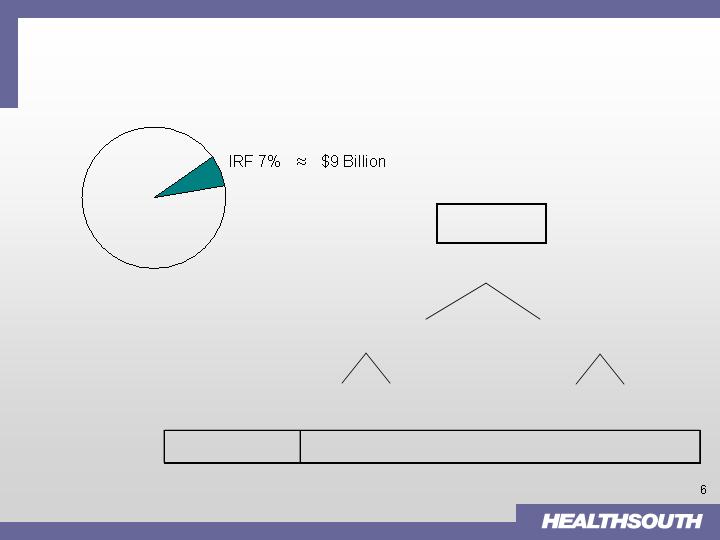
Post Acute Market
IRF Segment Profile
U. S. IRF
Market (
2004
)
(1)
1338 IRFs
Free-standing = 335 (25%)
In-hospital Unit
(2)
= 1003 (75%)
HLS
All Others
For-Profit
Not-for-Profit
Hospitals
Hospitals
Number of IRFs
93
242
266
737

Inpatient Division
(1) Number of IRF's & LTCH's Only
62%
5
SC
57%
5
AZ
52%
3
2
LA
47%
6
TN
41%
6
AL
36%
1
9
FL
26%
2
9
PA
15%
1
15
TX
LTCH
IRF
(1)
Cummulative %
(1)
State Concentrations
Payor Mix for the six months ended 6/30/2006
Threshold frozen at 60% for an additional year (07/01/07)
HealthSouth outperforms the market with compliant case
growth
Research underway; Symposium Q1 2007
Administrative “fix”; legislative remedy (1H 2007)
Rule creating consolidation opportunities for HealthSouth
Nation's largest provider of inpatient rehabilitation
services
202 locations (94 IRFs, 98 outpatient satellites)
10 LTCH facilities
YTD Performance (06/30/06)
Net Operating Revenues: $899.9 million
Operating Earnings: $194.4 million; Margin: 21.6%
Compliant Case Growth approximately 5.8%
75% Rule/ Reimbursement
104 Hospital Locations
Overview
HealthSouth Cost Reporting Year
June 30
Sept. 30
Dec. 30
May 30
9
1
67
16
Strong cash flow characteristics
Inpatient Division (cont’d)
Inpatient Division
($ in millions)
(1) Current overhead calculation of 4.25% of net operating revenue may not be comparable to stand alone entity
YTD 6/30/06
2005
Net Operating Revenues
$899.9
$1,810.4
Operating Earnings
194.4
393.0
Corporate OH (as a % of revenue)
(1)
(38.2)
(76.9)
Depreciation
32.4
66.4
Available Cash Before CAPEX & Debt Service
$188.6
$382.5
CAPEX (maintenance only)
(22.5)
(38.8)
Cash Available for Growth CAPEX
$166.1
$343.7
and Debt Service
Growth Opportunities
Post divestiture, HealthSouth’s growth will occur through organic and
development initiatives
2-3% Pricing
1-2% SS Volume
Development: Current IRF/LTCH pipeline:
~ 40+ projects
*After full implementation of 75% Rule
IRF
LTCH
IRF
1.
Consolidation
(Existing markets)
2.
De-novo (Existing or New markets)
3.
Acquisition (New markets)
LTCH (to supplement IRF presence)
J.V.
Acquire
Mid-to high-single digit
EBITDA growth
Development Strategies
Organic*
De-novo
Growth Potential – Illustrative Examples
(in thousands)
(1) % includes estimated corporate overhead of 4.25%
Higher Margin from Platform
Efficiency
Ramp-up Period though Strong IRR
Incremental EBITDA with No Investment
Capacity Rationalization
“Win - Win” Situation for Both Parties
Consolidation - Joint Venture
DeNovo - Proforma (40 Bed)
Revenue
EBITDA
%
(1)
Revenue
EBITDA
%
(1)
Stand Alone
10,000
2,000
16%
Year 1
8,500
1,275
11%
Joint Venture
14,000
3,200
19%
Year 2
10,500
2,500
20%
- Minority Interest
(640)
Run Rate
11,500
2,900
21%
After Consolidation
14,000
2,560
14%
Incremental
EBITDA
$560
Investment
$14,000
Investment
$0
5-year Annualized ROI
~ 18%

HealthSouth has emerged from a period of unprecedented
uncertainty and upheaval with a new Board, a new management
team, a new balance sheet and a new direction.
By divesting its non-core assets, the Company will be well-positioned
to become a “pure-play” post-acute provider and a consolidator in the
fragmented $126 B post-acute space
These divestures – along with the tax refund + derivative proceeds –
will significantly strengthen the company’s Balance Sheet through
deleveraging.
With our re-listing on NYSE (symbol: HLS) in late October, our
“rehabilitation” will be complete and we will begin a new chapter in the
history of HealthSouth.
Summary
Near Term
Longer-term
IRFs
LTCHs (supplemental to IRFs only)
Home Health
Hospice

Appendix
Non-GAAP Financial Reconciliations
A reconciliation of Adjusted Consolidated EBITDA to net cash used in operating
activities for the six months ended June 30, 2006 is as follows:
(In Thousands)
$ (50,564)
Net Cash Used in Operating Activities*
(122,046)
Change in assets and liabilities, net of acquisitions*
(56,213)
Change in government, class action and related settlements liability
(4,098)
Other operating cash used in discontinued operations
1,815
Net cash settlement on interest rate swap
(3,245)
Restructuring charges under FASB Statement No. 146
(10,865)
Current portion of income tax provision
(8,035)
Compensation expense under FASB Statement No. 123(R)
5,834
Stock-based compensation
57,217
Minority interest in earnings of consolidated affiliates
7,609
Distributions from nonconsolidated affiliates
(10,163)
Equity in net income of nonconsolidated affiliates
(1,953)
Gain on sale of investments, excluding marketable securities
(53)
Accretion of debt securities
2,201
Amortization of restricted stock
14,345
Amortization of debt issue costs, debt discounts and fees
(7,919)
Net gain on disposal of assets
52,585
Provision for doubtful accounts
8,377
Interest income
(168,228)
Interest expense and amortization of debt discounts and fees
(3,376)
Sarbanes-Oxley related costs
(76,632)
Professional fees – accounting, tax and legal
$ 272,279
Adjusted Consolidated EBITDA
Six Months Ended Jume 30,
2006
168,228
Interest expense and amortization of debt discounts and fees
10
Loss on sale of marketable securities
A reconciliation of net loss to Adjusted Consolidated EBITDA for the six
months ended June 30, 2006 is as follows:
(In Thousands)
$ 272,279
Adjusted Consolidated EBITDA
3,245
Restructuring activities under FASB Statement No. 146
3,376
Sarbanes-Oxley related costs
8,035
Compensation expense under FASB Statement No. 123(R)
75,851
Depreciation and amortization
5,814
Net non-cash loss on disposal of assets
3,860
Impairment charges
17,313
Government, class action and related settlements expense
76,632
Professional fees – accounting, tax and legal
365,642
Loss on early extinguishment of debt
(8,377)
Interest income
(14,789)
Gain on interest rate swap
27,019
Provision for income tax expense
17,994
Loss from discontinued operations
$ (477,574)
Net loss
Six Months Ended Jume 30,
2006
* See the Company's Form 10-Q for the period ended June 30, 2006 for a discussion of
changes in operating cash and assets and liabilities. The change during the six months
ended June 30, 2006 includes the payment of accrued interest on the Company's prior
indebtedness that was extinguished as part of the Company's recapitalization transactions
discussed in the Company's Form 10-Q for the period ended June 30, 2006.