
Unlocking Value
November 2006

Forward-Looking Statements
The information contained in this presentation includes certain estimates, projections and
other forward-looking information that reflect our current views with respect to future events
and financial performance. These estimates, projections and other forward-looking
information are based on assumptions that HealthSouth believes, as of the date hereof, are
reasonable. Inevitably, there will be differences between such estimates and actual results,
and those differences may be material.
There can be no assurance that any estimates, projections or forward-looking information will
be realized.
All such estimates, projections and forward-looking information speak only as of the date
hereof. HealthSouth undertakes no duty to publicly update or revise the information
contained herein.
You are cautioned not to place undue reliance on the estimates, projections and other
forward-looking information in this presentation as they are based on current expectations
and general assumptions and are subject to various risks, uncertainties and other factors,
including those set forth in our Form 10-Q for the periods ended March 30, 2006, June 30,
2006 & Sept. 30, 2006, the Form 10-K for the fiscal year ended December 31, 2005 and
current report on Form 8-K dated May 26, 2006 and in other documents that we previously
filed with the SEC, many of which are beyond our control, that may cause actual results to
differ materially from the views, beliefs and estimates expressed herein.
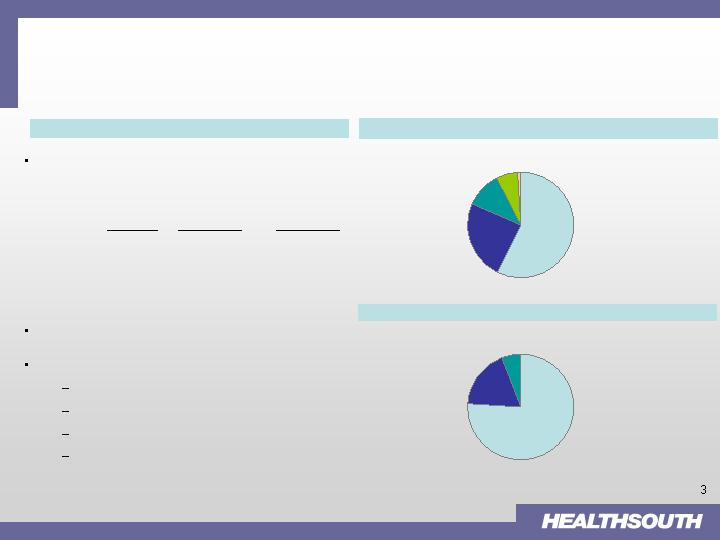
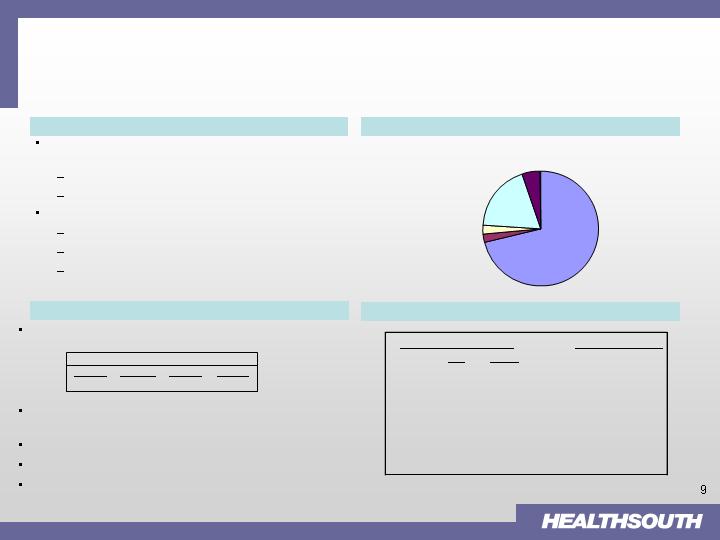
Diversified Healthcare Services Provider
The Company is a leader in each of its four major
operating divisions
Approximately 1,003 facilities in 45 states
YTD Performance (09/30/06)
Net Operating Revenues: $2.3 billion
Operating Earnings of $119.7 million
Adjusted Consolidated EBITDA: $411.8 million
Adjusted Consolidated EBITDA margin:
18.0%
Diagnostic
(6.9%)
Outpatient
6.3%
Surgery
19.7%
Inpatient
81.0%
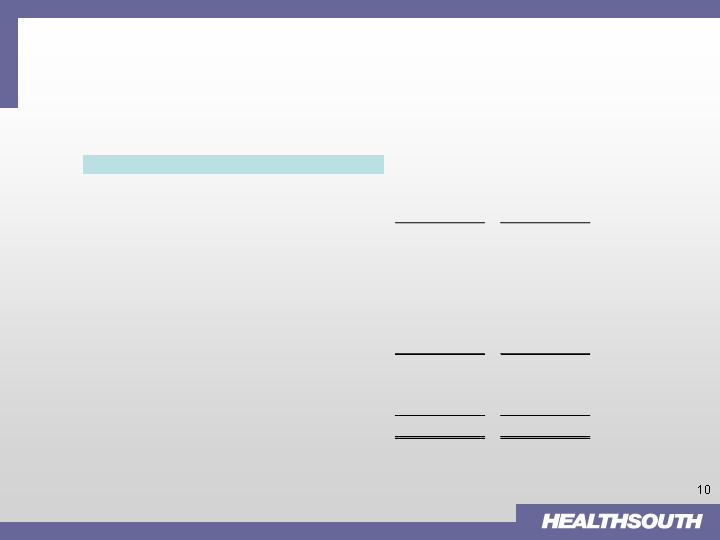
National Provider of Healthcare Services
Diversified Business Portfolio (b) (c) : % of Net Operating Revenues
Other
0.8%
Inpatient
57.1%
Surgery
24.3%
Outpatient
11.0%
Diagnostic
6.7%
(a) Based on facility counts as of Sept. 30, 2006.
(b) Percentages do not include Intersegment Revenues; operating earnings include operating
divisions only
(c) Nine months ended Sept. 30, 2006.
% of Operating Earnings (b) (c)
Market
YTD Net Rev.
YTD Op. Earn.
Share
(a)
(09/30/06)
(09/30/06)
Inpatient
#1
$1,303.3 M
$277.7 M
ASC
#1
$555.2 M
$67.5 M
Outpatient
#2
$251.4 M
$21.5 M
Diagnostic
#2
$153.6 M
($23.8 M)

Q3 2006 Earnings Call Re-cap
Consolidated
Net Operating Revenues of $731.2 million
Pre-tax loss from continuing operations of $68.3 million
$28.4 million provision for government, class action and related
settlements expense
$28.7 million loss on interest rate swap
Re-listed on NYSE on Thursday, October 26th
Divestiture Process
Extremely pleased with level of interest from potential bidders
Process on track; remain optimistic to announce transactions in early
2007

Q3 2006 Earnings Call Re-cap (cont’d)
Inpatient
Net Operating Revenues 3Q 2006 $420 million vs $440 million 3Q 2005
Acute-care weakness; 75% Rule; Pricing
Q3 Compliant Case growth approximately 4.9%
Post-acute strategy; several development milestones:
Closed market consolidation in Tucson; admissions in market up
24%
Broke ground on new 40-bed hospital in Fredericksburg, Virginia
Internal approval for new 50-bed IRF in Phoenix
Announcement of acquisition in Wichita Falls, Texas
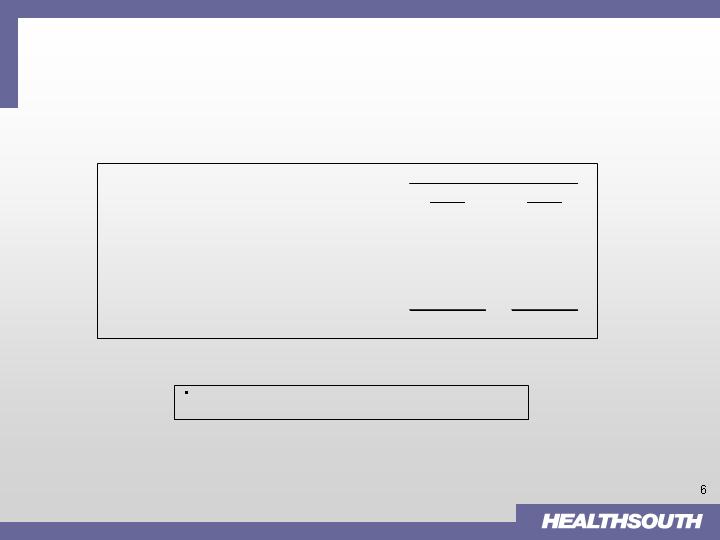
Q3 “Normalized” EBITDA(1)
Q3 2006 Earnings Call Re-cap (cont’d)
(1) Adjusted Consolidated EBITDA is a non-GAAP measure that we use to assess our operating performance;
See appendix for non-GAAP financial reconciliations
Shortfall in line from 75% Rule and CMS pricing
(pricing changes favorably as of October 1, 2006)
($ millions)
Q3
2006
2005
Adjusted Consolidated EBITDA per 10-Q
141.9
$
174.9
$
Non-recurring gains
(35.0)
(37.9)
Non-core Diagnostic
4.2
(5.4)
Inpatient - new system implementation
6.0
Adjusted EBITDA
117.1
$
131.6
$
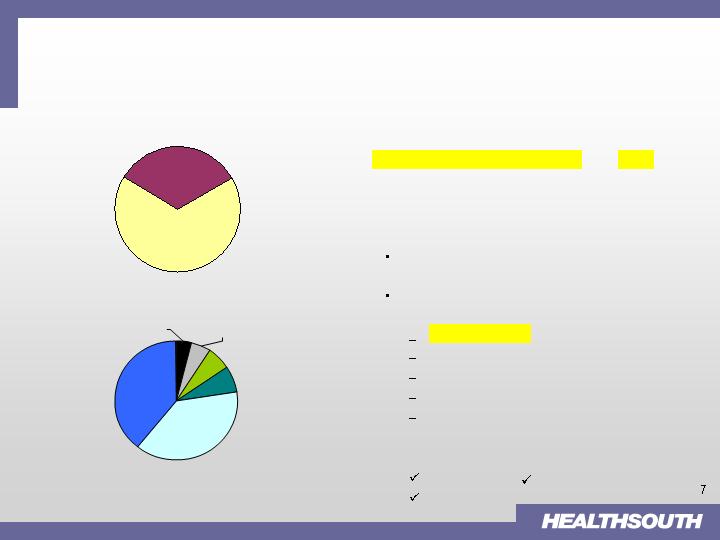
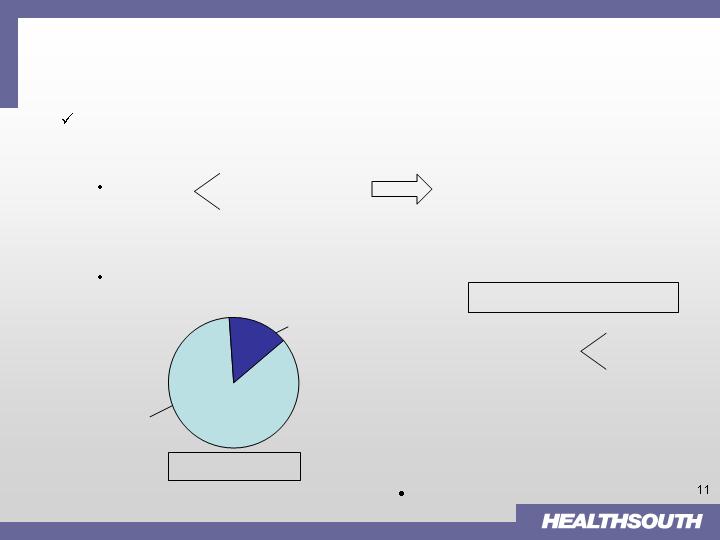
Repositioning: Post-Acute; Focus: IRFs
The Post-Acute Market is Sizeable and Remains Highly Fragmented
Post-Acute Usage After Hospital Discharge
Post-Acute Market (2004)
2004 Market Size: $126 B
Source: 2005 CMS, MedPAC and Wall Street research
Post Acute Care
33%
No Post Acute Care
67%
IRF 7%
Skilled Nursing
38%
Home Health
37%
IPF6%
Outpatient 5%
Hospice 4%
Approximately 1/3 of all hospital
patients require Post-Acute Care.
Top 3-5 players in each sector hold
the following market share:
Post-Acute Growth Opportunity
Segment
Projected Growth
Inpatient Rehab Facilities (IRFs)
4-6%
Home Health
5-9%
Hospice
12-15%
Long Term Acute Care (LTCH)
10-15%
Skilled Nursing
4-6%
<25% in IRFs
<10% in Home Health
<20% in Hospice
<20% in Skilled Nursing
~50% in LTCH
Non-core segments
Surgery
Diagnostic
Outpatient
Notes:
1. Source: Annual Reports; Verispan data; management analysis
2. Typically a 15 – 30 bed wing / unit of an acute-care hospital
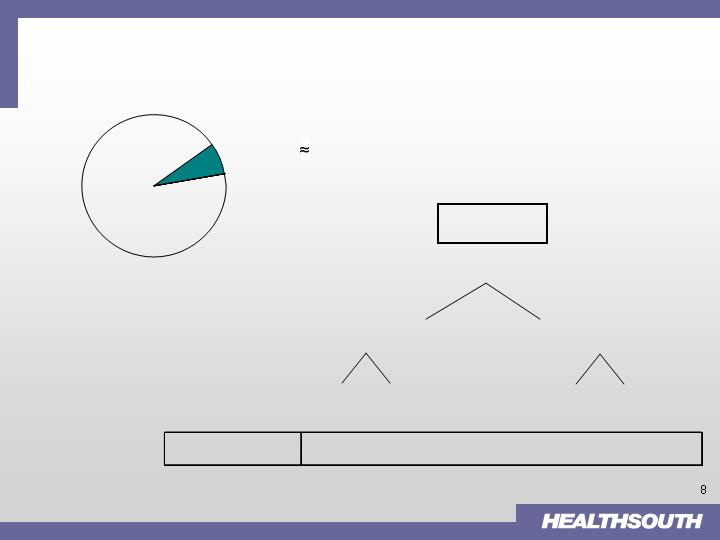
Post Acute Market
IRF Segment Profile
U. S. IRF
Market (
2004
)
(1)
1337 IRFs
Free-standing = 334 (25%)
In-hospital Unit
(2)
= 1003 (75%)
HLS
All Others
For-Profit
Not-for-Profit
Hospitals
Hospitals
Number of IRFs
92
242
266
737
IRF 7% $9 Billion
Inpatient Division
Managed Care
18.7%
Medicare
71.2%
Patients
0.2%
Other 3
rd
Party
5.1%
Medicaid
2.1%
Workers Comp
2.7%
16
66
1
9
May 31
Dec. 31
Sept. 30
June 30
HealthSouth Cost Reporting Year
Overview
102 Hospital Locations
75% Rule/ Reimbursement
Nation's largest provider of inpatient rehabilitation
services
193 locations (92 IRFs, 91 outpatient satellites)
10 LTCH facilities
YTD Performance (09/30/06)
Net Operating Revenues: $1,303.3 million
Operating Earnings: $277.7 million; Margin: 21.3%
Compliant Case Growth approximately 5.4%
Threshold frozen at 60% for an additional year (07/01/07)
HealthSouth outperforms the market with compliant case
growth
Research underway; Symposium Q1 2007
Administrative “fix”; legislative remedy (1H 2007)
Rule creating consolidation opportunities for HealthSouth
Payor Mix(1) for the nine months ended 9/30/2006
State Concentrations
(2)
Cummulative %
(2)
IRF
LTCH
TX
15
1
16%
PA
9
2
26%
FL
9
1
36%
AL
6
42%
TN
6
48%
LA
2
3
53%
AZ
5
58%
SC
5
63%
(1)
Net Patient Revenue
(2)
Number of IRF's & LTCH's Only
Strong cash flow characteristics
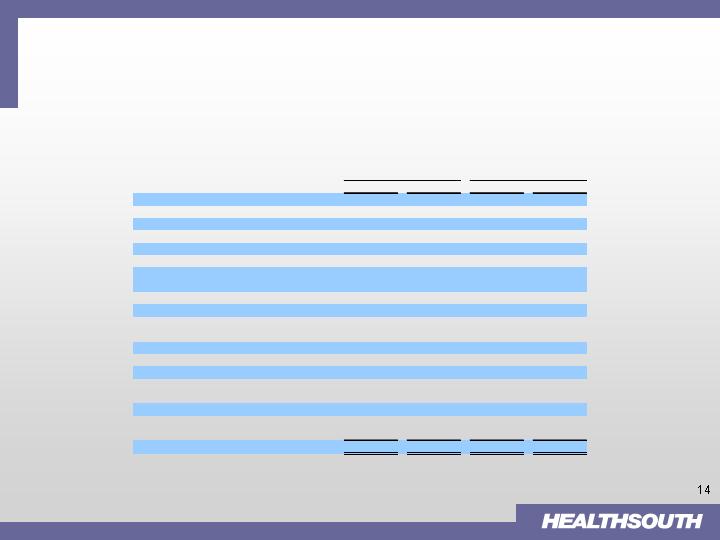
Inpatient Division (cont’d)
Inpatient Division
($ in millions)
(1) Current overhead calculation of 4.25% of net operating revenue may not be comparable to stand alone entity
(2) 2005 numbers adjusted for discontinued ops facilities in 2006
YTD 9/30/06
2005
(2)
Net Operating Revenues
$1,303.3
$1,776.3
Operating Earnings
277.7
388.3
Corporate OH (as a % of revenue)
(1)
(55.4)
(75.5)
Depreciation
47.5
65.4
Available Cash Before CAPEX & Debt Service
$269.8
$378.2
CAPEX (maintenance only)
(30.0)
(38.8)
Cash Available for Growth CAPEX
$239.8
$339.4
and Debt Service
Growth Opportunities
Post divestiture, HealthSouth’s growth will occur through organic and
development initiatives
Organic*
2-3% Pricing
1-2% SS Volume
Development: Current IRF/LTCH pipeline:
~ 40+ projects
*After full implementation of 75% Rule
IRF
LTCH
IRF
1.
Consolidation
(Existing markets)
2.
De-novo (Existing or New markets)
3.
Acquisition (New markets)
LTCH (to supplement IRF presence)
De-novo
J.V.
Acquire
Mid-to high-single digit
EBITDA growth
Development Strategies
85%
15%

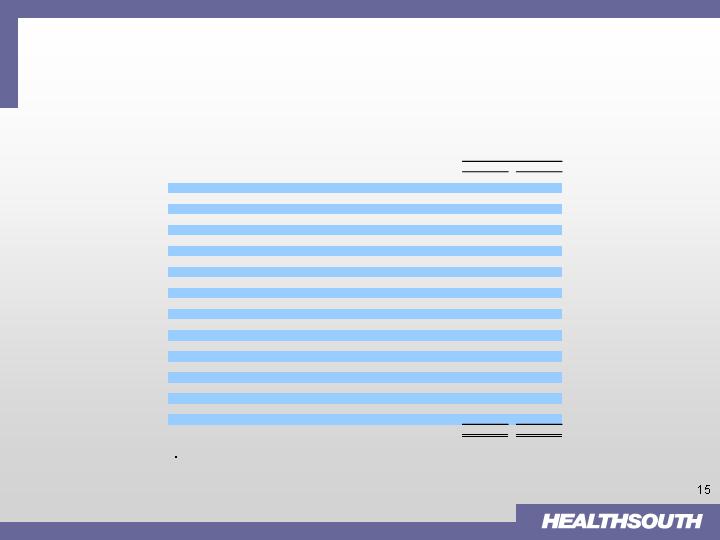
Growth Potential – Illustrative Examples
($ in thousands)
(1) % includes estimated corporate overhead of 4.25%
(2) Assumes HLS owns 80% of JV
Higher Margin from Platform Efficiency
Ramp-up Period though Strong IRR
Incremental EBITDA with No Investment
Capacity Rationalization
“Win - Win” Situation for Both Parties
Consolidation - Joint Venture
DeNovo - Proforma (40 Bed)
Revenue
EBITDA
%
(1)
Revenue
EBITDA
%
(1)
Stand Alone
$10,000
$2,000
16%
Year 1
$8,500
$1,275
11%
Joint Venture
(2)
$14,000
$3,200
19%
Year 2
$10,500
$2,500
20%
- Minority Interest
($640)
Run Rate
$11,500
$2,900
21%
After Consolidation
$14,000
$2,560
14%
Incremental
EBITDA
$560
Investment
$14,000
Investment
$0
5-year Annualized ROI
~ 18%
Summary
HealthSouth has emerged from a period of unprecedented uncertainty and
upheaval with a new Board, a new management team, a new balance sheet and a
new direction.
By divesting its non-core assets, the Company will be well-positioned to become a
“pure-play” post-acute provider and a consolidator in the fragmented $126 B post-
acute space
These divestures – along with any proceeds we may receive from tax refunds and
certain derivative litigation – will significantly strengthen the Company’s Balance
Sheet through deleveraging.
Re-listed on NYSE (symbol: HLS) in late October, completing our “rehabilitation”
and we have begun a new chapter in the history of HealthSouth.
Near Term
Longer-term
IRFs
LTCHs (supplemental to IRFs only)
Home Health
Hospice
Appendix
Non-GAAP Financial Reconciliations
(In Thousands)
Reconciliation of Net Loss to Adjusted Consolidated EBITDA
2006
2005
2006
2005
Net loss
(76,144)
$
(11,541)
$
(553,718)
$
(332,158)
$
Loss from discontinued operations
3,291
11,735
20,191
30,830
Provision for income tax expense
4,582
10,339
31,457
29,209
Loss on interest rate swap
28,711
-
13,922
-
Loss (gain) on sale of marketable securities
107
-
121
(10)
Interest income
(1,253)
(3,739)
(9,610)
(10,618)
Interest expense and amortization of debt
discounts and fees
82,493
82,904
250,647
253,530
(Gain) loss on early extinguishment of debt
(6)
-
365,636
33
Professional fees—accounting, tax, and legal
23,774
33,072
100,402
113,429
Government, class action, and related
settlements expense
28,420
-
45,733
215,000
Impairment charges
200
1,460
4,022
26,375
Net non-cash loss on disposal of assets
3,448
2,385
8,830
16,672
Depreciation and amortization
38,473
40,249
113,726
128,694
Compensation expense under FASB Statement
No. 123(R)
3,595
-
11,630
-
Sarbanes-Oxley related costs
861
7,738
4,237
22,965
Restructuring activities under FASB Statement
No. 146
1,348
249
4,579
7,456
Adjusted Consolidated EBITDA
141,900
$
174,851
$
411,805
$
501,407
$
Three Months Ended
September 30,
Nine Months Ended
September 30,
Appendix (cont’d)
Non-GAAP Financial Reconciliations
The change in operating cash and assets and liabilities during the nine months ended September 30, 2006 primarily
resulted from declining volumes in each of our operating segments, increased receivable balances (due to current
collection trends, the $35.0 million receivable recorded as a recovery from Mr. Scrushy, and a delay in Medicare
payments), and non-cash reductions in various accrued expenses, including a reduction in estimates associated with
legal fees owed to Mr. Scrushy.
Reconciliation of Adjusted Consolidated EBITDA to Net Cash (Used In) Provided By Operating Activities
2006
2005
Adjusted Consolidated EBITDA
411,805
$
501,407
$
Professional fees—accounting, tax, and legal
(100,402)
(113,429)
Sarbanes-Oxley related costs
(4,237)
(22,965)
Interest expense and amortization of debt discounts and fees
(250,647)
(253,530)
Interest income
9,610
10,618
Provision for doubtful accounts
86,364
68,583
Net gain on disposal of assets
(7,977)
(2,656)
Amortization of debt issue costs, debt discounts, and fees
16,312
30,371
Amortization of restricted stock
2,654
1,358
Accretion of debt securities
(53)
(117)
Loss on sale of investments, excluding marketable securities
1,103
3,420
Equity in net income of nonconsolidated affiliates
(16,841)
(21,115)
Distributions from nonconsolidated affiliates
10,455
15,615
Minority interest in earnings of consolidated affiliates
78,367
78,895
Stock-based compensation
8,976
-
Compensation expense under FASB Statement No. 123(R)
(11,630)
-
Current portion of income tax provision
(10,670)
(16,244)
Restructuring charges under FASB Statement No. 146
(4,579)
(7,456)
Recovery of amounts due from Richard M. Scrushy
(35,000)
-
Net cash settlement on interest rate swap
1,448
-
Other operating cash used in discontinued operations
(25,271)
(42,879)
Change in government, class action, and related settlements liability
(87,171)
(133,548)
Change in assets and liabilities, net of acquisitions*
(148,251)
(7,766)
Net Cash (Used In) Provided By Operating Activities*
(75,635)
$
88,562
$
Nine Months Ended
September 30,
(In Thousands)