
Unlocking Value
JP Morgan Healthcare Conference
January 8, 2007
San Francisco, CA

Forward-Looking Statements
The information contained in this presentation includes certain estimates, projections
and other forward-looking information that reflect our current views with respect to
future events and financial performance. These estimates, projections and other
forward-looking information are based on assumptions that HealthSouth believes, as of
the date hereof, are reasonable. Inevitably, there will be differences between such
estimates and actual results, and those differences may be material.
There can be no assurance that any estimates, projections or forward-looking
information will be realized.
All such estimates, projections and forward-looking information speak only as of the
date hereof. HealthSouth undertakes no duty to publicly update or revise the
information contained herein.
You are cautioned not to place undue reliance on the estimates, projections and other
forward-looking information in this presentation as they are based on current
expectations and general assumptions and are subject to various risks, uncertainties
and other factors, including those set forth in our Form 10-Q for the periods ended
March 30, 2006, June 30, 2006 & Sept. 30, 2006, the Form 10-K for the fiscal year
ended December 31, 2005 and current report on Form 8-K dated May 26, 2006 and in
other documents that we previously filed with the SEC, many of which are beyond our
control, that may cause actual results to differ materially from the views, beliefs and
estimates expressed herein.
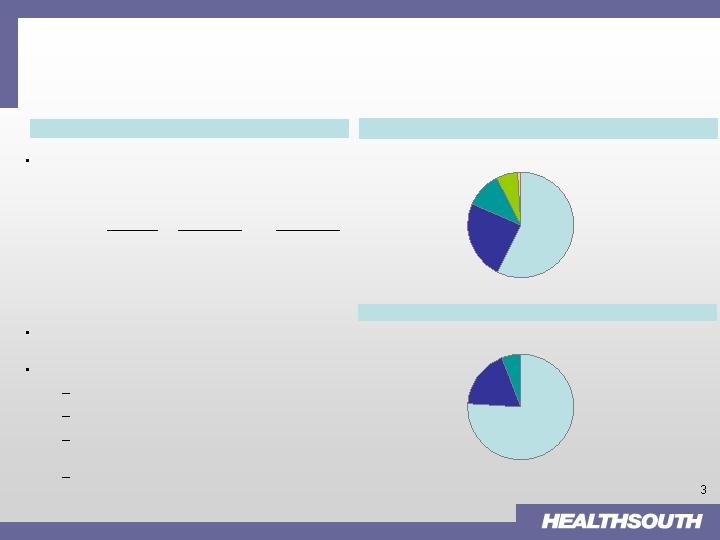
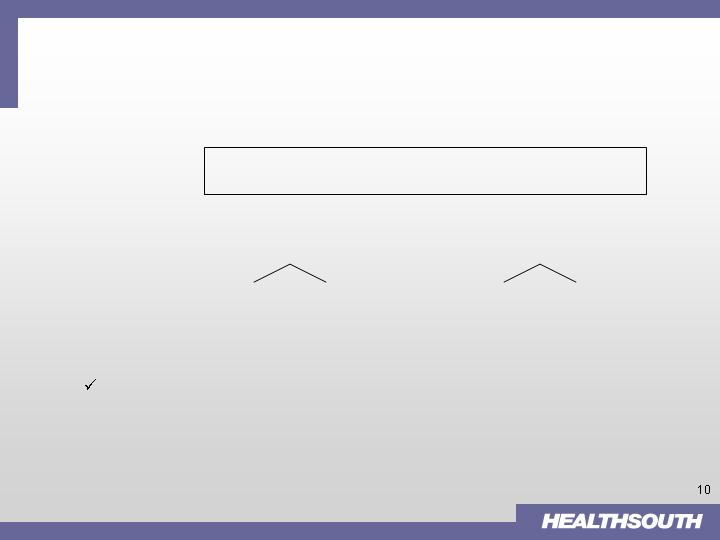
Today: Diversified Healthcare Services Provider
The Company is a leader in each of its four
major operating divisions
Approximately 1,003 facilities in 45 states
YTD Performance (09/30/06)
Net Operating Revenues: $2.3 billion
Operating Earnings of $119.7 million
Adjusted Consolidated EBITDA: $411.8
million
Adjusted Consolidated EBITDA margin:
18.0%
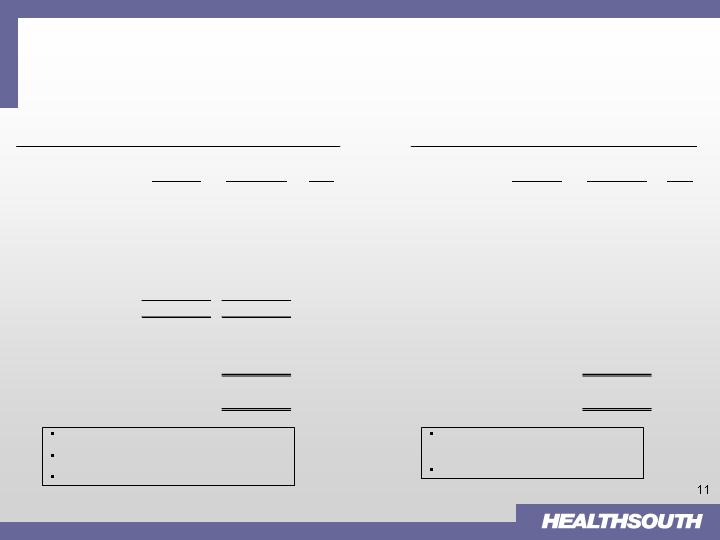
YTD Net Rev.
($23.8 M)
$153.6 M
#2
Diagnostic
$21.5 M
$251.4 M
#2
Outpatient
$67.5 M
$555.2 M
#1
ASC
$277.7 M
$1,303.3 M
#1
Inpatient
(09/30/06)
(09/30/06)
(a)
Share
YTD Op. Earn.
Market
Diagnostic
(6.9%)
Outpatient
6.3%
Surgery
19.7%
Inpatient
81.0%
% of Operating Earnings (b) (c)
(a) Based on facility counts as of Sept. 30, 2006.
(b) Percentages do not include Intersegment Revenues; operating earnings include
operating divisions only
(c) Nine months ended Sept. 30, 2006.
Diagnostic
6.7%
Outpatient
11.0%
Surgery
24.3%
Inpatient
57.1%
Other
0.8%
Diversified Business Portfolio (b) (c) : % of Net Operating Revenues
National Provider of Healthcare Services

Strategic Repositioning
August 14, 2006: HealthSouth announced it would seek
strategic alternatives for its Surgery and Outpatient business
segments
Diagnostic business segment previously designated as “non-core”
Divestiture process going well: strong interest; competitive
process; anticipated announcement Q1 with closing by end of
Q2
The “new” HealthSouth = Focus on Inpatient Rehabilitation
Facilities (“IRFs”)
Future growth in other post-acute segments:
Long-Term Acute Care
Home Health
Hospice
In part, driven by development of integrated, post-acute
payment system (Medicare)
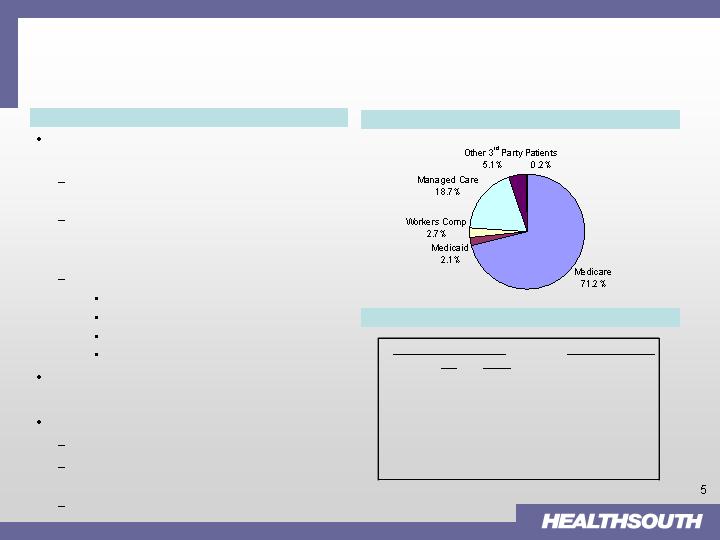
Future: Focus on Inpatient Rehabilitation
Overview
102 Hospital Locations
Nation's largest provider of inpatient
rehabilitation facilities (IRFs)
183 locations (92 IRFs, 91 outpatient
satellites)
Typical IRF: 40 bed 60 bed
Size: 42,000 62,000
CAPEX: $15-17mm $20-24mm
Major services offered:
Nursing Care (24/7)
Inpatient/Outpatient Physical Therapy
Occupational Therapy
Speech Therapy
Also operate 10 long-term acute care
hospitals (“LTCH”)
YTD Performance (09/30/06)
Net Operating Revenues: $1,303.3 million
Operating Earnings: $277.7 million;
Margin: 21.3%
Compliant Case Growth approximately 5.4%
Payor Mix(1) for the nine months ended 9/30/2006
State Concentrations
(2)
Cummulative %
(2)
IRF
LTCH
TX
15
1
16%
PA
9
2
26%
FL
9
1
36%
AL
6
42%
TN
6
48%
LA
2
3
53%
AZ
5
58%
SC
5
63%
(1)
Net Patient Revenue
(2)
Number of IRF's & LTCH's Only
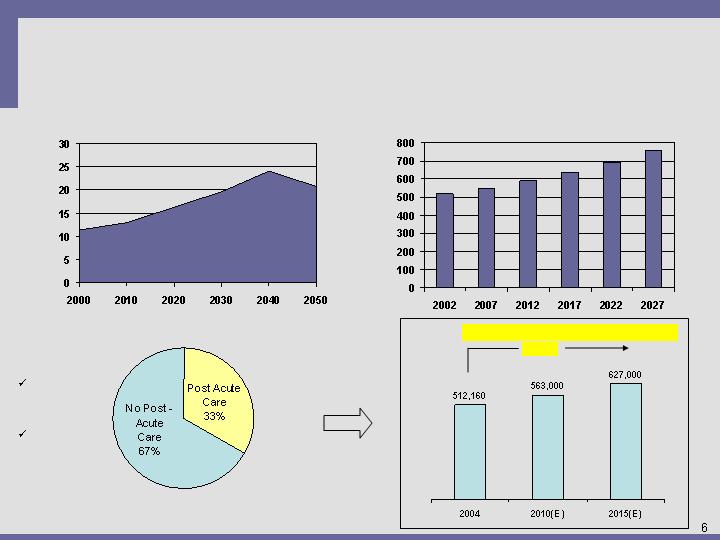
Aging “Baby Boomers” will Continue to Fuel
Demand for IRF Services
National Annual Acute Care Bed Demand in US
2002-2027 Projections (2)
Projected percentage of US population
65 years or older through 2050 (1)
%
Population
Beds per
Thousand
Post-Acute Usage After Discharge
Post-Acute Market
(1) Source: US Census Bureau, 2004
(2) Source: Solucient, LLC: National and Local Impact of Long-Term Demographic Change
on Inpatient Acute Care; Represents demand for additional utilization, not additional beds
(3) Source: Medicare Provider Analysis and Review File (2004); Claritas
Projected Medicare Compliant Case Growth(3)
+ 22%
Post-Acute
Industry
~ $125B
IRF Segment
~ $9B
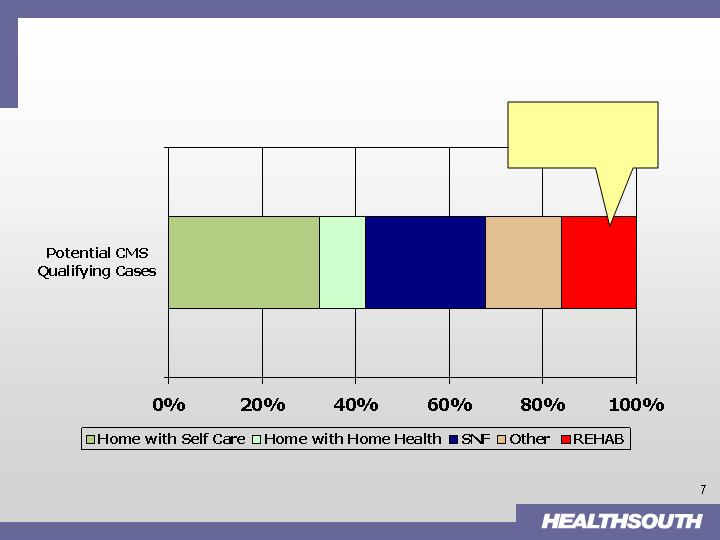
Not all Potential Compliant Cases are Going to
IRFs
On average ~16% of
Compliant Cases
“Convert” to an IRF
Admission
Source: HealthCare Concepts Study

IRFs Provide Significantly Greater Nursing and
Rehabilitative Patient Care to “Compliant Case”
Patients = Quality/Outcome Differentiation
Characteristic
IRF
SNF
1,
Attending physician visits
4 + times/week
At least every 30 days
2.
Multi-disciplinary team approach;
Required
Not required
Coordinated Program of Care
3.
MD or DO designated as Rehabilitation
Required
Not required
Director
4.
RN oversight and availability
24 hours/day
At least 8 consecutive
hours/day
5.
Nursing hours per pt-day
5.0 – 7.5
2.5 – 4.0
6.
Nursing training, expertise
Rehabilitation
None
specialty expertise
7.
PT, OT, and/or Speech Therapy
3 hours/day
No minimum
level of service
(minimum)

Growth = Significant Organic and Development
Opportunities
Organic*
2-3% Pricing
1-2% SS Volume
Development: 5-8 new facilities per year
Current pipeline
~ 40+ projects
“Steady-state” basis
IRF
LTCH
IRF
1.
Consolidation
(Existing markets)
2.
De-novo (Existing or New markets)
3.
Acquisition (New markets)
LTCH (to supplement IRF presence)
J.V.
Acquire
Mid- to high-single
digit EBITDA growth
Development Strategies
IRF Segment Highly Fragmented = Consolidation
Opportunities
(1) Source: Annual Reports; Verispan data; management analysis
(2) Typically a 15 – 30 bed wing / unit of an acute-care hospital
737
266
242
92
Number of IRFs:
Not-for-Profit
For-Profit
All Others
HLS
In-hospital Unit (2) = 1003 (75%)
Free-standing = 334 (25%)
IRF Market (2004)(1) = 1,337
The 75% Rule will stimulate consolidation as smaller providers
experience difficulties in meeting the higher thresholds.
Illustrative Development Examples
($ in thousands)
(1) Does NOT include estimated corporate overhead of ~4.5% of Net Revenues
(2) Assumes HLS owns ~80% of JV
Higher Margin from Platform
Efficiency
Ramp-up Period though Strong IRR
Incremental EBITDA with No Investment
Capacity Rationalization
“Win - Win” Situation for Both Parties
Consolidation - Joint Venture
DeNovo - Proforma (40 Bed)
Revenue
EBITDA
(1)
%
(1)
Revenue
EBITDA
(1)
%
(1)
Stand Alone
$10,000
$2,000
20%
Year 1
$8,500
$1,275
15%
Joint Venture
(2)
$14,000
$3,200
23%
Year 2
$10,500
$2,500
23%
- Minority Interest
($640)
Run Rate
$11,500
$2,900
25%
After Consolidation
$14,000
$2,560
18%
Incremental
EBITDA
$560
Investment
$15,000-17,000
Investment
$0
5-year Annualized ROI
~ 16-18%
2006 Development Achievements: Growth is
Occurring Ahead of Plan
Opened new 40-bed IRF in Petersburg, VA
Created joint venture/market consolidation in Tucson, AZ
Merged competitor’s 20-bed IRF with existing HLS 80-bed
IRF
Broke ground on new 40-bed IRF in Fredericksburg, VA
Approved new 50-bed IRF in Phoenix, AZ
Announced acquisition/market consolidation in Wichita Falls, TX
Acquired competitor’s 48-bed IRF; will consolidate patients
to HLS 63-bed IRF

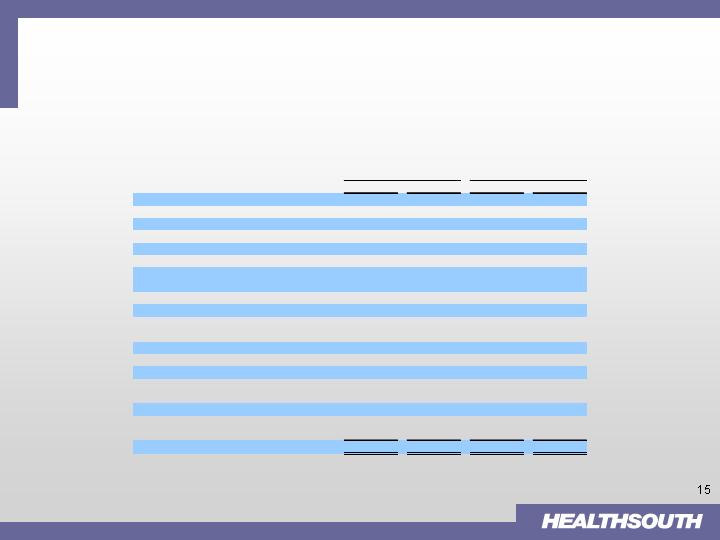
HealthSouth will have Strong Cash Flow
Characteristics
Inpatient Division
($ in millions)
(1) Current overhead calculation of 4.5% of net operating revenue may not be comparable to stand
alone entity or may take some time to achieve this run-rate
(2) 2005 numbers adjusted for discontinued ops facilities in 2006
YTD 09/30/06
2005
(2)
YTD 09/30/06
Annualized
Net Operating Revenues
$1,776.3
$1,303.3
$1,737.7
Operating Earnings
388.3
277.7
370.3
Corporate OH (as a % of revenue)
(1)
(79.9)
(58.6)
(78.2)
Depreciation
65.4
47.5
63.3
Available Cash Before CAPEX & Debt Service
$373.8
$266.5
$355.4
CAPEX (maintenance only)
(38.8)
(30.0)
(40.0)
Cash Available for Growth CAPEX
$335.0
$236.5
$315.4
and Debt Service

Summary
The “new” HealthSouth: new Board; new management team; new
balance sheet; and new direction.
By divesting its non-core assets, the Company will be well-
positioned to become a “pure-play” post-acute provider and a
consolidator in the fragmented $126 B post-acute space.
These divestures – along with any proceeds we may receive from
tax refunds and certain derivative litigation – will significantly
strengthen the company’s Balance Sheet through deleveraging.
The “new” HealthSouth will present a compelling investment
opportunity with EPS growth driven by organic growth,
development and de-leveraging.
Appendix
Non-GAAP Financial Reconciliations
(In Thousands)
Reconciliation of Net Loss to Adjusted Consolidated EBITDA
2006
2005
2006
2005
Net loss
(76,144)
$
(11,541)
$
(553,718)
$
(332,158)
$
Loss from discontinued operations
3,291
11,735
20,191
30,830
Provision for income tax expense
4,582
10,339
31,457
29,209
Loss on interest rate swap
28,711
-
13,922
-
Loss (gain) on sale of marketable securities
107
-
121
(10)
Interest income
(1,253)
(3,739)
(9,610)
(10,618)
Interest expense and amortization of debt
discounts and fees
82,493
82,904
250,647
253,530
(Gain) loss on early extinguishment of debt
(6)
-
365,636
33
Professional fees—accounting, tax, and legal
23,774
33,072
100,402
113,429
Government, class action, and related
settlements expense
28,420
-
45,733
215,000
Impairment charges
200
1,460
4,022
26,375
Net non-cash loss on disposal of assets
3,448
2,385
8,830
16,672
Depreciation and amortization
38,473
40,249
113,726
128,694
Compensation expense under FASB Statement
No. 123(R)
3,595
-
11,630
-
Sarbanes-Oxley related costs
861
7,738
4,237
22,965
Restructuring activities under FASB Statement
No. 146
1,348
249
4,579
7,456
Adjusted Consolidated EBITDA
141,900
$
174,851
$
411,805
$
501,407
$
Three Months Ended
September 30,
Nine Months Ended
September 30,

Appendix (cont’d)
Non-GAAP Financial Reconciliations
* The change in operating cash and assets and liabilities during the nine months ended September 30,
2006 primarily resulted from declining volumes in each of our operating segments, increased
receivable balances (due to current collection trends, the $35.0 million receivable recorded as a
recovery from Mr. Scrushy, and a delay in Medicare payments), and non-cash reductions in various
accrued expenses, including a reduction in estimates associated with legal fees owed to Mr. Scrushy
Reconciliation of Adjusted Consolidated EBITDA to Net Cash (Used In) Provided By Operating Activities
2006
2005
Adjusted Consolidated EBITDA
411,805
$
501,407
$
Professional fees—accounting, tax, and legal
(100,402)
(113,429)
Sarbanes-Oxley related costs
(4,237)
(22,965)
Interest expense and amortization of debt discounts and fees
(250,647)
(253,530)
Interest income
9,610
10,618
Provision for doubtful accounts
86,364
68,583
Net gain on disposal of assets
(7,977)
(2,656)
Amortization of debt issue costs, debt discounts, and fees
16,312
30,371
Amortization of restricted stock
2,654
1,358
Accretion of debt securities
(53)
(117)
Loss on sale of investments, excluding marketable securities
1,103
3,420
Equity in net income of nonconsolidated affiliates
(16,841)
(21,115)
Distributions from nonconsolidated affiliates
10,455
15,615
Minority interest in earnings of consolidated affiliates
78,367
78,895
Stock-based compensation
8,976
-
Compensation expense under FASB Statement No. 123(R)
(11,630)
-
Current portion of income tax provision
(10,670)
(16,244)
Restructuring charges under FASB Statement No. 146
(4,579)
(7,456)
Recovery of amounts due from Richard M. Scrushy
(35,000)
-
Net cash settlement on interest rate swap
1,448
-
Other operating cash used in discontinued operations
(25,271)
(42,879)
Change in government, class action, and related settlements liability
(87,171)
(133,548)
Change in assets and liabilities, net of acquisitions*
(148,251)
(7,766)
Net Cash (Used In) Provided By Operating Activities*
(75,635)
$
88,562
$
Nine Months Ended
September 30,
(In Thousands)
.