
Unlocking Value
Investor Presentation
March 2007

Forward-Looking Statements
The information contained in this presentation includes certain estimates, projections
and other forward-looking information that reflect our current views with respect to future
events and financial performance. These estimates, projections and other forward-
looking information are based on assumptions that HealthSouth believes, as of the date
hereof, are reasonable. Inevitably, there will be differences between such estimates and
actual results, and those differences may be material.
There can be no assurance that any estimates, projections or forward-looking
information will be realized.
All such estimates, projections and forward-looking information speak only as of the
date hereof. HealthSouth undertakes no duty to publicly update or revise the
information contained herein.
You are cautioned not to place undue reliance on the estimates, projections and other
forward-looking information in this presentation as they are based on current
expectations and general assumptions and are subject to various risks, uncertainties
and other factors, including those set forth in our Form 10-Q for the periods ended
March 30, 2006, June 30, 2006 & Sept. 30, 2006, the Form 10-K for the fiscal year
ended December 31, 2006 and current report on Form 8-K dated May 26, 2006 and in
other documents that we previously filed with the SEC, many of which are beyond our
control, that may cause actual results to differ materially from the views, beliefs and
estimates expressed herein.

(In Millions)
Form 10-K / 4th Quarter Consolidated Results
Note: Adjusted Consolidated EBITDA amounts are before professional fees, impairments and government,
class action and related settlements expense. See Appendix for Non-GAAP Financial Reconciliations
4th Quarter
Full Year
2006
2005
2006
2005
Net Operating Revenues
$730.2
$733.4
$3,000.1
$3,117.0
Expenses:
Salaries and Benefits
$354.4
$343.5
$1,398.4
$1,386.1
Supplies
72.5
72.7
287.8
294.2
Other
181.1
207.1
721.0
1,027.3
Provision for Doubtful Accounts
34.2
26.2
119.3
94.3
Recovery of Amounts Due
(12.8)
-
(47.8)
(37.9)
Depreciation and Amortization
35.5
35.4
148.2
162.6
Occupancy Costs
37.0
32.3
141.4
113.1
Minority Interest
13.9
18.3
92.3
97.2
Operating Earnings
$14.4
($2.1)
$139.5
($19.9)
Adjusted Consolidatd EBITDA
$125.7
$125.5
$535.5
$627.6
Adj. Consolidatd EBITDA Margin
17.2%
17.1%
17.8%
20.1%
Form 10-K / 4th Quarter Highlights
Fourth quarter signaled a turning point for the Company as we
experienced improved Net Operating Revenues and Operating
Earnings in our two largest segments
Inpatient
Net Operating Revenues were up both sequentially and
quarter-over-quarter
Compliance case growth up 4.7%; increase in Case Mix
Index resulting in stronger unit pricing and a 1.9%
increase in Net Operating Revenues
3.2% increase in Operating Earnings vs. 4Q 2005
(1) Implied EBITDA is before Corporate Overhead
(In Millions)
4Q 2006
4Q 2005
% ?
Net Operating Revenues
424.6
$
416.5
$
1.9%
Operating Earnings
80.7
$
78.2
$
3.2%
Depreciation & Amortization
17.4
14.7
18.4%
Implied EBITDA
(1)
98.1
$
92.9
$
5.6%
Implied EBITDA Margin
(1)
23.1%
22.3%
80 b.p.
Form 10-K / 4th Quarter Highlights (cont’d)
Surgery
Net Operating Revenues were up 3.1% vs. 4Q 2005
Operating Earnings showed both quarter-over-quarter
and sequential improvement
Increased by $12.8 million quarter over quarter as a result
of improved revenues and labor and supply cost
management initiatives, including the standardization of
non-physician preference items
0.9% increase in cases at those ASCs that were open for
at least twelve months
(1) Implied EBITDA is before Corporate Overhead
(In Millions)
4Q 2006
4Q 2005
% ?
Net Operating Revenues
182.4
$
177.0
$
3.1%
Operating Earnings
25.8
$
13.0
$
98.5%
Depreciation & Amortization
6.3
7.8
(19.2%)
Implied EBITDA
(1)
32.1
$
20.8
$
54.3%
Implied EBITDA Margin
(1)
17.6%
11.8%
580 b.p.

Strategic Repositioning
August 14, 2006: In an effort to deleverage its Balance Sheet
and reposition the Company as a “pure-play” post-acute
provider, HealthSouth announced it would seek strategic
alternatives for its Surgery and Outpatient business segments
Diagnostic business segment previously designated as “non-core”
Strategic alternatives = sale, spin, IPO, or some variation
thereof
Independent processes for each segment
Company will be disciplined in its approach to optimizing dual
objectives:
Reducing Debt
-and-
Obtaining Fair Value

Strategic Repositioning (cont’d)
Sale of Outpatient segment announced January 29, 2007
Purchaser: Select Medical
Sales Price: $245M
Closing: Estimated April 30, 2007
The “new” HealthSouth = Near-term focus on Inpatient
Rehabilitation Facilities (“IRFs”)
Future growth in other post-acute segments:
Long-Term Acute Care
Home Health
Hospice
In part, driven by development of integrated, post-acute payment
system (Medicare)

Future: Focus on Inpatient Rehabilitation
Overview
102 Hospital Locations
Nation's largest provider of inpatient
rehabilitation facilities (IRFs)
173 locations (92 IRFs, 81 outpatient
satellites)
Typical IRF: 40 bed 60 bed
Size (sq. ft.): 42,000 62,000
CAPEX: $15-17mm $20-24mm
Major services offered:
Nursing Care (24/7)
Inpatient/Outpatient Physical Therapy
Occupational Therapy
Speech Therapy
Also operate 10 long-term acute care
hospitals (“LTCH”)
YTD Performance (12/31/06)
Net Operating Revenues: $1,724.8 million
Operating Earnings: $359.5 million;
Margin: 20.8%
Compliant Case Growth approximately 6.0%
Payor Mix(1) for the year ended 12/31/2006
State Concentrations
(2)
Cummulative %
(2)
IRF
LTCH
TX
15
1
16%
PA
9
2
26%
FL
9
1
36%
AL
6
42%
TN
6
48%
LA
2
3
53%
AZ
5
58%
SC
5
63%
(1)
Net Patient Revenue
(2)
Number of IRF's & LTCH's Only
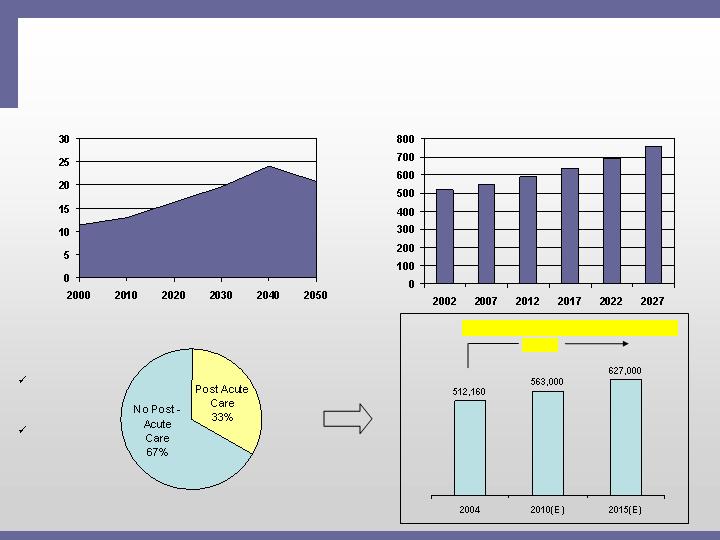
Aging “Baby Boomers” will Continue to Fuel
Demand for IRF Services
National Annual Acute Care Bed Demand in US
2002-2027 Projections (2)
Projected percentage of US population
65 years or older through 2050 (1)
%
Population
Beds per
Thousand
Post-Acute Usage After Discharge
(1) Source: US Census Bureau, 2004
(2) Source: Solucient, LLC: National and Local Impact of Long-Term Demographic Change
on Inpatient Acute Care; Represents demand for additional utilization, not additional beds
(3) Source: Medicare Provider Analysis and Review File (2004); Claritas
Projected Medicare Compliant Case Growth(3)
+ 22%
Post-Acute
Industry
~ $125B
IRF Segment
~ $9B
9

Not All Potential Compliant Cases Go To IRFs
NOTES: Internal assessment of compliant case yields; HealthCare Concepts
On average
~16% of
Potential
Compliant
Cases
“Convert” to
an IRF
Admission
10
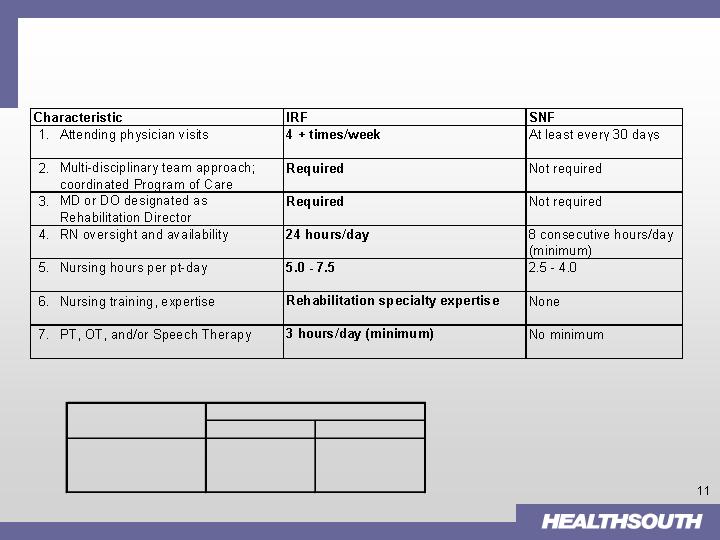
IRFs Provide Greater Nursing and Rehabilitative
Patient Care to Patients…
with significantly shorter length-of-stay (“LOS”)
(1)
NOTE:
(1) Source: Post-Acute care providers: An Overview of Issues. MedPAC analysis of cost reports.
Providers with Consistently
Days
Low Costs
High Costs
SNF average LOS
37.4
30.1
IRF average LOS
10.9
13.3
Growth = Significant Organic and Development
Opportunities
Organic*
2-3% Pricing
1-2% SS Volume
Development: 5-8 new facilities per year
Current pipeline
~ 40+ projects
“Steady-state” basis
IRF
LTCH
IRF
1.
Consolidation
(Existing markets)
2.
De-novo (Existing or New markets)
3.
Acquisition (New markets)
LTCH (to supplement IRF presence)
J.V.
Acquire
Mid- to high-single
digit EBITDA growth
Development Strategies

IRF Segment Highly Fragmented = Creates
Consolidation Opportunities
(1) Source: Report to Congress: Medicare Payment Policy; March 2007 MedPAC analysis of Providers of
service files from CMS
(2) Typically a 15-30 bed unit/ department of an acute care hospital
Type of IRF
(1)
2005
HLS = 92
All IRFs
1,231
7.5%
Urban
1,000
Rural
231
Freestanding
217
42.4%
Hospital-Based
(2)
1,014
Non-Profit
765
For-Profit
305
30.2%
Government
161
Illustrative Development Examples
(In Thousands)
(1) Does NOT include estimated corporate overhead of ~4.5% of Net Operating Revenues
(2) Assumes HLS owns ~80% of JV
Higher Margin from Platform
Efficiency
Ramp-up Period though Strong IRR
Incremental EBITDA with No Investment
Capacity Rationalization
“Win - Win” Situation for Both Parties
Consolidation - Joint Venture
DeNovo - Proforma (40 Bed)
Revenue
EBITDA
(1)
%
(1)
Revenue
EBITDA
(1)
%
(1)
Stand Alone
$10,000
$2,000
20%
Year 1
$8,500
$1,275
15%
Joint Venture
(2)
$14,000
$3,200
23%
Year 2
$10,500
$2,500
23%
- Minority Interest
($640)
Run Rate
$11,500
$2,900
25%
After Consolidation
$14,000
$2,560
18%
Incremental
EBITDA
$560
Investment
$15,000-17,000
Investment
$0
5-year Annualized ROI
~ 16-18%

Development Achievements: Growth is
Occurring Ahead of Plan
Opened new 40-bed IRF in Petersburg, VA
Created joint venture/market consolidation in Tucson, AZ
Merged competitor’s 20-bed IRF with existing HLS 80-bed IRF
Broke ground on new 40-bed IRF in Fredericksburg, VA
Approved new 50-bed IRF in Phoenix, AZ
Announced acquisition/market consolidation in Wichita Falls, TX
Acquired competitor’s 48-bed IRF; will consolidate patients to HLS
63-bed IRF
Opened 18 new beds at two facilities
New 40-bed IRF in Puerto Rico
Scheduled to open by end of March for commercial patients
Bed expansion projects approved at five of our hospitals
Total of 54 beds
Four of these expansions will come on-line in the second half of 2007
with the final project scheduled to open in 2008
2007
2006
2007 Guidance: Focus on Inpatient Segment
Inpatient
Volume growth: 1–2%
Net Revenue growth: 2-3%
Operating Earnings
Growth: 3-4%
We will move Surgery and Diagnostic Divisions to “Discontinued
Operations/Assets Held for Sale” as soon as they qualify under FASB
Statement No. 144
Investors should focus on four metrics to evaluate ‘07 performance:
1.
Deleveraging the Balance Sheet through the successful divestiture
of our non-core Divisions
2.
Achieving Inpatient Net Operating Revenues growth of 2-3%
3.
Achieving Inpatient Operating Earnings growth of 3-4%
4.
Consummating 5-8 development projects by year end
Corporate will still have “noise”
Continuing restructuring costs (winding
down substantially by year-end)
General Ledger upgrade costs
Transition services for divested
segments
Goal: ~4.75% of Net Operating
Revenues by ’08 year-end

Summary
The “new” HealthSouth: new Board; new management team; new
balance sheet; and new direction.
By divesting of three divisions, the Company will be well-
positioned to become a “pure-play” post-acute provider and a
consolidator in the fragmented $126 B post-acute space.
These divestures – along with any proceeds we may receive from
tax refunds and certain derivative litigation – will significantly
strengthen the Company’s Balance Sheet through deleveraging.
The “new” HealthSouth will present a compelling investment
opportunity with EPS growth driven by organic growth,
development and de-leveraging.
Appendix
Non-GAAP Financial Reconciliations
For the Year Ended
December 31,
2006
2005
(In Millions)
Net loss
$
(
625.0
)
$
(446.0)
Loss from discontinued operations
26.0
67.2
Provision for income tax expense
41.1
38.4
Loss on interest rate swap
10.5
–
Loss on sale of
marketable securities
0.3
–
Interest income
(15.7)
(17.1)
Interest expense and amortization of debt
discounts and fees
335.1
337.5
Loss on early extinguishment of debt
365.6
–
Professional fees
—
accounting, tax, and lega
l
163.6
169.8
Government, class action, and related
settlements expense
38.8
215.0
Impairment charges
15.2
43.3
Net non
-
cash loss on disposal of assets
6.4
16.6
Depreciation and amortization
148.2
162.6
Compen
sation expense under FASB Statement
No. 123(R)
15.5
–
Sarbanes
-
Oxley related costs
4.8
32.2
Restructuring activities under FASB Statement
No. 146
5.1
8.1
Adjusted Consolidated EBITDA
$
535.5
$
627.6
Appendix (cont’d)
Non-GAAP Financial Reconciliations
For the year ended December 31,
2006
2005
(In Millions)
Adjusted Consolidated EBITDA
$
535.5
$
627.6
Compensation expense under FASB Statement No. 123(R)
(15.5)
–
Restructuring charges under FASB Statement No. 146
(5.1)
(8.1)
Sar
banes
-
Oxley related costs
(4.8)
(32.2)
Provision for doubtful accounts
119.3
94.3
Net gain on disposal of assets
(10.9)
-
Professional fees
—
accounting, tax, and legal
(
163.6
)
(169.8)
Interest expense and amortization of debt disco
unts and fees
(335.1)
(337.5)
Interest income
15.7
17.1
Loss (gain) on sale of investments, excluding marketable
securities
1.6
0.1
Equity in net income of nonconsolidated affiliates
(21.3)
(
29.4
)
Minority interest in earn
ings of consolidated affiliates
92.
3
97.2
Amortization of debt issue costs, debt discounts, and fees
18.3
39.0
Amortization of restricted stock
3.4
2.0
Distributions from nonconsolidated affiliates
14.1
22.5
Stock
-
based compen
sation
12.1
–
Current portion of income tax provision
(7.9)
(21.4)
Change in assets and liabilities, net of acquisitions
(215.4)
(
101.8
)
Cash portion of 2006 g
overnment, class action, and related
settlements expense
(14.9)
–
Change in government, class action, and related settlements
liability
(118.4)
(165.4)
Other operating cash used in discontinued operations
(
19.6
)
(
36.5
)
Other
(
0.2
)
(
0.6
)
Net Cash
Used In
Operating Activities
$
(1
20.
4
)
$
(
2.9
)

Appendix (cont’d)
Non-GAAP Financial Reconciliations
2006
2005
Net loss
(71.4)
$
(113.9)
$
Loss from discontinued operations, net of tax
0.9
29.9
Income tax expense
9.4
7.8
Depreciation and amortization
35.5
35.4
Interest expense, net
78.5
77.4
Other debt related items
(3.6)
-
Other adjustments under Debt Agreements (a):
Professional fees
63.3
56.4
Impairment charges
12.8
17.4
Government, class action, and related
settlements expense
(6.9)
-
All other (b)
7.2
15.1
Adjusted Consolidated EBITDA
(1)
125.7
$
125.5
$
December 31,
HealthSouth Corporation and Subsidiaries
Supplemental Non-GAAP Disclosures
(In Millions)
Three Months Ended
(1) Adjusted
Consolidated
EBITDA is a non
-
GAAP financial measure. We believe Adjusted
Consolidated
EBITDA is
an important measure that supplements discussion and analysis of our results of operation. We believe that it is useful
to investors
as it is used in our covenant calculations under our 2006 Credit Agreement
.
Adjusted
Consolidated
EBITDA is not a measure of financial performance under accounting principles generally
accepted in the United States and should not be consider
ed as
an
alternative to net
loss
as an operating performance
measure
or to cash flows from operating, investing, or financing activities as a measure of liquidity. Because Adjusted
Consolidated
EBITDA is not a measure determined in accordance with general
l
y
accepted accounting principles and is
susceptible to varying calculations, Adjusted
Consolidated
EBITDA, as presented, may not be comparable to other
similarly titled measures presented by other companies.