
Unlocking Value
Citigroup
Global Health Care Conference
May 23, 2007

Forward-Looking Statements
The information contained in this presentation includes certain estimates, projections
and other forward-looking information that reflect our current views with respect to future
events and financial performance. These estimates, projections and other forward-
looking information are based on assumptions that HealthSouth believes, as of the date
hereof, are reasonable. Inevitably, there will be differences between such estimates and
actual results, and those differences may be material.
There can be no assurance that any estimates, projections or forward-looking
information will be realized.
All such estimates, projections and forward-looking information speak only as of the
date hereof. HealthSouth undertakes no duty to publicly update or revise the
information contained herein.
You are cautioned not to place undue reliance on the estimates, projections and other
forward-looking information in this presentation as they are based on current
expectations and general assumptions and are subject to various risks, uncertainties
and other factors, including those set forth in our Form 10-Q for the periods ended
March 30, 2006, June 30, 2006 & Sept. 30, 2006, the Form 10-K for the fiscal year
ended December 31, 2006 and current report on Form 8-K dated May 26, 2006 and in
other documents that we previously filed with the SEC, many of which are beyond our
control, that may cause actual results to differ materially from the views, beliefs and
estimates expressed herein.

Strategic Repositioning
August 14, 2006: In an effort to deleverage its Balance Sheet
and reposition the Company as a “pure-play” post-acute
provider, HealthSouth announced it would seek strategic
alternatives for its Surgery and Outpatient business segments
Diagnostic business segment previously designated as “non-core”
Sale of Outpatient segment announced January 29, 2007
Purchaser: Select Medical
Sales Price: Approximately $245M (debt-free)
Closed: May 1, 2007

Strategic Repositioning (cont’d)
Sale of Surgery segment announced March 26, 2007:
Purchaser: TPG
Sales Price: Approximately $920 million (debt-free) plus $25
million in options
Closing: Early third quarter 2007
Sale of Diagnostic segment announced April 14, 2007:
Purchaser: The Gores Group
Sales Price: Approximately $47.5 million (debt-free)
Closing: Early third quarter 2007

The “New” HealthSouth: Post-Acute Provider with
Near-Term Focus on Inpatient Rehabilitation
Overview
101 Hospital Locations
Nation's largest provider of inpatient
rehabilitation facilities (IRFs)
174 locations (93 IRFs, 81 outpatient satellites)
Typical IRF: 40 bed 60 bed
Size (sq. ft.): 42,000 62,000
CAPEX: $15-17mm $20-24mm
Major services offered:
Nursing Care (24/7)
Inpatient/Outpatient Physical Therapy
Occupational Therapy
Speech Therapy
Operate 8 long-term acute care hospitals
(“LTCH”)
Other post-acute platforms within
HealthSouth:
Home Health
Skilled Nursing
Payor Mix(1) for the year ended 12/31/2006
State Concentrations
(2)
Cummulative %
(2)
IRF
LTCH
TX
15
1
16%
PA
9
2
26%
FL
9
1
36%
AL
6
42%
TN
6
48%
LA
2
2
52%
AZ
5
57%
SC
5
62%
(1)
Net Patient Revenue
(2)
Number of IRF's & LTCH's Only
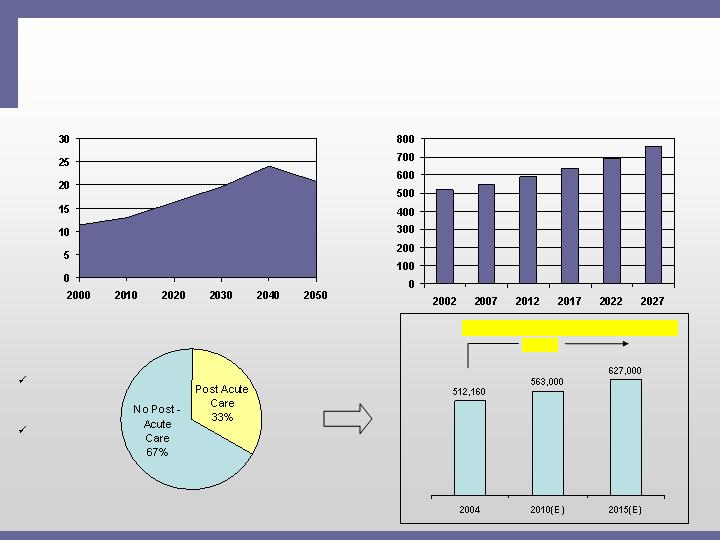
Aging “Baby Boomers” will Continue to Fuel
Demand for IRF Services
National Annual Acute Care Bed Demand in US
2002-2027 Projections (2)
Projected percentage of US population
65 years or older through 2050 (1)
%
Population
Beds per
Thousand
Post-Acute Usage After Discharge
(1) Source: US Census Bureau, 2004
(2) Source: Solucient, LLC: National and Local Impact of Long-Term Demographic Change
on Inpatient Acute Care; Represents demand for additional utilization, not additional beds
(3) Source: Medicare Provider Analysis and Review File (2004); Claritas
Projected Medicare Compliant Case Growth(3)
+ 22%
Post-Acute
Industry
~ $125B
IRF Segment
~ $9B
9
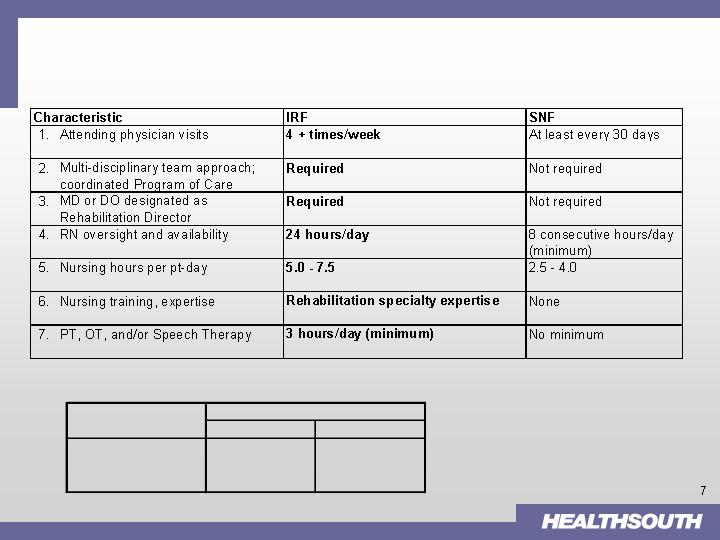
IRFs Provide Greater Nursing and Rehabilitative
Patient Care to Patients…
with significantly shorter length-of-stay (“LOS”)
(1)
NOTE:
(1) Source: Post-Acute care providers: An Overview of Issues. MedPAC analysis of cost reports.
Providers with Consistently
Days
Low Costs
High Costs
SNF average LOS
37.4
30.1
IRF average LOS
10.9
13.3
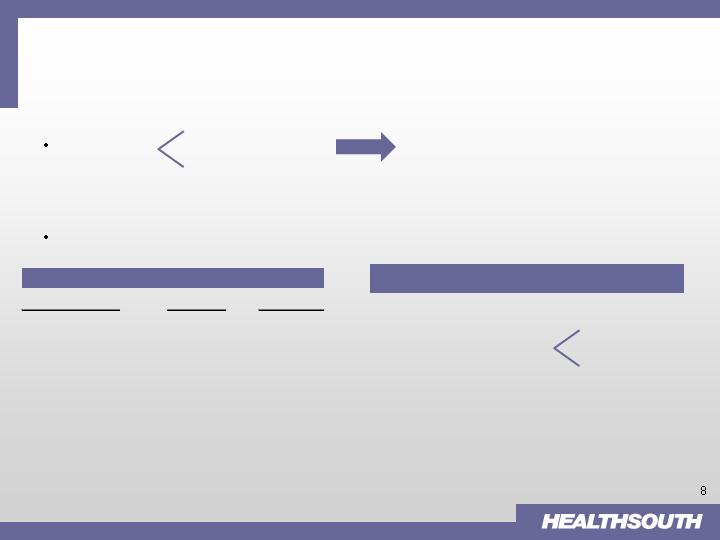
Growth = Organic and Development
Organic:*
IRF
1.
Consolidation
(existing markets)
2.
De-novo (existing or new markets)
3.
Acquisition (new markets)
LTCH (very limited; to supplement IRF
presence, only)
J.V.
Acquire
2-3% Pricing
1-2% SS Volume
Development: 5-8 new facilities per year
*“Steady-state” basis (post 75% Rule)
Mid- to high-single digit
EBITDA growth
Development Strategies
(1) Source: Report to Congress: Medicare Payment Policy; March 2007
MedPAC analysis of Providers of service files from CMS
(2) Typically a 15-30 bed unit/ department of an acute care hospital
Type of IRF
(1)
2005
HLS = 93
All IRFs
1,231
7.5%
Freestanding
217
42.4%
Hospital-Based
(2)
1,014
Non-Profit
765
For-Profit
305
30.2%
Government
161
Fragmented Sector
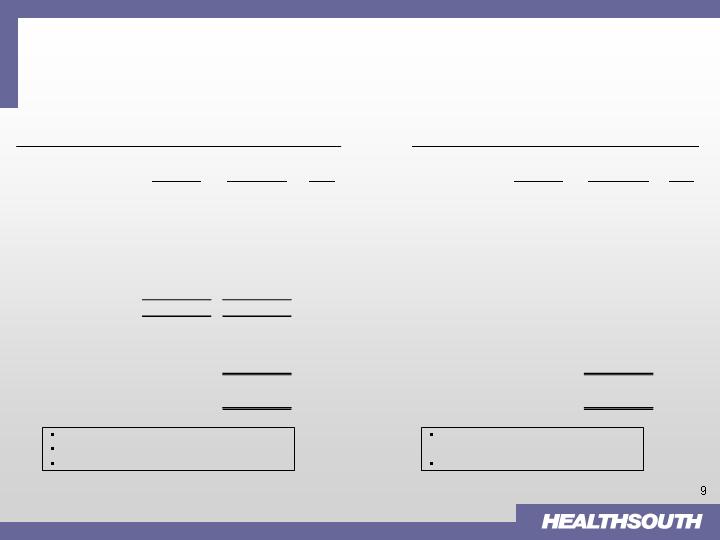
Illustrative Development Examples
(in thousands)
(1) Does NOT include estimated corporate overhead of ~4.75% of Net Operating Revenues
(2) Assumes HLS owns ~80% of JV
Higher Margin from Platform
Efficiency
Ramp-up Period though Strong IRR
Incremental EBITDA with No Investment
Capacity Rationalization
“Win - Win” Situation for Both Parties
Consolidation - Joint Venture
DeNovo - Proforma (40 Bed)
Revenue
EBITDA
(1)
%
(1)
Revenue
EBITDA
(1)
%
(1)
Stand Alone
$10,000
$2,000
20%
Year 1
$8,500
$1,275
15%
Joint Venture
(2)
$14,000
$3,200
23%
Year 2
$10,500
$2,500
23%
- Minority Interest
($640)
Run Rate
$11,500
$2,900
25%
After Consolidation
$14,000
$2,560
18%
Incremental
EBITDA
$560
Investment
$15,000-17,000
Investment
$0
5-year Annualized ROI
~ 16-18%

Development Achievements
Opened new 40-bed IRF in Petersburg, VA
Created joint venture/market consolidation in Tucson, AZ
Merged competitor’s 20-bed IRF with existing HLS 80-bed IRF
Approved new 50-bed IRF in Phoenix, AZ
Announced acquisition/market consolidation in Wichita Falls, TX
Acquired competitor’s 48-bed IRF; will consolidate patients to HLS 63-bed IRF
Opened 18 new beds at two facilities
New 40-bed IRF in Puerto Rico (opened: April 17, 2007)
New 40-bed IRF in Fredericksburg, VA (expected to open Q3)
Bed expansion projects approved at five hospitals
Total of 54 beds
Four of these expansions will come on-line in the second half of 2007 with the final
project scheduled to open in 2008
Wellmont Health System Partnership
Joint venture of existing HLS 50-bed IRF in Kingsport, TN
Development of a new 25-bed IRF in Bristol, VA (75% owned by HLS & 25% by
Wellmont); COPN was filed May 1, 2007
2007
2006
2007 Metrics
Consolidated:
Volume growth: 1–2% (full-year)
Net Revenue growth: 2-3%
Operating Earnings
Growth: 3-4%
“As Reported” EBITDA = $275-300 million
Investors should focus on four metrics to evaluate 2007 performance:
1.
Deleveraging the Balance Sheet
2.
Achieving Net Revenue growth of 2-3%
3.
Achieving Operating Earnings growth of 3-4%
4.
Consummating 5-8 development projects by year end
G&A will still have “noise”:
Costs related to all divisions until
closing occurs
General Ledger upgrade investment
Initial development investment
Goal: ~4.75% of Net Revenues
by 2008 year-end

Strong Cash Flow Characteristics
*Total of G&A to all revenues (continuing and discontinuing)
**Targeted rate
***Before tax refund proceeds and proceeds from Corporate complex
(in millions)
at 5.9%*
of Rev.
at 4.75%**
of Rev.
2007 First Quarter EBITDA
68.7
$
68.7
$
Add: Normalization of G&A
18.2
23.5
Sub-total
86.9
$
92.2
$
Less: Capital expenditures
(6.0)
(6.0)
Preferred stock dividend
(6.5)
(6.5)
Cash interest cost***
(56.5)
(56.5)
Excess
17.9
$
23.2
$
Annualized
71.6
$
92.8
$
Normalization of
Gen & Admin Expense
Appendix
Non-GAAP Financial Reconciliations
* After consummation of the divestitures discussed earlier in this Item, and in accordance with our
Credit Agreement (including the March 2007 amendment to the Credit Agreement, as discussed
below), Adjusted Consolidated EBITDA will be calculated on a pro forma basis to give effect to
each divestiture, including pro forma adjustments for the allocation of corporate overhead to each
divested division. No such pro forma adjustments have been made to the above calculation since
no divestitures were consummated as of March 31, 2007.
Reconciliation of Net Loss to Adjusted Consolidated EBITDA
2007
2006
Net loss
(56.6)
$
(435.1)
$
Loss from discontinued operations
27.4
2.3
Provision for income tax expense
3.3
13.7
Loss on interest rate swap
4.3
3.8
Interest expense and amortization of debt
discounts and fees
58.5
59.9
Loss on early extinguishment of debt
-
361.1
Professional fees—accounting, tax, and legal
21.8
48.6
Government, class action, and related settlements
(12.2)
4.3
Net noncash loss on disposal of assets
0.1
0.9
Depreciation and amortization
18.2
20.2
Compensation expense under FASB Statement No. 123(R)
3.6
4.3
Sarbanes-Oxley related costs
0.3
3.0
Adjusted Consolidated EBITDA*
68.7
$
87.0
$
For the three months ended
(In Millions)
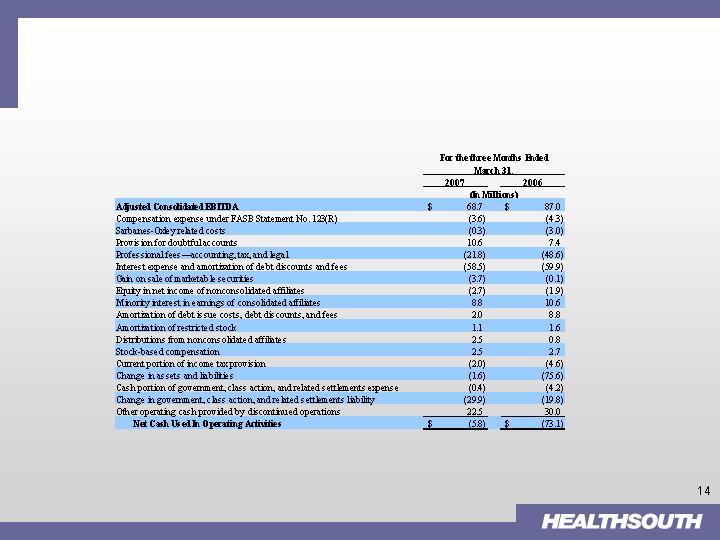
Appendix (cont’d)
Non-GAAP Financial Reconciliations
Reconciliation of Adjusted Consolidated EBITDA to Net Cash
Used in
Operating Activities